 © Fifth Third Bancorp | All Rights Reserved Annual Meeting of Shareholders April 18, 2017 Please refer to earnings release dated January 24, 2017 and 10-K dated February 25, 2017 for further information about our performance in 2016, including full-year results reported on a U.S. GAAP basis. Exhibit 99.1 |
 2 This presentation contains statements that we believe are “forward-looking statements” within the meaning of Section 27A of the Securities Act of 1933, as amended, and Rule 175 promulgated thereunder, and Section 21E of the Securities Exchange Act of 1934, as amended, and Rule 3b-6 promulgated thereunder. These statements relate to our financial condition, results of operations, plans, objectives, future performance or business. They usually can be identified by the use of forward-looking language such as “will likely result,” “may,” “are expected to,” “anticipates,” “potential,” “estimate,” “forecast,” “projected,” “intends to,” or may include other similar words or phrases such as “believes,” “plans,” “trend,” “objective,” “continue,” “remain,” or similar expressions, or future or conditional verbs such as “will,” “would,” “should,” “could,” “might,” “can,” or similar verbs. You should not place undue reliance on these statements, as they are subject to risks and uncertainties, including but not limited to the risk factors set forth in our most recent Annual Report on Form 10-K as updated from time to time by our Quarterly Reports on Form 10-Q. When considering these forward-looking statements, you should keep in mind these risks and uncertainties, as well as any cautionary statements we may make. Moreover, you should treat these statements as speaking only as of the date they are made and based only on information then actually known to us. There is a risk that additional information may become known during the company’s quarterly closing process or as a result of subsequent events that could affect the accuracy of the statements and financial information contained herein. There are a number of important factors that could cause future results to differ materially from historical performance and these forward-looking statements. Factors that might cause such a difference include, but are not limited to: (1) general economic or real estate market conditions, either nationally or in the states in which Fifth Third, one or more acquired entities and/or the combined company do business, weaken or are less favorable than expected; (2) deteriorating credit quality; (3) political developments, wars or other hostilities may disrupt or increase volatility in securities markets or other economic conditions; (4) changes in the interest rate environment reduce interest margins; (5) prepayment speeds, loan origination and sale volumes, charge-offs and loan loss provisions; (6) Fifth Third’s ability to maintain required capital levels and adequate sources of funding and liquidity; (7) maintaining capital requirements and adequate sources of funding and liquidity may limit Fifth Third’s operations and potential growth; (8) changes and trends in capital markets; (9) problems encountered by larger or similar financial institutions may adversely affect the banking industry and/or Fifth Third; (10) competitive pressures among depository institutions increase significantly; (11) changes in customer preferences or information technology systems; (12) effects of critical accounting policies and judgments; (13) changes in accounting policies or procedures as may be required by the Financial Accounting Standards Board (FASB) or other regulatory agencies; (14) legislative or regulatory changes or actions, or significant litigation, adversely affect Fifth Third, one or more acquired entities and/or the combined company or the businesses in which Fifth Third, one or more acquired entities and/or the combined company are engaged, including the Dodd-Frank Wall Street Reform and Consumer Protection Act; (15) ability to maintain favorable ratings from rating agencies; (16) failure of models or risk management systems or controls; (17) fluctuation of Fifth Third’s stock price; (18) ability to attract and retain key personnel; (19) ability to receive dividends from its subsidiaries; (20) potentially dilutive effect of future acquisitions on current shareholders’ ownership of Fifth Third; (21) declines in the value of Fifth Third’s goodwill or other intangible assets; (22) effects of accounting or financial results of one or more acquired entities; (23) difficulties from Fifth Third’s investment in, relationship with, and nature of the operations of Vantiv Holding, LLC; (24) loss of income from any sale or potential sale of businesses (25) difficulties in separating the operations of any branches or other assets divested; (26) losses or adverse impacts on the carrying values of branches and long-lived assets in connection with their sales or anticipated sales; (27) inability to achieve expected benefits from branch consolidations and planned sales within desired timeframes, if at all; (28) ability to secure confidential information and deliver products and services through the use of computer systems and telecommunications networks; and (29) the impact of reputational risk created by these developments on such matters as business generation and retention, funding and liquidity. You should refer to our periodic and current reports filed with the Securities and Exchange Commission, or “SEC,” for further information on other factors, which could cause actual results to be significantly different from those expressed or implied by these forward-looking statements. In this presentation, we may sometimes provide non-GAAP financial information. Please note that although non-GAAP financial measures provide useful insight to analysts, investors and regulators, they should not be considered in isolation or relied upon as a substitute for analysis using GAAP measures. We provide GAAP reconciliations for non- GAAP measures in a later slide in this presentation as well as in our earnings release, both of which are available in the investor relations section of our website, www.53.com. Management has provided forward-looking guidance on certain non-GAAP measures in connection with this presentation in order to facilitate comparability with the Bancorp’s historical performance and financial condition as reflected in these non-GAAP measures. Such forward-looking non-GAAP measures include return on tangible common equity. Bancorp’s management does not estimate on a forward-looking basis the impact of items similar to those that it has excluded to generate these non-GAAP measures on a historical basis because the occurrence and amounts of items such as these are difficult to predict. As a result, the Bancorp has not provided reconciliations of its forward- looking non-GAAP measures. Cautionary statement © Fifth Third Bancorp | All Rights Reserved |
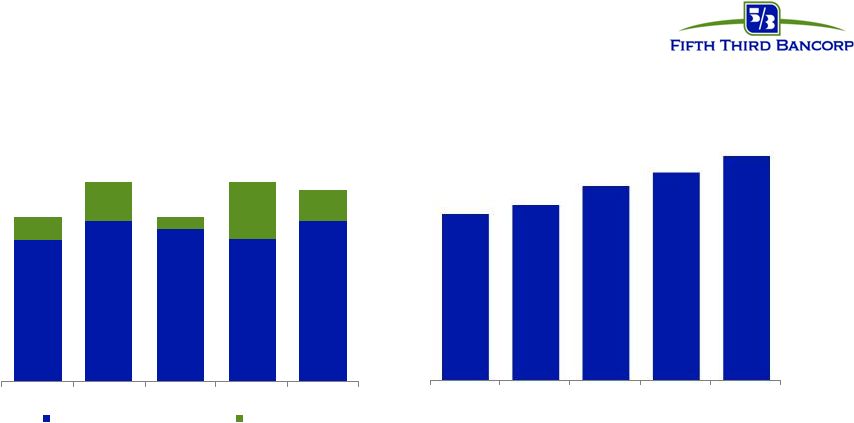 • Strong earnings growth with continued contribution from Vantiv gains • Track record of increasing tangible book value over time • Maintained a disciplined approach and continued to focus on areas that met our desired risk and return requirements 2016 performance at a glance Diluted earnings per share $1.66 $2.02 $1.66 $2.01 $1.93 1 Includes gains on sale of warrant, gains on IPO, gains on share sales, and warrant and put options; excluding recurring revenue from ownership interest and annual TRA payment received 2 Non-GAAP measure: see Regulation G Non-GAAP Reconciliation on page 12 and the Use of Non-GAAP Financial Measures on pages 32 and 33 of the 4Q16 Earnings Release 1,2 1 $1.43 $1.63 $1.54 $1.44 $1.63 $0.23 $0.39 $0.12 $0.57 $0.30 2012 2013 2014 2015 2016 EPS ex. Vantiv gains Vantiv gains $12.33 $13.00 $14.40 $15.39 $16.60 2012 2013 2014 2015 2016 3 Tangible book value per share 2 © Fifth Third Bancorp | All Rights Reserved |
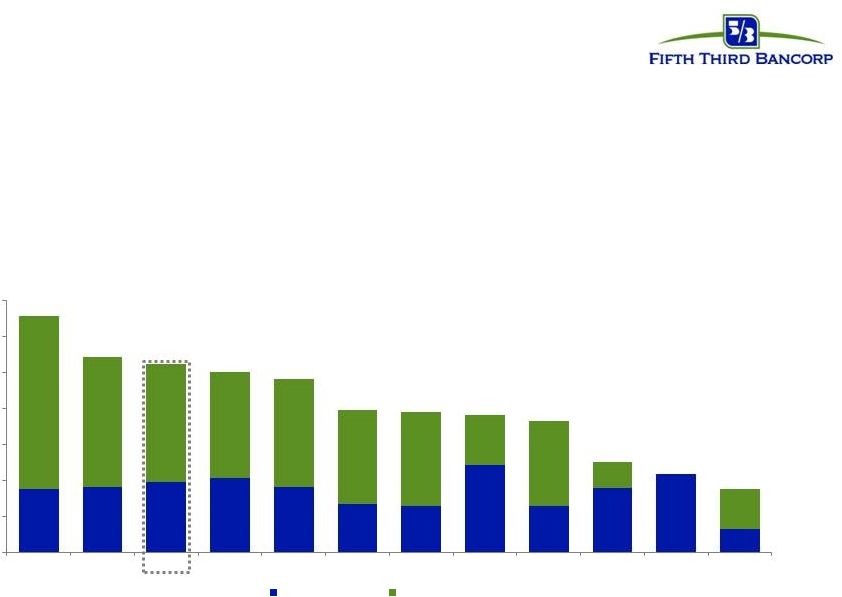 4 © Fifth Third Bancorp | All Rights Reserved Strong capital return to shareholders while increasing capital levels 2016 total payout yield (regional peers) Increased common stock dividend approximately 8% and continued active share repurchase program Source: SNL Financial. Total payout yield equals dividend yield plus shares repurchased ($) / reported market cap at 12/31/16. Repurchases shown include repurchases related to employee compensation issuances given peer comparisons • ~$1.1 billion in capital returned to common shareholders – $661MM common stock repurchases – $405MM common dividends declared 0% 1% 2% 3% 4% 5% 6% 7% RF PNC FITB USB STI MTB CMA BBT CFG KEY HBAN ZION Dividend Yield Buyback Yield |
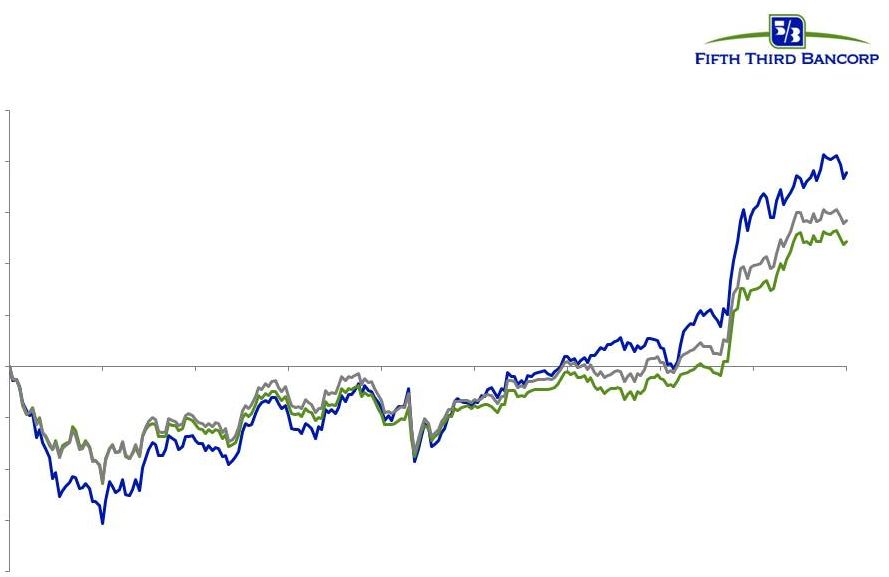 Performance track-record 2016 Total Shareholder Return Source: Bloomberg, cumulative total return net dividends as of 12/31/2017 Fifth Third (FITB) vs. KBW Bank Index and S&P 500 Bank Industry Index KBW 28.5% FITB 37.8% FITB shares have outperformed since the announcement of Project NorthStar S&P Banks 24.3% - 40% - 30% - 20% -10% 0% 10% 20% 30% 40% 50% 1/3/2016 2/11/2016 3/23/2016 5/3/2016 6/13/2016 7/22/2016 8/31/2016 10/11/2016 11/18/2016 12/30/2016 © Fifth Third Bancorp | All Rights Reserved 5 |
 3/31/2017 3/31/2016 3/31/2015 3/31/2014 3/31/2013 3/31/2012 The economic backdrop remains uncertain • The unemployment rate remains low but other economic indicators are mixed – We are benefiting from higher interest rates – The Fed has indicated the need to possibly accelerate tightening • The government is expected to take steps that should be positive for banks – Overall: Potential reductions in corporate tax rates and other fiscal stimulus – Banking: Fiduciary rule, CFPB, regulatory relief • The timing and magnitude of these changes remains uncertain Sources: Employment data – Bureau of Labor Statistics as of 04/07/2017 (underemployment – U-6); GDP - Bureau of Economic Analysis as of 03/30/2017 8.9% 15.2% 8.3% 4.5% Overall strong employment numbers Real GDP still below pre-crisis average © Fifth Third Bancorp | All Rights Reserved 1.70% 2.40% 2.60% 1.60% 0.0% 0.5% 1.0% 1.5% 2.0% 2.5% 3.0% 3.5% 2012 2013 2014 2015 2016 GDP Pre-crisis average (2003-2007) 6 Unemployment Underemployment 2.20% |
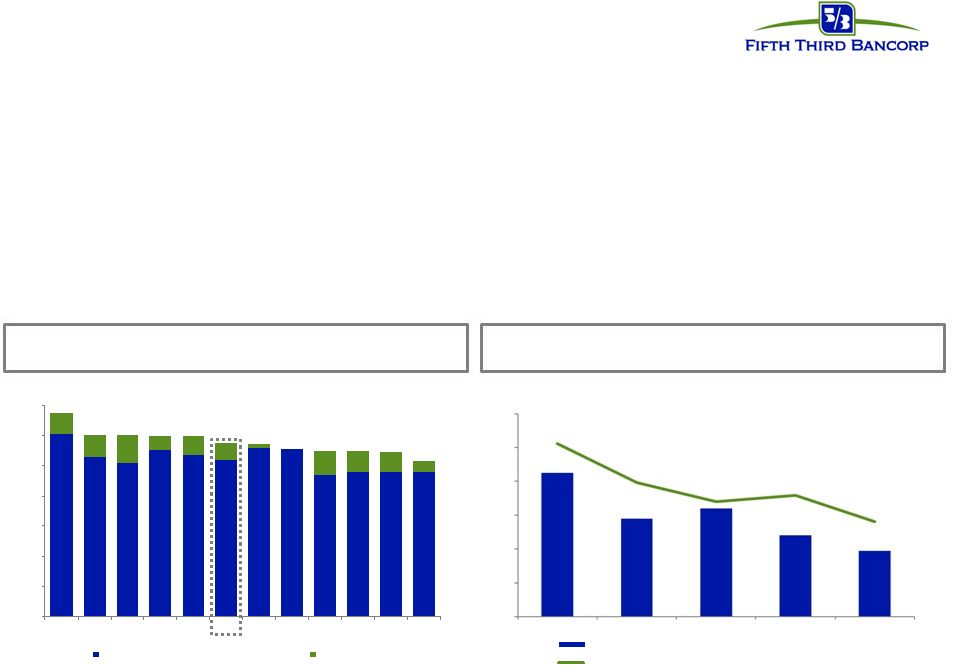 Our strong balance sheet has allowed us to capitalize on opportunities • Strong capital ratios • Balanced interest rate risk profile well-positioned to benefit from rising rate environment • Vantiv ownership with sizeable unrecognized value • Continued to reduce auto exposure • Criticized asset ratio lowest since Q3 2007; commercial NCOs lowest in 15 years • Growing loans that meet return hurdles while maintaining credit discipline Source: SNL Financial; regulatory filings as of 4Q16 Also have additional upside potential from unrecognized Vantiv ownership Healthy capital ratios while still deploying capital to shareholders Our criticized assets and NCOs have continued to decline 0.85 0.58 0.64 0.48 0.39 0% 2% 4% 6% 8% 10% 12% 2012 2013 2014 2015 2016 Net charge-offs (bps) Criticized assets as a percentage of total commercial loans 0% 2% 4% 6% 8% 10% 12% 14% ZION PNC BBT RF MTB FITB CFG CMA USB KEY HBAN STI Common Equity Tier 1 Ratio Tier 1 Ratio 7 © Fifth Third Bancorp | All Rights Reserved |
 8 © Fifth Third Bancorp | All Rights Reserved • Generating positive operating leverage is a top priority in 2017 • NorthStar long-term financial targets: – ROTCE : 12% - 14% – ROA: 1.1% - 1.3% – Efficiency ratio: < 60% • We plan to achieve our profitability targets regardless of the interest rate environment • We took a number of actions in 2016 to improve profitability We are committed to improved profitability • Black Knight mortgage loan operating system • Branch closures and consolidations • Omni-channel strategies • Launch of new credit card products • Contract renegotiations • Non-branch rationalization and workspace management • Re-design of commercial client experience • Exited $3.5 billion of commercial loans that did not meet our desired risk or return profile Forward-looking Non-GAAP measure: See cautionary statement on slide 2 of the presentation and page 32 of the 4Q16 earnings release for use of certain forward-looking non-GAAP measures 1 NorthStar strategies implemented or initiated in 2016 1 |
 9 © Fifth Third Bancorp | All Rights Reserved While we are investing in our businesses, we are also investing in our communities $30 Billion NCRC and Fifth Third signed revised community plan through 2020 Increased from $27.5 billion at the beginning of 2016 $30 billion in Lending & Tax Credit Investments • $11 billion in mortgage credit access • $10 billion in small business • $9 billion in community development lending and investments $158 million in Fifth Third Impact Initiatives, including: • $93.1 million in philanthropic donations • $23 million for 10 new branches in LMIT and/or HMT communities • $20 million in housing-related investments |
 10 © Fifth Third Bancorp | All Rights Reserved Recent accolades Employees Customers |
 11 © Fifth Third Bancorp | All Rights Reserved Fifth Third priorities Targeting growth in strategic areas Committed to higher profitability and attractive returns relative to peer group Well-positioned to achieve long-term targets |
 © Fifth Third Bancorp | All Rights Reserved |
 13 © Fifth Third Bancorp | All Rights Reserved Regulation G non-GAAP reconciliation Fifth Third Bancorp and Subsidiaries Regulation G Non-GAAP Reconciliation $ and shares in millions (unaudited) 2016 2015 2014 2013 2012 Total Bancorp shareholders' equity (U.S. GAAP) $16,205 $15,839 $15,626 $14,589 $13,716 Less: Preferred stock (1,331) (1,331) (1,331) (1,034) (398) Goodwill (2,416) (2,416) (2,416) (2,416) (2,416) Intangible assets and other servicing rights (10) (13) (16) (19) (27) Tangible common equity (a) $12,448 $12,079 $11,863 $11,120 $10,875 Common shares outstanding (b) 750 785 824 855 882 Tangible book value per share (a) / (b) $16.60 $15.39 $14.40 $13.00 $12.33 Vantiv-related gains Add: Warrant and put options $64 $236 $30 $207 $67 Gain on IPO - - - - 115 Gain on share sales - 331 125 327 157 Gain on sale of warrant 9 89 - - - Vantiv TRA settlement gains 280 49 - - - Pre-tax Vantiv-related gains $353 $705 $155 $534 $339 Less: Impact of assumed 35% rate on gains 124 247 54 187 119 After-tax Vantiv-related gains (c) $229 $458 $101 $347 $220 Avg. Diluted common shares outstanding (d) 764 808 843 895 946 Diluted EPS (U.S. GAAP) $1.93 $2.01 $1.66 $2.02 $1.66 Less: EPS impact of Vantiv-related gains (c) / (d) $0.30 $0.57 $0.12 $0.39 $0.23 Diluted EPS ex. Vantiv gains (e) - [(c) / (d)] $1.63 $1.44 $1.54 $1.63 $1.43 For the Year Ended |