Filed Pursuant to Rule 433
Issuer Free Writing Prospectus dated December 9, 2020
Relating to Preliminary Prospectus issued December 9, 2020
Registration Statement No. 333-249828

Roadshow Presentation December 2020 Strictly Confidential © Midwest Holding Inc.
Disclaimer Roadshow Presentation Disclaimer Midwest Holding Inc . has filed a registration statement (including a prospectus) with the SEC for the offering to which this communication relates . Before you invest, you should read the prospectus in that registration statement and other documents Midwest Holding Inc . has filed with the SEC for more complete information about Midwest Holding Inc . and this offering . You may get these documents for free by visiting EDGAR on the SEC Web site at www . sec . gov . Alternatively, Midwest Holding Inc . , any underwriter or any dealer participating in this offering will arrange to send you the prospectus if you request it by calling toll free at 866 - 805 - 4128 . Confidentiality This presentation (together with any other statements or information that the Company may furnish to you) is confidential and may not be reproduced, forwarded to any person or published, in whole or in part . Forward - Looking Statements This presentation contains certain “forward - looking statements” within the meaning of Section 27 A of the Securities Act, as amended, and Section 21 E of the Securities Exchange Act of 1934 , as amended, that are based on various facts and derived utilizing numerous important assumptions and are subject to known and unknown risks, uncertainties and other factors that may cause our actual results, performance or achievements to be materially different from any future results, performance or achievements expressed or implied by such forward - looking statements . Forward - looking statements include the information concerning our future financial performance, business and growth strategy, projected plans and objectives, as well as projections of macroeconomic and industry trends, which are inherently unreliable due to the multiple factors that impact economic trends, and any such variations may be material . Statements preceded by, followed by or that otherwise include the words “believes,” “expects,” “anticipates,” “intends,” “projects,” “estimates,” “plans” and similar expressions or future or conditional verbs such as “will,” “should,” “would,” “may” and “could” are generally forward - looking in nature and not historical facts, although not all forward - looking statements include the foregoing . Forward looking statements are based on management’s current expectations and involve risks and uncertainties that could cause actual results to differ materially from the Company’s historical results or those described in our forward - looking statements . Non - GAAP Financial Measures This presentation includes certain non - GAAP financial measures . While the Company believes these are useful measures for investors, they are not presented in accordance with GAAP . You should not consider non - GAAP measures in isolation or as a substitute for the most directly comparable or other financial measures calculated in accordance with GAAP . Because not all companies use identical calculations, the presentation herein of non - GAAP financial measures may not be comparable to other similarly titled measures of other companies . For a reconciliation of the non GAAP measures we use to the most comparable GAAP measures on a historical basis, see page 37 of this presentation . Industry and Other Data Certain market and industry data included in this presentation have been obtained from third - party sources that the Company believes to be reliable . Market estimates are calculated by using independent industry publications, government publications, reports by market research firms and third - party forecasts in conjunction with the Company’s assumptions about its markets . Some data are also based on the Company’s good faith estimates, which are derived from its review of internal surveys and from independent sources . The Company believe these estimates to be reasonable based on the information available to it as of the date of this presentation . However, the Company has not independently verified such third - party information and cannot assure the recipient of its accuracy or completeness . 2 © Midwest Holding Inc.
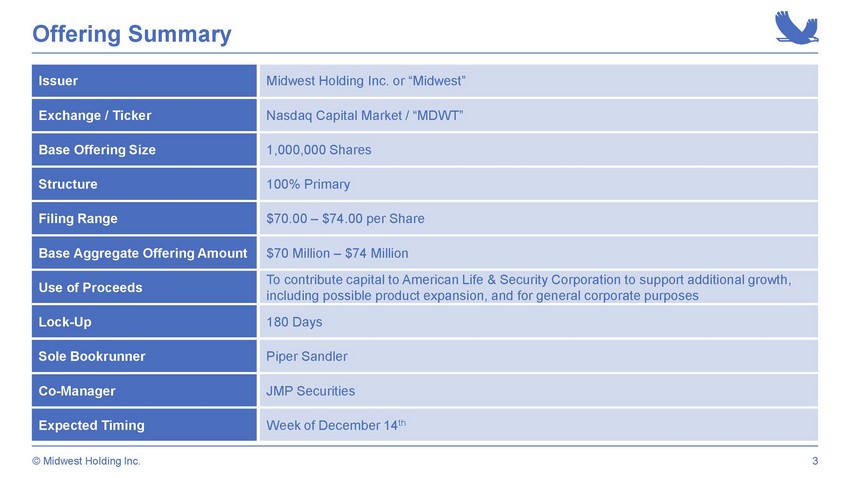
Offering Summary 3 © Midwest Holding Inc. Issuer Exchange / Ticker Base Offering Size Use of Proceeds Lock - Up Sole Bookrunner Co - Manager Expected Timing Midwest Holding Inc. or “Midwest” Nasdaq Capital Market / “MDWT” 1,000,000 Shares To contribute capital to American Life & Security Corporation to support additional growth, including possible product expansion, and for general corporate purposes 180 Days Piper Sandler JMP Securities Week of December 14 th Structure 100% Primary Filing Range $70.00 – $74.00 per Share Base Aggregate Offering Amount $70 Million – $74 Million

Presenters Mike Minnich Founder, Chairman & Co - Chief Executive Officer • 25 years of experience in asset management, insurance company management, technology and risk management • Managing member of insurance advisory firm Rendezvous Capital LLC since 2010 • Former Managing Director at Swiss Re, managing a multibillion - dollar portfolio • B.S. Electrical Engineering from MIT and MBA from MIT Sloan 4 Michael Salem Founder & Co - Chief Executive Officer • 16 years of experience in insurance investing, distribution and technology • Co - founded Vanbridge LLC, a boutique insurance intermediary sold in 2018 • Founding Portfolio Manager of Arrowgrass Capital Partners, a multibillion - dollar hedge fund • B.S. Computer Science from Brown University and M.S. Electrical Engineering from Stanford University © Midwest Holding Inc.
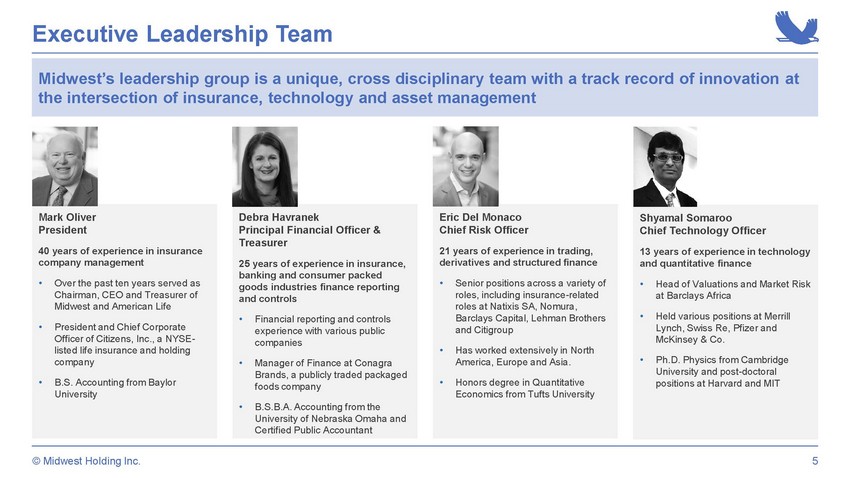
Executive Leadership Team Midwest Leadership Mark Oliver President 40 years of experience in insurance company management • Over the past ten years served as Chairman, CEO and Treasurer of Midwest and American Life • President and Chief Corporate Officer of Citizens, Inc., a NYSE - listed life insurance and holding company • B.S. Accounting from Baylor University Eric Del Monaco Chief Risk Officer 21 years of experience in trading, derivatives and structured finance • Senior positions across a variety of roles, including insurance - related roles at Natixis SA, Nomura, Barclays Capital, Lehman Brothers and Citigroup • Has worked extensively in North America, Europe and Asia. • Honors degree in Quantitative Economics from Tufts University Shyamal Somaroo Chief Technology Officer 13 years of experience in technology and quantitative finance • Head of Valuations and Market Risk at Barclays Africa • Held various positions at Merrill Lynch, Swiss Re, Pfizer and McKinsey & Co. • Ph.D. Physics from Cambridge University and post - doctoral positions at Harvard and MIT 5 Midwest’s leadership group is a unique, cross disciplinary team with a track record of innovation at the intersection of insurance, technology and asset management Debra Havranek Principal Financial Officer & Treasurer 25 years of experience in insurance, banking and consumer packed goods industries finance reporting and controls • Financial reporting and controls experience with various public companies • Manager of Finance at Conagra Brands, a publicly traded packaged foods company • B.S.B.A. Accounting from the University of Nebraska Omaha and Certified Public Accountant © Midwest Holding Inc.
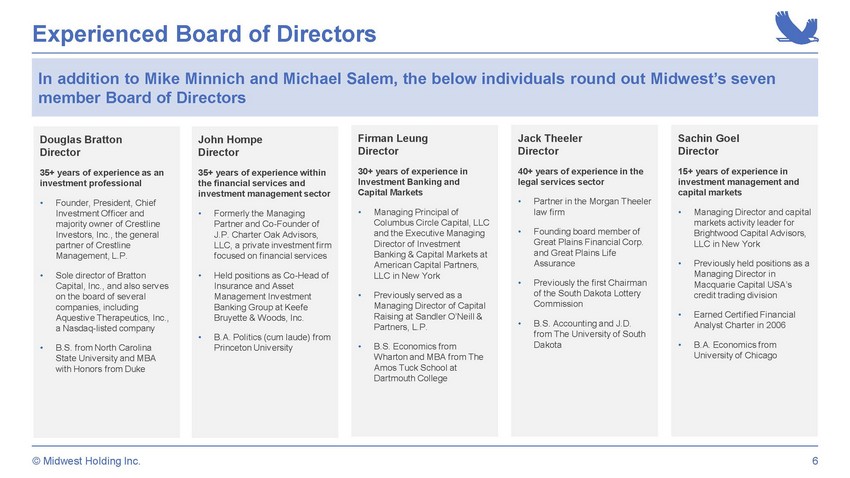
Experienced Board of Directors Midwest Leadership Jack Theeler Director 40+ years of experience in the legal services sector • Partner in the Morgan Theeler law firm • Founding board member of Great Plains Financial Corp. and Great Plains Life Assurance • Previously the first Chairman of the South Dakota Lottery Commission • B.S. Accounting and J.D. from The University of South Dakota Firman Leung Director 30+ years of experience in Investment Banking and Capital Markets • Managing Principal of Columbus Circle Capital, LLC and the Executive Managing Director of Investment Banking & Capital Markets at American Capital Partners, LLC in New York • Previously served as a Managing Director of Capital Raising at Sandler O’Neill & Partners, L.P. • B.S. Economics from Wharton and MBA from The Amos Tuck School at Dartmouth College Sachin Goel Director 15+ years of experience in investment management and capital markets • Managing Director and capital markets activity leader for Brightwood Capital Advisors, LLC in New York • Previously held positions as a Managing Director in Macquarie Capital USA’s credit trading division • Earned Certified Financial Analyst Charter in 2006 • B.A. Economics from University of Chicago Douglas Bratton Director 35+ years of experience as an investment professional • Founder, President, Chief Investment Officer and majority owner of Crestline Investors, Inc., the general partner of Crestline Management, L.P. • Sole director of Bratton Capital, Inc., and also serves on the board of several companies , including Aquestive Therapeutics, Inc., a Nasdaq - listed company • B.S. from North Carolina State University and MBA with Honors from Duke 6 John Hompe Director 35+ years of experience within the financial services and investment management sector • Formerly the Managing Partner and Co - Founder of J.P. Charter Oak Advisors, LLC, a private investment firm focused on financial services • Held positions as Co - Head of Insurance and Asset Management Investment Banking Group at Keefe Bruyette & Woods, Inc. • B.A. Politics (cum laude) from Princeton University In addition to Mike Minnich and Michael Salem, the below individuals round out Midwest’s seven member Board of Directors © Midwest Holding Inc.
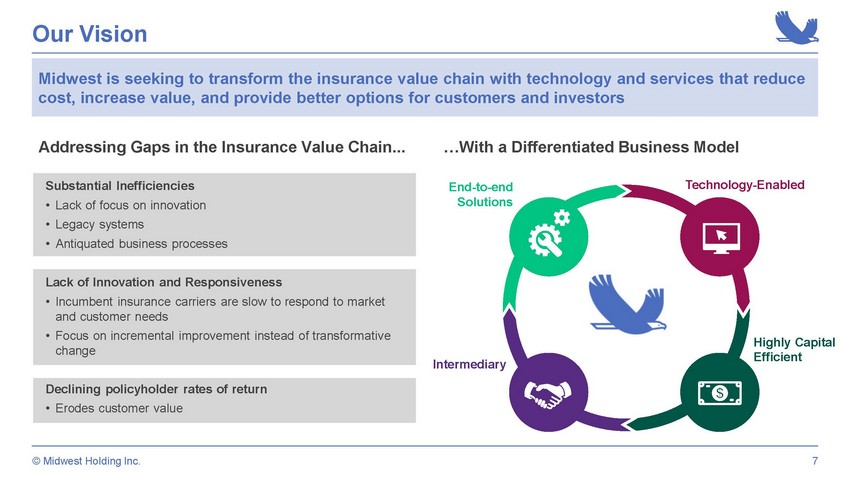
Highly Capital Efficient Intermediary Technology - Enabled End - to - end Solutions Our Vision 7 Substantial Inefficiencies • Lack of focus on innovation • Legacy systems • Antiquated business processes Lack of Innovation and Responsiveness • Incumbent insurance carriers are slow to respond to market and customer needs • Focus on incremental improvement instead of transformative change Declining policyholder rates of return • Erodes customer value Addressing Gaps in the Insurance Value Chain... …With a Differentiated Business Model Midwest is seeking to transform the insurance value chain with technology and services that reduce cost, increase value, and provide better options for customers and investors © Midwest Holding Inc.
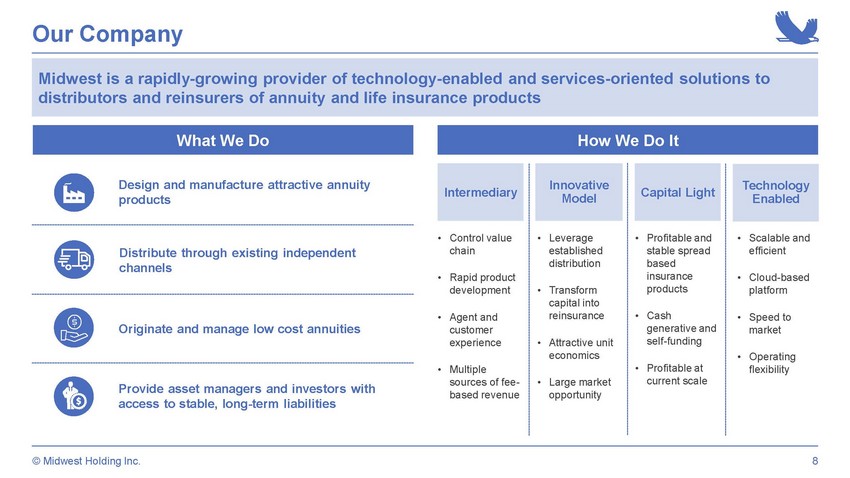
Our Company 8 Midwest is a rapidly - growing provider of technology - enabled and services - oriented solutions to distributors and reinsurers of annuity and life insurance products Intermediary Innovative Model • Control value chain • Rapid product development • Agent and customer experience • Multiple sources of fee - based revenue • Leverage established distribution • Transform capital into reinsurance • Attractive unit economics • Large market opportunity • Scalable and efficient • Cloud - based platform • Speed to market • Operating flexibility • Profitable and stable spread based insurance products • Cash generative and self - funding • Profitable at current scale Originate and manage low cost annuities Provide asset managers and investors with access to stable, long - term liabilities Design and manufacture attractive annuity products Distribute through existing independent channels Capital Light Technology Enabled What We Do How We Do It © Midwest Holding Inc.

Why the Annuity Market? 9 Large and Growing Market (1) Existing Independent Distribution (2) Large and growing U.S. market with established and accessible distribution channels, significant demand from capital providers, and substantial inefficiencies in the existing value chain U.S. Individual Annuity Market $242BN U.S. Private Passenger Auto Market $264BN $118BN U.S. Homeowners Market U.S. Residential Housing Units U.S. Population Age 65+ U.S. Registered Personal Vehicles Significant Capital Demand (3) 3.2% CAGR (2.0%) CAGR Sources: S&P Global Market Intelligence, U.S. Census Bureau, U.S. Federal Reserve, U.N. World Population Prospects, Insurance In formation Institute, “U.S. Individual Annuities, 2019 Year in Review, LIMRA, 2020”. 1. Dollar amounts represent 2019 U.S. direct written premiums. Compound annual growth rate (“CAGR”) for 2010 through 2019, o th er than U.S. registered personal vehicles which is through 2020. 2. Reflects percent of 2019 U.S. individual annuity sales. | 3. Reflects equity capital of selected investor owned life and a nnuity companies. 0.6% CAGR I nvestor O wned L ife and Annuity C ompany Capital $6BN $8BN $16BN $18BN $28BN 2015 2016 2017 2018 2019 Independent B/D's 24% Independent Agents 20% Banks 18% Full - service National B/D's 14% Career agents 17% Direct response 6% Other 3% © Midwest Holding Inc. Independent agents, served by IMOs, banks and broker - dealers account for over 75% of annual individual annuity volume Increasing demand from asset managers for stable, long term and attractively priced annuity investment Individual Annuity Sales by Distribution Channel

Differentiated Business Model Efficient Access to Products Faster Speed to Market Enhanced Customer and Agent Experience Tailored Asset Management Services Robust Risk Management Controls Better Products and Service Attractive Capital Deployment Opportunities 10 Midwest is transforming the insurance value chain with technology and services that reduce cost, increase value, and provide better options for customers and investors © Midwest Holding Inc. Customers Investors Agents & IMOs Traditional & Capital Markets Reinsurers Products & Distribution Reinsurance Asset Liability Management Technology & Administration Policy Issuance Reinsurance Management
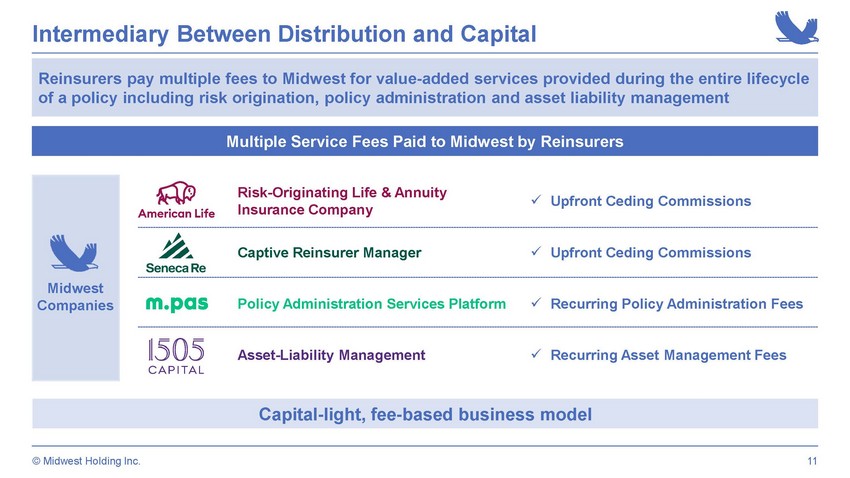
Risk - Originating Life & Annuity Insurance Company x Upfront Ceding Commissions Captive Reinsurer Manager x Upfront Ceding Commissions Policy Administration Services Platform x Recurring Policy Administration Fees Asset - Liability Management x Recurring Asset Management Fees Intermediary Between Distribution and Capital 11 Reinsurers pay multiple fees to Midwest for value - added services provided during the entire lifecycle of a policy including risk origination, policy administration and asset liability management Midwest Companies Multiple Service Fees Paid to Midwest by Reinsurers Capital - light, fee - based business model American Life © Midwest Holding Inc.

MYGA product launched Jan - 19 New management team closes acquisition of Midwest Jun - 18 Cloud based administration system goes live Nov - 18 Rated by AM Best Nov/Dec - 18 FIA product launched Oct - 19 FIA Bonus product launched Apr - 20 Strategic capital raise Apr - 20 Launched May - 20 Remaining 49% of 1505 Capital acquired Jun - 20 1,000+ active IMO agents Q3 20 Starting from zero… 2019 $ 160MM+ annual premiums Established Business Model and Market Position 2018 2019 2020 $132MM Q3’ 2020 / $525MM+ annualized premiums (1) 12 1. Annualized figures represent the annualization of the Q3’ 2020 financial data, calculated as the Q3’ 2020 figures multiplied by four periods. Rapidly built an innovative platform leveraging insurance expertise, technology and asset management capabilities positioned for sustained growth © Midwest Holding Inc.

Addressing a Large Market Opportunity Multiple Expansion Opportunities Total U.S. Annuity, Life & Health Market $934BN Total U.S. Individual Annuity Market $242BN Independent Agents $48BN Large Addressable Market (1) Geography (1) Channels (2) Products (1) Current Market Presence Total Market Opportunity 20 States & Washington D.C. Independent Agents Individual Annuities Midwest currently has less than one - half of 1% share of the individual annuity market 13 35% 20% 26% U.S. Annuity U.S. Individual Annuity U.S. Annuity, Life & Health Sources: S&P Global Market Intelligence, Insurance Information Institute , “U.S. Individual Annuities, 2019 Year in Review, LIMRA, 2020”. 1. Market data reflects 2019 direct written premiums. Geography and Product total market opportunity represent percent of 2019 t ota l direct written premiums. 2. Reflects percent of 2019 U.S. individual annuity sales. © Midwest Holding Inc.
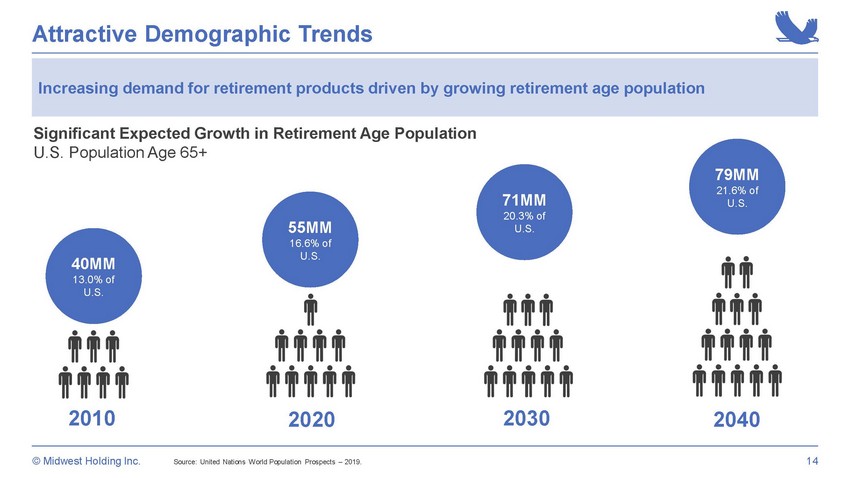
40MM 13.0% of U.S. 55MM 16.6% of U.S. 2030 2020 Significant Expected Growth in Retirement Age Population U.S. Population Age 65+ 2010 2040 Attractive Demographic Trends 71MM 20.3% of U.S. 79MM 21.6% of U.S. Source: United Nations World Population Prospects – 2019. 14 © Midwest Holding Inc. Increasing demand for retirement products driven by growing retirement age population

Complete Set of Innovative Capabilities • Existing insurance company reimagined in 2018 • Industry best practices combined with forward - thinking technology • Provides best - in class annuity products • End - to - end, cloud - based policy administration solution • Licensed third - party administrator • Able to launch new products in months, not years • SEC - registered investment advisor • Insurance experience, relationships and capabilities • Innovative investment solutions for American Life and investors • Vermont - sponsored captive reinsurer • Rapid and efficient launch of investor reinsurance vehicles • Efficiently and quickly transforms capital into reinsurance Policy Administration Insurance Products Reinsurance Management Asset Management 15 © Midwest Holding Inc. Customer Facing Capital Facing

Enabled by Modern Technology 16 Speed to Market Operational Efficiency Automation Scalability Optimized Customer Experience Electronic Applications Secure Log - ins Agent Portal Policyholder Portal Product Development Policy Issuance Document Management Policy Administration Practical Technology applied to solve business inefficiencies Optimized Enhances speed and efficiency of distribution Flexible Combination of proprietary and 3 rd party technology Scalable Cloud - based systems with internal development Our technology - focused approach combined with our cross disciplinary team enables us to drive innovation efficiently, quickly and effectively © Midwest Holding Inc.
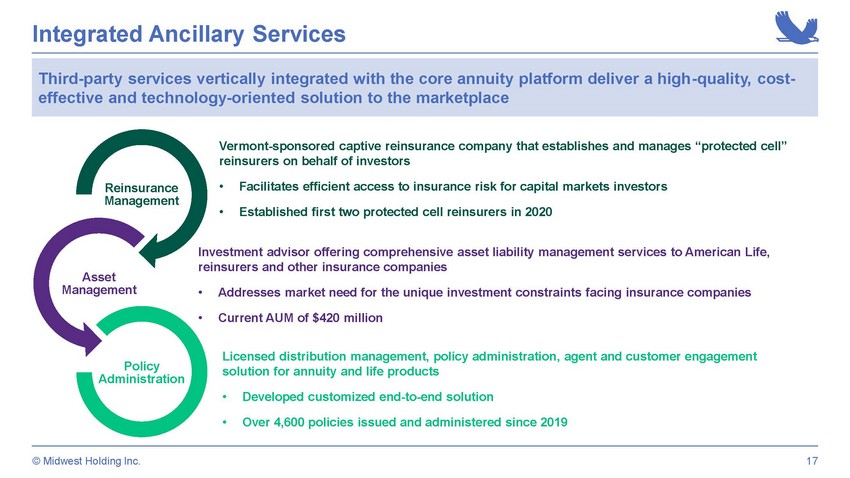
Integrated Ancillary Services Licensed distribution management, policy administration, agent and customer engagement solution for annuity and life products • Developed customized end - to - end solution • Over 4,600 policies issued and administered since 2019 Integrated Ancillary Services Investment advisor offering comprehensive asset liability management services to American Life, reinsurers and other insurance companies • Addresses market need for the unique investment constraints facing insurance companies • Current AUM of $420 million Vermont - sponsored captive reinsurance company that establishes and manages “protected cell” reinsurers on behalf of investors • Facilitates efficient access to insurance risk for capital markets investors • Established first two protected cell reinsurers in 2020 17 Third - party services vertically integrated with the core annuity platform deliver a high - quality, cost - effective and technology - oriented solution to the marketplace Reinsurance Management Asset Management Policy Administration © Midwest Holding Inc.

Strategic Distribution Relationships We partner with IMOs that provide access to large networks of independent agents to sell our competitive annuity products 18 • Offers fixed annuity and life insurance marketing support, education, and training to independent insurance agents and advisors • 600+ agents, ~$2BN in annual annuity premiums • Focus on strategic partnerships with established distribution channels • IMOs provide independent agents with access to products and operational support • Immediate access to large, national independent agent networks • Efficient, commission - based compensation model • Currently have strategic relationships with eight IMOs • Midwest Value Proposition • Product differentiation, speed of execution and ease of use • Innovative products developed with distribution partners • Responsive to market opportunities with quick new product development • Efficient, technology - enabled service and support • Provides insurance marketing services for independent advisors to increase their life insurance and annuity business • 600+ agents, ~$8BN in annual annuity premiums © Midwest Holding Inc.
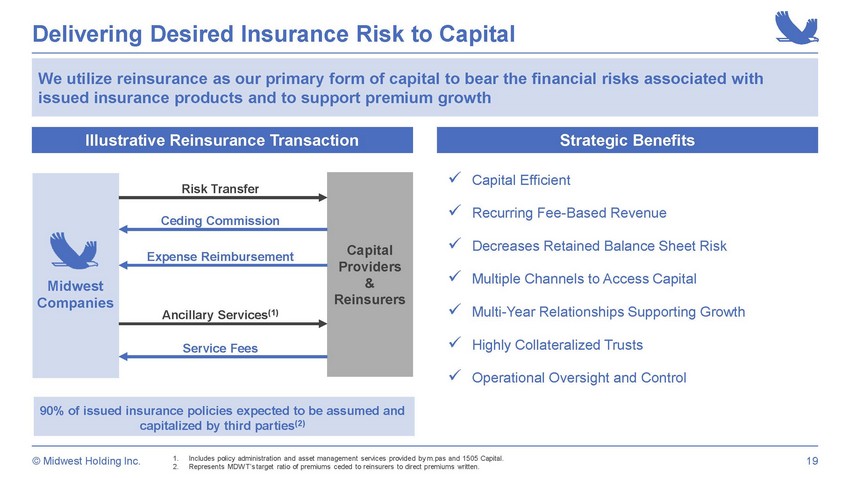
Delivering Desired Insurance Risk to Capital 19 Capital Providers & Reinsurers x Capital Efficient x Recurring Fee - Based Revenue x Decreases Retained Balance Sheet Risk x Multiple Channels to Access Capital x Multi - Year Relationships Supporting Growth x Highly Collateralized Trusts x Operational Oversight and Control Midwest Companies Illustrative Reinsurance Transaction 90% of issued insurance policies expected to be assumed and capitalized by third parties (2) Strategic Benefits 1. Includes policy administration and asset management services provided by m.pas and 1505 Capital. 2. Represents MDWT’s target ratio of premiums ceded to reinsurers to direct premiums written. Ceding Commission Risk Transfer Service Fees Ancillary Services (1) Expense Reimbursement We utilize reinsurance as our primary form of capital to bear the financial risks associated with issued insurance products and to support premium growth © Midwest Holding Inc.
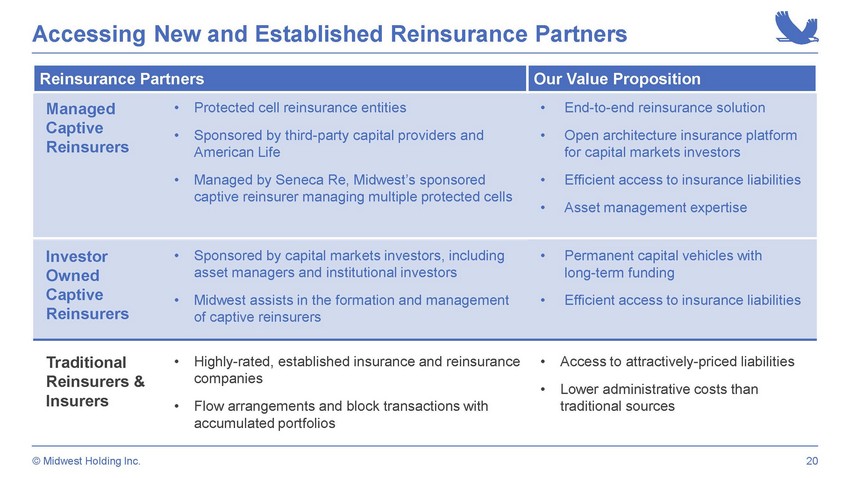
Accessing New and Established Reinsurance Partners Reinsurance Partners Our Value Proposition Managed Captive Reinsurers • Protected cell reinsurance entities • Sponsored by third - party capital providers and American Life • Managed by Seneca Re, Midwest’s sponsored captive reinsurer managing multiple protected cells • End - to - end reinsurance solution • Open architecture insurance platform for capital markets investors • Efficient access to insurance liabilities • Asset management expertise • Permanent capital vehicles with long - term funding • Efficient access to insurance liabilities Investor Owned Captive Reinsurers • Sponsored by capital markets investors, including asset managers and institutional investors • Midwest assists in the formation and management of captive reinsurers Traditional Reinsurers & Insurers • Highly - rated, established insurance and reinsurance companies • Flow arrangements and block transactions with accumulated portfolios • Access to attractively - priced liabilities • Lower administrative costs than traditional sources 20 © Midwest Holding Inc.

Diverse Set of Reinsurance Counterparties Capital Provider Objectives Policy Administration Asset Management Captiv e Reinsurer Management Passive Investor • Low maintenance • Accessing insurance “float” x x x Active Asset Manager • Diversification with insurance risk • Permanent capital x x Tax Motivated Offshore Investor • Tax - efficient structure • Higher tolerance for risk x x Traditional Reinsurer • Stable , low - risk business • Large blocks of business x Trapped Capital • Deploy excess capital • Attractive risk - adjusted returns x x 21 © Midwest Holding Inc.
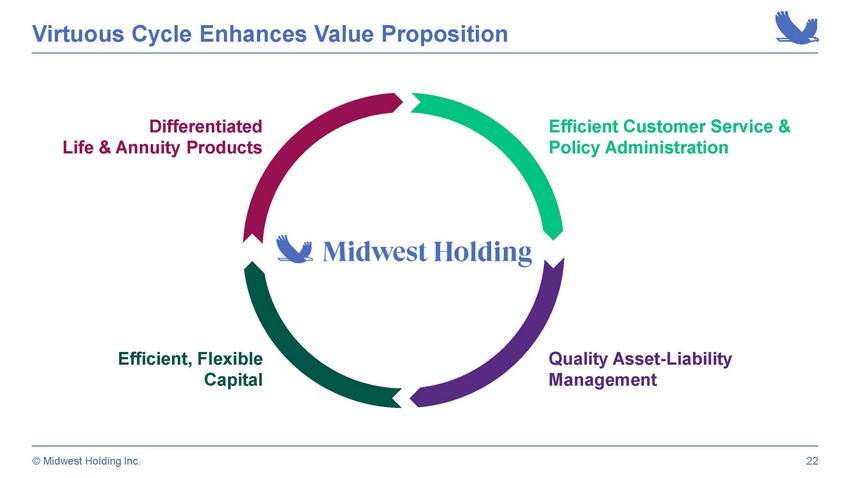
Virtuous Cycle Enhances Value Proposition Differentiated Life & Annuity Products Efficient Customer Service & Policy Administration Quality Asset - Liability Management Efficient, Flexible Capital 22 © Midwest Holding Inc.

Innovative and Differentiated Products 23 • Annuity that provides a Loyalty Bonus for not making withdrawals during the term • Flexible accounts that provide sheltered growth through exclusive equity indices / fixed rate accounts enabling higher potential returns on a tax - deferred basis • Bonus feature enables upfront payment equaling up to 10% of account on day one Current Products Future Product Opportunities American Classic – MYGA 5 - Year Multi - Year Guaranteed Annuity American Select – FIA 10 - Year Fixed Indexed Annuities: Select, Select Bonus & Select Bonus Plus Fixed deferred, fixed indexed and other annuities • 3 - Year MYGA • 7 - Year FIA Life insurance products Medicare supplemental insurance products • Deliver products that address new and changing marketplace demand • New products developed in coordination with distribution partners and consulting actuaries • Average three to five months to launch new products from development to market introduction © Midwest Holding Inc.

Strategic Premium Growth to Manage Profitability 1. D ata based on MDWT’s 2019 10 - K filing and 10 - Q documents filed in 2020. Premium Sales Driven by Risk and Profitability • MYGA product introduced in Q1 2019 to attract agents and build brand awareness • Shifted focus to FIA products in Q4 2019 due to the higher margins and lower risk in the product • Introduced new FIA features aligned with market environment in 2020 $8.3 $29.9 $41.3 $81.9 $47.8 $99.7 $132.1 Q1 2019 Q2 2019 Q3 2019 Q4 2019 Q1 2020 Q2 2020 Q3 2020 Multi-Year Guaranteed Annuity Fixed Index Annuity Strategic focus on growing higher margin products to balance overall premium growth and profitability 24 © Midwest Holding Inc. Quarterly Annuity Direct Written Premium ($MM) (1)
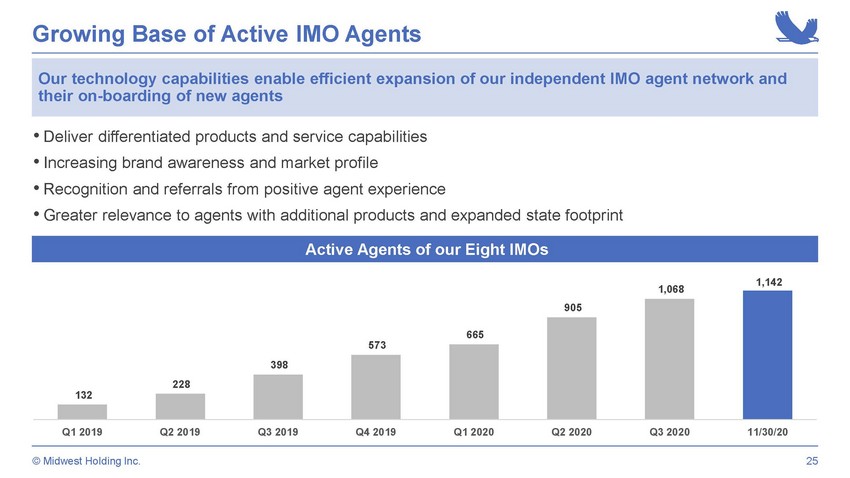
Growing Base of Active IMO Agents • Deliver differentiated products and service capabilities • Increasing brand awareness and market profile • Recognition and referrals from positive agent experience • Greater relevance to agents with additional products and expanded state footprint Active Agents of our Eight IMOs Our technology capabilities enable efficient expansion of our independent IMO agent network and their on - boarding of new agents 25 © Midwest Holding Inc. 132 228 398 573 665 905 1,068 1,142 Q1 2019 Q2 2019 Q3 2019 Q4 2019 Q1 2020 Q2 2020 Q3 2020 11/30/20

Expanding Market Presence 26 OR ID MT NV ND SD NE UT CO AZ NM IA MO OK LA IL OH HI Approved (14) Approved Last 12 Months (7) Pending (3) KS DC IN MI PR TX 1. Licensed but pending reinstatement. (1) © Midwest Holding Inc.
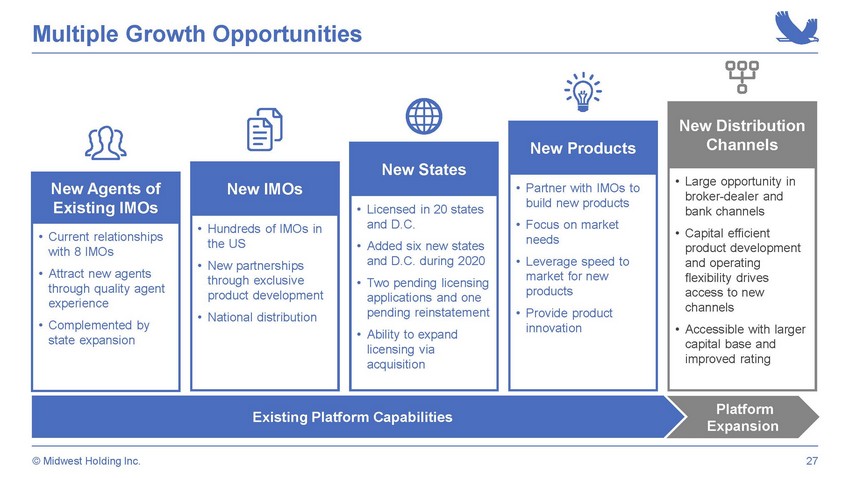
Multiple Growth Opportunities 27 Platform Expansion New IMOs • Hundreds of IMOs in the US • New partnerships through exclusive product development • National distribution New States • Licensed in 20 states and D.C. • Added six new states and D.C. during 2020 • Two pending licensing applications and one pending reinstatement • Ability to expand licensing via acquisition New Products • Partner with IMOs to build new products • Focus on market needs • Leverage speed to market for new products • Provide product innovation Existing Platform Capabilities New Distribution Channels • Large opportunity in broker - dealer and bank channels • Capital efficient product development and operating flexibility drives access to new channels • Accessible with larger capital base and improved rating New Agents of Existing IMOs • Current relationships with 8 IMOs • Attract new agents through quality agent experience • Complemented by state expansion © Midwest Holding Inc.

Attractive Financial Model Strong unit economics Attractive, self - sustaining cash dynamics Operating leverage Multiple sources of fee - based revenue Robust growth Modest incremental capital requirements • Combination of upfront and recurring fee and other income • Minimal direct or variable costs • Significant upfront ceding commissions • Reinsurers reimburse direct acquisition costs and other policy issuance expenses • Reinsurance is the primary source of capital • Capital raise provides significant incremental capacity • Ceding commissions from reinsuring policies • Recurring policy administration and asset management fees • Efficient, highly - scalable platform • Current platform supports significant growth • Multiple dimensions of immediate organic growth • Large market opportunity with attractive demographic trends 28 © Midwest Holding Inc.

Midwest Annuity Policy Flow 29 © Midwest Holding Inc. Customers 3 rd Party Investors Agents & IMOs Premiums Premiums Capital Investment Return Asset Management Fees Ceding Commission, Expense Reimbursement & Annuity Payouts Policy Admin Fees Policy Admin Agent & IMO Commission Policy Service & Support Asset Liability Management Technology & Administration Policy Issuance Reinsurance Management Investor Owned Reinsurer Annuity Payouts Investor Owned Reinsurer

Strong Unit Economics Lifetime Annuity Policy Revenue (2) Recurring Revenue Upfront Payment $100,000 Average policy size $140,000 Average policy size 5 years Average policy term 10 years Average policy term Midwest Policy Profile (1) 3.50% Target Ceding Commission Rate 5.00% Target Ceding Commission Rate 1. Representative of indicative Midwest policy traits and MDWT’s target ceding commission rate figure for MYGA and FIA pro duc ts, as applicable. The targeted ceding commission rates are representative of rates previously obtained by the Company. Actual results may vary. 2. Assumes issuance of a FIA policy. Actual results may vary. | 3. Assumes MDWT manages 25% of assets generated from ann uit y premium. Ceding Commission Asset Management Fees (25% of assets managed) (3) Policy Administration Fees © Midwest Holding Inc. Reinsurers reimburse Midwest for policy acquisition and issuance costs Lifetime Policy Revenue MYGA FIA 30

Multiple Sources of Fee - Based and Recurring Revenue 31 Revenue Source Description GAAP Revenue Recognition Cash Flow Ceding Commissions • Fees received for sourcing annuity policies • Paid by reinsurer upon assumption of policies • Percentage of ceded premium Amortized over life of policy Received upfront Policy Administration Fees • Upfront and recurring fees for services provided to reinsurers and other non - affiliated entities • Primary services include policy administration and operational support Recognized as earned Same as GAAP Asset Management Fees • Recurring fees for managing assets on behalf of third - party reinsurers and other insurers • Manage a portion of the underlying assets Recognized as earned Same as GAAP Retained Investment Income • Net investment income from assets of net retained annuity policies • Investment income from equity capital Recognized as earned Same as GAAP © Midwest Holding Inc.
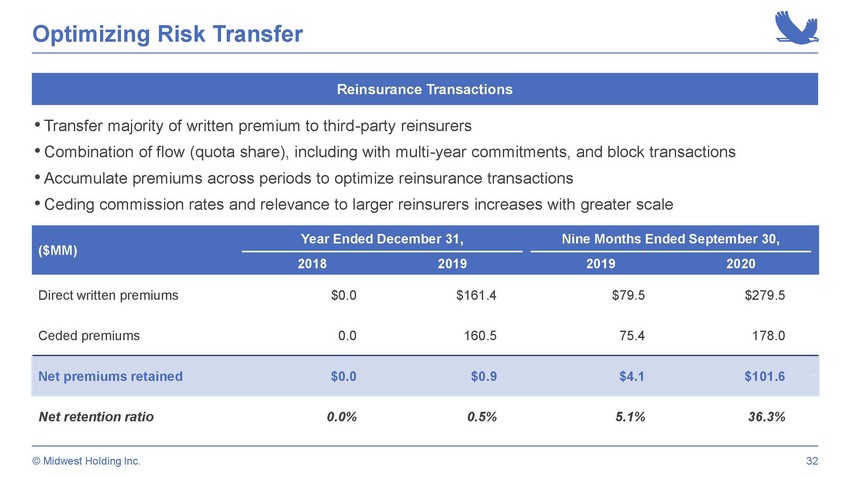
Optimizing Risk Transfer 32 Reinsurance Transactions • Transfer majority of written premium to third - party reinsurers • Combination of flow (quota share), including with multi - year commitments, and block transactions • Accumulate premiums across periods to optimize reinsurance transactions • Ceding commission rates and relevance to larger reinsurers increases with greater scale © Midwest Holding Inc. ($MM) Year Ended December 31, Nine Months Ended September 30, 2018 2019 2019 2020 Direct written premiums $0.0 $161.4 $79.5 $279.5 Ceded premiums 0.0 160.5 75.4 178.0 Net premiums retained $0.0 $0.9 $4.1 $101.6 Net retention ratio 0.0% 0.5% 5.1% 36.3%
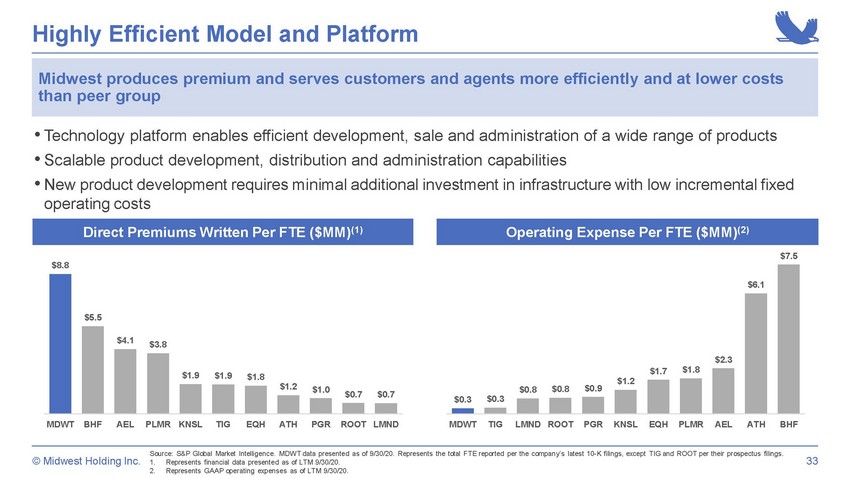
Highly Efficient Model and Platform 33 Highly Efficient Model and Platform • Technology platform enables efficient development, sale and administration of a wide range of products • Scalable product development, distribution and administration capabilities • New product development requires minimal additional investment in infrastructure with low incremental fixed operating costs Direct Premiums Written Per FTE ($MM) (1) Operating Expense Per FTE ($MM) (2) Source: S&P Global Market Intelligence. MDWT data presented as of 9/30/20. Represents the total FTE reported per the company’ s l atest 10 - K filings, except TIG and ROOT per their prospectus filings. 1. Represents financial data presented as of LTM 9/30/20. 2. Represents GAAP operating expenses as of LTM 9/30/20. Midwest produces premium and serves customers and agents more efficiently and at lower costs than peer group © Midwest Holding Inc. $0.3 $0.3 $0.8 $0.8 $0.9 $1.2 $1.7 $1.8 $2.3 $6.1 $7.5 MDWT TIG LMND ROOT PGR KNSL EQH PLMR AEL ATH BHF $8.8 $5.5 $4.1 $3.8 $1.9 $1.9 $1.8 $1.2 $1.0 $0.7 $0.7 MDWT BHF AEL PLMR KNSL TIG EQH ATH PGR ROOT LMND

Financial Highlights 34 Annualized Annuity Direct Written Premiums ($MM) Adjusted Revenue ($MM) (1) Adjusted Net Income ($MM) (2) $0 $161 $361 $132 $528 2018 2019 LTM 9/30/20 Q3 '20 $0 $7 $16 $8 $31 2018 2019 LTM 9/30/20 Q3 '20 $0 ($2) $2 $3 $11 2018 2019 LTM 9/30/20 Q3 '20 © Midwest Holding Inc. Note: Annualized figures represent the annualization of the Q3’ 2020 financial data, calculated as the Q3’ 2020 figures multiplied by four periods. 1. Represents the revenue we receive and retain taking into account the reinsurance transactions we complete. 2. Represents the impact of revenue we receive and retain taking into account the reinsurance transactions we complete.
Investment Highlights 35 Unique and Differentiated Value Proposition Entrepreneurial, Highly Experienced and Aligned Management Team Efficient and Flexible Capital Structure Effective Use of Technology Scalable, Low - Cost Operations Multiple Sources of Fee - Based Revenue Low - Risk, Profitable Business Model © Midwest Holding Inc.

© Midwest Holding Inc. Appendix 36

Non - GAAP Reconciliations 37 Last Twelve Months Nine Months Ended Year Ended Three Months Ended Ended September 30, September 30, December 31, September 30, 2020 2020 2019 2019 2020 2019 Annuity Premiums (SAP) Annuity direct written premiums 361,401,554$ 279,537,158$ 79,500,172$ 161,364,568$ 132,051,145$ 41,261,292$ Ceded premiums (263,033,514) (177,979,450) (75,439,664) (160,493,727) (58,991,559) (75,439,664) Net premiums retained 98,368,040$ 101,557,708$ 4,060,508$ 870,841$ 73,059,586$ (34,178,372)$ Adjusted Revenue Total revenue - GAAP 11,793,285$ 11,413,881$ 3,020,384$ 3,399,788$ (516,257)$ 452,136$ Adjustments: Net realized (gains) losses on investments (4,369,562) (4,369,562) - - 4,102,475 - Deferred coinsurance ceding commission 9,018,010 8,161,069 2,821,255 3,678,196 4,252,180 4,660,133 Adjusted revenue 16,441,733$ 15,205,388$ 5,841,639$ 7,077,984$ 7,838,398$ 5,112,269$ Adjusted Net Income Net (loss) income attributable to Midwest Holding Inc. - GAAP (2,270,097)$ (526,123)$ (3,989,684)$ (5,733,658)$ (5,537,242)$ (1,662,814)$ Adjustments: Net realized (gains) losses on investments (4,369,562) (4,369,562) - - 4,102,475 - Deferred coinsurance ceding commission 9,018,010 8,161,069 2,821,255 3,678,196 4,252,180 4,660,133 Total adjustments 4,648,448 3,791,507 2,821,255 3,678,196 8,354,655 4,660,133 Income tax (expense) benefit adjustment (1) - - - - - - Adjusted net (loss) income 2,378,351$ 3,265,384$ (1,168,429)$ (2,055,462)$ 2,817,413$ 2,997,319$ © Midwest Holding Inc. 1. All adjustments above do not have any tax impact.