Strong Large Cap Growth Fund (STRFX) Inactive
Filed: 1 Mar 04, 12:00am
OMB APPROVAL | ||
OMB Number: | 3235-0570 | |
Expires: | Nov. 30, 2005 | |
Estimated average burden | ||
hours per response: | 5.0 | |
UNITED STATES
SECURITIES AND EXCHANGE COMMISSION
Washington, D.C. 20549
FORM N-CSR
CERTIFIED SHAREHOLDER REPORT OF REGISTERED MANAGEMENT
INVESTMENT COMPANIES
Investment Company Act file number: 811-3254
Strong Large Cap Growth Fund, Inc.,
on behalf of Strong Large Cap Growth Fund
(Exact name of registrant as specified in charter)
| P.O. Box 2936 Milwaukee, WI | 53201 | |
| (Address of principal executive offices) | (Zip code) |
Richard Smirl, Strong Capital Management, Inc.
P.O. Box 2936 Milwaukee, WI 53201
(Name and address of agent for service)
Registrant’s telephone number, including area code: (414) 359-3400
Date of fiscal year end: December 31
Date of reporting period: December 31, 2003
Form N-CSR is to be used by management investment companies to file reports with the Commission not later than 10 days after the transmission to stockholders of any report that is required to be transmitted to stockholders under Rule 30e-1 under the Investment Company Act of 1940 (17 CFR 270.30e-1). The Commission may use the information provided on Form N-CSR in its regulatory, disclosure review, inspection, and policymaking roles.
A registrant is required to disclose the information specified by Form N-CSR, and the Commission will make this information public. A registrant is not required to respond to the collection of information contained in Form N-CSR unless the Form displays a currently valid Office of Management and Budget (“OMB”) control number. Please direct comments concerning the accuracy of the information collection burden estimate and any suggestions for reducing the burden to Secretary, Securities and Exchange Commission, 450 Fifth Street, NW, Washington, DC 20549-0609. The OMB has reviewed this collection of information under the clearance requirements of 44 U.S.C. (S) 3507.
Item 1. Reports to Shareholders
ANNUAL REPORT | December 31, 2003
Strong
Growth
Funds

| Strong Blue Chip Fund | ||
| Strong Discovery Fund | ||
| Strong Endeavor Fund | ||
| Strong Large Cap Growth Fund | ||
| Strong U.S. Emerging Growth Fund | ||
| Strong Enterprise Fund | ||
| Strong Growth 20 Fund | ||
| Strong Growth Fund | ||
| Strong Large Company Growth Fund | ||
 | ||
ANNUAL REPORT | December 31, 2003
Strong
Growth
Funds
Table of Contents
Investment Reviews | ||
| 2 | ||
| 4 | ||
| 6 | ||
| 8 | ||
| 10 | ||
| 12 | ||
| 14 | ||
| 16 | ||
| 18 | ||
Financial Information | ||
Schedules of Investments in Securities | ||
| 20 | ||
| 20 | ||
| 22 | ||
| 23 | ||
| 25 | ||
| 27 | ||
| 28 | ||
| 29 | ||
| 31 | ||
| 33 | ||
| 39 | ||
| 43 | ||
| 47 | ||
| 56 | ||
| 71 | ||
| 72 | ||
A Few Words From Dick Weiss

Market Update — January 1, 2003, to December 31, 2003
One of the great strengths of Strong Capital Management, Inc. (“Strong”), is the autonomy of its different investment teams. Unlike so many institutions where a single investment philosophy predominates and stock selection is done by committee, Strong is comprised of highly independent investment teams with individual philosophies and practices.
This independence notwithstanding, the investment teams share a common objective — adding value for shareholders.
Despite the turmoil surrounding the mutual fund industry and our firm during the last quarter of 2003, Strong’s investment teams performed admirably. According to Lipper, 74 percent of the Strong Funds beat their respective peer indices since their inception.*
Indeed, 2003 turned out to be a better year than anticipated by the investment world. In October of 2002, the market bottomed, and then began a steady advance upward into 2003. Troubled by the prospect of military conflict with Iraq, the market turned down in January and bottomed again in March. Once the outcome in Iraq
Economic Growth Rebounded in 2003

| * | Results are based on total returns. 110 of 149 funds, including separate share classes, outperformed their Lipper Peer Indices since the funds’ inception through 12-31-03. Investment values fluctuate. Results will vary for other time periods. Does not include effect of any loads (as applicable). |
(Continued on next page)
became clear, the market anticipated the major business recovery that materialized in the third and fourth quarters, and resumed its forward march. The S&P 500 Index, Dow Jones Industrial Average, and Nasdaq moved up smartly for the remainder of the year.
It was, in effect, a rising tide that lifted many boats. Stocks that had been especially battered by the three-year bear market — either because the market assumed their business models were broken or because they had been pushed to the edge of bankruptcy — enjoyed dramatic recoveries. Once it became clear that the economy had bottomed, many of the most downtrodden stocks rebounded like coiled springs and rose appreciably in the second half of 2003. This is a phenomenon that has typically occurred after tough bear markets and has generally lasted around 6-8 months. I believe we are approaching the end of this phase.
In some instances, I believe going against conventional wisdom in 2004 will spell the difference between average and exceptional performance. For example:
| • | Popular opinion has it that manufacturing — a sector which has suffered for roughly 30 years — will continue to falter in 2004. I disagree. It appears that 2004 may shape up to be the first synchronized global economic recovery in years. That, combined with a weak dollar, should make U.S. manufacturing goods increasingly competitive around the world and bolster the sector’s overall results. |
| • | The energy sector, which significantly underperformed in 2003, looks promising as well. While it participated in the fourth quarter rally, it lagged for the year and was nearing an all-time low, as a percentage of the S&P 500 Index. Energy prices were stronger than most observers expected in 2003. Given the likely increase in demand as the global economy expands, energy prices should remain at the upper end of their normal trading range. This scenario would allow individual energy stocks to play catch-up. |
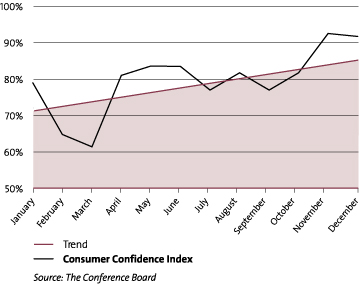
Here at home, the U.S. economy shows unmistakable signs of strengthening. Job growth is gaining momentum. Consumer confidence quite clearly is on the rise. All in all, it’s an encouraging combination.
If you accept the premise that there will be a wider divergence of performance this year, diversification becomes essential. It’s going to be harder to make money in 2004 than it was in 2003. But in a market environment where a rising tide will not lift all issues indiscriminately, diversified mutual funds can be a sound and sensible investment option.
Consumer Confidence Increased in 2003
Thank you for investing with Strong.

Richard T. Weiss
Vice Chairman
Strong Financial Corporation
The year 2003 proved to be a very strong year for equities, providing welcome relief from the three-year bear market. In this environment, the Strong Blue Chip Fund posted a return of 29.00% for the one-year period. This placed it slightly ahead of its broad-based benchmark, the S&P 500, which returned 28.67%.
Over the year, the Fund’s performance generally followed the same direction as the broader market. The Fund posted mild losses in the first quarter, when the markets and the economy were stalled by concerns about the war with Iraq. Over the remainder of the year, however, the Fund posted strong returns as the war’s quick resolution boosted investor and consumer confidence. Economic stimulus, in the form of tax cuts from the President and Congress, and continued low interest rates from the Federal Reserve helped to drive an economic rebound that supported strong equity performance across virtually every sector of the market.
Small caps led the market
In keeping with our “blue chip” mandate, this Fund focused on the stocks of high-quality, large-cap companies that we believed offer solid prospects for future growth and were available at reasonable prices. In the early stages of the year’s recovery, investors were still cautious, and thus favored larger-company stocks, which can offer a greater degree of stability than small-cap stocks. The Fund benefited strongly from this trend in the second quarter of the year.
As the economy showed signs of an accelerating recovery, though, investors gained more confidence and were willing to take on higher degrees of risk. This led to renewed interest in smaller-company stocks, driving their returns strongly forward in the second half of the year. Our portfolio was strongly skewed toward larger companies, so this shift in market direction was not entirely favorable to our relative returns. Less risk-wary investors also drove technology stocks higher, which did have a positive impact on a number of the Fund’s holdings.
While we retained a large-cap focus, in spring we expanded the universe of stocks eligible for inclusion in the portfolio. This roughly doubled the number of eligible stocks, giving us the ability to be both more flexible and more selective in our investments. This change contributed to the Fund’s improved performance in the late spring and the second half of the year. This does not mean that we are adding small caps to the Fund; it simply indicates that we have been able to make good use of our new ability to range outside of the very largest companies in the U.S.
Technology had strong returns
The return to favor of many technology and telecommunication stocks had a positive impact on the Fund’s performance. Among our successful holdings in these areas were eBay, Yahoo!, and Nextel Communications. We consider eBay and Yahoo! to be representatives of not only the technology sector but also a representative of consumer stocks. This characteristic was strongly evident in 2003, as the two appeared to benefit from strong consumer trends as well as renewed interest in the tech sector. The single most beneficial holding in the portfolio was also a technology stock: networking giant Cisco Systems. Because technology stocks have already experienced a strong run-up, we do not anticipate carrying a large overweighting in the sector (relative to our benchmark) in 2004.
In the second half of the year, we reduced the Fund’s exposure to healthcare stocks. As many stocks in the sector underperformed the market — particularly major pharmaceutical companies — this move benefited our returns. We believe we now can identify companies in the sector that offer good opportunities for growth, given their now much more reasonable valuations.
Recovery appears likely to continue
The consumer has led the economic recovery so far, with heavy spending in housing and cars. We believe consumer spending will continue to play a large role in economic growth in 2004. There are hopes for an improving employment picture, and that, along with continued benefits from 2003’s tax-cut legislation, should help to further the outlook for consumer spending. For this reason, we expect to emphasize consumer-oriented stocks in the portfolio.
Business spending may, however, now be moving into a leadership role, as evidenced by a resurgence in production and rising orders for capital goods. Considering all these factors, we have positioned the Fund to benefit from the global economic expansion that we anticipate will continue in 2004.
Thank you for your investment in the Strong Blue Chip Fund.

Karen E. McGrath
Portfolio Manager
2
Fund Highlights
Your Fund’s Approach
The Fund invests, under normal conditions, at least 80% of its net assets in blue chip companies. The Fund considers blue chip companies to be companies whose stock is included in the Russell Top 200 Growth Index or companies with a similar capitalization at the time of the Fund’s investment. The Fund invests in blue chip companies and focuses on companies its manager believes offers the potential for capital growth.
Average Annual Total Returns
As of 12-31-03
Investor Class | |||
1-year | 29.00 | % | |
3-year | -12.43 | % | |
5-year | -5.36 | % | |
Since Fund Inception (6-30-97) | 2.69 | % |
Equity funds are volatile investments and should only be considered for long-term goals.
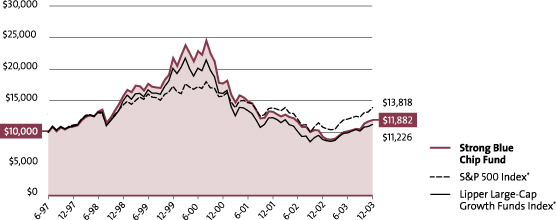
Growth of an Assumed $10,000 Investment†
From 6-30-97 to 12-31-03
Mention of specific securities in this report is not indicative of whether the Fund may make additional purchases of, sell all or a portion of, or continue to hold those securities.
| † | This graph, provided in accordance with SEC regulations, compares a $10,000 investment in the Fund, made at its inception, with the performance of the S&P 500 Index and the Lipper Large-Cap Growth Funds Index. Results include the reinvestment of all dividends and capital gains distributions. Performance is historical and does not represent future results. Investment returns and principal value vary, and you may have a gain or loss when you sell shares. Current performance may be lower or higher than the quoted performance. Call us or visit www.Strong.com for the most current performance information. The graph and the Average Annual Total Returns table do not reflect the deduction of taxes, if any, that a shareholder would pay on Fund distributions or the redemption of Fund shares. |
The Fund’s prospectus and statement of additional information may describe restrictions on the percentage of a particular type or quality of security in which the Fund may invest (“Percentage Restrictions”). Percentage Restrictions apply at the time the Fund purchases a security. Circumstances subsequent to the purchase of the security, such as a change in: (1) the Fund’s assets (e.g., due to cash inflows and redemptions); (2) the market value of the security; or (3) the pricing, liquidity, or rating of the security, may cause the Fund to exceed or fall short of the Percentage Restriction. If this happens, the Fund’s continued holding of the security will not constitute a violation of the Percentage Restriction.
From time to time, the Fund’s advisor and/or administrator has waived its fees and/or absorbed Fund expenses, which has resulted in higher returns.
| * | The S&P 500 Index consists of 500 stocks chosen for market size, liquidity, and industry group representation. It is a market value weighted index (stock price times number of shares outstanding), with each stock’s weight in the Index proportionate to its market value. The Lipper Large-Cap Growth Funds Index is the average of the 30 largest funds in the Lipper Large-Cap Growth Funds Category. Source of the S&P index data is Standard & Poor’s Micropal. Source of the Lipper index data is Lipper Inc. |
3
The Strong Discovery Fund delivered its best annual return to shareholders in more than a decade, gaining 38.34%. Nonetheless, the Fund’s positioning during the second quarter negatively affected the overall performance, resulting in the Fund trailing its broad-based benchmark, the Russell 2000 Index, which returned 47.25% for the year.
The return of the Russell 2000 was heavily influenced by the smallest companies in the index. In fact, micro-cap companies — those with market capitalizations of less than $500 million — produced a good deal of the index’s return. This Fund strives to keep a balance of both small- and mid-cap stocks to help manage risk. We believe this is a prudent long-term strategy, though it hindered our performance relative to our benchmark this past year.
Improvement in the economy and markets
The stock market improved considerably during the middle of 2003, as concerns about the conflict in Iraq eased, and the outlook for economic growth improved. Investor confidence improved significantly, and consumer spending remained robust. By the end of the year, signs of an impressive economic recovery became undeniable.
While we were not surprised by the fundamental strength of the economy or corporate earnings, we were surprised that high-volatility stocks experienced the strongest performance over the past year. This is evidenced by data indicating that the strongest performance in 2003 came from those companies that had the poorest returns on equity in addition to having the most volatile stock prices. Our focus on exhaustive, fundamental research tends to steer us away from such companies, which accounts for much of our underperformance this past year.
Intensive research drives the process
Our team of portfolio managers and analysts worked diligently in 2003 to research each individual holding for the Discovery Fund. Our research process is based on the idea of surrounding a company. This can be likened to the work of investigative journalists. We begin by thoroughly analyzing its financial statements, looking for strong earnings growth relative to the investment required to grow their businesses.
This year our research led us to a number of consumer discretionary holdings, including Urban Outfitters, which contributed significantly to performance. This lifestyle merchandising company operates specialty retail stores under the Urban Outfitters, Anthropologie, and Free People brands. Many elements of our research process helped us to identify the opportunity we believe this company represents. We hold extensive conversations with senior management, but also interview middle managers, sales personnel, and product or channel managers who can provide valuable insights into sales trends, customer interests, and the competitive landscape. These relationships help us to gain an understanding of the effectiveness of new product and customer initiatives. Information from competitors, suppliers, and customers helps to round out our understanding of a company.
Companies with distinct qualities
With our investigative research, we were able to determine that Urban Outfitters, which targets fashion-conscious young adults, offered unique merchandise that indicated a keen understanding of customer buying trends. We believed this company had an exciting growth opportunity in each of its store concepts, as the company grows from a relatively small base. We also believed the company would be able to grow smart, as it began to open more mall-based locations, which have a lower cost to operate.
Our research also led us to pay close attention to the healthcare sector, which was a robust contributor to portfolio performance in 2003. Fund holding Digene Corporation, a developer of gene-based testing systems for the screening of human diseases, performed especially well. Digene’s primary focus is on screening for women’s cancers and infectious diseases. During the year, Digene’s stock performed well as its testing products gained further acceptance and as the company continued its expansion in Europe.
When investing in small- and mid-cap companies, we believe that our research into companies of all sizes is a key advantage. Many small- and mid-cap companies compete, form partnerships, or do business with larger companies. With research that spans the market capitalization spectrum, we get unusual insights that enhance our ability to build a differentiated portfolio of growth stocks.
Our outlook for 2004
Investors enter 2004 with more optimism about the future for equities, supported by an improving economy and low interest rates and inflation. After the broad rally of the past year, however, we believe investors will be much more
4
Fund Highlights
Your Fund’s Approach
The Fund invests in securities that its managers believe offer attractive opportunities for growth. The Fund usually invests in a diversified portfolio of common stocks from small- and medium-capitalization companies. These are chosen through a combination of in-depth fundamental analysis of a company’s financial reports and direct, on-site research during company visits.
Average Annual Total Returns
As of 12-31-03
Investor Class | |||
1-year | 38.34 | % | |
5-year | 6.75 | % | |
10-year | 7.82 | % | |
Since Fund Inception (12-31-87) | 12.57 | % |
Equity funds are volatile investments and should only be considered for long-term goals.
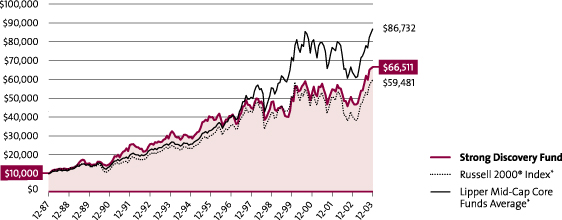
Growth of an Assumed $10,000 Investment†
From 12-31-87 to 12-31-03
Mention of specific securities in this report is not indicative of whether the Fund may make additional purchases of, sell all or a portion of, or continue to hold those securities.
| † | This graph, provided in accordance with SEC regulations, compares a $10,000 investment in the Fund, made at its inception, with the performance of the Russell 2000® Index and the Lipper Mid-Cap Core Funds Average. Results include the reinvestment of all dividends and capital gains distributions. Performance is historical and does not represent future results. Investment returns and principal value vary, and you may have a gain or loss when you sell shares. Current performance may be lower or higher than the quoted performance. Call us or visit www.Strong.com for the most current performance information. The graph and the Average Annual Total Returns table do not reflect the deduction of taxes, if any, that a shareholder would pay on Fund distributions or the redemption of Fund shares. |
The Fund’s prospectus and statement of additional information may describe restrictions on the percentage of a particular type or quality of security in which the Fund may invest (“Percentage Restrictions”). Percentage Restrictions apply at the time the Fund purchases a security. Circumstances subsequent to the purchase of the security, such as a change in: (1) the Fund’s assets (e.g., due to cash inflows and redemptions); (2) the market value of the security; or (3) the pricing, liquidity, or rating of the security, may cause the Fund to exceed or fall short of the Percentage Restriction. If this happens, the Fund’s continued holding of the security will not constitute a violation of the Percentage Restriction.
Because smaller companies often have narrower markets and limited financial resources, investments in theses stocks present more risk than investments in those of larger, more established companies.
From time to time, the Fund’s advisor and/or administrator has waived its fees and/or absorbed Fund expenses, which has resulted in higher returns.
| * | The Russell 2000® Index measures the performance of the 2,000 smallest companies in the Russell 3000® Index, which represents approximately 8% of the total market capitalization of the Russell 3000® Index. The Lipper Mid-Cap Core Funds Average is the average of all funds in the Lipper Mid-Cap Core Funds Category. Source of the Russell index data is Standard & Poor’s Micropal. Source of the Lipper index data is Lipper Inc. |
discriminating going forward. They are likely to reward companies with sustainable or improving growth, and punish those whose projections prove too optimistic — a situation that could particularly affect companies with the loftiest stock prices.
Thank you for your investment in the Strong Discovery Fund. We appreciate the trust you’ve placed in us.

Thomas J. Pence
Portfolio Co-Manager

James M. Leach
Portfolio Co-Manager
5
For the year ended December 31, 2003, the Strong Endeavor Fund delivered very solid returns, advancing 32.57%. It outperformed its broad-based index, the S&P 500, which returned 28.67% over the same period.
We had positioned the Fund to benefit from overall improvement in economic conditions and investor confidence. As that improvement took shape over the course of the year, the Fund posted solid performance. The Fund’s returns were largely driven by solid stock picking among the consumer discretionary, technology, and healthcare sectors of the market.
An investigative approach
Our team of portfolio managers and analysts worked diligently in 2003 to research each individual holding for the Fund. Our research process is based on the idea of surrounding a company. This can be likened to the work of investigative journalists, tapping into an extensive network of sources to develop an original investment opinion. We begin surrounding a company by thoroughly analyzing its financial statements, looking for companies that can produce strong earnings growth relative to the investment required to grow their businesses.
One of the companies this research led us toward in 2003 was Cisco Systems, the manufacturer of a broad array of networking and communications products. We seek to gain perspectives from many key individuals who directly affect the particular company or industry that is the subject of our research. We hold extensive conversations with senior management, but also interview middle managers, sales personnel, and product or channel managers who can provide valuable insights into sales trends, customer interests, and the competitive landscape. These relationships help us to gain an understanding of the effectiveness of new product and customer initiatives. Information from competitors, suppliers, and customers helps to round out our understanding.
In Cisco’s case, our research among component suppliers indicated that business trends were improving across most of the company’s customer base. Indeed, Cisco was able to announce an important new contract with the U.S. Defense Department to build a high-speed data network. Cisco’s solid operating leverage, improving business trends, and reduced product backlog and lead times were all positive for the company’s stock.
Healthy performers for the fund
Semiconductor manufacturer Intel Corporation was also a solid holding during the period. The semiconductor industry fared well this year, and Intel rose on the strength in demand as it witnessed a solid push in the markets for servers, desktop computers, and mobile devices. Also, the company continued to benefit from high expectations that its Centrino chipset will allow it to build considerable market share in the growing laptop market.
Finally, as demand for leisure travel improved this year, our carefully researched holdings in the travel sector contributed positively to returns. For example, Royal Caribbean, one of the world’s largest cruise lines, benefited from improved bookings and its strong position among its competitors. As the economy strengthened, we detected improving leisure travel as trends returned to normal after three years of below-average results.
We believe that our research of companies of all sizes is a key advantage even when investing in larger-cap companies. Many large companies compete, form partnerships, or do business with smaller and midsize companies. With research that spans the market-capitalization spectrum, we get unusual insights that enhance our ability to build a differentiated portfolio of growth stocks.
A positive outlook overall
We expect economic and corporate earnings growth to continue at a moderate pace in the coming year. Inflation appears to be at a sustainably low level, with strong productivity gains and job growth finally picking up. These factors should provide a solid foundation for the equity markets next year.
There is, however, potential for rising interest rates due to a weaker dollar and improving economy, which could hamper stock returns somewhat. In this environment, we intend to continue to maintain a balance of core growth holdings and develop growth stocks in the portfolio. Our aim is to take advantage of the opportunities that may present themselves in 2004, while prudently managing risk.
Thank you for your investment in the Strong Endeavor Fund. We appreciate the trust you’ve placed in us.
Thomas J. Pence
Portfolio Co-Manager
D. Paul Berg
Portfolio Co-Manager
6
Fund Highlights
Your Fund’s Approach
The Fund focuses on companies that its managers believe have above-average earnings growth prospects. The Fund invests primarily in large-capitalization companies but also invests in small- and medium-capitalization companies. The Fund’s managers select companies that have attractive growth prospects, accelerating sales and earnings, and positive fundamentals.
Average Annual Total Returns
As of 12-31-03
Investor Class | |||
1-year | 32.57 | % | |
Since Fund Inception (4-6-01) | -2.54 | % |
Equity funds are volatile investments and should only be considered for long-term goals.
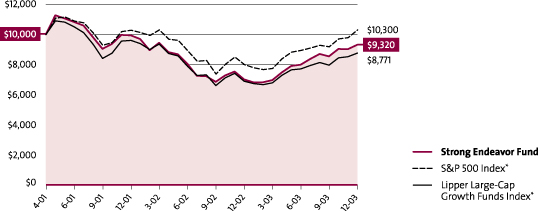
Growth of an Assumed $10,000 Investment†
From 4-6-01 to 12-31-03
Mention of specific securities in this report is not indicative of whether the Fund may make additional purchases of, sell all or a portion of, or continue to hold those securities.
| † | This graph, provided in accordance with SEC regulations, compares a $10,000 investment in the Fund, made at its inception, with a similar investment in the S&P 500 Index and the Lipper Large-Cap Growth Funds Index. Results include the reinvestment of all dividends and capital gains distributions. Performance is historical and does not represent future results. Investment returns and principal value vary, and you may have a gain or a loss when you sell shares. Current performance may be lower or higher than the quoted performance. Call us or visit www.Strong.com for the most current performance information. The graph and the Average Annual Total Returns table do not reflect the deduction of taxes, if any, that a shareholder would pay on Fund distributions or the redemption of Fund shares. |
The Fund’s prospectus and statement of additional information may describe restrictions on the percentage of a particular type or quality of security in which the Fund may invest (“Percentage Restrictions”). Percentage Restrictions apply at the time the Fund purchases a security. Circumstances subsequent to the purchase of the security, such as a change in: (1) the Fund’s assets (e.g., due to cash inflows and redemptions); (2) the market value of the security; or (3) the pricing, liquidity, or rating of the security, may cause the Fund to exceed or fall short of the Percentage Restriction. If this happens, the Fund’s continued holding of the security will not constitute a violation of the Percentage Restriction.
From time to time, the Fund’s advisor and/or administrator has waived its fees and/or absorbed Fund expenses, which has resulted in higher returns.
| * | The S&P 500 Index consists of 500 stocks chosen for market size, liquidity, and industry group representation. It is a market value weighted index (stock price times number of shares outstanding), with each stock’s weight in the Index proportionate to its market value. The Lipper Large-Cap Growth Funds Index is the average of the 30 largest funds in the Lipper Large-Cap Growth Funds Category. Source of the S&P index data is Standard & Poor’s Micropal. Source of the Lipper index data is Lipper Inc. |
7
The year 2003 offered extraordinary returns for equity investors, as double-digit returns surpassed the common expectations after a three-year bear market. The Strong Large Cap Growth Fund was up a solid 26.83% for the year, performance that placed it just behind its broad-based S&P 500 Index, which returned 28.67% for the same period.
Economic stimulus efforts worked
Stock markets surged upward around the world as central banks, including the U.S. Federal Reserve, took active steps to ignite languishing global economies. In the U.S., the Fed’s efforts received an extra boost from the tax cuts provided by the President and Congress.
The economic stimulus had its desired impact, and as economic activity increased, corporate earnings improved, and investors gained some much-needed confidence to buy stocks. The change was dramatic, with the equity markets rallying by more than 35% off the lows they hit in March.
While many positive fundamental trends provided welcome support for this year’s rally, the equity market included a speculative element as well. This is evidenced by data indicating that the strongest performance in 2003 came from those companies that had the poorest returns on equity in addition to having the most volatile stock prices. Our process tends to steer us away from such companies, which accounts for much of our underperformance this past year.
A hands-on research process
Our investment process to discover long-term winners was very fundamental in nature. First, we did our financial homework and kicked the tires, meeting directly with company management — and researching competitors as well, to gain a broader understanding of the opportunities and pressures within an industry. We then considered this company-specific research in light of our overall outlook on the direction of the economy, as well as any broad investment themes that we believed could provide a favorable tailwind for specific sectors and industries. Among the themes we considered were the impact of the aging of the baby boomer generation, the emergence of China as an economic power, and the rising demand for healthcare products and services.
Managing risk is essential, given that growth stocks tend to be more volatile than value-oriented stocks. We sought to diversify the Fund by owning 80 to 100 stocks in the portfolio, spanning many industries. Our discipline for selling stocks was also driven by our eye toward risk management. We set target prices for the stocks the Fund owns, and we continuously monitored the relevant valuation measures for our holdings. We also watched for changes in fundamental conditions that could hurt the prospects for one or more of the Fund’s holdings.
Two examples from the portfolio
Intel is an example of one of the Fund’s largest holdings, and one of its biggest gainers in 2003. As the world’s largest manufacturer of microprocessors for personal computers and other uses through the technology and telecommunications industries, Intel has emerged from the post-Y2K technology recession as an even stronger and more dominant competitor. Intel managed to remain profitable throughout the recession while awaiting an economic recovery by offering a host of new products, including the Centrino processor for mobile computers.
Another large Fund holding that performed during the year was Home Depot. In early 2003, Home Depot was commonly viewed as a broken, one-time growth stock with a new management team that didn’t understand the retail business and had carelessly destroyed the company’s famous culture of customer service. We didn’t accept the conventional wisdom at face value and instead looked more closely at the company’s CEO, Bob Nardelli. After carefully researching his reputation and previous track record, and by listening to his plans for turning around the troubled retailer, we formed a much more positive opinion and invested in the stock. In 2003, Nardelli’s initiatives, supported by a buoyant housing market, enabled Home Depot to exceed consensus earnings expectations and caused its stock to outperform for the year.
Economy could remain strong
Our outlook for the coming months is continued economic strength with the Federal Reserve keeping interest rates low through the first half of the year. These factors, combined with the tendency for Presidential election years to be friendly to the equity markets, should provide a good backdrop for stocks in early 2004. We therefore believe the companies that can benefit from a stronger economic environment should do well in the coming year.
8
Fund Highlights
Your Fund’s Approach
The Fund invests in stocks of large-capitalization companies that its manager believes offer the potential for capital growth. The Fund’s manager seeks to identify companies that have superior sales and earnings, enjoy a competitive advantage, and have effective management. Although the Fund can invest in stocks of any economic sector, at times it may emphasize one or more particular sectors.
Average Annual Total Returns
As of 12-31-03
Investor Class | |||
1-year | 26.83 | % | |
5-year | -3.59 | % | |
10-year | 6.92 | % | |
Since Fund Inception (12-30-81) | 11.82 | % |
Equity funds are volatile investments and should only be considered for long-term goals.
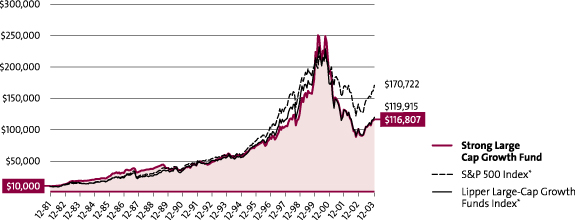
Growth of an Assumed $10,000 Investment†
From 12-30-81 to 12-31-03
Mention of specific securities in this report is not indicative of whether the Fund may make additional purchases of, sell all or a portion of, or continue to hold those securities.
| † | This graph, provided in accordance with SEC regulations, compares a $10,000 investment in the Fund, made at its inception, with the performance of the S&P 500 Index and the Lipper Large-Cap Growth Funds Index. Results include the reinvestment of all dividends and capital gains distributions. Performance is historical and does not represent future results. Investment returns and principal value vary, and you may have a gain or loss when you sell shares. Current performance may be lower or higher than the quoted performance. Call us or visit www.Strong.com for the most current performance information. The graph and the Average Annual Total Returns table do not reflect the deduction of taxes, if any, that a shareholder would pay on Fund distributions or the redemption of Fund shares. |
The Fund’s prospectus and statement of additional information may describe restrictions on the percentage of a particular type or quality of security in which the Fund may invest (“Percentage Restrictions”). Percentage Restrictions apply at the time the Fund purchases a security. Circumstances subsequent to the purchase of the security, such as a change in: (1) the Fund’s assets (e.g., due to cash inflows and redemptions); (2) the market value of the security; or (3) the pricing, liquidity, or rating of the security, may cause the Fund to exceed or fall short of the Percentage Restriction. If this happens, the Fund’s continued holding of the security will not constitute a violation of the Percentage Restriction.
From time to time, the Fund’s advisor and/or administrator has waived its fees and/or absorbed Fund expenses, which has resulted in higher returns.
| * | The S&P 500 Index consists of 500 stocks chosen for market size, liquidity, and industry group representation. It is a market value weighted index (stock price times number of shares outstanding), with each stock’s weight in the Index proportionate to its market value. The Lipper Large-Cap Growth Funds Index is the average of the 30 largest funds in the Lipper Large-Cap Growth Funds Category. Source of the S&P index data is Standard & Poor’s Micropal. Source of the Lipper index data is Lipper Inc. |
Thank you for your continued investment in the Strong Large Cap Growth Fund. We appreciate the confidence you’ve placed in us.

Bruce C. Olson
Portfolio Manager
9
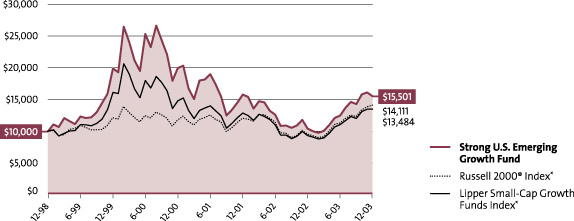
Strong U.S. Emerging Growth Fund
For the year ended December 31, 2003, the Strong U.S. Emerging Growth Fund returned 48.70%, placing it ahead of its broad-based benchmark, the Russell 2000 Index, which returned 47.25% for the same period.
The economic climate improved as the year progressed, as did the Fund’s performance. We believed that the Federal Reserve would maintain its accommodative stance on interest rates and also anticipated that the fiscal stimulus measures — particularly tax cuts — pursued by President Bush in advance of the election year would provide further support for economic recovery.
Based on our economic outlook, we decided to emphasize in the portfolio those companies and sectors that were positioned to benefit from a recovering economy. This move played a large part in the Fund’s strong relative and absolute performance.
There was also a change in market leadership; where value stocks had prevailed in less certain times, growth stocks came to the fore as the economic recovery took firm hold.
Prepared for recovery
The most notable event in the first half of 2003 was the war in Iraq. Uncertainty leading up to the war caused consumer and business confidence to plummet, making it very difficult to manage growth stock portfolios. In November 2002, we repositioned the Fund in anticipation of improving business conditions and increasing consumer confidence, positioning that hurt performance in the year’s first quarter.
As the major portion of the war came to a quick resolution, however, confidence returned to the economy and the markets. Improvement began in the second quarter, and in the third and fourth quarters the signs of economic recovery became much clearer. The resumption of economic growth coupled with low interest rates and inflation provided a very positive backdrop for small- and mid-cap growth stocks. We expect these positive conditions to continue into the future.
Favored sectors for the fund
We added to our holdings in those groups that have traditionally done well coming out of slow economic periods. These include trucking companies, freight forwarders, retailers, restaurants, and technology companies. For different reasons, we also began to add to our position in the energy sector. After three years of almost no drilling among these companies, we began to see an upturn in such activity. This suggested that a new natural-gas production cycle was beginning, which would be a positive development given the very constrained supply situation that existed.
To accommodate these additions to the portfolio, we reduced our holdings among some of the more defensive stocks in our portfolio. While these companies retained appealing characteristics, they historically have underperformed faster-growing sectors during an economic recovery.
Our outlook is positive
The shift in market leadership from value to growth stocks helped drive our performance in 2003. Typically, such cycles of outperformance for an investment style have lasted from three to five years. While we will carefully monitor the market and economic climate for changing conditions, we find this historical pattern to be encouraging as we look to the months and years ahead.
We anticipate that the positive environment for small- and mid-cap growth stocks should persist for some time to come. Based on our research, we believe that corporate profits may exceed expectations in 2004. Continued low interest rates and inflation, along with the still significant amounts of investable cash that remains on the sidelines, could help fuel the next move upward in the broader market in general, and smaller-cap growth stocks specifically.
Thank you for your investment in the Strong U.S. Emerging Growth Fund.

Thomas L. Press
Portfolio Co-Manager
Donald M. Longlet
Portfolio Co-Manager
Robert E. Scott
Portfolio Co-Manager
10
Fund Highlights
Your Fund’s Approach
The Fund invests in stocks of U.S. companies that appear to have relatively strong long-term growth potential in revenues and profitability. To identify these companies, the managers look for several characteristics, including strong revenue growth, high return on invested capital, overall financial strength, competitive advantages, reasonable current stock price, effective management, and competence in research, development, and marketing.
Average Annual Total Returns
As of 12-31-03
Investor Class | |||
1-year | 48.70 | % | |
3-year | -8.06 | % | |
5-year | 9.16 | % | |
Since Fund Inception (12-31-98) | 9.16 | % |
The Fund’s return since inception was significantly enhanced through investments in initial public offerings. You should not expect that such favorable returns can be consistently achieved. Please consider this before investing. Equity funds are volatile investments and should only be considered for long-term goals.
Growth of an Assumed $10,000 Investment†
From 12-31-98 to 12-31-03
Mention of specific securities in this report is not indicative of whether the Fund may make additional purchases of, sell all or a portion of, or continue to hold those securities.
| † | This graph, provided in accordance with SEC regulations, compares a $10,000 investment in the Fund, made at its inception, with the performance of the Russell 2000® Index and the Lipper Small-Cap Growth Funds Index. Results include the reinvestment of all dividends and capital gains distributions. Performance is historical and does not represent future results. Investment returns and principal value vary, and you may have a gain or loss when you sell shares. Current performance may be lower or higher than the quoted performance. Call us or visit www.Strong.com for the most current performance information. The graph and the Average Annual Total Returns table do not reflect the deduction of taxes, if any, that a shareholder would pay on Fund distributions or the redemption of Fund shares. |
The Fund’s prospectus and statement of additional information may describe restrictions on the percentage of a particular type or quality of security in which the Fund may invest (“Percentage Restrictions”). Percentage Restrictions apply at the time the Fund purchases a security. Circumstances subsequent to the purchase of the security, such as a change in: (1) the Fund’s assets (e.g., due to cash inflows and redemptions); (2) the market value of the security; or (3) the pricing, liquidity, or rating of the security, may cause the Fund to exceed or fall short of the Percentage Restriction. If this happens, the Fund’s continued holding of the security will not constitute a violation of the Percentage Restriction.
From time to time, the Fund’s advisor and/or administrator has waived its fees and/or absorbed Fund expenses, which has resulted in higher returns.
Because smaller companies often have narrower markets and limited financial resources, investments in these stocks present more risk than investments in those of larger, more established companies.
| * | The Russell 2000® Index measures the performance of the 2,000 smallest companies in the Russell 3000® Index, which represents approximately 8% of the total market capitalization of the Russell 3000® Index. The Lipper Small-Cap Growth Funds Index is the average of the 30 largest funds in the Lipper Small-Cap Growth Funds Category. Source of the Russell index data is Standard & Poor’s Micropal. Source of the Lipper index data is Lipper Inc. |
11
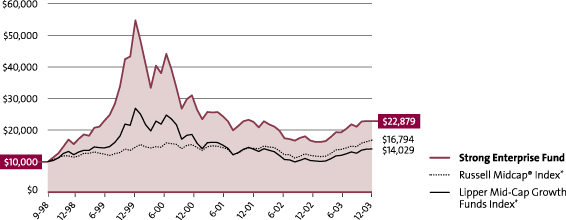
During the year, the Strong Enterprise Fund delivered solid gains to shareholders, advancing by 36.98% for the year ended December 31, 2003. The Fund’s returns lagged those of its broad-based benchmark, the Russell Midcap Index, which returned 40.06% for the same period.
While many positive fundamental trends provided welcome support for this year’s rally, the equity market included a speculative element as well. This is evidenced by data indicating that the strongest performance in 2003 came from those companies that had the poorest returns on equity in addition to having the most volatile stock prices. Our focus on exhaustive, fundamental research tends to steer us away from such companies, which accounts for much of our underperformance this past year.
An investigative investment process
Our team of portfolio managers and analysts worked diligently in 2003 to research each individual holding for the Enterprise Fund. Our research process is based on the idea of surrounding a company. This can be likened to the work of investigative journalists. We begin surrounding a company by thoroughly analyzing its financial statements, looking for companies that can produce strong earnings growth relative to the investment required to grow their businesses.
This year, our research led us to a number of consumer discretionary holdings, including Harman International Industries, that were strong performers during the year. Harman markets high-fidelity audio products and electronic systems for the consumer and professional markets. Many elements of our research process helped us to identify the opportunity we believed this company represented.
We hold extensive conversations with senior management, but we also interview middle managers, sales personnel, and product or channel managers who can provide valuable insights into sales trends, customer interests, and the competitive landscape. These relationships help us to gain an understanding of the effectiveness of new product and customer initiatives. Information from competitors, suppliers, and customers helps to round out our understanding of a company.
With our investigative research, we were able to determine that Harman was continuing to benefit from rolling out its Harman Infotainment system to higher-end auto manufacturers. The Harman system also helps auto manufacturers decrease costs by simplifying the assembly process. We believed Harman’s customer base should allow it to generate solid long-term revenue and earnings growth.
Ideas in many parts of the market
Another consumer holding our research drew us toward was Marvel Enterprises, the character-based entertainment company. Over the past couple of years, Marvel has transformed its business to focus on licensing its characters, which has decreased the level of capital invested and increased profit margins. We expected the company’s international licensing to expand dramatically over the next few years, and we believed Marvel’s deep pipeline of movie and toy licensing opportunities would continue to support strong profit growth.
We also were able to identify opportunities in other sectors of the market. For example, Millennium Pharmaceuticals was a solid performer during the year. Millennium focuses on developing products for cardiovascular diseases as well as cancer. The company also has potential products in earlier stages of development in each of those areas, as well as in the inflammatory disease and metabolic disease fields. Our research among physicians and other healthcare industry participants indicated that Millennium had products poised to experience strong growth and be well received by the medical community.
When investing in mid-cap companies, we believe that our research into companies of all sizes is a key advantage. Many mid-size companies compete, form partnerships, or do business with both small and large companies. With research that spans the market capitalization spectrum, we get unusual insights that enhance our ability to build a differentiated portfolio of growth stocks.
Our outlook for the year ahead
Investors enter 2004 with more optimism about the future for equities; supported by an improving economy and low interest rates and inflation. After the broad rally of the past year, however, we believe investors will be much more discriminating going forward. They are likely to reward companies with sustainable or improving growth, and punish those whose projections prove too optimistic — a situation that could particularly affect companies with the loftiest stock prices.
Thank you for your investment in the Strong Enterprise Fund. We appreciate the trust you’ve placed in us.
Thomas J. Pence
Portfolio Manager
12
Fund Highlights
Your Fund’s Approach
The Fund typically invests in stocks of small- and medium-capitalization companies, though it may invest in companies of any size. It focuses on companies that the manager believes are positioned for rapid growth of revenue and earnings. The Fund’s manager strives to find leading companies in rapidly growing industries such as business services, computer and digital products, financial services, healthcare services, Internet-related companies, medical technology, retail, and telecommunication.
Average Annual Total Returns
As of 12-31-03
Investor Class | |||
1-year | 36.98 | % | |
3-year | -8.43 | % | |
5-year | 9.19 | % | |
Since Fund Inception (9-30-98) | 17.07 | % | |
Institutional Class1 | |||
1-year | 37.55 | % | |
3-year | -8.31 | % | |
5-year | 9.28 | % | |
Since Fund Inception (9-30-98) | 17.16 | % | |
Advisor Class2 | |||
1-year | 37.39 | % | |
3-year | -8.36 | % | |
5-year | 9.12 | % | |
Since Fund Inception (9-30-98) | 16.98 | % | |
Class K3 | |||
1-year | 37.89 | % | |
3-year | -8.15 | % | |
5-year | 9.39 | % | |
Since Fund Inception (9-30-98) | 17.27 | % | |
Equity funds are volatile investments and should only be considered for long-term goals.
Growth of an Assumed $10,000 Investment †
From 9-30-98 to 12-31-03
Mention of specific securities in this report is not indicative of whether the Fund may make additional purchases of, sell all or a portion of, or continue to hold those securities.
| † | This graph, provided in accordance with SEC regulations, compares a $10,000 investment in the Fund, made at its inception, with the performance of the Russell Midcap® Index and the Lipper Mid-Cap Growth Funds Index. Results include the reinvestment of all dividends and capital gains distributions. Performance is historical and does not represent future results. Investment returns and principal value vary, and you may have a gain or loss when you sell shares. Current performance may be lower or higher than the quoted performance. Call us or visit www.Strong.com for the most current performance information. The graph and the Average Annual Total Returns table do not reflect the deduction of taxes, if any, that a shareholder would pay on Fund distributions or the redemption of Fund shares. This graph is based on Investor Class shares only; performance for other classes will vary, due to differences in fee structures. |
The Fund’s prospectus and statement of additional information may describe restrictions on the percentage of a particular type or quality of security in which the Fund may invest (“Percentage Restrictions”). Percentage Restrictions apply at the time the Fund purchases a security. Circumstances subsequent to the purchase of the security, such as a change in: (1) the Fund’s assets (e.g., due to cash inflows and redemptions); (2) the market value of the security; or (3) the pricing, liquidity, or rating of the security, may cause the Fund to exceed or fall short of the Percentage Restriction. If this happens, the Fund’s continued holding of the security will not constitute a violation of the Percentage Restriction.
From time to time, the Fund’s advisor and/or administrator has waived its fees and/or absorbed Fund expenses, which has resulted in higher returns.
| 1 | The performance of the Institutional Class shares prior to 6-30-03 is based on the Fund’s Investor Class shares’ performance. Please consult a prospectus for information about all share classes. |
| 2 | The performance of the Advisor Class shares prior to 2-24-00 is based on the Fund’s Investor Class shares’ performance, restated for the higher expense ratio of the Advisor Class shares. Please consult a prospectus for information about all share classes. |
| 3 | The performance of Class K shares prior to 8-30-02 is based on the Fund’s Investor Class shares’ performance. Please consult a prospectus for information about all share classes. |
Because smaller companies often have narrower markets and limited financial resources, investments in these stocks present more risk than investments in those of larger, more established companies.
| * | The Russell Midcap® Index measures the performance of the 800 smallest companies in the Russell 1000® Index, which represent approximately 26% of the total market capitalization of the Russell 1000® Index. The Lipper Mid-Cap Growth Funds Index is the average of the 30 largest funds in the Lipper Mid-Cap Growth Funds Category. Source of the Russell index data is Standard & Poor’s Micropal. Source of the Lipper index data is Lipper Inc. |
13
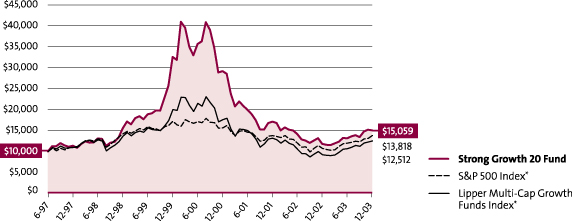
After enduring three consecutive years of negative returns in the equity markets, investors had something to smile about in 2003. For the year ended December 31, 2003, the Strong Growth 20 Fund posted a solid return of 27.18%, roughly in line with the broad-based S&P 500 Index return of 28.67%.
Many factors drove performance
During the year, several factors combined to create a very favorable investing climate. Among these factors were economic stimulus from new tax cuts, reduction of geopolitical uncertainties, and continued low interest rates and inflation. The positive impact was felt in both growth and value stocks, and across nearly all sectors of the economy.
The stocks that were the top contributors to the Fund’s performance over the year were in the consumer sector. This segment of the market experienced above-average growth as the economy strengthened over the course of the year. The Fund’s weaker holdings were confined mainly to the technology and energy sectors and hurt the performance of the Fund relative to the S&P 500 Index.
Our investment process
Research drives our process of selecting stocks for the Strong Growth 20 Fund. For a stock to be chosen for inclusion in the Fund, it must display — or have solid prospects for displaying — above-average growth trends in revenue, earnings, or both. Identifying stocks that are experiencing this growth is important. But what matters the most in our investment process is seeking to discern growth trends that are sustainable, as opposed to those that are likely to be short-lived.
In order for a company to make the most of its growth opportunities, it must also have a solid management team in place. For that reason, we analyze management’s track record of execution and often take time to get to know a company’s managers before buying its stock. Through our thorough, hands-on research, we also seek to determine whether their business plan is sensible and offers opportunities for future expansion. Finally, before we add a stock to the portfolio, we consider whether it fits in with our overall economic view, as well as one or more of the important investment themes that guide our market outlook. These trends include the aging of the overall population and the changes technological innovation can bring to virtually every part of the economy.
Harman International Industries is a company that met the above criteria — and it proved to be an excellent holding for the Fund during the year. Harman makes information, entertainment, and navigation systems used in a variety of automobiles. We were attracted to Harman because we recognized its element of sustainable, above-average growth, driven by their systems’ increasing popularity and management’s ability to take advantage of their opportunities. Harman was able to increase both the number of automobile makers to which it sells and its sales per vehicle. The result was outstanding revenue and earnings growth.
Our decision to sell a stock is generally based on criteria that are essentially the opposite of our buying criteria. We may sell a stock when we see a deterioration in fundamentals that threatens the sustainability of a company’s existing or prospective growth. Conditions that could cause this may include, but are not limited to, changes we see in the economy, a new competitive threat, or a change in management personnel or direction.
Maintaining a positive outlook
Our outlook for the next few months remains positive, as we expect the economy to benefit from continued low interest rates and inflation. This environment should allow for solid growth in corporate profits, which of course is beneficial to stock prices.
As has been our practice, we expect to continue to seek out the fastest-growing companies we can identify that we believe fit within the framework of our time-tested investment process.
We thank you for your continued investment in the Strong Growth 20 Fund.

Brandon M. Nelson
Portfolio Manager
14
Fund Highlights
Your Fund’s Approach
The Fund focuses on the stocks of 20 to 30 companies that its manager believes have favorable prospects for superior growth of earnings but are selling at reasonable valuations based on their earnings, cash flow, or asset value. Although the Fund can invest in stocks of any economic sector, at times it may emphasize one or more particular sectors.
Average Annual Total Returns
As of 12-31-03
Investor Class | |||
1-year | 27.18 | % | |
3-year | -19.81 | % | |
5-year | -0.63 | % | |
Since Fund Inception (6-30-97) | 6.50 | % | |
Advisor Class1 | |||
1-year | 27.48 | % | |
3-year | -19.67 | % | |
5-year | -0.64 | % | |
Since Fund Inception (6-30-97) | 6.43 | % | |
The Fund’s return since inception was significantly enhanced through investments in initial public offerings. You should not expect that such favorable returns can be consistently achieved. Please consider this before investing. Equity funds are volatile investments and should only be considered for long-term goals.
Growth of an Assumed $10,000 Investment†
From 6-30-97 to 12-31-03
Mention of specific securities in this report is not indicative of whether the Fund may make additional purchases of, sell all or a portion of, or continue to hold those securities.
| † | This graph, provided in accordance with SEC regulations, compares a $10,000 investment in the Fund, made at its inception, with the performance of the S&P 500 Index and the Lipper Multi-Cap Growth Funds Index. Results include the reinvestment of all dividends and capital gains distributions. Performance is historical and does not represent future results. Investment returns and principal value vary, and you may have a gain or loss when you sell shares. Current performance may be lower or higher than the quoted performance. Call us or visit www.Strong.com for the most current performance information. The graph and the Average Annual Total Returns table do not reflect the deduction of taxes, if any, that a shareholder would pay on Fund distributions or the redemption of Fund shares. This graph is based on Investor Class shares only; performance for other classes will vary, due to differences in fee structures. |
The Fund’s prospectus and statement of additional information may describe restrictions on the percentage of a particular type or quality of security in which the Fund may invest (“Percentage Restrictions”). Percentage Restrictions apply at the time the Fund purchases a security. Circumstances subsequent to the purchase of the security, such as a change in: (1) the Fund’s assets (e.g., due to cash inflows and redemptions); (2) the market value of the security; or (3) the pricing, liquidity, or rating of the security, may cause the Fund to exceed or fall short of the Percentage Restriction. If this happens, the Fund’s continued holding of the security will not constitute a violation of the Percentage Restriction.
From time to time, the Fund’s advisor and/or administrator has waived its fees and/or absorbed Fund expenses, which has resulted in higher returns.
| 1 | The performance of the Advisor Class shares prior to 2-24-00 is based on the Fund’s Investor Class shares’ performance, restated for the higher expense ratio of the Advisor Class shares. Please consult a prospectus for information about all share classes. |
The Fund is nondiversified, meaning it may concentrate its assets in fewer individual holdings than a diversified fund. Therefore, the Fund is more exposed to individual stock volatility and market pressure than a fully diversified fund.
| * | The S&P 500 Index consists of 500 stocks chosen for market size, liquidity, and industry group representation. It is a market value weighted index (stock price times number of shares outstanding), with each stock’s weight in the Index proportionate to its market value. The Lipper Multi-Cap Growth Funds Index is the average of the 30 largest funds in the Lipper Multi-Cap Growth Funds Category. Source of the S&P index data is Standard & Poor’s Micropal. Source of the Lipper index data is Lipper Inc. |
15
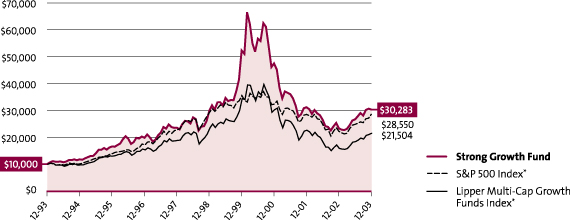
In a strong year for equities across the board, the Strong Growth Fund outperformed its broad-based benchmark, the S&P 500 Index. The Fund posted a return of 30.13% for the year ended December 31, 2003, while the S&P 500 returned 28.67%.
The stock market in 2003 was driven by three major trends. First, the newly enacted tax cuts offered the potential for stimulus to the economy and also provided a boost to investors’ anticipated after-tax returns. Second, the economy displayed solid improvement through the year, accelerating in the second half. Third, the credit and capital markets opened up dramatically, giving companies the opportunity to repair troubled balance sheets.
Overall, this environment favored the lowest-quality stocks the most, as the market found it had less reason to worry about these companies’ long-term viability. For most of the year, we positioned the Fund in stocks and sectors that we believed were likely to benefit strongly from the improving economy.
Seeking out fast-growing companies
Our process for selecting individual stocks has proprietary research at its core. The underlying theme to our process is the continual search for companies with superior business models that can achieve earnings growth by increasing their revenues and gaining market share.
Apollo Group is a good example to demonstrate our investment process. The company offers higher education both on campuses and via the Internet through its University of Phoenix operations. The company fit into an important investment theme that we follow, the dramatic economic growth associated with the very large echo boomer generation (that is, the children of the original baby boomers). This generation is now moving into its post-secondary education years, providing a generous tailwind for the University of Phoenix’s growth.
The company gained market share, strongly outpacing most of the post-secondary education market. Furthermore, it met our criteria for revenue growth, positive earnings surprises, return on invested capital, and consistency of performance. We supplemented our quantitative research with regular visits to the company to evaluate whether our growth expectations remained reasonable or needed to be revised upward or downward.
Choosing when to sell a stock
With Apollo Group, we observed times where the price of the stock was near our valuation targets — that is, the price we believed fully reflected its intrinsic value. As we do with other stocks in the portfolio, we took the opportunity to reduce our position in the stock. Because we invest in fast-growing companies, this sell discipline — that is, devising and employing the criteria we use to determine when a stock is no longer appropriate for the Fund — is a vital part of our management process.
Performance ultimately is driven not only by how well we buy a stock, but also by how well we sell it. Our decisions to sell stocks are driven by signs that the stock’s price has risen too high relative to its earnings and growth prospects and by indications that the growth rates we sought when we bought the stock may not come to fruition. (Similarly, we may choose to increase our position in a company if |its stock price dips while its prospects remain good.) Our consistent process has served us well with respect to Apollo Group, and we believe it is a good formula for evaluating, selecting, and eventually selling a wide range of growth stocks over the long term.
The outlook for 2004
For the near future, we anticipate continued economic strength, with the Federal Reserve taking a benign stance on interest rates through the first half of 2004. We believe that corporate profitability will continue to experience an above-average rate of growth, driven by rebounding domestic and international economies. We believe this should present a reasonable environment for growth stock investing.
The stock market is dynamic. Among the factors to which we expect to pay close attention in the coming months will be the direction of long bond rates, the recent weakness in the U.S. dollar relative to major foreign currencies, the environment for corporate credit, and the evolving demand for healthcare services.
We thank you for your investment in the Strong Growth Fund and appreciate the confidence you’ve continued to place in us.

Thomas C. Ognar
Portfolio Manager
16
Fund Highlights
Your Fund’s Approach
The Fund focuses on stocks of companies that its manager believes have favorable prospects for superior growth of earnings but are selling at reasonable valuations based on earnings, cash flow, or asset value. Although the Fund can invest in stocks of any economic sector, at times it may emphasize one or more particular sectors.
Average Annual Total Returns
As of 12-31-03
Investor Class | |||
1-year | 30.13 | % | |
5-year | 0.27 | % | |
10-year | 11.72 | % | |
Since Fund Inception (12-31-93) | 11.72 | % | |
Institutional Class1 | |||
1-year | 30.93 | % | |
5-year | 0.79 | % | |
10-year | 12.01 | % | |
Since Fund Inception (12-31-93) | 12.01 | % | |
Advisor Class2 | |||
1-year | 30.06 | % | |
5-year | 0.10 | % | |
10-year | 11.45 | % | |
Since Fund Inception (12-31-93) | 11.45 | % | |
Class C3 | |||
1-year | 27.92 | % | |
5-year | -0.80 | % | |
10-year | 10.45 | % | |
Since Fund Inception (12-31-93) | 10.45 | % | |
Class K4 | |||
1-year | 30.78 | % | |
5-year | 0.49 | % | |
10-year | 11.84 | % | |
Since Fund Inception (12-31-93) | 11.84 | % | |
Equity funds are volatile investments and should only be considered for long-term goals.
Growth of an Assumed $10,000 Investment†
From 12-31-93 to 12-31-03
Mention of specific securities in this report is not indicative of whether the Fund may make additional purchases of, sell all or a portion of, or continue to hold those securities.
| † | This graph, provided in accordance with SEC regulations, compares a $10,000 investment in the Fund, made at its inception, with the performance of the S&P 500 Index and the Lipper Multi-Cap Growth Funds Index. Results include the reinvestment of all dividends and capital gains distributions. Performance is historical and does not represent future results. Investment returns and principal value vary, and you may have a gain or loss when you sell shares. Current performance may be lower or higher than the quoted performance. Call us or visit www.Strong.com for the most current performance information. The graph and the Average Annual Total Returns table do not reflect the deduction of taxes, if any, that a shareholder would pay on Fund distributions or the redemption of Fund shares. This graph is based on Investor Class shares only; performance for other classes will vary due to differences in fee structures. |
The Fund’s prospectus and statement of additional information may describe restrictions on the percentage of a particular type or quality of security in which the Fund may invest (“Percentage Restrictions”). Percentage Restrictions apply at the time the Fund purchases a security. Circumstances subsequent to the purchase of the security, such as a change in: (1) the Fund’s assets (e.g., due to cash inflows and redemptions); (2) the market value of the security; or (3) the pricing, liquidity, or rating of the security, may cause the Fund to exceed or fall short of the Percentage Restriction. If this happens, the Fund’s continued holding of the security will not constitute a violation of the Percentage Restriction.
From time to time, the Fund’s advisor and/or administrator has waived its fees and/or absorbed Fund expenses, which has resulted in higher returns.
| 1 | The performance of the Institutional Class shares prior to 2-24-00 is based on the Fund’s Investor Class shares’ performance. Please consult a prospectus for information about all share classes. |
| 2 | The performance of the Advisor Class shares prior to 2-24-00 is based on the Fund’s Investor Class shares’ performance, restated for the higher expense ratio of the Advisor Class shares. Please consult a prospectus for information about all share classes. |
| 3 | The performance of Class C shares prior to 12-26-02 is based on the Fund’s Investor Class shares’ performance restated for the higher expense ratio of the Class C shares. Please consult a prospectus for information about all share classes. Average annual total returns include a 1.00% contingent deferred sales charge imposed on redemptions made within 12 months of purchase. |
| 4 | The performance of Class K shares prior to 8-30-02 is based on the Fund’s Investor Class shares’ performance. Please consult a prospectus for information about all share classes. |
| * | The S&P 500 Index consists of 500 stocks chosen for market size, liquidity, and industry group representation. It is a market value weighted index (stock price times number of shares outstanding), with each stock’s weight in the Index proportionate to its market value. The Lipper Multi-Cap Growth Funds Index is the average of the 30 largest funds in the Lipper Multi-Cap Growth Funds Category. Source of the S&P index data is Standard & Poor’s Micropal. Source of the Lipper index data is Lipper Inc. |
17
Strong Large Company Growth Fund
After three tough years for equity investors, 2003 ended up to be a great year. The Strong Large Company Growth Fund returned 24.16% for the year ended December 31, 2003. Although that was a strong positive return, it was not good enough to top the broad-based benchmark, the S&P 500 Index, which posted a return of 28.67% over the same period.
Lower quality prevailed
In 2003, the market rode the dual currents of emotions and liquidity. For their part, emotions began the year at a fairly low level. Over time, a well-fought war in Iraq, an improving economy, and the capture of Saddam Hussein led to an ever-growing level of confidence. Liquidity, on the other hand, stayed at very high levels during the entire year. Record-low interest rates, massive fiscal stimulus to the economy in the form of tax cuts, and the decline of the dollar relative to major foreign currencies have all given overextended consumers and corporations alike a chance to repair badly damaged balance sheets.
As is often the case in an environment of easy money, those companies in the greatest financial distress were the biggest beneficiaries of these trends, while those with the strongest balance sheets had the least to gain. According to Merrill Lynch research, S&P 500 companies rated A or better by Standard & Poor’s were up 27.4% for the year, while those companies rated C or D returned a dramatic 80.9%. This is easily one of the best one-year performances for junk-rated companies in history.
While lower-rated companies outperformed in 2003, over the longer term, we believe that the strongest returns will accrue to those companies that have the strongest finances, business models, and management teams. We therefore use an investment approach designed to identify such companies for the Fund.
Portfolio emphasizes higher quality
Our investment process starts with fundamentals — we analyze a company’s management, business model, and its stock price relative to its earnings. Second, we look at technicals — the trend in a stock’s price and in the company’s earnings. Last, but not least, we look at expectations — the current market sentiment toward the stock, indicating how much of the stock’s fundamentals and technicals are already factored into the share price.
The ideal candidate for addition to our portfolio would have strong fundamentals, strong technicals, and low expectations. We do not always make perfect decisions, but our disciplined process is designed to help us outperform our benchmark over time, while keeping risk levels modest. We believe that over long periods of time, the large-cap equity markets are very efficient. An efficient market is similar to games like tennis or golf, in that the goal is to make few mistakes and exploit those rare opportunities when the odds are in your favor.
Because our stock-selection process is designed to select higher-quality companies, we were significantly underweighted in low-quality companies relative to their representation in the index over the past year. This posture largely accounted for the Fund’s underperformance. Somewhat alarmingly (in our view), the market in 2003 appeared very similar to that in 1999 — another year that saw the returns of lower-quality, higher-risk stocks trounce those of higher-quality companies. This kind of short-run aberration poses a clear challenge to managers who remain committed to a higher-quality approach, as we do, but who attempt to outperform on an annual basis.
After a tough relative performance year like 2003, we have analyzed our process — and have found very little to change. This is supported by the Fund’s long-term performance versus the S&P 500 Index. We expect to continue to keep the Fund invested in stocks that are appealing on the basis of fundamentals, technicals, and expectations. To help manage risk, we expect to carefully monitor our allocations to market sectors and industries.
Keeping an eye on the consensus
We are hesitant to do anything that resembles market forecasting, but we do believe it is very important to monitor and understand the consensus view and see if we have a different perception.
Time and again, the market has shown a great ability to prove the consensus wrong, and nobody actually knows what the future holds. We therefore believe it’s prudent to remain flexible and be prepared to move against the consensus when it appears warranted.
Thank you for your investment in the Strong Large Company Growth Fund.
Christopher H. Wiles
Portfolio Co-Manager
Lawrence E. Eakin Jr.
Portfolio Co-Manager
18
Fund Highlights
Your Fund’s Approach
The Fund invests in securities of approximately 50 large-capitalization companies that its managers believe offer the potential for capital growth, consisting primarily of income-producing equity securities. To identify stocks that offer the opportunity for capital growth, the managers look for stocks that have a record of growth in the areas of sales, earnings, or book value, and stocks that have above-average returns on capital and equity.
Average Annual Total Returns
As of 12-31-03
Investor Class | |||
1-year1 | 24.16 | % | |
3-year | -2.21 | % | |
5-year | 8.01 | % | |
Since Inception (11-3-97) | 9.06 | % | |
Class K | |||
1-year1 | 25.79 | % | |
3-year | -2.12 | % | |
5-year | 8.08 | % | |
Since Inception (11-3-97) | 9.12 | % | |
Equity funds are volatile investments and should only be considered for long-term goals.
Growth of an Assumed $10,000 Investment†
From 11-3-97 to 12-31-03
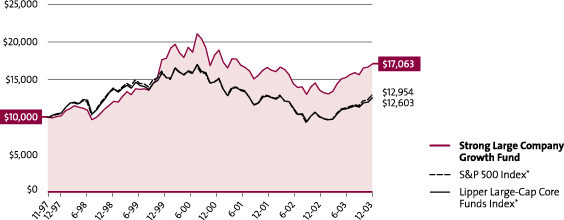
Mention of specific securities in this report is not indicative of whether the Fund may make additional purchases of, sell all or a portion of, or continue to hold those securities.
| † | This graph, provided in accordance with SEC regulations, compares a $10,000 investment in the Fund, made at its inception, with the performance of the S&P 500 Index (“S&P 500”) and the Lipper Large-Cap Core Funds Index. Results include the reinvestment of all dividends and capital gains distributions. This graph is based on the Investor Class shares only; performance for other classes will vary, due to differences in fee structures. Performance is historical and does not represent future results. Investment returns and principal value vary, and you may have a gain or loss when you sell shares. Current performance may be lower or higher than the quoted performance. Call us or visit www.Strong.com for the most current performance information. The graph and the Average Annual Total Returns table do not reflect the deduction of taxes, if any, that a shareholder would pay on Fund distributions or the redemption of Fund shares. The Fund’s prospectus and statement of additional information may describe restrictions on the percentage of a particular type or quality of security in which the Fund may invest (“Percentage Restrictions”). Percentage Restrictions apply at the time the Fund purchases a security. Circumstances subsequent to the purchase of the security, such as a change in: (1) the Fund’s assets (e.g., due to cash inflows and redemptions); (2) the market value of the security; or (3) the pricing, liquidity, or rating of the security, may cause the Fund to exceed or fall short of the Percentage Restriction. If this happens, the Fund’s continued holding of the security will not constitute a violation of the Percentage Restriction. |
From time to time, the Fund’s advisor and/or administrator has waived its fees and/or absorbed Fund expenses, which has resulted in higher returns.
We have contractually agreed to waive fees and/or absorb expenses for an indefinite period of time to keep Total Annual Operating Expenses of the Large Company Growth Fund at no more than 1.50%. This contract may only be terminated by the Board of Directors of the Fund, but not before May 1, 2004.
The performance of the Fund prior to 9-16-02 is based on the performance of the Rockhaven Premier Dividend Fund (the predecessor Fund) and does not reflect the Fund’s maximum sales charge of 5.75%, which was charged from 9-17-99 through 9-15-02.
| 1 | Average annual total returns include a 1.00% redemption fee (as a percentage of redemption proceeds) imposed on redemptions made within 12 months of purchase. |
| * | The S&P 500 Index consists of 500 stocks chosen for market size, liquidity, and industry group representation. It is a market value weighted index (stock price times number of shares outstanding), with each stock’s weight in the Index proportionate to its market value. The Lipper Large-Cap Core Funds Index is the average of the 30 largest funds in the Lipper Large-Cap Core Funds Category. Source of the S&P 500 index data is Standard & Poor’s Micropal. Source of the Lipper index data is Lipper Inc. |
19
SCHEDULES OF INVESTMENTS IN SECURITIES | December 31, 2003 |
Shares or Principal Amount | Value (Note 2) | ||||||
Common Stocks 99.4% | |||||||
Banks - Money Center 2.0% | |||||||
Citigroup, Inc. | 72,300 | $ | 3,509,442 | ||||
Beverages - Soft Drinks 1.1% | |||||||
The Coca-Cola Company | 38,200 | 1,938,650 | |||||
Building - Resident/Commercial 18.8% | |||||||
Centex Corporation | 68,600 | 7,384,790 | |||||
D.R. Horton, Inc. | 176,700 | 7,644,042 | |||||
Lennar Corporation Class A | 64,600 | 6,201,600 | |||||
Pulte Homes, Inc. | 65,100 | 6,094,662 | |||||
Ryland Group, Inc. | 65,100 | 5,770,464 | |||||
| 33,095,558 | |||||||
Computer - Local Networks 4.7% | |||||||
Cisco Systems, Inc. (b) | 343,600 | 8,346,044 | |||||
Computer - Manufacturers 3.9% | |||||||
Dell, Inc. (b) | 205,300 | 6,971,988 | |||||
Computer Software - Desktop 2.7% | |||||||
Microsoft Corporation | 171,900 | 4,734,126 | |||||
Computer Software - Enterprise 2.7% | |||||||
VERITAS Software Corporation (b) | 126,200 | 4,689,592 | |||||
Diversified Operations 9.5% | |||||||
General Electric Company | 122,800 | 3,804,344 | |||||
3M Co. | 83,000 | 7,057,490 | |||||
Tyco International, Ltd. | 79,200 | 2,098,800 | |||||
United Technologies Corporation | 40,800 | 3,866,616 | |||||
| 16,827,250 | |||||||
Electronics - Semiconductor Manufacturing 8.1% | |||||||
Analog Devices, Inc. | 137,000 | 6,254,050 | |||||
Intel Corporation | 249,900 | 8,046,780 | |||||
| 14,300,830 | |||||||
Finance - Investment Brokers 3.8% | |||||||
The Goldman Sachs Group, Inc. | 67,600 | 6,674,148 | |||||
Food - Miscellaneous Preparation 1.7% | |||||||
PepsiCo, Inc. | 66,100 | 3,081,582 | |||||
Internet - Content 4.8% | |||||||
Yahoo! Inc. (b) | 186,300 | 8,415,171 | |||||
Internet - E*Commerce 4.6% | |||||||
eBay, Inc. (b) | 124,800 | 8,060,832 | |||||
Machinery - Construction/Mining 2.3% | |||||||
Caterpillar, Inc. | 49,900 | 4,142,698 | |||||
Medical - Ethical Drugs 4.3% | |||||||
Eli Lilly & Company | 55,000 | 3,868,150 | |||||
Pfizer, Inc. | 104,800 | 3,702,584 | |||||
| 7,570,734 | |||||||
Medical - Generic Drugs 3.3% | |||||||
Teva Pharmaceutical Industries, Ltd. ADR | 101,500 | 5,756,065 | |||||
Medical - Genetics 2.2% | |||||||
Genentech, Inc. (b) | 40,800 | 3,817,656 | |||||
Medical - Products 2.1% | |||||||
Boston Scientific Corporation (b) | 103,100 | 3,789,956 | |||||
Metal Ores - Miscellaneous 1.1 % | |||||||
Alcoa, Inc. | 49,700 | $ | 1,888,600 | ||||
Oil & Gas - Field Services 3.8% | |||||||
Schlumberger, Ltd. | 123,400 | 6,752,448 | |||||
Retail - Restaurants 2.9% | |||||||
McDonald’s Corporation | 204,000 | 5,065,320 | |||||
Retail/Wholesale - Building Products 2.9% | |||||||
Lowe’s Companies, Inc. | 92,000 | 5,095,880 | |||||
Soap & Cleaning Preparations 1.6% | |||||||
The Procter & Gamble Company | 28,500 | 2,846,580 | |||||
Telecommunications - Wireless Services 4.5% | |||||||
Nextel Communications, Inc. Class A (b) | 282,000 | 7,912,920 | |||||
Total Common Stocks (Cost $135,428,305) | 175,284,070 | ||||||
Short-Term Investments (a) 0.6 % | |||||||
Repurchase Agreements | |||||||
State Street Bank (Dated 12/31/03), 0.75 %, Due 1/02/04 (Repurchase proceeds $1,112,546); Collateralized by: United States Government & Agency Issues (c) | $ | 1,112,500 | 1,112,500 | ||||
Total Short-Term Investments (Cost $1,112,500) | 1,112,500 | ||||||
Total Investments in Securities (Cost $136,540,805) 100.0% | 176,396,570 | ||||||
Other Assets and Liabilities, Net (0.0%) | (86,183 | ) | |||||
Net Assets 100.0% | $ | 176,310,387 | |||||
Shares or Principal Amount | Value (Note 2) | ||||
Common Stocks 99.1% | |||||
Apparel - Shoes & Related Manufacturing 0.9% | |||||
Reebok International, Ltd. | 37,090 | $ | 1,458,379 | ||
Auto/Truck - Original Equipment 0.8 % | |||||
Eaton Corporation | 12,720 | 1,373,506 | |||
Building - Heavy Construction 1.4% | |||||
Chicago Bridge & Iron Company NV | 82,290 | 2,378,181 | |||
Building - Mobile/Manufacturers & RV 1.3% | |||||
Champion Enterprises, Inc. (b) | 307,640 | 2,153,480 | |||
Commercial Services - Market Research 0.7% | |||||
Corporate Executive Board Company (b) | 24,070 | 1,123,347 | |||
Commercial Services - Schools 2.3% | |||||
Career Education Corporation (b) | 62,820 | 2,517,197 | |||
Strayer Education, Inc. | 12,130 | 1,320,108 | |||
| 3,837,305 | |||||
Commercial Services - Staffing 1.2% | |||||
Kforce.com, Inc. (b) | 210,042 | 1,961,792 | |||
20
STRONG DISCOVERY FUND (continued)
Shares or Principal Amount | Value (Note 2) | ||||
Computer - Local Networks 2.7% | |||||
Juniper Networks, Inc. (b) | 46,670 | $ | 871,796 | ||
Polycom, Inc. (b) | 183,970 | 3,591,094 | |||
| 4,462,890 | |||||
Computer Software - Education/Entertainment 0.9% | |||||
Activision, Inc. (b) | 79,649 | 1,449,612 | |||
Electronics - Miscellaneous Components 1.8% | |||||
Vishay Intertechnology, Inc. (b) | 130,920 | 2,998,068 | |||
Electronics - Scientific Measuring 2.2% | |||||
Teradyne, Inc. (b) | 145,010 | 3,690,505 | |||
Electronics - Semiconductor Manufacturing 13.4% | |||||
ASE Test, Ltd. (b) | 187,800 | 2,811,366 | |||
ATI Technologies, Inc. (b) | 54,890 | 829,937 | |||
Amkor Technology, Inc. (b) | 59,300 | 1,079,853 | |||
Credence Systems Corporation (b) | 136,134 | 1,791,523 | |||
Cymer, Inc. (b) | 25,830 | 1,193,088 | |||
Fairchild Semiconductor Corporation Class A (b) | 130,430 | 3,256,837 | |||
Intersil Holding Corporation Class A | 131,700 | 3,272,745 | |||
KLA-Tencor Corporation (b) | 40,900 | 2,399,603 | |||
SanDisk Corporation (b) | 28,600 | 1,748,604 | |||
Ultratech Stepper, Inc. (b) | 98,340 | 2,888,246 | |||
Xilinx, Inc. (b) | 27,110 | 1,050,241 | |||
| 22,322,043 | |||||
Financial Services - Miscellaneous 0.9% | |||||
Investors Financial Services Corporation | 38,550 | 1,480,706 | |||
Household - Consumer Electronics 1.5% | |||||
Harman International Industries, Inc. | 33,870 | 2,505,703 | |||
Insurance - Property/Casualty/Title 2.3% | |||||
Endurance Specialty Holdings, Ltd. | 41,900 | 1,405,745 | |||
ProAssurance Corporation (b) | 76,130 | 2,447,580 | |||
| 3,853,325 | |||||
Internet - E*Commerce 1.0% | |||||
eCollege.com (b) | 91,480 | 1,688,721 | |||
Leisure - Movies & Related 2.4% | |||||
Avid Technology, Inc. (b) | 25,160 | 1,207,680 | |||
Lions Gate Entertainment Corporation (b) | 628,870 | 2,817,338 | |||
| 4,025,018 | |||||
Leisure - Services 2.3% | |||||
Royal Caribbean Cruises, Ltd. | 108,320 | 3,768,453 | |||
Leisure - Toys/Games/Hobby 3.2% | |||||
Marvel Enterprises, Inc. (b) | 182,410 | 5,309,955 | |||
Media - Newspapers 1.1% | |||||
The E.W. Scripps Company Class A | 19,425 | 1,828,670 | |||
Media - Radio/TV 1.5% | |||||
Emmis Broadcasting Corporation Class A (b) | 45,410 | 1,228,341 | |||
Univision Communications, Inc. Class A (b) | 31,720 | 1,258,967 | |||
| 2,487,308 | |||||
Medical - Biomedical/Biotechnology 3.6% | |||||
Digene Corporation (b) | 98,623 | 3,954,782 | |||
Genzyme Corporation (b) | 24,600 | 1,213,764 | |||
ImClone Systems, Inc. (b) | 22,620 | 897,109 | |||
| 6,065,655 | |||||
Medical - Ethical Drugs 2.7% | |||||
Inspire Pharmaceuticals, Inc. (b) | 162,690 | $ | 2,303,690 | ||
Medicis Pharmaceutical Corporation Class A | 30,400 | 2,167,520 | |||
| 4,471,210 | |||||
Medical - Generic Drugs 1.5% | |||||
Watson Pharmaceuticals, Inc. (b) | 54,780 | 2,519,880 | |||
Medical - Genetics 1.5% | |||||
Millenium Pharmaceuticals (b) | 128,290 | 2,395,174 | |||
Medical - Health Maintenance Organizations 1.0% | |||||
Mid Atlantic Medical Services, Inc. (b) | 25,900 | 1,678,320 | |||
Medical - Hospitals 1.7% | |||||
Community Health Systems, Inc. (b) | 104,990 | 2,790,634 | |||
Medical - Nursing Homes 2.3% | |||||
Beverly Enterprises, Inc. (b) | 317,910 | 2,730,847 | |||
Select Medical Corporation | 65,940 | 1,073,503 | |||
| 3,804,350 | |||||
Medical - Products 5.6% | |||||
C.R. Bard, Inc. | 14,580 | 1,184,625 | |||
Cyberonics, Inc. (b) | 98,530 | 3,153,945 | |||
Encore Medical Corporation (b) | 390,810 | 3,185,102 | |||
Zimmer Holdings, Inc. (b) | 25,340 | 1,783,936 | |||
| 9,307,608 | |||||
Medical - Systems/Equipment 1.1% | |||||
Varian Medical Systems, Inc. (b) | 11,950 | 825,745 | |||
Viasys Healthcare, Inc. (b) | 47,234 | 973,020 | |||
| 1,798,765 | |||||
Medical/Dental - Services 2.0% | |||||
LabOne, Inc. (b) | 54,800 | 1,779,356 | |||
VCA Antech, Inc. (b) | 53,179 | 1,647,485 | |||
| 3,426,841 | |||||
Medical/Dental - Supplies 0.7% | |||||
Dentsply International, Inc. | 26,130 | 1,180,292 | |||
Oil & Gas - Drilling 2.1% | |||||
ENSCO International, Inc. | 45,100 | 1,225,367 | |||
Nabors Industries, Ltd. (b) | 53,170 | 2,206,555 | |||
| 3,431,922 | |||||
Oil & Gas - Field Services 0.5% | |||||
BJ Services Company (b) | 25,730 | 923,707 | |||
Oil & Gas - United States Exploration & Production 0.6% | |||||
XTO Energy, Inc. | 37,480 | 1,060,684 | |||
Pollution Control - Services 1.2% | |||||
Stericycle, Inc. (b) | 42,370 | 1,978,679 | |||
Retail - Clothing/Shoes 3.5% | |||||
Aeropostale, Inc. (b) | 39,430 | 1,081,171 | |||
Coach, Inc. (b) | 37,350 | 1,409,963 | |||
Ross Stores, Inc. | 44,040 | 1,163,977 | |||
Urban Outfitters, Inc. (b) | 60,310 | 2,234,485 | |||
| 5,889,596 | |||||
Retail - Home Furnishings 2.4% | |||||
The Bombay Company, Inc. (b) | 151,470 | 1,232,966 | |||
Select Comfort Corporation (b) | 110,650 | 2,739,694 | |||
| 3,972,660 | |||||
Retail - Leisure Products 1.3% | |||||
Sports Authority, Inc. (b) | 56,620 | 2,174,208 | |||
21
SCHEDULES OF INVESTMENTS IN SECURITIES (continued) | December 31, 2003 |
STRONG DISCOVERY FUND (continued)
22
STRONG ENDEAVOR FUND (continued)
Shares or Principal Amount | Value (Note 2) | ||||||
Insurance - Diversified 1.4% | |||||||
American International Group, Inc. | 960 | $ | 63,629 | ||||
Internet - Content 2.4% | |||||||
Yahoo! Inc. (b) | 2,400 | 108,408 | |||||
Internet - E*Commerce 0.5% | |||||||
eBay, Inc. (b) | 370 | 23,898 | |||||
Leisure - Gaming/Equipment 2.0% | |||||||
International Game Technology | 2,510 | 89,607 | |||||
Leisure - Services 2.8% | |||||||
Royal Caribbean Cruises, Ltd. | 3,620 | 125,940 | |||||
Leisure - Toys/Games/Hobby 1.3% | |||||||
Marvel Enterprises, Inc. (b) | 2,080 | 60,549 | |||||
Machinery - Farm 1.7% | |||||||
Deere & Company | 1,170 | 76,108 | |||||
Media - Cable TV 3.4% | |||||||
EchoStar Communications Corporation Class A (b) | 4,530 | 154,020 | |||||
Media - Newspapers 0.8% | |||||||
The E.W. Scripps Company Class A | 365 | 34,361 | |||||
Media - Radio/TV 0.8% | |||||||
Clear Channel Communications, Inc. | 730 | 34,186 | |||||
Medical - Biomedical/Biotechnology 5.0% | |||||||
Amgen, Inc. (b) | 1,990 | 122,982 | |||||
Genzyme Corporation (b) | 1,630 | 80,424 | |||||
Gilead Sciences, Inc. (b) | 370 | 21,512 | |||||
| 224,918 | |||||||
Medical - Drug/Diversified 2.3% | |||||||
Johnson & Johnson | 2,010 | 103,837 | |||||
Medical - Ethical Drugs 4.8% | |||||||
Medicis Pharmaceutical Corporation Class A | 610 | 43,493 | |||||
Pfizer, Inc. | 4,824 | 170,432 | |||||
| 213,925 | |||||||
Medical - Generic Drugs 1.1% | |||||||
Teva Pharmaceutical Industries, Ltd. ADR | 880 | 49,905 | |||||
Medical - Health Maintenance Organizations 1.0% | |||||||
Anthem, Inc. (b) | 580 | 43,500 | |||||
Medical - Products 2.5% | |||||||
Boston Scientific Corporation (b) | 1,760 | 64,698 | |||||
Medtronic, Inc. | 960 | 46,666 | |||||
| 111,364 | |||||||
Oil & Gas - Drilling 3.7% | |||||||
ENSCO International, Inc. | 1,630 | 44,287 | |||||
Nabors Industries, Ltd. (b) | 1,950 | 80,925 | |||||
Transocean, Inc. (b) | 1,720 | 41,297 | |||||
| 166,509 | |||||||
Oil & Gas - International Integrated 0.8% | |||||||
Suncor Energy, Inc. | 1,380 | 34,583 | |||||
Retail - Home Furnishings 0.8% | |||||||
Bed Bath & Beyond, Inc. (b) | 810 | 35,113 | |||||
Retail - Major Discount Chains 2.4% | |||||||
Target Corporation | 1,155 | 44,352 | |||||
Wal-Mart Stores, Inc. | 1,170 | 62,068 | |||||
| 106,420 | |||||||
Retail/Wholesale - Building Products 3.2% | |||||||
The Home Depot, Inc. | 1,910 | 67,786 | |||||
Lowe’s Companies, Inc. | 1,370 | 75,884 | |||||
| 143,670 | |||||||
Telecommunications - Wireless Equipment 0.8% | |||||||
Telefonaktiebolaget LM Ericsson Sponsored ADR (b) | 1,990 | 35,223 | |||||
Telecommunications - Wireless Services 3.9% | |||||||
Nextel Communications, Inc. Class A (b) | 6,280 | 176,217 | |||||
Trucks & Parts - Heavy Duty 1.7% | |||||||
Navistar International Corporation (b) | 1,610 | 77,103 | |||||
Total Common Stocks (Cost $3,687,041 ) | 4,459,970 | ||||||
Short-Term Investments (a) 1.4% | |||||||
Repurchase Agreements | |||||||
State Street Bank (Dated 12/31/03), 0.75%, Due 1/02/04 (Repurchase proceeds $64,403); Collateralized by: United States Government & Agency Issues (c) | $ | 64,400 | 64,400 | ||||
Total Short-Term Investments (Cost $64,400 ) | 64,400 | ||||||
Total Investments in Securities (Cost $3,751,441 ) 100.5% | 4,524,370 | ||||||
Other Assets and Liabilities, Net (0.5%) | (24,207 | ) | |||||
Net Assets 100.0% | $ | 4,500,163 | |||||
Shares or Principal Amount | Value (Note 2) | ||||
Common Stocks 99.5% | |||||
Banks - Money Center 1.1% | |||||
Citigroup, Inc. | 140,000 | $ | 6,795,600 | ||
Banks - Super Regional 0.8% | |||||
Charter One Financial, Inc. | 155,000 | 5,355,250 | |||
Beverages - Alcoholic 0.6% | |||||
Anheuser-Busch Companies, Inc. | 75,000 | 3,951,000 | |||
Beverages - Soft Drinks 1.0% | |||||
The Coca-Cola Company | 130,000 | 6,597,500 | |||
Chemicals - Specialty 0.9% | |||||
Praxair, Inc. | 150,000 | 5,730,000 | |||
Commercial Services - Advertising 0.5% | |||||
Omnicom Group, Inc. | 40,000 | 3,493,200 | |||
Commercial Services - Miscellaneous 1.1% | |||||
Paychex, Inc. | 190,000 | 7,068,000 | |||
Commercial Services - Schools 1.1% | |||||
Apollo Group, Inc. Class A (b) | 100,000 | 6,800,000 | |||
23
SCHEDULES OF INVESTMENT IN SECURITIES (continued) | December 31, 2003 |
STRONG LARGE CAP GROWTH FUND (continued)
Shares or Principal Amount | Value (Note 2) | ||||
Computer - Data Storage 0.9% | |||||
EMC Corporation (b) | 475,000 | $ | 6,137,000 | ||
Computer - IT Services 0.7 % | |||||
Accenture, Ltd. Class A (b) | 180,000 | 4,737,600 | |||
Computer - Local Networks 4.8% | |||||
Cisco Systems, Inc. (b) | 1,060,000 | 25,747,400 | |||
QLogic Corporation (b) | 105,000 | 5,418,000 | |||
| 31,165,400 | |||||
Computer - Manufacturers 2.4% | |||||
Dell, Inc. (b) | 450,000 | 15,282,000 | |||
Computer Software - Desktop 1.7% | |||||
Microsoft Corporation | 400,000 | 11,016,000 | |||
Computer Software - Education/Entertainment 0.5% | |||||
Electronic Arts, Inc. (b) | 60,000 | 2,866,800 | |||
Computer Software - Enterprise 2.2% | |||||
Mercury Interactive Corporation (b) | 110,000 | 5,350,400 | |||
SAP AG Sponsored ADR | 95,000 | 3,948,200 | |||
VERITAS Software Corporation (b) | 135,000 | 5,016,600 | |||
| 14,315,200 | |||||
Computer Software – Financial 1.3% | |||||
Intuit, Inc. (b) | 160,000 | 8,465,600 | |||
Cosmetics - Personal Care 0.5% | |||||
Kimberly-Clark Corporation | 50,000 | 2,954,500 | |||
Diversified Operations 3.0 % | |||||
General Electric Company | 330,000 | 10,223,400 | |||
Level 3 Communications, Inc. (b) | 600,000 | 3,420,000 | |||
United Technologies Corporation | 60,000 | 5,686,200 | |||
| 19,329,600 | |||||
Electronics - Contract Manufacturing 0.8% | |||||
Flextronics International, Ltd. (b) | 350,000 | 5,194,000 | |||
Electronics - Scientific Measuring 0.6% | |||||
Danaher Corporation | 40,000 | 3,670,000 | |||
Electronics - Semiconductor Manufacturing 11.1% | |||||
ASML Holding NV (b) | 175,000 | 3,508,750 | |||
Agere Systems, Inc. Class A (b) | 1,200,000 | 3,660,000 | |||
Analog Devices, Inc. | 190,000 | 8,673,500 | |||
Applied Materials, Inc. (b) | 145,000 | 3,255,250 | |||
Intel Corporation | 800,000 | 25,760,000 | |||
KLA-Tencor Corporation (b) | 50,000 | 2,933,500 | |||
Marvell Technology Group, Ltd. (b) | 120,000 | 4,551,600 | |||
Maxim Integrated Products, Inc. | 100,000 | 4,980,000 | |||
Microchip Technology, Inc. | 140,000 | 4,670,400 | |||
Silicon Laboratories, Inc. (b) | 105,000 | 4,538,100 | |||
Xilinx, Inc. (b) | 125,000 | 4,842,500 | |||
| 71,373,600 | |||||
Finance - Consumer/Commercial Loans 1.1% | |||||
SLM Corporation | 185,000 | 6,970,800 | |||
Finance - Investment Brokers 1.0% | |||||
The Goldman Sachs Group, Inc. | 65,000 | 6,417,450 | |||
Finance - Mortgage & Related Services 1.1% | |||||
FNMA | 90,000 | 6,755,400 | |||
Food - Flour & Grain 0.7% | |||||
Archer Daniels Midland Company | 295,000 | $ | 4,489,900 | ||
Food - Miscellaneous Preparation 1.5% | |||||
PepsiCo, Inc. | 210,000 | 9,790,200 | |||
Insurance - Diversified 1.8% | |||||
American International Group, Inc. | 175,000 | 11,599,000 | |||
Insurance - Property/Casualty/Title 0.5% | |||||
The St. Paul Companies, Inc. | 85,000 | 3,370,250 | |||
Internet - Content 0.8% | |||||
Yahoo! Inc. (b) | 120,000 | 5,420,400 | |||
Internet - E*Commerce 1.8% | |||||
Amazon.com, Inc. (b) | 65,000 | 3,421,600 | |||
eBay, Inc. (b) | 125,000 | 8,073,750 | |||
| 11,495,350 | |||||
Leisure - Gaming/Equipment 1.2% | |||||
International Game Technology | 155,000 | 5,533,500 | |||
Wynn Resorts, Ltd. (b) | 85,000 | 2,380,850 | |||
| 7,914,350 | |||||
Leisure - Hotels & Motels 0.8% | |||||
Marriott International, Inc. Class A | 110,000 | 5,082,000 | |||
Machinery - Construction/Mining 1.4% | |||||
Caterpillar, Inc. | 105,000 | 8,717,100 | |||
Media - Cable TV 0.8% | |||||
EchoStar Communications Corporation Class A (b) | 95,000 | 3,230,000 | |||
Hughes Electronics Corporation (b) | 100,003 | 1,655,050 | |||
| 4,885,050 | |||||
Media - Radio/TV 3.5% | |||||
Clear Channel Communications, Inc. | 150,000 | 7,024,500 | |||
Univision Communications, Inc. Class A (b) | 100,000 | 3,969,000 | |||
Viacom, Inc. Class B | 260,000 | 11,538,800 | |||
| 22,532,300 | |||||
Medical - Biomedical/Biotechnology 4.9% | |||||
Amgen, Inc. (b) | 200,000 | 12,360,000 | |||
Genzyme Corporation (b) | 210,000 | 10,361,400 | |||
Gilead Sciences, Inc. (b) | 155,000 | 9,011,700 | |||
| 31,733,100 | |||||
Medical - Drug/Diversified 1.6% | |||||
Abbott Laboratories | 220,000 | 10,252,000 | |||
Medical - Ethical Drugs 5.2% | |||||
Eli Lilly & Company | 125,000 | 8,791,250 | |||
Pfizer, Inc. | 700,000 | 24,731,000 | |||
| 33,522,250 | |||||
Medical - Generic Drugs 0.7% | |||||
Teva Pharmaceutical Industries, Ltd. ADR | 80,000 | 4,536,800 | |||
Medical - Genetics 0.9% | |||||
Genentech, Inc. (b) | 65,000 | 6,082,050 | |||
Medical - Hospitals 1.0% | |||||
HCA, Inc. | 155,000 | 6,658,800 | |||
Medical - Products 4.7% | |||||
Boston Scientific Corporation (b) | 180,000 | 6,616,800 | |||
Guidant Corporation | 65,000 | 3,913,000 | |||
Medtronic, Inc. | 175,000 | 8,506,750 | |||
24
STRONG LARGE CAP GROWTH FUND (continued)
| Shares or Principal Amount | Value (Note 2) | ||||||
St. Jude Medical, Inc. (b) | 40,000 | $ | 2,454,000 | ||||
Zimmer Holdings, Inc. (b) | 125,000 | 8,800,000 | |||||
| 30,290,550 | |||||||
Medical - Wholesale Drugs/Sundries 0.9% | |||||||
AmerisourceBergen Corporation | 100,000 | 5,615,000 | |||||
Metal Ores - Gold/Silver 1.3% | |||||||
Newmont Mining Corporation Holding Company | 175,000 | 8,506,750 | |||||
Oil & Gas - Drilling 1.0% | |||||||
ENSCO International, Inc. | 130,000 | 3,532,100 | |||||
Nabors Industries, Ltd. (b) | 75,000 | 3,112,500 | |||||
| 6,644,600 | |||||||
Oil & Gas - International Integrated 0.5% | |||||||
Exxon Mobil Corporation | 80,000 | 3,280,000 | |||||
Oil & Gas - Machinery/Equipment 1.3% | |||||||
Smith International, Inc. (b) | 195,000 | 8,096,400 | |||||
Oil & Gas - United States Exploration & Production 1.9% | |||||||
Apache Corporation | 85,000 | 6,893,500 | |||||
Occidental Petroleum Corporation | 120,000 | 5,068,800 | |||||
| 11,962,300 | |||||||
Retail - Consumer Electronics 1.0% | |||||||
Best Buy Company, Inc. | 125,000 | 6,530,000 | |||||
Retail - Department Stores 1.0% | |||||||
Kohl’s Corporation (b) | 140,000 | 6,291,600 | |||||
Retail - Discount & Variety 1.2% | |||||||
Dollar Tree Stores, Inc. (b) | 265,000 | 7,965,900 | |||||
Retail - Drug Stores 1.5% | |||||||
Walgreen Company | 265,000 | 9,640,700 | |||||
Retail - Major Discount Chains 2.4% | |||||||
Target Corporation | 400,000 | 15,360,000 | |||||
Retail - Miscellaneous 0.6% | |||||||
PETCO Animal Supplies, Inc. (b) | 120,000 | 3,654,000 | |||||
Retail - Restaurants 1.5% | |||||||
Outback Steakhouse, Inc. | 70,000 | 3,094,700 | |||||
Panera Bread Company Class A (b) | 90,000 | 3,557,700 | |||||
Starbucks Corporation (b) | 90,000 | 2,975,400 | |||||
| 9,627,800 | |||||||
Retail - Super/Mini Markets 0.6% | |||||||
Whole Foods Marketing, Inc. (b) | 60,000 | 4,027,800 | |||||
Retail/Wholesale - Building Products 2.5% | |||||||
The Home Depot, Inc. | 345,000 | 12,244,050 | |||||
Lowe’s Companies, Inc. | 70,000 | 3,877,300 | |||||
| 16,121,350 | |||||||
Soap & Cleaning Preparations 1.8% | |||||||
The Procter & Gamble Company | 115,000 | 11,486,200 | |||||
Telecommunications - Fiber Optics 1.0% | |||||||
Corning, Inc. (b) | 645,000 | 6,727,350 | |||||
Telecommunications - Wireless Equipment 1.7% | |||||||
Qualcomm, Inc. | 145,000 | $ | 7,819,850 | ||||
UTStarcom, Inc. (b) | 80,000 | 2,965,600 | |||||
| 10,785,450 | |||||||
Telecommunications - Wireless Services 1.2% | |||||||
Nextel Communications, Inc. Class A (b) | 280,000 | 7,856,800 | |||||
Total Common Stocks (Cost $506,235,678) | 640,992,950 | ||||||
Short-Term Investments (a) 0.7% | |||||||
Collateral Received for Securities Lending (d) 0.5% | |||||||
Navigator Prime Portfolio | 2,938,091 | 2,938,091 | |||||
Repurchase Agreements 0.2% | |||||||
State Street Bank (Dated 12/31/03),0.75%, Due 1/02/04 (Repurchase proceeds $1,642,068); Collateralized by: United States Government & Agency Issues (c) | $ | 1,642,000 | 1,642,000 | ||||
Total Short-Term Investments (Cost $4,580,091) | 4,580,091 | ||||||
Total Investments in Securities (Cost $510,815,769) 100.2% | 645,573,041 | ||||||
Other Assets and Liabilities, Net (0.2%) | (1,441,597 | ) | |||||
Net Assets 100.0% | $ | 644,131,444 | |||||
WRITTEN OPTIONS ACTIVITY
| Contracts | Premiums | ||||||
Options outstanding at beginning of year | — | $ | — | ||||
Options written during the year | 900 | 798,276 | |||||
Options closed | (900 | ) | (798,276 | ) | |||
Options expired | — | — | |||||
Options exercised | — | — | |||||
Options outstanding at end of year | — | $ | — | ||||
STRONG U.S. EMERGING GROWTH FUND
Shares or Principal Amount | Value (Note 2) | ||||
Common Stocks 99.9% | |||||
Commercial Services - Advertising 1.2% | |||||
aQuantive, Inc. (b) | 121,160 | $ | 1,241,890 | ||
Commercial Services - Market Research 1.0% | |||||
Corporate Executive Board Company (b) | 21,580 | 1,007,139 | |||
Commercial Services - Miscellaneous 0.6% | |||||
Portfolio Recovery Associates, Inc. (b) | 23,300 | 618,615 | |||
Commercial Services - Schools 5.0% | |||||
Career Education Corporation (b) | 45,190 | 1,810,763 | |||
Corinthian Colleges, Inc. (b) | 57,545 | 3,197,200 | |||
| 5,007,963 | |||||
Computer - IT Services 2.5% | |||||
Cognizant Technology Solutions Corporation (b) | 23,515 | 1,073,225 | |||
MTC Technologies, Inc. (b) | 46,040 | 1,483,409 | |||
| 2,556,634 | |||||
Computer - Local Networks 1.7% | |||||
Foundry Networks, Inc. (b) | 62,195 | 1,701,655 | |||
25
SCHEDULES OF INVESTMENTS IN SECURITIES (continued) | December 31, 2003 |
STRONG U.S. EMERGING GROWTH FUND (continued)
| Shares or Principal Amount | Value (Note 2) | ||||||
Computer - Software Design 2.3% | |||||||
Magma Design Automation (b) | 97,310 | $ | 2,271,215 | ||||
Computer Software - Desktop 0.9% | |||||||
Sonic Solutions (b) | 61,185 | 936,131 | |||||
Computer Software - Enterprise 1.6% | |||||||
Altiris, Inc. (b) | 43,180 | 1,575,206 | |||||
Computer Software - Medical 2.8% | |||||||
eResearch Technology, Inc. (b) | 110,255 | 2,802,682 | |||||
Computer Software - Security 1.9% | |||||||
Netscreen Technologies, Inc. (b) | 76,070 | 1,882,733 | |||||
Electronics - Semiconductor Manufacturing 21.4% | |||||||
Cabot Microelectronics Corporation (b) | 20,195 | 989,555 | |||||
Cree, Inc. (b) | 135,230 | 2,392,219 | |||||
Integrated Circuit Systems, Inc. (b) | 72,215 | 2,057,405 | |||||
Integrated Silicon Solution, Inc. (b) | 64,275 | 1,007,189 | |||||
Lexar Media, Inc. (b) | 146,850 | 2,559,596 | |||||
OmniVision Technologies, Inc. (b) | 49,580 | 2,739,295 | |||||
Power Integrations, Inc. (b) | 31,090 | 1,040,271 | |||||
Rudolph Technologies, Inc. (b) | 41,470 | 1,017,674 | |||||
SanDisk Corporation (b) | 32,070 | 1,960,760 | |||||
Silicon Laboratories, Inc. (b) | 51,075 | 2,207,461 | |||||
Trident Microsystems, Inc. (b) | 199,392 | 3,473,409 | |||||
| 21,444,834 | |||||||
Finance - Consumer/Commercial Loans 1.9% | |||||||
WFS Financial, Inc. (b) | 45,665 | 1,938,936 | |||||
Financial Services - Miscellaneous 3.9% | |||||||
Investors Financial Services Corporation | 68,485 | 2,630,509 | |||||
iPayment, Inc. (b) | 36,490 | 1,240,660 | |||||
| 3,871,169 | |||||||
Insurance - Property/Casualty/Title 0.9% | |||||||
ProAssurance Corporation (b) | 27,720 | 891,198 | |||||
Internet - Content 2.7% | |||||||
United Online, Inc. (b) | 159,235 | 2,673,556 | |||||
Internet - E*Commerce 5.5% | |||||||
Getty Images, Inc. (b) | 21,710 | 1,088,322 | |||||
Netflix, Inc. (b) | 51,140 | 2,796,847 | |||||
University of Phoenix Online (b) | 24,440 | 1,684,649 | |||||
| 5,569,818 | |||||||
Internet - Network Security/Solutions 0.8% | |||||||
iPass, Inc. (b) | 48,675 | 780,260 | |||||
Leisure - Gaming/Equipment 1.0% | |||||||
Shuffle Master, Inc. (b) | 29,260 | 1,012,981 | |||||
Medical - Generic Drugs 3.9% | |||||||
American Pharmaceutical Partners, Inc. (b) | 83,707 | 2,812,555 | |||||
Andrx Group (b) | 44,645 | 1,073,266 | |||||
| 3,885,821 | |||||||
Medical - Nursing Homes 5.7% | |||||||
Odyssey Healthcare, Inc. (b) | 103,695 | 3,034,116 | |||||
VistaCare, Inc. Class A (b) | 75,275 | 2,645,916 | |||||
| 5,680,032 | |||||||
Medical - Outpatient/Home Care 1.6% | |||||||
AmSurg Corporation (b) | 42,420 | 1,607,294 | |||||
Medical - Products 3.6% | |||||||
Advanced Neuromodulation Systems, Inc. (b) | 24,395 | $ | 1,121,682 | ||||
Cyberonics, Inc. (b) | 32,945 | 1,054,570 | |||||
Wilson Greatbatch Technologies, Inc. (b) | 34,690 | 1,466,346 | |||||
| 3,642,598 | |||||||
Medical/Dental - Services 2.5% | |||||||
American Healthways, Inc. (b) | 103,840 | 2,478,661 | |||||
Oil & Gas - United States Exploration & Production 1.9% | |||||||
Evergreen Resources, Inc. (b) | 59,005 | 1,918,253 | |||||
Retail - Clothing/Shoes 4.7% | |||||||
Chicos FAS, Inc. (b) | 39,029 | 1,442,122 | |||||
Hot Topic, Inc. (b) | 82,935 | 2,443,265 | |||||
The Wet Seal, Inc. Class A (b) | 84,450 | 835,210 | |||||
| 4,720,597 | |||||||
Retail - Discount & Variety 1.6% | |||||||
Fred’s, Inc. | 50,345 | 1,559,688 | |||||
Retail - Miscellaneous 1.2% | |||||||
Sharper Image Corporation (b) | 36,430 | 1,189,439 | |||||
Retail - Restaurants 2.4% | |||||||
P.F. Chang’s China Bistro, Inc. (b) | 47,445 | 2,414,002 | |||||
Telecommunications - Wireless Services 4.5% | |||||||
@Road, Inc. (b) | 81,660 | 1,086,078 | |||||
Alamosa Holdings, Inc. (b) | 232,995 | 934,310 | |||||
LCC International, Inc. Class A (b) | 227,100 | 1,217,710 | |||||
Nextel Partners, Inc. (b) | 92,305 | 1,241,502 | |||||
| 4,479,600 | |||||||
Transportation - Services 1.6% | |||||||
C.H. Robinson Worldwide, Inc. | 41,495 | 1,573,075 | |||||
Transportation - Truck 5.1% | |||||||
Heartland Express, Inc. | 43,850 | 1,060,731 | |||||
J.B. Hunt Transport Services, Inc. (b) | 86,480 | 2,335,825 | |||||
Knight Transportation, Inc. (b) | 65,255 | 1,673,791 | |||||
| 5,070,347 | |||||||
Total Common Stocks (Cost $65,741,028) | 100,004,022 | ||||||
Short-Term Investments (a) 0.2% | |||||||
Repurchase Agreements | |||||||
State Street Bank (Dated 12/31/03), 0.75%, Due 1/02/04 (Repurchase proceeds $155,606); Collateralized by: United States Government & Agency Issues (c) | $ | 155,600 | 155,600 | ||||
Total Short-Term Investments (Cost $155,600) | 155,600 | ||||||
Total Investments in Securities (Cost $65,896,628) 100.1% | 100,159,622 | ||||||
Other Assets and Liabilities, Net (0.1%) | (44,848 | ) | |||||
Net Assets 100.0% | $ | 100,114,774 | |||||
26
Shares or Principal Amount | Value (Note 2) | ||||
Common Stocks 97.5% | |||||
Apparel - Shoes & Related Manufacturing 0.9% | |||||
Reebok International, Ltd. | 65,200 | $ | 2,563,664 | ||
Auto/Truck - Original Equipment 0.8% | |||||
Eaton Corporation | 22,100 | 2,386,358 | |||
Building - Heavy Construction 1.3% | |||||
Chicago Bridge & Iron Company NV | 126,800 | 3,664,520 | |||
Commercial Services - Market Research 0.7% | �� | ||||
Corporate Executive Board Company (b) | 43,100 | 2,011,477 | |||
Commercial Services - Schools 2.1% | |||||
Apollo Group, Inc. Class A (b) | 26,030 | 1,770,040 | |||
Career Education Corporation (b) | 109,700 | 4,395,679 | |||
| 6,165,719 | |||||
Computer - Local Networks 2.8% | |||||
Juniper Networks, Inc. (b) | 113,900 | 2,127,652 | |||
Polycom, Inc. (b) | 309,300 | 6,037,536 | |||
| 8,165,188 | |||||
Computer Software - Education/Entertainment 2.0% | |||||
Activision, Inc. (b) | 144,444 | 2,628,881 | |||
Electronic Arts, Inc. (b) | 62,900 | 3,005,362 | |||
| 5,634,243 | |||||
Electronics - Miscellaneous Components 1.8% | |||||
Vishay Intertechnology, Inc. (b) | 230,000 | 5,267,000 | |||
Electronics - Scientific Measuring 2.2% | |||||
Teradyne, Inc. (b) | 250,900 | 6,385,405 | |||
Electronics - Semiconductor Manufacturing 16.0% | |||||
ASE Test, Ltd. (b) | 327,000 | 4,895,190 | |||
ATI Technologies, Inc. (b) | 93,200 | 1,409,184 | |||
Amkor Technology, Inc. (b) | 105,500 | 1,921,155 | |||
Credence Systems Corporation (b) | 239,820 | 3,156,031 | |||
Cymer, Inc. (b) | 45,200 | 2,087,788 | |||
Fairchild Semiconductor Corporation Class A (b) | 232,000 | 5,793,040 | |||
Intersil Holding Corporation Class A | 234,400 | 5,824,840 | |||
KLA-Tencor Corporation (b) | 71,780 | 4,211,333 | |||
Linear Technology Corporation | 89,900 | 3,782,093 | |||
SanDisk Corporation (b) | 44,200 | 2,702,388 | |||
Ultratech Stepper, Inc. (b) | 172,600 | 5,069,262 | |||
Xilinx, Inc. (b) | 130,460 | 5,054,020 | |||
| 45,906,324 | |||||
Finance - Mortgage & Related Services 1.8% | |||||
Countrywide Financial Corporation | 67,500 | 5,119,875 | |||
Financial Services - Miscellaneous 0.9% | |||||
Investors Financial Services Corporation | 63,800 | 2,450,558 | |||
Household - Consumer Electronics 2.0% | |||||
Harman International Industries, Inc. | 78,760 | 5,826,665 | |||
Leisure - Gaming/Equipment 1.9% | |||||
International Game Technology | 152,990 | 5,461,743 | |||
Leisure - Movies & Related 0.7% | |||||
Avid Technology, Inc. (b) | 44,200 | 2,121,600 | |||
Leisure - Services 2.4% | |||||
Royal Caribbean Cruises, Ltd. | 202,200 | $ | 7,034,538 | ||
Leisure - Toys/Games/Hobby 3.4% | |||||
Marvel Enterprises, Inc. (b) | 333,425 | 9,706,002 | |||
Media - Cable TV 2.1% | |||||
EchoStar Communications Corporation Class A (b) | 175,500 | 5,967,000 | |||
Media - Newspapers 1.3% | |||||
The E.W. Scripps Company Class A | 38,885 | 3,660,634 | |||
Media - Radio/TV 1.8% | |||||
Emmis Broadcasting Corporation Class A (b) | 102,800 | 2,780,740 | |||
Univision Communications, Inc. Class A (b) | 59,370 | 2,356,395 | |||
| 5,137,135 | |||||
Medical - Biomedical/Biotechnology 4.4% | |||||
Digene Corporation (b) | 118,159 | 4,738,176 | |||
Genzyme Corporation (b) | 84,875 | 4,187,732 | |||
Gilead Sciences, Inc. (b) | 35,126 | 2,042,226 | |||
ImClone Systems, Inc. (b) | 45,200 | 1,792,632 | |||
| 12,760,766 | |||||
Medical - Ethical Drugs 1.4% | |||||
Medicis Pharmaceutical Corporation Class A | 54,600 | 3,892,980 | |||
Medical - Generic Drugs 1.5% | |||||
Watson Pharmaceuticals, Inc. (b) | 92,800 | 4,268,800 | |||
Medical - Genetics 1.5% | |||||
Millennium Pharmaceuticals (b) | 228,300 | 4,262,361 | |||
Medical - Health Maintenance Organizations 1.4% | |||||
Anthem, Inc. (b) | 51,965 | 3,897,375 | |||
Medical - Hospitals 1.7% | |||||
Community Health Systems, Inc. (b) | 181,700 | 4,829,586 | |||
Medical - Nursing Homes 1.2% | |||||
Manor Care, Inc. | 40,900 | 1,413,913 | |||
Select Medical Corporation | 115,700 | 1,883,596 | |||
| 3,297,509 | |||||
Medical - Products 2.0% | |||||
C.R. Bard, Inc. | 25,700 | 2,088,125 | |||
Zimmer Holdings, Inc. (b) | 52,365 | 3,686,496 | |||
| 5,774,621 | |||||
Medical - Systems/Equipment 1.3% | |||||
Varian Medical Systems, Inc. (b) | 30,545 | 2,110,659 | |||
Viasys Healthcare, Inc. (b) | 83,149 | 1,712,869 | |||
| 3,823,528 | |||||
Medical/Dental - Services 0.8% | |||||
VCA Antech, Inc. (b) | 75,570 | 2,341,159 | |||
Medical/Dental - Supplies 0.7% | |||||
Dentsply International, Inc. | 46,100 | 2,082,337 | |||
Oil & Gas - Drilling 2.1% | |||||
ENSCO International, Inc. | 76,500 | 2,078,505 | |||
Nabors Industries, Ltd. (b) | 94,605 | 3,926,107 | |||
| 6,004,612 | |||||
Oil & Gas - Field Services 0.6% | |||||
BJ Services Company (b) | 45,830 | 1,645,297 | |||
27
SCHEDULES OF INVESTMENTS IN SECURITIES (continued ) | December 31, 2003 |
STRONG ENTERPRISE FUND (continued)
Shares or Principal Amount | Value (Note 2) | ||||||
Oil & Gas - International Integrated 1.0% | |||||||
Suncor Energy, Inc. | 117,000 | $ | 2,932,020 | ||||
Oil & Gas - United States Exploration & Production 1.0% | |||||||
Devon Energy Corporation | 52,100 | 2,983,246 | |||||
Pollution Control - Services 1.4% | |||||||
Stericycle, Inc. (b) | 88,000 | 4,109,600 | |||||
Retail - Clothing/Shoes 3.7% | |||||||
Aeropostale, Inc. (b) | 70,000 | 1,919,400 | |||||
Coach, Inc. (b) | 76,100 | 2,872,775 | |||||
Ross Stores, Inc. | 77,300 | 2,043,039 | |||||
Urban Outfitters, Inc. (b) | 101,300 | 3,753,165 | |||||
| 10,588,379 | |||||||
Retail - Home Furnishings 2.7% | |||||||
The Bombay Company, Inc. (b) | 180,900 | 1,472,526 | |||||
Select Comfort Corporation (b) | 183,850 | 4,552,126 | |||||
Williams-Sonoma, Inc. (b) | 46,800 | 1,627,236 | |||||
| 7,651,888 | |||||||
Retail - Leisure Products 1.0% | |||||||
Sports Authority, Inc. (b) | 76,100 | 2,922,240 | |||||
Retail - Miscellaneous 1.4% | |||||||
PETsMART, Inc. | 163,182 | 3,883,732 | |||||
Retail - Restaurants 2.2% | |||||||
Applebee’s International, Inc. | 55,500 | 2,179,485 | |||||
Panera Bread Company Class A (b) | 105,240 | 4,160,137 | |||||
| 6,339,622 | |||||||
Retail/Wholesale - Auto Parts 0.8% | |||||||
CarMax, Inc. (b) | 74,200 | 2,295,006 | |||||
Telecommunications - Equipment 2.2% | |||||||
Adtran, Inc. | 43,400 | 1,345,400 | |||||
Alcatel SA ADR (b) | 235,500 | 3,026,175 | |||||
Avaya, Inc. (b) | 148,600 | 1,922,884 | |||||
| 6,294,459 | |||||||
Telecommunications - Fiber Optics 0.8% | |||||||
Corning, Inc. (b) | 230,500 | 2,404,115 | |||||
Telecommunications - Wireless Services 3.9% | |||||||
Crown Castle International Corporation (b) | 434,200 | 4,789,226 | |||||
Nextel Communications, Inc. Class A (b) | 88,240 | 2,476,014 | |||||
NII Holdings, Inc. Class B (b) | 53,600 | 4,000,168 | |||||
| 11,265,408 | |||||||
Transportation - Airline 1.7% | |||||||
AirTran Holdings, Inc. (b) | 415,800 | 4,948,020 | |||||
Transportation - Truck 0.7% | |||||||
Heartland Express, Inc. | 78,798 | 1,906,124 | |||||
Trucks & Parts - Heavy Duty 3.5% | |||||||
Navistar International Corporation (b) | 161,910 | 7,753,870 | |||||
PACCAR, Inc. | 27,200 | 2,315,264 | |||||
| 10,069,134 | |||||||
Total Common Stocks (Cost $233,483,361) | 280,109,572 | ||||||
Short-Term Investments (a) 4.7% | |||||||
Collateral Received for Securities Lending (d) 4.2% | |||||||
Navigator Prime Portfolio | 12,001,350 | $ | 12,001,350 | ||||
Repurchase Agreements 0.5% | |||||||
State Street Bank (Dated 12/31/03),0.75%, Due 1/02/04, (Repurchase proceeds $1,330,655); Collateralized By: United States Government & Agency Issues (c) | $ | 1,330,600 | 1,330,600 | ||||
Total Short-Term Investments (Cost $13,331,950) | 13,331,950 | ||||||
Total Investments in Securities (Cost $246,815,311) 102.2% | 293,441,522 | ||||||
Other Assets and Liabilities, Net (2.2%) | (6,213,215 | ) | |||||
Net Assets 100.0% | $ | 287,228,307 | |||||
Shares or Principal Amount | Value (Note 2) | ||||
Common Stocks 98.7% | |||||
Building - Resident/Commercial 9.0% | |||||
Centex Corporation | 110,000 | $ | 11,841,500 | ||
Lennar Corporation Class A | 120,000 | 11,520,000 | |||
| 23,361,500 | |||||
Commercial Services - Schools 3.2% | |||||
Apollo Group, Inc. Class A (b) | 120,000 | 8,160,000 | |||
Computer - Local Networks 6.0% | |||||
Cisco Systems, Inc. (b) | 635,000 | 15,424,150 | |||
Computer Software - Enterprise 4.7% | |||||
VERITAS Software Corporation (b) | 330,000 | 12,262,800 | |||
Electronics – Semiconductor Manufacturing 12.9% | |||||
ASML Holding NV (b) | 335,000 | 6,716,750 | |||
Intel Corporation | 300,000 | 9,660,000 | |||
MEMC Electronic Materials, Inc. (b) | 395,000 | 3,799,900 | |||
Marvell Technology Group, Ltd. (b) | 85,000 | 3,224,050 | |||
SanDisk Corporation (b) | 165,000 | 10,088,100 | |||
| 33,488,800 | |||||
Finance - Mortgage & Related Services 5.2% | |||||
Doral Financial Corporation | 420,000 | 13,557,600 | |||
Finance - Savings & Loan 2.4% | |||||
Westcorp | 170,000 | 6,213,500 | |||
Household - Consumer Electronics 6.3% | |||||
Harman International Industries, Inc. | 220,000 | 16,275,600 | |||
Internet - Content 8.4% | |||||
Ask Jeeves, Inc. (b) | 195,000 | 3,533,400 | |||
Yahoo! Inc. (b) | 405,000 | 18,293,850 | |||
| 21,827,250 | |||||
Internet - E*Commerce 6.4% | |||||
eBay, Inc. (b) | 255,000 | 16,470,450 | |||
Internet - Internet Service Provider 2.1% | |||||
J2 Global Communications (b) | 220,000 | 5,449,400 | |||
28
STRONG GROWTH 20 FUND (continued)
Shares or Principal Amount | Value (Note 2) | |||||||
Machinery - Construction/Mining 1.0% | ||||||||
Caterpillar, Inc. | 30,000 | $ | 2,490,600 | |||||
Medical - Biomedical/Biotechnology 3.5% | ||||||||
Gilead Sciences, Inc. (b) | 155,000 | 9,011,700 | ||||||
Medical - Generic Drugs 7.2% | ||||||||
Pharmaceutical Resources, Inc. (b) | 75,000 | 4,886,250 | ||||||
Taro Pharmaceutical Industries, Ltd. (b) | 125,000 | 8,062,500 | ||||||
Teva Pharmaceutical Industries, Ltd. ADR | 100,000 | 5,671,000 | ||||||
| 18,619,750 | ||||||||
Medical - Genetics 2.3% | ||||||||
Genentech, Inc. (b) | 65,000 | 6,082,050 | ||||||
Metal Ores - Gold/Silver 1.5% | ||||||||
Newmont Mining Corporation Holding Company | 80,000 | 3,888,800 | ||||||
Oil & Gas - United States Exploration & Production 4.1% | ||||||||
Ultra Petroleum Corporation (b) | 425,000 | 10,463,500 | ||||||
Retail - Clothing/Shoes 5.8% | ||||||||
Coach, Inc. (b) | 395,000 | 14,911,250 | ||||||
Telecommunications - Fiber Optics 2.0% | ||||||||
Corning, Inc. (b) | 500,000 | 5,215,000 | ||||||
Telecommunications - Wireless Equipment 3.7% | ||||||||
UTStarcom, Inc. (b) | 260,000 | 9,638,200 | ||||||
Trucks & Parts - Heavy Duty 1.0% | ||||||||
Navistar International Corporation (b) | 55,000 | 2,633,950 | ||||||
Total Common Stocks (Cost $204,546,211) | 255,445,850 | |||||||
Short-Term Investments (a) 1.0% | ||||||||
Repurchase Agreements | ||||||||
State Street Bank (Dated 12/31/03),0.75%, Due 1/02/04 (Repurchase proceeds $2,718,413); Collateralized by: United States Government & Agency Issues (c) | $ | 2,718,300 | 2,718,300 | |||||
Total Short-Term Investments (Cost $2,718,300) | 2,718,300 | |||||||
Total Investments in Securities (Cost $207,264,511) 99.7% | 258,164,150 | |||||||
Other Assets and Liabilities, Net 0.3% | 727,997 | |||||||
Net Assets 100.0% | $ | 258,892,147 | ||||||
WRITTEN OPTIONS ACTIVITY | ||||||||
| Contracts | Premiums | |||||||
Options outstanding at beginning of year | — | $ | — | |||||
Options written during the year | 3,385 | 683,262 | ||||||
Options closed | (3,385 | ) | (683,262 | ) | ||||
Options expired | — | — | ||||||
Options exercised | — | — | ||||||
Options outstanding at end of year | — | $ | — | |||||
| Shares or Principal Amount | Value (Note 2) | ||||
Common Stocks 98.4% | |||||
Banks - Midwest 0.8% | |||||
TCF Financial Corporation | 280,000 | $ | 14,378,000 | ||
Banks - Super Regional 1.0% | |||||
Wells Fargo Company | 310,000 | 18,255,900 | |||
Chemicals - Specialty 0.8% | |||||
Praxair, Inc. | 360,000 | 13,752,000 | |||
Commercial Services - Miscellaneous 1.8% | |||||
Paychex, Inc. | 850,000 | 31,620,000 | |||
Commercial Services - Schools 3.8% | |||||
Apollo Group, Inc. Class A (b) | 490,000 | 33,320,000 | |||
Corinthian Colleges, Inc. (b) | 590,000 | 32,780,400 | |||
| 66,100,400 | |||||
Computer - Data Storage 1.0% | |||||
EMC Corporation (b) | 1,414,375 | 18,273,725 | |||
Computer - IT Services 1.4% | |||||
Amdocs, Ltd. (b) | 635,000 | 14,274,800 | |||
Cognizant Technology Solutions Corporation (b) | 220,000 | 10,040,800 | |||
| 24,315,600 | |||||
Computer - Local Networks 4.5% | |||||
Cisco Systems, Inc. (b) | 2,000,000 | 48,580,000 | |||
Juniper Networks, Inc. (b) | 500,000 | 9,340,000 | |||
Polycom, Inc. (b) | 250,000 | 4,880,000 | |||
QLogic Corporation (b) | 300,000 | 15,480,000 | |||
| 78,280,000 | |||||
Computer - Manufacturers 3.1% | |||||
Dell, Inc. (b) | 1,585,000 | 53,826,600 | |||
Computer Software - Desktop 2.1% | |||||
Microsoft Corporation | 1,300,000 | 35,802,000 | |||
Computer Software - Education/Entertainment 0.9% | |||||
Electronic Arts, Inc. (b) | 345,000 | 16,484,100 | |||
Computer Software - Enterprise 3.9% | |||||
Cognos, Inc. (b) | 380,000 | 11,635,600 | |||
Mercury Interactive Corporation (b) | 545,000 | 26,508,800 | |||
SAP AG Sponsored ADR | 425,000 | 17,663,000 | |||
VERITAS Software Corporation (b) | 325,000 | 12,077,000 | |||
| 67,884,400 | |||||
Computer Software - Security 1.4% | |||||
Netscreen Technologies, Inc. (b) | 975,000 | 24,131,250 | |||
Cosmetics - Personal Care 1.0% | |||||
Colgate Palmolive Company | 295,000 | 14,764,750 | |||
The Gillette Company | 95,000 | 3,489,350 | |||
| 18,254,100 | |||||
Diversified Operations 2.2% | |||||
General Electric Company | 1,225,000 | 37,950,500 | |||
Electronics - Contract Manufacturing 1.3% | |||||
Flextronics International, Ltd. (b) | 1,515,000 | 22,482,600 | |||
29
SCHEDULES OF INVESTMENTS IN SECURITIES (continued) | December 31, 2003 |
STRONG GROWTH FUND (continued)
| Shares or Principal Amount | Value (Note 2) | ||||
Electronics - Semiconductor Manufacturing 12.5% | |||||
Analog Devices, Inc. | 615,000 | $ | 28,074,750 | ||
Fairchild Semiconductor Corporation Class A (b) | 225,000 | 5,618,250 | |||
Integrated Circuit Systems, Inc. (b) | 400,000 | 11,396,000 | |||
Intel Corporation | 1,075,000 | 34,615,000 | |||
Intersil Holding Corporation Class A | 830,000 | 20,625,500 | |||
KLA-Tencor Corporation (b) | 315,000 | 18,481,050 | |||
Linear Technology Corporation | 275,000 | 11,569,250 | |||
MEMC Electronic Materials, Inc. (b) | 250,000 | 2,405,000 | |||
Marvell Technology Group, Ltd. (b) | 355,000 | 13,465,150 | |||
Microchip Technology, Inc. | 570,000 | 19,015,200 | |||
Novellus Systems, Inc. (b) | 475,000 | 19,973,750 | |||
Silicon Laboratories, Inc. (b) | 330,000 | 14,262,600 | |||
Taiwan Semiconductor Manufacturing Company, Ltd. Sponsored ADR (b) | 150,000 | 1,536,000 | |||
Xilinx, Inc. (b) | 435,000 | 16,851,900 | |||
| 217,889,400 | |||||
Finance - Consumer/Commercial Loans 1.4% | |||||
SLM Corporation | 655,000 | 24,680,400 | |||
Finance - Investment Brokers 1.2% | |||||
The Goldman Sachs Group, Inc. | 205,000 | 20,239,650 | |||
Finance - Mortgage & Related Services 1.8% | |||||
Countrywide Financial Corporation | 30,000 | 2,275,500 | |||
Doral Financial Corporation | 450,000 | 14,526,000 | |||
FNMA | 190,000 | 14,261,400 | |||
| 31,062,900 | |||||
Financial Services - Miscellaneous 1.5% | |||||
Alliance Data Systems Corporation (b) | 600,000 | 16,608,000 | |||
American Express Company | 185,000 | 8,922,550 | |||
First Marblehead Corporation (b) | 45,600 | 997,728 | |||
| 26,528,278 | |||||
Food - Miscellaneous Preparation 0.4% | |||||
PepsiCo, Inc. | 160,000 | 7,459,200 | |||
Household - Consumer Electronics 0.8% | |||||
Harman International Industries, Inc. | 185,000 | 13,686,300 | |||
Insurance - Diversified 1.0% | |||||
American International Group, Inc. | 255,000 | 16,901,400 | |||
Insurance - Property/Casualty/Title 0.3% | |||||
RenaissanceRe Holdings, Ltd. | 100,000 | 4,905,000 | |||
Internet - Content 1.9% | |||||
Monster Worldwide, Inc. (b) | 465,000 | 10,211,400 | |||
Yahoo! Inc. (b) | 520,000 | 23,488,400 | |||
| 33,699,800 | |||||
Internet - E*Commerce 2.3% | |||||
eBay, Inc. (b) | 500,000 | 32,295,000 | |||
University of Phoenix Online (b) | 105,000 | 7,237,650 | |||
| 39,532,650 | |||||
Internet - Software 0.1% | |||||
BEA Systems, Inc. (b) | 200,000 | 2,460,000 | |||
Leisure - Gaming/Equipment 0.8% | |||||
International Game Technology | 380,000 | 13,566,000 | |||
Leisure - Hotels & Motels 0.8% | |||||
Marriott International, Inc. Class A | 295,000 | 13,629,000 | |||
Machinery - General Industrial 0.5% | |||||
Dover Corporation | 240,000 | $ | 9,540,000 | ||
Media - Cable TV 0.7% | |||||
EchoStar Communications Corporation Class A (b) | 255,000 | 8,670,000 | |||
Hughes Electronics Corporation (b) | 164,643 | 2,724,842 | |||
| 11,394,842 | |||||
Media - Radio/TV 2.8% | |||||
Univision Communications, Inc. Class A (b) | 665,000 | 26,393,850 | |||
Viacom, Inc. Class B | 285,000 | 12,648,300 | |||
XM Satellite Radio Holdings, Inc. Class A (b) | 400,000 | 10,544,000 | |||
| 49,586,150 | |||||
Medical - Biomedical/Biotechnology 5.7% | |||||
Amgen, Inc. (b) | 300,000 | 18,540,000 | |||
Digene Corporation (b) | 530,000 | 21,253,000 | |||
Genzyme Corporation (b) | 565,000 | 27,877,100 | |||
Gilead Sciences, Inc. (b) | 530,000 | 30,814,200 | |||
| 98,484,300 | |||||
Medical - Ethical Drugs 4.0% | |||||
Eli Lilly & Company | 180,000 | 12,659,400 | |||
Pfizer, Inc. | 1,300,000 | 45,929,000 | |||
Wyeth | 250,000 | 10,612,500 | |||
| 69,200,900 | |||||
Medical - Generic Drugs 2.1% | |||||
Mylan Laboratories, Inc. | 500,000 | 12,630,000 | |||
Taro Pharmaceutical Industries, Ltd. (b) | 220,000 | 14,190,000 | |||
Teva Pharmaceutical Industries, Ltd. ADR | �� | 25,000 | 1,417,750 | ||
Watson Pharmaceuticals, Inc. (b) | 175,000 | 8,050,000 | |||
| 36,287,750 | |||||
Medical - Health Maintenance Organizations 0.5% | |||||
Molina Healthcare, Inc. (b) | 375,000 | 9,461,250 | |||
Medical - Products 3.9% | |||||
Advanced Neuromodulation Systems, Inc. (b) | 190,000 | 8,736,200 | |||
Boston Scientific Corporation (b) | 685,000 | 25,180,600 | |||
Medtronic, Inc. | 125,000 | 6,076,250 | |||
Respironics, Inc. (b) | 215,000 | 9,694,350 | |||
St. Jude Medical, Inc. (b) | 285,000 | 17,484,750 | |||
| 67,172,150 | |||||
Medical - Systems/Equipment 0.0% | |||||
Ventana Medical Systems, Inc. (b) | 20,000 | 788,000 | |||
Medical/Dental - Services 0.4% | |||||
VCA Antech, Inc. (b) | 212,000 | 6,567,760 | |||
Oil & Gas - Drilling 0.1% | |||||
ENSCO International, Inc. | 65,000 | 1,766,050 | |||
Oil & Gas - Machinery/Equipment 1.0% | |||||
Smith International, Inc. (b) | 405,000 | 16,815,600 | |||
Oil & Gas - United States Exploration & Production 1.2% | |||||
XTO Energy, Inc. | 745,000 | 21,083,500 | |||
Retail - Clothing/Shoes 2.5% | |||||
Chicos FAS, Inc. (b) | 285,000 | 10,530,750 | |||
Coach, Inc. (b) | 200,000 | 7,550,000 | |||
Ross Stores, Inc. | 965,000 | 25,504,950 | |||
| 43,585,700 | |||||
30
STRONG GROWTH FUND (continued)
31
SCHEDULES OF INVESTMENTS IN SECURITIES (continued) | December 31, 2003 |
STRONG LARGE COMPANY GROWTH FUND (continued)
Shares or Principal Amount | Value (Note 2) | ||||||
Computer Software - Financial 1.0% | |||||||
Intuit, Inc. (b) | 14,000 | $ | 740,740 | ||||
Diversified Operations 5.9% | |||||||
General Electric Company | 96,000 | 2,974,080 | |||||
United Technologies Corporation | 13,000 | 1,232,010 | |||||
| 4,206,090 | |||||||
Electronics - Scientific Measuring 1.5% | |||||||
Cognex Corporation | 38,400 | 1,084,416 | |||||
Electronics - Semiconductor Manufacturing 6.3% | |||||||
Intel Corporation | 61,800 | 1,989,960 | |||||
NVIDIA Corporation (b) | 41,000 | 953,250 | |||||
National Semiconductor Corporation (b) | 40,000 | 1,576,400 | |||||
| 4,519,610 | |||||||
Finance - Index Tracking Fund 1.1% | |||||||
MSCI I Shares Emerging Markets Index | 5,000 | 819,650 | |||||
Finance - Mortgage & Related Services 1.7% | |||||||
FNMA | 16,100 | 1,208,466 | |||||
Finance - Publicly Traded Investment Funds-Equity (Non 40 Act) 1.3% | |||||||
Pharmaceutical Holders Trust | 11,500 | 914,250 | |||||
Finance - Savings & Loan 1.0% | |||||||
Washington Mutual, Inc. | 18,000 | 722,160 | |||||
Financial Services - Miscellaneous 1.8% | |||||||
American Express Company | 27,300 | 1,316,679 | |||||
Food - Dairy Products 1.7% | |||||||
Dean Foods Company (b) | 37,500 | 1,232,625 | |||||
Food - Miscellaneous Preparation 1.9% | |||||||
PepsiCo, Inc. | 29,000 | 1,351,980 | |||||
Insurance - Diversified 2.9% | |||||||
American International Group, Inc. | 31,800 | 2,107,704 | |||||
Internet - E*Commerce 4.4% | |||||||
eBay,Inc. (b) | 23,600 | 1,524,324 | |||||
InterActiveCorp (b) | 48,000 | 1,628,640 | |||||
| 3,152,964 | |||||||
Media - Cable TV 1.5% | |||||||
Comcast Corporation Class A (b) | 32,000 | 1,051,840 | |||||
Media - Radio/TV 2.3% | |||||||
Viacom, Inc. Class B | 36,500 | 1,619,870 | |||||
Medical - Biomedical/Biotechnology 5.8% | |||||||
Amgen, Inc. (b) | 40,400 | 2,496,720 | |||||
Medimmune, Inc. (b) | 30,700 | 779,780 | |||||
Nektar Therapeutics (b) | 67,500 | 918,675 | |||||
| 4,195,175 | |||||||
Medical - Drug/Diversified 2.2% | |||||||
Johnson & Johnson | 30,500 | 1,575,630 | |||||
Medical - Ethical Drugs 5.7% | |||||||
Merck & Company, Inc. | 23,000 | 1,062,600 | |||||
Pfizer, Inc. | 86,180 | 3,044,739 | |||||
| 4,107,339 | |||||||
Medical - Generic Drugs 4.7% | |||||||
Barr Laboratories, Inc. (b) | 22,000 | $ | 1,692,900 | ||||
Teva Pharmaceutical Industries, Ltd. ADR | 29,200 | 1,655,932 | |||||
| 3,348,832 | |||||||
Medical - Products 1.7% | |||||||
Alcon, Inc. | 20,300 | 1,228,962 | |||||
Medical/Dental - Services 2.4% | |||||||
Aaipharma, Inc. (b) | 20,000 | 502,400 | |||||
Covance, Inc. (b) | 45,000 | 1,206,000 | |||||
| 1,708,400 | |||||||
Metal Ores - Miscellaneous 1.3% | |||||||
Freeport-McMoran Copper & Gold, Inc. Class B | 22,000 | 926,860 | |||||
Metal Products - Fasteners 1.5% | |||||||
Illinois Tool Works, Inc. | 13,000 | 1,090,830 | |||||
Oil& Gas - United States Exploration & Production 1.2% | |||||||
Devon Energy Corporation | 14,417 | 825,517 | |||||
Retail - Major Discount Chains 1.5% | |||||||
Wal-Mart Stores, Inc. | 19,800 | 1,050,390 | |||||
Retail/Wholesale - Building Products 1.9% | |||||||
Lowe’s Companies, Inc. | 25,100 | 1,390,289 | |||||
Retail/Wholesale - Jewelry 1.9% | |||||||
Tiffany & Company | 30,600 | 1,383,120 | |||||
Soap & Cleaning Preparations 1.5% | |||||||
The Procter & Gamble Company | 11,000 | 1,098,680 | |||||
Telecommunications - Wireless Equipment 2.3% | |||||||
Nokia Corporation Sponsored ADR | 97,500 | 1,657,500 | |||||
Total Common Stocks (Cost $62,915,131) | 71,332,972 | ||||||
Short-Term Investments (a) 1.7% | |||||||
Repurchase Agreements | |||||||
State Street Bank (Dated 12/31/03), 0.75%, Due 1/02/04 (Repurchase Proceeds $1,200,350); Collateralized by: United States Government & Agency Issues (c) | $ | 1,200,300 | 1,200,300 | ||||
Total Short-Term Investments (Cost $1,200,300) | 1,200,300 | ||||||
Total Investments in Securities (Cost $64,115,431) 101.1% | 72,533,272 | ||||||
Other Assets and Liabilities, Net (1.1%) | (758,683 | ) | |||||
NetAssets 100.0% | $ | 71,774,589 | |||||
LEGEND
| (a) | Short-term investments include any security which has a remaining maturity of less than one year and investments in money market funds. |
| (b) | Non-income producing security. |
| (c) | See Note 2(J) of Notes to Financial Statements. |
| (d) | See Note 2(K) of Notes to Financial Statements. |
Percentages are stated as a percent of net assets.
See Notes to Financial Statements.
32
STATEMENTS OF ASSETS AND LIABILITIES
December 31, 2003
| (In Thousands, Except Per Share Amounts) | ||||||||||||
Strong Blue Chip | Strong Discovery Fund | Strong Endeavor Fund | ||||||||||
Assets: | ||||||||||||
Investments in Securities, at Value (Cost of $136,541, $145,861 and $3,751, respectively) | $ | 176,397 | $ | 175,207 | $ | 4,524 | ||||||
Receivable for Securities Sold | — | 1,123 | 22 | |||||||||
Receivable for Fund Shares Sold | 13 | 166 | — | |||||||||
Dividends and Interest Receivable | 66 | 28 | 2 | |||||||||
Other Assets | 81 | 27 | 5 | |||||||||
Total Assets | 176,557 | 176,551 | 4,553 | |||||||||
Liabilities: | ||||||||||||
Payable for Securities Purchased | — | — | 46 | |||||||||
Payable for Fund Shares Redeemed | 114 | 84 | — | |||||||||
Payable Upon Return of Securities on Loan | — | 9,614 | — | |||||||||
Accrued Operating Expenses and Other Liabilities | 133 | 60 | 7 | |||||||||
Total Liabilities | 247 | 9,758 | 53 | |||||||||
Net Assets | $ | 176,310 | $ | 166,793 | $ | 4,500 | ||||||
Net Assets Consist of: | ||||||||||||
Capital Stock (Par Value and Paid-in Capital) | $ | 328,447 | $ | 138,569 | $ | 5,590 | ||||||
Undistributed Net Investment Income (Loss) | — | — | — | |||||||||
Undistributed Net Realized Gain (Loss) | (191,993 | ) | (1,122 | ) | (1,863 | ) | ||||||
Net Unrealized Appreciation (Depreciation) | 39,856 | 29,346 | 773 | |||||||||
Net Assets | $ | 176,310 | $ | 166,793 | $ | 4,500 | ||||||
Capital Shares Outstanding (Unlimited Number Authorized) | 15,862 | 8,452 | 483 | |||||||||
Net Asset Value Per Share | $ | 11.12 | $ | 19.73 | $ | 9.32 | ||||||
See Notes to Financial Statements.
33
STATEMENTS OF ASSETS AND LIABILITIES (continued)
December 31, 2003
| (In Thousands, Except Per Share Amounts) | ||||||||
Strong Large Cap | Strong U.S. Growth Fund | |||||||
Assets: | ||||||||
Investments in Securities, at Value (Cost of $510,816 and $65,897, respectively) | $ | 645,573 | $ | 100,160 | ||||
Receivable for Securities Sold | 9,045 | — | ||||||
Receivable for Fund Shares Sold | 65 | 48 | ||||||
Dividends and Interest Receivable | 189 | 6 | ||||||
Other Assets | 70 | 13 | ||||||
Total Assets | 654,942 | 100,227 | ||||||
Liabilities: | ||||||||
Payable for Securities Purchased | 7,442 | — | ||||||
Payable for Fund Shares Redeemed | 179 | 65 | ||||||
Payable Upon Return of Securities on Loan | 2,938 | — | ||||||
Accrued Operating Expenses and Other Liabilities | 252 | 47 | ||||||
Total Liabilities | 10,811 | 112 | ||||||
Net Assets | $ | 644,131 | $ | 100,115 | ||||
Net Assets Consist of: | ||||||||
Capital Stock (Par Value and Paid-in Capital) | $ | 1,061,010 | $ | 128,069 | ||||
Undistributed Net Investment Income (Loss) | — | — | ||||||
Undistributed Net Realized Gain (Loss) | (551,636 | ) | (62,217 | ) | ||||
Net Unrealized Appreciation (Depreciation) | 134,757 | 34,263 | ||||||
Net Assets | $ | 644,131 | $ | 100,115 | ||||
Capital Shares Outstanding (Unlimited Number Authorized) | 30,759 | 6,720 | ||||||
Net Asset Value Per Share | $ | 20.94 | $ | 14.90 | ||||
See Notes to Financial Statements.
34
STATEMENTS OF ASSETS AND LIABILITIES (continued)
December 31, 2003
(In Thousands, Except As Noted) | ||||
Strong Fund | ||||
Assets: | ||||
Investments in Securities, at Value (Cost of $246,815) | $ | 293,442 | ||
Receivable for Securities Sold | 6,840 | |||
Receivable for Fund Shares Sold | 5 | |||
Dividends and Interest Receivable | 49 | |||
Other Assets | 55 | |||
Total Assets | 300,391 | |||
Liabilities: | ||||
Payable for Securities Purchased | 775 | |||
Payable for Fund Shares Redeemed | 209 | |||
Payable Upon Return of Securities on Loan | 12,001 | |||
Accrued Operating Expenses and Other Liabilities | 178 | |||
Total Liabilities | 13,163 | |||
Net Assets | $ | 287,228 | ||
Net Assets Consist of: | ||||
Capital Stock (Par Value and Paid-in Capital) | $ | 572,444 | ||
Undistributed Net Investment Income (Loss) | — | |||
Undistributed Net Realized Gain (Loss) | (331,842 | ) | ||
Net Unrealized Appreciation (Depreciation) | 46,626 | |||
Net Assets | $ | 287,228 | ||
Investor Class ($ and shares in full) | ||||
Net Assets | $ | 249,220,769 | ||
Capital Shares Outstanding (Unlimited Number Authorized) | 11,441,034 | |||
Net Asset Value Per Share | $ | 21.78 | ||
Institutional Class ($ and shares in full) | ||||
Net Assets | $ | 2,113,659 | ||
Capital Shares Outstanding (Unlimited Number Authorized) | 96,657 | |||
Net Asset Value Per Share | $ | 21.87 | ||
Advisor Class ($ and shares in full) | ||||
Net Assets | $ | 1,689,567 | ||
Capital Shares Outstanding (Unlimited Number Authorized) | 77,528 | |||
Net Asset Value Per Share | $ | 21.79 | ||
Class K ($ and shares in full) | ||||
Net Assets | $ | 34,204,312 | ||
Capital Shares Outstanding (Unlimited Number Authorized) | 1,556,215 | |||
Net Asset Value Per Share | $ | 21.98 | ||
See Notes to Financial Statements.
35
STATEMENTS OF ASSETS AND LIABILITIES (continued)
December 31, 2003
(In Thousands, Except As Noted) | ||||
Strong Growth 20 Fund | ||||
Assets: | ||||
Investments in Securities, at Value (Cost of $207,265) | $ | 258,164 | ||
Receivable for Securities Sold | 1,432 | |||
Receivable for Fund Shares Sold | 18 | |||
Dividends and Interest Receivable | 5 | |||
Other Assets | 25 | |||
Total Assets | 259,644 | |||
Liabilities: | ||||
Payable for Fund Shares Redeemed | 589 | |||
Accrued Operating Expenses and Other Liabilities | 163 | |||
Total Liabilities | 752 | |||
Net Assets | $ | 258,892 | ||
Net Assets Consist of: | ||||
Capital Stock (Par Value and Paid-in Capital) | $ | 597,315 | ||
Undistributed Net Investment Income (Loss) | — | |||
Undistributed Net Realized Gain (Loss) | (389,323 | ) | ||
Net Unrealized Appreciation (Depreciation) | 50,900 | |||
Net Assets | $ | 258,892 | ||
Investor Class ($ and shares in full) | ||||
Net Assets | $ | 253,148,948 | ||
Capital Shares Outstanding (Unlimited Number Authorized) | 19,533,240 | |||
Net Asset Value Per Share | $ | 12.96 | ||
Advisor Class ($ and shares in full) | ||||
Net Assets | $ | 5,743,199 | ||
Capital Shares Outstanding (Unlimited Number Authorized) | 442,237 | |||
Net Asset Value Per Share | $ | 12.99 | ||
See Notes to Financial Statements.
36
STATEMENTS OF ASSETS AND LIABILITIES (continued)
December 31, 2003
(In Thousands, Except As Noted) | ||||
Strong Growth Fund | ||||
Assets: | ||||
Investments in Securities, at Value (Cost of $1,322,182) | $ | 1,771,128 | ||
Receivable for Securities Sold | 6,647 | |||
Receivable for Fund Shares Sold | 67 | |||
Dividends and Interest Receivable | 384 | |||
Other Assets | 112 | |||
Total Assets | 1,778,338 | |||
Liabilities: | ||||
Payable for Securities Purchased | 12,172 | |||
Payable for Fund Shares Redeemed | 1,017 | |||
Payable Upon Return of Securities on Loan | 21,625 | |||
Accrued Operating Expenses and Other Liabilities | 609 | |||
Total Liabilities | 35,423 | |||
Net Assets | $ | 1,742,915 | ||
Net Assets Consist of: | ||||
Capital Stock (Par Value and Paid-in Capital) | $ | 2,255,117 | ||
Undistributed Net Investment Income (Loss) | — | |||
Undistributed Net Realized Gain (Loss) | (961,148 | ) | ||
Net Unrealized Appreciation (Depreciation) | 448,946 | |||
Net Assets | $ | 1,742,915 | ||
Investor Class ($ and shares in full) | ||||
Net Assets | $ | 1,365,945,936 | ||
Capital Shares Outstanding (Unlimited Number Authorized) | 79,461,537 | |||
Net Asset Value Per Share | $ | 17.19 | ||
Institutional Class ($ and shares in full) | ||||
Net Assets | $ | 311,311,912 | ||
Capital Shares Outstanding (Unlimited Number Authorized) | 17,639,984 | |||
Net Asset Value Per Share | $ | 17.65 | ||
Advisor Class ($ and shares in full) | ||||
Net Assets | $ | 9,294,285 | ||
Capital Shares Outstanding (Unlimited Number Authorized) | 543,982 | |||
Net Asset Value Per Share | $ | 17.09 | ||
Class C ($ and shares in full) | ||||
Net Assets | $ | 511,781 | ||
Capital Shares Outstanding (Unlimited Number Authorized) | 30,052 | |||
Net Asset Value Per Share | $ | 17.03 | ||
Class K ($ and shares in full) | ||||
Net Assets | $ | 55,850,865 | ||
Capital Shares Outstanding (Unlimited Number Authorized) | 3,212,827 | |||
Net Asset Value Per Share | $ | 17.38 | ||
See Notes to Financial Statements.
37
STATEMENTS OF ASSETS AND LIABILITIES (continued)
December 31, 2003
(In Thousands, Except As Noted) | ||||
Strong Large Growth Fund | ||||
Assets: | ||||
Investments in Securities, at Value (Cost of $64,115) | $ | 72,533 | ||
Receivable for Securities Sold | 2,158 | |||
Receivable for Fund Shares Sold | 176 | |||
Dividends and Interest Receivable | 47 | |||
Other Assets | 18 | |||
Total Assets | 74,932 | |||
Liabilities: | ||||
Payable for Securities Purchased | 3,116 | |||
Payable for Fund Shares Redeemed | 13 | |||
Accrued Operating Expenses and Other Liabilities | 28 | |||
Total Liabilities | 3,157 | |||
Net Assets | $ | 71,775 | ||
Net Assets Consist of: | ||||
Capital Stock (Par Value and Paid-in Capital) | $ | 72,858 | ||
Undistributed Net Investment Income (Loss) | — | |||
Undistributed Net Realized Gain (Loss) | (9,501 | ) | ||
Net Unrealized Appreciation (Depreciation) | 8,418 | |||
Net Assets | $ | 71,775 | ||
Investor Class ($ and shares in full) | ||||
Net Assets | $ | 70,748,434 | ||
Capital Shares Outstanding (Unlimited Number Authorized) | 5,296,582 | |||
Net Asset Value Per Share | $ | 13.36 | ||
Class K ($ and shares in full) | ||||
Net Assets | $ | 1,026,155 | ||
Capital Shares Outstanding (Unlimited Number Authorized) | 76,602 | |||
Net Asset Value Per Share | $ | 13.40 | ||
See Notes to Financial Statements.
38
For the Year Ended December 31, 2003
| (In Thousands) | ||||||||||||
| Strong Blue Chip Fund | Strong Discovery Fund | Strong Endeavor | ||||||||||
Income: | ||||||||||||
Dividends – Unaffiliated Issuers (net of foreign withholding taxes of $1,$4 and $0, respectively) | $ | 1,468 | $ | 1,031 | $ | 32 | ||||||
Dividends – Affiliated Issuers | — | 5 | — | |||||||||
Interest | 63 | 105 | 1 | |||||||||
Total Income | 1,531 | 1,141 | 33 | |||||||||
Expenses: | ||||||||||||
Investment Advisory Fees | 883 | 1,126 | 34 | |||||||||
Administrative Fees | 530 | 375 | 13 | |||||||||
Custodian Fees | 13 | 28 | 7 | |||||||||
Shareholder Servicing Costs | 1,302 | 510 | 25 | |||||||||
Reports to Shareholders | 207 | 99 | 4 | |||||||||
12b-1 Fees | — | — | 11 | |||||||||
Professional Fees | 26 | 27 | 11 | |||||||||
Federal and State Registration Fees | 17 | 26 | 18 | |||||||||
Other | 51 | 23 | 3 | |||||||||
Total Expenses before Expense Offsets | 3,029 | 2,214 | 126 | |||||||||
Expense Offsets (Note 4) | (127 | ) | (61 | ) | (43 | ) | ||||||
Expenses, Net | 2,902 | 2,153 | 83 | |||||||||
Net Investment Income (Loss) | (1,371 | ) | (1,012 | ) | (50 | ) | ||||||
Realized and Unrealized Gain (Loss): | ||||||||||||
Net Realized Gain (Loss) on Investments | (20,202 | ) | 19,126 | 521 | ||||||||
Net Change in Unrealized Appreciation/Depreciation on Investments | 67,883 | 30,925 | 801 | |||||||||
Net Gain (Loss) on Investments | 47,681 | 50,051 | 1,322 | |||||||||
Net Increase (Decrease) in Net Assets Resulting from Operations | $ | 46,310 | $ | 49,039 | $ | 1,272 | ||||||
See Notes to Financial Statements.
39
STATEMENTS OF OPERATIONS (continued)
For the Year Ended December 31, 2003
| (In Thousands) | ||||||||
| Strong Large Cap Growth Fund | Strong U.S. Emerging Growth Fund | |||||||
Income: | ||||||||
Dividends – Unaffiliated Issuers (net of foreign withholding taxes of $21 and $0, respectively) | $ | 4,741 | $ | 24 | ||||
Dividends – Affiliated Issuers | 1 | — | ||||||
Interest | 173 | 16 | ||||||
Total Income | 4,915 | 40 | ||||||
Expenses: | ||||||||
Investment Advisory Fees | 3,504 | 610 | ||||||
Administrative Fees | 1,906 | 244 | ||||||
Custodian Fees | 60 | 13 | ||||||
Shareholder Servicing Costs | 2,071 | 451 | ||||||
Reports to Shareholders | 350 | 58 | ||||||
Other | 202 | 56 | ||||||
Total Expenses before Expense Offsets | 8,093 | 1,432 | ||||||
Expense Offsets (Note 4) | (146 | ) | (67 | ) | ||||
Expenses, Net | 7,947 | 1,365 | ||||||
Net Investment Income (Loss) | (3,032 | ) | (1,325 | ) | ||||
Realized and Unrealized Gain (Loss): | ||||||||
Net Realized Gain (Loss) on: | ||||||||
Investments | 31,449 | 7,047 | ||||||
Written Options | 254 | — | ||||||
Futures Contracts | 4,629 | — | ||||||
Net Realized Gain (Loss) | 36,332 | 7,047 | ||||||
Net Change in Unrealized Appreciation/Depreciation on: | ||||||||
Investments | 117,355 | 26,088 | ||||||
Futures Contracts | 490 | — | ||||||
Net Change in Unrealized Appreciation/Depreciation | 117,845 | 26,088 | ||||||
Net Gain (Loss) on Investments | 154,177 | 33,135 | ||||||
Net Increase (Decrease) in Net Assets Resulting from Operations | $ | 151,145 | $ | 31,810 | ||||
See Notes to Financial Statements.
40
STATEMENTS OF OPERATIONS (continued)
For the Year Ended December 31, 2003
| (In Thousands) | ||||||||
| Strong Enterprise Fund | Strong Growth 20 Fund | |||||||
Income: | ||||||||
Dividends (net of foreign withholding taxes of $15 and $12, respectively) | $ | 824 | $ | 386 | ||||
Interest | 127 | 158 | ||||||
Total Income | 951 | 544 | ||||||
Expenses (Note 4): | ||||||||
Investment Advisory Fees | 1,953 | 1,995 | ||||||
Administrative Fees | 769 | 797 | ||||||
Custodian Fees | 28 | 23 | ||||||
Shareholder Servicing Costs | 1,717 | 1,481 | ||||||
Reports to Shareholders | 325 | 241 | ||||||
12b-1 Fees | 4 | 17 | ||||||
Federal and State Registration Fees | 53 | 32 | ||||||
Other | 107 | 80 | ||||||
Total Expenses before Expense Offsets | 4,956 | 4,666 | ||||||
Expense Offsets | (399 | ) | (124 | ) | ||||
Expenses, Net | 4,557 | 4,542 | ||||||
Net Investment Income (Loss) | (3,606 | ) | (3,998 | ) | ||||
Realized and Unrealized Gain (Loss): | ||||||||
Net Realized Gain (Loss) on: | ||||||||
Investments | 41,662 | 24,221 | ||||||
Written Options | — | (460 | ) | |||||
Futures Contracts | — | 1,104 | ||||||
Net Realized Gain (Loss) | 41,662 | 24,865 | ||||||
Net Change in Unrealized Appreciation/Depreciation on Investments | 43,963 | 43,224 | ||||||
Net Gain (Loss) on Investments | 85,625 | 68,089 | ||||||
Net Increase (Decrease) in Net Assets Resulting from Operations | $ | 82,019 | $ | 64,091 | ||||
See Notes to Financial Statements.
41
STATEMENTS OF OPERATIONS (continued)
For the Year Ended December 31, 2003
| (In Thousands) | ||||||||
| Strong Growth Fund | Strong Large Company Growth Fund | |||||||
Income: | ||||||||
Dividends – Unaffiliated Issuers (net of foreign withholding taxes of $56 and $1, respectively) | $ | 7,279 | $ | 411 | ||||
Dividends – Affiliated Issuers | 50 | — | ||||||
Interest | 274 | 34 | ||||||
Total Income | 7,603 | 445 | ||||||
Expenses (Note 4): | ||||||||
Investment Advisory Fees | 12,665 | 330 | ||||||
Administrative Fees | 4,301 | 132 | ||||||
Custodian Fees | 123 | 14 | ||||||
Shareholder Servicing Costs | 5,546 | 102 | ||||||
Reports to Shareholders | 1,086 | 30 | ||||||
12b-1 Fees | 29 | 110 | ||||||
Federal and State Registration Fees | 87 | 45 | ||||||
Other | 458 | 13 | ||||||
Total Expenses before Expense Offsets | 24,295 | 776 | ||||||
Expense Offsets | (406 | ) | (129 | ) | ||||
Expenses, Net | 23,889 | 647 | ||||||
Net Investment Income (Loss) | (16,286 | ) | (202 | ) | ||||
Realized and Unrealized Gain (Loss): | ||||||||
Net Realized Gain (Loss) on: | ||||||||
Investments | 145,678 | 1,276 | ||||||
Written Options | (587 | ) | — | |||||
Futures Contracts | 834 | — | ||||||
Net Realized Gain (Loss) | 145,925 | 1,276 | ||||||
Net Change in Unrealized Appreciation/Depreciation on: | ||||||||
Investments | 320,871 | 8,628 | ||||||
Written Options | (271 | ) | — | |||||
Net Change in Unrealized Appreciation/Depreciation | 320,600 | 8,628 | ||||||
Net Gain (Loss) on Investments | 466,525 | 9,904 | ||||||
Net Increase (Decrease) in Net Assets Resulting from Operations | $ | 450,239 | $ | 9,702 | ||||
See Notes to Financial Statements.
42
STATEMENT OF CHANGES IN NET ASSETS
| (In Thousands) | ||||||||||||||||
| Strong Blue Chip Fund | Strong Discovery Fund | |||||||||||||||
Year Ended Dec. 31, 2003 | Year Ended Dec. 31, 2002 | Year Ended Dec. 31, 2003 | Year Ended Dec. 31, 2002 | |||||||||||||
Operations: | ||||||||||||||||
Net Investment Income (Loss) | $ | (1,371 | ) | $ | (1,903 | ) | $ | (1,012 | ) | $ | (548 | ) | ||||
Net Realized Gain (Loss) | (20,202 | ) | (50,225 | ) | 19,126 | (17,115 | ) | |||||||||
Net Change in Unrealized Appreciation/Depreciation | 67,883 | (40,555 | ) | 30,925 | (1,218 | ) | ||||||||||
Net Increase (Decrease) in Net Assets Resulting from Operations | 46,310 | (92,683 | ) | 49,039 | (18,881 | ) | ||||||||||
Distributions: | ||||||||||||||||
From Net Investment Income | — | — | (7 | ) | — | |||||||||||
From Net Realized Gains | — | — | (1,805 | ) | (4,117 | ) | ||||||||||
Total Distributions | — | — | (1,812 | ) | (4,117 | ) | ||||||||||
Capital Share Transactions (Note 8): | ||||||||||||||||
Net Increase (Decrease) in Net Assets from Capital Share Transactions | (73,292 | ) | (43,020 | ) | (13,795 | ) | (1,907 | ) | ||||||||
Total Increase (Decrease) in Net Assets | (26,982 | ) | (135,703 | ) | 33,432 | (24,905 | ) | |||||||||
NetAssets: | ||||||||||||||||
Beginning of Year | 203,292 | 338,995 | 133,361 | 158,266 | ||||||||||||
End of Year | $ | 176,310 | $ | 203,292 | $ | 166,793 | $ | 133,361 | ||||||||
Undistributed Net Investment Income (Loss) | $ | — | $ | — | $ | — | $ | 7 | ||||||||
| Strong Endeavor Fund | Strong Large Cap Growth Fund | |||||||||||||||
Year Ended Dec. 31, 2003 | Year Ended Dec. 31, 2002 | Year Ended Dec. 31, 2003 | Year Ended Dec. 31, 2002 | |||||||||||||
Operations: | ||||||||||||||||
Net Investment Income (Loss) | $ | (50 | ) | $ | (57 | ) | $ | (3,032 | ) | $ | (2,758 | ) | ||||
Net Realized Gain (Loss) | 521 | (1,459 | ) | 36,332 | �� | (168,104 | ) | |||||||||
Net Change in Unrealized Appreciation/Depreciation | 801 | (232 | ) | 117,845 | (103,040 | ) | ||||||||||
Net Increase (Decrease) in Net Assets Resulting from Operations | 1,272 | (1,748 | ) | 151,145 | (273,902 | ) | ||||||||||
Distributions From Net Investment Income | — | — | — | — | ||||||||||||
Capital Share Transactions (Note 8): | ||||||||||||||||
Net Increase (Decrease) in Net Assets from Capital Share Transactions | (447 | ) | (794 | ) | (95,908 | ) | (113,540 | ) | ||||||||
Total Increase (Decrease) in NetAssets | 825 | (2,542 | ) | 55,237 | (387,442 | ) | ||||||||||
Net Assets: | ||||||||||||||||
Beginning of Year | 3,675 | 6,217 | 588,894 | 976,336 | ||||||||||||
End of Year | $ | 4,500 | $ | 3,675 | $ | 644,131 | $ | 588,894 | ||||||||
Undistributed Net Investment Income (Loss) | $ | — | $ | — | $ | — | $ | — | ||||||||
See Notes to Financial Statements.
43
STATEMENTS OF CHANGES IN NET ASSETS (continued)
| (In Thousands) | ||||||||
| Strong U.S. Emerging Growth Fund | ||||||||
| Year Ended Dec. 31, 2003 | Year Ended Dec. 31, 2002 | |||||||
Operations: | ||||||||
Net Investment Income (Loss) | $ | (1,325 | ) | $ | (1,384 | ) | ||
Net Realized Gain (Loss) | 7,047 | (22,207 | ) | |||||
Net Change in Unrealized Appreciation/Depreciation | 26,088 | (8,450 | ) | |||||
Net Increase (Decrease) in Net Assets Resulting from Operations | 31,810 | (32,041 | ) | |||||
Distributions From Net Investment Income | — | — | ||||||
Capital Share Transactions (Note 8): | ||||||||
Net Increase (Decrease) in Net Assets from Capital Share Transactions | 9,891 | 4,156 | ||||||
Total Increase (Decrease) in Net Assets | 41,701 | (27,885 | ) | |||||
Net Assets: | ||||||||
Beginning of Year | 58,414 | 86,299 | ||||||
End of Year | $ | 100,115 | $ | 58,414 | ||||
Undistributed Net Investment Income (Loss) | $ | — | $ | — | ||||
| Strong Enterprise Fund | ||||||||
Year Ended Dec. 31, 2003 | Year Ended Dec. 31, 2002 | |||||||
Operations: | ||||||||
Net Investment Income (Loss) | $ | (3,606 | ) | $ | (4,456 | ) | ||
Net Realized Gain (Loss) | 41,662 | (68,214 | ) | |||||
Net Change in Unrealized Appreciation/Depreciation | 43,963 | (28,578 | ) | |||||
Net Increase (Decrease) in Net Assets Resulting from Operations | 82,019 | (101,248 | ) | |||||
Distributions From Net Investment Income | — | — | ||||||
Capital Share Transactions (Note 8): | ||||||||
Net Increase (Decrease) in Net Assets from Capital Share Transactions | (24,147 | ) | (42,799 | ) | ||||
Total Increase (Decrease) in Net Assets | 57,872 | (144,047 | ) | |||||
Net Assets: | ||||||||
Beginning of Year | 229,356 | 373,403 | ||||||
End of Year | $ | 287,228 | $ | 229,356 | ||||
Undistributed Net Investment Income (Loss) | $ | — | $ | — | ||||
See Notes to Financial Statements.
44
STATEMENTS OF CHANGES IN NET ASSETS (continued)
| (In Thousands) | ||||||||
| Strong Growth 20 Fund | ||||||||
Year Ended Dec. 31, 2003 | Year Ended Dec. 31, 2002 | |||||||
Operations: | ||||||||
Net Investment Income (Loss) | $ | (3,998 | ) | $ | (3,854 | ) | ||
Net Realized Gain (Loss) | 24,865 | (42,684 | ) | |||||
Net Change in Unrealized Appreciation/Depreciation | 43,224 | (53,067 | ) | |||||
Net Increase (Decrease) in Net Assets Resulting from Operations | 64,091 | (99,605 | ) | |||||
Distributions From Net Investment Income | — | — | ||||||
Capital Share Transactions (Note 8): | ||||||||
Net Increase (Decrease) in Net Assets from Capital Share Transactions | 4,591 | (81,964 | ) | |||||
Total Increase (Decrease) in Net Assets | 68,682 | (181,569 | ) | |||||
Net Assets: | ||||||||
Beginning of Year | 190,210 | 371,779 | ||||||
End of Year | $ | 258,892 | $ | 190,210 | ||||
Undistributed Net Investment Income (Loss) | $ | — | $ | — | ||||
| Strong Growth Fund | ||||||||
| Year Ended Dec. 31, 2003 | Year Ended Dec. 31, 2002 | |||||||
Operations: | ||||||||
Net Investment Income (Loss) | $ | (16,286 | ) | $ | (19,533 | ) | ||
Net Realized Gain (Loss) | 145,925 | (268,584 | ) | |||||
Net Change in Unrealized Appreciation/Depreciation | 320,600 | (230,635 | ) | |||||
Net Increase (Decrease) in Net Assets Resulting from Operations | 450,239 | (518,752 | ) | |||||
Distributions From Net Investment Income | — | — | ||||||
Capital Share Transactions (Note 8): | ||||||||
Net Increase (Decrease) in Net Assets from Capital Share Transactions | (181,638 | ) | (115,867 | ) | ||||
Total Increase (Decrease) in Net Assets | 268,601 | (634,619 | ) | |||||
Net Assets: | ||||||||
Beginning of Year | 1,474,314 | 2,108,933 | ||||||
End of Year | $ | 1,742,915 | $ | 1,474,314 | ||||
Undistributed Net Investment Income (Loss) | $ | — | $ | — | ||||
See Notes to Financial Statements.
45
STATEMENTS OF CHANGES IN NET ASSETS (continued)
| (In Thousands) | ||||||||||||
| Strong Large Company Growth Fund | ||||||||||||
Year Ended Dec. 31, 2003 | Period Ended Dec. 31, 2002 | Year Ended Sept. 30, 2002 | ||||||||||
Operations: | ||||||||||||
Net Investment Income (Loss) | $ | (202 | ) | $ | 14 | $ | 703 | |||||
Net Realized Gain (Loss) | 1,276 | (1,310 | ) | (4,671 | ) | |||||||
Net Change in Unrealized Appreciation/Depreciation | 8,628 | 2,206 | 653 | |||||||||
Net Increase (Decrease) in Net Assets Resulting from Operations | 9,702 | 910 | (3,315 | ) | ||||||||
Distributions: | ||||||||||||
From Net Investment Income: | ||||||||||||
Investor Class | (14 | ) | (77 | ) | (631 | ) | ||||||
From Net Realized Gains: | ||||||||||||
Investor Class | — | — | (69 | ) | ||||||||
Total Distributions | (14 | ) | (77 | ) | (700 | ) | ||||||
Capital Share Transactions (Note 8): | ||||||||||||
Net Increase (Decrease) in Net Assets from Capital Share Transactions | 40,712 | 2,321 | (10,937 | ) | ||||||||
Total Increase (Decrease) in Net Assets | 50,400 | 3,154 | (14,952 | ) | ||||||||
Net Assets: | ||||||||||||
Beginning of Year | 21,375 | 18,221 | 33,173 | |||||||||
End of Year | $ | 71,775 | $ | 21,375 | $ | 18,221 | ||||||
Undistributed Net Investment Income (Loss) | $ | — | $ | 14 | $ | 77 | ||||||
See Notes to Financial Statements.
46
STRONG BLUE CHIP FUND
| Year Ended | ||||||||||||||||||||||||
| Dec. 31, 2003 | Dec. 31, 2002 | Dec. 31, 2001 | Dec. 31, 2000(b) | Oct. 31, 2000 | Oct. 31, 1999 | |||||||||||||||||||
Selected Per-Share Data(a) | ||||||||||||||||||||||||
Net Asset Value, Beginning of Period | $ | 8.62 | $ | 12.36 | $ | 16.56 | $ | 20.99 | $ | 18.10 | $ | 13.24 | ||||||||||||
Income From Investment Operations: | ||||||||||||||||||||||||
Net Investment Income (Loss) | (0.09 | ) | (0.08 | ) | (0.06 | ) | (0.01 | ) | (0.09 | ) | (0.04 | ) | ||||||||||||
Net Realized and Unrealized Gains (Losses) on Investments | 2.59 | (3.66 | ) | (4.14 | ) | (3.42 | ) | 2.98 | 4.90 | |||||||||||||||
Total from Investment Operations | 2.50 | (3.74 | ) | (4.20 | ) | (3.43 | ) | 2.89 | 4.86 | |||||||||||||||
Less Distributions: | ||||||||||||||||||||||||
From Net Investment Income | — | — | — | — | — | (0.00 | )(c) | |||||||||||||||||
From Net Realized Gains | — | — | — | (1.00 | ) | — | — | |||||||||||||||||
Total Distributions | — | — | — | (1.00 | ) | — | (0.00 | )(c) | ||||||||||||||||
Net Asset Value, End of Period | $ | 11.12 | $ | 8.62 | $ | 12.36 | $ | 16.56 | $ | 20.99 | $ | 18.10 | ||||||||||||
Ratios and Supplemental Data | ||||||||||||||||||||||||
Total Return | +29.0 | % | –30.3 | % | –25.4 | % | –16.4 | % | +16.0 | % | +36.7 | % | ||||||||||||
Net Assets, End of Period (In Millions) | $ | 176 | $ | 203 | $ | 339 | $ | 499 | $ | 616 | $ | 485 | ||||||||||||
Ratio of Expenses to Average Net Assets before Expense Offsets | 1.7 | % | 1.6 | % | 1.4 | % | 1.1 | %* | 1.1 | % | 1.2 | % | ||||||||||||
Ratio of Expenses to Average Net Assets | 1.7 | % | 1.6 | % | 1.4 | % | 1.1 | %* | 1.1 | % | 1.2 | % | ||||||||||||
Ratio of Net Investment Income (Loss) to Average Net Assets | (0.8 | )% | (0.7 | )% | (0.4 | )% | (0.2 | )%* | (0.5 | )% | (0.3 | )% | ||||||||||||
Portfolio Turnover Rate | 268.5 | % | 214.0 | % | 203.9 | % | 21.2 | % | 67.9 | % | 75.4 | % | ||||||||||||
STRONG DISCOVERY FUND
| Year Ended | ||||||||||||||||||||
| Dec. 31, 2003 | Dec. 31, 2002 | Dec. 31, 2001 | Dec. 31, 2000 | Dec. 31, 1999 | ||||||||||||||||
Selected Per-Share Data(a) | ||||||||||||||||||||
Net Asset Value, Beginning of Period | $ | 14.42 | $ | 16.84 | $ | 16.39 | $ | 18.64 | $ | 17.95 | ||||||||||
Income From Investment Operations: | ||||||||||||||||||||
Net Investment Income (Loss) | (0.12 | ) | (0.06 | ) | (0.08 | ) | 0.06 | (0.17 | ) | |||||||||||
Net Realized and Unrealized Gains (Losses) on Investments | 5.64 | (1.91 | ) | 0.76 | 0.51 | 1.08 | ||||||||||||||
Total from Investment Operations | 5.52 | (1.97 | ) | 0.68 | 0.57 | 0.91 | ||||||||||||||
Less Distributions: | ||||||||||||||||||||
From Net Investment Income | (0.00 | )(c) | — | — | (0.04 | ) | — | |||||||||||||
From Net Realized Gains | (0.21 | ) | (0.45 | ) | (0.23 | ) | (2.78 | ) | (0.22 | ) | ||||||||||
Total Distributions | (0.21 | ) | (0.45 | ) | (0.23 | ) | (2.82 | ) | (0.22 | ) | ||||||||||
Net Asset Value, End of Period | $ | 19.73 | $ | 14.42 | $ | 16.84 | $ | 16.39 | $ | 18.64 | ||||||||||
Ratios and Supplemental Data | ||||||||||||||||||||
Total Return | +38.3 | % | –12.1 | % | +4.2 | % | +4.0 | % | +5.3 | % | ||||||||||
Net Assets, End of Period (In Millions) | $ | 167 | $ | 133 | $ | 158 | $ | 165 | $ | 187 | ||||||||||
Ratio of Expenses to Average Net Assets before Expense Offsets | 1.5 | % | 1.5 | % | 1.5 | % | 1.5 | % | 1.4 | % | ||||||||||
Ratio of Expenses to Average Net Assets | 1.4 | % | 1.5 | % | 1.5 | % | 1.5 | % | 1.4 | % | ||||||||||
Ratio of Net Investment Income (Loss) to Average Net Assets | (0.7 | )% | (0.4 | )% | (0.5 | )% | 0.3 | % | (0.7 | )% | ||||||||||
Portfolio Turnover Rate | 302.2 | % | 420.0 | % | 501.7 | % | 481.8 | % | 214.0 | % | ||||||||||
| * | Calculated on an annualized basis. |
| (a) | Information presented relates to a share of capital stock of the Fund outstanding for the entire period. |
| (b) | In 2000, the Fund changed its fiscal year-end from October to December. |
| (c) | Amount calculated is less than $0.005. |
See Notes to Financial Statements.
47
FINANCIAL HIGHLIGHTS (continued)
STRONG ENDEAVOR FUND
| Year Ended | ||||||||||||
Dec. 31, 2003 | Dec. 31, 2002 | Dec. 31, 2001(b) | ||||||||||
Selected Per-Share Data(a) | ||||||||||||
Net Asset Value, Beginning of Period | $ | 7.03 | $ | 9.94 | $ | 10.00 | ||||||
Income From Investment Operations: | ||||||||||||
Net Investment Income (Loss) | (0.10 | ) | (0.11 | ) | (0.06 | )(c) | ||||||
Net Realized and Unrealized Gains (Losses) on Investments | 2.39 | (2.80 | ) | 0.00 | (d) | |||||||
Total from Investment Operations | 2.29 | (2.91 | ) | (0.06 | ) | |||||||
Less Distributions: | ||||||||||||
From Net Investment Income | — | — | — | |||||||||
Total Distributions | — | — | — | |||||||||
Net Asset Value, End of Period | $ | 9.32 | $ | 7.03 | $ | 9.94 | ||||||
Ratios and Supplemental Data | ||||||||||||
Total Return | +32.6 | % | –29.3 | % | –0.6 | % | ||||||
Net Assets, End of Period (In Millions) | $ | 5 | $ | 4 | $ | 6 | ||||||
Ratio of Expenses to Average Net Assets before Expense Offsets | 2.8 | % | 2.7 | % | 3.1 | %* | ||||||
Ratio of Expenses to Average Net Assets | 1.9 | % | 1.9 | % | 2.2 | %* | ||||||
Ratio of Net Investment Income (Loss) to Average Net Assets | (1.1 | )% | (1.2 | )% | (1.2 | )%* | ||||||
Portfolio Turnover Rate | 243.0 | % | 416.8 | % | 391.8 | % | ||||||
STRONG LARGE CAP GROWTH FUND
| Year Ended | ||||||||||||||||||||||||
Dec. 31, 2003 | Dec. 31, 2002 | Dec. 31, 2001 | Dec. 31, 2000(e) | Oct. 31, 2000 | Oct. 31, 1999 | |||||||||||||||||||
Selected Per-Share Data(a) | ||||||||||||||||||||||||
Net Asset Value, Beginning of Period | $ | 16.51 | $ | 23.55 | $ | 34.77 | $ | 45.49 | $ | 41.52 | $ | 29.10 | ||||||||||||
Income From Investment Operations: | ||||||||||||||||||||||||
Net Investment Income (Loss) | (0.10 | ) | (0.08 | ) | (0.02 | ) | 0.01 | (0.16 | ) | (0.03 | ) | |||||||||||||
Net Realized and Unrealized Gains (Losses) on Investments | 4.53 | (6.96 | ) | (11.20 | ) | (4.81 | ) | 12.01 | 12.84 | |||||||||||||||
Total from Investment Operations | 4.43 | (7.04 | ) | (11.22 | ) | (4.80 | ) | 11.85 | 12.81 | |||||||||||||||
Less Distributions: | ||||||||||||||||||||||||
From Net Investment Income | — | — | (0.00 | )(d) | — | — | (0.01 | ) | ||||||||||||||||
From Net Realized Gains | — | — | — | (5.92 | ) | (7.88 | ) | (0.38 | ) | |||||||||||||||
Total Distributions | — | — | (0.00 | )(d) | (5.92 | ) | (7.88 | ) | (0.39 | ) | ||||||||||||||
Net Asset Value, End of Period | $ | 20.94 | $ | 16.51 | $ | 23.55 | $ | 34.77 | $ | 45.49 | $ | 41.52 | ||||||||||||
Ratios and Supplemental Data | ||||||||||||||||||||||||
Total Return | +26.8 | % | –29.9 | % | –32.3 | % | –10.3 | % | +28.1 | % | +44.3 | % | ||||||||||||
Net Assets, End of Period (In Millions) | $ | 644 | $ | 589 | $ | 976 | $ | 1,574 | $ | 1,769 | $ | 1,253 | ||||||||||||
Ratio of Expenses to Average Net Assets before Expense Offsets | 1.3 | % | 1.2 | % | 1.1 | % | 1.0 | %* | 1.0 | % | 1.0 | % | ||||||||||||
Ratio of Expenses to Average Net Assets | 1.3 | % | 1.2 | % | 1.1 | % | 1.0 | %* | 1.0 | % | 1.0 | % | ||||||||||||
Ratio of Net Investment Income (Loss) to Average Net Assets | (0.5 | )% | (0.4 | )% | (0.1 | )% | 0.1 | %* | (0.4 | )% | (0.1 | )% | ||||||||||||
Portfolio Turnover Rate | 253.4 | % | 443.2 | % | 468.7 | % | 68.6 | % | 455.0 | % | 402.3 | % | ||||||||||||
| * | Calculated on an annualized basis. |
| (a) | Information presented relates to a share of capital stock of the Fund outstanding for the entire period. |
| (b) | For the period from April 6, 2001 (commencement of class) to December 31, 2001. |
| (c) | Net investment loss per share represents net investment loss divided by the average shares outstanding throughout the period. |
| (d) | Amount calculated is less than $0.005. |
| (e) | In 2000, the Fund changed its fiscal year-end from October to December. |
See Notes to Financial Statements.
48
FINANCIAL HIGHLIGHTS (continued)
STRONG U.S. EMERGING GROWTH FUND
| Year Ended | ||||||||||||||||||||
Dec. 31, 2003 | Dec. 31, 2002 | Dec. 31, 2001 | Dec. 31, 2000 | Dec. 31, 1999 | ||||||||||||||||
Selected Per-Share Data(a) | ||||||||||||||||||||
Net Asset Value, Beginning of Period | $ | 10.02 | $ | 15.17 | $ | 19.17 | $ | 19.59 | $ | 10.00 | ||||||||||
Income From Investment Operations: | ||||||||||||||||||||
Net Investment Income (Loss) | (0.20 | ) | (0.24 | ) | (0.23 | ) | (0.19 | ) | (0.11 | ) | ||||||||||
Net Realized and Unrealized Gains (Losses) on Investments | 5.08 | (4.91 | ) | (3.77 | ) | 0.22 | 9.99 | |||||||||||||
Total from Investment Operations | 4.88 | (5.15 | ) | (4.00 | ) | 0.03 | 9.88 | |||||||||||||
Less Distributions: | ||||||||||||||||||||
From Net Realized Gains | — | — | — | (0.45 | ) | (0.29 | ) | |||||||||||||
Total Distributions | — | — | — | (0.45 | ) | (0.29 | ) | |||||||||||||
Net Asset Value, End of Period | $ | 14.90 | $ | 10.02 | $ | 15.17 | $ | 19.17 | $ | 19.59 | ||||||||||
Ratios and Supplemental Data | ||||||||||||||||||||
Total Return | +48.7 | % | –34.0 | % | –20.9 | % | +0.3 | % | +98.9 | % | ||||||||||
Net Assets, End of Period (In Millions) | $ | 100 | $ | 58 | $ | 86 | $ | 112 | $ | 36 | ||||||||||
Ratio of Expenses to Average Net Assets before Expense Offsets | 1.8 | % | 1.9 | % | 1.6 | % | 1.4 | % | 1.9 | % | ||||||||||
Ratio of Expenses to Average Net Assets | 1.7 | % | 1.9 | % | 1.6 | % | 1.4 | % | 1.8 | % | ||||||||||
Ratio of Net Investment Income (Loss) to Average Net Assets | (1.6 | )% | (1.8 | )% | (1.5 | )% | (1.2 | )% | (1.5 | )% | ||||||||||
Portfolio Turnover Rate | 100.3 | % | 171.5 | % | 168.2 | % | 186.8 | % | 281.1 | % | ||||||||||
STRONG ENTERPRISE FUND — INVESTOR CLASS
| Year Ended | ||||||||||||||||||||
Dec. 31, 2003 | Dec. 31, 2002 | Dec. 31, 2001 | Dec. 31, 2000 | Dec. 31, 1999 | ||||||||||||||||
Selected Per-Share Data(a) | ||||||||||||||||||||
Net Asset Value, Beginning of Period | $ | 15.90 | $ | 22.14 | $ | 28.37 | $ | 41.24 | $ | 14.74 | ||||||||||
Income From Investment Operations: | ||||||||||||||||||||
Net Investment Income (Loss) | (0.30 | ) | (0.28 | )(b) | (0.31 | ) | (0.28 | ) | (0.09 | ) | ||||||||||
Net Realized and Unrealized Gains (Losses) on Investments | 6.18 | (5.96 | ) | (5.92 | ) | (12.04 | ) | 27.43 | ||||||||||||
Total from Investment Operations | 5.88 | (6.24 | ) | (6.23 | ) | (12.32 | ) | 27.34 | ||||||||||||
Less Distributions: | ||||||||||||||||||||
From Net Realized Gains | — | — | — | (0.55 | ) | (0.84 | ) | |||||||||||||
Total Distributions | — | — | — | (0.55 | ) | (0.84 | ) | |||||||||||||
Net Asset Value, End of Period | $ | 21.78 | $ | 15.90 | $ | 22.14 | $ | 28.37 | $ | 41.24 | ||||||||||
Ratios and Supplemental Data | ||||||||||||||||||||
Total Return | +37.0 | % | –28.2 | % | –22.0 | % | –29.8 | % | +187.8 | % | ||||||||||
Net Assets, End of Period (In Millions) | $ | 249 | $ | 224 | $ | 372 | $ | 575 | $ | 571 | ||||||||||
Ratio of Expenses to Average Net Assets before Expense Offsets | 2.0 | % | 2.0 | % | 1.8 | % | 1.4 | % | 1.4 | % | ||||||||||
Ratio of Expenses to Average Net Assets | 1.8 | % | 2.0 | % | 1.8 | % | 1.4 | % | 1.4 | % | ||||||||||
Ratio of Net Investment Income (Loss) to Average Net Assets | (1.4 | )% | (1.5 | )% | (1.2 | )% | (0.7 | )% | (1.0 | )% | ||||||||||
Portfolio Turnover Rate(c) | 261.2 | % | 376.8 | % | 629.8 | % | 473.7 | % | 178.1 | % | ||||||||||
| (a) | Information presented relates to a share of capital stock of the Fund outstanding for the entire period. |
| (b) | Net investment income (loss) per share represents net investment income (loss) divided by the average shares outstanding throughout the period. |
| (c) | Calculated on the basis of the Fund as a whole without distinguishing between classes of shares issued. |
See Notes to Financial Statements.
49
FINANCIAL HIGHLIGHTS (continued)
STRONG ENTERPRISE FUND — INSTITUTIONAL CLASS
Period Ended Dec. 31, 2003(b) | ||||
Selected Per-Share Data(a) | ||||
Net Asset Value, Beginning of Period | $ | 18.34 | ||
Income From Investment Operations: | ||||
Net Investment Income (Loss) | (0.06 | ) | ||
Net Realized and Unrealized Gains (Losses) on Investments | 3.59 | |||
Total from Investment Operations | 3.53 | |||
Less Distributions: | ||||
From Net Investment Income | — | |||
Total Distributions | — | |||
Net Asset Value, End of Period | $ | 21.87 | ||
Ratios and Supplemental Data | ||||
Total Return | +19.3 | % | ||
Net Assets, End of Period (In Millions) | $ | 2 | ||
Ratio of Expenses to Average Net Assets before Expense Offsets | 1.2 | %* | ||
Ratio of Expenses to Average Net Assets | 1.0 | %* | ||
Ratio of Net Investment Income (Loss) to Average Net Assets | (0.7 | )%* | ||
Portfolio Turnover Rate(c) | 261.2 | % | ||
STRONG ENTERPRISE FUND — ADVISOR CLASS
| Year Ended | ||||||||||||||||
Dec. 31, 2003 | Dec. 31, 2002 | Dec. 31, 2001 | Dec. 31, 2000(d) | |||||||||||||
Selected Per-Share Data(a) | ||||||||||||||||
Net Asset Value, Beginning of Period | $ | 15.86 | $ | 22.04 | $ | 28.31 | $ | 51.32 | ||||||||
Income From Investment Operations: | ||||||||||||||||
Net Investment Income (Loss) | (0.23 | ) | (0.24 | )(e) | (0.21 | ) | (0.03 | ) | ||||||||
Net Realized and Unrealized Gains (Losses) on Investments | 6.16 | (5.94 | ) | (6.06 | ) | (22.43 | ) | |||||||||
Total from Investment Operations | 5.93 | (6.18 | ) | (6.27 | ) | (22.46 | ) | |||||||||
Less Distributions: | ||||||||||||||||
From Net Realized Gains | — | — | — | (0.55 | ) | |||||||||||
Total Distributions | — | — | — | (0.55 | ) | |||||||||||
Net Asset Value, End of Period | $ | 21.79 | $ | 15.86 | $ | 22.04 | $ | 28.31 | ||||||||
Ratios and Supplemental Data | ||||||||||||||||
Total Return | +37.4 | % | –28.0 | % | –22.2 | % | –43.7 | % | ||||||||
Net Assets, End of Period (In Millions) | $ | 2 | $ | 1 | $ | 1 | $ | 0 | (f) | |||||||
Ratio of Expenses to Average Net Assets before Expense Offsets | 1.5 | % | 1.8 | % | 2.1 | % | 2.0 | %* | ||||||||
Ratio of Expenses to Average Net Assets | 1.5 | % | 1.8 | % | 2.1 | % | 1.9 | %* | ||||||||
Ratio of Net Investment Income (Loss) to Average Net Assets | (1.1 | )% | (1.3 | )% | (1.6 | )% | (1.2 | )%* | ||||||||
Portfolio Turnover Rate(c) | 261.2 | % | 376.8 | % | 629.8 | % | 473.7 | % | ||||||||
| * | Calculated on an annualized basis. |
| (a) | Information presented relates to a share of capital stock of the Fund outstanding for the entire period. |
| (b) | For the period from June 30, 2003 (commencement of class) to December 31, 2003. |
| (c) | Calculated on the basis of the Fund as a whole without distinguishing between classes of shares issued. |
| (d) | For the period from February 24, 2000 (commencement of class) to December 31, 2000. |
| (e) | Net investment income (loss) per share represents net investment income (loss) divided by the average shares outstanding throughout the period. |
| (f) | Amount is less than $500,000. |
See Notes to Financial Statements.
50
FINANCIAL HIGHLIGHTS (continued)
STRONG ENTERPRISE FUND — CLASS K
| Year Ended | ||||||||
Dec. 31, 2003 | Dec. 31, 2002(b) | |||||||
Selected Per-Share Data(a) | ||||||||
Net Asset Value, Beginning of Period | $ | 15.94 | $ | 16.32 | ||||
Income From Investment Operations: | ||||||||
Net Investment Income (Loss) | (0.10 | ) | (0.04 | )(c) | ||||
Net Realized and Unrealized Gains (Losses) on Investments | 6.14 | (0.34 | ) | |||||
Total from Investment Operations | 6.04 | (0.38 | ) | |||||
Less Distributions: | ||||||||
From Net Investment Income | — | — | ||||||
Total Distributions | — | — | ||||||
Net Asset Value, End of Period | $ | 21.98 | $ | 15.94 | ||||
Ratios and Supplemental Data | ||||||||
Total Return | +37.9 | % | –2.3 | % | ||||
Net Assets, End of Period (In Millions) | $ | 34 | $ | 4 | ||||
Ratio of Expenses to Average Net Assets before Expense Offsets | 1.3 | % | 1.3 | %* | ||||
Ratio of Expenses to Average Net Assets | 1.2 | % | 1.1 | %* | ||||
Ratio of Net Investment Income (Loss) to Average Net Assets | (0.8 | )% | (0.6 | )%* | ||||
Portfolio Turnover Rate(d) | 261.2 | % | 376.8 | % | ||||
STRONG GROWTH 20 FUND — INVESTOR CLASS
| Year Ended | ||||||||||||||||||||
Dec. 31, 2003 | Dec. 31, 2002 | Dec. 31, 2001 | Dec. 31, 2000 | Dec. 31, 1999 | ||||||||||||||||
Selected Per-Share Data(a) | ||||||||||||||||||||
Net Asset Value, Beginning of Period | $ | 10.19 | $ | 14.74 | $ | 25.13 | $ | 30.63 | $ | 15.44 | ||||||||||
Income From Investment Operations: | ||||||||||||||||||||
Net Investment Income (Loss) | (0.17 | )(c) | (0.21 | ) | (0.15 | ) | (0.10 | ) | (0.08 | ) | ||||||||||
Net Realized and Unrealized Gains (Losses) on Investments | 2.94 | (4.34 | ) | (10.24 | ) | (3.05 | ) | 16.60 | ||||||||||||
Total from Investment Operations | 2.77 | (4.55 | ) | (10.39 | ) | (3.15 | ) | 16.52 | ||||||||||||
Less Distributions: | ||||||||||||||||||||
From Net Realized Gains | — | — | — | (2.35 | ) | (1.33 | ) | |||||||||||||
Total Distributions | — | — | — | (2.35 | ) | (1.33 | ) | |||||||||||||
Net Asset Value, End of Period | $ | 12.96 | $ | 10.19 | $ | 14.74 | $ | 25.13 | $ | 30.63 | ||||||||||
Ratios and Supplemental Data | ||||||||||||||||||||
Total Return | +27.2 | % | –30.9 | % | –41.4 | % | –10.3 | % | +109.5 | % | ||||||||||
Net Assets, End of Period (In Millions) | $ | 253 | $ | 184 | $ | 361 | $ | 766 | $ | 466 | ||||||||||
Ratio of Expenses to Average Net Assets before Expense Offsets | 1.8 | % | 1.9 | % | 1.5 | % | 1.3 | % | 1.4 | % | ||||||||||
Ratio of Expenses to Average Net Assets | 1.7 | % | 1.9 | % | 1.5 | % | 1.3 | % | 1.4 | % | ||||||||||
Ratio of Net Investment Income (Loss) to Average Net Assets | (1.5 | )% | (1.5 | )% | (0.8 | )% | (0.4 | )% | (0.6 | )% | ||||||||||
Portfolio Turnover Rate(d) | 318.1 | % | 460.8 | % | 658.7 | % | 521.0 | % | 432.3 | % | ||||||||||
| * | Calculated on an annualized basis. |
| (a) | Information presented relates to a share of capital stock of the Fund outstanding for the entire period. |
| (b) | For the period from August 30, 2002 (commencement of class) to December 31, 2002. |
| (c) | Net investment income (loss) per share represents net investment income (loss) divided by the average shares outstanding throughout the period. |
| (d) | Calculated on the basis of the Fund as a whole without distinguishing between classes of shares issued. |
See Notes to Financial Statements.
51
FINANCIAL HIGHLIGHTS (continued)
STRONG GROWTH 20 FUND — ADVISOR CLASS
| Year Ended | ||||||||||||||||
| Dec. 31, 2003 | Dec. 31, 2002 | Dec. 31, 2001 | Dec. 31, 2000(b) | |||||||||||||
Selected Per-Share Data(a) | ||||||||||||||||
Net Asset Value, Beginning of Period | $ | 10.19 | $ | 14.69 | $ | 25.06 | $ | 36.61 | ||||||||
Income From Investment Operations: | ||||||||||||||||
Net Investment Income (Loss) | (0.15 | )(d) | (0.15 | ) | (0.12 | ) | (0.02 | ) | ||||||||
Net Realized and Unrealized Gains (Losses) on Investments | 2.95 | (4.35 | ) | (10.25 | ) | (9.18 | ) | |||||||||
Total from Investment Operations | 2.80 | (4.50 | ) | (10.37 | ) | (9.20 | ) | |||||||||
Less Distributions: | ||||||||||||||||
From Net Realized Gains | — | — | — | (2.35 | ) | |||||||||||
Total Distributions | — | — | — | (2.35 | ) | |||||||||||
Net Asset Value, End of Period | $ | 12.99 | $ | 10.19 | $ | 14.69 | $ | 25.06 | ||||||||
Ratios and Supplemental Data | ||||||||||||||||
Total Return | +27.5 | % | –30.6 | % | –41.4 | % | –25.2 | % | ||||||||
Net Assets, End of Period (In Millions) | $ | 6 | $ | 7 | $ | 10 | $ | 5 | ||||||||
Ratio of Expenses to Average Net Assets before Expense Offsets | 1.6 | % | 1.6 | % | 1.6 | % | 2.0 | %* | ||||||||
Ratio of Expenses to Average Net Assets | 1.5 | % | 1.6 | % | 1.6 | % | 1.9 | %* | ||||||||
Ratio of Net Investment Income (Loss) to Average Net Assets | (1.3 | )% | (1.2 | )% | (0.9 | )% | (1.0 | )%* | ||||||||
Portfolio Turnover Rate(c) | 318.1 | % | 460.8 | % | 658.7 | % | 521.0 | % | ||||||||
STRONG GROWTH FUND — INVESTOR CLASS
| Year Ended | ||||||||||||||||||||
| Dec. 31, 2003 | Dec. 31, 2002 | Dec. 31, 2001 | Dec. 31, 2000 | Dec. 31, 1999 | ||||||||||||||||
Selected Per-Share Data(a) | ||||||||||||||||||||
Net Asset Value, Beginning of Period | $ | 13.21 | $ | 17.68 | $ | 27.05 | $ | 35.66 | $ | 23.25 | ||||||||||
Income From Investment Operations: | ||||||||||||||||||||
Net Investment Income (Loss) | (0.16 | )(d) | (0.18 | )(d) | (0.15 | ) | (0.17 | ) | (0.18 | ) | ||||||||||
Net Realized and Unrealized Gains (Losses) on Investments | 4.14 | (4.29 | ) | (9.15 | ) | (3.21 | ) | 17.08 | ||||||||||||
Total from Investment Operations | 3.98 | (4.47 | ) | (9.30 | ) | (3.38 | ) | 16.90 | ||||||||||||
Less Distributions: | ||||||||||||||||||||
From Net Realized Gains | — | — | (0.07 | ) | (5.23 | ) | (4.49 | ) | ||||||||||||
Total Distributions | — | — | (0.07 | ) | (5.23 | ) | (4.49 | ) | ||||||||||||
Net Asset Value, End of Period | $ | 17.19 | $ | 13.21 | $ | 17.68 | $ | 27.05 | $ | 35.66 | ||||||||||
Ratios and Supplemental Data | ||||||||||||||||||||
Total Return | +30.1 | % | –25.3 | % | –34.4 | % | –9.2 | % | +75.1 | % | ||||||||||
Net Assets, End of Period (In Millions) | $ | 1,366 | $ | 1,256 | $ | 2,022 | $ | 3,411 | $ | 3,354 | ||||||||||
Ratio of Expenses to Average Net Assets before Expense Offsets | 1.5 | % | 1.6 | % | 1.4 | % | 1.2 | % | 1.2 | % | ||||||||||
Ratio of Expenses to Average Net Assets | 1.5 | % | 1.6 | % | 1.4 | % | 1.2 | % | 1.2 | % | ||||||||||
Ratio of Net Investment Income (Loss) to Average Net Assets | (1.1 | )% | (1.2 | )% | (0.7 | )% | (0.6 | )% | (0.8 | )% | ||||||||||
Portfolio Turnover Rate(c) | 138.8 | % | 248.5 | % | 399.8 | % | 366.3 | % | 324.0 | % | ||||||||||
| * | Calculated on an annualized basis. |
| (a) | Information presented relates to a share of capital stock of the Fund outstanding for the entire period. |
| (b) | For the period from February 24, 2000 (commencement of class) to December 31, 2000. |
| (c) | Calculated on the basis of the Fund as a whole without distinguishing between classes of shares issued. |
| (d) | Net investment income (loss) per share represents net investment income (loss) divided by average shares outstanding throughout the year. |
See Notes to Financial Statements.
52
FINANCIAL HIGHLIGHTS (continued)
STRONG GROWTH FUND — INSTITUTIONAL CLASS
| Year Ended | ||||||||||||||||
| Dec. 31, 2003 | Dec. 31, 2002 | Dec. 31, 2001 | Dec. 31, 2000(b) | |||||||||||||
Selected Per-Share Data(a) | ||||||||||||||||
Net Asset Value, Beginning of Period | $ | 13.48 | $ | 17.91 | $ | 27.17 | $ | 43.74 | ||||||||
Income From Investment Operations: | ||||||||||||||||
Net Investment Income (Loss) | (0.07 | )(c) | (0.08 | )(c) | (0.02 | ) | (0.01 | ) | ||||||||
Net Realized and Unrealized Gains (Losses) on Investments | 4.24 | (4.35 | ) | (9.17 | ) | (11.33 | ) | |||||||||
Total from Investment Operations | 4.17 | (4.43 | ) | (9.19 | ) | (11.34 | ) | |||||||||
Less Distributions: | ||||||||||||||||
From Net Realized Gains | — | — | (0.07 | ) | (5.23 | ) | ||||||||||
Total Distributions | — | — | (0.07 | ) | (5.23 | ) | ||||||||||
Net Asset Value, End of Period | $ | 17.65 | $ | 13.48 | $ | 17.91 | $ | 27.17 | ||||||||
Ratios and Supplemental Data | ||||||||||||||||
Total Return | +30.9 | % | –24.7 | % | –33.8 | % | –25.7 | % | ||||||||
Net Assets, End of Period (In Millions) | $ | 311 | $ | 195 | $ | 73 | $ | 18 | ||||||||
Ratio of Expenses to Average Net Assets before Expense Offsets | 0.9 | % | 0.9 | % | 0.9 | % | 0.8 | %* | ||||||||
Ratio of Expenses to Average Net Assets | 0.9 | % | 0.9 | % | 0.9 | % | 0.8 | %* | ||||||||
Ratio of Net Investment Income (Loss) to Average Net Assets | (0.5 | )% | (0.5 | )% | (0.3 | )% | (0.1 | )%* | ||||||||
Portfolio Turnover Rate(d) | 138.8 | % | 248.5 | % | 399.8 | % | 366.3 | % | ||||||||
STRONG GROWTH FUND — ADVISOR CLASS
| Year Ended | ||||||||||||||||
| Dec. 31, 2003 | Dec. 31, 2002 | Dec. 31, 2001 | Dec. 31, 2000(b) | |||||||||||||
Selected Per-Share Data(a) | ||||||||||||||||
Net Asset Value, Beginning of Period | $ | 13.14 | $ | 17.58 | $ | 26.96 | $ | 43.74 | ||||||||
Income From Investment Operations: | ||||||||||||||||
Net Investment Income (Loss) | (0.16 | )(c) | (0.17 | )(c) | (0.15 | ) | (0.02 | ) | ||||||||
Net Realized and Unrealized Gains (Losses) on Investments | 4.11 | (4.27 | ) | (9.16 | ) | (11.53 | ) | |||||||||
Total from Investment Operations | 3.95 | (4.44 | ) | (9.31 | ) | (11.55 | ) | |||||||||
Less Distributions: | ||||||||||||||||
From Net Realized Gains | — | — | (0.07 | ) | (5.23 | ) | ||||||||||
Total Distributions | — | — | (0.07 | ) | (5.23 | ) | ||||||||||
Net Asset Value, End of Period | $ | 17.09 | $ | 13.14 | $ | 17.58 | $ | 26.96 | ||||||||
Ratios and Supplemental Data | ||||||||||||||||
Total Return | +30.1 | % | –25.3 | % | –34.5 | % | –26.2 | % | ||||||||
Net Assets, End of Period (In Millions) | $ | 9 | $ | 10 | $ | 14 | $ | 4 | ||||||||
Ratio of Expenses to Average Net Assets before Expense Offsets | 1.6 | % | 1.6 | % | 1.6 | % | 2.0 | %* | ||||||||
Ratio of Expenses to Average Net Assets | 1.6 | % | 1.6 | % | 1.6 | % | 1.9 | %* | ||||||||
Ratio of Net Investment Income (Loss) to Average Net Assets | (1.1 | )% | (1.2 | )% | (1.0 | )% | (0.9 | )%* | ||||||||
Portfolio Turnover Rate(d) | 138.8 | % | 248.5 | % | 399.8 | % | 366.3 | % | ||||||||
| * | Calculated on an annualized basis. |
| (a) | Information presented relates to a share of capital stock of the Fund outstanding for the entire period. |
| (b) | For the period from February 24, 2000 (commencement of class) to December 31, 2000. |
| (c) | Net investment income (loss) per share represents net investment income (loss) divided by average shares outstanding throughout the year. |
| (d) | Calculated on the basis of the Fund as a whole without distinguishing between the classes of shares issued. |
See Notes to Financial Statements.
53
FINANCIAL HIGHLIGHTS (continued)
STRONG GROWTH FUND — CLASS C
| Year Ended | ||||||||
| Dec. 31, 2003 | Dec. 31, 2002(b) | |||||||
Selected Per-Share Data(a) | ||||||||
Net Asset Value, Beginning of Period | $ | 13.21 | $ | 13.44 | ||||
Income From Investment Operations: | ||||||||
Net Investment Income (Loss) | (0.32 | )(d) | 0.00 | (c)(d) | ||||
Net Realized and Unrealized Gains (Losses) on Investments | 4.14 | (0.23 | ) | |||||
Total from Investment Operations | 3.82 | (0.23 | ) | |||||
Less Distributions: | ||||||||
From Net Investment Income | — | — | ||||||
Total Distributions | — | — | ||||||
Net Asset Value, End of Period | $ | 17.03 | $ | 13.21 | ||||
Ratios and Supplemental Data | ||||||||
Total Return | +28.9 | % | –1.7 | % | ||||
Net Assets, End of Period (In Millions) | $ | 1 | $ | 0 | (e) | |||
Ratio of Expenses to Average Net Assets before Expense Offsets | 4.3 | % | 2.3 | %* | ||||
Ratio of Expenses to Average Net Assets | 2.5 | % | 2.3 | %* | ||||
Ratio of Net Investment Income (Loss) to Average Net Assets | (2.0 | )% | 0.0 | %(c) | ||||
Portfolio Turnover Rate(f) | 138.8 | % | 248.5 | % | ||||
STRONG GROWTH FUND — CLASS K
| Year Ended | ||||||||
| Dec. 31, 2003 | Dec. 31, 2002(g) | |||||||
Selected Per-Share Data(a) | ||||||||
Net Asset Value, Beginning of Period | $ | 13.29 | $ | 13.53 | ||||
Income From Investment Operations: | ||||||||
Net Investment Income (Loss) | (0.08 | )(d) | (0.01 | )(d) | ||||
Net Realized and Unrealized Gains (Losses) on Investments | 4.17 | (0.23 | ) | |||||
Total from Investment Operations | 4.09 | (0.24 | ) | |||||
Less Distributions: | ||||||||
From Net Investment Income | — | — | ||||||
Total Distributions | — | — | ||||||
Net Asset Value, End of Period | $ | 17.38 | $ | 13.29 | ||||
Ratios and Supplemental Data | ||||||||
Total Return | +30.8 | % | –1.8 | % | ||||
Net Assets, End of Period (In Millions) | $ | 56 | $ | 13 | ||||
Ratio of Expenses to Average Net Assets before Expense Offsets | 1.2 | % | 1.3 | %* | ||||
Ratio of Expenses to Average Net Assets | 1.0 | % | 1.0 | %* | ||||
Ratio of Net Investment Income (Loss) to Average Net Assets | (0.5 | )% | (0.7 | )%* | ||||
Portfolio Turnover Rate(f) | 138.8 | % | 248.5 | % | ||||
| * | Calculated on an annualized basis. |
| (a) | Information presented relates to a share of capital stock of the Fund outstanding for the entire period. |
| (b) | For the period from December 26, 2002 (commencement of class) to December 31, 2002. |
| (c) | Amount calculated is less than $0.005 or 0.05%. |
| (d) | Net investment income (loss) per share represents net investment income (loss) divided by average shares outstanding throughout the year. |
| (e) | Amount is less than $500,000. |
| (f) | Calculated on the basis of the Fund as a whole without distinguishing between the classes of shares issued. |
| (g) | For the period from August 30, 2002 (commencement of class) to December 31, 2002. |
See Notes to Financial Statements.
54
FINANCIAL HIGHLIGHTS (continued)
STRONG LARGE COMPANY GROWTH FUND — INVESTOR CLASS
| Year Ended | ||||||||||||||||||||||||
| Dec. 31, 2003 | Dec. 31, 2002(b) | Sept. 30, 2002(e) | Sept. 30, 2001 | Sept. 30, 2000 | Sept. 30, 1999 | |||||||||||||||||||
Selected Per-Share Data(a) | ||||||||||||||||||||||||
Net Asset Value, Beginning of Period | $ | 10.66 | $ | 10.25 | $ | 12.17 | $ | 19.15 | $ | 13.12 | $ | 9.80 | ||||||||||||
Income From Investment Operations: | ||||||||||||||||||||||||
Net Investment Income | (0.04 | ) | 0.00 | (c) | 0.31 | 0.32 | 0.29 | 0.18 | ||||||||||||||||
Net Realized and Unrealized Gains (Losses) on Investments | 2.75 | (f) | 0.45 | (1.93 | ) | (5.09 | ) | 6.26 | 3.33 | |||||||||||||||
Total from Investment Operations | 2.71 | 0.45 | (1.62 | ) | (4.77 | ) | 6.55 | 3.51 | ||||||||||||||||
Less Distributions: | ||||||||||||||||||||||||
From Net Investment Income | (0.01 | ) | (0.04 | ) | (0.27 | ) | (0.32 | ) | (0.27 | ) | (0.19 | ) | ||||||||||||
From Net Realized Gains | — | — | (0.03 | ) | (1.89 | ) | (0.25 | ) | — | |||||||||||||||
Total Distributions | (0.01 | ) | (0.04 | ) | (0.30 | ) | (2.21 | ) | (0.52 | ) | (0.19 | ) | ||||||||||||
Net Asset Value, End of Period | $ | 13.36 | $ | 10.66 | $ | 10.25 | $ | 12.17 | $ | 19.15 | $ | 13.12 | ||||||||||||
Ratios and Supplemental Data | ||||||||||||||||||||||||
Total Return | +25.4 | % | +4.4 | % | –13.7 | % | –26.2 | % | +50.7 | % | +36.0 | % | ||||||||||||
Net Assets, End of Period (In Millions) | $ | 71 | $ | 21 | $ | 18 | $ | 33 | $ | 37 | $ | 9 | ||||||||||||
Ratio of Expenses to Average Net Assets before Expense Offsets | 1.8 | % | 1.9 | %* | 1.7 | % | 1.6 | % | 1.6 | % | 3.1 | % | ||||||||||||
Ratio of Expenses to Average Net Assets | 1.5 | % | 1.3 | %* | 1.5 | % | 1.5 | % | 1.5 | % | 1.5 | % | ||||||||||||
Ratio of Net Investment Income (Loss) to Average Net Assets | (0.5 | )% | 0.2 | %* | 2.3 | % | 2.2 | % | 1.8 | % | 1.5 | % | ||||||||||||
Portfolio Turnover Rate(d) | 229.0 | % | 71.8 | % | 311.3 | % | 285.3 | % | 180.8 | % | 120.2 | % | ||||||||||||
STRONG LARGE COMPANY GROWTH FUND — CLASS K
| Period Ended | ||||
| Dec. 31, 2003(g) | ||||
Selected Per-Share Data(a) | ||||
Net Asset Value, Beginning of Period | $ | 11.96 | ||
Income From Investment Operations: | ||||
Net Investment Income | (0.00 | )(c) | ||
Net Realized and Unrealized Gains (Losses) on Investments | 1.44 | (h) | ||
Total from Investment Operations | 1.44 | |||
Less Distributions: | ||||
From Net Investment Income | — | |||
Total Distributions | — | |||
Net Asset Value, End of Period | $ | 13.40 | ||
Ratios and Supplemental Data | ||||
Total Return | +12.0 | % | ||
Net Assets, End of Period (In Millions) | $ | 1 | ||
Ratio of Expenses to Average Net Assets before Expense Offsets | 2.1 | %* | ||
Ratio of Expenses to Average Net Assets | 0.9 | %* | ||
Ratio of Net Investment Income (Loss) to Average Net Assets | (0.0 | )%*(c) | ||
Portfolio Turnover Rate(d) | 229.0 | % | ||
| * | Calculated on an annualized basis. |
| (a) | Information presented relates to a share of capital stock of the Fund outstanding for the entire period. |
| (b) | In 2002, the Fund changed its fiscal year-end from September to December. |
| (c) | Amount calculated is less than $0.005 or 0.05%. |
| (d) | Calculated on the basis of the Fund as a whole without distinguishing between the classes of shares issued. |
| (e) | Effective September 5, 2002, Strong Capital Management, Inc. assumed the investment advisory responsibilities from Rockhaven Asset Management, LLC. |
| (f) | Includes $0.01 in redemption fees (Note 2Q). |
| (g) | For the period from June 30, 2003 (commencement of class) to December 31, 2003. |
| (h) | Includes $0.02 in redemption fees (Note 2Q). |
See Notes to Financial Statements.
55
December 31, 2003
| 1. | Organization |
The accompanying financial statements represent the following Strong Growth Funds (the “Funds”), each with its own investment objectives and policies:
| • | Strong Blue Chip Fund(1) (a series fund of Strong Conservative Equity Funds, Inc.) |
| • | Strong Discovery Fund(1) (a series fund of Strong Discovery Fund, Inc.) |
| • | Strong Endeavor Fund(1) (a series fund of Strong Opportunity Fund, Inc.) |
| • | Strong Large Cap Growth Fund(1) (a series fund of Strong Large Cap Growth Fund, Inc.) |
| • | Strong U.S. Emerging Growth Fund(1) (a series fund of Strong Equity Funds, Inc.) |
| • | Strong Enterprise Fund(1) (a series fund of Strong Equity Funds, Inc.) |
| • | Strong Growth 20 Fund(2) (a series fund of Strong Equity Funds, Inc.) |
| • | Strong Growth Fund(1) (a series fund of Strong Equity Funds, Inc.) |
| • | Strong Large Company Growth Fund(1) (a series fund of Strong Equity Funds, Inc.) |
(1) Diversified Fund.
(2) Non-diversified Fund.
Each Fund is an open-end management investment company registered under the Investment Company Act of 1940, as amended (“1940 Act”).
Strong Blue Chip Fund, Strong Discovery Fund, Strong Endeavor Fund, Strong Large Cap Growth Fund and Strong U.S. Emerging Growth Fund offer Investor Class shares. Strong Enterprise Fund offers Investor Class, Institutional Class, Advisor Class and Class K shares. Strong Growth 20 Fund offers Investor Class and Advisor Class shares. Strong Growth Fund offers Investor Class, Institutional Class, Advisor Class, Class C and Class K shares. Strong Large Company Growth Fund offers Investor Class and Class K shares. All classes of shares differ principally in their respective administration, transfer agent and distribution expenses and sales charges, if any. All classes of shares have identical rights to earnings, assets and voting privileges, except for class-specific expenses and exclusive rights to vote on matters affecting only individual classes.
Investor Class shares are available to the general public, Institutional Class shares are available to investors that meet certain higher initial investment minimums, Advisor Class shares and Class C shares are available only through financial professionals and Class K shares are primarily available through retirement plans.
Effective June 30, 2003 (public launch July 1, 2003), Strong Enterprise Fund issued an additional class of shares: Institutional Class shares.
Effective June 30, 2003 (public launch July 1, 2003), Strong Large Company Growth Fund issued an additional class of shares: Class K shares.
| 2. | Significant Accounting Policies |
The following is a summary of significant accounting policies followed by the Funds in the preparation of their financial statements.
| (A) | Security Valuation — Securities of the Funds traded on a national securities exchange are valued each business day at the last sales price. Securities traded on the NASDAQ Stock Market are valued each business day using the NASDAQ Official Closing Price (“NOCP”). Exchange-traded securities for which there were no transactions and NASDAQ-traded securities for which there is no NOCP are valued at the mean of the bid and ask prices. Securities for which market quotations are not readily available are fair valued as determined in good faith under the general supervision of the Board of Directors. Some of the Fund’s portfolio securities may be listed on foreign exchanges that close before the U.S. markets and that trade on days when the U.S. markets are closed. As a result, management, under the supervision of the Strong Funds’ Board of Directors, will consider significant events affecting foreign securities and the movements of the domestic markets that occur after the close of the foreign markets and before the time a Fund’s net asset value (“NAV”) is calculated in valuing such foreign securities. Securities that are purchased within 60 days of their stated maturity are valued at amortized cost, which approximates fair value. |
The Funds may own certain securities that are restricted as to resale. Restricted securities include Section 4(2) commercial paper, securities issued in a private placement, or securities eligible for resale pursuant to Rule 144A under the Securities Act of 1933. Restricted securities may be determined to be liquid or illiquid. Securities are deemed illiquid based upon guidelines established by the Funds’ Board of Directors. Illiquid securities are valued after giving due consideration to pertinent factors, such as recent private sales, market conditions and the issuer’s financial performance. The Funds held no restricted and illiquid securities at December 31, 2003.
56
| (B) | Federal Income and Excise Taxes and Distributions to Shareholders — The Funds intend to comply with the requirements of the Internal Revenue Code of 1986, as amended, applicable to regulated investment companies and to distribute substantially all of their taxable income to their shareholders in a manner which results in no tax cost to the Funds. Therefore, no federal income or excise tax provision is recorded. |
Undistributed income or net realized gains for financial statement purposes may differ from what is determined for federal income tax purposes due to differences in the timing, recognition and characterization of income, and expense and capital gain items for financial statement and tax purposes. Where appropriate, reclassifications between net asset accounts are made for such differences that are permanent in nature. The Funds may utilize earnings and profits distributed to shareholders on redemption of shares as part of the dividends paid deduction.
Strong Discovery Fund, Strong Endeavor Fund, Strong Large Cap Growth Fund, Strong U.S. Emerging Growth Fund, Strong Enterprise Fund, Strong Growth 20 Fund, Strong Growth Fund and Strong Large Company Growth Fund generally pay dividends from net investment income and distribute net realized capital gains, if any, at least annually. Strong Blue Chip Fund generally pays dividends from net investment income quarterly and distributes net realized capital gains, if any, at least annually.
| (C) | Realized Gains and Losses on Investment Transactions — Investment security transactions are recorded as of the trade date. Gains or losses realized on investment transactions are determined by comparing the identified cost of the security lot sold with the net sales proceeds. |
| (D) | Certain Investment Risks — The Funds may utilize derivative instruments including options, futures and other instruments with similar characteristics to the extent that they are consistent with the Funds’ investment objectives and limitations. The Funds intend to use such derivative instruments primarily to hedge or protect from adverse movements in securities’ prices, foreign currencies or interest rates. The use of these instruments involves certain risks, including the possibility that the value of the underlying assets or indices fluctuate, the derivative becomes illiquid, imperfect correlation exists between the value of the derivative and the underlying assets or indices, or that the counterparty fails to perform its obligations when due. |
Investments in foreign-denominated assets or forward currency contracts may involve greater risks than domestic investments due to currency rate fluctuations, political and economic instability, different financial reporting standards and taxes, less liquidity, less strict regulation of securities markets and smaller markets with lower trading volume.
| (E) | Futures — Upon entering into a futures contract, the Funds deposit in a segregated account with their custodian, in the name of the broker, cash and/or other liquid investments equal to the minimum “initial margin” requirements of the exchange. Each Fund designates liquid securities as collateral on open futures contracts. The Funds also receive from or pay to the broker an amount of cash equal to the daily fluctuation in the value of the futures contract. Such receipts or payments are known as “variation margin” and are recorded as unrealized gains or losses. When the futures contract is closed, a realized gain or loss is recorded equal to the difference between the value of the contract at the time it was opened and the value at the time it was closed. |
| (F) | Options — The Funds may write put or call options. Premiums received by the Funds upon writing put or call options are recorded as an asset with a corresponding liability that is subsequently adjusted daily to the current market value of the option. Changes between the initial premiums received and the current market value of the options are recorded as unrealized gains or losses. When an option is closed, expired or exercised, the Funds realize a gain or loss and the liability is eliminated. The Funds continue to bear the risk of adverse movements in the price of the underlying asset during the period of the written option, although any potential loss during the period would be reduced by the amount of the option premium received by the Funds. Each Fund designates liquid securities as collateral on open written options contracts. |
| (G) | Foreign Currency Conversion — Securities and other assets and liabilities initially expressed in foreign currencies are converted daily into U.S. dollars based upon current exchange rates. Purchases and sales of foreign securities and foreign income are converted into U.S. dollars based upon currency exchange rates prevailing on the respective dates of such transactions. The effect of changes in foreign exchange rates on realized and unrealized security gains or losses is reflected as a component of such gains or losses. |
| (H) | Forward Foreign Currency Exchange Contracts — Forward foreign currency exchange contracts are valued at the forward rate and are marked-to-market daily. The change in market value is recorded as an unrealized gain or loss. When the contract is closed, the Funds record an exchange gain or loss equal to the difference between the value of the contract at the time it was opened and the value at the time it was closed. |
| (I) | Short Positions — The Funds may engage in short sale transactions. For financial statement purposes, an amount equal to the settlement amount is included in the Statements of Assets and Liabilities as an asset and an equivalent liability. |
57
NOTES TO FINANCIAL STATEMENTS (continued)
December 31, 2003
The amount of the liability is subsequently marked-to-market to reflect the current value of the short position. Changes between the amount of the liability and the current market value of the short positions are recorded as unrealized gains or losses. The Funds are liable to the buyer for any dividends payable on securities while those securities are in a short position. If the Funds sell securities short while also holding the long position in the security, they may protect unrealized gains, but will lose the opportunity to profit on such securities if the price rises. If the Funds sell securities short when not holding the long position in the security, they will experience a loss if the market price of the security increases between the date of the short sale and the date the security is replaced.
| (J) | Repurchase Agreements — The Funds may enter into repurchase agreements with institutions that the Funds’ investment advisor, Strong Capital Management, Inc. (“Strong” or the “Advisor”), has determined are creditworthy. Each repurchase transaction is recorded at cost, which approximates fair value. The Funds require that the collateral, represented by cash and/or securities (primarily U.S. government securities), in a repurchase transaction be maintained in a segregated account under the control of the Funds’ custodial bank in a manner sufficient to enable the Funds to liquidate those securities in the event of a default of the counterparty. On a daily basis, the Funds’ custodial bank monitors the value of the collateral, including accrued interest, to ensure it is at least equal to the amounts owed to the Funds under each repurchase agreement. |
| (K) | Securities Lending — The Funds have entered into a Securities Lending Agreement (the “Agreement”) with Deutsche Bank, which was subsequently acquired by State Street Bank and Trust Company. Under the terms of the Agreement, the Funds may lend portfolio securities to qualified institutional borrowers in order to earn additional income. The Agreement requires that loans are collateralized at all times by cash and cash equivalents equal to at least 102% of the market value of the aggregate loaned securities, plus accrued interest, and the collateral is marked-to-market daily. Cash collateral received is invested in repurchase agreements, investment funds, government obligations and/or bank obligations. |
At December 31, 2003, Strong Discovery Fund, Strong Large Cap Growth Fund, Strong Enterprise Fund and Strong Growth Fund had securities with a market value of $9,385,417, $2,875,220, $11,711,132 and $21,103,774, respectively, on loan and had received $9,613,785, $2,938,091, $12,001,350 and $21,624,999, respectively, in collateral (both are included within Investments in the Statements of Assets and Liabilities). Amounts earned as interest on investments of cash collateral, net of rebates and other securities lending expenses, are included in Interest Income in the Statements of Operations. For the year ended December 31, 2003, the securities lending income totaled $20,642, $17,267, $35,363 and $40,560 for Strong Discovery Fund, Strong Large Cap Growth Fund, Strong Enterprise Fund and Strong Growth Fund, respectively.
The three primary risks associated with securities lending are: a borrower defaulting on its obligation to return the securities loaned resulting in a shortfall on the posted collateral; a principal loss arising from the lending agent’s investment of cash collateral; and the inability of the lending Fund to recall a security in time to exercise valuable voting rights or sell the security. In each case, the lending agent has indemnified the Funds for these types of losses.
| (L) | Directed Brokerage — The Funds direct certain portfolio trades to brokers who, in turn, pay a portion of the Funds’ expenses not attributable to the Advisor or its affiliates. Such amounts are included in Expense Offsets reported in the Funds’ Statements of Operations and in Note 4. |
| (M) | Earnings Credit Arrangements — Credits are earned on positive cash balances maintained in custodian accounts. These credits serve to reduce the custodian’s fees incurred by certain Funds and are included in Expense Offsets reported in the Funds’ Statements of Operations and in Note 4. |
| (N) | Expenses — The Funds and other affiliated Strong Funds contract for certain services on a collective basis. The majority of the expenses are directly identifiable to an individual Fund. Expenses that are not readily identifiable to a specific Fund will be allocated in such a manner as deemed equitable, taking into consideration, among other things, the nature and type of expense and the relative sizes of the Strong Funds. |
| (O) | Use of Estimates — The preparation of financial statements in conformity with accounting principles generally accepted in the United States of America requires management to make estimates and assumptions that affect the reported amounts in these financial statements. Actual results could differ from those estimates. |
| (P) | Other — Dividend income and distributions to shareholders are recorded on the ex-dividend date. Interest income is recorded on the accrual basis and includes amortization of premiums and discounts on the interest method. Income, expenses (other than expenses attributable to a specific class), and realized and unrealized gains or losses on investments are allocated to each class of shares based on its relative shares outstanding. |
| (Q) | Redemption Fees — Investor Class shares of Strong Large Company Growth Fund held for less than one year are subject to a redemption fee of 1.00%, based on the redeemed share’s market value. Redemption fees are paid directly to the Fund. The amount collected for the year is included in Capital Stock reported in the Statements of Assets and Liabilities and in Note 8. |
58
| 3. | Related Party Transactions |
The Advisor provides investment advisory and related services to the Funds. Strong Investor Services, Inc. (the “Administrator”), an affiliate of the Advisor, provides administrative, transfer agent and related services to the Funds. Certain officers and, until December 2, 2003, certain directors of the Funds are or were affiliated with the Advisor and the Administrator. Investment advisory and administration fees, which are established by terms of the advisory and administration agreements, are based on the following annualized rates of the average daily net assets of the respective Fund:
| Administrative Fees | ||||||||||||||||||
| Advisory Fees | Investor Class | Institutional Class | Advisor Class | Class C | Class K | |||||||||||||
Strong Blue Chip Fund | 0.50 | % | 0.30 | % | * | * | * | * | ||||||||||
Strong Discovery Fund | 0.75 | % | 0.25 | % | * | * | * | * | ||||||||||
Strong Endeavor Fund | 0.75 | %(1) | 0.30 | % | * | * | * | * | ||||||||||
Strong Large Cap Growth Fund | 0.60 | %(2) | 0.30 | % | * | * | * | * | ||||||||||
Strong U.S. Emerging Growth Fund | 0.75 | %(1) | 0.30 | % | * | * | * | * | ||||||||||
Strong Enterprise Fund | 0.75 | %(1) | 0.30 | % | 0.02 | % | 0.30 | % | * | 0.25 | % | |||||||
Strong Growth 20 Fund | 0.75 | %(1) | 0.30 | % | * | 0.30 | % | * | * | |||||||||
Strong Growth Fund | 0.75 | %(1) | 0.30 | % | 0.02 | % | 0.30 | % | 0.30 | % | 0.25 | % | ||||||
Strong Large Company Growth Fund | 0.75 | %(1) | 0.30 | % | * | * | * | 0.25 | % | |||||||||
| * | Does not offer share class. |
| (1) | The Investment Advisory fees are 0.75% for assets under $4 billion, 0.725% for the next $2 billion assets, and 0.70% for assets $6 billion and above. |
| (2) | The Investment Advisory fees are 0.60% for first $35 million assets and 0.55% for assets over $35 million. |
The Funds’ Advisor and/or Administrator may voluntarily waive or absorb certain expenses at their discretion. The Advisor and/or Administrator has contractually agreed to waive its fees and/or absorb expenses for the Investor Class shares of the Strong Large Company Growth Fund to keep Total Annual Operating Expenses at no more than 1.50%. This agreement may only be terminated by the Board of Directors of the Funds. The Advisor and/or Administrator has contractually agreed to waive and/or absorb expenses until May 1, 2004, to keep Total Annual Operating Expenses of the Investor Class of Strong Endeavor Fund and Strong Enterprise Fund at no more than 2.00%, Class K of Strong Enterprise Fund at no more than 1.20% and Class K of Strong Growth Fund and Strong Large Company Growth Fund at no more than 0.99%.
Transfer agent and related service fees for the Investor Class shares are paid at a rate of $27.00 for each open shareholder account and $4.20 for each closed shareholder account. Transfer agent and related service fees for the Institutional Class, Advisor Class, Class C and Class K shares are paid at an annual rate of 0.015%, 0.20%, 0.20% and 0.20%, respectively, of the average daily net assets of each respective class. Transfer agent fees are recorded in Shareholder Servicing Costs in the Funds’ Statements of Operations. The Administrator also allocates to each Fund certain charges or credits resulting from transfer agency banking activities based on each Class’ level of subscription and redemption activity. Transfer Agency Banking Charges allocated to the Funds by the Administrator, if any, are included in Other Expenses in the Funds’ Statements of Operations. Transfer Agency Banking Credits allocated by the Administrator, if any, serve to reduce the transfer agent expenses incurred by the Funds and are included in Expense Offsets in the Funds’ Statements of Operations and in Note 4. The Administrator is also compensated for certain other out-of-pocket expenses related to transfer agent services.
Next Century Growth Investors, LLC (“Next Century Growth”), an affiliate of the Advisor, manages the investments of Strong U.S. Emerging Growth Fund under a subadvisory agreement with the Advisor. Next Century Growth is compensated by the Advisor (not the Fund) and bears all of its own expenses in providing subadvisory services.
Strong Endeavor Fund, Strong Large Company Growth Fund, Strong Enterprise Fund, Strong Growth 20 Fund and Strong Growth Fund have adopted a Rule 12b-1 distribution and service plan under the 1940 Act on behalf of the Investor Class shares of Strong Endeavor Fund and Strong Large Company Growth Fund, the Advisor Class shares of Strong Enterprise Fund, Strong Growth 20 Fund and Strong Growth Fund and the Class C shares of Strong Growth Fund. Under the plan, Strong Investments, Inc. (the “Distributor,” and an affiliate of the Advisor) is paid an annual rate of 0.25% of the average daily net assets of the Investor Class shares and the Advisor Class shares and 1.00% for Class C shares as compensation for services provided and expenses incurred, including amounts paid to brokers or dealers, in connection with the sale of each Class’ shares. See Note 4.
Strong Growth Fund’s Class C shares have a 1.00% contingent deferred sales charge if shares are sold within one year of their original purchase date. For the year ended December 31, 2003, the Distributor received no aggregate contingent deferred sales charges from the redemption of Class C shares for Strong Growth Fund. Sales charges are not an expense of the Funds and are not reflected in the financial statements of the Funds. Sales charges may be waived in limited circumstances.
The Funds may invest cash in money market funds managed by the Advisor, subject to certain limitations.
59
NOTES TO FINANCIAL STATEMENTS (continued)
December 31, 2003
Certain information regarding related party transactions, excluding the effects of waivers and absorptions, for the year ended December 31, 2003, is as follows:
| Payable to/ (Receivable from) Advisor or Administrator at Dec. 31, 2003 | Shareholder Servicing and Other Related Expenses Paid to Administrator | Transfer Agency Charges/(Credits) | Unaffiliated Directors’ Fees | |||||||||
Strong Blue Chip Fund | $ | 102,931 | $ | 1,305,244 | $ | 12,811 | $ | 5,503 | ||||
Strong Discovery Fund | 45,733 | 510,815 | 3,476 | 3,320 | ||||||||
Strong Endeavor Fund | 2,602 | 25,661 | 59 | 823 | ||||||||
Strong Large Cap Growth Fund | 185,682 | 2,074,020 | 27,895 | 16,363 | ||||||||
Strong U.S. Emerging Growth Fund | 38,383 | 453,338 | 2,054 | 1,939 | ||||||||
Strong Enterprise Fund | 115,183 | 1,724,100 | 22,580 | 6,532 | ||||||||
Strong Growth 20 Fund | 124,379 | 1,484,673 | 11,768 | 5,924 | ||||||||
Strong Growth Fund | 465,893 | 5,557,652 | 63,668 | 38,950 | ||||||||
Strong Large Company Growth Fund | 11,468 | 102,888 | 3,555 | 1,099 | ||||||||
| 4. | Expenses and Expense Offsets |
For the year ended December 31, 2003, the class specific expenses are as follows:
| Administrative Fees | Shareholder Servicing Costs | Reports to Shareholders | 12b-1 Fees | Other | ||||||||||||
Strong Enterprise Fund | ||||||||||||||||
Investor Class | $ | 714,844 | $ | 1,674,191 | $ | 317,891 | $ | — | $ | 26,238 | ||||||
Institutional Class* | 154 | 113 | 2,604 | — | 6 | |||||||||||
Advisor Class | 4,752 | 3,219 | (616 | ) | 3,960 | 45 | ||||||||||
Class K | 49,407 | 39,558 | 5,209 | — | 3,311 | |||||||||||
Strong Growth 20 Fund | ||||||||||||||||
Investor Class | 777,538 | 1,467,358 | 240,871 | — | 14,931 | |||||||||||
Advisor Class | 19,829 | 13,249 | 139 | 16,524 | 904 | |||||||||||
Strong Growth Fund | ||||||||||||||||
Investor Class | 4,106,875 | 5,397,664 | 842,641 | — | 46,049 | |||||||||||
Institutional Class | 53,110 | 40,351 | 233,566 | — | 27,208 | |||||||||||
Advisor Class | 31,471 | 21,069 | 2,439 | 26,226 | 449 | |||||||||||
Class C | 966 | 653 | 6,539 | 3,227 | 37 | |||||||||||
Class K | 108,553 | 86,729 | 1,059 | — | 1,111 | |||||||||||
Strong Large Company Growth Fund | ||||||||||||||||
Investor Class | 131,466 | 101,373 | 28,191 | 109,555 | 4,546 | |||||||||||
Class K* | 576 | 462 | 1,777 | — | 61 | |||||||||||
| * | For the period from June 30, 2003 to December 31, 2003. |
60
For the year ended December 31, 2003, the expense offsets are as follows:
| Expense Waivers and Absorptions | Transfer Agency Banking Credits | Directed Brokerage Credits | Earnings Credits | |||||||||||||
Strong Blue Chip Fund | $ | (39,114 | ) | $ | — | $ | (87,365 | ) | $ | (201 | ) | |||||
Strong Discovery Fund | (9,290 | ) | — | (51,624 | ) | (510 | ) | |||||||||
Strong Endeavor Fund | (37,609 | ) | — | (5,792 | ) | (4 | ) | |||||||||
Strong Large Cap Growth Fund | (36,179 | ) | — | (105,957 | ) | (4,133 | ) | |||||||||
Strong U.S. Emerging Growth Fund | (43,280 | ) | — | (22,947 | ) | (720 | ) | |||||||||
Strong Enterprise Fund | ||||||||||||||||
Investor Class | (295,225 | ) | — | — | — | |||||||||||
Institutional Class* | (1,368 | ) | — | — | — | |||||||||||
Advisor Class | (1 | ) | (7 | ) | — | — | ||||||||||
Class K | (21,174 | ) | — | — | — | |||||||||||
Fund Level | (15,411 | ) | — | (65,118 | ) | (1,017 | ) | |||||||||
Strong Growth 20 Fund | ||||||||||||||||
Investor Class | (52,122 | ) | — | — | — | |||||||||||
Advisor Class | (4 | ) | — | — | — | |||||||||||
Fund Level | (14,615 | ) | — | (56,518 | ) | (1,150 | ) | |||||||||
Strong Growth Fund | ||||||||||||||||
Investor Class | (3,132 | ) | — | — | — | |||||||||||
Institutional Class | (2 | ) | — | — | — | |||||||||||
Advisor Class | (5 | ) | — | — | — | |||||||||||
Class C | (5,912 | ) | — | — | — | |||||||||||
Class K | (107,579 | ) | — | — | — | |||||||||||
Fund Level | (96,943 | ) | — | (189,496 | ) | (3,192 | ) | |||||||||
Strong Large Company Growth Fund | ||||||||||||||||
Investor Class | (71,361 | ) | — | — | — | |||||||||||
Class K* | (2,671 | ) | — | — | — | |||||||||||
Fund Level | (45,800 | ) | — | (9,007 | ) | (393 | ) | |||||||||
| * | For the period from June 30, 2003 to December 31, 2003. |
| 5. | Line of Credit |
The Strong Funds have established a line of credit agreement (“LOC”) with certain financial institutions, which expires October 8, 2004, to be used for temporary or emergency purposes, primarily for financing redemption payments. Combined borrowings among all participating Strong Funds are subject to a $350 million cap on the total LOC. For an individual Fund, borrowings under the LOC are limited to either the lesser of 15% of the market value of the Fund’s total assets or any explicit borrowing limits in the Fund’s registration statement. The principal amount of each borrowing under the LOC is due not more than 45 days after the date of the borrowing. Borrowings under the LOC bear interest based on prevailing market rates as defined in the LOC. A commitment fee of 0.09% per annum is incurred on the unused portion of the LOC and is allocated to all participating Strong Funds based on their net asset values. Strong Blue Chip Fund, Strong Large Cap Growth Fund and Strong Growth Fund had no borrowings under the LOC during the year. Strong Discovery Fund, Strong U.S. Emerging Growth Fund, Strong Enterprise Fund and Strong Growth 20 Fund had minimal borrowings during the year. The average daily balance, maximum amount outstanding and interest expense for Strong Endeavor Fund was $16,986, $700,000 and $285, respectively and for Strong Large Company Growth Fund was $74,247, $3,800,000 and $1,126, respectively, for the year ended December 31, 2003. At December 31, 2003, there were no outstanding borrowings by the Funds under the LOC.
61
NOTES TO FINANCIAL STATEMENTS (continued)
December 31, 2003
| 6. | Investment Transactions |
The aggregate purchases and sales of long-term securities during the year ended December 31, 2003, are as follows:
| Purchases | Sales | |||||
Strong Blue Chip Fund | $ | 456,381,623 | $ | 506,711,045 | ||
Strong Discovery Fund | 431,220,994 | 433,790,628 | ||||
Strong Endeavor Fund | 10,578,840 | 11,070,230 | ||||
Strong Large Cap Growth Fund | 1,556,179,164 | 1,619,608,420 | ||||
Strong U.S. Emerging Growth Fund | 88,839,991 | 80,163,984 | ||||
Strong Enterprise Fund | 658,049,752 | 686,883,665 | ||||
Strong Growth 20 Fund | 816,294,816 | 797,500,215 | ||||
Strong Growth Fund | 2,295,434,150 | 2,466,914,312 | ||||
Strong Large Company Growth Fund | 140,141,944 | 99,657,651 | ||||
There were no purchases or sales of long-term U.S. government securities during the year ended December 31, 2003.
| 7. | Income Tax Information |
The following information for the Funds is presented on an income tax basis as of December 31, 2003:
| Cost of Investments | Gross Unrealized Appreciation | Gross Unrealized (Depreciation) | Net Unrealized Investments | Distributable Ordinary Income | Distributable Long-Term Capital��Gains | ||||||||||||||
Strong Blue Chip Fund | $ | 138,690,180 | $ | 37,706,390 | $ | — | $ | 37,706,390 | $ | — | $ | — | |||||||
Strong Discovery Fund | 149,219,498 | 28,191,051 | (2,203,268 | ) | 25,987,783 | 2,284,239 | — | ||||||||||||
Strong Endeavor Fund | 3,772,813 | 781,507 | (29,950 | ) | 751,557 | — | — | ||||||||||||
Strong Large Cap Growth Fund | 532,657,830 | 114,598,614 | (1,683,403 | ) | 112,915,211 | — | — | ||||||||||||
Strong U.S. Emerging Growth Fund | 66,314,045 | 34,426,884 | (581,307 | ) | 33,845,577 | — | — | ||||||||||||
Strong Enterprise Fund | 250,287,726 | 46,821,324 | (3,667,528 | ) | 43,153,796 | — | — | ||||||||||||
Strong Growth 20 Fund | 212,017,214 | 49,163,981 | (3,017,045 | ) | 46,146,936 | — | — | ||||||||||||
Strong Growth Fund | 1,372,713,189 | 404,868,726 | (6,454,338 | ) | 398,414,388 | — | — | ||||||||||||
Strong Large Company Growth Fund | 65,843,773 | 6,808,566 | (119,067 | ) | 6,689,499 | — | — | ||||||||||||
The difference between cost amounts for financial statement and federal income tax purposes is due primarily to timing differences in recognizing certain gains and losses on security transactions.
The tax components of dividends paid during the years ended December 31, 2003 and 2002 and capital loss carryovers (expiring in varying amounts through 2011) as of December 31, 2003, and tax basis post-October losses as of December 31, 2003, which are not recognized for tax purposes until the first day of the following fiscal year, are:
| 2003 Income Tax Information | 2002 Income Tax Information | |||||||||||||||||||
| Ordinary Income Distributions | Long-Term Capital Gains Distributions | Net Capital Loss Carryovers | Post-October Losses | Ordinary Income Distributions | Long-Term Capital Gains Distributions | |||||||||||||||
Strong Blue Chip Fund | $ | — | $ | — | $ | 189,843,041 | $ | — | $ | — | $ | — | ||||||||
Strong Discovery Fund | 1,811,805 | — | — | 47,859 | — | 4,117,207 | ||||||||||||||
Strong Endeavor Fund | — | — | 1,841,060 | 99 | — | — | ||||||||||||||
Strong Large Cap Growth Fund | — | — | 523,964,290 | 5,676,937 | — | — | ||||||||||||||
Strong U.S. Emerging Growth Fund | — | — | 61,799,533 | — | — | — | ||||||||||||||
Strong Enterprise Fund | — | — | 327,970,652 | 398,910 | — | — | ||||||||||||||
Strong Growth 20 Fund | — | — | 384,570,210 | — | — | — | ||||||||||||||
Strong Growth Fund | — | — | 912,414,231 | — | — | — | ||||||||||||||
Strong Large Company Growth Fund | 14,224 | — | 7,772,161 | 1,046 | 77,055 | (1) | — | (1) | ||||||||||||
| (1) | For the period from October 1, 2002 through December 31, 2002. |
For corporate shareholders in the Funds, the percentages of ordinary dividend income distributed for the year ended December 31, 2003, which is designated as qualifying for the dividends-received deduction, is as follows (unaudited): Strong Blue Chip Fund 0.0%, Strong Discovery Fund 100.0%, Strong Endeavor Fund 0.0%, Strong Large Cap Growth Fund 0.0%, Strong U.S. Emerging Growth Fund 0.0%, Strong Enterprise Fund 0.0%, Strong Growth 20 Fund 0.0%, Strong Growth Fund 0.0% and Strong Large Company Growth Fund 100.0%.
62
For shareholders in the Funds, the percentages of dividend income distributed for the year ended December 31, 2003, which is designated as qualified dividend income under the Jobs and Growth Tax Relief Act of 2003, is as follows (unaudited): Strong Blue Chip Fund 0.0%, Strong Discovery Fund 43.0%, Strong Endeavor Fund 0.0%, Strong Large Cap Growth Fund 0.0%, Strong U.S. Emerging Growth Fund 0.0%, Strong Enterprise Fund 0.0%, Strong Growth 20 Fund 0.0%, Strong Growth Fund 0.0% and Strong Large Company Growth Fund 0.0%.
Capital loss carryovers utilized during the year ended December 31, 2003 is as follows: Strong Blue Chip Fund $0, Strong Discovery Fund $10,213,054, Strong Endeavor Fund $441,570, Strong Large Cap Growth Fund $5,370,201, Strong U.S. Emerging Growth Fund $5,163,587, Strong Enterprise Fund $31,830,620, Strong Growth 20 Fund $15,813,626, Strong Growth Fund $114,554,778 and Strong Large Company Growth Fund $1,988,353.
| 8. | Capital Share Transactions |
| Strong Blue Chip Fund | Strong Discovery Fund | |||||||||||||||
Year Ended Dec. 31, 2003 | Year Ended Dec. 31, 2002 | Year Ended Dec. 31, 2003 | Year Ended Dec. 31, 2002 | |||||||||||||
Capital Share Transactions of Each of the Funds Were as Follows: | ||||||||||||||||
Proceeds from Shares Sold | $ | 38,554,582 | $ | 58,579,917 | $ | 72,860,267 | $ | 106,826,156 | ||||||||
Proceeds from Reinvestment of Distributions | — | — | 1,765,655 | 4,008,647 | ||||||||||||
Payment for Shares Redeemed | (111,846,495 | ) | (101,599,557 | ) | (88,420,497 | ) | (112,742,042 | ) | ||||||||
Net Increase (Decrease) in Net Assets from Capital Share Transactions | $ | (73,291,913 | ) | $ | (43,019,640 | ) | $ | (13,794,575 | ) | $ | (1,907,239 | ) | ||||
Transactions in Shares of Each of the Funds Were as Follows: | ||||||||||||||||
Sold | 4,237,712 | 5,467,305 | 4,453,708 | 6,929,360 | ||||||||||||
Issued in Reinvestment of Distributions | — | — | 93,470 | 235,942 | ||||||||||||
Redeemed | (11,971,115 | ) | (9,308,147 | ) | (5,340,622 | ) | (7,318,812 | ) | ||||||||
Net Increase (Decrease) in Shares | (7,733,403 | ) | (3,840,842 | ) | (793,444 | ) | (153,510 | ) | ||||||||
| Strong Endeavor Fund | Strong Large Cap Growth Fund | |||||||||||||||
Year Ended Dec. 31, 2003 | Year Ended Dec. 31, 2002 | Year Ended Dec. 31, 2003 | Year Ended Dec. 31, 2002 | |||||||||||||
Capital Share Transactions of Each of the Funds Were as Follows: | ||||||||||||||||
Proceeds from Shares Sold | $ | 2,761,167 | $ | 2,639,463 | $ | 119,300,083 | $ | 92,753,828 | ||||||||
Proceeds from Reinvestment of Distributions | — | — | — | — | ||||||||||||
Payment for Shares Redeemed | (3,208,236 | ) | (3,433,944 | ) | (215,208,135 | ) | (206,294,132 | ) | ||||||||
Net Increase (Decrease) in Net Assets from Capital Share Transactions | $ | (447,069 | ) | $ | (794,481 | ) | $ | (95,908,052 | ) | $ | (113,540,304 | ) | ||||
Transactions in Shares of Each of the Funds Were as Follows: | ||||||||||||||||
Sold | 352,819 | 297,527 | 6,748,415 | 5,153,796 | ||||||||||||
Issued in Reinvestment of Distributions | — | — | — | — | ||||||||||||
Redeemed | (392,692 | ) | (400,627 | ) | (11,659,100 | ) | (10,941,355 | ) | ||||||||
Net Increase (Decrease) in Shares of the Fund | (39,873 | ) | (103,100 | ) | (4,910,685 | ) | (5,787,559 | ) | ||||||||
63
NOTES TO FINANCIAL STATEMENTS (continued)
December 31, 2003
| Strong U.S. Emerging Growth Fund | ||||||||
| Year Ended Dec. 31, 2003 | Year Ended Dec. 31, 2002 | |||||||
Capital Share Transactions of the Fund Were as Follows: | ||||||||
Proceeds from Shares Sold | $ | 80,614,500 | $ | 120,177,180 | ||||
Proceeds from Reinvestment of Distributions | — | — | ||||||
Payment for Shares Redeemed | (70,723,291 | ) | (116,020,955 | ) | ||||
Net Increase (Decrease) in Net Assets from Capital Share Transactions | $ | 9,891,209 | $ | 4,156,225 | ||||
Transactions in Shares of the Fund Were as Follows: | ||||||||
Sold | 6,579,270 | 9,702,326 | ||||||
Issued in Reinvestment of Distributions | — | — | ||||||
Redeemed | (5,686,579 | ) | (9,562,612 | ) | ||||
Net Increase (Decrease) in Shares of the Fund | 892,691 | 139,714 | ||||||
| Strong Enterprise Fund | ||||||||
Year Ended Dec. 31, 2003 | Year Ended Dec. 31, 2002 | |||||||
| (Note 1) | ||||||||
Capital Share Transactions of Each Class of Shares of the Fund Were as Follows: | ||||||||
INVESTOR CLASS | ||||||||
Proceeds from Shares Sold | $ | 57,913,922 | $ | 101,776,889 | ||||
Proceeds from Reinvestment of Distributions | — | — | ||||||
Payment for Shares Redeemed | (108,083,036 | ) | (148,882,956 | ) | ||||
Net Increase (Decrease) in Net Assets from Capital Share Transactions | (50,169,114 | ) | (47,106,067 | ) | ||||
INSTITUTIONAL CLASS | ||||||||
Proceeds from Shares Sold | 2,440,911 | — | ||||||
Proceeds from Reinvestment of Distributions | — | — | ||||||
Payment for Shares Redeemed | (571,699 | ) | — | |||||
Net Increase (Decrease) in Net Assets from Capital Share Transactions | 1,869,212 | — | ||||||
ADVISOR CLASS | ||||||||
Proceeds from Shares Sold | 794,357 | 849,133 | ||||||
Proceeds from Reinvestment of Distributions | — | — | ||||||
Payment for Shares Redeemed | (860,789 | ) | (481,554 | ) | ||||
Net Increase (Decrease) in Net Assets from Capital Share Transactions | (66,432 | ) | 367,579 | |||||
CLASS K CLASS | ||||||||
Proceeds from Shares Sold | 27,685,600 | 4,310,980 | ||||||
Proceeds from Reinvestment of Distributions | — | — | ||||||
Payment for Shares Redeemed | (3,466,148 | ) | (371,572 | ) | ||||
Net Increase (Decrease) in Net Assets from Capital Share Transactions | 24,219,452 | 3,939,408 | ||||||
Net Increase (Decrease) in Net Assets from Capital Share Transactions | $ | (24,146,882 | ) | $ | (42,799,080 | ) | ||
64
| Strong Enterprise Fund | ||||||
| Year Ended Dec. 31, 2003 | Year Ended Dec. 31, 2002 | |||||
| (Note 1) | ||||||
Transactions in Shares of Each Class of the Fund Were as Follows: | ||||||
INVESTOR CLASS | ||||||
Sold | 3,153,308 | 5,339,599 | ||||
Issued in Reinvestment of Distributions | — | — | ||||
Redeemed | (5,809,732 | ) | (8,049,574 | ) | ||
Net Increase (Decrease) in Shares | (2,656,424 | ) | (2,709,975 | ) | ||
INSTITUTIONAL CLASS | ||||||
Sold | 124,525 | — | ||||
Issued in Reinvestment of Distributions | — | — | ||||
Redeemed | (27,868 | ) | — | |||
Net Increase (Decrease) in Shares | 96,657 | — | ||||
ADVISOR CLASS | ||||||
Sold | 41,765 | 44,794 | ||||
Issued in Reinvestment of Distributions | — | — | ||||
Redeemed | (42,658 | ) | (26,641 | ) | ||
Net Increase (Decrease) in Shares | (893 | ) | 18,153 | |||
CLASS K | ||||||
Sold | 1,484,422 | 270,110 | ||||
Issued in Reinvestment of Distributions | — | — | ||||
Redeemed | (174,720 | ) | (23,597 | ) | ||
Net Increase (Decrease) in Shares | 1,309,702 | 246,513 | ||||
65
NOTES TO FINANCIAL STATEMENTS (continued)
December 31, 2003
| Strong Growth 20 Fund | ||||||||
Year Ended Dec. 31, 2003 | Year Ended Dec. 31, 2002 | |||||||
Capital Share Transactions of Each Class of Shares of the Fund Were as Follows: | ||||||||
INVESTOR CLASS | ||||||||
Proceeds from Shares Sold | $ | 215,730,444 | $ | 37,975,224 | ||||
Proceeds from Reinvestment of Distributions | — | — | ||||||
Payment for Shares Redeemed | (208,651,373 | ) | (119,329,093 | ) | ||||
Net Increase (Decrease) in Net Assets from Capital Share Transactions | 7,079,071 | (81,353,869 | ) | |||||
ADVISOR CLASS | ||||||||
Proceeds from Shares Sold | 1,330,952 | 2,702,059 | ||||||
Proceeds from Reinvestment of Distributions | — | — | ||||||
Payment for Shares Redeemed | (3,819,394 | ) | (3,312,180 | ) | ||||
Net Increase (Decrease) in Net Assets from Capital Share Transactions | (2,488,442 | ) | (610,121 | ) | ||||
Net Increase (Decrease) in Net Assets from Capital Share Transactions | $ | 4,590,629 | $ | (81,963,990 | ) | |||
Transactions in Shares of Each Class of the Fund Were as Follows: | ||||||||
INVESTOR CLASS | ||||||||
Sold | 20,382,621 | 3,076,476 | ||||||
Issued in Reinvestment of Distributions | — | — | ||||||
Redeemed | (18,867,469 | ) | (9,577,471 | ) | ||||
Net Increase (Decrease) in Shares | 1,515,152 | (6,500,995 | ) | |||||
ADVISOR CLASS | ||||||||
Sold | 116,482 | 218,805 | ||||||
Issued in Reinvestment of Distributions | — | — | ||||||
Redeemed | (323,340 | ) | (279,312 | ) | ||||
Net Increase (Decrease) in Shares | (206,858 | ) | (60,507 | ) | ||||
66
| Strong Growth Fund | ||||||||
Year Ended Dec. 31, 2003 | Year Ended Dec. 31, 2002 | |||||||
Capital Share Transactions of Each Class of Shares of the Fund Were as Follows: | ||||||||
INVESTOR CLASS | ||||||||
Proceeds from Shares Sold | $ | 195,543,770 | $ | 212,362,800 | ||||
Proceeds from Reinvestment of Distributions | — | — | ||||||
Payment for Shares Redeemed | (449,810,001 | ) | (501,568,269 | ) | ||||
Net Increase (Decrease) in Net Assets from Capital Share Transactions | (254,266,231 | ) | (289,205,469 | ) | ||||
INSTITUTIONAL CLASS | ||||||||
Proceeds from Shares Sold | 97,951,922 | 176,034,058 | ||||||
Proceeds from Reinvestment of Distributions | — | — | ||||||
Payment for Shares Redeemed | (53,916,690 | ) | (15,602,302 | ) | ||||
Net Increase (Decrease) in Net Assets from Capital Share Transactions | 44,035,232 | 160,431,756 | ||||||
ADVISOR CLASS | ||||||||
Proceeds from Shares Sold | 4,568,184 | 4,515,364 | ||||||
Proceeds from Reinvestment of Distributions | — | — | ||||||
Payment for Shares Redeemed | (7,899,492 | ) | (5,576,741 | ) | ||||
Net Increase (Decrease) in Net Assets from Capital Share Transactions | (3,331,308 | ) | (1,061,377 | ) | ||||
CLASS C | ||||||||
Proceeds from Shares Sold | 385,777 | 100,000 | ||||||
Proceeds from Reinvestment of Distributions | — | — | ||||||
Payment for Shares Redeemed | (48,846 | ) | — | |||||
Net Increase (Decrease) in Net Assets from Capital Share Transactions | 336,931 | 100,000 | ||||||
CLASS K | ||||||||
Proceeds from Shares Sold | 51,582,602 | 15,492,888 | ||||||
Proceeds from Reinvestment of Distributions | — | — | ||||||
Payment for Shares Redeemed | (19,995,565 | ) | (1,625,166 | ) | ||||
Net Increase (Decrease) in Net Assets from Capital Share Transactions | 31,587,037 | 13,867,722 | ||||||
Net Increase (Decrease) in Net Assets from Capital Share Transactions | $ | (181,638,339 | ) | $ | (115,867,368 | ) | ||
67
NOTES TO FINANCIAL STATEMENTS (continued)
December 31, 2003
| Strong Growth Fund | ||||||
| Year Ended Dec. 31, 2003 | Year Ended Dec. 31, 2002 | |||||
Transactions in Shares of Each Class of the Fund Were as Follows: | ||||||
INVESTOR CLASS | ||||||
Sold | 13,337,882 | 13,789,094 | ||||
Issued in Reinvestment of Distributions | — | — | ||||
Redeemed | (28,947,288 | ) | (33,083,023 | ) | ||
Net Increase (Decrease) in Shares | (15,609,406 | ) | (19,293,929 | ) | ||
INSTITUTIONAL CLASS | ||||||
Sold | 6,457,458 | 11,454,780 | ||||
Issued in Reinvestment of Distributions | — | — | ||||
Redeemed | (3,285,692 | ) | (1,053,015 | ) | ||
Net Increase (Decrease) in Shares | 3,171,766 | 10,401,765 | ||||
ADVISOR CLASS | ||||||
Sold | 304,356 | 292,723 | ||||
Issued in Reinvestment of Distributions | — | — | ||||
Redeemed | (503,466 | ) | (362,829 | ) | ||
Net Increase (Decrease) in Shares | (199,110 | ) | (70,106 | ) | ||
CLASS C | ||||||
Sold | 25,570 | 7,441 | ||||
Issued in Reinvestment of Distributions | — | — | ||||
Redeemed | (2,959 | ) | — | |||
Net Increase (Decrease) in Shares | 22,611 | 7,441 | ||||
CLASS K | ||||||
Sold | 3,430,845 | 1,111,771 | ||||
Issued in Reinvestment of Distributions | — | — | ||||
Redeemed | (1,204,449 | ) | (125,340 | ) | ||
Net Increase (Decrease) in Shares | 2,226,396 | 986,431 | ||||
68
| Strong Large Company Growth Fund | ||||||||||||
Year Ended Dec. 31, 2003 | Period Ended Dec. 31, 2002 | Year Ended Sept. 30, 2002 | ||||||||||
| (Note 1) | ||||||||||||
Capital Share Transactions of Each Class of Shares of the Fund Were as Follows: | ||||||||||||
INVESTOR CLASS | ||||||||||||
Proceeds from Shares Sold | $ | 71,224,694 | $ | 4,988,861 | $ | 5,920,297 | ||||||
Proceeds from Reinvestment of Distributions | 12,085 | 66,475 | 607,929 | |||||||||
Proceeds from Redemption Fees | 30,740 | 51 | — | |||||||||
Payment for Shares Redeemed | (31,528,112 | ) | (2,734,805 | ) | (17,465,133 | ) | ||||||
Net Increase (Decrease) in Net Assets from Capital Share Transactions | 39,739,407 | 2,320,582 | (10,936,907 | ) | ||||||||
CLASS K | ||||||||||||
Proceeds from Shares Sold | 1,000,551 | — | — | |||||||||
Proceeds from Reinvestment of Distributions | — | — | — | |||||||||
Proceeds from Redemption Fees | 626 | — | — | |||||||||
Payment for Shares Redeemed | (28,718 | ) | — | — | ||||||||
Net Increase (Decrease) in Net Assets from Capital Share Transactions | 972,459 | — | — | |||||||||
Net Increase (Decrease) in Net Assets from Capital Share Transactions | $ | 40,711,866 | $ | 2,320,582 | $ | (10,936,907 | ) | |||||
Transactions in Shares of Each Class of the Fund Were as Follows: | ||||||||||||
INVESTOR CLASS | ||||||||||||
Sold | 5,804,010 | 470,973 | 467,109 | |||||||||
Issued in Reinvestment of Distributions | 1,118 | 6,242 | 49,733 | |||||||||
Redeemed | (2,514,076 | ) | (248,984 | ) | (1,466,404 | ) | ||||||
Net Increase (Decrease) in Shares of the Fund | 3,291,052 | 228,231 | (949,562 | ) | ||||||||
CLASS K | ||||||||||||
Sold | 78,792 | — | — | |||||||||
Issued in Reinvestment of Distributions | — | — | — | |||||||||
Redeemed | (2,190 | ) | — | — | ||||||||
Net Increase (Decrease) in Shares of the Fund | 76,602 | — | — | |||||||||
| 9. | Investments in Affiliates |
Affiliated issuers, as defined under the 1940 Act, include any Fund of the Strong Funds and any issuer in which the Fund’s holdings of an issuer represent 5% or more of the outstanding voting securities of the issuer. A summary of transactions in the securities of these issuers during the year ended December 31, 2003 is as follows:
Balance of Shares Held Jan. 1, 2003 | Gross Purchases and Additions | Gross Sales and Reductions | Balance of Shares Held Dec. 31, 2003 | Value Dec. 31, 2003 | Dividend Income Dec. 31, 2003 | ||||||||||
Strong Discovery Fund | |||||||||||||||
Strong Heritage Money Fund – Institutional Class | 1,000,000 | — | (1,000,000 | ) | — | $ | — | $ | 5,291 | ||||||
Strong Large Cap Growth Fund | |||||||||||||||
Strong Heritage Money Fund – Institutional Class | 6,200,000 | — | (6,200,000 | ) | — | — | 1,113 | ||||||||
Strong Growth Fund | |||||||||||||||
Strong Heritage Money Fund – Institutional Class | 12,700,000 | — | (12,700,000 | ) | — | — | 50,219 | ||||||||
69
NOTES TO FINANCIAL STATEMENTS (continued)
December 31, 2003
| 10. | Special Meeting of Shareholders of Strong Advisor Mid Cap Growth Fund |
On August 1, 2003, the Strong Advisor Mid Cap Growth Fund’s and Strong Growth Fund’s Board of Directors approved the reorganization of the Strong Advisor Mid Cap Growth Fund into the Strong Growth Fund, subject to shareholder approval at a meeting scheduled for October 31, 2003, which was adjourned. A new meeting date has not been set. Effective after the close of the market on August 22, 2003, the Strong Advisor Mid Cap Growth Fund was closed to new investors. Effective January 30, 2004, Strong Advisor Mid Cap Growth Fund was reopened to new investors.
| 11. | Legal Proceedings |
The United States Securities and Exchange Commission (“SEC”), the New York Attorney General (“NYAG”), the Wisconsin Attorney General (“WAG”), and the Wisconsin Department of Financial Institutions (“WDFI”) are investigating active trading of the Strong Funds by employees of Strong, including Richard S. Strong, former employee and Chairman of Strong. The Independent Directors of the Strong Funds are also investigating these matters, with the assistance of counsel and an independent consulting firm. Fund expenses related to the investigation are reimbursed by Strong. The Independent Directors intend to obtain appropriate redress if they determine that the Strong Funds were harmed. In addition, Strong has received a subpoena from the West Virginia Attorney General (“WVAG”) requesting documents, if any, related to market timing and late trading practices. Effective November 2, 2003, the Independent Directors accepted Mr. Strong’s resignation as Chairman of the Strong Funds’ Boards. Effective December 2, 2003, Mr. Strong resigned as Director of the Strong Funds’ Boards, as Chairman, Chief Investment Officer and Director of Strong, and as Chairman and Director of Strong Financial Corporation, and its affiliates.
Strong is aware of a complaint filed and simultaneously settled on September 3, 2003 (the “Complaint”), by NYAG on behalf of the State of New York, against Canary Capital Partners, LLC, et al. (collectively, “Canary”), which alleges that Canary engaged in certain improper trading practices characterized as “late-day trading” and “market timing” with various mutual funds. Strong and certain Strong Funds are referenced, although not named as parties in the Complaint, with respect to the market timing allegations. On September 5, 2003, the SEC began an inquiry based on matters related to, and set forth in, the Complaint. On September 24, 2003, the WDFI asked that certain information and documents be provided related to the matters referenced in the Complaint.
Strong is currently cooperating with the NYAG, the SEC, the WAG, the WDFI, and the WVAG with respect to their separate inquiries into these matters. On September 26, 2003, Strong announced its commitment to make appropriate reimbursement if it is determined that the transactions set forth in the Complaint adversely affected investors in the Strong Funds referenced in the Complaint. On October 30, 2003, Mr. Strong announced that he has committed to personally compensate the Strong Funds for any financial losses they may have experienced as a result of his transactions.
As of the date of this Report, Strong is aware of multiple shareholder class and derivative actions (“Actions”) filed since September 4, 2003, with respect to the factual matters referenced in the Complaint naming, among others, Strong, Strong Funds, Strong affiliates, and certain of their officers and directors as defendants. These Actions have been filed in the following federal and state courts: U.S. District Court for the Southern District of New York; U.S. District Court, District of New Jersey; U.S. District Court, Eastern District of Wisconsin, Milwaukee Division; U.S. District Court, Western District of Wisconsin; Superior Court of New Jersey Law Division of Hudson; State of Wisconsin Circuit Court, Milwaukee County; State of Wisconsin Circuit Court, Waukesha County; Supreme Court of the State of New York; Superior Court of the State of California, County of Los Angeles; and U.S. District Court, District of Connecticut. The Actions generally allege, among other things, that the defendants violated their fiduciary duty to fund shareholders and certain retirement plan participants, and made false and misleading statements in the funds’ prospectuses in violation of federal and state securities laws. The Actions generally seek one or more of the following: compensatory damages, punitive damages, special damages, exemplary damages, rescission, restitution, payment of plaintiffs’ attorneys’ fees and experts’ fees, and/or replacement of the Board of Directors of the Strong Funds. Additional lawsuits may be filed in the same or other venues presenting allegations and demands for relief. Strong expects that any such lawsuits would contain allegations including the matters discussed here and that the demands for relief would not materially differ from those described above. Based on available information, Strong and the Strong Funds do not currently believe that any of the pending Actions or the regulatory inquiries will have a material impact on any of the Strong Funds.
70
REPORT OF INDEPENDENT AUDITORS
To the Board of Directors and Shareholders
of Strong Growth Funds:
In our opinion, the accompanying statements of assets and liabilities, including the schedules of investments in securities, and the related statements of operations and of changes in net assets and the financial highlights present fairly, in all material respects, the financial position of Strong Blue Chip Fund, Strong Discovery Fund, Strong Endeavor Fund, Strong Large Cap Growth Fund, Strong U.S. Emerging Growth Fund, Strong Enterprise Fund, Strong Growth 20 Fund, Strong Growth Fund and Strong Large Company Growth Fund (all nine collectively constituting Strong Growth Funds, hereafter referred to as the “Funds”) at December 31, 2003, and the results of each of their operations, the changes in each of their net assets and their financial highlights for the periods indicated, in conformity with the accounting principles generally accepted in the United States of America. These financial statements and financial highlights (hereafter referred to as “financial statements”) are the responsibility of the Funds’ management; our responsibility is to express an opinion on these financial statements based on our audits. We conducted our audits of these financial statements in accordance with auditing standards generally accepted in the United States of America, which require that we plan and perform the audit to obtain reasonable assurance about whether the financial statements are free of material misstatement. An audit includes examining, on a test basis, evidence supporting the amounts and disclosures in the financial statements, assessing the accounting principles used and significant estimates made by management, and evaluating the overall financial statement presentation. We believe that our audits, which included confirmation of securities at December 31, 2003 by correspondence with the custodian and brokers, provide a reasonable basis for our opinion.
PricewaterhouseCoopers LLP
Milwaukee, Wisconsin
February 3, 2004
71
Each officer and director holds the same position with the 27 registered open-end management investment companies consisting of 72 mutual funds (“Strong Funds”).
Willie D. Davis (DOB 7-24-34), Director of the Strong Funds since July 1994.
Mr. Davis has been President and Chief Executive Officer of All Pro Broadcasting, Inc., since 1977; Director of Wisconsin Energy Corporation (formerly WICOR, Inc., a utility company) since 1990, Metro Goldwyn Mayer, Inc. (an entertainment company), since 1998, Bassett Furniture Industries, Inc., since 1997, Checker’s Drive-In Restaurants, Inc. (formerly Rally’s Hamburgers, Inc.), since 1994, Johnson Controls, Inc. (an industrial company), since 1992, MGM Mirage (formerly MGM Grand, Inc., an entertainment/hotel company) since 1990, Dow Chemical Company since 1988, Sara Lee Corporation (a food/consumer products company) since 1983, Alliance Bank since 1980, Manpower, Inc. (a worldwide provider of staffing services), since 2001, and Kmart Corporation (a discount consumer products company) from 1985 to 2003; and Trustee of the University of Chicago since 1980 and Marquette University since 1988.
Gordon B. Greer (DOB 2-17-32), Director of the Strong Funds since March 2002.
Mr. Greer was Of Counsel for Bingham McCutchen LLP (a law firm previously known as Bingham Dana LLP) from 1997 to February 2002 and Partner of Bingham McCutchen LLP from 1967 to 1997. On behalf of Bingham McCutchen LLP, Mr. Greer provided representation to the disinterested directors of the Strong Funds from 1991 to February 2002. Bingham McCutchen LLP has provided representation to the Independent Directors of the Strong Funds since 1991.
Stanley Kritzik (DOB 1-9-30), Director of the Strong Funds since January 1995 and Chairman of the Audit Committee of the Strong Funds since July 2000.
Mr. Kritzik has been Partner of Metropolitan Associates (a real estate firm) since 1962; Director of Wisconsin Health Information Network since November 1997, Health Network Ventures, Inc., from 1992 to April 2000, Aurora Health Care from September 1987 to September 2002; and Member of the Board of Governors of Snowmass Village Resort Association from October 1999 until October 2002.
Neal Malicky (DOB 9-14-34), Director of the Strong Funds since December 1999.
Mr. Malicky has been President Emeritus of Baldwin-Wallace College since July 2000; Chancellor of Baldwin-Wallace College from July 1999 to June 2000; President of Baldwin-Wallace College from July 1981 to June 1999; Director of Aspire Learning Corporation since June 2000; Trustee of Southwest Community Health Systems, Cleveland Scholarship Program, and The National Conference for Community and Justice until 2001; President of the National Association of Schools and Colleges of the United Methodist Church, Chairperson of the Association of Independent Colleges and Universities of Ohio, and Secretary of the National Association of Independent Colleges and Universities until 2001.
William F. Vogt (DOB 7-19-47), Director and Chairman of Independent Directors Committee of the Strong Funds since January 1995.
Mr. Vogt has been Senior Vice President of IDX Systems Corporation (a management consulting firm) since June 2001; President of Vogt Management Consulting, Inc., from July 1990 June 2001; and former Fellow of the American College of Medical Practice Executives.
72
DIRECTORS AND OFFICERS (continued)
Ane K. Ohm (DOB 10-16-69), Anti-Money Laundering Compliance Officer of the Strong Funds since November 2002.
Ms. Ohm has been Anti-Money Laundering Compliance Officer of Strong Financial Corporation since February 2003; Assistant Executive Vice President of Strong Financial Corporation since November 2003; Executive Vice President of the Advisor since December 2001; Director of Mutual Fund Administration of Strong Investor Services, Inc., since April 2001; and Marketing Services Manager of Strong Investments, Inc., from November 1998 to April 2001.
Christopher O. Petersen (DOB 1-18-70), Vice President and Assistant Secretary of the Strong Funds since May 2003.
Mr. Petersen has been Managing Counsel of Strong Financial Corporation since March 2003; Corporate Counsel at U.S. Bancorp Asset Management, Inc., from May 2001 to March 2003; Corporate Counsel at First American Asset Management, a division of U.S. Bank National Association (“FAAM”), from September 1999 to May 2001; Compliance Officer at FAAM from January 1999 to September 1999; and Associate Attorney at Mauzy Law Firm from September 1997 to December 1998.
Richard W. Smirl (DOB 4-18-67), Vice President of the Strong Funds since February 2002 and Secretary of the Strong Funds since November 2001.
Mr. Smirl has been Senior Counsel of Strong Financial Corporation since December 2001; Assistant Secretary of Strong Financial Corporation from December 2001 to February 2003; Secretary of Strong Financial Corporation since February 2003; Assistant Executive Vice President of the Advisor since December 2001; Chief Legal Officer of the Advisor since February 2003; Secretary of the Advisor since November 2002; Assistant Secretary of the Advisor from December 2001 to November 2002; Senior Counsel of the Advisor from July 2000 to December 2001; General Counsel of Strong Investments, Inc. (“Distributor”), since November 2001; Secretary of the Distributor since July 2000; Vice President and Chief Compliance Officer of the Distributor from July 2000 to December 2003; Lead Counsel of the Distributor from July 2000 to November 2001; Vice President of Strong Investor Services, Inc., since December 2001; Assistant Secretary of Strong Investor Services, Inc., from December 2001 to May 2003; Secretary of Strong Investor Services, Inc., since May 2003; Partner at Keesal, Young & Logan LLP (a law firm) from September 1999 to July 2000; and Associate at Keesal, Young & Logan LLP from September 1992 to September 1999.
Gilbert L. Southwell III (DOB 4-13-54), Assistant Secretary of the Strong Funds since July 2001.
Mr. Southwell has been Associate Counsel of Strong Financial Corporation since December 2001; Assistant Secretary of the Advisor since December 2002; Associate Counsel of the Advisor from April 2001 to December 2001; Partner at Michael, Best & Friedrich, LLP (a law firm) from October 1999 to March 2001; and Assistant General Counsel of U.S. Bank, National Association (formerly Firstar Bank, N.A.) and/or certain of its subsidiaries from November 1984 to September 1999.
John W. Widmer (DOB 1-19-65), Treasurer of the Strong Funds since April 1999.
Mr. Widmer has been Treasurer of the Advisor since April 1999; Assistant Treasurer of Strong Financial Corporation since December 2001; Assistant Secretary of Strong Financial Corporation from December 2001 to January 2003; Treasurer of Strong Service Corporation since April 1999; Treasurer and Assistant Secretary of Strong Investor Services, Inc., since July 2001; and Manager of the Financial Management and Sales Reporting Systems department of the Advisor from May 1997 to April 1999.
Thomas M. Zoeller (DOB 2-21-64), Vice President of the Strong Funds since October 1999.
Mr. Zoeller has been Executive Vice President of the Advisor since April 2001; Chief Financial Officer of the Advisor since February 1998; Secretary of the Advisor from December 2001 to November 2002; Member of the Office of the Chief Executive of Strong Financial Corporation since May 2001; Chief Financial Officer and Treasurer of Strong Investments, Inc., since October 1993; Executive Vice President of Strong Investor Services, Inc., since July 2001; Secretary of Strong Investor Services, Inc., from July 2001 to May 2003; Executive Vice President, Chief Financial Officer, and Secretary of Strong Service Corporation since December 2001; Treasurer of Strong Service Corporation from September 1996 to April 1999; Vice President of Strong Service Corporation from April 1999 to December 2001; Member of the Office of the Chief Executive of the Advisor from November 1998 until May 2001; and Senior Vice President of the Advisor from February 1998 to April 2001.
Except for Messrs. Davis, Kritzik, Malicky, and Vogt, the address of all of the Directors and Officers is P.O. Box 2936, Milwaukee, WI 53201. Mr. Davis’s address is 161 North La Brea, Inglewood, CA 90301. Mr. Kritzik’s address is 1123 North Astor Street, Milwaukee, WI 53202. Mr. Malicky’s address is 4608 Turnberry Drive, Lawrence, KS 66047. Mr. Vogt’s address is P.O. Box 7657, Avon, CO 81620.
The statement of additional information contains additional information about fund directors and officers and is available without charge, upon request, by calling 1-800-368-3863.
73
NOTES
74
Directors
Willie D. Davis
Gordon B. Greer
Stanley Kritzik
Neal Malicky
William F. Vogt
Officers
Phillip O. Peterson, President (effective January 2004)
Thomas M. Zoeller, Vice President
Richard W. Smirl, Vice President and Secretary
Christopher O. Petersen, Vice President and Assistant Secretary
Gilbert L. Southwell III, Assistant Secretary
John W. Widmer, Treasurer
Ane K. Ohm, Anti-Money Laundering Compliance Officer
Investment Advisor
Strong Capital Management, Inc.
P.O. Box 2936, Milwaukee, Wisconsin 53201
Distributor
Strong Investments, Inc.
P.O. Box 2936, Milwaukee, Wisconsin 53201
Custodian
State Street Bank and Trust Company
801 Pennsylvania Avenue, Kansas City, Missouri 64105
Transfer Agent and Dividend-Disbursing Agent
Strong Investor Services, Inc.
P.O. Box 2936, Milwaukee, Wisconsin 53201
Independent Accountants
PricewaterhouseCoopers LLP
100 East Wisconsin Avenue, Milwaukee, Wisconsin 53202
Legal Counsel
Godfrey & Kahn, S.C.
780 North Water Street, Milwaukee, Wisconsin 53202
Strong Investments
P.O. Box 2936 | Milwaukee, WI 53201
www.Strong.com
To order a free prospectus kit,
call 1-800-368-1030
To learn more about our funds, discuss an
existing account, or conduct a transaction,
call 1-800-368-3863
To receive a free copy of the policies and
procedures the funds use to determine
how to vote proxies relating to portfolio
securities, call 1-800-368-3863, or visit the
Securities and Exchange Commission’s
web site at www.sec.gov
If you are a Financial Professional,
call 1-800-368-1683
Visit our web site at
www.Strong.com
This report does not constitute an offer for the sale of securities. Strong Funds are offered for sale by prospectus only. Securities are offered through Strong Investments, Inc. RT40968 02-04
AGRO/WH2150 12-03
| Item 2. | Code of Ethics |
(a) As of the end of the period covered by this report, the registrant has adopted a code of ethics that applies to the registrant’s principal executive officer, principal financial officer, principal accounting officer or controller, or persons performing similar functions. A copy of the code of ethics is filed as an exhibit to this Form N-CSR.
(b) During the period covered by this report, no amendments were made to the provisions of the code of ethics adopted in 2(a) above.
(c) During the period covered by this report, no implicit or explicit waivers to the provisions of the code of ethics adopted in 2(a) above were granted.
| Item 3. | Audit Committee Financial Expert |
The registrant’s Board of Directors has determined that independent director Stanley Kritzik qualifies as an Audit Committee financial expert. The designation of a person as an “Audit Committee financial expert” does not mean that the person has any greater duties, obligations, or liability than those imposed on the person without the “Audit Committee financial expert” designation. Similarly, the designation of a person as an “Audit Committee financial expert” does not affect the duties, obligations, or liability of any other member of the Audit Committee or Board of Directors.
| Item 4. | Principal Accountant Fees and Services |
(a) – (d) Aggregate fees billed to the registrant for the last two fiscal years for professional services rendered by the registrant’s principal accountant were as follows:
| 2003 | ||||||||||||
Audit Fees | Audit Related | Tax Fees | Other Fees | |||||||||
Strong Large Cap Growth Fund, Inc. | $ | 24,144 | $ | — | $ | 2,119 | $ | — | ||||
| 2002 | ||||||||||||
Audit Fees | Audit Related | Tax Fees | Other Fees | |||||||||
Strong Large Cap Growth Fund, Inc. | $ | 17,266 | $ | — | $ | 3,966 | $ | — | ||||
Audit fees include amounts related to the audit of the registrant’s annual financial statements and services normally provided by the accountant in connection with statutory and regulatory filings. Audit-related fees include amounts reasonably related to the performance of the audit of the registrant’s financial statements, specifically the review of regulatory filings related to reorganizations and new share classes. Tax fees include amounts related to tax compliance, tax planning, and tax advice. Other fees include the registrant’s pro-rata share of amounts for products and services other than those reported above.
(e) (1) The Audit Committee is required to preapprove audit and non-audit services performed for the Funds by the independent auditor in order to assure that the provision of such services does not impair the auditor’s independence. The Audit Committee also is required to preapprove certain non-audit services performed by the Funds’ independent auditor for the Funds’ investment adviser and certain of the adviser’s affiliates if the services relate directly to the operations and financial reporting of the Funds. Unless a type of service to be provided by the independent auditor has received preapproval, it will require specific preapproval by the Audit Committee. Any proposed services exceeding preapproved cost levels will require separate preapproval by the Audit Committee.
Notwithstanding any provision of this Policy, the Audit Committee is not required to preapprove services for which preapproval is not required by applicable law, including de minimis services (defined as non-audit services that constitute no more than 5% of the total amount of revenues paid to the independent auditor during the year in which the services are provided) and grandfathered services.
The Audit Committee may delegate preapproval authority to one or more of its members. The member or members to whom such authority is delegated shall report any preapproval decisions to the Audit Committee at its next scheduled meeting. The Audit Committee does not delegate its responsibility to preapprove services performed by the independent auditor to management.
(2) No services included in (b) – (d) above were approved pursuant to paragraph (c)(7)(i)(C) of Rule 2-01 of Regulation S-X.
(f) Not applicable.
(g) The aggregate fees billed for the most recent fiscal year and the preceding fiscal year by the registrant’s principal accountant for non-audit services rendered to the registrant, its investment adviser, and any entity controlling, controlled by, or under common control with the investment adviser that provides ongoing services to the registrant were $254,000 and $266,000, respectively.
(h) All non-audit services rendered in (g) above were pre-approved by the registrant’s audit committee. Accordingly, these services were considered by the registrant’s audit committee in maintaining the principal accountant’s independence.
| Item 5 – 6. [Reserved] |
| Item 7. | Disclosure of Proxy Voting Policies and Procedures for Closed-End Management Investment Companies |
Not applicable to this Registrant, insofar as the Registrant is not a closed-end management investment company.
| Item 8. | [Reserved] |
| Item 9. | Controls and Procedures |
(a) An evaluation was performed within 90 days from the date hereof under the supervision of the Registrant’s management, including the principal executive officer and treasurer, regarding the effectiveness of the registrant’s disclosure controls and procedures. Based on that evaluation, it was determined that such disclosure controls and procedures provide reasonable assurance that the material information required to be disclosed by the Registrant in the reports its files or submits on Form N-CSR (1) is accumulated and communicated to the Registrant’s management, including its principal executive officer and treasurer, to allow timely decisions regarding required disclosure, and (2) is recorded, processed, summarized, and reported within the time periods specified in the Commission’s rules and forms.
(b) There were no significant changes in the Registrant’s internal controls or in other factors that could significantly affect these controls subsequent to the date of the evaluation referenced in (a) above, including any corrective actions with regard to significant deficiencies and material weaknesses.
| Item 10. | Exhibits |
The following exhibits are attached to this Form N-CSR:
| 10(a) | Code of Ethics required by Item 2 of Form N-CSR | |
| 10(b)(1) | Certification of Principal Executive Officer Required by Section 302 of the Sarbanes-Oxley Act of 2002 | |
| 10(b)(2) | Certification of Principal Financial Officer Required by Section 302 of the Sarbanes-Oxley Act of 2002 | |
| 10(c) | Certification of Chief Executive Officer and Chief Financial Officer Required by Section 906 of the Sarbanes-Oxley Act of 2002 | |
Signatures
Pursuant to the requirements of the Securities Exchange Act of 1934 and the Investment Company Act of 1940, the Registrant has duly caused this report to be signed on its behalf by the undersigned, thereunto duly authorized.
Strong Large Cap Growth Fund, Inc., on behalf of Strong Large Cap Growth Fund
| By: | /s/ Richard W. Smirl | |
| Richard W. Smirl, Vice President and Secretary | ||
Date: February 24, 2004 | ||
Pursuant to the requirements of the Securities Exchange Act of 1934 and the Investment Company Act of 1940, this report has been signed below by the following persons on behalf of the registrant and in the capacities and on the dates indicated.
| By: | /s/ Thomas M. Zoeller | |
| Thomas M. Zoeller, Principal Executive Officer | ||
Date: February 24, 2004 | ||
| By: | /s/ John W. Widmer | |
| John W. Widmer, Treasurer (Principal Financial Officer) | ||
Date: February 24, 2004 | ||