Exhibit 99.2
| Draft | 2/10/2010 |

Supplemental Schedules
Fourth Quarter 2009
| Draft | 2/10/2010 |
Page 1
Quarterly Financial Highlights
(Dollars In Thousands) |
| 4TH QTR |
| 1ST QTR |
| 2ND QTR |
| 3RD QTR |
| 4TH QTR |
| YEAR |
| |||||||||
(Unaudited) |
| 2008 |
| 2009 |
| 2009 |
| 2009 |
| 2009 |
| 2008 |
| 2009 |
| |||||||
|
|
|
|
|
|
|
|
|
|
|
|
|
|
|
| |||||||
Pre-tax Operating Income * |
|
|
|
|
|
|
|
|
|
|
|
|
|
|
| |||||||
|
|
|
|
|
|
|
|
|
|
|
|
|
|
|
| |||||||
Life Marketing |
| $ | 51,737 |
| $ | 42,510 |
| $ | 37,179 |
| $ | 26,544 |
| $ | 31,593 |
| $ | 188,535 |
| $ | 137,826 |
|
Acquisitions |
| 35,368 |
| 33,621 |
| 35,041 |
| 33,061 |
| 32,037 |
| 136,479 |
| 133,760 |
| |||||||
Annuities |
| 6,175 |
| (575 | ) | 21,495 |
| 16,075 |
| 19,647 |
| 18,707 |
| 56,642 |
| |||||||
Stable Value Products |
| 27,866 |
| 20,207 |
| 16,976 |
| 14,339 |
| 10,441 |
| 89,811 |
| 61,963 |
| |||||||
Asset Protection |
| 6,087 |
| 6,280 |
| 4,656 |
| 5,731 |
| 6,562 |
| 30,789 |
| 23,229 |
| |||||||
Corporate & Other |
| (41,747 | ) | (9,247 | ) | 9,648 |
| (22,826 | ) | 104,405 |
| (105,986 | ) | 81,980 |
| |||||||
Total Pre-tax Operating Income |
| $ | 85,486 |
| $ | 92,796 |
| $ | 124,995 |
| $ | 72,924 |
| $ | 204,685 |
| $ | 358,335 |
| $ | 495,400 |
|
|
|
|
|
|
|
|
|
|
|
|
|
|
|
|
| |||||||
Balance Sheet Data |
|
|
|
|
|
|
|
|
|
|
|
|
|
|
| |||||||
|
|
|
|
|
|
|
|
|
|
|
|
|
|
|
| |||||||
Total GAAP Assets |
| $ | 39,572,449 |
| $ | 38,760,243 |
| $ | 40,392,169 |
| $ | 41,787,606 |
| $ | 42,311,587 |
|
|
|
|
| ||
Shareowners’ Equity |
| $ | 761,095 |
| $ | 783,178 |
| $ | 1,628,375 |
| $ | 2,302,799 |
| $ | 2,478,821 |
|
|
|
|
| ||
Shareowners’ Equity (excluding accumulated other comprehensive income (loss)) ** |
| $ | 2,428,151 |
| $ | 2,443,382 |
| $ | 2,660,094 |
| $ | 2,678,271 |
| $ | 2,799,990 |
|
|
|
|
| ||
|
|
|
|
|
|
|
|
|
|
|
|
|
|
|
| |||||||
Stock Data |
|
|
|
|
|
|
|
|
|
|
|
|
|
|
| |||||||
|
|
|
|
|
|
|
|
|
|
|
|
|
|
|
| |||||||
Closing Price |
| $ | 14.35 |
| $ | 5.25 |
| $ | 11.44 |
| $ | 21.42 |
| $ | 16.55 |
|
|
|
|
| ||
Average Shares Outstanding |
|
|
|
|
|
|
|
|
|
|
|
|
|
|
| |||||||
Basic |
| 71,122,593 |
| 70,850,571 |
| 77,893,480 |
| 86,481,240 |
| 86,491,754 |
| 71,108,961 |
| 80,488,694 |
| |||||||
Diluted |
| 71,122,593 |
| 71,392,134 |
| 78,528,511 |
| 87,372,659 |
| 87,459,899 |
| 71,108,961 |
| 81,249,265 |
| |||||||
* “Pre-tax Operating Income” is a non-GAAP financial measure. “Income (loss) Before Income Tax” is a GAAP financial measure to which “Pre-tax Operating Income” may be compared.
See Page 6 for a reconciliation of “Pre-tax Operating Income” to “Income (loss) Before Income Tax”.
** “Shareowners’ equity excluding accumulated other comprehensive income (loss)” is a non-GAAP financial measure. “Shareowners’ equity” is a GAAP financial measure to which “Shareowners’ equity excluding accumulated other comprehensive income (loss)” may be compared.
See Page 5 for a reconciliation of “Shareowners’ equity excluding accumulated other comprehensive income (loss)” to “Shareowners’ equity”.
| Draft | 2/10/2010 |
Page 2
Financial Strength Ratings as of December 31, 2009
|
| A.M. Best |
| Fitch |
| Standard & Poor’s |
| Moody’s |
|
Legal Entity |
|
|
|
|
|
|
|
|
|
|
|
|
|
|
|
|
|
|
|
Insurance companies: |
|
|
|
|
|
|
|
|
|
Protective Life Insurance Company |
| A+ |
| A |
| AA- |
| A2 |
|
West Coast Life Insurance Company |
| A+ |
| A |
| AA- |
| A2 |
|
Protective Life and Annuity Insurance Company |
| A+ |
| A |
| AA- |
| — |
|
Lyndon Property Insurance Company |
| A- |
| — |
| — |
| — |
|
Credit Ratings as of December 31, 2009
|
| A.M. Best |
| Fitch |
| Standard & Poor’s |
| Moody’s |
|
|
|
|
|
|
|
|
|
|
|
Legal Entity |
|
|
|
|
|
|
|
|
|
Protective Life Corporation |
| a- |
| BBB+/BBB (1) |
| A- |
| Baa2 |
|
Protective Life Insurance Company |
| aa- |
| — |
| AA- |
| — |
|
(1) The default rating is BBB+. The BBB rating is related to our senior notes.
| Draft | 2/10/2010 |
Page 3
GAAP Consolidated Statements of Income (Loss)
(Dollars In Thousands) |
| 4TH QTR |
| 1ST QTR |
| 2ND QTR |
| 3RD QTR |
| 4TH QTR |
| YEAR |
| |||||||||
(Unaudited) |
| 2008 |
| 2009 |
| 2009 |
| 2009 |
| 2009 |
| 2008 |
| 2009 |
| |||||||
|
|
|
|
|
|
|
|
|
|
|
|
|
|
|
| |||||||
REVENUES |
|
|
|
|
|
|
|
|
|
|
|
|
|
|
| |||||||
Gross Premiums and Policy Fees |
| $ | 686,812 |
| $ | 659,152 |
| $ | 679,989 |
| $ | 652,497 |
| $ | 698,061 |
| $ | 2,692,553 |
| $ | 2,689,699 |
|
Reinsurance Ceded |
| (421,230 | ) | (358,299 | ) | (394,225 | ) | (351,664 | ) | (422,865 | ) | (1,582,810 | ) | (1,527,053 | ) | |||||||
Net Premiums and Policy Fees |
| 265,582 |
| 300,853 |
| 285,764 |
| 300,833 |
| 275,196 |
| 1,109,743 |
| 1,162,646 |
| |||||||
Net investment income |
| 404,236 |
| 421,685 |
| 431,144 |
| 409,956 |
| 402,251 |
| 1,675,164 |
| 1,665,036 |
| |||||||
RIGL - Derivatives |
| (38,764 | ) | 92,433 |
| (97,991 | ) | (195,540 | ) | 23,145 |
| 116,657 |
| (177,953 | ) | |||||||
RIGL - All Other Investments |
| (63,766 | ) | (41,843 | ) | 167,799 |
| 165,576 |
| 8,662 |
| (272,694 | ) | 300,194 |
| |||||||
|
|
|
|
|
|
|
|
|
|
|
|
|
|
|
| |||||||
OTTI losses |
| (29,168 | ) | (117,314 | ) | (48,877 | ) | (14,873 | ) | (46,706 | ) | (311,798 | ) | (227,770 | ) | |||||||
OTTI losses/(gains) recognized in OCI (before taxes) |
| — |
| 27,488 |
| 7,906 |
| (16,095 | ) | 28,426 |
| — |
| 47,725 |
| |||||||
Net OTTI losses recognized in earnings |
| (29,168 | ) | (89,826 | ) | (40,971 | ) | (30,968 | ) | (18,280 | ) | (311,798 | ) | (180,045 | ) | |||||||
|
|
|
|
|
|
|
|
|
|
|
|
|
|
|
| |||||||
Other income |
| 47,057 |
| 38,663 |
| 39,586 |
| 41,222 |
| 178,677 |
| 188,492 |
| 298,148 |
| |||||||
Total Revenues |
| 585,177 |
| 721,965 |
| 785,331 |
| 691,079 |
| 869,651 |
| 2,505,564 |
| 3,068,026 |
| |||||||
|
|
|
|
|
|
|
|
|
|
|
|
|
|
|
| |||||||
BENEFITS & EXPENSES |
|
|
|
|
|
|
|
|
|
|
|
|
|
|
| |||||||
Benefits and settlement expenses |
| 475,682 |
| 504,359 |
| 478,148 |
| 521,218 |
| 474,254 |
| 1,976,541 |
| 1,977,979 |
| |||||||
Amortization of deferred policy acquisition costs and value of businesses acquired |
| 54,591 |
| 113,648 |
| 89,949 |
| 47,240 |
| 94,732 |
| 233,742 |
| 345,569 |
| |||||||
Other operating expenses |
| 47,120 |
| 46,671 |
| 49,647 |
| 54,459 |
| 62,832 |
| 233,180 |
| 213,609 |
| |||||||
Interest on indebtedness - subsidiaries |
| 14,698 |
| 7,991 |
| 10,782 |
| 9,615 |
| 2,469 |
| 67,475 |
| 30,857 |
| |||||||
Interest on indebtedness - holding company - other debt |
| 9,942 |
| 7,740 |
| 7,186 |
| 7,510 |
| 23,195 |
| 32,153 |
| 45,631 |
| |||||||
Interest on indebtedness - holding company - hybrid securities |
| 9,401 |
| 9,400 |
| 9,401 |
| 9,401 |
| 9,401 |
| 37,604 |
| 37,603 |
| |||||||
Total Benefits and Expenses |
| 611,434 |
| 689,809 |
| 645,113 |
| 649,443 |
| 666,883 |
| 2,580,695 |
| 2,651,248 |
| |||||||
|
|
|
|
|
|
|
|
|
|
|
|
|
|
|
| |||||||
INCOME (LOSS) BEFORE INCOME TAX |
| (26,257 | ) | 32,156 |
| 140,218 |
| 41,636 |
| 202,768 |
| (75,131 | ) | 416,778 |
| |||||||
Income tax expense (benefit) |
| (10,344 | ) | 10,021 |
| 49,461 |
| 14,051 |
| 71,757 |
| (33,276 | ) | 145,290 |
| |||||||
NET INCOME (LOSS) |
| $ | (15,913 | ) | $ | 22,135 |
| $ | 90,757 |
| $ | 27,585 |
| $ | 131,011 |
| $ | (41,855 | ) | $ | 271,488 |
|
|
|
|
|
|
|
|
|
|
|
|
|
|
|
|
| |||||||
PER SHARE DATA FOR QUARTER |
|
|
|
|
|
|
|
|
|
|
|
|
|
|
| |||||||
Operating income-diluted * |
| $ | 0.80 |
| $ | 0.86 |
| $ | 1.03 |
| $ | 0.55 |
| $ | 1.51 |
|
|
|
|
| ||
RIGL - Derivatives net of gains related to corp debt, investments and annuities |
| (0.15 | ) | 0.65 |
| (0.93 | ) | (1.24 | ) | 0.03 |
|
|
|
|
| |||||||
RIGL - All Other Investments, net of participating income |
| (0.87 | ) | (1.20 | ) | 1.06 |
| 1.01 |
| (0.04 | ) |
|
|
|
| |||||||
Net income (loss)-diluted |
| $ | (0.22 | ) | $ | 0.31 |
| $ | 1.16 |
| $ | 0.32 |
| $ | 1.50 |
|
|
|
|
| ||
Average shares outstanding-diluted |
| 71,122,593 |
| 71,392,134 |
| 78,528,511 |
| 87,372,659 |
| 87,459,899 |
|
|
|
|
| |||||||
Dividends paid |
| $ | 0.12 |
| $ | 0.12 |
| $ | 0.12 |
| $ | 0.12 |
| $ | 0.12 |
|
|
|
|
| ||
|
|
|
|
|
|
|
|
|
|
|
|
|
|
|
|
|
|
|
|
| ||
PER SHARE DATA FOR YTD |
|
|
|
|
|
|
|
|
|
|
|
|
|
|
| |||||||
Operating income-diluted * |
| $ | 3.37 |
| $ | 0.86 |
| $ | 1.90 |
| $ | 2.40 |
| $ | 3.97 |
|
|
|
|
| ||
RIGL - Derivatives net of gains related to corp debt, investments and annuities |
| 1.39 |
| 0.65 |
| (0.36 | ) | (1.71 | ) | (1.63 | ) |
|
|
|
| |||||||
RIGL - All Other Investments, net of participating income |
| (5.35 | ) | (1.20 | ) | (0.03 | ) | 1.08 |
| 1.00 |
|
|
|
|
| |||||||
Net income (loss)-diluted |
| $ | (0.59 | ) | $ | 0.31 |
| $ | 1.51 |
| $ | 1.77 |
| $ | 3.34 |
|
|
|
|
| ||
Average shares outstanding-diluted |
| 71,108,961 |
| 71,392,134 |
| 74,980,036 |
| 79,156,305 |
| 81,249,265 |
|
|
|
|
| |||||||
Dividends paid |
| $ | 0.82 |
| $ | 0.12 |
| $ | 0.24 |
| $ | 0.36 |
| $ | 0.48 |
|
|
|
|
| ||
* “Operating Income” is a non-GAAP financial measure. “Net Income (loss)” is a GAAP financial measure to which “Operating Income” may be compared.
| Draft | 2/10/2010 |
Page 4
GAAP Consolidated Balance Sheets
(Dollars In Thousands) |
| 4TH QTR |
| 1ST QTR |
| 2ND QTR |
| 3RD QTR |
| 4TH QTR |
| |||||
(Unaudited) |
| 2008 |
| 2009 |
| 2009 |
| 2009 |
| 2009 |
| |||||
|
|
|
|
|
|
|
|
|
|
|
| |||||
ASSETS |
|
|
|
|
|
|
|
|
|
|
| |||||
|
|
|
|
|
|
|
|
|
|
|
| |||||
Fixed maturities |
| $ | 20,098,980 |
| $ | 19,571,798 |
| $ | 20,561,840 |
| $ | 22,560,159 |
| $ | 22,830,427 |
|
Equity securities |
| 302,132 |
| 268,211 |
| 269,108 |
| 270,057 |
| 275,497 |
| |||||
Mortgage loans |
| 3,848,288 |
| 3,858,573 |
| 3,846,417 |
| 3,849,349 |
| 3,877,087 |
| |||||
Investment real estate |
| 14,810 |
| 14,769 |
| 17,427 |
| 19,651 |
| 25,188 |
| |||||
Policy loans |
| 810,933 |
| 800,617 |
| 792,853 |
| 788,402 |
| 794,276 |
| |||||
Other long-term investments |
| 432,137 |
| 451,847 |
| 346,037 |
| 232,927 |
| 204,754 |
| |||||
Long-term investments |
| 25,507,280 |
| 24,965,815 |
| 25,833,682 |
| 27,720,545 |
| 28,007,229 |
| |||||
Short-term investments |
| 1,059,506 |
| 845,558 |
| 1,841,149 |
| 1,076,621 |
| 1,049,609 |
| |||||
Total investments |
| 26,566,786 |
| 25,811,373 |
| 27,674,831 |
| 28,797,166 |
| 29,056,838 |
| |||||
Cash |
| 149,358 |
| 180,648 |
| 206,540 |
| 225,302 |
| 205,325 |
| |||||
Accrued investment income |
| 287,543 |
| 286,363 |
| 270,698 |
| 283,559 |
| 285,350 |
| |||||
Accounts and premiums receivable |
| 55,017 |
| 59,867 |
| 90,237 |
| 113,847 |
| 56,216 |
| |||||
Reinsurance receivable |
| 5,254,788 |
| 5,273,817 |
| 5,309,360 |
| 5,336,371 |
| 5,333,401 |
| |||||
Deferred policy acquisition costs and value of businesses acquired |
| 4,200,321 |
| 4,243,218 |
| 3,900,088 |
| 3,660,267 |
| 3,663,350 |
| |||||
Goodwill |
| 120,954 |
| 120,179 |
| 119,405 |
| 118,630 |
| 117,856 |
| |||||
Property and equipment, net |
| 39,707 |
| 37,795 |
| 38,401 |
| 38,031 |
| 37,037 |
| |||||
Other assets |
| 174,035 |
| 174,777 |
| 196,235 |
| 172,002 |
| 176,303 |
| |||||
Current/Deferred income tax |
| 453,526 |
| 440,110 |
| 69,004 |
| 47,358 |
| 115,447 |
| |||||
Assets related to separate accounts |
|
|
|
|
|
|
|
|
|
|
| |||||
Variable annuity |
| 2,027,470 |
| 1,907,272 |
| 2,257,859 |
| 2,694,715 |
| 2,948,457 |
| |||||
Variable universal life |
| 242,944 |
| 224,824 |
| 259,511 |
| 300,358 |
| 316,007 |
| |||||
|
|
|
|
|
|
|
|
|
|
|
| |||||
TOTAL ASSETS |
| $ | 39,572,449 |
| $ | 38,760,243 |
| $ | 40,392,169 |
| $ | 41,787,606 |
| $ | 42,311,587 |
|
| Draft | 2/10/2010 |
Page 5
GAAP Consolidated Balance Sheets - Continued
(Dollars In Thousands) |
| 4TH QTR |
| 1ST QTR |
| 2ND QTR |
| 3RD QTR |
| 4TH QTR |
| |||||
(Unaudited) |
| 2008 |
| 2009 |
| 2009 |
| 2009 |
| 2009 |
| |||||
|
|
|
|
|
|
|
|
|
|
|
| |||||
LIABILITIES |
|
|
|
|
|
|
|
|
|
|
| |||||
Policy liabilities and accruals |
|
|
|
|
|
|
|
|
|
|
| |||||
Future policy benefits and claims |
| $ | 17,008,524 |
| $ | 17,118,094 |
| $ | 17,169,737 |
| $ | 17,220,814 |
| $ | 17,327,279 |
|
Unearned premiums |
| 1,251,855 |
| 1,230,108 |
| 1,221,101 |
| 1,231,165 |
| 1,220,988 |
| |||||
Stable value product deposits |
| 4,960,405 |
| 4,360,658 |
| 4,138,131 |
| 3,863,329 |
| 3,581,150 |
| |||||
Annuity deposits |
| 9,357,427 |
| 9,316,791 |
| 9,596,476 |
| 9,726,082 |
| 9,911,040 |
| |||||
Other policyholders’ funds |
| 421,313 |
| 443,173 |
| 473,105 |
| 491,216 |
| 515,078 |
| |||||
Other liabilities |
| 926,821 |
| 719,550 |
| 922,242 |
| 852,449 |
| 715,110 |
| |||||
Deferred income taxes |
| — |
| — |
| 36,037 |
| 400,084 |
| 553,062 |
| |||||
Non-recourse funding obligations |
| 1,375,000 |
| 1,375,000 |
| 1,375,000 |
| 1,375,000 |
| 575,000 |
| |||||
Debt |
| 714,852 |
| 756,852 |
| 789,852 |
| 804,852 |
| 1,644,852 |
| |||||
Subordinated Debt Securities |
| 524,743 |
| 524,743 |
| 524,743 |
| 524,743 |
| 524,743 |
| |||||
Liabilities related to separate accounts |
|
|
|
|
|
|
|
|
|
|
| |||||
Variable annuity |
| 2,027,470 |
| 1,907,272 |
| 2,257,859 |
| 2,694,715 |
| 2,948,457 |
| |||||
Variable universal life |
| 242,944 |
| 224,824 |
| 259,511 |
| 300,358 |
| 316,007 |
| |||||
TOTAL LIABILITIES |
| 38,811,354 |
| 37,977,065 |
| 38,763,794 |
| 39,484,807 |
| 39,832,766 |
| |||||
|
|
|
|
|
|
|
|
|
|
|
| |||||
SHAREOWNERS’ EQUITY |
|
|
|
|
|
|
|
|
|
|
| |||||
Common stock |
| 36,626 |
| 36,626 |
| 44,388 |
| 44,388 |
| 44,388 |
| |||||
Additional paid-in-capital |
| 448,481 |
| 449,009 |
| 575,064 |
| 575,915 |
| 576,887 |
| |||||
Treasury stock |
| (26,978 | ) | (26,490 | ) | (25,945 | ) | (25,936 | ) | (25,929 | ) | |||||
Cumulative effect adjustments |
| 3,616 |
| 3,616 |
| 3,616 |
| 3,616 |
| 3,616 |
| |||||
Unallocated ESOP shares |
| (474 | ) | — |
| — |
| — |
| — |
| |||||
Retained earnings |
| 1,966,880 |
| 1,980,621 |
| 2,062,971 |
| 2,080,288 |
| 2,201,028 |
| |||||
Accumulated other comprehensive income (loss) |
| (1,667,056 | ) | (1,660,204 | ) | (1,031,719 | ) | (375,472 | ) | (321,169 | ) | |||||
TOTAL SHAREOWNERS’ EQUITY |
| 761,095 |
| 783,178 |
| 1,628,375 |
| 2,302,799 |
| 2,478,821 |
| |||||
TOTAL LIABILITIES AND SHAREOWNERS’ EQUITY |
| $ | 39,572,449 |
| $ | 38,760,243 |
| $ | 40,392,169 |
| $ | 41,787,606 |
| $ | 42,311,587 |
|
|
|
|
|
|
|
|
|
|
|
|
| |||||
SHAREOWNERS’ EQUITY PER SHARE |
|
|
|
|
|
|
|
|
|
|
| |||||
Total Shareowners’ Equity |
| $ | 10.89 |
| $ | 11.19 |
| $ | 19.03 |
| $ | 26.91 |
| $ | 28.96 |
|
Less: Accumulated other comprehensive income (loss) |
| (23.85 | ) | (23.72 | ) | (12.05 | ) | (4.39 | ) | (3.76 | ) | |||||
Excluding accumulated other comprehensive income (loss)* |
| $ | 34.74 |
| $ | 34.91 |
| $ | 31.08 |
| $ | 31.30 |
| $ | 32.72 |
|
|
|
|
|
|
|
|
|
|
|
|
| |||||
Total Shareowners’ Equity |
| $ | 761,095 |
| $ | 783,178 |
| $ | 1,628,375 |
| $ | 2,302,799 |
| $ | 2,478,821 |
|
Less: Accumulated other comprehensive income (loss) |
| (1,667,056 | ) | (1,660,204 | ) | (1,031,719 | ) | (375,472 | ) | (321,169 | ) | |||||
Shareowners’ Equity (excluding accumulated other comprehensive income (loss)) * |
| $ | 2,428,151 |
| $ | 2,443,382 |
| $ | 2,660,094 |
| $ | 2,678,271 |
| $ | 2,799,990 |
|
|
|
|
|
|
|
|
|
|
|
|
| |||||
Common shares outstanding |
| 69,905,807 |
| 69,986,429 |
| 85,578,907 |
| 85,579,870 |
| 85,580,803 |
| |||||
Treasury Stock shares |
| 3,346,153 |
| 3,265,531 |
| 3,198,053 |
| 3,197,090 |
| 3,196,157 |
| |||||
* “Shareowners’ equity” excluding accumulated other comprehensive income (loss)” is a non-GAAP financial measure. “Shareowners’ equity” is a GAAP financial measure to which “Shareowners’ equity excluding accumulated other comprehensive income (loss)” may be compared.
| Draft | 2/10/2010 |
Page 6
Calculation of Operating Earnings (Loss) Per Share
(Dollars In Thousands) |
| 4TH QTR |
| 1ST QTR |
| 2ND QTR |
| 3RD QTR |
| 4TH QTR |
| YEAR |
| |||||||||
(Unaudited) |
| 2008 |
| 2009 |
| 2009 |
| 2009 |
| 2009 |
| 2008 |
| 2009 |
| |||||||
|
|
|
|
|
|
|
|
|
|
|
|
|
|
|
| |||||||
CALCULATION OF NET INCOME (LOSS) PER SHARE |
|
|
|
|
|
|
|
|
|
|
|
|
|
|
| |||||||
|
|
|
|
|
|
|
|
|
|
|
|
|
|
|
| |||||||
Net income (loss) |
| $ | (15,913 | ) | $ | 22,135 |
| $ | 90,757 |
| $ | 27,585 |
| $ | 131,011 |
| $ | (41,855 | ) | $ | 271,488 |
|
|
|
|
|
|
|
|
|
|
|
|
|
|
|
|
| |||||||
Average shares outstanding-basic |
| 71,122,593 |
| 70,850,571 |
| 77,893,480 |
| 86,481,240 |
| 86,491,754 |
| 71,108,961 |
| 80,488,694 |
| |||||||
Average shares outstanding-diluted |
| 71,122,593 |
| 71,392,134 |
| 78,528,511 |
| 87,372,659 |
| 87,459,899 |
| 71,108,961 |
| 81,249,265 |
| |||||||
|
|
|
|
|
|
|
|
|
|
|
|
|
|
|
| |||||||
Net income (loss) per share-basic |
| $ | (0.22 | ) | $ | 0.31 |
| $ | 1.17 |
| $ | 0.32 |
| $ | 1.51 |
| $ | (0.59 | ) | $ | 3.37 |
|
Net income (loss) per share-diluted |
| $ | (0.22 | ) | $ | 0.31 |
| $ | 1.16 |
| $ | 0.32 |
| $ | 1.50 |
| $ | (0.59 | ) | $ | 3.34 |
|
|
|
|
|
|
|
|
|
|
|
|
|
|
|
|
| |||||||
Income (loss) from continuing operations |
| $ | (15,913 | ) | $ | 22,135 |
| $ | 90,757 |
| $ | 27,585 |
| $ | 131,011 |
| $ | (41,855 | ) | $ | 271,488 |
|
|
|
|
|
|
|
|
|
|
|
|
|
|
|
|
| |||||||
EPS (basic) |
| $ | (0.22 | ) | $ | 0.31 |
| $ | 1.17 |
| $ | 0.32 |
| $ | 1.51 |
| $ | (0.59 | ) | $ | 3.37 |
|
EPS (diluted) |
| $ | (0.22 | ) | $ | 0.31 |
| $ | 1.16 |
| $ | 0.32 |
| $ | 1.50 |
| $ | (0.59 | ) | $ | 3.34 |
|
|
|
|
|
|
|
|
|
|
|
|
|
|
|
|
| |||||||
CALCULATION OF REALIZED INVESTMENT GAINS (LOSSES) PER SHARE |
|
|
|
|
|
|
|
|
|
|
|
|
|
|
| |||||||
|
|
|
|
|
|
|
|
|
|
|
|
|
|
|
| |||||||
RIGL - Derivatives |
| $ | (38,764 | ) | $ | 92,433 |
| $ | (97,991 | ) | $ | (195,540 | ) | $ | 23,145 |
| $ | 116,657 |
| $ | (177,953 | ) |
Derivative Gains related to Corporate Debt and Investments |
| (1,569 | ) | (2,238 | ) | (1,163 | ) | — |
| — |
| (5,754 | ) | (3,401 | ) | |||||||
Derivative Gains related to Annuities |
| 22,496 |
| (19,088 | ) | (13,393 | ) | 28,864 |
| (19,003 | ) | 40,971 |
| (22,620 | ) | |||||||
RIGL - All Other Investments, net of participating income |
| (92,934 | ) | (131,669 | ) | 126,828 |
| 134,608 |
| (9,618 | ) | (584,492 | ) | 120,149 |
| |||||||
Related amortization of DAC & VOBA |
| (972 | ) | (78 | ) | 942 |
| 780 |
| 3,559 |
| (848 | ) | 5,203 |
| |||||||
|
| (111,743 | ) | (60,640 | ) | 15,223 |
| (31,288 | ) | (1,917 | ) | (433,466 | ) | (78,622 | ) | |||||||
Tax effect |
| 39,110 |
| 21,224 |
| (5,328 | ) | 10,951 |
| 671 |
| 151,713 |
| 27,518 |
| |||||||
|
| $ | (72,633 | ) | $ | (39,416 | ) | $ | 9,895 |
| $ | (20,337 | ) | $ | (1,246 | ) | $ | (281,753 | ) | $ | (51,104 | ) |
|
|
|
|
|
|
|
|
|
|
|
|
|
|
|
| |||||||
RIGL - Derivatives per share-diluted |
| $ | (0.15 | ) | $ | 0.65 |
| $ | (0.93 | ) | $ | (1.24 | ) | $ | 0.03 |
| $ | 1.39 |
| $ | (1.63 | ) |
RIGL - All Other Investments per share-diluted |
| $ | (0.87 | ) | $ | (1.20 | ) | $ | 1.06 |
| $ | 1.01 |
| $ | (0.04 | ) | $ | (5.35 | ) | $ | 1.00 |
|
|
|
|
|
|
|
|
|
|
|
|
|
|
|
|
| |||||||
OPERATING INCOME (LOSS) PER SHARE * |
|
|
|
|
|
|
|
|
|
|
|
|
|
|
| |||||||
|
|
|
|
|
|
|
|
|
|
|
|
|
|
|
| |||||||
Net income (loss) per share-diluted |
| $ | (0.22 | ) | $ | 0.31 |
| $ | 1.16 |
| $ | 0.32 |
| $ | 1.50 |
| $ | (0.59 | ) | $ | 3.34 |
|
RIGL - Derivatives per share-diluted |
| (0.15 | ) | 0.65 |
| (0.93 | ) | (1.24 | ) | 0.03 |
| 1.39 |
| (1.63 | ) | |||||||
RIGL - All Other Investments, net of participating income per share-diluted |
| (0.87 | ) | (1.20 | ) | 1.06 |
| 1.01 |
| (0.04 | ) | (5.35 | ) | 1.00 |
| |||||||
Operating income per share-diluted |
| $ | 0.80 |
| $ | 0.86 |
| $ | 1.03 |
| $ | 0.55 |
| $ | 1.51 |
| $ | 3.37 |
| $ | 3.97 |
|
|
|
|
|
|
|
|
|
|
|
|
|
|
|
|
| |||||||
NET OPERATING INCOME (LOSS) * |
|
|
|
|
|
|
|
|
|
|
|
|
|
|
| |||||||
|
|
|
|
|
|
|
|
|
|
|
|
|
|
|
| |||||||
Net income (loss) |
| $ | (15,913 | ) | $ | 22,135 |
| $ | 90,757 |
| $ | 27,585 |
| $ | 131,011 |
| $ | (41,855 | ) | $ | 271,488 |
|
Less: RIGL - Derivatives net of tax & gains related to corp debt, investments & annuities |
| (11,594 | ) | 46,220 |
| (73,156 | ) | (108,339 | ) | 2,692 |
| 98,718 |
| (132,583 | ) | |||||||
Less: RIGL - All Other Investments net of tax, amortization, and participating income |
| (61,039 | ) | (85,636 | ) | 83,051 |
| 88,002 |
| (3,938 | ) | (380,471 | ) | 81,479 |
| |||||||
Net operating income |
| $ | 56,720 |
| $ | 61,551 |
| $ | 80,862 |
| $ | 47,922 |
| $ | 132,257 |
| $ | 239,898 |
| $ | 322,592 |
|
|
|
|
|
|
|
|
|
|
|
|
|
|
|
|
| |||||||
PRE-TAX OPERATING INCOME (LOSS) ** |
|
|
|
|
|
|
|
|
|
|
|
|
|
|
| |||||||
|
|
|
|
|
|
|
|
|
|
|
|
|
|
|
| |||||||
Income (loss) before income tax and discontinued operations |
| $ | (26,257 | ) | $ | 32,156 |
| $ | 140,218 |
| $ | 41,636 |
| $ | 202,768 |
| $ | (75,131 | ) | $ | 416,778 |
|
Less: RIGL - Derivatives |
| (38,764 | ) | 92,433 |
| (97,991 | ) | (195,540 | ) | 23,145 |
| 116,657 |
| (177,953 | ) | |||||||
Less: Derivative gains related to corporate debt, investments & annuities |
| 20,927 |
| (21,326 | ) | (14,556 | ) | 28,864 |
| (19,003 | ) | 35,217 |
| (26,021 | ) | |||||||
Less: RIGL - All Other Investments, net of participating income |
| (92,934 | ) | (131,669 | ) | 126,828 |
| 134,608 |
| (9,618 | ) | (584,492 | ) | 120,149 |
| |||||||
Less: Related amortization of DAC & VOBA |
| (972 | ) | (78 | ) | 942 |
| 780 |
| 3,559 |
| (848 | ) | 5,203 |
| |||||||
Pre-tax operating income |
| $ | 85,486 |
| $ | 92,796 |
| $ | 124,995 |
| $ | 72,924 |
| $ | 204,685 |
| $ | 358,335 |
| $ | 495,400 |
|
* “Net Operating Income (Loss)” and “Operating Income (Loss) Per Share” are non-GAAP financial measures. “Net Income (Loss)” and “Net Income (Loss) Per Share” are GAAP financial measures to which “Net Operating Income (Loss)” and “Operating Income (Loss) Per Share” may be compared.
** “Pre-tax Operating Income (Loss)” is a non-GAAP financial measure. “Income (Loss) Before Income Tax” is a GAAP financial measure to which “Pre-tax Operating Income (Loss)” may be compared.
| Draft | 2/10/2010 |
Page 7
Invested Asset Summary
(Dollars In Millions) |
| 4TH QTR |
| 1ST QTR |
| 2ND QTR |
| 3RD QTR |
| 4TH QTR |
|
|
| |||||
(Unaudited) |
| 2008 |
| 2009 |
| 2009 |
| 2009 |
| 2009 |
|
|
| |||||
|
|
|
|
|
|
|
|
|
|
|
|
|
| |||||
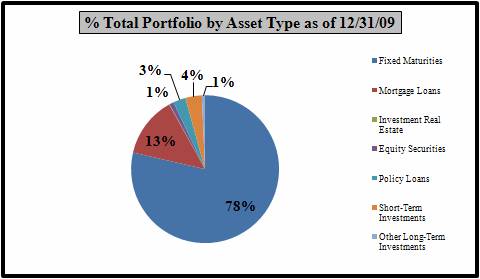
Total Portfolio |
|
|
|
|
|
|
|
|
|
|
|
|
| |||||
|
|
|
|
|
|
|
|
|
|
|
|
|
| |||||
Fixed Maturities |
| $ | 20,099.0 |
| $ | 19,571.8 |
| $ | 20,561.8 |
| $ | 22,560.2 |
| $ | 22,830.4 |
| 78 | % |
Mortgage Loans |
| 3,848.3 |
| 3,858.6 |
| 3,846.4 |
| 3,849.3 |
| 3,877.1 |
| 13 | % | |||||
Investment Real Estate |
| 14.8 |
| 14.8 |
| 17.4 |
| 19.7 |
| 25.2 |
| 0 | % | |||||
Equity Securities |
| 302.1 | �� | 268.2 |
| 269.1 |
| 270.1 |
| 275.5 |
| 1 | % | |||||
Policy Loans |
| 810.9 |
| 800.6 |
| 792.9 |
| 788.4 |
| 794.3 |
| 3 | % | |||||
Short-Term Investments |
| 1,059.5 |
| 845.6 |
| 1,841.2 |
| 1,076.6 |
| 1,049.6 |
| 4 | % | |||||
Other Long-Term Investments |
| 432.1 |
| 451.8 |
| 346.0 |
| 232.9 |
| 204.7 |
| 1 | % | |||||
Total Invested Assets |
| $ | 26,566.7 |
| $ | 25,811.4 |
| $ | 27,674.8 |
| $ | 28,797.2 |
| $ | 29,056.8 |
| 100 | % |
| Draft | 2/10/2010 |
Page 8
Invested Asset Summary - Fixed Income
(Dollars In Millions) |
| 4TH QTR |
| 1ST QTR |
| 2ND QTR |
| 3RD QTR |
| 4TH QTR |
|
|
| |||||
(Unaudited) |
| 2008 |
| 2009 |
| 2009 |
| 2009 |
| 2009 |
|
|
| |||||
|
|
|
|
|
|
|
|
|
|
|
|
|
| |||||
Fixed Income |
|
|
|
|
|
|
|
|
|
|
|
|
| |||||
|
|
|
|
|
|
|
|
|
|
|
|
|
| |||||
Corporate Bonds |
| $ | 12,076.6 |
| $ | 11,637.1 |
| $ | 12,842.6 |
| $ | 14,419.5 |
| $ | 14,847.8 |
| 65 | % |
Residential Mortgage-Backed Securities |
| 5,013.4 |
| 4,768.5 |
| 4,343.0 |
| 4,153.7 |
| 3,917.5 |
| 17 | % | |||||
Commercial Mortgage-Backed Securities |
| 1,182.1 |
| 1,161.4 |
| 1,106.3 |
| 1,108.5 |
| 1,124.3 |
| 5 | % | |||||
Asset-Backed Securities |
| 1,102.1 |
| 1,163.9 |
| 1,175.6 |
| 1,176.9 |
| 1,120.8 |
| 5 | % | |||||
U.S. Government-related Bonds |
| 534.7 |
| 495.5 |
| 498.9 |
| 889.4 |
| 811.3 |
| 3 | % | |||||
Other Government-related Bonds |
| 160.3 |
| 315.3 |
| 409.0 |
| 538.5 |
| 608.5 |
| 3 | % | |||||
States, Municipals and Political Subdivisions |
| 29.8 |
| 30.1 |
| 186.4 |
| 273.7 |
| 400.2 |
| 2 | % | |||||
Total Fixed Income Portfolio |
| $ | 20,099.0 |
| $ | 19,571.8 |
| $ | 20,561.8 |
| $ | 22,560.2 |
| $ | 22,830.4 |
| 100 | % |
|
|
|
|
|
|
|
|
|
|
|
|
|
| |||||
Fixed Income - Quality |
|
|
|
|
|
|
|
|
|
|
|
|
| |||||
|
|
|
|
|
|
|
|
|
|
|
|
|
| |||||
AAA |
| 35.2 | % | 33.7 | % | 24.2 | % | 22.5 | % | 19.9 | % |
|
| |||||
AA |
| 6.6 | % | 6.1 | % | 6.7 | % | 6.1 | % | 4.9 | % |
|
| |||||
A |
| 19.8 | % | 19.0 | % | 20.2 | % | 20.1 | % | 18.7 | % |
|
| |||||
BBB |
| 33.0 | % | 33.6 | % | 36.0 | % | 38.3 | % | 42.9 | % |
|
| |||||
Below investment grade |
| 5.4 | % | 7.6 | % | 12.9 | % | 13.0 | % | 13.6 | % |
|
| |||||
|
| 100.0 | % | 100.0 | % | 100.0 | % | 100.0 | % | 100.0 | % |
|
| |||||
Note: Prior periods restated to be consistent with current quarter presentation.

| Draft | 2/10/2010 |
Page 9
Invested Asset Summary - Mortgages
(Dollars In Millions) |
| 4TH QTR |
| 1ST QTR |
| 2ND QTR |
| 3RD QTR |
| 4TH QTR |
| |||||
(Unaudited) |
| 2008 |
| 2009 |
| 2009 |
| 2009 |
| 2009 |
| |||||
|
|
|
|
|
|
|
|
|
|
|
| |||||
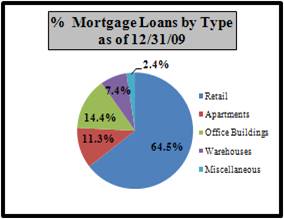
Mortgage Loans - Type |
|
|
|
|
|
|
|
|
|
|
| |||||
|
|
|
|
|
|
|
|
|
|
|
| |||||
Retail |
| 65.2 | % | 64.8 | % | 64.6 | % | 64.7 | % | 64.5 | % | |||||
Apartments |
| 10.1 | % | 10.7 | % | 10.7 | % | 10.5 | % | 11.3 | % | |||||
Office Buildings |
| 14.3 | % | 14.4 | % | 14.4 | % | 14.6 | % | 14.4 | % | |||||
Warehouses |
| 7.9 | % | 7.7 | % | 7.8 | % | 7.8 | % | 7.4 | % | |||||
Miscellaneous |
| 2.5 | % | 2.4 | % | 2.5 | % | 2.4 | % | 2.4 | % | |||||
|
| 100.0 | % | 100.0 | % | 100.0 | % | 100.0 | % | 100.0 | % | |||||
|
|
|
|
|
|
|
|
|
|
|
| |||||
Problem Mortgage Loans |
|
|
|
|
|
|
|
|
|
|
| |||||
|
|
|
|
|
|
|
|
|
|
|
| |||||
60 Days Past Due |
| $ | — |
| $ | 0.7 |
| $ | 4.0 |
| $ | 14.3 |
| $ | 5.9 |
|
90 Days Past Due |
| 7.4 |
| 10.7 |
| 8.8 |
| 7.1 |
| 6.5 |
| |||||
Renegotiated Loans |
| — |
| — |
| — |
| — |
| — |
| |||||
Foreclosed Real Estate |
| 7.8 |
| — |
| 2.7 |
| 5.0 |
| 10.7 |
| |||||
|
| $ | 15.2 |
| $ | 11.4 |
| $ | 15.5 |
| $ | 26.4 |
| $ | 23.1 |
|
| Draft | 2/10/2010 |
Page 10
Invested Asset Summary - Trading Portfolios
(Dollars In Millions) |
| 4TH QTR |
| 1ST QTR |
| 2ND QTR |
| 3RD QTR |
| 4TH QTR |
| |||||
(Unaudited) |
| 2008 |
| 2009 |
| 2009 |
| 2009 |
| 2009 |
| |||||
|
|
|
|
|
|
|
|
|
|
|
| |||||
Trading Portfolio Composition |
|
|
|
|
|
|
|
|
|
|
| |||||
|
|
|
|
|
|
|
|
|
|
|
| |||||
Rating |
|
|
|
|
|
|
|
|
|
|
| |||||
AAA |
| $ | 148.6 |
| $ | 138.7 |
| $ | 52.0 |
| $ | 23.9 |
| $ | 21.6 |
|
AA |
| — |
| 3.6 |
| 40.2 |
| 16.3 |
| 6.2 |
| |||||
A |
| 55.3 |
| 48.6 |
| 65.3 |
| 88.8 |
| 43.2 |
| |||||
BBB |
| 137.5 |
| 134.5 |
| 113.9 |
| 132.2 |
| 120.3 |
| |||||
Below investment grade |
| — |
| 5.8 |
| 56.8 |
| 61.2 |
| 81.3 |
| |||||
Total |
| $ | 341.4 |
| $ | 331.2 |
| $ | 328.2 |
| $ | 322.4 |
| $ | 272.6 |
|
|
|
|
|
|
|
|
|
|
|
|
| |||||
Modco Trading Portfolio |
|
|
|
|
|
|
|
|
|
|
| |||||
|
|
|
|
|
|
|
|
|
|
|
| |||||
Rating |
|
|
|
|
|
|
|
|
|
|
| |||||
AAA |
| $ | 1,357.1 |
| $ | 1,079.0 |
| $ | 878.4 |
| $ | 838.2 |
| $ | 834.7 |
|
AA |
| 147.3 |
| 134.1 |
| 164.6 |
| 166.0 |
| 73.2 |
| |||||
A |
| 591.5 |
| 563.6 |
| 600.5 |
| 568.7 |
| 544.1 |
| |||||
BBB |
| 743.5 |
| 837.2 |
| 822.8 |
| 872.5 |
| 950.3 |
| |||||
Below investment grade |
| 55.6 |
| 112.1 |
| 280.5 |
| 351.2 |
| 281.5 |
| |||||
Short-term investments |
| 80.4 |
| 125.4 |
| 243.3 |
| 242.7 |
| 250.8 |
| |||||
Total |
| $ | 2,975.4 |
| $ | 2,851.4 |
| $ | 2,990.1 |
| $ | 3,039.3 |
| $ | 2,934.6 |
|
| Draft | 2/10/2010 |
Page 11
Invested Asset Summary - MBS - Alt-A
Mortgage-backed Securities Collateralized by Alt-A Mortgage Loans as of December 31, 2009:
(Dollars In Millions) |
| 2005 and |
|
|
|
|
|
|
|
|
|
|
| ||||||
(Unaudited) |
| Prior |
| 2006 |
| 2007 |
| 2008 |
| 2009 |
| Total |
| ||||||
|
|
|
|
|
|
|
|
|
|
|
|
|
| ||||||
Estimated Fair Value of Security by Year of Security Origination |
|
|
|
|
|
|
|
|
|
|
|
|
| ||||||
|
|
|
|
|
|
|
|
|
|
|
|
|
| ||||||
Rating |
|
|
|
|
|
|
|
|
|
|
|
|
| ||||||
AAA |
| $ | 6.0 |
| $ | — |
| $ | — |
| $ | — |
| $ | — |
| $ | 6.0 |
|
A |
| 4.5 |
| — |
| — |
| — |
| — |
| 4.5 |
| ||||||
BBB |
| 31.3 |
| — |
| — |
| — |
| — |
| 31.3 |
| ||||||
Below investment grade |
| 45.8 |
| 220.2 |
| 158.8 |
| — |
| — |
| 424.8 |
| ||||||
Total mortgage-backed securities collateralized by Alt-A mortgage loans |
| $ | 87.6 |
| $ | 220.2 |
| $ | 158.8 |
| $ | — |
| $ | — |
| $ | 466.6 |
|
|
|
|
|
|
|
|
|
|
|
|
|
|
| ||||||
Estimated Unrealized Gain (Loss) of Security by Year of Security Origination |
|
|
|
|
|
|
|
|
|
|
|
|
| ||||||
|
|
|
|
|
|
|
|
|
|
|
|
|
| ||||||
Rating |
|
|
|
|
|
|
|
|
|
|
|
|
| ||||||
AAA |
| $ | (0.6 | ) | $ | — |
| $ | — |
| $ | — |
| $ | — |
| $ | (0.6 | ) |
A |
| 0.7 |
| — |
| — |
| — |
| — |
| 0.7 |
| ||||||
BBB |
| (4.3 | ) | — |
| — |
| — |
| — |
| (4.3 | ) | ||||||
Below investment grade |
| (3.1 | ) | (52.0 | ) | (32.7 | ) | — |
| — |
| (87.8 | ) | ||||||
Total mortgage-backed securities collateralized by Alt-A mortgage loans |
| $ | (7.3 | ) | $ | (52.0 | ) | $ | (32.7 | ) | $ | — |
| $ | — |
| $ | (92.0 | ) |
| Draft | 2/10/2010 |
Page 12
Invested Asset Summary - MBS - Sub-prime
Mortgage-backed Securities Collateralized by Sub-prime Loans as of December 31, 2009:
(Dollars In Millions) |
| 2005 and |
|
|
|
|
|
|
|
|
|
|
| ||||||
(Unaudited) |
| Prior |
| 2006 |
| 2007 |
| 2008 |
| 2009 |
| Total |
| ||||||
|
|
|
|
|
|
|
|
|
|
|
|
|
| ||||||
Estimated Fair Value of Security by Year of Security Origination |
|
|
|
|
|
|
|
|
|
|
|
|
| ||||||
|
|
|
|
|
|
|
|
|
|
|
|
|
| ||||||
Rating |
|
|
|
|
|
|
|
|
|
|
|
|
| ||||||
AAA |
| $ | 0.3 |
| $ | — |
| $ | — |
| $ | — |
| $ | — |
| $ | 0.3 |
|
AA |
| 0.8 |
| 1.2 |
| — |
| — |
| — |
| 2.0 |
| ||||||
A |
| 3.0 |
| — |
| — |
| — |
| — |
| 3.0 |
| ||||||
BBB |
| 0.1 |
| — |
| — |
| — |
| — |
| 0.1 |
| ||||||
Below investment grade |
| 1.2 |
| 16.9 |
| 11.7 |
| — |
| — |
| 29.8 |
| ||||||
Total mortgage-backed securities collateralized by sub-prime mortgage loans |
| $ | 5.4 |
| $ | 18.1 |
| $ | 11.7 |
| $ | — |
| $ | — |
| $ | 35.2 |
|
|
|
|
|
|
|
|
|
|
|
|
|
|
| ||||||
Estimated Unrealized Gain (Loss) of Security by Year of Security Origination |
|
|
|
|
|
|
|
|
|
|
|
|
| ||||||
|
|
|
|
|
|
|
|
|
|
|
|
|
| ||||||
Rating |
|
|
|
|
|
|
|
|
|
|
|
|
| ||||||
AAA |
| $ | — |
| $ | — |
| $ | — |
| $ | — |
| $ | — |
| $ | — |
|
AA |
| (0.5 | ) | (0.2 | ) | — |
| — |
| — |
| (0.7 | ) | ||||||
A |
| (0.3 | ) | — |
| — |
| — |
| — |
| (0.3 | ) | ||||||
BBB |
| — |
| — |
| — |
| — |
| — |
| — |
| ||||||
Below investment grade |
| (1.3 | ) | (9.2 | ) | (23.1 | ) | — |
| — |
| (33.6 | ) | ||||||
Total mortgage-backed securities collateralized by sub-prime mortgage loans |
| $ | (2.1 | ) | $ | (9.4 | ) | $ | (23.1 | ) | $ | — |
| $ | — |
| $ | (34.6 | ) |
| Draft | 2/10/2010 |
Page 13
Invested Asset Summary - MBS - Prime
Mortgage-backed Securities Collateralized by Prime Loans as of December 31, 2009:
(Dollars In Millions) |
| 2005 and |
|
|
|
|
|
|
|
|
|
|
| ||||||
(Unaudited) |
| Prior |
| 2006 |
| 2007 |
| 2008 |
| 2009 |
| Total |
| ||||||
|
|
|
|
|
|
|
|
|
|
|
|
|
| ||||||
Estimated Fair Value of Security by Year of Security Origination |
|
|
|
|
|
|
|
|
|
|
|
|
| ||||||
|
|
|
|
|
|
|
|
|
|
|
|
|
| ||||||
Rating |
|
|
|
|
|
|
|
|
|
|
|
|
| ||||||
AAA |
| $ | 1,167.8 |
| $ | 201.3 |
| $ | 19.8 |
| $ | — |
| $ | — |
| $ | 1,388.9 |
|
AA |
| 202.7 |
| — |
| — |
| — |
| — |
| 202.7 |
| ||||||
A |
| 250.7 |
| 66.2 |
| 1.0 |
| — |
| — |
| 317.9 |
| ||||||
BBB |
| 283.2 |
| 71.5 |
| 26.5 |
| — |
| — |
| 381.2 |
| ||||||
Below investment grade |
| 283.0 |
| 581.6 |
| 260.4 |
| — |
| — |
| 1,125.0 |
| ||||||
Total mortgage-backed securities collateralized by prime loans |
| $ | 2,187.4 |
| $ | 920.6 |
| $ | 307.7 |
| $ | — |
| $ | — |
| $ | 3,415.7 |
|
|
|
|
|
|
|
|
|
|
|
|
|
|
| ||||||
Includes $917.3 million of agency mortgage-backed securities | |||||||||||||||||||
|
|
|
|
|
|
|
|
|
|
|
|
|
| ||||||
Estimated Unrealized Gain (Loss) of Security by Year of Security Origination |
|
|
|
|
|
|
|
|
|
|
|
|
| ||||||
|
|
|
|
|
|
|
|
|
|
|
|
|
| ||||||
Rating |
|
|
|
|
|
|
|
|
|
|
|
|
| ||||||
AAA |
| $ | 21.6 |
| $ | (2.5 | ) | $ | 0.9 |
| $ | — |
| $ | — |
| $ | 20.0 |
|
AA |
| (6.7 | ) | — |
| — |
| — |
| — |
| (6.7 | ) | ||||||
A |
| (5.2 | ) | (6.0 | ) | 0.2 |
| — |
| — |
| (11.0 | ) | ||||||
BBB |
| (51.5 | ) | (3.3 | ) | (1.1 | ) | — |
| — |
| (55.9 | ) | ||||||
Below investment grade |
| (41.9 | ) | (134.2 | ) | (60.7 | ) | — |
| — |
| (236.8 | ) | ||||||
Total mortgage-backed securities collateralized by prime loans |
| $ | (83.7 | ) | $ | (146.0 | ) | $ | (60.7 | ) | $ | — |
| $ | — |
| $ | (290.4 | ) |
| Draft | 2/10/2010 |
Page 14
Invested Asset Summary - External CMBS
External Commercial Mortgage-backed Securities as of December 31, 2009:
(Dollars In Millions) |
| 2005 and |
|
|
|
|
|
|
|
|
|
|
| ||||||
(Unaudited) |
| Prior |
| 2006 |
| 2007 |
| 2008 |
| 2009 |
| Total |
| ||||||
|
|
|
|
|
|
|
|
|
|
|
|
|
| ||||||
Estimated Fair Value of Security by Year of Security Origination |
|
|
|
|
|
|
|
|
|
|
|
|
| ||||||
|
|
|
|
|
|
|
|
|
|
|
|
|
| ||||||
Rating |
|
|
|
|
|
|
|
|
|
|
|
|
| ||||||
AAA |
| $ | 214.7 |
| $ | 14.3 |
| $ | — |
| $ | 44.6 |
| $ | — |
| $ | 273.6 |
|
BBB |
| 6.2 |
| — |
| — |
| — |
| — |
| 6.2 |
| ||||||
Total external commercial mortgage-backed securities |
| $ | 220.9 |
| $ | 14.3 |
| $ | — |
| $ | 44.6 |
| $ | — |
| $ | 279.8 |
|
|
|
|
|
|
|
|
|
|
|
|
|
|
| ||||||
Estimated Unrealized Gain (Loss) of Security by Year of Security Origination |
|
|
|
|
|
|
|
|
|
|
|
|
| ||||||
|
|
|
|
|
|
|
|
|
|
|
|
|
| ||||||
Rating |
|
|
|
|
|
|
|
|
|
|
|
|
| ||||||
AAA |
| $ | 7.6 |
| $ | 0.5 |
| $ | — |
| $ | 0.5 |
| $ | — |
| $ | 8.6 |
|
BBB |
| (0.9 | ) | — |
| — |
| — |
| — |
| (0.9 | ) | ||||||
Total external commercial mortgage-backed securities |
| $ | 6.7 |
| $ | 0.5 |
| $ | — |
| $ | 0.5 |
| $ | — |
| $ | 7.7 |
|
| Draft | 2/10/2010 |
Page 15
Invested Asset Summary - ABS*
Asset-backed Securities* as of December 31, 2009:
(Dollars In Millions) |
| 2005 and |
|
|
|
|
|
|
|
|
|
|
| ||||||
(Unaudited) |
| Prior |
| 2006 |
| 2007 |
| 2008 |
| 2009 |
| Total |
| ||||||
|
|
|
|
|
|
|
|
|
|
|
|
|
| ||||||
Estimated Fair Value of Security by Year of Security Origination |
|
|
|
|
|
|
|
|
|
|
|
|
| ||||||
|
|
|
|
|
|
|
|
|
|
|
|
|
| ||||||
Rating |
|
|
|
|
|
|
|
|
|
|
|
|
| ||||||
AAA |
| $ | 704.3 |
| $ | 33.6 |
| $ | 273.2 |
| $ | 55.6 |
| $ | — |
| $ | 1,066.7 |
|
AA |
| 17.2 |
| 6.2 |
| — |
| — |
| — |
| 23.4 |
| ||||||
A |
| 1.3 |
| 4.9 |
| — |
| — |
| — |
| 6.2 |
| ||||||
BBB |
| 2.7 |
| 4.1 |
| 11.0 |
| — |
| — |
| 17.8 |
| ||||||
Below investment grade |
| — |
| 0.7 |
| 6.0 |
| — |
| — |
| 6.7 |
| ||||||
Total asset-backed securities |
| $ | 725.5 |
| $ | 49.5 |
| $ | 290.2 |
| $ | 55.6 |
| $ | — |
| $ | 1,120.8 |
|
|
|
|
|
|
|
|
|
|
|
|
|
|
| ||||||
Estimated Unrealized Gain (Loss) of Security by Year of Security Origination |
|
|
|
|
|
|
|
|
|
|
|
|
| ||||||
|
|
|
|
|
|
|
|
|
|
|
|
|
| ||||||
Rating |
|
|
|
|
|
|
|
|
|
|
|
|
| ||||||
AAA |
| $ | (50.5 | ) | $ | (1.2 | ) | $ | (12.2 | ) | $ | 0.1 |
| $ | — |
| $ | (63.8 | ) |
AA |
| 1.8 |
| 0.8 |
| — |
| — |
| — |
| 2.6 |
| ||||||
A |
| — |
| 0.1 |
| — |
| — |
| — |
| 0.1 |
| ||||||
BBB |
| — |
| (1.8 | ) | — |
| — |
| — |
| (1.8 | ) | ||||||
Below investment grade |
| — |
| (0.3 | ) | (17.3 | ) | — |
| — |
| (17.6 | ) | ||||||
Total asset-backed securities |
| $ | (48.7 | ) | $ | (2.4 | ) | $ | (29.5 | ) | $ | 0.1 |
| $ | — |
| $ | (80.5 | ) |
* Excludes Residential and Commercial mortgage-backed securities
| Draft | 2/10/2010 |
Page 16
Invested Asset Summary - Other
(Dollars In Millions) |
| GAAP |
| Market |
| Unrealized |
| |||
Hybrid / Preferred Securities |
|
|
|
|
|
|
| |||
|
|
|
|
|
|
|
| |||
Domestic Exposure |
|
|
|
|
|
|
| |||
Tier 1 |
| $ | 996.4 |
| $ | 898.1 |
| $ | (98.3 | ) |
Preferred Stock |
| 136.1 |
| 131.4 |
| (4.7 | ) | |||
Total Domestic Exposure |
| $ | 1,132.5 |
| $ | 1,029.5 |
| $ | (103.0 | ) |
|
|
|
|
|
|
|
| |||
European Exposure |
|
|
|
|
|
|
| |||
Upper Tier 2 |
| $ | 53.3 |
| $ | 52.6 |
| $ | (0.7 | ) |
Tier 1 |
| 217.4 |
| 168.5 |
| (48.9 | ) | |||
Preferred Stock |
| 64.5 |
| 65.5 |
| 1.0 |
| |||
Total European Exposure |
| $ | 335.2 |
| $ | 286.6 |
| $ | (48.6 | ) |
|
|
|
|
|
|
|
| |||
Other Foreign Exposure |
|
|
|
|
|
|
| |||
Tier 1 |
| $ | 65.1 |
| $ | 63.1 |
| $ | (2.0 | ) |
Preferred Stock |
| 0.1 |
| 0.1 |
| — |
| |||
Total Other Foreign Exposure |
| $ | 65.2 |
| $ | 63.2 |
| $ | (2.0 | ) |
|
|
|
|
|
|
|
| |||
Total Domestic, European and Other Exposure |
|
|
|
|
|
|
| |||
Upper Tier 2 |
| $ | 53.3 |
| $ | 52.6 |
| $ | (0.7 | ) |
Tier 1 |
| 1,278.9 |
| 1,129.7 |
| (149.2 | ) | |||
Preferred Stock |
| 200.7 |
| 197.0 |
| (3.7 | ) | |||
Total Domestic, European and Other Exposure |
| $ | 1,532.9 |
| $ | 1,379.3 |
| $ | (153.6 | ) |
| Draft | 2/10/2010 |
Page 17
Life Marketing Quarterly Trends
(Dollars In Thousands) |
| 4TH QTR |
| 1ST QTR |
| 2ND QTR |
| 3RD QTR |
| 4TH QTR |
| YEAR |
| |||||||||
(Unaudited) |
| 2008 |
| 2009 |
| 2009 |
| 2009 |
| 2009 |
| 2008 |
| 2009 |
| |||||||
|
|
|
|
|
|
|
|
|
|
|
|
|
|
|
| |||||||
REVENUES |
|
|
|
|
|
|
|
|
|
|
|
|
|
|
| |||||||
Gross Premiums and Policy Fees |
| $ | 391,302 |
| $ | 375,658 |
| $ | 397,195 |
| $ | 379,823 |
| $ | 412,468 |
| $ | 1,500,566 |
| $ | 1,565,144 |
|
Reinsurance Ceded |
| (254,723 | ) | (207,164 | ) | (241,002 | ) | (202,708 | ) | (260,829 | ) | (924,026 | ) | (911,703 | ) | |||||||
Net Premiums and Policy Fees |
| 136,579 |
| 168,494 |
| 156,193 |
| 177,115 |
| 151,639 |
| 576,540 |
| 653,441 |
| |||||||
Net investment income |
| 89,283 |
| 93,527 |
| 90,833 |
| 89,035 |
| 88,713 |
| 350,053 |
| 362,108 |
| |||||||
Other income |
| 22,184 |
| 19,830 |
| 20,168 |
| 19,587 |
| 21,262 |
| 96,746 |
| 80,847 |
| |||||||
Total Revenues |
| 248,046 |
| 281,851 |
| 267,194 |
| 285,737 |
| 261,614 |
| 1,023,339 |
| 1,096,396 |
| |||||||
|
|
|
|
|
|
|
|
|
|
|
|
|
|
|
| |||||||
BENEFITS & EXPENSES |
|
|
|
|
|
|
|
|
|
|
|
|
|
|
| |||||||
Benefits and settlement expenses |
| 153,115 |
| 195,410 |
| 189,101 |
| 215,567 |
| 182,294 |
| 704,955 |
| 782,372 |
| |||||||
Amortization of deferred policy acquisition costs and value of businesses acquired |
| 35,256 |
| 35,728 |
| 33,404 |
| 40,142 |
| 34,851 |
| 94,422 |
| 144,125 |
| |||||||
Other operating expenses |
| 7,938 |
| 8,203 |
| 7,510 |
| 3,484 |
| 12,876 |
| 35,427 |
| 32,073 |
| |||||||
Total Benefits and Expenses |
| 196,309 |
| 239,341 |
| 230,015 |
| 259,193 |
| 230,021 |
| 834,804 |
| 958,570 |
| |||||||
|
|
|
|
|
|
|
|
|
|
|
|
|
|
|
| |||||||
INCOME BEFORE INCOME TAX |
| $ | 51,737 |
| $ | 42,510 |
| $ | 37,179 |
| $ | 26,544 |
| $ | 31,593 |
| $ | 188,535 |
| $ | 137,826 |
|
Life Marketing Key Data
(Dollars In Thousands) |
| 4TH QTR |
| 1ST QTR |
| 2ND QTR |
| 3RD QTR |
| 4TH QTR |
| YEAR |
| |||||||||
(Unaudited) |
| 2008 |
| 2009 |
| 2009 |
| 2009 |
| 2009 |
| 2008 |
| 2009 |
| |||||||
|
|
|
|
|
|
|
|
|
|
|
|
|
|
|
| |||||||
SALES BY PRODUCT |
|
|
|
|
|
|
|
|
|
|
|
|
|
|
| |||||||
Traditional |
| $ | 22,274 |
| $ | 23,151 |
| $ | 26,102 |
| $ | 25,589 |
| $ | 22,090 |
| $ | 99,202 |
| $ | 96,932 |
|
Universal life |
| 14,496 |
| 12,819 |
| 12,796 |
| 15,383 |
| 21,027 |
| 52,832 |
| 62,025 |
| |||||||
Variable universal life |
| 1,162 |
| 642 |
| 854 |
| 912 |
| 1,235 |
| 5,667 |
| 3,643 |
| |||||||
Total |
| $ | 37,932 |
| $ | 36,612 |
| $ | 39,752 |
| $ | 41,884 |
| $ | 44,352 |
| $ | 157,701 |
| $ | 162,600 |
|
|
|
|
|
|
|
|
|
|
|
|
|
|
|
|
| |||||||
SALES BY DISTRIBUTION |
|
|
|
|
|
|
|
|
|
|
|
|
|
|
| |||||||
Brokerage general agents |
| $ | 20,549 |
| $ | 21,464 |
| $ | 25,783 |
| $ | 26,301 |
| $ | 27,833 |
| $ | 89,295 |
| $ | 101,381 |
|
Independent agents |
| 7,515 |
| 7,280 |
| 7,084 |
| 6,923 |
| 6,478 |
| 33,101 |
| 27,765 |
| |||||||
Stockbrokers/banks |
| 8,205 |
| 7,173 |
| 6,509 |
| 7,753 |
| 8,696 |
| 30,546 |
| 30,131 |
| |||||||
BOLI/other |
| 1,663 |
| 695 |
| 376 |
| 907 |
| 1,345 |
| 4,759 |
| 3,323 |
| |||||||
Total |
| $ | 37,932 |
| $ | 36,612 |
| $ | 39,752 |
| $ | 41,884 |
| $ | 44,352 |
| $ | 157,701 |
| $ | 162,600 |
|
| Draft | 2/10/2010 |
Page 18
Annuities Quarterly Trends
(Dollars In Thousands) |
| 4TH QTR |
| 1ST QTR |
| 2ND QTR |
| 3RD QTR |
| 4TH QTR |
| YEAR |
| |||||||||
(Unaudited) |
| 2008 |
| 2009 |
| 2009 |
| 2009 |
| 2009 |
| 2008 |
| 2009 |
| |||||||
|
|
|
|
|
|
|
|
|
|
|
|
|
|
|
| |||||||
REVENUES |
|
|
|
|
|
|
|
|
|
|
|
|
|
|
| |||||||
Gross Premiums and Policy Fees |
| $ | 10,013 |
| $ | 10,985 |
| $ | 7,406 |
| $ | 7,416 |
| $ | 8,176 |
| $ | 34,538 |
| $ | 33,983 |
|
Reinsurance Ceded |
| (206 | ) | (42 | ) | (42 | ) | (29 | ) | (39 | ) | (206 | ) | (152 | ) | |||||||
Net Premiums and Policy Fees |
| 9,807 |
| 10,943 |
| 7,364 |
| 7,387 |
| 8,137 |
| 34,332 |
| 33,831 |
| |||||||
Net investment income |
| 95,516 |
| 102,982 |
| 108,588 |
| 113,272 |
| 115,255 |
| 347,551 |
| 440,097 |
| |||||||
RIGL - Derivatives |
| (22,496 | ) | 19,088 |
| 13,393 |
| (28,864 | ) | 19,003 |
| (40,971 | ) | 22,620 |
| |||||||
RIGL - All Other Investments |
| 387 |
| (6,448 | ) | 925 |
| (482 | ) | 717 |
| (12,917 | ) | (5,288 | ) | |||||||
Other income |
| 3,137 |
| 3,380 |
| 4,215 |
| 4,737 |
| 5,264 |
| 12,761 |
| 17,596 |
| |||||||
Total Revenues |
| 86,351 |
| 129,945 |
| 134,485 |
| 96,050 |
| 148,376 |
| 340,756 |
| 508,856 |
| |||||||
|
|
|
|
|
|
|
|
|
|
|
|
|
|
|
| |||||||
BENEFITS & EXPENSES |
|
|
|
|
|
|
|
|
|
|
|
|
|
|
| |||||||
Benefits and settlement expenses |
| 90,101 |
| 85,808 |
| 78,759 |
| 96,118 |
| 90,165 |
| 310,800 |
| 350,850 |
| |||||||
Amortization of deferred policy acquisition costs and value of businesses acquired |
| (15,558 | ) | 45,085 |
| 26,568 |
| (20,176 | ) | 30,451 |
| 616 |
| 81,928 |
| |||||||
Other operating expenses |
| 6,225 |
| 5,975 |
| 6,068 |
| 6,855 |
| 7,396 |
| 25,622 |
| 26,294 |
| |||||||
Total Benefits and Expenses |
| 80,768 |
| 136,868 |
| 111,395 |
| 82,797 |
| 128,012 |
| 337,038 |
| 459,072 |
| |||||||
|
|
|
|
|
|
|
|
|
|
|
|
|
|
|
| |||||||
INCOME (LOSS) BEFORE INCOME TAX |
| 5,583 |
| (6,923 | ) | 23,090 |
| 13,253 |
| 20,364 |
| 3,718 |
| 49,784 |
| |||||||
|
|
|
|
|
|
|
|
|
|
|
|
|
|
|
| |||||||
Adjustments to Reconcile to Operating Income: |
|
|
|
|
|
|
|
|
|
|
|
|
|
|
| |||||||
Less: RIGL - Derivatives |
| (22,496 | ) | 19,088 |
| 13,393 |
| (28,864 | ) | 19,003 |
| (40,971 | ) | 22,620 |
| |||||||
Add back: Derivative gains related to annuities |
| (22,496 | ) | 19,088 |
| 13,393 |
| (28,864 | ) | 19,003 |
| (40,971 | ) | 22,620 |
| |||||||
Less: RIGL - All Other Investments |
| 387 |
| (6,448 | ) | 925 |
| (482 | ) | 717 |
| (12,917 | ) | (5,288 | ) | |||||||
Add back: Related amortization of deferred acquisition costs |
| 979 |
| (100 | ) | (670 | ) | 2,340 |
| — |
| 2,072 |
| 1,570 |
| |||||||
|
|
|
|
|
|
|
|
|
|
|
|
|
|
|
| |||||||
PRE-TAX OPERATING INCOME (LOSS) |
| $ | 6,175 |
| $ | (575 | ) | $ | 21,495 |
| $ | 16,075 |
| $ | 19,647 |
| $ | 18,707 |
| $ | 56,642 |
|
Annuities Key Data
|
| 4TH QTR |
| 1ST QTR |
| 2ND QTR |
| 3RD QTR |
| 4TH QTR |
| YEAR |
| |||||||||
|
| 2008 |
| 2009 |
| 2009 |
| 2009 |
| 2009 |
| 2008 |
| 2009 |
| |||||||
|
|
|
|
|
|
|
|
|
|
|
|
|
|
|
| |||||||
SALES |
|
|
|
|
|
|
|
|
|
|
|
|
|
|
| |||||||
Variable Annuity |
| $ | 111,794 |
| $ | 139,056 |
| $ | 177,306 |
| $ | 194,429 |
| $ | 285,454 |
| $ | 452,408 |
| $ | 796,245 |
|
Immediate Annuity |
| 47,642 |
| 26,043 |
| 17,918 |
| 20,498 |
| 11,886 |
| 349,859 |
| 76,345 |
| |||||||
Single Premium Deferred Annuity |
| 400,638 |
| 151,016 |
| 264,326 |
| 165,990 |
| 202,483 |
| 726,851 |
| 783,815 |
| |||||||
Market Value Adjusted Annuity |
| 411,145 |
| 117,305 |
| 150,129 |
| 71,447 |
| 22,409 |
| 1,066,073 |
| 361,290 |
| |||||||
Equity Indexed Annuity |
| 4,911 |
| 3,316 |
| — |
| 212 |
| 233 |
| 17,374 |
| 3,761 |
| |||||||
Total |
| $ | 976,130 |
| $ | 436,736 |
| $ | 609,679 |
| $ | 452,576 |
| $ | 522,465 |
| $ | 2,612,565 |
| $ | 2,021,456 |
|
|
|
|
|
|
|
|
|
|
|
|
|
|
|
|
| |||||||
PRE-TAX OPERATING INCOME (LOSS) |
|
|
|
|
|
|
|
|
|
|
|
|
|
|
| |||||||
Variable Annuity |
| $ | (7,056 | ) | $ | (5,841 | ) | $ | 15,230 |
| $ | 285 |
| $ | 11,607 |
| $ | (3,289 | ) | $ | 21,281 |
|
Fixed Annuity |
| 13,231 |
| 5,266 |
| 6,265 |
| 15,790 |
| 8,040 |
| 21,996 |
| 35,361 |
| |||||||
Total |
| $ | 6,175 |
| $ | (575 | ) | $ | 21,495 |
| $ | 16,075 |
| $ | 19,647 |
| $ | 18,707 |
| $ | 56,642 |
|
|
|
|
|
|
|
|
|
|
|
|
|
|
|
|
| |||||||
DEPOSIT BALANCE |
|
|
|
|
|
|
|
|
|
|
|
|
|
|
| |||||||
VA Fixed Annuity |
| $ | 202,395 |
| $ | 226,707 |
| $ | 242,491 |
| $ | 240,899 |
| $ | 291,733 |
|
|
|
|
| ||
VA Separate Account Annuity |
| 2,098,203 |
| 1,786,993 |
| 2,128,899 |
| 2,554,411 |
| 2,808,123 |
|
|
|
|
| |||||||
Sub-total |
| 2,300,598 |
| 2,013,700 |
| 2,371,390 |
| 2,795,310 |
| 3,099,856 |
|
|
|
|
| |||||||
Fixed Annuity |
| 6,195,293 |
| 6,530,391 |
| 6,882,551 |
| 7,074,803 |
| 7,252,246 |
|
|
|
|
| |||||||
Total |
| $ | 8,495,891 |
| $ | 8,544,091 |
| $ | 9,253,941 |
| $ | 9,870,113 |
| $ | 10,352,102 |
|
|
|
|
| ||
| Draft | 2/10/2010 |
Page 19
Stable Value Products Quarterly Trends
(Dollars In Thousands) |
| 4TH QTR |
| 1ST QTR |
| 2ND QTR |
| 3RD QTR |
| 4TH QTR |
| YEAR |
| |||||||||
(Unaudited) |
| 2008 |
| 2009 |
| 2009 |
| 2009 |
| 2009 |
| 2008 |
| 2009 |
| |||||||
|
|
|
|
|
|
|
|
|
|
|
|
|
|
|
| |||||||
REVENUES |
|
|
|
|
|
|
|
|
|
|
|
|
|
|
| |||||||
Net investment income |
| $ | 83,991 |
| $ | 63,176 |
| $ | 57,550 |
| $ | 54,024 |
| $ | 46,938 |
| $ | 328,353 |
| $ | 221,688 |
|
RIGL - Derivatives |
| (1,451 | ) | 707 |
| 247 |
| 87 |
| 529 |
| (4,073 | ) | 1,570 |
| |||||||
RIGL - All Other Investments |
| (17,216 | ) | 1,155 |
| (647 | ) | (5,036 | ) | 261 |
| (2,354 | ) | (4,267 | ) | |||||||
Other income |
| 6,360 |
| 1,526 |
| 340 |
| — |
| — |
| 9,360 |
| 1,866 |
| |||||||
Total Revenues |
| 71,684 |
| 66,564 |
| 57,490 |
| 49,075 |
| 47,728 |
| 331,286 |
| 220,857 |
| |||||||
|
|
|
|
|
|
|
|
|
|
|
|
|
|
|
| |||||||
BENEFITS & EXPENSES |
|
|
|
|
|
|
|
|
|
|
|
|
|
|
| |||||||
Benefits and settlement expenses |
| 60,066 |
| 42,585 |
| 39,206 |
| 37,972 |
| 34,792 |
| 237,608 |
| 154,555 |
| |||||||
Amortization of deferred policy acquisition costs and value of businesses acquired |
| 1,094 |
| 927 |
| 844 |
| 893 |
| 807 |
| 4,467 |
| 3,471 |
| |||||||
Other operating expenses |
| 1,325 |
| 983 |
| 864 |
| 820 |
| 898 |
| 5,827 |
| 3,565 |
| |||||||
Total Benefits and Expenses |
| 62,485 |
| 44,495 |
| 40,914 |
| 39,685 |
| 36,497 |
| 247,902 |
| 161,591 |
| |||||||
|
|
|
|
|
|
|
|
|
|
|
|
|
|
|
| |||||||
INCOME BEFORE INCOME TAX |
| 9,199 |
| 22,069 |
| 16,576 |
| 9,390 |
| 11,231 |
| 83,384 |
| 59,266 |
| |||||||
|
|
|
|
|
|
|
|
|
|
|
|
|
|
|
| |||||||
Adjustments to Reconcile to Operating Income: |
|
|
|
|
|
|
|
|
|
|
|
|
|
|
| |||||||
Less: RIGL-Derivatives |
| (1,451 | ) | 707 |
| 247 |
| 87 |
| 529 |
| (4,073 | ) | 1,570 |
| |||||||
Less: RIGL-All Other Investments |
| (17,216 | ) | 1,155 |
| (647 | ) | (5,036 | ) | 261 |
| (2,354 | ) | (4,267 | ) | |||||||
|
|
|
|
|
|
|
|
|
|
|
|
|
|
|
| |||||||
PRE-TAX OPERATING INCOME |
| $ | 27,866 |
| $ | 20,207 |
| $ | 16,976 |
| $ | 14,339 |
| $ | 10,441 |
| $ | 89,811 |
| $ | 61,963 |
|
Stable Value Products Key Data
|
| 4TH QTR |
| 1ST QTR |
| 2ND QTR |
| 3RD QTR |
| 4TH QTR |
| YEAR |
| |||||||||
|
| 2008 |
| 2009 |
| 2009 |
| 2009 |
| 2009 |
| 2008 |
| 2009 |
| |||||||
|
|
|
|
|
|
|
|
|
|
|
|
|
|
|
| |||||||
SALES |
|
|
|
|
|
|
|
|
|
|
|
|
|
|
| |||||||
GIC |
| $ | 58,339 |
| $ | — |
| $ | — |
| $ | — |
| $ | — |
| $ | 166,284 |
| $ | — |
|
GFA - Direct Institutional |
| — |
| — |
| — |
| — |
| — |
| 1,061,651 |
| — |
| |||||||
GFA - Registered - Institutional |
| — |
| — |
| — |
| — |
| — |
| 450,000 |
| — |
| |||||||
GFA - Registered - Retail |
| — |
| — |
| — |
| — |
| — |
| 290,848 |
| — |
| |||||||
Total |
| $ | 58,339 |
| $ | — |
| $ | — |
| $ | — |
| $ | — |
| $ | 1,968,783 |
| $ | — |
|
|
|
|
|
|
|
|
|
|
|
|
|
|
|
|
| |||||||
DEPOSIT BALANCE |
|
|
|
|
|
|
|
|
|
|
|
|
|
|
| |||||||
Quarter End Balance |
| $ | 4,960,405 |
| $ | 4,360,658 |
| $ | 4,138,131 |
| $ | 3,863,329 |
| $ | 3,581,150 |
|
|
|
|
| ||
Average Daily Balance |
| $ | 5,666,809 |
| $ | 4,523,563 |
| $ | 4,224,897 |
| $ | 4,025,344 |
| $ | 3,602,681 |
|
|
|
|
| ||
|
|
|
|
|
|
|
|
|
|
|
|
|
|
|
| |||||||
OPERATING SPREAD |
| 1.52 | %(1) | 1.65 | %(1) | 1.57 | %(1) | 1.42 | % | 1.16 | % |
|
|
|
| |||||||
(1) Excludes one-time funding agreement retirement gains
| Draft | 2/10/2010 |
Page 20
Asset Protection Quarterly Trends
(Dollars In Thousands) |
| 4TH QTR |
| 1ST QTR |
| 2ND QTR |
| 3RD QTR |
| 4TH QTR |
| YEAR |
| |||||||||
(Unaudited) |
| 2008 |
| 2009 |
| 2009 |
| 2009 |
| 2009 |
| 2008 |
| 2009 |
| |||||||
|
|
|
|
|
|
|
|
|
|
|
|
|
|
|
| |||||||
REVENUES |
|
|
|
|
|
|
|
|
|
|
|
|
|
|
| |||||||
Gross Premiums and Policy Fees |
| $ | 87,961 |
| $ | 86,935 |
| $ | 84,240 |
| $ | 83,020 |
| $ | 85,321 |
| $ | 363,169 |
| $ | 339,516 |
|
Reinsurance Ceded |
| (40,229 | ) | (41,485 | ) | (37,698 | ) | (36,600 | ) | (36,439 | ) | (170,875 | ) | (152,222 | ) | |||||||
Net Premiums and Policy Fees |
| 47,732 |
| 45,450 |
| 46,542 |
| 46,420 |
| 48,882 |
| 192,294 |
| 187,294 |
| |||||||
Net investment income |
| 9,348 |
| 8,932 |
| 8,407 |
| 8,038 |
| 7,780 |
| 38,656 |
| 33,157 |
| |||||||
Other income |
| 13,311 |
| 12,473 |
| 13,199 |
| 15,161 |
| 15,719 |
| 62,271 |
| 56,552 |
| |||||||
Total Revenues |
| 70,391 |
| 66,855 |
| 68,148 |
| 69,619 |
| 72,381 |
| 293,221 |
| 277,003 |
| |||||||
|
|
|
|
|
|
|
|
|
|
|
|
|
|
|
| |||||||
BENEFITS & EXPENSES |
|
|
|
|
|
|
|
|
|
|
|
|
|
|
| |||||||
Benefits and settlement expenses |
| 26,288 |
| 34,110 |
| 29,363 |
| 31,009 |
| 32,832 |
| 106,737 |
| 127,314 |
| |||||||
Amortization of deferred policy acquisition costs and value of businesses acquired |
| 13,877 |
| 13,683 |
| 14,104 |
| 13,446 |
| 13,887 |
| 57,704 |
| 55,120 |
| |||||||
Other operating expenses |
| 24,139 |
| 12,782 |
| 20,025 |
| 19,433 |
| 19,100 |
| 97,991 |
| 71,340 |
| |||||||
Total Benefits and Expenses |
| 64,304 |
| 60,575 |
| 63,492 |
| 63,888 |
| 65,819 |
| 262,432 |
| 253,774 |
| |||||||
|
|
|
|
|
|
|
|
|
|
|
|
|
|
|
| |||||||
INCOME BEFORE INCOME TAX |
| $ | 6,087 |
| $ | 6,280 |
| $ | 4,656 |
| $ | 5,731 |
| $ | 6,562 |
| $ | 30,789 |
| $ | 23,229 |
|
Asset Protection Key Data
|
| 4TH QTR |
| 1ST QTR |
| 2ND QTR |
| 3RD QTR |
| 4TH QTR |
| YEAR |
| |||||||||
|
| 2008 |
| 2009 |
| 2009 |
| 2009 |
| 2009 |
| 2008 |
| 2009 |
| |||||||
|
|
|
|
|
|
|
|
|
|
|
|
|
|
|
| |||||||
SALES |
|
|
|
|
|
|
|
|
|
|
|
|
|
|
| |||||||
Credit insurance |
| $ | 10,518 |
| $ | 8,483 |
| $ | 8,721 |
| $ | 10,345 |
| $ | 7,830 |
| $ | 67,317 |
| $ | 35,379 |
|
Service contracts |
| 53,517 |
| 48,076 |
| 56,368 |
| 64,865 |
| 57,526 |
| 279,862 |
| 226,835 |
| |||||||
Other products |
| 12,025 |
| 11,781 |
| 11,091 |
| 11,026 |
| 8,892 |
| 63,468 |
| 42,790 |
| |||||||
Total |
| $ | 76,060 |
| $ | 68,340 |
| $ | 76,180 |
| $ | 86,236 |
| $ | 74,248 |
| $ | 410,647 |
| $ | 305,004 |
|
| Draft | 2/10/2010 |
Page 21
Acquisitions Quarterly Trends
(Dollars In Thousands) |
| 4TH QTR |
| 1ST QTR |
| 2ND QTR |
| 3RD QTR |
| 4TH QTR |
| YEAR |
| |||||||||
(Unaudited) |
| 2008 |
| 2009 |
| 2009 |
| 2009 |
| 2009 |
| 2008 |
| 2009 |
| |||||||
|
|
|
|
|
|
|
|
|
|
|
|
|
|
|
| |||||||
REVENUES |
|
|
|
|
|
|
|
|
|
|
|
|
|
|
| |||||||
Gross Premiums and Policy Fees |
| $ | 191,053 |
| $ | 178,676 |
| $ | 184,484 |
| $ | 175,521 |
| $ | 185,807 |
| $ | 764,438 |
| $ | 724,488 |
|
Reinsurance Ceded |
| (126,071 | ) | (109,607 | ) | (115,482 | ) | (112,325 | ) | (125,558 | ) | (487,698 | ) | (462,972 | ) | |||||||
Net Premiums and Policy Fees |
| 64,982 |
| 69,069 |
| 69,002 |
| 63,196 |
| 60,249 |
| 276,740 |
| 261,516 |
| |||||||
Net investment income |
| 127,156 |
| 123,541 |
| 119,515 |
| 118,202 |
| 118,485 |
| 530,028 |
| 479,743 |
| |||||||
RIGL - Derivatives |
| 27,737 |
| 57,684 |
| (146,462 | ) | (156,504 | ) | (6,818 | ) | 209,800 |
| (252,100 | ) | |||||||
RIGL - All Other Investments |
| (72,964 | ) | (52,463 | ) | 157,871 |
| 163,529 |
| 13,026 |
| (306,581 | ) | 281,963 |
| |||||||
Other income |
| 1,862 |
| 1,403 |
| 1,592 |
| 1,519 |
| 1,545 |
| 6,735 |
| 6,059 |
| |||||||
Total Revenues |
| 148,773 |
| 199,234 |
| 201,518 |
| 189,942 |
| 186,487 |
| 716,722 |
| 777,181 |
| |||||||
|
|
|
|
|
|
|
|
|
|
|
|
|
|
|
| |||||||
BENEFITS & EXPENSES |
|
|
|
|
|
|
|
|
|
|
|
|
|
|
| |||||||
Benefits and settlement expenses |
| 137,897 |
| 138,731 |
| 135,773 |
| 131,786 |
| 126,702 |
| 580,271 |
| 532,992 |
| |||||||
Amortization of deferred policy acquisition costs and value of businesses acquired |
| 19,406 |
| 17,741 |
| 14,560 |
| 12,427 |
| 14,297 |
| 74,384 |
| 59,025 |
| |||||||
Other operating expenses |
| 1,322 |
| 4,098 |
| 4,463 |
| 2,523 |
| 3,684 |
| 21,145 |
| 14,768 |
| |||||||
Total Benefits and Expenses |
| 158,625 |
| 160,570 |
| 154,796 |
| 146,736 |
| 144,683 |
| 675,800 |
| 606,785 |
| |||||||
|
|
|
|
|
|
|
|
|
|
|
|
|
|
|
| |||||||
INCOME (LOSS) BEFORE INCOME TAX |
| (9,852 | ) | 38,664 |
| 46,722 |
| 43,206 |
| 41,804 |
| 40,922 |
| 170,396 |
| |||||||
|
|
|
|
|
|
|
|
|
|
|
|
|
|
|
| |||||||
Adjustments to Reconcile to Operating Income: |
|
|
|
|
|
|
|
|
|
|
|
|
|
|
| |||||||
Less: RIGL - Derivatives |
| 27,737 |
| 57,684 |
| (146,462 | ) | (156,504 | ) | (6,818 | ) | 209,800 |
| (252,100 | ) | |||||||
Less: RIGL - All Other Investments |
| (72,964 | ) | (52,463 | ) | 157,871 |
| 163,529 |
| 13,026 |
| (306,581 | ) | 281,963 |
| |||||||
Add back: Related amortization of deferred policy acquisition costs and value of businesses acquired |
| (7 | ) | 178 |
| (272 | ) | (3,120 | ) | (3,559 | ) | (1,224 | ) | (6,773 | ) | |||||||
|
|
|
|
|
|
|
|
|
|
|
|
|
|
|
| |||||||
PRE-TAX OPERATING INCOME |
| $ | 35,368 |
| $ | 33,621 |
| $ | 35,041 |
| $ | 33,061 |
| $ | 32,037 |
| $ | 136,479 |
| $ | 133,760 |
|
| Draft | 2/10/2010 |
Page 22
Corporate & Other Quarterly Trends
(Dollars In Thousands) |
| 4TH QTR |
| 1ST QTR |
| 2ND QTR |
| 3RD QTR |
| 4TH QTR |
| YEAR |
| |||||||||
(Unaudited) |
| 2008 |
| 2009 |
| 2009 |
| 2009 |
| 2009 |
| 2008 |
| 2009 |
| |||||||
|
|
|
|
|
|
|
|
|
|
|
|
|
|
|
| |||||||
REVENUES |
|
|
|
|
|
|
|
|
|
|
|
|
|
|
| |||||||
Gross Premiums and Policy Fees |
| $ | 6,483 |
| $ | 6,898 |
| $ | 6,664 |
| $ | 6,717 |
| $ | 6,289 |
| $ | 29,842 |
| $ | 26,568 |
|
Reinsurance Ceded |
| (1 | ) | (1 | ) | (1 | ) | (2 | ) | — |
| (5 | ) | (4 | ) | |||||||
Net Premiums and Policy Fees |
| 6,482 |
| 6,897 |
| 6,663 |
| 6,715 |
| 6,289 |
| 29,837 |
| 26,564 |
| |||||||
Net investment income |
| (1,058 | ) | 29,527 |
| 46,251 |
| 27,385 |
| 25,080 |
| 80,523 |
| 128,243 |
| |||||||
RIGL - Derivatives |
| (42,554 | ) | 14,954 |
| 34,832 |
| (10,259 | ) | 10,430 |
| (48,099 | ) | 49,957 |
| |||||||
RIGL - All Other Investments |
| (3,141 | ) | (73,913 | ) | (31,322 | ) | (23,403 | ) | (23,621 | ) | (262,640 | ) | (152,259 | ) | |||||||
Other income |
| 203 |
| 51 |
| 72 |
| 218 |
| 134,887 |
| 619 |
| 135,228 |
| |||||||
Total Revenues |
| (40,068 | ) | (22,484 | ) | 56,496 |
| 656 |
| 153,065 |
| (199,760 | ) | 187,733 |
| |||||||
|
|
|
|
|
|
|
|
|
|
|
|
|
|
|
| |||||||
BENEFITS & EXPENSES |
|
|
|
|
|
|
|
|
|
|
|
|
|
|
| |||||||
Benefits and settlement expenses |
| 8,215 |
| 7,715 |
| 5,946 |
| 8,766 |
| 7,469 |
| 36,170 |
| 29,896 |
| |||||||
Amortization of deferred policy acquisition costs and value of businesses acquired |
| 516 |
| 484 |
| 469 |
| 508 |
| 439 |
| 2,149 |
| 1,900 |
| |||||||
Other operating expenses |
| 40,212 |
| 39,761 |
| 38,086 |
| 47,870 |
| 53,943 |
| 184,400 |
| 179,660 |
| |||||||
Total Benefits and Expenses |
| 48,943 |
| 47,960 |
| 44,501 |
| 57,144 |
| 61,851 |
| 222,719 |
| 211,456 |
| |||||||
|
|
|
|
|
|
|
|
|
|
|
|
|
|
|
| |||||||
INCOME (LOSS) BEFORE INCOME TAX |
| (89,011 | ) | (70,444 | ) | 11,995 |
| (56,488 | ) | 91,214 |
| (422,479 | ) | (23,723 | ) | |||||||
|
|
|
|
|
|
|
|
|
|
|
|
|
|
|
| |||||||
Adjustments to Reconcile to Operating Income: |
|
|
|
|
|
|
|
|
|
|
|
|
|
|
| |||||||
Less: RIGL-Derivatives |
| (42,554 | ) | 14,954 |
| 34,832 |
| (10,259 | ) | 10,430 |
| (48,099 | ) | 49,957 |
| |||||||
Less: RIGL-All Other Investments, net of participating income |
| (3,141 | ) | (73,913 | ) | (31,322 | ) | (23,403 | ) | (23,621 | ) | (262,640 | ) | (152,259 | ) | |||||||
Add back: Derivative gains related to corporate debt and investments |
| 1,569 |
| 2,238 |
| 1,163 |
| — |
| — |
| 5,754 |
| 3,401 |
| |||||||
|
|
|
|
|
|
|
|
|
|
|
|
|
|
|
| |||||||
PRE-TAX OPERATING INCOME (LOSS) |
| $ | (41,747 | ) | $ | (9,247 | ) | $ | 9,648 |
| $ | (22,826 | ) | $ | 104,405 |
| $ | (105,986 | ) | $ | 81,980 |
|