Exhibit 99.2
Draft 2/9/2011

Supplemental Schedules
Fourth Quarter 2010

| Draft 2/9/2011 |
Page 1
Quarterly Financial Highlights
(Dollars In Thousands) | | 4TH QTR | | 1ST QTR | | 2ND QTR | | 3RD QTR | | 4TH QTR | | 12 MOS | |
(Unaudited) | | 2009 | | 2010 | | 2010 | | 2010 | | 2010 | | 2009 | | 2010 | |
| | | | | | | | | | | | | | | |
Pre-tax Operating Income (Loss) * | | | | | | | | | | | | | | | |
| | | | | | | | | | | | | | | |
Life Marketing | | $ | 31,593 | | $ | 40,678 | | $ | 35,755 | | $ | 30,868 | | $ | 40,169 | | $ | 137,826 | | $ | 147,470 | |
Acquisitions | | 32,037 | | 31,369 | | 30,190 | | 27,866 | | 21,718 | | 133,760 | | 111,143 | |
Annuities | | 19,647 | | 18,187 | | 605 | | 22,704 | | 12,405 | | 56,642 | | 53,901 | |
Stable Value Products | | 10,441 | | 11,027 | | 10,979 | | 8,339 | | 8,862 | | 61,963 | | 39,207 | |
Asset Protection | | 6,562 | | 13,067 | | 6,616 | | 5,154 | | 5,060 | | 23,229 | | 29,897 | |
Corporate & Other | | 104,405 | | (16,132 | ) | 377 | | 405 | | (9,703 | ) | 81,980 | | (25,053 | ) |
Total Pre-tax Operating Income | | $ | 204,685 | | $ | 98,196 | | $ | 84,522 | | $ | 95,336 | | $ | 78,511 | | $ | 495,400 | | $ | 356,565 | |
| | | | | | | | | | | | | | | |
Balance Sheet Data | | | | | | | | | | | | | | | |
| | | | | | | | | | | | | | | |
Total GAAP Assets | | $ | 42,311,587 | | $ | 43,617,727 | | $ | 44,576,236 | | $ | 45,932,314 | | $ | 47,566,378 | | | | | |
Total Protective Life Corporation’s Shareowners’ Equity | | $ | 2,478,821 | | $ | 2,821,033 | | $ | 3,085,599 | | $ | 3,571,392 | | $ | 3,331,087 | | | | | |
Total Protective Life Corporation’s Shareowners’ Equity (excluding accumulated other comprehensive income (loss))** | | $ | 2,799,990 | | $ | 2,876,749 | | $ | 2,908,109 | | $ | 2,969,428 | | $ | 3,037,833 | | | | | |
| | | | | | | | | | | | | | | |
Stock Data | | | | | | | | | | | | | | | |
| | | | | | | | | | | | | | | |
Closing Price | | $ | 16.55 | | $ | 21.99 | | $ | 21.39 | | $ | 21.76 | | $ | 26.64 | | | | | |
Average Shares Outstanding | | | | | | | | | | | | | | | |
Basic | | 86,491,754 | | 86,500,199 | | 86,562,379 | | 86,603,569 | | 86,600,622 | | 80,488,694 | | 86,567,069 | |
Diluted | | 87,459,899 | | 87,551,386 | | 87,666,035 | | 87,701,592 | | 87,781,602 | | 81,249,265 | | 87,675,857 | |
* “Pre-tax Operating Income (Loss)” is a non-GAAP financial measure. “Income (loss) Before Income Tax” is a GAAP financial measure to which “Pre-tax Operating Income” may be compared.
See Page 6 for a reconciliation of “Pre-tax Operating Income” to “Income (loss) Before Income Tax”.
** “Total Protective Life Corporation’s Shareowners’ equity excluding accumulated other comprehensive income (loss)” is a non-GAAP financial measure. “Total Protective Life Corporation’s Shareowners’ equity” is a GAAP financial measure to which “Total Protective Life Corporation’s Shareowners’ equity excluding accumulated other comprehensive income (loss)” may be compared.
See Page 5 for a reconciliation of “Total Protective Life Corporation’s Shareowners’ equity excluding accumulated other comprehensive income (loss)” to “Total Protective Life Corporation’s Shareowners’ equity”.
| Draft 2/9/2011 |
Page 2
Financial Strength Ratings as of December 31, 2010
| | A.M. Best | | Fitch | | Standard & Poor’s | | Moody’s | |
Legal Entity | | | | | | | | | |
| | | | | | | | | |
Insurance companies: | | | | | | | | | |
Protective Life Insurance Company | | A+ | | A | | AA- | | A2 | |
West Coast Life Insurance Company | | A+ | | A | | AA- | | A2 | |
Protective Life and Annuity Insurance Company | | A+ | | A | | AA- | | — | |
Lyndon Property Insurance Company | | A- | | — | | — | | — | |

| Draft 2/9/2011 |
Page 3
GAAP Consolidated Statements of Income
(Dollars In Thousands) | | 4TH QTR | | 1ST QTR | | 2ND QTR | | 3RD QTR | | 4TH QTR | | 12 MOS | |
(Unaudited) | | 2009 | | 2010 | | 2010 | | 2010 | | 2010 | | 2009 | | 2010 | |
| | | | | | | | | | | | | | | |
REVENUES | | | | | | | | | | | | | | | |
Gross Premiums and Policy Fees | | $ | 698,061 | | $ | 628,772 | | $ | 679,241 | | $ | 640,265 | | $ | 677,116 | | $ | 2,689,699 | | $ | 2,625,394 | |
Reinsurance Ceded | | (422,865 | ) | (305,829 | ) | (379,729 | ) | (334,040 | ) | (388,742 | ) | (1,527,053 | ) | (1,408,340 | ) |
Net Premiums and Policy Fees | | 275,196 | | 322,943 | | 299,512 | | 306,225 | | 288,374 | | 1,162,646 | | 1,217,054 | |
Net investment income | | 402,251 | | 411,997 | | 422,500 | | 429,548 | | 419,631 | | 1,665,036 | | 1,683,676 | |
RIGL - Derivatives | | 23,145 | | (23,072 | ) | (119,888 | ) | (94,034 | ) | 98,745 | | (177,953 | ) | (138,249 | ) |
RIGL - All Other Investments | | 8,662 | | 47,899 | | 67,704 | | 110,787 | | (72,024 | ) | 300,194 | | 154,366 | |
| | | | | | | | | | | | | | | |
OTTI losses | | (46,706 | ) | (21,856 | ) | (36,683 | ) | (12,898 | ) | (3,904 | ) | (227,770 | ) | (75,341 | ) |
OTTI losses/(gains) recognized in OCI (before taxes) | | 28,426 | | 9,987 | | 19,885 | | 5,283 | | (1,324 | ) | 47,725 | | 33,831 | |
Net OTTI losses recognized in earnings | | (18,280 | ) | (11,869 | ) | (16,798 | ) | (7,615 | ) | (5,228 | ) | (180,045 | ) | (41,510 | ) |
Other income | | 178,677 | | 43,872 | | 59,072 | | 58,190 | | 61,284 | | 298,148 | | 222,418 | |
Total Revenues | | 869,651 | | 791,770 | | 712,102 | | 803,101 | | 790,782 | | 3,068,026 | | 3,097,755 | |
| | | | | | | | | | | | | | | |
BENEFITS & EXPENSES | | | | | | | | | | | | | | | |
Benefits and settlement expenses | | 474,254 | | 507,295 | | 525,371 | | 549,567 | | 507,196 | | 1,977,979 | | 2,089,429 | |
Amortization of deferred policy acquisition costs and value of business acquired | | 94,732 | | 81,289 | | 23,086 | | 42,386 | | 62,961 | | 345,569 | | 209,722 | |
Other operating expenses | | 62,832 | | 66,680 | | 61,084 | | 65,213 | | 65,356 | | 213,609 | | 258,333 | |
Interest expense - subsidiaries | | 2,469 | | 2,158 | | 5,183 | | 6,073 | | 6,244 | | 30,857 | | 19,658 | |
Interest expense - holding company - other debt | | 23,195 | | 23,671 | | 23,517 | | 23,463 | | 23,494 | | 45,631 | | 94,145 | |
Interest expense - holding company - hybrid securities | | 9,401 | | 9,401 | | 9,401 | | 9,402 | | 9,401 | | 37,603 | | 37,605 | |
Total Benefits and Expenses | | 666,883 | | 690,494 | | 647,642 | | 696,104 | | 674,652 | | 2,651,248 | | 2,708,892 | |
| | | | | | | | | | | | | | | |
INCOME BEFORE INCOME TAX | | 202,768 | | 101,276 | | 64,460 | | 106,997 | | 116,130 | | 416,778 | | 388,863 | |
Income tax expense | | 71,757 | | 31,570 | | 23,216 | | 36,626 | | 37,655 | | 145,290 | | 129,067 | |
NET INCOME | | 131,011 | | 69,706 | | 41,244 | | 70,371 | | 78,475 | | 271,488 | | 259,796 | |
Less: Net Income (loss) attributable to noncontrolling interests | | — | | (73 | ) | (127 | ) | (77 | ) | (168 | ) | — | | (445 | ) |
NET INCOME AVAILABLE TO PLC’S COMMON SHAREOWNERS | | $ | 131,011 | | $ | 69,779 | | $ | 41,371 | | $ | 70,448 | | $ | 78,643 | | $ | 271,488 | | $ | 260,241 | |
| | | | | | | | | | | | | | | |
PER SHARE DATA FOR QUARTER | | | | | | | | | | | | | | | |
Operating income-diluted * | | $ | 1.51 | | $ | 0.78 | | $ | 0.62 | | $ | 0.71 | | $ | 0.62 | | | | | |
RIGL - Derivatives net of gains related to corp debt, investments and annuities | | 0.03 | | (0.24 | ) | (0.52 | ) | (0.67 | ) | 0.87 | | | | | |
RIGL - All Other Investments | | (0.04 | ) | 0.26 | | 0.37 | | 0.76 | | (0.59 | ) | | | | |
Net income available to PLC’s common shareowners-diluted | | $ | 1.50 | | $ | 0.80 | | $ | 0.47 | | $ | 0.80 | | $ | 0.90 | | | | | |
Average shares outstanding-diluted | | 87,459,899 | | 87,551,386 | | 87,666,035 | | 87,701,592 | | 87,781,602 | | | | | |
Dividends paid | | $ | 0.12 | | $ | 0.12 | | $ | 0.14 | | $ | 0.14 | | $ | 0.14 | | | | | |
PER SHARE DATA FOR YTD | | | | | | | | | | | | | | | |
Operating income-diluted * | | $ | 3.97 | | $ | 0.78 | | $ | 1.39 | | $ | 2.11 | | $ | 2.73 | | | | | |
RIGL - Derivatives net of gains related to corp debt, investments and annuities | | (1.63 | ) | (0.24 | ) | (0.77 | ) | (1.43 | ) | (0.56 | ) | | | | |
RIGL - All Other Investments | | 1.00 | | 0.26 | | 0.65 | | 1.39 | | 0.80 | | | | | |
Net income available to PLC’s common shareowners-diluted | | $ | 3.34 | | $ | 0.80 | | $ | 1.27 | | $ | 2.07 | | $ | 2.97 | | | | | |
Average shares outstanding-diluted | | 81,249,265 | | 87,551,386 | | 87,609,027 | | 87,640,221 | | 87,675,857 | | | | | |
Dividends paid | | $ | 0.48 | | $ | 0.12 | | $ | 0.26 | | $ | 0.40 | | $ | 0.54 | | | | | |
* “Operating Income” is a non-GAAP financial measure. “Net income available to PLC’s common shareowners” is a GAAP financial measure to which "Operating Income" may be compared.
| Draft 2/9/2011 |
Page 4
GAAP Consolidated Balance Sheets
(Dollars In Thousands) | | 4TH QTR | | 1ST QTR | | 2ND QTR | | 3RD QTR | | 4TH QTR | |
(Unaudited) | | 2009 | | 2010 | | 2010 | | 2010 | | 2010 | |
ASSETS | | | | | | | | | | | |
| | | | | | | | | | | |
Fixed maturities | | $ | 22,830,427 | | $ | 23,203,026 | | $ | 23,687,528 | | $ | 24,838,626 | | $ | 24,676,939 | |
Equity securities | | 275,497 | | 280,703 | | 308,951 | | 335,151 | | 359,412 | |
Mortgage loans | | 3,877,087 | | 4,861,699 | | 4,905,276 | | 4,884,102 | | 4,891,211 | |
Investment real estate | | 25,188 | | 25,068 | | 22,431 | | 24,669 | | 25,340 | |
Policy loans | | 794,276 | | 783,580 | | 775,105 | | 767,214 | | 793,448 | |
Other long-term investments | | 204,754 | | 198,014 | | 182,075 | | 256,093 | | 277,955 | |
Long-term investments | | 28,007,229 | | 29,352,090 | | 29,881,366 | | 31,105,855 | | 31,024,305 | |
Short-term investments | | 1,049,609 | | 647,952 | | 972,804 | | 483,698 | | 352,824 | |
Total investments | | 29,056,838 | | 30,000,042 | | 30,854,170 | | 31,589,553 | | 31,377,129 | |
Cash | | 205,325 | | 202,934 | | 156,524 | | 151,340 | | 264,425 | |
Accrued investment income | | 285,350 | | 308,779 | | 303,916 | | 320,668 | | 329,078 | |
Accounts and premiums receivable | | 56,216 | | 49,941 | | 38,817 | | 65,948 | | 58,580 | |
Reinsurance receivable | | 5,333,401 | | 5,445,109 | | 5,553,385 | | 5,563,824 | | 5,608,029 | |
Deferred policy acquisition costs and value of business acquired | | 3,663,350 | | 3,634,057 | | 3,671,153 | | 3,642,484 | | 3,855,336 | |
Goodwill | | 117,856 | | 117,081 | | 116,307 | | 115,532 | | 114,758 | |
Property and equipment, net | | 37,037 | | 36,909 | | 37,831 | | 37,722 | | 39,386 | |
Other assets | | 176,303 | | 168,274 | | 188,862 | | 207,198 | | 169,663 | |
Current/Deferred income tax | | 115,447 | | 14,225 | | 43,609 | | 2,438 | | 45,582 | |
Assets related to separate accounts | | | | | | | | | | | |
Variable annuity | | 2,948,457 | | 3,306,242 | | 3,307,239 | | 3,899,308 | | 5,170,193 | |
Variable universal life | | 316,007 | | 334,134 | | 304,423 | | 336,299 | | 534,219 | |
| | | | | | | | | | | |
TOTAL ASSETS | | $ | 42,311,587 | | $ | 43,617,727 | | $ | 44,576,236 | | $ | 45,932,314 | | $ | 47,566,378 | |
The 4Q 2010 balance sheet includes preliminary purchase GAAP accounting adjustments related to the United Investors Life Insurance Company acquisition. It is possible that these amounts may change as balances are finalized.
| Draft 2/9/2011 |
Page 5
GAAP Consolidated Balance Sheets - Continued
(Dollars In Thousands) | | 4TH QTR | | 1ST QTR | | 2ND QTR | | 3RD QTR | | 4TH QTR | |
(Unaudited) | | 2009 | | 2010 | | 2010 | | 2010 | | 2010 | |
| | | | | | | | | | | |
LIABILITIES | | | | | | | | | | | |
Policy liabilities and accruals | | | | | | | | | | | |
Future policy benefits and claims | | $ | 17,327,279 | | $ | 17,456,391 | | $ | 17,679,905 | | $ | 17,824,414 | | $ | 18,534,156 | |
Unearned premiums | | 1,220,988 | | 1,220,255 | | 1,258,161 | | 1,305,092 | | 1,182,828 | |
Stable value product deposits | | 3,581,150 | | 3,453,950 | | 3,487,963 | | 3,105,822 | | 3,076,233 | |
Annuity deposits | | 9,911,040 | | 10,035,799 | | 10,309,546 | | 10,451,322 | | 10,591,605 | |
Other policyholders’ funds | | 515,078 | | 534,740 | | 551,860 | | 577,275 | | 578,037 | |
Other liabilities | | 715,110 | | 907,330 | | 1,059,034 | | 1,115,755 | | 926,201 | |
Mortgage loan backed certificates | | — | | 110,679 | | 85,873 | | 74,324 | | 61,678 | |
Deferred income taxes | | 553,062 | | 718,070 | | 891,177 | | 1,113,532 | | 1,022,130 | |
Non-recourse funding obligations | | 575,000 | | 575,000 | | 556,600 | | 548,000 | | 532,400 | |
Debt | | 1,644,852 | | 1,619,852 | | 1,474,852 | | 1,485,852 | | 1,501,852 | |
Subordinated debt securities | | 524,743 | | 524,743 | | 524,743 | | 524,743 | | 524,743 | |
Liabilities related to separate accounts | | | | | | | | | | | |
Variable annuity | | 2,948,457 | | 3,306,242 | | 3,307,239 | | 3,899,308 | | 5,170,193 | |
Variable universal life | | 316,007 | | 334,134 | | 304,423 | | 336,299 | | 534,219 | |
TOTAL LIABILITIES | | 39,832,766 | | 40,797,185 | | 41,491,376 | | 42,361,738 | | 44,236,275 | |
| | | | | | | | | | | |
SHAREOWNERS’ EQUITY | | | | | | | | | | | |
Common stock | | 44,388 | | 44,388 | | 44,388 | | 44,388 | | 44,388 | |
Additional paid-in-capital | | 576,887 | | 579,915 | | 581,646 | | 584,865 | | 586,592 | |
Treasury stock | | (25,929 | ) | (25,997 | ) | (25,745 | ) | (26,101 | ) | (26,072 | ) |
Retained earnings | | 2,204,644 | | 2,278,443 | | 2,307,820 | | 2,366,276 | | 2,432,925 | |
Accumulated other comprehensive income (loss) | | (321,169 | ) | (55,716 | ) | 177,490 | | 601,964 | | 293,254 | |
TOTAL PROTECTIVE LIFE CORPORATION’S SHAREOWNERS’ EQUITY | | 2,478,821 | | 2,821,033 | | 3,085,599 | | 3,571,392 | | 3,331,087 | |
Noncontrolling interest | | — | | (491 | ) | (739 | ) | (816 | ) | (984 | ) |
TOTAL EQUITY | | 2,478,821 | | 2,820,542 | | 3,084,860 | | 3,570,576 | | 3,330,103 | |
TOTAL LIABILITIES AND SHAREOWNERS’ EQUITY | | $ | 42,311,587 | | $ | 43,617,727 | | $ | 44,576,236 | | $ | 45,932,314 | | $ | 47,566,378 | |
| | | | | | | | | | | |
PROTECTIVE LIFE CORPORATION’S SHAREOWNERS’ EQUITY PER SHARE | | | | | | | | | | | |
Total Protective Life Corporation’s Shareowners’ Equity | | $ | 28.96 | | $ | 32.96 | | $ | 36.02 | | $ | 41.69 | | $ | 38.88 | |
Less: Accumulated other comprehensive income (loss) | | (3.76 | ) | (0.65 | ) | 2.07 | | 7.03 | | 3.42 | |
Excluding accumulated other comprehensive income (loss)* | | $ | 32.72 | | $ | 33.61 | | $ | 33.95 | | $ | 34.66 | | $ | 35.46 | |
| | | | | | | | | | | |
Total Protective Life Corporation’s Shareowners’ Equity | | $ | 2,478,821 | | $ | 2,821,033 | | $ | 3,085,599 | | $ | 3,571,392 | | $ | 3,331,087 | |
Less: Accumulated other comprehensive income (loss) | | (321,169 | ) | (55,716 | ) | 177,490 | | 601,964 | | 293,254 | |
Total Protective Life Corporation’s Shareowners’ Equity (excluding accumulated other comprehensive income (loss)) * | | $ | 2,799,990 | | $ | 2,876,749 | | $ | 2,908,109 | | $ | 2,969,428 | | $ | 3,037,833 | |
| | | | | | | | | | | |
Common shares outstanding | | 85,580,803 | | 85,601,358 | | 85,662,191 | | 85,664,518 | | 85,667,977 | |
Treasury Stock shares | | 3,196,157 | | 3,175,602 | | 3,114,769 | | 3,112,442 | | 3,108,983 | |
* “Total Protective Life Corporation’s Shareowners’ equity excluding accumulated other comprehensive income (loss)” is a non-GAAP financial measure. “Total Protective Life Corporation’s Shareowners’ equity” is a GAAP financial measure to which “Total Protective Life Corporation’s Shareowners’ equity excluding accumulated other comprehensive income (loss)” may be compared.
The 4Q 2010 balance sheet includes preliminary purchase GAAP accounting adjustments related to the United Investors Life Insurance Company acquisition. It is possible that these amounts may change as balances are finalized.
| Draft 2/9/2011 |
Page 6
Calculation of Operating Earnings Per Share
(Dollars In Thousands) | | 4TH QTR | | 1ST QTR | | 2ND QTR | | 3RD QTR | | 4TH QTR | | 12 MOS | |
(Unaudited) | | 2009 | | 2010 | | 2010 | | 2010 | | 2010 | | 2009 | | 2010 | |
| | | | | | | | | | | | | | | |
CALCULATION OF NET INCOME PER SHARE | | | | | | | | | | | | | | | |
| | | | | | | | | | | | | | | |
Net income available to PLC’s common shareowners | | $ | 131,011 | | $ | 69,779 | | $ | 41,371 | | $ | 70,448 | | $ | 78,643 | | $ | 271,488 | | $ | 260,241 | |
| | | | | | | | | | | | | | | |
Average shares outstanding-basic | | 86,491,754 | | 86,500,199 | | 86,562,379 | | 86,603,569 | | 86,600,622 | | 80,488,694 | | 86,567,069 | |
Average shares outstanding-diluted | | 87,459,899 | | 87,551,386 | | 87,666,035 | | 87,701,592 | | 87,781,602 | | 81,249,265 | | 87,675,857 | |
| | | | | | | | | | | | | | | |
Net income available to PLC’s common shareowners per share-basic | | $ | 1.51 | | $ | 0.81 | | $ | 0.48 | | $ | 0.81 | | $ | 0.91 | | $ | 3.37 | | $ | 3.01 | |
Net income available to PLC’s common shareowners per share-diluted | | $ | 1.50 | | $ | 0.80 | | $ | 0.47 | | $ | 0.80 | | $ | 0.90 | | $ | 3.34 | | $ | 2.97 | |
| | | | | | | | | | | | | | | |
Income from continuing operations | | $ | 131,011 | | $ | 69,779 | | $ | 41,371 | | $ | 70,448 | | $ | 78,643 | | $ | 271,488 | | $ | 260,241 | |
| | | | | | | | | | | | | | | �� | | | | | | | |
EPS (basic) | | $ | 1.51 | | $ | 0.81 | | $ | 0.48 | | $ | 0.81 | | $ | 0.91 | | $ | 3.37 | | $ | 3.01 | |
EPS (diluted) | | $ | 1.50 | | $ | 0.80 | | $ | 0.47 | | $ | 0.80 | | $ | 0.90 | | $ | 3.34 | | $ | 2.97 | |
| | | | | | | | | | | | | | | |
CALCULATION OF REALIZED INVESTMENT GAINS (LOSSES) PER SHARE | | | | | | | | | | | | | | | |
| | | | | | | | | | | | | | | |
RIGL - Derivatives | | $ | 23,145 | | $ | (23,072 | ) | $ | (119,888 | ) | $ | (94,034 | ) | $ | 98,745 | | $ | (177,953 | ) | $ | (138,249 | ) |
Derivative activity related to Corporate Debt and Investments | | — | | (42 | ) | (42 | ) | (42 | ) | (42 | ) | (3,401 | ) | (168 | ) |
Derivative activity related to Annuities | | (19,003 | ) | (9,549 | ) | 49,417 | | 4,248 | | 19,329 | | (22,620 | ) | 63,445 | |
RIGL - All Other Investments | | (9,618 | ) | 36,030 | | 50,906 | | 103,172 | | (77,252 | ) | 120,149 | | 112,856 | |
Related amortization of DAC & VOBA | | 3,559 | | (214 | ) | (328 | ) | (1,606 | ) | (2,993 | ) | 5,203 | | (5,141 | ) |
| | (1,917 | ) | 3,153 | | (19,935 | ) | 11,738 | | 37,787 | | (78,622 | ) | 32,743 | |
Tax effect | | 671 | | (1,104 | ) | $ | 6,977 | | (4,108 | ) | (13,226 | ) | 27,518 | | (11,461 | ) |
| | $ | (1,246 | ) | $ | 2,049 | | $ | (12,958 | ) | $ | 7,630 | | $ | 24,561 | | $ | (51,104 | ) | $ | 21,282 | |
| | | | | | | | | | | | | | | |
RIGL - Derivatives per share-diluted | | $ | 0.03 | | $ | (0.24 | ) | $ | (0.52 | ) | $ | (0.67 | ) | $ | 0.87 | | $ | (1.63 | ) | $ | (0.56 | ) |
RIGL - All Other Investments per share-diluted | | $ | (0.04 | ) | $ | 0.26 | | $ | 0.37 | | $ | 0.76 | | $ | (0.59 | ) | $ | 1.00 | | $ | 0.80 | |
| | | | | | | | | | | | | | | |
OPERATING INCOME PER SHARE * | | | | | | | | | | | | | | | |
| | | | | | | | | | | | | | | |
Net income available to PLC’s common shareowners per share-diluted | | $ | 1.50 | | $ | 0.80 | | $ | 0.47 | | $ | 0.80 | | $ | 0.90 | | $ | 3.34 | | $ | 2.97 | |
RIGL - Derivatives per share-diluted | | 0.03 | | (0.24 | ) | (0.52 | ) | (0.67 | ) | 0.87 | | (1.63 | ) | (0.56 | ) |
RIGL - All Other Investments per share-diluted | | (0.04 | ) | 0.26 | | 0.37 | | 0.76 | | (0.59 | ) | 1.00 | | 0.80 | |
Operating income per share-diluted | | $ | 1.51 | | $ | 0.78 | | $ | 0.62 | | $ | 0.71 | | $ | 0.62 | | $ | 3.97 | | $ | 2.73 | |
| | | | | | | | | | | | | | | |
NET OPERATING INCOME * | | | | | | | | | | | | | | | |
| | | | | | | | | | | | | | | |
Net income available to PLC’s common shareowners | | $ | 131,011 | | $ | 69,779 | | $ | 41,371 | | $ | 70,448 | | $ | 78,643 | | $ | 271,488 | | $ | 260,241 | |
Less: RIGL - Derivatives net of tax & gains related to corp debt, investments & annuities | | 2,692 | | (21,231 | ) | (45,833 | ) | (58,388 | ) | 76,721 | | (132,583 | ) | (48,731 | ) |
Less: RIGL - All Other Investments net of tax and amortization | | (3,938 | ) | 23,280 | | 32,877 | | 66,018 | | (52,159 | ) | 81,479 | | 70,016 | |
Net operating income | | $ | 132,257 | | $ | 67,730 | | $ | 54,327 | | $ | 62,818 | | $ | 54,081 | | $ | 322,592 | | $ | 238,956 | |
| | | | | | | | | | | | | | | |
PRE-TAX OPERATING INCOME ** | | | | | | | | | | | | | | | |
| | | | | | | | | | | | | | | |
Income before income tax and discontinued operations | | $ | 202,768 | | $ | 101,275 | | $ | 64,461 | | $ | 106,997 | | $ | 116,130 | | $ | 416,778 | | $ | 388,863 | |
Less: RIGL - Derivatives | | 23,145 | | (23,072 | ) | (119,888 | ) | (94,034 | ) | 98,745 | | (177,953 | ) | (138,249 | ) |
Less: Derivative activity related to corporate debt, investments & annuities *** | | (19,003 | ) | (9,591 | ) | 49,375 | | 4,206 | | 19,287 | | (26,021 | ) | 63,277 | |
Less: RIGL - All Other Investments | | (9,618 | ) | 36,030 | | 50,906 | | 103,172 | | (77,252 | ) | 120,149 | | 112,856 | |
Less: Related amortization of DAC & VOBA | | 3,559 | | (214 | ) | (328 | ) | (1,606 | ) | (2,993 | ) | 5,203 | | (5,141 | ) |
Less: Minority Interest | | — | | (74 | ) | (126 | ) | (77 | ) | (168 | ) | — | | (445 | ) |
Pre-tax operating income | | $ | 204,685 | | $ | 98,196 | | $ | 84,522 | | $ | 95,336 | | $ | 78,511 | | $ | 495,400 | | $ | 356,565 | |
* “Net Operating Income” and “Operating Income Per Share” are non-GAAP financial measures. “Net Income available to PLC’s common shareowners” and “Net Income available to PLC’s common shareowners Per Share” are GAAP financial measures to which “Net Operating Income” and “Operating Income Per Share” may be compared.
** “Pre-tax Operating Income” is a non-GAAP financial measure. “Income Before Income Tax” is a GAAP financial measure to which “Pre-tax Operating Income” may be compared.
*** Includes derivative (gains)/losses
| Draft 2/9/2011 |
Page 7
Invested Asset Summary
(Dollars In Millions) | | 4TH QTR | | 1ST QTR | | 2ND QTR | | 3RD QTR | | 4TH QTR | | | |
(Unaudited) | | 2009 | | 2010 | | 2010 | | 2010 | | 2010 | | | |
| | | | | | | | | | | | | |
Total Portfolio | | | | | | | | | | | | | |
| | | | | | | | | | | | | |
Fixed Maturities | | $ | 22,830.4 | | $ | 23,203.0 | | $ | 23,687.5 | | $ | 24,838.6 | | $ | 24,676.9 | | 79 | % |
Mortgage Loans | | 3,877.1 | | 4,861.7 | | 4,905.3 | | 4,884.1 | | 4,891.2 | | 16 | % |
Investment Real Estate | | 25.2 | | 25.1 | | 22.4 | | 24.7 | | 25.3 | | 0 | % |
Equity Securities | | 275.5 | | 280.7 | | 309.0 | | 335.2 | | 359.4 | | 1 | % |
Policy Loans | | 794.3 | | 783.6 | | 775.1 | | 767.2 | | 793.5 | | 2 | % |
Short-Term Investments | | 1,049.6 | | 647.9 | | 972.8 | | 483.7 | | 352.8 | | 1 | % |
Other Long-Term Investments | | 204.7 | | 198.0 | | 182.1 | | 256.1 | | 278.0 | | 1 | % |
Total Invested Assets | | $ | 29,056.8 | | $ | 30,000.0 | | $ | 30,854.2 | | $ | 31,589.6 | | $ | 31,377.1 | | 100 | % |

| | Draft 2/9/2011 Page 8 |
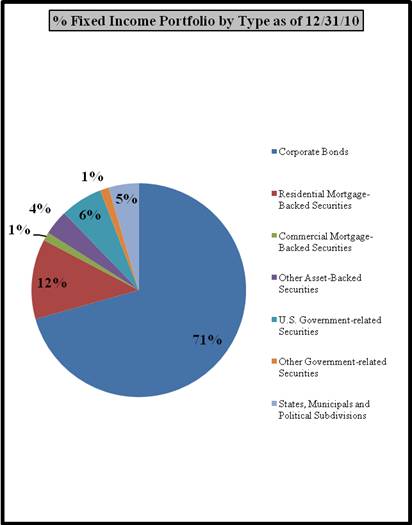
Invested Asset Summary - Fixed Income |
| | | | | | | | | | | | | |
(Dollars In Millions) | | 4TH QTR | | 1ST QTR | | 2ND QTR | | 3RD QTR | | 4TH QTR | | | |
(Unaudited) | | 2009 | | 2010 | | 2010 | | 2010 | | 2010 | | | |
| | | | | | | | | | | | | |
Fixed Income | | | | | | | | | | | | | |
| | | | | | | | | | | | | |
Corporate Bonds | | $ | 14,847.8 | | $ | 15,724.6 | | $ | 15,950.7 | | $ | 17,255.7 | | $ | 17,433.7 | | 71 | % |
Residential Mortgage-Backed Securities | | 3,917.5 | | 3,720.4 | | 3,511.4 | | 3,363.0 | | 2,979.8 | | 12 | % |
Commercial Mortgage-Backed Securities | | 1,124.3 | | 270.9 | | 297.0 | | 312.2 | | 312.6 | | 1 | % |
Other Asset-Backed Securities | | 1,120.8 | | 959.2 | | 951.6 | | 877.2 | | 927.1 | | 4 | % |
U.S. Government-related Securities | | 811.3 | | 1,579.4 | | 1,824.2 | | 1,718.5 | | 1,572.1 | | 6 | % |
Other Government-related Securities | | 608.5 | | 307.1 | | 368.8 | | 362.0 | | 327.8 | | 1 | % |
States, Municipals and Political Subdivisions | | 400.2 | | 641.4 | | 783.8 | | 950.0 | | 1,123.8 | | 5 | % |
Total Fixed Income Portfolio | | $ | 22,830.4 | | $ | 23,203.0 | | $ | 23,687.5 | | $ | 24,838.6 | | $ | 24,676.9 | | 100 | % |
| | | | | | | | | | | | | |
Fixed Income - Quality | | | | | | | | | | | | | |
| | | | | | | | | | | | | |
AAA | | 21.0 | % | 18.6 | % | 18.9 | % | 17.3 | % | 17.0 | % | | |
AA | | 4.9 | % | 4.0 | % | 4.6 | % | 4.7 | % | 4.8 | % | | |
A | | 17.6 | % | 18.0 | % | 17.4 | % | 17.8 | % | 17.9 | % | | |
BBB | | 42.9 | % | 45.6 | % | 45.1 | % | 46.6 | % | 47.8 | % | | |
Below investment grade | | 13.6 | % | 13.8 | % | 14.0 | % | 13.6 | % | 12.5 | % | | |
| | 100.0 | % | 100.0 | % | 100.0 | % | 100.0 | % | 100.0 | % | | |
Note: Prior periods restated to be consistent with current quarter presentation.
| | Draft 2/9/2011 Page 9 |
Invested Asset Summary - Mortgages | |
| | | | | | | | | | | |
(Dollars In Millions) | | 4TH QTR | | 1ST QTR | | 2ND QTR | | 3RD QTR | | 4TH QTR | |
(Unaudited) | | 2009 | | 2010 | | 2010 | | 2010 | | 2010 | |
| | | | | | | | | | | |
Mortgage Loans - Type | | | | | | | | | | | |
| | | | | | | | | | | |
Retail | | 64.5 | % | 66.4 | % | 66.3 | % | 66.3 | % | 66.2 | % |
Apartments | | 11.3 | % | 10.9 | % | 11.6 | % | 12.2 | % | 12.7 | % |
Office Buildings | | 14.4 | % | 13.3 | % | 13.0 | % | 12.9 | % | 12.2 | % |
Warehouses | | 7.4 | % | 7.4 | % | 7.1 | % | 7.2 | % | 7.1 | % |
Miscellaneous | | 2.4 | % | 2.0 | % | 2.0 | % | 1.4 | % | 1.8 | % |
| | 100.0 | % | 100.0 | % | 100.0 | % | 100.0 | % | 100.0 | % |
| | | | | | | | | | | |
Delinquent Loans & Foreclosed Properties | | | | | | | | | | | |
| | | | | | | | | | | |
60 Days Past Due | | $ | 5.9 | | $ | 23.8 | | $ | 21.0 | | $ | — | | $ | — | |
90 Days Past Due | | 6.5 | | 21.4 | | 8.2 | | 16.5 | | 12.7 | |
Renegotiated Loans | | — | | — | | 35.7 | | 35.7 | | 16.1 | |
Foreclosed Real Estate | | 10.7 | | — | | 0.7 | | 3.3 | | 4.8 | |
| | $ | 23.1 | | $ | 45.2 | | $ | 65.6 | | $ | 55.5 | | $ | 33.6 | (1) |
(1) Includes $16.1 million of loans being restructured under the terms of a pooling and servicing agreement.
Invested Asset Summary - Trading Portfolios | |
| | | | | | | | | | | |
(Dollars In Millions) | | 4TH QTR | | 1ST QTR | | 2ND QTR | | 3RD QTR | | 4TH QTR | |
(Unaudited) | | 2009 | | 2010 | | 2010 | | 2010 | | 2010 | |
| | | | | | | | | | | |
Trading Portfolio Composition (excl. Modco Trading Portfolio) | | | | | | | | | | | |
| | | | | | | | | | | |
Rating | | | | | | | | | | | |
AAA | | $ | 21.6 | | $ | 19.6 | | $ | 17.4 | | $ | 14.8 | | $ | 10.7 | |
AA | | 6.2 | | 6.3 | | 6.4 | | 1.3 | | 1.0 | |
A | | 43.2 | | 23.8 | | 12.6 | | — | | — | |
BBB | | 120.3 | | 82.8 | | 65.0 | | 47.5 | | 46.3 | |
Below investment grade | | 81.3 | | 84.8 | | 80.0 | | 69.3 | | 61.4 | |
Total | | $ | 272.6 | | $ | 217.3 | | $ | 181.4 | | $ | 132.9 | | $ | 119.4 | |
| | | | | | | | | | | |
Modco Trading Portfolio | | | | | | | | | | | |
| | | | | | | | | | | |
Rating | | | | | | | | | | | |
AAA | | $ | 834.7 | | $ | 780.6 | | $ | 919.9 | | $ | 898.2 | | $ | 816.1 | |
AA | | 73.2 | | 117.2 | | 133.7 | | 182.0 | | 177.4 | |
A | | 544.1 | | 574.1 | | 565.2 | | 636.7 | | 584.4 | |
BBB | | 950.3 | | 969.9 | | 978.2 | | 996.3 | | 1,008.9 | |
Below investment grade | | 281.5 | | 291.6 | | 275.8 | | 292.7 | | 269.7 | |
Short-term investments | | 250.8 | | 236.5 | | 130.5 | | 71.5 | | 114.3 | |
Total | | $ | 2,934.6 | | $ | 2,969.9 | | $ | 3,003.3 | | $ | 3,077.4 | | $ | 2,970.8 | |

| | Draft 2/9/2011 Page 11 |
Invested Asset Summary - MBS - Alt-A | |
| |
Mortgage-backed Securities Collateralized by Alt-A Mortgage Loans as of December 31, 2010: | |
| | | | | | | | | | | | | |
(Dollars In Millions) | | 2006 and | | | | | | | | | | | |
(Unaudited) | | Prior | | 2007 | | 2008 | | 2009 | | 2010 | | Total | |
| | | | | | | | | | | | | |
Estimated Fair Value of Security by Year of Security Origination | | | | | | | | | | | | | |
| | | | | | | | | | | | | |
Rating | | | | | | | | | | | | | |
AAA | | $ | 8.6 | | $ | — | | $ | — | | $ | — | | $ | 1.7 | | $ | 10.3 | |
A | | 4.0 | | — | | — | | — | | — | | 4.0 | |
BBB | | 1.0 | | — | | — | | — | | — | | 1.0 | |
Below investment grade | | 242.7 | | 143.6 | | — | | — | | — | | 386.3 | |
Total mortgage-backed securities collateralized by Alt-A mortgage loans | | $ | 256.3 | | $ | 143.6 | | $ | — | | $ | — | | $ | 1.7 | | $ | 401.6 | |
| | | | | | | | | | | | | |
Estimated Unrealized Gain (Loss) of Security by Year of Security Origination | | | | | | | | | | | | | |
| | | | | | | | | | | | | |
Rating | | | | | | | | | | | | | |
AAA | | $ | (0.2 | ) | $ | — | | $ | — | | $ | — | | $ | — | | $ | (0.2 | ) |
A | | 0.4 | | — | | — | | — | | — | | 0.4 | |
BBB | | (1.0 | ) | — | | — | | — | | — | | (1.0 | ) |
Below investment grade | | (23.2 | ) | (11.0 | ) | — | | — | | — | | (34.2 | ) |
Total mortgage-backed securities collateralized by Alt-A mortgage loans | | $ | (24.0 | ) | $ | (11.0 | ) | $ | — | | $ | — | | $ | — | | $ | (35.0 | ) |
| | Draft 2/9/2011 Page 12 |
Invested Asset Summary - MBS - Sub-prime | |
| | | | | | | | | | | | | |
Mortgage-backed Securities Collateralized by Sub-prime Loans as of December 31, 2010: | |
| | | | | | | | | | | | | |
(Dollars In Millions) | | 2006 and | | | | | | | | | | | |
(Unaudited) | | Prior | | 2007 | | 2008 | | 2009 | | 2010 | | Total | |
| | | | | | | | | | | | | |
Estimated Fair Value of Security by Year of Security Origination | | | | | | | | | | | | | |
| | | | | | | | | | | | | |
Rating | | | | | | | | | | | | | |
AAA | | $ | 4.0 | | $ | — | | $ | — | | $ | — | | $ | — | | $ | 4.0 | |
AA | | 2.1 | | — | | — | | — | | — | | 2.1 | |
BBB | | 2.1 | | — | | — | | — | | — | | 2.1 | |
Below investment grade | | 16.3 | | 17.6 | | — | | — | | — | | 33.9 | |
Total mortgage-backed securities collateralized by sub-prime mortgage loans | | $ | 24.5 | | $ | 17.6 | | $ | — | | $ | — | | $ | — | | $ | 42.1 | |
| | | | | | | | | | | | | |
Estimated Unrealized Gain (Loss) of Security by Year of Security Origination | | | | | | | | | | | | | |
| | | | | | | | | | | | | |
Rating | | | | | | | | | | | | | |
AAA | | $ | (0.2 | ) | $ | — | | $ | — | | $ | — | | $ | — | | $ | (0.2 | ) |
AA | | (0.1 | ) | — | | — | | — | | — | | (0.1 | ) |
BBB | | (0.5 | ) | — | | — | | — | | — | | (0.5 | ) |
Below investment grade | | (4.0 | ) | (16.6 | ) | — | | — | | — | | (20.6 | ) |
Total mortgage-backed securities collateralized by sub-prime mortgage loans | | $ | (4.8 | ) | $ | (16.6 | ) | $ | — | | $ | — | | $ | — | | $ | (21.4 | ) |
Invested Asset Summary - MBS - Prime
Mortgage-backed Securities Collateralized by Prime Loans as of December 31, 2010:
(Dollars In Millions) | | 2006 and | | | | | | | | | | | |
(Unaudited) | | Prior | | 2007 | | 2008 | | 2009 | | 2010 | | Total | |
| | | | | | | | | | | | | |
Estimated Fair Value of Security by Year of Security Origination | | | | | | | | | | | | | |
| | | | | | | | | | | | | |
Rating | | | | | | | | | | | | | |
AAA | | $ | 889.4 | | $ | 6.9 | | $ | — | | $ | — | | $ | 135.2 | | $ | 1,031.5 | |
AA | | 132.6 | | — | | — | | — | | — | | 132.6 | |
A | | 9.4 | | 4.8 | | — | | — | | — | | 14.2 | |
BBB | | 106.7 | | — | | — | | — | | — | | 106.7 | |
Below investment grade | | 1,018.4 | | 232.7 | | — | | — | | — | | 1,251.1 | |
Total mortgage-backed securities collateralized by prime loans | | $ | 2,156.5 | | $ | 244.4 | | $ | — | | $ | — | | $ | 135.2 | | $ | 2,536.1 | |
| | | | | | | | | | | | | |
Includes $825.9 million of agency mortgage backed securities. | | | | | | | | | | | | | |
| | | | | | | | | | | | | |
Estimated Unrealized Gain (Loss) of Security by Year of Security Origination | | | | | | | | | | | | | |
| | | | | | | | | | | | | |
Rating | | | | | | | | | | | | | |
AAA | | $ | 53.2 | | $ | 0.5 | | $ | — | | $ | — | | $ | (2.7 | ) | $ | 51.0 | |
AA | | 1.3 | | — | | — | | — | | — | | 1.3 | |
A | | (0.1 | ) | 0.4 | | — | | — | | — | | 0.3 | |
BBB | | 1.1 | | — | | — | | — | | — | | 1.1 | |
Below investment grade | | (67.4 | ) | (11.8 | ) | — | | — | | — | | (79.2 | ) |
Total mortgage-backed securities collateralized by prime loans | | $ | (11.9 | ) | $ | (10.9 | ) | $ | — | | $ | — | | $ | (2.7 | ) | $ | (25.5 | ) |
Invested Asset Summary - CMBS
Commercial Mortgage-backed Securities as of December 31, 2010:
(Dollars In Millions) | | 2006 and | | | | | | | | | | | |
(Unaudited) | | Prior | | 2007 | | 2008 | | 2009 | | 2010 | | Total | |
| | | | | | | | | | | | | |
Estimated Fair Value of Security by Year of Security Origination | | | | | | | | | | | | | |
| | | | | | | | | | | | | |
Rating | | | | | | | | | | | | | |
AAA | | $ | 170.4 | | $ | — | | $ | 47.2 | | $ | 3.9 | | $ | 85.6 | | $ | 307.1 | |
AA | | 2.6 | | — | | — | | — | | 2.9 | | 5.5 | |
Total commercial mortgage-backed securities | | $ | 173.0 | | $ | — | | $ | 47.2 | | $ | 3.9 | | $ | 88.5 | | $ | 312.6 | |
| | | | | | | | | | | | | |
Estimated Unrealized Gain (Loss) of Security by Year of Security Origination | | | | | | | | | | | | | |
| | | | | | | | | | | | | |
Rating | | | | | | | | | | | | | |
AAA | | $ | 6.1 | | $ | — | | $ | 3.0 | | $ | (0.1 | ) | $ | (0.9 | ) | $ | 8.1 | |
AA | | (0.1 | ) | — | | — | | — | | (0.1 | ) | (0.2 | ) |
Total commercial mortgage-backed securities | | $ | 6.0 | | $ | — | | $ | 3.0 | | $ | (0.1 | ) | $ | (1.0 | ) | $ | 7.9 | |
Invested Asset Summary - ABS*
Other Asset-backed Securities* as of December 31, 2010:
(Dollars In Millions) | | 2006 and | | | | | | | | | | | |
(Unaudited) | | Prior | | 2007 | | 2008 | | 2009 | | 2010 | | Total | |
| | | | | | | | | | | | | |
Estimated Fair Value of Security by Year of Security Origination | | | | | | | | | | | | | |
| | | | | | | | | | | | | |
Rating | | | | | | | | | | | | | |
AAA | | $ | 628.5 | | $ | 194.2 | | $ | — | | $ | 19.8 | | $ | 31.9 | | $ | 874.4 | |
AA | | 29.4 | | — | | — | | — | | — | | 29.4 | |
A | | 6.2 | | — | | — | | — | | — | | 6.2 | |
BBB | | 5.6 | | — | | — | | — | | — | | 5.6 | |
Below investment grade | | 0.5 | | 11.0 | | — | | — | | — | | 11.5 | |
Total other asset-backed securities | | $ | 670.2 | | $ | 205.2 | | $ | — | | $ | 19.8 | | $ | 31.9 | | $ | 927.1 | |
| | | | | | | | | | | | | |
Estimated Unrealized Gain (Loss) of Security by Year of Security Origination | | | | | | | | | | | | | |
| | | | | | | | | | | | | |
Rating | | | | | | | | | | | | | |
AAA | | $ | (13.9 | ) | $ | (2.3 | ) | $ | — | | $ | — | | $ | (0.1 | ) | $ | (16.3 | ) |
AA | | 2.7 | | — | | — | | — | | — | | 2.7 | |
A | | 0.3 | | — | | — | | — | | — | | 0.3 | |
BBB | | (0.8 | ) | — | | — | | — | | — | | (0.8 | ) |
Below investment grade | | (0.2 | ) | (10.6 | ) | — | | — | | — | | (10.8 | ) |
Total other asset-backed securities | | $ | (11.9 | ) | $ | (12.9 | ) | $ | — | | $ | — | | $ | (0.1 | ) | $ | (24.9 | ) |
* Excludes Residential and Commercial mortgage-backed securities
Invested Asset Summary - Other
(Dollars In Millions) | | GAAP | | | | | |
(Unaudited) | | Amortized | | Market | | Unrealized | |
(Excludes Modco portfolio) | | Cost | | Value | | Gain / (Loss) | |
Hybrid / Preferred Securities as of December 31, 2010 | | | | | | | |
| | | | | | | |
Domestic Exposure | | | | | | | |
Tier 1 | | $ | 998.7 | | $ | 1,004.6 | | $ | 5.9 | |
Preferred Stock | | 155.3 | | 159.3 | | 4.0 | |
Total Domestic Exposure | | $ | 1,154.0 | | $ | 1,163.9 | | $ | 9.9 | |
| | | | | | | |
European Exposure | | | | | | | |
Upper Tier 2 | | $ | 53.2 | | $ | 57.2 | | $ | 4.0 | |
Tier 1 | | 180.7 | | 164.8 | | (15.9 | ) |
Preferred Stock | | 64.4 | | 67.6 | | 3.2 | |
Total European Exposure | | $ | 298.3 | | $ | 289.6 | | $ | (8.7 | ) |
| | | | | | | |
Other Foreign Exposure | | | | | | | |
Tier 1 | | $ | 65.2 | | $ | 68.5 | | $ | 3.3 | |
Preferred Stock | | 0.1 | | 0.1 | | — | |
Total Other Foreign Exposure | | $ | 65.3 | | $ | 68.6 | | $ | 3.3 | |
| | | | | | | |
Total Domestic, European and Other Exposure | | | | | | | |
Upper Tier 2 | | $ | 53.2 | | $ | 57.2 | | $ | 4.0 | |
Tier 1 | | 1,244.6 | | 1,237.9 | | (6.7 | ) |
Preferred Stock | | 219.8 | | 227.0 | | 7.2 | |
Total Domestic, European and Other Exposure | | $ | 1,517.6 | | $ | 1,522.1 | | $ | 4.5 | |
Life Marketing Quarterly Trends
(Dollars In Thousands) | | 4TH QTR | | 1ST QTR | | 2ND QTR | | 3RD QTR | | 4TH QTR | | 12 MOS | |
(Unaudited) | | 2009 | | 2010 | | 2010 | | 2010 | | 2010 | | 2009 | | 2010 | |
| | | | | | | | | | | | �� | | | |
REVENUES | | | | | | | | | | | | | | | |
Gross Premiums and Policy Fees | | $ | 412,468 | | $ | 373,390 | | $ | 407,900 | | $ | 379,745 | | $ | 414,729 | | $ | 1,565,144 | | $ | 1,575,764 | |
Reinsurance Ceded | | (260,829 | ) | (176,752 | ) | (227,543 | ) | (190,877 | ) | (244,340 | ) | (911,703 | ) | (839,512 | ) |
Net Premiums and Policy Fees | | 151,639 | | 196,638 | | 180,357 | | 188,868 | | 170,389 | | 653,441 | | 736,252 | |
Net investment income | | 88,713 | | 91,144 | | 94,763 | | 96,977 | | 105,177 | | 362,108 | | 388,061 | |
Other income | | 21,262 | | 21,222 | | 23,008 | | 24,141 | | 26,708 | | 80,847 | | 95,079 | |
Total Revenues | | 261,614 | | 309,004 | | 298,128 | | 309,986 | | 302,274 | | 1,096,396 | | 1,219,392 | |
| | | | | | | | | | | | | | | |
BENEFITS & EXPENSES | | | | | | | | | | | | | | | |
Benefits and settlement expenses | | 182,294 | | 220,556 | | 217,032 | | 260,177 | | 224,000 | | 782,372 | | 921,765 | |
Amortization of deferred policy acquisition costs and value of business acquired | | 34,851 | | 34,078 | | 30,892 | | 1,172 | | 25,221 | | 144,125 | | 91,363 | |
Other operating expenses | | 12,876 | | 13,692 | | 14,449 | | 17,769 | | 12,884 | | 32,073 | | 58,794 | |
Total Benefits and Expenses | | 230,021 | | 268,326 | | 262,373 | | 279,118 | | 262,105 | | 958,570 | | 1,071,922 | |
| | | | | | | | | | | | | | | |
INCOME BEFORE INCOME TAX | | $ | 31,593 | | $ | 40,678 | | $ | 35,755 | | $ | 30,868 | | $ | 40,169 | | $ | 137,826 | | $ | 147,470 | |
Life Marketing Key Data
(Dollars In Thousands) | | 4TH QTR | | 1ST QTR | | 2ND QTR | | 3RD QTR | | 4TH QTR | | 12 MOS | |
(Unaudited) | | 2009 | | 2010 | | 2010 | | 2010 | | 2010 | | 2009 | | 2010 | |
| | | | | | | | | | | | | | | |
SALES BY PRODUCT | | | | | | | | | | | | | | | |
Traditional | | $ | 22,090 | | $ | 20,765 | | $ | 17,626 | | $ | 8,291 | | $ | 3,419 | | $ | 96,932 | | $ | 50,101 | |
Universal life | | 20,931 | | 21,263 | | 23,313 | | 29,553 | | 39,039 | | 62,025 | | 113,168 | |
Bank-owned life insurance | | 1,331 | | 940 | | 1,974 | | 1,987 | | 3,197 | | 3,643 | | 8,098 | |
Total | | $ | 44,352 | | $ | 42,968 | | $ | 42,913 | | $ | 39,831 | | $ | 45,655 | | $ | 162,600 | | $ | 171,367 | |
| | | | | | | | | | | | | | | |
SALES BY DISTRIBUTION | | | | | | | | | | | | | | | |
Brokerage general agents | | $ | 27,833 | | $ | 26,351 | | $ | 26,654 | | $ | 24,033 | | $ | 24,550 | | $ | 101,381 | | $ | 101,588 | |
Independent agents | | 6,478 | | 6,691 | | 6,254 | | 5,369 | | 6,524 | | 27,765 | | 24,838 | |
Stockbrokers/banks | | 8,696 | | 8,971 | | 8,031 | | 8,425 | | 11,206 | | 30,131 | | 36,633 | |
BOLI/other | | 1,345 | | 955 | | 1,974 | | 2,004 | | 3,375 | | 3,323 | | 8,308 | |
Total | | $ | 44,352 | | $ | 42,968 | | $ | 42,913 | | $ | 39,831 | | $ | 45,655 | | $ | 162,600 | | $ | 171,367 | |

| Draft 2/9/2011 |
Page 18
Annuities Quarterly Trends
(Dollars In Thousands) | | 4TH QTR | | 1ST QTR | | 2ND QTR | | 3RD QTR | | 4TH QTR | | 12 MOS | |
(Unaudited) | | 2009 | | 2010 | | 2010 | | 2010 | | 2010 | | 2009 | | 2010 | |
| | | | | | | | | | | | | | | |
REVENUES | | | | | | | | | | | | | | | |
Gross Premiums and Policy Fees | | $ | 8,176 | | $ | 8,775 | | $ | 9,800 | | $ | 11,086 | | $ | 13,125 | | $ | 33,983 | | $ | 42,786 | |
Reinsurance Ceded | | (39 | ) | (37 | ) | (38 | ) | (41 | ) | (20 | ) | (152 | ) | (136 | ) |
Net Premiums and Policy Fees | | 8,137 | | 8,738 | | 9,762 | | 11,045 | | 13,105 | | 33,831 | | 42,650 | |
Net investment income | | 115,255 | | 116,197 | | 118,719 | | 122,662 | | 124,686 | | 440,097 | | 482,264 | |
RIGL - Derivatives | | 19,003 | | 9,549 | | (49,417 | ) | (4,248 | ) | (19,329 | ) | 22,620 | | (63,445 | ) |
RIGL - All Other Investments | | 717 | | 102 | | (524 | ) | 3,610 | | 6,987 | | (5,288 | ) | 10,175 | |
Other income | | 5,264 | | 5,994 | | 6,935 | | 8,060 | | 9,603 | | 17,596 | | 30,592 | |
Total Revenues | | 148,376 | | 140,580 | | 85,475 | | 141,129 | | 135,052 | | 508,856 | | 502,236 | |
| | | | | | | | | | | | | | | |
BENEFITS & EXPENSES | | | | | | | | | | | | | | | |
Benefits and settlement expenses | | 90,165 | | 94,241 | | 114,534 | | 98,023 | | 100,657 | | 350,850 | | 407,455 | |
Amortization of deferred policy acquisition costs and value of business acquired | | 30,451 | | 19,671 | | (37,549 | ) | 8,616 | | 6,080 | | 81,928 | | (3,182 | ) |
Other operating expenses | | 7,396 | | 8,450 | | 9,003 | | 8,789 | | 10,528 | | 26,294 | | 36,770 | |
Total Benefits and Expenses | | 128,012 | | 122,362 | | 85,988 | | 115,428 | | 117,265 | | 459,072 | | 441,043 | |
| | | | | | | | | | | | | | | |
INCOME (LOSS) BEFORE INCOME TAX | | 20,364 | | 18,218 | | (513 | ) | 25,701 | | 17,787 | | 49,784 | | 61,193 | |
| | | | | | | | | | | | | | | |
Adjustments to Reconcile to Operating Income: | | | | | | | | | | | | | | | |
Less: RIGL - Derivatives | | 19,003 | | 9,549 | | (49,417 | ) | (4,248 | ) | (19,329 | ) | 22,620 | | (63,445 | ) |
Add back: Derivative activity related to annuities | | 19,003 | | 9,549 | | (49,417 | ) | (4,248 | ) | (19,329 | ) | 22,620 | | (63,445 | ) |
Less: RIGL - All Other Investments | | 717 | | 102 | | (524 | ) | 3,610 | | 6,987 | | (5,288 | ) | 10,175 | |
Add back: Related amortization of RIGL | | — | | 71 | | 594 | | 613 | | 1,605 | | 1,570 | | 2,883 | |
| | | | | | | | | | | | | | | |
PRE-TAX OPERATING INCOME | | $ | 19,647 | | $ | 18,187 | | $ | 605 | | $ | 22,704 | | $ | 12,405 | | $ | 56,642 | | $ | 53,901 | |
Annuities Key Data
| | 4TH QTR | | 1ST QTR | | 2ND QTR | | 3RD QTR | | 4TH QTR | | 12 MOS | |
| | 2009 | | 2010 | | 2010 | | 2010 | | 2010 | | 2009 | | 2010 | |
| | | | | | | | | | | | | | | |
SALES | | | | | | | | | | | | | | | |
Variable Annuity | | $ | 285,454 | | $ | 349,936 | | $ | 412,789 | | $ | 436,350 | | $ | 515,678 | | $ | 796,245 | | $ | 1,714,753 | |
Immediate Annuity | | 11,886 | | 9,347 | | 13,270 | | 20,949 | | 20,801 | | 76,345 | | 64,367 | |
Single Premium Deferred Annuity | | 202,483 | | 183,828 | | 261,673 | | 194,919 | | 120,135 | | 783,815 | | 760,555 | |
Market Value Adjusted Annuity | | 22,409 | | 24,713 | | 50,057 | | 24,951 | | 5,045 | | 361,290 | | 104,766 | |
Equity Indexed Annuity | | 233 | | 141 | | 299 | | 66 | | 100 | | 3,761 | | 606 | |
Total | | $ | 522,465 | | $ | 567,965 | | $ | 738,088 | | $ | 677,235 | | $ | 661,759 | | $ | 2,021,456 | | $ | 2,645,047 | |
| | | | | | | | | | | | | | | |
PRE-TAX OPERATING INCOME (LOSS) | | | | | | | | | | | | | | | |
Variable Annuity | | $ | 11,607 | | $ | 11,710 | | $ | (7,762 | ) | $ | 8,792 | | $ | 2,487 | | $ | 21,281 | | $ | 15,227 | |
Fixed Annuity | | 8,040 | | 6,477 | | 8,367 | | 13,912 | | 9,918 | | 35,361 | | 38,674 | |
Total | | $ | 19,647 | | $ | 18,187 | | $ | 605 | | $ | 22,704 | | $ | 12,405 | | $ | 56,642 | | $ | 53,901 | |
| | | | | | | | | | | | | | | |
DEPOSIT BALANCE | | | | | | | | | | | | | | | |
VA Fixed Annuity | | $ | 291,733 | | $ | 332,711 | | $ | 382,064 | | $ | 433,120 | | $ | 451,918 | | | | | |
VA Separate Account Annuity | | 2,808,123 | | 3,164,958 | | 3,177,824 | | 3,765,148 | | 4,429,084 | | | | | |
Sub-total | | 3,099,856 | | 3,497,669 | | 3,559,888 | | 4,198,268 | | 4,881,002 | | | | | |
Fixed Annuity | | 7,252,246 | | 7,364,042 | | 7,599,107 | | 7,715,622 | | 7,758,905 | | | | | |
Total | | $ | 10,352,102 | | $ | 10,861,711 | | $ | 11,158,995 | | $ | 11,913,890 | | $ | 12,639,907 | | | | | |
| Draft 2/9/2011 |
Page 19
Stable Value Products Quarterly Trends
(Dollars In Thousands) | | 4TH QTR | | 1ST QTR | | 2ND QTR | | 3RD QTR | | 4TH QTR | | 12 MOS | |
(Unaudited) | | 2009 | | 2010 | | 2010 | | 2010 | | 2010 | | 2009 | | 2010 | |
| | | | | | | | | | | | | | | |
REVENUES | | | | | | | | | | | | | | | |
Net investment income | | $ | 46,938 | | $ | 46,420 | | $ | 45,724 | | $ | 41,100 | | $ | 38,083 | | $ | 221,688 | | $ | 171,327 | |
RIGL - Derivatives | | 529 | | 360 | | (696 | ) | 26 | | 427 | | 1,570 | | 117 | |
RIGL - All Other Investments | | 261 | | 1,176 | | (7,755 | ) | 905 | | 2,113 | | (4,267 | ) | (3,561 | ) |
Other income | | — | | — | | — | | — | | — | | 1,866 | | — | |
Total Revenues | | 47,728 | | 47,956 | | 37,273 | | 42,031 | | 40,623 | | 220,857 | | 167,883 | |
| | | | | | | | | | | | | | | |
BENEFITS & EXPENSES | | | | | | | | | | | | | | | |
Benefits and settlement expenses | | 34,792 | | 33,731 | | 32,972 | | 30,442 | | 26,220 | | 154,555 | | 123,365 | |
Amortization of deferred policy acquisition costs and value of business acquired | | 807 | | 979 | | 882 | | 1,398 | | 2,171 | | 3,471 | | 5,430 | |
Other operating expenses | | 898 | | 683 | | 891 | | 921 | | 830 | | 3,565 | | 3,325 | |
Total Benefits and Expenses | | 36,497 | | 35,393 | | 34,745 | | 32,761 | | 29,221 | | 161,591 | | 132,120 | |
| | | | | | | | | | | | | | | |
INCOME BEFORE INCOME TAX | | 11,231 | | 12,563 | | 2,528 | | 9,270 | | 11,402 | | 59,266 | | 35,763 | |
| | | | | | | | | | | | | | | |
Adjustments to Reconcile to Operating Income: | | | | | | | | | | | | | | | |
Less: RIGL-Derivatives | | 529 | | 360 | | (696 | ) | 26 | | 427 | | 1,570 | | 117 | |
Less: RIGL-All Other Investments | | 261 | | 1,176 | | (7,755 | ) | 905 | | 2,113 | | (4,267 | ) | (3,561 | ) |
| | | | | | | | | | | | | | | |
PRE-TAX OPERATING INCOME | | $ | 10,441 | | $ | 11,027 | | $ | 10,979 | | $ | 8,339 | | $ | 8,862 | | $ | 61,963 | | $ | 39,207 | |
Stable Value Products Key Data
| | 4TH QTR | | 1ST QTR | | 2ND QTR | | 3RD QTR | | 4TH QTR | | 12 MOS | |
| | 2009 | | 2010 | | 2010 | | 2010 | | 2010 | | 2009 | | 2010 | |
| | | | | | | | | | | | | | | |
SALES | | | | | | | | | | | | | | | |
GIC | | $ | — | | $ | 1,000 | | $ | 6,500 | | $ | 66,477 | | $ | 58,635 | | $ | — | | $ | 132,612 | |
GFA - Direct Institutional | | — | | 150,000 | | 250,000 | | — | | 225,000 | | — | | 625,000 | |
GFA - Registered - Institutional | | — | | — | | — | | — | | — | | — | | — | |
GFA - Registered - Retail | | — | | — | | — | | — | | — | | — | | — | |
Total | | $ | — | | $ | 151,000 | | $ | 256,500 | | $ | 66,477 | | $ | 283,635 | | $ | — | | $ | 757,612 | |
| | | | | | | | | | | | | | | |
DEPOSIT BALANCE | | | | | | | | | | | | | | | |
Quarter End Balance | | $ | 3,581,409 | | $ | 3,454,186 | | $ | 3,488,175 | | $ | 3,105,822 | | $ | 3,076,233 | | | | | |
Average Daily Balance | | $ | 3,602,681 | | $ | 3,494,977 | | $ | 3,497,115 | | $ | 3,331,250 | | $ | 3,000,692 | | | | | |
| | | | | | | | | | | | | | | |
OPERATING SPREAD | | 1.16 | % | 1.26 | % | 1.26 | % | 1.00 | % | 1.18 | % | | | | |
| Draft 2/9/2011 |
Page 20
Asset Protection Quarterly Trends
(Dollars In Thousands) | | 4TH QTR | | 1ST QTR | | 2ND QTR | | 3RD QTR | | 4TH QTR | | 12 MOS | |
(Unaudited) | | 2009 | | 2010 | | 2010 | | 2010 | | 2010 | | 2009 | | 2010 | |
| | | | | | | | | | | | | | | |
REVENUES | | | | | | | | | | | | | | | |
Gross Premiums and Policy Fees | | $ | 85,321 | | $ | 79,515 | | $ | 76,984 | | $ | 75,601 | | $ | 73,731 | | $ | 339,516 | | $ | 305,831 | |
Reinsurance Ceded | | (36,439 | ) | (35,906 | ) | (34,654 | ) | (34,826 | ) | (33,153 | ) | (152,222 | ) | (138,539 | ) |
Net Premiums and Policy Fees | | 48,882 | | 43,609 | | 42,330 | | 40,775 | | 40,578 | | 187,294 | | 167,292 | |
Net investment income | | 7,780 | | 7,497 | | 7,316 | | 7,065 | | 6,942 | | 33,157 | | 28,820 | |
Other income | | 15,719 | | 15,325 | | 18,123 | | 19,916 | | 17,650 | | 56,552 | | 71,014 | |
Total Revenues | | 72,381 | | 66,431 | | 67,769 | | 67,756 | | 65,170 | | 277,003 | | 267,126 | |
| | | | | | | | | | | | | | | |
BENEFITS & EXPENSES | | | | | | | | | | | | | | | |
Benefits and settlement expenses | | 32,832 | | 18,756 | | 26,836 | | 28,942 | | 25,302 | | 127,314 | | 99,836 | |
Amortization of deferred policy acquisition costs and value of business acquired | | 13,887 | | 12,775 | | 12,807 | | 12,250 | | 12,175 | | 55,120 | | 50,007 | |
Other operating expenses | | 19,100 | | 21,907 | | 21,627 | | 21,487 | | 22,801 | | 71,340 | | 87,822 | |
Total Benefits and Expenses | | 65,819 | | 53,438 | | 61,270 | | 62,679 | | 60,278 | | 253,774 | | 237,665 | |
| | | | | | | | | | | | | | | |
INCOME BEFORE INCOME TAX | | 6,562 | | 12,993 | | 6,499 | | 5,077 | | 4,892 | | 23,229 | | 29,461 | |
Less: noncontrolling interests | | — | | (74 | ) | (117 | ) | (77 | ) | (168 | ) | — | | (436 | ) |
OPERATING INCOME | | $ | 6,562 | | $ | 13,067 | | $ | 6,616 | | $ | 5,154 | | $ | 5,060 | | $ | 23,229 | | $ | 29,897 | |
Asset Protection Key Data
| | 4TH QTR | | 1ST QTR | | 2ND QTR | | 3RD QTR | | 4TH QTR | | 12 MOS | |
| | 2009 | | 2010 | | 2010 | | 2010 | | 2010 | | 2009 | | 2010 | |
| | | | | | | | | | | | | | | |
SALES | | | | | | | | | | | | | | | |
Credit insurance | | $ | 7,830 | | $ | 7,692 | | $ | 9,693 | | $ | 10,099 | | $ | 8,735 | | $ | 35,379 | | $ | 36,219 | |
Service contracts | | 57,507 | | 52,539 | | 65,353 | | 71,384 | | 62,710 | | 226,794 | | 251,986 | |
Other products | | 8,911 | | 11,459 | | 13,363 | | 15,861 | | 13,806 | | 42,831 | | 54,489 | |
Total | | $ | 74,248 | | $ | 71,690 | | $ | 88,409 | | $ | 97,344 | | $ | 85,251 | | $ | 305,004 | | $ | 342,694 | |
| Draft 2/9/2011 |
Page 21
Acquisitions Quarterly Trends
(Dollars In Thousands) | | 4TH QTR | | 1ST QTR | | 2ND QTR | | 3RD QTR | | 4TH QTR | | 12 MOS | |
(Unaudited) | | 2009 | | 2010 | | 2010 | | 2010 | | 2010 | | 2009 | | 2010 | |
| | | | | | | | | | | | | | | |
REVENUES | | | | | | | | | | | | | | | |
Gross Premiums and Policy Fees | | $ | 185,807 | | $ | 160,721 | | $ | 178,389 | | $ | 167,985 | | $ | 169,754 | | $ | 724,488 | | $ | 676,849 | |
Reinsurance Ceded | | (125,558 | ) | (93,134 | ) | (117,492 | ) | (108,296 | ) | (111,229 | ) | (462,972 | ) | (430,151 | ) |
Net Premiums and Policy Fees | | 60,249 | | 67,587 | | 60,897 | | 59,689 | | 58,525 | | 261,516 | | 246,698 | |
Net investment income | | 118,485 | | 115,401 | | 116,748 | | 114,045 | | 112,509 | | 479,743 | | 458,703 | |
RIGL - Derivatives | | (6,818 | ) | (30,063 | ) | (62,593 | ) | (85,352 | ) | 112,021 | | (252,100 | ) | (65,987 | ) |
RIGL - All Other Investments | | 13,026 | | 44,519 | | 61,152 | | 97,784 | | (87,411 | ) | 281,963 | | 116,044 | |
Other income | | 1,545 | | 1,273 | | 1,375 | | 2,011 | | 1,227 | | 6,059 | | 5,886 | |
Total Revenues | | 186,487 | | 198,717 | | 177,579 | | 188,177 | | 196,871 | | 777,181 | | 761,344 | |
| | | | | | | | | | | | | | | |
BENEFITS & EXPENSES | | | | | | | | | | | | | | | |
Benefits and settlement expenses | | 126,702 | | 133,474 | | 127,554 | | 125,234 | | 126,171 | | 532,992 | | 512,433 | |
Amortization of deferred policy acquisition costs and value of business acquired | | 14,297 | | 13,338 | | 15,602 | | 18,551 | | 16,919 | | 59,025 | | 64,410 | |
Other operating expenses | | 3,684 | | 6,223 | | 5,408 | | 5,087 | | 8,841 | | 14,768 | | 25,559 | |
Total Benefits and Expenses | | 144,683 | | 153,035 | | 148,564 | | 148,872 | | 151,931 | | 606,785 | | 602,402 | |
| | | | | | | | | | | | | | | |
INCOME BEFORE INCOME TAX | | 41,804 | | 45,682 | | 29,015 | | 39,305 | | 44,940 | | 170,396 | | 158,942 | |
| | | | | | | | | | | | | | | |
Adjustments to Reconcile to Operating Income: | | | | | | | | | | | | | | | |
Less: RIGL - Derivatives | | (6,818 | ) | (30,063 | ) | (62,593 | ) | (85,352 | ) | 112,021 | | (252,100 | ) | (65,987 | ) |
Less: RIGL - All Other Investments | | 13,026 | | 44,519 | | 61,152 | | 97,784 | | (87,411 | ) | 281,963 | | 116,044 | |
Add back: Related amortization of deferred policy acquisition costs and value of business acquired | | (3,559 | ) | 143 | | (266 | ) | 993 | | 1,388 | | (6,773 | ) | 2,258 | |
| | | | | | | | | | | | | | | |
PRE-TAX OPERATING INCOME | | $ | 32,037 | | $ | 31,369 | | $ | 30,190 | | $ | 27,866 | | $ | 21,718 | | $ | 133,760 | | $ | 111,143 | |
| Draft 2/9/2011 |
Page 22
Corporate & Other Quarterly Trends
(Dollars In Thousands) | | 4TH QTR | | 1ST QTR | | 2ND QTR | | 3RD QTR | | 4TH QTR | | 12 MOS | |
(Unaudited) | | 2009 | | 2010 | | 2010 | | 2010 | | 2010 | | 2009 | | 2010 | |
| | | | | | | | | | | | | | | |
REVENUES | | | | | | | | | | | | | | | |
Gross Premiums and Policy Fees | | $ | 6,289 | | $ | 6,371 | | $ | 6,168 | | $ | 5,848 | | $ | 5,777 | | $ | 26,568 | | $ | 24,164 | |
Reinsurance Ceded | | — | | — | | (2 | ) | — | | — | | (4 | ) | (2 | ) |
Net Premiums and Policy Fees | | 6,289 | | 6,371 | | 6,166 | | 5,848 | | 5,777 | | 26,564 | | 24,162 | |
Net investment income | | 25,080 | | 35,338 | | 39,230 | | 47,699 | | 32,234 | | 128,243 | | 154,501 | |
RIGL - Derivatives | | 10,430 | | (2,918 | ) | (7,182 | ) | (4,460 | ) | 5,626 | | 49,957 | | (8,934 | ) |
RIGL - All Other Investments | | (23,621 | ) | (9,767 | ) | (1,967 | ) | 873 | | 1,059 | | (152,259 | ) | (9,802 | ) |
Other income | | 134,887 | | 58 | | 9,631 | | 4,062 | | 6,096 | | 135,228 | | 19,847 | |
Total Revenues | | 153,065 | | 29,082 | | 45,878 | | 54,022 | | 50,792 | | 187,733 | | 179,774 | |
| | | | | | | | | | | | | | | |
BENEFITS & EXPENSES | | | | | | | | | | | | | | | |
Benefits and settlement expenses | | 7,469 | | 6,537 | | 6,443 | | 6,749 | | 4,846 | | 29,896 | | 24,575 | |
Amortization of deferred policy acquisition costs and value of business acquired | | 439 | | 448 | | 452 | | 399 | | 395 | | 1,900 | | 1,694 | |
Other operating expenses | | 53,943 | | 50,955 | | 47,807 | | 50,098 | | 48,611 | | 179,660 | | 197,471 | |
Total Benefits and Expenses | | 61,851 | | 57,940 | | 54,702 | | 57,246 | | 53,852 | | 211,456 | | 223,740 | |
| | | | | | | | | | | | | | | |
INCOME (LOSS) BEFORE INCOME TAX | | 91,214 | | (28,858 | ) | (8,824 | ) | (3,224 | ) | (3,060 | ) | (23,723 | ) | (43,966 | ) |
| | | | | | | | | | | | | | | |
Adjustments to Reconcile to Operating Income: | | | | | | | | | | | | | | | |
Less: RIGL-Derivatives | | 10,430 | | (2,918 | ) | (7,182 | ) | (4,460 | ) | 5,626 | | 49,957 | | (8,934 | ) |
Less: RIGL-All Other Investments | | (23,621 | ) | (9,767 | ) | (1,967 | ) | 873 | | 1,059 | | (152,259 | ) | (9,802 | ) |
Add back: Derivative activity related to corporate debt and investments | | — | | 42 | | 42 | | 42 | | 42 | | 3,401 | | 168 | |
Less: noncontrolling interests | | — | | 1 | | (10 | ) | — | | — | | — | | (9 | ) |
| | | | | | | | | | | | | | | |
PRE-TAX OPERATING INCOME (LOSS) | | $ | 104,405 | | $ | (16,132 | ) | $ | 377 | | $ | 405 | | $ | (9,703 | ) | $ | 81,980 | | $ | (25,053 | ) |

| Draft 2/9/2011 |
Page 23
INFORMATION RELATED TO CERTAIN NON-GAAP DISCLOSURES
The following pages contain information related to certain non-GAAP disclosures (consolidated and segment operating income, operating income per diluted share, shareowners’ equity per share excluding accumulated other comprehensive income (loss), operating income return on average equity, and net income return on average equity).
All income per share results are presented on a diluted basis, unless otherwise noted.
CONSOLIDATED AND SEGMENT OPERATING INCOME AND OPERATING INCOME PER DILUTED SHARE
Consolidated and segment operating income and operating income per diluted share (hereinafter collectively referred to as “consolidated and segment operating income”) are defined as income before income tax excluding net realized investment gains (losses) (net of the related amortization of deferred policy acquisition costs (“DAC”) and value of business acquired (“VOBA”) and participating income from real estate ventures), and the cumulative effect of any change in accounting principle. Periodic settlements of derivatives associated with corporate debt and certain investments and annuity products are included in realized gains (losses), but are considered part of consolidated and segment operating income because the derivatives are used to mitigate risk in items affecting consolidated and segment operating inco me. Management believes that consolidated and segment operating income (loss) provides relevant and useful information to investors, as it represents the basis on which the performance of the Company’s business is internally assessed. Although the items excluded from consolidated and segment operating income may be significant components in understanding and assessing the Company’s overall financial performance, management believes that consolidated and segment operating income enhances an investor’s understanding of the Company’s results of operations by highlighting the income (loss) generally attributable to the normal, recurring operations of the Company’s business.
SHAREOWNERS’ EQUITY PER SHARE EXCLUDING ACCUMULATED OTHER COMPREHENSIVE INCOME (LOSS)
As prescribed by GAAP, certain investments are recorded at their market values with the resulting unrealized gains (losses) affected by a related adjustment to DAC and VOBA, net of income tax, reported as a component of shareowners’ equity. The market values of fixed maturities increase or decrease as interest rates change. The Company believes that an insurance company’s shareowners’ equity per share may be difficult to analyze without disclosing the effects of recording accumulated other comprehensive income (loss), including unrealized gains (losses) on investments. Therefore, the Company reports the non-GAAP measure shareowners’ equity per share excluding accumulated other comprehensive income (loss), including unrealized gains (losses) on investments. This non-GAAP measure may be reconciled to the GAAP measure, shareowners’ equity per share by including accumulated other com prehensive income (loss), including unrealized gains (losses) on investments.
OPERATING INCOME RETURN ON AVERAGE EQUITY
Operating income return on average equity is a measure used by management to evaluate the Company’s performance. It is calculated by dividing operating income (as defined above) for a rolling twelve month period by the average ending balance of shareowners’ equity excluding accumulated other comprehensive income (loss) for the five most recent quarters.
NET INCOME RETURN ON AVERAGE EQUITY
Net income return on average equity is a measure used by management to evaluate the Company’s performance. It is calculated by dividing net income for a rolling twelve month period by the average ending balance of shareowners’ equity excluding accumulated other comprehensive income (loss) for the five most recent quarters.
| Draft 2/9/2011 |
Page 24
Reconciliation of Segment Operating
Income to Net Income available to PLC’s
common shareowners
(Dollars In Thousands) | | 4TH QTR | | 4TH QTR | | 12 MOS | |
(Unaudited) | | 2009 | | 2010 | | 2009 | | 2010 | |
| | | | | | | | | |
Life Marketing | | $ | 31,593 | | $ | 40,169 | | $ | 137,826 | | $ | 147,470 | |
Acquisitions | | 32,037 | | 21,718 | | 133,760 | | 111,143 | |
Annuities | | 19,647 | | 12,405 | | 56,642 | | 53,901 | |
Stable Value Products | | 10,441 | | 8,862 | | 61,963 | | 39,207 | |
Asset Protection | | 6,562 | | 5,060 | | 23,229 | | 29,897 | |
Corporate & Other | | 104,405 | | (9,703 | ) | 81,980 | | (25,053 | ) |
| | | | | | | | | |
Total Pre-tax operating income | | 204,685 | | 78,511 | | 495,400 | | 356,565 | |
| | | | | | | | | |
Realized Investment Gains (Losses) - Investments | | (6,059 | ) | (80,245 | ) | (203,974 | ) | 107,715 | |
Realized Investment Gains (Losses) - Derivatives | | 4,142 | | 118,032 | | 125,352 | | (74,972 | ) |
Income Tax Expense | | (71,757 | ) | (37,655 | ) | (145,290 | ) | (129,067 | ) |
| | | | | | | | | |
Net income available to PLC’s common shareowners | | $ | 131,011 | | $ | 78,643 | | $ | 271,488 | | $ | 260,241 | |
| Draft 2/9/2011 |
Page 25
Reconciliation of Operating Income per Diluted Share to Net Income Available
to PLC’s Common Shareowners per Diluted Share
| | 4TH QTR | | 1ST QTR | | 2ND QTR | | 3RD QTR | | 4TH QTR | | 12 MOS | |
(Unaudited) | | 2009 | | 2010 | | 2010 | | 2010 | | 2010 | | 2009 | | 2010 | |
| | | | | | | | | | | | | | | |
OPERATING INCOME PER SHARE | | | | | | | | | | | | | | | |
| | | | | | | | | | | | | | | |
Operating income per share-diluted | | $ | 1.51 | | $ | 0.78 | | $ | 0.62 | | $ | 0.71 | | $ | 0.62 | | $ | 3.97 | | $ | 2.73 | |
RIGL - Derivatives per share-diluted | | 0.03 | | (0.24 | ) | (0.52 | ) | (0.67 | ) | 0.87 | | (1.63 | ) | (0.56 | ) |
RIGL - All Other Investments-diluted | | (0.04 | ) | 0.26 | | 0.37 | | 0.76 | | (0.59 | ) | 1.00 | | 0.80 | |
Net income available to PLC’s common shareowners per share-diluted | | $ | 1.50 | | $ | 0.80 | | $ | 0.47 | | $ | 0.80 | | $ | 0.90 | | $ | 3.34 | | $ | 2.97 | |
| Draft 2/9/2011 |
Page 26
Reconciliation of Total Protective Life
Corporation’s Shareowners’ Equity per Share
to Total Protective Life Corporation’s
Shareowners’ Equity (Excl. AOCI) per share
| | 4TH QTR | | 1ST QTR | | 2ND QTR | | 3RD QTR | | 4TH QTR | |
(Unaudited) | | 2009 | | 2010 | | 2010 | | 2010 | | 2010 | |
| | | | | | | | | | | |
PROTECTIVE LIFE CORPORATION’S SHAREOWNERS’ EQUITY PER SHARE | | | | | | | | | | | |
Total Protective Life Corporation’s Shareowners’ Equity | | $ | 28.96 | | $ | 32.96 | | $ | 36.02 | | $ | 41.69 | | $ | 38.88 | |
Less: Accumulated other comprehensive income (loss) | | (3.76 | ) | (0.65 | ) | 2.07 | | 7.03 | | 3.42 | |
Excluding accumulated other comprehensive income (loss) | | $ | 32.72 | | $ | 33.61 | | $ | 33.95 | | $ | 34.66 | | $ | 35.46 | |
| Draft 2/9/2011 |
Page 27
Calculation of Operating Income Return on Average Equity
Rolling Twelve Months Ended December 31, 2010
(Dollars In Thousands) | | Three Months | | Twelve Months | |
(Unaudited) | | 3/31/2010 | | 6/30/2010 | | 9/30/2010 | | 12/31/2010 | | 12/31/2010 | |
NUMERATOR: | | | | | | | | | | | |
Net income available to PLC’s common shareowners | | $ | 69,779 | | $ | 41,371 | | $ | 70,448 | | $ | 78,643 | | $ | 260,241 | |
Less: | | | | | | | | | | | |
Realized investment gains (losses), net of income tax | | | | | | | | | | | |
Investments | | 23,420 | | 33,089 | | 67,062 | | (50,214 | ) | 73,357 | |
Derivatives | | (21,204 | ) | (45,806 | ) | (58,361 | ) | 76,748 | | (48,623 | ) |
Related amortization of DAC and VOBA, net of income tax | | (140 | ) | (212 | ) | (1,044 | ) | (1,945 | ) | (3,341 | ) |
Add back: | | | | | | | | | | | |
Derivative gains related to Corp. debt and investments, net of income tax | | 27 | | 27 | | 27 | | 27 | | 108 | |
Operating Income | | $ | 67,730 | | $ | 54,327 | | $ | 62,818 | | $ | 54,081 | | $ | 238,956 | |
| | | | | | Total | |
| | | | | | Protective Life | |
| | | | | | Corporation’s | |
| | Total | | | | Shareowners’ | |
| | Protective Life | | Accumulated | | Equity Excluding | |
| | Corporation’s | | Other | | Accumulated Other | |
| | Shareowners’ | | Comprehensive | | Comprehensive | |
| | Equity | | Income (Loss) | | Income (Loss) | |
DENOMINATOR: | | | | | | | |
December 31, 2009 | | $ | 2,478,821 | | $ | (321,169 | ) | $ | 2,799,990 | |
March 31, 2010 | | 2,821,033 | | (55,716 | ) | 2,876,749 | |
June 30, 2010 | | 3,085,599 | | 177,490 | | 2,908,109 | |
September 30, 2010 | | 3,571,392 | | 601,964 | | 2,969,428 | |
December 31, 2010 | | 3,331,087 | | 293,254 | | 3,037,833 | |
Total | | | | | | $ | 14,592,109 | |
| | | | | | | |
Average | | | | | | $ | 2,918,422 | |
| | | | | | | |
Operating Income Return on Average Equity | | | | | | 8.2 | % |
| | | | | | | | | | |

| Draft 2/9/2011 |
Page 28
Calculation of Operating Income Return on Average Equity
Rolling Twelve Months Ended December 31, 2009
(Dollars In Thousands) | | Three Months | | Twelve Months | |
(Unaudited) | | 3/31/2009 | | 6/30/2009 | | 9/30/2009 | | 12/31/2009 | | 12/31/2009 | |
NUMERATOR: | | | | | | | | | | | |
Net income available to PLC’s common shareowners | | $ | 22,135 | | $ | 90,757 | | $ | 27,585 | | $ | 131,011 | | $ | 271,488 | |
Less: | | | | | | | | | | | |
Realized investment gains (losses), net of income tax | | | | | | | | | | | |
Investments | | (85,585 | ) | 82,439 | | 87,495 | | (6,251 | ) | 78,098 | |
Derivatives | | 47,675 | | (72,400 | ) | (108,339 | ) | 2,692 | | (130,372 | ) |
Related amortization of DAC and VOBA, net of income tax | | (51 | ) | 612 | | 507 | | 2,313 | | 3,381 | |
Add back: | | | | | | | | | | | |
Derivative gains related to Corp. debt and investments, net of income tax | | 1,455 | | 756 | | — | | — | | 2,211 | |
Operating Income | | $ | 61,551 | | $ | 80,862 | | $ | 47,922 | | $ | 132,257 | | $ | 322,592 | |
| | | | | | Total | |
| | | | | | Protective Life | |
| | | | | | Corporation’s | |
| | Total | | | | Shareowners’ | |
| | Protective Life | | Accumulated | | Equity Excluding | |
| | Corporation’s | | Other | | Accumulated Other | |
| | Shareowners’ | | Comprehensive | | Comprehensive | |
| | Equity | | Income (Loss) | | Income (Loss) | |
DENOMINATOR: | | | | | | | |
December 31, 2008 | | $ | 761,095 | | $ | (1,667,056 | ) | $ | 2,428,151 | |
March 31, 2009 | | 783,178 | | (1,660,204 | ) | 2,443,382 | |
June 30, 2009 | | 1,628,375 | | (1,031,719 | ) | 2,660,094 | |
September 30, 2009 | | 2,302,799 | | (375,472 | ) | 2,678,271 | |
December 31, 2009 | | 2,478,821 | | (321,169 | ) | 2,799,990 | |
Total | | | | | | $ | 13,009,888 | |
| | | | | | | |
Average | | | | | | $ | 2,601,978 | |
| | | | | | | |
Operating Income Return on Average Equity | | | | | | 12.4 | % |
| | | | | | | | | | |
| Draft 2/9/2011 |
Page 29
Calculation of Net Income Available to PLC’s
common shareowners Return on Average Equity
Rolling Twelve Months Ended December 31, 2010
(Dollars In Thousands) | | Three Months | | Twelve Months | |
(Unaudited) | | 3/31/2010 | | 6/30/2010 | | 9/30/2010 | | 12/31/2010 | | 12/31/2010 | |
NUMERATOR: | | | | | | | | | | | |
Net income available to PLC’s common shareowners | | $ | 69,779 | | $ | 41,371 | | $ | 70,448 | | $ | 78,643 | | $ | 260,241 | |
| | | | | | | | | | | | | | | | |
| | | | | | Total | |
| | | | | | Protective Life | |
| | | | | | Corporation’s | |
| | Total | | | | Shareowners’ | |
| | Protective Life | | Accumulated | | Equity Excluding | |
| | Corporation’s | | Other | | Accumulated Other | |
| | Shareowners’ | | Comprehensive | | Comprehensive | |
| | Equity | | Income (Loss) | | Income (Loss) | |
DENOMINATOR: | | | | | | | |
December 31, 2009 | | $ | 2,478,821 | | $ | (321,169 | ) | $ | 2,799,990 | |
March 31, 2010 | | 2,821,033 | | (55,716 | ) | 2,876,749 | |
June 30, 2010 | | 3,085,599 | | 177,490 | | 2,908,109 | |
September 30, 2010 | | 3,571,392 | | 601,964 | | 2,969,428 | |
December 31, 2010 | | 3,331,087 | | 293,254 | | 3,037,833 | |
Total | | | | | | $ | 14,592,109 | |
| | | | | | | |
Average | | | | | | $ | 2,918,422 | |
| | | | | | | |
Net income available to PLC’s common shareowners Return on Average Equity | | 8.9 | % |
| | | | | | | | | | |
| Draft 2/9/2011 |
Page 30
Calculation of Net Income available to PLC’s common shareowners Return on
Average Equity Rolling Twelve Months Ended December 31, 2009
(Dollars In Thousands) | | Three Months | | Twelve Months | |
(Unaudited) | | 3/31/2009 | | 6/30/2009 | | 9/30/2009 | | 12/31/2009 | | 12/31/2009 | |
NUMERATOR: | | | | | | | | | | | |
Net income available to PLC’s common shareowners | | $ | 22,135 | | $ | 90,757 | | $ | 27,585 | | $ | 131,011 | | $ | 271,488 | |
| | | | | | | | | | | | | | | | |
| | | | | | Total | |
| | | | | | Protective Life | |
| | | | | | Corporation’s | |
| | Total | | | | Shareowners’ | |
| | Protective Life | | Accumulated | | Equity Excluding | |
| | Corporation’s | | Other | | Accumulated Other | |
| | Shareowners’ | | Comprehensive | | Comprehensive | |
| | Equity | | Income (Loss) | | Income (Loss) | |
DENOMINATOR: | | | | | | | |
December 31, 2008 | | $ | 761,095 | | $ | (1,667,056 | ) | $ | 2,428,151 | |
March 31, 2009 | | 783,178 | | (1,660,204 | ) | 2,443,382 | |
June 30, 2009 | | 1,628,375 | | (1,031,719 | ) | 2,660,094 | |
September 30, 2009 | | 2,302,799 | | (375,472 | ) | 2,678,271 | |
December 31, 2009 | | 2,478,821 | | (321,169 | ) | 2,799,990 | |
Total | | | | | | $ | 13,009,888 | |
| | | | | | | |
Average | | | | | | $ | 2,601,978 | |
| | | | | | | |
Net income available to PLC’s common shareowners Return on Average Equity | | 10.4 | % |
| | | | | | | | | | |