UNITED STATES
SECURITIES AND EXCHANGE COMMISSION
Washington, D.C. 20549
FORM N-CSR
CERTIFIED SHAREHOLDER REPORT OF REGISTERED
MANAGEMENT INVESTMENT COMPANIES
Investment Company Act file number 811-3275
Legg Mason Partners Investment Funds, Inc.
(Exact name of registrant as specified in charter)
| | |
| 125 Broad Street, New York, NY | | 10004 |
|
| (Address of principal executive offices) | | (Zip code) |
Robert I. Frenkel, Esq.
Legg Mason & Co., LLC
300 First Stamford Place, 4th Floor
Stamford, CT 06902
(Name and address of agent for service)
Registrant’s telephone number, including area code: (800) 451-2010
Date of fiscal year end: December 31
Date of reporting period: June 30, 2006
ITEM 1. REPORT TO STOCKHOLDERS.
The Semi-Annual Report to Stockholders is filed herewith.
SEMI-ANNUAL
REPORT
JUNE 30, 2006


Legg Mason Partners
Real Return Strategy Fund
INVESTMENT PRODUCTS: NOT FDIC INSURED Ÿ NO BANK GUARANTEE Ÿ MAY LOSE VALUE
Legg Mason Partners Real Return Strategy Fund
Semi-Annual Report • June 30, 2006
What’s
Inside
Fund Objective
The Fund seeks capital appreciation and income.
“Smith Barney”, “Salomon Brothers” and “Citi” are service marks of Citigroup, licensed for use by Legg Mason as the names of funds and investment managers. Legg Mason and its affiliates, as well as the Fund’s investment manager, are not affiliated with Citigroup.
Letter from the Chairman

R. JAY GERKEN, CFA
Chairman, President and Chief Executive Officer
Dear Shareholder,
The U.S. economy appeared to be on solid footing during the six-month reporting period. After gross domestic product (“GDP”)i rose 1.7% in the fourth quarter of 2005—the first quarter in which GDP growth did not surpass 3.0% in nearly three years—the economy rebounded sharply in the first quarter of 2006. During this time, GDP rose 5.6%, its best showing since the third quarter of 2003. Both strong consumer and business spending prompted the economic turnaround. In the second quarter of 2006, GDP growth was a more modest 2.5%, according to the Commerce Department’s initial reading for the period. The decline was largely attributed to lower consumer spending, triggered by higher interest rates and oil prices, as well as a cooling housing market. In addition, business spending fell during the quarter.
The Federal Reserve Board (“Fed”)ii continued to raise interest rates during the reporting period. Despite the “changing of the guard” from Fed Chairman Alan Greenspan to Ben Bernanke in early 2006, it was “business as usual” for the Fed, as it raised short-term interest rates four times during the period. Since it began its tightening campaign in June 2004, the Fed has increased rates 17 consecutive times, bringing the federal funds rateiii from 1.00% to 5.25%. Coinciding with its latest rate hike in June 2006, the Fed said: “The extent and timing of any additional firming…will depend on the evolution of the outlook for both inflation and economic growth, as implied by incoming information.”
For the six-month period ended June 30, 2006, the U.S. stock market produced positive returns, with the S&P 500 Indexiv returning 2.71%. While the economy expanded and corporate profits remained strong, the headwinds from steadily rising interest rates, inflationary pressures and the potential for additional Fed rate hikes tempered returns.
Looking at the market more closely, small-cap stocks outperformed their mid- and large-cap counterparts, with the
Legg Mason Partners Real Return Strategy Fund I
Russell 2000v, Russell Midcapvi and Russell 1000vii Indexes returning 8.21%, 4.84% and 2.76%, respectively. From an investment style perspective, value stocks significantly outperformed growth stocks, with the Russell 3000 Valueviii and Russell 3000 Growthix Indexes returning 6.90% and -0.32%, respectively, over the reporting period.
Performance Review
For the six months ended June 30, 2006, Class A shares of the Legg Mason Partners Real Return Strategy Fund, excluding sales charges, returned 10.73%. In comparison, the Fund’s unmanaged benchmarks, the S&P 500 Index, the Lehman Brothers Global Real: U.S. TIPS Indexx, the Morgan Stanley REIT Indexxi, the MSCI World Energy Indexxii and the MSCI World Metals and Mining Indexxiii, returned 2.71%, -1.77%, 13.47%, 12.57% and 22.26%, respectively, for the same period. The Lipper Multi-Cap Core Funds Category Average1 increased 2.48% over the same time frame.
| | |
| Performance Snapshot as of June 30, 2006 (excluding sales charges) (unaudited) |
| |
| | | 6 Months |
| | | |
Real Return Strategy Fund — Class A Shares | | 10.73% |
|
S&P 500 Index | | 2.71% |
|
Lehman Brothers Global Real: U.S. TIPS Index | | -1.77% |
|
Morgan Stanley REIT Index | | 13.47% |
|
MSCI World Energy Index | | 12.57% |
|
MSCI World Metals and Mining Index | | 22.26% |
|
Lipper Multi-Cap Core Funds Category Average | | 2.48% |
|
| The performance shown represents past performance. Past performance is no guarantee of future results and current performance may be higher or lower than the performance shown above. Principal value and investment returns will fluctuate and investors’ shares, when redeemed, may be worth more or less than their original cost. To obtain performance data current to the most recent month-end, please visit our website at www.leggmason.com/InvestorServices. |
| Excluding sales charges, Class B shares returned 10.42% and Class C shares returned 10.34% over the six months ended June 30, 2006. All share class returns assume the reinvestment of all distributions, including returns of capital, if any, at net asset value and the deduction of all Fund expenses. Returns have not been adjusted to include sales charges that may apply when shares are purchased or the deduction of taxes that a shareholder would pay on Fund distributions. |
| Performance figures reflect reimbursements and/or fee waivers, without which the performance would have been lower. |
| 1 | | Lipper, Inc. is a major independent mutual-fund tracking organization. Returns are based on the six-month period ended June 30, 2006, including the reinvestment of all distributions, including returns of capital, if any, calculated among the 899 funds in the Fund’s Lipper category, and excluding sales charges. |
II Legg Mason Partners Real Return Strategy Fund
Special Shareholder Notices
As part of the continuing effort to integrate investment products managed by the advisers acquired with Citigroup’s asset management business, Legg Mason, Inc. (“Legg Mason”) has recommended various Fund actions in order to streamline product offerings, standardize share class pricing features, eliminate redundancies and improve efficiencies within the organization. At Board meetings held during June and July 2006, the Fund’s Board reviewed and approved these recommendations, and provided authorization to move ahead with proxy solicitations for those matters needing shareholder approval.
The Fund’s Board has approved the termination and liquidation of the Fund. The Board intends to seek approval of the termination and liquidation from shareholders at a meeting expected to be held during the fourth quarter of 2006. The termination will occur as soon as reasonably practicable once the requisite shareholder approval has been obtained. Until such approval is received, the Fund’s assets will continue to be invested in accordance with the Fund’s investment objective. In the interim, however, the Board has voted to close the Fund to new purchases and exchange purchases, at the close of business on June 30, 2006, except that dividend reinvestment and Class B to Class A conversions will continue until the Fund is terminated.
The Fund’s Board has also approved the appointment of Legg Mason Partners Fund Advisor, LLC (“LMPFA”) as the Fund’s investment manager effective August 1, 2006, replacing Smith Barney Fund Management LLC (“SBFM”). The Fund’s Board has also approved the appointment of CAM North America, LLC (“CAM N.A.”), Batterymarch Financial Management, Inc. (“Batterymarch”) and Western Asset Management Company (“Western Asset”) as the Fund’s subadvisers effective August 1, 2006. The portfolio managers who are responsible for the day-to-day management of the Fund remain the same immediately prior to and immediately after the date of these changes. LMPFA, CAM N.A., Batterymarch, and Western Asset are wholly-owned subsidiaries of Legg Mason.
Legg Mason Partners Real Return Strategy Fund III
Effective February 1, 2006, Smith Barney Fund Management LLC (“SBFM”) assumed portfolio management responsibilities for the Fund, and the subadvisory contracts with Citigroup Asset Management Limited and TIMCO Asset Management, Inc. were terminated. The Fund’s management fee rate did not change as a result of the sub-advisory contract terminations. At this time, management of the energy securities, real estate securities and metals and mining securities segments was assumed by a team of managers from Batterymarch. The team includes Thomas Linkas, Charles Lovejoy, Guy Bennett, Christopher W. Floyd and John Vietz.
Effective March 31, 2006, management of the Fund’s inflation protected securities segment was assumed by a team of investment professionals from Western Asset. The portfolio management team includes S. Kenneth Leech, Stephen A. Walsh, Carl L. Eichstaedt, Frederick Marki and Peter H. Stutz.
The Fund was formerly known as Smith Barney Real Return Strategy Fund.
Information About Your Fund
As you may be aware, several issues in the mutual fund industry have come under the scrutiny of federal and state regulators. Affiliates of the Fund’s Manager have, in recent years, received requests for information from various government regulators regarding market timing, late trading, fees, and other mutual fund issues in connection with various investigations. The regulators appear to be examining, among other things, the Fund’s response to market timing and shareholder exchange activity, including compliance with prospectus disclosure related to these subjects. The Fund is not in a position to predict the outcome of these requests and investigations.
Important information with regard to recent regulatory developments that may affect the Fund is contained in the Notes to Financial Statements included in this report.
IV Legg Mason Partners Real Return Strategy Fund
As always, thank you for your confidence in our stewardship of your assets. We look forward to helping you meet your financial goals.
Sincerely,

R. Jay Gerken, CFA
Chairman, President and Chief Executive Officer
July 28, 2006
The information provided is not intended to be a forecast of future events, a guarantee of future results or investment advice. Views expressed may differ from those of the firm as a whole.
RISKS: The Fund is subject to the risks associated with the individual equity market sectors represented in the Fund and IPS. The equity sectors may be more volatile than other types of investments and are sensitive to movements in the prices of their underlying commodities and geopolitical factors. The Fund is also subject to concentration, small-cap, mid-cap and foreign securities risks. The risks associated with IPS include deflation, interest rate, extension, liquidity and prepayment risks. As interest rates rise, bond prices fall, reducing the value of the Fund’s share price. The Fund may use derivatives, such as options and futures, which can be illiquid, may disproportionately increase losses, and have a potentially large impact on Fund performance. These and other risks are detailed in the prospectus. Please see the Fund’s prospectus for more information on these and other risks.
All index performance reflects no deduction for fees, expenses or taxes. Please note an investor cannot invest directly in an index.
| i | | Gross domestic product is a market value of goods and services produced by labor and property in a given country. |
| ii | | The Federal Reserve Board is responsible for the formulation of a policy designed to promote economic growth, full employment, stable prices, and a sustainable pattern of international trade and payments. |
| iii | | The federal funds rate is the interest rate that banks with excess reserves at a Federal Reserve district bank charge other banks that need overnight loans. |
| iv | | The S&P 500 Index is an unmanaged index of 500 stocks that is generally representative of the performance of larger companies in the U.S. |
| v | | The Russell 2000 Index measures the performance of the 2,000 smallest companies in the Russell 3000 Index, which represents approximately 8% of the total market capitalization of the Russell 3000 Index. |
| vi | | The Russell Midcap Index measures the performance of the 800 smallest companies in the Russell 1000 Index, which represents approximately 25% of the total market capitalization of the Russell 1000 Index. |
| vii | | The Russell 1000 Index measures the performance of the 1,000 largest companies in the Russell 3000 Index, which represents approximately 92% of the total market capitalization of the Russell 3000 Index. |
| viii | | The Russell 3000 Value Index measures the performance of those Russell 3000 Index companies with lower price-to-book ratios and lower forecasted growth values. (A price-to-book ratio is the price of a stock compared to the difference between a company’s assets and liabilities.) |
| ix | | The Russell 3000 Growth Index measures the performance of those Russell 3000 Index companies with higher price-to-book ratios and higher forecasted growth values. |
| x | | The Lehman Brothers Global Real: U.S. TIPS Index represents an unmanaged market index made up of U.S. Treasury Inflation Linked Index securities. |
| xi | | The Morgan Stanley REIT Index is an unmanaged capitalization-weighted index of the most actively traded real estate investment trusts. |
| xii | | The MSCI World Energy Index is a free float-adjusted market capitalization index that is designed to measure global developed market equity performance and focuses on the energy sector. |
| xiii | | The MSCI World Metals and Mining Index is a free float-adjusted market capitalization index that is designed to measure global developed market equity performance and focuses on the metal and mining sectors. |
Legg Mason Partners Real Return Strategy Fund V
Fund at a Glance (unaudited)
Legg Mason Partners Real Return Strategy Fund 2006 Semi-Annual Report 1
Fund Expenses (unaudited)
Example
As a shareholder of the Fund, you may incur two types of costs: (1) transaction costs, including front-end and back-end sales charges (loads) on purchase payments; and (2) ongoing costs, including management fees; distribution and/or service (12b-1) fees; and other Fund expenses. This example is intended to help you understand your ongoing costs (in dollars) of investing in the Fund and to compare these costs with the ongoing costs of investing in other mutual funds.
This example is based on an investment of $1,000 invested on January 1, 2006 and held for the six months ended June 30, 2006.
Actual Expenses
The table below titled “Based on Actual Total Return” provides information about actual account values and actual expenses. You may use the information provided in this table, together with the amount you invested, to estimate the expenses that you paid over the period. To estimate the expenses you paid on your account, divide your ending account value by $1,000 (for example, an $8,600 ending account value divided by $1,000 = 8.6), then multiply the result by the number under the heading entitled “Expenses Paid During the Period”.
| | | | | | | | | | | | | | | |
| Based on Actual Total Return(1) | | | | | | | | | |
| | | | | |
| | | Actual Total
Return Without
Sales Charges(2) | | | Beginning
Account
Value | | Ending
Account
Value | | Annualized
Expense
Ratio | | | Expenses
Paid During
the Period(3) |
Class A | | 10.73 | % | | $ | 1,000.00 | | $ | 1,107.30 | | 1.18 | % | | $ | 6.17 |
|
Class B | | 10.42 | | | | 1,000.00 | | | 1,104.20 | | 1.92 | | | | 10.02 |
|
Class C | | 10.34 | | | | 1,000.00 | | | 1,103.40 | | 1.92 | | | | 10.01 |
|
| (1) | | For the six months ended June 30, 2006. |
| (2) | | Assumes reinvestment of all distributions, including returns of capital, if any, at net asset value and does not reflect the deduction of the applicable sales charge with respect to Class A shares or the applicable contingent deferred sales charges (“CDSC”) with respect to Class B and C shares. Total return is not annualized, as it may not be representative of the total return for the year. Performance figures may reflect fee waivers and/or expense reimbursements. Past performance is no guarantee of future results. In the absence of fee waivers and/or expense reimbursements, the total return would have been lower. |
| (3) | | Expenses (net of fee waivers and/or expense reimbursements) are equal to each class’ respective annualized expense ratio multiplied by the average account value over the period, multiplied by the number of days in the most recent fiscal half-year, then divided by 365. |
2 Legg Mason Partners Real Return Strategy Fund 2006 Semi-Annual Report
Fund Expenses (unaudited) (continued)
Hypothetical Example for Comparison Purposes
The table below titled “Based on Hypothetical Total Return” provides information about hypothetical account values and hypothetical expenses based on the actual expense ratio and an assumed rate of return of 5.00% per year before expenses, which is not the Fund’s actual return. The hypothetical account values and expenses may not be used to estimate the actual ending account balance or expenses you paid for the period. You may use the information provided in this table to compare the ongoing costs of investing in the Fund and other funds. To do so, compare the 5.00% hypothetical example relating to the Fund with the 5.00% hypothetical examples that appear in the shareholder reports of the other funds.
Please note that the expenses shown in the table below are meant to highlight your ongoing costs only and do not reflect any transactional costs, such as front-end or back-end sales charges (loads). Therefore, the table is useful in comparing ongoing costs only, and will not help you determine the relative total costs of owning different funds. In addition, if these transaction costs were included, your costs would have been higher.
| | | | | | | | | | | | | | | |
| Based on Hypothetical Total Return(1) | | | | | | | | | |
| | | | | |
| | | Hypothetical
Annualized
Total Return | | | Beginning
Account
Value | | Ending
Account
Value | | Annualized
Expense
Ratio | | | Expenses
Paid During
the Period(2) |
Class A | | 5.00 | % | | $ | 1,000.00 | | $ | 1,018.94 | | 1.18 | % | | $ | 5.91 |
|
Class B | | 5.00 | | | | 1,000.00 | | | 1,015.27 | | 1.92 | | | | 9.59 |
|
Class C | | 5.00 | | | | 1,000.00 | | | 1,015.27 | | 1.92 | | | | 9.59 |
|
| (1) | | For the six months ended June 30, 2006. |
| (2) | | Expenses (net of fee waivers and/or expense reimbursements) are equal to each class’ respective annualized expense ratio multiplied by the average account value over the period, multiplied by the number of days in the most recent fiscal half-year, then divided by 365. |
Legg Mason Partners Real Return Strategy Fund 2006 Semi-Annual Report 3
Schedule of Investments (June 30, 2006) (unaudited)
LEGG MASON PARTNERS REAL RETURN STRATEGY FUND
| | | | | |
| | |
| Shares | | Security | | Value |
| | | | | | |
| COMMON STOCKS — 72.3% | | | |
| ENERGY — 29.0% | | | |
| Energy Equipment & Services — 3.6% | | | |
| 1,800 | | ENSCO International Inc. | | $ | 82,836 |
| 1,800 | | Ensign Energy Services Inc. | | | 37,033 |
| 1,945 | | Halliburton Co. | | | 144,338 |
| 1,250 | | Helix Energy Solutions Group Inc.* | �� | | 50,450 |
| 1,250 | | Helmerich & Payne Inc. | | | 75,325 |
| 860 | | Maverick Tube Corp.* | | | 54,343 |
| 880 | | Nabors Industries Ltd.* | | | 29,735 |
| 1,160 | | Patterson-UTI Energy Inc. | | | 32,840 |
| 507 | | Petroleum Geo-Services ASA* | | | 28,583 |
| 1,300 | | Precision Drilling Trust | | | 43,256 |
| 3,850 | | Schlumberger Ltd. | | | 250,674 |
| 1,600 | | Unit Corp.* | | | 91,024 |
|
| | | Total Energy Equipment & Services | | | 920,437 |
|
| Oil, Gas & Consumable Fuels — 25.4% | | | |
| 2,000 | | Anadarko Petroleum Corp. | | | 95,380 |
| 1,200 | | Apache Corp. | | | 81,900 |
| 15,479 | | BG Group PLC | | | 206,756 |
| 58,058 | | BP PLC | | | 676,746 |
| 800 | | Cameco Corp. | | | 31,907 |
| 1,500 | | Canadian Natural Resources Ltd. | | | 83,031 |
| 6,898 | | Chevron Corp. | | | 428,090 |
| 1,560 | | ConocoPhillips | | | 102,227 |
| 1,300 | | Devon Energy Corp. | | | 78,533 |
| 5,359 | | EnCana Corp. | | | 282,336 |
| 6,661 | | Eni SpA | | | 196,026 |
| 17,856 | | Exxon Mobil Corp. | | | 1,095,466 |
| 3,800 | | Frontier Oil Corp. | | | 123,120 |
| 2,742 | | Gazprom, Registered Shares, Sponsored ADR | | | 115,301 |
| 1,620 | | Hess Corp. | | | 85,617 |
| 1,200 | | Husky Energy Inc. | | | 75,401 |
| 6 | | Inpex Holdings Inc.* | | | 52,923 |
| 1,922 | | Kerr-McGee Corp. | | | 133,291 |
| 1,700 | | Marathon Oil Corp. | | | 141,610 |
| 1,700 | | Nexen Inc. | | | 95,901 |
| 2,500 | | OAO Gazprom, Sponsored ADR | | | 105,125 |
| 1,800 | | Occidental Petroleum Corp. | | | 184,590 |
| 2,809 | | Petroleo Brasileiro SA, Sponsored ADR | | | 224,271 |
| 7,900 | | PTT Public Co., Ltd. | | | 46,787 |
| | | Royal Dutch Shell PLC: | | | |
| 10,536 | | Class A Shares | | | 354,088 |
| 5,500 | | Class B Shares | | | 192,279 |
| 5,900 | | Saipem SpA | | | 134,125 |
| 660 | | St. Mary Land & Exploration Co. | | | 26,565 |
See Notes to Financial Statements.
4 Legg Mason Partners Real Return Strategy Fund 2006 Semi-Annual Report
Schedule of Investments (June 30, 2006) (unaudited) (continued)
| | | | | |
| | |
| Shares | | Security | | Value |
| | | | | | |
| Oil, Gas & Consumable Fuels — 25.4% (continued) | | | |
| 4,859 | | Statoil ASA | | $ | 137,748 |
| 2,150 | | Suncor Energy Inc. | | | 174,198 |
| 700 | | Sunoco Inc. | | | 48,503 |
| 1,450 | | Tesoro Corp. | | | 107,822 |
| 5,732 | | Total SA | | | 376,853 |
| 2,400 | | Trican Well Service Ltd. | | | 48,000 |
| 4,900 | | Tullow Oil PLC | | | 34,605 |
| 2,500 | | Valero Energy Corp. | | | 166,300 |
| 1,550 | | Woodside Petroleum Ltd. | | | 50,621 |
|
| | | Total Oil, Gas & Consumable Fuels | | | 6,594,042 |
|
| | | TOTAL ENERGY | | | 7,514,479 |
|
| EXCHANGE TRADED FUNDS — 0.1% | | | |
| 500 | | iShares Dow Jones U.S. Real Estate Index Fund | | | 35,625 |
|
| INDUSTRIAL — 0.0% | | | |
| 507 | | Petrojarl ASA* | | | 3,339 |
|
| MATERIALS — 19.4% | | | |
| Chemicals — 0.0% | | | |
| 193 | | Tronox Inc., Class B Shares | | | 2,541 |
|
| Metals & Mining — 19.4% | | | |
| 395 | | Aber Diamond Corp. | | | 12,119 |
| 2,829 | | Alcan Inc., Toronto Shares | | | 132,671 |
| 6,136 | | Alcoa Inc. | | | 198,561 |
| 9,335 | | Alumina Ltd. | | | 46,770 |
| 10,279 | | Anglo American PLC | | | 421,493 |
| 4,978 | | Arcelor | | | 240,069 |
| 3,268 | | Barrick Gold Corp. | | | 96,633 |
| 21,575 | | BHP Billiton Ltd. | | | 464,407 |
| 15,274 | | BHP Billiton PLC | | | 296,215 |
| 8,225 | | BlueScope Steel Ltd. | | | 48,535 |
| 800 | | Boehler-Uddeholm AG | | | 43,703 |
| 3,450 | | Boliden AB | | | 63,359 |
| 1,200 | | Companhia Vale do Rio Doce, Sponsored ADR | | | 24,696 |
| 7,000 | | Daido Steel Co., Ltd. | | | 54,897 |
| 6,000 | | Dowa Mining Co., Ltd. | | | 53,028 |
| 1,850 | | Falconbridge Ltd. | | | 97,561 |
| 1,500 | | First Quantum Minerals Ltd. | | | 67,318 |
| 1,421 | | Freeport-McMoRan Copper & Gold Inc., Class B Shares | | | 78,738 |
| 1,350 | | Gerdau SA, Sponsored ADR | | | 20,129 |
| 3,710 | | Gold Fields Ltd., Sponsored ADR | | | 84,959 |
| 18,000 | | Grupo Mexico SA de CV, Series B Shares | | | 51,667 |
| 710 | | Impala Platinum Holdings Ltd. | | | 130,821 |
| 2,700 | | JFE Holdings Inc. | | | 114,362 |
| 3,230 | | Kinross Gold Corp.* | | | 35,255 |
| 22,000 | | Kobe Steel Ltd. | | | 68,783 |
| 646 | | Meridian Gold Inc.* | | | 20,405 |
See Notes to Financial Statements.
Legg Mason Partners Real Return Strategy Fund 2006 Semi-Annual Report 5
Schedule of Investments (June 30, 2006) (unaudited) (continued)
| | | | | |
| | |
| Shares | | Security | | Value |
| | | | | | |
| Metals & Mining — 19.4% (continued) | | | |
| 11,000 | | Mitsui Mining & Smelting Co., Ltd. | | $ | 64,844 |
| 2,650 | | Newcrest Mining Ltd. | | | 41,464 |
| 1,943 | | Newmont Mining Corp. | | | 102,843 |
| 31,000 | | Nippon Steel Corp. | | | 117,226 |
| 2,570 | | Nucor Corp. | | | 139,423 |
| 15,900 | | OneSteel Ltd. | | | 48,033 |
| 19,400 | | Oxiana Ltd. | | | 45,503 |
| 2,032 | | Phelps Dodge Corp. | | | 166,949 |
| 1,517 | | Rautaruukki OYJ | | | 45,787 |
| 400 | | Reliance Steel & Aluminum Co. | | | 33,180 |
| 1,831 | | Rio Tinto Ltd. | | | 105,735 |
| 7,362 | | Rio Tinto PLC | | | 389,124 |
| 290 | | Southern Copper Corp. | | | 25,848 |
| 2,079 | | SSAB Svenskt Stal AB, Series A | | | 41,351 |
| 801 | | SSAB Svenskt Stal AB, Series B | | | 15,099 |
| 9,000 | | Sumitomo Metal Industries Ltd. | | | 37,099 |
| 5,000 | | Sumitomo Metal Mining Co., Ltd. | | | 65,150 |
| 1,840 | | Teck Cominco Ltd., Class B Shares | | | 110,532 |
| 2,803 | | ThyssenKrupp AG | | | 95,885 |
| 2,400 | | Tokyo Steel Manufacturing Co., Ltd. | | | 52,504 |
| 916 | | United States Steel Corp. | | | 64,230 |
| 2,200 | | Vedanta Resources PLC | | | 55,437 |
| 300 | | Voestalpine AG | | | 45,543 |
| 2,850 | | Xstrata PLC | | | 108,013 |
| 7,300 | | Zinifex Ltd. | | | 54,293 |
|
| | | Total Metals & Mining | | | 5,038,249 |
|
| | | TOTAL MATERIALS | | | 5,040,790 |
|
| REAL ESTATE INVESTMENT TRUSTS (REITs) — 23.8% | | | |
| Apartments — 2.6% | | | |
| 2,600 | | Apartment Investment and Management Co., Class A Shares | | | 112,970 |
| 2,757 | | Archstone-Smith Trust | | | 140,249 |
| 1,501 | | Avalonbay Communities Inc. | | | 166,041 |
| 1,062 | | BRE Properties Inc., Class A Shares | | | 58,410 |
| 2,111 | | Equity Residential | | | 94,425 |
| 141 | | Essex Property Trust Inc. | | | 15,744 |
| 1,320 | | Home Properties Inc. | | | 73,273 |
| 60 | | Post Properties Inc. | | | 2,720 |
|
| | | Total Apartments | | | 663,832 |
|
| Diversified — 7.1% | | | |
| 8,450 | | British Land Co. PLC | | | 197,305 |
| 27,000 | | Cheung Kong Holdings Ltd. | | | 292,700 |
| 1,140 | | Hammerson PLC | | | 24,954 |
| 606 | | Investors Real Estate Trust | | | 5,472 |
| 2,050 | | iStar Financial Inc. | | | 77,388 |
| 5,300 | | Land Securities Group PLC | | | 175,783 |
See Notes to Financial Statements.
6 Legg Mason Partners Real Return Strategy Fund 2006 Semi-Annual Report
Schedule of Investments (June 30, 2006) (unaudited) (continued)
| | | | | |
| | |
| Shares | | Security | | Value |
| | | | | | |
| Diversified — 7.1% (continued) | | | |
| 1,010 | | Metrovacesa SA | | $ | 91,118 |
| 11,000 | | Mitsubishi Estate Company Ltd. | | | 233,440 |
| 10,000 | | Mitsui Fudosan Co., Ltd. | | | 217,021 |
| 1,000 | | Rodamco Europe NV | | | 97,947 |
| 3,578 | | Spirit Finance Corp. | | | 40,288 |
| 14,675 | | Stockland | | | 76,466 |
| 11,000 | | Swire Pacific Ltd., Class A Shares | | | 113,512 |
| 500 | | Tokyu Land Corp. | | | 3,891 |
| 170 | | Unibail | | | 29,609 |
| 1,402 | | Vornado Realty Trust | | | 136,765 |
| 200 | | Wereldhave NV | | | 19,436 |
|
| | | Total Diversified | | | 1,833,095 |
|
| Health Care — 0.2% | | | |
| 1,816 | | Health Care Property Investors Inc. | | | 48,560 |
|
| Home Financing — 0.6% | | | |
| 2,400 | | Brookfield Asset Management Inc., Class A | | | 96,560 |
| 1,200 | | New Century Financial Corp. | | | 54,900 |
|
| | | Total Home Financing | | | 151,460 |
|
| Industrial — 1.1% | | | |
| 1,935 | | AMB Property Corp. | | | 97,814 |
| 3,701 | | ProLogis | | | 192,896 |
|
| | | Total Industrial | | | 290,710 |
|
| Industrial/Office – Mixed — 2.5% | | | |
| 6,000 | | CB Richard Ellis Group Inc., Class A Shares* | | | 149,400 |
| 5,750 | | Centro Properties Group | | | 28,553 |
| 853 | | Duke Realty Corp. | | | 29,983 |
| 55,000 | | Hang Lung Properties Ltd. | | | 99,491 |
| 47,000 | | New World Development Co., Ltd. | | | 76,851 |
| 66,000 | | Sino Land Co., Ltd. | | | 105,369 |
| 6,000 | | Sumitomo Realty & Development Co., Ltd. | | | 147,766 |
|
| | | Total Industrial/Office – Mixed | | | 637,413 |
|
| Lodging/Resorts — 1.7% | | | |
| 1,013 | | FelCor Lodging Trust Inc. | | | 22,022 |
| 624 | | Highland Hospitality Corp. | | | 8,786 |
| 2,041 | | Hospitality Properties Trust | | | 89,641 |
| 8,645 | | Host Marriott Corp. | | | 189,066 |
| 1,500 | | Jones Lang LaSalle Inc. | | | 131,325 |
|
| | | Total Lodging/Resorts | | | 440,840 |
|
| Office — 2.8% | | | |
| 1,805 | | BioMed Realty Trust Inc. | | | 54,042 |
| 1,400 | | Boston Properties Inc. | | | 126,560 |
| 291 | | Corporate Office Properties Trust | | | 12,245 |
| 6,364 | | Equity Office Properties Trust | | | 232,350 |
See Notes to Financial Statements.
Legg Mason Partners Real Return Strategy Fund 2006 Semi-Annual Report 7
Schedule of Investments (June 30, 2006) (unaudited) (continued)
| | | | | | | | | |
| | | |
| Shares | | | | Security | | Value | |
| | | | | | | | | | |
| | Office — 2.8% (continued) | | | | |
| | 4,000 | | | | Leopalace21 Corp. | | $ | 137,985 | |
| | 652 | | | | SL Green Realty Corp. | | | 71,374 | |
| | 10,000 | | | | Sun Hung Kai Properties Ltd. | | | 101,970 | |
|
|
|
| | | | | | Total Office | | | 736,526 | |
|
|
|
| | Regional Malls — 2.5% | | | | |
| | 1,346 | | | | General Growth Properties Inc. | | | 60,651 | |
| | 20,800 | | | | GPT Group | | | 67,004 | |
| | 900 | | | | Macerich Co. | | | 63,180 | |
| | 2,588 | | | | Simon Property Group Inc. | | | 214,649 | |
| | 1,023 | | | | Taubman Centers Inc. | | | 41,841 | |
| | 15,825 | | | | Westfield Group | | | 203,560 | |
|
|
|
| | | | | | Total Regional Malls | | | 650,885 | |
|
|
|
| | Retail – Free Standing — 0.9% | | | | |
| | 1,351 | | | | Getty Realty Corp. | | | 38,422 | |
| | 9,550 | | | | Lend Lease Corp. Ltd. | | | 99,168 | |
| | 10,050 | | | | Macquarie Goodman Group | | | 44,758 | |
| | 2,417 | | | | National Retail Properties Inc. | | | 48,219 | |
|
|
|
| | | | | | Total Retail – Free Standing | | | 230,567 | |
|
|
|
| | Self Storage — 0.5% | | | | |
| | 1,029 | | | | Public Storage Inc. | | | 78,101 | |
| | 1,051 | | | | Shurgard Storage Centers Inc., Class A Shares | | | 65,688 | |
|
|
|
| | | | | | Total Self Storage | | | 143,789 | |
|
|
|
| | Shopping Centers — 1.3% | | | | |
| | 1,103 | | | | Developers Diversified Realty Corp. | | | 57,555 | |
| | 642 | | | | Federal Realty Investment Trust | | | 44,940 | |
| | 3,337 | | | | Kimco Realty Corp. | | | 121,767 | |
| | 1,522 | | | | Regency Centers Corp. | | | 94,592 | |
| | 541 | | | | Weingarten Realty Investors | | | 20,709 | |
|
|
|
| | | | | | Total Shopping Centers | | | 339,563 | |
|
|
|
| | | | | | TOTAL REAL ESTATE INVESTMENT TRUSTS (REITs) | | | 6,167,240 | |
|
|
|
| | | | | | TOTAL COMMON STOCKS
(Cost — $15,574,019) | | | 18,761,473 | |
|
|
|
| | | |
Face
Amount | | Rating‡ | | | | | |
| | CORPORATE NOTES — 0.2% | | | | |
| | Capital Markets — 0.2% | | | | |
| $ | 60,000 | | A+ | | Lehman Brothers Holdings Inc., Medium-Term Notes, Series G, 4.270% due 9/28/07 (a) (Cost — $59,909) | | | 59,296 | |
|
|
|
See Notes to Financial Statements.
8 Legg Mason Partners Real Return Strategy Fund 2006 Semi-Annual Report
Schedule of Investments (June 30, 2006) (unaudited) (continued)
| | | | | | | |
| | |
Face
Amount | | Security | | Value | |
| | | | | | | | |
| | U.S. GOVERNMENT OBLIGATIONS — 0.6% | |
| $ | 90,000 | | U.S. Treasury Bonds, 6.250% due 8/15/23 | | $ | 99,288 | |
| | 100,000 | | U.S. Treasury Strip Principal (STRIPS), zero coupon bond to yield 5.533% due 11/15/21 | | | 44,229 | |
|
|
|
| | | | TOTAL U.S. GOVERNMENT OBLIGATIONS
(Cost — $143,135) | | | 143,517 | |
|
|
|
| | U.S. TREASURY INFLATION PROTECTED SECURITIES (b) — 20.7% | | | | |
| | | | U.S. Treasury Bonds, Inflation Indexed: | | | | |
| | 560,185 | | 3.000% due 7/15/12 | | | 577,035 | |
| | 1,709,888 | | 2.375% due 1/15/25 | | | 1,664,737 | |
| | | | U.S. Treasury Notes, Inflation Indexed: | | | | |
| | 187,035 | | 3.625% due 1/15/08 | | | 190,308 | |
| | 307,078 | | 3.875% due 1/15/09 | | | 318,161 | |
| | 718,392 | | 4.250% due 1/15/10 | | | 763,404 | |
| | 572,360 | | 2.000% due 1/15/14 | | | 552,641 | |
| | 1,265,976 | | 1.625% due 1/15/15 | | | 1,180,573 | |
| | 134,635 | | 1.875% due 7/15/15 | | | 127,792 | |
|
|
|
| | | | TOTAL U.S. TREASURY INFLATION PROTECTED SECURITIES
(Cost — $5,615,001) | | | 5,374,651 | |
|
|
|
| | | | TOTAL INVESTMENTS BEFORE SHORT-TERM INVESTMENTS
(Cost — $21,392,064) | | | 24,338,937 | |
|
|
|
| | SHORT-TERM INVESTMENTS — 6.3% | | | | |
| | Repurchase Agreements — 6.2% | | | | |
| | 542,000 | | Merrill Lynch, Pierce, Fenner & Smith Inc. repurchase agreement dated 6/30/06, 5.150% due 7/3/06; Proceeds at maturity — $542,233; (Fully collateralized by U.S. government agency obligation, 0.000% due 4/18/07; Market value — $555,002) (b) | | | 542,000 | |
| | 1,087,000 | | State Street Bank & Trust Co., dated 6/30/06, 4.080% due 7/3/06; Proceeds at maturity — $1,087,370; (Fully collateralized by U.S. Treasury Note, 4.625% due 3/31/08; Market value — $1,115,000) | | | 1,087,000 | |
|
|
|
| | | | Total Repurchase Agreements | | | 1,629,000 | |
|
|
|
| | U.S. Government Agency Obligation — 0.1% | | | | |
| | 20,000 | | Federal National Mortgage Association (FNMA), Discount Notes, 5.053% due 9/25/06 (c)(d) | | | 19,757 | |
|
|
|
| | | | TOTAL SHORT-TERM INVESTMENTS
(Cost — $1,648,763) | | | 1,648,757 | |
|
|
|
| | | | TOTAL INVESTMENTS — 100.1% (Cost — $23,040,827#) | | | 25,987,694 | |
| | | | Liabilities in Excess of Other Assets — (0.1)% | | | (38,360 | ) |
|
|
|
| | | | TOTAL NET ASSETS — 100.0% | | $ | 25,949,334 | |
|
|
|
See Notes to Financial Statements.
Legg Mason Partners Real Return Strategy Fund 2006 Semi-Annual Report 9
Schedule of Investments (June 30, 2006) (unaudited) (continued)
| * | | Non-income producing security. |
| ‡ | | All ratings are by Standard & Poor’s Ratings Service, unless otherwise noted. |
| (a) | | Variable rate security. Interest rate disclosed is that which is in effect at June 30, 2006. |
| (b) | | All or a portion of this security is segregated for open futures contracts and written options. |
| (c) | | Rate shown represents yield to maturity. |
| (d) | | All or a portion of this security is held at the broker as collateral for open futures contracts. |
| # | | Aggregate cost for federal income tax purposes is substantially the same. |
See page 11 for definitions of ratings.
| | |
Abbreviation used in this schedule:
|
| ADR | | — American Depositary Receipt |
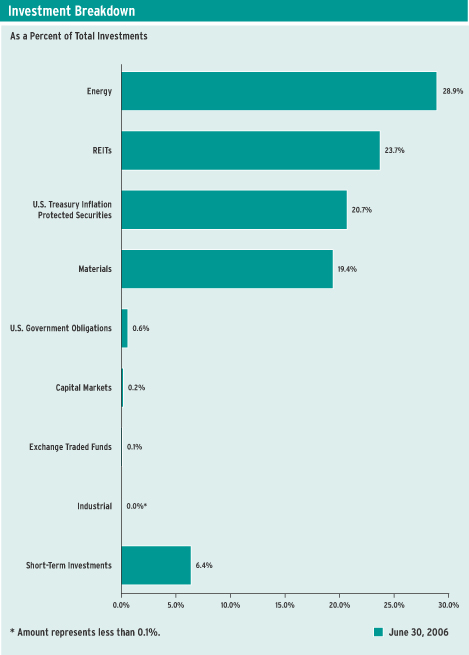
Summary of Investments by Country* (unaudited)
| | | |
United States | | 57.3 | % |
United Kingdom | | 10.7 | |
Japan | | 5.9 | |
Australia | | 5.5 | |
Canada | | 5.5 | |
France | | 3.0 | |
Italy | | 1.8 | |
Hong Kong | | 1.6 | |
Brazil | | 1.3 | |
Norway | | 1.0 | |
Netherlands | | 1.0 | |
Netherlands Antilles | | 0.9 | |
South Africa | | 0.8 | |
Luxembourg | | 0.8 | |
Sweden | | 0.6 | |
Spain | | 0.5 | |
Russia | | 0.4 | |
Austria | | 0.4 | |
Finland | | 0.3 | |
Germany | | 0.2 | |
Mexico | | 0.2 | |
Bermuda | | 0.2 | |
Cayman Islands | | 0.1 | |
|
|
| | | 100.0 | % |
|
|
| * | | As a percent of total investments. Please note that Fund holdings are as of June 30, 2006 and are subject to change. |
Schedule of Options Written (unaudited)
| | | | | | | | | | |
| | | | |
| Contracts | | Security | | Expiration
Date | | Strike
Price | | Value |
| 2 | | U.S. Treasury 10-Year Notes, Futures, Call | | 7/21/06 | | $ | 106.00 | | $ | 156 |
| 2 | | U.S. Treasury 5-Year Notes, Futures, Call | | 7/21/06 | | | 103.00 | | | 1,000 |
|
| | | TOTAL OPTIONS WRITTEN
(Premiums received — $1,449) | | | | | | | $ | 1,156 |
|
See Notes to Financial Statements.
10 Legg Mason Partners Real Return Strategy Fund 2006 Semi-Annual Report
Bond Ratings (unaudited)
The definitions of the applicable rating symbols are set forth below:
Standard & Poor’s Ratings Service (“Standard & Poor’s”) — Ratings from “AA” to “A” may be modified by the addition of a plus (+) or minus (-) sign to show relative standings within the major rating categories.
AAA | — Bonds rated “AAA” have the highest rating assigned by Standard & Poor’s. Capacity to pay interest and repay principal is extremely strong. |
AA | — Bonds rated “AA” have a very strong capacity to pay interest and repay principal and differ from the highest rated issues only in a small degree. |
A | — Bonds rated “A” have a strong capacity to pay interest and repay principal although they are somewhat more susceptible to the adverse effects of changes in circumstances and economic conditions than debt in higher rated categories. |
Legg Mason Partners Real Return Strategy Fund 2006 Semi-Annual Report 11
Statement of Assets and Liabilities (June 30, 2006) (unaudited)
| | | |
| ASSETS: | | | |
Investments, at value (Cost — $23,040,827) | | $ | 25,987,694 |
Foreign currency, at value (Cost — $13,163) | | | 13,365 |
Cash | | | 100,869 |
Receivable for Fund shares sold | | | 94,354 |
Dividends and interest receivable | | | 93,233 |
Receivable for securities sold | | | 46,153 |
Receivable from investment manager | | | 28,741 |
Receivable from broker — variation margin on open futures contracts | | | 766 |
Prepaid expenses | | | 20,869 |
|
Total Assets | | | 26,386,044 |
|
| LIABILITIES: | | | |
Payable for securities purchased | | | 353,729 |
Payable for Fund shares repurchased | | | 11,963 |
Distribution fees payable | | | 5,132 |
Distributions payable | | | 4,376 |
Directors’ fees payable | | | 2,282 |
Options written, at value (premium received $1,449) | | | 1,156 |
Accrued expenses | | | 58,072 |
|
Total Liabilities | | | 436,710 |
|
Total Net Assets | | $ | 25,949,334 |
|
| NET ASSETS: | | | |
Par value (Note 6) | | $ | 1,836 |
Paid-in capital in excess of par value | | | 21,711,451 |
Undistributed net investment income | | | 26,362 |
Accumulated net realized gain on investments, futures contracts and foreign currency transactions | | | 1,267,586 |
Net unrealized appreciation on investments, futures contracts, options written and foreign currencies | | | 2,942,099 |
|
Total Net Assets | | $ | 25,949,334 |
|
Shares Outstanding: | | | |
Class A | | | 1,201,957 |
|
Class B | | | 385,757 |
|
Class C | | | 248,176 |
|
Net Asset Value: | | | |
Class A (and redemption price) | | | $14.13 |
|
Class B * | | | $14.14 |
|
Class C * | | | $14.13 |
|
Maximum Public Offering Price Per Share: | | | |
Class A (based on maximum sales charge of 5.00%) | | | $14.87 |
|
| * | | Redemption price is NAV of Class B and C shares reduced by a 5.00% and 1.00% CDSC, respectively, if shares are redeemed within one year from purchase payment (See Note 2). |
See Notes to Financial Statements.
12 Legg Mason Partners Real Return Strategy Fund 2006 Semi-Annual Report
Statement of Operations (For the six months ended June 30, 2006) (unaudited)
| | | | |
| INVESTMENT INCOME: | | | | |
Dividends | | $ | 257,518 | |
Interest | | | 145,252 | |
Less: Foreign taxes withheld | | | (15,795 | ) |
|
|
Total Investment Income | | | 386,975 | |
|
|
| EXPENSES: | | | | |
Investment management fee (Note 2) | | | 78,081 | |
Distribution fees (Note 4) | | | 59,996 | |
Shareholder reports (Note 4) | | | 46,631 | |
Custody fees | | | 35,938 | |
Registration fees | | | 15,895 | |
Audit and tax | | | 13,736 | |
Transfer agent fees (Note 4) | | | 13,462 | |
Legal fees | | | 9,968 | |
Directors’ fees | | | 1,166 | |
Insurance | | | 237 | |
Miscellaneous expenses | | | 9,320 | |
|
|
Total Expenses | | | 284,430 | |
Less: Fee waivers and/or expense reimbursements (Notes 2 and 7) | | | (112,800 | ) |
|
|
Net Expenses | | | 171,630 | |
|
|
Net Investment Income | | | 215,345 | |
|
|
| REALIZED AND UNREALIZED GAIN (LOSS) ON INVESTMENTS, FUTURES CONTRACTS, OPTIONS WRITTEN AND FOREIGN CURRENCY TRANSACTIONS (NOTES 1 AND 3): | | | | |
Net Realized Gain From: | | | | |
Investment transactions | | | 1,317,036 | |
Futures contracts | | | 73 | |
Foreign currency transactions | | | 11,554 | |
|
|
Net Realized Gain | | | 1,328,663 | |
|
|
Change in Net Unrealized Appreciation/Depreciation From: | | | | |
Investments | | | 802,332 | |
Futures contracts | | | (4,249 | ) |
Options written | | | 293 | |
Foreign currencies | | | (774 | ) |
|
|
Change in Net Unrealized Appreciation/Depreciation | | | 797,602 | |
|
|
Net Gain on Investments, Futures Contracts, Options
Written and Foreign Currency Transactions | | | 2,126,265 | |
|
|
Increase in Net Assets From Operations | | $ | 2,341,610 | |
|
|
See Notes to Financial Statements.
Legg Mason Partners Real Return Strategy Fund 2006 Semi-Annual Report 13
Statements of Changes in Net Assets
| | | | | | | | | | | | |
For the six months ended June 30, 2006 (unaudited) and the periods ended December 31, 2005 and September 30, 2005 | |
| | | |
| | | 2006 | | | December 31,
2005(1)(2) | | | September 30,
2005(3) | |
| OPERATIONS: | | | | | | | | | | | | |
Net investment income | | $ | 215,345 | | | $ | 111,158 | | | $ | 290,995 | |
Net realized gain | | | 1,328,663 | | | | 182,166 | | | | 152,261 | |
Change in net unrealized appreciation/depreciation | | | 797,602 | | | | (498,813 | ) | | | 2,643,310 | |
|
|
Increase (Decrease) in Net Assets From Operations | | | 2,341,610 | | | | (205,489 | ) | | | 3,086,566 | |
|
|
DISTRIBUTIONS TO SHAREHOLDERS FROM (NOTES 1 AND 5): | | | | | | | | | | | | |
Net investment income | | | (188,983 | ) | | | (175,988 | ) | | | (302,611 | ) |
Net realized gains | | | (166,007 | ) | | | (193,482 | ) | | | — | |
|
|
Decrease in Net Assets From
Distributions to Shareholders | | | (354,990 | ) | | | (369,470 | ) | | | (302,611 | ) |
|
|
| FUND SHARE TRANSACTIONS (NOTE 6): | | | | | | | | | | | | |
Net proceeds from sale of shares | | | 3,884,449 | | | | 1,259,585 | | | | 20,279,118 | |
Reinvestment of distributions | | | 337,755 | | | | 349,309 | | | | 278,538 | |
Cost of shares repurchased | | | (1,747,785 | ) | | | (977,818 | ) | | | (1,909,433 | ) |
|
|
Increase in Net Assets From Fund Share Transactions | | | 2,474,419 | | | | 631,076 | | | | 18,648,223 | |
|
|
Increase in Net Assets | | | 4,461,039 | | | | 56,117 | | | | 21,432,178 | |
| NET ASSETS: | | | | | | | | | | | | |
Beginning of period | | | 21,488,295 | | | | 21,432,178 | | | | — | |
|
|
End of period* | | $ | 25,949,334 | | | $ | 21,488,295 | | | $ | 21,432,178 | |
|
|
* Includes undistributed net investment income of: | | | $26,362 | | | | $— | | | | $49,168 | |
|
|
| (1) | | For the period October 1, 2005 to December 31, 2005. |
| (2) | | Effective October 1, 2005, Legg Mason Partners Real Return Strategy Fund changed its fiscal year end to December 31. |
| (3) | | For the period November 12, 2004 (commencement of operations) to September 30, 2005. |
See Notes to Financial Statements.
14 Legg Mason Partners Real Return Strategy Fund 2006 Semi-Annual Report
Financial Highlights
For a share of each class of capital stock outstanding throughout each period ended December 31, unless otherwise noted:
| | | | | | | | | | | | |
| | | |
| Class A Shares(1) | | 2006(2) | | | 2005(3)(4) | | | 2005(5) | |
Net Asset Value, Beginning of Period | | $ | 12.96 | | | $ | 13.31 | | | $ | 11.40 | |
|
|
Income (Loss) From Operations: | | | | | | | | | | | | |
Net investment income | | | 0.14 | | | | 0.08 | | | | 0.23 | |
Net realized and unrealized gain (loss) | | | 1.24 | | | | (0.20 | ) | | | 1.91 | |
|
|
Total Income (Loss) From Operations | | | 1.38 | | | | (0.12 | ) | | | 2.14 | |
|
|
Less Distributions From: | | | | | | | | | | | | |
Net investment income | | | (0.12 | ) | | | (0.11 | ) | | | (0.23 | ) |
Net realized gains | | | (0.09 | ) | | | (0.12 | ) | | | — | |
|
|
Total Distributions | | | (0.21 | ) | | | (0.23 | ) | | | (0.23 | ) |
|
|
Net Asset Value, End of Period | | $ | 14.13 | | | $ | 12.96 | | | $ | 13.31 | |
|
|
Total Return(6) | | | 10.73 | % | | | (0.87 | )% | | | 18.92 | % |
|
|
Net Assets, End of Period (000s) | | | $16,989 | | | | $14,660 | | | | $15,006 | |
|
|
Ratios to Average Net Assets: | | | | | | | | | | | | |
Gross expenses(7) | | | 1.89 | % | | | 3.64 | % | | | 2.42 | % |
Net expenses(7)(8)(9) | | | 1.18 | | | | 1.20 | | | | 1.20 | |
Net investment income(7) | | | 2.02 | | | | 2.34 | | | | 2.17 | |
|
|
Portfolio Turnover Rate | | | 58 | % | | | 4 | % | | | 52 | % |
|
|
| (1) | | Per share amounts have been calculated using the average shares method. |
| (2) | | For the six months ended June 30, 2006 (unaudited). |
| (3) | | Effective October 1, 2005, Legg Mason Partners Real Return Strategy Fund changed its fiscal year end to December 31. |
| (4) | | For the period October 1, 2005 to December 31, 2005. |
| (5) | | For the period November 12, 2004 (commencement of operations) to September 30, 2005. |
| (6) | | Performance figures may reflect fee waivers and/or expense reimbursements. Past performance is no guarantee of future results. In the absence of fee waivers and/or expense reimbursements, the total return would have been lower. Total returns for periods of less than one year are not annualized. |
| (8) | | As a result of an expense limitation, the ratio of expenses to average net assets of Class A shares will not exceed 1.20%. |
| (9) | | Reflects fee waivers and/or expense reimbursements. |
See Notes to Financial Statements.
Legg Mason Partners Real Return Strategy Fund 2006 Semi-Annual Report 15
Financial Highlights (continued)
For a share of each class of capital stock outstanding throughout each period ended December 31, unless otherwise noted:
| | | | | | | | | | | | |
| | | |
| Class B Shares(1) | | 2006(2) | | | 2005(3)(4) | | | 2005(5) | |
Net Asset Value, Beginning of Period | | $ | 12.96 | | | $ | 13.31 | | | $ | 11.40 | |
|
|
Income (Loss) From Operations: | | | | | | | | | | | | |
Net investment income | | | 0.09 | | | | 0.05 | | | | 0.16 | |
Net realized and unrealized gain (loss) | | | 1.25 | | | | (0.19 | ) | | | 1.90 | |
|
|
Total Income (Loss) From Operations | | | 1.34 | | | | (0.14 | ) | | | 2.06 | |
|
|
Less Distributions From: | | | | | | | | | | | | |
Net investment income | | | (0.07 | ) | | | (0.09 | ) | | | (0.15 | ) |
Net realized gains | | | (0.09 | ) | | | (0.12 | ) | | | — | |
|
|
Total Distributions | | | (0.16 | ) | | | (0.21 | ) | | | (0.15 | ) |
|
|
Net Asset Value, End of Period | | $ | 14.14 | | | $ | 12.96 | | | $ | 13.31 | |
|
|
Total Return(6) | | | 10.42 | % | | | (1.06 | )% | | | 18.19 | % |
|
|
Net Assets, End of Period (000s) | | | $5,453 | | | | $4,247 | | | | $4,059 | |
|
|
Ratios to Average Net Assets: | | | | | | | | | | | | |
Gross expenses(7) | | | 3.44 | % | | | 4.98 | % | | | 4.26 | % |
Net expenses(7)(8)(9) | | | 1.92 | | | | 1.95 | | | | 1.95 | |
Net investment income(7) | | | 1.33 | | | | 1.59 | | | | 1.57 | |
|
|
Portfolio Turnover Rate | | | 58 | % | | | 4 | % | | | 52 | % |
|
|
| (1) | | Per share amounts have been calculated using the average shares method. |
| (2) | | For the six months ended June 30, 2006 (unaudited). |
| (3) | | Effective October 1, 2005, Legg Mason Partners Real Return Strategy Fund changed its fiscal year end to December 31. |
| (4) | | For the period October 1, 2005 to December 31, 2005. |
| (5) | | For the period November 15, 2004 (commencement of operations) to September 30, 2005. |
| (6) | | Performance figures may reflect fee waivers and/or expense reimbursements. Past performance is no guarantee of future results. In the absence of fee waivers and/or expense reimbursements, the total return would have been lower. Total returns for periods of less than one year are not annualized. |
| (8) | | As a result of an expense limitation, the ratio of expenses to average net assets of Class B shares will not exceed 1.95%. |
| (9) | | Reflects fee waivers and/or expense reimbursements. |
See Notes to Financial Statements.
16 Legg Mason Partners Real Return Strategy Fund 2006 Semi-Annual Report
Financial Highlights (continued)
For a share of each class of capital stock outstanding throughout each period ended December 31, unless otherwise noted:
| | | | | | | | | | | | |
| | | |
| Class C Shares(1) | | 2006(2) | | | 2005(3)(4) | | | 2005(5) | |
Net Asset Value, Beginning of Period | | $ | 12.96 | | | $ | 13.31 | | | $ | 11.40 | |
|
|
Income (Loss) From Operations: | | | | | | | | | | | | |
Net investment income | | | 0.09 | | | | 0.05 | | | | 0.16 | |
Net realized and unrealized gain (loss) | | | 1.24 | | | | (0.19 | ) | | | 1.90 | |
|
|
Total Income (Loss) From Operations | | | 1.33 | | | | (0.14 | ) | | | 2.06 | |
|
|
Less Distributions From: | | | | | | | | | | | | |
Net investment income | | | (0.07 | ) | | | (0.09 | ) | | | (0.15 | ) |
Net realized gains | | | (0.09 | ) | | | (0.12 | ) | | | — | |
|
|
Total Distributions | | | (0.16 | ) | | | (0.21 | ) | | | (0.15 | ) |
|
|
Net Asset Value, End of Period | | $ | 14.13 | | | $ | 12.96 | | | $ | 13.31 | |
|
|
Total Return(6) | | | 10.34 | % | | | (1.06 | )% | | | 18.19 | % |
|
|
Net Assets, End of Period (000s) | | | $3,507 | | | | $2,581 | | | | $2,367 | |
|
|
Ratios to Average Net Assets: | | | | | | | | | | | | |
Gross expenses(7) | | | 3.17 | % | | | 4.87 | % | | | 3.99 | % |
Net expenses(7)(8)(9) | | | 1.92 | | | | 1.95 | | | | 1.95 | |
Net investment income(7) | | | 1.35 | | | | 1.61 | | | | 1.52 | |
|
|
Portfolio Turnover Rate | | | 58 | % | | | 4 | % | | | 52 | % |
|
|
| (1) | | Per share amounts have been calculated using the average shares method. |
| (2) | | For the six months ended June 30, 2006 (unaudited). |
| (3) | | Effective October 1, 2005, Legg Mason Partners Real Return Strategy Fund changed its fiscal year end to December 31. |
| (4) | | For the period October 1, 2005 to December 31, 2005. |
| (5) | | For the period November 15, 2004 (commencement of operations) to September 30, 2005. |
| (6) | | Performance figures may reflect fee waivers and/or expense reimbursements. Past performance is no guarantee of future results. In the absence of fee waivers and/or expense reimbursements, the total return would have been lower. Total returns for periods of less than one year are not annualized. |
| (8) | | As a result of an expense limitation, the ratio of expenses to average net assets of Class C shares will not exceed 1.95%. |
| (9) | | Reflects fee waivers and/or expense reimbursements. |
See Notes to Financial Statements.
Legg Mason Partners Real Return Strategy Fund 2006 Semi-Annual Report 17
Notes to Financial Statements (unaudited)
| 1. | Organization and Significant Accounting Policies |
Legg Mason Partners Real Return Strategy Fund (formerly known as Smith Barney Real Return Strategy Fund) (the “Fund”) is a separate non-diversified series of Legg Mason Partners Investment Funds, Inc. (formerly known as Smith Barney Investment Funds Inc.) (the “Company”). The Company, a Maryland corporation, is registered under the Investment Company Act of 1940, as amended (the “1940 Act”), as an open-end management investment company.
The following are significant accounting policies consistently followed by the Fund and are in conformity with U.S. generally accepted accounting principles (“GAAP”). Estimates and assumptions are required to be made regarding assets, liabilities and changes in net assets resulting from operations when financial statements are prepared. Changes in the economic environment, financial markets and any other parameters used in determining these estimates could cause actual results to differ.
(a) Investment Valuation. Equity securities for which market quotations are available are valued at the last sale price or official closing price on the primary market or exchange on which they trade. Debt securities are valued at the mean between the bid and asked prices provided by an independent pricing service that are based on transactions in debt obligations, quotations from bond dealers, market transactions in comparable securities and various other relationships between securities. When prices are not readily available, or are determined not to reflect fair value, such as when the value of a security has been significantly affected by events after the close of the exchange or market on which the security is principally traded, but before the Fund calculates its net asset value, the Fund may value these investments at fair value as determined in accordance with the procedures approved by the Fund’s Board of Directors. Short-term obligations with maturities of 60 days or less are valued at amortized cost, which approximates market value.
(b) Repurchase Agreements. When entering into repurchase agreements, it is the Fund’s policy that its custodian or a third party custodian take possession of the underlying collateral securities, the market value of which at least equals the principal amount of the repurchase transaction, including accrued interest. To the extent that any repurchase transaction exceeds one business day, the value of the collateral is marked-to-market to ensure the adequacy of the collateral. If the seller defaults, and the market value of the collateral declines or if bankruptcy proceedings are commenced with respect to the seller of the security, realization of the collateral by the Fund may be delayed or limited.
(c) Financial Futures Contracts. The Fund may enter into financial futures contracts typically to attempt to hedge its portfolio, i.e., reduce the overall level of investment risk normally associated with the Fund, and for non-hedging purposes. Upon entering into a financial futures contract, the Fund is required to deposit cash or securities as initial margin. Additional securities are also segregated up to the current market value of the financial futures contracts. Subsequent payments, known as variation margin, are made or received by the Fund each day, depending on the daily fluctuation in the value of the underlying financial instruments. The Fund recognizes an unrealized gain or loss equal to the daily variation margin. When the financial futures contracts are closed, a realized gain or loss is recognized equal to the difference between the proceeds from (or cost of) the closing transactions and the Fund’s basis in the contracts.
18 Legg Mason Partners Real Return Strategy Fund 2006 Semi-Annual Report
Notes to Financial Statements (unaudited) (continued)
The risks associated with entering into financial futures contracts include the possibility that a change in the value of the contract may not correlate with the changes in the value of the underlying instruments. In addition, investing in financial futures contracts involves the risk that the Fund could lose more than the original margin deposit and subsequent payments required for a futures transaction. Risks may also arise upon entering into these contracts from the potential inability of the counterparties to meet the terms of their contracts.
(d) Written Options. When the Fund writes an option, an amount equal to the premium received by the Fund is recorded as a liability, the value of which is marked-to-market daily to reflect the current market value of the option written. If the option expires, the Fund realizes a gain from investments equal to the amount of the premium received. When a written call option is exercised, the difference between the premium and the amount for effecting a closing purchase transaction, including brokerage commission, is also treated as a realized gain or loss. When a written put option is exercised, the amount of the premium received reduces the cost of the security purchased by the Fund.
A risk in writing a covered call option is that the Fund may forego the opportunity of profit if the market price of the underlying security increases and the option is exercised. The risk in writing a put option is that the Fund may incur a loss if the market price of the underlying security decreases and the option is exercised. The risk in writing a call option is that the Fund is exposed to the risk of loss if the market price of the underlying security increases. In addition, there is the risk that the Fund may not be able to enter into a closing transaction because of an illiquid secondary market.
(e) Other Risks. The Fund primarily invests in the energy, real estate and metals and mining sectors, as well as inflation protected securities. Therefore, the Fund is subject to additional concentrations of credit and market risks associated with these industry segments, such as fluctuating prices and supplies of oil and other energy fuels, fluctuating property values, interest and mortgage related risks, price volatility caused by global economic, financial and political factors, resource availability and government regulation.
Additionally, the Fund’s investments in foreign securities may involve risks not present in domestic investments. Since securities may be denominated in foreign currencies and may require settlement in foreign currencies and pay interest and dividends in foreign currencies, changes in the relationship of these foreign currencies to the U.S. dollar can significantly affect the value of the investments and earnings of the Fund. Foreign investments may also subject the Fund to foreign government exchange restrictions, expropriation, taxation or other political, social or economic developments, all of which could affect the market and/or credit risk of the investments.
(f) Security Transactions and Investment Income. Security transactions are accounted for on a trade date basis. Interest income, adjusted for amortization of premium and accretion of discount, is recorded on the accrual basis. Dividend income is recorded on the ex-dividend date. Foreign dividend income is recorded on the ex-dividend date or as soon as practical after the Fund determines the existence of a dividend declaration after exercising reasonable due diligence. The cost of investments sold is determined by use of the specific identification method. To the extent any issuer defaults on an expected interest
Legg Mason Partners Real Return Strategy Fund 2006 Semi-Annual Report 19
Notes to Financial Statements (unaudited) (continued)
payment, the Fund’s policy is to generally halt any additional interest income accruals and consider the realizability of interest accrued up to the date of default.
(g) Foreign Currency Translation. Investment securities and other assets and liabilities denominated in foreign currencies are translated into U.S. dollar amounts based upon prevailing exchange rates on the date of valuation. Purchases and sales of investment securities and income and expense items denominated in foreign currencies are translated into U.S. dollar amounts based upon prevailing exchange rates on the respective dates of such transactions.
The Fund does not isolate that portion of the results of operations resulting from changes in foreign exchange rates on investments from the fluctuations arising from changes in market prices of securities held. Such fluctuations are included with the net realized and unrealized gain or loss on investments.
Net realized foreign exchange gains or losses arise from sales of foreign currencies, including gains and losses on forward foreign currency contracts, currency gains or losses realized between the trade and settlement dates on securities transactions and the difference between the amounts of dividends, interest and foreign withholding taxes recorded on the Fund’s books and the U.S. dollar equivalent of the amounts actually received or paid. Net unrealized foreign exchange gains and losses arise from changes in the fair values of assets and liabilities, other than investments in securities, at the date of valuation, resulting from changes in exchange rates.
Foreign security and currency transactions may involve certain considerations and risks not typically associated with those of U.S. dollar denominated transactions as a result of, among other factors, the possibility of lower levels of governmental supervision and regulation of foreign securities markets and the possibility of political or economic instability.
(h) Distributions to Shareholders. Distributions from net investment income for the Fund, if any, are declared and paid on a quarterly basis. Distributions of net realized gains, if any, are declared at least annually. Distributions are recorded on the ex-dividend date and are determined in accordance with income tax regulations, which may differ from GAAP.
(i) Class Accounting. Investment income, common expenses and realized/unrealized gain (loss) on investments are allocated to the various classes of the Fund on the basis of daily net assets of each class. Fees relating to a specific class are charged directly to that class.
(j) Federal and Other Taxes. It is the Fund’s policy to comply with the federal income and excise tax requirements of the Internal Revenue Code of 1986, as amended, applicable to regulated investment companies. Accordingly, the Fund intends to distribute substantially all of its income and net realized gains on investments, if any, to shareholders each year. Therefore, no federal income tax provision is required in the Fund’s financial statements. Under the applicable foreign tax laws, a withholding tax may be imposed on interest, dividends and capital gains at various rates.
(k) Reclassification. GAAP requires that certain components of net assets be adjusted to reflect permanent differences between financial and tax reporting. These reclassifications have no effect on net assets or net asset values per share.
20 Legg Mason Partners Real Return Strategy Fund 2006 Semi-Annual Report
Notes to Financial Statements (unaudited) (continued)
| 2. | Investment Management Agreement and Other Transactions with Affiliates |
For the period of this report, Smith Barney Fund Management LLC (“SBFM”), an indirect wholly-owned subsidiary of Legg Mason, Inc. (“Legg Mason”), acted as the investment manager of the Fund. Under the investment management agreement, the Fund paid an investment management fee calculated at an annual rate of 0.65% of the Fund’s average daily net assets. This fee is calculated daily and paid monthly.
During the six months ended June 30, 2006, SBFM waived its entire fee in the amount of $78,081. In addition, during the six months ended June 30, 2006, the Fund was reimbursed for expenses in the amount of $34,719.
During the six months ended June 30, 2006, the Fund’s Class A, B and C shares had voluntary expense limitations in place of 1.20%, 1.95% and 1.95%, respectively. These expense limitations may be modified or terminated at anytime by SBFM.
Citigroup Asset Management Limited (“CAM Ltd.”), an affiliate of SBFM, served as sub-adviser to the Fund pursuant to a Sub-Advisory Agreement since the Fund’s inception. CAM Ltd. managed the Fund’s Energy Securities segment under the supervision of SBFM. CAM Ltd. received a fee from SBFM, not the Fund, for its services, computed daily and paid monthly, at the annual rate of 0.45% of the Fund’s average daily net assets allocated to the Energy Securities segment.
TIMCO Asset Management Inc. (“TIMCO”), also an affiliate of SBFM, served as sub-adviser to the Fund pursuant to a Sub-Advisory Agreement since the Fund’s inception. TIMCO managed the Fund’s Real Estate Securities and Metals and Mining Securities segments under the supervision of SBFM. TIMCO received a fee from SBFM, not the Fund, for its services, computed daily and paid monthly, at the annual rate of 0.45% of the Fund’s average daily net assets allocated to the Real Estate Securities and Metals and Mining Securities segments.
Effective February 1, 2006, SBFM assumed portfolio management responsibilities for the Fund’s Energy Securities, Real Estate Securities and Metals and Mining Securities segments, and the sub-advisory contracts with CAM Ltd. with respect to the Fund’s Energy Securities segment and TIMCO with respect to the Fund’s Real Estate Securities and Metals and Mining Securities segments were terminated. The Fund’s management fee rate did not change as a result of the sub-advisory contract terminations.
Citigroup Global Markets Inc. (“CGM”), and Legg Mason Investor Services, LLC (“LMIS”), a wholly-owned broker-dealer subsidiary of Legg Mason, serve as co-distributors of the Fund.
There is a maximum initial sales charge of 5.00% for Class A shares. There is a contingent deferred sales charge (“CDSC”) of 5.00% on Class B shares, which applies if redemption occurs within one year from purchase payment. This CDSC declines thereafter by 1.00% per year until no CDSC is incurred. Class C shares have a 1.00% CDSC, which applies if redemption occurs within one year from purchase payment. In certain cases, Class A shares have a 1.00% CDSC, which applies if redemption occurs within one year from purchase payment. This CDSC only applies to those purchases of Class A shares which, when combined with current holdings of Class A shares, equal or exceed $1,000,000 in the aggregate. These purchases do not incur an initial sales charge.
Legg Mason Partners Real Return Strategy Fund 2006 Semi-Annual Report 21
Notes to Financial Statements (unaudited) (continued)
For the six months ended June 30, 2006, LMIS and its affiliates did not receive sales charges from the Fund’s Class A shares. In addition, for the six months ended June 30, 2006, there were no CDSCs paid to LMIS and its affiliates.
Certain officers and one Director of the Company are employees of Legg Mason or its affiliates and do not receive compensation from the Company.
During the six months ended June 30, 2006, the aggregate cost of purchases and proceeds from sales of investments (excluding short-term investments) and U.S. Government Obligations were as follows:
| | | | | | |
| | |
| | | Investments | | U.S. Government
Obligations |
Purchases | | $ | 12,707,428 | | $ | 2,250,031 |
|
Sales | | | 11,958,826 | | | 1,663,627 |
|
At June 30, 2006, the aggregate gross unrealized appreciation and depreciation of investments for federal income tax purposes were substantially as follows:
| | | | |
Gross unrealized appreciation | | $ | 3,443,943 | |
Gross unrealized depreciation | | | (497,076 | ) |
|
|
Net unrealized appreciation | | $ | 2,946,867 | |
|
|
At June 30, 2006, the Fund had the following open futures contracts:
| | | | | | | | | | | | | | |
| | | | | |
| Contracts to Buy | | Number of
Contracts | | Expiration
Date | | Basis Value | | Market
Value | | Unrealized
Loss | |
Euro Dollar | | 5 | | 12/06 | | $ | 1,183,275 | | $ | 1,180,062 | | $ | (3,213 | ) |
U.S. Treasury 10 Year Notes | | 1 | | 9/06 | | | 105,896 | | | 104,860 | | | (1,036 | ) |
|
|
Net Unrealized Loss on Open Futures Contracts | | | | | | | | $ | (4,249 | ) |
|
|
During the six months ended June 30, 2006, the written options for the Fund were as follows:
| | | | | |
| | |
| | | Number of
Contracts | | Premiums
Received |
Options written, outstanding December 31, 2005 | | — | | $ | — |
Options written | | 4 | | | 1,449 |
|
Options written, outstanding June 30, 2006 | | 4 | | $ | 1,449 |
|
22 Legg Mason Partners Real Return Strategy Fund 2006 Semi-Annual Report
Notes to Financial Statements (unaudited) (continued)
| 4. | Class Specific Expenses |
The Fund has adopted a Rule 12b-1distribution plan and under that plan, the Fund pays a service fee with respect to its Class A, B and C shares calculated at the annual rate of 0.25% of the average daily net assets of each respective class. The Fund also pays a distribution fee with respect to its Class B and C shares calculated at the annual rate of 0.75% of the average daily net assets of each class, respectively. These fees are accrued daily and paid monthly.
For the six months ended June 30, 2006, class specific expenses were as follows:
| | | | | | | | | |
| | | |
| | | Distribution
Fees | | Transfer
Agent Fees | | Shareholder
Reports Expenses |
Class A | | $ | 20,043 | | $ | 4,856 | | $ | 16,580 |
Class B | | | 24,815 | | | 5,932 | | | 20,582 |
Class C | | | 15,138 | | | 2,674 | | | 9,469 |
|
Total | | $ | 59,996 | | $ | 13,462 | | $ | 46,631 |
|
| 5. | Distributions to Shareholders by Class |
| | | | | | | | | |
| | | |
| | | Six Months Ended
June 30, 2006 | | Period Ended
December 31, 2005(1) | | Period Ended
September 30, 2005(2) |
Net Investment Income: | | | | | | | | | |
Class A | | $ | 144,875 | | $ | 127,635 | | $ | 246,666 |
Class B | | | 27,105 | | | 30,087 | | | 33,191 |
Class C | | | 17,003 | | | 18,266 | | | 22,754 |
|
Total | | $ | 188,983 | | $ | 175,988 | | $ | 302,611 |
|
Net Realized Gains: | | | | | | | | | |
Class A | | $ | 109,013 | | $ | 134,033 | | $ | — |
Class B | | | 34,693 | | | 37,242 | | | — |
Class C | | | 22,301 | | | 22,207 | | | — |
|
Total | | $ | 166,007 | | $ | 193,482 | | $ | — |
|
| (1) | | For the period October 1, 2005 to December 31, 2005. |
| (2) | | For the period November 12, 2004 (commencement of operations) to September 30, 2005 for Class A, and November 15, 2004 (commencement of operations) to September 30, 2005 for Classes B and C. |
At June 30, 2006, the Company had 10 billion shares of capital stock authorized with a par value of $0.001 per share. The Fund has the ability to issue multiple classes of shares. Each share of a class represents an identical interest in the Fund and has the same rights, except that each class bears certain direct expenses, including those specifically related to the distribution of its shares.
Legg Mason Partners Real Return Strategy Fund 2006 Semi-Annual Report 23
Notes to Financial Statements (unaudited) (continued)
Transactions in shares of each class were as follows:
| | | | | | | | | | | | | | | | | | | | | |
| | | |
| | | Six Months Ended
June 30, 2006
| | | Period Ended
December 31, 2005(1)
| | | Period Ended
September 30,
2005(2)
| |
| | | Shares | | | Amount | | | Shares | | | Amount | | | Shares | | | Amount | |
Class A | | | | | | | | | | | | | | | | | | | | | |
Shares sold | | 118,600 | | | $ | 1,657,966 | | | 33,012 | | | $ | 423,430 | | | 1,208,373 | | | $ | 13,876,263 | |
Shares issued on reinvestment | | 17,819 | | | | 247,185 | | | 19,421 | | | | 253,155 | | | 18,553 | | | | 230,077 | |
Shares repurchased | | (65,803 | ) | | | (917,777 | ) | | (48,655 | ) | | | (617,440 | ) | | (99,363 | ) | | | (1,156,258 | ) |
|
|
Net Increase | | 70,616 | | | $ | 987,374 | | | 3,778 | | | $ | 59,145 | | | 1,127,563 | | | $ | 12,950,082 | |
|
|
Class B | | | | | | | | | | | | | | | | | | | | | |
Shares sold | | 89,281 | | | $ | 1,246,195 | | | 42,777 | | | $ | 551,181 | | | 362,405 | | | $ | 4,292,205 | |
Shares issued on reinvestment | | 3,923 | | | | 54,061 | | | 4,486 | | | | 58,473 | | | 2,195 | | | | 27,781 | |
Shares repurchased | | (35,096 | ) | | | (490,674 | ) | | (24,553 | ) | | | (311,196 | ) | | (59,661 | ) | | | (686,428 | ) |
|
|
Net Increase | | 58,108 | | | $ | 809,582 | | | 22,710 | | | $ | 298,458 | | | 304,939 | | | $ | 3,633,558 | |
|
|
Class C | | | | | | | | | | | | | | | | | | | | | |
Shares sold | | 70,132 | | | $ | 980,288 | | | 22,229 | | | $ | 284,974 | | | 181,784 | | | $ | 2,110,650 | |
Shares issued on reinvestment | | 2,650 | | | | 36,509 | | | 2,892 | | | | 37,681 | | | 1,651 | | | | 20,680 | |
Shares repurchased | | (23,771 | ) | | | (339,334 | ) | | (3,793 | ) | | | (49,182 | ) | | (5,598 | ) | | | (66,747 | ) |
|
|
Net Increase | | 49,011 | | | $ | 677,463 | | | 21,328 | | | $ | 273,473 | | | 177,837 | | | $ | 2,064,583 | |
|
|
| (1) | | For the period October 1, 2005 to December 31, 2005. |
| (2) | | For the period November 12, 2004 (commencement of operations) to September 30, 2005 for Class A, and November 15, 2004 (commencement of operations) to September 30, 2005 for Classes B and C. |
On May 31, 2005, the U.S. Securities and Exchange Commission (“SEC”) issued an order in connection with the settlement of an administrative proceeding against SBFM and CGM relating to the appointment of an affiliated transfer agent for the Smith Barney family of mutual funds (the “Funds”).
The SEC order finds that SBFM and CGM willfully violated Section 206(1) of the Investment Advisers Act of 1940 (“Advisers Act”). Specifically, the order finds that SBFM and CGM knowingly or recklessly failed to disclose to the boards of the Funds in 1999 when proposing a new transfer agent arrangement with an affiliated transfer agent that: First Data Investors Services Group (“First Data”), the Funds’ then-existing transfer agent, had offered to continue as transfer agent and do the same work for substantially less money than before; and that Citigroup Asset Management (“CAM”), the Citigroup business unit that, at the time, included the Fund’s investment manager and other investment advisory companies, had entered into a side letter with First Data under which CAM agreed to recommend the appointment of First Data as sub-transfer agent to the affiliated transfer agent in exchange for, among other things, a guarantee by First Data of specified amounts of asset management and investment banking fees to CAM and CGM. The order also finds that SBFM and CGM willfully violated Section 206(2) of the Advisers Act by virtue of the omissions discussed above and other misrepresentations and omissions in the materials provided to the Funds’ boards, including the failure to make clear that the affiliated transfer agent would earn a high profit for performing limited functions while First Data continued
24 Legg Mason Partners Real Return Strategy Fund 2006 Semi-Annual Report
Notes to Financial Statements (unaudited) (continued)
to perform almost all of the transfer agent functions, and the suggestion that the proposed arrangement was in the Funds’ best interests and that no viable alternatives existed. SBFM and CGM do not admit or deny any wrongdoing or liability. The settlement does not establish wrongdoing or liability for purposes of any other proceeding.
The SEC censured SBFM and CGM and ordered them to cease and desist from violations of Sections 206(1) and 206(2) of the Advisers Act. The order requires Citigroup to pay $208.1 million, including $109 million in disgorgement of profits, $19.1 million in interest, and a civil money penalty of $80 million. Approximately $24.4 million has already been paid to the Funds, primarily through fee waivers. The remaining $183.7 million, including the penalty, has been paid to the U.S. Treasury and will be distributed pursuant to a plan submitted for the approval of the SEC. At this time, there is no certainty as to how the above-described proceeds of the settlement will be distributed, to whom such distributions will be made, the methodology by which such distributions will be allocated, and when such distributions will be made. The order also required that transfer agency fees received from the Funds since December 1, 2004, less certain expenses, be placed in escrow and provided that a portion of such fees might be subsequently distributed in accordance with the terms of the order. On April 3, 2006, an aggregate amount of approximately $9 million was distributed to the affected Funds.
The order required SBFM to recommend a new transfer agent contract to the Fund boards within 180 days of the entry of the order; if a Citigroup affiliate submitted a proposal to serve as transfer agent or sub-transfer agent, SBFM and CGM would have been required, at their expense, to engage an independent monitor to oversee a competitive bidding process. On November 21, 2005, and within the specified timeframe, the Fund’s Board selected a new transfer agent for the Fund. No Citigroup affiliate submitted a proposal to serve as transfer agent. Under the order, SBFM also must comply with an amended version of a vendor policy that Citigroup instituted in August 2004.
Although there can be no assurance, SBFM does not believe that this matter will have a material adverse effect on the Funds.
On December 1, 2005, Citigroup completed the sale of substantially all of its global asset management business, including SBFM, to Legg Mason.
Beginning in August 2005, five class action lawsuits alleging violations of federal securities laws and state law were filed against CGM and SBFM (collectively, the “Defendants”) based on the May 31, 2005 settlement order issued against the Defendants by the SEC described in Note 7. The complaints seek injunctive relief and compensatory and punitive damages, removal of SBFM as the investment manager for the Smith Barney family of funds, rescission of the Funds’ management and other contracts with SBFM, recovery of all fees paid to SBFM pursuant to such contracts, and an award of attorneys’ fees and litigation expenses.
On October 5, 2005, a motion to consolidate the five actions and any subsequently filed, related action was filed. That motion contemplates that a consolidated amended complaint alleging substantially similar causes of action will be filed in the future.
Legg Mason Partners Real Return Strategy Fund 2006 Semi-Annual Report 25
Notes to Financial Statements (unaudited) (continued)
As of the date of this report, SBFM believes that resolution of the pending lawsuit will not have a material effect on the financial position or results of operations of the Funds or the ability of SBFM and its affiliates to continue to render services to the Funds under their respective contracts.
* * *
Beginning in June 2004, class action lawsuits alleging violations of the federal securities laws were filed against CGM and a number of its then affiliates, including SBFM and Salomon Brothers Asset Management (“SBAM”), which were then investment adviser or manager to certain of the Funds (the “Managers”), substantially all of the mutual funds then managed by the Managers (the “Defendant Funds”), and Board Members of the Defendant Funds (collectively, the “Defendants”). The complaints alleged, among other things, that CGM created various undisclosed incentives for its brokers to sell Smith Barney and Salomon Brothers funds. In addition, according to the complaints, the Managers caused the Defendant Funds to pay excessive brokerage commissions to CGM for steering clients towards proprietary funds. The complaints also alleged that the defendants breached their fiduciary duty to the Defendant Funds by improperly charging Rule 12b-1 fees and by drawing on fund assets to make undisclosed payments of soft dollars and excessive brokerage commissions. The complaints also alleged that the Defendant Funds failed to adequately disclose certain of the allegedly wrongful conduct. The complaints sought injunctive relief and compensatory and punitive damages, rescission of the Defendant Funds’ contracts with the Managers, recovery of all fees paid to the Managers pursuant to such contracts and an award of attorneys’ fees and litigation expenses.
On December 15, 2004, a consolidated amended complaint (the “Complaint”) was filed alleging substantially similar causes of action. On May 27, 2005, all of the Defendants filed motions to dismiss the Complaint. On July 26, 2006, the court issued a decision and order (1) finding that plaintiffs lacked standing to sue on behalf of the shareholders of the Funds in which none of the plaintiffs had invested (including Legg Mason Partners Real Return Strategy Fund) and dismissing those Funds from the case (although stating that they could be brought back into the case if standing as to them could be established), and (2) other than one stayed claim, dismissing all of the causes of action against the remaining Defendants, with prejudice, except for the cause of action under Section 36(b) of the Investment Company Act, which the court granted plaintiffs leave to repeal as a derivative claim.
On September 16, 2005, the staff of the SEC informed SBFM and SBAM that the staff is considering recommending that the SEC institute administrative proceedings against SBFM and SBAM for alleged violations of Section 19(a) and 34(b) of the Investment Company Act (and related Rule 19a-1). The notification is a result of an industry wide inspection by the SEC and is based upon alleged deficiencies in disclosures regarding dividends and distributions paid to shareholders of certain funds. Section 19(a) and related Rule 19a-1 of the Investment Company Act generally require funds that are making dividend and distribution payments to provide shareholders with a written statement disclosing
26 Legg Mason Partners Real Return Strategy Fund 2006 Semi-Annual Report
Notes to Financial Statements (unaudited) (continued)
the source of the dividends and distributions, and, in particular, the portion of the payments made from each of net investment income, undistributed net profits and/or paid-in capital. In connection with the contemplated proceedings, the staff may seek a cease and desist order and/or monetary damages from SBFM or SBAM.
Although there can be no assurance, SBFM believes that this matter is not likely to have a material adverse effect on the Fund.
The Fund’s Board has approved the appointment of Legg Mason Partners Fund Advisor, LLC (“LMPFA”) as the Fund’s investment manager effective August 1, 2006. The Fund’s Board has also approved the appointment of CAM North America, LLC (“CAM N.A.”) Batterymarch Financial Management, Inc. (“Batterymarch”) and Western Asset Management Company (“Western Asset”) as the Fund’s subadvisers effective August 1, 2006. The portfolio managers who are responsible for the day-to-day management of the Fund remain the same immediately prior to and immediately after the date of these changes. LMPFA, CAM N.A., Batterymarch and Western Asset are wholly-owned subsidiaries of Legg Mason.
LMPFA will provide administrative and certain oversight services to the Fund. LMPFA will delegate to the subadvisers the day-to-day portfolio management of the Fund. The Fund’s investment management fee will remain unchanged. For its services, LMPFA will pay the subadvisers 70% of the net management fee that it receives from the Fund. This fee will be divided between the subadvisers, on a pro rata basis, based on the assets allocated to each subadviser, from time to time.
The Fund’s Board has also approved the termination and liquidation of the Fund. The Board intends to seek approval of the termination and liquidation from shareholders at a meeting expected to be held during the fourth quarter of 2006. The termination will occur as soon as reasonably practicable once the requisite shareholder approval has been obtained. Until such approval is received, the Fund’s assets will continue to be invested in accordance with the Fund’s investment objective. In the interim, however, the Board has voted to close the Fund to new purchases and exchange purchases, on close of business June 30, 2006, except that dividend reinvestment and Class B to Class A conversions will continue until the Fund is terminated.
The Fund’s Board has also approved certain share class modifications which, among other things, will standardize share class features for all funds in the fund complex. The features standardized include such things as sales loads, distribution charges and other costs. These modifications are expected to be implemented during the fourth quarter of 2006.
The Fund’s Board has also approved a number of other initiatives designed to streamline and restructure the fund complex, and has authorized seeking shareholder approval for those initiatives where shareholder approval is required. As a result, Fund shareholders will be asked to elect a new Board, approve matters that will result in the Fund being grouped for organizational and governance purposes with other funds in the fund complex, and domicile the Fund as a Maryland business trust, with all funds operating under uniform charter documents. Fund shareholders also will be asked to approve investment matters, including standardized fundamental investment policies.
Legg Mason Partners Real Return Strategy Fund 2006 Semi-Annual Report 27
Notes to Financial Statements (unaudited) (continued)
Proxy materials describing these matters are expected to be sent to shareholders later in 2006. If shareholder approval is obtained, these matters generally are expected to be implemented during the first quarter of 2007.
11. Recent Accounting Pronouncement
During June 2006, the Financial Accounting Standards Board (“FASB”) issued FASB Interpretation 48 (“FIN 48” or the “Interpretation”), Accounting for Uncertainty in Income Taxes—an interpretation of FASB statement 109. FIN 48 supplements FASB Statement 109 by defining the confidence level that a tax position must meet in order to be recognized in the financial statements. FIN 48 prescribes a comprehensive model for how a fund should recognize, measure, present, and disclose in its financial statements uncertain tax positions that the fund has taken or expects to take on a tax return. FIN 48 requires that the tax effects of a position be recognized only if it is “more likely than not” to be sustained based solely on its technical merits. Management must be able to conclude that the tax law, regulations, case law, and other objective information regarding the technical merits sufficiently support the position’s sustainability with a likelihood of more than 50 percent. FIN 48 is effective for fiscal periods beginning after December 15, 2006, which for this Fund will be January 1, 2007. At adoption, the financial statements must be adjusted to reflect only those tax positions that are more likely than not to be sustained as of the adoption date. Management of the Fund is currently evaluating the impact that FIN 48 will have on the financial statements.
28 Legg Mason Partners Real Return Strategy Fund 2006 Semi-Annual Report
Board Approval of Management and Subadvisory Agreements (unaudited)
At a meeting held in person on June 29, 2006, the Fund’s Board, including a majority of the Board Members who are not “interested persons” of the Fund or Legg Mason Partners Fund Advisor, LLC (the “Manager”) or any sub-investment adviser or proposed sub-investment adviser as defined in the Investment Company Act of 1940, as amended (the “1940 Act”) (the “Independent Board Members”), approved a new management agreement (the “New Management Agreement”) between the Fund and the Manager. The Fund’s Board, including a majority of the Independent Board Members, also approved one or more new subadvisory agreements between the Manager and CAM N.A., Batterymarch and Western Asset (each a “Subadviser”) (each a “New Subadvisory Agreement”). The New Management Agreement and the New Subadvisory Agreements replaced the Fund’s prior management agreement with pre-8/1/06 manager and the prior subadvisory agreements with the Subadvisers and were entered into in connection with an internal reorganization of the Manager’s, the prior manager’s and the Subadvisers’ parent organization, Legg Mason. In approving the New Management Agreement and New Subadvisory Agreements, the Board, including the Independent Board Members, considered the factors discussed below, among other things.
The Board noted that the Manager will provide administrative and certain oversight services to the Fund, and that the Manager will delegate to each of the Subadvisers the day-to-day portfolio management of the Fund. The Board Members reviewed the qualifications, backgrounds and responsibilities of the senior personnel that will provide oversight and general management services and the portfolio management team that would be primarily responsible for the day-to-day management of the Fund. The Board Members noted that the portfolio management team was expected to be the same as then managing the Fund.
The Board Members received and considered information regarding the nature, extent and quality of services expected to be provided to the Fund by the Manager under the New Management Agreement and by the Subadvisers under the New Subadvisory Agreements. The Board Members’ evaluation of the services expected to be provided by the Manager and the Subadvisers took into account the Board Members’ knowledge and familiarity gained as Fund Board Members, including as to the scope and quality of Legg Mason’s investment management and other capabilities and the quality of its administrative and other services. The Board Members considered, among other things, information and assurances provided by Legg Mason as to the operations, facilities and organization of the Manager and the Subadvisers and the qualifications, backgrounds and responsibilities of their senior personnel. The Board Members further considered the financial resources available to the Manager, the Subadvisers and Legg Mason. The Board Members concluded that, overall, the nature, extent and quality of services expected to be provided under the New Management Agreement and the New Subadvisory Agreements were acceptable.
The Board Members also received and considered performance information for the Fund as well as comparative information with respect to a peer group of funds (the “Performance Universe”) selected by Lipper, Inc. (“Lipper”), an independent provider of
Legg Mason Partners Real Return Strategy Fund 29
Board Approval of Management and Subadvisory Agreements (unaudited) (continued)
investment company data. The Board Members were provided with a description of the methodology Lipper used to determine the similarity of the Fund to the funds included in the Performance Universe. The Board Members noted that they had received and discussed with management, at periodic intervals, information comparing the Fund’s performance against, among other things, its benchmarks. Based on the Board Members’ review, which included careful consideration of the factors noted above, the Board Members concluded that the performance of the Fund, under the circumstances, supported approval of the New Management Agreement and New Subadvisory Agreements.
The Board Members reviewed and considered the management fee that would be payable by the Fund to the Manager in light of the nature, extent and quality of the management services expected to be provided by the Manager, including the fee waiver and/or expense reimbursement arrangements currently in place. Additionally, the Board Members received and considered information comparing the Fund’s management fee and overall expenses with those of comparable funds in both the relevant expense group and a broader group of funds, each selected and provided by Lipper. The Board Members also reviewed and considered the subadvisory fee that would be payable by the Manager to the Subadvisers in light of the nature, extent and quality of the management services expected to be provided by the Subadvisers. The Board Members noted that the Manager, and not the Fund, will pay the subadvisory fee to each Subadviser. The Board Members determined that the Fund’s management fee and the Fund’s subadvisory fees were reasonable in light of the nature, extent and quality of the services expected to be provided to the Fund under the New Management Agreement and the New Subadvisory Agreements.
The Board Members received and considered a pro-forma profitability analysis of Legg Mason and its affiliates in providing services to the Fund, including information with respect to the allocation methodologies used in preparing the profitability data. The Board Members recognized that Legg Mason may realize economies of scale based on its internal reorganization and synergies of operations. The Board Members noted that it was not possible to predict with a high degree of confidence how Legg Mason’s and its affiliates’ profitability would be affected by its internal reorganization and by other factors including potential economies of scale, but that based on their review of the pro forma profitability analysis, their most recent prior review of the profitability of the predecessor manager and its affiliates from their relationship with the Fund and other factors considered, they determined that the management fee was reasonable. The Board Members noted that they expect to receive profitability information on an annual basis.
In their deliberations, the Board Members also considered, and placed significant importance on, information that had been received and conclusions that had been reached by the Board in connection with the Board’s most recent approval of the Fund’s prior management agreement and the prior subadvisory agreements, in addition to information provided in connection with the Board’s evaluation of the terms and conditions of the New Management Agreement and the New Subadvisory Agreements.
The Board Members considered Legg Mason’s advice and the advice of its counsel that the New Management Agreement and the New Subadvisory Agreements were being
30 Legg Mason Partners Real Return Strategy Fund
Board Approval of Management and Subadvisory Agreements (unaudited) (continued)
entered into in connection with an internal reorganization within Legg Mason, that did not involve an actual change of control or management. The Board Members further noted that the terms and conditions of the New Management Agreement are substantially identical to those of the Fund’s previous management agreement except for the identity of the Manager, and that the initial term of the New Management Agreement (after which it will continue in effect only if such continuance is specifically approved at least annually by the Board, including a majority of the Independent Board Members) was the same as that under the prior management agreement. They noted, in addition, that the terms and conditions of the New Subadvisory Agreements are likewise unchanged from those of the prior subadvisory agreements.
In light of all of the foregoing, the Board, including the Independent Board Members, approved the New Management Agreement and the New Subadvisory Agreements. No single factor reviewed by the Board Members was identified as the principal factor in determining whether to approve the New Management Agreement and the New Subadvisory Agreements. The Independent Board Members were advised by separate independent legal counsel throughout the process. The Independent Board Members also discussed the proposed approval of the New Management Agreement and the New Subadvisory Agreements in private sessions with their independent legal counsel at which no representatives of the Manager or Subadvisers were present.
Legg Mason Partners Real Return Strategy Fund 31
Legg Mason Partners Real Return Strategy Fund
| | |
DIRECTORS Paul R. Ades Dwight B. Crane R. Jay Gerken, CFA
Chairman Frank G. Hubbard Jerome H. Miller Ken Miller INVESTMENT MANAGER Legg Mason Partners Fund Advisor, LLC SUBADVISERS Batterymarch Financial Management, Inc. CAM North America, LLC Western Asset Management Company | | DISTRIBUTORS Citigroup Global Markets Inc. Legg Mason Investor
Services, LLC CUSTODIAN State Street Bank and Trust Company TRANSFER AGENT PFPC Inc.
4400 Computer Drive
Westborough, Massachusetts
01581 INDEPENDENT REGISTERED PUBLIC ACCOUNTING FIRM KPMG LLP 345 Park Avenue New York, New York 10154 |
This report is submitted for the general information of shareholders Legg Mason Partners Real Return Strategy Fund, but it may also be used as sales literature when preceded or accompanied by the current Prospectus.
This report must be preceded or accompanied by a free prospectus. Investors should consider the Fund’s Investment objectives, risks, charges and expenses carefully before investing. The prospectus contains this and other important information about the Fund. Please read the prospectus carefully before investing.
www.leggmason.com/InvestorServices
©2006 Legg Mason Investor Services, LLC
Member NASD, SIPC
Legg Mason Partners Real Return Strategy Fund
The Fund is a separate series of Legg Mason Partners Investment Funds Inc., a Maryland corporation.
LEGG MASON PARTNERS REAL RETURN STRATEGY FUND
Legg Mason Partners Funds
125 Broad Street
10th Floor, MF-2
New York, New York 10004
The Fund files its complete schedule of portfolio holdings with the Securities and Exchange Commission for the first and third quarters of each fiscal year on Form N-Q. The Fund’s Forms N-Q are available on the Commission’s website at www.sec.gov. The Fund’s Forms N-Q may be reviewed and copied at the Commission’s Public Reference Room in Washington D.C., and information on the operation of the Public Reference Room may be obtained by calling 1-800-SEC-0330. To obtain information on Form N-Q from the Fund, shareholders can call 1-800-451-2010.
Information on how the Fund voted proxies relating to portfolio securities during the prior 12-month period ended June 30th of each year, and a description of the policies and procedures that the Fund uses to determine how to vote proxies relating to portfolio securities is available (1) without charge, upon request, by calling 1-800-451-2010, (2) on the Fund’s website at www.leggmason.com/InvestorServices and (3) on the SEC’s website at www.sec.gov. Proxy voting reports for the period ended June 30, 2005 will continue to be listed under the Fund’s former Smith Barney Investment Funds Inc. — Smith Barney Real Return Strategy Fund name.
ITEM 2. CODE OF ETHICS.
Not Applicable.
ITEM 3. AUDIT COMMITTEE FINANCIAL EXPERT.
Not Applicable.
ITEM 4. PRINCIPAL ACCOUNTANT FEES AND SERVICES.
Not applicable.
ITEM 5. AUDIT COMMITTEE OF LISTED REGISTRANTS.
Not applicable.
ITEM 6. SCHEDULE OF INVESTMENTS.
Included herein under Item 1.
ITEM 7. DISCLOSURE OF PROXY VOTING POLICIES AND PROCEDURES FOR CLOSED-END MANAGEMENT INVESTMENT COMPANIES.
Not applicable.
ITEM 8. PORTFOLIO MANAGERS OF CLOSED-END MANAGEMENT INVESTMENT COMPANIES.
Not applicable.
ITEM 9. PURCHASES OF EQUITY SECURITIES BY CLOSED-END MANAGEMENT INVESTMENT COMPANY AND AFFILIATED PURCHASERS.
Not applicable.
ITEM 10. SUBMISSION OF MATTERS TO A VOTE OF SECURITY HOLDERS.
Not applicable.
ITEM 11. CONTROLS AND PROCEDURES.
| | (a) | The registrant’s principal executive officer and principal financial officer have concluded that the registrant’s disclosure controls and procedures (as defined in Rule 30a- 3(c) under the Investment Company Act of 1940, as amended (the “1940 Act”)) are effective as of a date within 90 days of the filing date of this report that includes the disclosure required by this paragraph, based on their evaluation of the disclosure controls and procedures required by Rule 30a-3(b) under the 1940 Act and 15d-15(b) under the Securities Exchange Act of 1934. |
| | (b) | There were no changes in the registrant’s internal control over financial reporting (as defined in Rule 30a-3(d) under the 1940 Act) that occurred during the registrant’s last fiscal half-year (the registrant’s second fiscal half-year in the case of an annual report) that have materially affected, or are likely to materially affect the registrant’s internal control over financial reporting. |
| | |
| Exhibit 99.CERT | | Certifications pursuant to section 302 of the Sarbanes-Oxley Act of 2002 |
| |
| Exhibit 99.906CERT | | Certifications pursuant to Section 906 of the Sarbanes-Oxley Act of 2002 |
SIGNATURES
Pursuant to the requirements of the Securities Exchange Act of 1934 and the Investment Company Act of 1940, the registrant has duly caused this Report to be signed on its behalf by the undersigned, there unto duly authorized.
Legg Mason Partners Investment Funds, Inc.
| | |
| By: | | /s/ R. Jay Gerken
|
| | | (R. Jay Gerken) |
| | | Chief Executive Officer of |
| | | Legg Mason Partners Investment Funds, Inc. |
|
| Date: September 7, 2006 |
Pursuant to the requirements of the Securities Exchange Act of 1934 and the Investment Company Act of 1940, this report has been signed below by the following persons on behalf of the registrant and in the capacities and on the dates indicated.
| | |
| By: | | /s/ R. Jay Gerken
|
| | | (R. Jay Gerken) |
| | | Chief Executive Officer of |
| | | Legg Mason Partners Investment Funds, Inc. |
|
| Date: September 7, 2006 |
| | |
| By: | | /s/ Kaprel Ozsolak
|
| | | (Kaprel Ozsolak) |
| | | Chief Financial Officer of |
| | | Legg Mason Partners Investment Funds, Inc. |
|
| Date: September 7, 2006 |