UNITED STATES
SECURITIES AND EXCHANGE COMMISSION
Washington, D.C. 20549
FORM N-CSR
CERTIFIED SHAREHOLDER REPORT OF REGISTERED
MANAGEMENT INVESTMENT COMPANIES
Investment Company Act file number 811-3275
Legg Mason Partners Investment Funds, Inc.
(Exact name of registrant as specified in charter)
| | |
| 125 Broad Street, New York, NY | | 10004 |
|
| (Address of principal executive offices) | | (Zip code) |
Robert I. Frenkel, Esq.
Legg Mason & Co., LLC
300 First Stamford Place, 4th Floor
Stamford, CT 06902
(Name and address of agent for service)
Registrant’s telephone number, including area code: (800) 451-2010
Date of fiscal year end: December 31
Date of reporting period: June 30, 2006
ITEM 1. REPORT TO STOCKHOLDERS.
The Semi-Annual Report to Stockholders is filed herewith.
SEMI-ANNUAL
REPORT
JUNE 30, 2006

Legg Mason Partners
Government Securities Fund
INVESTMENT PRODUCTS: NOT FDIC INSURED • NO BANK GUARANTEE • MAY LOSE VALUE
Legg Mason Partners Government Securities Fund
Semi-Annual Report • June 30, 2006
What’s
Inside
Fund Objective:
The Fund seeks high current return.
“Smith Barney”, “Salomon Brothers” and “Citi” are service marks of Citigroup, licensed for use by Legg Mason as the names of funds and investment managers. Legg Mason and its affiliates, as well as the Fund’s investment manager, are not affiliated with Citigroup.
Letter from the Chairman

R. JAY GERKEN, CFA
Chairman, President and Chief Executive Officer
Dear Shareholder,
The U.S. economy appeared to be on solid footing during the six-month reporting period. After gross domestic product (“GDP”)i rose 1.7% in the fourth quarter of 2005—the first quarter in which GDP growth did not surpass 3.0% in nearly three years—the economy rebounded sharply in the first quarter of 2006. During this time, GDP rose 5.6%, its best showing since the third quarter of 2003. Both strong consumer and business spending prompted the economic turnaround. In the second quarter of 2006, GDP growth was a more modest 2.5%, according to the Commerce Department’s initial reading for the period. The decline was largely attributed to lower consumer spending, triggered by higher interest rates and oil prices, as well as a cooling housing market. In addition, business spending fell during the quarter.
The Federal Reserve Board (“Fed”)ii continued to raise interest rates during the reporting period. Despite the “changing of the guard” from Fed Chairman Alan Greenspan to Ben Bernanke in early 2006, it was “business as usual” for the Fed, as it raised short-term interest rates four times during the period. Since it began its tightening campaign in June 2004, the Fed has increased rates 17 consecutive times, bringing the federal funds rateiii from 1.00% to 5.25%. Coinciding with its latest rate hike in June 2006, the Fed said: “The extent and timing of any additional firming…will depend on the evolution of the outlook for both inflation and economic growth, as implied by incoming information.”
Both short- and long-term yields rose over the reporting period, causing the overall bond market to decline. During the six months ended June 30, 2006, two-year Treasury yields increased from 4.41% to 5.16%. Over the same period, 10-year Treasury yields moved from 4.39% to 5.15%. Short-term rates rose in concert with the Fed’s repeated rate hikes,
Legg Mason Partners Government Securities Fund I
while long-term rates rose on fears of mounting inflationary pressures. Looking at the six-month period as a whole, the overall bond market, as measured by the Lehman Brothers U.S. Aggregate Index,iv returned -0.72%.
Performance Review
For the six months ended June 30, 2006, Class A shares of the Legg Mason Partners Government Securities Fund, excluding sales charges, returned -1.25%. These shares outperformed the Lipper General U.S. Government Funds Category Average,1 which decreased 1.61%. The Fund’s unmanaged benchmarks, the Citigroup Treasury/Mortgage Indexv and the Lehman Brothers Government Bond Indexvi returned -0.61% and -0.89%, respectively, for the same period.
| | |
| Performance Snapshot as of June 30, 2006 (excluding sales charges) (unaudited) |
| |
| | | 6 Months |
| | | |
Government Securities Fund — Class A Shares | | -1.25% |
|
Citigroup Treasury/Mortgage Index | | -0.61% |
|
Lehman Brothers Government Bond Index | | -0.89% |
|
Lipper General U.S. Government Funds Category Average | | -1.61% |
|
| The performance shown represents past performance. Past performance is no guarantee of future results and current performance may be higher or lower than the performance shown above. Principal value and investment returns will fluctuate and investors’ shares, when redeemed, may be worth more or less than their original cost. To obtain performance data current to the most recent month-end, please visit our website at www.leggmason.com/InvestorServices. |
| Excluding sales charges, Class 1 shares returned -1.16%, Class B shares returned -1.55%, Class C shares returned -1.41% and Class Y shares returned -1.05% over the six months ended June 30, 2006. All share class returns assume the reinvestment of all distributions, including returns of capital, if any, at net asset value and the deduction of all Fund expenses. Returns have not been adjusted to include sales charges that may apply when shares are purchased or the deduction of taxes that a shareholder would pay on Fund distributions. |
| Performance figures reflect reimbursements and/or fee waivers, without which the performance would have been lower. |
Special Shareholder Notices
As part of the continuing effort to integrate investment products managed by the advisers acquired with Citigroup’s asset management business, Legg Mason, Inc. (“Legg Mason”) has
| 1 | | Lipper, Inc. is a major independent mutual-fund tracking organization. Returns are based on the six-month period ended June 30, 2006, including the reinvestment of all distributions, including returns of capital, if any, calculated among the 183 funds in the Fund’s Lipper category, and excluding sales charges. |
II Legg Mason Partners Government Securities Fund
recommended various Fund actions in order to streamline product offerings, standardize share class pricing features, eliminate redundancies and improve efficiencies within the organization. At Board meetings held during June and July 2006, the Fund’s Board reviewed and approved these recommendations, and provided authorization to move ahead with proxy solicitations for those matters needing shareholder approval.
The Fund’s Board has approved the appointment of Legg Mason Partners Fund Advisor, LLC (“LMPFA”) as the Fund’s investment manager effective August 1, 2006. The Fund’s Board has also approved the appointment of Western Asset Management Company (“Western Asset”) as the Fund’s sub-adviser effective August 1, 2006. The portfolio managers who are responsible for the day-to-day management of the Fund remain the same immediately prior to and immediately after the date of these changes. LMPFA and Western Asset are wholly-owned subsidiaries of Legg Mason.
During the reporting period, the Fund’s management was assumed by a team of seasoned investment professionals from Western Asset. The Fund’s portfolio managers include S. Kenneth Leech, Stephen A. Walsh, Mark Lindbloom, Carl L. Eichstaedt and Ronald D. Mass.
Effective September 1, 2006, the Fund’s benchmarks will change from the Lehman Brothers Government Bond Index and the Citigroup Treasury/Mortgage Index to the Lehman Brothers U.S. Fixed-Rate Mortgage Backed Securities (MBS) Index.vii
The Fund was formerly known as Smith Barney Government Securities Fund.
Information About Your Fund
As you may be aware, several issues in the mutual fund industry have come under the scrutiny of federal and state regulators. Affiliates of the Fund’s Manager have, in recent years, received requests for information from various government regulators regarding market timing, late trading, fees, and other mutual fund issues in connection with various investigations. The regulators appear to be examining, among other things, the Fund’s response to market timing
Legg Mason Partners Government Securities Fund III
and shareholder exchange activity, including compliance with prospectus disclosure related to these subjects. The Fund is not in a position to predict the outcome of these requests and investigations.
Important information with regard to recent regulatory developments that may affect the Fund is contained in the Notes to Financial Statements included in this report.
As always, thank you for your confidence in our stewardship of your assets. We look forward to helping you meet your financial goals.
Sincerely,

R. Jay Gerken, CFA
President, Chairman and Chief Executive Officer
July 28, 2006
The information provided is not intended to be a forecast of future events, a guarantee of future results or investment advice. Views expressed may differ from those of the firm as a whole.
RISKS: Keep in mind, fixed-income securities are subject to interest rate, credit and market risks. As interest rates rise, bond prices fall, reducing the value of the Fund’s share price. The U.S. government guarantee of principal and interest payments only applies to underlying securities in the Fund’s portfolio, not the Fund’s shares. Please note that the Fund’s shares are not guaranteed by the U.S. government or its agencies. The Fund may use derivatives, such as options and futures, which can be illiquid, may disproportionately increase losses, and have a potentially large impact on Fund performance. Please see the Fund’s prospectus for more information on these and other risks.
All index performance reflects no deduction for fees, expenses or taxes. Please note an investor cannot invest directly in an index.
| i | | Gross domestic product is a market value of goods and services produced by labor and property in a given country. |
| ii | | The Federal Reserve Board is responsible for the formulation of a policy designed to promote economic growth, full employment, stable prices, and a sustainable pattern of international trade and payments. |
| iii | | The federal funds rate is the interest rate that banks with excess reserves at a Federal Reserve district bank charge other banks that need overnight loans. |
| iv | | The Lehman Brothers U.S. Aggregate Index is a broad-based bond index comprised of government, corporate, mortgage and asset-backed issues, rated investment grade or higher, and having at least one year to maturity. |
| v | | The Citigroup Treasury/Mortgage Index is a component of the Citigroup U.S. Broad Investment Grade (“USBIG”) Bond Index. It includes institutionally-traded fixed rate U.S. Treasury securities and mortgages. Mortgages are comprised of 30- and 15-year GNMA, FNMA and FHLMC pass-throughs and FNMA and FHLMC balloon mortgages. |
| vi | | The Lehman Brothers Government Bond Index is a broad-based index of all public debt obligations of the U.S. government and its agencies that have an average maturity of roughly nine years. |
| vii | | The Lehman Brothers U.S. Fixed-Rate Mortgage-Backed Securities Index is composed of about 600 15-year to 30-year fixed-rate mortgage-backed pools of Government National Mortgage Association, Federal National Mortgage Association and Federal Home Loan Corporation. |
IV Legg Mason Partners Government Securities Fund
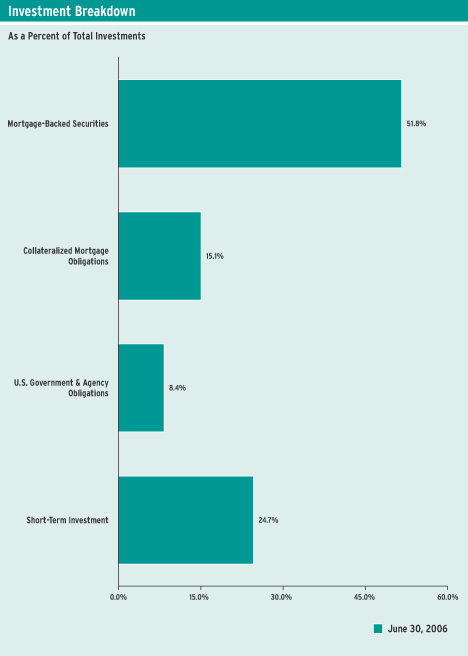
Fund at a Glance (unaudited)
Legg Mason Partners Government Securities Fund 2006 Semi-Annual Report 1
Fund Expenses (unaudited)
Example
As a shareholder of the Fund, you may incur two types of costs: (1) transaction costs, including front-end and back-end sales charges (loads) on purchase payments; and (2) ongoing costs, including management fees; distribution and/or service (12b-1) fees; and other Fund expenses. This example is intended to help you understand your ongoing costs (in dollars) of investing in the Fund and to compare these costs with the ongoing costs of investing in other mutual funds.
This example is based on an investment of $1,000 invested on January 1, 2006 and held for the six months ended June 30, 2006.
Actual Expenses
The table below titled “Based on Actual Total Return” provides information about actual account values and actual expenses. You may use the information provided in this table, together with the amount you invested, to estimate the expenses that you paid over the period. To estimate the expenses you paid on your account, divide your ending account value by $1,000 (for example, an $8,600 ending account value divided by $1,000 = 8.6), then multiply the result by the number under the heading entitled “Expenses Paid During the Period”.
| | | | | | | | | | | | | | | |
| Based on Actual Total Return(1) | | | | | | | | | | | | | |
| | | | | |
| | | Actual Total
Return Without
Sales Charges(2) | | | Beginning
Account
Value | | Ending
Account
Value | | Annualized
Expense
Ratio | | | Expenses
Paid During
the Period(3) |
Class 1 | | (1.16 | )% | | $ | 1,000.00 | | $ | 988.40 | | 0.80 | % | | $ | 3.94 |
|
Class A | | (1.25 | ) | | | 1,000.00 | | | 987.50 | | 0.97 | | | | 4.78 |
|
Class B | | (1.55 | ) | | | 1,000.00 | | | 984.50 | | 1.59 | | | | 7.82 |
|
Class C | | (1.41 | ) | | | 1,000.00 | | | 985.90 | | 1.31 | | | | 6.45 |
|
Class Y | | (1.05 | ) | | | 1,000.00 | | | 989.50 | | 0.57 | | | | 2.81 |
|
| (1) | | For the six months ended June 30, 2006. |
| (2) | | Assumes reinvestment of all distributions, including returns of capital, if any, at net asset value and does not reflect the deduction of the applicable sales charges with respect to Class 1 and A shares or the applicable contingent deferred sales charges (“CDSC”) with respect to Class B and C shares. Total return is not annualized, as it may not be representative of the total return for the year. Past performance is no guarantee of future results. |
| (3) | | Expenses (net of fee waivers and/or expense reimbursements) are equal to each class’ respective annualized expense ratio multiplied by the average account value over the period, multiplied by the number of days in the most recent fiscal half-year, then divided by 365. |
2 Legg Mason Partners Government Securities Fund 2006 Semi-Annual Report
Fund Expenses (unaudited) (continued)
Hypothetical Example for Comparison Purposes
The table below titled “Based on Hypothetical Total Return” provides information about hypothetical account values and hypothetical expenses based on the actual expense ratio and an assumed rate of return of 5.00% per year before expenses, which is not the Fund’s actual return. The hypothetical account values and expenses may not be used to estimate the actual ending account balance or expenses you paid for the period. You may use the information provided in this table to compare the ongoing costs of investing in the Fund and other funds. To do so, compare the 5.00% hypothetical example relating to the Fund with the 5.00% hypothetical examples that appear in the shareholder reports of the other funds.
Please note that the expenses shown in the table below are meant to highlight your ongoing costs only and do not reflect any transactional costs, such as front-end or back-end sales charges (loads). Therefore, the table is useful in comparing ongoing costs only, and will not help you determine the relative total costs of owning different funds. In addition, if these transaction costs were included, your costs would have been higher.
| | | | | | | | | | | | | | | |
| Based on Hypothetical Total Return(1) |
| | | | | |
| | | Hypothetical
Annualized
Total Return | | | Beginning
Account
Value | | Ending
Account
Value | | Annualized
Expense
Ratio | | | Expenses
Paid During
the Period(2) |
Class 1 | | 5.00 | % | | $ | 1,000.00 | | $ | 1,020.83 | | 0.80 | % | | $ | 4.01 |
|
Class A | | 5.00 | | | | 1,000.00 | | | 1,019.98 | | 0.97 | | | | 4.86 |
|
Class B | | 5.00 | | | | 1,000.00 | | | 1,016.91 | | 1.59 | | | | 7.95 |
|
Class C | | 5.00 | | | | 1,000.00 | | | 1,018.30 | | 1.31 | | | | 6.56 |
|
Class Y | | 5.00 | | | | 1,000.00 | | | 1,021.97 | | 0.57 | | | | 2.86 |
|
| (1) | | For the six months ended June 30, 2006. |
| (2) | | Expenses (net of fee waivers and/or expense reimbursements) are equal to each class’ respective annualized expense ratio multiplied by the average account value over the period, multiplied by the number of days in the most recent fiscal half-year, then divided by 365. |
Legg Mason Partners Government Securities Fund 2006 Semi-Annual Report 3
Schedule of Investments (June 30, 2006) (unaudited)
LEGG MASON PARTNERS GOVERNMENT SECURITIES FUND
| | | | | | | |
| | |
Face
Amount | | Security | | Value | |
| | | | | | | | |
| | MORTGAGE-BACKED SECURITIES — 72.5% | | | | |
| | Federal Home Loan Mortgage Corp. (FHLMC) — 12.0% | | | | |
| | | | FHLMC: | | | | |
| $ | 5,358,055 | | 6.730% due 4/1/32 (a) | | $ | 5,448,473 | |
| | 12,189,207 | | 4.566% due 4/1/34 (a) | | | 12,283,105 | |
| | | | Gold: | | | | |
| | 1,594,393 | | 6.500% due 1/1/16-6/1/31 | | | 1,614,025 | |
| | 13,026,266 | | 6.000% due 1/1/24-1/1/32 | | | 12,966,938 | |
| | 3,871,450 | | 7.000% due 6/1/32-7/1/32 | | | 3,967,388 | |
| | 9,768,614 | | 5.000% due 9/1/33 | | | 9,169,936 | |
| | 8,000,000 | | 5.000% due 7/13/36 (b)(c) | | | 7,472,496 | |
| | | | One Year LIBOR: | | | | |
| | 8,113,080 | | 5.124% due 11/1/34 (a) | | | 7,919,098 | |
| | 8,506,711 | | 4.967% due 2/1/35 (a) | | | 8,269,764 | |
|
|
|
| | | | TOTAL FHLMC | | | 69,111,223 | |
|
|
|
| | Federal National Mortgage Association (FNMA) — 51.6% | | | | |
| | | | FNMA: | | | | |
| | 26,231,330 | | 5.500% due 5/1/16-9/1/23 | | | 25,557,757 | |
| | 3,611,303 | | 5.000% due 2/1/18-9/1/18 (d) | | | 3,487,127 | |
| | 7,632,893 | | 6.000% due 11/1/22-7/1/32 | | | 7,599,061 | |
| | 27,555,700 | | 6.500% due 6/1/24-2/1/36 (d) | | | 27,716,801 | |
| | 2,504,795 | | 7.500% due 8/1/28-4/1/32 | | | 2,594,036 | |
| | 1,514,111 | | 7.000% due 8/1/29-5/1/32 | | | 1,551,887 | |
| | 3,062,572 | | 4.519% due 6/1/33 (a)(d) | | | 2,974,978 | |
| | 4,173,596 | | 6.000% due 8/1/34 (d) | | | 4,121,946 | |
| | 71,100,000 | | 5.000% due 7/13/36-8/14/36 (b)(c) | | | 66,474,750 | |
| | 65,000,000 | | 5.500% due 7/13/36-8/14/36 (b)(c) | | | 62,425,625 | |
| | 62,000,000 | | 6.000% due 7/13/36 (b)(c) | | | 61,031,250 | |
| | | | One Year LIBOR: | | | | |
| | 15,469,079 | | 4.961% due 5/1/35 (a)(d) | | | 15,124,598 | |
| | 17,714,148 | | 4.900% due 6/1/35 (a)(d) | | | 17,273,201 | |
|
|
|
| | | | TOTAL FNMA | | | 297,933,017 | |
|
|
|
| | Government National Mortgage Association (GNMA) — 8.9% | | | | |
| | | | GNMA: | | | | |
| | 2,517,288 | | 7.000% due 2/15/28-11/15/31 | | | 2,598,433 | |
| | 325,618 | | 7.500% due 4/15/29-9/15/31 | | | 340,516 | |
| | 1,058,847 | | 6.500% due 10/15/31-5/15/32 | | | 1,073,780 | |
| | 12,738,024 | | 5.000% due 8/15/33-9/15/33 | | | 12,071,537 | |
| | 6,000,000 | | 5.000% due 7/20/36 (b)(c) | | | 5,679,372 | |
| | 15,000,000 | | 5.500% due 7/20/36 (b)(c) | | | 14,540,625 | |
| | 15,000,000 | | 6.000% due 7/20/36 (b)(c) | | | 14,878,125 | |
|
|
|
| | | | TOTAL GNMA | | | 51,182,388 | |
|
|
|
| | | | TOTAL MORTGAGE-BACKED SECURITIES
(Cost — $428,954,991) | | | 418,226,628 | |
|
|
|
See Notes to Financial Statements.
4 Legg Mason Partners Government Securities Fund 2006 Semi-Annual Report
Schedule of Investments (June 30, 2006) (unaudited) (continued)
| | | | | | | |
| | |
Face
Amount | | Security | | Value | |
| | | | | | | | |
| | COLLATERALIZED MORTGAGE OBLIGATIONS — 21.0% | | | | |
| $ | 13,903,800 | | Adjustable Rate Mortgage Trust, Whole Loan, Series 2005-3, Class 7A1,
5.080% due 7/25/35 (a) | | $ | 13,636,803 | |
| | 6,292,173 | | Banc of America Funding Corp., Series 2005-H, Class 1A1,
5.097% due 11/20/35 (a) | | | 6,221,531 | |
| | 1,555,787 | | CS First Boston Mortgage Securities Corp., Whole Loan, Series 2002-10,
Class 2A1, 7.500% due 5/25/32 | | | 1,575,162 | |
| | 16,992,160 | | Federal Home Loan Mortgage Corp. (FHLMC), Series 2446, Class KL,
6.000% due 5/15/32 (d) | | | 16,868,680 | |
| | | | Federal National Mortgage Association (FNMA): | | | | |
| | 1,708,211 | | Series 2001-81, Class HE, 6.500% due 1/25/32 | | | 1,722,424 | |
| | 3,294,231 | | Series 2004-45, Class Z, 4.500% due 6/25/34 (d) | | | 2,465,162 | |
| | | | Whole Loan: | | | | |
| | 15,418,533 | | Series 2002-W10, Class A4, 5.700% due 8/25/42 (d) | | | 15,020,141 | |
| | | | Series 2003-W12: | | | | |
| | 11,118,919 | | Class 1A6, 4.500% due 6/25/43 (d) | | | 11,005,897 | |
| | 11,671,662 | | Class 2A4, 3.350% due 6/25/43 (d) | | | 11,439,842 | |
| | 15,000,000 | | Class 2A7, 4.680% due 6/25/43 (d) | | | 14,118,628 | |
| | 5,364,976 | | GMAC Mortgage Corporation Loan Trust, Series 2003-J7, Class A10,
5.500% due 11/25/33 (d) | | | 5,127,835 | |
| | | | Government National Mortgage Association (GNMA): | | | | |
| | 7,000,000 | | Series 2001-19, Class OH, 6.500% due 5/16/31 | | | 7,130,827 | |
| | 4,485,195 | | Series 2004-27, Class PD, 5.500% due 4/20/34 | | | 4,283,837 | |
| | | | Structured Adjustable Rate Mortgage Loan Trust: | | | | |
| | 5,698,111 | | Series 2004-10, Class 3A2, 5.349% due 8/25/34 (a) | | | 5,658,531 | |
| | 1,779,551 | | Series 2005-5, Class A3, 5.553% due 5/25/35 (a) | | | 1,782,283 | |
| | 3,441,525 | | Washington Mutual Mortgage Pass-Through Certificates, Whole Loan,
Series 2003-AR5, Class A7, 4.208% due 6/25/33 (a) | | | 3,353,375 | |
|
|
|
| | | | TOTAL COLLATERALIZED MORTGAGE OBLIGATIONS
(Cost — $125,453,331) | | | 121,410,958 | |
|
|
|
| | U.S. GOVERNMENT & AGENCY OBLIGATIONS — 11.8% | | | | |
| | U.S. Government Agency Obligations — 3.8% | | | | |
| | 5,000,000 | | Federal Home Loan Mortgage Corp. (FHLMC), Medium Term Notes,
4.000% due 11/7/08 | | | 4,843,820 | |
| | 7,500,000 | | Federal National Mortgage Association (FNMA), 4.500% due 8/4/08 | | | 7,362,135 | |
| | | | U.S. Department of Housing & Urban Development, Senior Debentures, Series 2003-A: | | | | |
| | 5,000,000 | | 5.530% due 8/1/20 | | | 4,845,345 | |
| | 5,000,000 | | 5.590% due 8/1/21 | | | 4,870,805 | |
|
|
|
| | | | Total U.S. Government Agency Obligations | | | 21,922,105 | |
|
|
|
| | U.S. Government Obligations — 8.0% | | | | |
| | 3,250,000 | | U.S. Treasury Bond STRIPS, Series S0, Principal only, zero coupon to yield 5.102% due 8/15/25 | | | 1,186,747 | |
| | | | U.S. Treasury Bonds: | | | | |
| | 10,900,000 | | 8.750% due 8/15/20 | | | 14,600,899 | |
| | 18,250,000 | | 7.250% due 8/15/22 | | | 22,024,045 | |
| | 3,500,000 | | 6.125% due 8/15/29 | | | 3,892,658 | |
See Notes to Financial Statements.
Legg Mason Partners Government Securities Fund 2006 Semi-Annual Report 5
Schedule of Investments (June 30, 2006) (unaudited) (continued)
| | | | | | | |
| | |
Face
Amount | | Security | | Value | |
| | | | | | | | |
| | U.S. Government Obligations — 8.0% (continued) | | | | |
| | | | U.S. Treasury Notes: | | | | |
| $ | 2,090,000 | | 3.625% due 6/15/10 | | $ | 1,981,828 | |
| | 1,000,000 | | 4.125% due 8/15/10 (e) | | | 964,454 | |
| | 1,330,000 | | 4.250% due 8/15/13 | | | 1,262,254 | |
|
|
|
| | | | Total U.S. Government Obligations | | | 45,912,885 | |
|
|
|
| | | | TOTAL U.S. GOVERNMENT & AGENCY OBLIGATIONS
(Cost — $69,351,431) | | | 67,834,990 | |
|
|
|
| | | | TOTAL INVESTMENTS BEFORE SHORT-TERM INVESTMENT
(Cost — $623,759,753) | | | 607,472,576 | |
|
|
|
| | SHORT-TERM INVESTMENT — 34.6% | | | | |
| | Repurchase Agreement — 34.6% | | | | |
| | 199,519,000 | | Merrill Lynch, Pierce, Fenner & Smith Inc. repurchase agreement dated 6/30/06, 5.150% due 7/3/06; Proceeds at maturity — $199,604,627; (Fully collateralized by various U.S. government agency obligations, 2.350% to 6.060% due 4/5/07 to 3/7/22; Market value — $203,513,985) (Cost — $199,519,000) (d) | | | 199,519,000 | |
|
|
|
| | | | TOTAL INVESTMENTS — 139.9% (Cost — $823,278,753#) | | | 806,991,576 | |
| | | | Liabilities in Excess of Other Assets — (39.9)% | | | (230,331,330 | ) |
|
|
|
| | | | TOTAL NET ASSETS — 100.0% | | $ | 576,660,246 | |
|
|
|
| (a) | | Variable rate security. Interest rate disclosed is that which is in effect at June 30, 2006. |
| (b) | | This security is traded on a to-be-announced (“TBA”) basis (See Note 1). |
| (c) | | All or a portion of this security was acquired under mortgage dollar roll agreement (See Notes 1 and 3). |
| (d) | | All or a portion of this security is segregated for open futures contracts, TBA’s and mortgage dollar rolls. |
| (e) | | All or a portion of this security is held at the broker as collateral for open futures contracts. |
| # | | Aggregate cost for federal income tax purposes is substantially the same. |
| | |
Abbreviations used in this schedule:
|
| LIBOR | | — London Interbank Offered Rate |
| STRIPS | | — Separate Trading of Registered Interest and Principal Securities |
See Notes to Financial Statements.
6 Legg Mason Partners Government Securities Fund 2006 Semi-Annual Report
Statement of Assets and Liabilities (June 30, 2006) (unaudited)
| | | | |
| ASSETS: | | | | |
Investments, at value (Cost — $623,759,753) | | $ | 607,472,576 | |
Repurchase agreement, at value (Cost — $199,519,000) | | | 199,519,000 | |
Cash | | | 633 | |
Receivable for securities sold | | | 28,508,438 | |
Interest receivable | | | 2,965,352 | |
Principal paydown receivable | | | 1,824,486 | |
Receivable from broker — variation margin on open futures contracts | | | 196,672 | |
Receivable for Fund shares sold | | | 195,314 | |
Prepaid expenses | | | 36,908 | |
|
|
Total Assets | | | 840,719,379 | |
|
|
| LIABILITIES: | | | | |
Payable for securities purchased | | | 262,559,793 | |
Payable for Fund shares repurchased | | | 700,407 | |
Investment management fee payable | | | 262,869 | |
Distributions payable | | | 139,721 | |
Deferred dollar roll income | | | 83,733 | |
Distribution fees payable | | | 59,672 | |
Directors’ fees payable | | | 6,353 | |
Accrued expenses | | | 246,585 | |
|
|
Total Liabilities | | | 264,059,133 | |
|
|
Total Net Assets | | $ | 576,660,246 | |
|
|
| NET ASSETS: | | | | |
Par value (Note 6) | | $ | 61,302 | |
Paid-in capital in excess of par value | | | 675,601,631 | |
Overdistributed net investment income | | | (568,471 | ) |
Accumulated net realized loss on investments, futures contracts and options written | | | (81,857,958 | ) |
Net unrealized depreciation on investments and futures contracts | | | (16,576,258 | ) |
|
|
Total Net Assets | | $ | 576,660,246 | |
|
|
Shares Outstanding: | | | | |
Class 1 | | | 8,018,858 | |
| |
Class A | | | 33,440,290 | |
| |
Class B | | | 8,235,265 | |
| |
Class C | | | 1,239,293 | |
| |
Class Y | | | 10,368,284 | |
| |
Net Asset Value: | | | | |
Class 1 (and redemption price) | | | $9.41 | |
| |
Class A (and redemption price) | | | $9.40 | |
| |
Class B * | | | $9.41 | |
| |
Class C * | | | $9.41 | |
| |
Class Y (and redemption price) | | | $9.42 | |
| |
Maximum Public Offering Price Per Share: | | | | |
Class 1 (based on maximum sales charge of 6.75%) | | | $10.09 | |
| |
Class A (based on maximum sales charge of 4.50%) | | | $9.84 | |
|
|
| * | | Redemption price is NAV of Class B and C shares reduced by a 4.50% and 1.00% CDSC, respectively, if shares are redeemed within one year from purchase payment (See Note 2). |
See Notes to Financial Statements.
Legg Mason Partners Government Securities Fund 2006 Semi-Annual Report 7
Statement of Operations (For the six months ended June 30, 2006) (unaudited)
| | | | |
| INVESTMENT INCOME: | | | | |
Interest | | $ | 14,639,193 | |
|
|
| EXPENSES: | | | | |
Investment management fee (Note 2) | | | 1,653,218 | |
Distribution fees (Note 4) | | | 761,796 | |
Transfer agent fees (Note 4) | | | 413,904 | |
Shareholder reports (Note 4) | | | 42,122 | |
Registration fees | | | 31,331 | |
Audit and tax | | | 15,518 | |
Legal fees | | | 10,618 | |
Directors’ fees | | | 10,412 | |
Insurance | | | 7,601 | |
Custody fees | | | 2,930 | |
Miscellaneous expenses | | | 5,825 | |
|
|
Total Expenses | | | 2,955,275 | |
Less: Fee waivers and/or expense reimbursements (Notes 2 and 8) | | | (27,236 | ) |
|
|
Net Expenses | | | 2,928,039 | |
|
|
Net Investment Income | | | 11,711,154 | |
|
|
REALIZED AND UNREALIZED GAIN (LOSS) ON INVESTMENTS,
FUTURES CONTRACTS AND OPTIONS WRITTEN (NOTES 1 AND 3): | | | | |
Net Realized Gain (Loss) From: | | | | |
Investment transactions | | | (6,203,012 | ) |
Futures contracts | | | 1,270,732 | |
Options written | | | 36,927 | |
|
|
Net Realized Loss | | | (4,895,353 | ) |
|
|
Change in Net Unrealized Appreciation/Depreciation From: | | | | |
Investments | | | (14,032,611 | ) |
Futures contracts | | | (349,399 | ) |
|
|
Change in Net Unrealized Appreciation/Depreciation | | | (14,382,010 | ) |
|
|
Net Loss on Investments, Futures Contracts and Options Written | | | (19,277,363 | ) |
|
|
Decrease in Net Assets From Operations | | $ | (7,566,209 | ) |
|
|
See Notes to Financial Statements.
8 Legg Mason Partners Government Securities Fund 2006 Semi-Annual Report
Statements of Changes in Net Assets
| | | | | | | | |
For the six months ended June 30, 2006 (unaudited)
and the year ended December 31, 2005 | | | | | | | | |
| | |
| | | 2006 | | | 2005 | |
| OPERATIONS: | | | | | | | | |
Net investment income | | $ | 11,711,154 | | | $ | 25,495,482 | |
Net realized loss | | | (4,895,353 | ) | | | (2,187,438 | ) |
Change in net unrealized appreciation/depreciation | | | (14,382,010 | ) | | | (6,324,098 | ) |
|
|
Increase (Decrease) in Net Assets From Operations | | | (7,566,209 | ) | | | 16,983,946 | |
|
|
| DISTRIBUTIONS TO SHAREHOLDERS FROM (NOTES 1 AND 5): | | | | | | | | |
Net investment income | | | (13,265,287 | ) | | | (25,695,305 | ) |
|
|
Decrease in Net Assets From Distributions to Shareholders | | | (13,265,287 | ) | | | (25,695,305 | ) |
|
|
| FUND SHARE TRANSACTIONS (NOTE 6): | | | | | | | | |
Net proceeds from sale of shares | | | 35,395,416 | | | | 79,021,214 | |
Reinvestment of distributions | | | 11,728,153 | | | | 20,639,254 | |
Cost of shares repurchased | | | (79,849,706 | ) | | | (254,727,182 | ) |
|
|
Decrease in Net Assets From Fund Share Transactions | | | (32,726,137 | ) | | | (155,066,714 | ) |
|
|
Decrease in Net Assets | | | (53,557,633 | ) | | | (163,778,073 | ) |
| NET ASSETS: | | | | | | | | |
Beginning of period | | | 630,217,879 | | | | 793,995,952 | |
|
|
End of period* | | $ | 576,660,246 | | | $ | 630,217,879 | |
|
|
*Includes undistributed (overdistributed) net investment income of: | | | $(568,471) | | | | $985,662 | |
|
|
See Notes to Financial Statements.
Legg Mason Partners Government Securities Fund 2006 Semi-Annual Report 9
Financial Highlights
For a share of each class of capital stock outstanding throughout each year ended December 31, unless otherwise noted:
| | | | | | | | | | | | | | | | | | | | | | | | |
| | | | | | |
| Class 1 Shares(1) | | 2006(2) | | | 2005 | | | 2004 | | | 2003 | | | 2002 | | | 2001 | |
Net Asset Value, Beginning of Period | | $ | 9.74 | | | $ | 9.87 | | | $ | 9.89 | | | $ | 10.08 | | | $ | 9.53 | | | $ | 9.47 | |
|
|
Income (Loss) From Operations: | | | | | | | | | | | | | | | | | | | | | | | | |
Net investment income | | | 0.19 | | | | 0.37 | | | | 0.34 | | | | 0.33 | | | | 0.39 | | | | 0.44 | |
Net realized and unrealized gain (loss) | | | (0.30 | ) | | | (0.13 | ) | | | 0.02 | | | | (0.14 | ) | | | 0.54 | | | | 0.09 | |
|
|
Total Income (Loss) From Operations | | | (0.11 | ) | | | 0.24 | | | | 0.36 | | | | 0.19 | | | | 0.93 | | | | 0.53 | |
|
|
Less Distributions From: | | | | | | | | | | | | | | | | | | | | | | | | |
Net investment income | | | (0.22 | ) | | | (0.37 | ) | | | (0.38 | ) | | | (0.38 | ) | | | (0.38 | ) | | | (0.45 | ) |
Return of capital | | | — | | | | — | | | | (0.00 | )(3) | | | — | | | | — | | | | (0.02 | ) |
|
|
Total Distributions | | | (0.22 | ) | | | (0.37 | ) | | | (0.38 | ) | | | (0.38 | ) | | | (0.38 | ) | | | (0.47 | ) |
|
|
Net Asset Value, End of Period | | $ | 9.41 | | | $ | 9.74 | | | $ | 9.87 | | | $ | 9.89 | | | $ | 10.08 | | | $ | 9.53 | |
|
|
Total Return(4) | | | (1.16 | )% | | | 2.50 | % | | | 3.76 | % | | | 1.95 | % | | | 10.00 | % | | | 5.74 | % |
|
|
Net Assets, End of Period (millions) | | | $75 | | | | $84 | | | | $96 | | | | $108 | | | | $120 | | | | $117 | |
|
|
Ratios to Average Net Assets: | | | | | | | | | | | | | | | | | | | | | | | | |
Gross expenses | | | 0.82 | %(5) | | | 0.87 | % | | | 0.84 | % | | | 0.81 | % | | | 0.85 | % | | | 0.85 | % |
Net expenses | | | 0.80 | (5)(6) | | | 0.87 | | | | 0.82 | (6) | | | 0.81 | | | | 0.85 | | | | 0.85 | |
Net investment income | | | 4.07 | (5) | | | 3.73 | | | | 3.45 | | | | 3.34 | | | | 4.01 | | | | 4.62 | |
|
|
Portfolio Turnover Rate | | | 71 | %(7) | | | 141 | %(7) | | | 138 | %(7) | | | 148 | %(7) | | | 280 | % | | | 447 | % |
|
|
| (1) | | Per share amounts have been calculated using the average shares method. |
| (2) | | For the six months ended June 30, 2006 (unaudited). |
| (3) | | Amount represents less than $0.01 per share. |
| (4) | | Performance figures may reflect fee waivers and/or expense reimbursements. Past performance is no guarantee of future results. In the absence of fee waivers and/or expense reimbursements, the total return would have been lower. Total returns for periods of less than one year are not annualized. |
| (6) | | Reflects fee waivers and/or expense reimbursements. |
| (7) | | Excluding mortgage dollar roll transactions. If mortgage dollar roll transactions had been included, the portfolio turnover rate would have been 220%, 315%, 292% and 328% for the six months ended June 30, 2006 and for the years ended December 31, 2005, 2004 and 2003, respectively. |
See Notes to Financial Statements.
10 Legg Mason Partners Government Securities Fund 2006 Semi-Annual Report
Financial Highlights (continued)
For a share of each class of capital stock outstanding throughout each year ended December 31, unless otherwise noted:
| | | | | | | | | | | | | | | | | | | | | | | | |
| | | | | | |
| Class A Shares(1) | | 2006(2) | | | 2005 | | | 2004 | | | 2003 | | | 2002 | | | 2001 | |
Net Asset Value, Beginning of Period | | $ | 9.73 | | | $ | 9.86 | | | $ | 9.88 | | | $ | 10.07 | | | $ | 9.52 | | | $ | 9.45 | |
|
|
Income (Loss) From Operations: | | | | | | | | | | | | | | | | | | | | | | | | |
Net investment income | | | 0.19 | | | | 0.35 | | | | 0.33 | | | | 0.32 | | | | 0.38 | | | | 0.43 | |
Net realized and unrealized gain (loss) | | | (0.31 | ) | | | (0.12 | ) | | | 0.02 | | | | (0.14 | ) | | | 0.54 | | | | 0.09 | |
|
|
Total Income (Loss) From Operations | | | (0.12 | ) | | | 0.23 | | | | 0.35 | | | | 0.18 | | | | 0.92 | | | | 0.52 | |
|
|
Less Distributions From: | | | | | | | | | | | | | | | | | | | | | | | | |
Net investment income | | | (0.21 | ) | | | (0.36 | ) | | | (0.37 | ) | | | (0.37 | ) | | | (0.37 | ) | | | (0.45 | ) |
Return of capital | | | — | | | | — | | | | (0.00 | )(3) | | | — | | | | — | | | | — | |
|
|
Total Distributions | | | (0.21 | ) | | | (0.36 | ) | | | (0.37 | ) | | | (0.37 | ) | | | (0.37 | ) | | | (0.45 | ) |
|
|
Net Asset Value, End of Period | | $ | 9.40 | | | $ | 9.73 | | | $ | 9.86 | | | $ | 9.88 | | | $ | 10.07 | | | $ | 9.52 | |
|
|
Total Return(4) | | | (1.25 | )% | | | 2.36 | % | | | 3.63 | % | | | 1.83 | % | | | 9.88 | % | | | 5.60 | % |
|
|
Net Assets, End of Period (millions) | | | $314 | | | | $339 | | | | $358 | | | | $378 | | | | $395 | | | | $334 | |
|
|
Ratios to Average Net Assets: | | | | | | | | | | | | | | | | | | | | | | | | |
Gross expenses | | | 0.98 | %(5) | | | 1.00 | % | | | 0.98 | % | | | 0.95 | % | | | 0.91 | % | | | 0.96 | % |
Net expenses | | | 0.97 | (5)(6) | | | 1.00 | | | | 0.97 | (6) | | | 0.95 | | | | 0.91 | | | | 0.96 | |
Net investment income | | | 3.90 | (5) | | | 3.60 | | | | 3.30 | | | | 3.19 | | | | 3.91 | | | | 4.50 | |
|
|
Portfolio Turnover Rate | | | 71 | %(7) | | | 141 | %(7) | | | 138 | %(7) | | | 148 | %(7) | | | 280 | % | | | 447 | % |
|
|
| (1) | | Per share amounts have been calculated using the average shares method. |
| (2) | | For the six months ended June 30, 2006 (unaudited). |
| (3) | | Amount represents less than $0.01 per share. |
| (4) | | Performance figures may reflect fee waivers and/or expense reimbursements. Past performance is no guarantee of future results. In the absence of fee waivers and/or expense reimbursements, the total return would have been lower. Total returns for periods of less than one year are not annualized. |
| (6) | | Reflects fee waivers and/or expense reimbursements. |
| (7) | | Excluding mortgage dollar roll transactions. If mortgage dollar roll transactions had been included, the portfolio turnover rate would have been 220%, 315%, 292% and 328% for the six months ended June 30, 2006 and for the years ended December 31, 2005, 2004 and 2003, respectively. |
See Notes to Financial Statements.
Legg Mason Partners Government Securities Fund 2006 Semi-Annual Report 11
Financial Highlights (continued)
For a share of each class of capital stock outstanding throughout each year ended December 31, unless otherwise noted:
| | | | | | | | | | | | | | | | | | | | | | | | |
| | | | | | |
| Class B Shares(1) | | 2006(2) | | | 2005 | | | 2004 | | | 2003 | | | 2002 | | | 2001 | |
Net Asset Value, Beginning of Period | | $ | 9.74 | | | $ | 9.87 | | | $ | 9.89 | | | $ | 10.08 | | | $ | 9.53 | | | $ | 9.46 | |
|
|
Income (Loss) From Operations: | | | | | | | | | | | | | | | | | | | | | | | | |
Net investment income | | | 0.16 | | | | 0.30 | | | | 0.27 | | | | 0.27 | | | | 0.33 | | | | 0.37 | |
Net realized and unrealized gain (loss) | | | (0.31 | ) | | | (0.12 | ) | | | 0.03 | | | | (0.14 | ) | | | 0.54 | | | | 0.10 | |
|
|
Total Income (Loss) From Operations | | | (0.15 | ) | | | 0.18 | | | | 0.30 | | | | 0.13 | | | | 0.87 | | | | 0.47 | |
|
|
Less Distributions From: | | | | | | | | | | | | | | | | | | | | | | | | |
Net investment income | | | (0.18 | ) | | | (0.31 | ) | | | (0.32 | ) | | | (0.32 | ) | | | (0.32 | ) | | | (0.40 | ) |
Return of capital | | | — | | | | — | | | | (0.00 | )(3) | | | — | | | | — | | | | — | |
|
|
Total Distributions | | | (0.18 | ) | | | (0.31 | ) | | | (0.32 | ) | | | (0.32 | ) | | | (0.32 | ) | | | (0.40 | ) |
|
|
Net Asset Value, End of Period | | $ | 9.41 | | | $ | 9.74 | | | $ | 9.87 | | | $ | 9.89 | | | $ | 10.08 | | | $ | 9.53 | |
|
|
Total Return(4) | | | (1.55 | )% | | | 1.80 | % | | | 3.09 | % | | | 1.30 | % | | | 9.29 | % | | | 5.05 | % |
|
|
Net Assets, End of Period (millions) | | | $78 | | | | $89 | | | | $103 | | | | $122 | | | | $132 | | | | $78 | |
|
|
Ratios to Average Net Assets: | | | | | | | | | | | | | | | | | | | | | | | | |
Gross expenses | | | 1.60 | %(5) | | | 1.55 | % | | | 1.51 | % | | | 1.51 | % | | | 1.42 | % | | | 1.48 | % |
Net expenses | | | 1.59 | (5)(6) | | | 1.55 | | | | 1.50 | (6) | | | 1.51 | | | | 1.42 | | | | 1.48 | |
Net investment income | | | 3.27 | (5) | | | 3.04 | | | | 2.77 | | | | 2.64 | | | | 3.41 | | | | 3.94 | |
|
|
Portfolio Turnover Rate | | | 71 | %(7) | | | 141 | %(7) | | | 138 | %(7) | | | 148 | %(7) | | | 280 | % | | | 447 | % |
|
|
| (1) | | Per share amounts have been calculated using the average shares method. |
| (2) | | For the six months ended June 30, 2006 (unaudited). |
| (3) | | Amount represents less than $0.01 per share. |
| (4) | | Performance figures may reflect fee waivers and/or expense reimbursements. Past performance is no guarantee of future results. In the absence of fee waivers and/or expense reimbursements, the total return would have been lower. Total returns for periods of less than one year are not annualized. |
| (6) | | Reflects fee waivers and/or expense reimbursements. |
| (7) | | Excluding mortgage dollar roll transactions. If mortgage dollar roll transactions had been included, the portfolio turnover rate would have been 220%, 315%, 292% and 328% for the six months ended June 30, 2006 and for the years ended December 31, 2005, 2004 and 2003, respectively. |
See Notes to Financial Statements.
12 Legg Mason Partners Government Securities Fund 2006 Semi-Annual Report
Financial Highlights (continued)
For a share of each class of capital stock outstanding throughout each year ended December 31, unless otherwise noted:
| | | | | | | | | | | | | | | | | | | | | | | | |
| | | | | | |
| Class C Shares(1) | | 2006(2) | | | 2005 | | | 2004 | | | 2003 | | | 2002 | | | 2001 | |
Net Asset Value, Beginning of Period | | $ | 9.74 | | | $ | 9.87 | | | $ | 9.88 | | | $ | 10.08 | | | $ | 9.53 | | | $ | 9.45 | |
|
|
Income (Loss) From Operations: | | | | | | | | | | | | | | | | | | | | | | | | |
Net investment income | | | 0.17 | | | | 0.31 | | | | 0.28 | | | | 0.28 | | | | 0.34 | | | | 0.38 | |
Net realized and unrealized gain (loss) | | | (0.31 | ) | | | (0.13 | ) | | | 0.04 | | | | (0.15 | ) | | | 0.54 | | | | 0.10 | |
|
|
Total Income (Loss) From Operations | | | (0.14 | ) | | | 0.18 | | | | 0.32 | | | | 0.13 | | | | 0.88 | | | | 0.48 | |
|
|
Less Distributions From: | | | | | | | | | | | | | | | | | | | | | | | | |
Net investment income | | | (0.19 | ) | | | (0.31 | ) | | | (0.33 | ) | | | (0.33 | ) | | | (0.33 | ) | | | (0.40 | ) |
Return of capital | | | — | | | | — | | | | (0.00 | )(3) | | | — | | | | — | | | | — | |
|
|
Total Distributions | | | (0.19 | ) | | | (0.31 | ) | | | (0.33 | ) | | | (0.33 | ) | | | (0.33 | ) | | | (0.40 | ) |
|
|
Net Asset Value, End of Period | | $ | 9.41 | | | $ | 9.74 | | | $ | 9.87 | | | $ | 9.88 | | | $ | 10.08 | | | $ | 9.53 | |
|
|
Total Return(4) | | | (1.41 | )% | | | 1.87 | % | | | 3.29 | % | | | 1.29 | % | | | 9.39 | % | | | 5.22 | % |
|
|
Net Assets, End of Period (millions) | | | $12 | | | | $14 | | | | $17 | | | | $25 | | | | $32 | | | | $17 | |
|
|
Ratios to Average Net Assets: | | | | | | | | | | | | | | | | | | | | | | | | |
Gross expenses | | | 1.38 | %(5) | | | 1.45 | % | | | 1.44 | % | | | 1.41 | % | | | 1.39 | % | | | 1.42 | % |
Net expenses | | | 1.31 | (5)(6) | | | 1.45 | | | | 1.42 | (6) | | | 1.41 | | | | 1.39 | | | | 1.42 | |
Net investment income | | | 3.55 | (5) | | | 3.14 | | | | 2.84 | | | | 2.75 | | | | 3.45 | | | | 3.95 | |
|
|
Portfolio Turnover Rate | | | 71 | %(7) | | | 141 | %(7) | | | 138 | %(7) | | | 148 | %(7) | | | 280 | % | | | 447 | % |
|
|
| (1) | | Per share amounts have been calculated using the average shares method. |
| (2) | | For the six months ended June 30, 2006 (unaudited). |
| (3) | | Amount represents less than $0.01 per share. |
| (4) | | Performance figures may reflect fee waivers and/or expense reimbursements. Past performance is no guarantee of future results. In the absence of fee waivers and/or expense reimbursements, the total return would have been lower. Total returns for periods of less than one year are not annualized. |
| (6) | | Reflects fee waivers and/or expense reimbursements. |
| (7) | | Excluding mortgage dollar roll transactions. If mortgage dollar roll transactions had been included, the portfolio turnover rate would have been 220%, 315%, 292% and 328% for the six months ended June 30, 2006 and for the years ended December 31, 2005, 2004 and 2003, respectively. |
See Notes to Financial Statements.
Legg Mason Partners Government Securities Fund 2006 Semi-Annual Report 13
Financial Highlights (continued)
For a share of each class of capital stock outstanding throughout each year ended December 31, unless otherwise noted:
| | | | | | | | | | | | | | | | | | | | | | | | |
| | | | | | |
| Class Y Shares(1) | | 2006(2) | | | 2005 | | | 2004 | | | 2003 | | | 2002 | | | 2001 | |
Net Asset Value, Beginning of Period | | $ | 9.75 | | | $ | 9.88 | | | $ | 9.89 | | | $ | 10.08 | | | $ | 9.53 | | | $ | 9.45 | |
|
|
Income (Loss) From Operations: | | | | | | | | | | | | | | | | | | | | | | | | |
Net investment income | | | 0.20 | | | | 0.39 | | | | 0.36 | | | | 0.36 | | | | 0.41 | | | | 0.47 | |
Net realized and unrealized gain (loss) | | | (0.30 | ) | | | (0.12 | ) | | | 0.04 | | | | (0.14 | ) | | | 0.55 | | | | 0.09 | |
|
|
Total Income (Loss) From Operations | | | (0.10 | ) | | | 0.27 | | | | 0.40 | | | | 0.22 | | | | 0.96 | | | | 0.56 | |
|
|
Less Distributions From: | | | | | | | | | | | | | | | | | | | | | | | | |
Net investment income | | | (0.23 | ) | | | (0.40 | ) | | | (0.41 | ) | | | (0.41 | ) | | | (0.41 | ) | | | (0.48 | ) |
Return of capital | | | — | | | | — | | | | (0.00 | )(3) | | | — | | | | — | | | | — | |
|
|
Total Distributions | | | (0.23 | ) | | | (0.40 | ) | | | (0.41 | ) | | | (0.41 | ) | | | (0.41 | ) | | | (0.48 | ) |
|
|
Net Asset Value, End of Period | | $ | 9.42 | | | $ | 9.75 | | | $ | 9.88 | | | $ | 9.89 | | | $ | 10.08 | | | $ | 9.53 | |
|
|
Total Return(4) | | | (1.05 | )% | | | 2.75 | % | | | 4.09 | % | | | 2.17 | % | | | 10.25 | % | | | 6.07 | % |
|
|
Net Assets, End of Period (millions) | | | $98 | | | | $104 | | | | $220 | | | | $231 | | | | $130 | | | | $147 | |
|
|
Ratios to Average Net Assets: | | | | | | | | | | | | | | | | | | | | | | | | |
Gross expenses | | | 0.58 | %(5) | | | 0.59 | % | | | 0.59 | % | | | 0.57 | % | | | 0.58 | % | | | 0.60 | % |
Net expenses | | | 0.57 | (5)(6) | | | 0.59 | | | | 0.57 | (6) | | | 0.57 | | | | 0.58 | | | | 0.60 | |
Net investment income | | | 4.30 | (5) | | | 3.97 | | | | 3.70 | | | | 3.54 | | | | 4.25 | | | | 4.94 | |
|
|
Portfolio Turnover Rate | | | 71 | %(7) | | | 141 | %(7) | | | 138 | %(7) | | | 148 | %(7) | | | 280 | % | | | 447 | % |
|
|
| (1) | | Per share amounts have been calculated using the average shares method. |
| (2) | | For the six months ended June 30, 2006 (unaudited). |
| (3) | | Amount represents less than $0.01 per share. |
| (4) | | Performance figures may reflect fee waivers and/or expense reimbursements. Past performance is no guarantee of future results. In the absence of fee waivers and/or expense reimbursements, the total return would have been lower. Total returns for periods of less than one year are not annualized. |
| (6) | | Reflects fee waivers and/or expense reimbursements. |
| (7) | | Excluding mortgage dollar roll transactions. If mortgage dollar roll transactions had been included, the portfolio turnover rate would have been 220%, 315%, 292% and 328% for the six months ended June 30, 2006 and for the years ended December 31, 2005, 2004 and 2003, respectively. |
See Notes to Financial Statements.
14 Legg Mason Partners Government Securities Fund 2006 Semi-Annual Report
Notes to Financial Statements (unaudited)
| 1. | Organization and Significant Accounting Policies |
Legg Mason Partners Government Securities Fund (formerly known as Smith Barney Government Securities Fund) (the “Fund”) is a separate diversified investment series of Legg Mason Partners Investment Funds, Inc. (formerly known as Smith Barney Investment Funds Inc.) (the “Company”). The Company, a Maryland corporation, is registered under the Investment Company Act of 1940, as amended (the “1940 Act”), as an open-end management investment company.
The following are significant accounting policies consistently followed by the Fund and are in conformity with U.S. generally accepted accounting principles (“GAAP”). Estimates and assumptions are required to be made regarding assets, liabilities and changes in net assets resulting from operations when financial statements are prepared. Changes in the economic environment, financial markets and any other parameters used in determining these estimates could cause actual results to differ.
(a) Investment Valuation. Securities are valued at the mean between the bid and asked prices based on market quotations for those securities, or if no quotations are available, then for securities of similar type, yield and maturity. Securities for which market quotations are not readily available or where market quotations are determined not to reflect fair value, will be valued in good faith by or under the direction of the Fund’s Board of Directors. Short-term obligations with maturities of 60 days or less are valued at amortized cost, which approximates market value.
(b) Repurchase Agreements. When entering into repurchase agreements, it is the Fund’s policy that its custodian or a third party custodian take possession of the underlying collateral securities, the market value of which at least equals the principal amount of the repurchase transaction, including accrued interest. To the extent that any repurchase transaction exceeds one business day, the value of the collateral is marked-to-market to ensure the adequacy of the collateral. If the seller defaults, and the market value of the collateral declines or if bankruptcy proceedings are commenced with respect to the seller of the security, realization of the collateral by the Fund may be delayed or limited.
(c) Financial Futures Contracts. The Fund may enter into financial futures contracts typically to hedge a portion of the portfolio. Upon entering into a financial futures contract, the Fund is required to deposit cash or securities as initial margin. Additional securities are also segregated up to the current market value of the financial futures contracts. Subsequent payments, known as variation margin, are made or received by the Fund each day, depending on the daily fluctuation in the value of the underlying financial instruments. The Fund recognizes an unrealized gain or loss equal to the daily variation margin. When the financial futures contracts are closed, a realized gain or loss is recognized equal to the difference between the proceeds from (or cost of) the closing transactions and the Fund’s basis in the contracts.
The risks associated with entering into financial futures contracts include the possibility that a change in the value of the contract may not correlate with the changes in the value of the underlying instruments. In addition, investing in financial futures contracts involves the risk that the Fund could lose more than the original margin deposit and subsequent payments required for a futures transaction. Risks may also arise upon entering into these contracts from the potential inability of the counterparties to meet the terms of their contracts.
Legg Mason Partners Government Securities Fund 2006 Semi-Annual Report 15
Notes to Financial Statements (unaudited) (continued)
(d) Written Options. When the Fund writes an option, an amount equal to the premium received by the Fund is recorded as a liability, the value of which is marked-to- market daily to reflect the current market value of the option written. If the option expires, the Fund realizes a gain from investments equal to the amount of the premium received. When a written call option is exercised, the difference between the premium and the amount for effecting a closing purchase transaction, including brokerage commission, is also treated as a realized gain or loss. When a written put option is exercised, the amount of the premium received reduces the cost of the security purchased by the Fund.
A risk in writing a covered call option is that the Fund may forego the opportunity of profit if the market price of the underlying security increases and the option is exercised. The risk in writing a put option is that the Fund may incur a loss if the market price of the underlying security decreases and the option is exercised. The risk in writing a call option is that the Fund is exposed to the risk of loss if the market price of the underlying security increases. In addition, there is the risk that the Fund may not be able to enter into a closing transaction because of an illiquid secondary market.
(e) Securities Traded on a To-Be-Announced Basis. The Fund may trade securities on a to-be-announced (“TBA”) basis. In a TBA transaction, the Fund commits to purchasing or selling securities which have not yet been issued by the issuer and for which specific information is not known, such as the face amount and maturity date and the underlying pool of investments in U.S. government agency mortgage pass-through transactions. Securities purchased on a TBA basis are not settled until they are delivered to the Fund, normally 15 to 45 days later. Beginning on the date the Fund enters into a TBA transaction, cash, U.S. government securities or other liquid high-grade debt obligations are segregated in an amount equal in value to the purchase price of the TBA security. These transactions are subject to market fluctuations and their current value is determined in the same manner as for other securities.
(f) Mortgage Dollar Rolls. The Fund enters into dollar rolls in which the Fund sells mortgage-backed securities for delivery in the current month and simultaneously contracts to repurchase substantially similar (same type, coupon and maturity) securities to settle on a specified future date. During the roll period, the Fund forgoes principal and interest paid on the securities. The Fund is compensated by a fee paid by the counterparty, often in the form of a drop in the repurchase price of the securities. Dollar rolls are accounted for as financing arrangements; the fee is accrued into interest income ratably over the term of the dollar roll and any gain or loss on the roll is deferred and realized upon disposition of the rolled security.
The risk of entering into a mortgage dollar roll is that the market value of the securities the Fund is obligated to repurchase under the agreement may decline below the repurchase price. In the event the buyer of securities under a mortgage dollar roll files for bankruptcy or becomes insolvent, the Fund’s use of proceeds of the dollar roll may be restricted pending a determination by the other party, or its trustee or receiver, whether to enforce the Fund’s obligation to repurchase the securities.
(g) Stripped Securities. The Fund invests in “Stripped Securities,” a term used collectively for stripped fixed income securities. Stripped securities can be principal only
16 Legg Mason Partners Government Securities Fund 2006 Semi-Annual Report
Notes to Financial Statements (unaudited) (continued)
securities (“PO”), which are debt obligations that have been stripped of unmatured interest coupons or, interest only securities (“IO”), which are unmatured interest coupons that have been stripped from debt obligations. As is the case with all securities, the market value of Stripped Securities will fluctuate in response to changes in economic conditions, interest rates and the market’s perception of the securities. However, fluctuations in response to interest rates may be greater in Stripped Securities than for debt obligations of comparable maturities that pay interest currently. The amount of fluctuation increases with a longer period of maturity.
The yield to maturity on IO’s is sensitive to the rate of principal repayments (including prepayments) on the related underlying debt obligation and principal payments may have a material effect on yield to maturity. If the underlying debt obligation experiences greater than anticipated prepayments of principal, the Fund may not fully recoup its initial investment in IO’s.
(h) Security Transactions and Investment Income. Security transactions are accounted for on a trade date basis. Interest income, adjusted for amortization of premium and accretion of discount, is recorded on the accrual basis. Dividend income is recorded on the ex-dividend date. The cost of investments sold is determined by use of the specific identification method. To the extent any issuer defaults on an expected interest payment, the Fund’s policy is to generally halt any additional interest income accruals and consider the realizability of interest accrued up to the date of default.
(i) Distributions to Shareholders. Distributions from net investment income on the shares of the Fund are declared each business day to shareholders of record, and are paid monthly. Distributions of net realized gains, if any, are declared at least annually. Distributions are recorded on the ex-dividend date and are determined in accordance with income tax regulations, which may differ from GAAP.
(j) Class Accounting. Investment income, common expenses and realized/unrealized gain (loss) on investments are allocated to the various classes of the Fund on the basis of daily net assets of each class. Fees relating to a specific class are charged directly to that class.
(k) Federal and Other Taxes. It is the Fund’s policy to comply with the federal income and excise tax requirements of the Internal Revenue Code of 1986, as amended, applicable to regulated investment companies. Accordingly, the Fund intends to distribute substantially all of its income and net realized gains on investments, if any, to shareholders each year. Therefore, no federal income tax provision is required in the Fund’s financial statements.
(l) Reclassification. GAAP requires that certain components of net assets be adjusted to reflect permanent differences between financial and tax reporting. These reclassifications have no effect on net assets or net asset values per share.
| 2. | Investment Management Agreement and Other Transactions with Affiliates |
For the period of this report, Smith Barney Fund Management LLC (“SBFM”), an indirect wholly-owned subsidiary of Legg Mason, Inc. (“Legg Mason”), acted as the investment manager of the Fund. Under the investment management agreement, the Fund
Legg Mason Partners Government Securities Fund 2006 Semi-Annual Report 17
Notes to Financial Statements (unaudited) (continued)
pays an investment management fee calculated daily and paid monthly in accordance with the following breakpoint schedule:
| | | |
| |
| Average Daily Net Assets | | Annual Rate | |
First $2 billion | | 0.55 | % |
Next $2 billion | | 0.50 | |
Next $2 billion | | 0.45 | |
Next $2 billion | | 0.40 | |
Over $8 billion | | 0.35 | |
|
|
During the six months ended June 30, 2006, the Fund was reimbursed for expenses in the amount of $27,236.
Citigroup Global Markets Inc. (“CGM”), PFS Investments Inc. (“PFS”), and Legg Mason Investor Services, LLC (“LMIS”), a wholly-owned broker-dealer subsidiary of Legg Mason, serve as co-distributors of the Fund.
There is a maximum initial sales charge of 6.75% and 4.50% for Class 1 and A shares, respectively. There is a contingent deferred sales charge (“CDSC”) of 4.50% on Class B shares, which applies if redemption occurs within one year from purchase payment. This CDSC declines by 0.50% the first year after purchase payment and thereafter by 1.00% per year until no CDSC is incurred. Class C shares have a 1.00% CDSC, which applies if redemption occurs within one year from purchase payment. In certain cases, Class A shares have a 1.00% CDSC, which applies if redemption occurs within one year from purchase payment. This CDSC only applies to those purchases of Class A shares, which, when combined with current holdings of Class A shares, equal or exceed $500,000 in the aggregate. These purchases do not incur an initial sales charge.
For the six months ended June 30, 2006, LMIS and its affiliates did not receive sales charges from the Fund’s Class 1 and Class A shares, respectively. In addition, for the six months ended June 30, 2006, there were no CDSCs paid to LMIS and its affiliates.
Certain officers and one Director of the Company are employees of Legg Mason or its affiliates and do not receive compensation from the Company.
During the six months ended June 30, 2006, the aggregate cost of purchases and proceeds from sales of investments (excluding short-term investments and mortgage dollar rolls) were as follows:
| | | | | | |
| | |
| | | Investments | | U.S. Government &
Agency Obligations |
Purchases | | $ | 9,874,837 | | $ | 454,288,420 |
|
Sales | | | 58,256,659 | | | 406,895,474 |
|
18 Legg Mason Partners Government Securities Fund 2006 Semi-Annual Report
Notes to Financial Statements (unaudited) (continued)
At June 30, 2006, the aggregate gross unrealized appreciation and depreciation of investments for federal income tax purposes were substantially as follows:
| | | | |
Gross unrealized appreciation | | $ | 988,822 | |
Gross unrealized depreciation | | | (17,275,999 | ) |
|
|
Net unrealized depreciation | | $ | (16,287,177 | ) |
|
|
At June 30, 2006, the Fund had the following open futures contracts:
| | | | | | | | | | | | | | |
| | | | | |
| | | Number of
Contracts | | Expiration
Date | | Basis Value | | Market
Value | | Unrealized
Gain (Loss) | |
Contracts to Buy: | | | | | | | | | | | | | | |
U.S. 5-Year Treasury Notes | | 631 | | 9/06 | | $ | 65,477,633 | | $ | 65,249,344 | | $ | (228,289 | ) |
U.S. Treasury Bonds | | 139 | | 9/06 | | | 14,933,601 | | | 14,825,219 | | | (108,382 | ) |
|
|
| | | | | | | | | | | | | | (336,671 | ) |
|
|
Contracts to Sell: | | | | | | | | | | | | | | |
U.S. 10-Year Treasury Notes | | 132 | | 9/06 | | | 13,889,028 | | | 13,841,438 | | | 47,590 | |
|
|
Net unrealized loss on open futures contracts | | | | | | | | | | | | $ | (289,081 | ) |
|
|
During the six months ended June 30, 2006, written options transactions for the Fund were as follows:
| | | | | | | |
| | |
| | | Number of Contracts | | | Premiums Received | |
Options written, outstanding at December 31, 2005 | | — | | | $ | — | |
Options written | | 75 | | | | 50,105 | |
Options closed | | (75 | ) | | | (50,105 | ) |
|
|
Options written, outstanding at June 30, 2006 | | — | | | $ | — | |
|
|
During the six months ended June 30, 2006, the Fund entered into mortgage dollar roll transactions in the aggregate amount of $976,081,508.
For the six months ended June 30, 2006, the Fund recorded interest income of $699,857 related to such mortgage roll transactions.
At June 30, 2006, the Fund had outstanding mortgage dollar rolls with a total cost of $231,474,555.
| 4. | Class Specific Expenses |
The Fund has adopted a Rule 12b-1distribution plan and under that plan the Fund pays a service fee with respect to its Class A, B and C shares calculated at the annual rate of 0.25% of the average daily net assets of each respective class. The Fund also pays a distribution fee with respect to its Class B and C shares calculated at the annual rate of 0.50% and 0.45% of the average daily net assets of each class, respectively. Distribution fees are accrued daily and paid monthly.
Legg Mason Partners Government Securities Fund 2006 Semi-Annual Report 19
Notes to Financial Statements (unaudited) (continued)
For the six months ended June 30, 2006, class specific expenses were as follows:
| | | | | | | | | |
| | | |
| | | Distribution
Fees | | Transfer
Agent Fees | | Shareholder
Reports Expenses |
Class 1 | | $ | — | | $ | 91,188 | | $ | 4,827 |
Class A | | | 407,485 | | | 214,444 | | | 26,773 |
Class B | | | 310,394 | | | 103,178 | | | 9,025 |
Class C | | | 43,917 | | | 5,034 | | | 1,428 |
Class Y | | | — | | | 60 | | | 69 |
|
Total | | $ | 761,796 | | $ | 413,904 | | $ | 42,122 |
|
| 5. | Distributions to Shareholders by Class |
| | | | | | |
| | |
| | | Six Months Ended
June 30, 2006 | | Year Ended
December 31, 2005 |
Net Investment Income: | | | | | | |
Class 1 | | $ | 1,813,466 | | $ | 3,408,433 |
Class A | | | 7,200,270 | | | 12,842,270 |
Class B | | | 1,568,503 | | | 2,979,795 |
Class C | | | 255,211 | | | 494,560 |
Class Y | | | 2,427,837 | | | 5,970,247 |
|
Total | | $ | 13,265,287 | | $ | 25,695,305 |
|
At June 30, 2006, the Company had 10 billion shares of capital stock authorized with a par value of $0.001 per share. The Fund has the ability to issue multiple classes of shares. Each share of a class represents an identical interest in the Fund and has the same rights, except that each class bears certain direct expenses, including those specifically related to the distribution of its shares.
Transactions in shares of each class were as follows:
| | | | | | | | | | | | | | |
| | |
| | | Six Months Ended
June 30, 2006
| | | Year Ended
December 31, 2005
| |
| | | Shares | | | Amount | | | Shares | | | Amount | |
Class 1 | | | | | | | | | | | | | | |
Shares sold | | 94,388 | | | $ | 904,876 | | | 230,609 | | | $ | 2,265,126 | |
Shares issued on reinvestment | | 192,031 | | | | 1,833,700 | | | 346,994 | | | | 3,408,432 | |
Shares repurchased | | (906,682 | ) | | | (8,685,339 | ) | | (1,628,379 | ) | | | (16,001,565 | ) |
|
|
Net Decrease | | (620,263 | ) | | $ | (5,946,763 | ) | | (1,050,776 | ) | | $ | (10,328,007 | ) |
|
|
Class A | | | | | | | | | | | | | | |
Shares sold | | 2,477,207 | | | $ | 23,774,064 | | | 4,879,480 | | | $ | 47,963,361 | |
Shares issued on reinvestment | | 612,750 | | | | 5,844,362 | | | 1,041,506 | | | | 10,217,752 | |
Shares repurchased | | (4,486,992 | ) | | | (42,916,513 | ) | | (7,379,357 | ) | | | (72,449,453 | ) |
|
|
Net Decrease | | (1,397,035 | ) | | $ | (13,298,087 | ) | | (1,458,371 | ) | | $ | (14,268,340 | ) |
|
|
20 Legg Mason Partners Government Securities Fund 2006 Semi-Annual Report
Notes to Financial Statements (unaudited) (continued)
| | | | | | | | | | | | | | |
| | |
| | | Six Months Ended
June 30, 2006
| | | Year Ended
December 31, 2005
| |
| | | Shares | | | Amount | | | Shares | | | Amount | |
Class B | | | | | | | | | | | | | | |
Shares sold | | 433,596 | | | $ | 4,151,138 | | | 1,044,174 | | | $ | 10,272,493 | |
Shares issued on reinvestment | | 147,487 | | | | 1,408,472 | | | 266,231 | | | | 2,614,511 | |
Shares repurchased | | (1,483,099 | ) | | | (14,191,741 | ) | | (2,599,846 | ) | | | (25,544,949 | ) |
|
|
Net Decrease | | (902,016 | ) | | $ | (8,632,131 | ) | | (1,289,441 | ) | | $ | (12,657,945 | ) |
|
|
Class C | | | | | | | | | | | | | | |
Shares sold | | 29,434 | | | $ | 282,107 | | | 161,216 | | | $ | 1,584,061 | |
Shares issued on reinvestment | | 19,465 | | | | 185,829 | | | 36,272 | | | | 355,972 | |
Shares repurchased | | (234,162 | ) | | | (2,246,891 | ) | | (537,020 | ) | | | (5,269,679 | ) |
|
|
Net Decrease | | (185,263 | ) | | $ | (1,778,955 | ) | | (339,532 | ) | | $ | (3,329,646 | ) |
|
|
Class Y | | | | | | | | | | | | | | |
Shares sold | | 651,632 | | | $ | 6,283,231 | | | 1,715,040 | | | $ | 16,936,173 | |
Shares issued on reinvestment | | 256,957 | | | | 2,455,790 | | | 411,490 | | | | 4,042,587 | |
Shares repurchased | | (1,233,069 | ) | | | (11,809,222 | ) | | (13,697,670 | ) | | | (135,461,536 | ) |
|
|
Net Decrease | | (324,480 | ) | | $ | (3,070,201 | ) | | (11,571,140 | ) | | $ | (114,482,776 | ) |
|
|
| 7. | Capital Loss Carryforward |
On December 31, 2005, the Fund had a net capital loss carryfoward of $73,939,965 of which $2,822,382 expires in 2006, $48,857,876 expires in 2007, $16,358,450 expires in 2008, $2,474,230 expires in 2012 and $3,427,027 expires in 2013. These amounts will be available to offset any future taxable capital gains.
On May 31, 2005, the U.S. Securities and Exchange Commission (“SEC”) issued an order in connection with the settlement of an administrative proceeding against SBFM and CGM relating to the appointment of an affiliated transfer agent for the Smith Barney family of mutual funds (the “Funds”).
The SEC order finds that SBFM and CGM willfully violated Section 206(1) of the Investment Advisers Act of 1940 (“Advisers Act”). Specifically, the order finds that SBFM and CGM knowingly or recklessly failed to disclose to the boards of the Funds in 1999 when proposing a new transfer agent arrangement with an affiliated transfer agent that: First Data Investors Services Group (“First Data”), the Funds’ then-existing transfer agent, had offered to continue as transfer agent and do the same work for substantially less money than before; and that Citigroup Asset Management (“CAM”), the Citigroup business unit that, at the time, included the Fund’s investment manager and other investment advisory companies, had entered into a side letter with First Data under which CAM agreed to recommend the appointment of First Data as sub-transfer agent to the affiliated transfer agent in exchange for, among other things, a guarantee by First Data of specified amounts of asset management and investment banking fees to CAM and CGM. The order also finds that SBFM and CGM willfully violated Section 206(2) of the Advisers Act by virtue of the omissions discussed above and other misrepresentations and omissions in the
Legg Mason Partners Government Securities Fund 2006 Semi-Annual Report 21
Notes to Financial Statements (unaudited) (continued)
materials provided to the Funds’ boards, including the failure to make clear that the affiliated transfer agent would earn a high profit for performing limited functions while First Data continued to perform almost all of the transfer agent functions, and the suggestion that the proposed arrangement was in the Funds’ best interests and that no viable alternatives existed. SBFM and CGM do not admit or deny any wrongdoing or liability. The settlement does not establish wrongdoing or liability for purposes of any other proceeding.
The SEC censured SBFM and CGM and ordered them to cease and desist from violations of Sections 206(1) and 206(2) of the Advisers Act. The order requires Citigroup to pay $208.1 million, including $109 million in disgorgement of profits, $19.1 million in interest, and a civil money penalty of $80 million. Approximately $24.4 million has already been paid to the Funds, primarily through fee waivers. The remaining $183.7 million, including the penalty, has been paid to the U.S. Treasury and will be distributed pursuant to a plan submitted for the approval of the SEC. At this time, there is no certainty as to how the above-described proceeds of the settlement will be distributed, to whom such distributions will be made, the methodology by which such distributions will be allocated, and when such distributions will be made. The order also required that transfer agency fees received from the Funds since December 1, 2004, less certain expenses, be placed in escrow and provided that a portion of such fees might be subsequently distributed in accordance with the terms of the order. On April 3, 2006, an aggregate amount of approximately $9 million was distributed to the affected Funds.
The order required SBFM to recommend a new transfer agent contract to the Fund boards within 180 days of the entry of the order; if a Citigroup affiliate submitted a proposal to serve as transfer agent or sub-transfer agent, SBFM and CGM would have been required, at their expense, to engage an independent monitor to oversee a competitive bidding process. On November 21, 2005, and within the specified timeframe, the Fund’s Board selected a new transfer agent for the Fund. No Citigroup affiliate submitted a proposal to serve as transfer agent. Under the order, SBFM also must comply with an amended version of a vendor policy that Citigroup instituted in August 2004.
Although there can be no assurance, SBFM does not believe that this matter will have a material adverse effect on the Funds.
On December 1, 2005, Citigroup completed the sale of substantially all of its global asset management business, including SBFM, to Legg Mason.
Beginning in August 2005, five class action lawsuits alleging violations of federal securities laws and state law were filed against CGM and SBFM, (collectively, the “Defendants”) based on the May 31, 2005 settlement order issued against the Defendants by the SEC described in Note 8. The complaints seek injunctive relief and compensatory and punitive damages, removal of SBFM as the investment manager for the Smith Barney family of funds, rescission of the Funds’ management and other contracts with SBFM, recovery of all fees paid to SBFM pursuant to such contracts, and an award of attorneys’ fees and litigation expenses.
22 Legg Mason Partners Government Securities Fund 2006 Semi-Annual Report
Notes to Financial Statements (unaudited) (continued)
On October 5, 2005, a motion to consolidate the five actions and any subsequently filed, related action was filed. That motion contemplates that a consolidated amended complaint alleging substantially similar causes of action will be filed in the future.
As of the date of this report, SBFM believes that resolution of the pending lawsuit will not have a material effect on the financial position or results of operations of the Funds or the ability of the Fund’s investment manager and its affiliates to continue to render services to the Funds under their respective contracts.
* * *
Beginning in June 2004, class action lawsuits alleging violations of the federal securities laws were filed against CGM and a number of its then affiliates, including SBFM and Salomon Brothers Asset Management (“SBAM”), which were then investment adviser or manager to certain of the Funds (the “Managers”), substantially all of the mutual funds then managed by the Managers (the “Defendant Funds”), and Board Members of the Defendant Funds (collectively, the “Defendants”). The complaints alleged, among other things, that CGM created various undisclosed incentives for its brokers to sell Smith Barney and Salomon Brothers funds. In addition, according to the complaints, the Managers caused the Defendant Funds to pay excessive brokerage commissions to CGM for steering clients towards proprietary funds. The complaints also alleged that the defendants breached their fiduciary duty to the Defendant Funds by improperly charging Rule 12b-1 fees and by drawing on fund assets to make undisclosed payments of soft dollars and excessive brokerage commissions. The complaints also alleged that the Defendant Funds failed to adequately disclose certain of the allegedly wrongful conduct. The complaints sought injunctive relief and compensatory and punitive damages, rescission of the Defendant Funds’ contracts with the Managers, recovery of all fees paid to the Managers pursuant to such contracts and an award of attorneys’ fees and litigation expenses.
On December 15, 2004, a consolidated amended complaint (the “Complaint”) was filed alleging substantially similar causes of action. On May 27, 2005, all of the Defendants filed motions to dismiss the Complaint. On July 26, 2006, the court issued a decision and order (1) finding that plaintiffs lacked standing to sue on behalf of the shareholders of the Funds in which none of the plaintiffs had invested (including Legg Mason Partners Government Securities Fund) and dismissing those Funds from the case (although stating that they could be brought back into the case if standing as to them could be established), and (2) other than one stayed claim, dismissing all of the causes of action against the remaining Defendants, with prejudice, except for the cause of action under Section 36(b) of the Investment Company Act, which the court granted plaintiffs leave to repeal as a derivative claim.
On September 16, 2005, the staff of the SEC informed SBFM and SBAM that the staff is considering recommending that the SEC institute administrative proceedings against SBFM and SBAM for alleged violations of Section 19(a) and 34(b) of the Investment Company Act (and related Rule 19a-1). The notification is a result of an industry wide
Legg Mason Partners Government Securities Fund 2006 Semi-Annual Report 23
Notes to Financial Statements (unaudited) (continued)
inspection by the SEC and is based upon alleged deficiencies in disclosures regarding dividends and distributions paid to shareholders of certain funds. Section 19(a) and related Rule 19a-1 of the Investment Company Act generally require funds that are making dividend and distribution payments to provide shareholders with a written statement disclosing the source of the dividends and distributions, and, in particular, the portion of the payments made from each of net investment income, undistributed net profits and/or paid-in capital. In connection with the contemplated proceedings, the staff may seek a cease and desist order and/or monetary damages from SBFM or SBAM.
Although there can be no assurance, SBFM believes that this matter is not likely to have a material adverse effect on the Fund.
The Fund’s Board has approved the appointment of Legg Mason Partners Fund Advisor, LLC (“LMPFA”) as the Fund’s investment manager effective August 1, 2006. The Fund’s Board has also approved the appointment of Western Asset Management Company (“Western Asset”) as the Fund’s subadviser effective August 1, 2006. The portfolio managers who are responsible for the day-to-day management of the Fund remain the same immediately prior to and immediately after the date of these changes. LMPFA and Western Asset are wholly-owned subsidiaries of Legg Mason.
LMPFA will provide administrative and certain oversight services to the Fund. LMPFA will delegate to the subadvisers the day-to-day portfolio management of the Fund, except for the management of cash and short-term instruments. The Fund’s investment management fee will remain unchanged. For its services, LMPFA will pay Western Asset 70% of the net management fee that it receives from the Fund.
The Fund’s Board has also approved certain share class modifications which, among other things, will standardize share class features for all funds in the fund complex. The features standardized include such things as sales loads, distribution charges and other costs. These modifications are expected to be implemented during the fourth quarter of 2006.
The Fund’s Board has also approved a number of other initiatives designed to streamline and restructure the fund complex, and has authorized seeking shareholder approval for those initiatives where shareholder approval is required. As a result, Fund shareholders will be asked to elect a new Board, approve matters that will result in the Fund being grouped for organizational and governance purposes with other funds in the fund complex, and domicile the Fund as a Maryland business trust, with all funds operating under uniform charter documents. Fund shareholders also will be asked to approve investment matters, including standardized fundamental investment policies.
Proxy materials describing these matters are expected to be sent to shareholders later in 2006. If shareholder approval is obtained, these matters generally are expected to be implemented during the first quarter of 2007.
| 12. | Recent Accounting Pronouncement |
During June 2006, the Financial Accounting Standards Board (“FASB”) issued FASB Interpretation 48 (“FIN 48” or the “Interpretation”), Accounting for Uncertainty in Income
24 Legg Mason Partners Government Securities Fund 2006 Semi-Annual Report
Notes to Financial Statements (unaudited) (continued)
Taxes—an interpretation of FASB statement 109. FIN 48 supplements FASB Statement 109 by defining the confidence level that a tax position must meet in order to be recognized in the financial statements. FIN 48 prescribes a comprehensive model for how a fund should recognize, measure, present, and disclose in its financial statements uncertain tax positions that the fund has taken or expects to take on a tax return. FIN 48 requires that the tax effects of a position be recognized only if it is “more likely than not” to be sustained based solely on its technical merits. Management must be able to conclude that the tax law, regulations, case law, and other objective information regarding the technical merits sufficiently support the position’s sustainability with a likelihood of more than 50 percent. FIN 48 is effective for fiscal periods beginning after December 15, 2006, which for this Fund will be January 1, 2007. At adoption, the financial statements must be adjusted to reflect only those tax positions that are more likely than not to be sustained as of the adoption date. Management of the Fund is currently evaluating the impact that FIN 48 will have on the financial statements.
Legg Mason Partners Government Securities Fund 2006 Semi-Annual Report 25
Board Approval of Management and Subadvisory Agreements (unaudited)
At a meeting held in person on June 29, 2006, the Fund’s Board, including a majority of the Board Members who are not “interested persons” of the Fund or Legg Mason Partners Fund Advisor, LLC (the “Manager”) or any sub-investment adviser or proposed sub-investment adviser as defined in the Investment Company Act of 1940, as amended (the “1940 Act”) (the “Independent Board Members”), approved a new management agreement (the “New Management Agreement”) between the Fund and the Manager. The Fund’s Board, including a majority of the Independent Board Members, also approved one or more new subadvisory agreements between the Manager and Western Asset (the “Subadviser”) (the “New Subadvisory Agreement”). The New Management Agreement and the New Subadvisory Agreement replaced the Fund’s prior management agreement with pre-8/1/06 manager and were entered into in connection with an internal reorganization of the Manager’s, the prior manager’s and the Subadviser’s parent organization, Legg Mason. In approving the New Management Agreement and New Subadvisory Agreement, the Board, including the Independent Board Members, considered the factors discussed below, among other things.
The Board noted that the Manager will provide administrative and certain oversight services to the Fund, and that the Manager will delegate to the Subadviser the day-to-day portfolio management of the Fund. The Board Members reviewed the qualifications, backgrounds and responsibilities of the senior personnel that will provide oversight and general management services and the portfolio management team that would be primarily responsible for the day-to-day management of the Fund. The Board Members noted that the portfolio management team was expected to be the same as then managing the Fund.
The Board Members received and considered information regarding the nature, extent and quality of services expected to be provided to the Fund by the Manager under the New Management Agreement and by the Subadviser under the New Subadvisory Agreement. The Board Members’ evaluation of the services expected to be provided by the Manager and the Subadviser took into account the Board Members’ knowledge and familiarity gained as Fund Board Members, including as to the scope and quality of Legg Mason’s investment management and other capabilities and the quality of its administrative and other services. The Board Members considered, among other things, information and assurances provided by Legg Mason as to the operations, facilities and organization of the Manager and the Subadviser and the qualifications, backgrounds and responsibilities of their senior personnel. The Board Members further considered the financial resources available to the Manager, the Subadviser and Legg Mason. The Board Members concluded that, overall, the nature, extent and quality of services expected to be provided under the New Management Agreement and the New Subadvisory Agreement were acceptable.
The Board Members also received and considered performance information for the Fund as well as comparative information with respect to a peer group of funds (the “Performance Universe”) selected by Lipper, Inc. (“Lipper”), an independent provider of investment company data. The Board Members were provided with a description of the methodology Lipper used to determine the similarity of the Fund to the funds included in
26 Legg Mason Partners Government Securities Fund
Board Approval of Management and Subadvisory Agreements (unaudited) (continued)
the Performance Universe. The Board Members noted that they had received and discussed with management, at periodic intervals, information comparing the Fund’s performance against, among other things, its benchmarks. Based on the Board Members’ review, which included careful consideration of the factors noted above, the Board Members concluded that the performance of the Fund, under the circumstances, supported approval of the New Management Agreement and New Subadvisory Agreement.
The Board Members reviewed and considered the management fee that would be payable by the Fund to the Manager in light of the nature, extent and quality of the management services expected to be provided by the Manager, including the fee waiver and/or expense reimbursement arrangements currently in place, if any. Additionally, the Board Members received and considered information comparing the Fund’s management fee and overall expenses with those of comparable funds in both the relevant expense group and a broader group of funds, each selected and provided by Lipper. The Board Members also reviewed and considered the subadvisory fee that would be payable by the Manager to the Subadviser in light of the nature, extent and quality of the management services expected to be provided by the Subadviser. The Board Members noted that the Manager, and not the Fund, will pay the subadvisory fee to the Subadviser. The Board Members determined that the Fund’s management fee and the Fund’s subadvisory fee were reasonable in light of the nature, extent and quality of the services expected to be provided to the Fund under the New Management Agreement and the New Subadvisory Agreement.
The Board Members received and considered a pro-forma profitability analysis of Legg Mason and its affiliates in providing services to the Fund, including information with respect to the allocation methodologies used in preparing the profitability data. The Board Members recognized that Legg Mason may realize economies of scale based on its internal reorganization and synergies of operations. The Board Members noted that it was not possible to predict with a high degree of confidence how Legg Mason’s and its affiliates’ profitability would be affected by its internal reorganization and by other factors including potential economies of scale, but that based on their review of the pro forma profitability analysis, their most recent prior review of the profitability of the predecessor manager and its affiliates from their relationship with the Fund and other factors considered, they determined that the management fee was reasonable. The Board Members noted that they expect to receive profitability information on an annual basis.
In their deliberations, the Board Members also considered, and placed significant importance on, information that had been received and conclusions that had been reached by the Board in connection with the Board’s most recent approval of the Fund’s prior management agreement, in addition to information provided in connection with the Board’s evaluation of the terms and conditions of the New Management Agreement and the New Subadvisory Agreement.
The Board Members considered Legg Mason’s advice and the advice of its counsel that the New Management Agreement and the New Subadvisory Agreement were being entered into in connection with an internal reorganization within Legg Mason, that did not involve an actual change of control or management. The Board Members further
Legg Mason Partners Government Securities Fund 27
Board Approval of Management and Subadvisory Agreements (unaudited) (continued)
noted that the terms and conditions of the New Management Agreement are substantially identical to those of the Fund’s previous management agreement except for the identity of the Manager, and that the initial term of the New Management Agreement (after which it will continue in effect only if such continuance is specifically approved at least annually by the Board, including a majority of the Independent Board Members) was the same as that under the prior management agreement.
In light of all of the foregoing, the Board, including the Independent Board Members, approved the New Management Agreement and the New Subadvisory Agreement. No single factor reviewed by the Board Members was identified as the principal factor in determining whether to approve the New Management Agreement and the New Subadvisory Agreement. The Independent Board Members were advised by separate independent legal counsel throughout the process. The Independent Board Members also discussed the proposed approval of the New Management Agreement and the New Subadvisory Agreement in private sessions with their independent legal counsel at which no representatives of the Manager or Subadviser were present.
28 Legg Mason Partners Government Securities Fund
Legg Mason Partners Government Securities Fund
| | |
DIRECTORS Paul R. Ades Dwight B. Crane R. Jay Gerken, CFA
Chairman Frank G. Hubbard Jerome H. Miller Ken Miller INVESTMENT MANAGER Legg Mason Partners Fund
Advisor, LLC SUBADVISER Western Asset Management Company DISTRIBUTORS Citigroup Global Markets Inc. Legg Mason Investor Services, LLC PFS Investments Inc. | | CUSTODIAN State Street Bank and Trust
Company TRANSFER AGENT PFPC Inc. 4400 Computer Drive Westborough, Massachusetts 01581 INDEPENDENT REGISTERED PUBLIC ACCOUNTING FIRM KPMG LLP 345 Park Avenue New York, New York 10154 |
This report is submitted for the general information of the shareholders of Legg Mason Partners Government Securities Fund, but it may also be used as sales literature.
This report must be preceded or accompanied by a free prospectus. Investors should consider the Fund’s investment objectives, risks, charges and expenses carefully before investing. The prospectus contains this and other important information about the Fund. Please read the prospectus carefully before investing.
www.leggmason.com/InvestorServices
©2006 Legg Mason
Investor Services, LLC
Member NASD, SIPC
Legg Mason Partners
Government Securities Fund
The Fund is a separate series of Legg Mason Partners Investment Funds, Inc., a Maryland corporation.
LEGG MASON PARTNERS GOVERNMENT SECURITIES FUND
Legg Mason Partners Funds
125 Broad Street
10th Floor, MF-2
New York, New York 10004
The Fund files its complete schedule of portfolio holdings with the Securities and Exchange Commission for the first and third quarters of each fiscal year on Form N-Q. The Fund’s Forms N-Q are available on the Commission’s website at www.sec.gov. The Fund’s Forms N-Q may be reviewed and copied at the Commission’s Public Reference Room in Washington, D.C., and information on the operation of the Public Reference Room may be obtained by calling 1-800-SEC-0330. To obtain information on Form N-Q from the Fund, shareholders can call 1-800-451-2010.
Information on how the Fund voted proxies relating to portfolio securities during the prior 12-month period ended June 30th of each year, and a description of the policies and procedures that the Fund uses to determine how to vote proxies relating to portfolio securities is available (1) without charge, upon request, by calling 1-800-451-2010, (2) on the Fund’s website at www.leggmason.com/InvestorServices and (3) on the SEC’s website at www.sec.gov. Proxy voting reports for the period ended June 30, 2005 will continue to be listed under the Fund’s former Smith Barney Investment Funds Inc. — Smith Barney Government Securities Fund name.
ITEM 2. CODE OF ETHICS.
Not Applicable.
ITEM 3. AUDIT COMMITTEE FINANCIAL EXPERT.
Not Applicable.
ITEM 4. PRINCIPAL ACCOUNTANT FEES AND SERVICES.
Not applicable.
ITEM 5. AUDIT COMMITTEE OF LISTED REGISTRANTS.
Not applicable.
ITEM 6. SCHEDULE OF INVESTMENTS.
Included herein under Item 1.
ITEM 7. DISCLOSURE OF PROXY VOTING POLICIES AND PROCEDURES FOR CLOSED-END MANAGEMENT INVESTMENT COMPANIES.
Not applicable.
ITEM 8. PORTFOLIO MANAGERS OF CLOSED-END MANAGEMENT INVESTMENT COMPANIES.
Not applicable.
ITEM 9. PURCHASES OF EQUITY SECURITIES BY CLOSED-END MANAGEMENT INVESTMENT COMPANY AND AFFILIATED PURCHASERS.
Not applicable.
ITEM 10. SUBMISSION OF MATTERS TO A VOTE OF SECURITY HOLDERS.
Not applicable.
ITEM 11. CONTROLS AND PROCEDURES.
| | (a) | The registrant’s principal executive officer and principal financial officer have concluded that the registrant’s disclosure controls and procedures (as defined in Rule 30a- 3(c) under the Investment Company Act of 1940, as amended (the “1940 Act”)) are effective as of a date within 90 days of the filing date of this report that includes the disclosure required by this paragraph, based on their evaluation of the disclosure controls and procedures required by Rule 30a-3(b) under the 1940 Act and 15d-15(b) under the Securities Exchange Act of 1934. |
| | (b) | There were no changes in the registrant’s internal control over financial reporting (as defined in Rule 30a-3(d) under the 1940 Act) that occurred during the registrant’s last fiscal half-year (the registrant’s second fiscal half-year in the case of an annual report) that have materially affected, or are likely to materially affect the registrant’s internal control over financial reporting. |
| | |
| Exhibit 99.CERT | | Certifications pursuant to section 302 of the Sarbanes-Oxley Act of 2002 |
| |
| Exhibit 99.906CERT | | Certifications pursuant to Section 906 of the Sarbanes-Oxley Act of 2002 |
SIGNATURES
Pursuant to the requirements of the Securities Exchange Act of 1934 and the Investment Company Act of 1940, the registrant has duly caused this Report to be signed on its behalf by the undersigned, there unto duly authorized.
Legg Mason Partners Investment Funds, Inc.
| | |
| By: | | /s/ R. Jay Gerken
|
| | | (R. Jay Gerken) |
| | | Chief Executive Officer of |
| | | Legg Mason Partners Investment Funds, Inc. |
|
| Date: September 7, 2006 |
Pursuant to the requirements of the Securities Exchange Act of 1934 and the Investment Company Act of 1940, this report has been signed below by the following persons on behalf of the registrant and in the capacities and on the dates indicated.
| | |
| By: | | /s/ R. Jay Gerken
|
| | | (R. Jay Gerken) |
| | | Chief Executive Officer of |
| | | Legg Mason Partners Investment Funds, Inc. |
|
| Date: September 7, 2006 |
| | |
| By: | | /s/ Kaprel Ozsolak
|
| | | (Kaprel Ozsolak) |
| | | Chief Financial Officer of |
| | | Legg Mason Partners Investment Funds, Inc. |
|
| Date: September 7, 2006 |