UNITED STATES
SECURITIES AND EXCHANGE COMMISSION
Washington, D.C. 20549
FORM N-CSR
CERTIFIED SHAREHOLDER REPORT OF REGISTERED
MANAGEMENT INVESTMENT COMPANIES
| | |
Investment Company Act file number | | 811–3275 |
Legg Mason Partners Investment Funds, Inc.
|
| (Exact name of registrant as specified in charter) |
| | |
| 125 Broad Street, New York, NY | | 10004 |
| (Address of principal executive offices) | | (Zip code) |
Robert I. Frenkel, Esq.
Legg Mason & Co., LLC
300 First Stamford Place, 4th Floor
Stamford, CT 06902
|
| (Name and address of agent for service) |
Registrant’s telephone number, including area code: (800) 451–2010
Date of fiscal year end: December 31
Date of reporting period: December 31, 2006
| ITEM 1. | REPORT TO STOCKHOLDERS. |
The Annual Report to Stockholders is filed herewith.
ANNUAL REPORT
DECEMBER 31, 2006

Legg Mason Partners
Government Securities Fund
INVESTMENT PRODUCTS: NOT FDIC INSURED • NO BANK GUARANTEE • MAY LOSE VALUE
Legg Mason Partners Government Securities Fund
Annual Report • December 31, 2006
What’s
Inside
Fund Objective:
The Fund seeks high current return.
Letter from the Chairman

R. JAY GERKEN, CFA
Chairman, President and Chief Executive Officer
Dear Shareholder,
U.S. economic growth was mixed during the 12-month reporting period. After gross domestic product (“GDP”)i increased 1.7% in the fourth quarter of 2005, the economy then rebounded sharply in the first quarter of 2006. Over this period, GDP rose 5.6%, its best showing since the third quarter of 2003. In the second quarter of 2006, GDP growth was 2.6% and it further moderated to 2.0% in the third quarter. The economy then strengthened in the fourth quarter, due largely to increased consumer spending. Over this time, the advance estimate for GDP growth was 3.5%.
After increasing the federal funds rateii to 5.25% in June—its 17th consecutive rate hike—the Federal Reserve Board (“Fed”)iii paused from raising rates at its next five meetings. In its statement accompanying the January 2007 meeting, the Fed stated, “Recent indicators have suggested somewhat firmer economic growth, and some tentative signs of stabilization have appeared in the housing market. Readings on core inflation have improved modestly in recent months, and inflation pressures seem likely to moderate over time.”
During the reporting period, short- and long-term Treasury yields experienced periods of significant volatility. After peaking in late June with two–and 10–year Treasuries hitting 5.29% and 5.25%, respectively—rates fell sharply as the Fed paused from its tightening cycle. In addition, inflationary pressures eased as oil prices fell after reaching a record high in mid-July. Overall, during the 12 months ended December 31, 2006, two-year Treasury yields increased from 4.41% to 4.82%. Over the same period, 10-year Treasury yields moved from 4.39% to 4.71%. Looking at the 12-month period as a whole, the overall bond market, as measured by the Lehman Brothers U.S. Aggregate Indexiv, returned 4.33%.
Legg Mason Partners Government Securities Fund I
Please read on for a more detailed look at prevailing economic and market conditions during the Fund’s fiscal year and to learn how those conditions have affected Fund performance.
Special Shareholder Notices
Effective August 1, 2006, Legg Mason Partners Fund Advisor, LLC (“LMPFA”) became the Fund’s investment manager and Western Asset Management Company (“Western Asset”) became the Fund’s subadviser. The portfolio managers who are responsible for the day-to-day management of the Fund remained the same immediately prior to and immediately after the date of these changes. LMPFA and Western Asset are wholly-owned subsidiaries of Legg Mason, Inc.
Effective September 1, 2006, the Fund’s benchmarks changed from the Lehman Brothers Government Bond Indexv and Citigroup Treasury/Mortgage Indexvi to the Lehman Brothers U.S. Fixed Rate Mortgage-Backed Securities (“MBS”) Indexvii. There was no change in the Fund’s investment objective or investment policies as a result of the benchmark change.
Certain changes regarding share class pricing and related matters were implemented on November 20, 2006. Please consult the Fund’s current prospectus for more information.
The Fund was formerly known as Smith Barney Government Securities Fund.
Information About Your Fund
As you may be aware, several issues in the mutual fund industry have come under the scrutiny of federal and state regulators. Affiliates of the Fund’s manager have, in recent years, received requests for information from various government regulators regarding market timing, late trading, fees, and other mutual fund issues in connection with various investigations. The regulators appear to be examining, among other things, the Fund’s response to market timing and shareholder exchange activity, including compliance with prospectus disclosure related to these subjects. The Fund is not in a position to predict the outcome of these requests and investigations.
II Legg Mason Partners Government Securities Fund
Important information with regard to recent regulatory developments that may affect the Fund is contained in the Notes to Financial Statements included in this report.
As always, thank you for your confidence in our stewardship of your assets. We look forward to helping you meet your financial goals.
Sincerely,

R. Jay Gerken, CFA
Chairman, President and Chief Executive Officer
January 31, 2007
All index performance reflects no deduction for fees, expenses or taxes. Please note that an investor cannot invest directly in an index.
i | | Gross domestic product is a market value of goods and services produced by labor and property in a given country. |
ii | | The federal funds rate is the interest rate that banks with excess reserves at a Federal Reserve district bank charge other banks that need overnight loans. |
iii | | The Federal Reserve Board is responsible for the formulation of a policy designed to promote economic growth, full employment, stable prices, and a sustainable pattern of international trade and payments. |
iv | | The Lehman Brothers U.S. Aggregate Index is a broad-based bond index comprised of government, corporate, mortgage and asset-backed issues, rated investment grade or higher, and having at least one year to maturity. |
v | | The Lehman Brothers Government Bond Index is a broad-based index of all public debt obligations of the U.S. government and its agencies that have an average maturity of roughly nine years. |
vi | | The Citigroup Treasury/Mortgage Index is a component of the Citigroup US Broad Investment-Grade (USBIG) Bond Index. It includes institutionally-traded fixed rate US Treasury securities and mortgages. Mortgages are comprised of 30- and 15-year GNMA, FNMA and FHLMC pass-throughs and FNMA and FHLMC balloon mortgages. |
vii | | Lehman Brothers U.S. Fixed-Rate Mortgage Backed Securities Index is an unmanaged index composed of securities backed by 15-year to 30-year fixed-rate mortgage pools of Government National Mortgage Association, Federal National Mortgage Association and Federal Home Loan Mortgage Corporation. |
Legg Mason Partners Government Securities Fund III
Fund Overview
Q. What were the overall market conditions during the Fund’s reporting period?
A. The economy weakened during the period due, in part, to the lagged effect of higher short-term interest rates and a rapidly cooling housing market. Inflationary pressures intensified during the first half of the reporting period. However, as oil prices retreated from their July record high and housing prices moderated, inflation became less of an issue. The Federal Reserve Board (“Fed”)i boosted its target federal funds rateii from 4.25% when the reporting period began to 5.25% in June 2006. The Fed then held rates steady during the remainder of the reporting period.
Turning to the bond market, the Treasury yield curveiii flattened in 2006, as the difference between short- and long-term yields narrowed. Throughout much of 2006, the Treasury yield curve was inverted, with two-year Treasury yields surpassing their 10-year counterparts. Historically, this anomaly has often been a precursor of slowing economic growth and, in many cases, a recessioniv.
Legg Mason Partners Government Securities Fund 2006 Annual Report 1
Performance Review
For the 12 months ended December 31, 2006, Class A shares of Legg Mason Partners Government Securities Fund, excluding sales charges, returned 3.98%. These shares outperformed the Lipper General U.S. Government Funds Category Average1, which returned 2.71%. The Fund’s unmanaged benchmark, the Lehman Brothers U.S. Fixed-Rate Mortgage-Backed Securities Indexv, returned 5.22% over the same time frame. The Citigroup Treasury/Mortgage Indexvi and the Lehman Brothers Government Bondvii Index returned 4.28%, and 3.48%, respectively, for the same period.
| | | | |
| Performance Snapshot as of December 31, 2006 (excluding sales charges) (unaudited) |
| | |
| | | 6 Months | | 12 Months |
Government Securities Fund — Class A Shares | | 5.29% | | 3.98% |
| |
Lehman Brothers U.S. Fixed-Rate Mortgage-Backed
Securities Index | | 5.28% | | 5.22% |
| |
Citigroup Treasury/Mortgage Index | | 4.92% | | 4.28% |
| |
Lehman Brothers Government Bond Index | | 4.41% | | 3.48% |
| |
Lipper General U.S. Government Funds Category Average | | 4.48% | | 2.74% |
| |
| The performance shown represents past performance. Past performance is no guarantee of future results and current performance may be higher or lower than the performance shown above. Principal value and investment returns will fluctuate and investors’ shares, when redeemed, may be worth more or less than their original cost. To obtain performance data current to the most recent month-end, please visit our website at www.leggmason.com/InvestorServices. |
| Excluding sales charges, Class 1 shares returned 5.44%, Class B shares returned 4.95%, Class C shares returned 5.13% and Class I (formerly Class Y) shares returned 5.49% over the six months ended December 31, 2006. Excluding sales charges, Class 1 shares returned 4.22%, Class B shares returned 3.32%, Class C shares returned 3.65% and Class I shares returned 4.39% over the twelve months ended December 31, 2006. All share class returns assume the reinvestment of all distributions, including returns of capital, if any, at net asset value and the deduction of all Fund expenses. Returns have not been adjusted to include sales charges that may apply when shares are purchased or the deduction of taxes that a shareholder would pay on Fund distributions. |
| Performance figures reflect reimbursements and/or fee waivers, without which the performance would have been lower. |
| Lipper, Inc. is a major independent mutual-fund tracking organization. Returns are based on the period ended December 31, 2006, including the reinvestment of all distributions, including returns of capital, if any, calculated among the 176 funds for the six-month period and among the 175 funds for the 12-month period in the Fund’s Lipper category and excluding sales charges. |
1 | | Lipper, Inc. is a major independent mutual-fund tracking organization. Returns are based on the 12-month period ended December 31, 2006, including the reinvestment of all distributions, including returns of capital, if any, calculated among the 175 funds in the Fund’s Lipper category, and excluding sales charges. |
2 Legg Mason Partners Government Securities Fund 2006 Annual Report
Q. What were the most significant factors affecting Fund performance?
What were the leading contributors to performance?
A. During the reporting period, a large overweight to mortgage pass-through securities issued by the Federal National Mortgage Association (Fannie Mae)viii enhanced results, as they outperformed the Fund’s benchmark. In addition, our emphasis on lower coupon securities had a positive impact on performance for the 12-month period ended December 31, 2006.
What were the leading detractors from performance?
A. We sought to diversify the Fund’s portfolio with a moderate allocation to agency and asset-backed securities. However, this detracted from results as they underperformed mortgages. In addition, a slightly long durationix position at the very front end of the yield curve was a drag on performance. Early in the year, the combination of strong economic growth and mounting inflationary pressures caused the Fed to raise short-term interest rates longer than expected. As a result, the yield curve inverted, with two-year Treasury yields surpassing their 10-year counterparts.
Q. Were there any significant changes to the Fund during the reporting period?
A. There were no significant changes during the period.
Thank you for your investment in Legg Mason Partners Government Securities Fund. As always, we appreciate that you have chosen us to manage your assets and we remain focused on achieving the Fund’s investment goals.
Sincerely,
Western Asset Management Company
January 20, 2007
Legg Mason Partners Government Securities Fund 2006 Annual Report 3
The information provided is not intended to be a forecast of future events, a guarantee of future results or investment advice. Views expressed may differ from those of the firm as a whole.
RISKS: Keep in mind, fixed-income securities are subject to interest rate, credit and market risks. As interest rates rise, bond prices fall, reducing the value of the Fund’s share price. The U.S. government guarantee of principal and interest payments only applies to underlying securities in the Fund’s portfolio, not the Fund’s shares. Please note that the Fund’s shares are not guaranteed by the U.S. government or its agencies. The Fund may use derivatives, such as options and futures, which can be illiquid, may disproportionately increase losses, and have a potentially large impact on Fund performance. Please see the Fund’s prospectus for more information on these and other risks.
| All | | index performance reflects no deduction for fees, expenses or taxes. Please note an investor cannot invest directly in an index. |
i | | The Federal Reserve Board is responsible for the formulation of a policy designed to promote economic growth, full employment, stable prices, and a sustainable pattern of international trade and payments. |
ii | | The federal funds rate is the interest rate that banks with excess reserves at a Federal Reserve district bank charge other banks that need overnight loans. |
iii | | The yield curve is the graphical depiction of the relationship between the yield on bonds of the same credit quality but different maturities. |
iv | | Source; The Wall Street Journal, 1/07 |
v | | The Lehman Brothers U.S. Fixed-Rate Mortgage-Backed Securities Index is composed of about 600 15-years to 30-year fixed rate mortgage-backed pools of Government National Mortgage Association, Federal National Mortgage Association and Federal Home Loan Corporation. |
vi | | The Citigroup Treasury/Mortgage Index is a component of the Citigroup US Broad Investment-Grade (USBIG) Bond Index. It includes institutionally-traded fixed rate U.S. Treasury securities and mortgages. Mortgages are comprised of 15 and 30-years GNMA, FNMA and FHLMC pass-throughs and FNMA and FHLMC balloon mortgages. |
vii | | The Lehman Brothers Government Bond Index is a broad-based index of all public debt obligations of the U.S government and its agencies that have an average maturity of roughly nine years. |
viii | | Federal National Mortgage Association obligations are securities consisting mostly of mortgages backed by the Federal Housing Administration. These obligations also include some mortgages that are not backed by the U.S government. |
ix | | Duration is a common gauge of the price sensitivity of a fixed income asset or portfolio to a change in interest rates. |
4 Legg Mason Partners Government Securities Fund 2006 Annual Report
Fund at a Glance (unaudited)

Legg Mason Partners Government Securities Fund 2006 Annual Report 5
Fund Expenses (unaudited)
Example
As a shareholder of the Fund, you may incur two types of costs: (1) transaction costs, including front-end and back-end sales charges (loads) on purchase payments; and (2) ongoing costs, including management fees; distribution and/or service (12b-1) fees; and other Fund expenses. This example is intended to help you understand your ongoing costs (in dollars) of investing in the Fund and to compare these costs with the ongoing costs of investing in other mutual funds.
This example is based on an investment of $1,000 invested on July 1, 2006 and held for the six months ended December 31, 2006.
Actual Expenses
The table below titled “Based on Actual Total Return” provides information about actual account values and actual expenses. You may use the information provided in this table, together with the amount you invested, to estimate the expenses that you paid over the period. To estimate the expenses you paid on your account, divide your ending account value by $1,000 (for example, an $8,600 ending account value divided by $1,000 = 8.6), then multiply the result by the number under the heading entitled “Expenses Paid During the Period”.
| | | | | | | | | | | | | | | |
| Based on Actual Total Return(1) | | | | | | | | | | | | | |
| | | | | |
| | | Actual Total
Return Without
Sales Charges(2) | | | Beginning
Account
Value | | Ending
Account
Value | | Annualized
Expense
Ratio(3) | | | Expenses
Paid During
the Period(4) |
Class 1 | | 5.44 | % | | $ | 1,000.00 | | $ | 1,054.40 | | 0.67 | % | | $ | 3.47 |
| |
Class A | | 5.29 | | | | 1,000.00 | | | 1,052.90 | | 0.95 | | | | 4.92 |
| |
Class B | | 4.95 | | | | 1,000.00 | | | 1,049.50 | | 1.60 | | | | 8.27 |
| |
Class C | | 5.13 | | | | 1,000.00 | | | 1,051.30 | | 1.26 | | | | 6.51 |
| |
Class I(5) | | 5.49 | | | | 1,000.00 | | | 1,054.90 | | 0.57 | | | | 2.95 |
| |
(1) | | For the six months ended December 31, 2006. |
(2) | | Assumes reinvestment of all distributions, including returns of capital, if any, at net asset value and does not reflect the deduction of the applicable sales charges with respect to Class 1 and A shares or the applicable contingent deferred sales charges (“CDSC”) with respect to Class B and C shares. Total return is not annualized, as it may not be representative of the total return for the year. Past performance is no guarantee of future results. |
(3) | | The expense ratios do not include the non-recurring restructuring and/or reorganization fees. |
(4) | | Expenses (net of fee waivers and/or expense reimbursements) are equal to each class’ respective annualized expense ratio multiplied by the average account value over the period, multiplied by the number of days in the most recent fiscal half-year, then divided by 365. |
(5) | | As of November 20, 2006, Class Y shares were renamed Class I Shares. |
6 Legg Mason Partners Government Securities Fund 2006 Annual Report
Fund Expenses (unaudited) (continued)
Hypothetical Example for Comparison Purposes
The table below titled “Based on Hypothetical Total Return” provides information about hypothetical account values and hypothetical expenses based on the actual expense ratio and an assumed rate of return of 5.00% per year before expenses, which is not the Fund’s actual return. The hypothetical account values and expenses may not be used to estimate the actual ending account balance or expenses you paid for the period. You may use the information provided in this table to compare the ongoing costs of investing in the Fund and other funds. To do so, compare the 5.00% hypothetical example relating to the Fund with the 5.00% hypothetical examples that appear in the shareholder reports of the other funds.
Please note that the expenses shown in the table below are meant to highlight your ongoing costs only and do not reflect any transactional costs, such as front-end or back-end sales charges (loads). Therefore, the table is useful in comparing ongoing costs only, and will not help you determine the relative total costs of owning different funds. In addition, if these transaction costs were included, your costs would have been higher.
| | | | | | | | | | | | | | | |
| Based on Hypothetical Total Return(1) |
| | | | | |
| | | Hypothetical
Annualized
Total Return | | | Beginning
Account
Value | | Ending
Account
Value | | Annualized
Expense
Ratio(2) | | | Expenses
Paid During
the Period(3) |
Class 1 | | 5.00 | % | | $ | 1,000.00 | | $ | 1,021.83 | | 0.67 | % | | $ | 3.41 |
| |
Class A | | 5.00 | | | | 1,000.00 | | | 1,020.42 | | 0.95 | | | | 4.84 |
| |
Class B | | 5.00 | | | | 1,000.00 | | | 1,017.14 | | 1.60 | | | | 8.13 |
| |
Class C | | 5.00 | | | | 1,000.00 | | | 1,018.85 | | 1.26 | | | | 6.41 |
| |
Class I(4) | | 5.00 | | | | 1,000.00 | | | 1,022.33 | | 0.57 | | | | 2.91 |
| |
(1) | | For the six months ended December 31, 2006. |
(2) | | The expense ratios do not include the non-recurring restructuring and/or reorganization fees. |
(3) | | Expenses (net of fee waivers and/or expense reimbursements) are equal to each class’ respective annualized expense ratio multiplied by the average account value over the period, multiplied by the number of days in the most recent fiscal half-year, then divided by 365. |
(4) | | As of November 20, 2006, Class Y shares were renamed Class I Shares. |
Legg Mason Partners Government Securities Fund 2006 Annual Report 7
Fund Performance
| | | | | | | | | | | | | | | |
| Average Annual Total Returns(1) (unaudited) | | | | | | | | | | | | | |
| |
| | | Without Sales Charges(2) | |
| | | Class 1 | | | Class A | | | Class B | | | Class C | | | Class I(3) | |
Twelve Months Ended 12/31/06 | | 4.22 | % | | 3.98 | % | | 3.32 | % | | 3.65 | % | | 4.39 | % |
| | |
Five Years Ended 12/31/06 | | 4.45 | | | 4.30 | | | 3.72 | | | 3.86 | | | 4.69 | |
| | |
Ten Years Ended 12/31/06 | | N/A | | | 5.22 | | | 4.67 | | | 4.76 | | | 5.61 | |
| | |
Inception* through 12/31/06 | | 5.32 | | | 5.54 | | | 6.55 | | | 4.79 | | | 5.36 | |
| | |
| |
| | | With Sales Charges(4) | |
| | | Class 1 | | | Class A(5) | | | Class B | | | Class C | | | Class I(3) | |
Twelve Months Ended 12/31/06 | | (2.86 | )% | | (0.42 | )% | | (1.14 | )% | | 2.65 | % | | 4.39 | % |
| | |
Five Years Ended 12/31/06 | | 3.00 | | | 3.40 | | | 3.55 | | | 3.86 | | | 4.69 | |
| | |
Ten Years Ended 12/31/06 | | N/A | | | 4.77 | | | 4.67 | | | 4.76 | | | 5.61 | |
| | |
Inception* through 12/31/06 | | 4.16 | | | 5.22 | | | 6.55 | | | 4.79 | | | 5.36 | |
| | |
| | | | | | | | | | | |
| Cumulative Total Returns(1) (unaudited) | | | | | | | | | | | |
| | | Without Sales Charges(2) |
Class 1 (Inception* through 12/31/06) | | | | | | 38.63 | % | | | | |
| |
Class A (12/31/96 through 12/31/06) | | | | | | 66.33 | | | | | |
| |
Class B (12/31/96 through 12/31/06) | | | | | | 57.83 | | | | | |
| |
Class C (12/31/96 through 12/31/06) | | | | | | 59.16 | | | | | |
| |
Class I(3) (12/31/96 through 12/31/06) | | | | | | 72.66 | | | | | |
| |
(1) | | All figures represent past performance and are not a guarantee of future results. Investment return and principal value of an investment will fluctuate so that an investor’s shares, when redeemed, may be worth more or less than their original cost. The returns shown do not reflect the deduction of taxes that a shareholder would pay on Fund distributions or the redemption of Fund shares. Performance figures may reflect fee waivers and/or expense reimbursements. In the absence of fee waivers and/or expense reimbursements, the total return would have been lower. |
(2) | | Assumes reinvestment of all distributions, including returns of capital, if any, at net asset value and does not reflect the deduction of the applicable sales charges with respect to Class 1 and A shares or the applicable CDSCs with respect to Class B and C shares. |
(3) | | As of November 20, 2006, Class Y shares were renamed Class I shares. |
(4) | | Assumes reinvestment of all distributions, including returns of capital, if any, at net asset value. In addition, Class 1 and A shares reflect the deduction of the maximum sales charges of 6.75% and 4.25%, respectively. Class B shares reflect the deduction of a 4.50% CDSC, which applies if shares are redeemed within one year from purchase payment. This CDSC declines by 0.50% the first year after purchase and thereafter by 1.00% per year until no CDSC is incurred. Class C shares reflect the deduction of a 1.00% CDSC, which applies if shares are redeemed within one year from purchase payment. |
(5) | | Class A shares maximum initial sales charge decreased from 4.50% to 4.25% on November 20, 2006. |
| * | | Inception dates for Class 1, A, B, C and I shares are September 12, 2000, November 6, 1992, March 20, 1984, February 4, 1993 and February 7, 1996, respectively. |
8 Legg Mason Partners Government Securities Fund 2006 Annual Report
Historical Performance (unaudited)
Value of $10,000 Invested in Class B Shares of the Legg Mason Partners Government Securities Fund vs. Lehman Brothers U.S. Fixed Rate Mortgage-Backed Securities Index, Citigroup Treasury/Mortgage Index, Lehman Brothers Government Bond Index and Lipper General U.S. Government Funds Category Average† (December 1996 — December 2006)
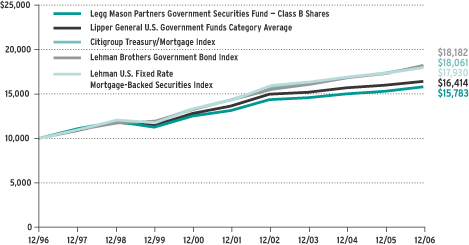
| † | | Hypothetical illustration of $10,000 invested in Class B shares of Legg Mason Partners Government Securities Fund on December 31, 1996, assuming reinvestment of all distributions, including returns of capital, if any, at net asset value through December 31, 2006. The Citigroup Treasury/Mortgage Index is a component of the Citigroup U.S. Broad Investment-Grade Bond Index. It includes institutionally-traded fixed rate U.S. Treasury securities and mortgages. The Lehman Brothers Government Bond Index is a broad-based index of all public debt obligations of the U.S. Government and its agencies and has an average maturity of approximately nine years. The Lehman Brothers U.S. Fixed Rate Mortgage-Backed Securities Index is composed of about 600 15-years to 30-years fixed rate mortgage-backed pools of Government National Mortgage Association, Federal National Mortgage Association and Federal Home Loan Corporation. The Lipper General U.S. Government Funds Category Average is composed of the Fund’s peer group of 175 mutual funds investing in U.S. Government securities as of December 31, 2006. The Index is unmanaged and is not subject to the same management and trading expenses as a mutual fund. Please note that an investor cannot invest directly in an index. The performance of the Fund’s other classes may be greater or less than the Class B shares’ performance indicated on this chart, depending on whether higher or lower sales charges and fees were incurred by shareholders investing in other classes. The returns shown do not reflect the deduction of taxes that a shareholder would pay on fund distributions or the redemption of Fund shares. |
All figures represent past performance and are not a guarantee of future results. Investment return and principal value of an investment will fluctuate so that an investor’s shares, when redeemed, may be worth more or less than their original cost. The returns shown do not reflect the deduction of taxes that a shareholder would pay on Fund distributions or the redemption of Fund shares. Performance figures may reflect fee waivers and/or expense reimbursements. In the absence of fee waivers and/or expense reimbursements, the total return would have been lower.
Legg Mason Partners Government Securities Fund 2006 Annual Report 9
Schedule of Investments (December 31, 2006)
LEGG MASON PARTNERS GOVERNMENT SECURITIES FUND
| | | | | | | |
| | |
Face
Amount | | Security | | Value | |
| | MORTGAGE-BACKED SECURITIES — 98.2% | | | | |
| | FHLMC — 4.8% | | | | |
| | | Federal Home Loan Mortgage Corp. (FHLMC): | | | | |
| $ | 4,051,335 | | 6.710% due 4/1/32 (a) | | $ | 4,114,556 | |
| | 8,166,222 | | 5.424% due 4/1/34 (a) | | | 8,281,707 | |
| | | Gold: | | | | |
| | 72,868 | | 6.500% due 1/1/16-6/1/31 | | | 74,610 | |
| | 2,351,903 | | 6.000% due 6/1/16-1/1/32 | | | 2,393,932 | |
| | 3,358,057 | | 7.000% due 6/1/16-7/1/32 | | | 3,452,833 | |
| | 9,356,021 | | 5.000% due 9/1/28-9/1/33 | | | 9,050,553 | |
| | | |
| | | TOTAL FHLMC | | | 27,368,191 | |
| | | |
| | FNMA — 73.5% | | | | |
| | | Federal National Mortgage Association (FNMA): | | | | |
| | 1,058,151 | | 5.500% due 5/1/16-12/1/16 | | | 1,061,519 | |
| | 14,012,632 | | 5.000% due 2/1/18-12/1/20 (b) | | | 13,789,310 | |
| | 125,400,000 | | 5.000% due 1/17/22-1/11/37 (c)(d) | | | 121,309,875 | |
| | 40,000,000 | | 5.500% due 1/17/22 (c)(d) | | | 40,000,000 | |
| | 2,201,978 | | 7.500% due 8/1/28-4/1/32 | | | 2,293,457 | |
| | 1,301,992 | | 7.000% due 8/1/29-5/1/32 | | | 1,340,292 | |
| | 1,083,600 | | 6.500% due 4/1/31-7/1/32 | | | 1,109,079 | |
| | 668,066 | | 6.000% due 1/1/32-7/1/32 | | | 674,616 | |
| | 111,030,638 | | 6.000% due 8/1/34-9/1/36 (b) | | | 111,823,359 | |
| | 12,553,980 | | 6.500% due 2/1/36 (b) | | | 12,794,598 | |
| | 112,590,794 | | 5.500% due 4/1/36 (b) | | | 111,340,017 | |
| | 1,000,000 | | 5.000% due 2/12/37 (c) | | | 965,625 | |
| | | |
| | | TOTAL FNMA | | | 418,501,747 | |
| | | |
| | GNMA — 19.9% | | | | |
| | | Government National Mortgage Association (GNMA): | | | | |
| | 2,373,408 | | 7.000% due 2/15/28-11/15/31 | | | 2,453,956 | |
| | 279,364 | | 7.500% due 4/15/29-9/15/31 | | | 291,660 | |
| | 89,796,764 | | 6.500% due 10/15/31-9/20/36 | | | 91,828,880 | |
| | 11,601,261 | | 5.000% due 8/15/33-9/15/33 | | | 11,300,220 | |
| | 7,490,000 | | 5.000% due 1/22/37 (c) | | | 7,284,025 | |
| | | |
| | | TOTAL GNMA | | | 113,158,741 | |
| | | |
| | | TOTAL MORTGAGE-BACKED SECURITIES
(Cost — $555,652,247) | | | 559,028,679 | |
| | | |
| | ASSET-BACKED SECURITIES — 9.3% | | | | |
| | Credit Card — 0.6% | | | | |
| | 3,332,704 | | Compucredit Acquired Portfolio Voltage Master Trust, Series 2006-1A, Class A1, 5.520% due 9/15/18 (a)(e) | | | 3,344,035 | |
| | | |
See Notes to Financial Statements.
10 Legg Mason Partners Government Securities Fund 2006 Annual Report
Schedule of Investments (December 31, 2006) (continued)
| | | | | | | |
| | |
Face
Amount | | Security | | Value | |
| | Home Equity — 8.7% | | | | |
| $ | 298,800 | | Aames Mortgage Investment Trust, Series 2005-03, Class A1,
5.500% due 8/25/35 (a)(e) | | $ | 298,893 | |
| | | ACE Securities Corp.: | | | | |
| | 1,451,111 | | Series 2004-OP1, Class M1, 5.870% due 4/25/34 (a) | | | 1,452,040 | |
| | 924,849 | | Series 2005-SD3, Class A, 5.750% due 8/25/45 (a) | | | 926,371 | |
| | 3,548,722 | | Series 2006-SD1, Class A1B, 5.700% due 2/25/36 (a) | | | 3,555,407 | |
| | 3,178,589 | | Ameriquest Mortgage Securities Inc., Series 2004-R7, Class A6,
5.720% due 8/25/34 (a) | | | 3,186,978 | |
| | 867,005 | | Argent Securities Inc., Series 2006-W4, Class A2A, 5.410% due 5/25/36 (a) | | | 867,600 | |
| | 3,657,529 | | Asset Backed Funding Certificates, Series 2005-WF1, Class A2B,
5.530% due 1/25/35 (a) | | | 3,663,025 | |
| | 150,000 | | Bear Stearns Asset Backed Securities, Series 2004-B01, Class 1A2,
5.700% due 9/25/34 (a) | | | 151,023 | |
| | 832,884 | | Countrywide Asset-Backed Certificates, Series 2005-17, Class-1AF1,
5.550% due 12/25/36 (a) | | | 833,827 | |
| | | Countrywide Home Equity Loan Trust: | | | | |
| | 1,443,247 | | Series 2004-I, Class A, 5.640% due 2/15/34 (a) | | | 1,448,026 | |
| | 4,385,976 | | Series 2004-R, Class 2A, 5.600% due 3/15/30 (a) | | | 4,406,022 | |
| | 1,534,045 | | Series 2006-D, Class 2A, 5.550% due 5/15/34 (a) | | | 1,535,102 | |
| | 2,155,213 | | Series 2006-RES, Class 4F1B, 5.610% due 5/15/34 (a)(e) | | | 2,156,630 | |
| | 3,891,269 | | EMC Mortgage Loan Trust, Series 2006-A, Class A1, 5.800% due 12/25/42 (a)(e) | | | 3,891,250 | |
| | 400,286 | | GSAMP Trust, Series 2003-SEA, Class A1, 5.750% due 2/25/33 (a) | | | 402,717 | |
| | 2,615,700 | | Indymac Home Equity Loan Asset-Backed Trust, Series 2004-C, Class 1A1, 5.660% due 3/25/35 (a) | | | 2,621,114 | |
| | 520,714 | | Lehman XS Trust, Series 2006-GP2, Class 1A1A, 5.420% due 6/25/46 (a) | | | 520,713 | |
| | 100,000 | | New Century Home Equity Loan Trust, Series 2003-B, Class M2,
7.000% due 9/25/33 (a) | | | 101,232 | |
| | | RAAC: | | | | |
| | 318,604 | | Series 2006-RP2, Class A, 5.600% due 2/25/37 (a)(e) | | | 318,608 | |
| | 4,949,346 | | Series 2006-RP3, Class A, 5.620% due 5/25/36 (a)(e) | | | 4,949,346 | |
| | | SACO I Trust: | | | | |
| | 1,846,082 | | Series 2006-4, Class A1, 5.520% due 3/25/36 (a) | | | 1,847,469 | |
| | 2,769,625 | | Series 2006-6, Class A, 5.450% due 6/25/36 (a) | | | 2,771,398 | |
| | 159,730 | | Series 2006-7, Class A1, 5.450% due 7/25/36 (a) | | | 159,832 | |
| | 1,634,584 | | Structured Asset Securities Corp., Series 2006-ARS1, Class A1,
5.460% due 2/25/36 (a)(e) | | | 1,635,120 | |
| | | Truman Capital Mortgage Loan Trust: | | | | |
| | 622,347 | | Series 2005-1, Class A, 5.780% due 3/25/37 (a)(e) | | | 622,347 | |
| | 5,094,677 | | Series 2006-01, Class A, 5.610% due 3/25/36 (a)(e) | | | 5,094,677 | |
| | | |
| | | Total Home Equity | | | 49,416,767 | |
| | | |
| | | TOTAL ASSET-BACKED SECURITIES
(Cost — $52,725,006) | | | 52,760,802 | |
| | | |
| | COLLATERALIZED MORTGAGE OBLIGATIONS — 15.5% | | | | |
| | 12,774,713 | | Adjustable Rate Mortgage Trust, Whole Loan, Series 2005-3, Class 7A1,
5.078% due 7/25/35 (a) | | | 12,705,602 | |
See Notes to Financial Statements.
Legg Mason Partners Government Securities Fund 2006 Annual Report 11
Schedule of Investments (December 31, 2006) (continued)
| | | | | | |
| | |
Face
Amount | | Security | | Value |
| | COLLATERALIZED MORTGAGE OBLIGATIONS — 15.5% (continued) | | | |
| $ | 5,145,637 | | Banc of America Funding Corp., Series 2005-H, Class 1A1,
5.057% due 11/20/35 (a) | | $ | 5,152,265 |
| | 1,213,028 | | Bear Stearns Alternate-A Trust, Series 2004-10, Class 1A1,
5.690% due 9/25/34 (a) | | | 1,214,779 |
| | 1,874,677 | | CBA Commercial Small Balance Commercial Mortgage, Series 2006-1A, Class A, 5.600% due 6/25/38 (a)(e) | | | 1,874,677 |
| | | Countrywide Alternative Loan Trust: | | | |
| | 695,653 | | Series 2005-17, Class 1A1, 5.610% due 7/25/35 (a) | | | 697,817 |
| | 4,611,112 | | Series 2005-24, Class 4A1, 5.580% due 7/20/35 (a) | | | 4,624,806 |
| | 1,195,954 | | Series 2005-44, Class 1A1, 5.680% due 10/25/35 (a) | | | 1,198,695 |
| | 243,689 | | Series 2005-59, Class 1A1, 5.650% due 11/20/35 (a) | | | 244,648 |
| | 205,782 | | Series 2005-72, Class A1, 5.620% due 1/25/36 (a) | | | 206,130 |
| | 1,615,662 | | Series 2005-IM1, Class A1, 5.650% due 11/25/36 (a) | | | 1,623,285 |
| | 1,788,908 | | Countrywide Home Loan, Series 2005-R3, Class AF, 5.720% due 9/25/35 (a)(e) | | | 1,799,743 |
| | 1,270,560 | | CS First Boston Mortgage Securities Corp., Whole Loan, Series 2002-10,
Class 2A1, 7.500% due 5/25/32 | | | 1,283,569 |
| | | Federal National Mortgage Association (FNMA), Whole Loan, Series 2003-W12: | | | |
| | 6,816,883 | | Class 1A6, 4.500% due 6/25/43 (b) | | | 6,769,189 |
| | 7,727,185 | | Class 2A4, 3.350% due 6/25/43 (b) | | | 7,617,600 |
| | 2,022,307 | | GSAMP Trust, Series 2004-AR1, Class A2B, 5.950% due 6/25/34 (a) | | | 2,023,605 |
| | 3,523,000 | | GSMPS Mortgage Loan Trust, Series 2005-RP1, Class 1AF,
5.700% due 1/25/35 (a)(e) | | | 3,539,530 |
| | 971,646 | | IMPAC CMB Trust, Series 2004-6, Class 1A2, 5.740% due 10/25/34 (a) | | | 973,670 |
| | 77,639 | | IMPAC Secured Assets Corp., Series 2005-2, Class A1, 5.670% due 3/25/36 (a) | | | 77,814 |
| | 1,590,724 | | Indymac Index Mortgage Loan Trust, Series 2005-AR1, Class 1A1,
5.263% due 3/25/35 (a) | | | 1,603,715 |
| | 1,427,621 | | Lehman XS Trust, Series 2005-5N, Class 3A1A, 5.650% due 11/25/35 (a) | | | 1,429,767 |
| | 2,142,050 | | Long Beach Mortgage Loan Trust, Series 2001-03, Class M1,
6.175% due 9/25/31 (a) | | | 2,170,822 |
| | 320,044 | | MASTR Adjustable Rate Mortgage Trust, Series 2006-OA1, Class 1A1,
5.560% due 4/25/46 (a) | | | 320,266 |
| | | Morgan Stanley Mortgage Loan Trust: | | | |
| | 1,243,547 | | Series 2004-6AR, Class 2A1, 4.074% due 8/25/34 (a) | | | 1,241,893 |
| | 1,403,416 | | Series 2006-4SL, Class A1, 5.500% due 3/25/36 (a) | | | 1,404,676 |
| | 500,922 | | Novastar Mortgage-Backed Notes, Series 2006-MTA1, Class 2A1A,
5.540% due 9/25/46 (a) | | | 501,443 |
| | 422,538 | | Opteum Mortgage Acceptance Corp., Series 2005-04, Class 1A1A,
5.520% due 11/25/35 (a) | | | 422,937 |
| | 1,743,602 | | Prime Mortgage Trust, Series 2006-CL1, Class A1, 5.820% due 2/25/35 (a) | | | 1,748,895 |
| | 776,810 | | Residential Asset Mortgage Products Inc., Series 2003-RP2, Class A1,
5.774% due 7/25/41 | | | 778,752 |
| | | Structured Adjustable Rate Mortgage Loan Trust: | | | |
| | 5,014,728 | | Series 2004-10, Class 3A2, 5.343% due 8/25/34 (a) | | | 5,002,564 |
| | 937,007 | | Series 2005-5, Class A3, 5.580% due 5/25/35 (a) | | | 938,429 |
| | 553,806 | | Structured Asset Mortgage Investments Inc., Series 2006-AR6, Class 1A3,
5.510% due 7/25/36 (a) | | | 555,218 |
See Notes to Financial Statements.
12 Legg Mason Partners Government Securities Fund 2006 Annual Report
Schedule of Investments (December 31, 2006) (continued)
| | | | | | | |
| | |
Face
Amount | | Security | | Value | |
| | COLLATERALIZED MORTGAGE OBLIGATIONS — 15.5% (continued) | | | | |
| $ | 2,383,462 | | Thornburg Mortgage Securities Trust, Series 2006-3, Class A3,
5.430% due 6/25/36 (a) | | $ | 2,379,812 | |
| | | Washington Mutual Inc.: | | | | |
| | 3,961,439 | | Series 2005-AR11, Class A1A, 5.670% due 8/25/45 (a) | | | 3,974,705 | |
| | 326,670 | | Series 2005-AR13, Class A1A1, 5.640% due 10/25/45 (a) | | | 327,314 | |
| | 1,947,672 | | Series 2005-AR17, Class A1A1, 5.590% due 12/25/45 (a) | | | 1,954,481 | |
| | 2,773,829 | | Series 2006-AR11, Class 2A, 5.846% due 9/25/46 (a) | | | 2,781,955 | |
| | 3,175,454 | | Washington Mutual Mortgage Pass-Through Certificates, Whole Loan,
Series 2003-AR5, Class A7, 4.208% due 6/25/33 (a) | | | 3,145,738 | |
| | 1,746,502 | | Zuni Mortgage Loan Trust, Series 2006-OA1, Class A1,
5.450% due 8/25/36 (a) | | | 1,745,418 | |
| | | |
| | | TOTAL COLLATERALIZED MORTGAGE OBLIGATIONS
(Cost — $88,344,964) | | | 88,056,224 | |
| | | |
| | U.S. GOVERNMENT OBLIGATIONS — 0.2% | | | | |
| | 1,000,000 | | U.S. Treasury Notes, 4.125% due 8/15/10 (Cost — $978,008) | | | 981,329 | |
| | | |
| | | TOTAL INVESTMENTS BEFORE SHORT-TERM INVESTMENTS
(Cost — $697,700,225) | | | 700,827,034 | |
| | | |
| | SHORT-TERM INVESTMENTS — 6.6% | | | | |
| | U.S. Government Obligations — 2.9% | | | | |
| | 16,520,000 | | U.S. Treasury Bills, 5.109% due 4/19/07 (f)(g) (Cost — $16,272,943) | | | 16,283,351 | |
| | | |
| | Repurchase Agreement — 3.7% | | | | |
| | 21,254,000 | | Nomura Securities International Inc. repurchase agreement dated 12/29/06, 5.270% due 1/2/07; Proceeds at maturity — $21,266,445; (Fully collateralized by various U.S. government & agency obligations, 0.000% to 6.000% due 1/18/07 to 3/15/16; Market value — $21,679,859)
(Cost — $21,254,000) (b) | | | 21,254,000 | |
| | | |
| | | TOTAL SHORT-TERM INVESTMENTS
(Cost — $37,526,943) | | | 37,537,351 | |
| | | |
| | | TOTAL INVESTMENTS — 129.8% (Cost — $735,227,168#) | | | 738,364,385 | |
| | | Liabilities in Excess of Other Assets — (29.8)% | | | (169,349,158 | ) |
| | | |
| | | TOTAL NET ASSETS — 100.0% | | $ | 569,015,227 | |
| | | |
(a) | | Variable rate security. Interest rate disclosed is that which is in effect at December 31, 2006. |
(b) | | All or a portion of this security is segregated for open futures contracts and TBA's and mortgage dollar rolls. |
(c) | | This security is traded on a to-be-announced ("TBA") basis (See Note 1). |
(d) | | All or a portion of this security was acquired under a mortgage dollar roll agreement (See Notes 1 and 3). |
(e) | | Security is exempt from registration under Rule 144A of the Securities Act of 1933. This security may be resold in transactions that are exempt from registration, normally to qualified institutional buyers. This security has been deemed liquid pursuant to guidelines approved by the Board of Directors, unless otherwise noted. |
(f) | | All or a portion of this security is held at the broker as collateral for open futures contracts. |
(g) | | Rate shown represents yield-to-maturity. |
| # | | Aggregate cost for federal income tax purposes is $735,247,092 |
| | |
Abbreviation used in this schedule: |
| MASTR | | — Mortgage Asset Securitization Transactions Inc. |
See Notes to Financial Statements.
Legg Mason Partners Government Securities Fund 2006 Annual Report 13
Statement of Assets and Liabilities (December 31, 2006)
| | | | |
| ASSETS: | | | | |
Investments, at value (Cost — $735,227,168) | | $ | 738,364,385 | |
Cash | | | 144 | |
Interest receivable | | | 2,323,315 | |
Receivable for Fund shares sold | | | 881,065 | |
Principal paydown receivable | | | 432,449 | |
Receivable due from manager | | | 4,117 | |
Prepaid expenses | | | 39,746 | |
| | |
Total Assets | | | 742,045,221 | |
| | |
| LIABILITIES: | | | | |
Payable for securities purchased | | | 171,305,146 | |
Payable for Fund shares repurchased | | | 931,103 | |
Investment management fee payable | | | 267,556 | |
Distributions payable | | | 163,584 | |
Distribution fees payable | | | 38,254 | |
Payable to broker — variation margin on open futures contracts | | | 31,651 | |
Directors' fees payable | | | 11,588 | |
Accrued expenses | | | 281,112 | |
| | |
Total Liabilities | | | 173,029,994 | |
| | |
Total Net Assets | | $ | 569,015,227 | |
| | |
| NET ASSETS: | | | | |
Par value (Note 6) | | $ | 58,858 | |
Paid-in capital in excess of par value | | | 649,227,543 | |
Undistributed net investment income | | | 362,685 | |
Accumulated net realized loss on investments, futures contracts and options written | | | (83,378,664 | ) |
Net unrealized appreciation on investments and futures contracts | | | 2,744,805 | |
| | |
Total Net Assets | | $ | 569,015,227 | |
| | |
Shares Outstanding: | | | | |
Class 1 | | | 7,625,640 | |
| |
Class A | | | 32,324,224 | |
| |
Class B | | | 7,422,119 | |
| |
Class C | | | 1,085,003 | |
| |
Class I(1) | | | 10,401,018 | |
| |
Net Asset Value: | | | | |
Class 1 (and redemption price) | | | $9.67 | |
| |
Class A (and redemption price) | | | $9.66 | |
| |
Class B(2) | | | $9.67 | |
| |
Class C(2) | | | $9.67 | |
| |
Class I(1) (and redemption price) | | | $9.68 | |
| |
Maximum Public Offering Price Per Share: | | | | |
Class 1 (based on maximum sales charge of 6.75%) | | | $10.37 | |
| |
Class A (based on maximum sales charge of 4.25%)(3) | | | $10.09 | |
| | |
(1) | | As of November 20, 2006, Class Y shares were renamed Class I shares. |
(2) | | Redemption price is NAV of Class B and C shares reduced by a 4.50% and 1.00% CDSC, respectively, if shares are redeemed within one year from purchase payment (See Note 2). |
(3) | | Class A shares maximum initial sales charge decreased from 4.50% to 4.25% on November 20, 2006. |
See Notes to Financial Statements.
14 Legg Mason Partners Government Securities Fund 2006 Annual Report
Statement of Operations (For the year ended December 31, 2006)
| | | | |
| INVESTMENT INCOME: | | | | |
Interest | | $ | 30,539,808 | |
| | |
| EXPENSES: | | | | |
Investment management fee (Note 2) | | | 3,248,951 | |
Distribution fees (Notes 2 and 4) | | | 1,481,075 | |
Transfer agent fees (Note 4) | | | 741,907 | |
Reorganization and restructuring fees (Note 11) | | | 117,864 | |
Registration fees | | | 65,570 | |
Shareholder reports (Note 4) | | | 63,506 | |
Audit and tax | | | 31,154 | |
Directors' fees (Note 11) | | | 23,903 | |
Insurance | | | 15,237 | |
Legal fees | | | 12,098 | |
Custody fees | | | 5,356 | |
Miscellaneous expenses | | | 8,835 | |
| | |
Total Expenses | | | 5,815,456 | |
Less: Fee waivers and/or expense reimbursements (Notes 2, 8 and 11) | | | (31,493 | ) |
| | |
Net Expenses | | | 5,783,963 | |
| | |
Net Investment Income | | | 24,755,845 | |
| | |
REALIZED AND UNREALIZED GAIN (LOSS) ON INVESTMENTS,
FUTURES CONTRACTS AND OPTIONS WRITTEN (NOTES 1 AND 3): | | | | |
Net Realized Gain (Loss) From: | | | | |
Investment transactions | | | (11,370,460 | ) |
Futures contracts | | | 3,893,635 | |
Options written | | | 94,349 | |
| | |
Net Realized Loss | | | (7,382,476 | ) |
| | |
Change in Net Unrealized Appreciation/Depreciation From: | | | | |
Investments | | | 5,391,783 | |
Futures contracts | | | (452,730 | ) |
| | |
Change in Net Unrealized Appreciation/Depreciation | | | 4,939,053 | |
| | |
Net Loss on Investments, Futures Contracts and Options Written | | | (2,443,423 | ) |
| | |
Increase in Net Assets From Operations | | $ | 22,312,422 | |
| | |
See Notes to Financial Statements.
Legg Mason Partners Government Securities Fund 2006 Annual Report 15
Statements of Changes in Net Assets (For the years ended December 31,)
| | | | | | | | |
| | |
| | | 2006 | | | 2005 | |
| OPERATIONS: | | | | | | | | |
Net investment income | | $ | 24,755,845 | | | $ | 25,495,482 | |
Net realized loss | | | (7,382,476 | ) | | | (2,187,438 | ) |
Change in net unrealized appreciation/depreciation | | | 4,939,053 | | | | (6,324,098 | ) |
| | |
Increase in Net Assets From Operations | | | 22,312,422 | | | | 16,983,946 | |
| | |
| DISTRIBUTIONS TO SHAREHOLDERS FROM (NOTES 1 AND 5): | | | | | | | | |
Net investment income | | | (27,352,651 | ) | | | (25,695,305 | ) |
| | |
Decrease in Net Assets From
Distributions to Shareholders | | | (27,352,651 | ) | | | (25,695,305 | ) |
| | |
| FUND SHARE TRANSACTIONS (NOTE 6): | | | | | | | | |
Net proceeds from sale of shares | | | 62,901,731 | | | | 79,021,214 | |
Reinvestment of distributions | | | 24,093,318 | | | | 20,639,254 | |
Cost of shares repurchased | | | (143,157,472 | ) | | | (254,727,182 | ) |
| | |
Decrease in Net Assets From Fund Share Transactions | | | (56,162,423 | ) | | | (155,066,714 | ) |
| | |
Decrease in Net Assets | | | (61,202,652 | ) | | | (163,778,073 | ) |
| NET ASSETS: | | | | | | | | |
Beginning of year | | | 630,217,879 | | | | 793,995,952 | |
| | |
End of year* | | $ | 569,015,227 | | | $ | 630,217,879 | |
| | |
* Includes undistributed net investment income of: | | | $362,685 | | | | $985,662 | |
| | |
See Notes to Financial Statements.
16 Legg Mason Partners Government Securities Fund 2006 Annual Report
Financial Highlights
For a share of each class of capital stock outstanding throughout each year ended December 31:
| | | | | | | | | | | | | | | | | | | | |
| | | | | |
| Class 1 Shares(1) | | 2006 | | | 2005 | | | 2004 | | | 2003 | | | 2002 | |
Net Asset Value, Beginning of Year | | $ | 9.74 | | | $ | 9.87 | | | $ | 9.89 | | | $ | 10.08 | | | $ | 9.53 | |
| | |
Income (Loss) From Operations: | | | | | | | | | | | | | | | | | | | | |
Net investment income | | | 0.42 | | | | 0.37 | | | | 0.34 | | | | 0.33 | | | | 0.39 | |
Net realized and unrealized gain (loss) | | | (0.02 | ) | | | (0.13 | ) | | | 0.02 | | | | (0.14 | ) | | | 0.54 | |
| | |
Total Income From Operations | | | 0.40 | | | | 0.24 | | | | 0.36 | | | | 0.19 | | | | 0.93 | |
| | |
Less Distributions From: | | | | | | | | | | | | | | | | | | | | |
Net investment income | | | (0.47 | ) | | | (0.37 | ) | | | (0.38 | ) | | | (0.38 | ) | | | (0.38 | ) |
Return of capital | | | — | | | | — | | | | (0.00 | )(2) | | | — | | | | — | |
| | |
Total Distributions | | | (0.47 | ) | | | (0.37 | ) | | | (0.38 | ) | | | (0.38 | ) | | | (0.38 | ) |
| | |
Net Asset Value, End of Year | | $ | 9.67 | | | $ | 9.74 | | | $ | 9.87 | | | $ | 9.89 | | | $ | 10.08 | |
| | |
Total Return(3) | | | 4.22 | % | | | 2.50 | % | | | 3.76 | % | | | 1.95 | % | | | 10.00 | % |
| | |
Net Assets, End of Year (millions) | | | $74 | | | | $84 | | | | $96 | | | | $108 | | | | $120 | |
| | |
Ratios to Average Net Assets: | | | | | | | | | | | | | | | | | | | | |
Gross expenses | | | 0.77 | %† | | | 0.87 | % | | | 0.84 | % | | | 0.81 | % | | | 0.85 | % |
Net expenses | | | 0.76 | (4)† | | | 0.87 | | | | 0.82 | (4) | | | 0.81 | | | | 0.85 | |
Net investment income | | | 4.41 | | | | 3.73 | | | | 3.45 | | | | 3.34 | | | | 4.01 | |
| | |
Portfolio Turnover Rate | | | 266 | %(5) | | | 141 | %(5) | | | 138 | %(5) | | | 148 | %(5) | | | 280 | % |
| | |
(1) | | Per share amounts have been calculated using the average shares method. |
(2) | | Amount represents less than $0.01 per share. |
(3) | | Performance figures may reflect fee waivers and/or expense reimbursements. Past performance is no guarantee of future results. In the absence of fee waivers and/or expense reimbursements, the total return would have been lower. |
(4) | | Reflects fee waivers and/or expense reimbursements. |
(5) | | Excluding mortgage dollar roll transactions. If mortgage dollar roll transactions had been included, the portfolio turnover rate would have been 615%, 315%, 292% and 328% for the years ended December 31, 2006, 2005, 2004 and 2003, respectively. |
| † | | Included in the expense ratios are certain non–recurring restructuring (and reorganization if applicable) fees that were incurred by the Fund during the period. Without these fees, the gross and net expense ratios would have been 0.75% and 0.74%, respectively (Note 11). |
See Notes to Financial Statements.
Legg Mason Partners Government Securities Fund 2006 Annual Report 17
Financial Highlights (continued)
For a share of each class of capital stock outstanding throughout each year ended December 31:
| | | | | | | | | | | | | | | | | | | | |
| | | | | |
| Class A Shares(1) | | 2006 | | | 2005 | | | 2004 | | | 2003 | | | 2002 | |
Net Asset Value, Beginning of Year | | $ | 9.73 | | | $ | 9.86 | | | $ | 9.88 | | | $ | 10.07 | | | $ | 9.52 | |
| | |
Income (Loss) From Operations: | | | | | | | | | | | | | | | | | | | | |
Net investment income | | | 0.40 | | | | 0.35 | | | | 0.33 | | | | 0.32 | | | | 0.38 | |
Net realized and unrealized gain (loss) | | | (0.03 | ) | | | (0.12 | ) | | | 0.02 | | | | (0.14 | ) | | | 0.54 | |
| | |
Total Income From Operations | | | 0.37 | | | | 0.23 | | | | 0.35 | | | | 0.18 | | | | 0.92 | |
| | |
Less Distributions From: | | | | | | | | | | | | | | | | | | | | |
Net investment income | | | (0.44 | ) | | | (0.36 | ) | | | (0.37 | ) | | | (0.37 | ) | | | (0.37 | ) |
Return of capital | | | — | | | | — | | | | (0.00 | )(2) | | | — | | | | — | |
| | |
Total Distributions | | | (0.44 | ) | | | (0.36 | ) | | | (0.37 | ) | | | (0.37 | ) | | | (0.37 | ) |
| | |
Net Asset Value, End of Year | | $ | 9.66 | | | $ | 9.73 | | | $ | 9.86 | | | $ | 9.88 | | | $ | 10.07 | |
| | |
Total Return(3) | | | 3.98 | % | | | 2.36 | % | | | 3.63 | % | | | 1.83 | % | | | 9.88 | % |
| | |
Net Assets, End of Year (millions) | | | $312 | | | | $339 | | | | $358 | | | | $378 | | | | $395 | |
| | |
Ratios to Average Net Assets: | | | | | | | | | | | | | | | | | | | | |
Gross expenses | | | 0.99 | %† | | | 1.00 | % | | | 0.98 | % | | | 0.95 | % | | | 0.91 | % |
Net expenses | | | 0.98 | (4)† | | | 1.00 | | | | 0.97 | (4) | | | 0.95 | | | | 0.91 | |
Net investment income | | | 4.19 | | | | 3.60 | | | | 3.30 | | | | 3.19 | | | | 3.91 | |
| | |
Portfolio Turnover Rate | | | 266 | %(5) | | | 141 | %(5) | | | 138 | %(5) | | | 148 | %(5) | | | 280 | % |
| | |
(1) | | Per share amounts have been calculated using the average shares method. |
(2) | | Amount represents less than $0.01 per share. |
(3) | | Performance figures may reflect fee waivers and/or expense reimbursements. Past performance is no guarantee of future results. In the absence of fee waivers and/or expense reimbursements, the total return would have been lower. |
(4) | | Reflects fee waivers and/or expense reimbursements. |
(5) | | Excluding mortgage dollar roll transactions. If mortgage dollar roll transactions had been included, the portfolio turnover rate would have been 615%, 315%, 292% and 328% for the years ended December 31, 2006, 2005, 2004 and 2003, respectively. |
| † | | Included in the expense ratios are certain non–recurring restructuring (and reorganization if applicable) that were incurred by the Fund during the period. Without these fees, the gross and net expense ratios would have been 0.97% and 0.96%, respectively (Note 11). |
See Notes to Financial Statements.
18 Legg Mason Partners Government Securities Fund 2006 Annual Report
Financial Highlights (continued)
For a share of each class of capital stock outstanding throughout each year ended December 31:
| | | | | | | | | | | | | | | | | | | | |
| | | | | |
| Class B Shares(1) | | 2006 | | | 2005 | | | 2004 | | | 2003 | | | 2002 | |
Net Asset Value, Beginning of Year | | $ | 9.74 | | | $ | 9.87 | | | $ | 9.89 | | | $ | 10.08 | | | $ | 9.53 | |
| | |
Income (Loss) From Operations: | | | | | | | | | | | | | | | | | | | | |
Net investment income | | | 0.34 | | | | 0.30 | | | | 0.27 | | | | 0.27 | | | | 0.33 | |
Net realized and unrealized gain (loss) | | | (0.03 | ) | | | (0.12 | ) | | | 0.03 | | | | (0.14 | ) | | | 0.54 | |
| | |
Total Income From Operations | | | 0.31 | | | | 0.18 | | | | 0.30 | | | | 0.13 | | | | 0.87 | |
| | |
Less Distributions From: | | | | | | | | | | | | | | | | | | | | |
Net investment income | | | (0.38 | ) | | | (0.31 | ) | | | (0.32 | ) | | | (0.32 | ) | | | (0.32 | ) |
Return of capital | | | — | | | | — | | | | (0.00 | )(2) | | | — | | | | — | |
| | |
Total Distributions | | | (0.38 | ) | | | (0.31 | ) | | | (0.32 | ) | | | (0.32 | ) | | | (0.32 | ) |
| | |
Net Asset Value, End of Year | | $ | 9.67 | | | $ | 9.74 | | | $ | 9.87 | | | $ | 9.89 | | | $ | 10.08 | |
| | |
Total Return(3) | | | 3.32 | % | | | 1.80 | % | | | 3.09 | % | | | 1.30 | % | | | 9.29 | % |
| | |
Net Assets, End of Year (millions) | | | $72 | | | | $89 | | | | $103 | | | | $122 | | | | $132 | |
| | |
Ratios to Average Net Assets: | | | | | | | | | | | | | | | | | | | | |
Gross expenses | | | 1.62 | %† | | | 1.55 | % | | | 1.51 | % | | | 1.51 | % | | | 1.42 | % |
Net expenses | | | 1.62 | (4)† | | | 1.55 | | | | 1.50 | (4) | | | 1.51 | | | | 1.42 | |
Net investment income | | | 3.55 | | | | 3.04 | | | | 2.77 | | | | 2.64 | | | | 3.41 | |
| | |
Portfolio Turnover Rate | | | 266 | %(5) | | | 141 | %(5) | | | 138 | %(5) | | | 148 | %(5) | | | 280 | % |
| | |
(1) | | Per share amounts have been calculated using the average shares method. |
(2) | | Amount represents less than $0.01 per share. |
(3) | | Performance figures may reflect fee waivers and/or expense reimbursements. Past performance is no guarantee of future results. In the absence of fee waivers and/or expense reimbursements, the total return would have been lower. |
(4) | | Reflects fee waivers and/or expense reimbursements. |
(5) | | Excluding mortgage dollar roll transactions. If mortgage dollar roll transactions had been included, the portfolio turnover rate would have been 615%, 315%, 292% and 328% for the years ended December 31, 2006, 2005, 2004 and 2003, respectively. |
| † | | Included in the expense ratios are certain non-recurring restructuring (and reorganization if applicable) fees that were incurred by the Fund during the period. Without these fees, the gross and net expense ratios would have been 1.60% and 1.60%, respectively (Note 11). |
See Notes to Financial Statements.
Legg Mason Partners Government Securities Fund 2006 Annual Report 19
Financial Highlights (continued)
For a share of each class of capital stock outstanding throughout each year ended December 31:
| | | | | | | | | | | | | | | | | | | | |
| | | | | |
| Class C Shares(1) | | 2006 | | | 2005 | | | 2004 | | | 2003 | | | 2002 | |
Net Asset Value, Beginning of Year | | $ | 9.74 | | | $ | 9.87 | | | $ | 9.88 | | | $ | 10.08 | | | $ | 9.53 | |
| | |
Income (Loss) From Operations: | | | | | | | | | | | | | | | | | | | | |
Net investment income | | | 0.37 | | | | 0.31 | | | | 0.28 | | | | 0.28 | | | | 0.34 | |
Net realized and unrealized gain (loss) | | | (0.03 | ) | | | (0.13 | ) | | | 0.04 | | | | (0.15 | ) | | | 0.54 | |
| | |
Total Income From Operations | | | 0.34 | | | | 0.18 | | | | 0.32 | | | | 0.13 | | | | 0.88 | |
| | |
Less Distributions From: | | | | | | | | | | | | | | | | | | | | |
Net investment income | | | (0.41 | ) | | | (0.31 | ) | | | (0.33 | ) | | | (0.33 | ) | | | (0.33 | ) |
Return of capital | | | — | | | | — | | | | (0.00 | )(2) | | | — | | | | — | |
| | |
Total Distributions | | | (0.41 | ) | | | (0.31 | ) | | | (0.33 | ) | | | (0.33 | ) | | | (0.33 | ) |
| | |
Net Asset Value, End of Year | | $ | 9.67 | | | $ | 9.74 | | | $ | 9.87 | | | $ | 9.88 | | | $ | 10.08 | |
| | |
Total Return(3) | | | 3.65 | % | | | 1.87 | % | | | 3.29 | % | | | 1.29 | % | | | 9.39 | % |
| | |
Net Assets, End of Year (millions) | | | $10 | | | | $14 | | | | $17 | | | | $25 | | | | $32 | |
| | |
Ratios to Average Net Assets: | | | | | | | | | | | | | | | | | | | | |
Gross expenses | | | 1.34 | %† | | | 1.45 | % | | | 1.44 | % | | | 1.41 | % | | | 1.39 | % |
Net expenses | | | 1.31 | (4)† | | | 1.45 | | | | 1.42 | (4) | | | 1.41 | | | | 1.39 | |
Net investment income | | | 3.85 | | | | 3.14 | | | | 2.84 | | | | 2.75 | | | | 3.45 | |
| | |
Portfolio Turnover Rate | | | 266 | %(5) | | | 141 | %(5) | | | 138 | %(5) | | | 148 | %(5) | | | 280 | % |
| | |
(1) | | Per share amounts have been calculated using the average shares method. |
(2) | | Amount represents less than $0.01 per share. |
(3) | | Performance figures may reflect fee waivers and/or expense reimbursements. Past performance is no guarantee of future results. In the absence of fee waivers and/or expense reimbursements, the total return would have been lower. |
(4) | | Reflects fee waivers and/or expense reimbursements. |
(5) | | Excluding mortgage dollar roll transactions. If mortgage dollar roll transactions had been included, the portfolio turnover rate would have been 615%, 315%, 292% and 328% for the years ended December 31, 2006, 2005, 2004 and 2003, respectively. |
| † | | Included in the expense ratios are certain non-recurring restructuring (and reorganization if applicable) fees that were incurred by the Fund during the period. Without these fees, the gross and net expense ratios would have been 1.33% and 1.29%, respectively (Note 11). |
See Notes to Financial Statements.
20 Legg Mason Partners Government Securities Fund 2006 Annual Report
Financial Highlights (continued)
For a share of each class of capital stock outstanding throughout each year ended December 31:
| | | | | | | | | | | | | | | | | | | | |
| | | | | |
| Class I Shares(1)(2) | | 2006 | | | 2005 | | | 2004 | | | 2003 | | | 2002 | |
Net Asset Value, Beginning of Year | | $ | 9.75 | | | $ | 9.88 | | | $ | 9.89 | | | $ | 10.08 | | | $ | 9.53 | |
| | |
Income (Loss) From Operations: | | | | | | | | | | | | | | | | | | | | |
Net investment income | | | 0.44 | | | | 0.39 | | | | 0.36 | | | | 0.36 | | | | 0.41 | |
Net realized and unrealized gain (loss) | | | (0.03 | ) | | | (0.12 | ) | | | 0.04 | | | | (0.14 | ) | | | 0.55 | |
| | |
Total Income From Operations | | | 0.41 | | | | 0.27 | | | | 0.40 | | | | 0.22 | | | | 0.96 | |
| | |
Less Distributions From: | | | | | | | | | | | | | | | | | | | | |
Net investment income | | | (0.48 | ) | | | (0.40 | ) | | | (0.41 | ) | | | (0.41 | ) | | | (0.41 | ) |
Return of capital | | | — | | | | — | | | | (0.00 | )(3) | | | — | | | | — | |
| | |
Total Distributions | | | (0.48 | ) | | | (0.40 | ) | | | (0.41 | ) | | | (0.41 | ) | | | (0.41 | ) |
| | |
Net Asset Value, End of Year | | $ | 9.68 | | | $ | 9.75 | | | $ | 9.88 | | | $ | 9.89 | | | $ | 10.08 | |
| | |
Total Return(4) | | | 4.39 | % | | | 2.75 | % | | | 4.09 | % | | | 2.17 | % | | | 10.25 | % |
| | |
Net Assets, End of Year (millions) | | | $101 | | | | $104 | | | | $220 | | | | $231 | | | | $130 | |
| | |
Ratios to Average Net Assets: | | | | | | | | | | | | | | | | | | | | |
Gross expenses | | | 0.60 | %† | | | 0.59 | % | | | 0.59 | % | | | 0.57 | % | | | 0.58 | % |
Net expenses | | | 0.59 | (5)† | | | 0.59 | | | | 0.57 | (5) | | | 0.57 | | | | 0.58 | |
Net investment income | | | 4.58 | | | | 3.97 | | | | 3.70 | | | | 3.54 | | | | 4.25 | |
| | |
Portfolio Turnover Rate | | | 266 | %(6) | | | 141 | %(6) | | | 138 | %(6) | | | 148 | %(6) | | | 280 | % |
| | |
(1) | | Per share amounts have been calculated using the average shares method. |
(2) | | As of November 20, 2006, Class Y shares were renamed Class I shares. |
(3) | | Amount represents less than $0.01 per share. |
(4) | | Performance figures may reflect fee waivers and/or expense reimbursements. Past performance is no guarantee of future results. In the absence of fee waivers and/or expense reimbursements, the total return would have been lower. |
(5) | | Reflects fee waivers and/or expense reimbursements. |
(6) | | Excluding mortgage dollar roll transactions. If mortgage dollar roll transactions had been included, the portfolio turnover rate would have been 615%, 315%, 292% and 328% for the years ended December 31, 2006, 2005, 2004 and 2003, respectively. |
| † | | Included in the expense ratios are certain non-recurring restructuring (and reorganization if applicable) fees that were incurred by the Fund during the period. Without these fees, the gross and net expense ratios would have been 0.58% and 0.57%, respectively (Note 11). |
See Notes to Financial Statements.
Legg Mason Partners Government Securities Fund 2006 Annual Report 21
Notes to Financial Statements
1. Organization and Significant Accounting Policies
Legg Mason Partners Government Securities Fund (formerly known as Smith Barney Government Securities Fund) (the "Fund") is a separate diversified series of Legg Mason Partners Investment Funds, Inc. (formerly known as Smith Barney Investment Funds Inc.) (the "Company"). The Company, a Maryland corporation, is registered under the Investment Company Act of 1940, as amended (the "1940 Act"), as an open-end management investment company.
The following are significant accounting policies consistently followed by the Fund and are in conformity with U.S. generally accepted accounting principles (“GAAP”). Estimates and assumptions are required to be made regarding assets, liabilities and changes in net assets resulting from operations when financial statements are prepared. Changes in the economic environment, financial markets and any other parameters used in determining these estimates could cause actual results to differ.
(a) Investment Valuation. Securities are valued at the mean between the bid and asked prices based on market quotations for those securities, or if no quotations are available, then for securities of similar type, yield and maturity. Securities for which market quotations are not readily available or where market quotations are determined not to reflect fair value, will be valued in good faith by or under the direction of the Fund’s Board of Directors. Short-term obligations with maturities of 60 days or less are valued at amortized cost, which approximates market value.
(b) Repurchase Agreements. When entering into repurchase agreements, it is the Fund's policy that its custodian or a third party custodian take possession of the underlying collateral securities, the market value of which at least equals the principal amount of the repurchase transaction, including accrued interest. To the extent that any repurchase transaction exceeds one business day, the value of the collateral is marked-to-market to ensure the adequacy of the collateral. If the seller defaults, and the market value of the collateral declines or if bankruptcy proceedings are commenced with respect to the seller of the security, realization of the collateral by the Fund may be delayed or limited.
(c) Financial Futures Contracts. The Fund may enter into financial futures contracts typically to hedge a portion of the portfolio. Upon entering into a financial futures contract, the Fund is required to deposit cash or securities as initial margin. Additional securities are also segregated up to the current market value of the financial futures contracts. Subsequent payments, known as variation margin, are made or received by the Fund each day, depending on the daily fluctuation in the value of the underlying financial instruments. The Fund recognizes an unrealized gain or loss equal to the daily variation margin. When the financial futures contracts are closed, a realized gain or loss is recognized equal to the difference between the proceeds from (or cost of) the closing transactions and the Fund’s basis in the contracts.
The risks associated with entering into financial futures contracts include the possibility that a change in the value of the contract may not correlate with the changes in the value of the underlying instruments. In addition, investing in financial futures contracts involves the risk that the Fund could lose more than the original margin deposit and subsequent payments required for a futures transaction. Risks may also arise upon entering into these contracts from the potential inability of the counterparties to meet the terms of their contracts.
22 Legg Mason Partners Government Securities Fund 2006 Annual Report
Notes to Financial Statements (continued)
(d) Written Options. When the Fund writes an option, an amount equal to the premium received by the Fund is recorded as a liability, the value of which is marked-to-market daily to reflect the current market value of the option written. If the option expires, the Fund realizes a gain from investments equal to the amount of the premium received. When a written call option is exercised, the difference between the premium and the amount for effecting a closing purchase transaction, including brokerage commission, is also treated as a realized gain or loss. When a written put option is exercised, the amount of the premium received reduces the cost of the security purchased by the Fund.
A risk in writing a covered call option is that the Fund may forego the opportunity of profit if the market price of the underlying security increases and the option is exercised. The risk in writing a put option is that the Fund may incur a loss if the market price of the underlying security decreases and the option is exercised. The risk in writing a call option is that the Fund is exposed to the risk of loss if the market price of the underlying security increases. In addition, there is the risk that the Fund may not be able to enter into a closing transaction because of an illiquid secondary market.
(e) Securities Traded on a To-Be-Announced Basis. The Fund may trade securities on a to-be-announced (“TBA”) basis. In a TBA transaction, the Fund commits to purchasing or selling securities which have not yet been issued by the issuer and for which specific information is not known, such as the face amount and maturity date and the underlying pool of investments in U.S. government agency mortgage pass-through transactions. Securities purchased on a TBA basis are not settled until they are delivered to the Fund, normally 15 to 45 days later. Beginning on the date the Fund enters into a TBA transaction, cash, U.S. government securities or other liquid high-grade debt obligations are segregated in an amount equal in value to the purchase price of the TBA security. These transactions are subject to market fluctuations and their current value is determined in the same manner as for other securities.
(f) Mortgage Dollar Rolls. The Fund enters into dollar rolls in which the Fund sells mortgage-backed securities for delivery in the current month and simultaneously contracts to repurchase substantially similar (same type, coupon and maturity) securities to settle on a specified future date. During the roll period, the Fund forgoes principal and interest paid on the securities. The Fund is compensated by a fee paid by the counterparty, often in the form of a drop in the repurchase price of the securities. Dollar rolls are accounted for as financing arrangements; the fee is accrued into interest income ratably over the term of the dollar roll and any gain or loss on the roll is deferred and realized upon disposition of the rolled security.
The risk of entering into a mortgage dollar roll is that the market value of the securities the Fund is obligated to repurchase under the agreement may decline below the repurchase price. In the event the buyer of securities under a mortgage dollar roll files for bankruptcy or becomes insolvent, the Fund’s use of proceeds of the dollar roll may be restricted pending a determination by the other party, or its trustee or receiver, whether to enforce the Fund’s obligation to repurchase the securities.
Legg Mason Partners Government Securities Fund 2006 Annual Report 23
Notes to Financial Statements (continued)
(g) Security Transactions and Investment Income. Security transactions are accounted for on a trade date basis. Interest income, adjusted for amortization of premium and accretion of discount, is recorded on the accrual basis. Dividend income is recorded on the ex-dividend date. The cost of investments sold is determined by use of the specific identification method. To the extent any issuer defaults on an expected interest payment, the Fund’s policy is to generally halt any additional interest income accruals and consider the realizability of interest accrued up to the date of default.
(h) Distributions to Shareholders. Distributions from net investment income on the shares of the Fund are declared each business day to shareholders of record, and are paid monthly. Distributions of net realized gains, if any, are declared at least annually. Distributions are recorded on the ex-dividend date and are determined in accordance with income tax regulations, which may differ from GAAP.
(i) Class Accounting. Investment income, common expenses and realized/unrealized gain (loss) on investments are allocated to the various classes of the Fund on the basis of daily net assets of each class. Fees relating to a specific class are charged directly to that class.
(j) Federal and Other Taxes. It is the Fund’s policy to comply with the federal income and excise tax requirements of the Internal Revenue Code of 1986, as amended, applicable to regulated investment companies. Accordingly, the Fund intends to distribute substantially all of its income and net realized gains on investments, if any, to shareholders each year. Therefore, no federal income tax provision is required in the Fund’s financial statements.
(k) Reclassification. GAAP requires that certain components of net assets be adjusted to reflect permanent differences between financial and tax reporting. These reclassifications have no effect on net assets or net asset values per share. During the current year, the following reclassifications have been made:
| | | | | | | | | |
| | | |
| | | Undistributed Net
Investment Income | | Accumulated Net Realized Loss | | Paid-in Capital |
| (a) | | $ | 117,864 | | $ | 2,822,382 | | $ | (2,940,246) |
| (b) | | | 1,855,965 | | | (1,855,965) | | | — |
| |
| (a) | Reclassifications are primarily due to the expiration of a capital loss carryforward and book/tax differences in the treatment of various items. |
| (b) | Reclassifications are primarily due to differences between book and tax amortization of premium on fixed income securities and income from mortgage backed securities treated as capital gains for tax purposes. |
24 Legg Mason Partners Government Securities Fund 2006 Annual Report
Notes to Financial Statements (continued)
| 2. | Investment Management Agreement and Other Transactions with Affiliates |
Prior to August 1, 2006, Smith Barney Fund Management LLC (“SBFM”), a wholly-owned subsidiary of Legg Mason, Inc. (“Legg Mason”), acted as the investment manager of the Fund. Under the investment management agreement, the Fund pays an investment management fee calculated daily and paid monthly in accordance with the following breakpoint schedule:
| | | |
| |
| Average Daily Net Assets | | Annual Rate | |
First $2 billion | | 0.55 | % |
Next $2 billion | | 0.50 | |
Next $2 billion | | 0.45 | |
Next $2 billion | | 0.40 | |
Over $8 billion | | 0.35 | |
| | |
Effective August 1, 2006, Legg Mason Partners Fund Advisor, LLC (“LMPFA”) became the Fund’s investment manager and Western Asset Management Company (“Western Asset”) became the Fund’s subadviser. The portfolio managers who are responsible for the day-to day management of the Fund remained the same immediately prior to and immediately after the date of these changes. LMPFA and Western Asset are wholly-owned subsidiaries of Legg Mason.
LMPFA provides administrative and certain oversight services to the Fund. LMPFA has delegated to the subadviser the day-to day portfolio management of the Fund. The Fund’s investment management fee remains unchanged. For its services, LMPFA pays Western Asset 70% of the net management fee that it receives from the Fund.
During the year ended December 31, 2006, SBFM and LMPFA waived a portion of their investment management fee in the amount of $13,458. In addition, during the year ended December 31, 2006, the Fund was reimbursed for expenses in the amount of $18,035.
Citigroup Global Markets Inc. (“CGM”), PFS Investments Inc. (“PFS”) and Legg Mason Investor Services, LLC (“LMIS”) serve as distributors of the Fund. LMIS is a wholly-owned broker-dealer subsidiary of Legg Mason.
There is a maximum initial sales charge of 6.75% and 4.25% for Class 1 and A shares, respectively. Effective November 20, 2006, the maximum initial sales charge on Class A shares of the Fund decreased from 4.50% to 4.25% for shares purchased on or after that date. There is a contingent deferred sales charge (“CDSC”) of 4.50% on Class B shares, which applies if redemption occurs within one year from purchase payment. This CDSC declines thereafter by 0.50% per year until no CDSC is incurred. Class C shares have a 1.00% CDSC, which applies if redemption occurs within one year from purchase payment. In certain cases, Class A shares have a 1.00% CDSC, which applies if redemption occurs within one year from purchase payment. This CDSC only applies to those purchases of Class A shares, which, when combined with current holdings of Class A shares, equal or exceed $500,000 in the aggregate. These purchases do not incur an initial sales charge.
Legg Mason Partners Government Securities Fund 2006 Annual Report 25
Notes to Financial Statements (continued)
For the year ended December 31, 2006, LMIS and its affiliates received sales charges of approximately $2,000 on sales of the Fund’s Class A shares. In addition, for the year ended December 31, 2006, CDSCs paid to LMIS and its affiliates were approximately:
| | | | | | | | | |
| | | |
| | | Class A | | Class B | | Class C |
CDSCs | | $ | 3,000 | | $ | 34,000 | | $ | 2,000 |
| |
Certain officers and one Director of the Company are employees of Legg Mason or its affiliates and do not receive compensation from the Company.
3. Investments
During the year ended December 31, 2006, the aggregate cost of purchases and proceeds from sales of investments (excluding short-term investments and mortgage dollar rolls) were as follows:
| | | | | | |
| | |
| | | Investments | | U.S. Government &
Agency Obligations |
Purchases | | $ | 214,290,258 | | $ | 1,684,454,028 |
| |
Sales | | | 193,752,150 | | | 1,625,923,719 |
| |
At December 31, 2006, the aggregate gross unrealized appreciation and depreciation of investments for federal income tax purposes were as follows:
| | | | |
Gross unrealized appreciation | | $ | 3,849,065 | |
Gross unrealized depreciation | | | (731,772 | ) |
| | |
Net unrealized appreciation | | $ | 3,117,293 | |
| | |
At December 31, 2006, the Fund had the following open futures contracts:
| | | | | | | | | | | | | | |
| | | | | |
| | | Number of
Contracts | | Expiration
Date | | Basis
Value | | Market
Value | | Unrealized
Gain (Loss) | |
Contracts to Buy: | | | | | | | | | | | | | | |
U.S. 5-Year Treasury Notes | | 637 | | 3/07 | | $ | 67,199,888 | | $ | 66,924,812 | | $ | (275,076 | ) |
U.S. Treasury Bonds | | 177 | | 3/07 | | | 20,090,901 | | | 19,724,438 | | | (366,463 | ) |
| | |
| | | | | | | | | | | | | (641,539 | ) |
| | |
Contracts to Sell: | | | | | | | | | | | | | | |
U.S. 10-Year Treasury Notes | | 184 | | 3/07 | | $ | 20,023,377 | | $ | 19,774,250 | | $ | 249,127 | |
| | |
Net unrealized loss on open futures contracts | | | | | | | | | | | | $ | (392,412 | ) |
| | |
26 Legg Mason Partners Government Securities Fund 2006 Annual Report
Notes to Financial Statements (continued)
During the year ended December 31, 2006, written options transactions for the Fund were as follows:
| | | | | | | |
| | |
| | | Number of Contracts | | | Premiums Received | |
Options written, outstanding at December 31, 2005 | | — | | | | — | |
Options written | | 21,000,075 | | | $ | 112,448 | |
Options closed | | (21,000,075 | ) | | | (112,448 | ) |
| | |
Options written, outstanding at December 31, 2006 | | — | | | | — | |
| | |
During the year ended December 31, 2006, the Fund entered into mortgage dollar roll transactions in the aggregate amount of $2,393,511,084. For the year ended December 31, 2006, the Fund recorded interest income of $1,182,627 related to such mortgage rolls. At December 31, 2006, the Fund had outstanding mortgage dollar rolls with a total cost of $162,052,696.
| 4. | Class Specific Expenses |
The Fund has adopted a Rule 12b-1distribution plan and under that plan the Fund pays a service fee with respect to its Class A, B and C shares calculated at the annual rate of 0.25% of the average daily net assets of each respective class. The Fund also pays a distribution fee with respect to its Class B and C shares calculated at the annual rate of 0.50% and 0.45% of the average daily net assets of each class, respectively. Distribution fees are accrued daily and paid monthly.
For the year ended December 31, 2006, class specific expenses were as follows:
| | | | | | | | | |
| | | |
| | | Distribution
Fees | | Transfer
Agent Fees | | Shareholder
Reports Expenses |
Class 1 | | | — | | $ | 127,570 | | $ | 5,902 |
Class A | | $ | 804,863 | | | 411,720 | | | 36,368 |
Class B | | | 593,771 | | | 199,655 | | | 18,199 |
Class C | | | 82,441 | | | 2,949 | | | 2,880 |
Class I* | | | — | | | 13 | | | 157 |
| |
Total | | $ | 1,481,075 | | $ | 741,907 | | $ | 63,506 |
| |
* | | As of November 20, 2006, Class Y shares were renamed Class I shares. |
| 5. | Distributions to Shareholders by Class |
| | | | | | |
| | | Year Ended December 31, 2006 | | Year Ended December 31, 2005 |
Net Investment Income | | | | | | |
Class 1 | | $ | 3,753,221 | | $ | 3,408,433 |
Class A | | | 14,899,301 | | | 12,842,270 |
Class B | | | 3,151,612 | | | 2,979,795 |
Class C | | | 504,239 | | | 494,560 |
Class I* | | | 5,044,278 | | | 5,970,247 |
| |
Total | | $ | 27,352,651 | | $ | 25,695,305 |
| |
* | | As of November 20, 2006, Class Y shares were renamed Class I shares. |
Legg Mason Partners Government Securities Fund 2006 Annual Report 27
Notes to Financial Statements (continued)
At December 31, 2006, the Company had 10 billion shares of capital stock authorized with a par value of $0.001 per share. The Fund has the ability to issue multiple classes of shares. Each share of a class represents an identical interest in the Fund and has the same rights, except that each class bears certain direct expenses, including those specifically related to the distribution of its shares.
Transactions in shares of each class were as follows:
| | | | | | | | | | | | | | |
| | |
| | | Year Ended December 31, 2006 | | | Year Ended December 31, 2005 | |
| | | Shares | | | Amount | | | Shares | | | Amount | |
Class 1 | | | | | | | | | | | | | | |
Shares sold | | 183,815 | | | $ | 1,761,866 | | | 230,609 | | | $ | 2,265,126 | |
Shares issued on reinvestment | | 393,207 | | | | 3,775,037 | | | 346,994 | | | | 3,408,432 | |
Shares repurchased | | (1,590,503 | ) | | | (15,256,584 | ) | | (1,628,379 | ) | | | (16,001,565 | ) |
| | |
Net Decrease | | (1,013,481 | ) | | $ | (9,719,681 | ) | | (1,050,776 | ) | | $ | (10,328,007 | ) |
| | |
Class A | | | | | | | | | | | | | | |
Shares sold | | 4,286,396 | | | $ | 41,131,431 | | | 4,879,480 | | | $ | 47,963,361 | |
Shares issued on reinvestment | | 1,256,939 | | | | 12,054,274 | | | 1,041,506 | | | | 10,217,752 | |
Shares repurchased | | (8,056,436 | ) | | | (77,190,379 | ) | | (7,379,357 | ) | | | (72,449,453 | ) |
| | |
Net Decrease | | (2,513,101 | ) | | $ | (24,004,674 | ) | | (1,458,371 | ) | | $ | (14,268,340 | ) |
| | |
Class B | | | | | | | | | | | | | | |
Shares sold | | 782,462 | | | $ | 7,502,515 | | | 1,044,174 | | | $ | 10,272,493 | |
Shares issued on reinvestment | | 294,266 | | | | 2,824,576 | | | 266,231 | | | | 2,614,511 | |
Shares repurchased | | (2,791,890 | ) | | | (26,767,249 | ) | | (2,599,846 | ) | | | (25,544,949 | ) |
| | |
Net Decrease | | (1,715,162 | ) | | $ | (16,440,158 | ) | | (1,289,441 | ) | | $ | (12,657,945 | ) |
| | |
Class C | | | | | | | | | | | | | | |
Shares sold | | 80,543 | | | $ | 775,168 | | | 161,216 | | | $ | 1,584,061 | |
Shares issued on reinvestment | | 38,225 | | | | 366,780 | | | 36,272 | | | | 355,972 | |
Shares repurchased | | (458,321 | ) | | | (4,395,490 | ) | | (537,020 | ) | | | (5,269,679 | ) |
| | |
Net Decrease | | (339,553 | ) | | $ | (3,253,542 | ) | | (339,532 | ) | | $ | (3,329,646 | ) |
| | |
Class I* | | | | | | | | | | | | | | |
Shares sold | | 1,217,460 | | | $ | 11,730,751 | | | 1,715,040 | | | $ | 16,936,173 | |
Shares issued on reinvestment | | 527,900 | | | | 5,072,651 | | | 411,490 | | | | 4,042,587 | |
Shares repurchased | | (2,037,106 | ) | | | (19,547,770 | ) | | (13,697,670 | ) | | | (135,461,536 | ) |
| | |
Net Decrease | | (291,746 | ) | | $ | (2,744,368 | ) | | (11,571,140 | ) | | $ | (114,482,776 | ) |
| | |
* | | As of November 20, 2006, Class Y shares were renamed Class I shares. |
28 Legg Mason Partners Government Securities Fund 2006 Annual Report
Notes to Financial Statements (continued)
7. Income Tax Information and Distributions to Shareholders
Subsequent to the fiscal year end, the Fund has made the following distributions:
| | | | | | | | | | | | | | | |
| | | | | |
Record Date Payable Date | | Class 1 | | Class A | | Class B | | Class C | | Class I |
Daily 1/31/2007 | | $ | 0.043849 | | $ | 0.040632 | | $ | 0.035101 | | $ | 0.037668 | | $ | 0.044051 |
| |
The tax character of distributions paid during the fiscal years ended December 31, were as follows:
| | | | | | |
| | |
| | | 2006 | | 2005 |
Distributions paid from: | | | | | | |
Ordinary Income | | $ | 27,352,651 | | $ | 25,695,305 |
| |
As of December 31, 2006, the components of accumulated earnings on a tax basis were as follows:
| | | | |
Undistributed ordinary income - net | | $ | 366,802 | |
Capital loss carryforward* | | | (83,745,003 | ) |
Other book/tax temporary differences(a) | | | 382,146 | |
Unrealized appreciation/(depreciation)(b) | | | 2,724,881 | |
| | |
Total accumulated earnings / (losses) — net | | $ | (80,271,174 | ) |
| | |
| * | | As of December 31, 2006, the Fund had the following net capital loss carryforward remaining: |
| | | | |
Year of Expiration | | Amount | |
12/31/2007 | | $ | (48,857,876 | ) |
12/31/2008 | | | (16,358,450 | ) |
12/31/2012 | | | (2,474,230 | ) |
12/31/2013 | | | (3,821,875 | ) |
12/31/2014 | | | (12,232,572 | ) |
| | | | |
| | $ | (83,745,003 | ) |
| | | | |
These amounts will be available to offset any future taxable capital gains.
(a) | | Other book/tax temporary differences are attributable primarily to the tax deferral of losses on straddles, the realization for tax purposes of unrealized gains/(losses) on certain futures contracts and differences in the book/tax treatment of various items. |
(b) | | The difference between book-basis and tax-basis unrealized application/(depreciation) is attributable primarily to the tax deferral of losses on wash sales. |
8. Regulatory Matters
On May 31, 2005, the U.S. Securities and Exchange Commission (“SEC”) issued an order in connection with the settlement of an administrative proceeding against SBFM, the Fund’s prior investment manager, and CGM relating to the appointment of an affiliated transfer agent for the Smith Barney family of mutual funds (the “Funds”).
The SEC order finds that SBFM and CGM willfully violated Section 206(1) of the Investment Advisers Act of 1940 (“Advisers Act”). Specifically, the order finds that SBFM and CGM knowingly or recklessly failed to disclose to the boards of the Funds in 1999
Legg Mason Partners Government Securities Fund 2006 Annual Report 29
Notes to Financial Statements (continued)
when proposing a new transfer agent arrangement with an affiliated transfer agent that: First Data Investors Services Group (“First Data”), the Funds’ then-existing transfer agent, had offered to continue as transfer agent and do the same work for substantially less money than before; and that Citigroup Asset Management (“CAM”), the Citigroup business unit that, at the time, included the Fund’s investment manager and other investment advisory companies, had entered into a side letter with First Data under which CAM agreed to recommend the appointment of First Data as sub-transfer agent to the affiliated transfer agent in exchange for, among other things, a guarantee by First Data of specified amounts of asset management and investment banking fees to CAM and CGM. The order also finds that SBFM and CGM willfully violated Section 206(2) of the Advisers Act by virtue of the omissions discussed above and other misrepresentations and omissions in the materials provided to the Funds’ boards, including the failure to make clear that the affiliated transfer agent would earn a high profit for performing limited functions while First Data continued to perform almost all of the transfer agent functions, and the suggestion that the proposed arrangement was in the Funds’ best interests and that no viable alternatives existed. SBFM and CGM do not admit or deny any wrongdoing or liability. The settlement does not establish wrongdoing or liability for purposes of any other proceeding.
The SEC censured SBFM and CGM and ordered them to cease and desist from violations of Sections 206(1) and 206(2) of the Advisers Act. The order requires Citigroup to pay $208.1 million, including $109 million in disgorgement of profits, $19.1 million in interest, and a civil money penalty of $80 million. Approximately $24.4 million has already been paid to the Funds, primarily through fee waivers. The remaining $183.7 million, including the penalty, has been paid to the U.S. Treasury and will be distributed pursuant to a plan submitted for the approval of the SEC. At this time, there is no certainty as to how the above-described proceeds of the settlement will be distributed, to whom such distributions will be made, the methodology by which such distributions will be allocated, and when such distributions will be made. The order also required that transfer agency fees received from the Funds since December 1, 2004, less certain expenses, be placed in escrow and provided that a portion of such fees might be subsequently distributed in accordance with the terms of the order. On April 3, 2006, an aggregate amount of approximately $9 million was distributed to the affected Funds.
The order required SBFM to recommend a new transfer agent contract to the Funds’ boards within 180 days of the entry of the order; if a Citigroup affiliate submitted a proposal to serve as transfer agent or sub-transfer agent, SBFM and CGM would have been required, at their expense, to engage an independent monitor to oversee a competitive bidding process. On November 21, 2005, and within the specified timeframe, the Fund’s Board selected a new transfer agent for the Fund. No Citigroup affiliate submitted a proposal to serve as transfer agent. Under the order, SBFM also must comply with an amended version of a vendor policy that Citigroup instituted in August 2004.
Although there can be no assurance, the Fund’s manager does not believe that this matter will have a material adverse effect on the Fund.
On December 1, 2005, Citigroup completed the sale of substantially all of its global asset management business, including SBFM, to Legg Mason.
30 Legg Mason Partners Government Securities Fund 2006 Annual Report
Notes to Financial Statements (continued)
9. Legal Matters
Beginning in August 2005, five class action lawsuits alleging violations of federal securities laws and state law were filed against CGM and SBFM, (collectively, the “Defendants”) based on the May 31, 2005 settlement order issued against the Defendants by the SEC as described in Note 8. The complaints seek injunctive relief and compensatory and punitive damages, removal of SBFM as the advisor for the Smith Barney family of funds, rescission of the Funds’ management and other contracts with SBFM, recovery of all fees paid to SBFM pursuant to such contracts, and an award of attorneys’ fees and litigation expenses.
On October 5, 2005, a motion to consolidate the five actions and any subsequently filed, related action was filed. That motion contemplates that a consolidated amended complaint alleging substantially similar causes of action will be filed in the future.
As of the date of this report, the Fund’s manager believes that resolution of the pending lawsuit will not have a material effect on the financial position or results of operations of the Fund or the ability of the Fund’s manager and its affiliates to continue to render services to the Fund under their respective contracts.
* * *
Beginning in June 2004, class action lawsuits alleging violations of the federal securities laws were filed against CGM and a number of its then affiliates, including SBFM and Salomon Brothers Asset Management Inc (“SBAM”), which were then investment adviser or manager to certain of the Funds (the “Managers”), substantially all of the mutual funds then managed by the Managers (the “Defendant Funds”), and Board members of the Defendant Funds (collectively, the “Defendants”). The complaints alleged, among other things, that CGM created various undisclosed incentives for its brokers to sell Smith Barney and Salomon Brothers funds. In addition, according to the complaints, the Managers caused the Defendant Funds to pay excessive brokerage commissions to CGM for steering clients towards proprietary funds. The complaints also alleged that the Defendants breached their fiduciary duty to the Defendant Funds by improperly charging Rule 12b-1 fees and by drawing on fund assets to make undisclosed payments of soft dollars and excessive brokerage commissions. The complaints also alleged that the Defendant Funds failed to adequately disclose certain of the allegedly wrongful conduct. The complaints sought injunctive relief and compensatory and punitive damages, rescission of the Defendant Funds’ contracts with the Managers, recovery of all fees paid to the Managers pursuant to such contracts and an award of attorneys’ fees and litigation expenses.
On December 15, 2004, a consolidated amended complaint (the “Complaint”) was filed alleging substantially similar causes of action. On May 27, 2005, all of the Defendants filed motions to dismiss the Complaint. On July 26, 2006, the court issued a decision and order (1) finding that plaintiffs lacked standing to sue on behalf of the shareholders of the Funds in which none of the plaintiffs had invested and dismissing those Funds from the case (although stating that they could be brought back into the case if standing as to them could be established), and (2) other than one stayed claim, dismissing all of the causes of action against the remaining Defendants, with prejudice, except for the cause of
Legg Mason Partners Government Securities Fund 2006 Annual Report 31
Notes to Financial Statements (continued)
action under Section 36(b) of the 1940 Act, which the court granted plaintiffs leave to repeal as a derivative claim.
On October 16, 2006, plaintiffs filed their Second Consolidated Amended Complaint (“Second Amended Complaint”) which alleges derivative claims on behalf of nine funds identified in the Second Amended Complaint, under Section 36(b) of the 1940 Act, against CAM, SBAM, SBFM and CGM as investment advisers to the identified funds, as well as CGM as a distributor for the identified funds (collectively, the “Second Amended Complaint Defendants”). The Fund was not identified in the Second Amended Complaint. The Second Amended Complaint alleges no claims against any of the funds or any of their Board members. Under Section 36(b), the Second Amended Complaint alleges similar facts and seeks similar relief against the Second Amended Complaint Defendants as the Complaint.
Additional lawsuits arising out of these circumstances and presenting similar allegations and requests for relief may be filed in the future.
10. Other Matters
On September 16, 2005, the staff of the SEC informed SBFM and SBAM that the staff is considering recommending that the SEC institute administrative proceedings against SBFM and SBAM for alleged violations of Section 19(a) and 34(b) of the 1940 Act (and related Rule 19a-1). The notification is a result of an industry wide inspection by the SEC and is based upon alleged deficiencies in disclosures regarding dividends and distributions paid to shareholders of certain funds. Section 19(a) and related Rule 19a-1 of the 1940 Act generally require funds that are making dividend and distribution payments to provide shareholders with a written statement disclosing the source of the dividends and distributions, and, in particular, the portion of the payments made from each of net investment income, undistributed net profits and/or paid-in capital. In connection with the contemplated proceedings, the staff may seek a cease and desist order and/or monetary damages from SBFM or SBAM.
Although there can be no assurance, the Fund’s manager believes that this matter is not likely to have a material adverse effect on the Fund.
11. Special Shareholder Meeting and Reorganization
The Board and the shareholders of the Legg Mason Partners U.S. Government Securities Fund (the “Acquired Fund”) and the Board of the Fund approved at the October 2006 shareholder meeting, an Agreement and Plan of Reorganization providing for the acquisition of all of the assets and the assumption of all the liabilities of the Acquired Fund, in exchange for shares of the Fund. The reorganization occurred on February 2, 2007.
Shareholders also approved a number of initiatives designed to streamline and restructure the fund complex. These matters generally are expected to be implemented in 2007. As noted in the proxy materials, Legg Mason will pay for a portion of the costs related to these initiatives. The portion of the costs that are borne by the Fund will be recognized in the period during which the expense is incurred. Such expenses relate to obtaining shareholder votes for proposals presented in the proxy, the election of board
32 Legg Mason Partners Government Securities Fund 2006 Annual Report
Notes to Financial Statements (continued)
members, retirement of board members, as well as printing, mailing, and soliciting proxies. See also “Additional Shareholder Information” at the end of this report.
12. Recent Accounting Pronouncements
During June 2006, the Financial Accounting Standards Board (“FASB”) issued FASB Interpretation 48 (“FIN 48” or the “Interpretation”), Accounting for Uncertainty in Income Taxes—an interpretation of FASB Statement 109. FIN 48 supplements FASB Statement 109, Accounting for Income Taxes, by defining the confidence level that a tax position must meet in order to be recognized in the financial statements. FIN 48 prescribes a comprehensive model for how a fund should recognize, measure, present, and disclose in its financial statements uncertain tax positions that the fund has taken or expects to take on a tax return. FIN 48 requires that the tax effects of a position be recognized only if it is “more likely than not” to be sustained based solely on its technical merits. Management must be able to conclude that the tax law, regulations, case law, and other objective information regarding the technical merits sufficiently support the position’s sustainability with a likelihood of more than 50 percent. FIN 48 is effective for fiscal periods beginning after December 15, 2006, which for this Fund will be January 1, 2007. At adoption, the financial statements must be adjusted to reflect only those tax positions that are more likely than not to be sustained as of the adoption date. Management of the Fund has determined that adopting FIN 48 will not have a material impact on the Fund’s financial statements.
* * *
On September 20, 2006, FASB released Statement of Financial Accounting Standards No. 157 Fair Value Measurements (“FAS 157”). FAS 157 establishes an authoritative definition of fair value, sets out a framework for measuring fair value, and requires additional disclosures about fair value measurements. The application of FAS 157 is required for fiscal years beginning after November 15, 2007 and interim periods within those fiscal years. At this time, management is evaluating the implications of FAS 157 and its impact on the financial statements has not yet been determined.
Legg Mason Partners Government Securities Fund 2006 Annual Report 33
Report of Independent Registered Public Accounting Firm
The Board of Directors and Shareholders
Legg Mason Partners Investment Funds, Inc.:
We have audited the accompanying statement of assets and liabilities, including the schedule of investments, of Legg Mason Partners Government Securities Fund (formerly Smith Barney Government Securities Fund), a series of Legg Mason Partners Investment Funds, Inc. (formerly Smith Barney Investment Funds Inc.), as of December 31, 2006, and the related statement of operations for the year then ended, the statements of changes in net assets for each of the years in the two-year period then ended, and the financial highlights for each of the years in the five-year period then ended. These financial statements and financial highlights are the responsibility of the Fund’s management. Our responsibility is to express an opinion on these financial statements and financial highlights based on our audits.
We conducted our audits in accordance with the standards of the Public Company Accounting Oversight Board (United States). Those standards require that we plan and perform the audit to obtain reasonable assurance about whether the financial statements and financial highlights are free of material misstatement. An audit includes examining, on a test basis, evidence supporting the amounts and disclosures in the financial statements. Our procedures included confirmation of securities owned as of December 31, 2006, by correspondence with the custodian and brokers or by other appropriate auditing procedures. An audit also includes assessing the accounting principles used and significant estimates made by management, as well as evaluating the overall financial statement presentation. We believe that our audits provide a reasonable basis for our opinion.
In our opinion, the financial statements and financial highlights referred to above present fairly, in all material respects, the financial position of Legg Mason Partners Government Securities Fund as of December 31, 2006, and the results of its operations for the year then ended, the changes in its net assets for each of the years in the two-year period then ended, and the financial highlights for each of the years in the five-year period then ended, in conformity with U.S. generally accepted accounting principles.

New York, New York
February 26, 2007
34 Legg Mason Partners Government Securities Fund 2006 Annual Report
Additional Information (unaudited)
Information about Directors and Officers
The business and affairs of the Legg Mason Partners Government Securities Fund (formerly known as Smith Barney Government Securities Fund) (the “Fund”) are managed under the direction of the Board of Directors of Legg Mason Partners Investment Funds, Inc. (formerly known as Smith Barney Investment Funds Inc.) (the “Company”). Information pertaining to the Directors and certain officers of the Company is set forth below. The Statement of Additional Information includes additional information about the Fund’s Directors and is available, without charge, upon request by calling Legg Mason Partners Shareholder Services at 1-800-451-2010.
| | | | | | | | | | |
| | | | | |
| Name, Address and Birth Year | | Position(s)
Held with
Fund | | Term of
Office* and
Length
of Time
Served | | Principal
Occupation(s) During Past
5 Years | | Number of
Portfolios
in the Fund
Complex
Overseen by Director | | Other Board
Memberships
Held by
Director |
| Non-Interested Directors: | | | | | | |
Paul R. Ades Paul R. Ades, PLLC 181 West Main Street Suite C Babylon, NY 11702 Birth Year: 1940 | | Director | | Since
1994 | | Law Firm of Paul R. Ades, PLLC (from April 2000 to Present) | | 12 | | None |
| | | | | |
Dwight B. Crane c/o R. Jay Gerken Legg Mason & Co. LLC (“Legg Mason”) 399 Park Avenue 4th Floor New York. NY. 10022 Birth Year: 1937 | | Director | | Since
1981 | | Professor, Harvard Business School | | 43 | | None |
| | | | | |
Frank G. Hubbard c/o Legg Mason 125 Broad Street New York, NY 10004 Birth Year: 1937 | | Director | | Since
1993 | | President of Avatar International, Inc. (Business Development) (since 1998) | | 12 | | None |
| | | | | |
Jerome H. Miller c/o Legg Mason 125 Broad Street New York, NY 10004 Birth Year: 1938 | | Director | | Since
1998 | | Retired | | 12 | | None |
| | | | | |
Ken Miller Young Stuff Apparel Group, Inc. 930 Fifth Avenue Suite 610 New York, NY 10021 Birth Year: 1942 | | Director | | Since
1994 | | President of Young Stuff Apparel Group, Inc. (since 1963) | | 12 | | None |
Legg Mason Partners Government Securities Fund 35
Additional Information (unaudited) (continued)
| | | | | | | | | | |
| | | | | |
| Name, Address and Birth Year | | Position(s)
Held with
Fund | | Term of
Office* and
Length
of Time
Served | | Principal
Occupation(s) During Past 5 Years | | Number of
Portfolios
in the Fund
Complex
Overseen by Director | | Other Board
Memberships
Held by
Director |
| Interested Director: | | | | | | |
R. Jay Gerken, CFA** Legg Mason 399 Park Avenue 4th Floor New York, NY 10022 Birth Year: 1951 | | Chairman, President and Chief Executive Officer | | Since
2002 | | Managing Director of Legg Mason; President and Chief Executive Officer of Legg Mason Partners Fund Advisors LLC (“LMPFA”) (Since 2006); President and Chief Executive Officer of Smith Barney Fund Management LLC (“SBFM”) and Citi Fund Management Inc, (“CFM”); President and Chief Executive Officer of certain mutual funds associated with Legg Mason; Formerly Chairman of SBFM and CFM (from 2002 to 2006); Formerly, Chairman, President and Chief Executive of Travelers Investment Advisers, Inc. (from 2002 to 2005) | | 162 | | None |
| | | |
| Officers: | | | | | | |
Kaprel Ozsolak Legg Mason 125 Broad Street 11th Floor New York, NY 10004 Birth Year: 1965 | | Chief Financial Officer and Treasurer | | Since
2004 | | Director of Legg Mason or its predecessors; Chief Financial Officer and Treasurer of certain mutual funds associated with Legg Mason; Formerly, Controller of certain mutual funds associated with predecessor firms of Legg Mason or its predecessors (from 2002 to 2004) | | N/A | | N/A |
36 Legg Mason Partners Government Securities Fund
Additional Information (unaudited) (continued)
| | | | | | | | | | |
| | | | | |
| Name, Address and Birth Year | | Position(s)
Held with
Fund | | Term of
Office* and
Length
of Time
Served | | Principal
Occupation(s) During Past
5 Years | | Number of
Portfolios
in the Fund
Complex
Overseen by Director | | Other Board
Memberships
Held by
Director |
| Officers: | | | | | | |
Ted P. Becker Legg Mason 399 Park Avenue New York, NY 10022 Birth Year: 1951 | | Chief Compliance Officer | | Since 2006 | | Director of Global Compliance at Legg Mason (since 2006); Chief Compliance Officer of LMPFA (since 2006); Managing Director of Compliance at Legg Mason (since 2005); Chief Compliance Officer with certain mutual funds associated with Legg Mason, LMPFA and certain affiliates (since 2006); Managing Director of Compliance at Legg Mason or its predecessors (from 2002 to 2005); Prior to 2002, Managing Director — Internal Audit & Risk Review at Citigroup Inc. | | N/A | | N/A |
| | | | | |
John Chiota Legg Mason 100 First Stamford Place
5th Floor Stamford, CT 06902 Birth Year: 1968 | | Chief Anti-Money Laundering Compliance Officer | | Since 2006 | | Vice President of Legg Mason or its predecessors (since 2004); Chief Anti-Money Laundering Compliance Officer with certain mutual funds associated with Legg Mason or its affiliates (since 2006); Prior to August 2004, Chief AML Compliance Officer with TD Waterhouse | | N/A | | N/A |
Legg Mason Partners Government Securities Fund 37
Additional Information (unaudited) (continued)
| | | | | | | | | | |
| | | | | |
| Name, Address and Birth Year | | Position(s)
Held with
Fund | | Term of
Office* and
Length
of Time
Served | | Principal
Occupation(s) During Past
5 Years | | Number of
Portfolios
in the Fund
Complex
Overseen by Director | | Other Board
Memberships
Held by
Director |
| Officers: | | | | | | |
Steven Frank Legg Mason 125 Broad Street
11th Floor New York, NY 10004 Birth Year: 1967 | | Controller | | Since
2005 | | Vice President of Legg Mason or its predecessors (since 2002); Controller of certain mutual funds associated with Legg Mason (since 2005); Formerly, Assistant Controller of certain mutual funds associated with Legg Mason (from 2001 to 2005) | | N/A | | N/A |
| | | | | |
Robert I. Frenkel Legg Mason 300 First Stamford Place 4th Floor Stamford, CT 06902 Birth Year: 1954 | | Secretary and Chief Legal Officer | | Since
2003 | | Managing Director and General Counsel of Global Mutual Funds for Legg Mason and its predecessors (since 1994); Secretary and Chief Legal Officer of mutual funds associated with Legg Mason (since 2003); Formerly, Secretary of CFM (from 2001 to 2004) | | N/A | | N/A |
| * | | Each Director and officer serves until his or her successor has been duly elected and qualified. |
| ** | | Mr. Gerken is an “interested person” of the Fund as defined in the Investment Company Act of 1940, as amended, because Mr. Gerken is an officer of LMPFA and certain of its affiliates. |
38 Legg Mason Partners Government Securities Fund
Additional Shareholder Information (unaudited)
Results of a Special Meeting of Shareholders
On December 11, 2006, a Special Meeting of Shareholders was held to vote on various proposals recently approved by the Fund's Board Members. The following tables provide the number of votes cast for, against or withheld, as well as the number of abstentions and broker non–votes as to the following proposals: (1) elect Board Members, (2) Reorganize as Corresponding Series of an Existing Trust and (3) Revise Fundamental Investment Policies.
Proposal 1: Elect Board Members†
| | | | | | |
| Nominees | | Votes For | | Authority
Withheld | | Abstentions |
Paul R. Ades | | 121,866,497.391 | | 3,054,107.186 | | 0.000 |
Andrew L. Breech | | 121,900,821.025 | | 3,019,783.552 | | 0.000 |
Dwight B. Crane | | 121,850,512.564 | | 3,070,092.013 | | 0.000 |
Robert M. Frayn, Jr. | | 121,778,191.988 | | 3,142,412.589 | | 0.000 |
Frank G. Hubbard | | 121,848,495.495 | | 3,072,109.082 | | 0.000 |
Howard J. Johnson | | 121,865,914.325 | | 3,054,690.252 | | 0.000 |
David E. Maryatt | | 121,813,754.911 | | 3,106,849.666 | | 0.000 |
Jerome H. Miller | | 121,858,470.310 | | 3,062,134.267 | | 0.000 |
Ken Miller | | 121,889,516.870 | | 3,031,087.707 | | 0.000 |
John J. Murphy | | 121,864,667.771 | | 3,055,936.806 | | 0.000 |
Thomas F. Schlafly | | 121,848,850.151 | | 3,071,754.426 | | 0.000 |
Jerry A. Viscione | | 121,844,786.595 | | 3,075,817.982 | | 0.000 |
R. Jay Gerken, CFA | | 121,826,709.153 | | 3,093,895.424 | | 0.000 |
| |
| † | | Board Members are elected by the shareholders of all of the series of the Company of which the Fund is a series. |
Proposal 2: Reorganize as Corresponding Series of an Existing Trust
| | | | | | | | |
| Fund | | Votes For | | Votes
Against | | Abstentions | | Broker
Non-Votes |
Reorganize as Corresponding Series of an Existing Trust | | 34,186,055.060 | | 414,675.156 | | 519,287.037 | | 549,179.000 |
| |
Proposal 3: Revise Fundamental Investment Policies
| | | | | | | | |
| Items Voted On | | Votes For | | Votes
Against | | Abstentions | | Broker
Non-Votes |
Borrowing Money | | 34,063,325.422 | | 519,493.086 | | 537,198.745 | | 549,179.000 |
Underwriting | | 34,029,805.704 | | 535,243.734 | | 554,967.815 | | 549,179.000 |
Lending | | 33,981,575.723 | | 577,987.375 | | 560,454.155 | | 549,179.000 |
Issuing Senior Securities | | 34,017,892.402 | | 544,491.281 | | 557,633.570 | | 549,179.000 |
Real Estate | | 34,037,042.792 | | 486,295.209 | | 596,679.252 | | 549,179.000 |
Commodities | | 33,949,585.006 | | 572,220.594 | | 598,211.653 | | 549,179.000 |
Concentration | | 34,033,668.921 | | 480,971.976 | | 605,376.356 | | 549,179.000 |
Diversification | | 34,063,425.633 | | 513,478.870 | | 543,112.750 | | 549,179.000 |
Non-Fundamental | | 33,880,252.297 | | 687,468.873 | | 552,296.083 | | 549,179.000 |
| |
Legg Mason Partners Government Securities Fund 39
Important Tax Information (unaudited)
The following information is provided with respect to the distributions paid during the taxable year ended December 31, 2006:
| | |
Record Date: | | Daily |
Payable Date: | | Monthly |
| |
Interest from Federal Obligations | | 16.72% |
| |
The law varies in each state as to whether and what percentage of dividend income attributable to Federal obligations is exempt from state income tax. We recommend that you consult with your tax adviser to determine if any portion of the dividends you received is exempt from state income taxes.
Please retain this information for your records.
40 Legg Mason Partners Government Securities Fund
Legg Mason Partners Government Securities Fund
| | |
DIRECTORS Paul R. Ades Dwight B. Crane R. Jay Gerken, CFA
Chairman Frank G. Hubbard Jerome H. Miller Ken Miller | | INVESTMENT MANAGER Legg Mason Partners Fund
Advisor, LLC SUBADVISER Western Asset Management Company DISTRIBUTORS Citigroup Global Markets Inc. Legg Mason Investor Services, LLC PFS Investments Inc. CUSTODIAN State Street Bank and Trust
Company TRANSFER AGENT PFPC Inc. 4400 Computer Drive Westborough,
Massachusetts 01581 INDEPENDENT REGISTERED PUBLIC ACCOUNTING FIRM KPMG LLP 345 Park Avenue New York, New York 10154 |
This report is submitted for the general information of the shareholders of Legg Mason Partners Government Securities Fund, but it may also be used as sales literature.
This report must be preceded or accompanied by a free prospectus. Investors should consider the Fund’s investment objectives, risks, charges and expenses carefully before investing. The prospectus contains this and other important information about the Fund. Please read the prospectus carefully before investing.
www.leggmason.com/InvestorServices
©2007 Legg Mason
Investor Services, LLC
Member NASD, SIPC
Legg Mason Partners
Government Securities Fund
The Fund is a separate series of Legg Mason Partners Investment Funds, Inc., a Maryland corporation.
LEGG MASON PARTNERS GOVERNMENT SECURITIES FUND
Legg Mason Partners Funds
125 Broad Street
10th Floor, MF-2
New York, New York 10004
The Fund files its complete schedule of portfolio holdings with the Securities and Exchange Commission (“Commission”) for the first and third quarters of each fiscal year on Form N-Q. The Fund’s Forms N-Q are available on the Commission’s website at www.sec.gov. The Fund’s Forms N-Q may be reviewed and copied at the Commission’s Public Reference Room in Washington, D.C., and information on the operation of the Public Reference Room may be obtained by calling 1-800-SEC-0330. To obtain information on Form N-Q from the Fund, shareholders can call Legg Mason Partners Shareholder Services at 1-800-451-2010.
Information on how the Fund voted proxies relating to portfolio securities during the prior 12-month period ended June 30th of each year, and a description of the policies and procedures that the Fund uses to determine how to vote proxies relating to portfolio transactions is available (1) without charge, upon request, by calling 1-800-451-2010, (2) on the Fund’s website at www.leggmason.com/InvestorServices and (3) on the SEC’s website at www.sec.gov.
The registrant has adopted a code of ethics that applies to the registrant’s principal executive officer, principal financial officer, principal accounting officer or controller.
| ITEM 3. | AUDIT COMMITTEE FINANCIAL EXPERT. |
The Board of Trustees of the registrant has determined that Dwight B. Crane possesses the technical attributes identified in Instruction 2(b) of Item 3 to Form N–CSR to qualify as an “audit committee financial expert,” and has designated Mr. Crane as the Audit Committee’s financial expert. Mr. Crane is an “independent” Trustee pursuant to paragraph (a)(2) of Item 3 to Form N–CSR.
| Item 4. | Principal Accountant Fees and Services |
a) Audit Fees. The aggregate fees billed in the last two fiscal years ending December 31, 2005 and December 31, 2006 (the “Reporting Periods”) for professional services rendered by the Registrant’s principal accountant (the “Auditor”) for the audit of the Registrant’s annual financial statements, or services that are normally provided by the Auditor in connection with the statutory and regulatory filings or engagements for the Reporting Periods, were $55,000 in 2005 and $55,000 in 2006.
b) Audit-Related Fees. There were no fees billed in the Reporting Periods for assurance and related services by the Auditor that are reasonably related to the performance of the audit of the Registrant’s financial statements and are not reported under paragraph (a) of this Item 4.
In addition, there were no Audit-Related Fees billed in the Reporting Period for assurance and related services by the Auditor to the Registrant’s investment adviser (not including any sub-adviser whose role is primarily portfolio management and is subcontracted with or overseen by another investment adviser), and any entity controlling, controlled by or under common control with the investment adviser that provides ongoing services to the Legg Mason Partners Investment Funds Inc. (“service affiliates”), that were reasonably related to the performance of the annual audit of the service affiliates. Accordingly, there were no such fees that required pre-approval by the Audit Committee for the Reporting Periods (prior to May 6, 2003 services provided by the Auditor were not required to be pre-approved).
(c) Tax Fees. The aggregate fees billed in the Reporting Periods for professional services rendered by the Auditor for tax compliance, tax advice and tax planning (“Tax Services”) were $4,700 in 2005 and $4,700 in 2006. These services consisted of (i) review or preparation of U.S. federal, state, local and excise tax returns; (ii) U.S. federal, state and local tax planning, advice and assistance regarding statutory, regulatory or administrative developments, and (iii) tax advice regarding tax qualification matters and/or treatment of various financial instruments held or proposed to be acquired or held.
There were no fees billed for tax services by the Auditors to service affiliates during the Reporting Periods that required pre-approval by the Audit Committee.
d) All Other Fees. There were no other fees billed in the Reporting Periods for products and services provided by the Auditor, other than the services reported in paragraphs (a) through (c) of this Item for the Legg Mason Partners Investment Funds Inc.
All Other Fees. There were no other non-audit services rendered by the Auditor to Smith Barney Fund Management LLC (“SBFM”), and any entity controlling, controlled by or under common control with SBFM that provided ongoing services to Legg Mason Partners Investment Funds Inc.requiring pre-approval by the Audit Committee in the Reporting Period.
(e) Audit Committee’s pre–approval policies and procedures described in paragraph (c) (7) of Rule 2-01 of Regulation S-X.
(1) The Charter for the Audit Committee (the “Committee”) of the Board of each registered investment company (the “Fund”) advised by Smith Barney Fund Management LLC or Salomon Brothers Asset Management Inc. or one of their affiliates (each, an “Adviser”) requires that the Committee shall approve (a) all audit and permissible non-audit services to be provided to the Fund and (b) all permissible non-audit services to be provided by the Fund’s independent auditors to the Adviser and any Covered Service Providers if the engagement relates directly to the operations and financial reporting of the Fund. The Committee may implement policies and procedures by which such services are approved other than by the full Committee.
The Committee shall not approve non-audit services that the Committee believes may impair the independence of the auditors. As of the date of the approval of this Audit Committee Charter, permissible non-audit services include any professional services (including tax services), that are not prohibited services as described below, provided to the Fund by the independent auditors, other than those provided to the Fund in connection with an audit or a review of the financial statements of the Fund. Permissible non-audit services may not include: (i) bookkeeping or other services related to the accounting records or financial statements of the Fund; (ii) financial information systems design and implementation; (iii) appraisal or valuation services, fairness opinions or contribution-in-kind reports; (iv) actuarial services; (v) internal audit outsourcing services; (vi) management functions or human resources; (vii) broker or dealer, investment adviser or investment banking services; (viii) legal services and expert services unrelated to the audit; and (ix) any other service the Public Company Accounting Oversight Board determines, by regulation, is impermissible.
Pre-approval by the Committee of any permissible non-audit services is not required so long as: (i) the aggregate amount of all such permissible non-audit services provided to the Fund, the Adviser and any service providers controlling, controlled by or under common control with the Adviser that provide ongoing services to the Fund (“Covered Service Providers”) constitutes not more than 5% of the total amount of revenues paid to the independent auditors during the fiscal year in which the permissible non-audit services are provided to (a) the Fund, (b) the Adviser and (c) any entity controlling, controlled by or under common control with the Adviser that provides ongoing services to the Fund during the fiscal year in which the services are provided that would have to be approved by the Committee; (ii) the permissible non-audit services were not recognized by the Fund at the time of the engagement to be non-audit services; and (iii) such services are promptly brought to the attention of the Committee and approved by the Committee (or its delegate(s)) prior to the completion of the audit.
(2) For the Legg Mason Partners Investment Trust, the percentage of fees that were approved by the audit committee, with respect to: Audit-Related Fees were 100% and 0% for 2005 and 2006; Tax Fees were 100% and 0% for 2005 and 2006; and Other Fees were 100% and 0% for 2005 and 2006.
(f) N/A
(g) Non-audit fees billed by the Auditor for services rendered to Legg Mason Partners Investment Funds Inc. and CAM and any entity controlling, controlled by, or under common control with CAM that provides ongoing services to Legg Mason Partners Investment Funds Inc. during the reporting period were $0 in 2006 for fees related to the transfer agent matter as fully described in the notes the financial statements titled “additional information” and $75,000 for 2005.
(h) Yes. Legg Mason Partners Investment Funds Inc.’s Audit Committee has considered whether the provision of non-audit services that were rendered to Service Affiliates, which were not pre-approved (not requiring pre-approval), is compatible with maintaining the Accountant’s independence. All services provided by the Auditor to the Legg Mason Partners Investment Funds Inc. or to Service Affiliates, which were required to be pre-approved, were pre-approved as required.
| ITEM 5. | AUDIT COMMITTEE OF LISTED REGISTRANTS. |
Not applicable.
| ITEM 6. | SCHEDULE OF INVESTMENTS. |
Included herein under Item 1.
| ITEM 7. | DISCLOSURE OF PROXY VOTING POLICIES AND PROCEDURES FOR CLOSED–END MANAGEMENT INVESTMENT COMPANIES. |
Not applicable.
| ITEM 8. | PORTFOLIO MANAGERS OF CLOSED–END MANAGEMENT INVESTMENT COMPANIES. |
Not applicable.
| ITEM 9. | PURCHASES OF EQUITY SECURITIES BY CLOSED–END MANAGEMENT INVESTMENT COMPANY AND AFFILIATED PURCHASERS. |
Not applicable.
| ITEM 10. | SUBMISSION OF MATTERS TO A VOTE OF SECURITY HOLDERS. |
Not applicable.
| ITEM 11. | CONTROLS AND PROCEDURES. |
(a) The registrant’s principal executive officer and principal financial officer have concluded that the registrant’s disclosure controls and procedures (as defined in Rule 30a- 3(c) under the Investment Company Act of 1940, as amended (the “1940 Act”)) are effective as of a date within 90 days of the filing date of this report that includes the disclosure required by this paragraph, based on their evaluation of the disclosure controls and procedures required by Rule 30a-3(b) under the 1940 Act and 15d-15(b) under the Securities Exchange Act of 1934.
(b) There were no changes in the registrant’s internal control over financial reporting (as defined in Rule 30a-3(d) under the 1940 Act) that occurred during the registrant’s last fiscal half-year (the registrant’s second fiscal half-year in the case of an annual report) that have materially affected, or are likely to materially affect the registrant’s internal control over financial reporting.
(a)(1) Code of Ethics attached hereto.
Exhibit 99.CODE ETH
(a) (2) Certifications pursuant to section 302 of the Sarbanes-Oxley Act of 2002 attached hereto.
Exhibit 99.CERT
SIGNATURES
Pursuant to the requirements of the Securities Exchange Act of 1934 and the Investment Company Act of 1940, the registrant has duly caused this Report to be signed on its behalf by the undersigned, there unto duly authorized.
| | |
| Legg Mason Partners Investment Funds, Inc. |
| |
| By: | | /s/ R. Jay Gerken |
| | (R. Jay Gerken) |
| | Chief Executive Officer of |
| | Legg Mason Partners Investment Funds, Inc. |
| |
| Date: | | March 9, 2007 |
Pursuant to the requirements of the Securities Exchange Act of 1934 and the Investment Company Act of 1940, this report has been signed below by the following persons on behalf of the registrant and in the capacities and on the dates indicated.
| | |
| By: | | /s/ R. Jay Gerken |
| | | (R. Jay Gerken) |
| | Chief Executive Officer of |
| | Legg Mason Partners Investment Funds, Inc. |
| |
| Date: | | March 9, 2007 |
| | |
| By: | | /s/ Kaprel Ozsolak |
| | | (Kaprel Ozsolak) |
| | Chief Financial Officer of |
| | Legg Mason Partners Investment Funds, Inc. |
| |
| Date: | | March 9, 2007 |