Exhibit (c)(2)
Exhibit (c)(2)
Presentation to Special Committee of the Board of Directors
The Hallwood Group Incorporated
March 28, 2013
Preface
The information herein has been prepared by Southwest Securities, Inc. (“SWS”) as part of a presentation being
made in support of our opinion as to the fairness of the terms of the proposed transaction from a financial point of view.
The material in this presentation and our analyses contained herein are confidential and are for the use of the Special
Committee of the Board of Directors of The Hallwood Group Incorporated (“Hallwood Group” or the “Company”)
and its advisors only. Any publication or use of this material or the analyses contained herein without the express
written consent of SWS is strictly prohibited.
Among the activities conducted in the course of our engagement as financial advisor, SWS received and reviewed
business and financial information of Hallwood Group and held discussions with the management of the Company
regarding this information. In connection with the analyses contained herein, we have not independently verified
any such information and have relied on all such information as being complete and accurate in all material respects.
In addition, we have not obtained any independent appraisal of the assets of either entity. With regard to financial forecasts,
we have assumed that they have been reasonably prepared on bases reflecting the best currently available estimates and judgments
of management of the Company as to the future financial performance of the Company. We assume no responsibility for and
express no view as to such forecasts or the assumptions on which they are based. We have not received financial forecasts
beyond 2013 from management of the Company. SWS is not an expert on, and does not render opinions regarding, legal,
accounting, regulatory or tax matters. You should consult with your advisors concerning these matters before undertaking
the proposed transaction.
Several analytical methodologies have been employed herein and no one method of analysis should be regarded as critical
to the overall conclusion we have reached. Each analytical technique has inherent strengths and weaknesses, and the nature of
the available information may further affect the value of particular techniques. The conclusions we have reached are based on
all the analyses and factors presented herein taken as a whole and also on application of our own experience and judgment.
Such conclusions may involve significant elements of subjective judgment or qualitative analysis. We therefore give no
opinion as to the value or merit standing alone of any one or more parts of the material that follows. Our only opinion is
the formal written opinion we express as to the fairness from a financial point of view. The opinion, the analyses contained
herein and all conclusions drawn from such analyses are necessarily based upon market, economic and other conditions
that exist and can be evaluated as of the date of this book.
In the ordinary course of our business, SWS may actively trade shares of the common stock and/or other securities of Hallwood Group for our own account and the accounts of our customers and, accordingly, may at any
time hold a long or short position in such securities.
2 |
|
Table of Contents
Executive Summary 1
Overview of Hallwood Group 2
Trading Overview 3
Selected Comparable Public 4
Selected Precedent Transactions 5
Discounted Cash Flow Analysis 6
Premium Analysis 7
Summary Valuation and Rationale 8
3 |
|
Section 1
Executive Summary
Executive Summary
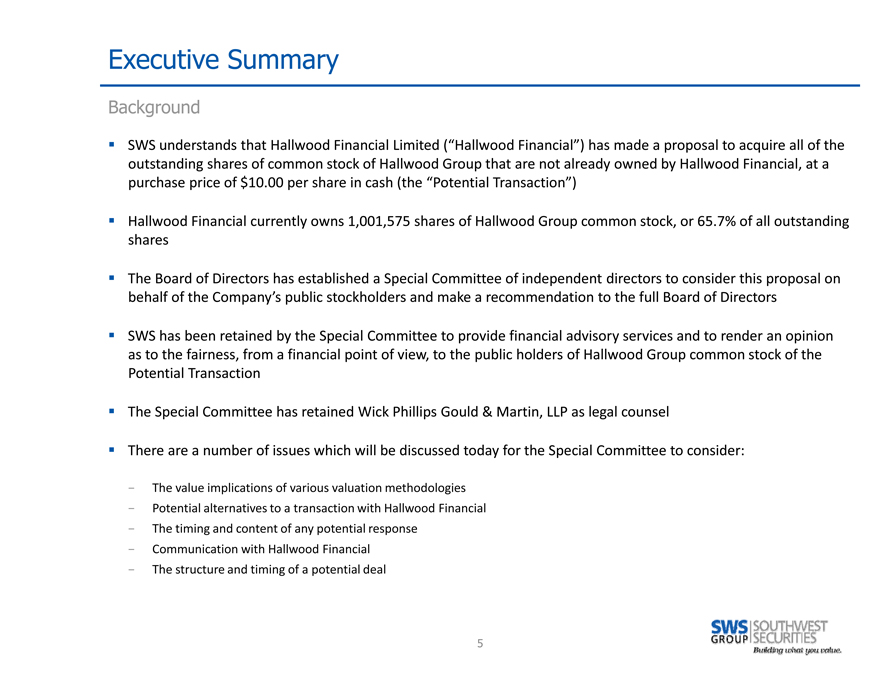
Background
SWS understands that Hallwood Financial Limited (“Hallwood Financial”) has made a proposal to acquire all of
the outstanding shares of common stock of Hallwood Group that are not already owned by Hallwood Financial, at
a purchase price of $10.00 per share in cash (the “Potential Transaction”)
Hallwood Financial currently owns 1,001,575 shares of Hallwood Group common stock, or 65.7% of all outstanding shares
The Board of Directors has established a Special Committee of independent directors to consider this proposal
on behalf of the Company’s public stockholders and make a recommendation to the full Board of Directors
SWS has been retained by the Special Committee to provide financial advisory services and to render an
opinion as to the fairness, from a financial point of view, to the public holders of Hallwood Group common stock
of the Potential Transaction
The Special Committee has retained Wick Phillips Gould & Martin, LLP as legal counsel
There are a number of issues which will be discussed today for the Special Committee to consider:
- The value implications of various valuation methodologies
- Potential alternatives to a transaction with Hallwood Financial
- The timing and content of any potential response
- Communication with Hallwood Financial
- The structure and timing of a potential deal
5 |
|
Executive Summary
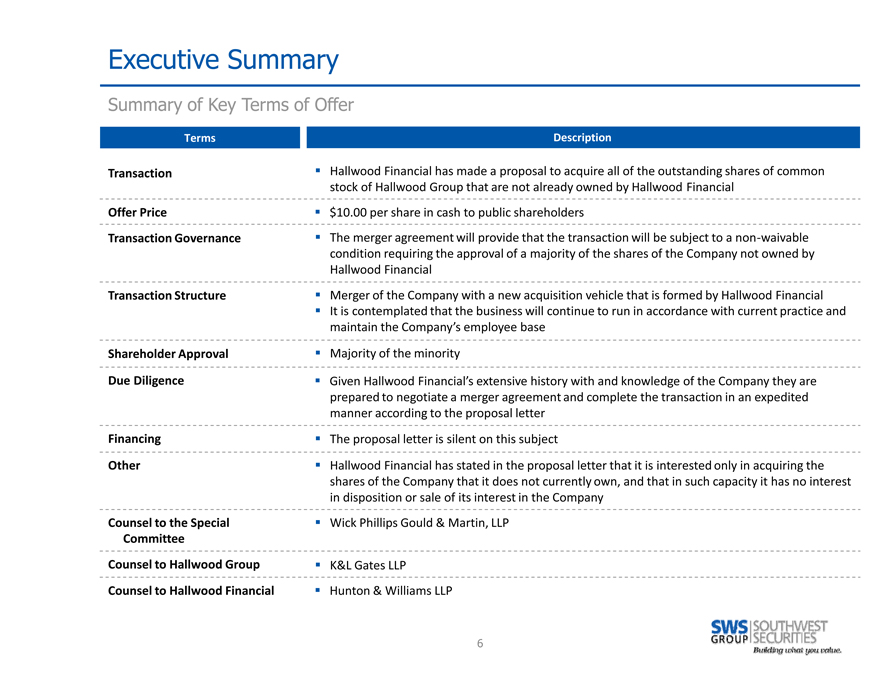
Summary of Key Terms of Offer
Terms Description
Transaction Hallwood Financial has made a proposal to acquire all of the outstanding shares of common
stock of Hallwood Group that are not already owned by Hallwood Financial
Offer Price $10.00 per share in cash to public shareholders
Transaction Governance The merger agreement will provide that the transaction will be subject to a non waivable
condition requiring the approval of a majority of the shares of the Company not owned by
Hallwood Financial
Transaction Structure Merger of the Company with a new acquisition vehicle that is formed by Hallwood Financial
It is contemplated that the business will continue to run in accordance with current practice and
maintain the Company’s employee base
Shareholder Approval Majority of the minority
Due Diligence Given Hallwood Financial’s extensive history with and knowledge of the Company they are
prepared to negotiate a merger agreement and complete the transaction in an expedited
manner according to the proposal letter
Financing The proposal letter is silent on this subject
Other Hallwood Financial has stated in the proposal letter that it is interested only in acquiring the
shares of the Company that it does not currently own, and that in such capacity it has no interest
in disposition or sale of its interest in the Company
Counsel to the Special Wick Phillips Gould & Martin, LLP
Committee
Counsel to Hallwood Group K&L Gates LLP
Counsel to Hallwood Financial Hunton & Williams LLP
6 |
|

Executive Summary
Summary Transaction Valuation and Implied Premiums
(Dollars in millions, except per share amounts)
Description Amounts
Current Offer Price Per Share: $10.00
% Premium to Current Price (03/26/13) 11.6%
(1) |
|
% Premium to 1Day Prior (11/8/12) 78.3%
% Premium to 30Trading Day Average Prior 49.8%
% Premium to 60Trading Day Average Prior 27.5%
% Premium to 90Trading Day Average Prior 17.4%
% Premium to 120Trading Day Average Prior 15.7%
Minority Public Shares / Ownership 0.524 million or 34.3% ownership
Minority BuyIn Value $5.2
Implied Equity Value $15.3
Implied Enterprise Value $29.2
Transaction Type Merger
Financing Not provided in offer
Enterprise Value to Revenues: Revenues Multiple
Enterprise Value / 2012 Revenues 130.5 0.22x
Enterprise Value / 2013E Revenues 127.6 0.23x
Enterprise Value to Adjusted EBITDA(2) : Adjusted EBITDA Multiple
Enterprise Value / 2012 Adjusted EBITDA 1.2 24.6x
Enterprise Value / 2013E Adjusted EBITDA (0.9) NM
(1) Last trading day prior to the date on which the offer was announced.
(2) Adjusted to add back expenses associated with the Company’s Hallwood Energy and Nextec litigation matters.
7 |
|
Executive Summary
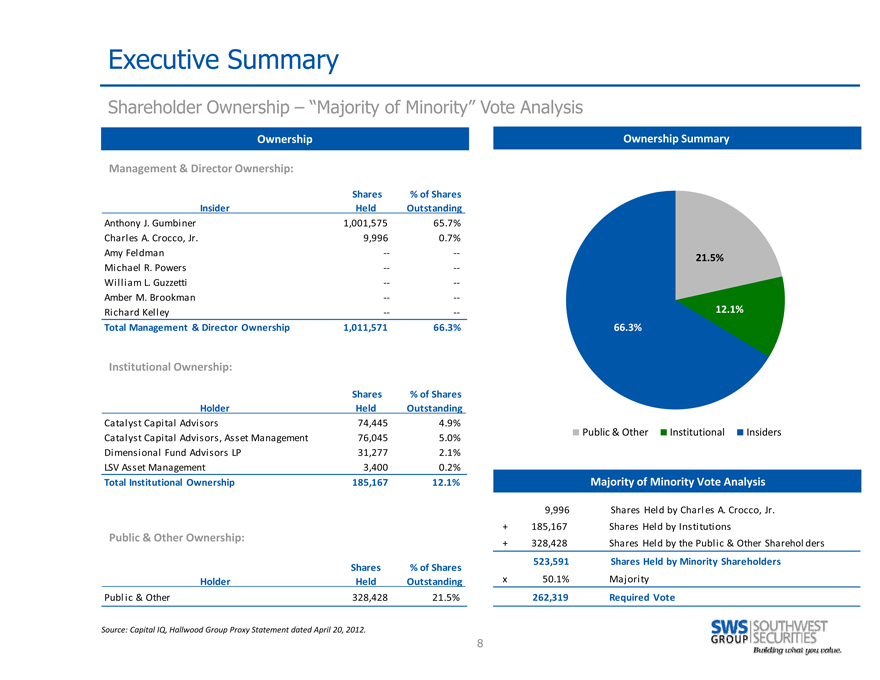
Shareholder Ownership – “Majority of Minority” Vote Analysis
Ownership
Management & Director Ownership:
Shares % of Shares
Insider Held Outstanding
Anthony J. Gumbi ner 1,001,575 65.7%
Charl es A. Crocco, Jr. 9,996 0.7%
Amy Fel dman - - -
Mi chael R. Powers
Wi l l i am L. Guzzetti
Amber M. Brookma n
Ri chard Kel l ey
Total Management & Director Ownership 1,011,571 66.3%
Institutional Ownership:
Shares % of Shares
Holder Held Outstanding
Catal ys t Capi tal Advi s ors 74,445 4.9%
Catal ys t Capi tal Advi sors , Ass et Management 76,045 5.0%
Di mensi onal Fund Advi s ors LP 31,277 2.1%
LSV Ass et Management 3,400 0.2%
Total Institutional Ownership 185,167 12.1%
Public & Other Ownership:
Shares % of Shares
Holder Held Outstanding
Publ i c & Other 328,428 21.5%
Ownership Summary
21.5%
12.1%
66.3%
Public & Other Institutional Insiders
Majority of Minority Vote Analysis
9,996 Shares Hel d by Charl es A. Crocco, Jr.
+ 185,167 Shares Hel d by Insti tuti ons
+ 328,428 Shares Hel d by the Publ i c & Other Sharehol ders
523,591 Shares Held by Minority Shareholders
x 50.1% Majori ty
262,319 Required Vote
Source: Capital IQ, Hallwood Group Proxy Statement dated April 20, 2012.
8 |
|

Executive Summary
Valuation Approaches
Implied Valuation
Comparable Public
Trading Overview Precedent Transaction Discounted Cash Flow
Companies
“Trading Specific” “Public Market” valuation “Transaction Specific” Present value of projected
comparison valuation free cash flows
Value based on public
Reviews historical market trading multiples Values based on multiples “Inherent” value of the
common stock trading of comparable companies paid in comparable business
prices and volume to offer transactions
Does not include control Incorporates time value
premium Includes control premium and cost of capital
Represents freely tradable Comparability of considerations
minority interest transactions and / or Relies on management’s
target company relevant projections
Premium Analysis Other Considerations
“Trading Specific” Industry characteristics and
comparison trends (e.g. size, volatility,
Compares premiums paid growth prospects, etc.)
in comparable transactions Relative market position and
Reflects premium over competitive environment
pre announcement prices Consistency and visibility of
Comparability of historical and projected
earnings
transaction most relevant
9
Section 2
Overview of Hallwood Group
Overview of Hallwood Group
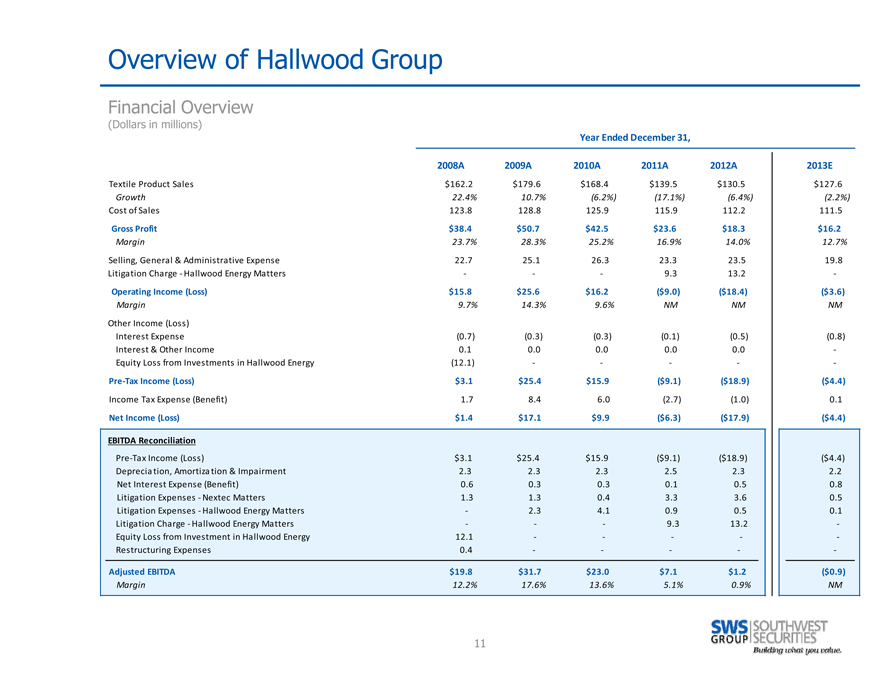
Financial Overview
(Dollars in millions)
Year Ended December 31,
2008A 2009A 2010A 2011A 2012A 2013E
Textile Product Sales $162.2 $179.6 $168.4 $139.5 $130.5 $127.6
Growth 22.4% 10.7% (6.2%) (17.1%) (6.4%) (2.2%)
Cost of Sales 123.8 128.8 125.9 115.9 112.2 111.5
Gross Profit $38.4 $50.7 $42.5 $23.6 $18.3 $16.2
Margin 23.7% 28.3% 25.2% 16.9% 14.0% 12.7%
Selling, General & Administrative Expense 22.7 25.1 26.3 23.3 23.5 19.8
Litiga tion Charge Hallwood Energy Matters 9.3 13.2
Operating Income (Loss) $15.8 $25.6 $16.2 ($9.0) ($18.4) ($3.6)
Margin 9.7% 14.3% 9.6% NM NM NM
Other Income (Loss)
Interest Expense (0.7) (0.3) (0.3) (0.1) (0.5) (0.8)
Interest & Other Income 0.1 0.0 0.0 0.0 0.0
Equity Loss from Investments in Hallwood Energy (12.1)
Pre Tax Income (Loss) $3.1 $25.4 $15.9 ($9.1) ($18.9) ($4.4)
Income Tax Expense (Benefit) 1.7 8.4 6.0 (2.7) (1.0) 0.1
Net Income (Loss) $1.4 $17.1 $9.9 ($6.3) ($17.9) ($4.4)
EBITDA Reconciliation
Pre Ta x Income (Loss) $3.1 $25.4 $15.9 ($9.1) ($18.9) ($4.4)
Deprecia tion, Amortiza tion & Impairment 2.3 2.3 2.3 2.5 2.3 2.2
Net Interest Expense (Benefit) 0.6 0.3 0.3 0.1 0.5 0.8
Litiga tion Expenses Nextec Matters 1.3 1.3 0.4 3.3 3.6 0.5
Litiga tion Expenses Hallwood Energy Matters 2.3 4.1 0.9 0.5 0.1
Litiga tion Charge Ha llwood Energy Ma tters 9.3 13.2
Equity Loss from Investment in Ha llwood Energy 12.1
Restructuring Expenses 0.4
Adjusted EBITDA $19.8 $31.7 $23.0 $7.1 $1.2 ($0.9)
Margin 12.2% 17.6% 13.6% 5.1% 0.9% NM
11

Section 3
Trading Overview
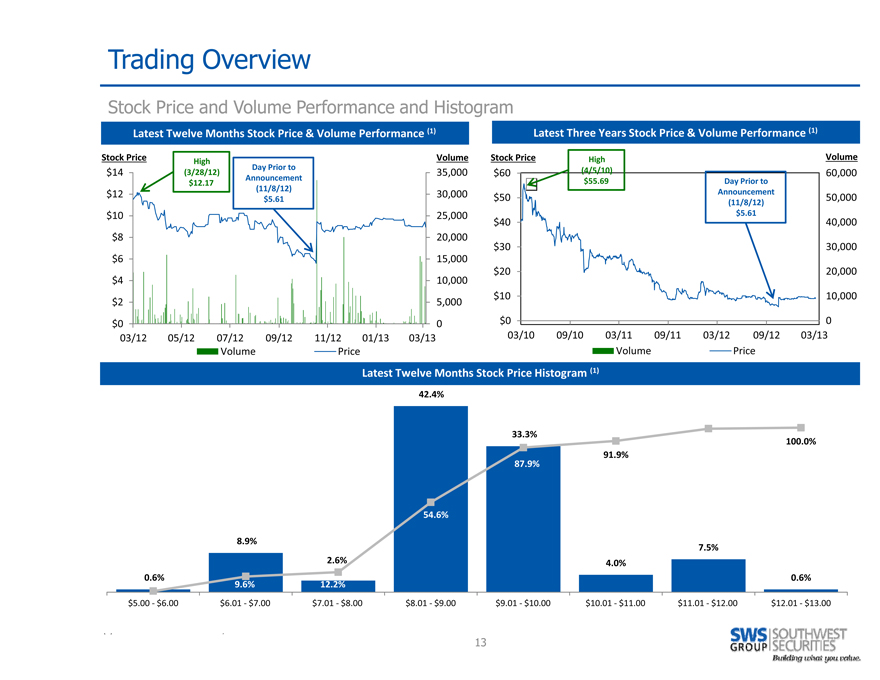
Trading Overview
Stock Price and Volume Performance and Histogram
Latest Twelve Months Stock Price & Volume Performance (1) Latest Three Years Stock Price & Volume Performance (1)
Stock Price Volume Stock Price High Volume
High
$14 (3/28/12) Day Prior to 35,000 $60 (4/5/10) 60,000
$12.17 Announcement $55.69 Day Prior to
$12 (11/8/12) 30,000 Announcement
$5.61 $50 50,000
(11/8/12)
$10 25,000 $5.61
$40 40,000
$8 20,000
$30 30,000
$6 15,000
$20 20,000
$4 10,000
$10 10,000
$2 5,000
$0 0 $0 0
03/12 05/12 07/12 09/12 11/12 01/13 03/13 03/10 09/10 03/11 09/11 03/12 09/12 03/13
Volume Price Volume Price
Latest Twelve Months Stock Price Histogram (1)
42.4%
33.3%
100.0%
91.9%
87.9%
54.6%
8.9% 7.5%
2.6% 4.0%
0.6% 0.6%
9.6% 12.2%
$5.00 $6.00 $6.01 $7.00 $7.01 $8.00 $8.01 $9.00 $9.01 $10.00 $10.01 $11.00 $11.01 $12.00 $12.01 $13.00
13
Section 4
Selected Comparable Public Companies
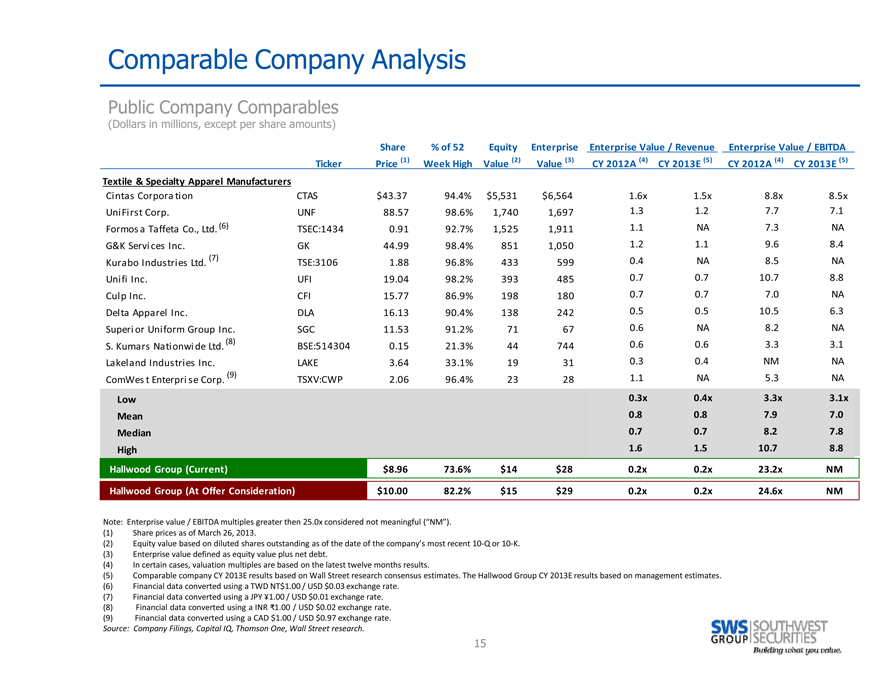
Comparable Company Analysis
Public Company Comparables
(Dollars in millions, except per share amounts)
Share % of 52 Equity Enterprise Enterprise Value / Revenue Enterprise Value / EBITDA
Ticker Price (1) Week High Value (2) Value (3) CY 2012A (4) CY 2013E (5) CY 2012A (4) CY 2013E (5)
Textile & Specialty Apparel Manufacturers
Cintas Corporation CTAS $43.37 94.4% $5,531 $6,564 1.6x 1.5x 8.8x 8.5x
UniFirst Corp. UNF 88.57 98.6% 1,740 1,697 1.3 1.2 7.7 7.1
Formos a Taffeta Co., Ltd. (6) TSEC:1434 0.91 92.7% 1,525 1,911 1.1 NA 7.3 NA
G&K Services Inc. GK 44.99 98.4% 851 1,050 1.2 1.1 9.6 8.4
Kurabo Industries Ltd. (7) TSE:3106 1.88 96.8% 433 599 0.4 NA 8.5 NA
Unifi Inc. UFI 19.04 98.2% 393 485 0.7 0.7 10.7 8.8
Culp Inc. CFI 15.77 86.9% 198 180 0.7 0.7 7.0 NA
Delta Apparel Inc. DLA 16.13 90.4% 138 242 0.5 0.5 10.5 6.3
Superior Uniform Group Inc. SGC 11.53 91.2% 71 67 0.6 NA 8.2 NA
S. Kumars Nationwide Ltd. (8) BSE:514304 0.15 21.3% 44 744 0.6 0.6 3.3 3.1
Lakel and Industries Inc. LAKE 3.64 33.1% 19 31 0.3 0.4 NM NA
ComWest Enterprise Corp. (9) TSXV:CWP 2.06 96.4% 23 28 1.1 NA 5.3 NA
Low 0.3x 0.4x 3.3x 3.1x
Mean 0.8 0.8 7.9 7.0
Median 0.7 0.7 8.2 7.8
High 1.6 1.5 10.7 8.8
Hallwood Group (Current) $8.96 73.6% $14 $28 0.2x 0.2x 23.2x NM
Hallwood Group (At Offer Consideration) $10.00 82.2% $15 $29 0.2x 0.2x 24.6x NM
Note: Enterprise value / EBITDA multiples greater then 25.0x considered not meaningful (“NM”).
(1) Share prices as of March 26, 2013.
(2) Equity value based on diluted shares outstanding as of the date of the company’s most recent 10 Q or 10 K.
(3) Enterprise value defined as equity value plus net debt.
(4) In certain cases, valuation multiples are based on the latest twelve months results.
(5) Comparable company CY 2013E results based on Wall Street research consensus estimates.
The Hallwood Group CY 2013E results based on management estimates.
(6) Financial data converted using a TWD NT$1.00 / USD $0.03 exchange rate.
(7) Financial data converted using a JPY Ą1.00 / USD $0.01 exchange rate.
(8) Financial data converted using a INR 1.00 / USD $0.02 exchange rate.
(9) Financial data converted using a CAD $1.00 / USD $0.97 exchange rate.
Source: Company Filings, Capital IQ, Thomson One, Wall Street research.
15

Selected Comparable Company Analysis
Summary Analysis
(Dollars in millions, except per share amounts)
Comparables Market Valuation Summary
Hallwood Implied per Share
Group Multiple Reference Range Equity Value (1)
Data Low Median High Low Median High
Adjusted EBITDA
CY 2012 $1.2 3.3x 8.2x 10.7x NM NM NM
CY 2013E (0.9) 3.1 7.8 8.8 NM NM NM
Reference Range NM NM NM
Offer Price $10.00
(1) Calculated based on implied enterprise value less net debt of $14.0 million divided by 1.5 million
total shares outstanding. The implied per share equity values based on CY 2012 and CY2013E EBITDA
resulted in negative values and therefore were determined to be not meaningful (“NM”).
16

Section 5
Selected Precedent Transactions

Selected Precedent Transactions
Precedent Merger and Acquisition Transactions
(Dollars in millions)
Date Date LTM LTM Enterprise Value/
Announced Closed Acquirer Target EV (1) Revenue EBITDA LTM Revenue LTM EBITDA
06/28/12 07/27/12 Qualium Investissement Kermel S.A. (2) $106 $47 $13 2.3x 8.2x
04/11/12 05/31/12 Lear Corp. (NYSE:LEA) Guil ford Performance Texti les , Inc. 257 400 0.6
05/11/11 07/31/11 Bangladesh Export Import Company Ltd. (DSE:BEXIMCO) Bextex Limited (3) 431 236 67 1.8 6.4
12/06/10 02/22/11 Gilde Buy Out Partners Gamma Holdi ng NV (4) 686 869 107 0.8 6.4
10/04/10 01/28/11 The Blackstone Group Polymer Group, Inc. 670 1,110 114 0.6 5.9
03/08/07 04/01/07 International Textile Group, Inc. (OTCPK:ITXN) Global Safety Textiles GmbH (5) 207 305 34 0.7 6.1
Low 0.6x 5.9x
Mean 1.1 6.6
Median 0.7 6.4
High 2.3 8.2
USD $1.23 exchnage rate.
USD $1.33 exchnage rate.
(1) Enterprise value (“EV”) based on the announced transaction terms and of the public information
available at the time of the announcement. (2) Financial data converted using a EUR €1.00 / USD $1.34 exchange rate.
(3) Financial data converted using a BDT €1.00 /USD $0.01 exchange rate. (4) Financial data converted using a EUR €1.00 /USD $1.23 exchange rate (5) Financial data converted using a EUR €1.00 / USD $1.33 exchange rate.
Source: Company Filings, Capital IQ, Thomson One, Wall Street research.
18
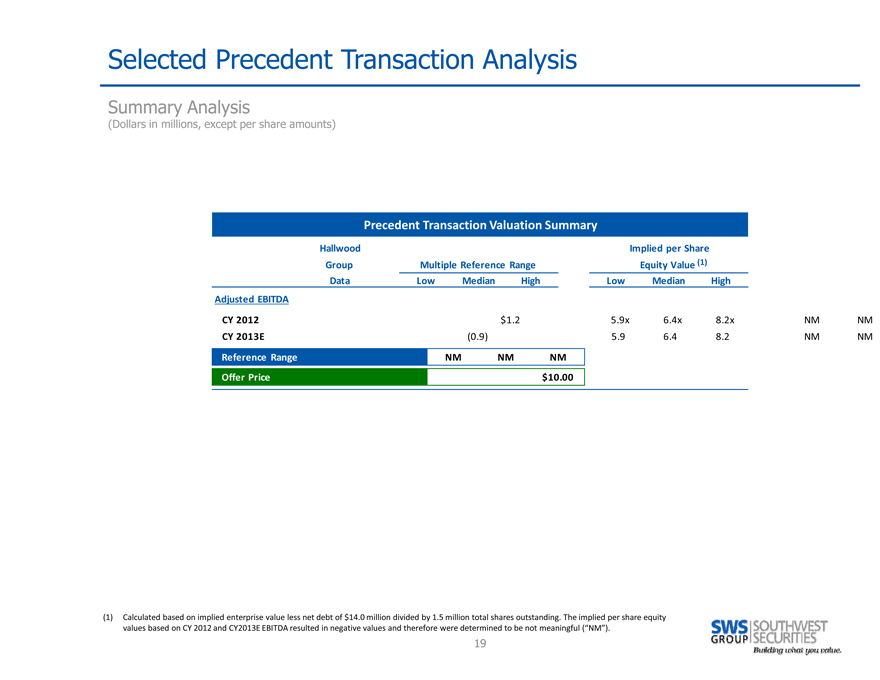
Selected Precedent Transaction Analysis
Summary Analysis
(Dollars in millions, except per share amounts)
Precedent Transaction Valuation Summary
Hallwood Implied per Share
Group Multiple Reference Range Equity Value (1)
Data Low Median High Low Median High
Adjusted EBITDA
CY 2012 $1.2 5.9x 6.4x 8.2x NM NM
CY 2013E (0.9) 5.9 6.4 8.2 NM NM
Reference Range NM NM NM
Offer Price $10.00
(1) Calculated based on implied enterprise value less net debt of $14.0 million divided by 1.5 million
total shares outstanding. The implied per share equity values based on CY 2012 and CY2013E EBITDA
resulted in negative values and therefore were determined to be not meaningful (“NM”).
19
Section 6
Discounted Cash Flow Analysis
Discounted Cash Flow Analysis
Management has not prepared or made available to SWS financial forecasts beyond 2013 and; therefore, a discounted cash flow analysis is not available.
21

Section 7
Premium Analysis
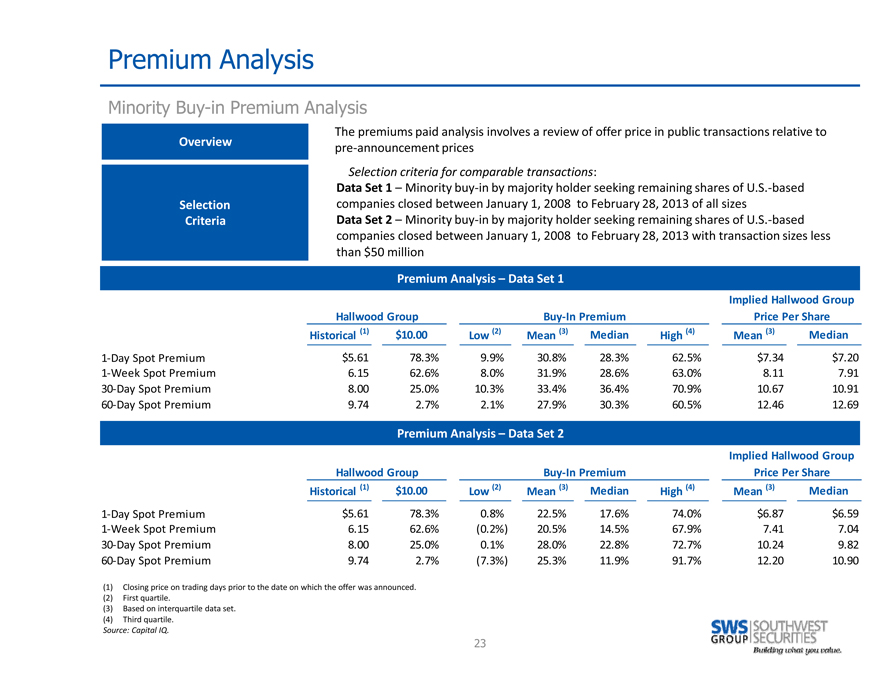
Premium Analysis
Minority Buy-in Premium Analysis
The premiums paid analysis involves a review of offer price in public transactions relative to
Overview pre announcement prices
Selection criteria for comparable transactions:
Data Set 1 – Minority buy in by majority holder seeking remaining shares of U.S. based
Selection companies closed between January 1, 2008 to February 28, 2013 of all sizes
Criteria Data Set 2 – Minority buy in by majority holder seeking remaining shares of U.S. based
companies closed between January 1, 2008 to February 28, 2013 with transaction sizes less
than $50 million
Premium Analysis – Data Set 1
Implied Hallwood Group
Hallwood Group Buy In Premium Price Per Share
Historical (1) $10.00 Low (2) Mean (3) Median High (4) Mean (3) Median
1 Day Spot Premium $5.61 78.3% 9.9% 30.8% 28.3% 62.5% $7.34 $7.20
1 Week Spot Premium 6.15 62.6% 8.0% 31.9% 28.6% 63.0% 8.11 7.91
30 Day Spot Premium 8.00 25.0% 10.3% 33.4% 36.4% 70.9% 10.67 10.91
60 Day Spot Premium 9.74 2.7% 2.1% 27.9% 30.3% 60.5% 12.46 12.69
Premium Analysis – Data Set 2
Implied Hallwood Group
Hallwood Group Buy In Premium Price Per Share
Historical (1) $10.00 Low (2) Mean (3) Median High (4) Mean (3) Median
1 Day Spot Premium $5.61 78.3% 0.8% 22.5% 17.6% 74.0% $6.87 $6.59
1 Week Spot Premium 6.15 62.6% (0.2%) 20.5% 14.5% 67.9% 7.41 7.04
30 Day Spot Premium 8.00 25.0% 0.1% 28.0% 22.8% 72.7% 10.24 9.82
60 Day Spot Premium 9.74 2.7% (7.3%) 25.3% 11.9% 91.7% 12.20 10.90
(1) Closing price on trading days prior to the date on which the offer was announced.
(2) First quartile.
(3) Based on interquartile data set.
(4) Third quartile.
Source: Capital IQ.
23
Section 8
Summary Valuation and Rationale
Summary Valuation and Rationale
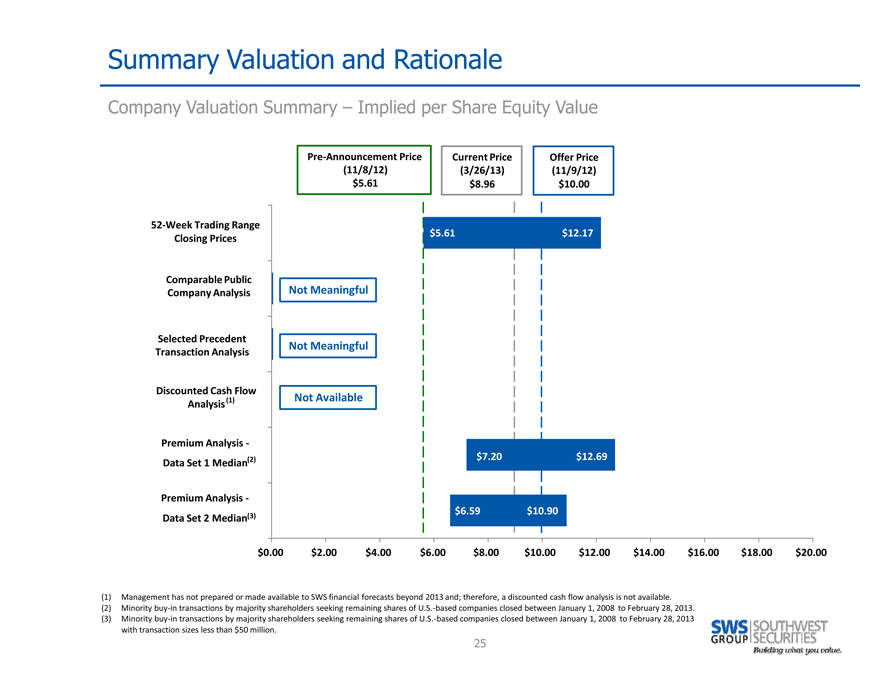
Company Valuation Summary – Implied per Share Equity Value
Pre Announcement Price Current Price Offer Price
(11/8/12) (3/26/13) (11/9/12)
$5.61 $8.96 $10.00
52 Week Trading Range
Closing Prices $5.61 $12.17
Comparable Public
Company Analysis Not Meaningful
Selected Precedent
Not Meaningful
Transaction Analysis
Discounted Cash Flow
(1) |
| Not Available |
Analysis
Premium Analysis
Data Set 1 Median(2) $7.20 $12.69
Premium Analysis
$6.59 $10.90
Data Set 2 Median(3)
$0.00 $2.00 $4.00 $6.00 $8.00 $10.00 $12.00 $14.00 $16.00 $18.00 $20.00
(1) Management has not prepared or made available to SWS financial forecasts beyond 2013
and; therefore, a discounted cash flow analysis is not available.
(2) Minority buy in transactions by majority shareholders seeking remaining shares of U.S. based companies closed between January 1, 2008 to February 28, 2013.
(3) Minority buy in transactions by majority shareholders seeking remaining shares of U.S. based companies closed between January 1, 2008 to February 28, 2013
with transaction sizes less than $50 million.
25
Summary Valuation and Rationale
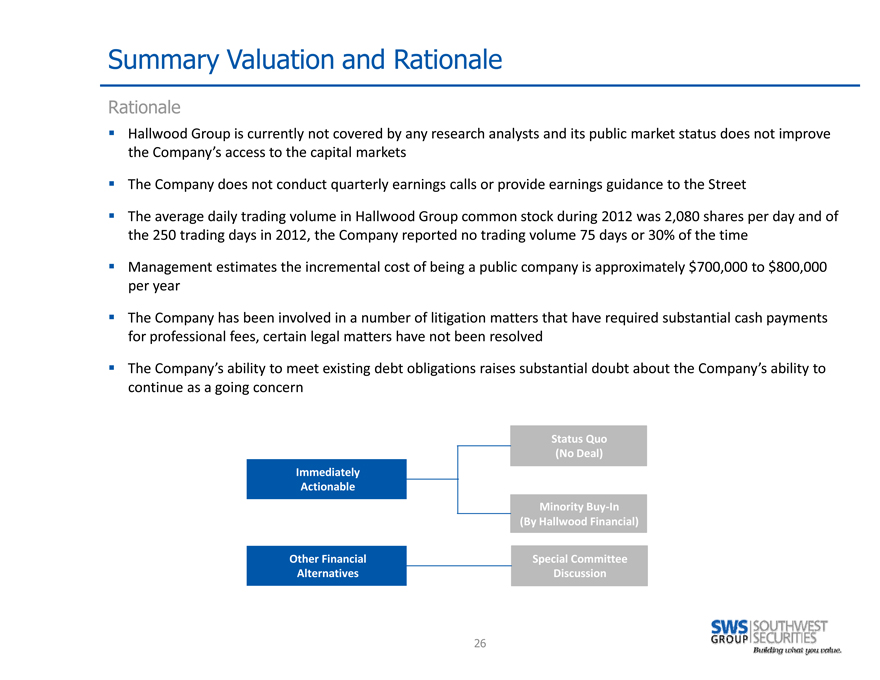
Rationale
Hallwood Group is currently not covered by any research analysts and its public market status does not improve
the Company’s access to the capital markets
The Company does not conduct quarterly earnings calls or provide earnings guidance to the Street
The average daily trading volume in Hallwood Group common stock during 2012 was 2,080 shares per day and of the
250 trading days in 2012, the Company reported no trading volume 75 days or 30% of the time
Management estimates the incremental cost of being a public company is approximately $700,000 to $800,000 per year
The Company has been involved in a number of litigation matters that have required substantial cash payments
for professional fees, certain legal matters have not been resolved
The Company’s ability to meet existing debt obligations raises substantial doubt about the Company’s ability
to continue as a going concern
Status Quo
(No Deal)
Immediately
Actionable
Minority Buy In
(By Hallwood Financial)
Other Financial Special Committee
Alternatives Discussion
26