
| Fund (Class) | Costs of $10,000 Investment | Costs Paid as a Percentage of a $10,000 Investment |
| New Alternatives Fund (Class A Shares/NALFX) | $53 | 1.04% |
- For the six-month period ending June 30, 2024, the Fund’s Class A Shares returned -3.93% with no load and -7.29% with the load.
- For the quarter ending June 30, 2024, the Fund’s Class A Shares gained 2.07% with no load and 2.00% with the load from the end of the previous quarter ending March 31, 2024.
- During the six-month period ending June 30, 2024, the Fund added positions in Ameresco, Inc., an energy management company; and GE Vernova, Inc., a wind turbine and energy transmission systems manufacturer. The Fund also sold off its holdings of Orron Energy AB, a Swedish renewable energy developer.
| Fund net assets | $274,141,620% |
| Total number of portfolio holdings | $47% |
| Portfolio turnover rate | $2% |
| Total advisory fees paid | $792,454% |
| Hannon Armstrong Sustainable Infrastructure Capital, Inc., REIT | 6.2% |
| Brookfield Renewable Corp., Class A (Canada) | 5.7% |
| Iberdrola SA (Spain) | 5.2% |
| Clearway Energy, Inc., Class A | 5.0% |
| Veolia Environnement SA (France) | 4.6% |
| Infratil Ltd. (New Zealand) | 4.5% |
| Siemens AG (Germany) | 4.4% |
| NextEra Energy Partners LP | 4.4% |
| EDP Renovaveis SA (Spain/Portugal) | 4.3% |
| Atlantica Sustainable Infrastructure PLC (United Kingdom) | 4.0% |

| Fund (Class) | Costs of $10,000 Investment | Costs Paid as a Percentage of a $10,000 Investment |
| New Alternatives Fund (Investor Shares/NAEFX) | $65 | 1.29% |
- For the six-month period ending June 30, 2024, the Fund’s no load Investor Shares returned -4.04%.
- For the quarter ending June 30, 2024, the Fund’s Investor Shares gained 2.01% from the end of the previous quarter ending March 31, 2024.
- During the six-month period ending June 30, 2024, the Fund added positions in Ameresco, Inc., an energy management company; and GE Vernova, Inc., a wind turbine and energy transmission systems manufacturer. The Fund also sold off its holdings of Orron Energy AB, a Swedish renewable energy developer.
| Fund net assets | $274,141,620% |
| Total number of portfolio holdings | $47% |
| Portfolio turnover rate | $2% |
| Total advisory fees paid | $792,454% |
| Hannon Armstrong Sustainable Infrastructure Capital, Inc., REIT | 6.2% |
| Brookfield Renewable Corp., Class A (Canada) | 5.7% |
| Iberdrola SA (Spain) | 5.2% |
| Clearway Energy, Inc., Class A | 5.0% |
| Veolia Environnement SA (France) | 4.6% |
| Infratil Ltd. (New Zealand) | 4.5% |
| Siemens AG (Germany) | 4.4% |
| NextEra Energy Partners LP | 4.4% |
| EDP Renovaveis SA (Spain/Portugal) | 4.3% |
| Atlantica Sustainable Infrastructure PLC (United Kingdom) | 4.0% |

| (b) | Not applicable. |
Item 2. Code of Ethics.
Not required in this filing.
Item 3. Audit Committee Financial Expert.
Not required in this filing.
Item 4. Principal Accountant Fees and Services.
Not required in this filing.
Item 5. Audit Committee of Listed Registrants.
Not applicable to Registrant, which is an open-end management investment company.
Item 6. Investments.
| (a) | The full Schedule of Investments in securities of unaffiliated issuers as of the close of the reporting period is included as part of the Semi-Annual Financial Statements and Other Information filed under Item 7 of this form. |
| (b) | Not applicable. |
Item 7. Financial Statements and Financial Highlights for Open-End Management Investment Companies.

ALTERNATIVE ENERGY AND THE ENVIRONMENT
CLASS A SHARES: NALFX
(Unaudited)
| THE FUND | 150 Broadhollow Road | Melville, New York 11747 | (800) 423-8383 | (631) 423-7373 |
| BNY Mellon Investment Servicing (US) Inc. | PO Box 534456 | Pittsburgh, PA 15253 | (800) 441-6580 | (610) 382-7819 |
| Overnight Address | 500 Ross Street | Pittsburgh, PA 15262 | ||
| Foreside Funds Distributors LLC | 3 Canal Plaza, Suite 100 | Portland, ME 04101 |
| Shares | Value | ||
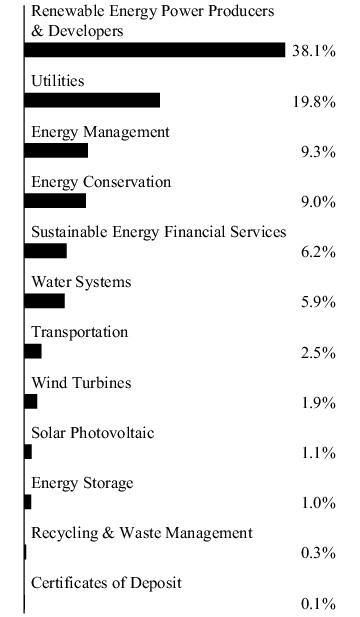
| COMMON STOCKS − 95.1% | |||
| Alternate Energy — 41.1%* | |||
| Renewable Energy Power Producers & Developers — 38.1% | |||
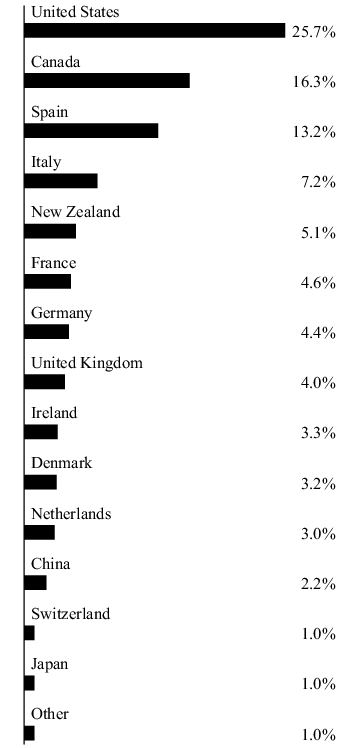
| Acciona SA (Spain) | 85,000 | $10,040,692 | |
| Atlantica Sustainable Infrastructure PLC (United Kingdom)** | 500,000 | 10,975,000 | |
| Boralex, Inc., Class A (Canada) | 125,000 | 3,086,250 | |
| Brookfield Renewable Corp., Class A (Canada) | 550,000 | 15,609,000 | |
| Brookfield Renewable Partners LP (Bermuda/Canada)*** | 100,000 | 2,477,000 | |
| Clearway Energy, Inc., Class A | 600,000 | 13,596,000 | |
| EDP Renovaveis SA (Spain/Portugal) | 836,000 | 11,683,850 | |
| Innergex Renewable Energy, Inc. (Canada) | 1,100,000 | 8,200,500 | |
| Manawa Energy Ltd. (New Zealand) | 650,000 | 1,631,170 | |
| NextEra Energy Partners LP**,*** | 435,000 | 12,023,400 | |
| Northland Power, Inc. (Canada) | 325,000 | 5,593,250 | |
| Orsted A/S (Denmark)**** | 100,000 | 5,321,731 | |
| TransAlta Corp. (Canada) | 600,000 | 4,248,000 | |
| 104,485,843 | |||
| Solar Photovoltaic — 1.1% | |||
| Array Technologies, Inc.**** | 50,000 | 513,000 | |
| Canadian Solar, Inc. (Canada)**** | 75,000 | 1,106,250 | |
| Enphase Energy, Inc.**** | 10,000 | 997,100 | |
| Shoals Technologies Group, Inc., Class A**** | 55,000 | 343,200 | |
| 2,959,550 | |||
| Wind Turbines — 1.9% | |||
| GE Vernova, Inc.**** | 10,000 | 1,715,100 | |
| Vestas Wind Systems A/S (Denmark)**** | 150,000 | 3,473,269 | |
| 5,188,369 | |||
| Total Alternate Energy | 112,633,762 | ||
| Utilities — 19.8% | |||
| Algonquin Power & Utilities Corp. (Canada) | 200,000 | 1,172,000 | |
| American Water Works Co., Inc. | 25,000 | 3,229,000 | |
| Avangrid, Inc. | 150,000 | 5,329,500 | |
| EDP - Energias de Portugal SA (Portugal) | 500,000 | 1,873,627 | |
| Enel SPA (Italy) | 1,400,000 | 9,736,649 | |
| Eversource Energy | 50,000 | 2,835,500 | |
| Hydro One Ltd. (Canada) | 125,000 | 3,642,500 | |
| Iberdrola SA (Spain) | 1,100,000 | 14,272,015 | |
| Infratil Ltd. (New Zealand) | 1,800,000 | 12,279,456 | |
| 54,370,247 | |||
| Energy Management — 9.3% | |||
| ABB Ltd. (Switzerland) SP ADR | 50,000 | 2,785,500 |
| Shares | Value | ||
| Ameresco, Inc., Class A**** | 25,000 | $720,250 | |
| Siemens AG (Germany) | 65,000 | 12,092,953 | |
| Terna-Rete Elettrica Nazionale (Italy) | 1,280,000 | 9,894,550 | |
| 25,493,253 | |||
| Energy Conservation — 9.0% | |||
| Carrier Global Corp. | 50,000 | 3,154,000 | |
| Johnson Controls International PLC (Ireland) | 50,000 | 3,323,500 | |
| Owens Corning, Inc. | 25,000 | 4,343,000 | |
| Signify NV (Netherlands) | 325,000 | 8,109,769 | |
| Trane Technologies PLC (Ireland) | 17,500 | 5,756,275 | |
| 24,686,544 | |||
| Sustainable Energy Financial Services — 6.2% | |||
| Hannon Armstrong Sustainable Infrastructure Capital, Inc., REIT | 575,000 | 17,020,000 | |
| 17,020,000 | |||
| Water Systems — 5.9% | |||
| Veolia Environnement SA (France) | 425,000 | 12,707,893 | |
| Xylem, Inc. | 25,000 | 3,390,750 | |
| 16,098,643 | |||
| Transportation — 2.5% | |||
| BYD Co. Ltd. (China) ADR | 100,000 | 5,908,000 | |
| Shimano, Inc. (Japan) ADR | 50,000 | 773,500 | |
| 6,681,500 | |||
| Energy Storage — 1.0% | |||
| Fluence Energy, Inc.**** | 50,000 | 867,000 | |
| Panasonic Holdings Corp. (Japan) ADR**** | 225,000 | 1,845,000 | |
| 2,712,000 | |||
| Recycling & Waste Management — 0.3% | |||
| Sims Ltd. (Australia) SP ADR | 125,000 | 850,000 | |
| 850,000 | |||
| Total Common Stocks (Cost $253,108,793) | 260,545,949 |
| Par | Value | ||
| CERTIFICATES OF DEPOSIT − 0.1% | |||
| Socially Concerned Banks — 0.1% | |||
| Alternatives Federal Credit Union 4.00% due 03/13/25 | $ 200,000 | $200,000 | |
| Self Help Credit Union 4.60% due 12/30/24 | 100,000 | 100,000 | |
| Total Certificates of Deposit (Cost $300,000) | 300,000 | ||
| Investments in Securities (Cost $253,408,793) — 95.2% | 260,845,949 | ||
| Other Assets in Excess of Liabilities — 4.8% | 13,295,671 | ||
| Net Assets — 100.0% | $274,141,620 | ||
| * | See (Note 8). |
| ** | These entities are commonly known as “Yieldco’s”. Yieldco’s are companies formed to own operating power assets which sell most of their electric production to major utilities under long term power purchase agreements. They are expected to pay most of their earnings in dividends to shareholders. They are similar in structure to Real Estate Investment Trusts (REITs). |
| *** | Master Limited Partnership |
| **** | Non-income producing security. |
| ADR | -American Depositary Receipts |
| LP | -Limited Partnership |
| PLC | -Public Limited Company |
| REIT | -Real Estate Investment Trust |
| SP ADR | -Sponsored American Depositary Receipts |
| ASSETS | |
Investment securities at fair value (cost: $253,408,793) (Notes 2A & 7) | $260,845,949 |
Cash | 13,712,922 |
| Receivables: | |
Capital shares subscribed | 3,515 |
Dividends | 319,451 |
Tax reclaims (Note 2D) | 608,329 |
Prepaid insurance and registration | 49,579 |
| Total Assets | 275,539,745 |
| LIABILITIES | |
| Payables: | |
Due to custodian in foreign currency (cost: $15,708) | 15,730 |
Capital shares reacquired | 1,007,251 |
Management fees | 128,108 |
Transfer agent fees | 98,771 |
Postage and printing fees | 44,278 |
Custodian fees | 41,840 |
Professional fees | 31,387 |
12b-1 fees | 3,566 |
Accrued expenses and other liabilities | 27,194 |
| Total Liabilities | 1,398,125 |
| Net Assets | $274,141,620 |
| ANALYSIS OF NET ASSETS | |
Net capital paid in shares of capital shares | $268,915,142 |
Total distributable earnings | 5,226,478 |
| Net Assets | $274,141,620 |
| Class A Shares: | |
Net Assets | $257,686,611 |
Net asset value and redemption price per share ($257,686,611/4,055,435) shares of outstanding beneficial interest, unlimited authorization, no par value | $63.54 |
Maximum offering price per share (100/96.50 of $63.54) | $65.84 |
| Investor Shares: | |
Net Assets | $16,455,009 |
Net asset value, offering and redemption* price per share ($16,455,009/260,480) shares of outstanding beneficial interest, unlimited authorization, no par value | $63.17 |
| * Redemption fee may apply (Note 1) |
| Investment Income: | |
Dividends (net of $650,584 foreign taxes withheld) | $4,701,715 |
| Total Investment Income | 4,701,715 |
| Expenses: | |
Management fees (Note 4) | 792,454 |
Transfer agent fees | 291,204 |
Administration and accounting fees | 136,267 |
Legal fees | 64,274 |
Custodian fees | 61,823 |
Registration fees | 32,833 |
Compliance service fees | 33,715 |
Postage and printing fees | 38,487 |
Trustees fees (Note 5) | 19,394 |
Audit fees | 11,934 |
12b-1 fees (Investor Shares) (Note 4) | 21,710 |
Insurance fees | 8,436 |
Other expenses | 28,631 |
| Total Expenses | 1,541,162 |
| Net Investment Income | 3,160,553 |
| Net Realized and Unrealized Gain/(Loss) from Investments and Foreign Currency Related Transactions: | |
| Realized Gain/(Loss) from Investments and Foreign Currency Related Transactions (Notes 2B & 6): | |
Net realized gain from investments | 1,292,126 |
Net realized loss from foreign currency transactions | (10,824) |
| Net Realized Gain | 1,281,302 |
| Net Change in Unrealized Appreciation/(Depreciation) on Investments and Foreign Currency Related Translations: | |
Net change in unrealized appreciation/(depreciation) on investments | (16,445,154) |
Net change in unrealized appreciation/(depreciation) on foreign currency translations | (12,277) |
| Net change in unrealized appreciation/(depreciation) | (16,457,431) |
Net Realized and Unrealized Loss on Investments and Foreign Currency Related Translations | (15,176,129) |
| Net Decrease in Net Assets Resulting from Operations | $(12,015,576) |
| For the Six Months Ended June 30, 2024 (Unaudited) | For the Year Ended December 31, 2023 | ||
| Investment Activities: | |||
Net investment income | $3,160,553 | $8,315,772 | |
Net realized gain from investments and foreign currency transactions | 1,281,302 | 3,107,065 | |
Net change in unrealized appreciation/(depreciation) on investments and foreign currency translations | (16,457,431) | (22,865,879) | |
Net decrease in net assets resulting from operations | (12,015,576) | (11,443,042) | |
| Distributions to Shareholders from distributable earnings: | |||
Class A Shares | — | (13,284,723) | |
Investor Shares | — | (729,534) | |
Total distributions to shareholders from distributable earnings | — | (14,014,257) | |
| Capital Share Transactions: | |||
Net decrease in net assets from capital share transactions (Note 3) | (39,846,651) | (27,169,763) | |
Total Decrease in Net Assets | (51,862,227) | (52,627,062) | |
| Net Assets: | |||
Beginning of the period | 326,003,847 | 378,630,909 | |
End of the period | $274,141,620 | $326,003,847 |
| Class A Shares | (Unaudited) Six Months Ended June 30, | For the Years Ended December 31, | |||||||||
| 2024 | 2023 | 2022 | 2021 | 2020 | 2019 | ||||||
| Net asset value at the beginning of period | $65.88 | $70.57 | $87.80 | $97.00 | $62.92 | $48.48 | |||||
| Investment Operations | |||||||||||
| Net investment income* | 0.68 | 1.60 | 0.75 | 0.34 | 0.26 | 0.09 | |||||
| Net realized and unrealized gain/(loss) on investments and foreign currency related transactions | (3.02) | (3.35) | (14.71) | (5.03) | 38.60 | 17.84 | |||||
| Total from investment operations | (2.34) | (1.75) | (13.96) | (4.69) | 38.86 | 17.93 | |||||
| Distributions | |||||||||||
| From net investment income | — | (2.05) | (0.80) | (0.48) | (0.07) | (0.26) | |||||
| From net realized gains | — | (0.89) | (2.46) | (3.90) | (4.71) | (3.23) | |||||
| From return of capital | — | — | (0.01) | (0.13) | — | — | |||||
| Total distributions | — | (2.94) | (3.27) | (4.51) | (4.78) | (3.49) | |||||
| Net asset value at end of period | $63.54 | $65.88 | $70.57 | $87.80 | $97.00 | $62.92 | |||||
| Total return (Sales load not reflected) | (3.55)% | (2.50)% | (15.93)% | (4.79)% | 61.76% | 36.98% | |||||
| Net assets, end of the period (in thousands) | $257,687 | $307,712 | $355,564 | $428,017 | $404,594 | $228,348 | |||||
| Ratio of expenses to average net assets | 1.04%** | 0.96% | 0.89% | 0.85% | 0.96% | 1.08% | |||||
| Ratio of net investment income to average net assets | 2.18%** | 2.33% | 0.96% | 0.36% | 0.36% | 0.16% | |||||
| Portfolio turnover | 2.39% | 7.97% | 9.21% | 8.75% | 20.34% | 18.78% | |||||
| Number of shares outstanding at end of the period | 4,055,435 | 4,670,814 | 5,038,240 | 4,875,026 | 4,171,206 | 3,629,088 | |||||
| * | The selected per share data was calculated using the average shares outstanding method for the period. |
| ** | Annualized |
| Investor Shares | (Unaudited) Six Months Ended June 30, | For the Years Ended December 31, | |||||||||
| 2024 | 2023 | 2022 | 2021 | 2020 | 2019 | ||||||
| Net asset value at the beginning of period | $65.58 | $70.21 | $87.35 | $96.52 | $62.74 | $48.36 | |||||
| Investment Operations | |||||||||||
| Net investment income/(loss)* | 0.61 | 1.42 | 0.55 | 0.11 | 0.08 | (0.05) | |||||
| Net realized and unrealized gain/(loss) on investments and foreign currency related transactions | (3.02) | (3.34) | (14.62) | (5.00) | 38.41 | 17.79 | |||||
| Total from investment operations | (2.41) | (1.92) | (14.07) | (4.89) | 38.49 | 17.74 | |||||
| Distributions | |||||||||||
| From net investment income | — | (1.82) | (0.60) | (0.25) | — | (0.13) | |||||
| From net realized gains | — | (0.89) | (2.46) | (3.90) | (4.71) | (3.23) | |||||
| From return of capital | — | — | (0.01) | (0.13) | — | — | |||||
| Total distributions | — | (2.71) | (3.07) | (4.28) | (4.71) | (3.36) | |||||
| Net asset value at end of period | $63.17 | $65.58 | $70.21 | $87.35 | $96.52 | $62.74 | |||||
| Total return | (3.67)% | (2.75)% | (16.14)% | (5.02)% | 61.35% | 36.68% | |||||
| Net assets, end of the period (in thousands) | $16,455 | $18,291 | $23,067 | $28,245 | $23,232 | $6,114 | |||||
| Ratio of expenses to average net assets | 1.29%** | 1.21% | 1.14% | 1.10% | 1.21% | 1.33% | |||||
| Ratio of net investment income/(loss) to average net assets | 1.95%** | 2.08% | 0.71% | 0.11% | 0.11% | (0.09)% | |||||
| Portfolio turnover | 2.39% | 7.97% | 9.21% | 8.75% | 20.34% | 18.78% | |||||
| Number of shares outstanding at end of the period | 260,480 | 278,919 | 328,561 | 323,368 | 240,704 | 97,453 | |||||
| * | The selected per share data was calculated using the average shares outstanding method for the period. |
| ** | Annualized |
| • | Level 1 - Unadjusted quoted prices in active markets for identical assets or liabilities that the Fund has the ability to access. |
| • | Level 2 - Observable inputs other than quoted prices included in Level 1 that are observable for the asset or liability, either directly or indirectly. These |
| • | Level 3 - Unobservable inputs for the asset or liability, to the extent relevant observable inputs are not available, representing the Fund’s own assumptions about the assumptions a market participant would use in valuing the asset or liability, and would be based on the best information available. |
| Total Value at 06/30/2024 | Level 1 - Quoted Price | Level 2 - Significant Observable Inputs | Level 3 - Significant Unobservable Inputs | ||||
| Common Stocks | |||||||
Alternate Energy | $112,633,762 | $112,633,762 | $— | $— | |||
Utilities | 54,370,247 | 54,370,247 | — | — | |||
Energy Management | 25,493,253 | 25,493,253 | — | — | |||
Energy Conservation | 24,686,544 | 24,686,544 | — | — | |||
Sustainable Energy Financial Services | 17,020,000 | 17,020,000 | — | — | |||
Water Systems | 16,098,643 | 16,098,643 | — | — | |||
Transportation | 6,681,500 | 6,681,500 | — | — | |||
Energy Storage | 2,712,000 | 2,712,000 | — | — | |||
Recycling & Waste Management | 850,000 | 850,000 | — | — | |||
Certificates of Deposit | 300,000 | — | 300,000 | — | |||
Total | $260,845,949 | $260,545,949 | $300,000 | $— |
| For the Six Months Ended June 30, 2024 | For the Year Ended December 31, 2023 | ||||||
| Shares | Amount | Shares | Amount | ||||
| Class A Shares | |||||||
| Shares of beneficial interest sold | 119,599 | $7,483,042 | 340,788 | $24,086,741 | |||
| Reinvestment of distributions | — | — | 180,186 | 11,915,691 | |||
| Redemptions | (734,978) | (46,068,763) | (888,400) | (59,839,554) | |||
| Net Decrease | (615,379) | $(38,585,721) | (367,426) | $(23,837,122) | |||
| For the Six Months Ended June 30, 2024 | For the Year Ended December 31, 2023 | ||||||
| Shares | Amount | Shares | Amount | ||||
| Investor Shares | |||||||
| Shares of beneficial interest sold | 24,513 | $1,476,187 | 31,067 | $2,080,811 | |||
| Reinvestment of distributions | — | — | 9,852 | 648,559 | |||
| Redemptions | (42,952) | (2,737,117) | (90,561) | (6,062,011) | |||
| Net Decrease | (18,439) | $(1,260,930) | (49,642) | $(3,332,641) | |||
| Total Net Decrease | (633,818) | $(39,846,651) | (417,068) | $(27,169,763) | |||
| Cost of investments for tax purposes | $253,408,793 |
| Unrealized appreciation for tax purposes | $42,370,126 |
| Unrealized depreciation for tax purposes | (34,932,970) |
| Net unrealized appreciation on investments and foreign currency translation | $7,437,156 |
| Distributions paid from: | 2023 | 2022 | |
| Ordinary Income | $10,499,035 | $4,113,084 | |
| Long-Term Capital Gains | 3,515,222 | 12,683,477 | |
| Return of Capital | — | 32,836 | |
| $14,014,257 | $16,829,397 |
| Undistributed Long-Term Capital Gains | $162,783 |
| Net Unrealized Appreciation on Investments and Foreign Currency Translations | 17,079,271 |
| $17,242,054 |
Item 8. Changes in and Disagreements with Accountants for Open-End Management Investment Companies.
Not applicable.
Item 9. Proxy Disclosures for Open-End Management Investment Companies.
Not applicable.
Item 10. Remuneration Paid to Directors, Officers, and Others of Open-End Management Investment Companies.
This information is disclosed as part of the Semi-Annual Financial Statements and Other Information filed under Item 7 of this form.
Item 11. Statement Regarding Basis for Approval of Investment Advisory Contract.
RE-APPROVAL OF INVESTMENT ADVISORY AGREEMENT – Accrued Equities, Inc. (the “Advisor”) serves as the investment adviser to New Alternatives Fund (the “Fund”). The Board of Trustees most recently approved the continuance of the investment advisory agreement between the Fund and the Advisor (the “Advisory Agreement”) at a meeting of the Board of Trustees held on March 21, 2024. The March 21, 2024 meeting was called, in part, to act upon the continuance of such Advisory Agreement. At this meeting, the Board of Trustees approved the continuance of such Advisory Agreement for a period of one year beginning March 31, 2024, under the same terms and conditions, including the provision for fees. This approval by the Board of Trustees included the approval by a majority of the trustees who are not “interested persons” of the Trust (the “Independent Trustees”), as that term is defined in the Investment Company Act of 1940, as amended, and by a majority of the entire Board.
The Advisor serves as the investment adviser to the Fund. The Advisor previously served as the investment adviser to New Alternatives Fund, Inc. (the “Predecessor Company”), a New York corporation that commenced operations in 1982. On November 14, 2014, the Predecessor Company was reorganized into the Class A Shares of the Fund. The Fund was organized to continue the investment operations and performance history of the Predecessor Company.
It was noted that the Independent Trustees were represented at this meeting by independent counsel.
Prior to the meeting, the Board received and reviewed certain materials concerning the Advisory Agreement. The materials included: (i) a memorandum prepared by independent counsel setting forth the Board’s fiduciary duties, responsibilities and the factors they should consider in their evaluation of the renewal of the Advisory Agreement; (ii) a proposed resolution; (iii) a copy of the Advisor’s responses to a request for information necessary to evaluate the terms of the Advisory Agreement renewal (the “Advisor Questionnaire”); (iv) an executed compliance program certificate; (v) a copy of the Advisor’s current Form ADV, Part I; (vi) audited financial information for the Advisor for its fiscal year ended December 31, 2023; (vii) an organizational chart for the Advisor; and (viii) a copy of the Advisory Agreement.
A copy of the Advisor’s compliance manual was available upon request. At the meeting, the Board was given the opportunity to speak with the Advisor’s Chief Compliance Officer and the Trust’s Chief Compliance Officer.
The Board noted that some of the information received in the Board materials referred to the historical relationship between the Advisor and the Predecessor Company.
The Advisor Questionnaire provided to the Board contained detailed information concerning the Advisor and the Advisory Agreement, including: (i) information on the Advisor, its business and its services; (ii) information concerning the employees of the Advisor who service the Fund; (iii) information on the Advisor’s investment process; (iv) performance information comparing the Fund and the Predecessor Company to other, similar mutual funds and to the Fund’s benchmark index; (v) information on the Advisor’s trading and brokerage practices; (vi) information concerning investment advisory fees paid to the Advisor by the Fund; (vii) information concerning other fees earned by the Advisor with respect to its relationship with the Fund, such as net underwriting fees, sales commissions for the sale of the Fund’s shares and Rule 12b-1 fees; (viii) information concerning investment advisory fees and total operating expenses as a percentage of net assets paid by the Fund and other, similar mutual funds; and (ix) other information concerning the Advisor, such as information concerning its compliance procedures, code of ethics and insurances.
It was noted that during the COVID-19 pandemic, the Advisor established its remote work procedures and was able to provide uninterrupted service to the Fund. Generally, at least one person has been in the office every business day.
Independent counsel reviewed with the Board various sections of the Advisor Questionnaire and the Advisor’s audited financial statements.
The Board of Trustees, including a majority of the Independent Trustees, decided to approve the renewal of the Advisory Agreement for a one year period commencing March 31, 2024 based upon their evaluation of: (i) the long-term relationship between the Advisor and the Fund, including the Predecessor Company; (ii) the Advisor’s commitment to the Fund’s investment objectives and its socially responsible investment policies, and the Advisor’s ability to manage the Fund’s portfolio in a manner consistent with those objectives and policies; (iii) the depth of experience and expertise of the Advisor with regard to the alternative energy market; (iv) the nature, extent and quality of the services provided; (v) the historical performance of the Fund, including the Predecessor Company; and (vi) the costs of the services provided and the profitability of the Advisor from its relationship with the Fund.
In general, the Independent Trustees considered it to be most significant that the proposed investment advisory arrangements would assure a continuity of relationships to service the Fund. The Board also noted that the Advisor continued to provide investment advisory services exclusively to the Fund and that the firm has been committed to alternative energy investing since the Predecessor Company’s commencement of operations over 40 years ago.
The Board considered the nature, quality and scope of the investment advisory services that had been provided to the Fund and the Predecessor Company by the Advisor in the past and the services that were expected to continue in the future. Further, the Board considered the Advisor’s personnel assigned to service the Fund. It was noted that Mr. Rosenblith was a minority shareholder in the Advisor. The Board considered the decrease in assets in the Fund during the year. The Advisor represented to the Board that the size of the Fund was still manageable by the portfolio management team currently in place. The Board concluded that the nature, quality and scope of the investment advisory services provided by the Advisor were very good.
The Board considered the performance results of the Fund, including the Predecessor Company, over various time periods. They reviewed information comparing the Fund’s performance with the performance of other, similar mutual funds and with its broad-based benchmark index. The Fund’s industry peer group was comprised of two other socially responsible mutual funds with an international scope and a focus on the environment and renewable energy. It was noted that there had been no change in the composition of the industry peer group from the prior year. The Board reviewed the Fund’s performance both with the sales load factored in and without the sales load. This was done because one of the funds in the industry peer group and the broad-based benchmark index do not have sales loads.
Both classes of the Fund’s shares underperformed one of its industry peer group funds for the one-year and five-year periods ended December 31, 2023, and outperformed the same fund for the ten-year (or life of the class, if shorter) period ended December 31, 2023. Both classes of the Fund’s shares underperformed the other industry peer group fund for the one-year and five-year periods ended December 31, 2023, and outperformed that same industry peer group fund for the ten-year (or life of the class, if shorter) period ended December 31, 2023. Both classes of the Fund’s shares underperformed their broad-based benchmark index for the one-year, five-year and ten-year (or life of the class, if shorter) period ended December 31, 2023.
The Board considered the investment advisory fees and other expenses paid by the Fund directly and in comparison to information regarding the fees and expenses incurred by the Fund’s industry peer group. The Board noted that the investment advisory fee for the Fund had break points that lowered the investment advisory fee rate as Fund assets reached certain levels. The Board also noted that the other comparable funds in its industry peer group were each subject to an expense limitation cap but that the Fund’s expense ratio reflected total gross expenses, without any waivers or expense reimbursements. The Fund’s investment advisory fee, after breakpoints, was 0.53%. The Advisor’s investment advisory fee as a percentage of average net assets, giving effect to the breakpoint fee schedule, was significantly lower than that of its industry peers. In addition, total annual fund operating expenses of the Fund were comparable to or lower than that of its industry peer group. Based on the foregoing, the Board determined that the investment advisory fee was appropriate.
The Independent Trustees reviewed and discussed other aspects of the Advisor, such as the profitability of the Advisor, the benefits each party received from their long-term relationship, the Advisor’s entrepreneurial risks, and the fact that the Advisor was eligible to receive other compensation from the relationship. The Board noted favorably that the Advisor was using its own resources to assist in the sales and marketing activities of the Fund.
The audited financial information provided by the Advisor indicated that the Advisor was well capitalized and profitable. In addition, the Board noted that the Advisor had no expense limitation commitments with the Fund.
The Board noted that the Advisor was also a registered broker-dealer and was eligible to receive underwriting fees and sales commissions on the sale of Fund shares, as well as fees from the Investor Shares’ Rule 12b-1 plan. The Board noted that two of the trustees, David J. Schoenwald and Murray D. Rosenblith, were owners, directors and/or officers of the Advisor, and would benefit by the approval of the investment advisory and sub-distribution agreements, and the continuation of the Rule 12b-1 plan for Investor Shares.
The Board reviewed the Advisor’s brokerage policies noting that the Advisor does not engage in any directed brokerage or soft dollar transactions. Best price and execution were the Advisor’s brokerage criteria.
In their deliberations, the Board did not rely upon comparisons of the services to be rendered and the amounts to be paid under the contract with those under other investment advisory contracts, such as contracts of the same and other investment advisers with other registered investment companies or other types of clients (e.g., pension funds and other institutional investors). These factors were considered not to be relevant in a situation where the Board was determining whether to re-approve the agreement with an existing entity on the same terms and conditions. Such factors would be relevant to considering and approving new investment advisory agreements with other investment advisory entities. In addition, the Advisor does not service any other investment advisory accounts.
| Item 12. | Disclosure of Proxy Voting Policies and Procedures for Closed-End Management Investment Companies. |
Not applicable to Registrant, which is an open-end management investment company.
Item 13. Portfolio Managers of Closed-End Management Investment Companies.
Not applicable to Registrant, which is an open-end management investment company.
Item 14. Purchases of Equity Securities by Closed-End Management Investment Company and Affiliated Purchasers.
Not applicable to Registrant, which is an open-end management investment company.
Item 15. Submission of Matters to a Vote of Security Holders.
There have been no material changes to the procedures by which the shareholders may recommend nominees to the Registrant’s Board of Trustees, where those changes were implemented after the Registrant last provided disclosure in response to the requirements of Item 407(c)(2)(iv) of Regulation S-K (17 CFR 229.407) (as required by Item 22(b)(15) of Schedule 14A (17 CFR 240.14a-101)), or this Item.
Item 16. Controls and Procedures.
| (a) | The Registrant’s principal executive officer and principal financial officer, based on his evaluation of the Registrant’s disclosure controls and procedures (as defined in Rule 30a-3(c) under the Investment Company Act of 1940, as amended (the “1940 Act”)) as of a date within 90 days of the filing date of this report, has concluded that such disclosure controls and procedures are reasonably designed and are operating effectively to ensure that material information relating to the Registrant, including its consolidated subsidiaries, is made known to him by others within those entities, particularly during the period in which this report is being prepared, and that the information required in filings on Form N-CSR is recorded, processed, summarized, and reported on a timely basis. |
| (b) | There were no changes in the Registrant’s internal control over financial reporting (as defined in Rule 30a-3(d) under the 1940 Act (17 CFR 270.30a-3(d)) that occurred during the period covered by this report that has materially affected, or is reasonably likely to materially affect, the registrant’s internal control over financial reporting. |
Item 17. Disclosure of Securities Lending Activities for Closed-End Management Investment Companies.
Not applicable.
Item 18. Recovery of Erroneously Awarded Compensation.
Not applicable.
Item 19. Exhibits.
| (a)(1) | Not required in this filing. |
| (a)(2) | Not required in this filing. |
| (a)(3) |
| (b) |
SIGNATURES
Pursuant to the requirements of the Securities Exchange Act of 1934 and the Investment Company Act of 1940, the registrant has duly caused this report to be signed on its behalf by the undersigned, thereunto duly authorized.
| (Registrant) New Alternatives Fund | ||
| By (Signature and Title)* | /s/ David J. Schoenwald | |
| David J. Schoenwald, President and Treasurer | ||
| (principal executive officer and principal financial officer) | ||
| Date August 29, 2024 | ||
Pursuant to the requirements of the Securities Exchange Act of 1934 and the Investment Company Act of 1940, this report has been signed below by the following persons on behalf of the registrant and in the capacities and on the dates indicated.
| By (Signature and Title)* | /s/ David J. Schoenwald | |
David J. Schoenwald, President and Treasurer (principal executive officer and principal financial officer) | ||
| Date August 29, 2024 | ||
* Print the name and title of each signing officer under his or her signature.