UNITED STATES
SECURITIES AND EXCHANGE COMMISSION
Washington, D.C. 20549
FORM N-CSR/A
CERTIFIED SHAREHOLDER REPORT OF REGISTERED
MANAGEMENT INVESTMENT COMPANIES
Investment Company Act file number 811-03290
Name of Fund: BlackRock Variable Series Funds, Inc.
BlackRock Balanced Capital V.I. Fund
Fund Address: 100 Bellevue Parkway, Wilmington, DE 19809
Name and address of agent for service: John M. Perlowski, Chief Executive Officer, BlackRock Variable Series
Funds, Inc., 55 East 52nd Street, New York, NY 10055
Registrant’s telephone number, including area code: (800) 441-7762
Date of fiscal year end: 12/31/2012
Date of reporting period: 06/30/2012
EXPLANATORY NOTE
The Registrant is filing this amendment to its amended Form N-CSR for the period ended June 30, 2012, filed with the Securities and Exchange Commission on September 5, 2012 (Accession Number 0001193125-12-380442).
The Class III Shares BlackRock Balanced Capital V.I. Fund of BlackRock Variable Series Funds, Inc. are scheduled to re-open to new investors effective January 22, 2013.
Item 1 – Report to Stockholders
JUNE 30, 2012
| | | | |
SEMI-ANNUAL REPORT (UNAUDITED) | | | |  |
BlackRock Variable Series Funds, Inc.
|
| Not FDIC Insured • May Lose Value • No Bank Guarantee |
Dear Shareholder
One year ago, risk assets were in a broad retreat as sovereign debt problems loomed over Europe and confidence in both the US and global economic recoveries was waning. Last summer’s prolonged debt ceiling debate in Washington, DC ended with Standard & Poor’s historic downgrade of US government debt, an event that triggered financial-market turmoil all over the world. Extraordinary levels of volatility persisted in the months that followed as the debt situation in Europe intensified. Macro-level news drove asset prices broadly up and down in lockstep, in a “risk on” — “risk off” trading pattern. Equity markets crumbled while safe-haven assets such as US Treasuries and gold rallied to historic highs by the end of the third quarter of 2011.
By October, however, improving economic data and more concerted efforts among European leaders toward stemming the region’s debt crisis drew investors back to the markets. Improving sentiment carried over into early 2012 as investors saw some relief from the world’s financial woes. Risk assets (including stocks, commodities and high yield bonds) moved boldly higher through the first two months of 2012 while climbing Treasury yields pressured higher-quality fixed income assets.
However, risk assets reversed course in the spring when Europe’s debt problems boiled over once again. Markets became highly volatile as political instability in Greece threatened the country’s membership in the euro zone. Spain faced severe deficit issues while the nation’s banks clamored for liquidity. Yields on Spanish and Italian government debt rose to levels deemed unsustainable. European leaders conferred and debated vehemently over the need for fiscal integration among the 17 euro-zone nations to resolve the crisis for the long term.
Alongside the drama in Europe, investors were discouraged by gloomy economic reports from various parts of the world. A slowdown in China, a key powerhouse for global growth, became particularly worrisome. In the United States, disappointing jobs reports dealt a crushing blow to sentiment. Risk assets sold off through April and May as investors ran back to safe havens including US, German and UK government debt as well as gold. As the period drew to a close, risk assets were beginning to rebound modestly as European leaders stepped up their efforts to move toward fiscal unity and investors anticipated additional stimulus from central banks on both sides of the Atlantic.
All asset classes posted gains for the 6-month period ended June 30, 2012, with US stocks delivering the largest returns. On a 12-month basis, US large-cap stocks generated positive results; however, small-cap stocks finished in negative territory and international and emerging equities, which experienced significant downturns in 2011, lagged the broader rebound. Among fixed income asset classes, safe-haven US Treasury bonds and municipal bonds outperformed corporate credits for the 12-month period. Continued low short-term interest rates kept yields on money market securities near their all-time lows.
We know that investors continue to face a world of uncertainty and highly volatile markets, but we also believe these challenging times present many opportunities. We remain committed to working with you and your financial professional to identify actionable ideas for your portfolio. We encourage you to visit blackrock.com/newworld for more information.
Sincerely,

Rob Kapito
President, BlackRock Advisors, LLC

“We know that investors continue to face a world of uncertainty and highly volatile markets, but we also believe these challenging times present many opportunities.”
Rob Kapito
President, BlackRock Advisors, LLC
| | | | | | | | |
Total Returns as of June 30, 2012 | |
| | | 6-month | | | 12-month | |
US large cap equities
(S&P 500® Index) | | | 9.49 | % | | | 5.45 | % |
US small cap equities
(Russell 2000® Index) | | | 8.53 | | | | (2.08 | ) |
International equities
(MSCI Europe, Australasia,
Far East Index) | | | 2.96 | | | | (13.83 | ) |
Emerging market equities
(MSCI Emerging
Markets Index) | | | 3.93 | | | | (15.95 | ) |
3-month Treasury bill
(BofA Merrill Lynch
3-Month Treasury Bill Index) | | | 0.04 | | | | 0.05 | |
US Treasury securities
(BofA Merrill Lynch
10-Year US Treasury Index) | | | 3.44 | | | | 17.36 | |
| US investment grade bonds (Barclays US Aggregate Bond Index) | | | 2.37 | | | | 7.47 | |
Tax-exempt municipal bonds
(S&P Municipal Bond Index) | | | 4.14 | | | | 10.16 | |
US high yield bonds
(Barclays US Corporate High Yield 2% Issuer Capped Index) | | | 7.23 | | | | 7.21 | |
|
| Past performance is no guarantee of future results. Index performance is shown for illustrative purposes only. You cannot invest directly in an index. | |
| | | | |
| | | | | |
| | THIS PAGE NOT PART OF YOUR FUND REPORT | | |
JUNE 30, 2012
| | | | |
SEMI-ANNUAL REPORT (UNAUDITED) | | | | |
BlackRock Balanced Capital V.I. Fund
|
| Not FDIC Insured • May Lose Value • No Bank Guarantee |
BlackRock Variable Series Funds, Inc.
BlackRock Balanced Capital V.I. Fund
Fund Summary as of June 30, 2012
Investment Objective
BlackRock Balanced Capital V.I. Fund’s (the “Fund”) investment objective is to seek a level of current income and degree of stability of principal not normally available from an investment solely in equity securities, as well as the opportunity for capital appreciation greater than is normally available from an investment solely in debt securities.
On February 27, 2012, the Fund eliminated its non-fundamental policy that had prevented the Fund from investing in securities of foreign issuers if at the time of acquisition more than 20% of the Fund’s total assets would be invested in such securities.
Portfolio Management Commentary
How did the Fund perform?
| | — | | For the six-month period ended June 30, 2012, the Fund underperformed its blended benchmark (60% Russell 1000® Index/40% Barclays US Aggregate Bond Index). |
What factors influenced performance?
| | — | | From an asset class perspective, the Fund benefited from its allocation decisions during the first half of the year. Early in 2012, as equities advanced, the Fund benefited from a slight overweight in equities versus fixed income. In the latter half of the period, the Fund allowed its equity allocation to drift downward with falling stock market prices. |
| | — | | The Fund underperformed its blended benchmark due primarily to security selection in the equity portion of the Fund, most notably in the financials and information technology (“IT”) sectors. In financials, stock selection within diversified financial services, commercial banks and capital markets hurt returns, as did overexposure to life insurers as the industry struggled amid the sharp declines in interest rates and emerging underwriting quality concerns. Relative to the Russell 1000® Index, the Fund’s broad underweight to the financials sector hindered returns, especially during the first half of the reporting period, when riskier assets outperformed amid improved economic data and investor confidence. In the IT sector, the Fund was underweight in select mega-cap benchmark names that performed well during the period, while it was biased toward commodity-exposed hardware securities that lagged on weakness in enterprise and personal computer demand. |
| | — | | Positive performance in the equity portion of the Fund was derived from stock selection in the materials sector, where the Fund’s chemicals industry holdings were standout performers. Stock selection also contributed positively in the consumer discretionary sector, with particularly strong returns from the Fund’s travel-related holdings. |
| | — | | The fixed income portion of the Fund outperformed the Barclays US Aggregate Bond Index, primarily due to an overweight to non-government spread sectors. More specifically, an overweight to commercial mortgage-backed securities (“CMBS”) boosted returns as well as allocations to the high yield debt and non-agency residential mortgage-backed securities (“MBS”) sectors, which are not represented in the benchmark index. An overweight to investment grade credit, security selection within industrials and active trading within the agency MBS sector also had positive impacts. |
| | — | | The Fund maintained a short duration bias relative to the Barclays US Aggregate Bond Index, which detracted slightly from performance as concerns about Europe’s sovereign debt trouble dominated financial markets and US Treasury yields reached new all-time lows. However, the Fund’s yield curve-flattening bias more than offset the negative effect of its short duration stance as longer-dated bonds rallied significantly. |
Describe recent portfolio activity.
| | — | | During the period, the Fund maintained a general cautious stance given concerns about the global economy. From an asset allocation perspective, the Fund’s equity position was |
| | | | |
| | | | | |
| 2 | | BLACKROCK VARIABLE SERIES FUNDS, INC. | | JUNE 30, 2012 |
| | reduced in favor of fixed income. Within equities, the Fund increased exposure to financials, industrials and energy, and reduced its weightings in consumer staples and health care. In fixed income, the Fund actively managed duration while maintaining a short duration bias relative to the benchmark index. The Fund slightly reduced risk by decreasing its net exposure to corporate credit and adding to its US Treasury positions. Also during the period, the Fund slightly reduced exposure to the agency MBS sector, and increased exposure to high quality CMBS and auto loan asset-backed securities (“ABS”). |
Describe portfolio positioning at period end.
| | — | | The Fund ended the period broadly neutral to its blended benchmark, with a slight underweight in equities and corresponding overweight in fixed income. Within equities, the Fund’s largest sector overweights relative to |
| | | the Russell 1000® Index were in health care and consumer discretionary, while consumer staples and financials were the largest underweights. Relative to the Barclays US Aggregate Bond Index, the fixed income segment was overweight in CMBS, ABS, investment grade corporate credit and agency MBS, and underweight in US Treasuries and agency debentures. The Fund also held out-of-index allocations to non-agency residential MBS and high yield corporate credit. The Fund ended the period with a shorter duration relative to the benchmark index. The outlook for the global economy is fragmented, with Europe in recession and the US and emerging markets expected to outperform other parts of the world. However, sluggish aggregate global growth does not necessarily mean a poor outlook for risk assets. Nevertheless, Fund management remains conscious of downside risk from policy mistakes and negative economic surprises. |
The views expressed reflect the opinions of BlackRock as of the date of this report and are subject to change based on changes in market, economic or other conditions. These views are not intended to be a forecast of future events and are no guarantee of future results.
| | | | |
| | | | | |
| JUNE 30, 2012 | | BLACKROCK VARIABLE SERIES FUNDS, INC. | | 3 |
BlackRock Variable Series Funds, Inc.
BlackRock Balanced Capital V.I. Fund
Total Return Based on a $10,000 Investment
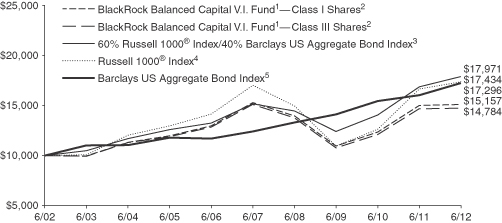
| 1 | The Fund invests in equity securities and fixed income securities. |
| 2 | Assuming transaction costs, if any, and other operating expenses, including investment advisory fees. Does not include insurance- related fees and expenses. The returns for Class III Shares, which have not recommenced operations as of the date of this report, are based upon performance of the Fund’s Class I Shares. The returns for Class III Shares, however, are adjusted to reflect the distribution (12b-1) fees applicable to Class III Shares. |
| 3 | The Fund compares its performance to that of a customized weighted index comprised of the returns of the Russell 1000® Index (60%) and Barclays US Aggregate Bond Index (40%). |
| 4 | This unmanaged broad-based index measures the performance of the 1,000 largest companies in the Russell 3000® Index, which represents approximately 91% of the total market capitalization of the Russell 3000® Index. |
| 5 | This unmanaged index is a widely recognized market-weighted index comprised of investment grade corporate bonds, rated BBB or better, mortgages and US Treasury and US government agency issues with at least one year to maturity. |
Performance Summary for the Period Ended June 30, 2012
| | | | | | | | | | | | | | | | |
| | | 6-Month Total Returns7 | | | Average Annual Total Returns | |
| | | | 1 Year7 | | | 5 Years7 | | | 10 Years7 | |
Class I Shares6 | | | 4.65 | % | | | 0.59 | % | | | (0.25 | )% | | | 4.25 | % |
Class III Shares6 | | | 4.52 | 8 | | | 0.34 | 8 | | | (0.50 | )8 | | | 3.99 | 8 |
60% Russell 1000® Index/40% Barclays US Aggregate Bond Index | | | 6.67 | | | | 6.07 | | | | 3.39 | | | | 6.04 | |
Russell 1000® Index | | | 9.38 | | | | 4.37 | | | | 0.39 | | | | 5.72 | |
Barclays US Aggregate Bond Index | | | 2.37 | | | | 7.47 | | | | 6.79 | | | | 5.63 | |
| 6 | Average annual and cumulative total investment returns are based on changes in net asset value for the periods shown, and assume reinvestment of all dividends and capital gains distributions at net asset value on the ex-dividend date. Insurance-related fees and expenses are not reflected in these returns. |
| 7 | For a portion of the period, the Fund’s investment advisor waived a portion of its fees. Without such waiver, the Fund’s performance would have been lower. |
| 8 | The returns for Class III Shares, which have not recommenced operations as of the date of this report, are based upon performance of the Fund’s Class I Shares. The returns for Class III Shares, however, are adjusted to reflect the distribution (12b-1) fees applicable to Class III Shares. |
Past performance is not indicative of future results.
| | | | |
| | | | | |
| 4 | | BLACKROCK VARIABLE SERIES FUNDS, INC. | | JUNE 30, 2012 |
BlackRock Variable Series Funds, Inc.
BlackRock Balanced Capital V.I. Fund
Fund Information as of June 30, 2012
| | | | |
| Portfolio Composition | | Percent of
Long-Term Investments | |
Common Stocks | | | 49 | % |
US Government Sponsored Agency Securities | | | 24 | |
US Treasury Obligations | | | 11 | |
Corporate Bonds | | | 10 | |
Non-Agency Mortgage-Backed Securities | | | 3 | |
Asset-Backed Securities | | | 2 | |
Foreign Agency Obligations | | | 1 | |
Disclosure of Expenses
Shareholders of the Fund may incur the following charges: (a) expenses related to transactions, including sales charges and exchange fees; and (b) operating expenses, including advisory fees, service and distribution fees, including 12b-1 fees, and other Fund expenses. The expense example shown below (which is based on a hypothetical investment of $1,000 invested on January 1, 2012 and held through June 30, 2012) is intended to assist shareholders both in calculating expenses based on an investment in the Fund and in comparing these expenses with similar costs of investing in other mutual funds.
The expense example provides information about actual account values and actual expenses. In order to estimate the expenses a shareholder paid during the period covered by this report, shareholders can divide their account value by $1,000 and then multiply the result by the number under the heading entitled “Expenses Paid During the Period.”
The expense example also provides information about hypothetical account values and hypothetical expenses based on the Fund’s actual expense ratio and an assumed rate of return of 5% per year before expenses. In order to assist shareholders in comparing the ongoing expenses of investing in this Fund and other funds, compare the 5% hypothetical example with the 5% hypothetical examples that appear in other funds’ shareholder reports.
The expenses shown in the expense example are intended to highlight shareholders’ ongoing costs only and do not reflect any transactional expenses, such as sales charges or exchange fees, if any. Therefore, the hypothetical example is useful in comparing ongoing expenses only, and will not help shareholders determine the relative total expenses of owning different funds. If these transactional expenses were included, shareholder expenses would have been higher.
Expense Example
| | | | | | | | | | | | | | | | | | | | | | | | | | | | |
| | | Actual | | | Hypothetical2 | | | | |
| | | Beginning
Account Value
January 1, 2012 | | | Ending
Account Value
June 30, 2012 | | | Expenses Paid
During the Period1 | | | Beginning
Account Value
January 1, 2012 | | | Ending
Account Value
June 30, 2012 | | | Expenses Paid
During the Period1 | | | Annualized
Expense Ratio | |
Class I | | $ | 1,000.00 | | | $ | 1,046.50 | | | $ | 6.16 | | | $ | 1,000.00 | | | $ | 1,018.85 | | | $ | 6.07 | | | | 1.21 | % |
| 1 | Expenses are equal to the annualized expense ratio, multiplied by the average account value over the period, multiplied by 182/366 (to reflect the one-half year period shown). |
| 2 | Hypothetical 5% annual return before expenses is calculated by pro rating the number of days in the most recent fiscal half year divided by 366. |
| | | | |
| | | | | |
| JUNE 30, 2012 | | BLACKROCK VARIABLE SERIES FUNDS, INC. | | 5 |
BlackRock Variable Series Funds, Inc.
BlackRock Balanced Capital V.I. Fund
The Benefits and Risks of Leveraging
The Fund may utilize leverage to seek to enhance the yield and net asset value (“NAV”). However, these objectives cannot be achieved in all interest rate environments.
The Fund may utilize leverage through entering into reverse repurchase agreements and treasury roll transactions. In general, the concept of leveraging is based on the premise that the financing cost of assets to be obtained from leverage, which will be based on short-term interest rates, will normally be lower than the income earned by the Fund on its longer-term portfolio investments. To the extent that the total assets of the Fund (including the assets obtained from leverage) are invested in higher-yielding portfolio investments, the Fund’s shareholders will benefit from the incremental net income.
The interest earned on securities purchased with the proceeds from leverage is paid to shareholders in the form of dividends, and the value of these portfolio holdings is reflected in the per share NAV. However, in order to benefit shareholders, the yield curve must be positively sloped; that is, short-term interest rates must be lower than long-term interest rates. If the yield curve becomes negatively sloped, meaning short-term interest rates exceed long-term interest rates, income to shareholders will be lower than if the Fund had not used leverage.
If short-term interest rates rise, narrowing the differential between short-term and long-term interest rates, the incremental net income pickup will be reduced or eliminated completely. Furthermore, if prevailing short-term interest rates rise above long-term interest rates, the yield curve has a negative slope. In this case, the Fund pays higher short-term
interest rates whereas the Fund’s total portfolio earns income based on lower long-term interest rates.
Furthermore, the value of the Fund’s portfolio investments generally varies inversely with the direction of long-term interest rates, although other factors can influence the value of the portfolio investments. As a result, changes in interest rates can influence the Fund’s NAV positively or negatively in addition to the impact on Fund performance from leverage discussed above.
The use of leverage may enhance opportunities for increased income to the Fund, but as described above, it also creates risks as short- or long-term interest rates fluctuate. Leverage also will generally cause greater changes in the Fund’s NAVs and dividend rates than comparable portfolios without leverage. If the income derived from securities purchased with assets received from leverage exceeds the cost of leverage, the Fund’s net income will be greater than if leverage had not been used. Conversely, if the income from the securities purchased is not sufficient to cover the cost of leverage, the Fund’s net income will be less than if leverage had not been used, and therefore the amount available for distribution to shareholders will be reduced. The Fund may be required to sell portfolio securities at inopportune times or at distressed values in order to comply with regulatory requirements applicable to the use of leverage or as required by the terms of leverage instruments, which may cause the Fund to incur losses. The use of leverage may limit the Fund’s ability to invest in certain types of securities or use certain types of hedging strategies. The Fund will incur expenses in connection with the use of leverage, all of which are borne by shareholders and may reduce income.
Derivative Financial Instruments
The Fund may invest in various derivative financial instruments, including financial futures contracts, foreign currency exchange contracts, options and swaps, as specified in Note 2 of the Notes to Financial Statements, which may constitute forms of economic leverage. Such derivative financial instruments are used to obtain exposure to a security, index and/or market without owning or taking physical custody of securities or to hedge market, equity, credit, interest rate and/or foreign currency exchange rate risks. Derivative financial instruments involve risks, including the imperfect correlation between the value of a derivative financial instrument and the underlying asset, possible default of the counterparty to the transaction or illiquidity of
the derivative financial instrument. The Fund’s ability to use a derivative financial instrument successfully depends on the investment advisor’s ability to predict pertinent market movements accurately, which cannot be assured. The use of derivative financial instruments may result in losses greater than if they had not been used, may require the Fund to sell or purchase portfolio investments at inopportune times or for distressed values, may limit the amount of appreciation the Fund can realize on an investment, may result in lower dividends paid to shareholders or may cause the Fund to hold an investment that it might otherwise sell. The Fund’s investments in these instruments are discussed in detail in the Notes to Financial Statements.
| | | | |
| | | | | |
| 6 | | BLACKROCK VARIABLE SERIES FUNDS, INC. | | JUNE 30, 2012 |
BlackRock Variable Series Funds, Inc.
BlackRock Balanced Capital V.I. Fund
| | |
| Schedule of Investments June 30, 2012 (Unaudited) | | (Percentages shown are based on Net Assets) |
| | | | | | | | | | |
| | |
Common Stocks | | Shares | | | Value | |
| Aerospace & Defense — 2.9% | |
General Dynamics Corp. | | | | | 2,775 | | | $ | 183,039 | |
L-3 Communications Holdings, Inc. | | | | | 2,575 | | | | 190,576 | |
Lockheed Martin Corp. | | | | | 2,200 | | | | 191,576 | |
Northrop Grumman Corp. | | | | | 2,975 | | | | 189,775 | |
| | | | | | | | | | |
| | | | | | | | | | 754,966 | |
| Beverages — 0.1% | |
The Coca-Cola Co. | | | | | 200 | | | | 15,638 | |
| Capital Markets — 0.8% | |
The Goldman Sachs Group, Inc. | | | | | 2,200 | | | | 210,892 | |
| Chemicals — 0.7% | |
CF Industries Holdings, Inc. | | | | | 900 | | | | 174,366 | |
| Commercial Banks — 0.7% | |
Regions Financial Corp. | | | | | 26,225 | | | | 177,019 | |
Wells Fargo & Co. | | | | | 500 | | | | 16,720 | |
| | | | | | | | | | |
| | | | | | | | | | 193,739 | |
| Computers & Peripherals — 5.4% | |
Apple, Inc. (a) | | | | | 1,350 | | | | 788,400 | |
Dell, Inc. (a) | | | | | 14,100 | | | | 176,532 | |
Hewlett-Packard Co. | | | | | 8,550 | | | | 171,940 | |
Lexmark International, Inc., Class A | | | | | 2,375 | | | | 63,128 | |
QLogic Corp. (a) | | | | | 6,250 | | | | 85,562 | |
Western Digital Corp. (a) | | | | | 4,375 | | | | 133,350 | |
| | | | | | | | | | |
| | | | | | | | | | 1,418,912 | |
| Construction & Engineering — 0.6% | |
Chicago Bridge & Iron Co. NV | | | | | 2,200 | | | | 83,512 | |
Fluor Corp. | | | | | 1,400 | | | | 69,076 | |
| | | | | | | | | | |
| | | | | | | | | | 152,588 | |
| Consumer Finance — 0.8% | |
Discover Financial Services | | | | | 5,850 | | | | 202,293 | |
| Diversified Consumer Services — 1.1% | |
Apollo Group, Inc., Class A (a) | | | | | 4,775 | | | | 172,807 | |
ITT Educational Services, Inc. (a) | | | | | 1,845 | | | | 112,084 | |
| | | | | | | | | | |
| | | | | | | | | | 284,891 | |
| Diversified Financial Services — 2.2% | |
Citigroup, Inc. | | | | | 9,200 | | | | 252,172 | |
JPMorgan Chase & Co. | | | | | 9,050 | | | | 323,357 | |
| | | | | | | | | | |
| | | | | | | | | | 575,529 | |
| Diversified Telecommunication Services — 1.5% | |
AT&T, Inc. | | | | | 2,000 | | | | 71,320 | |
Verizon Communications, Inc. | | | | | 7,050 | | | | 313,302 | |
| | | | | | | | | | |
| | | | | | | | | | 384,622 | |
| Energy Equipment & Services — 0.6% | |
Nabors Industries Ltd. (a) | | | | | 11,825 | | | | 170,280 | |
| | | | | | | | | | |
| | |
Common Stocks | | Shares | | | Value | |
| Food & Staples Retailing — 1.2% | | | | | |
The Kroger Co. | | | | | 7,350 | | | $ | 170,446 | |
Safeway, Inc. | | | | | 8,650 | | | | 156,998 | |
| | | | | | | | | | |
| | | | | | | | | | 327,444 | |
| Health Care Equipment & Supplies — 0.7% | |
Zimmer Holdings, Inc. | | | | | 2,875 | | | | 185,035 | |
| Health Care Providers & Services — 4.2% | |
Aetna, Inc. | | | | | 3,875 | | | | 150,234 | |
AmerisourceBergen Corp. | | | | | 4,475 | | | | 176,091 | |
Cardinal Health, Inc. | | | | | 4,275 | | | | 179,550 | |
Humana, Inc. | | | | | 2,100 | | | | 162,624 | |
McKesson Corp. | | | | | 2,000 | | | | 187,500 | |
UnitedHealth Group, Inc. | | | | | 4,075 | | | | 238,387 | |
| | | | | | | | | | |
| | | | | | | | | | 1,094,386 | |
| Hotels, Restaurants & Leisure — 0.6% | |
Wyndham Worldwide Corp. | | | | | 3,175 | | | | 167,450 | |
| Household Products — 0.2% | |
The Procter & Gamble Co. | | | | | 900 | | | | 55,125 | |
| Independent Power Producers & Energy Traders — 1.0% | |
The AES Corp. (a) | | | | | 13,600 | | | | 174,488 | |
NRG Energy, Inc. (a) | | | | | 4,775 | | | | 82,894 | |
| | | | | | | | | | |
| | | | | | | | | | 257,382 | |
| Industrial Conglomerates — 1.3% | |
3M Co. | | | | | 659 | | | | 59,046 | |
General Electric Co. | | | | | 4,375 | | | | 91,175 | |
Tyco International Ltd. | | | | | 3,475 | | | | 183,654 | |
| | | | | | | | | | |
| | | | | | | | | | 333,875 | |
| Insurance — 3.4% | |
The Allstate Corp. | | | | | 600 | | | | 21,054 | |
Assurant, Inc. | | | | | 2,500 | | | | 87,100 | |
The Chubb Corp. | | | | | 2,675 | | | | 194,793 | |
Lincoln National Corp. | | | | | 7,450 | | | | 162,932 | |
MetLife, Inc. | | | | | 5,950 | | | | 183,557 | |
Protective Life Corp. | | | | | 2,100 | | | | 61,761 | |
The Travelers Cos., Inc. | | | | | 2,975 | | | | 189,924 | |
| | | | | | | | | | |
| | | | | | | | | | 901,121 | |
| Internet & Catalog Retail — 0.6% | |
Expedia, Inc. | | | | | 3,325 | | | | 159,833 | |
| Internet Software & Services — 1.3% | |
Google, Inc., Class A (a) | | | | | 575 | | | | 333,540 | |
| IT Services — 2.7% | |
Accenture Plc, Class A | | | | | 1,200 | | | | 72,108 | |
Alliance Data Systems Corp. (a) | | | | | 1,300 | | | | 175,500 | |
International Business Machines Corp. | | | | | 1,100 | | | | 215,138 | |
Total System Services, Inc. | | | | | 3,275 | | | | 78,371 | |
Portfolio Abbreviations
To simplify the listings of portfolio holdings in the Schedule of Investments, the names and descriptions of many of the securities have been abbreviated according to the following list:
| | |
| AUD | | Australian Dollar |
| CAD | | Canadian Dollar |
| CBA | | Canadian Bankers Acceptances |
| CDO | | Collateralized Debt Obligation |
| CHF | | Swiss Franc |
| CNY | | Chinese Renminbi |
| | |
| EUR | | Euro |
| JPY | | Japanese Yen |
| LIBOR | | London Interbank Offered Rate |
| RB | | Revenue Bonds |
| TBA | | To Be Announced |
| USD | | US Dollar |
See Notes to Financial Statements.
| | | | |
| | | | | |
| JUNE 30, 2012 | | BLACKROCK VARIABLE SERIES FUNDS, INC. | | 7 |
BlackRock Variable Series Funds, Inc.
BlackRock Balanced Capital V.I. Fund
| | |
| Schedule of Investments (continued) | | (Percentages shown are based on Net Assets) |
| | | | | | | | | | |
| | |
Common Stocks | | Shares | | | Value | |
| IT Services (concluded) | |
The Western Union Co. | | | | | 9,825 | | | $ | 165,453 | |
| | | | | | | | | | |
| | | | | | | | | | 706,570 | |
| Machinery — 1.9% | |
AGCO Corp. (a) | | | | | 3,375 | | | | 154,339 | |
Ingersoll-Rand Plc | | | | | 4,200 | | | | 177,156 | |
Parker Hannifin Corp. | | | | | 2,200 | | | | 169,136 | |
| | | | | | | | | | |
| | | | | | | | | | 500,631 | |
| Media — 1.9% | |
DISH Network Corp., Class A | | | | | 5,550 | | | | 158,453 | |
Gannett Co., Inc. | | | | | 9,525 | | | | 140,303 | |
Time Warner Cable, Inc. | | | | | 2,475 | | | | 203,197 | |
| | | | | | | | | | |
| | | | | | | | | | 501,953 | |
| Metals & Mining — 0.6% | |
Alcoa, Inc. | | | | | 17,275 | | | | 151,156 | |
| Multi-Utilities — 0.6% | |
Ameren Corp. | | | | | 4,875 | | | | 163,508 | |
| Multiline Retail — 1.1% | |
Dillard’s, Inc., Class A | | | | | 2,300 | | | | 146,464 | |
Nordstrom, Inc. | | | | | 3,075 | | | | 152,797 | |
| | | | | | | | | | |
| | | | | | | | | | 299,261 | |
| Office Electronics — 0.7% | |
Xerox Corp. | | | | | 22,650 | | | | 178,256 | |
| Oil, Gas & Consumable Fuels — 7.4% | |
Apache Corp. | | | | | 2,375 | | | | 208,739 | |
Chevron Corp. | | | | | 3,875 | | | | 408,812 | |
ConocoPhillips | | | | | 4,575 | | | | 255,651 | |
Denbury Resources, Inc. (a) | | | | | 10,425 | | | | 157,522 | |
Devon Energy Corp. | | | | | 2,975 | | | | 172,520 | |
Exxon Mobil Corp. | | | | | 4,575 | | | | 391,483 | |
Marathon Oil Corp. | | | | | 5,950 | | | | 152,141 | |
Marathon Petroleum Corp. | | | | | 4,375 | | | | 196,525 | |
| | | | | | | | | | |
| | | | | | | | | | 1,943,393 | |
| Paper & Forest Products — 0.5% | |
International Paper Co. | | | | | 5,075 | | | | 146,718 | |
| Pharmaceuticals — 5.3% | |
Abbott Laboratories | | | | | 4,275 | | | | 275,609 | |
Eli Lilly & Co. | | | | | 5,100 | | | | 218,841 | |
Forest Laboratories, Inc. (a) | | | | | 4,875 | | | | 170,576 | |
Johnson & Johnson | | | | | 800 | | | | 54,048 | |
Merck & Co., Inc. | | | | | 7,700 | | | | 321,475 | |
Pfizer, Inc. | | | | | 15,601 | | | | 358,823 | |
| | | | | | | | | | |
| | | | | | | | | | 1,399,372 | |
| Semiconductors & Semiconductor Equipment — 0.0% | |
Advanced Micro Devices, Inc. (a) | | | | | 1,501 | | | | 8,601 | |
| Software — 2.2% | |
Microsoft Corp. | | | | | 13,900 | | | | 425,201 | |
Symantec Corp. (a) | | | | | 10,025 | | | | 146,465 | |
| | | | | | | | | | |
| | | | | | | | | | 571,666 | |
| Specialty Retail — 3.1% | |
Advance Auto Parts, Inc. | | | | | 2,200 | | | | 150,084 | |
Best Buy Co., Inc. | | | | | 6,950 | | | | 145,672 | |
Foot Locker, Inc. | | | | | 1,800 | | | | 55,044 | |
GameStop Corp., Class A | | | | | 2,061 | | | | 37,840 | |
The Gap, Inc. | | | | | 6,150 | | | | 168,264 | |
| | | | | | | | | | |
| | |
Common Stocks | | Shares | | | Value | |
| Specialty Retail (concluded) | |
Limited Brands, Inc. | | | | | 3,475 | | | $ | 147,792 | |
PetSmart, Inc. | | | | | 1,500 | | | | 102,270 | |
| | | | | | | | | | |
| | | | | | | | | | 806,966 | |
| Tobacco — 1.1% | |
Philip Morris International, Inc. | | | | | 3,475 | | | | 303,229 | |
| Total Common Stocks — 61.0% | | | | | | | | | 16,035,187 | |
|
| |
| | | |
| Fixed Income Securities | | | | | | | | | | |
| | |
| Asset-Backed Securities | | Par (000) | | | | |
AmeriCredit Automobile Receivables Trust: | | | | | | | | | | |
Series 2011-5, Class C,
3.44%, 10/08/17 | | USD | | | 25 | | | | 25,585 | |
Series 2012-2, Class C,
2.64%, 10/10/17 | | | | | 10 | | | | 10,183 | |
Series 2012-2, Class D,
3.38%, 4/09/18 | | | | | 15 | | | | 15,084 | |
Series 2012-3, Class C,
2.42%, 5/08/18 | | | | | 10 | | | | 9,999 | |
Series 2012-3, Class D,
3.03%, 7/09/18 | | | | | 10 | | | | 9,996 | |
Capital Trust Re CDO, Ltd.,
Series 2006-4A, Class A1,
0.55%, 10/20/43 (b)(c) | | | | | 21 | | | | 17,520 | |
CarMax Auto Owner Trust: | | | | | | | | | | |
Series 2012-1, Class B,
1.76%, 8/15/17 | | | | | 5 | | | | 5,020 | |
Series 2012-1, Class C,
2.20%, 10/16/17 | | | | | 5 | | | | 5,043 | |
Series 2012-1, Class D,
3.09%, 8/15/18 | | | | | 5 | | | | 5,018 | |
Countrywide Asset-Backed Certificates,
Series 2004-5, Class A,
0.70%, 10/25/34 (c) | | | | | 8 | | | | 7,118 | |
Ford Credit Floorplan Master Owner Trust: | | | | | | | | | | |
Series 2010-5, Class C,
2.07%, 9/15/15 (b) | | | | | 20 | | | | 20,126 | |
Series 2010-5, Class D,
2.41%, 9/15/15 (b) | | | | | 10 | | | | 10,062 | |
Series 2011-2, Class C,
2.37%, 9/15/15 | | | | | 30 | | | | 30,047 | |
Series 2011-2, Class D,
2.86%, 9/15/15 | | | | | 20 | | | | 20,030 | |
Globaldrive BV, Series 2008-2, Class A,
4.00%, 10/20/16 | | EUR | | | 5 | | | | 5,953 | |
Hyundai Auto Receivables Trust,
Series 2012-A, Class D,
2.61%, 5/15/18 | | USD | | | 10 | | | | 10,066 | |
Morgan Stanley ABS Capital I,
Series 2005-HE1, Class A2MZ,
0.55%, 12/25/34 (c) | | | | | 8 | | | | 6,602 | |
New Century Home Equity Loan Trust,
Series 2005-2, Class A2MZ,
0.51%, 6/25/35 (c)(d) | | | | | 21 | | | | 20,281 | |
See Notes to Financial Statements.
| | | | |
| | | | | |
| 8 | | BLACKROCK VARIABLE SERIES FUNDS, INC. | | JUNE 30, 2012 |
BlackRock Variable Series Funds, Inc.
BlackRock Balanced Capital V.I. Fund
| | |
| Schedule of Investments (continued) | | (Percentages shown are based on Net Assets) |
| | | | | | | | | | |
| | |
| Asset-Backed Securities | |
Par (000) | | | Value | |
Santander Consumer Acquired Receivables Trust (b): | | | | | | | | | | |
Series 2011-S1A, Class B,
1.66%, 8/15/16 | | USD | | | 35 | | | $ | 34,626 | |
Series 2011-S1A, Class C,
2.01%, 8/15/16 | | | | | 32 | | | | 32,127 | |
Series 2011-WO, Class C,
3.19%, 10/15/15 | | | | | 20 | | | | 20,112 | |
Santander Drive Auto Receivables Trust:
Series 2010-2, Class C,
3.89%, 7/17/17 | | | | | 30 | | | | 31,077 | |
Series 2011-S1A, Class B,
1.48%, 5/15/17 (b)
| | | | | 30 | | | | 29,600 | |
Series 2012-1, Class B,
2.72%, 5/16/16 | | | | | 5 | | | | 5,082 | |
Series 2012-1, Class C,
3.78%, 11/15/17 | | | | | 10 | | | | 10,290 | |
Series 2012-3, Class B,
1.94%, 12/15/16 | | | | | 40 | | | | 40,019 | |
Series 2012-3, Class C,
3.01%, 4/16/18 | | | | | 60 | | | | 60,091 | |
Series 2012-3, Class D,
3.64%, 5/15/18 | | | | | 45 | | | | 45,141 | |
Series 2012-4, Class C,
2.94%, 12/15/17 (e) | | | | | 10 | | | | 9,998 | |
Series 2012-4, Class D,
3.50%, 6/15/18 (e) | | | | | 10 | | | | 9,998 | |
Scholar Funding Trust, Series 2011-A, Class A,
1.37%, 10/28/43 (b)(c) | | | | | 89 | | | | 87,169 | |
Structured Asset Investment Loan Trust,
Series 2004-8, Class M4,
1.75%, 9/25/34 (c) | | | | | 18 | | | | 8,729 | |
Structured Asset Securities Corp. (c): | | | | | | | | | | |
Series 2004-23XS, Class 2A1,
0.55%, 1/25/35 | | | | | 20 | | | | 14,547 | |
Series 2005-GEL2, Class A,
0.53%, 4/25/35 | | | | | 6 | | | | 5,430 | |
| Total Asset-Backed Securities — 2.6% | | | | 677,769 | |
|
| |
| | | |
| Corporate Bonds | | | | | | | | |
| Aerospace & Defense — 0.1% | | | | | | | | | | |
United Technologies Corp.: | | | | | | | | | | |
3.10%, 6/01/22 | | | | | 5 | | | | 5,239 | |
4.50%, 6/01/42 | | | | | 10 | | | | 10,984 | |
| | | | | | | | | | |
| | | | | | | | | | 16,223 | |
| Auto Components — 0.0% | | | | | | | | | | |
BorgWarner, Inc., 4.63%, 9/15/20 | | | | | 10 | | | | 10,892 | |
| Capital Markets — 0.1% | | | | | | | | | | |
Credit Suisse AG, 5.40%, 1/14/20 | | | | | 10 | | | | 10,401 | |
The Goldman Sachs Group, Inc.,
5.75%, 1/24/22 | | | | | 25 | | | | 26,390 | |
| | | | | | | | | | |
| | | | | | | | | | 36,791 | |
| Chemicals — 0.0% | | | | | | | | | | |
The Dow Chemical Co., 4.13%, 11/15/21 | | | | | 10 | | | | 10,726 | |
| Commercial Banks — 0.6% | | | | | | | | | | |
BNP Paribas Home Loan Covered Bonds SA, 2.20%, 11/02/15 (b) | | | | | 90 | | | | 90,129 | |
HSBC Holdings Plc, 6.10%, 1/14/42 | | | | | 10 | | | | 12,247 | |
| | | | | | | | | | |
| | |
| Corporate Bonds | |
Par (000) | | | Value | |
| Commercial Banks (concluded) | | | | | | | | | | |
VTB Capital SA, 6.55%, 10/13/20 (b) | | USD | | | 20 | | | $ | 20,125 | |
Wells Fargo & Co., 3.50%, 3/08/22 | | | | | 30 | | | | 30,869 | |
| | | | | | | | | | |
| | | | | | | | | | 153,370 | |
| Construction Materials — 0.0% | | | | | | | | | | |
Lafarge SA, 7.13%, 7/15/36 | | | | | 4 | | | | 3,960 | |
| Consumer Finance — 0.1% | | | | | | | | | | |
SLM Corp., 6.25%, 1/25/16 | | | | | 25 | | | | 26,250 | |
| Diversified Financial Services — 1.1% | | | | | | | | | | |
Bank of America Corp.: | | | | | | | | | | |
3.88%, 3/22/17 | | | | | 20 | | | | 20,374 | |
5.70%, 1/24/22 | | | | | 50 | | | | 55,065 | |
Citigroup, Inc.: | | | | | | | | | | |
4.59%, 12/15/15 | | | | | 80 | | | | 83,686 | |
4.45%, 1/10/17 | | | | | 10 | | | | 10,482 | |
General Electric Capital Corp.,
6.15%, 8/07/37 | | | | | 25 | | | | 29,536 | |
JPMorgan Chase & Co., 3.15%, 7/05/16 | | | | | 100 | | | | 102,840 | |
| | | | | | | | | | |
| | | | | | | | | | 301,983 | |
| Diversified Telecommunication Services — 0.3% | |
Level 3 Financing, Inc., 8.13%, 7/01/19 | | | | | 31 | | | | 31,814 | |
Verizon Communications, Inc.: | | | | | | | | | | |
3.50%, 11/01/21 | | | | | 20 | | | | 21,293 | |
6.40%, 2/15/38 | | | | | 27 | | | | 35,062 | |
| | | | | | | | | | |
| | | | | | | | | | 88,169 | |
| Electric Utilities — 1.0% | | | | | | | | | | |
Alabama Power Co., 3.95%, 6/01/21 | | | | | 15 | | | | 16,400 | |
The Cleveland Electric Illuminating Co.: | | | | | | | | | | |
8.88%, 11/15/18 | | | | | 2 | | | | 2,673 | |
5.95%, 12/15/36 | | | | | 9 | | | | 10,175 | |
Duke Energy Carolinas LLC, 4.25%, 12/15/41 | | | | | 5 | | | | 5,390 | |
Florida Power & Light Co., 5.95%, 2/01/38 | | | | | 25 | | | | 33,212 | |
Georgia Power Co., 3.00%, 4/15/16 | | | | | 25 | | | | 26,733 | |
Hydro-Quebec: | | | | | | | | | | |
8.40%, 1/15/22 | | | | | 25 | | | | 36,168 | |
8.05%, 7/07/24 | | | | | 65 | | | | 96,147 | |
Jersey Central Power & Light Co.,
7.35%, 2/01/19 | | | | | 5 | | | | 6,336 | |
Southern California Edison Co.,
5.63%, 2/01/36 | | | | | 6 | | | | 7,578 | |
Trans-Allegheny Interstate Line Co.,
4.00%, 1/15/15 (b) | | | | | 10 | | | | 10,502 | |
| | | | | | | | | | |
| | | | | | | | | | 251,314 | |
| Energy Equipment & Services — 0.6% | |
Ensco Plc, 4.70%, 3/15/21 | | | | | 11 | | | | 11,982 | |
MEG Energy Corp., 6.50%, 3/15/21 (b) | | | | | 30 | | | | 30,637 | |
Peabody Energy Corp., 6.25%, 11/15/21 (b) | | | | | 15 | | | | 14,850 | |
Pride International, Inc., 6.88%, 8/15/20 | | | | | 10 | | | | 12,270 | |
Transocean, Inc.: | | | | | | | | | | |
5.05%, 12/15/16 | | | | | 30 | | | | 32,539 | |
6.00%, 3/15/18 | | | | | 20 | | | | 22,340 | |
6.50%, 11/15/20 | | | | | 20 | | | | 22,686 | |
| | | | | | | | | | |
| | | | | | | | | | 147,304 | |
| Food Products — 0.2% | | | | | | | | | | |
Kraft Foods Group, Inc. (b): | | | | | | | | | | |
3.50%, 6/06/22 | | | | | 13 | | | | 13,340 | |
5.00%, 6/04/42 | | | | | 6 | | | | 6,350 | |
See Notes to Financial Statements.
| | | | |
| | | | | |
| JUNE 30, 2012 | | BLACKROCK VARIABLE SERIES FUNDS, INC. | | 9 |
BlackRock Variable Series Funds, Inc.
BlackRock Balanced Capital V.I. Fund
| | |
| Schedule of Investments (continued) | | (Percentages shown are based on Net Assets) |
| | | | | | | | | | |
| | |
| Corporate Bonds | |
Par (000) | | | Value | |
| Food Products (concluded) | | | | | | | | | | |
Kraft Foods, Inc.: | | | | | | | | | | |
6.50%, 8/11/17 | | USD | | | 6 | | | $ | 7,280 | |
6.50%, 2/09/40 | | | | | 20 | | | | 25,692 | |
| | | | | | | | | | |
| | | | | | | | | | 52,662 | |
| Health Care Equipment & Supplies — 0.2% | |
Boston Scientific Corp., 6.25%, 11/15/15 | | | | | 43 | | | | 48,160 | |
| Health Care Providers & Services — 0.2% | |
HCA, Inc.: | | | | | | | | | | |
6.50%, 2/15/20 | | | | | 10 | | | | 10,838 | |
7.25%, 9/15/20 | | | | | 20 | | | | 22,000 | |
Tenet Healthcare Corp.: | | | | | | | | | | |
6.25%, 11/01/18 | | | | | 15 | | | | 15,862 | |
8.88%, 7/01/19 | | | | | 10 | | | | 11,225 | |
UnitedHealth Group, Inc., 3.38%, 11/15/21 | | | | | 5 | | | | 5,259 | |
| | | | | | | | | | |
| | | | | | | | | | 65,184 | |
| Hotels, Restaurants & Leisure — 0.2% | |
MGM Resorts International: | | | | | | | | | | |
10.38%, 5/15/14 | | | | | 10 | | | | 11,275 | |
11.13%, 11/15/17 | | | | | 20 | | | | 22,450 | |
Wyndham Worldwide Corp., 4.25%, 3/01/22 | | | | | 15 | | | | 15,104 | |
| | | | | | | | | | |
| | | | | | | | | | 48,829 | |
| Independent Power Producers & Energy Traders — 0.2% | |
Energy Future Intermediate Holding Co. LLC, 10.00%, 12/01/20 | | | | | 40 | | | | 43,500 | |
Laredo Petroleum, Inc., 7.38%, 5/01/22 (b) | | | | | 10 | | | | 10,400 | |
| | | | | | | | | | |
| | | | | | | | | | 53,900 | |
| Industrial Conglomerates — 0.0% | | | | | | | | | | |
Sequa Corp., 11.75%, 12/01/15 (b) | | | | | 10 | | | | 10,550 | |
| Insurance — 2.2% | | | | | | | | | | |
Allianz Finance II BV, 5.75%, 7/08/41 | | EUR | | | 100 | | | | 113,980 | |
American International Group, Inc.: | | | | | | | | | | |
3.80%, 3/22/17 | | USD | | | 21 | | | | 21,407 | |
5.45%, 5/18/17 | | | | | 10 | | | | 10,856 | |
4.88%, 6/01/22 | | | | | 41 | | | | 41,952 | |
Fairfax Financial Holdings Ltd.,
5.80%, 5/15/21 (b) | | | | | 17 | | | | 16,642 | |
Hartford Financial Services Group, Inc.,
6.00%, 1/15/19 | | | | | 10 | | | | 10,712 | |
Hartford Life Global Funding Trusts,
0.65%, 6/16/14 (c) | | | | | 50 | | | | 49,083 | |
Lincoln National Corp., 7.00%, 6/15/40 | | | | | 10 | | | | 11,795 | |
Manulife Financial Corp., 3.40%, 9/17/15 | | | | | 20 | | | | 20,554 | |
Metropolitan Life Global Funding I (b): | | | | | | | | | | |
2.50%, 1/11/13 | | | | | 185 | | | | 186,731 | |
5.13%, 6/10/14 | | | | | 25 | | | | 26,809 | |
Prudential Financial, Inc.: | | | | | | | | | | |
4.75%, 9/17/15 | | | | | 30 | | | | 32,298 | |
4.50%, 11/15/20 | | | | | 30 | | | | 31,800 | |
| | | | | | | | | | |
| | | | | | | | | | 574,619 | |
| IT Services — 0.0% | | | | | | | | | | |
First Data Corp. (b): | | | | | | | | | | |
7.38%, 6/15/19 | | | | | 5 | | | | 5,100 | |
8.25%, 1/15/21 | | | | | 5 | | | | 5,000 | |
| | | | | | | | | | |
| | | | | | | | | | 10,100 | |
| Life Sciences Tools & Services — 0.1% | |
Life Technologies Corp., 6.00%, 3/01/20 | | | | | 15 | | | | 17,598 | |
| | | | | | | | | | |
| | |
| Corporate Bonds | |
Par (000) | | | Value | |
| Machinery — 0.1% | | | | | | | | | | |
UR Merger Sub Corp., 7.63%, 4/15/22 (b) | | USD | | | 30 | | | $ | 31,425 | |
| Media — 1.3% | | | | | | | | | | |
CBS Corp.: | | | | | | | | | | |
4.63%, 5/15/18 | | | | | 5 | | | | 5,456 | |
8.88%, 5/15/19 | | | | | 10 | | | | 13,224 | |
5.75%, 4/15/20 | | | | | 10 | | | | 11,631 | |
CCH II LLC, 13.50%, 11/30/16 | | | | | 20 | | | | 22,300 | |
Clear Channel Worldwide Holdings, Inc.: | | | | | | | | | | |
9.25%, 12/15/17 | | | | | 7 | | | | 7,612 | |
Series B, 9.25%, 12/15/17 | | | | | 38 | | | | 41,420 | |
Comcast Corp.: | | | | | | | | | | |
5.88%, 2/15/18 | | | | | 25 | | | | 29,562 | |
6.45%, 3/15/37 | | | | | 23 | | | | 27,970 | |
4.65%, 7/15/42 | | | | | 10 | | | | 10,005 | |
Cox Communications, Inc.,
8.38%, 3/01/39 (b) | | | | | 35 | | | | 49,255 | |
CSC Holdings LLC, 8.50%, 4/15/14 | | | | | 10 | | | | 11,000 | |
DIRECTV Holdings LLC: | | | | | | | | | | |
6.38%, 3/01/41 | | | | | 15 | | | | 17,174 | |
5.15%, 3/15/42 | | | | | 5 | | | | 5,032 | |
Intelsat Jackson Holdings SA, 7.25%, 4/01/19 | | | | | 12 | | | | 12,600 | |
NBC Universal Media LLC, 5.15%, 4/30/20 | | | | | 37 | | | | 42,479 | |
Time Warner Cable, Inc.: | | | | | | | | | | |
5.88%, 11/15/40 | | | | | 15 | | | | 16,788 | |
5.50%, 9/01/41 | | | | | 20 | | | | 21,762 | |
Time Warner, Inc., 4.70%, 1/15/21 | | | | | 10 | | | | 11,143 | |
| | | | | | | | | | |
| | | | | | | | | | 356,413 | |
| Metals & Mining — 0.2% | | | | | | | | | | |
Freeport-McMoRan Copper & Gold, Inc.,
2.15%, 3/01/17 | | | | | 5 | | | | 4,930 | |
Newcrest Finance Property Ltd.,
4.45%, 11/15/21 (b) | | | | | 15 | | | | 15,392 | |
Novelis, Inc., 8.75%, 12/15/20 | | | | | 20 | | | | 21,550 | |
| | | | | | | | | | |
| | | | | | | | | | 41,872 | |
| Multi-Utilities — 0.1% | | | | | | | | | | |
Dominion Resources, Inc., 1.95%, 8/15/16 | | | | | 20 | | | | 20,381 | |
| Multiline Retail — 0.3% | | | | | | | | | | |
Dollar General Corp., 11.88%, 7/15/17 (c) | | | | | 25 | | | | 26,531 | |
Macy’s Retail Holdings, Inc.: | | | | | | | | | | |
5.90%, 12/01/16 | | | | | 30 | | | | 34,580 | |
7.45%, 7/15/17 | | | | | 11 | | | | 13,394 | |
| | | | | | | | | | |
| | | | | | | | | | 74,505 | |
| Oil, Gas & Consumable Fuels — 1.9% | |
Anadarko Petroleum Corp.: | | | | | | | | | | |
5.95%, 9/15/16 | | | | | 39 | | | | 44,256 | |
6.38%, 9/15/17 | | | | | 30 | | | | 34,849 | |
BP Capital Markets Plc, 3.13%, 10/01/15 | | | | | 10 | | | | 10,631 | |
Consol Energy, Inc., 8.25%, 4/01/20 | | | | | 9 | | | | 9,450 | |
El Paso Pipeline Partners Operating Co. LLC, 6.50%, 4/01/20 | | | | | 15 | | | | 17,409 | |
Energy Transfer Partners LP, 6.50%, 2/01/42 | | | | | 20 | | | | 21,433 | |
Enterprise Products Operating LLC, Series L,
6.30%, 9/15/17 | | | | | 50 | | | | 59,681 | |
KeySpan Gas East Corp., 5.82%, 4/01/41 (b) | | | | | 15 | | | | 19,158 | |
Kinder Morgan Energy Partners LP: | | | | | | | | | | |
5.95%, 2/15/18 | | | | | 25 | | | | 28,990 | |
6.55%, 9/15/40 | | | | | 5 | | | | 5,702 | |
Linn Energy LLC, 6.25%, 11/01/19 (b) | | | | | 20 | | | | 19,600 | |
Marathon Petroleum Corp., 6.50%, 3/01/41 | | | | | 20 | | | | 22,729 | |
See Notes to Financial Statements.
| | | | |
| | | | | |
| 10 | | BLACKROCK VARIABLE SERIES FUNDS, INC. | | JUNE 30, 2012 |
BlackRock Variable Series Funds, Inc.
BlackRock Balanced Capital V.I. Fund
| | |
| Schedule of Investments (continued) | | (Percentages shown are based on Net Assets) |
| | | | | | | | | | |
| | |
| Corporate Bonds | |
Par (000) | | | Value | |
| Oil, Gas & Consumable Fuels (concluded) | |
MidAmerican Energy Holdings Co.,
5.95%, 5/15/37 | | USD | | | 25 | | | $ | 31,008 | |
Nexen, Inc., 7.50%, 7/30/39 | | | | | 5 | | | | 5,827 | |
Petrobras International Finance Co.: | | | | | | | | | | |
3.88%, 1/27/16 | | | | | 40 | | | | 41,298 | |
5.75%, 1/20/20 | | | | | 44 | | | | 48,131 | |
Plains Exploration & Production Co.,
10.00%, 3/01/16 | | | | | 5 | | | | 5,450 | |
Range Resources Corp.: | | | | | | | | | | |
7.25%, 5/01/18 | | | | | 25 | | | | 26,500 | |
5.75%, 6/01/21 | | | | | 5 | | | | 5,225 | |
Rockies Express Pipeline LLC,
3.90%, 4/15/15 (b) | | | 4 | | | | 3,850 | |
Valero Energy Corp., 6.63%, 6/15/37 | | | | | 10 | | | | 11,213 | |
Western Gas Partners LP: | | | | | | | | | | |
5.38%, 6/01/21 | | | | | 22 | | | | 24,352 | |
4.00%, 7/01/22 | | | | | 10 | | | | 10,000 | |
| | | | | | | | | | |
| | | | | | | | | | 506,742 | |
| Paper & Forest Products — 0.1% | | | | | | | | | | |
International Paper Co.: | | | | | | | | | | |
4.75%, 2/15/22 | | | | | 10 | | | | 10,916 | |
6.00%, 11/15/41 | | | | | 10 | | | | 11,274 | |
| | | | | | | | | | |
| | | | | | | | | | 22,190 | |
| Pharmaceuticals — 0.2% | | | | | | | | | | |
Teva Pharmaceutical Finance Co. BV,
Series 2, 3.65%, 11/10/21 | | | | | 5 | | | | 5,259 | |
Teva Pharmaceutical Finance II BV/Teva Pharmaceutical Finance III LLC,
3.00%, 6/15/15 | | | | | 20 | | | | 21,048 | |
Teva Pharmaceutical Finance IV BV,
3.65%, 11/10/21 | | | | | 15 | | | | 15,776 | |
| | | | | | | | | | |
| | | | | | | | | | 42,083 | |
| Real Estate Investment Trusts (REITs) — 0.3% | |
ERP Operating LP, 4.63%, 12/15/21 | | | | | 15 | | | | 16,293 | |
Hospitality Properties Trust, 5.63%, 3/15/17 | | | | | 7 | | | | 7,454 | |
Ventas Realty LP/Ventas Capital Corp.,
4.75%, 6/01/21 | | | | | 10 | | | | 10,388 | |
Vornado Realty LP, 5.00%, 1/15/22 | | | | | 35 | | | | 37,010 | |
| | | | | | | | | | |
| | | | | | | | | | 71,145 | |
| Real Estate Management & Development — 0.1% | | | | | |
Realogy Corp., 7.88%, 2/15/19 (b) | | | | | 25 | | | | 24,437 | |
| Software — 0.0% | | | | | | | | | | |
Oracle Corp., 5.38%, 7/15/40 | | | | | 5 | | | | 6,126 | |
| Specialty Retail — 0.1% | | | | | | | | | | |
QVC, Inc., 7.50%, 10/01/19 (b) | | | | | 15 | | | | 16,650 | |
| Thrifts & Mortgage Finance — 0.1% | | | | | | | | | | |
Radian Group, Inc., 5.38%, 6/15/15 | | | | | 40 | | | | 27,800 | |
| Transportation Infrastructure — 0.1% | | | | | | | | |
Penske Truck Leasing Co. LP/PTL Finance Corp., 3.13%, 5/11/15 (b) | | | | | 25 | | | | 25,149 | |
| Wireless Telecommunication Services — 0.7% | |
Cricket Communications, Inc.,
7.75%, 5/15/16 | | | | | 14 | | | | 14,857 | |
MetroPCS Wireless, Inc., 7.88%, 9/01/18 | | | | | 5 | | | | 5,188 | |
SBA Tower Trust, 5.10%, 4/15/42 (b) | | | | | 120 | | | | 131,461 | |
Sprint Capital Corp., 6.88%, 11/15/28 | | | | | 5 | | | | 4,025 | |
| | | | | | | | | | |
| | |
| Corporate Bonds | |
Par (000) | | | Value | |
| Wireless Telecommunication Services (concluded) | |
Sprint Nextel Corp., 9.00%, 11/15/18 (b) | | USD | | | 20 | | | $ | 22,350 | |
| | | | | | | | | | |
| | | | | | | | | | 177,881 | |
| Total Corporate Bonds — 12.8% | | | | | | | | | 3,373,383 | |
|
| |
| | | |
| Foreign Agency Obligations | | | | | | | | | | |
Deutsche Bundesrepublik Inflation Linked Bond, 0.10%, 4/15/23 | | EUR | | | 128 | | | | 163,088 | |
Kreditanstalt fuer Wiederaufbau,
1.38%, 7/15/13 | | USD | | | 20 | | | | 20,197 | |
Mexico Government International Bond: | | | | | | | | | | |
6.38%, 1/16/13 | | | | | 15 | | | | 15,420 | |
5.63%, 1/15/17 | | | | | 15 | | | | 17,456 | |
5.13%, 1/15/20 | | | | | 40 | | | | 46,900 | |
Poland Government International Bond,
5.00%, 3/23/22 | | | | | 10 | | | | 10,915 | |
Russia Government International Bond,
7.50%, 3/31/30 (f) | | | | | 48 | | | | 57,989 | |
| Total Foreign Agency Obligations — 1.3% | | | | | | | 331,965 | |
|
| |
|
| Non-Agency Mortgage-Backed Securities | |
| Collateralized Mortgage Obligations — 0.7% | |
Countrywide Home Loan Mortgage
Pass-Through Trust: | | | | | |
Series 2006-0A5, Class 2A1,
0.45%, 4/25/46 (c) | | | | | 14 | | | | 7,578 | |
Series 2006-0A5, Class 3A1,
0.45%, 4/25/46 (c) | | | | | 27 | | | | 16,062 | |
Series 2007-J3, Class A10,
6.00%, 7/25/37 | | | | | 75 | | | | 55,184 | |
Credit Suisse Mortgage Capital Certificates (b)(c): | | | | | | | | |
Series 2011-2R, Class 2A1,
2.63%, 7/27/36 | | | | | 38 | | | | 36,789 | |
Series 2011-5R, Class 2A1,
2.88%, 8/27/46 | | | | | 32 | | | | 27,692 | |
First Horizon Asset Securities, Inc.,
Series 2005-AR3, Class 3A1,
3.82%, 8/25/35 (c) | | | | | 15 | | | | 13,035 | |
Impac Secured Assets CMN Owner Trust,
Series 2004-3, Class 1A4,
1.05%, 11/25/34 (c) | | | | | 8 | | | | 7,673 | |
| | | | | | | | | | |
| | | | | | | | | | 164,013 | |
| Commercial Mortgage-Backed Securities — 2.5% | | | | | |
Bear Stearns Commercial Mortgage Securities,
Series 2007-PW17, Class A3,
5.74%, 6/11/50 | | | | | 30 | | | | 31,366 | |
Commercial Mortgage Pass-Through Certificates: | | | | | | | | | | |
Series 2006-C7, Class AM,
5.77%, 6/10/46 (c) | | | | | 40 | | | | 41,560 | |
Series 2006-C8, Class AM,
5.35%, 12/10/46 | | | | | 15 | | | | 15,328 | |
Credit Suisse First Boston Mortgage Securities Corp., Series 2005-C3, Class AJ,
4.77%, 7/15/37 | | | | | 20 | | | | 17,748 | |
See Notes to Financial Statements.
| | | | |
| | | | | |
| JUNE 30, 2012 | | BLACKROCK VARIABLE SERIES FUNDS, INC. | | 11 |
BlackRock Variable Series Funds, Inc.
BlackRock Balanced Capital V.I. Fund
| | |
| Schedule of Investments (continued) | | (Percentages shown are based on Net Assets) |
| | | | | | | | | | |
| | |
| Non-Agency Mortgage-Backed Securities | |
Par (000) | | | Value | |
| Commercial Mortgage-Backed Securities (concluded) | |
Credit Suisse Mortgage Capital Certificates,
Series 2010-RR2, Class 2A,
5.97%, 9/15/39 (b)(c) | | USD | | | 30 | | | $ | 33,197 | |
GMAC Commercial Mortgage Securities, Inc.,
Series 2004-C3, Class AAB,
4.70%, 12/10/41 | | | | | 129 | | | | 133,662 | |
JPMorgan Chase Commercial Mortgage
Securities Corp.: | | | | | | | | | | |
Series 2004-LN2, Class A2,
5.12%, 7/15/41 | | | | | 30 | | | | 31,841 | |
Series 2006-CB14, Class AM,
5.64%, 12/12/44 (c) | | | | | 15 | | | | 15,254 | |
Series 2007-CB18, Class A3,
5.45%, 6/12/47 | | | | | 21 | | | | 21,982 | |
Series 2008-C2, Class ASB,
6.13%, 2/12/51 (c) | | | | | 50 | | | | 53,330 | |
LB-UBS Commercial Mortgage Trust: | | | | | | | | | | |
Series 2004-C8, Class C,
4.93%, 12/15/39 (c) | | | | | 40 | | | | 42,274 | |
Series 2007-C1, Class AM,
5.46%, 2/15/40 | | | | | 10 | | | | 10,431 | |
Merrill Lynch/Countrywide Commercial Mortgage Trust, Series 2007-9, Class A4,
5.70%, 9/12/49 | | | | | 40 | | | | 43,917 | |
Morgan Stanley Capital I (c): | | | | | | | | | | |
Series 1998-WF2, Class G,
6.34%, 7/15/30 (b) | | | | | 50 | | | | 52,216 | |
Series 2007-HQ12, Class A2FX,
5.78%, 4/12/49 | | | | | 18 | | | | 18,545 | |
RBSCF Trust, Series 2010-RR3, Class WBTA,
6.10%, 2/16/51 (b)(c) | | | | | 50 | | | | 55,774 | |
UBS-Barclays Commercial Mortgage Trust,
Series 2012-C2, Class A4,
3.53%, 5/10/63 | | | | | 10 | | | | 10,157 | |
Wachovia Bank Commercial Mortgage Trust,
Series 2007-C33, Class A4,
6.10%, 2/15/51 (c) | | | | | 30 | | | | 33,619 | |
| | | | | | | | | | |
| | | | | | | | | | 662,201 | |
| Interest Only Commercial Mortgage-Backed Securities — 0.0% | |
Morgan Stanley Capital I, Series 2012-C4, Class XA, 2.89%, 3/15/45 (b)(c) | | | | | 125 | | | | 18,751 | |
| Total Non-Agency Mortgage-Backed Securities — 3.2% | | | | 844,965 | |
|
| |
|
| Taxable Municipal Bonds | |
New York City Municipal Water Finance Authority, Refunding RB, Second General Resolution, Series EE: | | | | | | | | | | |
5.38%, 6/15/43 | | | | | 10 | | | | 11,481 | |
5.50%, 6/15/43 | | | | | 15 | | | | 17,431 | |
| Total Taxable Municipal Bonds — 0.1% | | | | | | | 28,912 | |
|
| |
|
| US Government Sponsored Agency Securities | |
| Agency Obligations — 0.8% | | | | | | | | | | |
Fannie Mae: | | | | | | | | | | |
5.13%, 1/02/14 | | | | | 100 | | | | 106,742 | |
2.91%, 10/09/19 (g) | | | | | 35 | | | | 28,370 | |
| | | | | | | | | | |
| | |
| US Government Sponsored Agency Securities | |
Par (000) | | | Value | |
| Agency Obligations (concluded) | |
Tennessee Valley Authority, 5.25%, 9/15/39 | | USD | | | 60 | | | $ | 78,232 | |
| | | | | | | | | | |
| | | | | | | | | | 213,344 | |
| Collateralized Mortgage Obligations — 0.4% | | | | | |
Freddie Mac Mortgage-Backed Securities: | | | | | | | | | | |
Series K013, Class A2,
3.97%, 1/25/21 (c) | | | | | 30 | | | | 33,645 | |
Series K017, Class A2, 2.87%, 12/25/21 | | | | | 55 | | | | 57,417 | |
| | | | | | | | | | |
| | | | | | | | | | 91,062 | |
| Commercial Mortgage-Backed Securities — 0.0% | | | | | |
Freddie Mac Mortgage-Backed Securities,
Series K706, Class C,
4.02%, 11/25/44 (b)(c) | | | 10 | | | | 8,682 | |
| Federal Deposit Insurance Corporation Guaranteed — 0.1% | | | | | |
General Electric Capital Corp.,
2.13%, 12/21/12 | | | | | 25 | | | | 25,215 | |
| Interest Only Collateralized Mortgage Obligations — 0.0% | |
Freddie Mac Mortgage-Backed Securities, Series K707, Class X1,
1.70%, 12/25/18 (c) | | | | | 72 | | | | 5,937 | |
| Mortgage-Backed Securities — 29.2% | | | | | | | | |
Fannie Mae Mortgage-Backed Securities: | | | | | | | | | | |
3.00%, 7/12/42 (h) | | | | | 400 | | | | 410,188 | |
3.31%, 12/01/40 (c) | | | | | 19 | | | | 20,134 | |
3.50%, 11/01/26-7/15/42 (h) | | | | | 754 | | | | 794,099 | |
4.00%, 9/01/25-7/15/42 (h) | | | | | 1,408 | | | | 1,508,008 | |
4.50%, 6/01/26-7/15/42 (h) | | | | | 862 | | | | 928,780 | |
4.80%, 8/01/38 (c) | | | | | 34 | | | | 36,778 | |
5.00%, 7/01/34-8/15/42 (h) | | | | | 486 | | | | 526,779 | |
5.50%, 9/01/34-8/15/42 (h) | | | | | 507 | | | | 555,684 | |
6.00%, 12/01/31-8/15/42 (h) | | | | | 1,280 | | | | 1,408,601 | |
6.50%, 5/01/40 | | | | | 150 | | | | 169,377 | |
Freddie Mac Mortgage-Backed Securities: | | | | | | | | | | |
4.00%, 7/15/42 (h) | | | | | 100 | | | | 106,109 | |
4.50%, 7/15/42-8/15/42 (h) | | | 200 | | | | 213,547 | |
5.00%, 3/01/38-7/15/42 (h) | | | 300 | | | | 322,432 | |
5.50%, 4/01/38-1/01/40 | | | 92 | | | | 100,080 | |
6.00%, 6/01/35 | | | | | 27 | | | | 29,308 | |
Ginnie Mae Mortgage-Backed Securities (h): | | | | | | | | | | |
4.00%, 7/15/42 | | | | | 100 | | | | 109,203 | |
4.50%, 7/15/42 | | | | | 200 | | | | 218,656 | |
5.00%, 7/15/42 | | | | | 200 | | | | 220,062 | |
| | | | | | | | | | |
| | | | | | | | | | 7,677,825 | |
Total US Government Sponsored Agency
Securities — 30.5% | | | | 8,022,065 | |
|
| |
| | | |
| US Treasury Obligations | | | | | | | | | | |
US Treasury Bonds: | | | | | | | | | | |
3.13%, 2/15/42 | | | | | 192 | | | | 206,220 | |
3.00%, 5/15/42 | | | | | 485 | | | | 507,962 | |
US Treasury Inflation Indexed Bonds,
0.75%, 2/15/42 | | | | | 36 | | | | 37,381 | |
US Treasury Notes: | | | | | | | | | | |
0.63%, 1/31/13 (i) | | | | | 115 | | | | 115,292 | |
0.25%, 5/31/14 | | | | | 115 | | | | 114,856 | |
0.50%, 8/15/14 | | | | | 45 | | | | 45,151 | |
2.50%, 4/30/15 | | | | | 35 | | | | 37,048 | |
See Notes to Financial Statements.
| | | | |
| | | | | |
| 12 | | BLACKROCK VARIABLE SERIES FUNDS, INC. | | JUNE 30, 2012 |
BlackRock Variable Series Funds, Inc.
BlackRock Balanced Capital V.I. Fund
| | |
| Schedule of Investments (continued) | | (Percentages shown are based on Net Assets) |
| | | | | | | | | | |
| | |
| US Treasury Obligations | |
Par (000) | | | Value | |
US Treasury Notes: (concluded) | | | | | | | | | | |
0.38%, 6/15/15 | | USD | | | 260 | | | $ | 259,777 | |
0.63%, 5/31/17 (j) | | | | | 260 | | | | 258,802 | |
0.63%, 6/30/17 | | | | | 510 | | | | 510,518 | |
1.13%, 5/31/19 | | | | | 150 | | | | 150,234 | |
1.00%, 6/30/19 | | | | | 150 | | | | 148,805 | |
1.75%, 5/15/22 (j) | | | | | 1,020 | | | | 1,028,287 | |
| Total US Treasury Obligations — 13.0% | | | | 3,420,333 | |
| Total Fixed Income Securities — 63.5% | | | | 16,699,392 | |
|
| |
| | | |
| Preferred Securities | | | | | | | | | | |
| | | |
| Capital Trusts | | | | | | | | |
| Commercial Banks — 0.1% | |
Fifth Third Capital Trust IV,
6.50%, 4/15/67 (c) | | | | | 15 | | | | 14,906 | |
JPMorgan Chase Capital XXV,
Series Y, 6.80%, 10/01/37 | | | | | 5 | | | | 5,000 | |
| | | | | | | | | | |
| | | | | | | | | | 19,906 | |
| Consumer Finance — 0.1% | |
Capital One Capital VI,
8.88%, 5/15/40 | | | | | 30 | | | | 30,488 | |
| Insurance — 0.1% | |
American International Group, Inc.,
8.18%, 5/15/58 (c) | | | | | 5 | | | | 5,425 | |
Swiss Re Capital I LP, 6.85% (b)(c)(k) | | | | | 15 | | | | 13,818 | |
XL Group Plc, Series E, 6.50% (c)(k) | | | | | 20 | | | | 16,250 | |
| | | | | | | | | | |
| | | | | | | | | | 35,493 | |
| Total Capital Trusts — 0.3% | | | | | | | 85,887 | |
|
| |
| | |
| Trust Preferred | | Shares | | | | |
| Commercial Banks — 0.1% | |
Citigroup Capital XIII, 7.88%, 10/30/40 | | | | | 481 | | | | 12,971 | |
| Total Preferred Securities — 0.4% | | | | | | | 98,858 | |
Total Long-Term Investments (Cost — $31,440,114) — 124.9% | | | | | | | 32,833,437 | |
|
| |
| | |
| Short-Term Securities | | Beneficial
Interest
(000) | | | | |
Bank of New York Cash Reserves, 0.01% (l) | | USD | | | 87 | | | | 87,216 | |
Total Short-Term Securities
(Cost — $87,216) — 0.3% | | | | | | | 87,216 | |
|
| |
| | |
| Options Purchased | | Contracts | | | | |
| Exchange-Traded Call Options — 0.0% | |
Euro-Dollar 3-Year Mid-Curve Options, Strike Price USD 99.00, Expires 8/10/12 | | | | | 7 | | | | 788 | |
| | | | | | | | | | |
| | |
| Options Purchased | |
Contracts | | | Value | |
| Exchange-Traded Put Options — 0.0% | |
10-Year US Treasury Note,
Strike Price USD 131.00,
Expires 7/27/12 | | | | | 5 | | | $ | 547 | |
| | |
| | | Notional
Amount
(000) | | | | |
| Over-the-Counter Call Options — 0.0% | |
USD Currency: | | | | | | | | | | |
Strike Price JPY 85.00,
Expires 8/24/12,
Broker Citibank NA | | USD | | | 185 | | | | 181 | |
Strike Price JPY 85.00,
Expires 8/24/12,
Broker Goldman Sachs Group, Inc. | | | | | 185 | | | | 181 | |
| | | | | | | | | | |
| | | | | | | | | | 362 | |
| Over-the-Counter Interest Rate Put Swaptions — 0.1% | |
Pay a fixed rate of 2.70% and receive a floating rate based on 3-month LIBOR, Expires 07/23/12, Broker Deutsche
Bank AG | | | | | 100 | | | | — | |
Pay a fixed rate of 4.50% and receive a floating rate based on 3-month LIBOR, Expires 03/20/17, Broker Deutsche
Bank AG | | | | | 100 | | | | 2,632 | |
Pay a fixed rate of 2.13% and receive a floating rate based on 3-month LIBOR, Expires 03/21/13, Broker Deutsche
Bank AG | | | | | 200 | | | | 312 | |
| | | | | | | | | | |
| | | | | | | | | | 2,944 | |
Total Options Purchased (Cost — $17,078) — 0.1% | | | | | | | 4,641 | |
Total Investments Before TBA Sale Commitments and Options Written (Cost — $31,544,408) — 125.3% | | | | | | | 32,925,294 | |
|
| |
| | |
| TBA Sale Commitments (h) | | Par (000) | | | | |
Fannie Mae Mortgage-Backed Securities: | | | | | | | | | | |
3.00%, 7/15/42 | | | | | 300 | | | | (307,641 | ) |
3.50%, 7/15/42 | | | | | 600 | | | | (630,656 | ) |
4.00%, 7/15/42 — 8/15/42 | | | | | 1,100 | | | | (1,170,453 | ) |
4.50%, 7/15/42 | | | | | 200 | | | | (214,531 | ) |
5.00%, 7/15/42 | | | | | 200 | | | | (216,438 | ) |
5.50%, 7/15/42 | | | | | 200 | | | | (218,156 | ) |
6.00%, 7/15/42 | | | | | 800 | | | | (879,125 | ) |
Freddie Mac Mortgage-Backed Securities: | | | | | | | | | | |
4.50%, 7/15/42 | | | | | 100 | | | | (106,797 | ) |
5.00%, 7/15/42 | | | | | 200 | | | | (214,969 | ) |
Total TBA Sale Commitments (Proceeds — $3,950,605) — (15.1)% | | | | | | | (3,958,766 | ) |
|
| |
| | |
| Options Written | | Contracts | | | | |
| Exchange-Traded Call Options — (0.0)% | |
Euro-Dollar 3-Year Mid-Curve Options,
Strike Price USD 99.13, Expires 8/10/12 | | | 7 | | | | (262 | ) |
| Exchange-Traded Put Options — (0.0)% | |
10-Year US Treasury Note,
Strike Price USD 129.50, Expires 7/27/12 | | | 5 | | | | (156 | ) |
See Notes to Financial Statements.
| | | | |
| | | | | |
| JUNE 30, 2012 | | BLACKROCK VARIABLE SERIES FUNDS, INC. | | 13 |
BlackRock Variable Series Funds, Inc.
BlackRock Balanced Capital V.I. Fund
| | |
| Schedule of Investments (continued) | | (Percentages shown are based on Net Assets) |
| | | | | | | | | | |
| | |
| Options Written | | Notional
Amount
(000) | | | Value | |
| Over-the-Counter Call Options — (0.0)% | |
EUR Currency, Strike Price USD 1.28, Expires 7/31/12, Broker Goldman Sachs Group, Inc. | | EUR | | | 92 | | | $ | (2,071 | ) |
USD Currency: | | | | | | | | | | |
Strike Price JPY 90.00, Expires 8/24/12, Broker Goldman Sachs International | | USD | | | 185 | | | | (21 | ) |
Strike Price JPY 90.00, Expires 8/24/12, Broker Citibank NA | | | | | 370 | | | | (41 | ) |
| | | | | | | | | | |
| | | | | | | | | | (2,133 | ) |
| Over-the-Counter Interest Rate Call Swaptions — (0.0)% | |
Pay a fixed rate of 1.25% and receive a floating rate based on 3-month LIBOR, Expires 6/20/14, Broker Barclays Plc | | | | | 100 | | | | (881 | ) |
| Over-the-Counter Interest Rate Put Swaptions — (0.0)% | |
Receive a fixed rate of 6.00% and pay a floating rate based on 3-month LIBOR,
Expires 3/20/17, Broker Deutsche
Bank AG | | | 200 | | | | (2,646 | ) |
| | | | | | | | | | |
| | |
| Options Written | | Notional
Amount
(000) | | | Value | |
| Over-the-Counter Interest Rate Put Swaptions (concluded) | |
Receive a fixed rate of 1.55% and pay a floating rate based on 3-month LIBOR, Expires 10/29/12, Broker Morgan Stanley | | USD | | | 200 | | | $ | (189 | ) |
Receive a fixed rate of 2.25% and pay a floating rate based on 3-month LIBOR, Expires 6/20/14, Broker Barclays Plc | | | | | 100 | | | | (1,170 | ) |
| | | | | | | | | | |
| | | | | | | | | | (4,005 | ) |
Total Options Written
(Premiums Received — 13,065) — 0.0% | | | | | | | (7,437 | ) |
| Total Investments, Net of TBA Sale Commitments and Options Written — 110.2% | | | | 28,959,091 | |
| Liabilities in Excess of Other Assets — (10.2)% | | | | (2,669,929 | ) |
| | | | | | | | | | |
| Net Assets — 100.0% | | | $ | 26,289,162 | |
| | | | | | | | | | |
| (a) | Non-income producing security. |
| (b) | Security exempt from registration pursuant to Rule 144A under the Securities Act of 1933, as amended. These securities may be resold in transactions exempt from registration to qualified institutional investors. |
| (c) | Variable rate security. Rate shown is as of report date. |
| (d) | Represents a payment-in-kind security which may pay interest/dividends in additional par/shares. |
| (e) | When-issued security. Unsettled when-issued transactions were as follows: |
| | | | | | | | |
| Counterparty | | Value | | | Unrealized
Appreciation
(Depreciation) | |
Barclays Plc | | $ | 19,996 | | | | — | |
UBS AG | | $ | 10,157 | | | | — | |
| (f) | Represents a step-up bond that pays an initial coupon rate for the first period and then a higher coupon rate for the following periods. Rate shown is as of report date. |
| (g) | Represents a zero-coupon bond. Rate shown reflects the current yield as of report date. |
| (h) | Represents or includes a TBA transaction. Unsettled TBA transactions as of June 30, 2012 were as follows: |
| | | | | | | | |
| Counterparty | | Value | | | Unrealized
Appreciation
(Depreciation) | |
Bank of America Corp. | | | — | | | $ | (218 | ) |
Barclays Plc | | | — | | | $ | 66 | |
Citigroup, Inc. | | $ | 4,125 | | | $ | (1,469 | ) |
Credit Suisse Group AG | | $ | 116,859 | | | $ | (555 | ) |
Goldman Sachs Group, Inc. | | $ | 123,015 | | | $ | (1,664 | ) |
JPMorgan Chase & Co. | | $ | 108,672 | | | $ | 336 | |
Morgan Stanley | | $ | 206,031 | | | $ | 133 | |
Nomura Trust and Banking Co., Ltd. | | $ | 220,063 | | | $ | (984 | ) |
Royal Bank of Scotland Group Plc | | | — | | | $ | 23 | |
| (i) | All or a portion of security has been pledged as collateral in connection with open financial futures contracts. |
| (j) | All or a portion of security has been pledged as collateral in connection with open reverse repurchase agreements. |
| (k) | Security is perpetual in nature and has no stated maturity date. |
| (l) | Represents the current yield as of report date. |
| — | Investments in companies considered to be an affiliate of the Portfolio during the period, for purposes of Section 2(a)(3) of the Investment Company Act of 1940, as amended, were as follows: |
| | | | | | | | | | | | | | | | |
| Affiliate | | Shares Held at
December 31,
2011 | | | Net Activity | | | Shares
Held at
June 30,
2012 | | | Income | |
BlackRock Liquidity Funds, TempFund, Institutional Class | | | 272,440 | | | | (272,440 | ) | | | — | | | $ | 195 | |
| — | For Fund compliance purposes, the Fund’s industry classifications refer to any one or more of the industry sub-classifications used by one or more widely recognized market indexes or rating group indexes, and/or as defined by Fund management. These definitions may not apply for purposes of this report, which may combine such industry sub-classifications for reporting ease. |
See Notes to Financial Statements.
| | | | |
| | | | | |
| 14 | | BLACKROCK VARIABLE SERIES FUNDS, INC. | | JUNE 30, 2012 |
BlackRock Variable Series Funds, Inc.
BlackRock Balanced Capital V.I. Fund
| | |
| Schedule of Investments (continued) | | |
| — | | Reverse repurchase agreements outstanding as of June 30, 2012 were as follows: |
| | | | | | | | | | | | | | | | |
| Counterparty | | Interest
Rate | | | Trade Date | | Maturity
Date | | Net Closing
Amount | | | Face
Amount | |
BNP Paribas SA | | | (0.08 | )% | | 6/29/12 | | 7/02/12 | | $ | 260,323 | | | $ | 260,325 | |
Credit Suisse Group AG | | | (0.09 | )% | | 6/29/12 | | 7/02/12 | | | 1,031,467 | | | | 1,031,475 | |
Total | | | | | | | | | | $ | 1,291,790 | | | $ | 1,291,800 | |
| | | | | | | | | | | | | | | | |
| — | | Financial futures contracts purchased as of June 30, 2012 were as follows: |
| | | | | | | | | | | | | | |
| Contracts | | Issue | | Exchange | | Expiration | | Notional
Value | | | Unrealized
Depreciation | |
| 2 | | 10-Year Australian Treasury Bond | | Australian Securities Exchange | | September 2012 | | USD | 256,812 | | | $ | (1,721 | ) |
| 2 | | 30-Year US Treasury Bond | | Chicago Board of Trade | | September 2012 | | USD | 295,938 | | | | (1,879 | ) |
| 5 | | 2-Year US Treasury Note | | Chicago Board of Trade | | September 2012 | | USD | 1,100,938 | | | | (299 | ) |
| 3 | | 5-Year US Treasury Note | | Chicago Board of Trade | | September 2012 | | USD | 371,906 | | | | (649 | ) |
| 2 | | 90-Day Euro-Dollar | | Chicago Mercantile | | March 2015 | | USD | 495,525 | | | | (80 | ) |
| 2 | | 90-Day Euro-Dollar | | Chicago Mercantile | | June 2015 | | USD | 494,975 | | | | (105 | ) |
| 2 | | 90-Day Euro-Dollar | | Chicago Mercantile | | September 2015 | | USD | 494,350 | | | | (143 | ) |
| 2 | | 90-Day Euro-Dollar | | Chicago Mercantile | | December 2015 | | USD | 493,625 | | | | (205 | ) |
| Total | | | | | | | | | | | | $ | (5,081 | ) |
| | | | | | | | | | | | | | |
| — | | Financial futures contracts sold as of June 30, 2012 were as follows: |
| | | | | | | | | | | | | | |
| Contracts | | Issue | | Exchange | | Expiration | | Notional Value | | | Unrealized
Appreciation
(Depreciation) | |
| 3 | | German Euro-Bund | | Eurex | | September 2012 | | USD | 534,927 | | | $ | 8,108 | |
| 5 | | 3-Year Australian Treasury Bond | | Australian Securities Exchange | | September 2012 | | USD | 564,926 | | | | 2,263 | |
| 3 | | 10-Year US Treasury Note | | Chicago Board of Trade | | September 2012 | | USD | 400,125 | | | | 210 | |
| 4 | | Ultra-Long US Treasury Bond | | Chicago Board of Trade | | September 2012 | | USD | 667,375 | | | | (9,363 | ) |
| 2 | | 90-Day Australia Bank Bill | | Australian Securities Exchange | | December 2012 | | USD | 2,031,769 | | | | 542 | |
| 2 | | 3-Month Canada Bankers Acceptance | | Montreal Exchange | | June 2013 | | USD | 485,021 | | | | (2,132 | ) |
Total | | | | | | | | | | $ | (372 | ) |
| | | | | | | | | | | | | | |
| — | | Foreign currency exchange contracts as of June 30, 2012 were as follows: |
| | | | | | | | | | | | | | |
| Currency Purchased | | | Currency Sold | | | Counterparty | | Settlement Date | | Unrealized
Appreciation
(Depreciation) | |
| CHF | 96,028 | | | EUR | 80,000 | | | UBS AG | | 7/11/12 | | $ | (55 | ) |
| EUR | 40,000 | | | CHF | 48,039 | | | Citibank NA | | 7/11/12 | | | 2 | |
| EUR | 40,000 | | | CHF | 48,034 | | | UBS AG | | 7/11/12 | | | 6 | |
| USD | 26,307 | | | EUR | 20,000 | | | Citibank NA | | 7/25/12 | | | 993 | |
| USD | 94,384 | | | EUR | 71,500 | | | JPMorgan Chase & Co. | | 7/25/12 | | | 3,885 | |
| USD | 142,162 | | | EUR | 110,000 | | | Royal Bank of Scotland Group Plc | | 7/25/12 | | | 2,933 | |
| USD | 50,221 | | | AUD | 50,000 | | | UBS AG | | 7/31/12 | | | (819 | ) |
| USD | 56,116 | | | EUR | 45,000 | | | Citibank NA | | 7/31/12 | | | (844 | ) |
| USD | 25,406 | | | EUR | 20,000 | | | Citibank NA | | 7/31/12 | | | 91 | |
| USD | 68,760 | | | EUR | 55,000 | | | Deutsche Bank AG | | 7/31/12 | | | (858 | ) |
| USD | 37,383 | | | EUR | 30,000 | | | UBS AG | | 7/31/12 | | | (590 | ) |
| USD | 30,000 | | | JPY | 2,381,364 | | | Citibank NA | | 8/28/12 | | | 186 | |
| USD | 27,191 | | | CNY | 175,000 | | | Standard Chartered Plc | | 6/07/13 | | | (164 | ) |
| USD | 27,237 | | | CNY | 175,000 | | | Standard Chartered Plc | | 6/07/13 | | | (118 | ) |
| | Total | | | | | | | | | | | $ | 4,648 | |
| | | | | | | | | | | | | | |
| — | | Credit default swaps on single-name issues—buy protection outstanding as of June 30, 2012 were as follows: |
| | | | | | | | | | | | | | | | |
| Issuer | | Pay
Fixed
Rate | | | Counterparty | | Expiration
Date | | Notional Amount (000) | | | Unrealized
Appreciation
(Depreciation) | |
Eastman Chemical Co. | | | 0.68% | | | Morgan Stanley | | 9/20/13 | | USD | 55 | | | $ | (338 | ) |
Radian Group, Inc. | | | 5.00% | | | Citibank NA | | 6/20/15 | | USD | 40 | | | | 10,477 | |
Sara Lee Corp. | | | 1.00% | | | JPMorgan Chase & Co. | | 3/20/17 | | USD | 12 | | | | — | |
Total | | | | | | | | | | | | | | $ | 10,139 | |
| | | | | | | | | | | | | | | | |
See Notes to Financial Statements.
| | | | |
| | | | | |
| JUNE 30, 2012 | | BLACKROCK VARIABLE SERIES FUNDS, INC. | | 15 |
BlackRock Variable Series Funds, Inc.
BlackRock Balanced Capital V.I. Fund
| | |
| Schedule of Investments (continued) | | |
| — | | Credit default swaps on single-name issues—sold protection outstanding as of June 30, 2012 were as follows: |
| | | | | | | | | | | | | | | | | | | | | | |
| Issuer | | | Receive
Fixed
Rate | | | Counterparty | | Expiration
Date | | Issuer
Credit
Rating1 | | | Notional Amount (000)2 | | | Unrealized
Appreciation
(Depreciation) | |
| | MetLife, Inc. | | | | 1.00 | % | | Deutsche Bank AG | | 9/20/16 | | | A- | | | | USD 10 | | | $ | 90 | |
| | MetLife, Inc. | | | | 1.00 | % | | Morgan Stanley | | 9/20/16 | | | A- | | | | USD 20 | | | | 153 | |
| | MetLife, Inc. | | | | 1.00 | % | | Morgan Stanley | | 9/20/16 | | | A- | | | | USD 10 | | | | 1 | |
| | MetLife, Inc. | | | | 1.00 | % | | Citibank NA | | 12/20/16 | | | A- | | | | USD 13 | | | | (39 | ) |
| | MetLife, Inc. | | | | 1.00 | % | | Citibank NA | | 12/20/16 | | | A- | | | | USD 15 | | | | 35 | |
| | MetLife, Inc. | | | | 1.00 | % | | Citibank NA | | 3/20/17 | | | A- | | | | USD 5 | | | | (86 | ) |
| | MetLife, Inc. | | | | 1.00 | % | | UBS AG | | 3/20/17 | | | A- | | | | USD 10 | | | | (172 | ) |
| | Total | | | | | | | | | | | | | | | | | | | $ | (18 | ) |
| | | | | | | | | | | | | | | | | | | | | | |
| 1 | Using Standard & Poor’s (“S&P”s) rating. |
| 2 | The maximum potential amount the Fund may pay should a negative credit event take place as defined under the terms of the agreement. |
| — | | Credit default swaps on traded indexes—buy protection outstanding as of June 30, 2012 were as follows: |
| | | | | | | | | | | | | | | | |
| Index | | Pay
Fixed
Rate | | | Counterparty | | Expiration
Date | | Notional
Amount
(000) | | | Unrealized
Appreciation
(Depreciation) | |
Dow Jones CDX Emerging Markets Series 14, Version 1 | | | 5.00% | | | Morgan Stanley | | 12/20/15 | | | USD 20 | | | $ | 152 | |
Dow Jones CDX North America Investment Grade Index Series 16, Version 1 | | | 1.00% | | | Credit Suisse Group AG | | 6/20/16 | | | USD 13 | | | | (132 | ) |
Dow Jones CDX North America Investment Grade Index Series 16, Version 1 | | | 1.00% | | | JPMorgan Chase & Co. | | 6/20/16 | | | USD 1 | | | | (6 | ) |
Dow Jones CDX North America Investment Grade Index Series 17, Version 1 | | | 1.00% | | | Morgan Stanley | | 12/20/16 | | | USD 120 | | | | (1,024 | ) |
Total | | | | | | | | | | | | | | $ | (1,010 | ) |
| | | | | | | | | | | | | | | | |
| — | | Credit default swaps on traded indexes—sold protection outstanding as of June 30, 2012 were as follows: |
| | | | | | | | | | | | | | | | | | |
| Index | | Receive
Fixed
Rate | | | Counterparty | | Expiration
Date | | Credit
Rating3 | | Notional
Amount
(000)4 | | | Unrealized
Appreciation
(Depreciation) | |
Dow Jones CDX North America High Yield Index Series 18, Version 2 | | | 5.00% | | | Deutsche Bank AG | | 6/20/17 | | B+ | | | USD 59 | | | $ | 436 | |
Dow Jones CDX North America High Yield Index Series 18, Version 2 | | | 5.00% | | | Deutsche Bank AG | | 6/20/17 | | B+ | | | USD 30 | | | | 359 | |
Dow Jones CDX North America High Yield Index Series 18, Version 2 | | | 5.00% | | | Deutsche Bank AG | | 6/20/17 | | B+ | | | USD 59 | | | | 349 | |
Dow Jones CDX North America High Yield Index Series 18, Version 2 | | | 5.00% | | | Morgan Stanley | | 6/20/17 | | B+ | | | USD 30 | | | | 433 | |
Markit CMBX North America AM Index Series 2 | | | 0.50% | | | Deutsche Bank AG | | 3/15/49 | | A- | | | USD 10 | | | | 195 | |
Markit CMBX North America AAA Index Series 3 | | | 0.08% | | | Morgan Stanley | | 12/13/49 | | A+ | | | USD 15 | | | | 569 | |
Markit CMBX North America AAA Index Series 4 | | | 0.35% | | | Morgan Stanley | | 2/17/51 | | A- | | | USD 15 | | | | 459 | |
Total | | | | | | | | | | | | | | | | $ | 2,800 | |
| | | | | | | | | | | | | | | | | | |
| 3 | Using S&P’s rating of the underlying securities. |
| 4 | The maximum potential amount the Fund may pay should a negative credit event take place as defined under the terms of the agreement. |
See Notes to Financial Statements.
| | | | |
| | | | | |
| 16 | | BLACKROCK VARIABLE SERIES FUNDS, INC. | | JUNE 30, 2012 |
BlackRock Variable Series Funds, Inc.
BlackRock Balanced Capital V.I. Fund
| | |
| Schedule of Investments (continued) | | |
| — | | Interest rate swaps outstanding as of June 30, 2012 were as follows: |
| | | | | | | | | | | | | | | | | | |
Fixed Rate | | | Floating
Rate | | Counterparty | | Expiration
Date | | Notional Amount (000) | | | Unrealized
Appreciation
(Depreciation) | |
| | 1.72% | 1 | | 3-month CBA | | Deutsche Bank AG | | 5/03/14 | | CAD | | | 285 | | | $ | (1,239 | ) |
| | 1.72% | 1 | | 3-month CBA | | Morgan Stanley | | 5/03/14 | | CAD | | | 285 | | | | (1,239 | ) |
| | 0.54% | 2 | | 3-month LIBOR | | Barclays Plc | | 6/26/14 | | USD | | | 400 | | | | (76 | ) |
| | 0.56% | 1 | | 3-month LIBOR | | Deutsche Bank AG | | 7/02/14 | | USD | | | 2,000 | �� | | | (223 | ) |
| | 0.55% | 1 | | 3-month LIBOR | | Credit Suisse Group AG | | 7/03/14 | | USD | | | 400 | | | | — | |
| | 1.39% | 1 | | 3-month LIBOR | | Deutsche Bank AG | | 3/19/17 | | USD | | | 200 | | | | (4,403 | ) |
| | 1.39% | 1 | | 3-month LIBOR | | Deutsche Bank AG | | 3/19/17 | | USD | | | 400 | | | | (8,806 | ) |
| | 1.09% | 1 | | 3-month LIBOR | | Morgan Stanley | | 5/09/17 | | USD | | | 100 | | | | (713 | ) |
| | 2.38% | 1 | | 3-month LIBOR | | Morgan Stanley | | 11/17/17 | | USD | | | 100 | | | | (6,996 | ) |
| | 3.27% | 1 | | 3-month LIBOR | | Deutsche Bank AG | | 5/16/21 | | USD | | | 30 | | | | (4,104 | ) |
| | 2.69% | 1 | | 3-month LIBOR | | Citibank NA | | 8/09/21 | | USD | | | 100 | | | | (8,769 | ) |
| | 2.40% | 2 | | 3-month LIBOR | | Bank of America NA | | 10/21/21 | | USD | | | 100 | | | | 6,169 | |
| | 2.10% | 1 | | 3-month LIBOR | | Morgan Stanley | | 1/05/22 | | USD | | | 50 | | | | (1,677 | ) |
| | 2.36% | 1 | | 3-month LIBOR | | Citibank NA | | 3/26/22 | | USD | | | 100 | | | | (5,573 | ) |
| | 2.82% | 1 | | 3-month CBA | | Deutsche Bank AG | | 5/18/22 | | CAD | | | 100 | | | | 68 | |
| | 2.86% | 1 | | 3-month CBA | | Morgan Stanley | | 5/23/22 | | CAD | | | 100 | | | | (66 | ) |
| | Total | | | | | | | | | | | | | | | $ | (37,647 | ) |
| | | | | | | | | | | | | | | | | | |
| 1 | Fund pays a fixed rate and receives floating rate. |
| 2 | Fund pays a floating rate and receives fixed rate. |
| — | | Fair Value Measurements—Various inputs are used in determining the fair value of investments and derivative financial instruments. These inputs to valuation techniques are categorized into a disclosure hierarchy consisting of three broad levels for financial statement purposes as follows: |
| — | | Level 1—unadjusted price quotations in active markets/exchanges for identical assets and liabilities |
| — | | Level 2—other observable inputs (including, but not limited to: quoted prices for similar assets or liabilities in markets that are active, quoted prices for identical or similar assets or liabilities in markets that are not active, inputs other than quoted prices that are observable for the assets or liabilities (such as interest rates, yield curves, volatilities, prepayment speeds, loss severities, credit risks and default rates) or other market-corroborated inputs) |
| — | | Level 3—unobservable inputs based on the best information available in the circumstances, to the extent observable inputs are not available (including the Fund’s own assumptions used in determining the fair value of investments and derivative financial instruments) |
Changes in valuation techniques may result in transfers into or out of an assigned level within the disclosure hierarchy. In accordance with the Fund’s policy, transfers between different levels of the fair value disclosure hierarchy are deemed to have occurred as of the beginning of the reporting period. The categorization of a value determined for investments and derivative financial instruments is based on the pricing transparency of the investment and derivative financial instruments and is not necessarily an indication of the risks associated with investing in those securities. For information about the Fund’s policy regarding valuation of investments and derivative financial instruments and other significant accounting policies, please refer to Note 1 of the Notes to Financial Statements.
The following tables summarize the Fund’s investments and derivative financial instruments categorized in the disclosure hierarchy as of June 30, 2012:
| | | | | | | | | | | | | | | | |
| | | Level 1 | | | Level 2 | | | Level 3 | | | Total | |
| Assets: | | | | | | | | | | | | | | | | |
Investments: | | | | | | | | | | | | | | | | |
Long-Term Investments: | | | | | | | | | | | | | | | | |
Common Stocks | | $ | 16,035,187 | | | | — | | | | — | | | $ | 16,035,187 | |
Asset- Backed Securities | | | — | | | $ | 608,127 | | | $ | 69,642 | | | | 677,769 | |
Corporate Bonds | | | — | | | | 3,373,383 | | | | — | | | | 3,373,383 | |
Foreign Agency Obligations | | | — | | | | 331,965 | | | | — | | | | 331,965 | |
Non-Agency Mortgage-Backed Securities | | | — | | | | 817,273 | | | | 27,692 | | | | 844,965 | |
Preferred Securities | | | 12,971 | | | | 85,887 | | | | — | | | | 98,858 | |
Taxable Municipal Bonds | | | — | | | | 28,912 | | | | — | | | | 28,912 | |
US Government Sponsored Agency Securities | | | — | | | | 8,022,065 | | | | — | | | | 8,022,065 | |
US Treasury Obligations | | | — | | | | 3,420,333 | | | | — | | | | 3,420,333 | |
Short-Term Securities: | | | | | | | | | | | | | | | | |
Money Market Funds | | | 87,216 | | | | — | | | | — | | | | 87,216 | |
| Liabilities: | | | | | | | | | | | | | | | | |
Investments: | | | | | | | | | | | | | | | | |
TBA Sale Commitments | | | — | | | | (3,958,766 | ) | | | — | | | | (3,958,766 | ) |
Total | | $ | 16,135,374 | | | $ | 12,729,179 | | | $ | 97,334 | | | $ | 28,961,887 | |
| | | | | | | | | | | | | | | | |
See Notes to Financial Statements.
| | | | |
| | | | | |
| JUNE 30, 2012 | | BLACKROCK VARIABLE SERIES FUNDS, INC. | | 17 |
BlackRock Variable Series Funds, Inc.
BlackRock Balanced Capital V.I. Fund
| | |
| Schedule of Investments (concluded) | | |
| | | | | | | | | | | | | | | | |
| | | Level 1 | | | Level 2 | | | Level 3 | | | Total | |
Derivative Financial Instruments1 | | | | | | | | | | | | | | | | |
| Assets: | | | | | | | | | | | | | | | | |
Credit contracts | | | — | | | $ | 13,708 | | | | — | | | $ | 13,708 | |
Foreign currency exchange contracts | | | — | | | | 8,458 | | | | — | | | | 8,458 | |
Interest rate contracts | | $ | 12,458 | | | | 9,181 | | | | — | | | | 21,639 | |
| Liabilities: | | | | | | | | | | | — | | | | | |
Credit contracts | | | — | | | | (1,797 | ) | | | | | | | (1,797 | ) |
Foreign currency exchange contracts | | | — | | | | (5,581 | ) | | | — | | | | (5,581 | ) |
Interest rate contracts | | | (16,994 | ) | | | (48,770 | ) | | | — | | | | (65,764 | ) |
Total | | $ | (4,536 | ) | | $ | (24,801 | ) | | | — | | | $ | (29,337 | ) |
| | | | | | | | | | | | | | | | |
| 1 | Derivative financial instruments are swaps, financial futures contracts, foreign currency exchange contracts and options. Swaps, financial futures contracts, and foreign currency exchange contracts are valued at the unrealized appreciation/depreciation on the instrument and options are shown at value. |
Certain of the Fund’s assets and liabilities are held at carrying or face amount, which approximates fair value for financial statement purposes. As of June 30, 2012, such assets and liabilities are categorized within the disclosure hierarchy as follows:
| | | | | | | | | | | | | | | | |
| | | Level 1 | | | Level 2 | | | Level 3 | | | Total | |
| Assets: | | | | | | | | | | | | | | | | |
Foreign currency | | $ | 22,796 | | | | — | | | | — | | | $ | 22,796 | |
| Liabilities: | | | | | | | | | | | | | | | | |
Reverse repurchase agreements | | | — | | | $ | (1,291,800 | ) | | | — | | | | (1,291,800 | ) |
Total | | $ | 22,796 | | | $ | (1,291,800 | ) | | | — | | | $ | (1,269,004 | ) |
| | | | | | | | | | | | | | | | |
There were no transfers between Level 1 and Level 2 during the period ended June 30, 2012.
Certain of the Fund’s investments and derivative financial instruments are categorized as Level 3 and were valued utilizing transaction prices or third party pricing information without adjustment. Such valuations are based on unobservable inputs. A significant change in the unobservable inputs could result in a significantly lower or higher value in such Level 3 investments and derivative financial instruments.
The following table is a reconciliation of Level 3 investments for which significant unobservable inputs were used in determining fair value:
| | | | | | | | | | | | |
| | | Asset-
Backed
Securities | | | Non-Agency
Mortgage-
Backed
Securities | | | Total | |
| Assets: | | | | | | | | | | | | |
Opening balance, as of December 31, 2011 | | $ | 241,315 | | | $ | 38,630 | | | $ | 279,945 | |
Transfers into Level 32 | | | — | | | | — | | | | — | |
Transfers out of Level 32 | | | (183,692 | ) | | | (9,212 | ) | | | (192,904 | ) |
Accrued discounts/premiums | | | 21 | | | | 488 | | | | 509 | |
Net realized gain (loss) | | | 532 | | | | 361 | | | | 893 | |
Net change in unrealized appreciation/depreciation3 | | | 208 | | | | 200 | | | | 408 | |
Purchases | | | 38,798 | | | | — | | | | 38,798 | |
Sales | | | (27,540 | ) | | | (2,775 | ) | | | (30,315 | ) |
| Closing Balance, as of June 30, 2012 | | $ | 69,642 | | | $ | 27,692 | | | $ | 97,334 | |
| | | | | | | | | | | | |
| 2 | Transfers into and transfers out of Level 3 represent the values as of the beginning of the reporting period. |
| 3 | Included in the related net change in unrealized appreciation/depreciation in the Statement of Operations. The change in unrealized appreciation/depreciation on investments still held as of June 30, 2012 was $263. |
The following table is a reconciliation of Level 3 derivative financial instruments for which significant unobservable inputs were used in determining fair value:
| | | | |
| | | Credit
Contracts | |
| Liabilities: | | | | |
Opening balance, as of December 31, 2011 | | $ | (48 | ) |
Transfers into Level 32 | | | — | |
Transfers out of Level 32 | | | — | |
Accrued discounts/premiums | | | — | |
Net realized gain (loss) | | | — | |
Net change in unrealized appreciation/depreciation4 | | | 48 | |
Purchases | | | — | |
Issues5 | | | — | |
Sales | | | — | |
Settlements6 | | | — | |
Closing Balance, as of June 30, 2012 | | | — | |
| | | | |
| 4 | Included in the related net change in unrealized appreciation/depreciation in the Statement of Operations. The change in unrealized appreciation/depreciation on derivative financial instruments still held as of June 30, 2012 was $48. |
| 5 | Issues represent upfront cash received on certain derivative financial instruments. |
| 6 | Settlements represent periodic contractual cash flows and/or cash flows to terminate certain derivative financial instruments. |
A reconciliation of Level 3 investments and derivative financial instruments is presented when the Fund had a significant amount of Level 3 investments and derivative financial instruments as of the beginning and/or end of the period in relation to net assets.
See Notes to Financial Statements.
| | | | |
| | | | | |
| 18 | | BLACKROCK VARIABLE SERIES FUNDS, INC. | | JUNE 30, 2012 |
BlackRock Variable Series Funds, Inc.
BlackRock Balanced Capital V.I. Fund
| | |
| Statement of Assets and Liabilities June 30, 2012 (Unaudited) | | |
| | | | |
Assets: | | | | |
Investments at value—unaffiliated (cost—$31,544,408) | | $ | 32,925,294 | |
TBA sale commitments receivable | | | 3,950,605 | |
Investments sold receivable | | | 813,935 | |
Interest receivable | | | 87,725 | |
Foreign currency at value (cost—$23,546) | | | 22,796 | |
Unrealized appreciation on swaps | | | 19,945 | |
Dividends receivable | | | 16,567 | |
Unrealized appreciation on foreign currency exchange contracts | | | 8,096 | |
Variation margin receivable | | | 9,264 | |
Swaps receivable | | | 1,133 | |
Swap premiums paid | | | 927 | |
Prepaid expenses | | | 198 | |
| | | | |
Total assets | | | 37,856,485 | |
| | | | |
| | | | | |
Liabilities: | | | | |
Investments purchased payable | | | 6,173,877 | |
TBA sale commitments at value (proceeds—$3,950,605) | | | 3,958,766 | |
Reverse repurchase agreements | | | 1,291,800 | |
Unrealized depreciation on swaps | | | 45,681 | |
Swap premiums received | | | 18,250 | |
Investment advisory fees payable | | | 11,656 | |
Swaps payable | | | 8,492 | |
Options written at value (premiums received—$13,065) | | | 7,437 | |
Unrealized depreciation on foreign currency exchange contracts | | | 3,448 | |
Interest expense payable | | | 5,093 | |
Capital shares redeemed payable | | | 1,104 | |
Other affiliates payable | | | 174 | |
Other liabilities | | | 14,694 | |
Other accrued expenses payable | | | 26,851 | |
| | | | |
Total liabilities | | | 11,567,323 | |
| | | | |
| | | | | |
Net Assets | | $ | 26,289,162 | |
| | | | |
| | | | | |
Net Assets Consist of: | | | | |
Paid-in capital | | $ | 28,319,083 | |
Undistributed net investment income | | | 243,695 | |
Accumulated net realized loss | | | (3,624,359 | ) |
Net unrealized appreciation/depreciation | | | 1,350,743 | |
| | | | |
Net Assets | | $ | 26,289,162 | |
| | | | |
| | | | | |
Net Asset Value: | | | | |
Class 1—Based on net assets of $26,289,162 and 2,049,627 shares outstanding, 100 million shares authorized, $0.10 par value | | $ | 12.83 | |
| | | | |
| | | | | |
See Notes to Financial Statements.
| | | | |
| | | | | |
| JUNE 30, 2012 | | BLACKROCK VARIABLE SERIES FUNDS, INC. | | 19 |
BlackRock Variable Series Funds, Inc.
BlackRock Balanced Capital V.I. Fund
| | |
| Statement of Operations Six Months Ended June 30, 2012 (Unaudited) | | |
| | | | |
Investment Income: | | | | |
Dividends—unaffiliated | | $ | 173,754 | |
Foreign taxes withheld | | | (194 | ) |
Dividends—affiliated | | | 195 | |
Interest | | | 212,783 | |
| | | | |
Total income | | | 386,538 | |
| | | | |
| | | | | |
Expenses: | | | | |
Investment advisory | | | 75,117 | |
Accounting services | | | 22,758 | |
Custodian | | | 19,341 | |
Professional | | | 16,627 | |
Transfer agent | | | 11,751 | |
Officer and Directors | | | 8,747 | |
Printing | | | 5,320 | |
Miscellaneous | | | 14,647 | |
| | | | |
Total expenses excluding interest expense | | | 174,308 | |
Interest expense | | | 756 | |
| | | | |
Total expenses | | | 175,064 | |
Less fees waived by advisor | | | (1,071 | ) |
Less transfer agent fees reimbursed | | | (9,179 | ) |
| | | | |
Total expenses after fees waived and reimbursed | | | 164,814 | |
| | | | |
Net investment income | | | 221,724 | |
| | | | |
| | | | | |
Realized and Unrealized Gain (Loss): | | | | |
Net realized gain (loss) from: | | | | |
Investments | | | 749,561 | |
Financial futures contracts | | | (33,307 | ) |
Foreign currency transactions | | | 26,501 | |
Options written | | | 21,952 | |
Borrowed bonds | | | 454 | |
Swaps | | | (12,464 | ) |
| | | | |
| | | 752,697 | |
| | | | |
Net change in unrealized appreciation/depreciation on: | | | | |
Investments | | | 292,111 | |
Financial futures contracts | | | 5,601 | |
Foreign currency transactions | | | (12,854 | ) |
Options written | | | 10,750 | |
Swaps | | | (29,367 | ) |
| | | | |
| | | 266,241 | |
| | | | |
Total realized and unrealized gain | | | 1,018,938 | |
| | | | |
Net Increase in Net Assets Resulting from Operations | | $ | 1,240,662 | |
| | | | |
| | | | | |
See Notes to Financial Statements.
| | | | |
| | | | | |
| 20 | | BLACKROCK VARIABLE SERIES FUNDS, INC. | | JUNE 30, 2012 |
BlackRock Variable Series Funds, Inc.
BlackRock Balanced Capital V.I. Fund
| | |
| Statements of Changes in Net Assets | | |
| | | | | | | | |
| Increase (Decrease) in Net Assets: | | Six Months Ended
June 30, 2012
(Unaudited) | | | Year Ended December 31, 2011 | |
Operations: | | | | | | | | |
Net investment income | | $ | 221,724 | | | $ | 489,601 | |
Net realized gain | | | 752,697 | | | | 2,209,376 | |
Net change in unrealized appreciation/depreciation | | | 266,241 | | | | (1,537,961 | ) |
| | | | | | | | |
Net increase in net assets resulting from operations | | | 1,240,662 | | | | 1,161,016 | |
| | | | | | | | |
| | | | | | | | | |
Dividends to Shareholders From: | | | | | | | | |
Net investment income | | | — | | | | (597,964 | ) |
| | | | | | | | |
| | | | | | | | | |
Capital Share Transactions: | | | | | | | | |
Net decrease in net assets derived from capital share transactions | | | (1,811,228 | ) | | | (3,344,744 | ) |
| | | | | | | | |
| | | | | | | | | |
Net Assets: | | | | | | | | |
Total decrease in net assets | | | (570,566 | ) | | | (2,781,692 | ) |
Beginning of period | | | 26,859,728 | | | | 29,641,420 | |
| | | | | | | | |
End of period | | $ | 26,289,162 | | | $ | 26,859,728 | |
| | | | | | | | |
Undistributed net investment income | | $ | 243,695 | | | $ | 21,971 | |
| | | | | | | | |
| | | | | | | | | |
See Notes to Financial Statements.
| | | | |
| | | | | |
| JUNE 30, 2012 | | BLACKROCK VARIABLE SERIES FUNDS, INC. | | 21 |
BlackRock Variable Series Funds, Inc.
BlackRock Balanced Capital V.I. Fund
| | | | | | | | | | | | | | | | | | | | | | | | |
| | | Class I | |
| | Six Months Ended
June 30, 2012
(Unaudited) | | | Year Ended December 31, | |
| | | 2011 | | | 2010 | | | 2009 | | | 2008 | | | 2007 | |
Per Share Operating Performance: | | | | | | | | | | | | | | | | | | | | | | | | |
Net asset value, beginning of period | | $ | 12.26 | | | $ | 12.07 | | | $ | 11.30 | | | $ | 9.79 | | | $ | 14.16 | | | $ | 13.76 | |
| | | | | | | | | | | | | | | | | | | | | | | | |
Net investment income1 | | | 0.10 | | | | 0.21 | | | | 0.18 | | | | 0.22 | | | | 0.29 | | | | 0.31 | |
Net realized and unrealized gain (loss) | | | 0.47 | | | | 0.26 | | | | 0.81 | | | | 1.53 | | | | (4.35) | | | | 0.42 | |
| | | | | | | | | | | | | | | | | | | | | | | | |
Net increase (decrease) from investment operations | | | 0.57 | | | | 0.47 | | | | 0.99 | | | | 1.75 | | | | (4.06) | | | | 0.73 | |
| | | | | | | | | | | | | | | | | | | | | | | | |
Dividends from net investment income | | | — | | | | (0.28) | | | | (0.22) | | | | (0.24) | | | | (0.31) | | | | (0.33) | |
| | | | | | | | | | | | | | | | | | | | | | | | |
Net asset value, end of period | | $ | 12.83 | | | $ | 12.26 | | | $ | 12.07 | | | $ | 11.30 | | | $ | 9.79 | | | $ | 14.16 | |
| | | | | | | | | | | | | | | | | | | | | | | | |
| | | | | | | | | | | | | | | | | | | | | | | | | |
Total Investment Return:2 | | | | | | | | | | | | | | | | | | | | | | | | |
Based on net asset value | | | 4.65% | 3 | | | 3.84% | | | | 8.76% | | | | 17.93% | | | | (28.62)% | | | | 5.31% | |
| | | | | | | | | | | | | | | | | | | | | | | | |
| | | | | | | | | | | | | | | | | | | | | | | | | |
Ratios to Average Net Assets: | | | | | | | | | | | | | | | | | | | | | | | | |
Total expenses | | | 1.29% | 4 | | | 1.16% | | | | 1.14% | | | | 1.08% | | | | 0.92% | | | | 0.75% | |
| | | | | | | | | | | | | | | | | | | | | | | | |
Total expenses after fees waived | | | 1.21% | 4 | | | 1.14% | | | | 1.14% | | | | 1.07% | | | | 0.92% | | | | 0.75% | |
| | | | | | | | | | | | | | | | | | | | | | | | |
Total expenses after fees waived and excluding interest expense | | | 1.21% | 4 | | | 1.13% | | | | 1.10% | | | | 1.07% | | | | 0.90% | | | | 0.75% | |
| | | | | | | | | | | | | | | | | | | | | | | | |
Net investment income | | | 1.63% | 4 | | | 1.71% | | | | 1.60% | | | | 2.19% | | | | 2.37% | | | | 2.14% | |
| | | | | | | | | | | | | | | | | | | | | | | | |
| | | | | | | | | | | | | | | | | | | | | | | | | |
Supplemental Data: | | | | | | | | | | | | | | | | | | | | | | | | |
Net assets, end of period (000) | | $ | 26,289 | | | $ | 26,860 | | | $ | 29,641 | | | $ | 31,498 | | | $ | 32,191 | | | $ | 56,550 | |
| | | | | | | | | | | | | | | | | | | | | | | | |
Portfolio turnover | | | 279% | 5 | | | 570% | 6 | | | 730% | 7 | | | 381% | 8 | | | 344% | 9 | | | 385% | |
| | | | | | | | | | | | | | | | | | | | | | | | |
| | | | | | | | | | | | | | | | | | | | | | | | | |
| 1 | Based on average shares outstanding. |
| 2 | Where applicable, total investment returns exclude insurance-related fees and expenses and include the reinvestment of dividends and distributions. |
| 3 | Aggregate total investment return. |
| 5 | Includes mortgage dollar roll transactions. Excluding these transactions, the portfolio turnover rate would have been 230%. |
| 6 | Includes mortgage dollar roll transactions. Excluding these transactions, the portfolio turnover rate would have been 400%. |
| 7 | Includes mortgage dollar roll transactions. Excluding these transactions, the portfolio turnover rate would have been 547%. |
| 8 | Includes mortgage dollar roll transactions. Excluding these transactions, the portfolio turnover rate would have been 263%. |
| 9 | Includes mortgage dollar roll transactions. Excluding these transactions, the portfolio turnover rate would have been 260%. |
See Notes to Financial Statements.
| | | | |
| | | | | |
| 22 | | BLACKROCK VARIABLE SERIES FUNDS, INC. | | JUNE 30, 2012 |
BlackRock Variable Series Funds, Inc.
BlackRock Balanced Capital V.I. Fund
Financial Highlights (concluded)
| | | | |
| | | Class III | |
| | | Year Ended
December 31, 20071 | |
Per Share Operating Performance: | | | | |
Net asset value, beginning of year | | $ | 13.72 | |
| | | | |
Net investment income2 | | | 0.28 | |
Net realized and unrealized gain | | | 0.41 | |
| | | | |
Net increase from investment operations | | | 0.69 | |
| | | | |
Dividends from net investment income3 | | | (0.30) | |
| | | | |
Net asset value, end of year | | $ | 14.11 | |
| | | | |
| | | | | |
Total Investment Return:3 | | | | |
Based on net asset value | | | 5.02% | |
| | | | |
| | | | | |
Ratios to Average Net Assets: | | | | |
Total expenses | | | 1.03% | |
| | | | |
Total expenses after fees waived and/or reimbursed | | | 1.03% | |
| | | | |
Net investment income | | | 1.92% | |
| | | | |
| | | | | |
Supplemental Data: | | | | |
Net assets, end of year (000) | | $ | — | 1 |
| | | | |
Portfolio turnover | | | 385% | |
| | | | |
| | | | | |
| 1 | There were no Class III Shares outstanding as of December 31, 2007 and during the years ended December 31, 2008, December 31, 2009, December 31, 2010 and December 31, 2011 and the six months ended June 30, 2012. As there were no Class III Shares outstanding as of June 30, 2012, the financial highlights for Class III were not required to be presented in the previously filed June 30, 2012 financial statements. The Class III Shares are scheduled to re-open to new investors effective January 22, 2013. |
| 2 | Based on average shares outstanding. |
| 3 | Where applicable, total investment returns exclude insurance-related fees and expenses and include the reinvestment of dividends and distributions. |
See Notes to Financial Statements.
| | | | |
| | | | | |
| JUNE 30, 2012 | | BLACKROCK VARIABLE SERIES FUNDS, INC. | | 23 |
BlackRock Variable Series Funds, Inc.
BlackRock Balanced Capital V.I. Fund
Notes to Financial Statements (Unaudited)
1. Organization and Significant Accounting Policies:
BlackRock Variable Series Funds, Inc. (the “Company”), is registered under the Investment Company Act of 1940, as amended (the “1940 Act”), as an open-end management investment company. The Company is organized as a Maryland Corporation. The funds offer shares to insurance companies for their separate accounts to fund benefits under certain variable annuity and variable life insurance contracts. The financial statements presented are for the BlackRock Balanced Capital V.I. Fund (the “Fund”), and are prepared in conformity with accounting principles generally accepted in the United States of America (“US GAAP”), which may require management to make estimates and assumptions that affect the reported amounts and disclosures in the financial statements. Actual results could differ from those estimates. Class I and Class III Shares have equal voting, dividend, liquidation and other rights, except that only shares of the respective classes are entitled to vote on matters concerning only that class. In addition, Class III Shares bear certain expenses related to the distribution of such shares. Class III Shares were redeemed on December 31, 2007 and currently are not offered.
The following is a summary of significant accounting policies followed by the Fund:
Valuation: US GAAP defines fair value as the price the Fund would receive to sell an asset or pay to transfer a liability in an orderly transaction between market participants at the measurement date. The Fund fair values its financial instruments at market value using independent dealers or pricing services under policies approved annually by the Board of Directors of the Company (the “Board”). The BlackRock Global Valuation Methodologies Committee (the “Global Valuation Committee”) is the committee formed by management to develop global pricing policies and procedures and to provide oversight of the pricing function for the Fund for all financial instruments.
The Fund values its bond investments on the basis of last available bid prices or current market quotations provided by dealers or pricing services. In determining the value of a particular investment, pricing services may use certain information with respect to transactions in such investments, quotations from dealers, pricing matrixes, market transactions in comparable investments, various relationships observed in the market between investments and calculated yield measures.
Asset-backed and mortgage-backed securities are valued by independent pricing services using models that consider estimated cash flows of each tranche of the security, establish a benchmark yield and develop an estimated tranche specific spread to the benchmark yield based on the unique attributes of the tranche. Financial futures contracts traded on exchanges are valued at their last sale price. To-be-announced (“TBA”) commitments are valued on the basis of last available bid prices or current market quotations provided by pricing services. Swap agreements are valued utilizing quotes received daily by the Fund’s pricing service or through brokers, which are derived using daily swap curves and models that incorporate a number of market data factors, such as discounted cash flows, trades and values of the underlying reference instruments. Investments in open-end registered investment companies are valued at NAV each business day. Short-term securities with remaining maturities of 60 days or less may be valued at amortized cost, which approximates fair value.
Municipal investments (including commitments to purchase such investments on a “when-issued” basis) are valued on the basis of prices provided by dealers or pricing services. In determining the value of a particular investment, pricing services may use certain information with respect to transactions in such investments, quotations from dealers, pricing matrixes, market transactions in comparable investments and information with respect to various relationships between investments.
Equity investments traded on a recognized securities exchange or the NASDAQ Global Market System (“NASDAQ”) are valued at the last reported sale price that day or the NASDAQ official closing price, if applicable. For equity investments traded on more than one exchange, the last reported sale price on the exchange where the stock is primarily traded is used. Equity investments traded on a recognized exchange for which there were no sales on that day are valued at the last available bid (long positions) or ask (short positions) price. If no bid or ask price is available, the prior day’s price will be used, unless it is determined that such prior day’s price no longer reflects the fair value of the security.
Securities and other assets and liabilities denominated in foreign currencies are translated into US dollars using exchange rates determined as of the close of business on the New York Stock Exchange (“NYSE”). Foreign currency exchange contracts are valued at the mean between the bid and ask prices and are determined as of the close of business on the NYSE. Interpolated values are derived when the
| | | | |
| | | | | |
| 24 | | BLACKROCK VARIABLE SERIES FUNDS, INC. | | JUNE 30, 2012 |
settlement date of the contract is an interim date for which quotations are not available.
Exchange-traded options are valued at the mean between the last bid and ask prices at the close of the options market in which the options trade. An exchange-traded option for which there is no mean price is valued at the last bid (long positions) or ask (short positions) price. If no bid or ask price is available, the prior day’s price will be used, unless it is determined that the prior day’s price no longer reflects the fair value of the option. Over-the-counter (“OTC”) options and swaptions are valued by an independent pricing service using a mathematical model which incorporates a number of market data factors, such as the trades and prices of the underlying instruments.
In the event that application of these methods of valuation results in a price for an investment which is deemed not to be representative of the market value of such investment or if a price is not available, the investment will be valued by the Global Valuation Committee, or its delegate, in accordance with a policy approved by the Board as reflecting fair value (“Fair Value Assets”). When determining the price for Fair Value Assets, the Global Valuation Committee, or its delegate, seeks to determine the price that the Fund might reasonably expect to receive from the current sale of that asset in an arm’s-length transaction. Fair value determinations shall be based upon all available factors that the investment advisor and/or sub-advisor deems relevant. These factors include but are not limited to (i) attributes specific to the investment or asset; (ii) the principal market for the investment or asset; (iii) the customary participants in the principal market for the investment or asset; (iv) data assumptions by market participants for the investment or asset, if reasonably available; (v) quoted prices for similar investments or assets in active markets; and (vi) other factors, such as future cash flows, interest rates, yield curves, volatilities, prepayment speeds, loss severities, credit risks and/or default rates. The Global Valuation Committee, or its delegate, employs various methods for calibrating valuation approaches, including regular due diligence of the Fund’s pricing vendors, a regular review of key inputs and assumptions, transactional back-testing or disposition analysis to compare unrealized gains and losses to realized gains and losses, reviews of missing or stale prices and large movements in market values and reviews of any market related activity. The pricing of all Fair Value Assets is subsequently reported to the Board or a committee thereof on a quarterly basis.
Generally, trading in foreign instruments is substantially completed each day at various times prior to the close of business on the NYSE. Occasionally, events affecting the values of such instruments may
occur between the foreign market close and the close of business on the NYSE that may not be reflected in the computation of the Fund’s net assets. If events (for example, a company announcement, market volatility or a natural disaster) occur during such periods that are expected to affect the value of such instruments materially, those instruments may be Fair Value Assets and valued at their fair value, as determined in good faith by the Global Valuation Committee using a pricing service and/or policies approved by the Board. Each business day, the Fund uses a pricing service to assist with the valuation of certain foreign exchange-traded equity securities and foreign exchange-traded and OTC options (the “Systematic Fair Value Price”). Using current market factors, the Systematic Fair Value Price is designed to value such foreign securities and foreign options at fair value as of the close of business on the NYSE, which follows the close of the local markets.
Foreign Currency Transactions: The Fund’s books and records are maintained in US dollars. Purchases and sales of investment securities are recorded at the rates of exchange prevailing on the respective date of such transactions. Generally, when the US dollar rises in value against a foreign currency, the Fund’s investments denominated in that currency will lose value because that currency is worth fewer US dollars; the opposite effect occurs if the US dollar falls in relative value.
The Fund does not isolate the portion of the results of operations arising as a result of changes in the foreign exchange rates from the changes in the market prices of investments held or sold for financial reporting purposes. Accordingly, the effects of changes in foreign currency exchange rates on investments are not segregated on the Statement of Operations from the effects of changes in market prices of those investments but are included as a component of net realized and unrealized gain (loss) from investments. The Fund reports realized currency gains (losses) on foreign currency related transactions as components of net realized gain (loss) for financial reporting purposes, whereas such components are treated as ordinary income for federal income tax purposes.
Asset-Backed and Mortgage-Backed Securities: The Fund may invest in asset-backed securities. Asset-backed securities are generally issued as pass-through certificates, which represent undivided fractional ownership interests in an underlying pool of assets, or as debt instruments, which are also known as collateralized obligations, and are generally issued as the debt of a special purpose entity organized solely for the purpose of owning such assets and issuing such debt. Asset-backed securities are often backed by a pool of assets representing the obligations of a number of different
| | | | |
| | | | | |
| JUNE 30, 2012 | | BLACKROCK VARIABLE SERIES FUNDS, INC. | | 25 |
parties. The yield characteristics of certain asset-backed securities may differ from traditional debt securities. One such major difference is that all or a principal part of the obligations may be prepaid at any time because the underlying assets (i.e., loans) may be prepaid at any time. As a result, a decrease in interest rates in the market may result in increases in the level of prepayments as borrowers, particularly mortgagors, refinance and repay their loans. An increased prepayment rate with respect to an asset-backed security subject to such a prepayment feature will have the effect of shortening the maturity of the security. If the Fund has purchased such an asset-backed security at a premium, a faster than anticipated prepayment rate could result in a loss of principal to the extent of the premium paid.
The Fund may purchase certain mortgage pass-through securities. There are a number of important differences among the agencies and instrumentalities of the US government that issue mortgage-related securities and among the securities that they issue. For example, mortgage-related securities guaranteed by Ginnie Mae are guaranteed as to the timely payment of principal and interest by Ginnie Mae and such guarantee is backed by the full faith and credit of the United States. However, mortgage-related securities issued by Freddie Mac and Fannie Mae, including Freddie Mac and Fannie Mae guaranteed Mortgage Pass-Through Certificates, which are solely the obligations of Freddie Mac and Fannie Mae, are not backed by or entitled to the full faith and credit of the United States but are supported by the right of the issuer to borrow from the Treasury.
Inflation-Indexed Bonds: The Fund may invest in inflation-indexed bonds. Inflation-indexed bonds are fixed income securities whose principal value is periodically adjusted according to the rate of inflation. If the index measuring inflation rises or falls, the principal value of inflation-indexed bonds will be adjusted upward or downward, and consequently the interest payable on these securities (calculated with respect to a larger or smaller principal amount) will be increased or reduced, respectively. Repayment of the original bond principal upon maturity (as adjusted for inflation) is guaranteed in the case of US Treasury inflation-indexed bonds. For bonds that do not provide a similar guarantee, the adjusted principal value of the bond repaid at maturity may be less than the original principal.
Collateralized Debt Obligations: The Fund may invest in collateralized debt obligations (“CDOs”), which include collateralized bond obligations (“CBOs”) and collateralized loan obligations (“CLOs”). CBOs and CLOs are types of asset-backed securities. A CDO is a bankruptcy remote entity
which is backed by a diversified pool of debt securities (CBOs) or syndicated bank loans (CLOs). The cash flows of the CDO can be split into multiple segments, called “tranches”, which will vary in risk profile and yield. The riskiest segment is the subordinated or “equity” tranche. This tranche bears the greatest risk of defaults from the underlying assets in the CDO and serves to protect the other, more senior, tranches from default in all but the most severe circumstances. Since it is shielded from defaults by the more junior tranches, a “senior” tranche will typically have higher credit ratings and lower yields than their underlying securities, and often receive investment grade ratings from one or more of the nationally recognized rating agencies. Despite the protection from the more junior tranches, senior tranches can experience substantial losses due to actual defaults, increased sensitivity to future defaults and the disappearance of one or more protecting tranches as a result of changes in the credit profile of the underlying pool of assets.
Inflation-Indexed Bonds: The Fund may invest in inflation-indexed bonds. Inflation-indexed bonds are fixed income securities whose principal value is periodically adjusted according to the rate of inflation. If the index measuring inflation rises or falls, the principal value of inflation-indexed bonds will be adjusted upward or downward, and consequently the interest payable on these securities (calculated with respect to a larger or smaller principal amount) will be increased or reduced, respectively. Repayment of the original bond principal upon maturity (as adjusted for inflation) is guaranteed in the case of US Treasury inflation-indexed bonds. For bonds that do not provide a similar guarantee, the adjusted principal value of the bond repaid at maturity may be less than the original principal.
Multiple Class Pass-Through Securities: The Fund may invest in multiple class pass-through securities, including collateralized mortgage obligations (“CMOs”) and commercial mortgage-backed securities. These multiple class securities may be issued by Ginnie Mae, US government agencies or instrumentalities or by trusts formed by private originators of, or investors in, mortgage loans. In general, CMOs are debt obligations of a legal entity that are collateralized by, and multiple class pass-through securities represent direct ownership interests in, a pool of residential or commercial mortgage loans or mortgage pass-through securities (the “Mortgage Assets”), the payments on which are used to make payments on the CMOs or multiple pass-through securities. Classes of CMOs include interest only (“IOs”), principal only (“POs”), planned amortization classes and targeted amortization classes. IOs and POs are stripped mortgage-backed
| | | | |
| | | | | |
| 26 | | BLACKROCK VARIABLE SERIES FUNDS, INC. | | JUNE 30, 2012 |
securities representing interests in a pool of mortgages, the cash flow from which has been separated into interest and principal components. IOs receive the interest portion of the cash flow while POs receive the principal portion. IOs and POs can be extremely volatile in response to changes in interest rates. As interest rates rise and fall, the value of IOs tends to move in the same direction as interest rates. POs perform best when prepayments on the underlying mortgages rise since this increases the rate at which the principal is returned and the yield to maturity on the PO. When payments on mortgages underlying a PO are slower than anticipated, the life of the PO is lengthened and the yield to maturity is reduced. If the underlying Mortgage Assets experience greater than anticipated pre-payments of principal, the Fund may not fully recoup its initial investment in IOs.
Stripped Mortgage-Backed Securities: The Fund may invest in stripped mortgage-backed securities issued by the US government, its agencies and instrumentalities. Stripped mortgage-backed securities are usually structured with two classes that receive different proportions of the interest (IOs) and principal (POs) distributions on a pool of Mortgage Assets. The Fund also may invest in stripped mortgage-backed securities that are privately issued.
Zero-Coupon Bonds: The Fund may invest in zero-coupon bonds, which are normally issued at a significant discount from face value and do not provide for periodic interest payments. Zero-coupon bonds may experience greater volatility in market value than similar maturity debt obligations which provide for regular interest payments.
Capital Trusts: The Fund may invest in capital trusts. These securities are typically issued by corporations, generally in the form of interest-bearing notes with preferred securities characteristics, or by an affiliated business trust of a corporation, generally in the form of beneficial interests in subordinated debentures or similarly structured securities. The securities can be structured as either fixed or adjustable coupon securities that can have either a perpetual or stated maturity date. Dividends can be deferred without creating an event of default or acceleration, although maturity cannot take place unless all cumulative payment obligations have been met. The deferral of payments does not affect the purchase or sale of these securities in the open market. Payments on these securities are treated as interest rather than dividends for federal income tax purposes. These securities generally are rated below that of the issuing company’s senior debt securities.
Preferred Stock: The Fund may invest in preferred stocks. Preferred stock has a preference over common stock in liquidation (and generally in
receiving dividends as well) but is subordinated to the liabilities of the issuer in all respects. As a general rule, the market value of preferred stock with a fixed dividend rate and no conversion element varies inversely with interest rates and perceived credit risk, while the market price of convertible preferred stock generally also reflects some element of conversion value. Because preferred stock is junior to debt securities and other obligations of the issuer, deterioration in the credit quality of the issuer will cause greater changes in the value of a preferred stock than in a more senior debt security with similar stated yield characteristics. Unlike interest payments on debt securities, preferred stock dividends are payable only if declared by the issuer’s board of directors. Preferred stock also may be subject to optional or mandatory redemption provisions.
Borrowed Bond Agreements: The Fund may enter into borrowed bond agreements. In a borrowed bond agreement, the Fund borrows a bond from a counterparty in exchange for cash collateral with the commitment that the security and the cash will be returned to the counterparty and the Fund, respectively, at a mutually agreed upon rate and date. Certain agreements have no stated maturity and can be terminated by either party at any time. Borrowed bond agreements are entered into primarily in connection with short sales of bonds. Earnings on cash collateral and compensation to the lender of the bond are based on agreed upon rates between the Fund and the counterparty. The value of the underlying cash collateral approximates the market value and accrued interest of the borrowed bond. To the extent that a borrowed bond transaction exceeds one business day, the value of the cash collateral in the possession of the counterparty is monitored on a daily basis to ensure the adequacy of the collateral. As the market value of the borrowed bond changes, the cash collateral is periodically increased or decreased with a frequency and in amounts prescribed in the borrowed bond agreement. Full realization of the collateral by the Fund may be limited if the value of an investment purchased with the cash collateral by the lender decreases. The Fund may also experience delays in gaining access to the collateral.
Short Sales: The Fund may enter into short sale transactions in which the Fund sells a security it does not hold in anticipation of a decline in the market price of that security. When the Fund makes a short sale, it will borrow the security sold short (borrowed bond) and deliver it to the counterparty to which it sold the security short. An amount equal to the proceeds received by the Fund is reflected as an asset and an equivalent liability. The amount of the liability is subsequently marked-to-market to reflect the market value of the short sale. The Fund is required to repay the counterparty any dividends or
| | | | |
| | | | | |
| JUNE 30, 2012 | | BLACKROCK VARIABLE SERIES FUNDS, INC. | | 27 |
interest received on the security sold short, which is shown as dividend or interest expense in the Statement of Operations. The Fund may pay a fee on the assets borrowed from the counterparty, which is shown as stock loan fees in the Statement of Operations. The Fund maintains a segregated account of securities or deposits cash with the broker-dealer as collateral for the short sales. The Fund may receive interest on its cash collateral deposited with the broker-dealer. The Fund is exposed to market risk based on the amount, if any, that the market value of the security increases beyond the market value at which the position was sold. Thus, a short sale of a security involves the risk that instead of declining, the price of the security sold short will rise. The short sale of securities involves the possibility of a theoretically unlimited loss since there is a theoretically unlimited potential for the market price of the security sold short to increase. A gain, limited to the price at which the Fund sold the security short, or a loss, unlimited as to the dollar amount, will be recognized upon the termination of a short sale if the market price is greater or less than the proceeds originally received. There is no assurance the Fund will be able to close out a short position at a particular time or at an acceptable price.
Forward Commitments and When-Issued Delayed Delivery Securities: The Fund may purchase securities on a when-issued basis and may purchase or sell securities on a forward commitment basis. Settlement of such transactions normally occurs within a month or more after the purchase or sale commitment is made. The Fund may purchase securities under such conditions with the intention of actually acquiring them, but may enter into a separate agreement to sell the securities before the settlement date. Since the value of securities purchased may fluctuate prior to settlement, the Fund may be required to pay more at settlement than the security is worth. In addition, the Fund is not entitled to any of the interest earned prior to settlement. When purchasing a security on a delayed delivery basis, the Fund assumes the rights and risks of ownership of the security, including the risk of price and yield fluctuations. In the event of default by the counterparty, the Fund’s maximum amount of loss is the unrealized appreciation of unsettled when-issued transactions, which is shown in the Schedule of Investments.
TBA Commitments: The Fund may enter into TBA commitments. TBA commitments are forward agreements for the purchase or sale of mortgage-backed securities for a fixed price, with payment and delivery on an agreed upon future settlement date. The specific securities to be delivered are not identified at the trade date. However, delivered securities must meet specified terms, including issuer, rate and mortgage terms. The Fund generally enters into TBA commitments with the intent to take possession of
or deliver the underlying mortgage-backed securities but can extend the settlement or roll the transaction. TBA commitments involve a risk of loss if the value of the security to be purchased or sold declines or increases, respectively, prior to settlement date.
Mortgage Dollar Roll Transactions: The Fund may sell TBA mortgage-backed securities and simultaneously contract to repurchase substantially similar (same type, coupon and maturity) securities on a specific future date at an agreed upon price. During the period between the sale and repurchase, the Fund will not be entitled to receive interest and principal payments on the securities sold. The Fund accounts for mortgage dollar roll transactions as purchases and sales and realizes gains and losses on these transactions. These transactions may increase the Fund’s portfolio turnover rate. Mortgage dollar rolls involve the risk that the market value of the securities that the Fund is required to purchase may decline below the agreed upon repurchase price of those securities.
Treasury Roll Transactions: The Fund may enter into treasury roll transactions. In a treasury roll transaction, the Fund sells a Treasury security to a counterparty with a simultaneous agreement to repurchase the same security at an agreed upon price and future settlement date. The Fund receives cash from the sale of the Treasury security to use for other investment purposes. The difference between the sale price and repurchase price represents net interest income or net interest expense reflective of an agreed upon rate between the Fund and the counterparty over the term of the borrowing. For US GAAP purposes, a treasury roll transaction is accounted for as a secured borrowing and not as a purchase or sale. During the term of the borrowing, interest income from the Treasury security and the related interest expense on the secured borrowing is recorded by the Fund on an accrual basis. The Fund will benefit from the transaction if the income earned on the investment purchased with the cash received in the treasury roll transaction exceeds the interest expense incurred by the Fund. If the interest expense exceeds the income earned, the Fund’s net investment income and dividends to shareholders may be adversely impacted. Treasury roll transactions involve the risk that the market value of the securities that the Fund is required to repurchase may decline below the agreed upon repurchase price of those securities.
Reverse Repurchase Agreements: The Fund may enter into reverse repurchase agreements with qualified third party broker-dealers. In a reverse repurchase agreement, the Fund sells securities to a bank or broker-dealer and agrees to repurchase the same securities at a mutually agreed upon date and price. Securities sold under reverse repurchase agreements are recorded at face value as a liability
| | | | |
| | | | | |
| 28 | | BLACKROCK VARIABLE SERIES FUNDS, INC. | | JUNE 30, 2012 |
in the Statement of Assets and Liabilities. Due to the short term nature of the reverse repurchase agreements, face value approximates fair value. During the term of the reverse repurchase agreement, the Fund continues to receive the principal and interest payments on these securities. Certain agreements have no stated maturity and can be terminated by either party at any time. Interest on the value of the reverse repurchase agreements issued and outstanding is based upon competitive market rates determined at the time of issuance. The Fund may utilize reverse repurchase agreements when it is anticipated that the interest income to be earned from the investment of the proceeds of the transaction is greater than the interest expense of the transaction. Reverse repurchase agreements involve leverage risk and also the risk that the market value of the securities that the Fund is obligated to repurchase under the agreement may decline below the repurchase price. In the event the buyer of securities under a reverse repurchase agreement files for bankruptcy or becomes insolvent, the Fund’s use of the proceeds of the agreement may be restricted while the other party, or its trustee or receiver, determines whether or not to enforce the Fund’s obligation to repurchase the securities.
Segregation and Collateralization: In cases in which the 1940 Act and the interpretive positions of the Securities and Exchange Commission (“SEC”) require that the Fund either deliver collateral or segregate assets in connection with certain investments (e.g., dollar rolls, TBA sale commitments, financial futures contracts, foreign currency exchange contracts, swaps, short sales and options written), or certain borrowings (e.g., reverse repurchase agreements and treasury roll transactions), the Fund will, consistent with SEC rules and/or certain interpretive letters issued by the SEC, segregate collateral or designate on its books and records cash or liquid securities having a market value at least equal to the amount that would otherwise be required to be physically segregated. Furthermore, based on requirements and agreements with certain exchanges and third party broker-dealers, each party to such transactions has requirements to deliver/deposit securities as collateral for certain investments.
Investment Transactions and Investment Income: For financial reporting purposes, investment transactions are recorded on the dates the transactions are entered into (the trade dates). Realized gains and losses on investment transactions are determined on the identified cost basis. Dividend income is recorded on the ex-dividend dates. Dividends from foreign securities where the ex-dividend date may have passed are subsequently recorded when the Fund is informed of the ex-dividend date. Under the applicable foreign tax
laws, a withholding tax at various rates may be imposed on capital gains, dividends and interest. Upon notification from issuers, some of the dividend income received from a real estate investment trust may be redesignated as a reduction of cost of the related investment and/or realized gain. Interest income, including amortization and accretion of premiums and discounts on debt securities, is recognized on the accrual basis. Income and realized and unrealized gains and losses are allocated daily to each class based on its relative net assets. Consent fees are compensation for agreeing to changes in the terms of debt instruments and are included in interest income in the Statement of Operations.
Dividends and Distributions: Dividends and distributions paid by the Fund are recorded on the ex-dividend dates. The amount and timing of dividends and distributions are determined in accordance with federal income tax regulations, which may differ from US GAAP.
Income Taxes: It is the Fund’s policy to comply with the requirements of the Internal Revenue Code of 1986, as amended, applicable to regulated investment companies and to distribute substantially all of its taxable income to its shareholders. Therefore, no federal income tax provision is required.
The Fund files US federal and various state and local tax returns. No income tax returns are currently under examination. The statute of limitations on the Fund’s US federal tax returns remains open for each of the four years ended December 31, 2011. The statutes of limitations on the Fund’s state and local tax returns may remain open for an additional year depending upon the jurisdiction. Management does not believe there are any uncertain tax positions that require recognition of a tax liability.
Recent Accounting Standards: In December 2011, the Financial Accounting Standards Board issued guidance that will expand current disclosure requirements on the offsetting of certain assets and liabilities. The new disclosures will be required for investments and derivative financial instruments subject to master netting or similar agreements which are eligible for offset in the Statement of Assets and Liabilities and will require an entity to disclose both gross and net information about such investments and transactions in the financial statements. The guidance is effective for financial statements with fiscal years beginning on or after January 1, 2013, and interim periods within those fiscal years. Management is evaluating the impact of this guidance on the Fund’s financial statement disclosures.
Other: Expenses directly related to the Fund are charged to the Fund. Other operating expenses shared by several funds are pro rated among those
| | | | |
| | | | | |
| JUNE 30, 2012 | | BLACKROCK VARIABLE SERIES FUNDS, INC. | | 29 |
funds on the basis of relative net assets or other appropriate methods.
The Fund has an arrangement with the custodian whereby fees may be reduced by credits earned on uninvested cash balances, which, if applicable, are shown as fees paid indirectly in the Statement of Operations. The custodian imposes fees on overdrawn cash balances, which can be offset by accumulated credits earned or may result in additional custody charges.
2. Derivative Financial Instruments:
The Fund engages in various portfolio investment strategies using derivative contracts both to increase the returns of the Fund and/or to economically hedge, or protect, its exposure to certain risks such as credit risk, equity risk, interest rate risk, foreign currency exchange rate risk or other risk (commodity price risk and inflation risk). These contracts may be transacted on an exchange or OTC.
Losses may arise if the value of the contract decreases due to an unfavorable change in the market rates or values of the underlying instrument or if the counterparty does not perform under the contract. The Fund’s maximum risk of loss from counterparty credit risk on OTC derivatives is generally the aggregate unrealized gain netted against any collateral pledged by/posted to the counterparty. For OTC options purchased, the Fund bears the risk of loss in the amount of the premiums paid plus the positive change in market values net of any collateral received on the options should the counterparty fail to perform under the contracts. Options written by the Fund do not give rise to counterparty credit risk, as options written obligate the Fund to perform and not the counterparty. Counterparty risk related to exchange-traded financial futures contracts and options and centrally cleared swaps is deemed to be minimal due to the protection against defaults provided by the exchange on which these contracts trade.
The Fund may mitigate counterparty risk by procuring collateral and through netting provisions included within an International Swaps and Derivatives Association, Inc. master agreement (“ISDA Master Agreement”) implemented between the Fund and each of its respective counterparties. An ISDA Master Agreement allows the Fund to offset with each separate counterparty certain derivative financial instrument’s payables and/or receivables with collateral held. The amount of collateral moved to/from applicable counterparties is generally based upon minimum transfer amounts of up to $500,000. To the extent amounts due to the Fund from its counterparties are not fully collateralized, contractually or otherwise, the Fund bears the risk of loss from counterparty non-performance. See Note 1
“Segregation and Collateralization” for information with respect to collateral practices. In addition, the Fund manages counterparty risk by entering into agreements only with counterparties that it believes have the financial resources to honor their obligations and by monitoring the financial stability of those counterparties.
Certain ISDA Master Agreements allow counterparties to OTC derivatives to terminate derivative contracts prior to maturity in the event the Fund’s net assets decline by a stated percentage or the Fund fails to meet the terms of its ISDA Master Agreements, which would cause the Fund to accelerate payment of any net liability owed to the counterparty.
Financial Futures Contracts: The Fund purchases or sells financial futures contracts and options on financial futures contracts to gain exposure to, or economically hedge against, changes in interest rates (interest rate risk), changes in the value of equity securities (equity risk) or foreign currencies (foreign currency exchange rate risk). Financial futures contracts are agreements between the Fund and the counterparty to buy or sell a specific quantity of an underlying instrument at a specified price and at a specified date. Depending on the terms of the particular contract, financial futures contracts are settled either through physical delivery of the underlying instrument on the settlement date or by payment of a cash settlement amount on the settlement date. Pursuant to the contract, the Fund agrees to receive from or pay to the broker an amount of cash equal to the daily fluctuation in value of the contract. Such receipts or payments are known as variation margin and are recorded by the Fund as unrealized appreciation or depreciation. When the contract is closed, the Fund records a realized gain or loss equal to the difference between the value of the contract at the time it was opened and the value at the time it was closed. The use of financial futures contracts involves the risk of an imperfect correlation in the movements in the price of financial futures contracts, interest or foreign currency exchange rates and the underlying assets.
Foreign Currency Exchange Contracts: The Fund enters into foreign currency exchange contracts as an economic hedge against either specific transactions or portfolio instruments or to obtain exposure to foreign currencies (foreign currency exchange rate risk). A foreign currency exchange contract is an agreement between two parties to buy and sell a currency at a set exchange rate on a future date. Foreign currency exchange contracts, when used by the Fund, help to manage the overall exposure to the currencies in which some of the investments held by the Fund are denominated. The contract is marked-to-market daily and the change in market value is recorded by the Fund as an
| | | | |
| | | | | |
| 30 | | BLACKROCK VARIABLE SERIES FUNDS, INC. | | JUNE 30, 2012 |
unrealized gain or loss. When the contract is closed, the Fund records a realized gain or loss equal to the difference between the value at the time it was opened and the value at the time it was closed. The use of foreign currency exchange contracts involves the risk that the value of a foreign currency exchange contract changes unfavorably due to movements in the value of the referenced foreign currencies and the risk that the counterparty to the contract does not perform its obligations under the agreement.
Options: The Fund purchases and writes call and put options to increase or decrease its exposure to underlying instruments (including equity risk, interest rate risk and/or commodity price risk) and/or, in the case of options written, to generate gains from options premiums. A call option gives the purchaser (holder) of the option the right (but not the obligation) to buy, and obligates the seller (writer) to sell (when the option is exercised), the underlying instrument at the exercise or strike price at any time or at a specified time during the option period. A put option gives the holder the right to sell and obligates the writer to buy the underlying instrument at the exercise or strike price at any time or at a specified time during the option period. When the Fund purchases (writes) an option, an amount equal to the premium paid (received) by the Fund is reflected as an asset (liability). The amount of the asset (liability) is subsequently marked-to-market to reflect the current market value of the option purchased (written). When an instrument is purchased or sold through an exercise of an option, the related premium paid (or received) is added to (or deducted from) the basis of the instrument acquired or deducted from (or added to) the proceeds of the instrument sold. When an option expires (or the Fund enters into a closing transaction), the Fund realizes a gain or loss on the option to the extent of the premiums received or paid (or gain or loss to the extent the cost of the closing transaction exceeds the premiums received or paid). When the Fund writes a call option, such option is “covered,” meaning that the Fund holds the underlying instrument subject to being called by the option counterparty. When the Fund writes a put option, such option is covered by cash in an amount sufficient to cover the obligation.
Options on swaps (swaptions) are similar to options on securities except that instead of selling or purchasing the right to buy or sell a security, the writer or purchaser of the swap option is granting or buying the right to enter into a previously agreed upon interest rate or credit default swap agreement (interest rate risk and/or credit risk) at any time before the expiration of the option.
The Fund also purchases or sells listed or OTC foreign currency options, foreign currency futures and
related options on foreign currency futures as a short or long hedge against possible variations in foreign exchange rates or to gain exposure to foreign currencies (foreign currency exchange rate risk). When foreign currency is purchased or sold through an exercise of a foreign currency option, the related premium paid (or received) is added to (or deducted from) the basis of the foreign currency acquired or deducted from (or added to) the proceeds of the foreign currency sold. Such transactions may be effected with respect to hedges on non-US dollar denominated instruments owned by the Fund but not yet delivered, or committed or anticipated to be purchased by the Fund.
In purchasing and writing options, the Fund bears the risk of an unfavorable change in the value of the underlying instrument or the risk that the Fund may not be able to enter into a closing transaction due to an illiquid market. Exercise of a written option could result in the Fund purchasing or selling a security at a price different from the current market value.
Swaps: The Fund enters into swap agreements, in which the Fund and a counterparty agree to either make periodic net payments on a specified notional amount or net payment upon termination. Swap agreements are privately negotiated in the OTC market and may be executed on a registered financial and commodities exchange (“centrally cleared swaps”). In a centrally cleared swap, the Fund typically enters into an agreement with a counterparty; however, performance is guaranteed by the central clearinghouse reducing or eliminating the Fund’s exposure to the credit risk of the counterparty. These payments received or made by the Fund are recorded in the Statement of Operations as realized gains or losses, respectively. Any upfront fees paid are recorded as assets and any upfront fees received are recorded as liabilities and amortized over the term of the swap. Swaps are marked-to-market daily and changes in value are recorded as unrealized appreciation (depreciation). The daily change in valuation of centrally cleared swaps, if any, is recorded as a receivable or payable for variation margin in the Statement of Assets and Liabilities. When the swap is terminated, the Fund will record a realized gain or loss equal to the difference between the proceeds from (or cost of) the closing transaction and the Fund’s basis in the contract, if any. Generally, the basis of the contracts is the premium received or paid. Swap transactions involve, to varying degrees, elements of interest rate, credit and market risk in excess of the amounts recognized in the Statement of Assets and Liabilities. Such risks involve the possibility that there will be no liquid market for these agreements, that the counterparty to the agreements may default on its obligation to perform or disagree as to the meaning of the contractual terms in the agreements, and that there may be unfavorable changes in
| | | | |
| | | | | |
| JUNE 30, 2012 | | BLACKROCK VARIABLE SERIES FUNDS, INC. | | 31 |
interest rates and/or market values associated with these transactions.
| — | | Credit default swaps—The Fund enters into credit default swaps to manage its exposure to the market or certain sectors of the market, to reduce its risk exposure to defaults of corporate and/or sovereign issuers or to create exposure to corporate and/or sovereign issuers to which it is not otherwise exposed (credit risk). The Fund enters into credit default swap agreements to provide a measure of protection against the default of an issuer (as buyer of protection) and/or gain credit exposure to an issuer to which it is not otherwise exposed (as seller of protection). The Fund may either buy or sell (write) credit default swaps on single-name issuers (corporate or sovereign), a combination or basket of single-name issuers or traded indexes. Credit default swaps on single-name issuers are agreements in which the buyer pays fixed periodic payments to the seller in consideration for a guarantee from the seller to make a specific payment should a negative credit event take place with respect to the referenced entity (e.g., bankruptcy, failure to pay, obligation accelerators, repudiation, moratorium or restructuring). Credit default swaps on traded indexes are agreements in which the buyer pays fixed periodic payments to the seller in consideration for a guarantee from the seller to make a specific payment should a write-down, principal or interest shortfall or default of all or individual underlying securities included in the index occurs. As a buyer, if an underlying credit event occurs, the Fund will either receive from the seller an amount equal to the notional amount of the swap and deliver the referenced security or underlying securities comprising the index or receive a net settlement of cash equal to the notional amount of the swap less the recovery value of the security or underlying securities comprising the index. As a seller (writer), if an underlying credit event occurs, the Fund will either pay the buyer an amount equal to the notional amount of the swap and take delivery of the referenced security or underlying securities comprising the index or pay a net settlement of cash equal to the notional amount of the swap less the recovery value of the security or underlying securities comprising the index. |
| — | | Total return swaps—The Fund enters into total return swaps to obtain exposure to a security or market without owning such security or investing directly in that market or to transfer the risk/return of one market (e.g., fixed income) to another market (e.g., equity) (equity risk and/or interest rate risk). Total return swaps are agreements in which there is an exchange of cash flows whereby one party commits to make payments based on the total return (coupons plus capital gains/losses) of an underlying instrument in exchange for fixed or floating rate interest |
| | | payments. To the extent the total return of the instrument or index underlying the transaction exceeds or falls short of the offsetting interest rate obligation, the Fund will receive a payment from or make a payment to the counterparty. |
| — | | Interest rate swaps—The Fund enters into interest rate swaps to gain or reduce exposure to interest rates or to manage duration, the yield curve or interest rate risk by economically hedging the value of the fixed rate bonds which may decrease when interest rates rise (interest rate risk). Interest rate swaps are agreements in which one party pays a stream of interest payments, either fixed or floating rate, for another party’s stream of interest payments, either fixed or floating, on the same notional amount for a specified period of time. Interest rate floors, which are a type of interest rate swap, are agreements in which one party agrees to make payments to the other party to the extent that interest rates fall below a specified rate or floor in return for a premium. In more complex swaps, the notional principal amount may decline (or amortize) over time. |
Derivative Financial Instruments Categorized by Risk Exposure:
| | | | | | |
| Fair Values of Derivative Financial Instruments as of June 30, 2012 | |
| | | Asset Derivatives | |
| | | Statement of Assets and Liabilities Location | | Value | |
Interest rate contracts | | Net unrealized appreciation/depreciation1; Unrealized appreciation on swaps1; Investments at value-unaffiliated2 | | $ | 21,639 | |
| | |
Foreign currency exchange contracts | | Unrealized appreciation on foreign currency exchange contracts; Investments at value-unaffiliated2 | | | 8,458 | |
| | |
Credit contracts | | Unrealized appreciation on swaps | | | 13,708 | |
Total | | | | $ | 43,805 | |
| | | | | | |
| 1 | Includes cumulative appreciation/depreciation on financial futures contracts and centrally cleared swaps as reported in the Schedule of Investments. Only current day’s variation margin is reported within the Statement of Assets and Liabilities. |
| 2 | Includes options purchased at value as reported in the Schedule of Investments. |
| | | | |
| | | | | |
| 32 | | BLACKROCK VARIABLE SERIES FUNDS, INC. | | JUNE 30, 2012 |
| | | | | | |
| | | Liability Derivatives | |
| | | Statement of Assets and Liabilities Location | | Value | |
Interest rate contracts | | Net unrealized depreciation1; Unrealized depreciation on swaps1; Options written at value | | $ | (65,764 | ) |
| | |
Foreign currency exchange contracts | | Unrealized depreciation on foreign currency exchange contracts; Options written at value | | | (5,581 | ) |
| | |
Credit contracts | | Unrealized depreciation on swaps1 | | | (1,797 | ) |
Total | | | | $ | (73,142 | ) |
| | | | | | |
| 1 | Includes cumulative appreciation/depreciation on financial futures contracts and centrally cleared swaps as reported in the Schedule of Investments. Only current day’s variation margin is reported within the Statement of Assets and Liabilities. |
| | | | |
The Effect of Derivative Financial Instruments in the
Statement of Operations
Six Months Ended June 30, 2012 | |
Net Realized Gain (Loss) From | |
Interest rate contracts: | | | | |
Financial futures contracts | | $ | (33,307 | ) |
Swaps | | | (12,801 | ) |
Options2 | | | (39,330 | ) |
Foreign currency exchange contracts: | | | | |
Foreign currency transactions | | | 16,198 | |
Options2 | | | 1,890 | |
Credit contracts: | | | | |
Swaps | | | 337 | |
| | | | |
Total | | $ | (67,013 | ) |
| | | | |
| | | | |
Net Change in Unrealized Appreciation/Depreciation on | |
Interest rate contracts: | | | | |
Financial futures contracts | | $ | 5,601 | |
Swaps | | | (15,054 | ) |
Options2 | | | 15,384 | |
Foreign currency exchange contracts: | | | | |
Foreign currency transactions | | | (12,766 | ) |
Options2 | | | (2,049 | ) |
Credit contracts: | | | | |
Swaps | | | (14,313 | ) |
Options2 | | | (2,143 | ) |
| | | | |
Total | | $ | (25,340 | ) |
| | | | |
| 2 | Options purchased are included in the net realized gain (loss) from investments and net change in unrealized appreciation/depreciation on investments. |
For the six months ended June 30, 2012, the average quarterly balances of outstanding derivative financial instruments were as follows:
| | | | |
Financial futures contracts: | | | | |
Average number of contracts purchased | | | 19 | |
Average number of contracts sold | | | 21 | |
Average notional value of contracts purchased | | $ | 3,561,110 | |
Average notional value of contracts sold | | $ | 4,895,459 | |
Foreign currency exchange contracts: | | | | |
Average number of contracts — US dollars purchased | | | 12 | |
Average number of contracts — US dollars sold | | | 4 | |
Average US dollar amounts purchased | | $ | 678,758 | |
Average US dollar amounts sold | | $ | 219,147 | |
| | | | |
Options: | | | | |
Average number of option contracts purchased | | | 657,509 | |
Average number of option contracts written | | | 758,506 | |
Average notional value of option contracts purchased | | $ | 676,250 | |
Average notional value of option contracts written | | $ | 769,750 | |
Average number of swaption contracts purchased | | | 5 | |
Average number of swaption contracts written | | | 6 | |
Average notional value of swaption contracts purchased | | $ | 550,000 | |
Average notional value of swaption contracts written | | $ | 1,100,000 | |
Credit default swaps: | | | | |
Average number of contracts — buy protection | | | 7 | |
Average number of contracts — sell protection | | | 13 | |
Average notional value — buy protection | | $ | 259,739 | |
Average notional value — sell protection | | $ | 236,600 | |
Interest rate swaps: | | | | |
Average number of contracts — pays fixed rate | | | 8 | |
Average number of contracts — receives fixed rate | | | 7 | |
Average notional value — pays fixed rate | | $ | 2,168,155 | |
Average notional value — receives fixed rate | | $ | 1,040,000 | |
Total return swaps: | | | | |
Average number of contracts | | | 1 | |
Average notional value | | $ | 70,728 | |
3. Investment Advisory Agreement and Other Transactions with Affiliates:
The PNC Financial Services Group, Inc. (“PNC”) is the largest stockholder and an affiliate, for 1940 Act purposes, of BlackRock, Inc. (“BlackRock”).
The Company, on behalf of the Fund, entered into an Investment Advisory Agreement with BlackRock Advisors, LLC (the “Manager”), the Fund’s investment advisor, an indirect, wholly owned subsidiary of BlackRock, to provide investment advisory and administration services. The Manager is responsible for the management of the Fund’s portfolio and provides the necessary personnel, facilities, equipment and certain other services necessary to the operations of the Fund. For such services, the Fund pays the Manager a monthly fee based on a percentage of the Fund’s average daily net assets at the following annual rates:
| | | | |
| Average Daily Net Assets | | Investment
Advisory
Fee | |
First $1 billion | | | 0.55 | % |
$1 billion — $3 billion | | | 0.52 | % |
$3 billion — $5 billion | | | 0.50 | % |
$5 billion — $10 billion | | | 0.48 | % |
Greater Than $10 billion | | | 0.47 | % |
The Manager entered into a sub-advisory agreement with BlackRock Investment Management, LLC (“BIM”) and BlackRock Financial Management, Inc. (“BFM”), both affiliates of the Manager. The Manager pays each sub-advisor, for services they provide, a monthly fee that is a percentage of the investment advisory fees paid by the Fund to the Manager.
The Manager voluntarily agreed to waive and/or reimburse fees or expenses, excluding interest expense, dividend expense, acquired fund fees and expenses and certain other fund expenses, in order to limit expenses as a percentage of net assets as follows: 1.25% for Class I Shares and 1.50% for
| | | | |
| | | | | |
| JUNE 30, 2012 | | BLACKROCK VARIABLE SERIES FUNDS, INC. | | 33 |
Class III Shares. This voluntary waiver and/or reimbursement may be reduced or discontinued at any time without notice.
The Manager voluntarily agreed to waive its investment advisory fees by the amount of investment advisory fees the Fund pays to the Manager indirectly through its investment in affiliated money market funds. However, the Manager does not waive its investment advisory fees by the amount of investment advisory fees paid in connection with the Fund’s investment in other affiliated investment companies, if any. This amount is shown as fees waived by advisor in the Statement of Operations.
For the six months ended June 30, 2012, the Fund reimbursed the Manager $171 for certain accounting services, which is included in accounting services in the Statement of Operations.
The Company, on behalf of the Fund, entered into a Distribution Agreement with BlackRock Investments, LLC (“BRIL”), an affiliate of the Manager. Pursuant to the Distribution Plan and in accordance with Rule 12b-1 under the 1940 Act, the Fund pays BRIL ongoing distribution fees. The fees are accrued daily and paid monthly at an annual rate of 0.25% of the average daily net assets of Class III Shares.
The Manager, on behalf of the Fund, entered into agreements with insurance companies and other financial intermediaries (“Service Organizations”), some of which may be affiliates. Pursuant to these agreements, the Service Organizations provide the Fund with administrative, networking, recordkeeping, sub-transfer agency and shareholder services to sub-accounts they service. For these services, the Service Organizations receive an annual fee per shareholder account, which will vary depending on share class and/or net assets of Fund shareholders serviced by the Service Organization. For the six months ended June 30, 2012, the Fund did not pay any amounts to affiliates in return for these services. However, the Manager has voluntarily agreed to reimburse such fees in order to limit such expenses to 0.00% of average daily net assets.
This voluntary reimbursement may be reduced or discontinued at any time. These amounts are shown as transfer agent fees reimbursed in the Statement of Operations.
Certain officers and/or directors of the Company are officers and/or directors of BlackRock or its affiliates. The Fund reimburses the Manager for a portion of the compensation paid to the Company’s Chief Compliance Officer.
4. Investments:
Purchases and sales of investments including paydowns, mortgage dollar roll and TBA transactions and excluding short-term securities and US government
securities for the six months ended June 30, 2012, were $61,966,755 and $63,209,497, respectively.
Purchases and sales of US government securities for the Fund for the six months ended June 30, 2012 were $19,979,490 and $19,850,709, respectively.
For the six months ended June 30, 2012, purchases and sales of mortgage dollar rolls were $15,560,069 and $15,570,263, respectively.
Transactions in options written for the six months ended June 30, 2012, were as follows:
| | | | | | | | | | | | |
| | | Calls | |
| | | Option Contracts | | | Notional (000) | | | Premiums Received | |
Outstanding options, beginning of period | | | — | | | $ | 820 | | | $ | 20,350 | |
Options written | | | 7 | | | | 947 | | | | 10,683 | |
Options exercised | | | — | | | | (300 | ) | | | (2,602 | ) |
Options expired | | | — | | | | (120 | ) | | | (633 | ) |
Options closed | | | — | | | | (600 | ) | | | (22,857 | ) |
| | | | | | | | | | | | |
Outstanding options, end of period | | | 7 | | | $ | 747 | | | $ | 4,941 | |
| | | | | | | | | | | | |
| | | | | | | | | | | | |
| | | Puts | |
| | | Option Contracts | | | Notional (000) | | | Premiums Received | |
Outstanding options, beginning of period | | | — | | | $ | 1,837 | | | $ | 48,516 | |
Options written | | | 32 | | | | 4,060 | | | | 32,920 | |
Options exercised | | | — | | | | (768 | ) | | | (20,104 | ) |
Options expired | | | (8 | ) | | | (2,944 | ) | | | (23,587 | ) |
Options closed | | | (19 | ) | | | (1,685 | ) | | | (29,621 | ) |
| | | | | | | | | | | | |
Outstanding options, end of period | | | 5 | | | $ | 500 | | | $ | 8,124 | |
| | | | | | | | | | | | |
5. Income Tax Information:
As of December 31, 2011, the Fund had capital loss carryforwards available to offset future realized capital gains through the indicated expiration dates as follows:
| | | | |
| Expires December 31, | | | |
2017 | | $ | 4,269,677 | |
As of June 30, 2012, gross unrealized appreciation and gross unrealized depreciation based on cost for federal income tax purposes were as follows:
| | | | |
Tax cost | | $ | 31,585,426 | |
| | | | |
Gross unrealized appreciation | | $ | 1,975,410 | |
Gross unrealized depreciation | | | (635,542 | ) |
| | | | |
Net unrealized appreciation | | $ | 1,339,868 | |
| | | | |
6. Borrowings:
The Company, on behalf of the Fund, along with certain other funds managed by the Manager and its affiliates, is a party to a $500 million credit agreement with a group of lenders. The Fund may borrow under the credit agreement to fund shareholder redemptions. Effective November 2011 to November 2012, the credit agreement has the following terms: a commitment fee of 0.065% per annum based on
| | | | |
| | | | | |
| 34 | | BLACKROCK VARIABLE SERIES FUNDS, INC. | | JUNE 30, 2012 |
the Fund’s pro rata share of the unused portion of the credit agreement and interest at a rate equal to the higher of (a) the one-month LIBOR plus 0.80% per annum or (b) the Fed Funds rate plus 0.80% per annum on amounts borrowed. In addition, the Fund paid administration and arrangement fees which were allocated to the Fund based on its net assets as of October 31, 2011. The Fund did not borrow under the credit agreement during the six months ended June 30, 2012.
For the six months ended June 30, 2012, the average amount of transactions considered as borrowings and the daily weighted average interest rates from reverse repurchase agreement and treasury roll transactions for the Fund were $1,368,028 and 0.11%, respectively.
7. Concentration, Market and Credit Risk:
In the normal course of business, the Fund invests in securities and enters into transactions where risks exist due to fluctuations in the market (market risk) or failure of the issuer of a security to meet all its obligations (issuer credit risk). The value of securities held by the Fund may decline in response to certain events, including those directly involving the issuers whose securities are owned by the Fund; conditions affecting the general economy; overall market changes; local, regional or global political, social or economic instability; and currency and interest rate and price fluctuations. Similar to issuer credit risk, the Fund may be exposed to counterparty credit risk, or the risk that an entity with which the Fund has unsettled or open transactions may fail to or be unable to perform on its commitments. The Fund manages counterparty credit risk by entering into transactions only with counterparties that it believes have the financial resources to honor their obligations and by monitoring the financial stability of those counterparties. Financial assets, which potentially expose the Fund to market, issuer and counterparty credit risks, consist principally of
financial instruments and receivables due from counterparties. The extent of the Fund’s exposure to market, issuer and counterparty credit risks with respect to these financial assets is generally approximated by their value recorded in the Fund’s Statement of Assets and Liabilities, less any collateral held by the Fund.
The Fund invests a significant portion of its assets in securities backed by commercial or residential mortgage loans or in issuers that hold mortgage and other asset-backed securities. Please see the Schedule of Investments for these securities. Changes in economic conditions, including delinquencies and/or defaults on assets underlying these securities, can affect the value, income and/or liquidity of such positions.
8. Capital Share Transactions:
Transactions in Class I shares were as follows:
| | | | | | | | | | | | | | | | |
| | | Six Months Ended
June 30, 2012 | | | Year Ended
December 31, 2011 | |
Class I Shares | | Shares | | | Amount | | | Shares | | | Amount | |
Shares sold | | | 3,471 | | | $ | 44,635 | | | | 1,891 | | | $ | 24,407 | |
Shares issued to shareholders in reinvestment of dividends | | | — | | | | — | | | | 48,252 | | | | 597,964 | |
Shares redeemed | | | (144,004 | ) | | | (1,855,863 | ) | | | (315,914 | ) | | | (3,967,115 | ) |
| | | | | | | | | | | | | | | | |
Net decrease | | | (140,533 | ) | | $ | (1,811,228 | ) | | | (265,771 | ) | | $ | (3,344,744 | ) |
| | | | | | | | | | | | | | | | |
| | | | | | | | | | | | | | | | | |
9. Subsequent Events:
Management’s evaluation of the impact of all subsequent events on the Fund’s financial statements was completed through the date the financial statements were issued and other than disclosed in the Class III financial highlights, the following item was noted:
The Fund paid a net investment income dividend in the amount of $0.0207 per share on 7/20/12 to shareholders of record on 7/18/12.
| | | | |
| | | | | |
| JUNE 30, 2012 | | BLACKROCK VARIABLE SERIES FUNDS, INC. | | 35 |
BlackRock Variable Series Funds, Inc.
Disclosure of Investment Advisory Agreements and Sub-Advisory Agreements
Disclosure of Investment Advisory Agreements and Sub-Advisory Agreements
The Board of Directors (the “Board,” and the members of which are referred to as “Board Members”) of BlackRock Balanced Capital V.I. Fund (the “Balanced Capital V.I. Fund”), BlackRock Basic Value V.I. Fund (the “Basic Value V.I. Fund”), BlackRock Capital Appreciation V.I. Fund (the “Capital Appreciation V.I. Fund”), BlackRock Equity Dividend V.I. Fund (the “Equity Dividend V.I. Fund”), BlackRock Global Allocation V.I. Fund (the “Global Allocation V.I. Fund”), BlackRock Global Opportunities V.I. Fund (the “Global Opportunities V.I. Fund”), BlackRock High Yield V.I. Fund (the “High Yield V.I. Fund”), BlackRock International V.I. Fund (the “International V.I. Fund”), BlackRock Large Cap Core V.I. Fund (the “Large Cap Core V.I. Fund”), BlackRock Large Cap Growth V.I. Fund (the “Large Cap Growth V.I. Fund”), BlackRock Large Cap Value V.I. Fund (the “Large Cap Value V.I. Fund”), BlackRock Money Market V.I. Fund (the “Money Market V.I. Fund”), BlackRock S&P 500 Index V.I. Fund (the “S&P 500 Index V.I. Fund”), BlackRock Total Return V.I. Fund (the “Total Return V.I. Fund”), BlackRock U.S. Government Bond V.I. Fund (the “U.S. Government Bond V.I. Fund”) and BlackRock Value Opportunities V.I. Fund (the “Value Opportunities V.I. Fund”) (each, a “Fund,” and collectively, the “Funds”), each a series of BlackRock Variable Series Funds, Inc. (the “Corporation”), met on April 10, 2012 and May 8-9, 2012 to consider the approval of the Corporation’s investment advisory agreements (collectively, the “Advisory Agreements”), on behalf of each Fund, with BlackRock Advisors, LLC (the “Manager”), each Fund’s investment advisor. The Board also considered the approval of the sub-advisory agreements (collectively, the “Sub-Advisory Agreements”) between the Manager and each of (a) BlackRock Investment Management, LLC; (b) BlackRock Financial Management, Inc.; and (c) BlackRock International Limited (collectively, the “Sub-Advisors”) with respect to the Funds, as applicable. The Manager and the Sub-Advisors are referred to herein as “BlackRock.” The Advisory Agreements and the Sub-Advisory Agreements are referred to herein as the “Agreements.”
Activities and Composition of the Board
The Board consists of thirteen individuals, ten of whom are not “interested persons” of the Corporation as defined in the Investment Company Act of 1940, as amended (the “1940 Act”) (the “Independent Board Members”). The Board Members are responsible for the oversight of the operations of the Funds and perform the various duties imposed on the directors of investment companies
by the 1940 Act. The Independent Board Members have retained independent legal counsel to assist them in connection with their duties. The Chairman of the Board is an Independent Board Member. The Board has established five standing committees: an Audit Committee, a Governance and Nominating Committee, a Compliance Committee, a Performance Oversight Committee and an Executive Committee, each of which is chaired by an Independent Board Member and composed of Independent Board Members (except for the Performance Oversight Committee and the Executive Committee, each of which also has one interested Board Member).
The Agreements
Pursuant to the 1940 Act, the Board is required to consider the continuation of the Agreements on an annual basis. The Board has four quarterly meetings per year, each extending over two days, and a fifth meeting to consider specific information surrounding the consideration of renewing the Agreements. In connection with this process, the Board assessed, among other things, the nature, scope and quality of the services provided to each Fund by BlackRock, its personnel and its affiliates, including investment management, administrative and shareholder services, oversight of fund accounting and custody, marketing services, risk oversight, compliance and assistance in meeting applicable legal and regulatory requirements.
The Board, acting directly and through its committees, considers at each of its meetings, and from time to time as appropriate, factors that are relevant to its annual consideration of the renewal of the Agreements, including the services and support provided by BlackRock to each Fund and its shareholders. Among the matters the Board considered were: (a) investment performance for one-, three- and five-year periods, as applicable, against peer funds, and applicable benchmarks, if any, as well as senior management’s and portfolio managers’ analysis of the reasons for any over performance or underperformance against its peers and/or benchmark, as applicable; (b) fees, including advisory, administration, if applicable, and other amounts paid to BlackRock and its affiliates by each Fund for services, such as marketing and distribution, call center and fund accounting; (c) Fund operating expenses and how BlackRock allocates expenses to each Fund; (d) the resources devoted to, risk oversight of, and compliance reports relating to, implementation of each Fund’s investment objective, policies and restrictions; (e) each Fund’s compliance with its Code of Ethics and other compliance policies and procedures; (f) the nature, cost and character of non-investment management
services provided by BlackRock and its affiliates; (g) BlackRock’s and other service providers’ internal controls and risk and compliance oversight mechanisms; (h) BlackRock’s implementation of the proxy voting policies approved by the Board; (i) the use of brokerage commissions and execution quality of portfolio transactions; (j) BlackRock’s implementation of each Fund’s valuation and liquidity procedures; (k) an analysis of management fees for products with similar investment objectives across the open-end fund, exchange traded fund (“ETF”), closed-end fund and institutional account product channels, as applicable; (l) BlackRock’s compensation methodology for its investment professionals and the incentives it creates; and (m) periodic updates on BlackRock’s business.
The Board has engaged in an ongoing strategic review with BlackRock of opportunities to consolidate funds and of BlackRock’s commitment to investment performance. In addition, the Board requested, to the extent reasonably possible, an analysis of the risk and return relative to selected funds in peer groups. BlackRock provides information to the Board in response to specific questions. These questions covered issues such as profitability, investment performance and management fee levels. The Board considered the importance of: (i) managing fixed income assets with a view toward preservation of capital; (ii) portfolio managers’ investments in the funds they manage; (iii) BlackRock’s controls surrounding the coding of quantitative investment models; and (iv) BlackRock’s oversight of relationships with third party service providers.
Board Considerations in Approving the
Agreements
The Approval Process: Prior to the April 10, 2012 meeting, the Board requested and received materials specifically relating to the Agreements. The Board is engaged in a process with its independent legal counsel and BlackRock to review periodically the nature and scope of the information provided to better assist its deliberations. The materials provided in connection with the April meeting included (a) information independently compiled and prepared by Lipper, Inc. (“Lipper”) on Fund fees and expenses and the investment performance of each Fund as compared with a peer group of funds as determined by Lipper (collectively, “Peers”), and, for the S&P 500 Index V.I. Fund, the gross investment performance of the Fund as compared with its benchmark; (b) information on the profitability of the Agreements to BlackRock and a discussion of fall-out benefits to BlackRock and its affiliates; (c) a general analysis provided by BlackRock concerning investment management fees (a combination of the advisory fee and the administration fee, if any) charged to other clients, such as institutional clients, ETFs and closed-end funds, under similar
investment mandates, as well as the performance of such other clients, as applicable; (d) the existence, impact and sharing of potential economies of scale; (e) a summary of aggregate amounts paid by each Fund to BlackRock; (f) sales and redemption data regarding each Fund’s shares; and (g) if applicable, a comparison of management fees to similar BlackRock open-end funds, as classified by Lipper.
At an in-person meeting held on April 10, 2012, the Board reviewed materials relating to its consideration of the Agreements. As a result of the discussions that occurred during the April 10, 2012 meeting, and as a culmination of the Board’s year-long deliberative process, the Board presented BlackRock with questions and requests for additional information. BlackRock responded to these requests with additional written information in advance of the May 8-9, 2012 Board meeting.
At an in-person meeting held on May 8-9, 2012, the Board, including all the Independent Board Members, approved the continuation of the Advisory Agreements between the Manager and the Corporation, on behalf of each Fund, and the Sub-Advisory Agreements between the Manager and the Sub-Advisors with respect to each Fund, as applicable, each for a one-year term ending June 30, 2013. In approving the continuation of the Agreements, the Board considered: (a) the nature, extent and quality of the services provided by BlackRock; (b) the investment performance of each Fund and BlackRock; (c) the advisory fee and the cost of the services and profits to be realized by BlackRock and its affiliates from their relationship with each Fund; (d) economies of scale; (e) fall-out benefits to BlackRock as a result of its relationship with each Fund; and (f) other factors deemed relevant by the Board Members.
The Board also considered other matters it deemed important to the approval process, such as payments made to BlackRock or its affiliates relating to the distribution of Fund shares and securities lending, services related to the valuation and pricing of Fund portfolio holdings, direct and indirect benefits to BlackRock and its affiliates from their relationship with each Fund and advice from independent legal counsel with respect to the review process and materials submitted for the Board’s review. The Board noted the willingness of BlackRock personnel to engage in open, candid discussions with the Board. The Board did not identify any particular information as controlling, and each Board Member may have attributed different weights to the various items considered.
A. Nature, Extent and Quality of the Services Provided by BlackRock
The Board, including the Independent Board Members, reviewed the nature, extent and quality of services provided by BlackRock, including the
investment advisory services and the resulting performance of each Fund. Throughout the year, the Board compared Fund performance to the performance of a comparable group of mutual funds and/or the performance of a relevant benchmark, if any. The Board met with BlackRock’s senior management personnel responsible for investment operations, including the senior investment officers. The Board also reviewed the materials provided by each Fund’s portfolio management team discussing Fund performance and each Fund’s investment objective, strategies and outlook.
The Board considered, among other factors, the number, education and experience of BlackRock’s investment personnel generally and each Fund’s portfolio management team, investments by portfolio managers in the funds they manage, BlackRock’s portfolio trading capabilities, BlackRock’s use of technology, BlackRock’s commitment to compliance, BlackRock’s credit analysis capabilities, BlackRock’s risk analysis and oversight capabilities and BlackRock’s approach to training and retaining portfolio managers and other research, advisory and management personnel. The Board engaged in a review of BlackRock’s compensation structure with respect to each Fund’s portfolio management team and BlackRock’s ability to attract and retain high-quality talent and create performance incentives.
In addition to advisory services, the Board considered the quality of the administrative and non-investment advisory services provided to each Fund. BlackRock and its affiliates provide each Fund with certain administrative, shareholder and other services (in addition to any such services provided to each Fund by third parties) and officers and other personnel as are necessary for the operations of each Fund. In particular, BlackRock and its affiliates provide each Fund with the following administrative services, including, among others: (i) preparing disclosure documents, such as the prospectus, the statement of additional information and periodic shareholder reports; (ii) assisting with daily accounting and pricing; (iii) overseeing and coordinating the activities of other service providers; (iv) organizing Board meetings and preparing the materials for such Board meetings; (v) providing legal and compliance support; and (vi) performing other administrative functions necessary for the operation of each Fund, such as tax reporting, fulfilling regulatory filing requirements and call center services. The Board reviewed the structure and duties of BlackRock’s fund administration, accounting, legal and compliance departments and considered BlackRock’s policies and procedures for assuring compliance with applicable laws and regulations.
B. The Investment Performance of each Fund and BlackRock
The Board, including the Independent Board Members, also reviewed and considered the performance history of each Fund. In preparation for the April 10, 2012 meeting, the Board worked with its independent legal counsel, BlackRock and Lipper to develop a template for, and was provided with, reports independently prepared by Lipper, which included a comprehensive analysis of each Fund’s performance. The Board also reviewed a narrative and statistical analysis of the Lipper data that was prepared by BlackRock, which analyzed various factors that affect Lipper’s rankings. In connection with its review, the Board received and reviewed information regarding the investment performance of each Fund as compared to funds in the Fund’s applicable Lipper category, and, for the S&P 500 Index V.I. Fund, the gross investment performance of the Fund compared with its benchmark. The Board was provided with a description of the methodology used by Lipper to select peer funds and periodically meets with Lipper representatives to review their methodology. The Board and the Board’s Performance Oversight Committee regularly review, and meet with Fund management to discuss, the performance of each Fund throughout the year.
The Board noted that the Balanced Capital V.I. Fund ranked in the first, fourth and third quartiles against its Lipper Performance Universe for the one-, three- and five-year periods reported, respectively. The Board and BlackRock reviewed and discussed the reasons for the Balanced Capital V.I. Fund’s underperformance during the three- and five-year periods compared with its Peers. The Board was informed that, among other things, the Balanced Capital V.I. Fund’s performance was affected by the underperformance of the Balanced Capital V.I. Fund’s equity segment during these periods. The bulk of the underperformance for the Balanced Capital V.I. Fund’s equity segment was concentrated over the 18-month period ended August 31, 2010. During this time, cheap stocks with improving fundamentals noticeably underperformed more expensive stocks with deteriorating fundamentals, especially during the middle two quarters of 2009.
The Board and BlackRock discussed BlackRock’s strategy for improving the Balanced Capital V.I. Fund’s performance and BlackRock’s commitment to providing the resources necessary to assist the Balanced Capital V.I. Fund’s portfolio managers and to improve the Balanced Capital V.I. Fund’s performance.
The Board noted that the Basic Value V.I. Fund ranked in the third, first and second quartiles against its Lipper Performance Universe for the one-, three- and five-year periods reported, respectively. The Board and BlackRock reviewed
and discussed the reasons for the Basic Value V.I. Fund’s underperformance during the one-year period and will monitor closely the Basic Value V.I. Fund’s performance in the coming year.
The Board noted that the Capital Appreciation V.I. Fund ranked in the fourth, fourth and second quartiles against its Lipper Performance Universe for the one-, three- and five-year periods reported, respectively. The Board and BlackRock reviewed and discussed the reasons for the Capital Appreciation V.I. Fund’s underperformance during the one- and three-year periods compared with its Peers. The Board was informed that, among other things, the portfolio’s aggressive positioning generated relative underperformance as investors sold more volatile high growth holdings in favor of more defensive dividend yielding companies. The increased importance of macroeconomic developments overshadowed company results during 2011, making it a challenging backdrop for the bottom-up stock pickers.
The Board and BlackRock discussed BlackRock’s strategy for improving the Capital Appreciation V.I. Fund’s performance and BlackRock’s commitment to providing the resources necessary to assist the Capital Appreciation V.I. Fund’s portfolio managers and to improve the Capital Appreciation V.I. Fund’s performance.
The Board noted that the Equity Dividend V.I. Fund ranked in the first, fourth and first quartiles against its Lipper Performance Universe for the one-, three- and five-year periods reported, respectively.
The Board noted that the Global Allocation V.I. Fund ranked in the second, fourth and first quartiles against its Lipper Performance Universe for the one-, three- and five-year periods reported, respectively.
The Board noted that the Global Opportunities V.I. Fund ranked in the fourth, fourth and first quartiles against its Lipper Performance Universe for the one-, three- and five-year periods reported, respectively. The Board and BlackRock reviewed and discussed the reasons for the Global Opportunities V.I. Fund’s underperformance during the one- and three-year periods compared with its Peers. The Board was informed that, among other things, underperformance in the one-year period can be attributed to being long coal and short integrated oils in the first quarter, greater economic sensitivity within industrials and materials than realized, and greater exposure to BRIC (Brazil, Russia, India and China) end-markets relative to the benchmark in the third quarter. During the one-year period ended June 2010, the Global Opportunities V.I. Fund’s poorly timed adjustments to portfolio risks during the risk-on/risk-off environment was a major detractor to the three-year performance.
The Board and BlackRock discussed BlackRock’s strategy for improving the Global Opportunities V.I.
Fund’s performance and BlackRock’s commitment to providing the resources necessary to assist the Global Opportunities V.I. Fund’s portfolio managers and to improve the Global Opportunities V.I. Fund’s performance.
The Board noted that the High Yield V.I. Fund ranked in the third, first and second quartiles against its Lipper Performance Universe for the one-, three- and five-year periods reported, respectively. The Board and BlackRock reviewed and discussed the reasons for the High Yield V.I. Fund’s underperformance during the one-year period and will monitor closely the High Yield V.I. Fund’s performance in the coming year.
The Board noted that the International V.I. Fund ranked in the second, second and third quartiles against its Lipper Performance Universe for the one-, three- and five-year periods reported, respectively.
The Board noted that the Large Cap Core V.I. Fund ranked in the first, fourth and fourth quartiles against its Lipper Performance Universe for the one-, three- and five-year periods reported, respectively. The Board and BlackRock reviewed and discussed the reasons for the Large Cap Core V.I. Fund’s underperformance during the three- and five-year periods compared with its Peers. BlackRock informed the Board that, among other things, the bulk of the underperformance was concentrated over the 18-month period ended August 31, 2010. During this time, higher quality stocks with improving fundamentals noticeably underperformed lower quality stocks with deteriorating fundamentals, especially during the middle two quarters of 2009.
The Board and BlackRock discussed BlackRock’s strategy for improving the Large Cap Core V.I. Fund’s performance and BlackRock’s commitment to providing the resources necessary to assist the Large Cap Core V.I. Fund’s portfolio managers and to improve the Large Cap Core V.I. Fund’s performance.
The Board noted that the Large Cap Growth V.I. Fund ranked in the first, second and third quartiles against its Lipper Performance Universe for the one-, three- and five-year periods reported, respectively.
The Board noted that the Large Cap Value V.I. Fund ranked in the second, fourth and fourth quartiles against its Lipper Performance Universe for the one-, three- and five-year periods reported, respectively. The Board and BlackRock reviewed and discussed the reasons for the Large Cap Value V.I. Fund’s underperformance during the three- and five-year periods compared with its Peers. BlackRock informed the Board that, among other things, the bulk of the underperformance was concentrated over the 18-month period ended August 31, 2010. During this time, higher quality stocks with improving fundamentals noticeably underperformed lower
quality stocks with deteriorating fundamentals, especially during the middle two quarters of 2009.
The Board and BlackRock discussed BlackRock’s strategy for improving the Large Cap Value V.I. Fund’s performance and BlackRock’s commitment to providing the resources necessary to assist the Large Cap Value V.I. Fund’s portfolio managers and to improve the Large Cap Value V.I. Fund’s performance.
The Board noted that the Money Market V.I. Fund ranked in the third, second and second quartiles against its Lipper Performance Universe for the one-, three- and five-year periods reported, respectively. The Board and BlackRock reviewed and discussed the reasons for the Money Market V.I. Fund’s underperformance during the one-year period and will monitor closely the Money Market V.I. Fund’s performance in the coming year.
The Board noted that the S&P 500 Index V.I. Fund’s gross performance exceeded its benchmark index during each of the one-, three- and five-year periods reported. Based on its discussions with BlackRock and the Board’s review of the S&P 500 Index V.I. Fund’s investment performance compared to its Lipper Peer Group, the methodology used by Lipper to select peer funds, and other relevant information provided by BlackRock, the Board noted that the S&P 500 Index V.I. Fund’s gross investment performance as compared to its benchmark index provided a more meaningful comparison of the S&P 500 Index V.I. Fund’s relative performance.
The Board noted that the Total Return V.I. Fund ranked in the fourth, first and fourth quartiles against its Lipper Performance Universe for the one-, three- and five-year periods reported, respectively. The Board and BlackRock reviewed and discussed the reasons for the Total Return V.I. Fund’s underperformance during the one- and five-year periods compared with its Peers. The Board was informed that, among other things, the Total Return V.I. Fund maintained a shorter duration bias and underweight Treasuries relative to its peer universe throughout most of the one-year period. While this duration stance was beneficial in the earlier half of the period, the overall impact on performance for the one-year period was negative as interest rates declined to historically low levels in the latter half due to fears of a global economic slowdown and persistent sovereign debt problems in Europe. For the five-year period the Total Return V.I. Fund’s underperformance was primarily due to the significant exposure to non-government debt during the financial crisis in 2008. Most notably the Total Return V.I. Fund’s allocation to non-agency mortgages, commercial mortgage backed securities and asset-backed securities which all dramatically underperformed Treasuries that year.
The Board and BlackRock discussed BlackRock’s strategy for improving the Total Return V.I. Fund’s
performance and BlackRock’s commitment to providing the resources necessary to assist the Total Return V.I. Fund’s portfolio managers and to improve the Total Return V.I. Fund’s performance.
The Board noted that the U.S. Government Bond V.I. Fund ranked in the third, fourth and fourth quartiles against its Lipper Performance Universe for the one-, three- and five-year periods reported, respectively. The Board and BlackRock reviewed and discussed the reasons for the U.S. Government Bond V.I. Fund’s underperformance during these periods compared with its Peers. The Board was informed that, among other things, underperformance during the five-year period was primarily due to the U.S. Government Bond V.I. Fund’s significant exposure to non-government debt during the financial crisis in 2008. Most notably the underperformance was due to a large allocation to non-agency mortgages and commercial mortgage backed securities which both dramatically underperformed. For the one- and three-year periods the U.S. Government Bond V.I. Fund’s underperformance compared to the peer group was primarily driven by its shorter duration positioning. The European sovereign debt crisis and growing concerns over slowing global growth drove U.S. Treasury prices higher benefitting those peers who maintained a greater exposure to Treasuries and longer durations.
The Board and BlackRock discussed BlackRock’s strategy for improving the U.S. Government Bond V.I. Fund’s performance and BlackRock’s commitment to providing the resources necessary to assist the U.S. Government Bond V.I. Fund’s portfolio managers and to improve the U.S. Government Bond V.I. Fund’s performance.
The Board noted that the Value Opportunities V.I. Fund ranked in the second, second and fourth quartiles against its Lipper Performance Universe for the one-, three- and five-year periods reported, respectively.
C. Consideration of the Advisory/Management Fees and the Cost of the Services and Profits to be Realized by BlackRock and its Affiliates from their Relationship with each Fund
The Board, including the Independent Board Members, reviewed each Fund’s contractual management fee rate compared with the other funds in its Lipper category. It also compared each Fund’s total expense ratio, as well as actual management fee rate, to those of other funds in its Lipper category. The Board considered the services provided and the fees charged by BlackRock to other types of clients with similar investment mandates, including separately managed institutional accounts.
The Board received and reviewed statements relating to BlackRock’s financial condition and profitability with respect to the services it provided each
Fund. The Board was also provided with a profitability analysis that detailed the revenues earned and the expenses incurred by BlackRock for services provided to each Fund. The Board reviewed BlackRock’s profitability with respect to each Fund and other funds the Board currently oversees for the year ended December 31, 2011 compared to available aggregate profitability data provided for the years ended December 31, 2010 and December 31, 2009. The Board reviewed BlackRock’s profitability with respect to other fund complexes managed by the Manager and/or its affiliates. The Board reviewed BlackRock’s assumptions and methodology of allocating expenses in the profitability analysis, noting the inherent limitations in allocating costs among various advisory products. The Board recognized that profitability may be affected by numerous factors including, among other things, fee waivers and expense reimbursements by the Manager, the types of funds managed, expense allocations and business mix, and the difficulty of comparing profitability as a result of those factors.
The Board noted that, in general, individual fund or product line profitability of other advisors is not publicly available. The Board considered BlackRock’s operating margin, in general, compared to the operating margin for leading investment management firms whose operations include advising open-end funds, among other product types. In addition, the Board considered, among other things, certain third party data comparing BlackRock’s operating margin with that of other publicly-traded asset management firms. The Board considered the differences between BlackRock and these other firms, including the contribution of technology at BlackRock, BlackRock’s expense management, and the relative product mix.
In addition, the Board considered the cost of the services provided to each Fund by BlackRock, and BlackRock’s and its affiliates’ profits relating to the management and distribution of each Fund and the other funds advised by BlackRock and its affiliates. As part of its analysis, the Board reviewed BlackRock’s methodology in allocating its costs to the management of each Fund. The Board also considered whether BlackRock has the financial resources necessary to attract and retain high quality investment management personnel to perform its obligations under the Agreements and to continue to provide the high quality of services that is expected by the Board.
The Board noted that the Balanced Capital V.I. Fund’s contractual management fee ratio (a combination of the advisory fee and the administration fee, if any) was lower than or equal to the median contractual management fee ratio paid by the Balanced Capital V.I. Fund’s Peers, in each case before taking into account any expense reimbursements or fee waivers. The Board also noted that the
Balanced Capital V.I. Fund has an advisory fee arrangement that includes breakpoints that adjust the fee ratio downward as the size of the Balanced Capital V.I. Fund increases above certain contractually specified levels. The Board further noted that BlackRock has voluntarily agreed to waive fees or reimburse expenses in order to limit, to a specified amount, the Balanced Capital V.I. Fund’s total net expenses on a class-by-class basis, as applicable.
The Board noted that the Basic Value V.I. Fund’s contractual management fee ratio (a combination of the advisory fee and the administration fee, if any) was lower than or equal to the median contractual management fee ratio paid by the Basic Value V.I. Fund’s Peers, in each case before taking into account any expense reimbursements or fee waivers. The Board also noted that the Basic Value V.I. Fund has an advisory fee arrangement that includes breakpoints that adjust the fee ratio downward as the size of the Basic Value V.I. Fund increases above certain contractually specified levels. The Board further noted that BlackRock has voluntarily agreed to waive fees or reimburse expenses in order to limit, to a specified amount, the Basic Value V.I. Fund’s total net expenses on a class-by-class basis, as applicable.
The Board noted that the Capital Appreciation V.I. Fund’s contractual management fee ratio (a combination of the advisory fee and the administration fee, if any) was lower than or equal to the median contractual management fee ratio paid by the Capital Appreciation V.I. Fund’s Peers, in each case before taking into account any expense reimbursements or fee waivers. The Board also noted that the Capital Appreciation V.I. Fund has an advisory fee arrangement that includes breakpoints that adjust the fee ratio downward as the size of the Capital Appreciation V.I. Fund increases above certain contractually specified levels. The Board further noted that BlackRock has voluntarily agreed to waive fees or reimburse expenses in order to limit, to a specified amount, the Capital Appreciation V.I. Fund’s total net expenses on a class-by-class basis, as applicable.
The Board noted that the Equity Dividend V.I. Fund’s contractual management fee ratio (a combination of the advisory fee and the administration fee, if any) was lower than or equal to the median contractual management fee ratio paid by the Equity Dividend V.I. Fund’s Peers, in each case before taking into account any expense reimbursements or fee waivers. The Board also noted that the Equity Dividend V.I. Fund has an advisory fee arrangement that includes breakpoints that adjust the fee ratio downward as the size of the Equity Dividend V.I. Fund increases above certain contractually specified levels. The Board further noted that BlackRock has voluntarily agreed to waive fees or reimburse expenses in order to limit, to a specified amount,
the Equity Dividend V.I. Fund’s total net expenses on a class-by-class basis, as applicable.
The Board noted that the Global Allocation V.I. Fund’s contractual management fee ratio (a combination of the advisory fee and the administration fee, if any) was lower than or equal to the median contractual management fee ratio paid by the Global Allocation V.I. Fund’s Peers, in each case before taking into account any expense reimbursements or fee waivers. The Board also noted that the Global Allocation V.I. Fund has an advisory fee arrangement that includes breakpoints that adjust the fee ratio downward as the size of the Global Allocation V.I. Fund increases above certain contractually specified levels. The Board further noted that BlackRock has voluntarily agreed to waive fees or reimburse expenses in order to limit, to a specified amount, the Global Allocation V.I. Fund’s total net expenses on a class-by-class basis, as applicable.
The Board noted that the Global Opportunities V.I. Fund’s contractual management fee ratio (a combination of the advisory fee and the administration fee, if any) was lower than or equal to the median contractual management fee ratio paid by the Global Opportunities V.I. Fund’s Peers, in each case before taking into account any expense reimbursements or fee waivers. The Board also noted that the Global Opportunities V.I. Fund has an advisory fee arrangement that includes breakpoints that adjust the fee ratio downward as the size of the Global Opportunities V.I. Fund increases above certain contractually specified levels. The Board further noted that BlackRock has voluntarily agreed to waive fees or reimburse expenses in order to limit, to a specified amount, the Global Opportunities V.I. Fund’s total net expenses on a class-by-class basis, as applicable.
The Board noted that the High Yield V.I. Fund’s contractual management fee ratio (a combination of the advisory fee and the administration fee, if any) was lower than or equal to the median contractual management fee ratio paid by the Fund’s Peers, in each case before taking into account any expense reimbursements or fee waivers. The Board also noted that the High Yield V.I. Fund has an advisory fee arrangement that includes breakpoints that adjust the fee ratio downward as the aggregate assets of the High Yield V.I. Fund, combined with the assets of Total Return V.I. Fund, increase above certain contractually specified levels. The Board further noted that BlackRock has voluntarily agreed to waive fees or reimburse expenses in order to limit, to a specified amount, the High Yield V.I. Fund’s total net expenses on a class-by-class basis, as applicable.
The Board noted that the International V.I. Fund’s contractual management fee ratio (a combination of the advisory fee and the administration fee, if any) was lower than or equal to the median contractual
management fee ratio paid by the International V.I. Fund’s Peers, in each case before taking into account any expense reimbursements or fee waivers. The Board also noted that the International V.I. Fund has an advisory fee arrangement that includes breakpoints that adjust the fee ratio downward as the size of the International V.I. Fund increases above certain contractually specified levels. The Board further noted that BlackRock has voluntarily agreed to waive fees or reimburse expenses in order to limit, to a specified amount, the International V.I. Fund’s total net expenses on a class-by-class basis, as applicable.
The Board noted that the Large Cap Core V.I. Fund’s contractual management fee ratio (a combination of the advisory fee and the administration fee, if any) was lower than or equal to the median contractual management fee ratio paid by the Large Cap Core V.I. Fund’s Peers, in each case before taking into account any expense reimbursements or fee waivers. The Board also noted that the Large Cap Core V.I. Fund has an advisory fee arrangement that includes breakpoints that adjust the fee ratio downward as the size of the Large Cap Core V.I. Fund increases above certain contractually specified levels. The Board further noted that BlackRock has voluntarily agreed to waive fees or reimburse expenses in order to limit, to a specified amount, the Large Cap Core V.I. Fund’s total net expenses on a class-by-class basis, as applicable.
The Board noted that the Large Cap Growth V.I. Fund’s contractual management fee ratio (a combination of the advisory fee and the administration fee, if any) was lower than or equal to the median contractual management fee ratio paid by the Large Cap Growth V.I. Fund’s Peers, in each case before taking into account any expense reimbursements or fee waivers. The Board also noted that the Large Cap Growth V.I. Fund has an advisory fee arrangement that includes breakpoints that adjust the fee ratio downward as the size of the Large Cap Growth V.I. Fund increases above certain contractually specified levels. The Board further noted that BlackRock has voluntarily agreed to waive fees or reimburse expenses in order to limit, to a specified amount, the Large Cap Growth V.I. Fund’s total net expenses on a class-by-class basis, as applicable.
The Board noted that the Large Cap Value V.I. Fund’s contractual management fee ratio (a combination of the advisory fee and the administration fee, if any) was above the median contractual management fee ratio paid by the Large Cap Value V.I. Fund’s Peers, in each case before taking into account any expense reimbursements or fee waivers. The Board also noted that the Large Cap Value V.I. Fund has an advisory fee arrangement that includes breakpoints that adjust the fee ratio downward as the size of the Large Cap Value V.I. Fund increases above certain contractually specified levels. The Board further noted that BlackRock has
voluntarily agreed to waive fees or reimburse expenses in order to limit, to a specified amount, the Large Cap Value V.I. Fund’s total net expenses on a class-by-class basis, as applicable. Additionally, the Board noted that after discussions between the Board, including the Independent Board Members, and BlackRock, the Board and BlackRock agreed to a voluntary advisory fee reduction effective June 1, 2012.
The Board noted that the Money Market V.I. Fund’s contractual management fee ratio (a combination of the advisory fee and the administration fee, if any) was above the median contractual management fee ratio paid by the Money Market V.I. Fund’s Peers, in each case before taking into account any expense reimbursements or fee waivers. The Board also noted, however, that the Money Market V.I. Fund’s actual management fee ratio, after giving effect to any expense reimbursements or fee waivers by BlackRock, was lower than or equal to the median actual management fee ratio paid by the Money Market V.I. Fund’s Peers, after giving effect to any expense reimbursements or fee waivers. The Board further noted that the Money Market V.I. Fund has an advisory fee arrangement that includes breakpoints that adjust the fee ratio downward as the size of the Money Market V.I. Fund increases above certain contractually specified levels. Additionally, the Board noted that BlackRock has voluntarily agreed to waive fees or reimburse expenses in order to limit, to a specified amount, the Money Market V.I. Fund’s total net expenses on a class-by-class basis, as applicable. Moreover, the Board noted that BlackRock has voluntarily agreed to waive a portion of their respective fees and/or reimburse operating expenses to enable the Money Market V.I. Fund to maintain minimum levels of daily net investment income. This waiver and/or reimbursement may be discontinued at any time without notice.
The Board noted that the S&P 500 Index V.I. Fund’s contractual management fee ratio (a combination of the advisory fee and the administration fee, if any) was lower than or equal to the median contractual management fee ratio paid by the S&P 500 Index V.I. Fund’s Peers, in each case before taking into account any expense reimbursements or fee waivers. The Board also noted that BlackRock has voluntarily agreed to waive fees or reimburse expenses in order to limit, to a specified amount, the S&P 500 Index V.I. Fund’s total net expenses on a class-by-class basis, as applicable. Additionally, the Board noted that BlackRock has voluntarily agreed to waive management fees for the S&P 500 Index V.I. Fund.
The Board noted that the Total Return V.I. Fund’s contractual management fee ratio (a combination of the advisory fee and the administration fee, if any) was lower than or equal to the median contractual management fee ratio paid by the Total Return V.I.
Fund’s Peers, in each case before taking into account any expense reimbursements or fee waivers. The Board also noted that the Total Return V.I. Fund has an advisory fee arrangement that includes breakpoints that adjust the fee ratio downward as the aggregate assets of the Total Return V.I. Fund, combined with the assets of the High Yield V.I. Fund, increase above certain contractually specified levels. The Board further noted that BlackRock has voluntarily agreed to waive fees or reimburse expenses in order to limit, to a specified amount, the Total Return V.I. Fund’s total net expenses on a class-by-class basis, as applicable.
The Board noted that the U.S. Government Bond V.I. Fund’s contractual management fee ratio (a combination of the advisory fee and the administration fee, if any) was lower than or equal to the median contractual management fee ratio paid by the U.S. Government Bond V.I. Fund’s Peers, in each case before taking into account any expense reimbursements or fee waivers. The Board also noted that the U.S. Government Bond V.I. Fund has an advisory fee arrangement that includes breakpoints that adjust the fee ratio downward as the size of the U.S. Government Bond V.I. Fund increases above certain contractually specified levels. The Board further noted that BlackRock has voluntarily agreed to waive fees or reimburse expenses in order to limit, to a specified amount, the U.S. Government Bond V.I. Fund’s total net expenses on a class-by-class basis, as applicable.
The Board noted that the Value Opportunities V.I. Fund’s contractual management fee ratio (a combination of the advisory fee and the administration fee, if any) was lower than or equal to the median contractual management fee ratio paid by the Value Opportunities V.I. Fund’s Peers, in each case before taking into account any expense reimbursements or fee waivers. The Board also noted that the Value Opportunities V.I. Fund has an advisory fee arrangement that includes breakpoints that adjust the fee ratio downward as the size of the Value Opportunities V.I. Fund increases above certain contractually specified levels. The Board further noted that BlackRock has voluntarily agreed to waive fees or reimburse expenses in order to limit, to a specified amount, the Value Opportunities V.I. Fund’s total net expenses on a class-by-class basis, as applicable.
D. Economies of Scale
The Board, including the Independent Board Members, considered the extent to which economies of scale might be realized as the assets of each Fund increase, as well as the existence of expense caps. The Board also considered the extent to which each Fund benefits from such economies and whether there should be changes in the advisory fee rate or structure in order to enable each Fund to participate in these economies of scale, for example through
the use of revised breakpoints, or with respect to the S&P 500 Index V.I. Fund, through the use of contractual breakpoints and/or revised voluntary breakpoints, in the advisory fee based upon the asset level of each Fund, and in the case of High Yield V.I. Fund and Total Return V.I. Fund, based on the combined assets of those two funds. In its consideration, the Board Members took into account the existence of expense caps and further considered the continuation and/or implementation, as applicable, of such caps.
E. Other Factors Deemed Relevant by the Board Members
The Board, including the Independent Board Members, also took into account other ancillary or “fall-out” benefits that BlackRock or its affiliates may derive from their respective relationships with each Fund, both tangible and intangible, such as BlackRock’s ability to leverage its investment professionals who manage other portfolios and risk management personnel, an increase in BlackRock’s profile in the investment advisory community, and the engagement of BlackRock’s affiliates as service providers to each Fund, including for administrative, distribution, securities lending and cash management services. The Board also considered BlackRock’s overall operations and its efforts to expand the scale of, and improve the quality of, its operations. The Board also noted that BlackRock may use and benefit from third party research obtained by soft dollars generated by certain registered fund transactions to assist in managing all or a number of its other client accounts. The Board further noted that it had considered the investment by BlackRock’s funds in ETFs without any offset against the management fees payable by the funds to BlackRock.
In connection with its consideration of the Agreements, the Board also received information regard-
ing BlackRock’s brokerage and soft dollar practices. The Board received reports from BlackRock which included information on brokerage commissions and trade execution practices throughout the year.
The Board noted the competitive nature of the open-end fund marketplace, and that shareholders are able to redeem their Fund shares if they believe that each Fund’s fees and expenses are too high or if they are dissatisfied with the performance of each Fund.
Conclusion
The Board, including all the Independent Board Members, approved the continuation of the Advisory Agreements between the Manager and the Corporation, on behalf of each Fund, for a one-year term ending June 30, 2013, and the Sub-Advisory Agreements between the Manager and the Sub-Advisors, with respect to each Fund, as applicable, for a one-year term ending June 30, 2013. Based upon its evaluation of all of the aforementioned factors in their totality, the Board, including the Independent Board Members, was satisfied that the terms of the Agreements were fair and reasonable and in the best interest of each Fund and its shareholders. In arriving at its decision to approve the Agreements, the Board did not identify any single factor or group of factors as all-important or controlling, but considered all factors together, and different Board Members may have attributed different weights to the various factors considered. The Independent Board Members were also assisted by the advice of independent legal counsel in making this determination. The contractual fee arrangements for each Fund reflect the results of several years of review by the Board Members and predecessor Board Members, and discussions between such Board Members (and predecessor Board Members) and BlackRock. As a result, the Board Members’ conclusions may be based in part on their consideration of these arrangements in prior years.
BlackRock Variable Series Funds, Inc.
Officers and Directors
Officers and Directors
Robert M. Hernandez,
Chairman of the Board and Director
Fred G. Weiss, Vice Chairman of the Board and Director
Paul L. Audet, Director
James H. Bodurtha, Director
Bruce R. Bond, Director
Donald W. Burton, Director
Honorable Stuart E. Eizenstat, Director
Laurence D. Fink, Director
Kenneth A. Froot, Director
Henry Gabbay, Director
John F. O’Brien, Director
Roberta Cooper Ramo, Director
David H. Walsh, Director
John M. Perlowski, President and Chief Executive Officer
Brendan Kyne, Vice President
Neal Andrews, Chief Financial Officer
Jay Fife, Treasurer
Brian Kindelan, Chief Compliance Officer
and Anti-Money Laundering Officer
Benjamin Archibald, Secretary1
| 1 | Effective May 8, 2012, Ira P. Shapiro resigned as Secretary of the Company and Benjamin Archibald became Secretary of the Company. |
Investment Advisor
BlackRock Advisors, LLC
Wilmington, DE 19809
Sub-Advisors
BlackRock Financial Management, Inc.
New York, NY 10055
BlackRock Investment Management, LLC
Princeton, NJ 08540
BlackRock International Limited
Edinburgh, EH3 8JB, United Kingdom
Custodians
The Bank of New York Mellon2
New York, NY 10286
Brown Brothers Harriman & Co.3
Boston, MA 02109
Transfer Agent
BNY Mellon Investment Servicing (US) Inc.
Wilmington, DE 19809
Accounting Agent
State Street Bank and Trust Company
Boston, MA 02110
Distributor
BlackRock Investments, LLC
New York, NY 10022
Independent Registered Public Accounting Firm
Deloitte & Touche LLP
Boston, MA 02116
Legal Counsel
Willkie, Farr & Gallagher LLP
New York, NY 10019
Address of the Funds
100 Bellevue Parkway
Wilmington, DE 19809
| 2 | For all Funds except BlackRock Global Allocation V.I. Fund, BlackRock International V.I. Fund and BlackRock Large Cap Growth V.I. Fund. |
| 3 | For BlackRock Global Allocation V.I. Fund, BlackRock International V.I. Fund and BlackRock Large Cap Growth V.I. Fund. |
BlackRock Variable Series Funds, Inc.
Additional Information
General Information
Availability of Proxy Voting Policies and Procedures
A description of the policies and procedures that the Funds use to determine how to vote proxies relating to portfolio securities is available (1) without charge, upon request, by calling (800) 441-7762; (2) at http://www.blackrock.com; and (3) on the Securities and Exchange Commission’s (the “SEC”) website at http://www.sec.gov.
Availability of Proxy Voting Record
Information about how the Funds voted proxies relating to securities held in each Fund’s portfolio during the most recent 12-month period ended June 30 is available upon request and without charge (1) at
http://www.blackrock.com or by calling (800) 441-7762 and (2) on the SEC’s website at http://www.sec.gov.
Availability of Quarterly Schedule of Investments
The Funds file their complete schedule of portfolio holdings with the SEC for the first and third quarters of each fiscal year on Form N-Q. The Funds’ Forms N-Q are available on the SEC’s website at http://www.sec.gov and may also be reviewed and copied at the SEC’s Public Reference Room in Washington, D.C. Information on how to access documents on the SEC’s website without charge may be obtained by calling (800) SEC-0330. The Funds’ Forms N-Q may also be obtained upon request and without charge by calling (800) 441-7762.
BlackRock Privacy Principles
BlackRock is committed to maintaining the privacy of its current and former fund investors and individual clients (collectively, “Clients”) and to safeguarding their non-public personal information. The following information is provided to help you understand what personal information BlackRock collects, how we protect that information and why in certain cases we share such information with select parties.
If you are located in a jurisdiction where specific laws, rules or regulations require BlackRock to provide you with additional or different privacy-related rights beyond what is set forth below, then BlackRock will comply with those specific laws, rules or regulations.
BlackRock obtains or verifies personal non-public information from and about you from different sources, including the following: (i) information we receive from you or, if applicable, your financial intermediary, on applications, forms or other documents; (ii) information about your transactions with us, our affiliates, or others; (iii) information we
receive from a consumer reporting agency; and (iv) from visits to our websites.
BlackRock does not sell or disclose to non-affiliated third parties any non-public personal information about its Clients, except as permitted by law or as is necessary to respond to regulatory requests or to service Client accounts. These non-affiliated third parties are required to protect the confidentiality and security of this information and to use it only for its intended purpose.
We may share information with our affiliates to service your account or to provide you with information about other BlackRock products or services that may be of interest to you. In addition, BlackRock restricts access to non-public personal information about its Clients to those BlackRock employees with a legitimate business need for the information. BlackRock maintains physical, electronic and procedural safeguards that are designed to protect the non-public personal information of its Clients, including procedures relating to the proper storage and disposal of such information.
This report is only for distribution to shareholders of the Funds of BlackRock Variable Series Funds, Inc. Past performance results shown in this report should not be considered a representation of future performance. Investment return and principal value of non-money market fund shares will fluctuate so that shares, when redeemed, may be worth more or less than their original cost. An investment in the BlackRock Money Market V.I. Fund is not insured or guaranteed by the Federal Deposit Insurance Corporation or any other government agency. Although the money market fund seeks to preserve the value of your investment at $1.00 per share, it is possible to lose money by investing in money market funds. Statements and other information herein are as dated and are subject to change.
Investment in foreign securities involves special risks including fluctuating foreign exchange rates, foreign government regulations, differing degrees of liquidity and the possibility of substantial volatility due to adverse political, economic or other developments.
| | |
| #16897-6/12-SAR | |  |
| | |
| Item 2 – | | Code of Ethics – Not Applicable to this semi-annual report |
| |
| Item 3 – | | Audit Committee Financial Expert – Not Applicable to this semi-annual report |
| |
| Item 4 – | | Principal Accountant Fees and Services – Not Applicable to this semi-annual report |
| |
| Item 5 – | | Audit Committee of Listed Registrants – Not Applicable |
| |
| Item 6 – | | Investments |
| | (a) The registrant’s Schedule of Investments is included as part of the Report to Stockholders filed under Item 1 of this Form. |
| | (b) Not Applicable due to no such divestments during the semi-annual period covered since the previous Form N-CSR filing. |
| |
| Item 7 – | | Disclosure of Proxy Voting Policies and Procedures for Closed-End Management Investment Companies – Not Applicable |
| |
| Item 8 – | | Portfolio Managers of Closed-End Management Investment Companies – Not Applicable |
| |
| Item 9 – | | Purchases of Equity Securities by Closed-End Management Investment Company and Affiliated Purchasers – Not Applicable |
| |
| Item 10 – | | Submission of Matters to a Vote of Security Holders – There have been no material changes to these procedures. |
| |
| Item 11 – | | Controls and Procedures |
| |
| | (a) – The registrant’s principal executive and principal financial officers, or persons performing similar functions, have concluded that the registrant’s disclosure controls and procedures (as defined in Rule 30a-3(c) under the Investment Company Act of 1940, as amended (the “1940 Act”)) are effective as of a date within 90 days of the filing of this report based on the evaluation of these controls and procedures required by Rule 30a-3(b) under the 1940 Act and Rule 15d-15(b) under the Securities Exchange Act of 1934, as amended. |
| |
| | (b) – There were no changes in the registrant’s internal control over financial reporting (as defined in Rule 30a-3(d) under the 1940 Act) that occurred during the second fiscal quarter of the period covered by this report that have materially affected, or are reasonably likely to materially affect, the registrant’s internal control over financial reporting. |
| |
| Item 12 – | | Exhibits attached hereto |
| |
| | (a)(1) – Code of Ethics – Not Applicable to this semi-annual report |
| |
| | (a)(2) – Certifications – Attached hereto |
| |
| | (a)(3) – Not Applicable |
| |
| | (b) – Certifications – Attached hereto |
Pursuant to the requirements of the Securities Exchange Act of 1934 and the Investment Company Act of 1940, the registrant has duly caused this report to be signed on its behalf by the undersigned, thereunto duly authorized.
| | |
| BlackRock Variable Series Funds, Inc. |
| |
| By: | | /s/ John M. Perlowski |
| | John M. Perlowski |
| | Chief Executive Officer (principal executive officer) of |
| | BlackRock Variable Series Funds, Inc. |
|
| Date: January 18, 2013 |
Pursuant to the requirements of the Securities Exchange Act of 1934 and the Investment Company Act of 1940, this report has been signed below by the following persons on behalf of the registrant and in the capacities and on the dates indicated.
| | |
| By: | | /s/ John M. Perlowski |
| | John M. Perlowski |
| | Chief Executive Officer (principal executive officer) of |
| | BlackRock Variable Series Funds, Inc. |
|
| Date: January 18, 2013 |
| |
| By: | | /s/ Neal J. Andrews |
| | Neal J. Andrews |
| | Chief Financial Officer (principal financial officer) of |
| | BlackRock Variable Series Funds, Inc. |
|
| Date: January 18, 2013 |