Earnings Presentation First Quarter 2018 April 26, 2018 Exhibit 99.2
Forward-Looking Statements 2 This presentation contains forward-looking statements, including statements regarding the proposed business combination transaction between Essendant Inc. (“Essendant”) and Genuine Parts Company (“GPC”) in which GPC will separate its Business Products Group and combine this business with Essendant. From time to time, oral or written forward-looking statements may also be included in other information released to the public. These forward-looking statements are intended to provide management’s current expectations or plans for our future operating and financial performance, based on assumptions currently believed to be valid. Forward-looking statements often contain words such as “expects,” “anticipates,” “estimates,” “intends,” “plans,” “believes,” “seeks,” “will,” “is likely to,” “scheduled,” “positioned to,” “continue,” “forecast,” “predicting,” “projection,” “potential” or similar expressions. Forward-looking statements may include references to goals, plans, strategies, objectives, projected costs or savings, anticipated future performance, results, events or transactions of Essendant or the combined company following the proposed transaction, the anticipated benefits of the proposed transaction, including estimated synergies, the expected timing of completion of the transaction and other statements that are not strictly historical in nature. These forward-looking statements are based on management’s current expectations, forecasts and assumptions. This means they involve a number of risks and uncertainties that could cause actual results to differ materially from those expressed or implied here, including but not limited to: the ability of Essendant and GPC to receive the required regulatory approvals for the proposed transaction and approval of Essendant’s stockholders and to satisfy the other conditions to the closing of the transaction on a timely basis or at all; the occurrence of events that may give rise to a right of one or both of Essendant and GPC to terminate the merger agreement; negative effects of the announcement or the consummation of the transaction on the market price of Essendant’s common stock and/or on its business, financial condition, results of operations and financial performance; risks relating to the value of the Essendant shares to be issued in the transaction, significant transaction costs and/or unknown liabilities; the possibility that the anticipated benefits from the proposed transaction cannot be realized in full or at all or may take longer to realize than expected; risks associated with contracts containing consent and/or other provisions that may be triggered by the proposed transaction; risks associated with transaction-related litigation; the possibility that costs or difficulties related to the integration of the businesses will be greater than expected; and the ability of the combined company to retain and hire key personnel. There can be no assurance that the proposed transaction or any other transaction described above will in fact be consummated in the manner described or at all. Stockholders, potential investors and other readers are urged to consider these risks and uncertainties in evaluating forward-looking statements and are cautioned not to place undue reliance on the forward-looking statements. For additional information on identifying factors that may cause actual results to vary materially from those stated in forward-looking statements, please see Essendant’s and GPC’s reports on Forms 10-K, 10-Q and 8-K filed with or furnished to the U.S. Securities and Exchange Commission (the “SEC”) and other written statements made by Essendant and/or GPC from time to time. The forward-looking information herein is given as of this date only, and neither Essendant nor GPC undertakes any obligation to revise or update it. It is not possible to anticipate or foresee all risks and uncertainties, and investors should not consider any list of risks and uncertainties to be exhaustive or complete.
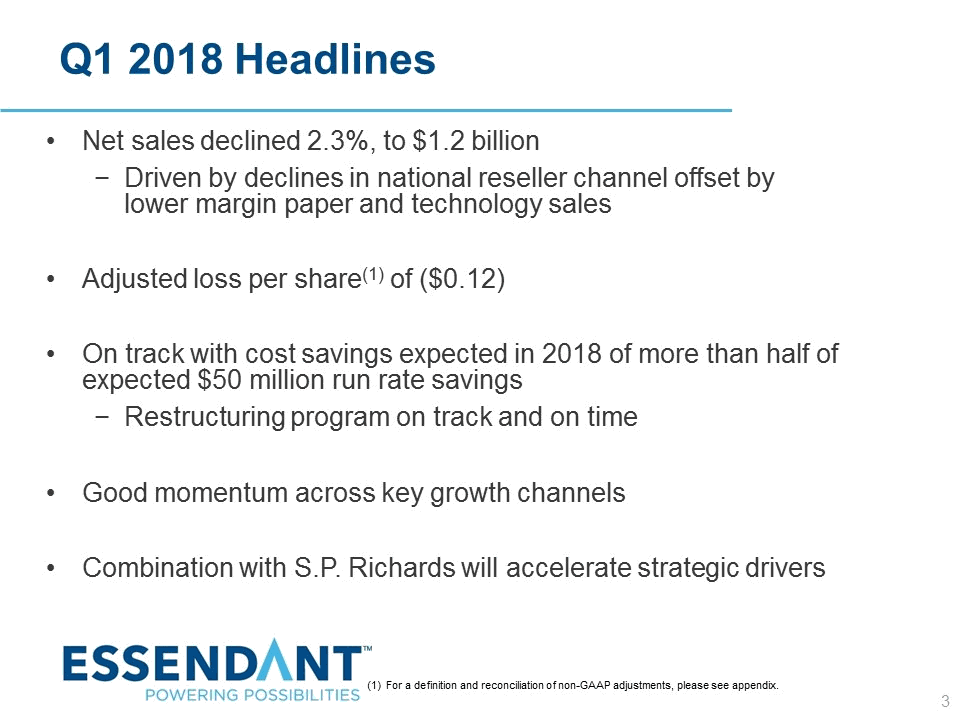
Q1 2018 Headlines 3 Net sales declined 2.3%, to $1.2 billion Driven by declines in national reseller channel offset by lower margin paper and technology sales Adjusted loss per share(1) of ($0.12) On track with cost savings expected in 2018 of more than half of expected $50 million run rate savings Restructuring program on track and on time Good momentum across key growth channels Combination with S.P. Richards will accelerate strategic drivers (1) For a definition and reconciliation of non-GAAP adjustments, please see appendix.
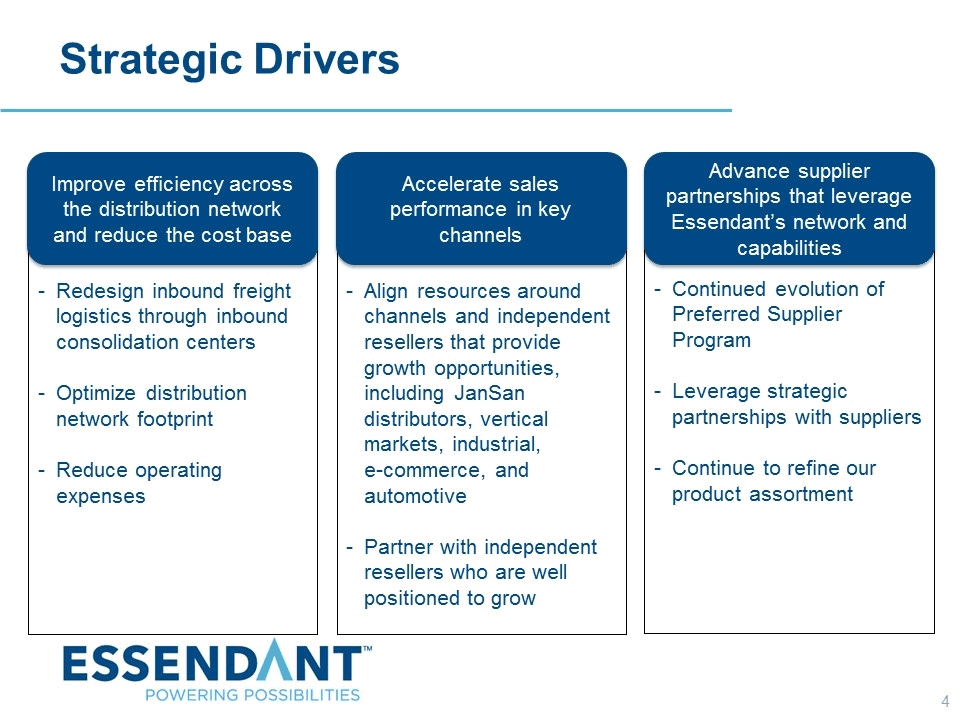
Strategic Drivers Improve efficiency across the distribution network and reduce the cost base Redesign inbound freight logistics through inbound consolidation centers Optimize distribution network footprint Reduce operating expenses Accelerate sales performance in key channels Align resources around channels and independent resellers that provide growth opportunities, including JanSan distributors, vertical markets, industrial, e-commerce, and automotive Partner with independent resellers who are well positioned to grow Advance supplier partnerships that leverage Essendant’s network and capabilities Continued evolution of Preferred Supplier Program Leverage strategic partnerships with suppliers Continue to refine our product assortment
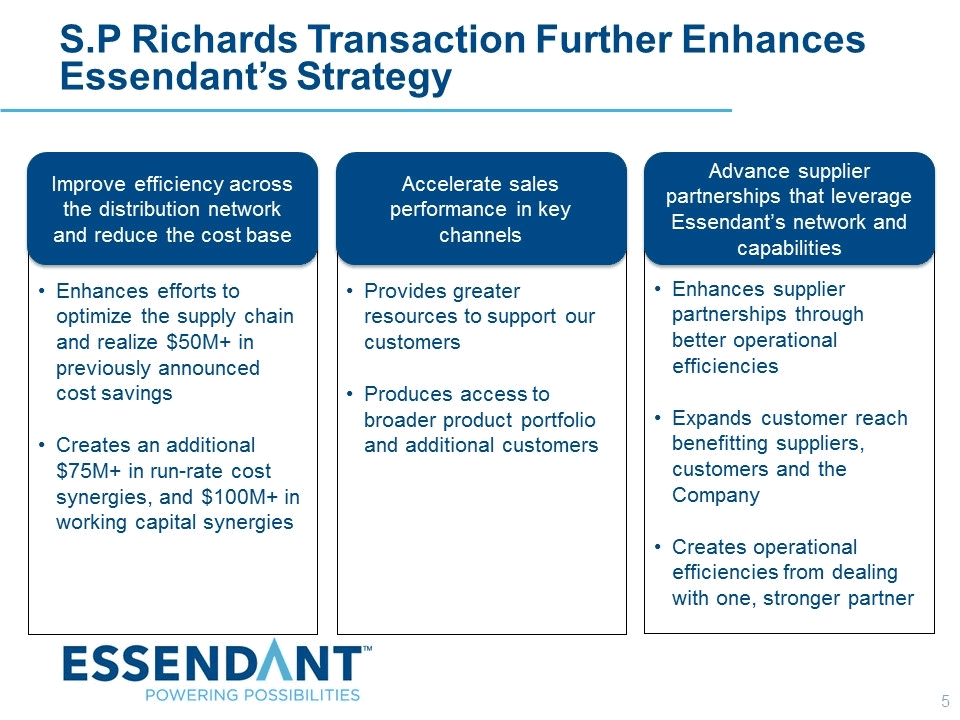
S.P Richards Transaction Further Enhances Essendant’s Strategy Improve efficiency across the distribution network and reduce the cost base Enhances efforts to optimize the supply chain and realize $50M+ in previously announced cost savings Creates an additional $75M+ in run-rate cost synergies, and $100M+ in working capital synergies Accelerate sales performance in key channels Provides greater resources to support our customers Produces access to broader product portfolio and additional customers Advance supplier partnerships that leverage Essendant’s network and capabilities Enhances supplier partnerships through better operational efficiencies Expands customer reach benefitting suppliers, customers and the Company Creates operational efficiencies from dealing with one, stronger partner
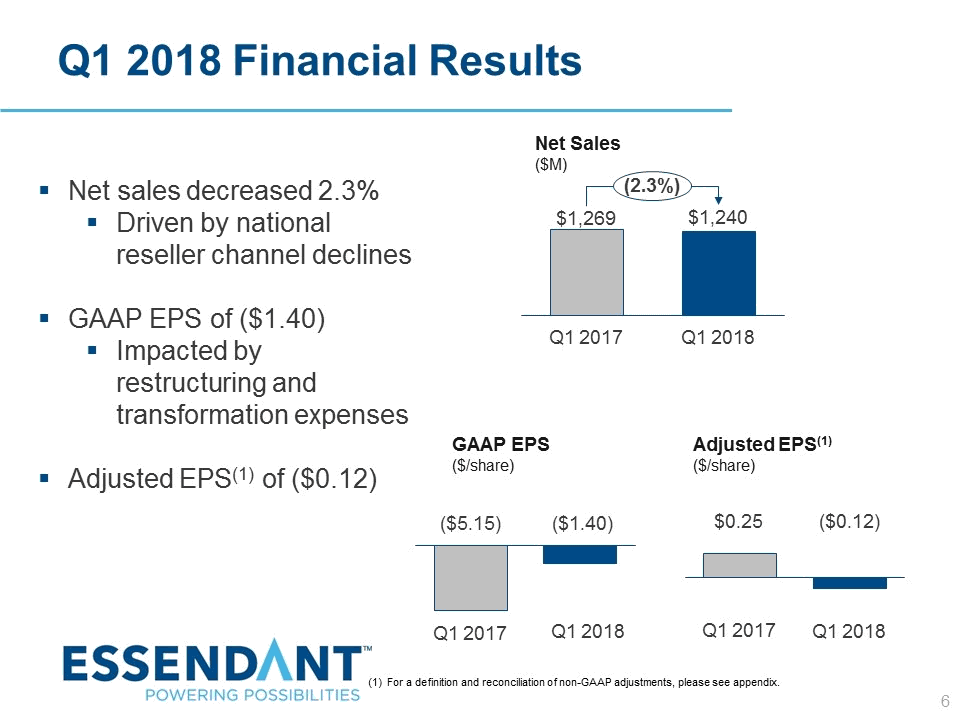
Q1 2018 Financial Results 6 Net sales decreased 2.3% Driven by national reseller channel declines GAAP EPS of ($1.40) Impacted by restructuring and transformation expenses Adjusted EPS(1) of ($0.12) GAAP EPS ($/share) Adjusted EPS(1) ($/share) $0.25 Q1 2017 ($0.12) Q1 2018 (2.3%) Q1 2017 Q1 2018 $1,240 $1,269 Net Sales ($M) Q1 2018 Q1 2017 ($1.40) ($5.15) (1) For a definition and reconciliation of non-GAAP adjustments, please see appendix.
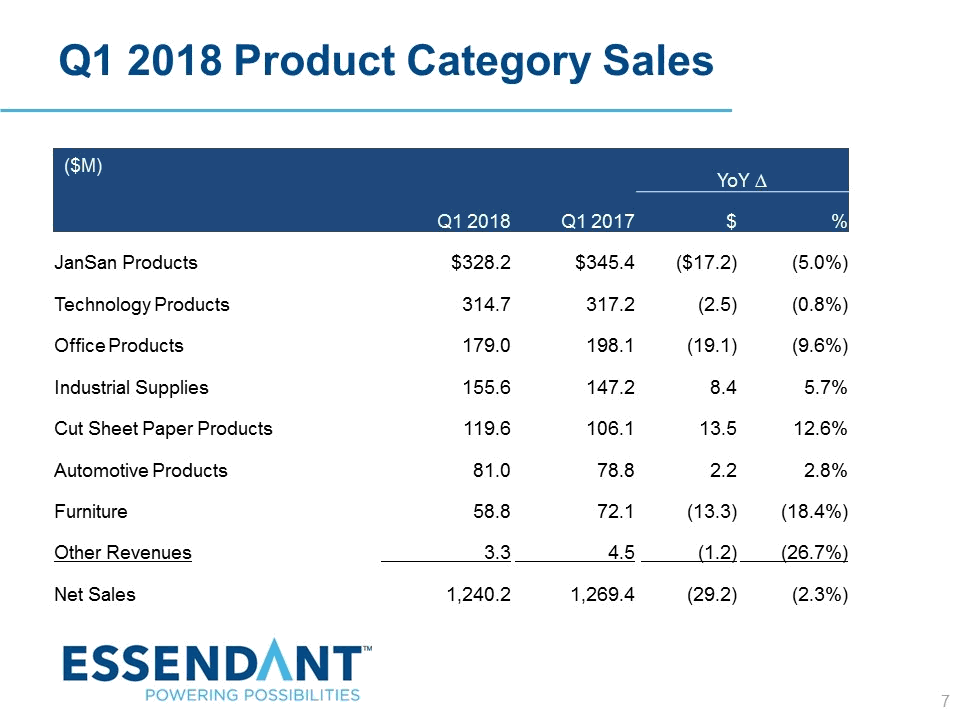
7 Q1 2018 Product Category Sales YoY ∆ Q1 2018 Q1 2017 $ % JanSan Products $328.2 $345.4 ($17.2) (5.0%) Technology Products 314.7 317.2 (2.5) (0.8%) Office Products 179.0 198.1 (19.1) (9.6%) Industrial Supplies 155.6 147.2 8.4 5.7% Cut Sheet Paper Products 119.6 106.1 13.5 12.6% Automotive Products 81.0 78.8 2.2 2.8% Furniture 58.8 72.1 (13.3) (18.4%) Other Revenues 3.3 4.5 (1.2) (26.7%) Net Sales 1,240.2 1,269.4 (29.2) (2.3%) ($M)
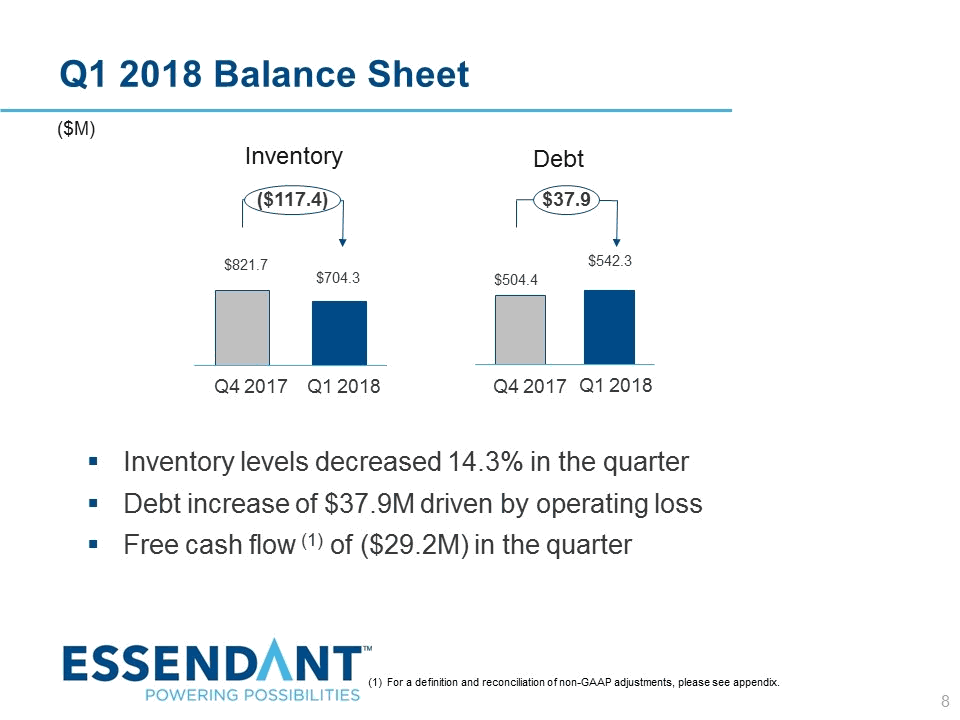
8 Q1 2018 Balance Sheet Inventory levels decreased 14.3% in the quarter Debt increase of $37.9M driven by operating loss Free cash flow (1) of ($29.2M) in the quarter Inventory Debt $821.7 $704.3 $504.4 $542.3 ($M) Q4 2017 Q4 2017 Q1 2018 Q1 2018 ($117.4) $37.9 (1) For a definition and reconciliation of non-GAAP adjustments, please see appendix.
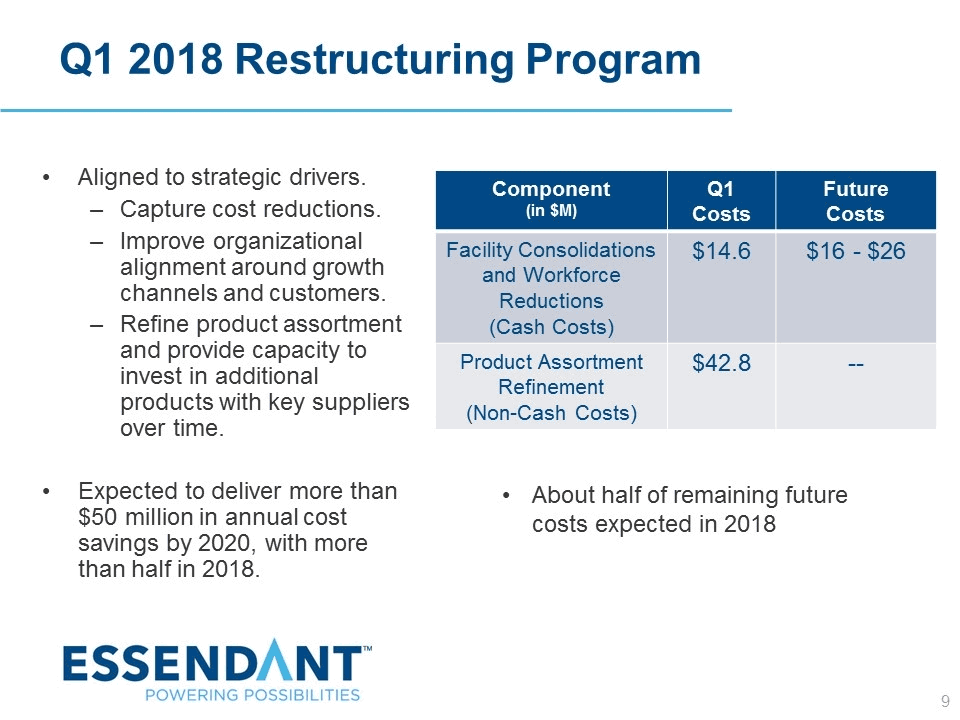
Q1 2018 Restructuring Program Aligned to strategic drivers. Capture cost reductions. Improve organizational alignment around growth channels and customers. Refine product assortment and provide capacity to invest in additional products with key suppliers over time. Expected to deliver more than $50 million in annual cost savings by 2020, with more than half in 2018. Component (in $M) Q1 Costs Future Costs Facility Consolidations and Workforce Reductions (Cash Costs) $14.6 $16 - $26 Product Assortment Refinement (Non-Cash Costs) $42.8 -- About half of remaining future costs expected in 2018
10 Full Year 2018 Outlook Net Sales for full year 2018 are expected to be down 3% to down 5% from the prior year. Adjusted diluted earnings per share (1) is expected to increase in the second half of 2018 compared to the first half, as our cost improvement efforts will scale through the year. This will enable us to return to positive adjusted diluted earnings per share in the second half and for the full year. Free cash flow (1) generated by the business for 2018, incorporating the costs and benefits of restructuring, is expected to be in excess of $40 million for the full year, excluding transaction costs. (1) For a definition and reconciliation of non-GAAP adjustments, please see appendix.

Appendix
12 The Non-GAAP table below presents Adjusted Gross Profit, Adjusted Operating Expenses, Adjusted Operating Income, Adjusted Net (Loss) Income, Adjusted Diluted (Loss) Earnings per Share, Adjusted EBITDA and Free Cash Flow for the three months ended March 31, 2018 and 2017 (in thousands, except per share data). These non-GAAP measures exclude certain non-recurring items and exclude other items that do not reflect the Company’s ongoing operations and are included to provide investors with useful information about the financial performance of our business. The presented non-GAAP financial measures should not be considered in isolation or as substitutes for the comparable GAAP financial measures. The non-GAAP financial measures do not reflect all of the amounts associated with our results of operations as determined in accordance with GAAP, and these non-GAAP financial measures should only be used to evaluate our results of operations in conjunction with the corresponding GAAP financial measures. In order to calculate the non-GAAP measures, management excludes the following items to the extent they occur in the reporting period, to facilitate the comparison of current and prior year results and ongoing operations, as management believes these items do not reflect the underlying cost structure of our business. These items can vary significantly in amount and frequency. •Restructuring charges. Workforce reduction and facility closure charges such as employee termination costs, facility closure and consolidation costs, and other costs directly associated with shifting business strategies or business conditions that are part of a restructuring program. Restructuring actions were taken in 2018 that included facility consolidations, workforce reductions and product assortment refinements. •Gain or loss on sale of assets or businesses. Sales of assets, such as buildings or equipment, and businesses can cause gains or losses. These transactions occur as the Company is repositioning its business and reviewing its cost structure. •Severance costs for operating leadership. Employee termination costs related to members of the Company’s operating leadership team are excluded as they are based upon individual agreements. •Asset impairments. Changes in strategy or macroeconomic events may cause asset impairments. In the three months ended March 31, 2017, the Company recorded goodwill impairment which resulted from declines in sales, earnings and market capitalization. •Other actions. Actions, which may be non-recurring events, that result from the changing strategies and needs of the Company and do not reflect the underlying expense of the on-going business. In the three months ended March 31, 2018, these include charges related to transformational expenses and a gain reflecting receipt of payment on notes receivable reserved in 2015. In the three months ended March 31, 2017, other actions included litigation and transformational expenses. Essendant Inc. and Subsidiaries Reconciliation of Non-GAAP Financial Measures Adjusted Gross Profit, Adjusted Operating Expenses, Adjusted Operating Income, Adjusted Net (Loss) Income, Adjusted Diluted (Loss) Earnings Per Share, Adjusted EBITDA, and Free Cash Flow
13 Adjusted Gross Profit, adjusted operating expenses and adjusted operating income. Adjusted gross profit, adjusted operating expenses and adjusted operating income provide management and our investors with an understanding of the results from the primary operations of our business by excluding the effects of items described above that do not reflect the ordinary expenses and earnings of our operations. Adjusted operating expenses and adjusted operating income are used to evaluate our period-over-period operating performance as they are more comparable measures of our continuing business. These measures may be useful to an investor in evaluating the underlying operating performance of our business. Adjusted net (loss) income and adjusted diluted (loss) earnings per share. Adjusted net (loss) income and adjusted diluted (loss) earnings per share provide a more comparable view of our Company’s underlying performance and trends than the comparable GAAP measures. Net (loss) income and diluted (loss) earnings per share are adjusted for the effect of items described above that do not reflect the ordinary earnings of our operations. Adjusted earnings before interest, taxes, depreciation and amortization (EBITDA). Adjusted EBITDA is helpful in evaluating our operating performance and is used by management for various purposes, including as a measure of performance and as a basis for strategic planning and forecasting. Net income is adjusted for the effect of interest, taxes, depreciation and amortization and stock-based compensation expense. Management believes that adjusted EBITDA is also commonly used by investors to evaluate operating performance between competitors because it helps reduce variability caused by differences in capital structures, income taxes, stock-based compensation accounting policies, and depreciation and amortization policies. Free cash flow. Free cash flow is useful to management and our investors as it is a measure of the Company’s liquidity. It provides a more complete understanding of factors and trends affecting our cash flows than the comparable GAAP measure. Net cash provided by (used in) operating activities and net cash provided by (used in) investing activities are aggregated and adjusted to exclude the impact of acquisitions, net of cash acquired and divestitures. Outlook. Adjusted diluted earnings per share and free cash flow are non-GAAP measures. A quantitative reconciliation of non-GAAP guidance to the corresponding GAAP information is not available because the non-GAAP guidance excludes certain GAAP information that is uncertain and difficult to predict. The adjusted diluted earnings per share guidance excludes impacts in the first three months of 2018 of $1.26 per share related to restructuring charges, transformational expenses and a payment on notes receivable. Actual amounts appear in the non-GAAP table included later in this appendix. For the remainder of the year, the factors that will be excluded are currently unknown due to the level of unpredictability and uncertainty associated with these items, but may include actions such as future restructuring chargers, transformational expenses and cash flow impacts of acquisitions. Essendant Inc. and Subsidiaries Reconciliation of Non-GAAP Financial Measures Adjusted Gross Profit, Adjusted Operating Expenses, Adjusted Operating Income, Adjusted Net (Loss) Income, Adjusted Diluted (Loss) Earnings Per Share, Adjusted EBITDA, and Free Cash Flow
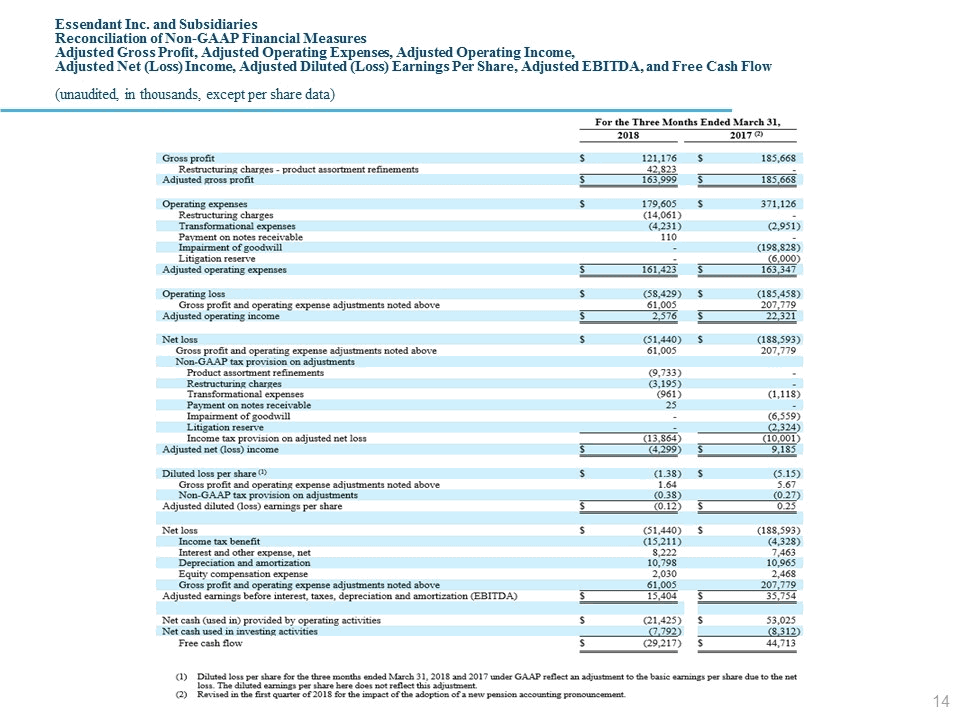
14 Essendant Inc. and Subsidiaries Reconciliation of Non-GAAP Financial Measures Adjusted Gross Profit, Adjusted Operating Expenses, Adjusted Operating Income, Adjusted Net (Loss) Income, Adjusted Diluted (Loss) Earnings Per Share, Adjusted EBITDA, and Free Cash Flow (unaudited, in thousands, except per share data)