UNITED STATES
SECURITIES AND EXCHANGE COMMISSION
Washington, D.C. 20549
FORM N-CSR
CERTIFIED SHAREHOLDER REPORT OF REGISTERED
MANAGEMENT INVESTMENT COMPANIES
Investment Company Act file number 811-3320
Colchester Street Trust
(Exact name of registrant as specified in charter)
82 Devonshire St., Boston, Massachusetts 02109
(Address of principal executive offices) (Zip code)
Eric D. Roiter, Secretary
82 Devonshire St.
Boston, Massachusetts 02109
(Name and address of agent for service)
Registrant's telephone number, including area code: 617-563-7000
Date of fiscal year end: | March 31 |
| |
Date of reporting period: | September 30, 2005 |
Item 1. Reports to Stockholders
| | Fidelity®
Institutional
Money Market
Funds
|
Semiannual Report
September 30, 2005
|


| Contents | | |
| |
| Fidelity Institutional Money Market Funds | | |
| Shareholder Expense Example | | 3 |
| Investment Changes, Schedules of Investments & Financial Statements | | |
| Treasury Only Portfolio | | 6 |
| Treasury Portfolio | | 12 |
| Government Portfolio | | 18 |
| Prime Money Market Portfolio | | 25 |
| Money Market Portfolio | | 35 |
| Tax Exempt Portfolio | | 45 |
| Notes to Financial Statements | | 69 |
| Board Approval of Investment Advisory Contracts and Management Fees | | 78 |
| | Fund Goals:
Treasury Only Portfolio, Treasury Portfolio, Government Portfolio, Prime Money Market Portfolio, and Money Market Portfolio seek to
obtain as high a level of current income as is consistent with the preservation of principal and liquidity within the limitations prescribed for
the fund.
Tax Exempt Portfolio seeks to obtain as high a level of interest income exempt from federal income tax as is consistent with liquidity and
stability of principal.
To view a fund’s proxy voting guidelines and proxy voting record for the 12 month period ended June 30, visit www.fidelity.com/proxyvotingresults or visit the
Securities and Exchange Commission’s (SEC) website at www.sec.gov. You may also call 1-877-208-0098 to request a free copy of the proxy voting guidelines.
Standard & Poor’s, S&P and S&P 500 are registered service marks of The McGraw Hill Companies, Inc. and have been licensed for use by
Fidelity Distributors Corporation.
Other third party marks appearing herein are the property of their respective owners.
All other marks appearing herein are registered or unregistered trademarks or service marks of FMR Corp. or an affiliated company.
|
| | Investments in the funds are neither insured nor guaranteed by the U.S. Government, and there can be no assurance that the funds will maintain a stable
$1.00 share price.
This report and the financial statements contained herein are submitted for the general information of the shareholders of the funds. This report is not
authorized for distribution to prospective investors in the funds unless preceded or accompanied by an effective prospectus.
A fund files its complete schedule of portfolio holdings with the SEC for the first and third quarters of each fiscal year on Form N Q. Forms N Q are available
on the SEC’s web site at http://www.sec.gov. A fund’s Forms N Q may be reviewed and copied at the SEC’s Public Reference Room in Washington, DC. Informa
tion regarding the operation of the SEC’s Public Reference Room may be obtained by calling 1-800-SEC-0330. For a complete list of a fund’s portfolio hold-
ings, view the most recent quarterly holdings report, semiannual report, or annual report on Fidelity’s web site at http://www.advisor.fidelity.com.
NOT FDIC INSURED · MAY LOSE VALUE · NO BANK GUARANTEE
Neither the funds nor Fidelity Distributors Corporation is a bank.
|
Shareholder Expense Example
|
As a shareholder of a Fund, you incur two types of costs: (1) transaction costs, and (2) ongoing costs, including management fees, distribution and/or service (12b 1) fees and other Fund expenses. This Example is intended to help you understand your ongoing costs (in dollars) of investing in the Funds and to compare these costs with the ongoing costs of investing in other mutual funds.
The Example is based on an investment of $1,000 invested at the beginning of the period and held for the entire period (April 1, 2005 to September 30, 2005).
The first line of the table below for each class of each fund provides information about actual account values and actual expenses. You may use the information in this line, together with the amount you invested, to estimate the expenses that you paid over the period. Simply divide your account value by $1,000.00 (for example, an $8,600 account value divided by $1,000.00 = 8.6), then multiply the result by the number in the first line for a class of the fund under the heading entitled “Expenses Paid During Period” to estimate the expenses you paid on your account during this period. A small balance maintenance fee of $12.00 that is charged once a year may apply for certain accounts with a value of less than $2,000. This fee is not included in the table below. If it was, the estimate of expenses you paid during the period would be higher, and your ending account value lower, by this amount.
Hypothetical Example for Comparison Purposes
|
The second line of the table below for each class of each fund provides information about hypothetical account values and hypothetical expenses based on a Class’ actual expense ratio and an assumed rate of return of 5% per year before expenses, which is not the Class’ actual return. The hypothetical account values and expenses may not be used to estimate the actual ending account balance or expenses you paid for the period. You may use this information to compare the ongoing costs of investing in the Fund and other funds. To do so, compare this 5% hypothetical example with the 5% hypothetical examples that appear in the shareholder reports of the other funds. A small balance maintenance fee of $12.00 that is charged once a year may apply for certain accounts with a value of less than $2,000. This fee is not included in the table below. If it was, the estimate of expenses you paid during the period would be higher, and your ending account value lower, by this amount.
Please note that the expenses shown in the table are meant to highlight your ongoing costs only and do not reflect any transaction costs. Therefore, the second line of the table is useful in comparing ongoing costs only, and will not help you determine the relative total costs of owning different funds.
| | | | | | | Expenses Paid |
| | | Beginning | | Ending | | During Period* |
| | | Account Value | | Account Value | | April 1, 2005 to |
| | | April 1, 2005 | | September 30, 2005 | | September 30, 2005 |
| Treasury Only Portfolio | | | | | | | | |
| Class I | | | | | | | | |
| Actual | | $ 1,000.00 | | $ 1,014.10 | | $ | | 1.01 |
| HypotheticalA | | $ 1,000.00 | | $ 1,024.07 | | $ | | 1.01 |
| Class II | | | | | | | | |
| Actual | | $ 1,000.00 | | $ 1,013.30 | | $ | | 1.77 |
| HypotheticalA | | $ 1,000.00 | | $ 1,023.31 | | $ | | 1.78 |
| Class III | | | | | | | | |
| Actual | | $ 1,000.00 | | $ 1,012.80 | | $ | | 2.27 |
| HypotheticalA | | $ 1,000.00 | | $ 1,022.81 | | $ | | 2.28 |
| Select Class | | | | | | | | |
| Actual | | $ 1,000.00 | | $ 1,013.80 | | $ | | 1.26 |
| HypotheticalA | | $ 1,000.00 | | $ 1,023.82 | | $ | | 1.27 |
| Treasury Portfolio | | | | | | | | |
| Class I | | | | | | | | |
| Actual | | $ 1,000.00 | | $ 1,015.10 | | $ | | 1.01 |
| HypotheticalA | | $ 1,000.00 | | $ 1,024.07 | | $ | | 1.01 |
| Class II | | | | | | | | |
| Actual | | $ 1,000.00 | | $ 1,014.30 | | $ | | 1.77 |
| HypotheticalA | | $ 1,000.00 | | $ 1,023.31 | | $ | | 1.78 |
| Class III | | | | | | | | |
| Actual | | $ 1,000.00 | | $ 1,013.80 | | $ | | 2.27 |
| HypotheticalA | | $ 1,000.00 | | $ 1,022.81 | | $ | | 2.28 |
| Select Class | | | | | | | | |
| Actual | | $ 1,000.00 | | $ 1,014.80 | | $ | | 1.26 |
| HypotheticalA | | $ 1,000.00 | | $ 1,023.82 | | $ | | 1.27 |
3 Semiannual Report
| Shareholder Expense Example continued | | | | | | | | | | |
| |
| |
| |
| | | | | | | | | | | Expenses Paid |
| | | | | | | Beginning | | Ending | | During Period* |
| | | | | | | Account Value | | Account Value | | April 1, 2005 to |
| | | | | | | April 1, 2005 | | September 30, 2005 | | September 30, 2005 |
| Government Portfolio | | | | | | | | | | | | |
| Class I | | | | | | | | | | | | |
| Actual | | | | | $ | 1,000.00 | | $ 1,015.40 | | | $ | 1.01 |
| HypotheticalA | | | | | $ | 1,000.00 | | $ 1,024.07 | | | $ | 1.01 |
| Class II | | | | | | | | | | | | |
| Actual | | | | | $ | 1,000.00 | | $ 1,014.60 | | | $ | 1.77 |
| HypotheticalA | | | | | $ | 1,000.00 | | $ 1,023.31 | | | $ | 1.78 |
| Class III | | | | | | | | | | | | |
| Actual | | | | | $ | 1,000.00 | | $ 1,014.10 | | | $ | 2.27 |
| HypotheticalA | | | | | $ | 1,000.00 | | $ 1,022.81 | | | $ | 2.28 |
| Select Class | | | | | | | | | | | | |
| Actual | | | | | $ | 1,000.00 | | $ 1,015.10 | | | $ | 1.26 |
| HypotheticalA | | | | | $ | 1,000.00 | | $ 1,023.82 | | | $ | 1.27 |
| Prime Money Market Portfolio | | | | | | | | | | | | |
| Class I | | | | | | | | | | | | |
| Actual | | | | | $ | 1,000.00 | | $ 1,015.60 | | | $ | 1.01 |
| HypotheticalA | | | | | $ | 1,000.00 | | $ 1,024.07 | | | $ | 1.01 |
| Class II | | | | | | | | | | | | |
| Actual | | | | | $ | 1,000.00 | | $ 1,014.80 | | | $ | 1.77 |
| HypotheticalA | | | | | $ | 1,000.00 | | $ 1,023.31 | | | $ | 1.78 |
| Class III | | | | | | | | | | | | |
| Actual | | | | | $ | 1,000.00 | | $ 1,014.30 | | | $ | 2.27 |
| HypotheticalA | | | | | $ | 1,000.00 | | $ 1,022.81 | | | $ | 2.28 |
| Select Class | | | | | | | | | | | | |
| Actual | | | | | $ | 1,000.00 | | $ 1,015.40 | | | $ | 1.26 |
| HypotheticalA | | | | | $ | 1,000.00 | | $ 1,023.82 | | | $ | 1.27 |
| Money Market Portfolio | | | | | | | | | | | | |
| Class I | | | | | | | | | | | | |
| Actual | | | | | $ | 1,000.00 | | $ 1,015.70 | | | $ | .91 |
| HypotheticalA | | | | | $ | 1,000.00 | | $ 1,024.17 | | | $ | .91 |
| Class II | | | | | | | | | | | | |
| Actual | | | | | $ | 1,000.00 | | $ 1,014.90 | | | $ | 1.67 |
| HypotheticalA | | | | | $ | 1,000.00 | | $ 1,023.41 | | | $ | 1.67 |
| Class III | | | | | | | | | | | | |
| Actual | | | | | $ | 1,000.00 | | $ 1,014.40 | | | $ | 2.17 |
| HypotheticalA | | | | | $ | 1,000.00 | | $ 1,022.91 | | | $ | 2.18 |
| Select Class | | | | | | | | | | | | |
| Actual | | | | | $ | 1,000.00 | | $ 1,015.40 | | | $ | 1.16 |
| HypotheticalA | | | | | $ | 1,000.00 | | $ 1,023.92 | | | $ | 1.17 |
| Tax Exempt Portfolio | | | | | | | | | | | | |
| Class I | | | | | | | | | | | | |
| Actual | | | | | $ | 1,000.00 | | $ 1,011.80 | | | $ | 1.01 |
| HypotheticalA | | | | | $ | 1,000.00 | | $ 1,024.07 | | | $ | 1.01 |
| Class II | | | | | | | | | | | | |
| Actual | | | | | $ | 1,000.00 | | $ 1,011.00 | | | $ | 1.76 |
| HypotheticalA | | | | | $ | 1,000.00 | | $ 1,023.31 | | | $ | 1.78 |
| Class III | | | | | | | | | | | | |
| Actual | | | | | $ | 1,000.00 | | $ 1,010.50 | | | $ | 2.27 |
| HypotheticalA | | | | | $ | 1,000.00 | | $ 1,022.81 | | �� | $ | 2.28 |
| Select Class | | | | | | | | | | | | |
| Actual | | | | | $ | 1,000.00 | | $ 1,011.50 | | | $ | 1.26 |
| HypotheticalA | | | | | $ | 1,000.00 | | $ 1,023.82 | | | $ | 1.27 |
| |
| A 5% return per year before expenses | | | | | | | | | | | | |
* Expenses are equal to each Class’ annualized expense ratio (shown in the table below); multiplied by the average account value over the period, multiplied by 183/365 (to reflect the one half year period).
| | | Annualized |
| | | Expense Ratio |
| Treasury Only Portfolio | | |
| Class I | | 20% |
| Class II | | 35% |
| Class III | | 45% |
| Select Class | | 25% |
| Treasury Portfolio | | |
| Class I | | 20% |
| Class II | | 35% |
| Class III | | 45% |
| Select Class | | 25% |
| Government Portfolio | | |
| Class I | | 20% |
| Class II | | 35% |
| Class III | | 45% |
| Select Class | | 25% |
| Prime Money Market Portfolio | | |
| Class I | | 20% |
| Class II | | 35% |
| Class III | | 45% |
| Select Class | | 25% |
| Money Market Portfolio | | |
| Class I | | 18% |
| Class II | | 33% |
| Class III | | 43% |
| Select Class | | 23% |
| Tax Exempt Portfolio | | |
| Class I | | 20% |
| Class II | | 35% |
| Class III | | 45% |
| Select Class | | 25% |
5 Semiannual Report
| | Treasury Only Portfolio
Investment Changes
|
| Maturity Diversification | | | | | | |
| Days | | % of fund’s | | % of fund’s | | % of fund’s |
| | | investments | | investments | | investments |
| | | 9/30/05 | | 3/31/05 | | 9/30/04 |
| 0- 30 | | 9.2 | | 38.9 | | 44.2 |
| 31-90 | | 83.4 | | 52.2 | | 32.9 |
| 91-180 | | 7.4 | | 8.9 | | 20.2 |
| 181-397 | | 0.0 | | 0.0 | | 2.7 |
| Weighted Average Maturity | | | | | | |
| | | 9/30/05 | | 3/31/05 | | 9/30/04 |
| Treasury Only Portfolio | | 50 Days | | 45 Days | | 55 Days |
| All Taxable Money Market Funds Average* | | 38 Days | | 38 Days | | 43 Days |

* Source: iMoneyNet, Inc.
Semiannual Report 6
Investments September 30, 2005 (Unaudited)
Showing Percentage of Net Assets
U.S. Treasury Obligations 99.9%
| Due | | Annualized Yield at | | | | Principal | | | | Value (Note 1) |
| Date | | Time of Purchase | | | | Amount (000s) | | | | (000s) |
| U.S. Treasury Bills – 74.1% | | | | | | | | |
| 10/13/05 | | 3.17% | | | $ | 12,497 | | | $ | 12,484 |
| 10/13/05 | | 3.18 | | | | 55,000 | | | | 54,942 |
| 10/27/05 | | 3.37 | | | | 27,500 | | | | 27,434 |
| 11/3/05 | | 3.41 | | | | 35,000 | | | | 34,891 |
| 11/10/05 | | 3.49 | | | | 85,000 | | | | 84,673 |
| 11/17/05 | | 3.10 | | | | 20,000 | | | | 19,920 |
| 11/17/05 | | 3.26 | | | | 66,000 | | | | 65,720 |
| 11/17/05 | | 3.46 | | | | 8,716 | | | | 8,677 |
| 11/17/05 | | 3.50 | | | | 65,000 | | | | 64,706 |
| 11/17/05 | | 3.51 | | | | 40,000 | | | | 39,819 |
| 11/25/05 | | 3.51 | | | | 153,000 | | | | 152,188 |
| 12/1/05 | | 3.52 | | | | 65,000 | | | | 64,616 |
| 12/1/05 | | 3.53 | | | | 25,000 | | | | 24,852 |
| 12/1/05 | | 3.54 | | | | 35,000 | | | | 34,792 |
| 1/5/06 | | 3.49 | | | | 38,000 | | | | 37,650 |
| 3/9/06 | | 3.63 | | | | 30,000 | | | | 29,528 |
| 3/9/06 | | 3.64 | | | | 10,000 | | | | 9,842 |
| | | | | | | | | | | 766,734 |
| U.S. Treasury Notes – 25.8% | | | | | | | | |
| 10/31/05 | | 3.24 | | | | 6,059 | | | | 6,051 |
| 10/31/05 | | 3.40 | | | | 74,000 | | | | 73,892 |
| 10/31/05 | | 3.47 | | | | 97,000 | | | | 96,853 |
| 11/15/05 | | 3.50 | | | | 90,000 | | | | 90,239 |
| | | | | | | | | | | 267,035 |
| |
| |
| TOTAL INVESTMENT PORTFOLIO 99.9% | | | | |
| (Cost $1,033,769) | | | | | | | | 1,033,769 |
| |
| NET OTHER ASSETS 0.1% | | | | | | | | 1,436 |
| NET ASSETS 100% | | | | | | | $ | 1,035,205 |
At March 31, 2005, the fund had a capital loss carryforward of approximately $373,000 of which $47,000, $142,000 and $184,000 will expire on March 31, 2011, 2012 and 2013, respectively.
See accompanying notes which are an integral part of the financial statements.
7 Semiannual Report
| Treasury Only Portfolio | | | | | | | | |
| |
| Financial Statements | | | | | | |
| |
| |
| Statement of Assets and Liabilities | | | | | | |
| Amounts in thousands (except per share amounts) | | | | September 30, 2005 |
| | | | | | | | | | | (Unaudited) |
| Assets | | | | | | | | | | |
| Investment in securities, at value | | | | | | | | | | |
| (cost $1,033,769) — See | | | | | | | | | | |
| accompanying schedule | | | | | | | | $ | | 1,033,769 |
| Interest receivable | | | | | | | | | | 3,156 |
| Prepaid expenses | | | | | | | | | | 1 |
| Receivable from investment adviser | | | | | | | | |
| for expense reductions | | | | | | | | | | 39 |
| Total assets | | | | | | | | | | 1,036,965 |
| |
| Liabilities | | | | | | | | | | |
| Distributions payable | | $ | | | | 1,479 | | | | | | |
| Accrued management fee | | | | | | 184 | | | | |
| Distribution fees payable | | | | | | 46 | | | | |
| Other affiliated payables | | | | | | 29 | | | | |
| Other payables and accrued ex- | | | | | | | | | | |
| penses | | | | | | 22 | | | | |
| Total liabilities | | | | | | | | | | 1,760 |
| |
| Net Assets | | | | | | | | $ | | 1,035,205 |
| Net Assets consist of: | | | | | | | | | | |
| Paid in capital | | | | | | | | $ | | 1,035,496 |
| Distributions in excess of net invest- | | | | | | | | |
| ment income | | | | | | | | | | (6) |
| Accumulated undistributed net real- | | | | | | | | |
| ized gain (loss) on investments | | | | | | | | | | (285) |
| Net Assets | | | | | | | | $ | | 1,035,205 |
| Calculation of Maximum Offering | | | | | | | | |
| Price | | | | | | | | | | |
| Class I: | | | | | | | | | | |
| Net Asset Value, offering price | | | | | | | | | | |
| and redemption price | | | | | | | | | | |
| per share ($757,459 ÷ | | | | | | | | | | |
| 757,446 shares) | | | | | | | | $ | | 1.00 |
| Class II: | | | | | | | | | | |
| Net Asset Value, offering price | | | | | | | | | | |
| and redemption price | | | | | | | | | | |
| per share ($112,392 ÷ | | | | | | | | | | |
| 112,418 shares) | | | | | | | | $ | | 1.00 |
| Class III: | | | | | | | | | | |
| Net Asset Value, offering price | | | | | | | | | | |
| and redemption price | | | | | | | | | | |
| per share ($145,488 ÷ | | | | | | | | | | |
| 145,478 shares) | | | | | | | | $ | | 1.00 |
| Select Class: | | | | | | | | | | |
| Net Asset Value, offering price | | | | | | | | | | |
| and redemption price per share | | | | | | | | |
| ($19,866 ÷ 19,871 shares) | | | | | | | | $ | | 1.00 |
| Statement of Operations | | | | | | |
| Amounts in thousands | | Six months ended September 30, 2005 |
| | | | | | | (Unaudited) |
| Investment Income | | | | | | |
| Interest | | | | $ | | 16,918 |
| |
| Expenses | | | | | | |
| Management fee | | $ | | 1,126 | | |
| Transfer agent fees | | | | 100 | | |
| Distribution fees | | | | 296 | | |
| Accounting fees and expenses | | | | 67 | | |
| Independent trustees’ compensation | | | | 3 | | |
| Custodian fees and expenses | | | | 10 | | |
| Registration fees | | | | 32 | | |
| Audit | | | | 20 | | |
| Legal | | | | 1 | | |
| Miscellaneous | | | | 7 | | |
| Total expenses before reductions | | | | 1,662 | | |
| Expense reductions | | | | (237) | | 1,425 |
| |
| Net investment income | | | | | | 15,493 |
| |
| Net realized gain (loss) on invest- | | | | | | |
| ment securities | | | | | | (20) |
| Net increase in net assets resulting | | | | | | |
| from operations | | | | $ | | 15,473 |
| See accompanying notes which are an integral part of the financial statements. | | |
| Semiannual Report | | 8 |
| Statement of Changes in Net Assets | | | | | | | | | | | | | | | | | | | | | | | | | | |
| | | | | | | | | | | | | | | | | Six months ended | | | | Year ended |
| | | | | | | | | | | | | | | | | September 30, 2005 | | | | March 31, |
| Amounts in thousands | | | | | | | | | | | | | | | | | | (Unaudited) | | | | 2005 |
| Increase (Decrease) in Net Assets | | | | | | | | | | | | | | | | | | | | | | | | | | |
| Operations | | | | | | | | | | | | | | | | | | | | | | | | | | |
| Net investment income | | | | | | | | | | | | | | | | $ | | | | 15,493 | | $ | | | | 15,996 |
| Net realized gain (loss) | | | | | | | | | | | | | | | | | | | | (20) | | | | | | (242) |
| Net increase in net assets resulting from operations | | | | | | | | | | | | | | | | | | 15,473 | | | | | | 15,754 |
| Distributions to shareholders from net investment income | | | | | | | | | | | | | | | | | | (15,493) | | | | | | (16,000) |
| Distributions to shareholders from net realized gain | | | | | | | | | | | | | | | | | | | | — | | | | | | (110) |
| Total distributions | | | | | | | | | | | | | | | | | | | | (15,493) | | | | | | (16,110) |
| Share transactions — net increase (decrease) | | | | | | | | | | | | | | | | | | | | (68,604) | | | | (128,690) |
| Total increase (decrease) in net assets | | | | | | | | | | | | | | | | | | | | (68,624) | | | | (129,046) |
| |
| Net Assets | | | | | | | | | | | | | | | | | | | | | | | | | | |
| Beginning of period | | | | | | | | | | | | | | | | | | 1,103,829 | | | | 1,232,875 |
| End of period (including distributions in excess of net investment income of $6 and distributions in excess of net | | | | | | | | | | | | |
| investment income of $6, respectively) | | | | | | | | | | | | | | | | $ | | 1,035,205 | | $ | | 1,103,829 |
| |
| Financial Highlights Class I | | | | | | | | | | | | | | | | | | | | | | | | | | |
| | | Six months ended | | | | | | | | | | | | | | | | | | | | | | |
| | | September 30, 2005 | | | | Years ended March 31, |
| | | (Unaudited) | | | | 2005 | | 2004 | | | | 2003 | | | | 2002 | | | | | | 2001 |
| Selected Per-Share Data | | | | | | | | | | | | | | | | | | | | | | | | | | |
| Net asset value, beginning of period | | $ | | 1.00 | | $ | | 1.00 | | $ | | 1.00 | | $ | | 1.00 | | $ | | 1.00 | | | | $ | | 1.00 |
| Income from Investment Operations | | | | | | | | | | | | | | | | | | | | | | | | | | |
| Net investment income | | | | 014 | | | | .014 | | | | .009 | | | | .015 | | | | .031 | | | | | | .059 |
| Net realized and unrealized gain (loss)E | | | | — | | | | — | | | | — | | | | — | | | | — | | | | | | — |
| Total from investment operations | | | | 014 | | | | .014 | | | | .009 | | | | .015 | | | | .031 | | | | | | .059 |
| Distributions from net investment income | | | | (.014) | | | | (.014) | | | | (.009) | | | | (.015) | | | | (.031) | | | | | | (.059) |
| Distributions from net realized gain | | | | — | | | | —E | | | | — | | | | — | | | | — | | | | | | — |
| Total distributions | | | | (.014) | | | | (.014) | | | | (.009) | | | | (.015) | | | | (.031) | | | | | | (.059) |
| Net asset value, end of period | | $ | | 1.00 | | $ | | 1.00 | | $ | | 1.00 | | $ | | 1.00 | | $ | | 1.00 | | | | $ | | 1.00 |
| Total ReturnB,C | | | | 1.41% | | | | 1.45% | | | | .89% | | | | 1.50% | | | | 3.14% | | | | | | 6.03% |
| Ratios to Average Net AssetsD | | | | | | | | | | | | | | | | | | | | | | | | | | |
| Expenses before expense reductions | | | | 24%A | | | | .24% | | | | .24% | | | | .24% | | | | .24% | | | | | | .25% |
| Expenses net of voluntary waivers, if any | | | | 20%A | | | | .20% | | | | .20% | | | | .20% | | | | .20% | | | | | | .20% |
| Expenses net of all reductions | | | | 20%A | | | | .20% | | | | .20% | | | | .20% | | | | .20% | | | | | | .20% |
| Net investment income | | | | 2.80%A | | | | 1.43% | | | | .89% | | | | 1.48% | | | | 3.00% | | | | | | 5.87% |
| Supplemental Data | | | | | | | | | | | | | | | | | | | | | | | | | | |
| Net assets, end of period (in millions) | | $ | | 757 | | $ | | 835 | | $ | | 982 | | $ | | 1,175 | | $ | | 1,199 | | | | $ | | 1,054 |
A Annualized
B Total returns for periods of less than one year are not annualized.
C Total returns would have been lower had certain expenses not been reduced during the periods shown.
D Expense ratios reflect operating expenses of the class. Expenses before reductions do not reflect amounts reimbursed by the investment adviser or reductions from brokerage service arrangements or other expense offset arrangements and do not represent
the amount paid by the class during periods when reimbursements or reductions occur. Expenses net of any voluntary waivers reflect expenses after reimbursement by the investment adviser but prior to reductions from brokerage service arrangements or
other expense offset arrangements. Expenses net of all reductions represent the net expenses paid by the class.
E Amount represents less than $.001 per share.
|
See accompanying notes which are an integral part of the financial statements.
|
9 Semiannual Report
| Financial Highlights Class II | | | | | | | | | | | | | | | | | | | | |
| | | Six months ended | | | | | | | | | | | | | | | | |
| | | September 30, 2005 | | Years ended March 31, |
| | | (Unaudited) | | | | 2005 | | 2004 | | | | 2003 | | | | 2002 | | 2001 |
| Selected Per Share Data | | | | | | | | | | | | | | | | | | | | |
| Net asset value, beginning of period | | $ | | 1.00 | | $ | | 1.00 | | $ 1.00 | | $ | | 1.00 | | $ | | 1.00 | | $ 1.00 |
| Income from Investment Operations | | | | | | | | | | | | | | | | | | | | |
| Net investment income | | | | 013 | | | | .013 | | .007 | | | | .013 | | | | .029 | | .057 |
| Net realized and unrealized gain (loss)E | | | | — | | | | — | | — | | | | — | | | | — | | — |
| Total from investment operations | | | | 013 | | | | .013 | | .007 | | | | .013 | | | | .029 | | .057 |
| Distributions from net investment income | | | | (.013) | | | | (.013) | | (.007) | | | | (.013) | | | | (.029) | | (.057) |
| Distributions from net realized gain | | | | — | | | | —E | | — | | | | — | | | | — | | — |
| Total distributions | | | | (.013) | | | | (.013) | | (.007) | | | | (.013) | | | | (.029) | | (.057) |
| Net asset value, end of period | | $ | | 1.00 | | $ | | 1.00 | | $ 1.00 | | $ | | 1.00 | | $ | | 1.00 | | $ 1.00 |
| Total ReturnB,C | | | | 1.33% | | | | 1.30% | | .74% | | | | 1.34% | | | | 2.98% | | 5.88% |
| Ratios to Average Net AssetsD | | | | | | | | | | | | | | | | | | | | |
| Expenses before expense reductions | | | | 39%A | | | | .39% | | .39% | | | | .39% | | | | .39% | | .40% |
| Expenses net of voluntary waivers, if any | | | | 35%A | | | | .35% | | .35% | | | | .35% | | | | .35% | | .35% |
| Expenses net of all reductions | | | | 35%A | | | | .35% | | .35% | | | | .35% | | | | .35% | | .35% |
| Net investment income | | | | 2.65%A | | | | 1.28% | | .74% | | | | 1.33% | | | | 2.82% | | 5.72% |
| Supplemental Data | | | | | | | | | | | | | | | | | | | | |
| Net assets, end of period (in millions) | | $ | | 112 | | $ | | 121 | | $ 119 | | $ | | 225 | | $ | | 187 | | $ 120 |
A Annualized
B Total returns for periods of less than one year are not annualized.
C Total returns would have been lower had certain expenses not been reduced during the periods shown.
D Expense ratios reflect operating expenses of the class. Expenses before reductions do not reflect amounts reimbursed by the investment adviser or reductions from brokerage service arrangements or other expense offset arrangements and do not
represent the amount paid by the class during periods when reimbursements or reductions occur. Expenses net of any voluntary waivers reflect expenses after reimbursement by the investment adviser but prior to reductions from brokerage service
arrangements or other expense offset arrangements. Expenses net of all reductions represent the net expenses paid by the class.
E Amount represents less than $.001 per share.
|
| Financial Highlights Class III | | | | | | | | | | | | | | | | | | | | |
| | | Six months ended | | | | | | | | | | | | | | | | |
| | | September 30, 2005 | | | | | | | | Years ended March 31, | | | | |
| | | (Unaudited) | | | | 2005 | | 2004 | | | | 2003 | | | | 2002 | | 2001 |
| Selected Per Share Data | | | | | | | | | | | | | | | | | | | | |
| Net asset value, beginning of period | | $ | | 1.00 | | $ | | 1.00 | | $ 1.00 | | $ | | 1.00 | | $ | | 1.00 | | $ 1.00 |
| Income from Investment Operations | | | | | | | | | | | | | | | | | | | | |
| Net investment income | | | | 013 | | | | .012 | | .006 | | | | .012 | | | | .028 | | .056 |
| Net realized and unrealized gain (loss)E | | | | — | | | | — | | — | | | | — | | | | — | | — |
| Total from investment operations | | | | 013 | | | | .012 | | .006 | | | | .012 | | | | .028 | | .056 |
| Distributions from net investment income | | | | (.013) | | | | (.012) | | (.006) | | | | (.012) | | | | (.028) | | (.056) |
| Distributions from net realized gain | | | | — | | | | —E | | — | | | | — | | | | — | | — |
| Total distributions | | | | (.013) | | | | (.012) | | (.006) | | | | (.012) | | | | (.028) | | (.056) |
| Net asset value, end of period | | $ | | 1.00 | | $ | | 1.00 | | $ 1.00 | | $ | | 1.00 | | $ | | 1.00 | | $ 1.00 |
| Total ReturnB,C | | | | 1.28% | | | | 1.20% | | .64% | | | | 1.25% | | | | 2.88% | | 5.77% |
| Ratios to Average Net AssetsD | | | | | | | | | | | | | | | | | | | | |
| Expenses before expense reductions | | | | 49%A | | | | .49% | | .49% | | | | .49% | | | | .49% | | .50% |
| Expenses net of voluntary waivers, if any | | | | 45%A | | | | .45% | | .45% | | | | .45% | | | | .45% | | .45% |
| Expenses net of all reductions | | | | 45%A | | | | .45% | | .45% | | | | .45% | | | | .45% | | .45% |
| Net investment income | | | | 2.55%A | | | | 1.18% | | .64% | | | | 1.23% | | | | 2.72% | | 5.62% |
| Supplemental Data | | | | | | | | | | | | | | | | | | | | |
| Net assets, end of period (in millions) | | $ | | 145 | | $ | | 135 | | $ 126 | | $ | | 134 | | $ | | 234 | | $ 180 |
A Annualized
B Total returns for periods of less than one year are not annualized.
C Total returns would have been lower had certain expenses not been reduced during the periods shown.
D Expense ratios reflect operating expenses of the class. Expenses before reductions do not reflect amounts reimbursed by the investment adviser or reductions from brokerage service arrangements or other expense offset arrangements and do not
represent the amount paid by the class during periods when reimbursements or reductions occur. Expenses net of any voluntary waivers reflect expenses after reimbursement by the investment adviser but prior to reductions from brokerage service
arrangements or other expense offset arrangements. Expenses net of all reductions represent the net expenses paid by the class.
E Amount represents less than $.001 per share.
|
| See accompanying notes which are an integral part of the financial statements. | | |
| Semiannual Report | | 10 |
| Financial Highlights Select Class | | | | | | | | | | | | |
| | Six months ended | | | | | | | | | | | | |
| | | September 30, 2005 | | | | Years ended March 31, | | |
| | | (Unaudited) | | 2005 | | 2004 | | 2003 | | 2002D |
| Selected Per Share Data | | | | | | | | | | | | |
| Net asset value, beginning of period | | $ 1.00 | | $ 1.00 | | $ 1.00 | | $ 1.00 | | $ 1.00 |
| Income from Investment Operations | | | | | | | | | | |
| Net investment income | | 014 | | .014 | | .008 | | .014 | | .004 |
| Net realized and unrealized gain (loss)F | | — | | — | | — | | — | | — |
| Total from investment operations | | 014 | | .014 | | .008 | | .014 | | .004 |
| Distributions from net investment income | | (.014) | | (.014) | | (.008) | | (.014) | | (.004) |
| Distributions from net realized gain | | — | | —F | | — | | — | | — |
| Total distributions | | (.014) | | (.014) | | (.008) | | (.014) | | (.004) |
| Net asset value, end of period | | $ 1.00 | | $ 1.00 | | $ 1.00 | | $ 1.00 | | $ 1.00 |
| Total ReturnB,C | | 1.38% | | 1.40% | | .84% | | 1.45% | | .36% |
| Ratios to Average Net AssetsE | | | | | | | | | | |
| Expenses before expense reductions | | 28%A | | .29% | | .28% | | .29% | | .28%A |
| Expenses net of voluntary waivers, if any | | 25%A | | .25% | | .25% | | .25% | | .25%A |
| Expenses net of all reductions | | 25%A | | .25% | | .25% | | .25% | | .25%A |
| Net investment income | | 2.75%A | | 1.38% | | .84% | | 1.43% | | 1.78%A |
| Supplemental Data | | | | | | | | | | |
| Net assets, end of period (000 omitted) | | $ 19,866 | | $ 11,661 | | $ 6,090 | | $ 14,598 | | $ 100 |
A Annualized
B Total returns for periods of less than one year are not annualized.
C Total returns would have been lower had certain expenses not been reduced during the periods shown.
D For the period January 17, 2002 (commencement of sale of shares) to March 31, 2002.
E Expense ratios reflect operating expenses of the class. Expenses before reductions do not reflect amounts reimbursed by the investment adviser or reductions from brokerage service arrangements or other expense offset arrangements and do not
represent the amount paid by the class during periods when reimbursements or reductions occur. Expense ratios before reductions for start up periods may not be representative of longer term operating periods. Expenses net of any voluntary
waivers reflect expenses after reimbursement by the investment adviser but prior to reductions from brokerage service arrangements or other expense offset arrangements. Expenses net of all reductions represent the net expenses paid by the class.
F Amount represents less than $.001 per share.
|
See accompanying notes which are an integral part of the financial statements.
|
11 Semiannual Report
| | Treasury Portfolio
Investment Changes
|
| Maturity Diversification | | | | | | | | |
| Days | | % of fund’s | | % of fund’s | | % of fund’s |
| | | investments | | investments | | investments |
| | | 9/30/05 | | 3/31/05 | | 9/30/04 |
| 0 - 30 | | 96.1 | | 88.8 | | 69.0 |
| 31 - 90 | | 0.0 | | 7.8 | | 20.3 |
| 91 - 180 | | 3.9 | | 3.4 | | 7.2 |
| 181 - 397 | | 0.0 | | 0.0 | | 3.5 |
| Weighted Average Maturity | | | | | | | | |
| | | 9/30/05 | | 3/31/05 | | 9/30/04 |
| Treasury Portfolio | | 9 Days | | 12 Days | | 27 Days |
| All Taxable Money Market Funds Average* | | 38 Days | | 38 Days | | 43 Days |
*Source: iMoneyNet, Inc.
Semiannual Report 12
Treasury Portfolio
Investments September 30, 2005 (Unaudited)
Showing Percentage of Net Assets
|
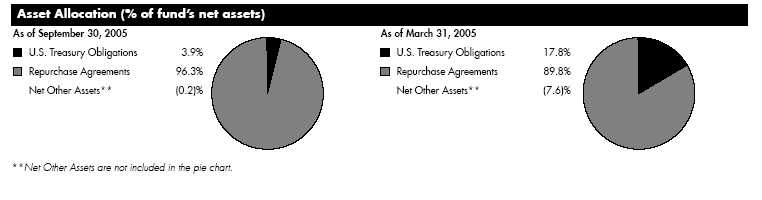
| U.S. Treasury Obligations 3.9% | | |
| Due | | Annualized Yield at | | | | Principal | | Value (Note 1) |
| Date | | Time of Purchase | | | | Amount (000s) | | (000s) |
| U.S. Treasury Bills – 3.9% | | | | | | |
| 3/9/06 | | 3.58% | | | | $ 245,000 | | $ 241,196 |
| 3/9/06 | | 3.64 | | | | 95,000 | | 93,502 |
| TOTAL U.S. TREASURY OBLIGATIONS | | 334,698 |
| |
| Repurchase Agreements 96.3% | | |
| | | | | | | Maturity | | |
| | | | | | | Amount (000s) | | |
| In a joint trading account | | | | | | |
| (Collateralized by U.S. Treasury | | | | | | |
| Obligations) dated 9/30/05 due | | | | | | |
| 10/3/05 At: | | | | | | | | |
| 3.27% (a) | | | | $ 325,088 | | 325,000 |
| 3.27% (a) | | | | | | 383,794 | | 383,689 |
| 3.29% (a) | | | | | | 6,947,233 | | 6,945,327 |
| With UBS Warburg LLC At: | | | | | | |
| 3.67%, dated 9/21/05 due | | | | | | |
| 10/5/05 (Collateralized by U.S. | | | | | | |
| Treasury Obligations valued at | | | | | | |
| $417,751,175, 3.63% 4%, | | | | | | |
| 9/30/07 – 4/15/28) | | | | 405,578 | | 405,000 |
| 3.68%, dated 9/21/05 due | | | | | | |
| 10/5/05 (Collateralized by U.S. | | | | | | |
| Treasury Obligations valued at | | | | | | |
| $206,503,609, 3.63% 4%, | | | | | | |
| 9/30/07 – 4/15/28) | | | | 200,286 | | 200,000 |
| TOTAL REPURCHASE AGREEMENTS | | 8,259,016 |
| |
| TOTAL INVESTMENT PORTFOLIO 100.2% | | |
| (Cost $8,593,714) | | | | | | 8,593,714 |
| |
| NET OTHER ASSETS (0.2)% | | | | | | (16,769) |
| NET ASSETS 100% | | | | | | $ 8,576,945 |
Legend
(a) Additional information on each counterparty to the repurchase agreement is as follows:
| Repurchase Agreement/ | | | | Value |
| Counterparty | | | | (000s) |
| $325,000,000 due 10/3/05 at 3.27% | | | | |
| Barclays Capital Inc. | | | | 60,000 |
| BNP Paribas Securities Corp. | | | | 105,000 |
| Morgan Stanley & Co. Incorporated. | | | | 160,000 |
| | | | $ | 325,000 |
| |
| $383,689,000 due 10/3/05 at 3.27% | | | | |
| Banc of America Securities LLC. | | | $ | 53,523 |
| Barclays Capital Inc. | | | | 124,173 |
| BNP Paribas Securities Corp. | | | | 141,299 |
| State Street Bank and Trust Company | | | | 64,694 |
| | | | $ | 383,689 |
| Repurchase Agreement/ | | | | Value |
| Counterparty | | | | (000s) |
| $6,945,327,000 due 10/3/05 at 3.29% | | | | |
| ABN AMRO Bank, N.V. - New York Branch | | | $ | 398,087 |
| Barclays Capital Inc. | | | | 517,513 |
| Bear Stearns & Co. Inc. | | | | 1,472,921 |
| BNP Paribas Securities Corp. | | | | 796,174 |
| Credit Suisse First Boston LLC | | | | 597,130 |
| Deutsche Bank Securities Inc. | | | | 318,469 |
| Merrill Lynch Government Securities, Inc. | | | | 398,087 |
| Morgan Stanley & Co. Incorporated. | | | | 1,451,729 |
| UBS Securities LLC | | | | 995,217 |
| | | | $ | 6,945,327 |
Income Tax Information
At March 31, 2005, the fund had a capital loss carryforward of approximately $482,000 of which $32,000, $191,000 and $259,000 will expire on March 31, 2010, 2011 and 2013, respectively.
See accompanying notes which are an integral part of the financial statements.
13 Semiannual Report
| Treasury Portfolio | | | | | | | | | | |
| |
| Financial Statements | | | | | | | | |
| |
| |
| Statement of Assets and Liabilities | | | | | | |
| Amounts in thousands (except per share amounts) | | | | September 30, 2005 |
| | | | | | | | | | | (Unaudited) |
| Assets | | | | | | | | | | |
| Investment in securities, at value | | | | | | | | | | |
| (including repurchase agreements | | | | | | | | |
| of $8,259,016) (cost $8,593,714) | | | | | | | | |
| — See accompanying schedule | | | | | | | | $ | | 8,593,714 |
| Receivable for fund shares sold | | | | | | | | | | 105 |
| Interest receivable | | | | | | | | | | 1,317 |
| Prepaid expenses | | | | | | | | | | 5 |
| Receivable from investment adviser | | | | | | | | | | |
| for expense reductions | | | | | | | | | | 250 |
| Total assets | | | | | | | | | | 8,595,391 |
| |
| Liabilities | | | | | | | | | | |
| Payable for fund shares redeemed | | $ | | | | 178 | | | | |
| Distributions payable | | | | | | 15,858 | | | | | | |
| Accrued management fee | | | | 1,459 | | | | |
| Distribution fees payable | | | | | | 705 | | | | |
| Other affiliated payables | | | | | | 206 | | | | |
| Other payables and accrued | | | | | | | | | | |
| expenses | | | | | | 40 | | | | |
| Total liabilities | | | | | | | | | | 18,446 |
| |
| Net Assets | | | | | | | | $ | | 8,576,945 |
| Net Assets consist of: | | | | | | | | | | |
| Paid in capital | | | | | | | | $ | | 8,577,562 |
| Undistributed net investment income | | | | | | | | | | 65 |
| Accumulated undistributed net real- | | | | | | | | | | |
| ized gain (loss) on investments | | | | | | | | | | (682) |
| Net Assets | | | | | | | | $ | | 8,576,945 |
| Calculation of Maximum Offering | | | | | | | | | | |
| Price | | | | | | | | | | |
| Class I: | | | | | | | | | | |
| Net Asset Value, offering price | | | | | | | | | | |
| and redemption price | | | | | | | | | | |
| per share ($4,641,688 ÷ | | | | | | | | | | |
| 4,641,389 shares) | | | | | | | | $ | | 1.00 |
| Class II: | | | | | | | | | | |
| Net Asset Value, offering price | | | | | | | | | | |
| and redemption price | | | | | | | | | | |
| per share ($153,018 ÷ | | | | | | | | | | |
| 152,904 shares) | | | | | | | | $ | | 1.00 |
| Class III: | | | | | | | | | | |
| Net Asset Value, offering | | | | | | | | | | |
| price and redemption price | | | | | | | | | | |
| per share ($3,527,130 ÷ | | | | | | | | | | |
| 3,527,700 shares) | | | | | | | | $ | | 1.00 |
| Select Class: | | | | | | | | | | |
| Net Asset Value, offering price | | | | | | | | | | |
| and redemption price per share | | | | | | | | | | |
| ($255,109 ÷ 255,114 shares) | | . | | | | | | $ | | 1.00 |
| Statement of Operations | | | | | | |
| Amounts in thousands | | Six months ended September 30, 2005 |
| | | | | | | (Unaudited) |
| Investment Income | | | | | | |
| Interest | | | | $ | | 130,770 |
| |
| Expenses | | | | | | |
| Management fee | | $ | | 8,155 | | |
| Transfer agent fees | | | | 658 | | |
| Distribution fees | | | | 4,153 | | |
| Accounting fees and expenses | | | | 357 | | |
| Independent trustees’ compensation | | | | 18 | | |
| Custodian fees and expenses | | | | 3 | | |
| Registration fees | | | | 56 | | |
| Audit | | | | 39 | | |
| Legal | | | | 10 | | |
| Miscellaneous | | | | 46 | | |
| Total expenses before reductions | | | | 13,495 | | |
| Expense reductions | | | | (1,158) | | 12,337 |
| |
| Net investment income | | | | | | 118,433 |
| |
| Net realized gain (loss) on invest- | | | | | | |
| ment securities | | | | | | (26) |
| Net increase in net assets resulting | | | | | | |
| from operations | | | | $ | | 118,407 |
| See accompanying notes which are an integral part of the financial statements. | | |
| Semiannual Report | | 14 |
| Statement of Changes in Net Assets | | | | | | | | | | | | | | | | | | | | | | | | |
| | | | | | | | | | | | | | | Six months ended | | | | Year ended |
| | | | | | | | | | | | | | | September 30, 2005 | | | | March 31, |
| Amounts in thousands | | | | | | | | | | | | | | | | (Unaudited) | | | | 2005 |
| Increase (Decrease) in Net Assets | | | | | | | | | | | | | | | | | | | | | | | | |
| Operations | | | | | | | | | | | | | | | | | | | | | | | | |
| Net investment income | | | | | | | | | | | | | | $ | | | | 118,433 | | $ | | 116,441 |
| Net realized gain (loss) | | | | | | | | | | | | | | | | | | (26) | | | | | | (433) |
| Net increase in net assets resulting from operations | | | | | | | | | | | | | | | | 118,407 | | | | 116,008 |
| Distributions to shareholders from net investment income | | | | | | | | | | | | | | (118,418) | | | | (116,452) |
| Share transactions - net increase (decrease) | | | | | | | | | | | | | | | | (472,827) | | | | | | 18,644 |
| Total increase (decrease) in net assets | | | | | | | | | | | | | | | | (472,838) | | | | | | 18,200 |
| |
| Net Assets | | | | | | | | | | | | | | | | | | | | | | | | |
| Beginning of period | | | | | | | | | | | | | | | | 9,049,783 | | | | 9,031,583 |
| End of period (including undistributed net investment income of $65 and undistributed net investment income of | | | | | | | | | | | | |
| $50, respectively) | | | | | | | | | | | | | | $ | | 8,576,945 | | $ | | 9,049,783 |
| |
| Financial Highlights Class I | | | | | | | | | | | | | | | | | | | | | | | | |
| | | Six months ended | | | | | | | | | | | | | | | | | | | | |
| | | September 30, 2005 | | | | | | | | Years ended March 31, | | | | | | |
| | | (Unaudited) | | | | 2005 | | 2004 | | | | 2003 | | | | 2002 | | | | | | 2001 |
| Selected Per Share Data | | | | | | | | | | | | | | | | | | | | | | | | |
| Net asset value, beginning of period | | $ | | 1.00 | | $ | | 1.00 | | $ 1.00 | | $ | | 1.00 | | $ | | 1.00 | | | | $ | | 1.00 |
| Income from Investment Operations | | | | | | | | | | | | | | | | | | | | | | | | |
| Net investment income | | | | 015 | | | | .015 | | .009 | | | | .015 | | | | .030 | | | | | | .061 |
| Distributions from net investment income | | | | (.015) | | | | (.015) | | (.009) | | | | (.015) | | | | (.030) | | | | | | (.061) |
| Net asset value, end of period | | $ | | 1.00 | | $ | | 1.00 | | $ 1.00 | | $ | | 1.00 | | $ | | 1.00 | | | | $ | | 1.00 |
| Total ReturnB,C | | | | 1.51% | | | | 1.50% | | .91% | | | | 1.47% | | | | 3.00% | | | | | | 6.22% |
| Ratios to Average Net AssetsD | | | | | | | | | | | | | | | | | | | | | | | | |
| Expenses before expense reductions | | | | 23%A | | | | .23% | | .23% | | | | .23% | | | | .23% | | | | | | .24% |
| Expenses net of voluntary waivers, if any | | | | 20%A | | | | .20% | | .20% | | | | .20% | | | | .20% | | | | | | .20% |
| Expenses net of all reductions | | | | 20%A | | | | .20% | | .20% | | | | .20% | | | | .20% | | | | | | .20% |
| Net investment income | | | | 3.00%A | | | | 1.48% | | .90% | | | | 1.46% | | | | 2.93% | | | | | | 6.03% |
| Supplemental Data | | | | | | | | | | | | | | | | | | | | | | | | |
| Net assets, end of period (in millions) | | $ | | 4,642 | | $ | | 5,348 | | $ 4,567 | | $ | | 5,082 | | $ | | 4,400 | | | | $ | | 5,152 |
A Annualized
B Total returns for periods of less than one year are not annualized.
C Total returns would have been lower had certain expenses not been reduced during the periods shown.
D Expense ratios reflect operating expenses of the class. Expenses before reductions do not reflect amounts reimbursed by the investment adviser or reductions from brokerage service arrangements or other expense offset arrangements and do not represent
the amount paid by the class during periods when reimbursements or reductions occur. Expenses net of any voluntary waivers reflect expenses after reimbursement by the investment adviser but prior to reductions from brokerage service arrangements or
other expense offset arrangements. Expenses net of all reductions represent the net expenses paid by the class.
|
See accompanying notes which are an integral part of the financial statements.
|
15 Semiannual Report
| Financial Highlights Class II | | | | | | | | | | | | | | | | |
| | | Six months ended | | | | | | | | | | | | |
| | | September 30, 2005 | | | | Years ended March 31, |
| | | (Unaudited) | | | | 2005 | | 2004 | | 2003 | | 2002 | | 2001 |
| Selected Per Share Data | | | | | | | | | | | | | | | | |
| Net asset value, beginning of period | | $ 1.00 | | | | $ 1.00 | | $ 1.00 | | $ 1.00 | | $ 1.00 | | $ 1.00 |
| Income from Investment Operations | | | | | | | | | | | | | | |
| Net investment income | | 014 | | | | .013 | | .008 | | .013 | | .028 | | .059 |
| Distributions from net investment income | | (.014) | | | | (.013) | | (.008) | | (.013) | | (.028) | | (.059) |
| Net asset value, end of period | | $ 1.00 | | | | $ 1.00 | | $ 1.00 | | $ 1.00 | | $ 1.00 | | $ 1.00 |
| Total ReturnB,C | | 1.43% | | | | 1.35% | | .76% | | 1.32% | | 2.85% | | 6.07% |
| Ratios to Average Net AssetsD | | | | | | | | | | | | | | | | |
| Expenses before expense reductions | | 38%A | | | | .38% | | .38% | | .38% | | .38% | | .39% |
| Expenses net of voluntary waivers, if any | | 35%A | | | | .35% | | .35% | | .35% | | .35% | | .35% |
| Expenses net of all reductions | | 35%A | | | | .35% | | .35% | | .35% | | .35% | | .35% |
| Net investment income | | 2.85%A | | | | 1.33% | | .75% | | 1.31% | | 2.73% | | 5.90% |
| Supplemental Data | | | | | | | | | | | | | | | | |
| Net assets, end of period (in millions) | | $ 153 | | | | $ 180 | | $ 231 | | $ 274 | | $ 370 | | $ 319 |
A Annualized
B Total returns for periods of less than one year are not annualized.
C Total returns would have been lower had certain expenses not been reduced during the periods shown.
D Expense ratios reflect operating expenses of the class. Expenses before reductions do not reflect amounts reimbursed by the investment adviser or reductions from brokerage service arrangements or other expense offset arrangements and do not
represent the amount paid by the class during periods when reimbursements or reductions occur. Expenses net of any voluntary waivers reflect expenses after reimbursement by the investment adviser but prior to reductions from brokerage service
arrangements or other expense offset arrangements. Expenses net of all reductions represent the net expenses paid by the class.
|
| Financial Highlights Class III | | | | | | | | | | | | | | | | | | | | |
| | | Six months ended | | | | | | | | | | | | | | | | |
| | | September 30, 2005 | | | | | | | | Years ended March 31, | | | | |
| | | (Unaudited) | | | | 2005 | | 2004 | | | | 2003 | | | | 2002 | | 2001 |
| Selected Per Share Data | | | | | | | | | | | | | | | | | | | | |
| Net asset value, beginning of period | | $ 1.00 | | | | $ 1.00 | | $ 1.00 | | | | $ 1.00 | | | | $ 1.00 | | $ 1.00 |
| Income from Investment Operations | | | | | | | | | | | | | | | | | | | | |
| Net investment income | | | | 014 | | | | .012 | | .007 | | | | .012 | | | | .027 | | .058 |
| Distributions from net investment income | | | | (.014) | | | | (.012) | | (.007) | | | | (.012) | | | | (.027) | | (.058) |
| Net asset value, end of period | | $ 1.00 | | | | $ 1.00 | | $ 1.00 | | | | $ 1.00 | | | | $ 1.00 | | $ 1.00 |
| Total ReturnB,C | | | | 1.38% | | | | 1.25% | | .66% | | | | 1.22% | | | | 2.74% | | 5.96% |
| Ratios to Average Net AssetsD | | | | | | | | | | | | | | | | | | | | |
| Expenses before expense reductions | | | | 48%A | | | | .48% | | .48% | | | | .48% | | | | .48% | | .49% |
| Expenses net of voluntary waivers, if any | | | | 45%A | | | | .45% | | .45% | | | | .45% | | | | .45% | | .45% |
| Expenses net of all reductions | | | | 45%A | | | | .45% | | .45% | | | | .45% | | | | .45% | | .45% |
| Net investment income | | | | 2.75%A | | | | 1.23% | | .65% | | | | 1.21% | | | | 2.65% | | 5.79% |
| Supplemental Data | | | | | | | | | | | | | | | | | | | | |
| Net assets, end of period (in millions) | | $ 3,527 | | | | $ 3,439 | | $ 4,132 | | | | $ 3,938 | | | | $ 4,520 | | $ 3,776 |
A Annualized
B Total returns for periods of less than one year are not annualized.
C Total returns would have been lower had certain expenses not been reduced during the periods shown.
D Expense ratios reflect operating expenses of the class. Expenses before reductions do not reflect amounts reimbursed by the investment adviser or reductions from brokerage service arrangements or other expense offset arrangements and do not
represent the amount paid by the class during periods when reimbursements or reductions occur. Expenses net of any voluntary waivers reflect expenses after reimbursement by the investment adviser but prior to reductions from brokerage service
arrangements or other expense offset arrangements. Expenses net of all reductions represent the net expenses paid by the class.
|
| See accompanying notes which are an integral part of the financial statements. | | |
| Semiannual Report | | 16 |
| Financial Highlights Select Class | | | | | | | | | | | | |
| | Six months ended | | | | | | | | | | | | |
| | | September 30, 2005 | | Years ended March 31, |
| | | (Unaudited) | | 2005 | | 2004 | | 2003 | | 2002D |
| Selected Per Share Data | | | | | | | | | | | | |
| Net asset value, beginning of period | | $ 1.00 | | $ 1.00 | | $ 1.00 | | $ 1.00 | | $ 1.00 |
| Income from Investment Operations | | | | | | | | | | | | |
| Net investment income | | 015 | | .014 | | .009 | | .014 | | .003 |
| Distributions from net investment income | | (.015) | | (.014) | | (.009) | | (.014) | | (.003) |
| Net asset value, end of period | | $ 1.00 | | $ 1.00 | | $ 1.00 | | $ 1.00 | | $ 1.00 |
| Total ReturnB,C | | 1.48% | | 1.45% | | .86% | | 1.42% | | .34% |
| Ratios to Average Net AssetsE | | | | | | | | | | | | |
| Expenses before expense reductions | | 28%A | | .29% | | .28% | | .28% | | .27%A |
| Expenses net of voluntary waivers, if any | | 25%A | | .25% | | .25% | | .25% | | .25%A |
| Expenses net of all reductions | | 25%A | | .25% | | .25% | | .25% | | .25%A |
| Net investment income | | 2.95%A | | 1.43% | | .85% | | 1.40% | | 1.72%A |
| Supplemental Data | | | | | | | | | | | | |
| Net assets, end of period (000 omitted) | | $ 255,109 | | $ 82,134 | | $ 101,421 | | $ 2,223 | | $ 100 |
A Annualized
B Total returns for periods of less than one year are not annualized.
C Total returns would have been lower had certain expenses not been reduced during the periods shown.
D For the period January 17, 2002 (commencement of sale of shares) to March 31, 2002.
E Expense ratios reflect operating expenses of the class. Expenses before reductions do not reflect amounts reimbursed by the investment adviser or reductions from brokerage service arrangements or other expense offset arrangements and do not
represent the amount paid by the class during periods when reimbursements or reductions occur. Expense ratios before reductions for start up periods may not be representative of longer term operating periods. Expenses net of any voluntary
waivers reflect expenses after reimbursement by the investment adviser but prior to reductions from brokerage service arrangements or other expense offset arrangements. Expenses net of all reductions represent the net expenses paid by the class.
|
See accompanying notes which are an integral part of the financial statements.
|
17 Semiannual Report
| | Government Portfolio
Investment Changes
|
| Maturity Diversification | | | | | | |
| Days | | % of fund’s | | % of fund’s | | % of fund’s |
| | | investments | | investments | | investments |
| | | 9/30/05 | | 3/31/05 | | 9/30/04 |
| 0 - 30 | | 67.2 | | 66.0 | | 66.9 |
| 31 - 90 | | 27.2 | | 20.1 | | 17.7 |
| 91 - 180 | | 3.4 | | 12.9 | | 13.0 |
| 181 - 397 | | 2.2 | | 1.0 | | 2.4 |
| Weighted Average Maturity | | | | | | |
| | | 9/30/05 | | 3/31/05 | | 9/30/04 |
| Government Portfolio | | 33 Days | | 36 Days | | 40 Days |
| All Taxable Money Market Funds Average* | | 38 Days | | 38 Days | | 43 Days |
*Source: iMoneyNet, Inc.
Semiannual Report 18
Government Portfolio
Investments September 30, 2005 (Unaudited)
Showing Percentage of Net Assets
|
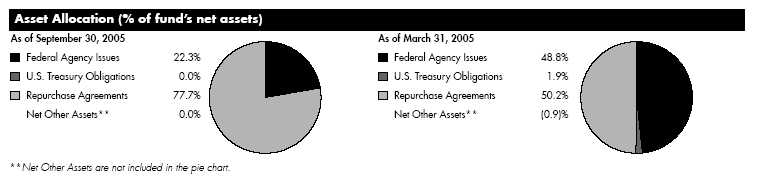
| Federal Agencies 22.3% | | | | | | | | |
| Due | | Annualized Yield at | | | | Principal | | | | Value (Note 1) |
| Date | | Time of Purchase | | | | Amount (000s) | | | | (000s) |
| Fannie Mae – 13.4% | | | | | | | | |
| Agency Coupons – 11.9% | | | | | | | | |
| 10/3/05 | | 3.39% (a) | | | $ | 75,000 | | | $ | 75,000 |
| 11/22/05 | | 3.72 (a) | | | | 150,000 | | | | 149,940 |
| 12/19/05 | | 3.77 (a) | | | | 25,000 | | | | 24,996 |
| 12/21/05 | | 3.80 (a) | | | | 250,000 | | | | 249,830 |
| 12/22/05 | | 3.79 (a) | | | | 405,000 | | | | 404,693 |
| | | | | | | | | | | 904,459 |
| |
| Discount Notes 1.5% | | | | | | | | |
| 3/1/06 | | 3.73 | | | | 69,240 | | | | 68,177 |
| 3/1/06 | | 3.74 | | | | 19,078 | | | | 18,784 |
| 7/28/06 | | 3.86 | | | | 25,855 | | | | 25,051 |
| | | | | | | | | | | 112,012 |
| |
| | | | | | | | | | | 1,016,471 |
| Federal Home Loan Bank 4.8% | | | | | | | | |
| Agency Coupons – 4.8% | | | | | | | | |
| 11/2/05 | | 3.59 (a) | | | | 62,000 | | | | 61,964 |
| 11/10/05 | | 3.65 (a) | | | | 80,000 | | | | 79,969 |
| 12/13/05 | | 3.73 (a) | | | | 225,000 | | | | 224,875 |
| | | | | | | | | | | 366,808 |
| |
| Freddie Mac 4.1% | | | | | | | | |
| Discount Notes 4.1% | | | | | | | | |
| 2/28/06 | | 3.72 | | | | 101,550 | | | | 100,006 |
| 3/7/06 | | 3.78 | | | | 69,000 | | | | 67,884 |
| 7/25/06 | | 4.01 | | | | 72,100 | | | | 69,810 |
| 9/27/06 | | 4.26 | | | | 75,000 | | | | 71,928 |
| | | | | | | | | | | 309,628 |
| |
| TOTAL FEDERAL AGENCIES | | | | | | 1,692,907 |
| Repurchase Agreements 77.7% | | |
| |
| | | Maturity | | Value (Note 1) |
| | | Amount (000s) | | (000s) |
| |
| In a joint trading account | | | | |
| (Collateralized by U.S. Government | | | | |
| Obligations) dated 9/30/05 due | | | | |
| 10/3/05 At: | | | | |
| 3.9% (b) | | $ 331,963 | | 331,855 |
| 3.91% (b) | | 4,458,584 | | 4,457,134 |
| With: | | | | |
| CS First Boston Corp. At 3.7%, dated | | | | |
| 9/7/05 due 11/30/05 | | | | |
| (Collateralized by Mortgage Loan | | | | |
| Obligations valued at | | | | |
| $229,501,492, 4% 7%, 10/1/13 | | | | |
| – 9/1/35) | | 226,943 | | 225,000 |
| Morgan Stanley & Co., Inc. At 3.9%, | | | | |
| dated 9/22/05 due 12/22/05 | | | | |
| (Collateralized by Mortgage Loan | | | | |
| Obligations valued at | | | | |
| $231,386,883, 3.89% 5.23%, | | | | |
| 8/1/33 – 4/1/35) | | 228,228 | | 226,000 |
| UBS Warburg LLC At: | | | | |
| 3.67%, dated 9/6/05 due | | | | |
| 11/30/05 (Collateralized by | | | | |
| Mortgage Loan Obligations | | | | |
| valued at $165,244,029, 5.02% | | | | |
| 5.34%, 9/1/34 5/1/38) | | 163,404 | | 162,000 |
| 3.77%, dated: | | | | |
| 9/20/05 due 10/28/05 | | | | |
| (Collateralized by Mortgage | | | | |
| Loan Obligations valued at | | | | |
| $237,662,836, 4.01% | | | | |
| 5.63%, 2/1/25 9/1/35) | | 233,926 | | 233,000 |
| 9/21/05 due 11/1/05 | | | | |
| (Collateralized by Mortgage | | | | |
| Loan Obligations valued at | | | | |
| $260,101,184, 4.2% 6.05%, | | | | |
| 12/1/08 – 3/1/38) | | 256,093 | | 255,000 |
| |
| TOTAL REPURCHASE AGREEMENTS | | 5,889,989 |
| |
| |
| TOTAL INVESTMENT PORTFOLIO 100.0% | | |
| (Cost $7,582,896) | | | | 7,582,896 |
| |
| |
| NET OTHER ASSETS 0.0% | | | | (1,897) |
| |
| NET ASSETS 100% | | | | $ 7,580,999 |
See accompanying notes which are an integral part of the financial statements.
19 Semiannual Report
Investments (Unaudited) - continued
(a) The coupon rate shown on floating or adjustable rate securities represents
the rate at period end. The due dates on these types of securities reflect
the next interest rate reset date or, when applicable, the final maturity
date.
(b) Additional information on each counterparty to the repurchase agreement
is as follows:
|
| Repurchase Agreement/ | | | | Value |
| Counterparty | | | | (000s) |
| $331,855,000 due 10/3/05 at 3.9% | | | | |
| Banc of America Securities LLC | | | $ | 91,260 |
| Credit Suisse First Boston LLC | | | | 165,928 |
| Morgan Stanley & Co. Incorporated | | | | 74,667 |
| | | | $ | 331,855 |
| $4,457,134,000 due 10/3/05 at 3.91% | | | | |
| Banc of America Securities LLC | | | $ | 312,225 |
| Bank of America, National Association | | | | 624,449 |
| Barclays Capital Inc. | | | | 936,674 |
| Citigroup Global Markets Inc | | | | 156,112 |
| Credit Suisse First Boston LLC | | | | 156,112 |
| Goldman, Sachs & Co. | | | | 780,561 |
| Greenwich Capital Markets, Inc. | | | | 156,112 |
| Morgan Stanley & Co. Incorporated. | | | | 632,383 |
| UBS Securities LLC | | | | 312,225 |
| Wachovia Capital Markets, LLC | | | | 78,056 |
| WestLB AG | | | | 312,225 |
| | | | $ | 4,457,134 |
At March 31, 2005, the fund had a capital loss carryforward of approximately $585,000 of which $86,000, $191,000 and $308,000 will expire on March 31, 2011, 2012 and 2013, respectively.
| See accompanying notes which are an integral part of the financial statements. | | |
| Semiannual Report | | 20 |
Government Portfolio
Financial Statements
|
| Statement of Assets and Liabilities | | | | | | |
| Amounts in thousands (except per share amounts) | | | | September 30, 2005 |
| | | | | | | | | (Unaudited) |
| Assets | | | | | | | | |
| Investment in securities, at value | | | | | | | | |
| (including repurchase agreements | | | | | | | | |
| of $5,889,989) (cost $7,582,896) | | | | | | | | |
| — See accompanying schedule | | | | | | $ | | 7,582,896 |
| Receivable for fund shares sold | | | | | | | | 3,884 |
| Interest receivable | | | | | | | | 5,387 |
| Prepaid expenses | | | | | | | | 4 |
| Receivable from investment adviser | | | | | | | | |
| for expense reductions | | | | | | | | 231 |
| Other affiliated receivables | | | | | | | | 23 |
| Total assets | | | | | | | | 7,592,425 |
| |
| Liabilities | | | | | | | | |
| Payable for fund shares redeemed . $ | | | | 4 | | | | |
| Distributions payable | | | | 9,733 | | | | | | |
| Accrued management fee | | 1,157 | | | | |
| Distribution fees payable | | | | 251 | | | | |
| Other affiliated payables | | | | 247 | | | | |
| Other payables and accrued | | | | | | | | |
| expenses | | | | 34 | | | | |
| Total liabilities | | | | | | | | 11,426 |
| |
| Net Assets | | | | | | $ | | 7,580,999 |
| Net Assets consist of: | | | | | | | | |
| Paid in capital | | | | | | $ | | 7,581,312 |
| Distributions in excess of net invest- | | | | | | | | |
| ment income | | | | | | | | (24) |
| Accumulated undistributed net real- | | | | | | | | |
| ized gain (loss) on investments | | | | | | | | (289) |
| Net Assets | | | | | | $ | | 7,580,999 |
| Calculation of Maximum Offering | | | | | | | | |
| Price | | | | | | | | |
| Class I: | | | | | | | | |
| Net Asset Value, offering price | | | | | | | | |
| and redemption price | | | | | | | | |
| per share ($6,040,557 ÷ | | | | | | | | |
| 6,040,729 shares) | | | | | | $ | | 1.00 |
| Class II: | | | | | | | | |
| Net Asset Value, offering price | | | | | | | | |
| and redemption price | | | | | | | | |
| per share ($426,329 ÷ | | | | | | | | |
| 426,252 shares) | | | | | | $ | | 1.00 |
| Class III: | | | | | | | | |
| Net Asset Value, offering | | | | | | | | |
| price and redemption price | | | | | | | | |
| per share ($1,077,155 ÷ | | | | | | | | |
| 1,077,064 shares) | | | | | | $ | | 1.00 |
| Select Class: | | | | | | | | |
| Net Asset Value, offering price | | | | | | | | |
| and redemption price per share | | | | | | | | |
| ($36,958 ÷ 36,968 shares) | | | | | | $ | | 1.00 |
| Statement of Operations | | | | | | |
| Amounts in thousands | | Six months ended September 30, 2005 |
| | | | | | | (Unaudited) |
| Investment Income | | | | | | |
| Interest | | | | $ | | 110,157 |
| |
| Expenses | | | | | | |
| Management fee | | $ | | 6,761 | | |
| Transfer agent fees | | | | 573 | | |
| Distribution fees | | | | 1,224 | | |
| Accounting fees and expenses | | | | 300 | | |
| Independent trustees’ compensation | | | | 15 | | |
| Appreciation in deferred trustee | | | | | | |
| compensation account | | | | 1 | | |
| Custodian fees and expenses | | | | 17 | | |
| Registration fees | | | | 61 | | |
| Audit | | | | 35 | | |
| Legal | | | | 8 | | |
| Miscellaneous | | | | 33 | | |
| Total expenses before reductions | | | | 9,028 | | |
| Expense reductions | | | | (1,037) | | 7,991 |
| |
| Net investment income | | | | | | 102,166 |
| |
| Net realized gain (loss) on invest- | | | | | | |
| ment securities | | | | | | 52 |
| Net increase in net assets resulting | | | | | | |
| from operations | | | | $ | | 102,218 |
See accompanying notes which are an integral part of the financial statements.
21 Semiannual Report
| Government Portfolio | | | | | | | | | | | | | | | | | | | | | | | | |
| Financial Statements - continued | | | | | | | | | | | | | | | | | | | | | | |
| |
| |
| Statement of Changes in Net Assets | | | | | | | | | | | | | | | | | | | | | | | | |
| | | | | | | | | | | | | | | Six months ended | | | | Year ended |
| | | | | | | | | | | | | | | September 30, 2005 | | | | March 31, |
| Amounts in thousands | | | | | | | | | | | | | | (Unaudited) | | | | 2005 |
| Increase (Decrease) in Net Assets | | | | | | | | | | | | | | | | | | | | | | | | |
| Operations | | | | | | | | | | | | | | | | | | | | | | | | |
| Net investment income | | | | | | | | | | | | | | $ | | | | 102,166 | | | $ | 105,816 |
| Net realized gain (loss) | | | | | | | | | | | | | | | | | | 52 | | | | | | (508) |
| Net increase in net assets resulting from operations | | | | | | | | | | | | | | | | 102,218 | | | | 105,308 |
| Distributions to shareholders from net investment income | | | | | | | | | | | | | | (102,282) | | | | (106,199) |
| Share transactions - net increase (decrease) | | | | | | | | | | | | | | | | | | 871,563 | | | | (1,319,771) |
| Total increase (decrease) in net assets | | | | | | | | | | | | | | | | | | 871,499 | | | | (1,320,662) |
| |
| Net Assets | | | | | | | | | | | | | | | | | | | | | | | | |
| Beginning of period | | | | | | | | | | | | | | | | 6,709,500 | | | | 8,030,162 |
| End of period (including distributions in excess of net investment income of $24 and undistributed net investment | | | | | | | | | | | | |
| income of $92, respectively) | | | | | | | | | | | | | | $ | | 7,580,999 | | | $ | 6,709,500 |
| |
| Financial Highlights Class I | | | | | | | | | | | | | | | | | | | | | | | | |
| | | Six months ended | | | | | | | | | | | | | | | | | | | | |
| | | September 30, 2005 | | | | Years ended March 31, |
| | | (Unaudited) | | | | 2005 | | 2004 | | | | 2003 | | | | 2002 | | | | | | 2001 |
| Selected Per Share Data | | | | | | | | | | | | | | | | | | | | | | | | |
| Net asset value, beginning of period | | $ 1.00 | | | | $ 1.00 | | $ 1.00 | | | | $ 1.00 | | | | $ 1.00 | | | | | | $ 1.00 |
| Income from Investment Operations | | | | | | | | | | | | | | | | | | | | | | | | |
| Net investment income | | 015 | | | | .016 | | .010 | | | | .015 | | | | .031 | | | | | | .062 |
| Distributions from net investment income | | (.015) | | | | (.016) | | (.010) | | | | (.015) | | | | (.031) | | | | | | (.062) |
| Net asset value, end of period | | $ 1.00 | | | | $ 1.00 | | $ 1.00 | | | | $ 1.00 | | | | $ 1.00 | | | | | | $ 1.00 |
| Total ReturnB,C | | 1.54% | | | | 1.58% | | .97% | | | | 1.53% | | | | 3.16% | | | | | | 6.34% |
| Ratios to Average Net AssetsD | | | | | | | | | | | | | | | | | | | | | | | | |
| Expenses before expense reductions | | 23%A | | | | .23% | | .23% | | | | .23% | | | | .23% | | | | | | .26% |
| Expenses net of voluntary waivers, if any | | 20%A | | | | .20% | | .20% | | | | .20% | | | | .20% | | | | | | .20% |
| Expenses net of all reductions | | 20%A | | | | .20% | | .20% | | | | .20% | | | | .20% | | | | | | .20% |
| Net investment income | | 3.05%A | | | | 1.53% | | .98% | | | | 1.52% | | | | 3.06% | | | | | | 6.13% |
| Supplemental Data | | | | | | | | | | | | | | | | | | | | | | | | |
| Net assets, end of period (in millions) | | $ 6,041 | | | | $ 5,590 | | $ 6,024 | | | | $ 7,928 | | | | $ 8,604 | | | | | | $ 9,141 |
A Annualized
B Total returns for periods of less than one year are not annualized.
C Total returns would have been lower had certain expenses not been reduced during the periods shown.
D Expense ratios reflect operating expenses of the class. Expenses before reductions do not reflect amounts reimbursed by the investment adviser or reductions from brokerage service arrangements or other expense offset arrangements and do not represent
the amount paid by the class during periods when reimbursements or reductions occur. Expenses net of any voluntary waivers reflect expenses after reimbursement by the investment adviser but prior to reductions from brokerage service arrangements or
other expense offset arrangements. Expenses net of all reductions represent the net expenses paid by the class.
|
| See accompanying notes which are an integral part of the financial statements. | | |
| Semiannual Report | | 22 |
| Financial Highlights Class II | | | | | | | | | | | | | | | | | | | | |
| | | Six months ended | | | | | | | | | | | | | | | | |
| | | September 30, 2005 | | | | Years ended March 31, |
| | | (Unaudited) | | | | 2005 | | 2004 | | | | 2003 | | | | 2002 | | 2001 |
| Selected Per Share Data | | | | | | | | | | | | | | | | | | | | |
| Net asset value, beginning of period | | $ 1.00 | | | | $ 1.00 | | $ 1.00 | | | | $ 1.00 | | | | $ 1.00 | | $ 1.00 |
| Income from Investment Operations | | | | | | | | | | | | | | | | | | | | |
| Net investment income | | 015 | | | | .014 | | .008 | | | | .014 | | | | .030 | | .060 |
| Distributions from net investment income | | (.015) | | | | (.014) | | (.008) | | | | (.014) | | | | (.030) | | (.060) |
| Net asset value, end of period | | $ 1.00 | | | | $ 1.00 | | $ 1.00 | | | | $ 1.00 | | | | $ 1.00 | | $ 1.00 |
| Total ReturnB,C | | 1.46% | | | | 1.43% | | .82% | | | | 1.38% | | | | 3.01% | | 6.18% |
| Ratios to Average Net AssetsD | | | | | | | | | | | | | | | | | | | | |
| Expenses before expense reductions | | 39%A | | | | .38% | | .38% | | | | .38% | | | | .38% | | .41% |
| Expenses net of voluntary waivers, if any | | 35%A | | | | .35% | | .35% | | | | .35% | | | | .35% | | .35% |
| Expenses net of all reductions | | 35%A | | | | .35% | | .35% | | | | .35% | | | | .35% | | .35% |
| Net investment income | | 2.90%A | | | | 1.38% | | .83% | | | | 1.37% | | | | 2.86% | | 5.98% |
| Supplemental Data | | | | | | | | | | | | | | | | | | | | |
| Net assets, end of period (in millions) | | $ 426 | | | | $ 499 | | $ 859 | | | | $ 917 | | | | $ 918 | | $ 828 |
A Annualized
B Total returns for periods of less than one year are not annualized.
C Total returns would have been lower had certain expenses not been reduced during the periods shown.
D Expense ratios reflect operating expenses of the class. Expenses before reductions do not reflect amounts reimbursed by the investment adviser or reductions from brokerage service arrangements or other expense offset arrangements and do not
represent the amount paid by the class during periods when reimbursements or reductions occur. Expenses net of any voluntary waivers reflect expenses after reimbursement by the investment adviser but prior to reductions from brokerage service
arrangements or other expense offset arrangements. Expenses net of all reductions represent the net expenses paid by the class.
|
| Financial Highlights Class III | | | | | | | | | | | | | | | | | | | | |
| | | Six months ended | | | | | | | | | | | | | | | | |
| | | September 30, 2005 | | | | Years ended March 31, |
| | | (Unaudited) | | | | 2005 | | 2004 | | | | 2003 | | | | 2002 | | 2001 |
| Selected Per Share Data | | | | | | | | | | | | | | | | | | | | |
| Net asset value, beginning of period | | $ 1.00 | | | | $ 1.00 | | $ 1.00 | | | | $ 1.00 | | | | $ 1.00 | | $ 1.00 |
| Income from Investment Operations | | | | | | | | | | | | | | | | | | | | |
| Net investment income | | 014 | | | | .013 | | .007 | | | | .013 | | | | .029 | | .059 |
| Distributions from net investment income | | (.014) | | | | (.013) | | (.007) | | | | (.013) | | | | (.029) | | (.059) |
| Net asset value, end of period | | $ 1.00 | | | | $ 1.00 | | $ 1.00 | | | | $ 1.00 | | | | $ 1.00 | | $ 1.00 |
| Total ReturnB,C | | 1.41% | | | | 1.32% | | .72% | | | | 1.27% | | | | 2.90% | | 6.08% |
| Ratios to Average Net AssetsD | | | | | | | | | | | | | | | | | | | | |
| Expenses before expense reductions | | 48%A | | | | .48% | | .48% | | | | .48% | | | | .48% | | .51% |
| Expenses net of voluntary waivers, if any | | 45%A | | | | .45% | | .45% | | | | .45% | | | | .45% | | .45% |
| Expenses net of all reductions | | 45%A | | | | .45% | | .45% | | | | .45% | | | | .45% | | .45% |
| Net investment income | | 2.80%A | | | | 1.28% | | .73% | | | | 1.27% | | | | 2.76% | | 5.88% |
| Supplemental Data | | | | | | | | | | | | | | | | | | | | |
| Net assets, end of period (in millions) | | $ 1,077 | | | | $ 572 | | $ 1,109 | | | | $ 866 | | | | $ 1,326 | | $ 1,028 |
A Annualized
B Total returns for periods of less than one year are not annualized.
C Total returns would have been lower had certain expenses not been reduced during the periods shown.
D Expense ratios reflect operating expenses of the class. Expenses before reductions do not reflect amounts reimbursed by the investment adviser or reductions from brokerage service arrangements or other expense offset arrangements and do not
represent the amount paid by the class during periods when reimbursements or reductions occur. Expenses net of any voluntary waivers reflect expenses after reimbursement by the investment adviser but prior to reductions from brokerage service
arrangements or other expense offset arrangements. Expenses net of all reductions represent the net expenses paid by the class.
|
See accompanying notes which are an integral part of the financial statements.
|
23 Semiannual Report
| Financial Highlights Select Class | | | | | | | | | | | | |
| | Six months ended | | | | | | | | | | | | |
| | | September 30, 2005 | | Years ended March 31, |
| | | (Unaudited) | | 2005 | | 2004 | | 2003 | | 2002D |
| Selected Per Share Data | | | | | | | | | | | | |
| Net asset value, beginning of period | | $ 1.00 | | $ 1.00 | | $ 1.00 | | $ 1.00 | | $ 1.00 |
| Income from Investment Operations | | | | | | | | | | | | |
| Net investment income | | 015 | | .015 | | .009 | | .015 | | .004 |
| Distributions from net investment income | | (.015) | | (.015) | | (.009) | | (.015) | | (.004) |
| Net asset value, end of period | | $ 1.00 | | $ 1.00 | | $ 1.00 | | $ 1.00 | | $ 1.00 |
| Total ReturnB,C | | 1.51% | | 1.53% | | .92% | | 1.47% | | .37% |
| Ratios to Average Net AssetsE | | | | | | | | | | | | |
| Expenses before expense reductions | | 28%A | | .28% | | .28% | | .28% | | .27%A |
| Expenses net of voluntary waivers, if any | | 25%A | | .25% | | .25% | | .25% | | .25%A |
| Expenses net of all reductions | | 25%A | | .25% | | .25% | | .25% | | .25%A |
| Net investment income | | 3.00%A | | 1.48% | | .92% | | 1.47% | | 1.83%A |
| Supplemental Data | | | | | | | | | | | | |
| Net assets, end of period (000 omitted) | | $ 36,958 | | $ 49,025 | | $ 38,785 | | $ 272,495 | | $ 100 |
A Annualized
B Total returns for periods of less than one year are not annualized.
C Total returns would have been lower had certain expenses not been reduced during the periods shown.
D For the period January 17, 2002 (commencement of sale of shares) to March 31, 2002.
E Expense ratios reflect operating expenses of the class. Expenses before reductions do not reflect amounts reimbursed by the investment adviser or reductions from brokerage service arrangements or other expense offset arrangements and do not
represent the amount paid by the class during periods when reimbursements or reductions occur. Expense ratios before reductions for start up periods may not be representative of longer term operating periods. Expenses net of any voluntary
waivers reflect expenses after reimbursement by the investment adviser but prior to reductions from brokerage service arrangements or other expense offset arrangements. Expenses net of all reductions represent the net expenses paid by the class.
|
| See accompanying notes which are an integral part of the financial statements. | | |
| Semiannual Report | | 24 |
Prime Money Market Portfolio
Investment Changes
|
| Maturity Diversification | | | | | | |
| Days | | % of fund’s | | % of fund’s | | % of fund’s |
| | | investments | | investments | | investments |
| | | 9/30/05 | | 3/31/05 | | 9/30/04 |
| 0 - 30 | | 58.7 | | 43.4 | | 51.2 |
| 31 - 90 | | 31.1 | | 36.2 | | 26.2 |
| 91 - 180 | | 8.4 | | 19.4 | | 17.9 |
| 181 - 397 | | 1.8 | | 1.0 | | 4.7 |
| Weighted Average Maturity | | | | | | |
| | | 9/30/05 | | 3/31/05 | | 9/30/04 |
| Prime Money Market Portfolio | | 34 Days | | 49 Days | | 56 Days |
| All Taxable Money Market Funds Average* | | 34 Days | | 38 Days | | 43 Days |
*Source: iMoneyNet, Inc.
See accompanying notes which are an integral part of the financial statements.
25 Semiannual Report
Prime Money Market Portfolio
Investments September 30, 2005 (Unaudited)
Showing Percentage of Net Assets
|
| Corporate Bonds 0.2% | | | | | | | | |
| Due | | Annualized Yield at | | | | Principal | | | | Value (Note 1) |
| Date | | Time of Purchase | | | | Amount (000s) | | | | (000s) |
| Morgan Stanley | | | | | | | | | | | | |
| 12/27/05 | | 4.25% (c) | | | | | $ | 18,000 | | | $ | 18,027 |
| 4/15/06 | | 4.05 | | | | | | 5,000 | | | | 5,053 |
| TOTAL CORPORATE BONDS | | | | | | | | | | 23,080 |
| |
| Certificates of Deposit 21.1% | | | | |
| |
| Domestic Certificates Of Deposit 2.5% | | | | | | |
| Morgan Stanley Bank, West Valley City Utah | | | | |
| 10/31/05 | | 3.81 | | | | | | 150,000 | | | | 150,000 |
| Washington Mutual Bank FA | | | | | | | | | | |
| 12/13/05 | | 3.90 | | | | | | 40,000 | | | | 39,995 |
| Washington Mutual Bank, California | | | | | | | | |
| 11/1/05 | | 3.70 | | | | | | 100,000 | | | | 100,000 |
| | | | | | | | | | | | | 289,995 |
| London Branch, Eurodollar, Foreign Banks – 4.3% | | | | |
| Credit Industriel et Commercial | | | | | | | | | | |
| 1/26/06 | | 4.00 | | | | | | 100,000 | | | | 100,000 |
| 1/30/06 | | 4.05 | | | | | | 75,000 | | | | 75,000 |
| 1/30/06 | | 4.06 | | | | | | 75,000 | | | | 75,000 |
| 1/30/06 | | 4.08 | | | | | | 100,000 | | | | 100,000 |
| Deutsche Bank AG | | | | | | | | | | | | |
| 10/31/05 | | 3.80 | | | | | | 150,000 | | | | 150,000 |
| | | | | | | | | | | | | 500,000 |
| New York Branch, Yankee Dollar, Foreign Banks – 14.3% | | | | |
| Bank of Tokyo Mitsubishi Ltd. | | | | | | | | | | |
| 10/28/05 | | 3.79 | | | | | | 38,000 | | | | 38,000 |
| 11/1/05 | | 3.79 | | | | | | 195,000 | | | | 195,000 |
| Barclays Bank PLC | | | | | | | | | | | | |
| 11/1/05 | | 3.78 | | | | | | 300,000 | | | | 300,000 |
| 12/2/05 | | 3.71 | | | | | | 124,000 | | | | 124,000 |
| Credit Industriel et Commercial | | | | | | | | | | |
| 2/13/06 | | 4.00 | | | | | | 55,000 | | | | 55,000 |
| 2/15/06 | | 4.01 | | | | | | 70,000 | | | | 70,000 |
| Credit Suisse First Boston New York Branch | | | | |
| 10/19/05 | | 3.58 (c) | | | | 60,000 | | | | 60,000 |
| 10/19/05 | | 3.77 (c) | | | | 50,000 | | | | 50,000 |
| 12/28/05 | | 3.93 (c) | | | | 85,000 | | | | 85,000 |
| Deutsche Bank AG | | | | | | | | | | | | |
| 12/5/05 | | 3.73 (c) | | | | 65,000 | | | | 65,000 |
| Dresdner Bank AG | | | | | | | | | | | | |
| 1/13/06 | | 3.78 | | | | | | 65,000 | | | | 65,000 |
| Eurohypo AG | | | | | | | | | | | | |
| 11/23/05 | | 3.80 | | | | | | 100,000 | | | | 100,000 |
| Mizuho Corporate Bank Ltd. | | | | | | | | | | |
| 11/1/05 | | 3.83 | | | | | | 85,000 | | | | 85,000 |
| Skandinaviska Enskilda Banken AB | | | | | | | | |
| 10/6/05 | | 3.50 (c) | | | | 115,000 | | | | 114,987 |
| Due | | Annualized Yield at | | | | Principal | | Value (Note 1) |
| Date | | Time of Purchase | | | | Amount (000s) | | (000s) |
| Toronto Dominion Bank | | | | | | | | |
| 4/7/06 | | 3.86% | | | $ | 40,000 | | $ | | 40,000 |
| 4/18/06 | | 3.92 | | | | 125,000 | | | | 125,000 |
| Unicredito Italiano Spa | | | | | | | | |
| 11/14/05 | | 3.73 (c) | | | | 75,000 | | | | 74,993 |
| | | | | | | | | | | 1,646,980 |
| |
| TOTAL CERTIFICATES OF DEPOSIT | | | | 2,436,975 |
| |
| Commercial Paper 24.0% | | | | | | | | |
| |
| Aspen Funding Corp. | | | | | | | | |
| 10/24/05 | | 3.78 | | | | 10,000 | | | | 9,976 |
| Capital One Multi Asset Execution Trust | | | | | | |
| 10/12/05 | | 3.55 | | | | 5,000 | | | | 4,995 |
| 10/26/05 | | 3.69 | | | | 25,000 | | | | 24,936 |
| 11/2/05 | | 3.70 | | | | 15,000 | | | | 14,951 |
| 12/13/05 | | 3.92 | | | | 20,000 | | | | 19,843 |
| Citibank Credit Card Master Trust I (Dakota Certificate Program) |
| 10/25/05 | | 3.78 | | | | 91,815 | | | | 91,584 |
| 10/26/05 | | 3.70 | | | | 125,000 | | | | 124,681 |
| 10/26/05 | | 3.78 | | | | 15,000 | | | | 14,961 |
| Emerald (MBNA Credit Card Master Note Trust) | | | | |
| 10/4/05 | | 3.55 | | | | 45,000 | | | | 44,987 |
| 10/11/05 | | 3.60 | | | | 5,000 | | | | 4,995 |
| 10/25/05 | | 3.63 | | | | 25,000 | | | | 24,940 |
| 11/2/05 | | 3.74 | | | | 100,000 | | | | 99,670 |
| 11/9/05 | | 3.75 | | | | 50,000 | | | | 49,798 |
| 11/15/05 | | 3.82 | | | | 43,700 | | | | 43,493 |
| 12/6/05 | | 3.96 | | | | 80,000 | | | | 79,424 |
| 12/20/05 | | 4.00 | | | | 50,000 | | | | 49,560 |
| 12/21/05 | | 4.00 | | | | 45,000 | | | | 44,599 |
| Eurohypo AG | | | | | | | | | | |
| 10/31/05 | | 3.58 | | | | 60,000 | | | | 59,823 |
| FCAR Owner Trust | | | | | | | | | | |
| 10/4/05 | | 3.35 | | | | 4,000 | | | | 3,999 |
| Giro Funding US Corp. | | | | | | | | |
| 10/17/05 | | 3.58 | | | | 51,444 | | | | 51,363 |
| 10/28/05 | | 3.79 | | | | 15,000 | | | | 14,957 |
| 11/8/05 | | 3.75 | | | | 5,000 | | | | 4,980 |
| Govco, Inc. | | | | | | | | | | |
| 3/16/06 | | 4.01 | | | | 35,000 | | | | 34,366 |
| HSBC Finance Corp. | | | | | | | | |
| 11/16/05 | | 3.77 | | | | 100,000 | | | | 99,523 |
| Market Street Funding Corp. | | | | | | | | |
| 10/5/05 | | 3.68 | | | | 149,208 | | | | 149,147 |
| Motown Notes Program | | | | | | | | |
| 10/5/05 | | 3.53 | | | | 10,000 | | | | 9,996 |
| 11/2/05 | | 3.72 | | | | 35,000 | | | | 34,885 |
| 11/3/05 | | 3.72 | | | | 10,000 | | | | 9,966 |
| 11/7/05 | | 3.76 | | | | 179,900 | | | | 179,210 |
See accompanying notes which are an integral part of the financial statements.
Semiannual Report 26
Commercial Paper continued
| | | | | | |
| Due | | Annualized Yield at | | Principal | | Value (Note 1) |
| Date | | Time of Purchase | | Amount (000s) | | (000s) |
| Motown Notes Program – continued | | | | | | | | |
| 11/8/05 | | | | 3.77% | | $ | | 15,000 | | $ | | 14,941 |
| 11/14/05 | | | | 3.83 | | | | 26,000 | | | | 25,879 |
| 11/21/05 | | | | 3.81 | | | | 55,000 | | | | 54,706 |
| 11/21/05 | | | | 3.85 | | | | 40,000 | | | | 39,783 |
| 12/12/05 | | | | 3.85 | | | | 30,000 | | | | 29,771 |
| 12/14/05 | | | | 3.87 | | | | 35,000 | | | | 34,724 |
| 12/16/05 | | | | 3.88 | | | | 50,000 | | | | 49,595 |
| Newcastle (Discover Card Master Trust) | | | | | | |
| 10/19/05 | | | | 3.80 | | | | 15,000 | | | | 14,972 |
| 10/20/05 | | | | 3.79 | | | | 5,000 | | | | 4,990 |
| 10/24/05 | | | | 3.79 | | | | 10,000 | | | | 9,976 |
| 11/16/05 | | | | 3.82 | | | | 14,800 | | | | 14,729 |
| 11/22/05 | | | | 3.82 | | | | 75,000 | | | | 74,591 |
| 12/14/05 | | | | 3.87 | | | | 15,000 | | | | 14,882 |
| Paradigm Funding LLC | | | | | | | | | | |
| 10/31/05 | | | | 3.81 | | | | 65,000 | | | | 64,795 |
| 11/16/05 | | | | 3.75 | | | | 170,000 | | | | 169,194 |
| Park Granada LLC | | | | | | | | | | | | |
| 10/3/05 | | | | 0.00 | | | | 30,000 | | | | 29,993 |
| 10/27/05 | | | | 3.83 | | | | 130,000 | | | | 129,641 |
| 10/28/05 | | | | 3.83 | | | | 30,000 | | | | 29,914 |
| 11/1/05 | | | | 3.69 | | | | 40,000 | | | | 39,874 |
| Strand Capital LLC | | | | | | | | | | | | |
| 11/14/05 | | | | 3.69 | | | | 25,000 | | | | 24,888 |
| 1/17/06 | | | | 3.91 | | | | 40,000 | | | | 39,537 |
| Stratford Receivables Co. LLC | | | | | | | | |
| 10/7/05 | | | | 3.77 | | | | 30,000 | | | | 29,981 |
| 10/17/05 | | | | 3.80 | | | | 10,000 | | | | 9,983 |
| 10/17/05 | | | | 3.81 | | | | 15,000 | | | | 14,975 |
| 10/18/05 | | | | 3.81 | | | | 25,150 | | | | 25,105 |
| 10/20/05 | | | | 3.81 | | | | 10,000 | | | | 9,980 |
| 10/20/05 | | | | 3.82 | | | | 85,000 | | | | 84,829 |
| 10/24/05 | | | | 3.83 | | | | 50,000 | | | | 49,878 |
| 10/26/05 | | | | 3.82 | | | | 80,000 | | | | 79,788 |
| 11/3/05 | | | | 3.84 | | | | 80,000 | | | | 79,719 |
| Thames Asset Global Securities No. 1, Inc. | | | | | | |
| 11/18/05 | | | | 3.77 | | | | 71,236 | | | | 70,882 |
| TOTAL COMMERCIAL PAPER | | | | | | 2,766,103 |
| |
| Federal Agencies 0.2% | | | | | | | | |
| |
| Overseas Private Investment Corp. U.S. Government guaranteed |
| participation certificates 0.2% | | | | | | | | |
| Agency Coupons – 0.2% | | | | | | | | | | |
| 10/7/05 | | | | 3.85 (c) | | | | 18,025 | | | | 18,025 |
| Master Notes 2.2% | | | | | | | | |
| Due | | Annualized Yield at | | Principal | | Value (Note 1) |
| Date | | Time of Purchase | | Amount (000s) | | (000s) |
| Bear Stearns Companies, Inc. | | | | | | | | |
| 10/12/05 | | 3.77% (e) | | $ | | 44,000 | | $ | | 44,000 |
| Goldman Sachs Group, Inc. | | | | | | | | |
| 10/11/05 | | 3.78 (c)(e) | | | | 16,000 | | | | 16,000 |
| 10/14/05 | | 3.80 (c)(e) | | | | 60,000 | | | | 60,000 |
| 11/28/05 | | 3.89 (c)(e) | | | | 71,000 | | | | 71,000 |
| 1/9/06 | | 3.69 (e) | | | | 59,000 | | | | 59,000 |
| TOTAL MASTER NOTES | | | | | | | | 250,000 |
| |
| Medium Term Notes 21.5% | | | | | | |
| |
| AIG Matched Funding Corp. | | | | | | | | |
| 12/15/05 | | 3.89 (c) | | | | 50,000 | | | | 50,000 |
| 12/15/05 | | 3.89 (c) | | | | 5,000 | | | | 5,000 |
| 1/3/06 | | 4.06 (b)(c) | | | | 50,000 | | | | 50,000 |
| 1/11/06 | | 4.13 (b)(c) | | | | 50,000 | | | | 50,000 |
| 1/23/06 | | 4.02 (c) | | | | 55,000 | | | | 55,000 |
| Allstate Life Global Funding II | | | | | | | | |
| 10/10/05 | | 3.72 (a)(c) | | | | 10,000 | | | | 10,000 |
| 10/17/05 | | 3.79 (a)(c) | | | | 5,000 | | | | 5,000 |
| 10/17/05 | | 3.80 (a)(c) | | | | 10,000 | | | | 10,000 |
| 10/27/05 | | 3.82 (a)(c) | | | | 6,000 | | | | 6,000 |
| American Express Credit Corp. | | | | | | | | |
| 10/5/05 | | 3.76 (c) | | | | 95,000 | | | | 95,016 |
| ASIF Global Financing XXX | | | | | | | | |
| 10/24/05 | | 3.82 (a)(c) | | | | 50,000 | | | | 50,000 |
| Australia & New Zealand Banking Group Ltd. | | | | |
| 10/24/05 | | 3.81 (a)(c) | | | | 26,000 | | | | 26,000 |
| Bayerische Landesbank Girozentrale | | | | | | | | |
| 10/15/05 | | 3.58 (c) | | | | 75,000 | | | | 75,000 |
| 11/21/05 | | 3.82 (c) | | | | 60,000 | | | | 60,000 |
| BMW U.S. Capital LLC | | | | | | | | |
| 10/17/05 | | 3.74 (c) | | | | 16,000 | | | | 16,000 |
| BNP Paribas SA | | | | | | | | | | |
| 10/26/05 | | 3.81 (a)(c) | | | | 50,000 | | | | 50,000 |
| 10/26/05 | | 3.81 (a)(c) | | | | 50,000 | | | | 50,000 |
| Commonwealth Bank of Australia | | | | | | | | |
| 10/24/05 | | 3.80 (c) | | | | 26,000 | | | | 26,000 |
| Descartes Funding Trust | | | | | | | | |
| 10/17/05 | | 3.77 (c) | | | | 15,000 | | | | 15,000 |
| Eli Lilly Services, Inc. | | | | | | | | |
| 10/3/05 | | 3.66 (a)(c) | | | | 25,000 | | | | 25,000 |
| GE Capital Assurance Co. | | | | | | | | |
| 10/3/05 | | 3.77 (c)(e) | | | | 15,000 | | | | 15,000 |
| General Electric Capital Corp. | | | | | | | | |
| 10/7/05 | | 3.68 (c) | | | | 127,000 | | | | 127,000 |
| 10/11/05 | | 3.80 (c) | | | | 79,500 | | | | 79,518 |
| 10/17/05 | | 3.89 (c) | | | | 148,000 | | | | 148,074 |
See accompanying notes which are an integral part of the financial statements.
27 Semiannual Report
Prime Money Market Portfolio
Investments (Unaudited) - continued
|
| Medium Term Notes continued | | | | | | |
| Due | | Annualized Yield at | | Principal | | Value (Note 1) |
| Date | | Time of Purchase | | Amount (000s) | | | | (000s) |
| Hartford Life Global Funding Trust | | | | | | | | |
| 10/17/05 | | 3.76% (c) | | $ | | 35,000 | | $ | | 35,000 |
| HSBC Finance Corp. | | | | | | | | |
| 10/24/05 | | 3.82 (c) | | | | 37,000 | | | | 37,000 |
| HSH Nordbank AG | | | | | | | | |
| 10/24/05 | | 3.83 (a)(c) | | | | 36,000 | | | | 36,000 |
| ING USA Annuity & Life Insurance Co. | | | | | | | | |
| 12/28/05 | | 4.04 (c)(e) | | | | 18,000 | | | | 18,000 |
| MBIA Global Funding LLC | | | | | | | | |
| 10/18/05 | | 3.57 (a)(c) | | | | 15,000 | | | | 15,000 |
| Merrill Lynch & Co., Inc. | | | | | | | | |
| 10/17/05 | | 3.75 (c) | | | | 50,000 | | | | 50,000 |
| 10/17/05 | | 3.75 (c) | | | | 14,000 | | | | 14,000 |
| Metropolitan Life Insurance Co. | | | | | | | | |
| 10/6/05 | | 3.67 (a)(c) | | | | 21,087 | | | | 21,087 |
| 10/6/05 | | 3.67 (a)(c) | | | | 8,000 | | | | 8,000 |
| Morgan Stanley | | | | | | | | | | |
| 10/3/05 | | 3.67 (c) | | | | 50,000 | | | | 50,000 |
| 10/3/05 | | 3.67 (c) | | | | 22,000 | | | | 22,000 |
| 10/3/05 | | 3.67 (c) | | | | 50,000 | | | | 50,000 |
| 10/3/05 | | 3.67 (c) | | | | 50,000 | | | | 50,000 |
| 10/3/05 | | 3.67 (c) | | | | 15,000 | | | | 15,000 |
| 10/3/05 | | 3.97 (c) | | | | 7,000 | | | | 7,000 |
| 10/4/05 | | 3.71 (c) | | | | 15,000 | | | | 15,000 |
| 10/17/05 | | 3.80 (c) | | | | 11,000 | | | | 11,000 |
| 10/27/05 | | 3.87 (c) | | | | 55,000 | | | | 55,007 |
| Pacific Life Global Funding | | | | | | | | |
| 10/4/05 | | 3.70 (a)(c) | | | | 22,500 | | | | 22,500 |
| 10/13/05 | | 3.76 (c) | | | | 5,000 | | | | 5,000 |
| RACERS | | | | | | | | | | |
| 10/24/05 | | 3.82 (a)(c) | | | | 65,000 | | | | 65,000 |
| Royal Bank of Scotland PLC | | | | | | | | |
| 10/21/05 | | 3.78 (a)(c) | | | | 50,000 | | | | 50,000 |
| 10/21/05 | | 3.78 (a)(c) | | | | 35,000 | | | | 35,000 |
| SBC Communications, Inc. | | | | | | | | |
| 6/5/06 | | 4.02 (a) | | | | 21,830 | | | | 21,883 |
| Security Life of Denver Insurance Co. | | | | | | | | |
| 11/30/05 | | 3.94 (c)(e) | | | | 14,000 | | | | 14,000 |
| SLM Corp. | | | | | | | | | | |
| 10/3/05 | | 3.74 (a)(c) | | | | 30,000 | | | | 30,000 |
| Verizon Global Funding Corp. | | | | | | | | |
| 10/17/05 | | 3.98 (c) | | | | 70,000 | | | | 70,000 |
| Wachovia Asset Securitization Issuance LLC | | | | | | |
| 10/25/05 | | 3.82 (a)(c) | | | | 15,000 | | | | 15,000 |
| Washington Mutual Bank, California | | | | | | | | |
| 10/27/05 | | 3.64 (c) | | | | 80,000 | | | | 80,000 |
| 11/4/05 | | 3.70 (c) | | | | 20,000 | | | | 20,000 |
| 12/20/05 | | 3.87 (c) | | | | 40,000 | | | | 40,000 |
| Due | | Annualized Yield at | | | | Principal | | Value (Note 1) |
| Date | | Time of Purchase | | Amount (000s) | | | | (000s) |
| 12/20/05 | | 3.87% (c) | | $ | | 16,000 | | $ | | 16,000 |
| 12/28/05 | | 3.94 (c) | | | | 65,000 | | | | 64,997 |
| Wells Fargo & Co. | | | | | | | | |
| 10/3/05 | | 3.75 (c) | | | | 30,000 | | | | 30,000 |
| 10/17/05 | | 3.76 (c) | | | | 90,000 | | | | 90,001 |
| WestLB AG | | | | | | | | | | |
| 10/11/05 | | 3.74 (a)(c) | | | | 41,000 | | | | 41,000 |
| 12/30/05 | | 4.02 (a)(c) | | | | 50,000 | | | | 50,000 |
| 12/30/05 | | 4.02 (a)(c) | | | | 1,000 | | | | 1,000 |
| Westpac Banking Corp. | | | | | | | | |
| 12/12/05 | | 3.84 (c) | | | | 15,000 | | | | 15,000 |
| White Pine Finance LLC | | | | | | | | |
| 10/31/05 | | 3.64 (a)(c) | | | | 40,000 | | | | 39,998 |
| 12/12/05 | | 3.78 (a)(c) | | | | 62,000 | | | | 61,994 |
| TOTAL MEDIUM-TERM NOTES | | | | | | 2,486,075 |
| |
| Short Term Notes 2.0% | | | | | | | | |
| |
| Hartford Life Insurance Co. | | | | | | | | |
| 12/1/05 | | 4.02 (c)(e) | | | | 25,000 | | | | 25,000 |
| Jackson National Life Insurance Co. | | | | | | | | |
| 10/1/05 | | 3.64 (c)(e) | | | | 10,000 | | | | 10,000 |
| Metropolitan Life Insurance Co. | | | | | | | | |
| 10/3/05 | | 3.64 (c)(e) | | | | 30,000 | | | | 30,000 |
| 10/28/05 | | 3.91 (a)(c) | | | | 10,000 | | | | 10,000 |
| Monumental Life Insurance Co. | | | | | | | | |
| 10/3/05 | | 3.83 (c)(e) | | | | 10,000 | | | | 10,000 |
| 10/3/05 | | 3.86 (c)(e) | | | | 10,000 | | | | 10,000 |
| New York Life Insurance Co. | | | | | | | | |
| 12/31/05 | | 4.15 (c)(e) | | | | 95,000 | | | | 95,000 |
| Transamerica Occidental Life Insurance Co. | | | | |
| 11/1/05 | | 3.86 (c)(e) | | | | 35,000 | | | | 35,000 |
| TOTAL SHORT TERM NOTES | | | | | | | | 225,000 |
| |
| Municipal Securities 1.0% | | | | | | |
| |
| California Statewide Cmntys. Dev. | | | | | | | | |
| Auth. Rev. TRAN Series C2, 3.9% | | | | | | | | |
| 6/30/06 | | | | | | 17,600 | | | | 17,600 |
| LoanStar Assets Partners LP Student Ln. | | | | | | | | |
| Rev. Series A, 3.85%, LOC State | | | | | | | | |
| Street Bank & Trust Co., Boston, | | | | | | | | |
| VRDN (c) | | | | | | 50,000 | | | | 50,000 |
| Mississippi Gen. Oblig. (Nissan Proj.) | | | | | | | | |
| Series B, 3.94% (Liquidity Facility | | | | | | | | |
| Dexia Cr. Local de France), VRDN (c) | | | | 51,000 | | | | 51,000 |
| TOTAL MUNICIPAL SECURITIES | | | | | | | | 118,600 |
See accompanying notes which are an integral part of the financial statements.
Semiannual Report 28
| Interfund Loans 0.0% | | | | | | | | |
| |
| | | | | | | Principal | | Value (Note 1) |
| | | | | | | Amount (000s) | | (000s) |
| |
| With Fidelity Advisor Equity Growth | | | | | | | | |
| Fund, at 4.01% due 10/3/05 (f) | | | $ | 5,115 | | | $ | 5,115 |
| |
| Repurchase Agreements 28.6% | | | | |
| |
| | | | | | | Maturity | | Value (Note 1) |
| | | | | | | Amount (000s) | | (000s) |
| |
| In a joint trading account | | | | | | | | | | |
| (Collateralized by U.S. Government | | | | | | | | |
| Obligations) dated 9/30/05 due | | | | | | | | |
| 10/3/05 At: | | | | | | | | | | |
| 3.9% (g) | | | | | $ | 114,905 | | | | 114,868 |
| 3.91% (g) | | | | | | 1,282,755 | | | | 1,282,338 |
| With: | | | | | | | | | | |
| Banc of America Securities LLC At | | | | | | | | |
| 4.02%, dated 9/30/05 due | | | | | | | | |
| 10/3/05 (Collateralized by | | | | | | | | |
| Corporate Obligations valued at | | | | | | | | |
| $510,000,001, 3.81% - 9.25%, | | | | | | | | |
| 4/10/07 – 5/9/35) | | | | | | 500,168 | | | | 500,000 |
| Barclays Capital, Inc. At 3.99%, | | | | | | | | |
| dated 9/30/05 due 10/3/05 | | | | | | | | |
| (Collateralized by Mortgage Loan | | | | | | | | |
| Obligations valued at | | | | | | | | | | |
| $165,240,001, 3.69% - 8.25%, | | | | | | | | |
| 1/25/13 – 5/23/35) | | | | | | 162,054 | | | | 162,000 |
| Citigroup Global Markets, Inc. At | | | | | | | | |
| 4.04%, dated 9/30/05 due | | | | | | | | |
| 10/3/05 (Collateralized by | | | | | | | | |
| Corporate Obligations valued at | | | | | | | | |
| $426,448,406, 1.43% - 13.5%, | | | | | | | | |
| 10/1/07 – 7/15/41) | | | | | | 407,137 | | | | 407,000 |
| Credit Suisse First Boston, Inc. At | | | | | | | | |
| 4.02%, dated 9/30/05 due | | | | | | | | |
| 10/3/05 (Collateralized by | | | | | | | | |
| Commercial Paper Obligations | | | | | | | | |
| valued at $306,002,578, 0% | | | | | | | | |
| 3.53%, 10/3/05 – 1/12/06) | | | | 300,101 | | | | 300,000 |
| Goldman Sachs & Co. At: | | | | | | | | |
| 4.04%, dated: | | | | | | | | | | |
| 8/23/05 due 11/21/05 | | | | | | | | |
| (Collateralized by Equity | | | | | | | | |
| Securities valued at | | | | | | | | | | |
| $153,523,373, 4.25% | | | | | | | | |
| 12.05%, 4/1/07 | | | | | | | | | | |
| 7/9/40) (c)(d) | | | | | | 148,485 | | | | 147,000 |
| 9/30/05 due 10/3/05 | | | | | | | | |
| (Collateralized by Mortgage | | | | | | | | |
| Loan Obligations valued at | | | | | | | | |
| $197,400,001, 4.23% | | | | | | | | |
| 7.15%, 1/15/09 - 6/25/43) . | | 188,063 | | | | 188,000 |
| | | | | | | Maturity | | Value (Note 1) |
| | | | | | | Amount (000s) | | (000s) |
| |
| 4.05%, dated 8/23/05 due | | | | | | |
| 11/21/05 (Collateralized by | | | | | | |
| Corporate Obligations valued at | | | | |
| $47,250,344, 0% - 5.75%, | | | | | | |
| 7/1/07 – 6/15/33) (c)(d) | | | $ | 45,456 | | $ 45,000 |
| Lehman Brothers, Inc. At 4.02%, | | | | | | |
| dated 9/30/05 due 10/3/05 | | | | | | |
| (Collateralized by Mortgage Loan | | | | |
| Obligations valued at | | | | | | | | |
| $165,903,461, 0% - 7.5%, | | | | | | |
| 3/1/26 – 9/11/42) | | | | | | 158,053 | | 158,000 |
| |
| TOTAL REPURCHASE AGREEMENTS | | | | 3,304,206 |
| |
| TOTAL INVESTMENT PORTFOLIO 100.8% | | |
| (Cost $11,633,179) | | | | | | | | 11,633,179 |
| |
| NET OTHER ASSETS (0.8)% | | | | | | (95,484) |
| |
| NET ASSETS 100% | | | | | | | | $ 11,537,695 |
Security Type Abbreviations
TRAN - TAX AND REVENUE ANTICIPATION NOTE
VRDN - VARIABLE RATE DEMAND NOTE
|
Legend
(a) Security exempt from registration under Rule 144A of the Securities
Act of 1933. These securities may be resold in transactions exempt from
registration, normally to qualified institutional buyers. At the period end,
the value of these securities amounted to $755,462,000 or 6.5% of net
assets.
(b) Security or a portion of the security purchased on a delayed delivery or
when-issued basis.
(c) The coupon rate shown on floating or adjustable rate securities represents
the rate at period end. The due dates on these types of securities reflect the
next interest rate reset date or, when applicable, the final maturity date.
(d) The maturity amount is based on the rate at period end.
(e) Restricted securities – Investment in securities not registered under the
Securities Act of 1933 (excluding 144A issues). At the end of the period,
the value of restricted securities (excluding 144A issues) amounted to
$512,000,000 or 4.4% of net assets.
Additional information on each holding is as follows:
|
| Security | | Acquisition Date | | | | Cost (000s) |
| Bear Stearns Companies, Inc. | | | | | | |
| 3.77%, 10/12/05 | | 9/8/05 | | $ | | 44,000 |
| GE Capital Assurance Co. | | | | | | |
| 3.77%, 10/3/05 | | 7/28/05 | | $ | | 15,000 |
| Goldman Sachs Group, Inc.: | | | | | | |
| 3.69%, 1/9/06 | | 4/12/05 | | $ | | 59,000 |
| 3.78%, 10/11/05 | | 1/13/05 | | $ | | 16,000 |
| 3.8%, 10/14/05 | | 2/14/05 | | $ | | 60,000 |
| 3.89%, 11/28/05 | | 8/26/04 | | $ | | 71,000 |
See accompanying notes which are an integral part of the financial statements.
29 Semiannual Report
Prime Money Market Portfolio
Investments (Unaudited) - continued
| Security | | Acquisition Date | | | | Cost (000s) |
| Hartford Life Insurance Co. | | | | | | |
| 4.02%, 12/1/05 | | 12/16/03 | | $ | | 25,000 |
| ING USA Annuity & Life Insurance | | | | | | |
| Co. 4.04%, 12/28/05 | | 6/23/05 | | $ | | 18,000 |
| Jackson National Life Insurance Co. | | | | | | |
| 3.64%, 10/1/05 | | 3/31/03 | | $ | | 10,000 |
| Metropolitan Life Insurance Co. | | | | | | |
| 3.64%, 10/3/05 | | 3/26/02 | | $ | | 30,000 |
| Monumental Life Insurance Co.: | | | | | | |
| 3.83%, 10/3/05 | | 9/17/98 | | $ | | 10,000 |
| 3.86%, 10/3/05 | | 3/12/99 | | $ | | 10,000 |
| New York Life Insurance Co. | | 2/28/02 - | | | | |
| 4.15%, 12/31/05 | | 12/19/02 | | $ | | 95,000 |
| Security Life of Denver Insurance Co. | | | | | | |
| 3.94%, 11/30/05 | | 8/26/05 | | $ | | 14,000 |
| Transamerica Occidental Life | | | | | | |
| Insurance Co. 3.86%, 11/1/05 | | 4/28/00 | | $ | | 35,000 |
(f) Affiliated entity
(g) Additional information on each counterparty to the repurchase agreement
is as follows:
|
| Repurchase Agreement/ | | | | Value |
| Counterparty | | | | (000s) |
| |
| $114,868,000 due 10/3/05 at 3.9% | | | | |
| Banc of America Securities LLC. | | | $ | 31,589 |
| Credit Suisse First Boston LLC | | | | 57,434 |
| Morgan Stanley & Co. Incorporated. | | | | 25,845 |
| | | | $ | 114,868 |
| |
| $1,282,338,000 due 10/3/05 at 3.91% | | | | |
| Bank of America, National Association | | | $ | 179,657 |
| Bank of America Securities LLC | | | | 89,828 |
| Barclays Capital Inc. | | | | 269,485 |
| Citigroup Global Markets Inc | | | | 44,914 |
| Credit Suisse First Boston LLC | | | | 44,914 |
| Goldman Sachs & Co. | | | | 224,571 |
| Greenwich Capital Markets, Inc. | | | | 44,914 |
| Morgan Stanley & Co. Incorporated. | | | | 181,940 |
| UBS Securities LLC | | | | 89,829 |
| Wachovia Capital Markets, LLC | | | | 22,457 |
| WestLB AG | | | | 89,829 |
| | | | $ | 1,282,338 |
At March 31, 2005, the fund had a capital loss carryforward of approximately $619,000 of which $119,000 and $500,000 will expire on March 31, 2012 and 2013, respectively.
| See accompanying notes which are an integral part of the financial statements. | | |
| Semiannual Report | | 30 |
Prime Money Market Portfolio
Financial Statements
|
| Statement of Assets and Liabilities | | | | | | |
| Amounts in thousands (except per share amounts) | | | | September 30, 2005 |
| | | | | | | | | | | (Unaudited) |
| Assets | | | | | | | | | | |
| Investment in securities, at value | | | | | | | | | | |
| (including repurchase agreements | | | | | | | | |
| of $3,304,206) (cost | | | | | | | | | | |
| $11,633,179) — See | | | | | | | | | | |
| accompanying schedule | | | | | | | | $ | | 11,633,179 |
| Cash | | | | | | | | | | 879 |
| Interest receivable | | | | | | | | | | 16,762 |
| Prepaid expenses | | | | | | | | | | 5 |
| Receivable from investment adviser | | | | | | | | | | |
| for expense reductions | | | | | | | | | | 319 |
| Other affiliated receivables | | | | | | | | | | 1 |
| Total assets | | | | | | | | | | 11,651,145 |
| |
| Liabilities | | | | | | | | | | |
| Payable for investments purchased | | | | | | | | | | |
| on a delayed delivery basis | | $ | | 100,000 | | |
| Distributions payable | | | | 10,975 | | |
| Accrued management fee | | | | 1,723 | | |
| Distribution fees payable | | | | | | 473 | | | | |
| Other affiliated payables | | | | | | 229 | | | | |
| Other payables and accrued | | | | | | | | | | |
| expenses | | | | | | 50 | | | | |
| Total liabilities | | | | | | | | | | 113,450 |
| |
| Net Assets | | | | | | | | $ | | 11,537,695 |
| Net Assets consist of: | | | | | | | | | | |
| Paid in capital | | | | | | | | $ | | 11,539,010 |
| Undistributed net investment income | | | | | | | | | | 38 |
| Accumulated undistributed net real- | | | | | | | | | | |
| ized gain (loss) on investments | | | | | | | | | | (1,353) |
| Net Assets | | | | | | | | $ | | 11,537,695 |
| Calculation of Maximum Offering | | | | | | | | | | |
| Price | | | | | | | | | | |
| Class I: | | | | | | | | | | |
| Net Asset Value, offering price | | | | | | | | | | |
| and redemption price | | | | | | | | | | |
| per share ($8,087,650 ÷ | | | | | | | | | | |
| 8,088,015 shares) | | | | | | | | $ | | 1.00 |
| Class II: | | | | | | | | | | |
| Net Asset Value, offering price | | | | | | | | | | |
| and redemption price per share | | | | | | | | | | |
| ($971,200 ÷ 971,119 shares) | | . | | | | | | $ | | 1.00 |
| Class III: | | | | | | | | | | |
| Net Asset Value, offering price | | | | | | | | | | |
| and redemption price | | | | | | | | | | |
| per share ($2,362,087 ÷ | | | | | | | | | | |
| 2,362,601 shares) | | | | | | | | $ | | 1.00 |
| Select Class: | | | | | | | | | | |
| Net Asset Value, offering price | | | | | | | | | | |
| and redemption price per share | | | | | | | | | | |
| ($116,758 ÷ 116,769 shares) | | . | | | | | | $ | | 1.00 |
| Statement of Operations | | | | |
| Amounts in thousands | | Six months ended September 30, 2005 (Unaudited) |
| |
| Investment Income | | | | | | |
| Interest | | | | $ | | 158,411 |
| |
| Expenses | | | | | | |
| Management fee | | $ | | 9,589 | | |
| Transfer agent fees | | | | 793 | | |
| Distribution fees | | | | 2,335 | | |
| Accounting fees and expenses | | 414 | | |
| Independent trustees’ compensation | | 22 | | |
| Custodian fees and expenses | | 64 | | |
| Registration fees | | | | 131 | | |
| Audit | | | | 43 | | |
| Legal | | | | 11 | | |
| Miscellaneous | | | | 35 | | |
| Total expenses before reductions | | 13,437 | | |
| Expense reductions | | | | (1,525) | | 11,912 |
| |
| Net investment income | | | | | | 146,499 |
| |
| Net realized gain (loss) on invest- | | | | |
| ment securities | | | | | | (194) |
| Net increase in net assets resulting | | | | |
| from operations | | | | $ | | 146,305 |
See accompanying notes which are an integral part of the financial statements.
31 Semiannual Report
| Prime Money Market Portfolio | | | | | | | | | | | | | | | | | | | | | | | | |
| Financial Statements - continued | | | | | | | | | | | | | | | | | | | | | | |
| |
| |
| Statement of Changes in Net Assets | | | | | | | | | | | | | | | | | | | | | | | | |
| | | | | | | | | | | | | | | Six months ended | | | | Year ended |
| | | | | | | | | | | | | | | September 30, 2005 | | | | March 31, |
| Amounts in thousands | | | | | | | | | | | | | | (Unaudited) | | | | 2005 |
| Increase (Decrease) in Net Assets | | | | | | | | | | | | | | | | | | | | | | | | |
| Operations | | | | | | | | | | | | | | | | | | | | | | | | |
| Net investment income | | | | | | | | | | | | | | $ | | | | 146,499 | | $ | | 141,920 |
| Net realized gain (loss) | | | | | | | | | | | | | | | | | | (194) | | | | | | (1,040) |
| Net increase in net assets resulting from operations | | | | | | | | | | | | | | | | 146,305 | | | | 140,880 |
| Distributions to shareholders from net investment income | | | | | | | | | | | | | | (146,521) | | | | (141,941) |
| Share transactions - net increase (decrease) | | | | | | | | | | | | | | | | 1,489,213 | | | | 2,708,787 |
| Total increase (decrease) in net assets | | | | | | | | | | | | | | | | 1,488,997 | | | | 2,707,726 |
| |
| Net Assets | | | | | | | | | | | | | | | | | | | | | | | | |
| Beginning of period | | | | | | | | | | | | | | | | 10,048,698 | | | | 7,340,972 |
| End of period (including undistributed net investment income of $38 and undistributed net investment income of | | | | | | | | | | | | |
| $60, respectively) | | | | | | | | | | | | | | $ | | 11,537,695 | | $ | | 10,048,698 |
| |
| Financial Highlights Class I | | | | | | | | | | | | | | | | | | | | | | | | |
| | | Six months ended | | | | | | | | | | | | | | | | | | | | |
| | | September 30, 2005 | | | | Years ended March 31, |
| | | (Unaudited) | | | | 2005 | | 2004 | | | | 2003 | | | | 2002 | | | | | | 2001 |
| Selected Per Share Data | | | | | | | | | | | | | | | | | | | | | | | | |
| Net asset value, beginning of period | | $ 1.00 | | | | $ 1.00 | | $ 1.00 | | | | $ 1.00 | | | | $ 1.00 | | | | | | $ 1.00 |
| Income from Investment Operations | | | | | | | | | | | | | | | | | | | | | | | | |
| Net investment income | | 016 | | | | .016 | | .010 | | | | .016 | | | | .031 | | | | | | .062 |
| Distributions from net investment income | | (.016) | | | | (.016) | | (.010) | | | | (.016) | | | | (.031) | | | | | | (.062) |
| Net asset value, end of period | | $ 1.00 | | | | $ 1.00 | | $ 1.00 | | | | $ 1.00 | | | | $ 1.00 | | | | | | $ 1.00 |
| Total ReturnB,C | | 1.56% | | | | 1.62% | | 1.00% | | | | 1.56% | | | | 3.17% | | | | | | 6.43% |
| Ratios to Average Net AssetsD | | | | | | | | | | | | | | | | | | | | | | | | |
| Expenses before expense reductions | | 23%A | | | | .23% | | .23% | | | | .23% | | | | .23% | | | | | | .25% |
| Expenses net of voluntary waivers, if any | | 20%A | | | | .20% | | .20% | | | | .20% | | | | .20% | | | | | | .20% |
| Expenses net of all reductions | | 20%A | | | | .20% | | .20% | | | | .20% | | | | .20% | | | | | | .20% |
| Net investment income | | 3.10%A | | | | 1.68% | | .99% | | | | 1.57% | | | | 3.14% | | | | | | 6.21% |
| Supplemental Data | | | | | | | | | | | | | | | | | | | | | | | | |
| Net assets, end of period (in millions) | | $ 8,088 | | | | $ 8,158 | | $ 6,153 | | | | $ 4,434 | | | | $ 6,782 | | | | | | $ 6,829 |
A Annualized
B Total returns for periods of less than one year are not annualized.
C Total returns would have been lower had certain expenses not been reduced during the periods shown.
D Expense ratios reflect operating expenses of the class. Expenses before reductions do not reflect amounts reimbursed by the investment adviser or reductions from brokerage service arrangements or other expense offset arrangements and do not represent
the amount paid by the class during periods when reimbursements or reductions occur. Expenses net of any voluntary waivers reflect expenses after reimbursement by the investment adviser but prior to reductions from brokerage service arrangements or
other expense offset arrangements. Expenses net of all reductions represent the net expenses paid by the class.
|
| See accompanying notes which are an integral part of the financial statements. | | |
| Semiannual Report | | 32 |
| Financial Highlights Class II | | | | | | | | | | | | | | | | | | | | |
| | | Six months ended | | | | | | | | | | | | | | | | |
| | | September 30, 2005 | | | | Years ended March 31, |
| | | (Unaudited) | | | | 2005 | | 2004 | | | | 2003 | | | | 2002 | | 2001 |
| Selected Per Share Data | | | | | | | | | | | | | | | | | | | | |
| Net asset value, beginning of period | | $ 1.00 | | | | $ 1.00 | | $ 1.00 | | | | $ 1.00 | | | | $ 1.00 | | $ 1.00 |
| Income from Investment Operations | | | | | | | | | | | | | | | | | | | | |
| Net investment income | | 015 | | | | .015 | | .008 | | | | .014 | | | | .030 | | .061 |
| Distributions from net investment income | | (.015) | | | | (.015) | | (.008) | | | | (.014) | | | | (.030) | | (.061) |
| Net asset value, end of period | | $ 1.00 | | | | $ 1.00 | | $ 1.00 | | | | $ 1.00 | | | | $ 1.00 | | $ 1.00 |
| Total ReturnB,C | | 1.48% | | | | 1.47% | | .85% | | | | 1.42% | | | | 3.01% | | 6.27% |
| Ratios to Average Net AssetsD | | | | | | | | | | | | | | | | | | | | |
| Expenses before expense reductions | | 39%A | | | | .38% | | .38% | | | | .38% | | | | .38% | | .40% |
| Expenses net of voluntary waivers, if any | | 35%A | | | | .35% | | .35% | | | | .35% | | | | .35% | | .35% |
| Expenses net of all reductions | | 35%A | | | | .35% | | .35% | | | | .35% | | | | .35% | | .35% |
| Net investment income | | 2.95%A | | | | 1.53% | | .84% | | | | 1.41% | | | | 2.96% | | 6.06% |
| Supplemental Data | | | | | | | | | | | | | | | | | | | | |
| Net assets, end of period (in millions) | | $ 971 | | | | $ 661 | | $ 176 | | | | $ 188 | | | | $ 886 | | $ 1,295 |
A Annualized
B Total returns for periods of less than one year are not annualized.
C Total returns would have been lower had certain expenses not been reduced during the periods shown.
D Expense ratios reflect operating expenses of the class. Expenses before reductions do not reflect amounts reimbursed by the investment adviser or reductions from brokerage service arrangements or other expense offset arrangements and do not
represent the amount paid by the class during periods when reimbursements or reductions occur. Expenses net of any voluntary waivers reflect expenses after reimbursement by the investment adviser but prior to reductions from brokerage service
arrangements or other expense offset arrangements. Expenses net of all reductions represent the net expenses paid by the class.
|
| Financial Highlights Class III | | | | | | | | | | | | | | | | | | | | |
| | | Six months ended | | | | | | | | | | | | | | | | |
| | | September 30, 2005 | | | | Years ended March 31, |
| | | (Unaudited) | | | | 2005 | | 2004 | | | | 2003 | | | | 2002 | | 2001 |
| Selected Per Share Data | | | | | | | | | | | | | | | | | | | | |
| Net asset value, beginning of period | | $ 1.00 | | | | $ 1.00 | | $ 1.00 | | | | $ 1.00 | | | | $ 1.00 | | $ 1.00 |
| Income from Investment Operations | | | | | | | | | | | | | | | | | | | | |
| Net investment income | | 014 | | | | .014 | | .007 | | | | .013 | | | | .029 | | .060 |
| Distributions from net investment income | | (.014) | | | | (.014) | | (.007) | | | | (.013) | | | | (.029) | | (.060) |
| Net asset value, end of period | | $ 1.00 | | | | $ 1.00 | | $ 1.00 | | | | $ 1.00 | | | | $ 1.00 | | $ 1.00 |
| Total ReturnB,C | | 1.43% | | | | 1.36% | | .74% | | | | 1.31% | | | | 2.91% | | 6.16% |
| Ratios to Average Net AssetsD | | | | | | | | | | | | | | | | | | | | |
| Expenses before expense reductions | | 48%A | | | | .48% | | .48% | | | | .49% | | | | .49% | | .50% |
| Expenses net of voluntary waivers, if any | | 45%A | | | | .45% | | .45% | | | | .45% | | | | .45% | | .45% |
| Expenses net of all reductions | | 45%A | | | | .45% | | .45% | | | | .45% | | | | .45% | | .45% |
| Net investment income | | 2.85%A | | | | 1.43% | | .74% | | | | 1.32% | | | | 2.81% | | 5.96% |
| Supplemental Data | | | | | | | | | | | | | | | | | | | | |
| Net assets, end of period (in millions) | | $ 2,362 | | | | $ 1,123 | | $ 898 | | | | $ 1,187 | | | | $ 1,407 | | $ 1,531 |
A Annualized
B Total returns for periods of less than one year are not annualized.
C Total returns would have been lower had certain expenses not been reduced during the periods shown.
D Expense ratios reflect operating expenses of the class. Expenses before reductions do not reflect amounts reimbursed by the investment adviser or reductions from brokerage service arrangements or other expense offset arrangements and do not
represent the amount paid by the class during periods when reimbursements or reductions occur. Expenses net of any voluntary waivers reflect expenses after reimbursement by the investment adviser but prior to reductions from brokerage service
arrangements or other expense offset arrangements. Expenses net of all reductions represent the net expenses paid by the class.
|
See accompanying notes which are an integral part of the financial statements.
|
33 Semiannual Report
| Financial Highlights Select Class | | | | | | | | | | | | | | |
| | Six months ended | | | | | | | | | | | | |
| | | September 30, 2005 | | | | | | Years ended March 31, | | |
| | | (Unaudited) | | | | 2005 | | 2004 | | 2003 | | 2002D |
| Selected Per Share Data | | | | | | | | | | | | | | |
| Net asset value, beginning of period | | $ 1.00 | | | | $ 1.00 | | $ 1.00 | | $ 1.00 | | $ 1.00 |
| Income from Investment Operations | | | | | | | | | | | | | | |
| Net investment income | | 015 | | | | .016 | | .009 | | .015 | | .004 |
| Distributions from net investment income | | (.015) | | | | (.016) | | (.009) | | (.015) | | (.004) |
| Net asset value, end of period | | $ 1.00 | | | | $ 1.00 | | $ 1.00 | | $ 1.00 | | $ 1.00 |
| Total ReturnB,C | | 1.54% | | | | 1.57% | | .95% | | 1.51% | | .37% |
| Ratios to Average Net AssetsE | | | | | | | | | | | | | | |
| Expenses before expense reductions | | 28%A | | | | .28% | | .28% | | .29% | | .27%A |
| Expenses net of voluntary waivers, if any | | 25%A | | | | .25% | | .25% | | .25% | | .25%A |
| Expenses net of all reductions | | 25%A | | | | .25% | | .25% | | .25% | | .25%A |
| Net investment income | | 3.05%A | | | | 1.63% | | .94% | | 1.52% | | 1.44%A |
| Supplemental Data | | | | | | | | | | | | | | |
| Net assets, end of period (in millions) | | $ 117 | | | | $ 106 | | $ 114 | | $ 134 | | $ 5 |
A Annualized
B Total returns for periods of less than one year are not annualized.
C Total returns would have been lower had certain expenses not been reduced during the periods shown.
D For the period January 17, 2002 (commencement of sale of shares) to March 31, 2002.
E Expense ratios reflect operating expenses of the class. Expenses before reductions do not reflect amounts reimbursed by the investment adviser or reductions from brokerage service arrangements or other expense offset arrangements and do not
represent the amount paid by the class during periods when reimbursements or reductions occur. Expense ratios before reductions for start up periods may not be representative of longer term operating periods. Expenses net of any voluntary
waivers reflect expenses after reimbursement by the investment adviser but prior to reductions from brokerage service arrangements or other expense offset arrangements. Expenses net of all reductions represent the net expenses paid by the class.
|
| See accompanying notes which are an integral part of the financial statements. | | |
| Semiannual Report | | 34 |
Money Market Portfolio
Investment Changes
|
| Maturity Diversification | | | | | | |
| Days | | % of fund’s | | % of fund’s | | % of fund’s |
| | | investments | | investments | | investments |
| | | 9/30/05 | | 3/31/05 | | 9/30/04 |
| 0 - 30 | | 53.0 | | 48.3 | | 41.3 |
| 31 - 90 | | 35.2 | | 37.0 | | 25.2 |
| 91 - 180 | | 7.3 | | 13.5 | | 26.4 |
| 181 - 397 | | 4.5 | | 1.2 | | 7.1 |
| Weighted Average Maturity | | | | | | |
| | | 9/30/05 | | 3/31/05 | | 9/30/04 |
| Money Market Portfolio | | 41 Days | | 44 Days | | 72 Days |
| All Taxable Money Market Funds Average* | | 38 Days | | 38 Days | | 43 Days |
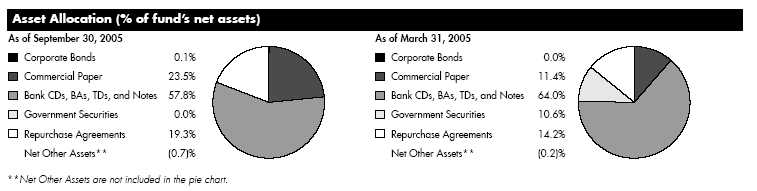
*Source: iMoneyNet, Inc.
35 Semiannual Report
Money Market Portfolio
Investments September 30, 2005 (Unaudited)
Showing Percentage of Net Assets
|
| Corporate Bonds 0.1% | | | | | | |
| Due | | Annualized Yield | | | | Principal | | Value (Note 1) |
| Date | | at Time of | | | | Amount (000s) | | (000s) |
| | | Purchase | | | | | | |
| Morgan Stanley | | | | | | | | | | |
| 4/15/06 | | 3.90% | | | | | $ | 10,000 | | $ 10,107 |
| |
| Certificates of Deposit 29.6% | | |
| |
| Domestic Certificates Of Deposit 2.0% | | | | |
| Huntington National Bank, Columbus | | | | | | |
| 10/24/05 | | 3.41 | | | | | | 15,000 | | 15,000 |
| 11/10/05 | | 3.50 | | | | | | 4,000 | | 4,000 |
| PNC Bank NA, Pittsburgh | | | | | | | | |
| 12/21/05 | | 3.61 | | | | | | 40,000 | | 40,000 |
| Washington Mutual Bank FA | | | | | | | | |
| 12/13/05 | | 3.90 | | | | | | 60,000 | | 59,993 |
| Washington Mutual Bank, California | | | | | | |
| 11/1/05 | | 3.70 | | | | | | 45,000 | | 45,000 |
| Wells Fargo Bank NA, San Francisco | | | | | | |
| 10/28/05 | | 3.69 | | | | | | 138,000 | | 138,000 |
| | | | | | | | | | | 301,993 |
| London Branch, Eurodollar, Foreign Banks – 14.4% | | |
| Banco Bilbao Vizcaya Argentaria SA | | | | | | |
| 11/25/05 | | 3.80 | | | | | | 50,000 | | 50,000 |
| Barclays Bank PLC | | | | | | | | | | |
| 10/21/05 | | 3.79 | | | | | | 315,000 | | 314,996 |
| Credit Agricole SA | | | | | | | | | | |
| 11/1/05 | | 3.80 | | | | | | 115,000 | | 115,000 |
| 3/31/06 | | 3.88 | | | | | | 115,000 | | 115,000 |
| Credit Industriel et Commercial | | | | | | | | |
| 1/30/06 | | 4.05 | | | | | | 75,000 | | 75,000 |
| 1/30/06 | | 4.06 | | | | | | 75,000 | | 75,000 |
| 1/30/06 | | 4.08 | | | | | | 75,000 | | 75,000 |
| 4/20/06 | | 3.95 | | | | | | 75,000 | | 75,000 |
| 4/21/06 | | 3.97 | | | | | | 100,000 | | 100,000 |
| Dresdner Bank AG | | | | | | | | | | |
| 10/24/05 | | 3.51 | | | | | | 130,000 | | 130,000 |
| ING Bank NV | | | | | | | | | | |
| 11/1/05 | | 3.80 | | | | | | 185,000 | | 185,000 |
| Landesbank Hessen Thuringen | | | | | | | | |
| 11/14/05 | | 3.46 | | | | | | 190,000 | | 190,000 |
| Royal Bank of Scotland PLC | | | | | | | | |
| 11/1/05 | | 3.80 | | | | | | 300,000 | | 300,000 |
| Societe Generale | | | | | | | | | | |
| 12/22/05 | | 3.00 | | | | | | 50,000 | | 50,000 |
| 4/28/06 | | 4.00 | | | | | | 150,000 | | 150,000 |
| Unicredito Italiano Spa | | | | | | | | |
| 11/16/05 | | 3.76 | | | | | | 155,000 | | 155,001 |
| | | | | | | | | | | 2,154,997 |
| New York Branch, Yankee Dollar, Foreign Banks – 13.2% | | |
| Bank of Tokyo Mitsubishi Ltd. | | | | | | | | |
| 10/28/05 | | 3.79 | | | | | | 56,000 | | 56,000 |
| Due | | Annualized Yield | | | | Principal | | Value (Note 1) |
| Date | | at Time of | | | | Amount (000s) | | (000s) |
| | | Purchase | | | | | | | | |
| 11/1/05 | | 3.79% | | | $ | 200,000 | | $ | | 200,000 |
| Barclays Bank PLC | | | | | | | | | | |
| 11/1/05 | | 3.78 | | | | 160,000 | | | | 160,000 |
| 12/2/05 | | 3.71 | | | | 183,000 | | | | 183,000 |
| Canadian Imperial Bank of Commerce | | | | | | | | |
| 10/17/05 | | 3.83 (c) | | | | 155,000 | | | | 155,000 |
| Credit Industriel et Commercial | | | | | | | | |
| 2/13/06 | | 4.00 | | | | 77,000 | | | | 77,000 |
| 2/15/06 | | 4.01 | | | | 100,000 | | | | 100,000 |
| Credit Suisse First Boston New York Branch | | | | |
| 10/19/05 | | 3.58 (c) | | | | 90,000 | | | | 90,000 |
| 10/19/05 | | 3.77 (c) | | | | 80,000 | | | | 80,000 |
| Deutsche Bank AG | | | | | | | | | | |
| 12/5/05 | | 3.73 (c) | | | | 155,000 | | | | 155,000 |
| Dresdner Bank AG | | | | | | | | | | |
| 1/13/06 | | 3.78 | | | | 105,000 | | | | 105,000 |
| Eurohypo AG | | | | | | | | | | |
| 11/23/05 | | 3.80 | | | | 50,000 | | | | 50,000 |
| Mizuho Corporate Bank Ltd. | | | | | | | | |
| 11/1/05 | | 3.83 | | | | 115,000 | | | | 115,000 |
| Skandinaviska Enskilda Banken AB | | | | | | | | |
| 10/6/05 | | 3.50 (c) | | | | 170,000 | | | | 169,981 |
| Svenska Handelsbanken AB | | | | | | | | |
| 11/30/05 | | 3.70 | | | | 9,000 | | | | 9,000 |
| Toronto Dominion Bank | | | | | | | | |
| 4/7/06 | | 3.86 | | | | 100,000 | | | | 100,000 |
| 4/18/06 | | 3.92 | | | | 75,000 | | | | 75,000 |
| Unicredito Italiano Spa | | | | | | | | |
| 11/14/05 | | 3.73 (c) | | | | 105,000 | | | | 104,990 |
| | | | | | | | | | | 1,984,971 |
| |
| TOTAL CERTIFICATES OF DEPOSIT | | | | 4,441,961 |
| |
| Commercial Paper 23.5% | | | | | | | | |
| |
| Aspen Funding Corp. | | | | | | | | |
| 10/24/05 | | 3.78 | | | | 15,000 | | | | 14,964 |
| Capital One Multi Asset Execution Trust | | | | | | |
| 10/5/05 | | 3.52 | | | | 15,000 | | | | 14,994 |
| 10/12/05 | | 3.55 | | | | 5,000 | | | | 4,995 |
| 11/21/05 | | 3.80 | | | | 50,000 | | | | 49,734 |
| 12/13/05 | | 3.92 | | | | 30,000 | | | | 29,764 |
| Citibank Credit Card Master Trust I (Dakota Certificate Program) |
| 10/25/05 | | 3.78 | | | | 27,000 | | | | 26,932 |
| 10/26/05 | | 3.70 | | | | 175,000 | | | | 174,553 |
| 10/26/05 | | 3.78 | | | | 25,000 | | | | 24,935 |
| Countrywide Financial Corp. | | | | | | | | |
| 10/17/05 | | 3.81 | | | | 43,000 | | | | 42,927 |
| 10/26/05 | | 3.85 | | | | 50,000 | | | | 49,867 |
| 10/27/05 | | 3.85 | | | | 29,000 | | | | 28,920 |
See accompanying notes which are an integral part of the financial statements.
Semiannual Report 36
| Commercial Paper continued | | | | | | |
| Due | | Annualized Yield | | | | Principal | | Value (Note 1) |
| Date | | at Time of | | | | Amount (000s) | | (000s) |
| | | Purchase | | | | | | | | |
| Dresdner U.S. Finance, Inc. | | | | | | | | |
| 11/7/05 | | 3.70% | | | $ | 90,000 | | $ | | 89,660 |
| Emerald (MBNA Credit Card Master Note Trust) | | | | |
| 10/11/05 | | 3.60 | | | | 10,000 | | | | 9,990 |
| 10/25/05 | | 3.63 | | | | 35,000 | | | | 34,916 |
| 11/3/05 | | 3.73 | | | | 101,000 | | | | 100,657 |
| 12/20/05 | | 4.00 | | | | 69,300 | | | | 68,690 |
| 12/21/05 | | 4.00 | | | | 60,000 | | | | 59,465 |
| Eurohypo AG | | | | | | | | | | |
| 10/3/05 | | 3.51 | | | | 45,000 | | | | 44,991 |
| 10/31/05 | | 3.58 | | | | 125,000 | | | | 124,631 |
| FCAR Owner Trust | | | | | | | | | | |
| 10/4/05 | | 3.35 | | | | 5,000 | | | | 4,999 |
| Giro Funding US Corp. | | | | | | | | |
| 10/28/05 | | 3.79 | | | | 20,000 | | | | 19,943 |
| 10/31/05 | | 3.80 | | | | 11,000 | | | | 10,965 |
| 11/8/05 | | 3.75 | | | | 10,000 | | | | 9,961 |
| Govco, Inc. | | | | | | | | | | |
| 3/16/06 | | 4.01 | | | | 50,000 | | | | 49,094 |
| Market Street Funding Corp. | | | | | | | | |
| 10/4/05 | | 3.68 | | | | 200,000 | | | | 199,939 |
| 10/4/05 | | 3.69 | | | | 10 | | | | 10 |
| 10/20/05 | | 3.79 | | | | 65,000 | | | | 64,870 |
| Motown Notes Program | | | | | | | | |
| 10/5/05 | | 3.53 | | | | 20,000 | | | | 19,992 |
| 10/12/05 | | 3.80 | | | | 10,000 | | | | 9,988 |
| 11/2/05 | | 3.72 | | | | 55,000 | | | | 54,820 |
| 11/3/05 | | 3.72 | | | | 17,686 | | | | 17,626 |
| 11/4/05 | | 3.72 | | | | 55,000 | | | | 54,808 |
| 11/4/05 | | 3.75 | | | | 75,000 | | | | 74,736 |
| 11/8/05 | | 3.77 | | | | 20,000 | | | | 19,921 |
| 11/14/05 | | 3.78 | | | | 25,000 | | | | 24,885 |
| 11/14/05 | | 3.83 | | | | 74,000 | | | | 73,656 |
| 11/21/05 | | 3.85 | | | | 130,000 | | | | 129,296 |
| 12/2/05 | | 3.73 | | | | 70,000 | | | | 69,554 |
| 12/12/05 | | 3.85 | | | | 45,000 | | | | 44,657 |
| 12/13/05 | | 3.95 | | | | 25,000 | | | | 24,802 |
| 12/14/05 | | 3.87 | | | | 50,000 | | | | 49,606 |
| 12/16/05 | | 3.88 | | | | 47,000 | | | | 46,619 |
| Newcastle (Discover Card Master Trust) | | | | | | |
| 10/19/05 | | 3.80 | | | | 25,000 | | | | 24,953 |
| 10/20/05 | | 3.79 | | | | 10,000 | | | | 9,980 |
| 10/24/05 | | 3.79 | | | | 15,000 | | | | 14,964 |
| 11/21/05 | | 3.80 | | | | 95,836 | | | | 95,326 |
| 12/14/05 | | 3.87 | | | | 30,000 | | | | 29,764 |
| Oracle Corp. | | | | | | | | | | |
| 11/1/05 | | 3.73 | | | | 40,000 | | | | 39,873 |
| Paradigm Funding LLC | | | | | | | | |
| 10/7/05 | | 3.51 | | | | 35,000 | | | | 34,980 |
| 11/16/05 | | 3.75 | | | | 100,000 | | | | 99,526 |
| Due | | Annualized Yield | | | | Principal | | Value (Note 1) |
| Date | | at Time of | | | | Amount (000s) | | (000s) |
| | | Purchase | | | | | | | | |
| Park Granada LLC | | | | | | | | | | |
| 10/3/05 | | 3.65% | | | $ | 125,000 | | $ | | 124,975 |
| 10/11/05 | | 3.70 | | | | 10,000 | | | | 9,990 |
| 10/28/05 | | 3.72 | | | | 10,000 | | | | 9,972 |
| 10/31/05 | | 3.83 | | | | 165,000 | | | | 164,475 |
| 11/1/05 | | 3.69 | | | | 85,000 | | | | 84,732 |
| 11/1/05 | | 3.70 | | | | 25,000 | | | | 24,921 |
| 11/2/05 | | 3.70 | | | | 15,000 | | | | 14,951 |
| Sigma Finance, Inc. | | | | | | | | | | |
| 10/5/05 | | 3.51 (a) | | | | 25,000 | | | | 24,990 |
| Strand Capital LLC | | | | | | | | | | |
| 11/1/05 | | 3.84 | | | | 50,000 | | | | 49,835 |
| 11/7/05 | | 3.63 | | | | 15,000 | | | | 14,945 |
| 1/17/06 | | 3.91 | | | | 10,000 | | | | 9,884 |
| 1/18/06 | | 3.92 | | | | 50,000 | | | | 49,414 |
| Stratford Receivables Co. LLC | | | | | | | | |
| 10/3/05 | | 3.80 | | | | 100,000 | | | | 99,979 |
| 10/7/05 | | 3.77 | | | | 50,000 | | | | 49,969 |
| 10/7/05 | | 3.80 | | | | 5,000 | | | | 4,997 |
| 10/17/05 | | 3.80 | | | | 10,000 | | | | 9,983 |
| 10/17/05 | | 3.81 | | | | 25,000 | | | | 24,958 |
| 10/20/05 | | 3.81 | | | | 45,000 | | | | 44,910 |
| 10/20/05 | | 3.82 | | | | 121,730 | | | | 121,485 |
| 10/24/05 | | 3.83 | | | | 60,000 | | | | 59,854 |
| 11/3/05 | | 3.84 | | | | 50,496 | | | | 50,319 |
| 11/4/05 | | 3.71 | | | | 50,000 | | | | 49,826 |
| TOTAL COMMERCIAL PAPER | | | | | | 3,519,062 |
| |
| Master Notes 3.2% | | | | | | | | |
| |
| Bear Stearns Companies, Inc. | | | | | | | | |
| 10/12/05 | | 3.77 (e) | | | | 54,000 | | | | 54,000 |
| Goldman Sachs Group, Inc. | | | | | | | | |
| 10/11/05 | | 3.78 (c)(e) | | | | 206,000 | | | | 206,000 |
| 11/28/05 | | 3.89 (c)(e) | | | | 221,000 | | | | 221,000 |
| TOTAL MASTER NOTES | | | | | | | | 481,000 |
| |
| Medium Term Notes 20.6% | | | | | | |
| |
| AIG Matched Funding Corp. | | | | | | | | |
| 12/15/05 | | 3.89 (c) | | | | 85,000 | | | | 85,000 |
| 1/3/06 | | 4.06 (b)(c) | | | | 70,000 | | | | 70,000 |
| 1/11/06 | | 4.13 (b)(c) | | | | 70,000 | | | | 70,000 |
| 1/23/06 | | 4.02 (c) | | | | 75,000 | | | | 75,000 |
| Allstate Life Global Funding II | | | | | | | | |
| 10/10/05 | | 3.72 (a)(c) | | | | 25,000 | | | | 25,000 |
| 10/17/05 | | 3.79 (a)(c) | | | | 20,000 | | | | 20,000 |
| 10/17/05 | | 3.80 (a)(c) | | | | 25,000 | | | | 25,000 |
| 10/27/05 | | 3.82 (a)(c) | | | | 11,000 | | | | 11,000 |
See accompanying notes which are an integral part of the financial statements.
37 Semiannual Report
Money Market Portfolio
Investments (Unaudited) - continued
|
| Medium Term Notes continued | | | | |
| Due | | Annualized Yield at | | | | Principal | | Value (Note 1) |
| Date | | Time of Purchase | | | | Amount (000s) | | (000s) |
| Australia & New Zealand Banking Group Ltd. | | | | |
| 10/24/05 | | 3.81% (a)(c) | | | $ | 44,000 | | $ | | 44,000 |
| Bayerische Landesbank Girozentrale | | | | | | | | |
| 10/15/05 | | 3.58 (c) | | | | 115,000 | | | | 115,000 |
| 11/21/05 | | 3.82 (c) | | | | 155,000 | | | | 155,000 |
| BellSouth Telecommunications | | | | | | | | |
| 12/5/05 | | 3.82 (c) | | | | 35,000 | | | | 35,000 |
| BMW U.S. Capital LLC | | | | | | | | |
| 10/17/05 | | 3.74 (c) | | | | 19,000 | | | | 19,000 |
| Commonwealth Bank of Australia | | | | | | | | |
| 10/24/05 | | 3.80 (c) | | | | 41,000 | | | | 41,000 |
| Descartes Funding Trust | | | | | | | | |
| 10/17/05 | | 3.77 (c) | | | | 30,000 | | | | 30,000 |
| Eli Lilly Services, Inc. | | | | | | | | |
| 10/3/05 | | 3.66 (a)(c) | | | | 40,000 | | | | 40,000 |
| GE Capital Assurance Co. | | | | | | | | |
| 10/3/05 | | 3.77 (c)(e) | | | | 40,000 | | | | 40,000 |
| General Electric Capital Corp. | | | | | | | | |
| 10/7/05 | | 3.68 (c) | | | | 200,000 | | | | 200,000 |
| HBOS Treasury Services PLC | | | | | | | | |
| 11/21/05 | | 3.87 (a)(c) | | | | 18,000 | | | | 18,006 |
| 12/28/05 | | 4.01 (c) | | | | 150,000 | | | | 150,000 |
| HSBC Finance Corp. | | | | | | | | |
| 10/24/05 | | 3.82 (c) | | | | 51,000 | | | | 51,000 |
| HSH Nordbank AG | | | | | | | | |
| 10/24/05 | | 3.83 (a)(c) | | | | 54,000 | | | | 54,000 |
| ING USA Annuity & Life Insurance Co. | | | | | | | | |
| 12/28/05 | | 4.04 (c)(e) | | | | 30,000 | | | | 30,000 |
| MBIA Global Funding LLC | | | | | | | | |
| 10/18/05 | | 3.57 (a)(c) | | | | 23,000 | | | | 23,000 |
| Merrill Lynch & Co., Inc. | | | | | | | | |
| 10/17/05 | | 3.75 (c) | | | | 82,000 | | | | 82,000 |
| Metropolitan Life Insurance Co. | | | | | | | | |
| 10/6/05 | | 3.67 (a)(c) | | | | 40,994 | | | | 40,994 |
| Morgan Stanley | | | | | | | | | | |
| 10/3/05 | | 3.67 (c) | | | | 150,000 | | | | 150,000 |
| 10/3/05 | | 3.97 (c) | | | | 25,000 | | | | 25,000 |
| 10/4/05 | | 3.71 (c) | | | | 40,000 | | | | 40,000 |
| 10/17/05 | | 3.80 (c) | | | | 57,000 | | | | 57,000 |
| 10/27/05 | | 3.87 (c) | | | | 107,000 | | | | 107,003 |
| Pacific Life Global Funding | | | | | | | | |
| 10/4/05 | | 3.70 (a)(c) | | | | 25,000 | | | | 25,000 |
| 10/13/05 | | 3.76 (c) | | | | 10,000 | | | | 10,000 |
| RACERS | | | | | | | | | | |
| 10/24/05 | | 3.82 (a)(c) | | | | 170,000 | | | | 170,000 |
| Royal Bank of Canada | | | | | | | | |
| 10/10/05 | | 3.74 (c) | | | | 20,000 | | | | 20,000 |
| Due | | Annualized Yield at | | | | Principal | | Value (Note 1) |
| Date | | Time of Purchase | | | | Amount (000s) | | (000s) |
| Royal Bank of Scotland PLC | | | | | | | | |
| 10/21/05 | | 3.78% (a)(c) | | | $ | 100,000 | | $ | | 100,000 |
| SBC Communications, Inc. | | | | | | | | |
| 6/5/06 | | 3.96 (a) | | | | 34,640 | | | | 34,724 |
| Security Life of Denver Insurance Co. | | | | | | | | |
| 11/30/05 | | 3.94 (c)(e) | | | | 20,000 | | | | 20,000 |
| Verizon Global Funding Corp. | | | | | | | | |
| 10/17/05 | | 3.98 (c) | | | | 235,000 | | | | 235,000 |
| Wachovia Asset Securitization Issuance LLC | | | | |
| 10/25/05 | | 3.82 (a)(c) | | | | 20,000 | | | | 20,000 |
| Washington Mutual Bank, California | | | | | | | | |
| 10/27/05 | | 3.64 (c) | | | | 100,000 | | | | 100,000 |
| 11/4/05 | | 3.70 (c) | | | | 94,000 | | | | 94,000 |
| 12/20/05 | | 3.87 (c) | | | | 81,000 | | | | 81,000 |
| 12/28/05 | | 3.94 (c) | | | | 100,000 | | | | 99,996 |
| WestLB AG | | | | | | | | | | |
| 10/11/05 | | 3.74 (a)(c) | | | | 58,000 | | | | 58,000 |
| 12/30/05 | | 4.02 (a)(c) | | | | 59,000 | | | | 59,000 |
| Westpac Banking Corp. | | | | | | | | |
| 12/12/05 | | 3.84 (c) | | | | 40,000 | | | | 40,000 |
| TOTAL MEDIUM-TERM NOTES | | | | | | 3,094,723 |
| |
| Short Term Notes 4.2% | | | | | | | | |
| |
| Hartford Life Insurance Co. | | | | | | | | |
| 12/1/05 | | 4.02 (c)(e) | | | | 65,000 | | | | 65,000 |
| Jackson National Life Insurance Co. | | | | | | | | |
| 10/1/05 | | 3.64 (c)(e) | | | | 47,000 | | | | 47,000 |
| Metropolitan Life Insurance Co. | | | | | | | | |
| 10/3/05 | | 3.64 (c)(e) | | | | 65,000 | | | | 65,000 |
| 10/28/05 | | 3.91 (a)(c) | | | | 25,000 | | | | 25,000 |
| Monumental Life Insurance Co. | | | | | | | | |
| 10/3/05 | | 3.83 (c)(e) | | | | 36,000 | | | | 36,000 |
| 10/3/05 | | 3.86 (c)(e) | | | | 55,000 | | | | 55,000 |
| New York Life Insurance Co. | | | | | | | | |
| 12/31/05 | | 4.15 (c)(e) | | | | 215,000 | | | | 215,000 |
| Transamerica Occidental Life Insurance Co. | | | | |
| 11/1/05 | | 3.86 (c)(e) | | | | 95,000 | | | | 95,000 |
| Travelers Insurance Co. | | | | | | | | |
| 10/1/05 | | 3.60 (c)(e) | | | | 30,000 | | | | 30,000 |
| TOTAL SHORT TERM NOTES | | | | | | | | 633,000 |
| |
| Municipal Securities 0.2% | | | | | | |
| |
| California Statewide Cmntys. Dev. | | | | | | | | |
| Auth. Rev. TRAN Series C4, | | | | | | | | |
| 3.93% 6/30/06 | | | | 28,000 | | | | 28,000 |
See accompanying notes which are an integral part of the financial statements.
Semiannual Report 38
| Repurchase Agreements 19.3% | | |
| |
| | | Maturity | | Value (Note 1) |
| | | Amount | | (000s) |
| | | (000s) | | |
| |
| In a joint trading account (Collateralized | | |
| by U.S. Government Obligations) | | |
| dated 9/30/05 due 10/3/05 At: | | |
| 3.9% | | $ 291,102 | | $ 291,008 |
| 3.91% | | 209,915 | | 209,847 |
| With: | | | | |
| Banc of America Securities LLC At 4%, | | |
| dated 9/30/05 due 10/3/05 | | |
| (Collateralized by Commercial Paper | | |
| Obligations valued at | | | | |
| $284,580,001, 0%, 10/7/05 | | |
| 12/30/05) | | 279,093 | | 279,000 |
| Barclays Capital, Inc. At 4.05%, dated | | |
| 9/30/05 due 10/3/05 | | | | |
| (Collateralized by Equity Securities | | |
| valued at $80,850,032) | | 77,026 | | 77,000 |
| Citigroup Global Markets, Inc. At 4%, | | |
| dated 9/30/05 due 10/3/05: | | |
| (Collateralized by Corporate | | |
| Obligations valued at | | | | |
| $222,360,000, 2.88% | | 8.13%, | | |
| 6/1/08 – 6/25/35) | | 218,073 | | 218,000 |
| (Collateralized by Mortgage Loan | | |
| Obligations valued at | | | | |
| $458,039,179, 3.26% | | 7.9%, | | |
| 10/15/10 – 5/15/44) | | 439,146 | | 439,000 |
| Credit Suisse First Boston, Inc. At | | |
| 4.04%, dated 9/30/05 due | | |
| 10/3/05 (Collateralized by | | |
| Mortgage Loan Obligations valued at | | |
| $593,253,014, 0% 12.05%, | | |
| 12/1/06 – 5/25/43) | | 565,190 | | 565,000 |
| Goldman Sachs & Co. At: | | | | |
| 4.04%, dated: | | | | |
| 8/23/05 due 11/21/05 | | | | |
| (Collateralized by Corporate | | |
| Obligations valued at | | | | |
| $183,750,005, 7.31% | | | | |
| 7/10/13) (c)(d) | | 176,768 | | 175,000 |
| 9/30/05 due 10/3/05 | | | | |
| (Collateralized by Mortgage | | |
| Loan Obligations valued at | | |
| $76,650,000, 6.53% | | 7.34%, | | |
| 9/10/09 – 5/15/16) | | 73,025 | | 73,000 |
| | | Maturity | | Value (Note 1) |
| | | Amount | | (000s) |
| | | (000s) | | |
| |
| 4.05%, dated 8/23/05 due | | | | |
| 11/21/05 (Collateralized by | | | | |
| Corporate Obligations valued at | | | | |
| $63,000,143, 1% 7.5%, 7/1/06 | | | | |
| – 1/15/31) (c)(d) | | $ 60,608 | | $ 60,000 |
| Lehman Brothers, Inc. At 4.06%, dated | | | | |
| 9/30/05 due 10/3/05 | | | | |
| (Collateralized by Equity Securities | | | | |
| valued at $525,022,091) | | 500,169 | | 500,000 |
| |
| TOTAL REPURCHASE AGREEMENTS | | | | 2,886,855 |
| |
| |
| TOTAL INVESTMENT PORTFOLIO 100.7% | | |
| (Cost $15,094,708) | | | | 15,094,708 |
| |
| |
| NET OTHER ASSETS (0.7)% | | | | (103,017) |
| |
| NET ASSETS 100% | | | | $14,991,691 |
Security Type Abbreviation
TRAN - TAX AND REVENUE ANTICIPATION NOTE
Legend
(a) Security exempt from registration under Rule 144A of the Securities Act
of 1933. These securities may be resold in transactions exempt from
registration, normally to qualified institutional buyers. At the period end,
the value of these securities amounted to $817,714,000 or 5.5% of net
assets.
(b) Security or a portion of the security purchased on a delayed delivery or
when-issued basis.
(c) The coupon rate shown on floating or adjustable rate securities represents
the rate at period end. The due dates on these types of securities reflect
the next interest rate reset date or, when applicable, the final maturity
date.
(d) The maturity amount is based on the rate at period end.
|
See accompanying notes which are an integral part of the financial statements.
39 Semiannual Report
Investments (Unaudited) - continued
(e) Restricted securities – Investment in securities not registered under the
Securities Act of 1933 (excluding 144A issues). At the end of the period,
the value of restricted securities (excluding 144A issues) amounted to
$1,179,000,000 or 7.9% of net assets.
|
Additional information on each holding is as follows:
| Security | | Acquisition Date | | | | Cost (000s) |
| Bear Stearns Companies, Inc. 3.77%, | | | | | | |
| 10/12/05 | | 9/8/05 | | $ | | 54,000 |
| GE Capital Assurance Co. 3.77%, | | | | | | |
| 10/3/05 | | 4/1/05 | | $ | | 40,000 |
| Goldman Sachs Group, Inc.: | | | | | | |
| 3.78%, 10/11/05 | | 1/13/05 | | $ | | 206,000 |
| 3.89%, 11/28/05 | | 8/26/04 | | $ | | 221,000 |
| Hartford Life Insurance Co. 4.02%, | | | | | | |
| 12/1/05 | | 12/16/03 | | $ | | 65,000 |
| ING USA Annuity & Life Insurance | | | | | | |
| Co. 4.04%, 12/28/05 | | 6/23/05 | | $ | | 30,000 |
| Jackson National Life Insurance Co. | | | | | | |
| 3.64%, 10/1/05 | | 3/31/03 | | $ | | 47,000 |
| Metropolitan Life Insurance Co. | | | | | | |
| 3.64%, 10/3/05 | | 3/26/02 | | $ | | 65,000 |
| Monumental Life Insurance Co.: | | 7/31/98 - | | | | |
| 3.83%, 10/3/05 | | 9/17/98 | | $ | | 36,000 |
| 3.86%, 10/3/05 | | 3/12/99 | | $ | | 55,000 |
| New York Life Insurance Co. 4.15%, | | 2/28/02 - | | | | |
| 12/31/05 | | 12/19/02 | | $ | | 215,000 |
| Security Life of Denver Insurance Co. | | | | | | |
| 3.94%, 11/30/05 | | 8/26/05 | | $ | | 20,000 |
| Transamerica Occidental Life | | | | | | |
| Insurance Co. 3.86%, 11/1/05 | | 4/28/00 | | $ | | 95,000 |
| Travelers Insurance Co. 3.6%, | | | | | | |
| 10/1/05 | | 4/1/05 | | $ | | 30,000 |
At March 31, 2005, the fund had a capital loss carryforward of approximately $1,466,000 of which $414,000, $535,000 and $517,000 will expire on March 31, 2011, 2012 and 2013, respectively.
| See accompanying notes which are an integral part of the financial statements. | | |
| Semiannual Report | | 40 |
Money Market Portfolio
Financial Statements
|
| Statement of Assets and Liabilities | | | | | | |
| Amounts in thousands (except per share amounts) | | | | September 30, 2005 |
| | | | | | | | | | | (Unaudited) |
| Assets | | | | | | | | | | |
| Investment in securities, at value (in- | | | | | | | | | | |
| cluding repurchase agreements of | | | | | | | | |
| $2,886,855) (cost $15,094,708) | | | | | | | | | | |
| — See accompanying schedule | | | | | | | | $ | | 15,094,708 |
| Cash | | | | | | | | | | 1,989 |
| Receivable for fund shares sold | | | | | | | | | | 16,307 |
| Interest receivable | | | | | | | | | | 33,011 |
| Prepaid expenses | | | | | | | | | | 10 |
| Receivable from investment adviser | | | | | | | | | | |
| for expense reductions | | | | | | | | | | 596 |
| Other affiliated receivables | | | | | | | | | | 98 |
| Total assets | | | | | | | | | | 15,146,719 |
| |
| Liabilities | | | | | | | | | | |
| Payable for investments purchased | | | | | | | | | | |
| on a delayed delivery basis | | $ | | 140,000 | | | | |
| Distributions payable | | | | 11,713 | | | | |
| Accrued management fee | | | | 2,473 | | | | |
| Distribution fees payable | | | | 193 | | | | |
| Other affiliated payables | | | | 582 | | | | |
| Other payables and accrued ex- | | | | | | | | | | |
| penses | | | | 67 | | | | |
| Total liabilities | | | | | | | | | | 155,028 |
| |
| Net Assets | | | | | | | | $ | | 14,991,691 |
| Net Assets consist of: | | | | | | | | | | |
| Paid in capital | | | | | | | | $ | | 14,995,769 |
| Distributions in excess of net invest- | | | | | | | | | | |
| ment income | | | | | | | | | | (134) |
| Accumulated undistributed net real- | | | | | | | | | | |
| ized gain (loss) on investments | | | | | | | | | | (3,944) |
| Net Assets | | | | | | | | $ | | 14,991,691 |
| Calculation of Maximum Offering | | | | | | | | | | |
| Price | | | | | | | | | | |
| Class I: | | | | | | | | | | |
| Net Asset Value, offering price | | | | | | | | | | |
| and redemption price | | | | | | | | | | |
| per share ($13,387,270 ÷ | | | | | | | | | | |
| 13,389,963 shares) | | | | | | | | $ | | 1.00 |
| Class II: | | | | | | | | | | |
| Net Asset Value, offering price | | | | | | | | | | |
| and redemption price per share | | | | | | | | | | |
| ($223,679 ÷ 223,749 shares) | | . | | | | | | $ | | 1.00 |
| Class III: | | | | | | | | | | |
| Net Asset Value, offering price | | | | | | | | | | |
| and redemption price per share | | | | | | | | | | |
| ($863,326 ÷ 863,812 shares) | | . | | | | | | $ | | 1.00 |
| Select Class: | | | | | | | | | | |
| Net Asset Value, offering price and | | | | | | | | |
| redemption price per share | | | | | | | | | | |
| ($517,416 ÷ 517,433 shares) | | . | | | | | | $ | | 1.00 |
| Statement of Operations | | | | | | |
| Amounts in thousands | | Six months ended September 30, 2005 |
| | | | | | | (Unaudited) |
| Investment Income | | | | | | |
| Interest | | | | $ | | 229,862 |
| |
| Expenses | | | | | | |
| Management fee | | $ | | 13,915 | | |
| Transfer agent fees | | | | 1,081 | | |
| Distribution fees | | | | 1,340 | | |
| Accounting fees and expenses | | | | 519 | | |
| Independent trustees’ compensation | | | | 31 | | |
| Appreciation in deferred trustee | | | | | | |
| compensation account | | | | 3 | | |
| Custodian fees and expenses | | | | 102 | | |
| Registration fees | | | | 112 | | |
| Audit | | | | 54 | | |
| Legal | | | | 17 | | |
| Miscellaneous | | | | 84 | | |
| Total expenses before reductions | | | | 17,258 | | |
| Expense reductions | | | | (3,386) | | 13,872 |
| |
| Net investment income | | | | | | 215,990 |
| |
| Net realized gain (loss) on invest- | | | | | | |
| ment securities | | | | | | 10 |
| Net increase in net assets resulting | | | | | | |
| from operations | | | | $ | | 216,000 |
See accompanying notes which are an integral part of the financial statements.
41 Semiannual Report
| Money Market Portfolio | | | | | | | | | | | | | | | | | | | | | | | | |
| Financial Statements - continued | | | | | | | | | | | | | | | | | | | | | | |
| |
| |
| Statement of Changes in Net Assets | | | | | | | | | | | | | | | | | | | | | | | | |
| | | | | | | | | | | | | | | Six months ended | | | | Year ended |
| | | | | | | | | | | | | | | September 30, 2005 | | | | March 31, |
| Amounts in thousands | | | | | | | | | | | | | | (Unaudited) | | | | 2005 |
| Increase (Decrease) in Net Assets | | | | | | | | | | | | | | | | | | | | | | | | |
| Operations | | | | | | | | | | | | | | | | | | | | | | | | |
| Net investment income | | | | | | | | | | | | | | $ | | 215,990 | | $ | | 266,931 |
| Net realized gain (loss) | | | | | | | | | | | | | | | | | | 10 | | | | | | (2,674) |
| Net increase in net assets resulting from operations | | | | | | | | | | | | | | 216,000 | | | | 264,257 |
| Distributions to shareholders from net investment income | | | | | | | | | | | | | | (215,967) | | | | (267,263) |
| Share transactions - net increase (decrease) | | | | | | | | | | | | | | | | 2,492,752 | | | | (7,217,115) |
| Total increase (decrease) in net assets | | | | | | | | | | | | | | | | 2,492,785 | | | | (7,220,121) |
| |
| Net Assets | | | | | | | | | | | | | | | | | | | | | | | | |
| Beginning of period | | | | | | | | | | | | | | | | 12,498,906 | | | | 19,719,027 |
| End of period (including distributions in excess of net investment income of $134 and distributions in excess of net | | | | | | | | | | |
| investment income of $157, respectively) | | | | | | | | | | | | | | $ | | 14,991,691 | | $ | | 12,498,906 |
| |
| Financial Highlights Class I | | | | | | | | | | | | | | | | | | | | | | | | |
| | | Six months ended | | | | | | | | | | | | | | | | | | | | |
| | | September 30, 2005 | | | | Years ended March 31, |
| | | (Unaudited) | | | | 2005 | | 2004 | | | | 2003 | | | | 2002 | | | | | | 2001 |
| Selected Per Share Data | | | | | | | | | | | | | | | | | | | | | | | | |
| Net asset value, beginning of period | | $ 1.00 | | | | $ 1.00 | | $ 1.00 | | | | $ 1.00 | | | | $ 1.00 | | | | | | $ 1.00 |
| Income from Investment Operations | | | | | | | | | | | | | | | | | | | | | | | | |
| Net investment income | | 016 | | | | .016 | | .010 | | | | .016 | | | | .032 | | | | | | .063 |
| Distributions from net investment income | | (.016) | | | | (.016) | | (.010) | | | | (.016) | | | | (.032) | | | | | | (.063) |
| Net asset value, end of period | | $ 1.00 | | | | $ 1.00 | | $ 1.00 | | | | $ 1.00 | | | | $ 1.00 | | | | | | $ 1.00 |
| Total ReturnB,C | | 1.57% | | | | 1.58% | | 1.03% | | | | 1.59% | | | | 3.20% | | | | | | 6.47% |
| Ratios to Average Net AssetsD | | | | | | | | | | | | | | | | | | | | | | | | |
| Expenses before expense reductions | | 23%A | | | | .23% | | .23% | | | | .22% | | | | .23% | | | | | | .24% |
| Expenses net of voluntary waivers, if any | | 18%A | | | | .18% | | .18% | | | | .18% | | | | .18% | | | | | | .18% |
| Expenses net of all reductions | | 18%A | | | | .18% | | .18% | | | | .18% | | | | .18% | | | | | | .18% |
| Net investment income | | 3.12%A | | | | 1.50% | | 1.03% | | | | 1.58% | | | | 3.13% | | | | | | 6.26% |
| Supplemental Data | | | | | | | | | | | | | | | | | | | | | | | | |
| Net assets, end of period (in millions) | | $ 13,387 | | | | $ 11,389 | | $ 18,841 | | | | $ 16,325 | | | | $ 17,038 | | | | $ 19,337 |
A Annualized
B Total returns for periods of less than one year are not annualized.
C Total returns would have been lower had certain expenses not been reduced during the periods shown.
D Expense ratios reflect operating expenses of the class. Expenses before reductions do not reflect amounts reimbursed by the investment adviser or reductions from brokerage service arrangements or other expense offset arrangements and do not represent
the amount paid by the class during periods when reimbursements or reductions occur. Expenses net of any voluntary waivers reflect expenses after reimbursement by the investment adviser but prior to reductions from brokerage service arrangements or
other expense offset arrangements. Expenses net of all reductions represent the net expenses paid by the class.
|
| See accompanying notes which are an integral part of the financial statements. | | |
| Semiannual Report | | 42 |
| Financial Highlights Class II | | | | | | | | | | | | | | | | | | | | |
| | | Six months ended | | | | | | | | | | | | | | | | |
| | | September 30, 2005 | | | | Years ended March 31, |
| | | (Unaudited) | | | | 2005 | | 2004 | | | | 2003 | | | | 2002 | | 2001 |
| Selected Per Share Data | | | | | | | | | | | | | | | | | | | | |
| Net asset value, beginning of period | | $ 1.00 | | | | $ 1.00 | | $ 1.00 | | | | $ 1.00 | | | | $ 1.00 | | $ 1.00 |
| Income from Investment Operations | | | | | | | | | | | | | | | | | | | | |
| Net investment income | | 015 | | | | .014 | | .009 | | | | .014 | | | | .030 | | .061 |
| Distributions from net investment income | | (.015) | | | | (.014) | | (.009) | | | | (.014) | | | | (.030) | | (.061) |
| Net asset value, end of period | | $ 1.00 | | | | $ 1.00 | | $ 1.00 | | | | $ 1.00 | | | | $ 1.00 | | $ 1.00 |
| Total ReturnB,C | | 1.49% | | | | 1.43% | | .88% | | | | 1.46% | | | | 3.04% | | 6.31% |
| Ratios to Average Net AssetsD | | | | | | | | | | | | | | | | | | | | |
| Expenses before expense reductions | | 38%A | | | | .38% | | .38% | | | | .38% | | | | .37% | | .39% |
| Expenses net of voluntary waivers, if any | | 33%A | | | | .33% | | .33% | | | | .33% | | | | .33% | | .33% |
| Expenses net of all reductions | | 33%A | | | | .33% | | .33% | | | | .33% | | | | .33% | | .33% |
| Net investment income | | 2.97%A | | | | 1.35% | | .87% | | | | 1.43% | | | | 2.89% | | 6.11% |
| Supplemental Data | | | | | | | | | | | | | | | | | | | | |
| Net assets, end of period (in millions) | | $ 224 | | | | $ 168 | | $ 260 | | | | $ 206 | | | | $ 376 | | $ 271 |
A Annualized
B Total returns for periods of less than one year are not annualized.
C Total returns would have been lower had certain expenses not been reduced during the periods shown.
D Expense ratios reflect operating expenses of the class. Expenses before reductions do not reflect amounts reimbursed by the investment adviser or reductions from brokerage service arrangements or other expense offset arrangements and do not
represent the amount paid by the class during periods when reimbursements or reductions occur. Expenses net of any voluntary waivers reflect expenses after reimbursement by the investment adviser but prior to reductions from brokerage service
arrangements or other expense offset arrangements. Expenses net of all reductions represent the net expenses paid by the class.
|
| Financial Highlights Class III | | | | | | | | | | | | | | | | | | | | |
| | | Six months ended | | | | | | | | | | | | | | | | |
| | | September 30, 2005 | | | | Years ended March 31, |
| | | (Unaudited) | | | | 2005 | | 2004 | | | | 2003 | | | | 2002 | | 2001 |
| Selected Per Share Data | | | | | | | | | | | | | | | | | | | | |
| Net asset value, beginning of period | | $ 1.00 | | | | $ 1.00 | | $ 1.00 | | | | $ 1.00 | | | | $ 1.00 | | $ 1.00 |
| Income from Investment Operations | | | | | | | | | | | | | | | | | | | | |
| Net investment income | | 014 | | | | .013 | | .008 | | | | .013 | | | | .029 | | .060 |
| Distributions from net investment income | | (.014) | | | | (.013) | | (.008) | | | | (.013) | | | | (.029) | | (.060) |
| Net asset value, end of period | | $ 1.00 | | | | $ 1.00 | | $ 1.00 | | | | $ 1.00 | | | | $ 1.00 | | $ 1.00 |
| Total ReturnB,C | | 1.44% | | | | 1.33% | | .78% | | | | 1.34% | | | | 2.94% | | 6.20% |
| Ratios to Average Net AssetsD | | | | | | | | | | | | | | | | | | | | |
| Expenses before expense reductions | | 48%A | | | | .48% | | .48% | | | | .48% | | | | .48% | | .49% |
| Expenses net of voluntary waivers, if any | | 43%A | | | | .43% | | .43% | | | | .43% | | | | .43% | | .43% |
| Expenses net of all reductions | | 43%A | | | | .43% | | .43% | | | | .43% | | | | .43% | | .43% |
| Net investment income | | 2.87%A | | | | 1.25% | | .77% | | | | 1.33% | | | | 2.88% | | 6.01% |
| Supplemental Data | | | | | | | | | | | | | | | | | | | | |
| Net assets, end of period (in millions) | | $ 863 | | | | $ 926 | | $ 456 | | | | $ 439 | | | | $ 784 | | $ 789 |
A Annualized
B Total returns for periods of less than one year are not annualized.
C Total returns would have been lower had certain expenses not been reduced during the periods shown.
D Expense ratios reflect operating expenses of the class. Expenses before reductions do not reflect amounts reimbursed by the investment adviser or reductions from brokerage service arrangements or other expense offset arrangements and do not
represent the amount paid by the class during periods when reimbursements or reductions occur. Expenses net of any voluntary waivers reflect expenses after reimbursement by the investment adviser but prior to reductions from brokerage service
arrangements or other expense offset arrangements. Expenses net of all reductions represent the net expenses paid by the class.
|
See accompanying notes which are an integral part of the financial statements.
|
43 Semiannual Report
| Financial Highlights Select Class | | | | | | | | | | | | |
| | Six months ended | | | | | | | | | | | | |
| | | September 30, 2005 | | Years ended March 31, |
| | | (Unaudited) | | 2005 | | 2004 | | 2003 | | 2002D |
| Selected Per Share Data | | | | | | | | | | | | |
| Net asset value, beginning of period | | $ 1.00 | | $ 1.00 | | $ 1.00 | | $ 1.00 | | $ 1.00 |
| Income from Investment Operations | | | | | | | | | | | | |
| Net investment income | | 015 | | .015 | | .010 | | .015 | | .004 |
| Distributions from net investment income | | (.015) | | (.015) | | (.010) | | (.015) | | (.004) |
| Net asset value, end of period | | $ 1.00 | | $ 1.00 | | $ 1.00 | | $ 1.00 | | $ 1.00 |
| Total ReturnB,C | | 1.54% | | 1.53% | | .98% | | 1.54% | | .38% |
| Ratios to Average Net AssetsE | | | | | | | | | | | | |
| Expenses before expense reductions | | 28%A | | .28% | | .28% | | .28% | | .27%A |
| Expenses net of voluntary waivers, if any | | 23%A | | .23% | | .23% | | .23% | | .23%A |
| Expenses net of all reductions | | 23%A | | .23% | | .23% | | .23% | | .23%A |
| Net investment income | | 3.07%A | | 1.45% | | .98% | | 1.53% | | 1.90%A |
| Supplemental Data | | | | | | | | | | | | |
| Net assets, end of period (000 omitted) | | $ 517,416 | | $ 16,279 | | $ 161,505 | | $ 24,271 | | $ 100 |
A Annualized
B Total returns for periods of less than one year are not annualized.
C Total returns would have been lower had certain expenses not been reduced during the periods shown.
D For the period January 17, 2002 (commencement of sale of shares) to March 31, 2002.
E Expense ratios reflect operating expenses of the class. Expenses before reductions do not reflect amounts reimbursed by the investment adviser or reductions from brokerage service arrangements or other expense offset arrangements and do not
represent the amount paid by the class during periods when reimbursements or reductions occur. Expense ratios before reductions for start up periods may not be representative of longer term operating periods. Expenses net of any voluntary
waivers reflect expenses after reimbursement by the investment adviser but prior to reductions from brokerage service arrangements or other expense offset arrangements. Expenses net of all reductions represent the net expenses paid by the class.
|
| See accompanying notes which are an integral part of the financial statements. | | |
| Semiannual Report | | 44 |
| | Tax-Exempt Portfolio
Investment Changes
|
| Maturity Diversification | | | | | | |
| Days | | % of fund’s | | % of fund’s | | % of fund’s |
| | | investments | | investments | | investments |
| | | 9/30/05 | | 3/31/05 | | 9/30/04 |
| 0 - 30 | | 91.9 | | 93.6 | | 89.7 |
| 31 - 90 | | 0.8 | | 1.8 | | 0.8 |
| 91 - 180 | | 0.4 | | 3.3 | | 0.6 |
| 181 - 397 | | 6.9 | | 1.3 | | 8.9 |
| Weighted Average Maturity | | | | | | |
| | | 9/30/05 | | 3/31/05 | | 9/30/04 |
| Tax Exempt Portfolio | | 27 Days | | 14 Days | | 33 Days |
| All Tax Free Money Market Funds Average* | | 28 Days | | 26 Days | | 36 Days |

*Source: iMoneyNet, Inc.
45 Semiannual Report
| | Tax-Exempt Portfolio
Investments September 30, 2005 (Unaudited)
Showing Percentage of Net Assets
|
| Municipal Securities 95.2% | | | | | | | | |
| |
| | | | | | | Principal | | Value (Note 1) |
| | | | | | | Amount (000s) | | (000s) |
| |
| Alabama 1.0% | | | | | | | | | | | | |
| ABN AMRO Muni. Tops Ctfs. Trust | | | | | | | | | | |
| Participating VRDN Series AAB 20, | | | | | | | | | | |
| 2.77% (Liquidity Facility ABN AMRO | | | | | | | | | | |
| Bank NV) (b)(e) | | | | | | $ | | 17,190 | | $ | | 17,190 |
| Jefferson County Swr. Rev. Participating | | | | | | | | | | |
| VRDN Series MS 00 397, 2.78% | | | | | | | | | | |
| (Liquidity Facility Morgan | | | | | | | | | | | | |
| Stanley) (b)(e) | | | | | | | | 8,545 | | | | 8,545 |
| Mobile Indl. Dev. Board Poll. Cont. Rev. | | | | | | | | | | |
| (Alabama Pwr. Co. Proj.) Series C, | | | | | | | | | | |
| 2.73%, VRDN (b) | | | | | | | | 12,000 | | | | 12,000 |
| Montgomery AlaHA Spl. Care Facilities | | | | | | | | | | |
| Fing. Auth. Prog. Rev. (Mizell Memorial | | | | | | | | |
| Hosp. Proj.) 2.79%, LOC AmSouth | | | | | | | | | | |
| Bank NA, Birmingham, VRDN (b) | | | | | | 5,935 | | | | 5,935 |
| Montgomery Baptist Med. Ctr. Spl. Care | | | | | | | | | | |
| Facilities Fing. Auth. Rev. (Baptist Med. | | | | | | | | |
| Ctr. Proj.) Series 1994 A, 2.8%, LOC | | | | | | | | | | |
| AmSouth Bank NA, Birmingham, | | | | | | | | | | |
| VRDN (b) | | | | | | | | 2,980 | | | | 2,980 |
| Tuscaloosa Spl. Care Facilities Fing. | | | | | | | | | | |
| Auth. Residential Care Family | | | | | | | | | | |
| Mortgage Rev. (Capstone Village Proj.) | | | | | | | | |
| Series C, 2.77%, LOC BNP Paribas | | | | | | | | | | |
| SA, VRDN (b) | | | | | | | | 9,750 | | | | 9,750 |
| | | | | | | | | | | | | 56,400 |
| |
| Alaska – 0.6% | | | | | | | | | | | | |
| Alaska Hsg. Fin. Corp. Participating | | | | | | | | | | |
| VRDN: | | | | | | | | | | | | |
| Series BA 97 F, 2.85% (Liquidity | | | | | | | | | | |
| Facility Bank of America NA) (b)(e) | | . | | | | 1,160 | | | | 1,160 |
| Series DB 131, 2.79% (Liquidity | | | | | | | | | | |
| Facility Deutsche Bank AG) (b)(e) | | | | | | 4,960 | | | | 4,960 |
| Series DB 162, 2.79% (Liquidity | | | | | | | | | | |
| Facility Deutsche Bank AG) (b)(e) | | | | | | 12,080 | | | | 12,080 |
| Series PA 1298, 2.79% (Liquidity | | | | | | | | | | |
| Facility Merrill Lynch & Co., | | | | | | | | | | |
| Inc.) (b)(e) | | | | | | | | 5,000 | | | | 5,000 |
| Valdez Marine Term. Rev. (BP Pipelines, | | | | | | | | | | |
| Inc. Proj.) Series B, 2.83%, VRDN (b) | | . | | | | 11,780 | | | | 11,780 |
| | | | | | | | | | | | | 34,980 |
| |
| Arizona 2.1% | | | | | | | | | | | | |
| Arizona School Facilities Board Ctfs. of | | | | | | | | | | |
| Prtn. Participating VRDN: | | | | | | | | | | | | |
| Series IXIS 05 5, 2.79% (Liquidity | | | | | | | | | | |
| Facility CDC Fin. CDC IXIS) (b)(e) | | | | | | 15,170 | | | | 15,170 |
| Series Putters 940, 2.79% (Liquidity | | | | | | | | | | |
| Facility JPMorgan Chase Bank) (b)(e) | | | | 2,890 | | | | 2,890 |
| Arizona School Facilities Board State | | | | | | | | | | |
| School Impt. Rev. Participating VRDN: | | | | | | | | | | |
| Series Putters 483, 2.79% (Liquidity | | | | | | | | | | |
| Facility PNC Bank NA, | | | | | | | | | | | | |
| Pittsburgh) (b)(e) | | | | | | | | 3,760 | | | | 3,760 |
| Series Putters 484, 2.79% (Liquidity | | | | | | | | | | |
| Facility JPMorgan Chase Bank) (b)(e) | | | | 11,950 | | | | 11,950 |
| | | Principal | | Value (Note 1) |
| | | Amount (000s) | | (000s) |
| |
| Arizona Tourism & Sports Auth. Tax Rev.: | | | | | | | | |
| Participating VRDN Series Putters 690, | | | | | | | | |
| 2.79% (Liquidity Facility JPMorgan | | | | | | | | |
| Chase & Co.) (b)(e) | | $ | | 3,540 | | $ | | 3,540 |
| Series A, 2.8% (AMBAC Insured), | | | | | | | | |
| VRDN (b) | | | | 16,000 | | | | 16,000 |
| Arizona Trans. Board Hwy. Rev. | | | | | | | | |
| Participating VRDN Series ROC II | | | | | | | | |
| R1038, 2.79% (Liquidity Facility | | | | | | | | |
| Citigroup Global Markets Hldgs., | | | | | | | | |
| Inc.) (b)(e) | | | | 4,135 | | | | 4,135 |
| Phoenix Gen. Oblig. Participating VRDN | | | | | | | | |
| Series PT 1436, 2.79% (Liquidity | | | | | | | | |
| Facility Merrill Lynch & Co., Inc.) (b)(e) | | | | 95 | | | | 95 |
| Phoenix Indl. Dev. Auth. Multi family | | | | | | | | |
| Hsg. Rev. (Paradise Lakes Apt. Proj.) | | | | | | | | |
| Series 1995, 2.85%, LOC Gen. Elec. | | | | | | | | |
| Cap. Corp., VRDN (b) | | | | 18,000 | | | | 18,000 |
| Salt River Proj. Agric. Impt. & Pwr. | | | | | | | | |
| District Elec. Sys. Rev.: | | | | | | | | |
| Participating VRDN: | | | | | | | | |
| Series PT 1512, 2.79% (Liquidity | | | | | | | | |
| Facility Merrill Lynch & Co., | | | | | | | | |
| Inc.) (b)(e) | | | | 1,655 | | | | 1,655 |
| Series SG 03 160, 2.79% (Liquidity | | | | | | | | |
| Facility Societe Generale) (b)(e) | | | | 18,600 | | | | 18,600 |
| Series 1997 A, 2.85% 10/6/05, CP . | | | | 10,000 | | | | 10,000 |
| Sun Devil Energy Ctr. LLC Rev. (Arizona | | | | | | | | |
| State Univ. Proj.) 2.79% (FGIC | | | | | | | | |
| Insured), VRDN (b) | | | | 10,005 | | | | 10,005 |
| | | | | | | | | 115,800 |
| |
| Arkansas 0.0% | | | | | | | | |
| Arkansas Hosp. Equip. Fin. Auth. (Baptist | | | | | | | | |
| Health Proj.) Series 1995, 2.8% (MBIA | | | | | | | | |
| Insured), VRDN (b) | | | | 1,950 | | | | 1,950 |
| California 0.9% | | | | | | | | |
| California Dept. of Wtr. Resources Pwr. | | | | | | | | |
| Supply Rev. Participating VRDN: | | | | | | | | |
| Series Putters 309, 2.78% (Liquidity | | | | | | | | |
| Facility JPMorgan Chase Bank) (b)(e) | | | | 13,095 | | | | 13,095 |
| Series Putters 310, 2.78% (Liquidity | | | | | | | | |
| Facility JPMorgan Chase Bank) (b)(e) | | | | 4,995 | | | | 4,995 |
| Series Putters 322, 2.78% (Liquidity | | | | | | | | |
| Facility JPMorgan Chase & | | | | | | | | |
| Co.) (b)(e) | | | | 17,690 | | | | 17,690 |
| Pajaro Valley Unified School District | | | | | | | | |
| Participating VRDN Series PA 1182, | | | | | | | | |
| 2.78% (Liquidity Facility Merrill Lynch | | | | | | | | |
| & Co., Inc.) (b)(e) | | | | 4,290 | | | | 4,290 |
| Poway Redev. Agcy. Tax Allocation Rev. | | | | | | | | |
| Participating VRDN Series Putters 372, | | | | | | | | |
| 2.78% (Liquidity Facility JPMorgan | | | | | | | | |
| Chase Bank) (b)(e) | | | | 11,085 | | | | 11,085 |
| | | | | | | | | 51,155 |
See accompanying notes which are an integral part of the financial statements.
Semiannual Report 46
| Municipal Securities continued | | | | | | |
| |
| | | Principal | | Value (Note 1) |
| | | Amount (000s) | | (000s) |
| |
| Colorado 2.7% | | | | | | | | |
| Adams County Rev. Participating VRDN | | | | | | |
| Series TOC 05 T, 2.79% (Liquidity | | | | | | | | |
| Facility Goldman Sachs Group, | | | | | | | | |
| Inc.) (b)(e) | | $ | | 12,200 | | $ | | 12,200 |
| Arapahoe County Cherry Creek School | | | | | | |
| District #5 Participating VRDN Series | | | | | | |
| Merlots 04 A4, 2.77% (Liquidity | | | | | | | | |
| Facility Wachovia Bank NA) (b)(e) | | | | 7,020 | | | | 7,020 |
| Arapahoe Park & Recreation District | | | | | | | | |
| Participating VRDN Series PT 1677, | | | | | | |
| 2.8% (Liquidity Facility Merrill Lynch & | | | | | | |
| Co., Inc.) (b)(e) | | | | 1,600 | | | | 1,600 |
| Centerra Metropolitan District No. 1 Rev. | | | | | | |
| 2.78%, LOC BNP Paribas SA, | | | | | | | | |
| VRDN (b) | | | | 12,000 | | | | 12,000 |
| Colorado Health Facilities Auth. Rev. | | | | | | | | |
| (Boulder Cmnty. Hosp. Proj.) Series | | | | | | | | |
| 2000, 2.93%, LOC JPMorgan Chase | | | | | | |
| Bank, VRDN (b) | | | | 18,900 | | | | 18,900 |
| Colorado Hsg. & Fin. Auth. Bonds Series | | | | | | |
| 2004 B4 Class I, 1.99% 11/1/05 | | | | 10,400 | | | | 10,400 |
| Colorado Springs Utils. Rev. Participating | | | | | | |
| VRDN: | | | | | | | | |
| Series SGA 88, 2.85% (Liquidity | | | | | | | | |
| Facility Societe Generale) (b)(e) | | | | 12,100 | | | | 12,100 |
| Series SGB 28, 2.79% (Liquidity | | | | | | | | |
| Facility Societe Generale) (b)(e) | | | | 12,000 | | | | 12,000 |
| Colorado Wtr. Resources and Pwr. Dev. | | | | | | |
| Auth. Wastewtr. Rev. Participating | | | | | | | | |
| VRDN Series PT 2781, 2.79% | | | | | | | | |
| (Liquidity Facility Dexia Cr. Local de | | | | | | |
| France) (b)(e) | | | | 14,220 | | | | 14,220 |
| Denver City & County Arpt. Rev. | | | | | | | | |
| Participating VRDN: | | | | | | | | |
| Series Merlots 97 Q, 2.77% (Liquidity | | | | | | |
| Facility Wachovia Bank NA) (b)(e) | | 2,900 | | | | 2,900 |
| Series MS 00 425, 2.78% (Liquidity | | | | | | |
| Facility Morgan Stanley) (b)(e) | | | | 8,433 | | | | 8,433 |
| Series MS 1167, 2.78% (Liquidity | | | | | | | | |
| Facility Morgan Stanley) (b)(e) | | | | 15,240 | | | | 15,240 |
| Jefferson County School District #R1 | | | | | | | | |
| Participating VRDN Series PT 2716, | | | | | | |
| 2.79% (Liquidity Facility Merrill Lynch | | | | | | |
| & Co., Inc.) (b)(e) | | | | 5,000 | | | | 5,000 |
| Mesa County Valley School District | | | | | | | | |
| #051, Grand Junction Participating | | | | | | |
| VRDN Series PT 2456, 2.79% | | | | | | | | |
| (Liquidity Facility Merrill Lynch & Co., | | | | | | |
| Inc.) (b)(e) | | | | 7,685 | | | | 7,685 |
| Reg’l. Trans. District Sales Tax Rev. | | | | | | | | |
| Participating VRDN Series MS 01 679, | | | | | | |
| 2.78% (Liquidity Facility Morgan | | | | | | | | |
| Stanley) (b)(e) | | | | 6,915 | | | | 6,915 |
| Southern Ute Indian Tribe of Southern | | | | | | |
| Ute Indian Reservation 2.83%, | | | | | | | | |
| VRDN (b) | | | | 3,500 | | | | 3,500 |
| | | | | | | | | 150,113 |
| | | Principal | | Value (Note 1) |
| | | Amount (000s) | | (000s) |
| |
| Delaware 0.4% | | | | | | | | |
| Wilmington Adjustable Rate Demand | | | | | | | | |
| Rev. (Delaware Art Museum, Inc. Proj.) | | | | | | | | |
| 2.78%, LOC Allied Irish Banks PLC, | | | | | | | | |
| VRDN (b) | | $ | | 19,650 | | $ | | 19,650 |
| District Of Columbia – 0.8% | | | | | | | | |
| District of Columbia Gen. Oblig. | | | | | | | | |
| Participating VRDN: | | | | | | | | |
| Series PT 750, 2.79% (Liquidity Facility | | | | | | | | |
| Landesbank Hessen Thuringen) (b)(e) | | | | 14,635 | | | | 14,635 |
| Series PT 852, 2.79% (Liquidity Facility | | | | | | | | |
| Landesbank Hessen Thuringen) (b)(e) | | | | 10,455 | | | | 10,455 |
| Series ROC II 99 10, 2.79% (Liquidity | | | | | | | | |
| Facility Citibank NA) (b)(e) | | | | 3,965 | | | | 3,965 |
| District of Columbia Hsg. Fin. Auth. Cap. | | | | | | | | |
| Prog. Rev. Participating VRDN Series | | | | | | | | |
| PT 2780, 2.79% (Liquidity Facility | | | | | | | | |
| Merrill Lynch & Co., Inc.) (b)(e) | | | | 5,000 | | | | 5,000 |
| District of Columbia Rev. (DC | | | | | | | | |
| Preparatory Academy Proj.) 2.8%, | | | | | | | | |
| LOC Manufacturers & Traders Trust | | | | | | | | |
| Co., VRDN (b) | | | | 5,500 | | | | 5,500 |
| District of Columbia Wtr. & Swr. Auth. | | | | | | | | |
| Participating VRDN Series PA 612, | | | | | | | | |
| 2.79% (Liquidity Facility Merrill Lynch | | | | | | | | |
| & Co., Inc.) (b)(e) | | | | 5,320 | | | | 5,320 |
| | | | | | | | | 44,875 |
| |
| Florida – 8.6% | | | | | | | | |
| Dade County Wtr. & Swr. Sys. Rev. | | | | | | | | |
| Participating VRDN Series SG 74, | | | | | | | | |
| 2.78% (Liquidity Facility Societe | | | | | | | | |
| Generale) (b)(e) | | | | 10,000 | | | | 10,000 |
| Florida Board of Ed. Participating VRDN | | | | | | | | |
| Series MSTC 01 131, 2.83% (Liquidity | | | | | | | | |
| Facility Bear Stearns Companies, | | | | | | | | |
| Inc.) (b)(e) | | | | 6,300 | | | | 6,300 |
| Florida Board of Ed. Cap. Outlay | | | | | | | | |
| Participating VRDN: | | | | | | | | |
| Series EGL 01 902, 2.79% (Liquidity | | | | | | | | |
| Facility Citibank NA, New | | | | | | | | |
| York) (b)(e) | | | | 23,360 | | | | 23,360 |
| Series EGL 01 905, 2.79% (Liquidity | | | | | | | | |
| Facility Citibank NA, New | | | | | | | | |
| York) (b)(e) | | | | 5,630 | | | | 5,630 |
| Series EGL 7050031, 2.79% (Liquidity | | | | | | | | |
| Facility Citibank NA) (b)(e) | | | | 4,600 | | | | 4,600 |
| Series MS 1017, 2.78% (Liquidity | | | | | | | | |
| Facility Morgan Stanley) (b)(e) | | | | 7,200 | | | | 7,200 |
| Series MSTC 01 161, 2.83% (Liquidity | | | | | | | | |
| Facility Bear Stearns Companies, | | | | | | | | |
| Inc.) (b)(e) | | | | 6,395 | | | | 6,395 |
| Series ROC II R344, 2.79% (Liquidity | | | | | | | | |
| Facility Citibank NA) (b)(e) | | | | 13,990 | | | | 13,990 |
| Series SGA 03 138, 2.8% (Liquidity | | | | | | | | |
| Facility Societe Generale) (b)(e) | | | | 3,090 | | | | 3,090 |
See accompanying notes which are an integral part of the financial statements.
47 Semiannual Report
Tax-Exempt Portfolio
Investments (Unaudited) - continued
|
| Municipal Securities continued | | | | | | |
| |
| | | Principal | | Value (Note 1) |
| | | Amount (000s) | | (000s) |
| |
| Florida – continued | | | | | | | | |
| Florida Board of Ed. Lottery Rev. | | | | | | | | |
| Participating VRDN: | | | | | | | | |
| Series EGL 00 904, 2.79% (Liquidity | | | | | | |
| Facility Citibank NA, New | | | | | | | | |
| York) (b)(e) | | $ | | 5,000 | | $ | | 5,000 |
| Series EGL 01 904, 2.79% (Liquidity | | | | | | |
| Facility Citibank NA, New | | | | | | | | |
| York) (b)(e) | | | | 23,375 | | | | 23,375 |
| Series EGL 01 906, 2.79% (Liquidity | | | | | | |
| Facility Citibank NA, New | | | | | | | | |
| York) (b)(e) | | | | 3,000 | | | | 3,000 |
| Series MS 01 570, 2.78% (Liquidity | | | | | | |
| Facility Morgan Stanley) (b)(e) | | | | 13,490 | | | | 13,490 |
| Series MSTC 01 115, 2.83% (Liquidity | | | | | | |
| Facility Bear Stearns Companies, | | | | | | | | |
| Inc.) (b)(e) | | | | 35,955 | | | | 35,955 |
| Series MSTC 01 160, 2.83% (Liquidity | | | | | | |
| Facility Bear Stearns Companies, | | | | | | | | |
| Inc.) (b)(e) | | | | 13,315 | | | | 13,315 |
| Series PT 1687, 2.78% (Liquidity | | | | | | | | |
| Facility Merrill Lynch & Co., | | | | | | | | |
| Inc.) (b)(e) | | | | 16,840 | | | | 16,840 |
| Florida Board of Ed. Pub. Ed. | | | | | | | | |
| Participating VRDN: | | | | | | | | |
| Series ROC II R6037, 2.79% (Liquidity | | | | | | |
| Facility Citibank NA) (b)(e) | | | | 2,990 | | | | 2,990 |
| Series SGA 00 102, 2.83% (Liquidity | | | | | | |
| Facility Societe Generale) (b)(e) | | | | 42,500 | | | | 42,500 |
| Florida Dept. of Envir. Protection | | | | | | | | |
| Preservation Rev. Participating VRDN | | | | | | |
| Series Clipper 05 20, 2.78% (Liquidity | | | | | | |
| Facility State Street Bank & Trust Co., | | | | | | |
| Boston) (b)(e) | | | | 5,000 | | | | 5,000 |
| Florida Gen. Oblig. Participating VRDN | | | | | | |
| Series ROC II R1001 2.79% (Liquidity | | | | | | |
| Facility Citigroup Global Markets | | | | | | | | |
| Hldgs., Inc.) (b)(e) | | | | 7,540 | | | | 7,540 |
| Florida Hsg. Fin. Agcy. (Town Colony II | | | | | | |
| Proj.) Series 1985 EE, 2.78%, LOC Cr. | | | | | | |
| Suisse, VRDN (b) | | | | 3,600 | | | | 3,600 |
| Highlands County Health Facilities Auth. | | | | | | |
| Rev. (Adventist Health Sys./Sunbelt | | | | | | | | |
| Obligated Group Proj.) Series C, | | | | | | | | |
| 2.77%, VRDN (b) | | | | 19,300 | | | | 19,300 |
| Hillsborough County School Board Ctfs. | | | | | | |
| of Prtn. Participating VRDN Series PT | | | | | | |
| 1694, 2.78% (Liquidity Facility Merrill | | | | | | |
| Lynch & Co., Inc.) (b)(e) | | | | 14,175 | | | | 14,175 |
| Hollywood Wtr. & Swr. Rev. Participating | | | | | | |
| VRDN Series ROC II R4055, 2.79% | | | | | | |
| (Liquidity Facility Citigroup Global | | | | | | | | |
| Markets Hldgs., Inc.) (b)(e) | | | | 2,755 | | | | 2,755 |
| Jacksonville Poll. Cont. Rev. (Florida Pwr. | | | | | | |
| & Lt. Co. Proj.) 2.9%, VRDN (b) | | | | 25,000 | | | | 25,000 |
| | | Principal | | Value (Note 1) |
| | | Amount (000s) | | (000s) |
| |
| JEA Elec. Sys. Rev. Participating VRDN | | | | | | | | |
| Series PA 1068, 2.8% (Liquidity Facility | | | | | | | | |
| Merrill Lynch & Co., Inc.) (b)(e) | | $ | | 5,620 | | $ | | 5,620 |
| JEA Wtr. & Swr. Sys. Rev. Participating | | | | | | | | |
| VRDN Series Putters 408, 2.79% | | | | | | | | |
| (Liquidity Facility JPMorgan Chase | | | | | | | | |
| Bank) (b)(e) | | | | 2,685 | | | | 2,685 |
| Lakeland Elec. & Wtr. Rev. Participating | | | | | | | | |
| VRDN Series EGL 96 901, 2.92% | | | | | | | | |
| (Liquidity Facility Citibank NA, New | | | | | | | | |
| York) (b)(e) | | | | 1,330 | | | | 1,330 |
| Martin County Poll. Cont. Rev. (Florida | | | | | | | | |
| Pwr. & Lt. Co. Proj.) Series 2000, | | | | | | | | |
| 2.88%, VRDN (b) | | | | 11,150 | | | | 11,150 |
| Miami Dade County Edl. Facilities Auth. | | | | | | | | |
| Rev. Participating VRDN Series SG | | | | | | | | |
| 176, 2.78% (Liquidity Facility Societe | | | | | | | | |
| Generale) (b)(e) | | | | 19,000 | | | | 19,000 |
| Miami Dade County Health Facilities | | | | | | | | |
| Auth. Hosp. Rev. Participating VRDN | | | | | | | | |
| Series PT 721, 2.78% (Liquidity Facility | | | | | | | | |
| BNP Paribas SA) (b)(e) | | | | 9,300 | | | | 9,300 |
| Miami Dade County Pub. Svc. Tax Rev. | | | | | | | | |
| Participating VRDN Series MSTC 02 | | | | | | | | |
| 9043, 2.8% (Liquidity Facility Bear | | | | | | | | |
| Stearns Companies, Inc.) (b)(e) | | | | 3,160 | | | | 3,160 |
| Miami Dade County School Board Ctfs. | | | | | | | | |
| of Prtn. Participating VRDN Series PT | | | | | | | | |
| 845, 2.78% (Liquidity Facility Merrill | | | | | | | | |
| Lynch & Co., Inc.) (b)(e) | | | | 6,400 | | | | 6,400 |
| Orange County Sales Tax Rev. | | | | | | | | |
| Participating VRDN Series Putters 717, | | | | | | | | |
| 2.79% (Liquidity Facility JPMorgan | | | | | | | | |
| Chase & Co.) (b)(e) | | | | 1,965 | | | | 1,965 |
| Orange County School Board Ctfs. of | | | | | | | | |
| Prtn. Participating VRDN: | | | | | | | | |
| Series Putters 645, 2.79% (Liquidity | | | | | | | | |
| Facility JPMorgan Chase Bank) (b)(e) | | | | 5,315 | | | | 5,315 |
| Series ROC II R 2182, 2.79% (Liquidity | | | | | | | | |
| Facility Citigroup Global Markets | | | | | | | | |
| Hldgs., Inc.) (b)(e) | | | | 3,440 | | | | 3,440 |
| Orange County Tourist Dev. Tax Rev. | | | | | | | | |
| Participating VRDN Series MS 817, | | | | | | | | |
| 2.78% (Liquidity Facility Morgan | | | | | | | | |
| Stanley) (b)(e) | | | | 7,315 | | | | 7,315 |
| Orlando Utils. Commission Wtr. & Elec. | | | | | | | | |
| Rev. Participating VRDN Series PT | | | | | | | | |
| 2285, 2.77% (Liquidity Facility Dexia | | | | | | | | |
| Cr. Local de France) (b)(e) | | | | 9,460 | | | | 9,460 |
| Palm Beach County Rev. (Morse Oblig. | | | | | | | | |
| Group Proj.) 2.77%, LOC Key Bank | | | | | | | | |
| NA, VRDN (b) | | | | 10,000 | | | | 10,000 |
| Pasco County Indl. Dev. Rev. (Academy | | | | | | | | |
| Lakes Day School Proj.) 2.8%, LOC | | | | | | | | |
| Bank of America NA, VRDN (b) | | | | 1,955 | | | | 1,955 |
| Pinellas County School District TAN 4% | | | | | | | | |
| 6/30/06 (a) | | | | 23,200 | | | | 23,381 |
| Santa Rosa County Health Facilities Rev. | | | | | | | | |
| (Baptists Hosp., Inc. Proj.) 2.75%, LOC | | | | | | | | |
| Bank of America NA, VRDN (b) | | | | 820 | | | | 820 |
See accompanying notes which are an integral part of the financial statements.
Semiannual Report 48
| Municipal Securities continued | | | | | | |
| |
| | | Principal | | Value (Note 1) |
| | | Amount (000s) | | (000s) |
| |
| Florida – continued | | | | | | | | |
| Tampa Bay Wtr. Util. Sys. Rev. | | | | | | | | |
| Participating VRDN Series BA 01 N, | | | | | | | | |
| 2.83% (Liquidity Facility Bank of | | | | | | | | |
| America NA) (b)(e) | | $ | | 5,200 | | $ | | 5,200 |
| Volusia County Health Facilities Auth. | | | | | | | | |
| Rev. Participating VRDN Series MT | | | | | | | | |
| 151, 2.78% (Liquidity Facility | | | | | | | | |
| Landesbank Hessen Thuringen) (b)(e) | | . | | 14,340 | | | | 14,340 |
| Volusia County Tourist Dev. Tax Rev. | | | | | | | | |
| Participating VRDN Series PT 2395, | | | | | | | | |
| 2.78% (Liquidity Facility Merrill Lynch | | | | | | | | |
| & Co., Inc.) (b)(e) | | | | 15,265 | | | | 15,265 |
| | | | | | | | | 471,501 |
| |
| Georgia – 1.8% | | | | | | | | |
| Atlanta Arpt. Rev. Participating VRDN | | | | | | | | |
| Series EGL 00 1003, 2.79% (Liquidity | | | | | | | | |
| Facility Citibank NA, New York) (b)(e) | | | | 10,000 | | | | 10,000 |
| Atlanta Wtr. & Wastewtr. Rev. | | | | | | | | |
| Participating VRDN: | | | | | | | | |
| Series EGL 720050009, 2.79% | | | | | | | | |
| (Liquidity Facility Citibank NA) (b)(e) | | 6,000 | | | | 6,000 |
| Series ROC II R 324, 2.79% (Liquidity | | | | | | | | |
| Facility Citibank NA) (b)(e) | | | | 4,375 | | | | 4,375 |
| Carrollton Payroll Dev. Auth. Rev. | | | | | | | | |
| Participating VRDN Series PT 2468, | | | | | | | | |
| 2.79% (Liquidity Facility Merrill Lynch | | | | | | | | |
| & Co., Inc.) (b)(e) | | | | 5,275 | | | | 5,275 |
| Cobb County Dev. Auth. Univ. Facilities | | | | | | | | |
| Rev. Participating VRDN Series MS | | | | | | | | |
| 983, 2.78% (Liquidity Facility Morgan | | | | | | | | |
| Stanley) (b)(e) | | | | 6,232 | | | | 6,232 |
| DeKalb County Dev. Auth. Rev. (Marist | | | | | | | | |
| School, Inc. Proj.) Series 1999, 2.8%, | | | | | | | | |
| LOC Suntrust Bank, VRDN (b) | | | | 6,915 | | | | 6,915 |
| Fulton County Dev. Auth. Participating | | | | | | | | |
| VRDN Series MS 960, 2.78% (Liquidity | | | | | | |
| Facility Morgan Stanley) (b)(e) | | | | 5,000 | | | | 5,000 |
| Fulton County Wtr. & Swr. Rev. | | | | | | | | |
| Participating VRDN Series MS 1120, | | | | | | | | |
| 2.78% (Liquidity Facility Morgan | | | | | | | | |
| Stanley) (b)(e) | | | | 17,320 | | | | 17,320 |
| Georgia Gen. Oblig. Participating | | | | | | | | |
| VRDN: | | | | | | | | |
| Series EGL 01 1001, 2.79% (Liquidity | | | | | | | | |
| Facility Citibank NA, New | | | | | | | | |
| York) (b)(e) | | | | 10,580 | | | | 10,580 |
| Series EGL 04 1004, 2.79% (Liquidity | | | | | | | | |
| Facility Citibank NA) (b)(e) | | | | 5,000 | | | | 5,000 |
| Georgia Muni. Elec. Auth. Pwr. Rev. | | | | | | | | |
| Participating VRDN Series Macon 04 | | | | | | | | |
| E, 2.83% (Liquidity Facility Bank of | | | | | | | | |
| America NA) (b)(e) | | | | 6,810 | | | | 6,810 |
| | | Principal | | Value (Note 1) |
| | | Amount (000s) | | (000s) |
| |
| Metropolitan Atlanta Rapid Transit Auth. | | | | | | | | |
| Sales Tax Rev. Participating VRDN | | | | | | | | |
| Series ROC II R4011, 2.79% (Liquidity | | | | | | | | |
| Facility Citigroup Global Markets | | | | | | | | |
| Hldgs., Inc.) (b)(e) | | $ | | 3,210 | | $ | | 3,210 |
| Putnam County Dev. Auth. Poll. Cont. | | | | | | | | |
| Rev. Bonds (Georgia Pwr. Co. Plant | | | | | | | | |
| Proj.) First Series 1997, 2.83%, tender | | | | | | | | |
| 5/5/06 (b) | | | | 9,200 | | | | 9,200 |
| | | | | | | | | 95,917 |
| |
| Hawaii 0.4% | | | | | | | | |
| Hawaii Gen. Oblig. Participating VRDN: | | | | | | | | |
| Series ROC II R153, 2.79% (Liquidity | | | | | | | | |
| Facility Citibank NA) (b)(e) | | | | 3,300 | | | | 3,300 |
| Series ROC II R417, 2.79% (Liquidity | | | | | | | | |
| Facility Citibank NA) (b)(e) | | | | 8,000 | | | | 8,000 |
| Hawaii Hwy. Rev. Participating VRDN | | | | | | | | |
| Series EGL 7051003, 2.79% (Liquidity | | | | | | | | |
| Facility Citibank NA) (b)(e) | | | | 9,900 | | | | 9,900 |
| Honolulu City & County Gen. Oblig. | | | | | | | | |
| Participating VRDN Series ROC II | | | | | | | | |
| R5025, 2.79% (Liquidity Facility | | | | | | | | |
| Citigroup Global Markets Hldgs., | | | | | | | | |
| Inc.) (b)(e) | | | | 2,640 | | | | 2,640 |
| | | | | | | | | 23,840 |
| |
| Illinois – 6.6% | | | | | | | | |
| Chicago Board of Ed. Participating | | | | | | | | |
| VRDN: | | | | | | | | |
| Series BA 96 BB, 2.85% (Liquidity | | | | | | | | |
| Facility Bank of America NA) (b)(e) . | | | | 9,000 | | | | 9,000 |
| Series MSDW 01 467, 2.78% | | | | | | | | |
| (Liquidity Facility Morgan | | | | | | | | |
| Stanley) (b)(e) | | | | 3,000 | | | | 3,000 |
| Series PT 2446, 2.79% (Liquidity | | | | | | | | |
| Facility Merrill Lynch & Co., | | | | | | | | |
| Inc.) (b)(e) | | | | 5,535 | | | | 5,535 |
| Series TOC 05 Z8, 2.83% (Liquidity | | | | | | | | |
| Facility Goldman Sachs Group, | | | | | | | | |
| Inc.) (b)(e) | | | | 7,700 | | | | 7,700 |
| Chicago Gen. Oblig. Participating | | | | | | | | |
| VRDN: | | | | | | | | |
| Series Merlots 00 A12, 2.77% | | | | | | | | |
| (Liquidity Facility Wachovia Bank | | | | | | | | |
| NA) (b)(e) | | | | 2,200 | | | | 2,200 |
| Series MS 00 426, 2.78% (Liquidity | | | | | | | | |
| Facility Morgan Stanley) (b)(e) | | | | 7,695 | | | | 7,695 |
| Series PA 643R, 2.79% (Liquidity | | | | | | | | |
| Facility Merrill Lynch & Co., | | | | | | | | |
| Inc.) (b)(e) | | | | 5,895 | | | | 5,895 |
| Series PT 2356, 2.79% (Liquidity | | | | | | | | |
| Facility Dexia Cr. Local de | | | | | | | | |
| France) (b)(e) | | | | 9,525 | | | | 9,525 |
| Series Putters 1050, 2.79% (Liquidity | | | | | | | | |
| Facility JPMorgan Chase Bank) (b)(e) | | | | 3,800 | | | | 3,800 |
| Series Putters 737, 2.79% (Liquidity | | | | | | | | |
| Facility JPMorgan Chase Bank) (b)(e) | | | | 8,105 | | | | 8,105 |
See accompanying notes which are an integral part of the financial statements.
49 Semiannual Report
Tax-Exempt Portfolio
Investments (Unaudited) - continued
|
| Municipal Securities continued | | | | | | |
| |
| | | Principal | | Value (Note 1) |
| | | Amount (000s) | | (000s) |
| |
| Illinois – continued | | | | | | | | |
| Chicago Park District TAN Series A, 4% | | | | | | |
| 5/1/06 | | $ | | 25,000 | | $ | | 25,160 |
| Chicago Pub. Bldg. Commission Bldg. | | | | | | |
| Rev. Participating VRDN Series PT | | | | | | | | |
| 1835, 2.79% (Liquidity Facility Merrill | | | | | | |
| Lynch & Co., Inc.) (b)(e) | | | | 5,965 | | | | 5,965 |
| Chicago Skyway Toll Bridge Rev. | | | | | | | | |
| Participating VRDN Series EGL 01 | | | | | | | | |
| 1304, 2.79% (Liquidity Facility | | | | | | | | |
| Citibank NA, New York) (b)(e) | | | | 3,000 | | | | 3,000 |
| Chicago Wtr. Rev. Participating VRDN | | | | | | |
| Series Merlots 00 TT, 2.77% (Liquidity | | | | | | |
| Facility Wachovia Bank NA) (b)(e) | | | | 5,200 | | | | 5,200 |
| Clipper Tax Exempt Trust Participating | | | | | | |
| VRDN Series Clipper 05 21, 2.83% | | | | | | |
| (Liquidity Facility State Street Bank & | | | | | | |
| Trust Co., Boston) (b)(e) | | | | 5,040 | | | | 5,040 |
| Cook County Forest Preservation District | | | | | | |
| Participating VRDN Series Putters 566, | | | | | | |
| 2.79% (Liquidity Facility JPMorgan | | | | | | | | |
| Chase Bank) (b)(e) | | | | 6,315 | | | | 6,315 |
| Cook County Gen. Oblig. Participating | | | | | | |
| VRDN: | | | | | | | | |
| Series EGL 01 1302, 2.79% (Liquidity | | | | | | |
| Facility Citibank NA, New | | | | | | | | |
| York) (b)(e) | | | | 6,700 | | | | 6,700 |
| Series PT 2637, 2.79% (Liquidity | | | | | | | | |
| Facility Merrill Lynch & Co., | | | | | | | | |
| Inc.) (b)(e) | | | | 5,130 | | | | 5,130 |
| Hoffman Estates Tax Increment Rev. | | | | | | | | |
| (Sears, Roebuck & Co. Proj.) 2.78%, | | | | | | |
| LOC Northern Trust Co., Chicago, | | | | | | | | |
| VRDN (b) | | | | 15,400 | | | | 15,400 |
| Illinois Edl. Facilities Auth. Revs. | | | | | | | | |
| Participating VRDN: | | | | | | | | |
| Series Merlots 97 U, 2.77% (Liquidity | | | | | | |
| Facility Wachovia Bank NA) (b)(e) | | 4,250 | | | | 4,250 |
| Series MS 1077, 2.78% (Liquidity | | | | | | | | |
| Facility Morgan Stanley) (b)(e) | | | | 4,995 | | | | 4,995 |
| Illinois Fin. Auth. Rev.: | | | | | | | | |
| Participating VRDN Series ROC II | | | | | | | | |
| R6015, 2.79% (Liquidity Facility | | | | | | | | |
| Citibank NA) (b)(e) | | | | 4,975 | | | | 4,975 |
| (Central DuPage Hosp. Proj.) Series B, | | | | | | |
| 2.77%, VRDN (b) | | | | 20,000 | | | | 20,000 |
| (Northwestern Memorial Proj.) Series | | | | | | |
| B1, 2.81% (Liquidity Facility Bank of | | | | | | |
| Nova Scotia, New York Agcy.), | | | | | | | | |
| VRDN (b) | | | | 5,610 | | | | 5,610 |
| (Rest Haven Christian Services Proj.) | | | | | | |
| Series B, 2.77%, LOC KBC Bank NV, | | | | | | |
| VRDN (b) | | | | 10,000 | | | | 10,000 |
| Illinois Gen. Oblig.: | | | | | | | | |
| Participating VRDN: | | | | | | | | |
| Series EGL 00 1304, 2.79% | | | | | | | | |
| (Liquidity Facility Citibank NA, | | | | | | | | |
| New York) (b)(e) | | | | 2,300 | | | | 2,300 |
| | | Principal | | Value (Note 1) |
| | | Amount (000s) | | (000s) |
| |
| Series MS 98 143, 2.78% (Liquidity | | | | | | | | |
| Facility Morgan Stanley) (b)(e) | | $ | | 24,965 | | $ | | 24,965 |
| Series PT 1975, 2.79% (Liquidity | | | | | | | | |
| Facility Merrill Lynch & Co., | | | | | | | | |
| Inc.) (b)(e) | | | | 3,995 | | | | 3,995 |
| Series Putters 133, 2.79% (Liquidity | | | | | | | | |
| Facility JPMorgan Chase & | | | | | | | | |
| Co.) (b)(e) | | | | 4,945 | | | | 4,945 |
| Series 2003 B, 2.79% (Liquidity Facility | | | | | | | | |
| DEPFA BANK PLC), VRDN (b) | | | | 34,315 | | | | 34,315 |
| Illinois Health Facilities Auth. Rev. | | | | | | | | |
| (Memorial Health Sys. Proj.) 2.85%, | | | | | | | | |
| LOC JPMorgan Chase Bank, VRDN (b) | | | | 4,500 | | | | 4,500 |
| Illinois Reg’l. Trans. Auth. Participating | | | | | | | | |
| VRDN: | | | | | | | | |
| Series EGL 01 1306, 2.79% (Liquidity | | | | | | | | |
| Facility Citibank NA, New | | | | | | | | |
| York) (b)(e) | | | | 8,600 | | | | 8,600 |
| Series EGL 7050028 Class A, 2.79% | | | | | | | | |
| (Liquidity Facility Citibank NA) (b)(e) | | | | 2,895 | | | | 2,895 |
| Series Merlots 02 A24, 2.77% | | | | | | | | |
| (Liquidity Facility Wachovia Bank | | | | | | | | |
| NA) (b)(e) | | | | 4,955 | | | | 4,955 |
| Series PT 2761, 2.79% (Liquidity | | | | | | | | |
| Facility Dexia Cr. Local de | | | | | | | | |
| France) (b)(e) | | | | 19,000 | | | | 19,000 |
| Illinois Toll Hwy. Auth. Toll Hwy. Rev. | | | | | | | | |
| Participating VRDN Series PT 3182, | | | | | | | | |
| 2.79% (Liquidity Facility Merrill Lynch | | | | | | | | |
| & Co., Inc.) (b)(e) | | | | 10,610 | | | | 10,610 |
| Lake County Cmnty. High School District | | | | | | | | |
| Participating VRDN Series Stars 92, | | | | | | | | |
| 2.79% (Liquidity Facility BNP Paribas | | | | | | | | |
| SA) (b)(e) | | | | 14,330 | | | | 14,330 |
| Metropolitan Pier & Exposition Auth. | | | | | | | | |
| Dedicated State Tax Rev. Participating | | | | | | | | |
| VRDN: | | | | | | | | |
| Series MS 962, 2.83% (Liquidity | | | | | | | | |
| Facility Morgan Stanley) (b)(e) | | | | 3,010 | | | | 3,010 |
| Series PZ 44, 2.83% (Liquidity Facility | | | | | | | | |
| Merrill Lynch & Co., Inc.) (b)(e) | | | | 6,610 | | | | 6,610 |
| Quad Cities Reg’l. Econ. Dev. Auth. Rev. | | | | | | | | |
| (Two Rivers YMCA, Inc. Proj.) 2.85%, | | | | | | | | |
| LOC U.S. Bank NA, Minnesota, | | | | | | | | |
| VRDN (b) | | | | 2,600 | | | | 2,600 |
| Schaumburg Village Gen. Oblig. | | | | | | | | |
| Participating VRDN: | | | | | | | | |
| Series EGL 04 45 Class A, 2.79% | | | | | | | | |
| (Liquidity Facility Citibank NA) (b)(e) | | | | 3,085 | | | | 3,085 |
| Series MS 1178, 2.78% (Liquidity | | | | | | | | |
| Facility Morgan Stanley) (b)(e) | | | | 8,835 | | | | 8,835 |
See accompanying notes which are an integral part of the financial statements.
Semiannual Report 50
| Municipal Securities continued | | | | | | |
| |
| | | Principal | | Value (Note 1) |
| | | Amount (000s) | | (000s) |
| |
| Illinois – continued | | | | | | | | |
| Univ. of Illinois Auxiliary Facilities Sys. | | | | | | |
| Rev. Participating VRDN: | | | | | | | | |
| Series EGL 00 1301, 2.79% (Liquidity | | | | | | |
| Facility Citibank NA, New | | | | | | | | |
| York) (b)(e) | | $ | | 6,855 | | $ | | 6,855 |
| Series SG 65, 2.79% (Liquidity Facility | | | | | | |
| Societe Generale) (b)(e) | | | | 3,000 | | | | 3,000 |
| | | | | | | | | 359,600 |
| |
| Indiana – 1.8% | | | | | | | | |
| Avon 2000 Cmnty. School Bldg. Corp. | | | | | | |
| Participating VRDN Series Putters | | | | | | | | |
| 1055, 2.79% (Liquidity Facility | | | | | | | | |
| JPMorgan Chase & Co.) (b)(e) | | | | 6,310 | | | | 6,310 |
| Boone County Hosp. Assoc. Lease Rev. | | | | | | |
| Participating VRDN Series DB 149, | | | | | | | | |
| 2.79% (Liquidity Facility Deutsche Bank | | | | | | |
| AG) (b)(e) | | | | 8,980 | | | | 8,980 |
| Ctr. Grove 2000 Bldg. Corp. | | | | | | | | |
| Participating VRDN Series DB 135, | | | | | | | | |
| 2.79% (Liquidity Facility Deutsche Bank | | | | | | |
| AG) (b)(e) | | | | 6,065 | | | | 6,065 |
| Indiana Edl. Facilities Auth. Rev. | | | | | | | | |
| (Earlham College Proj.) Series E, | | | | | | | | |
| 2.78%, LOC U.S. Bank NA, | | | | | | | | |
| Minnesota, VRDN (b) | | | | 8,025 | | | | 8,025 |
| Indiana Health & Edl. Facilities Fing. | | | | | | | | |
| Auth. Hosp. Rev. (Howard Reg’l. | | | | | | | | |
| Health Sys. Proj.) Series A, 2.85%, | | | | | | | | |
| LOC Comerica Bank, Detroit, | | | | | | | | |
| VRDN (b) | | | | 3,400 | | | | 3,400 |
| Indiana Muni. Pwr. Agcy. Pwr. Supply | | | | | | |
| Sys. Rev. Participating VRDN Series PT | | | | | | |
| 1412, 2.79% (Liquidity Facility Merrill | | | | | | |
| Lynch & Co., Inc.) (b)(e) | | | | 12,410 | | | | 12,410 |
| Indiana Toll Road Commission Toll Road | | | | | | |
| Rev. Participating VRDN: | | | | | | | | |
| Series Merlots 01 A104, 2.77% | | | | | | | | |
| (Liquidity Facility Wachovia Bank | | | | | | | | |
| NA) (b)(e) | | | | 3,275 | | | | 3,275 |
| Series Stars 103, 2.77% (Liquidity | | | | | | | | |
| Facility BNP Paribas SA) (b)(e) | | | | 15,095 | | | | 15,095 |
| Indiana Trans. Fin. Auth. Hwy. | | | | | | | | |
| Participating VRDN Series Merlots | | | | | | | | |
| B18, 2.77% (Liquidity Facility | | | | | | | | |
| Wachovia Bank NA) (b)(e) | | | | 5,000 | | | | 5,000 |
| Mount Vernon of Hancock County | | | | | | | | |
| Multi School Corp. Participating VRDN | | | | | | |
| Series DB 137, 2.79% (Liquidity | | | | | | | | |
| Facility Deutsche Bank AG) (b)(e) | | | | 5,500 | | | | 5,500 |
| New Albany Floyd County Independent | | | | | | |
| School Bldg. Corp. Participating VRDN | | | | | | |
| Series PT 2794, 2.79% (Liquidity | | | | | | | | |
| Facility Merrill Lynch & Co., Inc.) (b)(e) | | 8,000 | | | | 8,000 |
| Purdue Univ. Rev. Series 2004 S, 2.82%, | | | | | | |
| VRDN (b) | | | | 2,425 | | | | 2,425 |
| | | Principal | | Value (Note 1) |
| | | Amount (000s) | | (000s) |
| |
| Richmond Econ. Dev. Rev. (Friends | | | | | | | | |
| Fellowship Cmnty. Proj.) Series 1993, | | | | | | | | |
| 2.88%, LOC U.S. Bank NA, | | | | | | | | |
| Minnesota, VRDN (b) | | $ | | 900 | | $ | | 900 |
| Valparaiso Econ. Dev. Rev. (Indiana | | | | | | | | |
| Retirement Cmnty. Proj.) 2.88%, LOC | | | | | | | | |
| JPMorgan Chase Bank, VRDN (b) | | | | 1,200 | | | | 1,200 |
| Westfield Independent High School Bldg. | | | | | | | | |
| Corp. Participating VRDN Series | | | | | | | | |
| Putters 98 236, 2.79% (Liquidity | | | | | | | | |
| Facility JPMorgan Chase Bank) (b)(e) . | | | | 10,065 | | | | 10,065 |
| | | | | | | | | 96,650 |
| |
| Iowa 0.3% | | | | | | | | |
| Grinnell Hosp. Rev. (Grinnell Reg’l. Med. | | | | | | | | |
| Ctr. Proj.) 2.85%, LOC U.S. Bank NA, | | | | | | | | |
| Minnesota, VRDN (b) | | | | 4,535 | | | | 4,535 |
| Hills Healthcare Rev. (Mercy Hosp. Proj.) | | | | | | | | |
| 2.8%, LOC U.S. Bank NA, Minnesota, | | | | | | | | |
| VRDN (b) | | | | 8,740 | | | | 8,740 |
| Iowa Fin. Auth. Wellness Facilities Rev. | | | | | | | | |
| (Cmnty. Y of Marshalltown Proj.) 2.8%, | | | | | | | | |
| LOC Bank of America NA, VRDN (b) . | | | | 3,500 | | | | 3,500 |
| | | | | | | | | 16,775 |
| |
| Kansas 0.7% | | | | | | | | |
| Kansas Dept. of Trans. Hwy. Rev.: | | | | | | | | |
| Participating VRDN Series EGL 00 | | | | | | | | |
| 1601, 2.79% (Liquidity Facility | | | | | | | | |
| Citibank NA, New York) (b)(e) | | | | 4,000 | | | | 4,000 |
| Series 2004 C3, 2.73% (Liquidity | | | | | | | | |
| Facility DEPFA BANK PLC), VRDN (b) | | | | 22,875 | | | | 22,875 |
| Kansas Dev. Fin. Auth. Lease Rev. (State | | | | | | | | |
| of Kansas Dept. of Administration 7th | | | | | | | | |
| and Harrison State Office Bldg. Proj.) | | | | | | | | |
| Series 2002 J1, 2.8% (Liquidity Facility | | | | | | | | |
| Kansas Pooled Money Invt. Board), | | | | | | | | |
| VRDN (b) | | | | 9,830 | | | | 9,830 |
| | | | | | | | | 36,705 |
| |
| Kentucky – 0.5% | | | | | | | | |
| Kentucky Property & Bldgs. Commission | | | | | | | | |
| Revs. Participating VRDN: | | | | | | | | |
| Series EGL 04 2, 2.79% (Liquidity | | | | | | | | |
| Facility Citibank NA) (b)(e) | | | | 3,000 | | | | 3,000 |
| Series Putters 739, 2.79% (Liquidity | | | | | | | | |
| Facility PNC Bank NA, | | | | | | | | |
| Pittsburgh) (b)(e) | | | | 2,860 | | | | 2,860 |
| Louisville & Jefferson County | | | | | | | | |
| Metropolitan Swr. District Swr. & Drain | | | | | | | | |
| Sys. Rev. Participating VRDN Series | | | | | | | | |
| EGL 01 1701, 2.79% (Liquidity Facility | | | | | | | | |
| Citibank NA, New York) (b)(e) | | | | 3,915 | | | | 3,915 |
| Mason County Poll. Cont. Rev. (East | | | | | | | | |
| Kentucky Pwr. Coop. Proj.): | | | | | | | | |
| Series 1984 B1, 3% (Nat’l. Rural Utils. | | | | | | | | |
| Coop. Fin. Corp. Guaranteed), | | | | | | | | |
| VRDN (b) | | | | 2,450 | | | | 2,450 |
See accompanying notes which are an integral part of the financial statements.
51 Semiannual Report
Tax-Exempt Portfolio
Investments (Unaudited) - continued
|
| Municipal Securities continued | | | | | | |
| |
| | | Principal | | Value (Note 1) |
| | | Amount (000s) | | (000s) |
| |
| Kentucky – continued | | | | | | | | |
| Mason County Poll. Cont. Rev. (East | | | | | | | | |
| Kentucky Pwr. Coop. Proj.): – | | | | | | | | |
| continued | | | | | | | | |
| Series 1984 B2, 3% (Nat’l. Rural Utils. | | | | | | |
| Coop. Fin. Corp. Guaranteed), | | | | | | | | |
| VRDN (b) | | $ | | 6,950 | | $ | | 6,950 |
| Series 1984 B3, 3% (Nat’l. Rural Utils. | | | | | | |
| Coop. Fin. Corp. Guaranteed), | | | | | | | | |
| VRDN (b) | | | | 6,425 | | | | 6,425 |
| | | | | | | | | 25,600 |
| |
| Louisiana 1.0% | | | | | | | | |
| Ernest N. Morial New Orleans Exhibit | | | | | | |
| Hall Auth. Spl. Tax Participating VRDN | | | | | | |
| Series Merlots 03 A46, 2.77% | | | | | | | | |
| (Liquidity Facility Wachovia Bank | | | | | | | | |
| NA) (b)(e) | | | | 8,070 | | | | 8,070 |
| Louisiana Gas & Fuel Tax Rev. | | | | | | | | |
| Participating VRDN: | | | | | | | | |
| Series MS 1127, 2.78% (Liquidity | | | | | | | | |
| Facility Morgan Stanley) (b)(e) | | | | 15,970 | | | | 15,970 |
| Series PT 2749, 2.79% (Liquidity | | | | | | | | |
| Facility Merrill Lynch & Co., | | | | | | | | |
| Inc.) (b)(e) | | | | 5,000 | | | | 5,000 |
| Louisiana Pub. Facilities Auth. Rev. | | | | | | | | |
| Participating VRDN Series PT 2439, | | | | | | |
| 2.79% (Liquidity Facility Merrill Lynch | | | | | | |
| & Co., Inc.) (b)(e) | | | | 6,270 | | | | 6,270 |
| New Orleans Aviation Board Rev. (MBIA | | | | | | |
| Insured) Series 1993 B, 2.86% (MBIA | | | | | | |
| Insured), VRDN (b) | | | | 18,000 | | | | 18,000 |
| | | | | | | | | 53,310 |
| |
| Maine – 0.2% | | | | | | | | |
| Maine Health & Higher Ed. Facilities | | | | | | | | |
| Auth. Rev. Participating VRDN Series | | | | | | |
| PT 1923, 2.79% (Liquidity Facility | | | | | | | | |
| Merrill Lynch & Co., Inc.) (b)(e) | | | | 2,745 | | | | 2,745 |
| Maine Hsg. Auth. Gen. Hsg. Rev. | | | | | | | | |
| Participating VRDN: | | | | | | | | |
| Series PT 2336, 2.8% (Liquidity Facility | | | | | | |
| Merrill Lynch & Co., Inc.) (b)(e) | | | | 1,925 | | | | 1,925 |
| Series PT 2487, 2.8% (Liquidity Facility | | | | | | |
| Merrill Lynch & Co., Inc.) (b)(e) | | | | 1,920 | | | | 1,920 |
| Maine Tpk. Auth. Tpk. Rev. Participating | | | | | | |
| VRDN Series EGL 00 1901, 2.79% | | | | | | | | |
| (Liquidity Facility Citibank NA, New | | | | | | |
| York) (b)(e) | | | | 3,975 | | | | 3,975 |
| | | | | | | | | 10,565 |
| |
| Maryland – 0.7% | | | | | | | | |
| Baltimore Rev. Participating VRDN Series | | | | | | |
| SGA 20, 2.81% (Liquidity Facility | | | | | | | | |
| Societe Generale) (b)(e) | | | | 5,500 | | | | 5,500 |
| | | Principal | | Value (Note 1) |
| | | Amount (000s) | | (000s) |
| |
| Maryland Cmnty. Dev. Administration | | | | | | | | |
| Dept. of Hsg. & Cmnty. Dev. | | | | | | | | |
| Participating VRDN Series MT 160, | | | | | | | | |
| 2.8% (Liquidity Facility Merrill Lynch & | | | | | | | | |
| Co., Inc.) (b)(e) | | $ | | 10,900 | | $ | | 10,900 |
| Montgomery County Econ. Dev. Rev. | | | | | | | | |
| (Riderwood Village, Inc. Proj.) 2.77%, | | | | | | | | |
| LOC Manufacturers & Traders Trust | | | | | | | | |
| Co., VRDN (b) | | | | 20,000 | | | | 20,000 |
| | | | | | | | | 36,400 |
| |
| Massachusetts 2.2% | | | | | | | | |
| Massachusetts Gen. Oblig.: | | | | | | | | |
| Participating VRDN: | | | | | | | | |
| Series EGL 04 0005, 2.78% | | | | | | | | |
| (Liquidity Facility Citibank | | | | | | | | |
| NA) (b)(e) | | | | 12,000 | | | | 12,000 |
| Series EGL 7050062, 2.78% | | | | | | | | |
| (Liquidity Facility Citibank | | | | | | | | |
| NA) (b)(e) | | | | 16,575 | | | | 16,575 |
| Series 2001 B, 2.82% (Liquidity Facility | | | | | | | | |
| Landesbank Hessen Thuringen), | | | | | | | | |
| VRDN (b) | | | | 26,595 | | | | 26,595 |
| Massachusetts Spl. Oblig. Dedicated Tax | | | | | | | | |
| Rev. Participating VRDN: | | | | | | | | |
| Series EGL 7050063, 2.78% (Liquidity | | | | | | | | |
| Facility Citibank NA) (b)(e) | | | | 54,400 | | | | 54,400 |
| Series EGL 7050068, 2.78% (Liquidity | | | | | | | | |
| Facility Citibank NA) (b)(e) | | | | 11,880 | | | | 11,880 |
| | | | | | | | | 121,450 |
| |
| Michigan – 3.4% | | | | | | | | |
| Charlotte Pub. School District | | | | | | | | |
| Participating VRDN Series Putters 860, | | | | | | | | |
| 2.79% (Liquidity Facility JPMorgan | | | | | | | | |
| Chase Bank) (b)(e) | | | | 5,050 | | | | 5,050 |
| Detroit City School District Participating | | | | | | | | |
| VRDN: | | | | | | | | |
| ROC II R1033, 2.79% (Liquidity Facility | | | | | | | | |
| Citigroup Global Markets Hldgs., | | | | | | | | |
| Inc.) (b)(e) | | | | 3,675 | | | | 3,675 |
| Series BA 01 P, 2.85% (Liquidity | | | | | | | | |
| Facility Bank of America NA) (b)(e) . | | | | 6,075 | | | | 6,075 |
| Series PT 1579, 2.78% (Liquidity | | | | | | | | |
| Facility Merrill Lynch & Co., | | | | | | | | |
| Inc.) (b)(e) | | | | 13,035 | | | | 13,035 |
| Detroit Swr. Disp. Rev. Participating | | | | | | | | |
| VRDN: | | | | | | | | |
| Series PA 1183, 2.78% (Liquidity | | | | | | | | |
| Facility Merrill Lynch & Co., | | | | | | | | |
| Inc.) (b)(e) | | | | 8,025 | | | | 8,025 |
| Series PT 2595, 2.78% (Liquidity | | | | | | | | |
| Facility Dexia Cr. Local de | | | | | | | | |
| France) (b)(e) | | | | 11,505 | | | | 11,505 |
| Detroit Wtr. Supply Sys. Rev. | | | | | | | | |
| Participating VRDN Series Merlots 00 | | | | | | | | |
| D, 2.77% (Liquidity Facility Wachovia | | | | | | | | |
| Bank NA) (b)(e) | | | | 2,000 | | | | 2,000 |
See accompanying notes which are an integral part of the financial statements.
Semiannual Report 52
| Municipal Securities continued | | | | | | |
| |
| | | Principal | | Value (Note 1) |
| | | Amount (000s) | | (000s) |
| |
| Michigan – continued | | | | | | | | |
| Fraser Pub. School District Participating | | | | | | |
| VRDN Series AAB 05 39, 2.77% | | | | | | | | |
| (Liquidity Facility ABN AMRO Bank | | | | | | |
| NV) (b)(e) | | $ | | 8,000 | | $ | | 8,000 |
| Grand Rapids San. Swr. Sys. Rev. | | | | | | | | |
| Participating VRDN Series TOC 04 G, | | | | | | |
| 2.78% (Liquidity Facility Goldman | | | | | | | | |
| Sachs Group, Inc.) (b)(e) | | | | 2,000 | | | | 2,000 |
| Huron Valley School District Participating | | | | | | |
| VRDN Series EGL 01 2203, 2.79% | | | | | | | | |
| (Liquidity Facility Citibank NA, New | | | | | | |
| York) (b)(e) | | | | 13,375 | | | | 13,375 |
| Michigan Bldg. Auth. Rev. Participating | | | | | | |
| VRDN: | | | | | | | | |
| Series AAB 02 35, 2.77% (Liquidity | | | | | | |
| Facility ABN AMRO Bank NV) (b)(e) | | 13,845 | | | | 13,845 |
| Series EGL 01 2202, 2.79% (Liquidity | | | | | | |
| Facility Citibank NA, New | | | | | | | | |
| York) (b)(e) | | | | 8,145 | | | | 8,145 |
| Series PA 889R, 2.78% (Liquidity | | | | | | | | |
| Facility Merrill Lynch & Co., | | | | | | | | |
| Inc.) (b)(e) | | | | 7,795 | | | | 7,795 |
| Michigan Gen. Oblig. Participating | | | | | | | | |
| VRDN Series Putters 125, 2.79% | | | | | | | | |
| (Liquidity Facility JPMorgan Chase & | | | | | | |
| Co.) (b)(e) | | | | 9,055 | | | | 9,055 |
| Michigan Hosp. Fin. Auth. Hosp. Rev. | | | | | | |
| Series C, 2.79%, LOC Fifth Third Bank, | | | | | | |
| Cincinnati, VRDN (b) | | | | 11,900 | | | | 11,900 |
| Michigan Muni. Bond Auth. Rev. RAN | | | | | | |
| Series 2005 B2, 4% 8/18/06, LOC | | | | | | |
| JPMorgan Chase Bank | | | | 44,300 | | | | 44,709 |
| Michigan Strategic Fund Ltd. Oblig. Rev. | | | | | | |
| (The Van Andel Research Institute Proj.) | | | | | | |
| Series 1999, 2.78%, LOC Standard | | | | | | |
| Fed. Bank, VRDN (b) | | | | 14,400 | | | | 14,400 |
| Oakridge Pub. Schools Participating | | | | | | | | |
| VRDN Series PT 3059, 2.78% | | | | | | | | |
| (Liquidity Facility Merrill Lynch & Co., | | | | | | |
| Inc.) (b)(e) | | | | 5,035 | | | | 5,035 |
| | | | | | | | | 187,624 |
| |
| Minnesota – 1.1% | | | | | | | | |
| Duluth Econ. Dev. Auth. Health Care | | | | | | | | |
| Facilities Rev. (Miller Dwan Med. Ctr. | | | | | | |
| #97 Proj.) 2.85%, LOC U.S. Bank NA, | | | | | | |
| Minnesota, VRDN (b) | | | | 3,650 | | | | 3,650 |
| Minneapolis & Saint Paul Hsg. Fin. | | | | | | | | |
| Board Rev. Participating VRDN Series | | | | | | |
| MT 120, 2.8% (Liquidity Facility | | | | | | | | |
| Landesbank Hessen Thuringen) (b)(e) . | | 6,160 | | | | 6,160 |
| Minneapolis & Saint Paul Metropolitan | | | | | | |
| Arpts. Commission Arpt. Rev. | | | | | | | | |
| Participating VRDN: | | | | | | | | |
| Series Merlots 00 ZZ, 2.77% (Liquidity | | | | | | |
| Facility Wachovia Bank NA) (b)(e) | | 3,275 | | | | 3,275 |
| Series SGA 121, 2.81% (Liquidity | | | | | | | | |
| Facility Societe Generale) (b)(e) | | | | 3,700 | | | | 3,700 |
| | | Principal | | Value (Note 1) |
| | | Amount (000s) | | (000s) |
| |
| Minnesota Gen. Oblig. Participating | | | | | | | | |
| VRDN: | | | | | | | | |
| Series EGL 01 2301, 2.79% (Liquidity | | | | | | | | |
| Facility Citibank NA, New | | | | | | | | |
| York) (b)(e) | | $ | | 3,300 | | $ | | 3,300 |
| Series MS 01 719, 2.78% (Liquidity | | | | | | | | |
| Facility Morgan Stanley) (b)(e) | | | | 6,735 | | | | 6,735 |
| Series ROC II R4039, 2.79% (Liquidity | | | | | | | | |
| Facility Citigroup Global Markets | | | | | | | | |
| Hldgs., Inc.) (b)(e) | | | | 3,650 | | | | 3,650 |
| Minnetonka Multi family Hsg. Rev. (Cliffs | | | | | | | | |
| at Ridgedale Proj.) Series 1995, 2.8%, | | | | | | | | |
| LOC Fannie Mae, VRDN (b) | | | | 21,400 | | | | 21,400 |
| Roseville Health Care Facilities | | | | | | | | |
| (Presbyterian Homes Proj.) 2.85%, | | | | | | | | |
| LOC U.S. Bank NA, Minnesota, | | | | | | | | |
| VRDN (b) | | | | 3,505 | | | | 3,505 |
| West Saint Paul Independent School | | | | | | | | |
| District #197 Participating VRDN | | | | | | | | |
| Series Putters 602, 2.79% (Liquidity | | | | | | | | |
| Facility JPMorgan Chase & Co.) (b)(e) . | | | | 3,940 | | | | 3,940 |
| | | | | | | | | 59,315 |
| |
| Mississippi 0.8% | | | | | | | | |
| Claiborne County Poll. Cont. Rev. Bonds | | | | | | | | |
| (South Mississippi Elec. Pwr. Assoc. | | | | | | | | |
| Proj.) Series 1985 G2, 2.75% tender | | | | | | | | |
| 10/3/05 (Nat’l. Rural Utils. Coop. Fin. | | | | | | | | |
| Corp. Guaranteed), CP mode | | | | 7,800 | | | | 7,800 |
| Mississippi Dev. Bank Spl. Oblig. Series | | | | | | | | |
| 2005 B, 2.75% (FGIC Insured), | | | | | | | | |
| VRDN (b) | | | | 10,000 | | | | 10,000 |
| Mississippi Gen. Oblig. Participating | | | | | | | | |
| VRDN: | | | | | | | | |
| Series EGL 99 2401, 2.79% (Liquidity | | | | | | | | |
| Facility Citibank NA, New | | | | | | | | |
| York) (b)(e) | | | | 5,300 | | | | 5,300 |
| Series MS 905, 2.78% (Liquidity | | | | | | | | |
| Facility Morgan Stanley) (b)(e) | | | | 3,325 | | | | 3,325 |
| Series Putters 138, 2.79% (Liquidity | | | | | | | | |
| Facility JPMorgan Chase & | | | | | | | | |
| Co.) (b)(e) | | | | 14,380 | | | | 14,380 |
| Series ROC II R1043, 2.79% (Liquidity | | | | | | | | |
| Facility Citigroup Global Markets | | | | | | | | |
| Hldgs., Inc.) (b)(e) | | | | 4,420 | | | | 4,420 |
| | | | | | | | | 45,225 |
| |
| Missouri 1.5% | | | | | | | | |
| Kansas City Indl. Dev. Auth. (Ewing | | | | | | | | |
| Marion Kauffman Foundation Prog.) | | | | | | | | |
| 2.8%, VRDN (b) | | | | 7,000 | | | | 7,000 |
| Missouri Board of Pub. Bldgs. State | | | | | | | | |
| Office Bldg. Spl. Oblig. Participating | | | | | | | | |
| VRDN Series Putters 382, 2.79% | | | | | | | | |
| (Liquidity Facility JPMorgan Chase | | | | | | | | |
| Bank) (b)(e) | | | | 7,040 | | | | 7,040 |
| Missouri Health & Edl. Facilities Auth. | | | | | | | | |
| Edl. Facilities Rev.: | | | | | | | | |
| Participating VRDN Series SG 157, | | | | | | | | |
| 2.79% (Liquidity Facility Societe | | | | | | | | |
| Generale) (b)(e) | | | | 14,840 | | | | 14,840 |
See accompanying notes which are an integral part of the financial statements.
53 Semiannual Report
| | Tax-Exempt Portfolio
Investments (Unaudited) - continued
|
| Municipal Securities continued | | | | | | |
| |
| | | Principal | | Value (Note 1) |
| | | Amount (000s) | | (000s) |
| |
| Missouri – continued | | | | | | | | |
| Missouri Health & Edl. Facilities Auth. | | | | | | |
| Edl. Facilities Rev.: – continued | | | | | | | | |
| (DeSmet Jesuit High School Proj.) | | | | | | | | |
| Series 2002, 2.85%, LOC U.S. Bank | | | | | | |
| NA, Minnesota, VRDN (b) | | $ | | 5,900 | | $ | | 5,900 |
| (Saint Louis Univ. Proj.): | | | | | | | | |
| Series 1999 B, 2.85% (Liquidity | | | | | | | | |
| Facility Bank of America NA), | | | | | | | | |
| VRDN (b) | | | | 4,900 | | | | 4,900 |
| 2.85% (Liquidity Facility U.S. Bank | | | | | | |
| NA, Minnesota), VRDN (b) | | | | 4,120 | | | | 4,120 |
| Missouri Health & Edl. Facilities Auth. | | | | | | |
| Health Facilities Rev.: | | | | | | | | |
| Participating VRDN Series Putters 847, | | | | | | |
| 2.79% (Liquidity Facility JPMorgan | | | | | | |
| Chase Bank) (b)(e) | | | | 3,195 | | | | 3,195 |
| (BJC Health Sys. Proj.) Series B, 2.81% | | | | | | |
| (Liquidity Facility Bank of Nova | | | | | | | | |
| Scotia, New York Agcy.) (Liquidity | | | | | | |
| Facility JPMorgan Chase Bank), | | | | | | | | |
| VRDN (b) | | | | 29,350 | | | | 29,350 |
| Platte County Reorganized School District | | | | | | |
| Participating VRDN Series PT 2180, | | | | | | |
| 2.79% (Liquidity Facility Merrill Lynch | | | | | | |
| & Co., Inc.) (b)(e) | | | | 5,230 | | | | 5,230 |
| | | | | | | | | 81,575 |
| |
| Nebraska 0.6% | | | | | | | | |
| Muni. Energy Agcy. Pwr. Swr. Rev. | | | | | | | | |
| Participating VRDN: | | | | | | | | |
| Series MS 1176, 2.78% (Liquidity | | | | | | | | |
| Facility Morgan Stanley) (b)(e) | | | | 8,615 | | | | 8,615 |
| Series ROC II R2051, 2.79% (Liquidity | | | | | | |
| Facility Citigroup Global Markets | | | | | | | | |
| Hldgs., Inc.) (b)(e) | | | | 4,370 | | | | 4,370 |
| Omaha Gen. Oblig. Participating VRDN: | | | | | | |
| Series EGL 00 2701, 2.79% (Liquidity | | | | | | |
| Facility Citibank NA, New | | | | | | | | |
| York) (b)(e) | | | | 9,000 | | | | 9,000 |
| Series MSTC 00 108, 2.85% (Liquidity | | | | | | |
| Facility Bear Stearns Companies, | | | | | | | | |
| Inc.) (b)(e) | | | | 9,495 | | | | 9,495 |
| | | | | | | | | 31,480 |
| |
| Nevada 0.9% | | | | | | | | |
| Clark County School District Participating | | | | | | |
| VRDN: | | | | | | | | |
| Series PT 2406, 2.79% (Liquidity | | | | | | | | |
| Facility Merrill Lynch & Co., | | | | | | | | |
| Inc.) (b)(e) | | | | 5,500 | | | | 5,500 |
| Series Putters 745, 2.79% (Liquidity | | | | | | |
| Facility JPMorgan Chase Bank) (b)(e) | | 3,600 | | | | 3,600 |
| | | Principal | | Value (Note 1) |
| | | Amount (000s) | | (000s) |
| |
| Las Vegas Valley Wtr. District | | | | | | | | |
| Participating VRDN Series PT 1675, | | | | | | | | |
| 2.79% (Liquidity Facility Merrill Lynch | | | | | | | | |
| & Co., Inc.) (b)(e) | | $ | | 11,930 | | $ | | 11,930 |
| Nevada Gen. Oblig. Participating | | | | | | | | |
| VRDN: | | | | | | | | |
| Series PT 2762, 2.79% (Liquidity | | | | | | | | |
| Facility Merrill Lynch & Co., | | | | | | | | |
| Inc.) (b)(e) | | | | 7,500 | | | | 7,500 |
| Series SG 39, 2.79% (Liquidity Facility | | | | | | | | |
| Societe Generale) (b)(e) | | | | 9,160 | | | | 9,160 |
| Series SGB 31, 2.79% (Liquidity | | | | | | | | |
| Facility Societe Generale) (b)(e) | | | | 7,600 | | | | 7,600 |
| Washoe County School District Gen. | | | | | | | | |
| Oblig. Participating VRDN Series | | | | | | | | |
| Putters 759, 2.79% (Liquidity Facility | | | | | | | | |
| JPMorgan Chase & Co.) (b)(e) | | | | 6,480 | | | | 6,480 |
| | | | | | | | | 51,770 |
| |
| New Hampshire 0.2% | | | | | | | | |
| New Hampshire Bus. Fin. Auth. Poll. | | | | | | | | |
| Cont. Rev. Participating VRDN Series | | | | | | | | |
| PT 1810, 2.79% (Liquidity Facility | | | | | | | | |
| Merrill Lynch & Co., Inc.) (b)(e) | | | | 5,255 | | | | 5,255 |
| New Hampshire Health & Ed. Facilities | | | | | | | | |
| Auth. Rev. (Riverwoods at Exeter Proj.) | | | | | | | | |
| 2.81%, LOC Fleet Nat’l. Bank, | | | | | | | | |
| VRDN (b) | | | | 3,095 | | | | 3,095 |
| | | | | | | | | 8,350 |
| |
| New Jersey 1.9% | | | | | | | | |
| New Jersey Econ. Dev. Auth. Rev. | | | | | | | | |
| Participating VRDN Series MT 14, | | | | | | | | |
| 2.78% (Liquidity Facility BNP Paribas | | | | | | | | |
| SA) (b)(e) | | | | 6,080 | | | | 6,080 |
| New Jersey Edl. Facilities Auth. Rev. | | | | | | | | |
| Participating VRDN: | | | | | | | | |
| Series PA 1325, 2.78% (Liquidity | | | | | | | | |
| Facility Merrill Lynch & Co., | | | | | | | | |
| Inc.) (b)(e) | | | | 9,500 | | | | 9,500 |
| Series ROC II R2102, 2.78% (Liquidity | | | | | | | | |
| Facility Citigroup Global Markets | | | | | | | | |
| Hldgs., Inc.) (b)(e) | | | | 4,735 | | | | 4,735 |
| Series ROC II R5033, 2.78% (Liquidity | | | | | | | | |
| Facility Citigroup Global Markets | | | | | | | | |
| Hldgs., Inc.) (b)(e) | | | | 2,060 | | | | 2,060 |
| New Jersey Gen. Oblig. TRAN Series | | | | | | | | |
| 2005 A, 4% 6/23/06 | | | | 30,000 | | | | 30,247 |
| New Jersey Tpk. Auth. Tpk. Rev. | | | | | | | | |
| Participating VRDN: | | | | | | | | |
| Series PA 613, 2.78% (Liquidity Facility | | | | | | | | |
| Merrill Lynch & Co., Inc.) (b)(e) | | | | 3,165 | | | | 3,165 |
| Series PT 2843, 2.78% (Liquidity | | | | | | | | |
| Facility Dexia Cr. Local de | | | | | | | | |
| France) (b)(e) | | | | 4,000 | | | | 4,000 |
| New Jersey Trans. Trust Fund Auth. | | | | | | | | |
| Participating VRDN: | | | | | | | | |
| Series PA 646, 2.78% (Liquidity Facility | | | | | | | | |
| Merrill Lynch & Co., Inc.) (b)(e) | | | | 5,020 | | | | 5,020 |
See accompanying notes which are an integral part of the financial statements.
Semiannual Report 54
| Municipal Securities continued | | | | | | |
| |
| | | Principal | | Value (Note 1) |
| | | Amount (000s) | | (000s) |
| |
| New Jersey – continued | | | | | | | | |
| New Jersey Trans. Trust Fund Auth. | | | | | | | | |
| Participating VRDN: continued | | | | | | | | |
| Series PT 1926, 2.78% (Liquidity | | | | | | | | |
| Facility Merrill Lynch & Co., | | | | | | | | |
| Inc.) (b)(e) | | $ | | 8,315 | | $ | | 8,315 |
| Series PT 2402, 2.78% (Liquidity | | | | | | | | |
| Facility Dexia Cr. Local de | | | | | | | | |
| France) (b)(e) | | | | 9,000 | | | | 9,000 |
| Series PT 2494, 2.78% (Liquidity | | | | | | | | |
| Facility Dexia Cr. Local de | | | | | | | | |
| France) (b)(e) | | | | 15,800 | | | | 15,800 |
| Series ROC 4040, 2.78% (Liquidity | | | | | | | | |
| Facility Citigroup Global Markets | | | | | | | | |
| Hldgs., Inc.) (b)(e) | | | | 7,080 | | | | 7,080 |
| | | | | | | | | 105,002 |
| |
| New Jersey/Pennsylvania – 0.1% | | | | | | | | |
| Delaware River Port Auth. Pennsylvania | | | | | | |
| & New Jersey Rev. Participating VRDN | | | | | | |
| Series SGA 89, 2.85% (Liquidity | | | | | | | | |
| Facility Societe Generale) (b)(e) | | | | 6,545 | | | | 6,545 |
| New York 5.1% | | | | | | | | |
| Metropolitan Trans. Auth. Rev. | | | | | | | | |
| Participating VRDN: | | | | | | | | |
| Series PA 1040, 2.78% (Liquidity | | | | | | | | |
| Facility Merrill Lynch & Co., | | | | | | | | |
| Inc.) (b)(e) | | | | 7,000 | | | | 7,000 |
| Series ROC II R282, 2.78% (Liquidity | | | | | | |
| Facility Citibank NA) (b)(e) | | | | 20,155 | | | | 20,155 |
| New York City Gen. Oblig.: | | | | | | | | |
| Participating VRDN Series ROC II | | | | | | | | |
| R251, 2.82% (Citigroup Global | | | | | | | | |
| Markets Hldgs., Inc. Guaranteed) | | | | | | | | |
| (Liquidity Facility Citigroup Global | | | | | | |
| Markets Hldgs., Inc.) (b)(e) | | | | 12,000 | | | | 12,000 |
| Series 1994 A4, 2.8%, LOC WestLB | | | | | | |
| AG, VRDN (b) | | | | 9,500 | | | | 9,500 |
| New York City Indl. Dev. Agcy. Rev. (One | | | | | | |
| Bryant Park LLC Proj.): | | | | | | | | |
| Series A, 2.76%, LOC Bank of America | | | | | | |
| NA, LOC Bank of New York, New | | | | | | |
| York, VRDN (b) | | | | 29,500 | | | | 29,500 |
| Series B, 2.83%, LOC Bank of America | | | | | | |
| NA, LOC Bank of New York, New | | | | | | |
| York, VRDN (b) | | | | 9,300 | | | | 9,300 |
| New York City Muni. Wtr. Fin. Auth. Wtr. | | | | | | |
| & Swr. Sys. Rev.: | | | | | | | | |
| Participating VRDN: | | | | | | | | |
| Series EGL 04 27 Class A, 2.78% | | | | | | |
| (Liquidity Facility Citibank | | | | | | | | |
| NA) (b)(e) | | | | 8,485 | | | | 8,485 |
| Series EGL 04 35 Class A, 2.79% | | | | | | |
| (Liquidity Facility Citibank | | | | | | | | |
| NA) (b)(e) | | | | 4,950 | | | | 4,950 |
| Series PA 1327, 2.78% (Liquidity | | | | | | | | |
| Facility Merrill Lynch & Co., | | | | | | | | |
| Inc.) (b)(e) | | | | 34,080 | | | | 34,080 |
| | | Principal | | Value (Note 1) |
| | | Amount (000s) | | (000s) |
| |
| Series PA 960, 2.8% (Liquidity | | | | | | | | |
| Facility Merrill Lynch & Co., | | | | | | | | |
| Inc.) (b)(e) | | $ | | 7,100 | | $ | | 7,100 |
| Series PT 2443, 2.78% (Liquidity | | | | | | | | |
| Facility Merrill Lynch & Co., | | | | | | | | |
| Inc.) (b)(e) | | | | 7,280 | | | | 7,280 |
| Series Putters 621, 2.78% (Liquidity | | | | | | | | |
| Facility JPMorgan Chase & | | | | | | | | |
| Co.) (b)(e) | | | | 21,150 | | | | 21,150 |
| Series 2000 C, 2.93% (Liquidity | | | | | | | | |
| Facility Dexia Cr. Local de France), | | | | | | | | |
| VRDN (b) | | | | 13,000 | | | | 13,000 |
| New York State Dorm. Auth. Revs. | | | | | | | | |
| Participating VRDN: | | | | | | | | |
| Series MSDW 00 305, 2.76% | | | | | | | | |
| (Liquidity Facility Morgan | | | | | | | | |
| Stanley) (b)(e) | | | | 13,670 | | | | 13,670 |
| Series PA 1265, 2.78% (Liquidity | | | | | | | | |
| Facility Merrill Lynch & Co., | | | | | | | | |
| Inc.) (b)(e) | | | | 5,000 | | | | 5,000 |
| Series PA 784R, 2.78% (Liquidity | | | | | | | | |
| Facility Merrill Lynch & Co., | | | | | | | | |
| Inc.) (b)(e) | | | | 7,025 | | | | 7,025 |
| New York Transitional Fin. Auth. Rev. | | | | | | | | |
| Participating VRDN Series PT 1839, | | | | | | | | |
| 2.78% (Liquidity Facility Merrill Lynch | | | | | | | | |
| & Co., Inc.) (b)(e) | | | | 13,750 | | | | 13,750 |
| Triborough Bridge & Tunnel Auth. Revs. | | | | | | | | |
| Series B, 2.75% (Liquidity Facility | | | | | | | | |
| Dexia Cr. Local de France), VRDN (b) . | | | | 55,500 | | | | 55,500 |
| | | | | | | | | 278,445 |
| |
| Non State Specific – 0.1% | | | | | | | | |
| Clipper Tax Exempt Trust Participating | | | | | | | | |
| VRDN: | | | | | | | | |
| Series Clipper 05 26, 2.87% (Liquidity | | | | | | | | |
| Facility State Street Bank & Trust Co., | | | | | | | | |
| Boston) (b)(e) | | | | 3,360 | | | | 3,360 |
| Series Clipper 05 7, 2.87% (Liquidity | | | | | | | | |
| Facility State Street Bank & Trust Co., | | | | | | | | |
| Boston) (b)(e) | | | | 4,600 | | | | 4,600 |
| | | | | | | | | 7,960 |
| |
| North Carolina – 2.2% | | | | | | | | |
| High Point Combined Enterprise Sys. Rev. | | | | | | | | |
| Participating VRDN Series MS 998, | | | | | | | | |
| 2.78% (Liquidity Facility Morgan | | | | | | | | |
| Stanley) (b)(e) | | | | 2,503 | | | | 2,503 |
| Mecklenburg County Ctfs. of Prtn. 2.76% | | | | | | | | |
| (Liquidity Facility Bank of America | | | | | | | | |
| NA), VRDN (b) | | | | 10,000 | | | | 10,000 |
| North Carolina Cap. Facilities Fin. Agcy. | | | | | | | | |
| Rev. Participating VRDN Series TOC | | | | | | | | |
| 2005 I, 2.78% (Liquidity Facility | | | | | | | | |
| Goldman Sachs Group, Inc.) (b)(e) | | | | 17,840 | | | | 17,840 |
| North Carolina Cap. Facilities Fin. Agcy. | | | | | | | | |
| Student Rev. (Wolfpack Club Student | | | | | | | | |
| Hsg. Fund LLC Proj.) Series A, 2.78%, | | | | | | | | |
| LOC Wachovia Bank NA, VRDN (b) | | | | 9,885 | | | | 9,885 |
See accompanying notes which are an integral part of the financial statements.
55 Semiannual Report
Tax-Exempt Portfolio
Investments (Unaudited) - continued
|
| Municipal Securities continued | | | | | | |
| |
| | | Principal | | Value (Note 1) |
| | | Amount (000s) | | (000s) |
| |
| North Carolina – continued | | | | | | | | |
| North Carolina Ctfs. of Prtn. | | | | | | | | |
| Participating VRDN Series Putters 429, | | | | | | |
| 2.79% (Liquidity Facility JPMorgan | | | | | | | | |
| Chase Bank) (b)(e) | | $ | | 6,135 | | $ | | 6,135 |
| North Carolina Eastern Muni. Pwr. Agcy. | | | | | | |
| Pwr. Sys. Rev. Participating VRDN: | | | | | | | | |
| Series MS 00 209, 2.78% (Liquidity | | | | | | |
| Facility Morgan Stanley) (b)(e) | | | | 6,665 | | | | 6,665 |
| Series MS 955 D, 2.78% (Liquidity | | | | | | | | |
| Facility Morgan Stanley) (b)(e) | | | | 4,400 | | | | 4,400 |
| Series MT 99, 2.79% (Liquidity Facility | | | | | | |
| BNP Paribas SA) (b)(e) | | | | 4,075 | | | | 4,075 |
| Series PA 693, 2.79% (Liquidity Facility | | | | | | |
| Merrill Lynch & Co., Inc.) (b)(e) | | | | 6,495 | | | | 6,495 |
| North Carolina Gen. Oblig. Participating | | | | | | |
| VRDN: | | | | | | | | |
| Series IXIS 05 1, 2.78% (Liquidity | | | | | | | | |
| Facility CDC Fin. CDC IXIS) (b)(e) | | | | 11,730 | | | | 11,730 |
| Series PT 2207, 2.79% (Liquidity | | | | | | | | |
| Facility Merrill Lynch & Co., | | | | | | | | |
| Inc.) (b)(e) | | | | 8,540 | | | | 8,540 |
| Series ROC II R384, 2.79% (Liquidity | | | | | | |
| Facility Citibank NA) (b)(e) | | | | 4,445 | | | | 4,445 |
| North Carolina Med. Care Commission | | | | | | |
| Health Care Facilities Rev. (Carolina | | | | | | |
| Meadows, Inc. Proj.) 2.77%, LOC | | | | | | | | |
| Allied Irish Banks PLC, VRDN (b) | | | | 5,000 | | | | 5,000 |
| North Carolina Med. Care Commission | | | | | | |
| Retirement Facilities Rev. (The Givens | | | | | | |
| Estates Proj.) Series 2003 C, 2.77%, | | | | | | |
| LOC Bank of Scotland, VRDN (b) | | | | 6,000 | | | | 6,000 |
| North Carolina Muni. Pwr. Agcy. #1 | | | | | | | | |
| Catawba Elec. Rev. Participating | | | | | | | | |
| VRDN: | | | | | | | | |
| Series PT 900, 2.79% (Liquidity Facility | | | | | | |
| BNP Paribas SA) (b)(e) | | | | 9,695 | | | | 9,695 |
| Series ROC II R211, 2.79% (Liquidity | | | | | | |
| Facility Citibank NA) (b)(e) | | | | 4,330 | | | | 4,330 |
| Wake County Gen. Oblig. Participating | | | | | | |
| VRDN Series IXIS 05 9, 2.79% | | | | | | | | |
| (Liquidity Facility CDC Fin. CDC | | | | | | | | |
| IXIS) (b)(e) | | | | 2,175 | | | | 2,175 |
| | | | | | | | | 119,913 |
| |
| North Dakota – 0.1% | | | | | | | | |
| Ward County Health Care Facility Rev. | | | | | | |
| Series 2002 A, 2.85%, LOC U.S. Bank | | | | | | |
| NA, Minnesota, VRDN (b) | | | | 7,750 | | | | 7,750 |
| Ohio – 2.6% | | | | | | | | |
| Cincinnati City School District | | | | | | | | |
| Participating VRDN Series EGL 04 34, | | | | | | |
| 2.79% (Liquidity Facility Citibank | | | | | | | | |
| NA) (b)(e) | | | | 6,000 | | | | 6,000 |
| | | Principal | | Value (Note 1) |
| | | Amount (000s) | | (000s) |
| |
| Columbus City School District | | | | | | | | |
| Participating VRDN Series TOC 04 H, | | | | | | | | |
| 2.78% (Liquidity Facility Goldman | | | | | | | | |
| Sachs Group, Inc.) (b)(e) | | $ | | 8,300 | | $ | | 8,300 |
| Columbus Gen. Oblig. Participating | | | | | | | | |
| VRDN Series IXIS 05 2 Class A, 2.78% | | | | | | | | |
| (Liquidity Facility CDC Fin. CDC | | | | | | | | |
| IXIS) (b)(e) | | | | 10,125 | | | | 10,125 |
| Cuyahoga County Econ. Dev. Rev. | | | | | | | | |
| (Cleveland Botanical Garden Proj.) | | | | | | | | |
| 2.78%, LOC Allied Irish Banks PLC, | | | | | | | | |
| VRDN (b) | | | | 10,000 | | | | 10,000 |
| Cuyahoga County Health Care Facilities | | | | | | | | |
| Rev. (The A.M. McGregor Home Proj.) | | | | | | | | |
| 2.77%, LOC Key Bank NA, VRDN (b) . | | | | 4,425 | | | | 4,425 |
| Cuyahoga County Rev. (Cleveland Clinic | | | | | | | | |
| Health Sys. Obligated Group Prog.) | | | | | | | | |
| Subseries B1, 2.86%, VRDN (b) | | | | 17,500 | | | | 17,500 |
| Erie County Health Care Facilities Rev. | | | | | | | | |
| (Commons of Providence Proj.) Series | | | | | | | | |
| 1999 B, 2.9%, LOC JPMorgan Chase | | | | | | | | |
| Bank, VRDN (b) | | | | 3,300 | | | | 3,300 |
| Lake County Hosp. Facilities Rev. (Lake | | | | | | | | |
| Hosp. Sys., Inc. Proj.) Series 1996, | | | | | | | | |
| 2.83%, LOC JPMorgan Chase Bank, | | | | | | | | |
| VRDN (b) | | | | 10,830 | | | | 10,830 |
| Ohio Bldg. Auth. Participating VRDN: | | | | | | | | |
| Series FRRI 02 L 31J, 2.82% (Liquidity | | | | | | | | |
| Facility Lehman Brothers Hldgs., | | | | | | | | |
| Inc.) (b)(e) | | | | 5,375 | | | | 5,375 |
| Series LB 04 L21J, 2.82% (Liquidity | | | | | | | | |
| Facility Lehman Brothers Hldgs., | | | | | | | | |
| Inc.) (b)(e) | | | | 13,100 | | | | 13,100 |
| Ohio Gen. Oblig. Participating VRDN: | | | | | | | | |
| Series PT 1591, 2.78% (Liquidity | | | | | | | | |
| Facility Merrill Lynch & Co., | | | | | | | | |
| Inc.) (b)(e) | | | | 10,000 | | | | 10,000 |
| Series Putters 389, 2.79% (Liquidity | | | | | | | | |
| Facility JPMorgan Chase Bank) (b)(e) | | | | 7,420 | | | | 7,420 |
| Series Putters 511, 2.79% (Liquidity | | | | | | | | |
| Facility PNC Bank NA, | | | | | | | | |
| Pittsburgh) (b)(e) | | | | 10,345 | | | | 10,345 |
| Ohio Higher Edl. Facility Commission | | | | | | | | |
| Rev. (Pooled Fing. Prog.): | | | | | | | | |
| Series 1997, 2.83%, LOC Fifth Third | | | | | | | | |
| Bank, Cincinnati, VRDN (b) | | | | 4,705 | | | | 4,705 |
| Series 1999, 2.83%, LOC Fifth Third | | | | | | | | |
| Bank, Cincinnati, VRDN (b) | | | | 4,875 | | | | 4,875 |
| Ohio Tpk. Commission Tpk. Rev. | | | | | | | | |
| Participating VRDN Series MS 98 71, | | | | | | | | |
| 2.77% (Liquidity Facility Morgan | | | | | | | | |
| Stanley) (b)(e) | | | | 2,620 | | | | 2,620 |
| Warren County Health Care Facilities | | | | | | | | |
| Rev. (Otterbein Homes Proj.) Series | | | | | | | | |
| 1998 B, 2.82%, LOC Fifth Third Bank, | | | | | | | | |
| Cincinnati, VRDN (b) | | | | 10,705 | | | | 10,705 |
| | | | | | | | | 139,625 |
See accompanying notes which are an integral part of the financial statements.
Semiannual Report 56
| Municipal Securities continued | | | | | | |
| |
| | | Principal | | Value (Note 1) |
| | | Amount (000s) | | (000s) |
| |
| Oklahoma – 0.8% | | | | | | | | |
| Oklahoma Dev. Fin. Auth. Rev. | | | | | | | | |
| (Continuing Care Cmnty. Proj.) Series | | | | | | |
| 2002 C, 2.85%, LOC KBC Bank NV, | | | | | | |
| VRDN (b) | | $ | | 2,300 | | $ | | 2,300 |
| Oklahoma Industries Auth. Rev. | | | | | | | | |
| Participating VRDN Series Putters | | | | | | | | |
| 455Z, 2.79% (Liquidity Facility | | | | | | | | |
| JPMorgan Chase Bank) (b)(e) | | | | 7,495 | | | | 7,495 |
| Payne County Econ. Dev. Auth. Student | | | | | | |
| Hsg. Rev. (OSUF Phase III Proj.) 2.78% | | | | | | |
| (AMBAC Insured), VRDN (b) | | | | 35,400 | | | | 35,400 |
| | | | | | | | | 45,195 |
| |
| Oregon – 0.5% | | | | | | | | |
| Oregon Dept. Administrative Svcs. Ctfs. | | | | | | |
| of Prtn. Participating VRDN Series | | | | | | | | |
| Putters 876, 2.79% (Liquidity Facility | | | | | | |
| JPMorgan Chase Bank) (b)(e) | | | | 5,275 | | | | 5,275 |
| Oregon Dept. of Trans. Hwy. User Tax | | | | | | |
| Rev. Participating VRDN Series Putters | | | | | | |
| 469, 2.79% (Liquidity Facility | | | | | | | | |
| JPMorgan Chase Bank) (b)(e) | | | | 9,725 | | | | 9,725 |
| Port Morrow Poll. Cont. Rev. | | | | | | | | |
| Participating VRDN Series FRRI 03 F4J, | | | | | | |
| 2.92% (Lehman Brothers Hldgs., Inc. | | | | | | |
| Guaranteed) (Liquidity Facility Lehman | | | | | | |
| Brothers Hldgs., Inc.) (b)(e) | | | | 10,000 | | | | 10,000 |
| Tri City Metropolitan Trans. District Rev. | | | | | | |
| Participating VRDN Series Putters 787, | | | | | | |
| 2.79% (Liquidity Facility JPMorgan | | | | | | | | |
| Chase Bank) (b)(e) | | | | 4,245 | | | | 4,245 |
| | | | | | | | | 29,245 |
| |
| Pennsylvania – 4.8% | | | | | | | | |
| Allegheny County Hosp. Dev. Auth. Rev. | | | | | | |
| Bonds Series PT 762, 2.85%, tender | | | | | | |
| 6/15/06 (Liquidity Facility | | | | | | | | |
| Landesbank Hessen Thuringen) (b)(e)(f) | | 11,300 | | | | 11,300 |
| Allegheny County Indl. Dev. Auth. Rev. | | | | | | |
| (UPMC Children’s Hosp. Proj.) Series | | | | | | |
| 2004 A, 2.86%, VRDN (b) | | | | 12,400 | | | | 12,400 |
| Chester County Health & Ed. Facilities | | | | | | |
| Auth. Retirement Cmnty. Rev. | | | | | | | | |
| (Kendal-Crosslands Communities Proj.) | | | | | | |
| Series 2003, 2.77%, LOC Allied Irish | | | | | | |
| Banks PLC, VRDN (b) | | | | 2,845 | | | | 2,845 |
| Delaware County Auth. Hosp. Rev. | | | | | | | | |
| (Crozer Chester Med. Ctr. Proj.) Series | | | | | | |
| 1996, 2.76%, LOC KBC Bank NV, | | | | | | | | |
| VRDN (b) | | | | 4,380 | | | | 4,380 |
| Delaware County Indl. Dev. Auth. Poll. | | | | | | |
| Cont. Rev. (PECO Energy Co. Proj.) | | | | | | | | |
| Series 1999 A, 2.95%, LOC Wachovia | | | | | | |
| Bank NA, VRDN (b) | | | | 6,850 | | | | 6,850 |
| | | Principal | | Value (Note 1) |
| | | Amount (000s) | | (000s) |
| |
| Geisinger Auth. Health Sys. Rev. | | | | | | | | |
| (Geisinger Health Sys. Proj.): | | | | | | | | |
| Series B, 2.81% (Liquidity Facility | | | | | | | | |
| Wachovia Bank NA), VRDN (b) | | $ | | 24,200 | | $ | | 24,200 |
| Series C, 2.81% (Liquidity Facility | | | | | | | | |
| Wachovia Bank NA), VRDN (b) | | | | 17,600 | | | | 17,600 |
| Harrisburg Auth. Wtr. Rev. Series 2002 | | | | | | | | |
| B, 2.8% (FSA Insured), VRDN (b) | | | | 13,535 | | | | 13,535 |
| Lackawanna County Gen. Oblig. Series | | | | | | | | |
| 2004 B, 2.78% (FSA Insured), | | | | | | | | |
| VRDN (b) | | | | 9,285 | | | | 9,285 |
| Lancaster Higher Ed. Auth. College Rev. | | | | | | | | |
| (Franklin & Marshall College Proj.) | | | | | | | | |
| Series 1997, 2.85%, VRDN (b) | | | | 14,330 | | | | 14,330 |
| Luzerne County Indl. Dev. Auth. Rev. | | | | | | | | |
| (United Methodist Homes Proj.) 2.81%, | | | | | | | | |
| LOC Bank of New York, New York, | | | | | | | | |
| VRDN (b) | | | | 5,320 | | | | 5,320 |
| Manheim Township School District 2.77% | | | | | | | | |
| (FSA Insured), VRDN (b) | | | | 8,000 | | | | 8,000 |
| Montgomery Higher Ed. & Health Auth. | | | | | | | | |
| Hosp. Rev. Participating VRDN Series | | | | | | | | |
| MSTC 98 31 Class A, 2.83% (Liquidity | | | | | | | | |
| Facility Bear Stearns Companies, | | | | | | | | |
| Inc.) (b)(e) | | | | 10,000 | | | | 10,000 |
| Pennsylvania Gen. Oblig. Participating | | | | | | | | |
| VRDN: | | | | | | | | |
| Series EGL 04 43 Class A, 2.78% | | | | | | | | |
| (Liquidity Facility Citibank NA) (b)(e) | | | | 5,750 | | | | 5,750 |
| Series IXIS 05 8 Class A, 2.78% | | | | | | | | |
| (Liquidity Facility CDC Fin. CDC | | | | | | | | |
| IXIS) (b)(e) | | | | 34,900 | | | | 34,900 |
| Series MSTC 00 110, 2.8% (Liquidity | | | | | | | | |
| Facility Bear Stearns Companies, | | | | | | | | |
| Inc.) (b)(e) | | | | 1,000 | | | | 1,000 |
| Pennsylvania Higher Edl. Facilities Auth. | | | | | | | | |
| Hosp. Rev. Participating VRDN Series | | | | | | | | |
| MT 42, 2.81% (Liquidity Facility Lloyds | | | | | | | | |
| TSB Bank PLC) (b)(e) | | | | 10,455 | | | | 10,455 |
| Pennsylvania Higher Edl. Facilities Auth. | | | | | | | | |
| Rev.: | | | | | | | | |
| (Honeysuckle Student Hldgs., Inc. | | | | | | | | |
| Student Hsg. Proj.) Series A, 2.77%, | | | | | | | | |
| LOC Allied Irish Banks PLC, | | | | | | | | |
| VRDN (b) | | | | 8,000 | | | | 8,000 |
| (Student Assoc., Inc. Proj.) Series A, | | | | | | | | |
| 2.77%, LOC Citizens Bank of | | | | | | | | |
| Pennsylvania, VRDN (b) | | | | 9,100 | | | | 9,100 |
| Pennsylvania Pub. School Bldg. Auth. | | | | | | | | |
| School Rev. Participating VRDN Series | | | | | | | | |
| AAB 03 24, 2.77% (Liquidity Facility | | | | | | | | |
| ABN AMRO Bank NV) (b)(e) | | | | 11,490 | | | | 11,490 |
| Philadelphia Gas Works Rev. | | | | | | | | |
| Participating VRDN Series Putters 384, | | | | | | | | |
| 2.79% (Liquidity Facility JPMorgan | | | | | | | | |
| Chase Bank) (b)(e) | | | | 4,100 | | | | 4,100 |
See accompanying notes which are an integral part of the financial statements.
57 Semiannual Report
Tax-Exempt Portfolio
Investments (Unaudited) - continued
|
| Municipal Securities continued | | | | | | |
| |
| | | Principal | | Value (Note 1) |
| | | Amount (000s) | | (000s) |
| |
| Pennsylvania – continued | | | | | | | | |
| Philadelphia School District Participating | | | | | | |
| VRDN: | | | | | | | | |
| Series Putters 870, 2.79% (Liquidity | | | | | | |
| Facility JPMorgan Chase & | | | | | | | | |
| Co.) (b)(e) | | $ | | 2,700 | | $ | | 2,700 |
| Series Stars 04 88, 2.78% (Liquidity | | | | | | |
| Facility BNP Paribas SA) (b)(e) | | | | 5,440 | | | | 5,440 |
| Philadelphia Wtr. & Wastewtr. Rev. | | | | | | | | |
| Participating VRDN: | | | | | | | | |
| Series EGL 7050050, 2.78% (Liquidity | | | | | | |
| Facility Citibank NA) (b)(e) | | | | 17,605 | | | | 17,605 |
| Series SG 158, 2.78% (Liquidity | | | | | | | | |
| Facility Societe Generale) (b)(e) | | | | 9,195 | | | | 9,195 |
| Scranton Lackawanna Health & Welfare | | | | | | |
| Auth. Rev. (Elan Gardens Proj.) Series | | | | | | |
| 1996, 2.78%, LOC PNC Bank NA, | | | | | | | | |
| Pittsburgh, VRDN (b) | | | | 3,700 | | | | 3,700 |
| | | | | | | | | 263,480 |
| |
| Rhode Island 0.2% | | | | | | | | |
| Rhode Island & Providence Plantations | | | | | | |
| Participating VRDN Series MS 01 568, | | | | | | |
| 2.78% (Liquidity Facility Morgan | | | | | | | | |
| Stanley) (b)(e) | | | | 9,660 | | | | 9,660 |
| South Carolina – 0.6% | | | | | | | | |
| Greenville County School District | | | | | | | | |
| Installment Purp. Rev. Participating | | | | | | | | |
| VRDN Series Stars 131, 2.79% | | | | | | | | |
| (Liquidity Facility BNP Paribas | | | | | | | | |
| SA) (b)(e) | | | | 7,595 | | | | 7,595 |
| Richland County School District #1 | | | | | | | | |
| Participating VRDN Series AAB 03 29, | | | | | | |
| 2.78% (Liquidity Facility ABN AMRO | | | | | | |
| Bank NV) (b)(e) | | | | 10,000 | | | | 10,000 |
| South Carolina Pub. Svc. Auth. Rev. | | | | | | | | |
| Participating VRDN: | | | | | | | | |
| Series EGL 00 4001, 2.79% (Liquidity | | | | | | |
| Facility Citibank NA, New | | | | | | | | |
| York) (b)(e) | | | | 2,000 | | | | 2,000 |
| Series EGL 03 44, 2.79% (Liquidity | | | | | | | | |
| Facility Citibank NA, New | | | | | | | | |
| York) (b)(e) | | | | 4,200 | | | | 4,200 |
| South Carolina Trans. Infrastructure Bank | | | | | | |
| Rev. Participating VRDN Series SGA | | | | | | |
| 116, 2.85% (Liquidity Facility Societe | | | | | | |
| Generale) (b)(e) | | | | 8,365 | | | | 8,365 |
| | | | | | | | | 32,160 |
| |
| Tennessee 1.5% | | | | | | | | |
| Blount County Pub. Bldg. Auth. Series | | | | | | |
| D3A, 2.82% (Liquidity Facility DEPFA | | | | | | |
| BANK PLC), VRDN (b) | | | | 7,000 | | | | 7,000 |
| Bristol Health & Edl. Facilities Board Rev. | | | | | | |
| Participating VRDN Series LB 03 L42J, | | | | | | |
| 2.82% (Liquidity Facility Lehman | | | | | | | | |
| Brothers Hldgs., Inc.) (b)(e) | | | | 37,615 | | | | 37,615 |
| | | Principal | | Value (Note 1) |
| | | Amount (000s) | | (000s) |
| |
| Knox County Health Edl. & Hsg. Facilities | | | | | | | | |
| Board Hosp. Facilities Rev. | | | | | | | | |
| Participating VRDN Series PA 750, | | | | | | | | |
| 2.79% (Liquidity Facility Merrill Lynch | | | | | | | | |
| & Co., Inc.) (b)(e) | | $ | | 8,935 | | $ | | 8,935 |
| Memphis Elec. Sys. Rev. Participating | | | | | | | | |
| VRDN Series MS 1031, 2.78% | | | | | | | | |
| (Liquidity Facility Morgan | | | | | | | | |
| Stanley) (b)(e) | | | | 3,045 | | | | 3,045 |
| Memphis Gen. Oblig. Participating | | | | | | | | |
| VRDN: | | | | | | | | |
| Series IXIS 05 7, 2.79% (Liquidity | | | | | | | | |
| Facility CDC Fin. CDC IXIS) (b)(e) | | | | 5,760 | | | | 5,760 |
| Series MS 1018, 2.78% (Liquidity | | | | | | | | |
| Facility Morgan Stanley) (b)(e) | | | | 70 | | | | 70 |
| Metropolitan Govt. Nashville & Davidson | | | | | | | | |
| County Participating VRDN Series PT | | | | | | | | |
| 2732, 2.79% (Liquidity Facility Merrill | | | | | | | | |
| Lynch & Co., Inc.) (b)(e) | | | | 5,000 | | | | 5,000 |
| Shelby County Gen. Oblig. Participating | | | | | | | | |
| VRDN: | | | | | | | | |
| Series EGL 00 4201, 2.79% (Liquidity | | | | | | | | |
| Facility Citibank NA, New | | | | | | | | |
| York) (b)(e) | | | | 8,000 | | | | 8,000 |
| Series EGL 7050073, 2.79% (Liquidity | | | | | | | | |
| Facility Citibank NA) (b)(e) | | | | 4,550 | | | | 4,550 |
| | | | | | | | | 79,975 |
| |
| Texas 21.5% | | | | | | | | |
| Alvin Independent School District | | | | | | | | |
| Participating VRDN Series PT 3110, | | | | | | | | |
| 2.79% (Liquidity Facility Merrill Lynch | | | | | | | | |
| & Co., Inc.) (b)(e) | | | | 6,195 | | | | 6,195 |
| Austin Elec. Util. Sys. Rev. Participating | | | | | | | | |
| VRDN: | | | | | | | | |
| Series EGL 01 4302, 2.79% (Liquidity | | | | | | | | |
| Facility Citibank NA, New | | | | | | | | |
| York) (b)(e) | | | | 10,000 | | | | 10,000 |
| Series PT 1699, 2.79% (Liquidity | | | | | | | | |
| Facility Merrill Lynch & Co., | | | | | | | | |
| Inc.) (b)(e) | | | | 2,755 | | | | 2,755 |
| Series SGA 131, 2.81% (Liquidity | | | | | | | | |
| Facility Societe Generale) (b)(e) | | | | 8,605 | | | | 8,605 |
| 2.79% (Liquidity Facility Merrill Lynch | | | | | | | | |
| & Co., Inc.) (b)(e) | | | | 8,720 | | | | 8,720 |
| Austin Gen. Oblig. Participating VRDN: | | | | | | | | |
| Series EGL 00 4305, 2.79% (Liquidity | | | | | | | | |
| Facility Citibank NA, New | | | | | | | | |
| York) (b)(e) | | | | 5,955 | | | | 5,955 |
| Series Putters 720, 2.79% (Liquidity | | | | | | | | |
| Facility JPMorgan Chase Bank) (b)(e) | | | | 4,030 | | | | 4,030 |
| Austin Util. Sys. Rev. Participating VRDN | | | | | | | | |
| Series BA 98 V, 2.83% (Liquidity | | | | | | | | |
| Facility Bank of America NA) (b)(e) | | | | 6,575 | | | | 6,575 |
| Austin Wtr. & Wastewtr. Sys. Rev. | | | | | | | | |
| Participating VRDN Series EGL 00 | | | | | | | | |
| 4303, 2.79% (Liquidity Facility | | | | | | | | |
| Citibank NA, New York) (b)(e) | | | | 5,000 | | | | 5,000 |
See accompanying notes which are an integral part of the financial statements.
Semiannual Report 58
| Municipal Securities continued | | | | | | |
| |
| | | Principal | | Value (Note 1) |
| | | Amount (000s) | | (000s) |
| |
| Texas continued | | | | | | | | |
| Beaumont Wtrwks. & Swr. Sys. | | | | | | | | |
| Participating VRDN Series Putters 859, | | | | | | |
| 2.79% (Liquidity Facility JPMorgan | | | | | | | | |
| Chase Bank) (b)(e) | | $ | | 5,525 | | $ | | 5,525 |
| Bexar County Health Facilities Dev. Corp. | | | | | | |
| Rev. (Warm Springs Rehabilitation | | | | | | | | |
| Proj.) Series 1997, 2.83%, LOC | | | | | | | | |
| JPMorgan Chase Bank, VRDN (b) | | | | 4,000 | | | | 4,000 |
| Board of Regents of The Univ. of Texas | | | | | | |
| Sys. Permanent Univ. Fund | | | | | | | | |
| Participating VRDN Series MS 1023, | | | | | | |
| 2.78% (Liquidity Facility Morgan | | | | | | | | |
| Stanley) (b)(e) | | | | 14,125 | | | | 14,125 |
| Canadian River Muni. Wtr. Auth. | | | | | | | | |
| Participating VRDN: | | | | | | | | |
| Series PT 2792, 2.79% (Liquidity | | | | | | | | |
| Facility Merrill Lynch & Co., | | | | | | | | |
| Inc.) (b)(e) | | | | 5,855 | | | | 5,855 |
| Series ROC II R 2204, 2.79% (Liquidity | | | | | | |
| Facility Citigroup Global Markets | | | | | | | | |
| Hldgs., Inc.) (b)(e) | | | | 8,625 | | | | 8,625 |
| Canutillo Independent School District | | | | | | | | |
| Participating VRDN Series PT 1936, | | | | | | |
| 2.79% (Liquidity Facility Merrill Lynch | | | | | | |
| & Co., Inc.) (b)(e) | | | | 4,840 | | | | 4,840 |
| Collin County Gen. Oblig. Participating | | | | | | |
| VRDN Series Putters 764, 2.79% | | | | | | | | |
| (Liquidity Facility JPMorgan Chase | | | | | | | | |
| Bank) (b)(e) | | | | 7,330 | | | | 7,330 |
| Comal Independent School District | | | | | | | | |
| Participating VRDN Series PT 1676, | | | | | | |
| 2.79% (Liquidity Facility Merrill Lynch | | | | | | |
| & Co., Inc.) (b)(e) | | | | 5,955 | | | | 5,955 |
| Corpus Christi Gen. Oblig. Participating | | | | | | |
| VRDN Series Putters 968, 2.79% | | | | | | | | |
| (Liquidity Facility JPMorgan Chase | | | | | | | | |
| Bank) (b)(e) | | | | 4,420 | | | | 4,420 |
| Corpus Christi Util. Sys. Rev. Series 2004 | | | | | | |
| B, 2.85% 1/17/06, CP | | | | 15,500 | | | | 15,500 |
| Dallas Area Rapid Transit Sales Tax Rev.: | | | | | | |
| Participating VRDN: | | | | | | | | |
| Series EGL 01 4310, 2.79% | | | | | | | | |
| (Liquidity Facility Citibank NA, | | | | | | | | |
| New York) (b)(e) | | | | 6,290 | | | | 6,290 |
| Series ROC II R3014, 2.79% | | | | | | | | |
| (Liquidity Facility Citigroup Global | | | | | | |
| Markets Hldgs., Inc.) (b)(e) | | | | 5,180 | | | | 5,180 |
| Series 2001, 2.9% 11/2/05 (Liquidity | | | | | | |
| Facility Bayerische Landesbank | | | | | | | | |
| Girozentrale) (Liquidity Facility | | | | | | | | |
| WestLB AG), CP | | | | 4,800 | | | | 4,800 |
| Dallas County Util. & Reclamation District | | | | | | |
| Rev. Participating VRDN Series PA | | | | | | | | |
| 1136R, 2.79% (Liquidity Facility Merrill | | | | | | |
| Lynch & Co., Inc.) (b)(e) | | | | 6,570 | | | | 6,570 |
| | | Principal | | Value (Note 1) |
| | | Amount (000s) | | (000s) |
| |
| Dallas Independent School District | | | | | | | | |
| Participating VRDN Series EGL | | | | | | | | |
| 7050034, Class A, 2.79% (Liquidity | | | | | | | | |
| Facility Citibank NA) (b)(e) | | $ | | 5,300 | | $ | | 5,300 |
| Dickinson Independent School District | | | | | | | | |
| Participating VRDN Series DB 152, | | | | | | | | |
| 2.79% (Liquidity Facility Deutsche Bank | | | | | | | | |
| AG) (b)(e) | | | | 6,290 | | | | 6,290 |
| Eanes Independent School District | | | | | | | | |
| Participating VRDN Series PT 1681, | | | | | | | | |
| 2.79% (Liquidity Facility Merrill Lynch | | | | | | | | |
| & Co., Inc.) (b)(e) | | | | 3,465 | | | | 3,465 |
| Edinburg Consolidated Independent | | | | | | | | |
| School District Participating VRDN | | | | | | | | |
| Series SGA 106, 2.81% (Liquidity | | | | | | | | |
| Facility Societe Generale) (b)(e) | | | | 2,485 | | | | 2,485 |
| Elgin Independent School District | | | | | | | | |
| Participating VRDN Series DB 166, | | | | | | | | |
| 2.79% (Liquidity Facility Deutsche Bank | | | | | | | | |
| AG) (b)(e) | | | | 5,675 | | | | 5,675 |
| Fort Worth Wtr. & Swr. Rev. Participating | | | | | | | | |
| VRDN Series PT 2506, 2.79% | | | | | | | | |
| (Liquidity Facility Merrill Lynch & Co., | | | | | | | | |
| Inc.) (b)(e) | | | | 5,450 | | | | 5,450 |
| Frisco Gen. Oblig. Participating VRDN: | | | | | | | | |
| Series MSTC 01 170, 2.81% (Liquidity | | | | | | | | |
| Facility Bear Stearns Companies, | | | | | | | | |
| Inc.) (b)(e) | | | | 13,105 | | | | 13,105 |
| Series PT 1905, 2.79% (Liquidity | | | | | | | | |
| Facility Merrill Lynch & Co., | | | | | | | | |
| Inc.) (b)(e) | | | | 4,080 | | | | 4,080 |
| Frisco Independent School District | | | | | | | | |
| Participating VRDN Series Putters 476, | | | | | | | | |
| 2.79% (Liquidity Facility JPMorgan | | | | | | | | |
| Chase Bank) (b)(e) | | | | 1,995 | | | | 1,995 |
| Harlandale Independent School District | | | | | | | | |
| Participating VRDN Series SGA 100, | | | | | | | | |
| 2.81% (Liquidity Facility Societe | | | | | | | | |
| Generale) (b)(e) | | | | 7,480 | | | | 7,480 |
| Harris County Gen. Oblig. Participating | | | | | | | | |
| VRDN: | | | | | | | | |
| Series EGL 01 4305, 2.79% (Liquidity | | | | | | | | |
| Facility Citibank NA, New | | | | | | | | |
| York) (b)(e) | | | | 4,500 | | | | 4,500 |
| Series EGL 02 6012, 2.79% (Liquidity | | | | | | | | |
| Facility Citibank NA, New | | | | | | | | |
| York) (b)(e) | | | | 4,000 | | | | 4,000 |
| Series PA 02 1095, 2.79% (Liquidity | | | | | | | | |
| Facility Merrill Lynch & Co., | | | | | | | | |
| Inc.) (b)(e) | | | | 11,185 | | | | 11,185 |
| Series Putters 545, 2.79% (Liquidity | | | | | | | | |
| Facility JPMorgan Chase Bank) (b)(e) | | | | 4,690 | | | | 4,690 |
| Series Putters 646, 2.79% (Liquidity | | | | | | | | |
| Facility JPMorgan Chase Bank) (b)(e) | | | | 4,220 | | | | 4,220 |
| Series Putters 691, 2.79% (Liquidity | | | | | | | | |
| Facility Dresdner Bank AG) (b)(e) | | | | 11,460 | | | | 11,460 |
| Series Putters 767, 2.79% (Liquidity | | | | | | | | |
| Facility JPMorgan Chase Bank) (b)(e) | | | | 5,600 | | | | 5,600 |
See accompanying notes which are an integral part of the financial statements.
59 Semiannual Report
Tax-Exempt Portfolio
Investments (Unaudited) - continued
Municipal Securities continued
| | | Principal | | Value (Note 1) |
| | | Amount (000s) | | (000s) |
| |
| Texas continued | | | | | | | | |
| Harris County Health Facilities Dev. | | | | | | | | |
| Corp. Hosp. Rev. Participating VRDN | | | | | | | | |
| Series LB 05 L15, 2.82% (Liquidity | | | | | | | | |
| Facility Lehman Brothers Hldgs., | | | | | | | | |
| Inc.) (b)(e) | | $ | | 6,445 | | $ | | 6,445 |
| Harris County Health Facilities Dev. | | | | | | | | |
| Corp. Rev.: | | | | | | | | |
| (Methodist Hosp. Proj.) Series B, | | | | | | | | |
| 2.81%, VRDN (b) | | | | 128,800 | | | | 128,800 |
| (Saint Dominic Village Proj.) Series | | | | | | | | |
| 2000, 2.83%, LOC JPMorgan Chase | | | | | | | | |
| Bank, VRDN (b) | | | | 4,805 | | | | 4,805 |
| (Saint Luke’s Episcopal Hosp. Proj.) | | | | | | | | |
| Series B, 2.81% (Liquidity Facility | | | | | | | | |
| JPMorgan Chase Bank) (Liquidity | | | | | | | | |
| Facility Bayerische Landesbank | | | | | | | | |
| Girozentrale), VRDN (b) | | | | 56,180 | | | | 56,180 |
| Harris County Houston Sports Auth. Spl. | | | | | | | | |
| Rev. (Rodeo Proj.) Series 2001 C, | | | | | | | | |
| 2.83% (MBIA Insured), VRDN (b) | | | | 11,100 | | | | 11,100 |
| Houston Arpt. Sys. Rev. Participating | | | | | | | | |
| VRDN: | | | | | | | | |
| Series EGL 01 4306, 2.79% (Liquidity | | | | | | | | |
| Facility Citibank NA, New | | | | | | | | |
| York) (b)(e) | | | | 8,910 | | | | 8,910 |
| Series MS 845, 2.78% (Liquidity | | | | | | | | |
| Facility Morgan Stanley) (b)(e) | | | | 3,010 | | | | 3,010 |
| Series SG 03 161, 2.79% (Liquidity | | | | | | | | |
| Facility Societe Generale) (b)(e) | | | | 3,900 | | | | 3,900 |
| Houston Gen. Oblig.: | | | | | | | | |
| Bonds Series PT 969, 2.95%, tender | | | | | | | | |
| 7/20/06 (Liquidity Facility DEPFA | | | | | | | | |
| BANK PLC) (b)(e)(f) | | | | 18,835 | | | | 18,835 |
| Participating VRDN: | | | | | | | | |
| Series EGL 04 23 Class A, 2.79% | | | | | | | | |
| (Liquidity Facility Citibank | | | | | | | | |
| NA) (b)(e) | | | | 4,950 | | | | 4,950 |
| Series PT 2214, 2.79% (Liquidity | | | | | | | | |
| Facility Merrill Lynch & Co., | | | | | | | | |
| Inc.) (b)(e) | | | | 21,320 | | | | 21,320 |
| Houston Higher Ed. Fin. Corp. Higher | | | | | | | | |
| Ed. Rev. Participating VRDN Series | | | | | | | | |
| EGL 01 4303, 2.79% (Liquidity Facility | | | | | | | | |
| Citibank NA, New York) (b)(e) | | | | 7,500 | | | | 7,500 |
| Houston Independent School District: | | | | | | | | |
| Bonds 2.77%, tender 6/14/06 | | | | | | | | |
| (Permanent School Fund of Texas | | | | | | | | |
| Guaranteed) (b) | | | | 18,500 | | | | 18,500 |
| Participating VRDN: | | | | | | | | |
| Series Putters 1078, 2.79% | | | | | | | | |
| (Liquidity Facility JPMorgan Chase | | | | | | | | |
| & Co.) (b)(e) | | | | 2,930 | | | | 2,930 |
| Series ROC II R408, 2.79% (Liquidity | | | | | | | | |
| Facility Citibank NA) (b)(e) | | | | 5,300 | | | | 5,300 |
| Houston Util. Sys. Rev. Participating | | | | | | | | |
| VRDN: | | | | | | | | |
| Series Putters 1070, 2.79% (Liquidity | | | | | | | | |
| Facility JPMorgan Chase & Co.) (b)(e) | | | | 1,860 | | | | 1,860 |
| | | Principal | | Value (Note 1) |
| | | Amount (000s) | | (000s) |
| |
| Series Putters 669, 2.79% (Liquidity | | | | | | | | |
| Facility JPMorgan Chase & | | | | | | | | |
| Co.) (b)(e) | | $ | | 6,485 | | $ | | 6,485 |
| Series Putters 906, 2.79% (Liquidity | | | | | | | | |
| Facility JPMorgan Chase Bank) (b)(e) | | | | 5,000 | | | | 5,000 |
| Houston Wtr. & Swr. Sys. Rev. | | | | | | | | |
| Participating VRDN: | | | | | | | | |
| Series BA 02 F, 2.83% (Liquidity | | | | | | | | |
| Facility Bank of America NA) (b)(e) . | | | | 6,525 | | | | 6,525 |
| Series MSTC 01 111, 2.85% (Liquidity | | | | | | | | |
| Facility Bear Stearns Companies, | | | | | | | | |
| Inc.) (b)(e) | | | | 6,000 | | | | 6,000 |
| Series SG 120, 2.79% (Liquidity | | | | | | | | |
| Facility Societe Generale) (b)(e) | | | | 7,705 | | | | 7,705 |
| Keller Independent School District | | | | | | | | |
| Participating VRDN Series PT 2280, | | | | | | | | |
| 2.79% (Liquidity Facility Merrill Lynch | | | | | | | | |
| & Co., Inc.) (b)(e) | | | | 6,350 | | | | 6,350 |
| Klein Independent School District | | | | | | | | |
| Participating VRDN Series PT 2482, | | | | | | | | |
| 2.79% (Liquidity Facility Merrill Lynch | | | | | | | | |
| & Co., Inc.) (b)(e) | | | | 6,810 | | | | 6,810 |
| Leander Independent School District | | | | | | | | |
| Participating VRDN: | | | | | | | | |
| Series PT 2405, 2.79% (Liquidity | | | | | | | | |
| Facility Merrill Lynch & Co., | | | | | | | | |
| Inc.) (b)(e) | | | | 5,285 | | | | 5,285 |
| Series Putters 507, 2.79% (Liquidity | | | | | | | | |
| Facility JPMorgan Chase Bank) (b)(e) | | | | 7,250 | | | | 7,250 |
| Lower Colorado River Auth. Rev. | | | | | | | | |
| Participating VRDN Series EGL 00 | | | | | | | | |
| 4302, 2.79% (Liquidity Facility | | | | | | | | |
| Citibank NA, New York) (b)(e) | | | | 5,880 | | | | 5,880 |
| Lower Colorado River Auth. Transmission | | | | | | | | |
| Contract Rev. Participating VRDN | | | | | | | | |
| Series ROC II R4530, 2.79% (Liquidity | | | | | | | | |
| Facility Citigroup Global Markets | | | | | | | | |
| Hldgs., Inc.) (b)(e) | | | | 1,885 | | | | 1,885 |
| Mansfield Independent School District | | | | | | | | |
| Participating VRDN Series PA 1174, | | | | | | | | |
| 2.79% (Liquidity Facility Merrill Lynch | | | | | | | | |
| & Co., Inc.) (b)(e) | | | | 10,080 | | | | 10,080 |
| Mesquite Independent School District | | | | | | | | |
| Participating VRDN Series PT 2192, | | | | | | | | |
| 2.79% (Liquidity Facility Merrill Lynch | | | | | | | | |
| & Co., Inc.) (b)(e) | | | | 6,270 | | | | 6,270 |
| Mission Consolidated Independent | | | | | | | | |
| School District Participating VRDN | | | | | | | | |
| Series SGA 105, 2.81% (Liquidity | | | | | | | | |
| Facility Societe Generale) (b)(e) | | | | 6,000 | | | | 6,000 |
| North East Texas Independent School | | | | | | | | |
| District Participating VRDN: | | | | | | | | |
| Series PT 1249, 2.79% (Liquidity | | | | | | | | |
| Facility Merrill Lynch & Co., | | | | | | | | |
| Inc.) (b)(e) | | | | 18,340 | | | | 18,340 |
| Series Putters 393, 2.79% (Liquidity | | | | | | | | |
| Facility JPMorgan Chase Bank) (b)(e) | | | | 6,445 | | | | 6,445 |
| See accompanying notes which are an integral part of the financial statements. | | |
| Semiannual Report | | 60 |
| Municipal Securities continued | | | | | | |
| |
| | | Principal | | Value (Note 1) |
| | | Amount (000s) | | (000s) |
| |
| Texas continued | | | | | | | | |
| North Texas Tollway Auth. Dallas North | | | | | | |
| Tollway Sys. Rev. Participating VRDN | | | | | | |
| Series SG 168, 2.79% (Liquidity | | | | | | | | |
| Facility Societe Generale) (b)(e) | | $ | | 26,100 | | $ | | 26,100 |
| Odessa Wtr. & Swr. Rev. Participating | | | | | | |
| VRDN Series EGL 01 4307, 2.79% | | | | | | | | |
| (Liquidity Facility Citibank NA, New | | | | | | |
| York) (b)(e) | | | | 2,085 | | | | 2,085 |
| Rockwall Independent School District | | | | | | | | |
| Participating VRDN Series MSTC 01 | | | | | | |
| 123, 2.85% (Liquidity Facility Bear | | | | | | | | |
| Stearns Companies, Inc.) (b)(e) | | | | 12,100 | | | | 12,100 |
| San Antonio Elec. & Gas Systems Rev.: | | | | | | |
| Participating VRDN: | | | | | | | | |
| Series PT 1977, 2.79% (Liquidity | | | | | | | | |
| Facility Merrill Lynch & Co., | | | | | | | | |
| Inc.) (b)(e) | | | | 7,295 | | | | 7,295 |
| Series Putters 769, 2.79% (Liquidity | | | | | | |
| Facility JPMorgan Chase | | | | | | | | |
| Bank) (b)(e) | | | | 5,375 | | | | 5,375 |
| Series SG 105, 2.79% (Liquidity | | | | | | | | |
| Facility Societe Generale) (b)(e) | | | | 44,800 | | | | 44,800 |
| Series Stars 112, 2.79% (Liquidity | | | | | | |
| Facility BNP Paribas SA) (b)(e) | | | | 15,025 | | | | 15,025 |
| 2.82% (Liquidity Facility Bank of | | | | | | | | |
| America NA), VRDN (b) | | | | 54,900 | | | | 54,900 |
| San Antonio Hotel Occupancy Tax Rev. | | | | | | |
| Participating VRDN Series SG 51, | | | | | | | | |
| 2.79% (Liquidity Facility Societe | | | | | | | | |
| Generale) (b)(e) | | | | 6,250 | | | | 6,250 |
| San Antonio Independent School District: | | | | | | |
| Bonds Series AAB 01 28, 2.78%, | | | | | | | | |
| tender 10/7/05 (Liquidity Facility | | | | | | |
| ABN AMRO Bank NV) (b)(e) | | | | 3,400 | | | | 3,400 |
| Participating VRDN: | | | | | | | | |
| Series PT 1600, 2.79% (Liquidity | | | | | | | | |
| Facility Merrill Lynch & Co., | | | | | | | | |
| Inc.) (b)(e) | | | | 12,100 | | | | 12,100 |
| Series ROC II R268, 2.79% (Liquidity | | | | | | |
| Facility Citibank NA) (b)(e) | | | | 4,495 | | | | 4,495 |
| San Antonio Wtr. Sys. Rev.: | | | | | | | | |
| Participating VRDN: | | | | | | | | |
| Series Merlots 00 VV, 2.77% | | | | | | | | |
| (Liquidity Facility Wachovia Bank | | | | | | |
| NA) (b)(e) | | | | 2,300 | | | | 2,300 |
| Series MSTC 01 132, 2.85% | | | | | | | | |
| (Liquidity Facility Bear Stearns | | | | | | | | |
| Companies, Inc.) (b)(e) | | | | 1,600 | | | | 1,600 |
| Series 2001 A, 2.9% 11/2/05 | | | | | | | | |
| (Liquidity Facility Bank of America | | | | | | |
| NA), CP | | | | 12,600 | | | | 12,600 |
| Schertz/Seguin Local Govt. Corp. | | | | | | | | |
| Contract Rev. Participating VRDN | | | | | | | | |
| Series MSTC 01 114, 2.81% (Liquidity | | | | | | |
| Facility Bear Stearns Companies, | | | | | | | | |
| Inc.) (b)(e) | | | | 9,995 | | | | 9,995 |
| | | Principal | | Value (Note 1) |
| | | Amount (000s) | | (000s) |
| |
| Socorro Independent School District | | | | | | | | |
| Participating VRDN: | | | | | | | | |
| Series EGL 00 4306, 2.79% (Liquidity | | | | | | | | |
| Facility Citibank NA, New | | | | | | | | |
| York) (b)(e) | | $ | | 5,900 | | $ | | 5,900 |
| Series PT 2653, 2.79% (Liquidity | | | | | | | | |
| Facility Merrill Lynch & Co., | | | | | | | | |
| Inc.) (b)(e) | | | | 11,065 | | | | 11,065 |
| Temple Independent School District | | | | | | | | |
| Participating VRDN Series DB 136, | | | | | | | | |
| 2.79% (Liquidity Facility Deutsche Bank | | | | | | | | |
| AG) (b)(e) | | | | 8,225 | | | | 8,225 |
| Texas A&M Univ. Rev. Participating | | | | | | | | |
| VRDN Series ROC II R4005, 2.79% | | | | | | | | |
| (Liquidity Facility Citigroup Global | | | | | | | | |
| Markets Hldgs., Inc.) (b)(e) | | | | 4,965 | | | | 4,965 |
| Texas Gen. Oblig.: | | | | | | | | |
| Participating VRDN: | | | | | | | | |
| Series MS 1147, 2.78% (Liquidity | | | | | | | | |
| Facility Morgan Stanley) (b)(e) | | | | 3,335 | | | | 3,335 |
| Series Putters 05 1013A, 2.79% | | | | | | | | |
| (Liquidity Facility JPMorgan Chase | | | | | | | | |
| Bank) (b)(e) | | | | 3,665 | | | | 3,665 |
| Series SGB 58, 2.79% (Liquidity | | | | | | | | |
| Facility Societe Generale) (b)(e) | | | | 5,800 | | | | 5,800 |
| TRAN 4.5% 8/31/06 | | | | 169,000 | | | | 171,269 |
| Texas Pub. Fin. Auth. Series 2002 B, | | | | | | | | |
| 2.85% 3/1/06 (Liquidity Facility Texas | | | | | | | | |
| Gen. Oblig.), CP | | | | 1,200 | | | | 1,200 |
| The Colony Wtr. & Swr. Sys. Rev. | | | | | | | | |
| Participating VRDN Series PT 2369, | | | | | | | | |
| 2.79% (Liquidity Facility Merrill Lynch | | | | | | | | |
| & Co., Inc.) (b)(e) | | | | 7,400 | | | | 7,400 |
| Travis County Health Facilities Dev. Corp. | | | | | | | | |
| Rev. Participating VRDN Series PT 677, | | | | | | | | |
| 2.8% (Liquidity Facility Svenska | | | | | | | | |
| Handelsbanken AB) (b)(e) | | | | 4,995 | | | | 4,995 |
| Trinity River Auth. Rev. Participating | | | | | | | | |
| VRDN Series Putters 1061, 2.79% | | | | | | | | |
| (Liquidity Facility JPMorgan Chase | | | | | | | | |
| Bank) (b)(e) | | | | 5,660 | | | | 5,660 |
| Tyler Health Facilities Dev. Corp. Hosp. | | | | | | | | |
| Rev. Participating VRDN Series PT 833, | | | | | | | | |
| 2.79% (Liquidity Facility Svenska | | | | | | | | |
| Handelsbanken AB) (b)(e) | | | | 5,220 | | | | 5,220 |
| Univ. of North Texas Univ. Rev. | | | | | | | | |
| Participating VRDN Series SGA 146, | | | | | | | | |
| 2.81% (Liquidity Facility Societe | | | | | | | | |
| Generale) (b)(e) | | | | 3,000 | | | �� | 3,000 |
| Univ. of Texas Univ. Revs. Participating | | | | | | | | |
| VRDN: | | | | | | | | |
| Series MS 98 97, 2.78% (Liquidity | | | | | | | | |
| Facility Morgan Stanley) (b)(e) | | | | 5,120 | | | | 5,120 |
| Series Putters 584, 2.79% (Liquidity | | | | | | | | |
| Facility JPMorgan Chase Bank) (b)(e) | | | | 7,495 | | | | 7,495 |
| Series Putters 592, 2.79% (Liquidity | | | | | | | | |
| Facility JPMorgan Chase Bank) (b)(e) | | | | 5,595 | | | | 5,595 |
See accompanying notes which are an integral part of the financial statements.
61 Semiannual Report
Tax-Exempt Portfolio
Investments (Unaudited) - continued
|
| Municipal Securities continued | | | | | | |
| |
| | | Principal | | Value (Note 1) |
| | | Amount (000s) | | (000s) |
| |
| Texas continued | | | | | | |
| Waco Gen. Oblig. Participating VRDN | | | | | | |
| Series PT 2098, 2.79% (Liquidity | | | | | | |
| Facility Merrill Lynch & Co., Inc.) (b)(e) $ | | 5,440 | | $ | | 5,440 |
| West Harris County Reg’l. Wtr. Auth. | | | | | | |
| Wtr. Sys. Rev. Participating VRDN | | | | | | |
| Series SGA 148, 2.81% (Liquidity | | | | | | |
| Facility Societe Generale) (b)(e) | | 4,000 | | | | 4,000 |
| White Settlement Independent School | | | | | | |
| District Participating VRDN Series PT | | | | | | |
| 3047, 2.79% (Liquidity Facility Merrill | | | | | | |
| Lynch & Co., Inc.) (b)(e) | | 7,115 | | | | 7,115 |
| Ysleta Independent School District | | | | | | |
| Participating VRDN Series Putters | | | | | | |
| 1051, 2.79% (Liquidity Facility | | | | | | |
| JPMorgan Chase Bank) (b)(e) | | 5,865 | | | | 5,865 |
| | | | | | | 1,177,234 |
| |
| Utah 1.0% | | | | | | |
| Central Utah Wtr. Conservatory District | | | | | | |
| Participating VRDN Series PT 2420, | | | | | | |
| 2.79% (Liquidity Facility Merrill Lynch | | | | | | |
| & Co., Inc.) (b)(e) | | 5,315 | | | | 5,315 |
| Intermountain Pwr. Agcy. Pwr. Supply | | | | | | |
| Rev. Bonds Series 1985 F, 2.9% tender | | | | | | |
| 11/2/05 (AMBAC Insured) (Liquidity | | | | | | |
| Facility JPMorgan Chase Bank), CP | | | | | | |
| mode | | 13,800 | | | | 13,800 |
| Salt Lake City Sales Tax Rev. 2.82% | | | | | | |
| (Liquidity Facility State Street Bank & | | | | | | |
| Trust Co., Boston), VRDN (b) | | 16,050 | | | | 16,050 |
| Weber County Hosp. Rev. (IHC Health | | | | | | |
| Services, Inc. Proj.) Series C, 2.81% | | | | | | |
| (Liquidity Facility Landesbank | | | | | | |
| Hessen Thuringen), VRDN (b) | | 18,180 | | | | 18,180 |
| | | | | | | 53,345 |
| |
| Vermont – 0.3% | | | | | | |
| Vermont Edl. & Health Bldgs. Fing. Agcy. | | | | | | |
| Rev. Bonds (Middlebury College Proj.) | | | | | | |
| 2.91%, tender 5/1/06 (b) | | 5,350 | | | | 5,350 |
| Vermont Hsg. Fin. Agcy. Student Hsg. | | | | | | |
| Fin. Agcy. (West Block Univ. of | | | | | | |
| Vermont Apts. Proj.) Series 2004 A, | | | | | | |
| 2.77%, LOC Bank of Nova Scotia, | | | | | | |
| New York Agcy., VRDN (b) | | 12,075 | | | | 12,075 |
| | | | | | | 17,425 |
| |
| Virginia – 1.1% | | | | | | |
| Chesterfield County Indl. Dev. Auth. Rev. | | | | | | |
| Participating VRDN Series PT 886, | | | | | | |
| 2.84% (Liquidity Facility Lloyds TSB | | | | | | |
| Bank PLC) (b)(e) | | 4,300 | | | | 4,300 |
| Loudoun County Gen. Oblig. | | | | | | |
| Participating VRDN Series Putters 451, | | | | | | |
| 2.79% (Liquidity Facility JPMorgan | | | | | | |
| Chase Bank) (b)(e) | | 3,910 | | | | 3,910 |
| Univ. of Virginia Univ. Revs. Participating | | | | | | |
| VRDN Series MS 856, 2.78% (Liquidity | | | | | | |
| Facility Morgan Stanley) (b)(e) | | 3,000 | | | | 3,000 |
| | | Principal | | Value (Note 1) |
| | | Amount (000s) | | (000s) |
| |
| Upper Occoquan Swr. Auth. Reg’l. Swr. | | | | | | | | |
| Rev. Participating VRDN Series MSTC | | | | | | | | |
| 01 159, 2.85% (Liquidity Facility Bear | | | | | | | | |
| Stearns Companies, Inc.) (b)(e) | | $ | | 11,495 | | $ | | 11,495 |
| Virginia College Bldg. Auth. Edl. | | | | | | | | |
| Facilities Rev. Participating VRDN: | | | | | | | | |
| Series MS 01 721, 2.78% (Liquidity | | | | | | | | |
| Facility Morgan Stanley) (b)(e) | | | | 4,875 | | | | 4,875 |
| Series Putters 134, 2.79% (Liquidity | | | | | | | | |
| Facility JPMorgan Chase & | | | | | | | | |
| Co.) (b)(e) | | | | 14,335 | | | | 14,335 |
| Virginia Commonwealth Trans. Board | | | | | | | | |
| Trans. Rev. Participating VRDN Series | | | | | | | | |
| MS 01 727, 2.78% (Liquidity Facility | | | | | | | | |
| Morgan Stanley) (b)(e) | | | | 3,750 | | | | 3,750 |
| Virginia Pub. School Auth. Participating | | | | | | | | |
| VRDN Series Putters 139, 2.79% | | | | | | | | |
| (Liquidity Facility JPMorgan Chase & | | | | | | | | |
| Co.) (b)(e) | | | | 16,910 | | | | 16,910 |
| | | | | | | | | 62,575 |
| |
| Washington 6.3% | | | | | | | | |
| Clark County Gen. Oblig. Participating | | | | | | | | |
| VRDN Series Putters 541, 2.79% | | | | | | | | |
| (Liquidity Facility JPMorgan Chase | | | | | | | | |
| Bank) (b)(e) | | | | 3,980 | | | | 3,980 |
| Clark County School District #114, | | | | | | | | |
| Evergreen Participating VRDN Series | | | | | | | | |
| PT 1575, 2.79% (Liquidity Facility | | | | | | | | |
| Merrill Lynch & Co., Inc.) (b)(e) | | | | 5,135 | | | | 5,135 |
| Energy Northwest Elec. Rev. Participating | | | | | | | | |
| VRDN: | | | | | | | | |
| Series PA 825, 2.8% (Liquidity Facility | | | | | | | | |
| Merrill Lynch & Co., Inc.) (b)(e) | | | | 6,245 | | | | 6,245 |
| Series PT 1978, 2.79% (Liquidity | | | | | | | | |
| Facility Merrill Lynch & Co., | | | | | | | | |
| Inc.) (b)(e) | | | | 6,560 | | | | 6,560 |
| Series PT 2165, 2.79% (Liquidity | | | | | | | | |
| Facility Merrill Lynch & Co., | | | | | | | | |
| Inc.) (b)(e) | | | | 5,390 | | | | 5,390 |
| Series PT 2236, 2.79% (Liquidity | | | | | | | | |
| Facility Merrill Lynch & Co., | | | | | | | | |
| Inc.) (b)(e) | | | | 10,630 | | | | 10,630 |
| Series Putters 256, 2.79% (Liquidity | | | | | | | | |
| Facility JPMorgan Chase Bank) (b)(e) | | | | 4,545 | | | | 4,545 |
| Series ROC II R4524, 2.79% (Liquidity | | | | | | | | |
| Facility Citigroup Global Markets | | | | | | | | |
| Hldgs., Inc.) (b)(e) | | | | 5,050 | | | | 5,050 |
| Everett Gen. Oblig. 2.8%, LOC Bank of | | | | | | | | |
| America NA, VRDN (b) | | | | 2,600 | | | | 2,600 |
| Grant County Pub. Util. District #2 Elec. | | | | | | | | |
| Rev. Participating VRDN Series PA | | | | | | | | |
| 952, 2.8% (Liquidity Facility Merrill | | | | | | | | |
| Lynch & Co., Inc.) (b)(e) | | | | 10,495 | | | | 10,495 |
| King & Snohomish Counties School | | | | | | | | |
| District #417 Northshore Participating | | | | | | | | |
| VRDN Series PT 1789, 2.79% | | | | | | | | |
| (Liquidity Facility Merrill Lynch & Co., | | | | | | | | |
| Inc.) (b)(e) | | | | 5,445 | | | | 5,445 |
See accompanying notes which are an integral part of the financial statements.
Semiannual Report 62
| Municipal Securities continued | | | | | | |
| |
| | | Principal | | Value (Note 1) |
| | | Amount (000s) | | (000s) |
| |
| Washington – continued | | | | | | | | |
| King County Gen. Oblig. Participating | | | | | | |
| VRDN: | | | | | | | | |
| Series PT 2170, 2.79% (Liquidity | | | | | | | | |
| Facility Merrill Lynch & Co., | | | | | | | | |
| Inc.) (b)(e) | | $ | | 8,035 | | $ | | 8,035 |
| Series Putters 848, 2.79% (Liquidity | | | | | | |
| Facility Dresdner Bank AG) (b)(e) | | | | 6,845 | | | | 6,845 |
| Series ROC II R5036, 2.79% (Liquidity | | | | | | |
| Facility Citigroup Global Markets | | | | | | | | |
| Hldgs., Inc.) (b)(e) | | | | 1,820 | | | | 1,820 |
| King County Pub. Hosp. District #2 | | | | | | | | |
| Participating VRDN Series PT 2469, | | | | | | |
| 2.79% (Liquidity Facility Merrill Lynch | | | | | | |
| & Co., Inc.) (b)(e) | | | | 7,930 | | | | 7,930 |
| King County Swr. Rev. Participating | | | | | | | | |
| VRDN Series Merlots 00 E, 2.77% | | | | | | | | |
| (Liquidity Facility Wachovia Bank | | | | | | | | |
| NA) (b)(e) | | | | 1,800 | | | | 1,800 |
| Port of Seattle Rev. Participating VRDN: | | | | | | |
| Series DB 168, 2.79% (Liquidity | | | | | | | | |
| Facility Deutsche Bank AG) (b)(e) | | | | 10,390 | | | | 10,390 |
| Series PT 3043, 2.79% (Liquidity | | | | | | | | |
| Facility Merrill Lynch & Co., | | | | | | | | |
| Inc.) (b)(e) | | | | 8,405 | | | | 8,405 |
| Port of Tacoma Rev. Participating VRDN | | | | | | |
| Series PT 2164, 2.79% (Liquidity | | | | | | | | |
| Facility Merrill Lynch & Co., Inc.) (b)(e) | | 7,940 | | | | 7,940 |
| Seattle Drain & Wastewtr. Util. Rev. | | | | | | | | |
| Participating VRDN Series SG 00 135, | | | | | | |
| 2.79% (Liquidity Facility Societe | | | | | | | | |
| Generale) (b)(e) | | | | 19,885 | | | | 19,885 |
| Seattle Drainage & Wastewtr. Rev. | | | | | | | | |
| Participating VRDN Series PT 1604, | | | | | | |
| 2.79% (Liquidity Facility Merrill Lynch | | | | | | |
| & Co., Inc.) (b)(e) | | | | 8,770 | | | | 8,770 |
| Seattle Muni. Lt. & Pwr. Rev. Participating | | | | | | |
| VRDN Series SGA 85, 2.85% | | | | | | | | |
| (Liquidity Facility Societe | | | | | | | | |
| Generale) (b)(e) | | | | 16,600 | | | | 16,600 |
| Snohomish County Hsg. Auth. Hsg. Rev. | | | | | | |
| (Ebey Arms Centerhouse Proj.) 2.8%, | | | | | | |
| LOC Bank of America NA, VRDN (b) . | | 3,100 | | | | 3,100 |
| Spokane County School District #81 | | | | | | | | |
| Participating VRDN Series ROC II | | | | | | | | |
| R4000, 2.79% (Liquidity Facility | | | | | | | | |
| Citigroup Global Markets Hldgs., | | | | | | | | |
| Inc.) (b)(e) | | | | 3,570 | | | | 3,570 |
| Tulalip Tribes of The Tulalip Reservation | | | | | | |
| Spl. Rev. 2.77%, LOC Bank of America | | | | | | |
| NA, VRDN (b) | | | | 10,430 | | | | 10,430 |
| Washington Gen. Oblig. Participating | | | | | | |
| VRDN: | | | | | | | | |
| Series EGL 00 4703, 2.79% (Liquidity | | | | | | |
| Facility Citibank NA, New | | | | | | | | |
| York) (b)(e) | | | | 14,140 | | | | 14,140 |
| Series EGL 00 4704, 2.79% (Liquidity | | | | | | |
| Facility Citibank NA, New | | | | | | | | |
| York) (b)(e) | | | | 3,065 | | | | 3,065 |
| | | Principal | | Value (Note 1) |
| | | Amount (000s) | | (000s) |
| |
| Series EGL 00 4705, 2.79% (Liquidity | | | | | | | | |
| Facility Citibank NA, New | | | | | | | | |
| York) (b)(e) | | $ | | 8,235 | | $ | | 8,235 |
| Series EGL 96 4701, 2.79% (Liquidity | | | | | | | | |
| Facility Citibank NA, New | | | | | | | | |
| York) (b)(e) | | | | 14,015 | | | | 14,015 |
| Series MS 00 388, 2.78% (Liquidity | | | | | | | | |
| Facility Morgan Stanley) (b)(e) | | | | 12,145 | | | | 12,145 |
| Series MS 1161, 2.78% (Liquidity | | | | | | | | |
| Facility Morgan Stanley) (b)(e) | | | | 10,000 | | | | 10,000 |
| Series PT 2559, 2.79% (Liquidity | | | | | | | | |
| Facility Merrill Lynch & Co., | | | | | | | | |
| Inc.) (b)(e) | | | | 6,740 | | | | 6,740 |
| Series PT 2563, 2.79% (Liquidity | | | | | | | | |
| Facility Merrill Lynch & Co., | | | | | | | | |
| Inc.) (b)(e) | | | | 9,455 | | | | 9,455 |
| Series PT 2733, 2.79% (Liquidity | | | | | | | | |
| Facility Merrill Lynch & Co., | | | | | | | | |
| Inc.) (b)(e) | | | | 7,000 | | | | 7,000 |
| Series PT 2734, 2.79% (Liquidity | | | | | | | | |
| Facility Merrill Lynch & Co., | | | | | | | | |
| Inc.) (b)(e) | | | | 5,790 | | | | 5,790 |
| Series PT 2735, 2.79% (Liquidity | | | | | | | | |
| Facility Merrill Lynch & Co., | | | | | | | | |
| Inc.) (b)(e) | | | | 10,000 | | | | 10,000 |
| Series Putters 1000, 2.79% (Liquidity | | | | | | | | |
| Facility Dresdner Bank AG) (b)(e) | | | | 7,000 | | | | 7,000 |
| Series Putters 1109, 2.79% (Liquidity | | | | | | | | |
| Facility JPMorgan Chase & | | | | | | | | |
| Co.) (b)(e) | | | | 4,890 | | | | 4,890 |
| Series Putters 744, 2.79% (Liquidity | | | | | | | | |
| Facility Dresdner Bank AG) (b)(e) | | | | 9,130 | | | | 9,130 |
| Series Putters 749, 2.79% (Liquidity | | | | | | | | |
| Facility JPMorgan Chase Bank) (b)(e) | | | | 4,395 | | | | 4,395 |
| Series RobIns 6, 2.84% (Liquidity | | | | | | | | |
| Facility Bank of New York, New | | | | | | | | |
| York) (b)(e) | | | | 13,095 | | | | 13,095 |
| Washington Health Care Facilities Auth. | | | | | | | | |
| Rev. Participating VRDN Series FRRI 02 | | | | | | | | |
| L45J, 2.82% (Liquidity Facility Lehman | | | | | | | | |
| Brothers Hldgs., Inc.) (b)(e) | | | | 25,000 | | | | 25,000 |
| | | | | | | | | 345,690 |
| |
| West Virginia – 0.1% | | | | | | | | |
| West Virginia Gen. Oblig. Participating | | | | | | | | |
| VRDN Series AAB 00 12, 2.77% | | | | | | | | |
| (Liquidity Facility ABN AMRO Bank | | | | | | | | |
| NV) (b)(e) | | | | 6,000 | | | | 6,000 |
| Wisconsin – 1.2% | | | | | | | | |
| Green Bay Wtr. Sys. Rev. Participating | | | | | | | | |
| VRDN Series PT 2396, 2.79% | | | | | | | | |
| (Liquidity Facility Merrill Lynch & Co., | | | | | | | | |
| Inc.) (b)(e) | | | | 5,765 | | | | 5,765 |
| Manitowoc Elec. Rev. Participating VRDN | | | | | | | | |
| Series DB 110, 2.79% (Liquidity | | | | | | | | |
| Facility Deutsche Bank AG) (b)(e) | | | | 14,390 | | | | 14,390 |
| Wilmot Union High School District | | | | | | | | |
| Participating VRDN Series PT 2275, | | | | | | | | |
| 2.79% (Liquidity Facility Merrill Lynch | | | | | | | | |
| & Co., Inc.) (b)(e) | | | | 5,185 | | | | 5,185 |
See accompanying notes which are an integral part of the financial statements.
63 Semiannual Report
| | Tax-Exempt Portfolio
Investments (Unaudited) - continued
|
| Municipal Securities continued | | | | | | |
| |
| | | | | Principal | | Value (Note 1) |
| | | | | Amount (000s) | | (000s) |
| |
| Wisconsin – continued | | | | | | | | |
| Wisconsin Gen. Oblig. Participating | | | | | | | | |
| VRDN: | | | | | | | | |
| Series MS 1166, 2.78% (Liquidity | | | | | | | | |
| Facility Morgan Stanley) (b)(e) | | | $ | 14,870 | | $ | | 14,870 |
| Series PT 2076, 2.79% (Liquidity | | | | | | | | |
| Facility Merrill Lynch & Co., | | | | | | | | |
| Inc.) (b)(e) | | | | 3,440 | | | | 3,440 |
| Wisconsin Health & Edl. Facilities Auth. | | | | | | | | |
| Rev.: | | | | | | | | |
| Participating VRDN Series RobIns 03 | | | | | | | | |
| A, 2.81% (Liquidity Facility Bank of | | | | | | | | |
| New York, New York) (b)(e) | | | | 7,466 | | | | 7,466 |
| (Riverview Hosp. Assoc. Proj.) Series | | | | | | | | |
| 2001, 2.85%, LOC U.S. Bank NA, | | | | | | | | |
| Minnesota, VRDN (b) | | | | 7,700 | | | | 7,700 |
| Wisconsin Trans. Rev. Series 1997 A, | | | | | | | | |
| 2.85% 3/1/06, CP | | | | 5,775 | | | | 5,775 |
| | | | | | | | | 64,591 |
| |
| Wyoming – 0.4% | | | | | | | | |
| Platte County Poll. Cont. Rev. (Tri State | | | | | | | | |
| Generation & Transmission Assoc. | | | | | | | | |
| Proj.) Series 1984 A, 2.95%, LOC | | | | | | | | |
| Nat’l. Rural Utils. Coop. Fin. Corp., | | | | | | | | |
| VRDN (b) | | | | 20,000 | | | | 20,000 |
| |
| Other – 1.0% | | | | Shares | | | | |
| Fidelity Tax Free Cash Central Fund, | | | | | | | | |
| 2.68% (c)(d) | | | | 57,156,000 | | | | 57,156 |
| |
| |
| TOTAL INVESTMENT PORTFOLIO - 95.2% | | | | |
| (Cost $5,217,546) | | | | | | | | 5,217,546 |
| |
| |
| NET OTHER ASSETS 4.8% | | | | | | | | 261,616 |
| |
| NET ASSETS 100% | | | | $ | | 5,479,162 |
| Security Type Abbreviations |
| CP | | — | | COMMERCIAL PAPER |
| RAN | | — | | REVENUE ANTICIPATION NOTE |
| TAN | | — | | TAX ANTICIPATION NOTE |
| TRAN | | — | | TAX AND REVENUE ANTICIPATION NOTE |
| VRDN | | — | | VARIABLE RATE DEMAND NOTE |
Legend
(a) Security or a portion of the security purchased on a delayed delivery or
when-issued basis.
(b) The coupon rate shown on floating or adjustable rate securities represents
the rate at period end.
(c) Information in this report regarding holdings by state and security types
does not reflect the holdings of the Fidelity Tax-Free Cash Central Fund.
(d) Affiliated fund that is available only to investment companies and other
accounts managed by Fidelity Investments. The rate quoted is the
annualized seven-day yield of the fund at period end. A complete
unaudited listing of the fund’s holdings as of its most recent quarter end is
available upon request.
(e) Provides evidence of ownership in one or more underlying municipal
bonds.
(f) Restricted securities – Investment in securities not registered under the
Securities Act of 1933 (excluding 144A issues). At the end of the period,
the value of restricted securities (excluding 144A issues) amounted to
$30,135,000 or 0.5% of net assets.
Additional information on each holding is as follows:
|
| Security | | Acquisition Date | | Cost (000s) |
| Allegheny County Hosp. Dev. Auth. Rev. | | | | |
| Bonds Series PT 762, 2.85%, tender | | | | |
| 6/15/06 (Liquidity Facility Landesbank | | | | |
| Hessen-Thuringen) | | 6/17/05 | | $ 11,300 |
| Houston Gen. Oblig. Bonds | | | | |
| Series PT 969, 2.95%, tender 7/20/06 | | | | |
| (Liquidity Facility DEPFA BANK PLC) | | 5/27/04 | | $ 18,835 |
See accompanying notes which are an integral part of the financial statements.
Semiannual Report 64
Tax-Exempt Portfolio
Financial Statements
|
| Statement of Assets and Liabilities | | | | | | |
| Amounts in thousands (except per share amounts) | | | | September 30, 2005 |
| | | | | | | | | | | (Unaudited) |
| Assets | | | | | | | | | | |
| Investment in securities, at value | | | | | | | | | | |
| (cost $5,217,546) — See | | | | | | | | | | |
| accompanying schedule | | | | | | | | $ | | 5,217,546 |
| Cash | | | | | | | | | | 5,492 |
| Receivable for investments sold | | | | | | | | | | 249,091 |
| Receivable for fund shares sold | | | | | | | | | | 7,685 |
| Interest receivable | | | | | | | | | | 27,624 |
| Prepaid expenses | | | | | | | | | | 2 |
| Receivable from investment adviser | | | | | | | | | | |
| for expense reductions | | | | | | | | | | 156 |
| Other receivables | | | | | | | | | | 128 |
| Total assets | | | | | | | | | | 5,507,724 |
| |
| Liabilities | | | | | | | | | | |
| Payable for investments purchased | | | | | | | | | | |
| on a delayed delivery basis | | $ | | | | 23,381 | | | | |
| Distributions payable | | | | | | 4,014 | | | | |
| Accrued management fee | | | | | | 931 | | | | |
| Distribution fees payable | | | | | | 81 | | | | |
| Other affiliated payables | | | | | | 122 | | | | |
| Other payables and accrued | | | | | | | | | | |
| expenses | | | | | | 33 | | | | |
| Total liabilities | | | | | | | | | | 28,562 |
| |
| Net Assets | | | | | | | | $ | | 5,479,162 |
| Net Assets consist of: | | | | | | | | | | |
| Paid in capital | | | | | | | | $ | | 5,479,013 |
| Undistributed net investment income | | | | | | | | | | 5 |
| Accumulated undistributed net real- | | | | | | | | | | |
| ized gain (loss) on investments | | | | | | | | | | 144 |
| Net Assets | | | | | | | | $ | | 5,479,162 |
| Calculation of Maximum Offering | | | | | | | | | | |
| Price | | | | | | | | | | |
| Class I: | | | | | | | | | | |
| Net Asset Value, offering price | | | | | | | | | | |
| and redemption price | | | | | | | | | | |
| per share ($4,980,278 ÷ | | | | | | | | | | |
| 4,979,056 shares) | | | | | | | | $ | | 1.00 |
| Class II: | | | | | | | | | | |
| Net Asset Value, offering price | | | | | | | | | | |
| and redemption price per share | | | | | | | | | | |
| ($155,002 ÷ 154,982 shares) | | . | | | | | | $ | | 1.00 |
| Class III: | | | | | | | | | | |
| Net Asset Value, offering price | | | | | | | | | | |
| and redemption price per share | | | | | | | | | | |
| ($287,341 ÷ 287,290 shares) | | . | | | | | | $ | | 1.00 |
| Select Class: | | | | | | | | | | |
| Net Asset Value, offering price | | | | | | | | | | |
| and redemption price per share | | | | | | | | | | |
| ($56,541 ÷ 56,527 shares) | | | | | | | | $ | | 1.00 |
| Statement of Operations | | | | | | |
| Amounts in thousands | | Six months ended September 30, 2005 |
| | | | | | | (Unaudited) |
| Investment Income | | | | | | |
| Interest | | | | $ | | 66,603 |
| |
| Expenses | | | | | | |
| Management fee | | $ | | 5,314 | | |
| Transfer agent fees | | | | 388 | | |
| Distribution fees | | | | 484 | | |
| Accounting fees and expenses | | | | 240 | | |
| Independent trustees’ compensation | | | | 12 | | |
| Custodian fees and expenses | | | | 47 | | |
| Registration fees | | | | 140 | | |
| Audit | | | | 31 | | |
| Legal | | | | 6 | | |
| Miscellaneous | | | | 18 | | |
| Total expenses before reductions | | | | 6,680 | | |
| Expense reductions | | | | (1,492) | | 5,188 |
| |
| Net investment income | | | | | | 61,415 |
| |
| Net realized gain (loss) on invest- | | | | | | |
| ment securities | | | | | | 75 |
| Net increase in net assets resulting | | | | | | |
| from operations | | | | $ | | 61,490 |
See accompanying notes which are an integral part of the financial statements.
65 Semiannual Report
| Tax-Exempt Portfolio | | | | | | | | | | | | | | | | | | | | | | | | | | |
| Financial Statements - continued | | | | | | | | | | | | | | | | | | | | | | | | |
| |
| |
| Statement of Changes in Net Assets | | | | | | | | | | | | | | | | | | | | | | | | | | |
| | | | | | | | | | | | | | | | | Six months ended | | | | Year ended |
| | | | | | | | | | | | | | | | | September 30, 2005 | | | | March 31, |
| Amounts in thousands | | | | | | | | | | | | | | | | (Unaudited) | | | | 2005 |
| Increase (Decrease) in Net Assets | | | | | | | | | | | | | | | | | | | | | | | | | | |
| Operations | | | | | | | | | | | | | | | | | | | | | | | | | | |
| Net investment income | | | | | | | | | | | | | | | | $ | | | | 61,415 | | $ | | | | 59,744 |
| Net realized gain (loss) | | | | | | | | | | | | | | | | | | | | 75 | | | | | | 56 |
| Net increase in net assets resulting from operations | | | | | | | | | | | | | | | | | | 61,490 | | | | | | 59,800 |
| Distributions to shareholders from net investment income | | | | | | | | | | | | | | | | | | (61,394) | | | | | | (59,770) |
| Distributions to shareholders from net realized gain | | | | | | | | | | | | | | | | | | | | — | | | | | | (689) |
| Total distributions | | | | | | | | | | | | | | | | | | | | (61,394) | | | | | | (60,459) |
| Share transactions - net increase (decrease) | | | | | | | | | | | | | | | | | | 1,059,770 | | | | | | (67,722) |
| Total increase (decrease) in net assets | | | | | | | | | | | | | | | | | | 1,059,866 | | | | | | (68,381) |
| |
| Net Assets | | | | | | | | | | | | | | | | | | | | | | | | | | |
| Beginning of period | | | | | | | | | | | | | | | | | | 4,419,296 | | | | 4,487,677 |
| End of period (including undistributed net investment income of $5 and distributions in excess of net investment | | | | | | | | | | | | |
| income of $16, respectively) | | | | | | | | | | | | | | | | $ | | 5,479,162 | | $ | | 4,419,296 |
| |
| Financial Highlights Class I | | | | | | | | | | | | | | | | | | | | | | | | | | |
| | | Six months ended | | | | | | | | | | | | | | | | | | | | | | |
| | | September 30, 2005 | | | | Years ended March 31, |
| | | (Unaudited) | | | | 2005 | | | | 2004 | | | | 2003 | | | | 2002 | | | | | | 2001 |
| Selected Per Share Data | | | | | | | | | | | | | | | | | | | | | | | | | | |
| Net asset value, beginning of period | | $ 1.00 | | | | $ 1.00 | | | | $ 1.00 | | | | $ 1.00 | | | | $ 1.00 | | | | | | $ 1.00 |
| Income from Investment Operations | | | | | | | | | | | | | | | | | | | | | | | | | | |
| Net investment income | | 012 | | | | .013 | | | | .009 | | | | .013 | | | | .022 | | | | | | .039 |
| Net realized and unrealized gain (loss)E | | — | | | | — | | | | — | | | | — | | | | — | | | | | | — |
| Total from investment operations | | 012 | | | | .013 | | | | .009 | | | | .013 | | | | .022 | | | | | | .039 |
| Distributions from net investment income | | (.012) | | | | (.013) | | | | (.009) | | | | (.013) | | | | (.022) | | | | | | (.039) |
| Distributions from net realized gain | | — | | | | —E | | | | —E | | | | — | | | | — | | | | | | — |
| Total distributions | | (.012) | | | | (.013) | | | | (.009) | | | | (.013) | | | | (.022) | | | | | | (.039) |
| Net asset value, end of period | | $ 1.00 | | | | $ 1.00 | | | | $ 1.00 | | | | $ 1.00 | | | | $ 1.00 | | | | | | $ 1.00 |
| Total ReturnB,C | | 1.18% | | | | 1.30% | | | | .89% | | | | 1.30% | | | | 2.22% | | | | | | 4.02% |
| Ratios to Average Net AssetsD | | | | | | | | | | | | | | | | | | | | | | | | |
| Expenses before expense reductions | | 23%A | | | | .23% | | | | .23% | | | | .24% | | | | .23% | | | | | | .25% |
| Expenses net of voluntary waivers, if any | | 20%A | | | | .20% | | | | .20% | | | | .20% | | | | .20% | | | | | | .20% |
| Expenses net of all reductions | | 18%A | | | | .18% | | | | .19% | | | | .19% | | | | .18% | | | | | | .19% |
| Net investment income | | 2.33%A | | | | 1.28% | | | | .88% | | | | 1.28% | | | | 2.10% | | | | | | 3.93% |
| Supplemental Data | | | | | | | | | | | | | | | | | | | | | | | | | | |
| Net assets, end of period (in millions) | | $ 4,980 | | | | $ 4,041 | | | | $ 4,044 | | | | $ 3,337 | | | | $ 2,753 | | | | | | $ 1,852 |
A Annualized
B Total returns for periods of less than one year are not annualized.
C Total returns would have been lower had certain expenses not been reduced during the periods shown.
D Expense ratios reflect operating expenses of the class. Expenses before reductions do not reflect amounts reimbursed by the investment adviser or reductions from brokerage service arrangements or other expense offset arrangements and do not represent
the amount paid by the class during periods when reimbursements or reductions occur. Expenses net of any voluntary waivers reflect expenses after reimbursement by the investment adviser but prior to reductions from brokerage service arrangements or
other expense offset arrangements. Expenses net of all reductions represent the net expenses paid by the class.
E Amount represents less than $.001 per share.
|
| See accompanying notes which are an integral part of the financial statements. | | |
| Semiannual Report | | 66 |
| Financial Highlights Class II | | | | | | | | | | | | | | | | | | | | |
| | | Six months ended | | | | | | | | | | | | | | | | |
| | | September 30, 2005 | | | | Years ended March 31, |
| | | (Unaudited) | | | | 2005 | | 2004 | | | | 2003 | | | | 2002 | | 2001 |
| Selected Per Share Data | | | | | | | | | | | | | | | | | | | | |
| Net asset value, beginning of period | | $ 1.00 | | | | $ 1.00 | | $ 1.00 | | | | $ 1.00 | | | | $ 1.00 | | $ 1.00 |
| Income from Investment Operations | | | | | | | | | | | | | | | | | | | | |
| Net investment income | | 011 | | | | .011 | | .007 | | | | .011 | | | | .020 | | .038 |
| Net realized and unrealized gain (loss)E | | — | | | | — | | — | | | | — | | | | — | | — |
| Total from investment operations | | 011 | | | | .011 | | .007 | | | | .011 | | | | .020 | | .038 |
| Distributions from net investment income | | (.011) | | | | (.011) | | (.007) | | | | (.011) | | | | (.020) | | (.038) |
| Distributions from net realized gain | | — | | | | —E | | —E | | | | — | | | | — | | — |
| Total distributions | | (.011) | | | | (.011) | | (.007) | | | | (.011) | | | | (.020) | | (.038) |
| Net asset value, end of period | | $ 1.00 | | | | $ 1.00 | | $ 1.00 | | | | $ 1.00 | | | | $ 1.00 | | $ 1.00 |
| Total ReturnB,C | | 1.10% | | | | 1.15% | | .74% | | | | 1.15% | | | | 2.07% | | 3.86% |
| Ratios to Average Net AssetsD | | | | | | | | | | | | | | | | | | | | |
| Expenses before expense reductions | | 38%A | | | | .38% | | .38% | | | | .39% | | | | .38% | | .40% |
| Expenses net of voluntary waivers, if any | | 35%A | | | | .35% | | .35% | | | | .35% | | | | .35% | | .35% |
| Expenses net of all reductions | | 33%A | | | | .33% | | .34% | | | | .34% | | | | .33% | | .34% |
| Net investment income | | 2.18%A | | | | 1.13% | | .73% | | | | 1.13% | | | | 2.00% | | 3.82% |
| Supplemental Data | | | | | | | | | | | | | | | | | | | | |
| Net assets, end of period (in millions) | | $ 155 | | | | $ 133 | | $ 220 | | | | $ 55 | | | | $ 44 | | $ 16 |
A Annualized
B Total returns for periods of less than one year are not annualized.
C Total returns would have been lower had certain expenses not been reduced during the periods shown.
D Expense ratios reflect operating expenses of the class. Expenses before reductions do not reflect amounts reimbursed by the investment adviser or reductions from brokerage service arrangements or other expense offset arrangements and do not
represent the amount paid by the class during periods when reimbursements or reductions occur. Expenses net of any voluntary waivers reflect expenses after reimbursement by the investment adviser but prior to reductions from brokerage service
arrangements or other expense offset arrangements. Expenses net of all reductions represent the net expenses paid by the class.
E Amount represents less than $.001 per share.
|
| Financial Highlights Class III | | | | | | | | | | | | | | | | | | | | |
| | | Six months ended | | | | | | | | | | | | | | | | |
| | | September 30, 2005 | | | | Years ended March 31, |
| | | (Unaudited) | | | | 2005 | | 2004 | | | | 2003 | | | | 2002 | | 2001 |
| Selected Per Share Data | | | | | | | | | | | | | | | | | | | | |
| Net asset value, beginning of period | | $ 1.00 | | | | $ 1.00 | | $ 1.00 | | | | $ 1.00 | | | | $ 1.00 | | $ 1.00 |
| Income from Investment Operations | | | | | | | | | | | | | | | | | | | | |
| Net investment income | | 010 | | | | .010 | | .006 | | | | .010 | | | | .019 | | .037 |
| Net realized and unrealized gain (loss)E | | — | | | | — | | — | | | | — | | | | — | | — |
| Total from investment operations | | 010 | | | | .010 | | .006 | | | | .010 | | | | .019 | | .037 |
| Distributions from net investment income | | (.010) | | | | (.010) | | (.006) | | | | (.010) | | | | (.019) | | (.037) |
| Distributions from net realized gain | | — | | | | —E | | —E | | | | — | | | | — | | — |
| Total distributions | | (.010) | | | | (.010) | | (.006) | | | | (.010) | | | | (.019) | | (.037) |
| Net asset value, end of period | | $ 1.00 | | | | $ 1.00 | | $ 1.00 | | | | $ 1.00 | | | | $ 1.00 | | $ 1.00 |
| Total ReturnB,C | | 1.05% | | | | 1.05% | | .64% | | | | 1.05% | | | | 1.96% | | 3.76% |
| Ratios to Average Net AssetsD | | | | | | | | | | | | | | | | | | | | |
| Expenses before expense reductions | | 48%A | | | | .48% | | .48% | | | | .49% | | | | .48% | | .50% |
| Expenses net of voluntary waivers, if any | | 45%A | | | | .45% | | .45% | | | | .45% | | | | .45% | | .45% |
| Expenses net of all reductions | | 43%A | | | | .43% | | .44% | | | | .44% | | | | .43% | | .44% |
| Net investment income | | 2.08%A | | | | 1.03% | | .63% | | | | 1.02% | | | | 1.87% | | 3.64% |
| Supplemental Data | | | | | | | | | | | | | | | | | | | | |
| Net assets, end of period (in millions) | | $ 287 | | | | $ 174 | | $ 162 | | | | $ 123 | | | | $ 113 | | $ 84 |
A Annualized
B Total returns for periods of less than one year are not annualized.
C Total returns would have been lower had certain expenses not been reduced during the periods shown.
D Expense ratios reflect operating expenses of the class. Expenses before reductions do not reflect amounts reimbursed by the investment adviser or reductions from brokerage service arrangements or other expense offset arrangements and do not
represent the amount paid by the class during periods when reimbursements or reductions occur. Expenses net of any voluntary waivers reflect expenses after reimbursement by the investment adviser but prior to reductions from brokerage service
arrangements or other expense offset arrangements. Expenses net of all reductions represent the net expenses paid by the class.
E Amount represents less than $.001 per share.
|
See accompanying notes which are an integral part of the financial statements.
|
67 Semiannual Report
| Financial Highlights Select Class | | | | | | | | | | | | |
| | Six months ended | | | | | | | | | | | | |
| | | September 30, 2005 | | Years ended March 31, |
| | | (Unaudited) | | 2005 | | 2004 | | 2003 | | 2002D |
| Selected Per Share Data | | | | | | | | | | | | |
| Net asset value, beginning of period | | $ 1.00 | | $ 1.00 | | $ 1.00 | | $ 1.00 | | $ 1.00 |
| Income from Investment Operations | | | | | | | | | | | | |
| Net investment income | | 011 | | .012 | | .008 | | .012 | | .003 |
| Net realized and unrealized gain (loss)F | | — | | — | | — | | — | | — |
| Total from investment operations | | 011 | | .012 | | .008 | | .012 | | .003 |
| Distributions from net investment income | | (.011) | | (.012) | | (.008) | | (.012) | | (.003) |
| Distributions from net realized gain | | — | | —F | | —F | | — | | — |
| Total distributions | | (.011) | | (.012) | | (.008) | | (.012) | | (.003) |
| Net asset value, end of period | | $ 1.00 | | $ 1.00 | | $ 1.00 | | $ 1.00 | | $ 1.00 |
| Total ReturnB,C | | 1.15% | | 1.25% | | .84% | | 1.24% | | .26% |
| Ratios to Average Net AssetsE | | | | | | | | | | | | |
| Expenses before expense reductions | | 28%A | | .28% | | .28% | | .29% | | .28%A |
| Expenses net of voluntary waivers, if any | | 25%A | | .25% | | .25% | | .25% | | .25%A |
| Expenses net of all reductions | | 23%A | | .23% | | .24% | | .24% | | .23%A |
| Net investment income | | 2.28%A | | 1.23% | | .83% | | 1.23% | | 1.32%A |
| Supplemental Data | | | | | | | | | | | | |
| Net assets, end of period (000 omitted) | | $ 56,541 | | $ 71,516 | | $ 61,925 | | $ 103,950 | | $ 100 |
A Annualized
B Total returns for periods of less than one year are not annualized.
C Total returns would have been lower had certain expenses not been reduced during the periods shown.
D For the period January 17, 2002 (commencement of sale of shares) to March 31, 2002.
E Expense ratios reflect operating expenses of the class. Expenses before reductions do not reflect amounts reimbursed by the investment adviser or reductions from brokerage service arrangements or other expense offset arrangements and do not
represent the amount paid by the class during periods when reimbursements or reductions occur. Expense ratios before reductions for start up periods may not be representative of longer term operating periods. Expenses net of any voluntary
waivers reflect expenses after reimbursement by the investment adviser but prior to reductions from brokerage service arrangements or other expense offset arrangements. Expenses net of all reductions represent the net expenses paid by the class.
F Amount represents less than $.001 per share.
|
| See accompanying notes which are an integral part of the financial statements. | | |
| Semiannual Report | | 68 |
Notes to Financial Statements
For the period ended September 30, 2005 (Unaudited)
(Amounts in thousands except ratios)
1. Significant Accounting Policies.
|
Treasury Only Portfolio, Treasury Portfolio, Government Portfolio, Prime Money Market Portfolio, Money Market Portfolio and Tax Exempt Portfolio (the funds) are funds of Colchester Street Trust (the trust). Each fund is authorized to issue an unlimited number of shares. The trust is registered under the Investment Company Act of 1940, as amended (the 1940 Act), as an open end management investment company organized as a Delaware statutory trust.
Each fund offers Class I, Class II, and Class III and Select Class shares, each of which has equal rights as to assets and voting privileges. Each class has exclusive voting rights with respect to matters that affect that class. Investment income, realized and unrealized capital gains and losses, the common expenses of the fund, and certain fund level expense reductions, if any, are allocated on a pro rata basis to each class based on the relative net assets of each class to the total net assets of each fund. Each class differs with respect to transfer agent and distribution and service plan fees incurred. Certain expense reductions also differ by class. The fund may invest in affiliated money market central funds (Money Market Central Funds), which are open end investment companies available to investment companies and other accounts managed by Fidelity Management & Research Company (FMR) and its affiliates. The financial statements have been prepared in conformity with accounting principles generally accepted in the United States of America, which require management to make certain estimates and assumptions at the date of the financial statements. The following summarizes the significant accounting policies of the funds:
Security Valuation. As permitted under Rule 2a 7 of the 1940 Act, and certain conditions therein, securities are valued initially at cost and thereafter assume a constant amortization to maturity of any discount or premium. Investments in open end investment companies are valued at their net asset value each business day.
Investment Transactions and Income. Security transactions are accounted for as of trade date. Gains and losses on securities sold are determined on the basis of identified cost. Interest income is accrued as earned. Interest income includes coupon interest and amortization of premium and accretion of discount on debt securities.
Expenses. Most expenses of the trust can be directly attributed to a fund. Expenses which cannot be directly attributed are apportioned among each fund in the trust.
Deferred Trustee Compensation. Under a Deferred Compensation Plan (the Plan) for Government Portfolio and Money Market Portfolio, indepen dent Trustees must defer receipt of a portion of, and may elect to defer receipt of an additional portion of, their annual compensation. Deferred amounts are treated as though equivalent dollar amounts had been invested in shares of each applicable fund or are invested in a cross section of other Fidelity money market funds, and are marked to market. Deferred amounts remain in the fund until distributed in accordance with the Plan.
Income Tax Information and Distributions to Shareholders. Each year, each fund intends to qualify as a regulated investment company by distributing all of its taxable income and realized gains under Subchapter M of the Internal Revenue Code. As a result, no provision for income taxes is required in the accompanying financial statements.
Dividends are declared daily and paid monthly from net investment income. Distributions from realized gains, if any, are recorded on the ex dividend date. Income dividends and capital gain distributions are declared separately for each class. Income and capital gain distributions are determined in accordance with income tax regulations, which may differ from generally accepted accounting principles.
Capital accounts within the financial statements are adjusted for permanent book tax differences. These adjustments have no impact on net assets or the results of operations. Temporary book tax differences will reverse in a subsequent period.
Book tax differences are primarily due to deferred trustees compensation, capital loss carryforwards and losses deferred due to excise tax regulations.
The Tax Exempt portfolio purchases municipal securities whose interest, in the opinion of the issuer, is free from federal income tax. There is no assurance that the Internal Revenue Service (IRS) will agree with this opinion. In the event the IRS determines that the issuer does not comply with relevant tax requirements, interest payments from a security could become federally taxable, possibly retroactively to the date the security was issued.
The federal tax cost of investments and unrealized appreciation (depreciation) as of period end were as follows for each fund:
| | | Cost for Federal | | | | Unrealized | | | | Unrealized | | Net Unrealized Appreciation/ |
| | | Income Tax Purposes | | | | Appreciation | | | | Depreciation | | | | (Depreciation) |
| Treasury Only Portfolio | | $ 1,033,769 | | $ | | — | | $ | | — | | $ | | — |
| Treasury Portfolio | | 8,593,714 | | | | — | | | | — | | | | — |
| Government Portfolio | | 7,582,896 | | | | — | | | | — | | | | — |
| Prime Money Market Portfolio | | 11,633,179 | | | | — | | | | — | | | | — |
| Money Market Portfolio | | 15,094,708 | | | | — | | | | — | | | | — |
| Tax Exempt Portfolio | | 5,217,546 | | | | — | | | | — | | | | — |
69 Semiannual Report
Notes to Financial Statements (Unaudited) continued
(Amounts in thousands except ratios)
2. Operating Policies.
|
Repurchase Agreements. FMR has received an Exemptive Order from the Securities and Exchange Commission (the SEC) which permits certain funds and other affiliated entities of FMR to transfer uninvested cash balances into joint trading accounts which are then invested in repurchase agreements. Certain funds may also invest directly with institutions in repurchase agreements. Repurchase agreements are collateralized by government or non government securities. Collateral is held in segregated accounts with custodian banks and may be obtained in the event of a default of the counterparty. Each applicable fund monitors, on a daily basis, the value of the collateral to ensure it is at least equal to the principal amount of the repurchase agreement (including accrued interest). In the event of a default by the counterparty, realization of the collateral proceeds could be delayed, during which time the value of the collateral may decline.
Delayed Delivery Transactions and When Issued Securities. Certain funds may purchase or sell securities on a delayed delivery or when issued basis. Payment and delivery may take place after the customary settlement period for that security. The price of the underlying securities and the date when the securities will be delivered and paid for are fixed at the time the transaction is negotiated. During the time a delayed delivery sell is outstand ing, the contract is marked to market daily and equivalent deliverable securities are held for the transaction. The value of the securities purchased on a delayed delivery or when issued basis are identified as such in each applicable fund’s Schedule of Investments. Certain funds may receive compensation for interest forgone in the purchase of a delayed delivery or when issued security. With respect to purchase commitments, each applicable fund identifies securities as segregated in its records with a value at least equal to the amount of the commitment. Losses may arise due to changes in the value of the underlying securities or if the counterparty does not perform under the contract’s terms, or if the issuer does not issue the securities due to political, economic, or other factors.
Restricted Securities. Certain funds may invest in securities that are subject to legal or contractual restrictions on resale. These securities generally may be resold in transactions exempt from registration or to the public if the securities are registered. Disposal of these securities may involve time consuming negotiations and expense, and prompt sale at an acceptable price may be difficult. Information regarding restricted securities is included at the end of each applicable fund’s Schedule of Investments.
Note Purchase Agreements. Tax Exempt Portfolio together with other affiliated funds, has entered into an agreement representing a commitment to purchase specific notes prior to their issuance. Based on the terms of the agreement, the fund is committed to purchase up to $12,028 of notes with a floating rate coupon based on an Index Rate as defined in the agreement and maturing on August 31, 2006.
Payment for the notes is not required and interest does not accrue until the delivery date. The obligation of the fund to purchase these notes is contin gent upon no material adverse changes in the credit quality of the issuer. The issuer may submit a request to the fund to purchase up to the maximum principal amount of the note. The fund does not record a portfolio holding or any entries to its records until the notes are purchased. The notes are subject to market value fluctuations and there is risk the securities will not be issued as anticipated. The fund has identified securities as segregated with a value at least equal to the amount of the commitment.
3. Fees and Other Transactions with Affiliates.
|
Management Fee. FMR and its affiliates provide the funds with investment management related services for which the funds pay a monthly manage ment fee that is based on an annual rate of .20% of average net assets.
Distribution and Service Plan. In accordance with Rule 12b 1 of the 1940 Act, the funds have adopted separate Distribution and Service Plans for Class II, Class III and Select Class shares. Class II, Class III and Select Class of each fund pays Fidelity Distributors Corporation (FDC), an affiliate of FMR, a Service fee based on an annual percentage of each class’ average net assets. In addition, FDC may pay financial intermediaries for selling shares of the funds and providing shareholder support services. For the period, the Service fee rates were as follows:
| Class II | | 15% |
| Class III | | 25% |
| Select Class | | 05% |
| 3. Fees and Other Transactions with Affiliates continued | | | | | | | | | | |
| |
| Distribution and Service Plan continued | | | | | | | | | | | | |
| |
| The following amounts were paid to and retained by FDC: | | | | | | | | | | | | |
| | | | | | | Paid to | | | | Retained | | |
| | | | | | | FDC | | | | by FDC | | |
| Treasury Only Portfolio: | | | | | | | | | | | | |
| Class II | | | | $ | | 100 | | $ | | | | — |
| Class III | | | | | | 192 | | | | | | — |
| Select Class | | | | | | 4 | | | | | | — |
| | | | | $ | | 296 | | $ | | | | — |
| Treasury Portfolio: | | | | | | | | | | | | |
| Class II | | | | $ | | 124 | | $ | | | | 1 |
| Class III | | | | | | 4,005 | | | | | | — |
| Select Class | | | | | | 24 | | | | | | — |
| | | | | $ | | 4,153 | | $ | | | | 1 |
| Government Portfolio: | | | | | | | | | | | | |
| Class II | | | | $ | | 370 | | $ | | | | 2 |
| Class III | | | | | | 844 | | | | | | 1 |
| Select Class | | | | | | 10 | | | | | | — |
| | | | | $ | | 1,224 | | $ | | | | 3 |
| Prime Money Market Portfolio: | | | | | | | | | | | | |
| Class II | | | | $ | | 634 | | $ | | | | 6 |
| Class III | | | | | | 1,672 | | | | | | — |
| Select Class | | | | | | 29 | | | | | | — |
| | | | | $ | | 2,335 | | $ | | | | 6 |
| Money Market Portfolio: | | | | | | | | | | | | |
| Class II | | | | $ | | 139 | | $ | | | | 2 |
| Class III | | | | | | 1,192 | | | | | | — |
| Select Class | | | | | | 9 | | | | | | 1 |
| | | | | $ | | 1,340 | | $ | | | | 3 |
| Tax Exempt Portfolio: | | | | | | | | | | | | |
| Class II | | | | $ | | 133 | | $ | | | | — |
| Class III | | | | | | 324 | | | | | | — |
| Select Class | | | | | | 27 | | | | | | — |
| | | | | $ | | 484 | | $ | | | | — |
Transfer Agent Fees. Fidelity Investments Institutional Operations Company, Inc. (FIIOC), an affiliate of FMR, is the transfer, dividend disbursing and shareholder servicing agent for the funds except for Tax Exempt Portfolio. Citibank, N.A. (Citibank) is the custodian, transfer and shareholder servicing agent for Tax Exempt Portfolio. Citibank has entered into a sub arrangement with FIIOC to perform the activities associated with the transfer and shareholder servicing agent functions for Tax Exempt Portfolio. FIIOC receives asset based fees with respect to each account. FIIOC pays for typesetting, printing and mailing of all shareholder reports, except proxy statements. Each class pays a transfer agent fee equal to an annual rate of .015% of their month end net assets. For the period the total transfer agent fees paid by each class to FIIOC were as follows.
| Treasury Only Portfolio | | Class I | | $ | | 75 |
| Treasury Only Portfolio | | Class II | | | | 10 |
| Treasury Only Portfolio | | Class III | | | | 14 |
| Treasury Only Portfolio | | Select Class | | | | 1 |
| | | | | | | $ | | 100 |
| Treasury Portfolio | | Class I | | $ | | 387 |
| Treasury Portfolio | | Class II | | | | 12 |
| Treasury Portfolio | | Class III | | | | 252 |
| Treasury Portfolio | | Select Class | | | | 7 |
| | | | | | | $ | | 658 |
| Government Portfolio | | Class I | | $ | | 442 |
| Government Portfolio | | Class II | | | | 70 |
| Government Portfolio | | Class III | | | | 58 |
| Government Portfolio | | Select Class | | | | 3 |
| | | | | | | $ | | 573 |
71 Semiannual Report
| Notes to Financial Statements (Unaudited) continued | | | | |
| (Amounts in thousands except ratios) | | | | | | |
| |
| |
| 3. Fees and Other Transactions with Affiliates continued | | | | |
| |
| Transfer Agent Fees - continued | | | | | | |
| |
| Prime Money Market Portfolio | | Class I | | | | $ | | 574 |
| Prime Money Market Portfolio | | Class II | | | | | | 102 |
| Prime Money Market Portfolio | | Class III | | | | | | 108 |
| Prime Money Market Portfolio | | Select Class | | | | | | 9 |
| | | | | | | | | | | $ | | 793 |
| Money Market Portfolio | | Class I | | | | $ | | 987 |
| Money Market Portfolio | | Class II | | | | | | 15 |
| Money Market Portfolio | | Class III | | | | | | 76 |
| Money Market Portfolio | | Select Class | | | | | | 3 |
| | | | | | | | | | | $ | | 1,081 |
| Tax Exempt Portfolio | | Class I | | | | | | $ | | 346 |
| Tax Exempt Portfolio | | Class II | | | | | | | | 14 |
| Tax Exempt Portfolio | | Class III | | | | | | | | 20 |
| Tax Exempt Portfolio | | Select Class | | | | | | 8 |
| | | | | | | | | | | $ | | 388 |
Accounting Fees. Fidelity Service Company, Inc. (FSC), an affiliate of FMR, maintains the accounting records for the funds except for Tax Exempt Portfolio. Citibank has entered into a sub arrangement with FSC to maintain Tax Exempt Portfolio’s accounting records. The fee is based on the level of average net assets for the month.
Affiliated Central Funds. Certain funds may invest in Money Market Central Funds which seek preservation of capital and current income and are managed by Fidelity Investments Money Management, Inc. (FIMM) an affiliate of FMR.
The Money Market Central Funds do not pay a management fee. Income distributions earned by the funds are recorded as income in the accompanying financial statements. Distributions from the Money Market Central Funds are noted in the table below:
| | | Income Distributions |
| Tax Exempt Portfolio | | $ 320 |
Interfund Lending Program. Pursuant to an Exemptive Order issued by the SEC, the funds, along with other registered investment companies having management contracts with FMR, may participate in an interfund lending program. This program provides an alternative credit facility allowing the funds to borrow from, or lend money to, other participating affiliated funds. Each applicable fund’s activity in this program during the period for which loans were outstanding was as follows:
| | | Borrower | | Average Daily | | Weighted Average | | Interest Earned | | Interest |
| | | or Lender | | Loan Balance | | Interest Rate | | (included in interest income) | | Expense |
| Prime Money Market Portfolio | | Lender | | 18,173 | | 3.25% | | $ | | 30 | | — |
| Money Market Portfolio | | Lender | | 12,126 | | 3.28% | | $ | | 20 | | — |
Semiannual Report 72
FMR voluntarily agreed to reimburse funds to the extent annual operating expenses exceeded certain levels of average net assets as noted in the table below. Some expenses, for example interest expense, are excluded from this reimbursement.
| The following classes of each applicable fund were in reimbursement during the period: | | | | | | |
| | | Expense | | Reimbursement |
| | | Limitations | | from adviser |
| |
| Treasury Only Portfolio | | | | | | |
| Class I | | 20% | | $ | | 174 |
| Class II | | 35% | | | | 27 |
| Class III | | 45% | | | | 31 |
| Select Class | | 25% | | | | 3 |
| Treasury Portfolio | | | | | | |
| Class I | | 20% | | $ | | 676 |
| Class II | | 35% | | | | 23 |
| Class III | | 45% | | | | 446 |
| Select Class | | 25% | | | | 13 |
| Government Portfolio | | | | | | |
| Class I | | 20% | | $ | | 820 |
| Class II | | 35% | | | | 106 |
| Class III | | 45% | | | | 104 |
| Select Class | | 25% | | | | 5 |
| Prime Money Market Portfolio | | | | | | |
| Class I | | 20% | | $ | | 1,121 |
| Class II | | 35% | | | | 172 |
| Class III | | 45% | | | | 210 |
| Select Class | | 25% | | | | 17 |
| Money Market Portfolio | | | | | | |
| Class I | | 18% | | $ | | 3,097 |
| Class II | | 33% | | | | 48 |
| Class III | | 43% | | | | 225 |
| Select Class | | 23% | | | | 9 |
| Tax Exempt Portfolio | | | | | | |
| Class I | | 20% | | $ | | 815 |
| Class II | | 35% | | | | 31 |
| Class III | | 45% | | | | 44 |
| Select Class | | 25% | | | | 18 |
In addition, through arrangements with each applicable fund’s custodian, credits realized as a result of uninvested cash balances were used to reduce each fund’s expenses. All of the applicable expense reductions are noted in the table below.
| | | | | | | Transfer | | | | |
| | | Custody | | | | Agent | | | | Accounting |
| | | expense | | | | expense | | | | expense |
| | | reduction | | | | reduction | | | | reduction |
| Treasury Only Portfolio | | $ 2 | | $ | | — | | $ | | — |
| Government Portfolio | | 2 | | | | — | | | | — |
| Prime Money Market Portfolio | | 5 | | | | — | | | | — |
| Money Market Portfolio | | 7 | | | | — | | | | — |
| Tax Exempt Portfolio | | 47 | | | | — | | | | 240 |
| Class I | | | | | | 267 | | | | |
| Class II | | | | | | 10 | | | | |
| Class III | | | | | | 14 | | | | |
| Select Class | | | | | | 6 | | | | |
73 Semiannual Report
Notes to Financial Statements (Unaudited) continued
(Amounts in thousands except ratios)
5. Other.
|
The funds’ organizational documents provide former and current trustees and officers with a limited indemnification against liabilities arising in connection with the performance of their duties to the funds. In the normal course of business, the funds may also enter into contracts that provide general indemnifications. The funds’ maximum exposure under these arrangements is unknown as this would be dependent on future claims that may be made against the funds. The risk of material loss from such claims is considered remote.
| 6. Distributions to Shareholders. | | | | | | | | |
| |
| Distributions to shareholders of each class were as follows: | | | | | | | | |
| | | Six months ended | | | | Year ended |
| | | September 30, 2005 | | | | March 31, 2005 |
| From net investment income | | | | | | | | |
| Treasury Only Portfolio - Class I | | $ | | 11,537 | | $ | | 12,300 |
| Treasury Only Portfolio - Class II | | | | 1,756 | | | | 2,015 |
| Treasury Only Portfolio - Class III | | | | 1,966 | | | | 1,488 |
| Treasury Only Portfolio - Select Class | | | | 234 | | | | 197 |
| Total | | $ | | 15,493 | | $ | | 16,000 |
| Treasury Portfolio - Class I | | $ | | 70,736 | | $ | | 68,752 |
| Treasury Portfolio - Class II | | | | 2,330 | | | | 2,873 |
| Treasury Portfolio - Class III | | | | 43,906 | | | | 43,620 |
| Treasury Portfolio - Select Class | | | | 1,446 | | | | 1,207 |
| Total | | $ | | 118,418 | | $ | | 116,452 |
| Government Portfolio - Class I | | $ | | 84,974 | | $ | | 87,026 |
| Government Portfolio - Class II | | | | 7,087 | | | | 9,036 |
| Government Portfolio - Class III | | | | 9,630 | | | | 9,532 |
| Government Portfolio - Select Class | | | | 591 | | | | 605 |
| Total | | $ | | 102,282 | | $ | | 106,199 |
| Prime Money Market Portfolio - Class I | | $ | | 113,134 | | $ | | 118,085 |
| Prime Money Market Portfolio - Class II | | | | 12,460 | | | | 7,809 |
| Prime Money Market Portfolio - Class III | | | | 19,177 | | | | 14,479 |
| Prime Money Market Portfolio - Select Class | | | | 1,750 | | | | 1,568 |
| Total | | $ | | 146,521 | | $ | | 141,941 |
| Money Market Portfolio - Class I | | $ | | 199,123 | | $ | | 243,040 |
| Money Market Portfolio - Class II | | | | 2,729 | | | | 3,050 |
| Money Market Portfolio - Class III | | | | 13,559 | | | | 20,187 |
| Money Market Portfolio - Select Class | | | | 556 | | | | 986 |
| Total | | $ | | 215,967 | | $ | | 267,263 |
| Tax Exempt Portfolio - Class I | | $ | | 55,443 | | $ | | 55,857 |
| Tax Exempt Portfolio - Class II | | | | 1,950 | | | | 1,649 |
| Tax Exempt Portfolio - Class III | | | | 2,727 | | | | 1,534 |
| Tax Exempt Portfolio - Select Class | | | | 1,274 | | | | 730 |
| Total | | $ | | 61,394 | | $ | | 59,770 |
| From net realized gain | | | | | | | | |
| Treasury Only Portfolio - Class I | | $ | | — | | $ | | 81 |
| Treasury Only Portfolio - Class II | | | | — | | | | 17 |
| Treasury Only Portfolio - Class III | | | | — | | | | 11 |
| Treasury Only Portfolio - Select Class | | | | — | | | | 1 |
| Total | | $ | | — | | $ | | 110 |
| Tax Exempt Portfolio - Class I | | $ | | — | | $ | | 632 |
| Tax Exempt Portfolio - Class II | | | | — | | | | 30 |
| Tax Exempt Portfolio - Class III | | | | — | | | | 21 |
| Tax Exempt Portfolio - Select Class | | | | — | | | | 6 |
| Total | | $ | | — | | $ | | 689 |
| 7. Share Transactions. | | | | |
| |
| Transactions for each class of shares were as follows: | | | | |
| | | Six months ended | | Year ended |
| | | September 30, 2005 | | March 31, 2005 |
| Treasury Only Portfolio Class I | | | | |
| Shares sold | | 1,124,689 | | 2,485,684 |
| Reinvestment of distributions | | 5,956 | | 6,060 |
| Shares redeemed | | (1,208,548) | | (2,637,820) |
| Net increase (decrease) | | (77,903) | | (146,076) |
| Treasury Only Portfolio Class II | | | | |
| Shares sold | | 421,401 | | 1,040,533 |
| Reinvestment of distributions | | 1,158 | | 1,433 |
| Shares redeemed | | (431,566) | | (1,039,710) |
| Net increase (decrease) | | (9,007) | | 2,256 |
| Treasury Only Portfolio Class III | | | | |
| Shares sold | | 467,386 | | 852,925 |
| Reinvestment of distributions | | 1,034 | | 901 |
| Shares redeemed | | (458,320) | | (844,270) |
| Net increase (decrease) | | 10,100 | | 9,556 |
| Treasury Only Portfolio Select Class | | | | |
| Shares sold | | 64,086 | | 76,340 |
| Reinvestment of distributions | | 226 | | 161 |
| Shares redeemed | | (56,106) | | (70,927) |
| Net increase (decrease) | | 8,206 | | 5,574 |
| Treasury Portfolio - Class I | | | | |
| Shares sold | | 28,829,876 | | 51,904,178 |
| Reinvestment of distributions | | 28,797 | | 30,037 |
| Shares redeemed | | (29,565,319) | | (51,152,946) |
| Net increase (decrease) | | (706,646) | | 781,269 |
| Treasury Portfolio Class II | | | | |
| Shares sold | | 919,231 | | 2,039,525 |
| Reinvestment of distributions | | 882 | | 814 |
| Shares redeemed | | (946,911) | | (2,091,843) |
| Net increase (decrease) | | (26,798) | | (51,504) |
| Treasury Portfolio Class III | | | | |
| Shares sold | | 6,772,832 | | 13,933,326 |
| Reinvestment of distributions | | 8,588 | | 10,308 |
| Shares redeemed | | (6,693,777) | | (14,635,473) |
| Net increase (decrease) | | 87,643 | | (691,839) |
| Treasury Portfolio Select Class | | | | |
| Shares sold | | 366,719 | | 1,097,946 |
| Reinvestment of distributions | | 39 | | 87 |
| Shares redeemed | | (193,784) | | (1,117,315) |
| Net increase (decrease) | | 172,974 | | (19,282) |
| Government Portfolio - Class I | | | | |
| Shares sold | | 20,511,947 | | 43,403,247 |
| Reinvestment of distributions | | 45,943 | | 52,121 |
| Shares redeemed | | (20,106,791) | | (43,889,206) |
| Net increase (decrease) | | 451,099 | | (433,838) |
| Government Portfolio Class II | | | | |
| Shares sold | | 3,721,596 | | 4,616,517 |
| Reinvestment of distributions | | 4,490 | | 5,622 |
| Shares redeemed | | (3,798,768) | | (4,981,800) |
| Net increase (decrease) | | (72,682) | | (359,661) |
75 Semiannual Report
| Notes to Financial Statements (Unaudited) continued | | | | |
| (Amounts in thousands except ratios) | | | | | | |
| |
| |
| 7. Share Transactions - continued | | | | | | |
| |
| | | | | | | Six months ended | | Year ended |
| | | | | | | September 30, 2005 | | March 31, 2005 |
| Government Portfolio Class III | | | | | | | | |
| Shares sold | | | | | | 2,299,175 | | 4,264,565 |
| Reinvestment of distributions | | | | | | 4,502 | | 4,835 |
| Shares redeemed | | | | | | (1,798,463) | | (4,805,917) |
| Net increase (decrease) | | | | | | 505,214 | | (536,517) |
| Government Portfolio - Select Class | | | | | | |
| Shares sold | | | | | | 24,103 | | 112,420 |
| Reinvestment of distributions | | | | | | 188 | | 167 |
| Shares redeemed | | | | | | (36,359) | | (102,342) |
| Net increase (decrease) | | | | | | (12,068) | | 10,245 |
| Prime Money Market Portfolio | | Class I | | | | | | |
| Shares sold | | | | | | 39,648,419 | | 73,120,217 |
| Reinvestment of distributions | | | | | | 68,676 | | 67,152 |
| Shares redeemed | | | | | | (39,787,246) | | (71,181,838) |
| Net increase (decrease) | | | | | | (70,151) | | 2,005,531 |
| Prime Money Market Portfolio | | Class II | | | | | | |
| Shares sold | | | | | | 5,593,187 | | 5,186,383 |
| Reinvestment of distributions | | | | | | 11,447 | | 7,187 |
| Shares redeemed | | | | | | (5,294,377) | | (4,708,454) |
| Net increase (decrease) | | | | | | 310,257 | | 485,116 |
| Prime Money Market Portfolio | | Class III | | | | | | |
| Shares sold | | | | | | 8,246,373 | | 10,832,357 |
| Reinvestment of distributions | | | | | | 12,249 | | 12,177 |
| Shares redeemed | | | | | | (7,019,895) | | (10,618,552) |
| Net increase (decrease) | | | | | | 1,238,727 | | 225,982 |
| Prime Money Market Portfolio | | Select Class | | | | | | |
| Shares sold | | | | | | 121,076 | | 437,478 |
| Reinvestment of distributions | | | | | | 937 | | 828 |
| Shares redeemed | | | | | | (111,633) | | (446,148) |
| Net increase (decrease) | | | | | | 10,380 | | (7,842) |
| Money Market Portfolio Class I | | | | | | |
| Shares sold | | | | | | 45,956,621 | | 83,014,930 |
| Reinvestment of distributions | | | | | | 145,253 | | 162,686 |
| Shares redeemed | | | | | | (44,103,280) | | (90,627,460) |
| Net increase (decrease) | | | | | | 1,998,594 | | (7,449,844) |
| Money Market Portfolio Class II | | | | | | |
| Shares sold | | | | | | 1,220,176 | | 2,724,611 |
| Reinvestment of distributions | | | | | | 2,661 | | 2,901 |
| Shares redeemed | | | | | | (1,166,911) | | (2,819,596) |
| Net increase (decrease) | | | | | | 55,926 | | (92,084) |
| Money Market Portfolio Class III | | | | | | |
| Shares sold | | | | | | 6,730,609 | | 9,798,088 |
| Reinvestment of distributions | | | | | | 5,905 | | 4,956 |
| Shares redeemed | | | | | | (6,799,421) | | (9,333,022) |
| Net increase (decrease) | | | | | | (62,907) | | 470,022 |
| Money Market Portfolio Select Class | | | | | | |
| Shares sold | | | | | | 1,825,672 | | 2,376,845 |
| Reinvestment of distributions | | | | | | 232 | | 648 |
| Shares redeemed | | | | | | (1,324,765) | | (2,522,702) |
| Net increase (decrease) | | | | | | 501,139 | | (145,209) |
| 7. Share Transactions - continued | | | | |
| |
| | | Six months ended | | Year ended |
| | | September 30, 2005 | | March 31, 2005 |
| Tax Exempt Portfolio - Class I | | | | |
| Shares sold | | 13,544,857 | | 20,028,084 |
| Reinvestment of distributions | | 32,681 | | 33,465 |
| Shares redeemed | | (12,638,139) | | (20,063,770) |
| Net increase (decrease) | | 939,399 | | (2,221) |
| Tax Exempt Portfolio Class II | | | | |
| Shares sold | | 541,177 | | 800,247 |
| Reinvestment of distributions | | 1,390 | | 1,065 |
| Shares redeemed | | (520,865) | | (887,794) |
| Net increase (decrease) | | 21,702 | | (86,482) |
| Tax Exempt Portfolio Class III | | | | |
| Shares sold | | 924,887 | | 704,243 |
| Reinvestment of distributions | | 1,708 | | 1,123 |
| Shares redeemed | | (812,963) | | (693,982) |
| Net increase (decrease) | | 113,632 | | 11,384 |
| Tax Exempt Portfolio Select Class | | | | |
| Shares sold | | 721,374 | | 916,879 |
| Reinvestment of distributions | | 830 | | 490 |
| Shares redeemed | | (737,167) | | (907,772) |
| Net increase (decrease) | | (14,963) | | 9,597 |
77 Semiannual Report
Board Approval of Investment Advisory Contracts and Management Fees
FIMM Funds: Government Portfolio / Money Market Portfolio / Prime Money Market Portfolio / Tax-Exempt Portfolio / Treasury Portfolio / Treasury Only Portfolio
Each year, typically in June, the Board of Trustees, including the independent Trustees (together, the Board), votes on the renewal of the management contract and sub advisory agreements (together, the Advisory Contracts) for each fund. The Board, assisted by the advice of fund counsel and independent Trustees’ counsel, requests and considers a broad range of information throughout the year.
The Board meets regularly each month except August and takes into account throughout the year matters bearing on Advisory Contracts. The Board, acting directly and through its separate committees, considers at each of its meetings factors that are relevant to the annual renewal of each fund’s Advisory Contracts, including the services and support provided to each fund and its shareholders by Fidelity. At the time of the renewal, the Board had 11 standing committees, each composed of independent Trustees with varying backgrounds, to which the Board has assigned specific subject matter responsibilities in order to enhance effective decision making by the Board. Each committee has adopted a written charter outlining the structure and purposes of the committee. One such committee, the Fixed Income Contract Committee, meets periodically during the first six months of each year and as necessary to consider matters specifically related to the annual renewal of Advisory Contracts. The committee requests and receives information on, and makes recommendations to the independent Trustees concerning, the approval and annual review of the Advisory Contracts.
At its June 2005 meeting, the Board of Trustees, including the independent Trustees, unanimously determined to renew the Advisory Contracts for each fund. In reaching its determination, the Board considered all factors it believed relevant, including (1) the nature, extent, and quality of the services to be provided to each fund and its shareholders by Fidelity (including the investment performance of each fund); (2) the competitiveness of the man agement fee and total expenses of each fund; (3) the total costs of the services to be provided by and the profits to be realized by the investment adviser and its affiliates from the relationship with each fund; (4) the extent to which economies of scale would be realized as each fund grows; and (5) whether fee levels reflect these economies of scale, if any, for the benefit of fund shareholders.
In determining whether to renew the Advisory Contracts for each fund, the Board ultimately reached a determination, with the assistance of fund counsel and independent Trustees’ counsel, that the renewal of the Advisory Contracts and the compensation to be received by Fidelity under the management contracts is consistent with Fidelity’s fiduciary duty under applicable law. In addition to evaluating the specific factors noted above, the Board, in reaching its determination, is aware that shareholders in each fund have a broad range of investment choices available to them, including a wide choice among mutual funds offered by competitors to Fidelity, and that each fund’s shareholders, with the opportunity to review and weigh the disclosure provided by the fund in its prospectus and other public disclosures, have chosen to invest in that fund, managed by Fidelity.
Nature, Extent, and Quality of Services Provided by Fidelity. The Board considered staffing within the investment adviser, FMR, and the sub advisers (together, the Investment Advisers), including the backgrounds of the funds’ portfolio managers and the funds’ investment objectives and disciplines. The independent Trustees also had discussions with senior management of Fidelity’s investment operations and investment groups. The Board considered the structure of the portfolio manager compensation program and whether this structure provides appropriate incentives.
Fidelity Resources Dedicated to Investment Management and Support Services. The Board reviewed the size, education, and experience of the Invest ment Advisers’ investment staff, their use of technology, and the Investment Advisers’ approach to recruiting, training, and retaining portfolio managers and other research, advisory, and management personnel. The Board considered Fidelity’s extensive global research capabilities that enable the Investment Advisers to aggregate data from various sources in an effort to produce positive investment results. The Board noted that Fidelity’s analysts have access to a variety of technological tools that enable them to perform both fundamental and quantitative analysis and to specialize in various disciplines. The Board also considered that Fidelity’s portfolio managers and analysts have access to daily portfolio attribution that allows for monitor ing of a fund’s portfolio, as well as an electronic communication system that provides immediate real time access to research concerning issuers and credit enhancers.
Shareholder and Administrative Services. The Board considered the nature, extent, quality, and cost of administrative, distribution, and shareholder services performed by the Investment Advisers and their affiliates under the Advisory Contracts and under separate agreements covering transfer agency and pricing and bookkeeping services for each fund. The Board also considered the nature and extent of the Investment Advisers’ supervision of third party service providers, principally custodians and subcustodians. The Board also considered the resources devoted to, and the record of com pliance with, each fund’s compliance policies and procedures.
The Board noted that the growth of fund assets across the complex allows Fidelity to reinvest in the development of services designed to enhance the value or convenience of the Fidelity funds as investment vehicles. These services include 24 hour access to account information and market informa tion through phone representatives and over the Internet, and investor education materials and asset allocation tools.
Investment in a Large Fund Family. The Board considered the benefits to shareholders of investing in a Fidelity fund, including the benefits of investing in a fund that is part of a large family of funds offering a variety of investment disciplines and providing for a large variety of mutual fund investor services. For example, fund shareholders are offered the privilege of exchanging shares of a fund for shares of other Fidelity funds, as set forth in the fund’s prospectus, without paying a sales charge. The Board noted that, since the last Advisory Contract renewals in June 2004, Fidelity has taken a number of actions that benefited particular funds, including (i) voluntarily deciding in 2004 to stop using “soft” commission dollars to pay for market
data and, instead, to pay for that data out of its own resources, (ii) contractually agreeing to impose management fee reductions and expense limita tions on its five Spartan stock index funds and its stock index fund available through variable insurance products, (iii) contractually agreeing to eliminate the management fees on the Fidelity Freedom Funds and the Fidelity Advisor Freedom Funds, (iv) contractually agreeing to reduce the management fees on most of its investment grade taxable bond funds, and (v) contractually agreeing to impose expense limitations on its retail and Spartan investment grade taxable bond funds.
Investment Performance. The Board considered whether each fund has operated within its investment objective, as well as its record of compliance with its investment restrictions. It also reviewed each fund’s absolute investment performance for each class, as well as each fund’s relative investment performance for each class measured against a peer group of mutual funds deemed appropriate by the Board over multiple periods. For each fund, the following charts considered by the Board show, over the one , three , and five year periods ended December 31, 2004, the returns of Class III and Class I of the fund, and a range of returns of a peer group of mutual funds identified by Lipper Inc. as having an investment objective similar to that of the fund. The returns of Class III and Class I represent the performance of classes with the highest and lowest 12b 1 fees, respectively (not necessarily with the highest and lowest total expenses). The box within each chart shows the 25th percentile return (bottom of box) and the 75th percentile return (top of box) of the Lipper peer group. The percentage beaten numbers noted below each chart correspond to the percentile box and represent the percentage of funds in the Lipper peer group whose performance was equal to or lower than that of the class indicated.
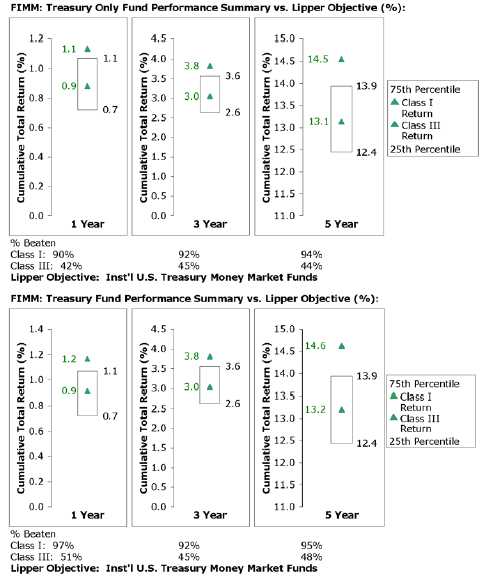
79 Semiannual Report
Board Approval of Investment Advisory Contracts and Management Fees - continued

Semiannual Report 80
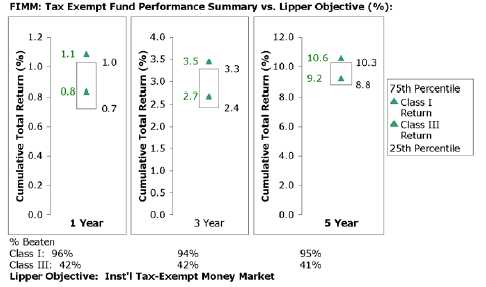
The Board noted that the relative investment performance of Class I of each fund has compared favorably to its Lipper peer group over time. The Board considered that the variations in performance among each fund’s classes reflect the variations in class expenses, which result in lower performance for higher expense classes.
Based on its review, and giving particular weight to the nature and quality of the resources dedicated by the Investment Advisers to maintain and improve relative performance, the Board concluded that the nature, extent, and quality of the services provided by Fidelity will benefit each fund’s shareholders, particularly in light of the Board’s view that each fund’s shareholders benefit from investing in a fund that is part of a large family of funds offering a variety of investment disciplines and services.
Competitiveness of Management Fee and Total Fund Expenses. The Board considered each fund’s management fee and total expenses compared to “mapped groups” of competitive funds and classes. Fidelity creates “mapped groups” by combining similar Lipper investment objective categories that have comparable management fee characteristics. Combining Lipper investment objective categories aids the Board’s management fee and total expense comparisons by broadening the competitive group used for comparison and by reducing the number of universes to which various Fidelity funds are compared.
The Board considered two proprietary management fee comparisons for the 12 month periods shown in the charts below. The group of Lipper funds used by the Board for management fee comparisons is referred to below as the “Total Mapped Group” and, for the reasons explained above, is broader than the Lipper peer group used by the Board for performance comparisons. The Total Mapped Group comparison focuses on a fund’s standing relative to the total universe of comparable funds available to investors, in terms of gross management fees before expense reimbursements or caps. “TMG %” represents the percentage of funds in the Total Mapped Group that had management fees that were lower than a fund’s. For example, a TMG % of 14% would mean that 86% of the funds in the Total Mapped Group had higher management fees than a fund. The “Asset Size Peer Group” (ASPG) compari son focuses on a fund’s standing relative to non Fidelity funds similar in size to the fund within the Total Mapped Group. The ASPG represents at least 15% of the funds in the Total Mapped Group with comparable asset size and management fee characteristics, subject to a minimum of 50 funds (or all funds in the Total Mapped Group if fewer than 50). Additional information, such as the ASPG quartile (“quadrant”) in which a fund’s management fee ranked, is also included in the charts and considered by the Board.
81 Semiannual Report
Board Approval of Investment Advisory Contracts and Management Fees - - continued
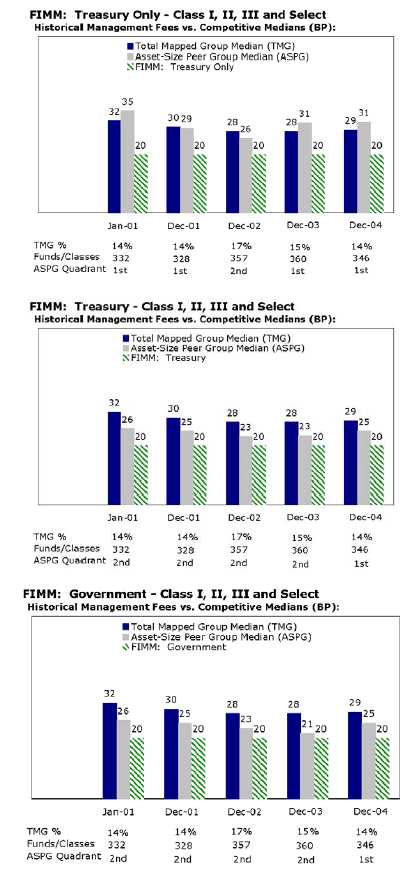
Semiannual Report 82
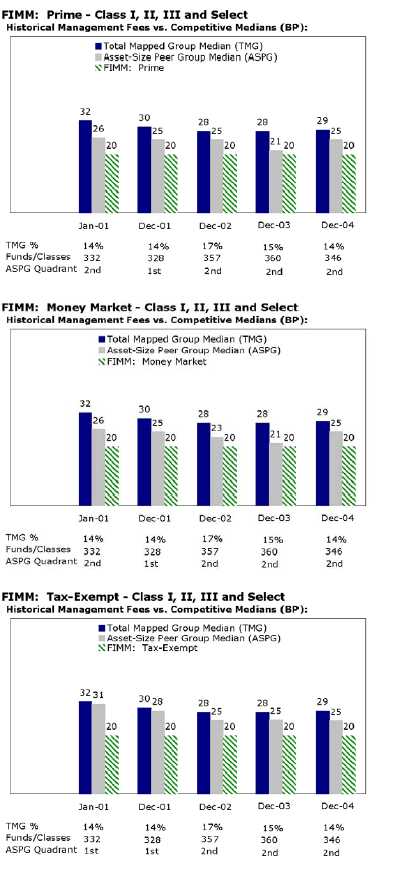
83 Semiannual Report
Board Approval of Investment Advisory Contracts and Management Fees - continued
The Board noted that each fund’s management fee ranked below the median of its Total Mapped Group and below the median of its ASPG for 2004. Based on its review, the Board concluded that each fund’s management fee was fair and reasonable in light of the services that the fund receives and the other factors considered.
In its review of the total expenses of each class of each fund, the Board considered the fund’s management fee as well as other fund or class expenses, as applicable, such as transfer agent fees, pricing and bookkeeping fees, fund paid 12b 1 fees, and custodial, legal, and audit fees. The Board also noted the effects of any waivers and reimbursements on fees and expenses. As part of its review, the Board also considered current and historical total expenses of each class of each fund compared to competitive fund median expenses. Each class of each fund is compared to those funds and classes in the Total Mapped Group (used by the Board for management fee comparisons) that have a similar sales load structure.
The Board noted that the total expenses of Class I, Class II, and Select Class of each fund ranked below its competitive median for 2004, and the total expenses of Class III of each fund ranked above its competitive median for 2004, except Class III of Money Market, which ranked equal to its competi tive median for 2004. The Board noted that each fund offers multiple classes, each of which has a different 12b 1 fee structure, and that the multiple structures are intended to offer a range of pricing options for the intermediary market. The Board also noted that the total expenses of the classes vary primarily by the level of their 12b 1 fees.
In its review of total expenses, the Board also considered Fidelity fee structures and other information on clients that FMR and its affiliates service in other competitive markets, such as other mutual funds advised or subadvised by FMR or its affiliates, pension plan clients, and other institutional clients.
Based on its review, the Board concluded that the total expenses for each class of each fund were reasonable, although in some cases above the median of the universe presented for comparison, in light of the services that the fund and its shareholders receive and the other factors considered.
Costs of the Services and Profitability. The Board considered the revenues earned and the expenses incurred by Fidelity in conducting the busi ness of developing, marketing, distributing, managing, administering and servicing each fund and its shareholders. The Board also considered the level of Fidelity’s profits in respect of all the Fidelity funds.
On an annual basis, FMR presents to the Board Fidelity’s profitability for each fund. Fidelity calculates the profitability for each fund, as well as aggre gate profitability for groups of Fidelity funds and all Fidelity funds, using a series of detailed revenue and cost allocation methodologies which originate with the audited books and records of Fidelity. The Audit Committee of the Board reviews any significant changes from the prior year’s methodologies.
PricewaterhouseCoopers LLP (PwC), independent registered accounting firm and auditor to Fidelity and certain Fidelity funds, has been engaged annually by the Board as part of the Board’s assessment of the results of Fidelity’s profitability analysis. PwC’s engagement includes the review and assessment of Fidelity’s methodologies used in determining the revenues and expenses attributable to Fidelity’s mutual fund business, and completion of agreed upon procedures surrounding the mathematical accuracy of fund profitability and its conformity to allocation methodologies. After consider ing PwC’s reports issued under the engagement and information provided by Fidelity, the Board believes that while other allocation methods may also be reasonable, Fidelity’s profitability methodologies are reasonable in all material respects.
The Board has also reviewed Fidelity’s non fund businesses and any fall out benefits related to the mutual fund business as well as cases where Fidelity’s affiliates may benefit from or be related to the funds’ business. In addition, a special committee of the Board reviewed services provided to Fidelity by its affiliates and determined that the fees that Fidelity paid for such services were reasonable.
The Board considered the costs of the services provided by and the profits realized by Fidelity in connection with the operation of each fund and determined that the amount of profit is a fair entrepreneurial profit for the management of each fund.
Economies of Scale. The Board considered whether there have been economies of scale in respect of the management of the Fidelity funds, whether the Fidelity funds (including each fund) have appropriately benefited from any such economies of scale, and whether there is potential for realization of any further economies of scale. The Board considered the extent to which each fund will benefit from economies of scale through increased services to the fund, through waivers or reimbursements, or through fee or expense reductions. The Board concluded that any potential economies of scale are being shared between fund shareholders and Fidelity in an appropriate manner.
Additional Information Requested by the Board. In order to develop fully the factual basis for consideration of the Advisory Contracts, the Board requested additional information regarding (i) Fidelity’s fund profitability methodology, including additional detail on various cost allocations; (ii) fall out benefits to Fidelity; and (iii) compensation of portfolio managers and research analysts.
Based on its evaluation of all of the conclusions noted above, and after considering all material factors, the Board ultimately concluded that the exist ing advisory fee structures are fair and reasonable, and that each fund’s existing Advisory Contracts should be renewed.
85 Semiannual Report
87 Semiannual Report
Investment Advisor
Fidelity Management & Research Company
Boston, MA
Investment Sub-Advisor
Fidelity Investments Money Management, Inc.
Fidelity International Investment Advisors
Fidelity International Investment Advisors
(U.K.) Limited
General Distributor
Fidelity Distributors Corporation
Boston, MA
Transfer and Service Agents
Fidelity Investments Institutional Operations Company, Inc.
Boston, MA
Fidelity Service Company, Inc.
Boston, MA
Treasury Only Portfolio, Treasury Portfolio,
Government Portfolio, Prime Money Market Portfolio
and Money Market Portfolio
Citibank, N.A.
New York, NY
Tax-Exempt Portfolio
Custodians
The Bank of New York
New York, NY
Treasury Only Portfolio, Treasury Portfolio,
Government Portfolio, Prime Money Market Portfolio
and Money Market Portfolio
Citibank, N.A.
New York, NY
Tax-Exempt Portfolio
|
FIMM-SANN-1105 416210.1.0
1.537280.108
|

Item 2. Code of Ethics
Not applicable.
Item 3. Audit Committee Financial Expert
Not applicable.
Item 4. Principal Accountant Fees and Services
Not applicable.
Item 5. Audit Committee of Listed Registrants
Not applicable.
Item 6. Schedule of Investments
Not applicable.
Item 7. Disclosure of Proxy Voting Policies and Procedures for Closed-End Management Investment Companies
Not applicable.
Item 8. Portfolio Managers of Closed-End Management Investment Companies
Not applicable.
Item 9. Purchase of Equity Securities by Closed-End Management Investment Company and Affiliated Purchasers
Not applicable.
Item 10. Submission of Matters to a Vote of Security Holders
There were no material changes to the procedures by which shareholders may recommend nominees to the Colchester Street Trust's Board of Trustees.
Item 11. Controls and Procedures
(a)(i) The President and Treasurer and the Chief Financial Officer have concluded that the Colchester Street Trust's (the "Trust") disclosure controls and procedures (as defined in Rule 30a-3(c) under the Investment Company Act) provide reasonable assurances that material information relating to the Trust is made known to them by the appropriate persons, based on their evaluation of these controls and procedures as of a date within 90 days of the filing date of this report.
(a)(ii) There was no change in the Trust's internal control over financial reporting (as defined in Rule 30a-3(d) under the Investment Company Act) that occurred during the second fiscal quarter of the period covered by this report that has materially affected, or is reasonably likely to materially affect, the Trust's internal control over financial reporting.
Item 12. Exhibits
(a) | (1) | Not applicable. |
(a) | (2) | Certification pursuant to Rule 30a-2(a) under the Investment Company Act of 1940 (17 CFR 270.30a-2(a)) is filed and attached hereto as Exhibit 99.CERT. |
(a) | (3) | Not applicable. |
(b) | | Certification pursuant to Rule 30a-2(b) under the Investment Company Act of 1940 (17 CFR 270.30a-2(b)) is furnished and attached hereto as Exhibit 99.906CERT. |
SIGNATURES
Pursuant to the requirements of the Securities Exchange Act of 1934 and the Investment Company Act of 1940, the registrant has duly caused this report to be signed on its behalf by the undersigned, thereunto duly authorized.
Colchester Street Trust
By: | /s/Christine Reynolds |
| Christine Reynolds |
| President and Treasurer |
| |
Date: | November 18, 2005 |
Pursuant to the requirements of the Securities Exchange Act of 1934 and the Investment Company Act of 1940, this report has been signed below by the following persons on behalf of the registrant and in the capacities and on the dates indicated.
By: | /s/Christine Reynolds |
| Christine Reynolds |
| President and Treasurer |
| |
Date: | November 18, 2005 |
By: | /s/Paul M. Murphy |
| Paul M. Murphy |
| Chief Financial Officer |
| |
Date: | November 18, 2005 |