UNITED STATES
SECURITIES AND EXCHANGE COMMISSION
Washington, D.C. 20549
FORM N-CSR
CERTIFIED SHAREHOLDER REPORT OF REGISTERED
MANAGEMENT INVESTMENT COMPANIES
Investment Company Act file number 811-3320
Fidelity Colchester Street Trust
(Exact name of registrant as specified in charter)
82 Devonshire St., Boston, Massachusetts 02109
(Address of principal executive offices) (Zip code)
Eric D. Roiter, Secretary
82 Devonshire St.
Boston, Massachusetts 02109
(Name and address of agent for service)
Registrant's telephone number, including area code: 617-563-7000
Date of fiscal year end: | March 31 |
| |
Date of reporting period: | March 31, 2006 |
Item 1. Reports to Stockholders
Fidelity®
Institutional
Money Market
Funds
|
Annual Report
March 31, 2006
|


| Contents | | |
| |
| Fidelity Institutional Money Market Funds | | |
| Shareholder Expense Example | | 3 |
| Investment Changes, Schedules of Investments & Financial Statements | | |
| Treasury Only Portfolio | | 6 |
| Treasury Portfolio | | 12 |
| Government Portfolio | | 18 |
| Prime Money Market Portfolio | | 24 |
| Money Market Portfolio | | 34 |
| Tax Exempt Portfolio | | 44 |
| Notes to Financial Statements | | 72 |
| Report of Independent Registered Public Accounting Firm | | 81 |
| Trustees and Officers | | 82 |
| Distributions | | 88 |
| Board Approval of Investment Advisory Contracts and Management Fees | | 89 |
| | Fund Goals:
Treasury Only Portfolio, Treasury Portfolio, Government Portfolio, Prime Money Market Portfolio, and Money Market Portfolio seek to
obtain as high a level of current income as is consistent with the preservation of principal and liquidity within the limitations prescribed for
the fund.
Tax Exempt Portfolio seeks to obtain as high a level of interest income exempt from federal income tax as is consistent with liquidity and
stability of principal.
To view a fund’s proxy voting guidelines and proxy voting record for the 12 month period ended June 30, visit www.fidelity.com/proxyvotingresults or visit the
Securities and Exchange Commission’s (SEC) website at www.sec.gov. You may also call 1-877-208-0098 to request a free copy of the proxy voting guidelines.
Standard & Poor’s, S&P and S&P 500 are registered service marks of The McGraw Hill Companies, Inc. and have been licensed for use by
Fidelity Distributors Corporation.
Other third party marks appearing herein are the property of their respective owners.
All other marks appearing herein are registered or unregistered trademarks or service marks of FMR Corp. or an affiliated company.
|
| | Investments in the funds are neither insured nor guaranteed by the U.S. Government, and there can be no assurance that the funds will maintain a stable
$1.00 share price.
This report and the financial statements contained herein are submitted for the general information of the shareholders of the funds. This report is not
authorized for distribution to prospective investors in the funds unless preceded or accompanied by an effective prospectus.
A fund files its complete schedule of portfolio holdings with the SEC for the first and third quarters of each fiscal year on Form N Q. Forms N Q are available
on the SEC’s web site at http://www.sec.gov. A fund’s Forms N Q may be reviewed and copied at the SEC’s Public Reference Room in Washington, DC. Informa
tion regarding the operation of the SEC’s Public Reference Room may be obtained by calling 1-800-SEC-0330. For a complete list of a fund’s portfolio hold-
ings, view the most recent quarterly holdings report, semiannual report, or annual report on Fidelity’s web site at http://www.advisor.fidelity.com.
NOT FDIC INSURED · MAY LOSE VALUE · NO BANK GUARANTEE
Neither the funds nor Fidelity Distributors Corporation is a bank.
|
Shareholder Expense Example
|
As a shareholder of a Fund, you incur two types of costs: (1) transaction costs, and (2) ongoing costs, including management fees, distribution and/or service (12b 1) fees and other Fund expenses. This Example is intended to help you understand your ongoing costs (in dollars) of investing in the Funds and to compare these costs with the ongoing costs of investing in other mutual funds.
The Example is based on an investment of $1,000 invested at the beginning of the period and held for the entire period (October 1, 2005 to March 31, 2006).
The first line of the table below for each class of each fund provides information about actual account values and actual expenses. You may use the information in this line, together with the amount you invested, to estimate the expenses that you paid over the period. Simply divide your account value by $1,000.00 (for example, an $8,600 account value divided by $1,000.00 = 8.6), then multiply the result by the number in the first line for a class of the fund under the heading entitled “Expenses Paid During Period” to estimate the expenses you paid on your account during this period. A small balance maintenance fee of $12.00 that is charged once a year may apply for certain accounts with a value of less than $2,000. This fee is not included in the table below. If it was, the estimate of expenses you paid during the period would be higher, and your ending account value lower, by this amount.
Hypothetical Example for Comparison Purposes
|
The second line of the table below for each class of each fund provides information about hypothetical account values and hypothetical expenses based on a Class’ actual expense ratio and an assumed rate of return of 5% per year before expenses, which is not the Class’ actual return. The hypothetical account values and expenses may not be used to estimate the actual ending account balance or expenses you paid for the period. You may use this information to compare the ongoing costs of investing in the Fund and other funds. To do so, compare this 5% hypothetical example with the 5% hypothetical examples that appear in the shareholder reports of the other funds. A small balance maintenance fee of $12.00 that is charged once a year may apply for certain accounts with a value of less than $2,000. This fee is not included in the table below. If it was, the estimate of expenses you paid during the period would be higher, and your ending account value lower, by this amount.
Please note that the expenses shown in the table are meant to highlight your ongoing costs only and do not reflect any transaction costs. Therefore, the second line of the table is useful in comparing ongoing costs only, and will not help you determine the relative total costs of owning different funds.
| | | | | | | | | Expenses Paid |
| | | Beginning | | Ending | | During Period* |
| | | Account Value | | Account Value | | October 1, 2005 |
| | | October 1, 2005 | | March 31, 2006 | | to March 31, 2006 |
| Treasury Only Portfolio | | | | | | | | | | |
| Class I | | | | | | | | | | |
| Actual | | $ 1,000.00 | | | | $ 1,018.90 | | | | $ 1.01 |
| HypotheticalA | | $ 1,000.00 | | | | $ 1,023.93 | | | | $ 1.01 |
| Class II | | | | | | | | | | |
| Actual | | $ 1,000.00 | | | | $ 1,018.20 | | | | $ 1.76 |
| HypotheticalA | | $ 1,000.00 | | | | $ 1,023.19 | | | | $ 1.77 |
| Class III | | | | | | | | | | |
| Actual | | $ 1,000.00 | | | | $ 1,017.70 | | | | $ 2.26 |
| HypotheticalA | | $ 1,000.00 | | | | $ 1,022.69 | | | | $ 2.27 |
| Select Class | | | | | | | | | | |
| Actual | | $ 1,000.00 | | | | $ 1,018.70 | | | | $ 1.26 |
| HypotheticalA | | $ 1,000.00 | | | | $ 1,023.68 | | | | $ 1.26 |
| Treasury Portfolio | | | | | | | | | | |
| Class I | | | | | | | | | | |
| Actual | | $ 1,000.00 | | | | $ 1,020.10 | | | | $ 1.01 |
| HypotheticalA | | $ 1,000.00 | | | | $ 1,023.93 | | | | $ 1.01 |
| Class II | | | | | | | | | | |
| Actual | | $ 1,000.00 | | | | $ 1,019.40 | | | | $ 1.76 |
| HypotheticalA | | $ 1,000.00 | | | | $ 1,023.19 | | | | $ 1.77 |
| Class III | | | | | | | | | | |
| Actual | | $ 1,000.00 | | | | $ 1,018.80 | | | | $ 2.26 |
| HypotheticalA | | $ 1,000.00 | | | | $ 1,022.69 | | | | $ 2.27 |
| Select Class | | | | | | | | | | |
| Actual | | $ 1,000.00 | | | | $ 1,019.90 | | | | $ 1.26 |
| HypotheticalA | | $ 1,000.00 | | | | $ 1,023.68 | | | | $ 1.26 |
33 Annual Report
| Shareholder Expense Example continued | | | | | | | | | | | | |
| |
| |
| | | | | | | | | | | | | Expenses Paid |
| | | | | Beginning | | Ending | | During Period* |
| | | | | Account Value | | Account Value | | October 1, 2005 |
| | | | | October 1, 2005 | | March 31, 2006 | | to March 31, 2006 |
| Government Portfolio | | | | | | | | | | | | | | |
| Class I | | | | | | | | | | | | | | |
| Actual | | | | | | $ 1,000.00 | | | | $ 1,020.50 | | | | $ 1.01 |
| HypotheticalA | | | | | | $ 1,000.00 | | | | $ 1,023.93 | | | | $ 1.01 |
| Class II | | | | | | | | | | | | | | |
| Actual | | | | | | $ 1,000.00 | | | | $ 1,019.70 | | | | $ 1.76 |
| HypotheticalA | | | | | | $ 1,000.00 | | | | $ 1,023.19 | | | | $ 1.77 |
| Class III | | | | | | | | | | | | | | |
| Actual | | | | | | $ 1,000.00 | | | | $ 1,019.20 | | | | $ 2.27 |
| HypotheticalA | | | | | | $ 1,000.00 | | | | $ 1,022.69 | | | | $ 2.27 |
| Select Class | | | | | | | | | | | | | | |
| Actual | | | | | | $ 1,000.00 | | | | $ 1,020.20 | | | | $ 1.26 |
| HypotheticalA | | | | | | $ 1,000.00 | | | | $ 1,023.68 | | | | $ 1.26 |
| Prime Money Market Portfolio | | | | | | | | | | | | | | |
| Class I | | | | | | | | | | | | | | |
| Actual | | | | | | $ 1,000.00 | | | | $ 1,020.80 | | | | $ 1.01 |
| HypotheticalA | | | | | | $ 1,000.00 | | | | $ 1,023.93 | | | | $ 1.01 |
| Class II | | | | | | | | | | | | | | |
| Actual | | | | | | $ 1,000.00 | | | | $ 1,020.00 | | | | $ 1.76 |
| HypotheticalA | | | | | | $ 1,000.00 | | | | $ 1,023.19 | | | | $ 1.77 |
| Class III | | | | | | | | | | | | | | |
| Actual | | | | | | $ 1,000.00 | | | | $ 1,019.50 | | | | $ 2.27 |
| HypotheticalA | | | | | | $ 1,000.00 | | | | $ 1,022.69 | | | | $ 2.27 |
| Select Class | | | | | | | | | | | | | | |
| Actual | | | | | | $ 1,000.00 | | | | $ 1,020.50 | | | | $ 1.26 |
| HypotheticalA | | | | | | $ 1,000.00 | | | | $ 1,023.68 | | | | $ 1.26 |
| Money Market Portfolio | | | | | | | | | | | | | | |
| Class I | | | | | | | | | | | | | | |
| Actual | | | | | | $ 1,000.00 | | | | $ 1,020.90 | | | | $ .91 |
| HypotheticalA | | | | | | $ 1,000.00 | | | | $ 1,024.03 | | | | $ .91 |
| Class II | | | | | | | | | | | | | | |
| Actual | | | | | | $ 1,000.00 | | | | $ 1,020.10 | | | | $ 1.66 |
| HypotheticalA | | | | | | $ 1,000.00 | | | | $ 1,023.29 | | | | $ 1.66 |
| Class III | | | | | | | | | | | | | | |
| Actual | | | | | | $ 1,000.00 | | | | $ 1,019.60 | | | | $ 2.17 |
| HypotheticalA | | | | | | $ 1,000.00 | | | | $ 1,022.79 | | | | $ 2.17 |
| Select Class | | | | | | | | | | | | | | |
| Actual | | | | | | $ 1,000.00 | | | | $ 1,020.60 | | | | $ 1.16 |
| HypotheticalA | | | | | | $ 1,000.00 | | | | $ 1,023.78 | | | | $ 1.16 |
| Tax Exempt Portfolio | | | | | | | | | | | | | | |
| Class I | | | | | | | | | | | | | | |
| Actual | | | | | | $ 1,000.00 | | | | $ 1,014.10 | | | | $ 1.00 |
| HypotheticalA | | | | | | $ 1,000.00 | | | | $ 1,023.93 | | | | $ 1.01 |
| Class II | | | | | | | | | | | | | | |
| Actual | | | | | | $ 1,000.00 | | | | $ 1,013.40 | | | | $ 1.76 |
| HypotheticalA | | | | | | $ 1,000.00 | | | | $ 1,023.19 | | | | $ 1.77 |
| Class III | | | | | | | | | | | | | | |
| Actual | | | | | | $ 1,000.00 | | | | $ 1,012.80 | | | | $ 2.26 |
| HypotheticalA | | | | | | $ 1,000.00 | | | | $ 1,022.69 | | | | $ 2.27 |
| Select Class | | | | | | | | | | | | | | |
| Actual | | | | | | $ 1,000.00 | | | | $ 1,013.90 | | | | $ 1.26 |
| HypotheticalA | | | | | | $ 1,000.00 | | | | $ 1,023.68 | | | | $ 1.26 |
| |
| A 5% return per year before expenses | | | | | | | | | | | | | | |
* Expenses are equal to each Class’ annualized expense ratio (shown in the table below); multiplied by the average account value over the period, multiplied by 182/365 (to reflect the one half year period).
| | | Annualized |
| | | Expense Ratio |
| Treasury Only Portfolio | | |
| Class I | | 20% |
| Class II | | 35% |
| Class III | | 45% |
| Select Class | | 25% |
| Treasury Portfolio | | |
| Class I | | 20% |
| Class II | | 35% |
| Class III | | 45% |
| Select Class | | 25% |
| Government Portfolio | | |
| Class I | | 20% |
| Class II | | 35% |
| Class III | | 45% |
| Select Class | | 25% |
| Prime Money Market Portfolio | | |
| Class I | | 20% |
| Class II | | 35% |
| Class III | | 45% |
| Select Class | | 25% |
| Money Market Portfolio | | |
| Class I | | 18% |
| Class II | | 33% |
| Class III | | 43% |
| Select Class | | 23% |
| Tax Exempt Portfolio | | |
| Class I | | 20% |
| Class II | | 35% |
| Class III | | 45% |
| Select Class | | 25% |
55 Annual Report
| Treasury Only Portfolio | | | | | | |
| Investment Changes | | | | | | |
| |
| Maturity Diversification | | | | | | |
| Days | | % of fund’s | | % of fund’s | | % of fund’s |
| | | investments | | investments | | investments |
| | | 3/31/06 | | 9/30/05 | | 3/31/05 |
| 0 – 30 | | 28.2 | | 9.2 | | 38.9 |
| 31 – 90 | | 66.4 | | 83.4 | | 52.2 |
| 91 – 180 | | 5.4 | | 7.4 | | 8.9 |
Weighted Average Maturity | | | | | | |
| | | 3/31/06 | | 9/30/05 | | 3/31/05 |
| Treasury Only Portfolio | | 51 Days | | 50 Days | | 45 Days |
| All Taxable Money Market Funds Average* | | 38 Days | | 38 Days | | 38 Days |
*Source: iMoneyNet, Inc.
Annual Report 6
| Treasury Only Portfolio | | | | | | | | |
| Investments March 31, 2006 |
| Showing Percentage of Net Assets | | | | | | |
| |
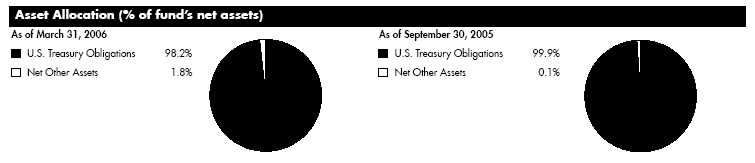
| U.S. Treasury Obligations 98.2% | | | | |
| Due | | Annualized Yield at | | Principal | | | | Value (Note 1) |
| Date | | Time of Purchase | | Amount (000s) | | | | (000s) |
| U.S. Treasury Bills – 74.5% | | | | | | | | | | |
| 4/6/06 | | 4.37% | | | | $ 28,084 | | | | $ 28,067 |
| 4/6/06 | | 4.38 | | | | 30,000 | | | | 29,982 |
| 4/6/06 | | 4.43 | | | | 44,000 | | | | 43,973 |
| 4/13/06 | | 4.42 | | | | 12,031 | | | | 12,004 |
| 4/13/06 | | 4.43 | | | | 26,000 | | | | 25,962 |
| 4/13/06 | | 4.59 | | | | 40,000 | | | | 39,939 |
| 4/13/06 | | 4.61 | | | | 5,105 | | | | 5,097 |
| 4/17/06 | | 4.69 | | | | 40,000 | | | | 39,927 |
| 4/20/06 | | 4.59 | | | | 10,356 | | | | 10,331 |
| 4/20/06 | | 4.61 | | | | 2,666 | | | | 2,660 |
| 4/27/06 | | 4.58 | | | | 17,817 | | | | 17,756 |
| 4/27/06 | | 4.64 | | | | 69,500 | | | | 69,268 |
| 4/27/06 | | 4.65 | | | | 37,500 | | | | 37,375 |
| 5/11/06 | | 4.44 | | | | 45,000 | | | | 44,781 |
| 5/18/06 | | 4.49 | | | | 110,770 | | | | 110,128 |
| 5/25/06 | | 4.51 | | | | 87,000 | | | | 86,419 |
| 6/8/06 | | 4.54 | | | | 60,000 | | | | 59,490 |
| 6/8/06 | | 4.56 | | | | 65,000 | | | | 64,446 |
| 6/15/06 | | 4.58 | | | | 50,000 | | | | 49,529 |
| 6/22/06 | | 4.60 | | | | 100,000 | | | | 98,964 |
| 6/29/06 | | 4.55 | | | | 40,000 | | | | 39,555 |
| 7/27/06 | | 4.45 | | | | 12,000 | | | | 11,830 |
| 8/3/06 | | 4.50 | | | | 24,670 | | | | 24,296 |
| 8/17/06 | | 4.66 | | | | 24,000 | | | | 23,581 |
| | | | | | | | | | | 975,360 |
| U.S. Treasury Notes – 23.7% | | | | | | | | |
| 5/15/06 | | 4.43 | | | | 132,429 | | | | 132,453 |
| 5/15/06 | | 4.59 | | | | 72,000 | | | | 71,773 |
| 5/31/06 | | 4.45 | | | | 52,500 | | | | 52,332 |
| 5/31/06 | | 4.66 | | | | 44,000 | | | | 43,842 |
| 6/30/06 | | 4.27 | | | | 10,000 | | | | 9,963 |
| | | | | | | | | | | 310,363 |
| |
| |
| TOTAL INVESTMENT PORTFOLIO 98.2% | | | | |
| (Cost $1,285,723) | | | | | | | | 1,285,723 |
| |
| NET OTHER ASSETS 1.8% | | | | | | | | 23,183 |
| NET ASSETS 100% | | | | | | | | $ 1,308,906 |
Income Tax Information
At March 31, 2006, the fund had a capital loss carryforward of approximately $433,000 of which $47,000, $142,000, $184,000 and $60,000 will expire on March 31, 2011, 2012, 2013 and 2014, respectively.
See accompanying notes which are an integral part of the financial statements.
7 Annual Report
| Treasury Only Portfolio | | | | |
| |
| Financial Statements | | | | |
| |
| |
| Statement of Assets and Liabilities | | |
| Amounts in thousands (except per share amounts) | | March 31, 2006 |
| |
| Assets | | | | |
| Investment in securities, at value — | | | | |
| See accompanying schedule: | | | | |
| Unaffiliated issuers | | | | |
| (cost $1,285,723) | | | | $ 1,285,723 |
| Receivable for investments sold | | | | 39,949 |
| Receivable for fund shares sold | | | | 21,976 |
| Interest receivable | | | | 3,742 |
| Prepaid expenses | | | | 4 |
| Receivable from investment adviser | | | | |
| for expense reductions | | | | 36 |
| Total assets | | | | 1,351,430 |
| |
| Liabilities | | | | |
| Payable for investments purchased | | $ 39,927 | | |
| Payable for fund shares redeemed | | 401 | | |
| Distributions payable | | 1,887 | | |
| Accrued management fee | | 203 | | |
| Distribution fees payable | | 44 | | |
| Other affiliated payables | | 31 | | |
| Other payables and accrued | | | | |
| expenses | | 31 | | |
| Total liabilities | | | | 42,524 |
| |
| Net Assets | | | | $ 1,308,906 |
| Net Assets consist of: | | | | |
| Paid in capital | | | | $ 1,309,229 |
| Undistributed net investment income . | | | | 7 |
| Accumulated undistributed net | | | | |
| realized gain (loss) on investments | | | | (330) |
| Net Assets | | | | $ 1,308,906 |
| Class I: | | | | |
| Net Asset Value, offering price and | | | | |
| redemption price per share | | | | |
| ($1,054,985 ÷ 1,054,957 | | | | |
| shares) | | | | $ 1.00 |
| Class II: | | | | |
| Net Asset Value, offering price and | | | | |
| redemption price per share | | | | |
| ($101,507 ÷ 101,531 shares) | | | | $ 1.00 |
| Class III: | | | | |
| Net Asset Value, offering price and | | | | |
| redemption price per share | | | | |
| ($119,600 ÷ 119,591 shares) | | | | $ 1.00 |
| Select Class: | | | | |
| Net Asset Value, offering price and | | | | |
| redemption price per share | | | | |
| ($32,814 ÷ 32,818 shares) | | | | $ 1.00 |
| Statement of Operations | | | | | | |
| Amounts in thousands | | | | Year ended March 31, 2006 |
| |
| Investment Income | | | | | | |
| Interest | | | | | | $ 40,912 |
| |
| Expenses | | | | | | |
| Management fee | | | | $ 2,334 | | |
| Transfer agent fees | | | | 208 | | |
| Distribution fees | | | | 600 | | |
| Accounting fees and expenses | | | | 138 | | |
| Independent trustees’ compensation | | . | | 5 | | |
| Custodian fees and expenses | | | | 20 | | |
| Registration fees | | | | 57 | | |
| Audit | | | | 40 | | |
| Legal | | | | 3 | | |
| Miscellaneous | | | | 14 | | |
| Total expenses before reductions | | | | 3,419 | | |
| Expense reductions | | | | (493) | | 2,926 |
| |
| Net investment income | | | | | | 37,986 |
| Realized and Unrealized Gain (Loss) | | | | | | |
| Net realized gain (loss) on: | | | | | | |
| Investment securities: | | | | | | |
| Unaffiliated issuers | | | | | | (8) |
| Net increase in net assets resulting | | | | | | |
| from operations | | | | | | $ 37,978 |
See accompanying notes which are an integral part of the financial statements.
Annual Report 8
| Statement of Changes in Net Assets | | | | | | | | | | | | | | | | | | |
| | | | | | | | | | | | | Year ended | | | | Year ended |
| | | | | | | | | | | | | March 31, | | | | March 31, |
| Amounts in thousands | | | | | | | | | | | | 2006 | | | | 2005 |
| Increase (Decrease) in Net Assets | | | | | | | | | | | | | | | | | | |
| Operations | | | | | | | | | | | | | | | | | | |
| Net investment income | | | | | | | | | | | | | | $ 37,986 | | | | $ 15,996 |
| Net realized gain (loss) | | | | | | | | | | | | | | (8) | | | | (242) |
| Net increase in net assets resulting from operations | | | | | | | | | | | | | | 37,978 | | | | 15,754 |
| Distributions to shareholders from net investment income | | | | | | | | | | | | | | (37,981) | | | | (16,000) |
| Distributions to shareholders from net realized gain | | | | | | | | | | | | | | — | | | | (110) |
| Total distributions | | | | | | | | | | | | | | (37,981) | | | | (16,110) |
| Share transactions - net increase (decrease) | | | | | | | | | | | | | | 205,080 | | | | (128,690) |
| Total increase (decrease) in net assets | | | | | | | | | | | | | | 205,077 | | | | (129,046) |
| |
| Net Assets | | | | | | | | | | | | | | | | | | |
| Beginning of period | | | | | | | | | | | | | | 1,103,829 | | | | 1,232,875 |
| End of period (including undistributed net investment income of $7 and distributions in excess of net investment income | | | | | | | | | | | | | | | | | | | | |
| of $6, respectively) | | | | | | | | | | | | | | $ 1,308,906 | | | | $ 1,103,829 |
| |
| Financial Highlights Class I | | | | | | | | | | | | | | | | | | |
| Years ended March 31, | | 2006 | | | | 2005 | | | | 2004 | | | | 2003 | | | | 2002 |
| Selected Per-Share Data | | | | | | | | | | | | | | | | | | |
| Net asset value, beginning of period | | $ 1.00 | | | | $ 1.00 | | | | $ 1.00 | | | | $ 1.00 | | | | $ 1.00 |
| Income from Investment Operations | | | | | | | | | | | | | | | | | | |
| Net investment income | | 033 | | | | .014 | | | | .009 | | | | .015 | | | | .031 |
| Net realized and unrealized gain (loss)C | | — | | | | — | | | | — | | | | — | | | | — |
| Total from investment operations | | 033 | | | | .014 | | | | .009 | | | | .015 | | | | .031 |
| Distributions from net investment income | | (.033) | | | | (.014) | | | | (.009) | | | | (.015) | | | | (.031) |
| Distributions from net realized gain | | — | | | | —C | | | | — | | | | — | | | | — |
| Total distributions | | (.033) | | | | (.014) | | | | (.009) | | | | (.015) | | | | (.031) |
| Net asset value, end of period | | $ 1.00 | | | | $ 1.00 | | | | $ 1.00 | | | | $ 1.00 | | | | $ 1.00 |
| Total ReturnA | | 3.33% | | | | 1.45% | | | | .89% | | | | 1.50% | | | | | | 3.14% |
| Ratios to Average Net AssetsB | | | | | | | | | | | | | | | | | | |
| Expenses before reductions | | 24% | | | | .24% | | | | .24% | | | | .24% | | | | | | .24% |
| Expenses net of fee waivers, if any | | 20% | | | | .20% | | | | .20% | | | | .20% | | | | | | .20% |
| Expenses net of all reductions | | 20% | | | | .20% | | | | .20% | | | | .20% | | | | | | .20% |
| Net investment income | | 3.30% | | | | 1.43% | | | | .89% | | | | 1.48% | | | | | | 3.00% |
| Supplemental Data | | | | | | | | | | | | | | | | | | |
| Net assets, end of period (in millions) | | $ 1,055 | | | | $ 835 | | | | $ 982 | | | | $ 1,175 | | | | $ 1,199 |
A Total returns would have been lower had certain expenses not been reduced during the periods shown.
B Expense ratios reflect operating expenses of the class. Expenses before reductions do not reflect amounts reimbursed by the investment adviser or expense offset arrangements and do not represent the amount paid by the class during periods when reimburse
ments or reductions occur. Expenses net of fee waivers reflect expenses after reimbursement by the investment adviser but prior to reductions from expense offset arrangements. Expenses net of all reductions represent the net expenses paid by the class.
C Amount represents less than $.001 per share.
|
See accompanying notes which are an integral part of the financial statements.
|
9 Annual Report
| Financial Highlights Class II | | | | | | | | | | | | | | | | | | |
| Years ended March 31, | | 2006 | | | | 2005 | | | | 2004 | | | | 2003 | | | | 2002 |
| Selected Per-Share Data | | | | | | | | | | | | | | | | | | |
| Net asset value, beginning of period | | $ 1.00 | | | | $ 1.00 | | | | $ 1.00 | | | | $ 1.00 | | | | $ 1.00 |
| Income from Investment Operations | | | | | | | | | | | | | | | | | | |
| Net investment income | | 031 | | | | .013 | | | | .007 | | | | .013 | | | | .029 |
| Net realized and unrealized gain (loss)C | | — | | | | — | | | | — | | | | — | | | | — |
| Total from investment operations | | 031 | | | | .013 | | | | .007 | | | | .013 | | | | .029 |
| Distributions from net investment income | | (.031) | | | | (.013) | | | | (.007) | | | | (.013) | | | | (.029) |
| Distributions from net realized gain | | — | | | | —C | | | | — | | | | — | | | | — |
| Total distributions | | (.031) | | | | (.013) | | | | (.007) | | | | (.013) | | | | (.029) |
| Net asset value, end of period | | $ 1.00 | | | | $ 1.00 | | | | $ 1.00 | | | | $ 1.00 | | | | $ 1.00 |
| Total ReturnA | | 3.18% | | | | 1.30% | | | | .74% | | | | 1.34% | | | | 2.98% |
| Ratios to Average Net AssetsB | | | | | | | | | | | | | | | | | | |
| Expenses before reductions | | 39% | | | | .39% | | | | .39% | | | | .39% | | | | .39% |
| Expenses net of fee waivers, if any | | 35% | | | | .35% | | | | .35% | | | | .35% | | | | .35% |
| Expenses net of all reductions | | 35% | | | | .35% | | | | .35% | | | | .35% | | | | .35% |
| Net investment income | | 3.15% | | | | 1.28% | | | | .74% | | | | 1.33% | | | | 2.82% |
| Supplemental Data | | | | | | | | | | | | | | | | | | |
| Net assets, end of period (in millions) | | $ 102 | | | | $ 121 | | | | $ 119 | | | | $ 225 | | | | $ 187 |
A Total returns would have been lower had certain expenses not been reduced during the periods shown.
B Expense ratios reflect operating expenses of the class. Expenses before reductions do not reflect amounts reimbursed by the investment adviser or expense offset arrangements and do not represent the amount paid by the class during periods when
reimbursements or reductions occur. Expenses net of fee waivers reflect expenses after reimbursement by the investment adviser but prior to reductions from expense offset arrangements. Expenses net of all reductions represent the net expenses
paid by the class.
C Amount represents less than $.001 per share.
|
| Financial Highlights Class III | | | | | | | | | | | | | | | | | | |
| Years ended March 31, | | 2006 | | | | 2005 | | | | 2004 | | | | 2003 | | | | 2002 |
| Selected Per-Share Data | | | | | | | | | | | | | | | | | | |
| Net asset value, beginning of period | | $ 1.00 | | | | $ 1.00 | | | | $ 1.00 | | | | $ 1.00 | | | | $ 1.00 |
| Income from Investment Operations | | | | | | | | | | | | | | | | | | |
| Net investment income | | 030 | | | | .012 | | | | .006 | | | | .012 | | | | .028 |
| Net realized and unrealized gain (loss)C | | — | | | | — | | | | — | | | | — | | | | — |
| Total from investment operations | | 030 | | | | .012 | | | | .006 | | | | .012 | | | | .028 |
| Distributions from net investment income | | (.030) | | | | (.012) | | | | (.006) | | | | (.012) | | | | (.028) |
| Distributions from net realized gain | | — | | | | —C | | | | — | | | | — | | | | — |
| Total distributions | | (.030) | | | | (.012) | | | | (.006) | | | | (.012) | | | | (.028) |
| Net asset value, end of period | | $ 1.00 | | | | $ 1.00 | | | | $ 1.00 | | | | $ 1.00 | | | | $ 1.00 |
| Total ReturnA | | 3.07% | | | | 1.20% | | | | .64% | | | | 1.25% | | | | 2.88% |
| Ratios to Average Net AssetsB | | | | | | | | | | | | | | | | | | |
| Expenses before reductions | | 49% | | | | .49% | | | | .49% | | | | .49% | | | | .49% |
| Expenses net of fee waivers, if any | | 45% | | | | .45% | | | | .45% | | | | .45% | | | | .45% |
| Expenses net of all reductions | | 45% | | | | .45% | | | | .45% | | | | .45% | | | | .45% |
| Net investment income | | 3.05% | | | | 1.18% | | | | .64% | | | | 1.23% | | | | 2.72% |
| Supplemental Data | | | | | | | | | | | | | | | | | | |
| Net assets, end of period (in millions) | | $ 120 | | | | $ 135 | | | | $ 126 | | | | $ 134 | | | | $ 234 |
A Total returns would have been lower had certain expenses not been reduced during the periods shown.
B Expense ratios reflect operating expenses of the class. Expenses before reductions do not reflect amounts reimbursed by the investment adviser or expense offset arrangements and do not represent the amount paid by the class during periods when
reimbursements or reductions occur. Expenses net of fee waivers reflect expenses after reimbursement by the investment adviser but prior to reductions from expense offset arrangements. Expenses net of all reductions represent the net expenses
paid by the class.
C Amount represents less than $.001 per share.
|
See accompanying notes which are an integral part of the financial statements.
| | |
| Annual Report | | 10 |
| Financial Highlights Select Class | | | | | | | | | | | | | | | | | | |
| Years ended March 31, | | 2006 | | | | 2005 | | | | 2004 | | | | 2003 | | | | 2002D |
| Selected Per-Share Data | | | | | | | | | | | | | | | | | | |
| Net asset value, beginning of period | | $ 1.00 | | | | $ 1.00 | | | | $ 1.00 | | | | $ 1.00 | | | | $ 1.00 |
| Income from Investment Operations | | | | | | | | | | | | | | | | | | |
| Net investment income | | 032 | | | | .014 | | | | .008 | | | | .014 | | | | .004 |
| Net realized and unrealized gain (loss)F | | — | | | | — | | | | — | | | | — | | | | — |
| Total from investment operations | | 032 | | | | .014 | | | | .008 | | | | .014 | | | | .004 |
| Distributions from net investment income | | (.032) | | | | (.014) | | | | (.008) | | | | (.014) | | | | (.004) |
| Distributions from net realized gain | | — | | | | —F | | | | — | | | | — | | | | — |
| Total distributions | | (.032) | | | | (.014) | | | | (.008) | | | | (.014) | | | | (.004) |
| Net asset value, end of period | | $ 1.00 | | | | $ 1.00 | | | | $ 1.00 | | | | $ 1.00 | | | | $ 1.00 |
| Total ReturnB,C | | 3.28% | | | | 1.40% | | | | .84% | | | | 1.45% | | | | .36% |
| Ratios to Average Net AssetsE | | | | | | | | | | | | | | | | | | |
| Expenses before reductions | | 29% | | | | .29% | | | | .28% | | | | .29% | | | | .28%A |
| Expenses net of fee waivers, if any | | 25% | | | | .25% | | | | .25% | | | | .25% | | | | .25%A |
| Expenses net of all reductions | | 25% | | | | .25% | | | | .25% | | | | .25% | | | | .25%A |
| Net investment income | | 3.25% | | | | 1.38% | | | | .84% | | | | 1.43% | | | | 1.78%A |
| Supplemental Data | | | | | | | | | | | | | | | | | | |
| Net assets, end of period (000 omitted) | | $ 32,814 | | | | $ 11,661 | | | | $ 6,090 | | | | $ 14,598 | | | | $ 100 |
A Annualized
B Total returns for periods of less than one year are not annualized.
C Total returns would have been lower had certain expenses not been reduced during the periods shown.
D For the period January 17, 2002 (commencement of sale of shares) to March 31, 2002.
E Expense ratios reflect operating expenses of the class. Expenses before reductions do not reflect amounts reimbursed by the investment adviser or expense offset arrangements and do not represent the amount paid by the class during periods when
reimbursements or reductions occur. Expense ratios before reductions for start up periods may not be representative of longer term operating periods. Expenses net of fee waivers reflect expenses after reimbursement by the investment adviser but
prior to reductions from expense offset arrangements. Expenses net of all reductions represent the net expenses paid by the class.
F Amount represents less than $.001 per share.
|
See accompanying notes which are an integral part of the financial statements.
|
11 Annual Report
| Treasury Portfolio | | | | | | |
| Investment Changes | | | | | | |
| |
| Maturity Diversification | | | | | | |
| Days | | % of fund’s | | % of fund’s | | % of fund’s |
| | | investments | | investments | | investments |
| | | 3/31/06 | | 9/30/05 | | 3/31/05 |
| 0 – 30 | | 91.7 | | 96.1 | | 88.8 |
| 31 – 90 | | 2.1 | | 0.0 | | 7.8 |
| 91 – 180 | | 5.0 | | 3.9 | | 3.4 |
| 181 – 397 | | 1.2 | | 0.0 | | 0.0 |
Weighted Average Maturity | | | | | | |
| | | 3/31/06 | | 9/30/05 | | 3/31/05 |
| Treasury Portfolio | | 14 Days | | 9 Days | | 12 Days |
| All Taxable Money Market Funds Average* | | 38 Days | | 38 Days | | 38 Days |

*Source: iMoneyNet, Inc.
Annual Report 12
| Treasury Portfolio | | | | | | | | |
| Investments March 31, 2006 |
| Showing Percentage of Net Assets | | | | | | |
| |
| U.S. Treasury Obligations 7.1% | | | | | | | | | | | | |
| Due | | Annualized Yield at | | Principal Amount | | | | Value (Note 1) |
| Date | | Time of Purchase | | (000s) | | | | (000s) |
| U.S. Treasury Bills – 6.1% | | | | | | | | |
| 5/18/06 | | 4.49% | | | | $ 80,000 | | | | $ 79,536 |
| 5/25/06 | | 4.51 | | | | 90,000 | | | | 89,399 |
| 7/27/06 | | 4.45 | | | | 160,000 | | | | 157,735 |
| 8/3/06 | | 4.50 | | | | 179,165 | | | | 176,450 |
| | | | | | | | | | | 503,120 |
| U.S. Treasury Notes – 1.0% | | | | | | | | |
| 6/30/06 | | 4.27 | | | | 80,000 | | | | 79,705 |
| TOTAL U.S. TREASURY OBLIGATIONS | | | | 582,825 |
| |
| Repurchase Agreements 93.2% | | | | |
| | | | | Maturity | | | | |
| | | | | Amount (000s) | | | | |
| In a joint trading account (Collateralized | | | | | | |
| by U.S. Treasury Obligations) dated | | | | | | | | |
| 3/31/06 due 4/3/06 At: | | | | | | | | |
| 4.52% (a) | | | | | | $ 601,105 | | | | 600,879 |
| 4.54% (a) | | | | | | 6,142,724 | | | | 6,140,398 |
| With: | | | | | | | | | | |
| Merrill Lynch Government Securities, | | | | | | |
| Inc. At: | | | | | | | | | | |
| 4.75%, dated 3/31/06 due | | | | | | | | |
| 4/3/06 (Collateralized by U.S. | | | | | | |
| Treasury Obligations valued at | | | | | | | | |
| $412,005,173, 0% 3.875%, | | | | | | | | |
| 1/15/09 – 1/15/16) | | | | 400,158 | | | | 400,000 |
| 5.1%, dated 3/30/06 due | | | | | | | | |
| 3/30/07 (Collateralized by U.S. | | | | | | |
| Treasury Obligations valued at | | | | | | | | |
| $103,000,863, 1.88%, | | | | | | | | |
| 7/15/13) | | | | | | 105,171 | | | | 100,000 |
| Morgan Stanley & Co., Inc. At 4.75%, | | | | | | |
| dated 3/30/06 due 4/3/06 | | | | | | | | |
| (Collateralized by U.S. Treasury | | | | | | | | |
| Obligations valued at | | | | | | | | |
| $405,836,752, 7.13% 7.63%, | | | | | | | | |
| 8/15/22 – 2/15/23) | | | | 395,208 | | | | 395,000 |
| TOTAL REPURCHASE AGREEMENTS | | | | | | 7,636,277 |
| |
| TOTAL INVESTMENT PORTFOLIO 100.3% | | | | | | | | 8,219,102 |
| (Cost $8,219,102) | | | | | | | | |
| |
| NET OTHER ASSETS (0.3)% | | | | | | | | (21,591) |
| NET ASSETS 100% | | | | | | | | $ 8,197,511 |
Legend
(a) Additional information on each counterparty to the repurchase agreement
is as follows:
|
| Repurchase Agreement/ | | | | Value |
| Counterparty | | | | (000s) |
| $600,879,000 due 4/3/06 at 4.52% | | | | |
| Banc of America Securities LLC. | | | | $ 48,958 |
| Barclays Capital Inc. | | | | 113,582 |
| Credit Suisse First Boston LLC | | | | 195,831 |
| Deutsche Bank Securities Inc. | | | | 58,749 |
| Morgan Stanley & Co. Incorporated. | | | | 129,248 |
| State Street Bank and Trust Company | | | | 54,511 |
| | | | | $ 600,879 |
| |
| $6,140,398,000 due 4/3/06 at 4.54% | | | | |
| Banc of America Securities LLC. | | | | $ 63,456 |
| Bear Stearns & Co. Inc. | | | | 1,161,199 |
| BNP Paribas Securities Corp. | | | | 1,548,266 |
| Credit Suisse First Boston LLC | | | | 387,066 |
| Deutsche Bank Securities Inc. | | | | 270,946 |
| HBSC Securities, Inc | | | | 387,066 |
| J.P. Morgan Securities, Inc. | | | | 774,133 |
| Merrill Lynch, Pierce, Fenner & Smith | | | | 1,316,026 |
| Mizuho Securities USA, Inc | | | | 232,240 |
| | | | | $ 6,140,398 |
Income Tax Information
At March 31, 2006, the fund had a capital loss carryforward of approximately $660,000 of which $32,000, $191,000, $259,000 and $178,000 will expire on March 31, 2010, 2011, 2013 and 2014, respectively.
See accompanying notes which are an integral part of the financial statements.
13 Annual Report
| Treasury Portfolio | | | | |
| |
| Financial Statements | | | | |
| |
| |
| Statement of Assets and Liabilities | | |
| Amounts in thousands (except per share amounts) | | March 31, 2006 |
| |
| Assets | | | | |
| Investment in securities, at value | | | | |
| (including repurchase agreements | | | | |
| of $7,636,277) — See | | | | |
| accompanying schedule: | | | | |
| Unaffiliated issuers | | | | |
| (cost $8,219,102) | | | | $ 8,219,102 |
| Receivable for fund shares sold | | | | 954 |
| Interest receivable | | | | 1,589 |
| Prepaid expenses | | | | 28 |
| Receivable from investment adviser | | | | |
| for expense reductions | | | | 161 |
| Total assets | | | | 8,221,834 |
| |
| Liabilities | | | | |
| Payable for fund shares redeemed | | $ 37 | | |
| Distributions payable | | 21,943 | | |
| Accrued management fee | | 1,365 | | |
| Distribution fees payable | | 743 | | |
| Other affiliated payables | | 203 | | |
| Other payables and accrued | | | | |
| expenses | | 32 | | |
| Total liabilities | | | | 24,323 |
| |
| Net Assets | | | | $ 8,197,511 |
| Net Assets consist of: | | | | |
| Paid in capital | | | | $ 8,198,119 |
| Undistributed net investment income . | | | | 52 |
| Accumulated undistributed net | | | | |
| realized gain (loss) on investments | | | | (660) |
| Net Assets | | | | $ 8,197,511 |
| Class I: | | | | |
| Net Asset Value, offering price and | | | | |
| redemption price per share | | | | |
| ($4,297,337 ÷ 4,297,101 | | | | |
| shares) | | | | $ 1.00 |
| Class II: | | | | |
| Net Asset Value, offering price and | | | | |
| redemption price per share | | | | |
| ($330,953 ÷ 330,746 shares) | | | | $ 1.00 |
| Class III: | | | | |
| Net Asset Value, offering price and | | | | |
| redemption price per share | | | | |
| ($3,299,385 ÷ 3,299,960 | | | | |
| shares) | | | | $ 1.00 |
| Select Class: | | | | |
| Net Asset Value, offering price and | | | | |
| redemption price per share | | | | |
| ($269,836 ÷ 269,848 shares) | | | | $ 1.00 |
| Statement of Operations | | | | |
| Amounts in thousands | | | | Year ended March 31, 2006 |
| |
| Investment Income | | | | | | |
| Interest | | | | | | $ 307,409 |
| |
| Expenses | | | | | | |
| Management fee | | | | $ 16,547 | | |
| Transfer agent fees | | | | 1,324 | | |
| Distribution fees | | | | 8,571 | | |
| Accounting fees and expenses | | | | 724 | | |
| Independent trustees’ compensation | | | | 36 | | |
| Custodian fees and expenses | | | | 10 | | |
| Registration fees | | | | 107 | | |
| Audit | | | | 75 | | |
| Legal | | | | 20 | | |
| Miscellaneous | | | | 100 | | |
| Total expenses before reductions | | | | 27,514 | | |
| Expense reductions | | | | (2,358) | | 25,156 |
| |
| Net investment income | | | | | | 282,253 |
| Realized and Unrealized Gain | | | | | | |
| (Loss) | | | | | | |
| Net realized gain (loss) on: | | | | | | |
| Investment securities: | | | | | | |
| Unaffiliated issuers | | | | | | (4) |
| Net increase in net assets resulting | | | | | | |
| from operations | | | | | | $ 282,249 |
See accompanying notes which are an integral part of the financial statements.
| | |
| Annual Report | | 14 |
| Statement of Changes in Net Assets | | | | | | | | | | | | | | | | | | | | |
| | | | | | | | | | | | | | | Year ended | | | | Year ended |
| | | | | | | | | | | | | | | March 31, | | | | March 31, |
| Amounts in thousands | | | | | | | | | | | | | | 2006 | | | | 2005 |
| Increase (Decrease) in Net Assets | | | | | | | | | | | | | | | | | | | | |
| Operations | | | | | | | | | | | | | | | | | | | | |
| Net investment income | | | | | | | | | | | | | | $ 282,253 | | | | $ 116,441 |
| Net realized gain (loss) | | | | | | | | | | | | | | (4) | | | | (433) |
| Net increase in net assets resulting from operations | | | | | | | | | | | | | | 282,249 | | | | 116,008 |
| Distributions to shareholders from net investment income | | | | | | | | | | | | | | (282,242) | | | | (116,452) |
| Share transactions - net increase (decrease) | | | | | | | | | | | | | | (852,279) | | | | 18,644 |
| Total increase (decrease) in net assets | | | | | | | | | | | | | | (852,272) | | | | 18,200 |
| |
| Net Assets | | | | | | | | | | | | | | | | | | | | |
| Beginning of period | | | | | | | | | | | | | | 9,049,783 | | | | 9,031,583 |
| End of period (including undistributed net investment income of $52 and undistributed net investment income of $50, | | | | | | | | |
| respectively) | | | | | | | | | | | | | | $ 8,197,511 | | | | $ 9,049,783 |
| |
| Financial Highlights Class I | | | | | | | | | | | | | | | | | | | | |
| Years ended March 31, | | | | 2006 | | | | 2005 | | | | 2004 | | | | 2003 | | | | 2002 |
| Selected Per-Share Data | | | | | | | | | | | | | | | | | | | | |
| Net asset value, beginning of period | | | | $ 1.00 | | | | $ 1.00 | | | | $ 1.00 | | | | $ 1.00 | | | | $ 1.00 |
| Income from Investment Operations | | | | | | | | | | | | | | | | | | | | |
| Net investment income | | | | 035 | | | | .015 | | | | .009 | | | | .015 | | | | .030 |
| Distributions from net investment income | | | | (.035) | | | | (.015) | | | | (.009) | | | | (.015) | | | | (.030) |
| Net asset value, end of period | | | | $ 1.00 | | | | $ 1.00 | | | | $ 1.00 | | | | $ 1.00 | | | | $ 1.00 |
| Total ReturnA | | | | 3.55% | | | | 1.50% | | | | .91% | | | | 1.47% | | | | | | 3.00% |
| Ratios to Average Net AssetsB | | | | | | | | | | | | | | | | | | | | |
| Expenses before reductions | | | | 23% | | | | .23% | | | | .23% | | | | .23% | | | | | | .23% |
| Expenses net of fee waivers, if any | | | | 20% | | | | .20% | | | | .20% | | | | .20% | | | | | | .20% |
| Expenses net of all reductions | | | | 20% | | | | .20% | | | | .20% | | | | .20% | | | | | | .20% |
| Net investment income | | | | 3.51% | | | | 1.48% | | | | .90% | | | | 1.46% | | | | | | 2.93% |
| Supplemental Data | | | | | | | | | | | | | | | | | | | | |
| Net assets, end of period (in millions) | | | | $ 4,297 | | | | $ 5,348 | | | | $ 4,567 | | | | $ 5,082 | | | | $ 4,400 |
A Total returns would have been lower had certain expenses not been reduced during the periods shown.
B Expense ratios reflect operating expenses of the class. Expenses before reductions do not reflect amounts reimbursed by the investment adviser or expense offset arrangements and do not represent the amount paid by the class during periods when reimbursements or
reductions occur. Expenses net of fee waivers reflect expenses after reimbursement by the investment adviser but prior to reductions from expense offset arrangements. Expenses net of all reductions represent the net expenses paid by the class.
|
See accompanying notes which are an integral part of the financial statements.
|
15 Annual Report
| Financial Highlights Class II | | | | | | | | | | | | | | | | | | |
| Years ended March 31, | | 2006 | | | | 2005 | | | | 2004 | | | | 2003 | | | | 2002 |
| Selected Per-Share Data | | | | | | | | | | | | | | | | | | |
| Net asset value, beginning of period | | $ 1.00 | | | | $ 1.00 | | | | $ 1.00 | | | | $ 1.00 | | | | $ 1.00 |
| Income from Investment Operations | | | | | | | | | | | | | | | | | | |
| Net investment income | | 033 | | | | .013 | | | | .008 | | | | .013 | | | | .028 |
| Distributions from net investment income | | (.033) | | | | (.013) | | | | (.008) | | | | (.013) | | | | (.028) |
| Net asset value, end of period | | $ 1.00 | | | | $ 1.00 | | | | $ 1.00 | | | | $ 1.00 | | | | $ 1.00 |
| Total ReturnA | | 3.39% | | | | 1.35% | | | | .76% | | | | 1.32% | | | | 2.85% |
| Ratios to Average Net AssetsB | | | | | | | | | | | | | | | | | | |
| Expenses before reductions | | 38% | | | | .38% | | | | .38% | | | | .38% | | | | .38% |
| Expenses net of fee waivers, if any | | 35% | | | | .35% | | | | .35% | | | | .35% | | | | .35% |
| Expenses net of all reductions | | 35% | | | | .35% | | | | .35% | | | | .35% | | | | .35% |
| Net investment income | | 3.36% | | | | 1.33% | | | | .75% | | | | 1.31% | | | | 2.73% |
| Supplemental Data | | | | | | | | | | | | | | | | | | |
| Net assets, end of period (in millions) | | $ 331 | | | | $ 180 | | | | $ 231 | | | | $ 274 | | | | $ 370 |
A Total returns would have been lower had certain expenses not been reduced during the periods shown.
B Expense ratios reflect operating expenses of the class. Expenses before reductions do not reflect amounts reimbursed by the investment adviser or expense offset arrangements and do not represent the amount paid by the class during periods when
reimbursements or reductions occur. Expenses net of fee waivers reflect expenses after reimbursement by the investment adviser but prior to reductions from expense offset arrangements. Expenses net of all reductions represent the net expenses
paid by the class.
|
| Financial Highlights Class III | | | | | | | | | | | | | | | | | | |
| Years ended March 31, | | 2006 | | | | 2005 | | | | 2004 | | | | 2003 | | | | 2002 |
| Selected Per-Share Data | | | | | | | | | | | | | | | | | | |
| Net asset value, beginning of period | | $ 1.00 | | | | $ 1.00 | | | | $ 1.00 | | | | $ 1.00 | | | | $ 1.00 |
| Income from Investment Operations | | | | | | | | | | | | | | | | | | |
| Net investment income | | 032 | | | | .012 | | | | .007 | | | | .012 | | | | .027 |
| Distributions from net investment income | | (.032) | | | | (.012) | | | | (.007) | | | | (.012) | | | | (.027) |
| Net asset value, end of period | | $ 1.00 | | | | $ 1.00 | | | | $ 1.00 | | | | $ 1.00 | | | | $ 1.00 |
| Total ReturnA | | 3.29% | | | | 1.25% | | | | .66% | | | | 1.22% | | | | 2.74% |
| Ratios to Average Net AssetsB | | | | | | | | | | | | | | | | | | |
| Expenses before reductions | | 48% | | | | .48% | | | | .48% | | | | .48% | | | | .48% |
| Expenses net of fee waivers, if any | | 45% | | | | .45% | | | | .45% | | | | .45% | | | | .45% |
| Expenses net of all reductions | | 45% | | | | .45% | | | | .45% | | | | .45% | | | | .45% |
| Net investment income | | 3.26% | | | | 1.23% | | | | .65% | | | | 1.21% | | | | 2.65% |
| Supplemental Data | | | | | | | | | | | | | | | | | | |
| Net assets, end of period (in millions) | | $ 3,299 | | | | $ 3,439 | | | | $ 4,132 | | | | $ 3,938 | | | | $ 4,520 |
A Total returns would have been lower had certain expenses not been reduced during the periods shown.
B Expense ratios reflect operating expenses of the class. Expenses before reductions do not reflect amounts reimbursed by the investment adviser or expense offset arrangements and do not represent the amount paid by the class during periods when
reimbursements or reductions occur. Expenses net of fee waivers reflect expenses after reimbursement by the investment adviser but prior to reductions from expense offset arrangements. Expenses net of all reductions represent the net expenses
paid by the class.
|
See accompanying notes which are an integral part of the financial statements.
| | |
| Annual Report | | 16 |
| Financial Highlights Select Class | | | | | | | | | | | | | | | | | | |
| Years ended March 31, | | 2006 | | | | 2005 | | | | 2004 | | | | 2003 | | | | 2002D |
| Selected Per-Share Data | | | | | | | | | | | | | | | | | | |
| Net asset value, beginning of period | | $ 1.00 | | | | $ 1.00 | | | | $ 1.00 | | | | $ 1.00 | | | | $ 1.00 |
| Income from Investment Operations | | | | | | | | | | | | | | | | | | |
| Net investment income | | 034 | | | | .014 | | | | .009 | | | | .014 | | | | .003 |
| Distributions from net investment income | | (.034) | | | | (.014) | | | | (.009) | | | | (.014) | | | | (.003) |
| Net asset value, end of period | | $ 1.00 | | | | $ 1.00 | | | | $ 1.00 | | | | $ 1.00 | | | | $ 1.00 |
| Total ReturnB,C | | 3.49% | | | | 1.45% | | | | .86% | | | | 1.42% | | | | .34% |
| Ratios to Average Net AssetsE | | | | | | | | | | | | | | | | | | |
| Expenses before reductions | | 28% | | | | .29% | | | | .28% | | | | .28% | | | | .27%A |
| Expenses net of fee waivers, if any | | 25% | | | | .25% | | | | .25% | | | | .25% | | | | .25%A |
| Expenses net of all reductions | | 25% | | | | .25% | | | | .25% | | | | .25% | | | | .25%A |
| Net investment income | | 3.46% | | | | 1.43% | | | | .85% | | | | 1.40% | | | | 1.72%A |
| Supplemental Data | | | | | | | | | | | | | | | | | | |
| Net assets, end of period (000 omitted) | | $ 269,836 | | | | $ 82,134 | | | | $ 101,421 | | | | $ 2,223 | | | | $ 100 |
A Annualized
B Total returns for periods of less than one year are not annualized.
C Total returns would have been lower had certain expenses not been reduced during the periods shown.
D For the period January 17, 2002 (commencement of sale of shares) to March 31, 2002.
E Expense ratios reflect operating expenses of the class. Expenses before reductions do not reflect amounts reimbursed by the investment adviser or expense offset arrangements and do not represent the amount paid by the class during periods when
reimbursements or reductions occur. Expense ratios before reductions for start up periods may not be representative of longer term operating periods. Expenses net of fee waivers reflect expenses after reimbursement by the investment adviser but
prior to reductions from expense offset arrangements. Expenses net of all reductions represent the net expenses paid by the class.
|
See accompanying notes which are an integral part of the financial statements.
|
17 Annual Report
| Government Portfolio | | | | | | |
| Investment Changes | | | | | | |
| |
| Maturity Diversification | | | | | | |
| Days | | % of fund’s | | % of fund’s | | % of fund’s |
| | | investments | | investments | | investments |
| | | 3/31/06 | | 9/30/05 | | 3/31/05 |
| 0 – 30 | | 72.9 | | 67.2 | | 66.0 |
| 31 – 90 | | 16.6 | | 27.2 | | 20.1 |
| 91 – 180 | | 5.5 | | 3.4 | | 12.9 |
| 181 – 397 | | 5.0 | | 2.2 | | 1.0 |
| Weighted Average Maturity | | | | | | |
| | | 3/31/06 | | 9/30/05 | | 3/31/05 |
| Government Portfolio | | 34 Days | | 33 Days | | 36 Days |
| All Taxable Money Market Funds Average* | | 38 Days | | 38 Days | | 38 Days |

*Source: iMoneyNet, Inc.
Annual Report 18
| Government Portfolio | | | | | | |
| Investments March 31, 2006 |
| Showing Percentage of Net Assets | | | | | | |
| |
| Federal Agencies 24.6% | | | | | | |
| Due | | Annualized Yield at | | Principal | | Value (Note 1) |
| Date | | Time of Purchase | | Amount (000s) | | (000s) |
| Fannie Mae – 12.0% | | | | | | | | |
| Agency Coupons – 11.6% | | | | | | | | |
| 5/22/06 | | 4.67% (a) | | | | $ 150,000 | | $ 149,987 |
| 6/21/06 | | 4.81 (a) | | | | 250,000 | | 249,917 |
| 6/22/06 | | 4.81 (a) | | | | 405,000 | | 404,820 |
| | | | | | | | | 804,724 |
| Discount Notes – 0.4% | | | | | | | | |
| 7/28/06 | | 3.86 | | | | 25,855 | | 25,539 |
| | | | | | | | | 830,263 |
| Federal Home Loan Bank – 4.1% | | | | | | | | |
| Agency Coupons – 4.1% | | | | | | | | |
| 5/2/06 | | 4.57 (a) | | | | 62,000 | | 61,986 |
| 6/13/06 | | 4.77 (a) | | | | 225,000 | | 224,964 |
| | | | | | | | | 286,950 |
| Freddie Mac – 8.5% | | | | | | | | |
| Discount Notes – 8.5% | | | | | | | | |
| 7/25/06 | | 4.01 | | | | 72,100 | | 71,213 |
| 7/25/06 | | 4.60 | | | | 50,855 | | 50,124 |
| 7/25/06 | | 4.61 | | | | 46,015 | | 45,353 |
| 9/27/06 | | 4.26 | | | | 75,000 | | 73,477 |
| 9/29/06 | | 4.51 | | | | 32,000 | | 31,303 |
| 10/17/06 | | 4.53 | | | | 36,046 | | 35,181 |
| 10/23/06 | | 4.90 | | | | 45,925 | | 44,685 |
| 12/1/06 | | 4.72 | | | | 55,600 | | 53,900 |
| 1/9/07 | | 4.75 | | | | 26,660 | | 25,708 |
| 1/17/07 | | 4.76 | | | | 47,480 | | 45,735 |
| 1/18/07 | | 5.11 | | | | 70,000 | | 67,218 |
| 1/19/07 | | 4.81 | | | | 47,375 | | 45,602 |
| | | | | | | | | 589,499 |
| |
| TOTAL FEDERAL AGENCIES | | | | | | 1,706,712 |
| |
| U.S. Treasury Obligations 2.5% | | |
| |
| U.S. Treasury Bills – 2.5% | | | | | | |
| 5/25/06 | | 4.51 | | | | 65,000 | | 64,566 |
| 8/3/06 | | 4.50 | | | | 66,480 | | 65,472 |
| 8/3/06 | | 4.53 | | | | 47,300 | | 46,578 |
| TOTAL U.S. TREASURY OBLIGATIONS | | 176,616 |
| Repurchase Agreements 73.0% | | |
| | | Maturity | | Value (Note 1) |
| | | Amount | | (000s) |
| | | (000s) | | |
| In a joint trading account (Collateralized by | | | | |
| U.S. Government Obligations) dated | | | | |
| 3/31/06 due 4/3/06 At: | | | | |
| 4.85% (b) | | $ 331,424 | | $ 331,290 |
| 4.88% (b) | | 4,740,572 | | 4,738,644 |
| TOTAL REPURCHASE AGREEMENTS | | | | 5,069,934 |
| |
| TOTAL INVESTMENT PORTFOLIO 100.1% | | |
| (Cost $6,953,262) | | | | 6,953,262 |
| |
| NET OTHER ASSETS (0.1)% | | | | (7,569) |
| NET ASSETS 100% | | | | $ 6,945,693 |
Legend
(a) The coupon rate shown on floating or adjustable rate securities represents
the rate at period end. The due dates on these types of securities reflect
the next interest rate reset date or, when applicable, the final maturity
date.
(b) Additional information on each counterparty to the repurchase agreement
is as follows:
|
| Repurchase Agreement/ | | | | Value |
| Counterparty | | | | (000s) |
| |
| $331,290,000 due 4/3/06 at 4.85% | | | | |
| Banc of America Securities LLC | | | | $ 82,823 |
| Goldman, Sachs & Co. | | | | 150,586 |
| Morgan Stanley & Co. Incorporated | | | | 97,881 |
| | | | | $ 331,290 |
| $4,738,644,000 due 4/3/06 at 4.88% | | | | |
| Bank of America, National Association | | | | $ 895,165 |
| Barclays Capital Inc. | | | | 1,566,539 |
| Countrywide Securities Corporation. | | | | 447,582 |
| Goldman, Sachs & Co. | | | | 128,544 |
| Greenwich Capital Markets, Inc. | | | | 223,791 |
| HSBC Securities (USA), Inc. | | | | 447,583 |
| Merrill Lynch Government Securities, Inc. | | | | 55,948 |
| Morgan Stanley & Co. Incorporated. | | | | 749,701 |
| WestLB AG | | | | 223,791 |
| | | | | $ 4,738,644 |
Income Tax Information
At March 31, 2006, the fund had a capital loss carryforward of approximately $555,000 of which $55,000, $192,000 and $308,000 will expire on March 31, 2011, 2012 and 2013, respectively.
See accompanying notes which are an integral part of the financial statements.
19 Annual Report
| Government Portfolio | | | | | | |
| |
| Financial Statements | | | | |
| |
| |
| Statement of Assets and Liabilities | | |
| Amounts in thousands (except per share amounts) | | March 31, 2006 |
| |
| Assets | | | | | | |
| Investment in securities, at value | | | | | | |
| (including repurchase agreements | | | | |
| of $5,069,934) — See | | | | | | |
| accompanying schedule: | | | | | | |
| Unaffiliated issuers | | | | | | |
| (cost $6,953,262) | | | | | | $ 6,953,262 |
| Receivable for fund shares sold | | | | | | 1,000 |
| Interest receivable | | | | | | 3,357 |
| Prepaid expenses | | | | | | 24 |
| Receivable from investment adviser | | | | |
| for expense reductions | | | | | | 135 |
| Other affiliated receivables | | | | | | 28 |
| Total assets | | | | | | 6,957,806 |
| |
| Liabilities | | | | | | |
| Distributions payable | | | | $ 10,577 | | |
| Accrued management fee | | | | 1,050 | | |
| Distribution fees payable | | | | 227 | | |
| Other affiliated payables | | | | 226 | | |
| Other payables and accrued | | | | | | |
| expenses | | | | 33 | | |
| Total liabilities | | | | | | 12,113 |
| |
| Net Assets | | | | | | $ 6,945,693 |
| Net Assets consist of: | | | | | | |
| Paid in capital | | | | | | $ 6,946,307 |
| Distributions in excess of net | | | | | | |
| investment income | | | | | | (59) |
| Accumulated undistributed net | | | | | | |
| realized gain (loss) on investments | | | | (555) |
| Net Assets | | | | | | $ 6,945,693 |
| Class I: | | | | | | |
| Net Asset Value, offering price and | | | | |
| redemption price per share | | | | | | |
| ($5,256,833 ÷ 5,256,917 | | | | | | |
| shares) | | | | | | $ 1.00 |
| Class II: | | | | | | |
| Net Asset Value, offering price and | | | | |
| redemption price per share | | | | | | |
| ($933,097 ÷ 932,920 shares) | | | | $ 1.00 |
| Class III: | | | | | | |
| Net Asset Value, offering price and | | | | |
| redemption price per share | | | | | | |
| ($727,072 ÷ 726,992 shares) | | | | $ 1.00 |
| Select Class: | | | | | | |
| Net Asset Value, offering price and | | | | |
| redemption price per share | | | | | | |
| ($28,691 ÷ 28,698 shares) | | | | | | $ 1.00 |
| Statement of Operations | | | | |
| Amounts in thousands | | | | Year ended March 31, 2006 |
| |
| Investment Income | | | | | | |
| Interest | | | | | | $ 250,997 |
| |
| Expenses | | | | | | |
| Management fee | | | | $ 13,371 | | |
| Transfer agent fees | | | | 1,096 | | |
| Distribution fees | | | | 2,518 | | |
| Accounting fees and expenses | | | | 593 | | |
| Independent trustees’ compensation | | | | 29 | | |
| Appreciation in deferred trustee | | | | | | |
| compensation account | | | | 2 | | |
| Custodian fees and expenses | | | | 30 | | |
| Registration fees | | | | 108 | | |
| Audit | | | | 67 | | |
| Legal | | | | 16 | | |
| Miscellaneous | | | | 65 | | |
| Total expenses before reductions | | . | | 17,895 | | |
| Expense reductions | | | | (2,019) | | 15,876 |
| |
| Net investment income | | | | | | 235,121 |
| Realized and Unrealized Gain | | | | | | |
| (Loss) | | | | | | |
| Net realized gain (loss) on: | | | | | | |
| Investment securities: | | | | | | |
| Unaffiliated issuers | | | | | | 230 |
| Net increase in net assets resulting | | | | | | |
| from operations | | | | | | $ 235,351 |
See accompanying notes which are an integral part of the financial statements.
Annual Report 20
| Statement of Changes in Net Assets | | | | | | | | | | | | | | | | | | | | |
| | | | | | | | | | | | | | | Year ended | | | | Year ended |
| | | | | | | | | | | | | | | March 31, | | | | March 31, |
| Amounts in thousands | | | | | | | | | | | | | | 2006 | | | | 2005 |
| Increase (Decrease) in Net Assets | | | | | | | | | | | | | | | | | | | | |
| Operations | | | | | | | | | | | | | | | | | | | | |
| Net investment income | | | | | | | | | | | | | | | | $ 235,121 | | | | $ 105,816 |
| Net realized gain (loss) | | | | | | | | | | | | | | | | 230 | | | | (508) |
| Net increase in net assets resulting from operations | | | | | | | | | | | | | | | | 235,351 | | | | 105,308 |
| Distributions to shareholders from net investment income | | | | | | | | | | | | | | | | (235,235) | | | | (106,199) |
| Share transactions - net increase (decrease) | | | | | | | | | | | | | | | | 236,077 | | | | (1,319,771) |
| Total increase (decrease) in net assets | | | | | | | | | | | | | | | | 236,193 | | | | (1,320,662) |
| |
| Net Assets | | | | | | | | | | | | | | | | | | | | |
| Beginning of period | | | | | | | | | | | | | | | | 6,709,500 | | | | 8,030,162 |
| End of period (including distributions in excess of net investment income of $59 and undistributed net investment | | | | | | | | | | |
| income of $92, respectively) | | | | | | | | | | | | | | | | $ 6,945,693 | | | | $ 6,709,500 |
| |
| Financial Highlights Class I | | | | | | | | | | | | | | | | | | | | |
| Years ended March 31, | | | | 2006 | | | | 2005 | | | | 2004 | | | | 2003 | | | | 2002 |
| Selected Per-Share Data | | | | | | | | | | | | | | | | | | | | |
| Net asset value, beginning of period | | | | $ 1.00 | | | | $ 1.00 | | | | $ 1.00 | | | | $ 1.00 | | | | $ 1.00 |
| Income from Investment Operations | | | | | | | | | | | | | | | | | | | | |
| Net investment income | | | | 036 | | | | .016 | | | | .010 | | | | .015 | | | | .031 |
| Distributions from net investment income | | | | (.036) | | | | (.016) | | | | (.010) | | | | (.015) | | | | (.031) |
| Net asset value, end of period | | | | $ 1.00 | | | | $ 1.00 | | | | $ 1.00 | | | | $ 1.00 | | | | $ 1.00 |
| Total ReturnA | | | | 3.62% | | | | 1.58% | | | | .97% | | | | 1.53% | | | | | | 3.16% |
| Ratios to Average Net AssetsB | | | | | | | | | | | | | | | | | | | | |
| Expenses before reductions | | | | 23% | | | | .23% | | | | .23% | | | | .23% | | | | | | .23% |
| Expenses net of fee waivers, if any | | | | 20% | | | | .20% | | | | .20% | | | | .20% | | | | | | .20% |
| Expenses net of all reductions | | | | 20% | | | | .20% | | | | .20% | | | | .20% | | | | | | .20% |
| Net investment income | | | | 3.55% | | | | 1.53% | | | | .98% | | | | 1.52% | | | | | | 3.06% |
| Supplemental Data | | | | | | | | | | | | | | | | | | | | |
| Net assets, end of period (in millions) | | | | $ 5,257 | | | | $ 5,590 | | | | $ 6,024 | | | | $ 7,928 | | | | $ 8,604 |
A Total returns would have been lower had certain expenses not been reduced during the periods shown.
B Expense ratios reflect operating expenses of the class. Expenses before reductions do not reflect amounts reimbursed by the investment adviser or expense offset arrangements and do not represent the amount paid by the class during periods when reimbursements or
reductions occur. Expenses net of fee waivers reflect expenses after reimbursement by the investment adviser but prior to reductions from expense offset arrangements. Expenses net of all reductions represent the net expenses paid by the class.
|
See accompanying notes which are an integral part of the financial statements.
|
21 Annual Report
| Financial Highlights Class II | | | | | | | | | | | | | | | | | | |
| Years ended March 31, | | 2006 | | | | 2005 | | | | 2004 | | | | 2003 | | | | 2002 |
| Selected Per-Share Data | | | | | | | | | | | | | | | | | | |
| Net asset value, beginning of period | | $ 1.00 | | | | $ 1.00 | | | | $ 1.00 | | | | $ 1.00 | | | | $ 1.00 |
| Income from Investment Operations | | | | | | | | | | | | | | | | | | |
| Net investment income | | 034 | | | | .014 | | | | .008 | | | | .014 | | | | .030 |
| Distributions from net investment income | | (.034) | | | | (.014) | | | | (.008) | | | | (.014) | | | | (.030) |
| Net asset value, end of period | | $ 1.00 | | | | $ 1.00 | | | | $ 1.00 | | | | $ 1.00 | | | | $ 1.00 |
| Total ReturnA | | 3.47% | | | | 1.43% | | | | .82% | | | | 1.38% | | | | 3.01% |
| Ratios to Average Net AssetsB | | | | | | | | | | | | | | | | | | |
| Expenses before reductions | | 38% | | | | .38% | | | | .38% | | | | .38% | | | | .38% |
| Expenses net of fee waivers, if any | | 35% | | | | .35% | | | | .35% | | | | .35% | | | | .35% |
| Expenses net of all reductions | | 35% | | | | .35% | | | | .35% | | | | .35% | | | | .35% |
| Net investment income | | 3.40% | | | | 1.38% | | | | .83% | | | | 1.37% | | | | 2.86% |
| Supplemental Data | | | | | | | | | | | | | | | | | | |
| Net assets, end of period (in millions) | | $ 933 | | | | $ 499 | | | | $ 859 | | | | $ 917 | | | | $ 918 |
A Total returns would have been lower had certain expenses not been reduced during the periods shown.
B Expense ratios reflect operating expenses of the class. Expenses before reductions do not reflect amounts reimbursed by the investment adviser or expense offset arrangements and do not represent the amount paid by the class during periods when
reimbursements or reductions occur. Expenses net of fee waivers reflect expenses after reimbursement by the investment adviser but prior to reductions from expense offset arrangements. Expenses net of all reductions represent the net expenses
paid by the class.
|
| Financial Highlights Class III | | | | | | | | | | | | | | | | | | |
| Years ended March 31, | | 2006 | | | | 2005 | | | | 2004 | | | | 2003 | | | | 2002 |
| Selected Per-Share Data | | | | | | | | | | | | | | | | | | |
| Net asset value, beginning of period | | $ 1.00 | | | | $ 1.00 | | | | $ 1.00 | | | | $ 1.00 | | | | $ 1.00 |
| Income from Investment Operations | | | | | | | | | | | | | | | | | | |
| Net investment income | | 033 | | | | .013 | | | | .007 | | | | .013 | | | | .029 |
| Distributions from net investment income | | (.033) | | | | (.013) | | | | (.007) | | | | (.013) | | | | (.029) |
| Net asset value, end of period | | $ 1.00 | | | | $ 1.00 | | | | $ 1.00 | | | | $ 1.00 | | | | $ 1.00 |
| Total ReturnA | | 3.36% | | | | 1.32% | | | | .72% | | | | 1.27% | | | | 2.90% |
| Ratios to Average Net AssetsB | | | | | | | | | | | | | | | | | | |
| Expenses before reductions | | 48% | | | | .48% | | | | .48% | | | | .48% | | | | .48% |
| Expenses net of fee waivers, if any | | 45% | | | | .45% | | | | .45% | | | | .45% | | | | .45% |
| Expenses net of all reductions | | 45% | | | | .45% | | | | .45% | | | | .45% | | | | .45% |
| Net investment income | | 3.30% | | | | 1.28% | | | | .73% | | | | 1.27% | | | | 2.76% |
| Supplemental Data | | | | | | | | | | | | | | | | | | |
| Net assets, end of period (in millions) | | $ 727 | | | | $ 572 | | | | $ 1,109 | | | | $ 866 | | | | $ 1,326 |
A Total returns would have been lower had certain expenses not been reduced during the periods shown.
B Expense ratios reflect operating expenses of the class. Expenses before reductions do not reflect amounts reimbursed by the investment adviser or expense offset arrangements and do not represent the amount paid by the class during periods when
reimbursements or reductions occur. Expenses net of fee waivers reflect expenses after reimbursement by the investment adviser but prior to reductions from expense offset arrangements. Expenses net of all reductions represent the net expenses
paid by the class.
|
See accompanying notes which are an integral part of the financial statements.
| | |
| Annual Report | | 22 |
| Financial Highlights Select Class | | | | | | | | | | | | | | | | | | |
| Years ended March 31, | | 2006 | | | | 2005 | | | | 2004 | | | | 2003 | | | | 2002D |
| Selected Per-Share Data | | | | | | | | | | | | | | | | | | |
| Net asset value, beginning of period | | $ 1.00 | | | | $ 1.00 | | | | $ 1.00 | | | | $ 1.00 | | | | $ 1.00 |
| Income from Investment Operations | | | | | | | | | | | | | | | | | | |
| Net investment income | | 035 | | | | .015 | | | | .009 | | | | .015 | | | | .004 |
| Distributions from net investment income | | (.035) | | | | (.015) | | | | (.009) | | | | (.015) | | | | (.004) |
| Net asset value, end of period | | $ 1.00 | | | | $ 1.00 | | | | $ 1.00 | | | | $ 1.00 | | | | $ 1.00 |
| Total ReturnB,C | | 3.57% | | | | 1.53% | | | | .92% | | | | 1.47% | | | | .37% |
| Ratios to Average Net AssetsE | | | | | | | | | | | | | | | | | | |
| Expenses before reductions | | 28% | | | | .28% | | | | .28% | | | | .28% | | | | .27%A |
| Expenses net of fee waivers, if any | | 25% | | | | .25% | | | | .25% | | | | .25% | | | | .25%A |
| Expenses net of all reductions | | 25% | | | | .25% | | | | .25% | | | | .25% | | | | .25%A |
| Net investment income | | 3.50% | | | | 1.48% | | | | .92% | | | | 1.47% | | | | 1.83%A |
| Supplemental Data | | | | | | | | | | | | | | | | | | |
| Net assets, end of period (000 omitted) | | $ 28,691 | | | | $ 49,025 | | | | $ 38,785 | | | | $ 272,495 | | | | $ 100 |
A Annualized
B Total returns for periods of less than one year are not annualized.
C Total returns would have been lower had certain expenses not been reduced during the periods shown.
D For the period January 17, 2002 (commencement of sale of shares) to March 31, 2002.
E Expense ratios reflect operating expenses of the class. Expenses before reductions do not reflect amounts reimbursed by the investment adviser or expense offset arrangements and do not represent the amount paid by the class during periods when
reimbursements or reductions occur. Expense ratios before reductions for start up periods may not be representative of longer term operating periods. Expenses net of fee waivers reflect expenses after reimbursement by the investment adviser but
prior to reductions from expense offset arrangements. Expenses net of all reductions represent the net expenses paid by the class.
|
See accompanying notes which are an integral part of the financial statements.
|
23 Annual Report
| Prime Money Market Portfolio | | | | | | |
| Investment Changes | | | | | | |
| |
| Maturity Diversification | | | | | | |
| Days | | % of fund’s | | % of fund’s | | % of fund’s |
| | | investments | | investments | | investments |
| | | 3/31/06 | | 9/30/05 | | 3/31/05 |
| 0 – 30 | | 67.6 | | 58.7 | | 43.4 |
| 31 – 90 | | 21.8 | | 31.1 | | 36.2 |
| 91 – 180 | | 2.9 | | 8.4 | | 19.4 |
| 181 – 397 | | 7.7 | | 1.8 | | 1.0 |
Weighted Average Maturity | | | | | | |
| | | 3/31/06 | | 9/30/05 | | 3/31/05 |
| Prime Money Market Portfolio | | 40 Days | | 34 Days | | 49 Days |
| All Taxable Money Market Funds Average* | | 38 Days | | 38 Days | | 38 Days |
**Net Other Assets are not included in the pie chart.
*Source: iMoneyNet, Inc.
Annual Report 24
| Prime Money Market Portfolio | | | | | | |
| Investments March 31, 2006 |
| Showing Percentage of Net Assets | | | | | | | | |
| |
| Corporate Bonds 0.0% | | | | | | | | |
| Due | | Annualized Yield at | | Principal | | Value (Note 1) |
| Date | | Time of Purchase | | Amount (000s) | | (000s) |
| Morgan Stanley | | | | | | | | | | |
| 4/15/06 | | 4.05% | | | | $ 5,000 | | | | $ 5,004 |
| |
| Certificates of Deposit 23.9% | | | | | | | | | | |
| |
| London Branch, Eurodollar, Foreign Banks – 9.9% | | | | | | | | | | |
| Calyon | | | | | | | | | | |
| 10/24/06 | | 4.92 | | | | 65,000 | | | | 64,935 |
| 2/12/07 | | 5.00 | | | | 75,000 | | | | 75,000 |
| Credit Agricole SA | | | | | | | | | | |
| 5/15/06 | | 4.70 | | | | 50,000 | | | | 49,985 |
| Credit Industriel et Commercial | | | | | | | | | | |
| 6/8/06 | | 4.75 | | | | 70,000 | | | | 70,000 |
| 9/11/06 | | 5.00 | | | | 90,000 | | | | 90,000 |
| 9/29/06 | | 5.08 | | | | 100,000 | | | | 100,000 |
| 10/24/06 | | 4.77 | | | | 50,000 | | | | 50,000 |
| 11/7/06 | | 4.76 | | | | 40,000 | | | | 40,000 |
| 3/30/07 | | 5.22 | | | | 50,000 | | | | 50,000 |
| Deutsche Bank AG | | | | | | | | | | |
| 1/30/07 | | 4.86 | | | | 105,000 | | | | 105,000 |
| HBOS Treasury Services PLC | | | | | | | | | | |
| 5/8/06 | | 4.67 | | | | 40,000 | | | | 40,000 |
| Landesbank Hessen Thuringen | | | | | | | | | | |
| 5/8/06 | | 4.67 | | | | 90,000 | | | | 90,000 |
| Societe Generale | | | | | | | | | | |
| 5/10/06 | | 4.80 | | | | 225,000 | | | | 225,000 |
| 6/7/06 | | 4.75 | | | | 98,000 | | | | 97,966 |
| 11/7/06 | | 4.91 | | | | 85,000 | | | | 85,000 |
| 12/6/06 | | 4.80 | | | | 55,000 | | | | 55,000 |
| Unicredito Italiano Spa | | | | | | | | | | |
| 5/19/06 | | 4.87 | | | | 10,000 | | | | 9,998 |
| | | | | | | | | | | 1,297,884 |
| New York Branch, Yankee Dollar, Foreign Banks – 14.0% | | | | | | | | | | |
| Bank Tokyo Mitsubishi UFJ Ltd. | | | | | | | | | | |
| 4/20/06 | | 4.76 | | | | 45,000 | | | | 45,000 |
| 4/24/06 | | 4.78 | | | | 55,000 | | | | 55,000 |
| Barclays Bank PLC | | | | | | | | | | |
| 5/10/06 | | 4.80 | | | | 365,000 | | | | 364,994 |
| BNP Paribas SA | | | | | | | | | | |
| 10/30/06 | | 4.81 | | | | 105,000 | | | | 105,000 |
| 11/8/06 | | 4.93 | | | | 80,000 | | | | 80,000 |
| Canadian Imperial Bank of Commerce | | | | | | | | | | |
| 4/24/06 | | 4.78 (b) | | | | 170,000 | | | | 170,000 |
| Credit Suisse First Boston New York Branch | | | | | | | | | | |
| 4/19/06 | | 4.57 (b) | | | | 60,000 | | | | 60,000 |
| 4/19/06 | | 4.76 (b) | | | | 50,000 | | | | 50,000 |
| 6/26/06 | | 4.93 (b) | | | | 85,000 | | | | 85,000 |
| 11/7/06 | | 4.75 | | | | 35,000 | | | | 35,000 |
| Due | | Annualized Yield at | | Principal | | Value (Note 1) |
| Date | | Time of Purchase | | Amount (000s) | | (000s) |
| Deutsche Bank AG | | | | | | | | | | |
| 6/5/06 | | 4.80% (b) | | | | $ 65,000 | | | | $ 65,000 |
| 2/5/07 | | 4.90 | | | | 70,000 | | | | 70,000 |
| DZ Bank AG Deutsche Genosbank | | | | | | | | | | |
| 4/24/06 | | 4.79 | | | | 25,000 | | | | 25,000 |
| Mizuho Corporate Bank Ltd. | | | | | | | | | | |
| 5/8/06 | | 4.82 | | | | 95,000 | | | | 95,000 |
| 5/10/06 | | 4.83 | | | | 100,000 | | | | 100,000 |
| Skandinaviska Enskilda Banken AB | | | | | | | | | | |
| 4/6/06 | | 4.50 (b) | | | | 115,000 | | | | 114,995 |
| Sumitomo Mitsui Banking Corp. | | | | | | | | | | |
| 4/10/06 | | 4.68 | | | | 11,000 | | | | 11,000 |
| 4/17/06 | | 4.75 | | | | 22,000 | | | | 22,000 |
| 4/20/06 | | 4.77 | | | | 19,000 | | | | 19,000 |
| 4/21/06 | | 4.80 | | | | 18,000 | | | | 18,000 |
| 4/24/06 | | 4.80 | | | | 14,000 | | | | 14,000 |
| 4/28/06 | | 4.82�� | | | | 18,000 | | | | 18,000 |
| Toronto Dominion Bank | | | | | | | | | | |
| 4/7/06 | | 3.86 | | | | 30,000 | | | | 30,000 |
| 4/18/06 | | 3.92 | | | | 125,000 | | | | 125,000 |
| Unicredito Italiano Spa | | | | | | | | | | |
| 5/12/06 | | 4.69 (b) | | | | 75,000 | | | | 74,999 |
| | | | | | | | | | | 1,851,988 |
| |
| TOTAL CERTIFICATES OF DEPOSIT | | | | | | | | 3,149,872 |
| |
| Commercial Paper 31.7% | | | | | | | | | | |
| |
| Bavaria TRR Corp. | | | | | | | | | | |
| 4/4/06 | | 4.66 | | | | 145,000 | | | | 144,944 |
| 4/6/06 | | 4.68 | | | | 40,000 | | | | 39,974 |
| 4/17/06 | | 4.80 | | | | 1,142 | | | | 1,140 |
| 4/20/06 | | 4.78 | | | | 100,000 | | | | 99,749 |
| Charta LLC | | | | | | | | | | |
| 4/20/06 | | 4.66 | | | | 96,500 | | | | 96,265 |
| 5/16/06 | | 4.71 | | | | 40,000 | | | | 39,767 |
| CIESCO LP | | | | | | | | | | |
| 5/15/06 | | 4.70 | | | | 75,000 | | | | 74,574 |
| Citibank Credit Card Master Trust I (Dakota Certificate Program) | | | | | | | | | | |
| 4/3/06 | | 4.53 | | | | 85,000 | | | | 84,979 |
| 4/4/06 | | 4.53 | | | | 29,000 | | | | 28,989 |
| 4/4/06 | | 4.54 | | | | 30,000 | | | | 29,989 |
| 4/10/06 | | 4.63 | | | | 65,000 | | | | 64,925 |
| 5/8/06 | | 4.81 | | | | 10,000 | | | | 9,951 |
| 5/10/06 | | 4.82 | | | | 20,000 | | | | 19,901 |
| Credit Suisse First Boston New York Branch | | | | | | | | | | |
| 4/3/06 | | 4.61 | | | | 185,000 | | | | 184,953 |
| Cullinan Finance Corp. | | | | | | | | | | |
| 5/8/06 | | 4.69 (a) | | | | 8,000 | | | | 7,962 |
| 5/10/06 | | 4.70 (a) | | | | 35,410 | | | | 35,232 |
See accompanying notes which are an integral part of the financial statements.
25 Annual Report
| Prime Money Market Portfolio | | | | | | |
| Investments - continued | | | | | | | | |
| |
| |
Commercial Paper continued
| | | | | | |
| Due | | Annualized Yield at | | Principal | | Value (Note 1) |
| Date | | Time of Purchase | | Amount (000s) | | (000s) |
| Danske Corp. | | | | | | | | | | |
| 11/10/06 | | 4.94% | | | | $ 100,000 | | | | $ 97,051 |
| Emerald (MBNA Credit Card Master Note Trust) | | | | | | | | | | |
| 4/4/06 | | 4.52 | | | | 75,500 | | | | 75,472 |
| 4/5/06 | | 4.53 | | | | 51,220 | | | | 51,194 |
| 4/12/06 | | 4.63 | | | | 10,000 | | | | 9,986 |
| 4/12/06 | | 4.64 | | | | 52,120 | | | | 52,047 |
| 4/28/06 | | 4.79 | | | | 118,858 | | | | 118,433 |
| 5/4/06 | | 4.81 | | | | 5,000 | | | | 4,978 |
| 5/11/06 | | 4.71 | | | | 25,000 | | | | 24,871 |
| FCAR Owner Trust | | | | | | | | | | |
| 4/4/06 | | 4.50 | | | | 105,000 | | | | 104,961 |
| 4/4/06 | | 4.52 | | | | 45,000 | | | | 44,983 |
| 5/4/06 | | 4.80 | | | | 125,000 | | | | 124,453 |
| 6/2/06 | | 4.81 | | | | 31,000 | | | | 30,746 |
| 6/2/06 | | 4.83 | | | | 50,000 | | | | 49,589 |
| 7/18/06 | | 4.76 | | | | 65,000 | | | | 64,093 |
| 7/25/06 | | 4.75 | | | | 20,000 | | | | 19,704 |
| Giro Funding US Corp. | | | | | | | | | | |
| 4/3/06 | | 4.62 | | | | 20,000 | | | | 19,995 |
| 4/11/06 | | 4.70 | | | | 47,074 | | | | 47,013 |
| 4/24/06 | | 4.80 | | | | 130,000 | | | | 129,603 |
| 4/27/06 | | 4.82 | | | | 66,955 | | | | 66,723 |
| 5/8/06 | | 4.69 | | | | 17,000 | | | | 16,919 |
| 6/15/06 | | 4.91 | | | | 25,000 | | | | 24,747 |
| Intesa Funding LLC | | | | | | | | | | |
| 5/9/06 | | 4.83 | | | | 47,403 | | | | 47,163 |
| Jupiter Securitization Corp. | | | | | | | | | | |
| 4/7/06 | | 4.67 | | | | 10,000 | | | | 9,992 |
| K2 (USA) LLC | | | | | | | | | | |
| 8/3/06 | | 4.82 (a) | | | | 78,500 | | | | 77,226 |
| Mont Blanc Capital Corp. | | | | | | | | | | |
| 4/13/06 | | 4.70 | | | | 9,458 | | | | 9,443 |
| Monument Gardens Funding | | | | | | | | | | |
| 4/21/06 | | 4.69 | | | | 20,000 | | | | 19,948 |
| 5/22/06 | | 4.77 | | | | 10,000 | | | | 9,933 |
| 5/23/06 | | 4.79 | | | | 10,000 | | | | 9,932 |
| 5/23/06 | | 4.80 | | | | 5,000 | | | | 4,966 |
| Motown Notes Program | | | | | | | | | | |
| 4/4/06 | | 4.54 | | | | 30,000 | | | | 29,989 |
| 4/7/06 | | 4.64 | | | | 44,900 | | | | 44,866 |
| 4/10/06 | | 4.56 | | | | 20,000 | | | | 19,977 |
| 4/10/06 | | 4.69 | | | | 40,000 | | | | 39,953 |
| 4/11/06 | | 4.75 | | | | 5,000 | | | | 4,993 |
| 5/5/06 | | 4.71 | | | | 35,000 | | | | 34,846 |
| 5/17/06 | | 4.85 | | | | 10,000 | | | | 9,939 |
| 6/5/06 | | 4.87 | | | | 25,000 | | | | 24,783 |
| Nordea North America, Inc. | | | | | | | | | | |
| 4/5/06 | | 4.64 | | | | 53,552 | | | | 53,525 |
| Due | | Annualized Yield at | | Principal | | Value (Note 1) |
| Date | | Time of Purchase | | Amount (000s) | | (000s) |
| Paradigm Funding LLC | | | | | | | | | | |
| 4/4/06 | | 4.64% | | | | $ 30,000 | | | | $ 29,988 |
| 4/5/06 | | 4.67 | | | | 54,000 | | | | 53,972 |
| 4/18/06 | | 4.75 | | | | 40,000 | | | | 39,911 |
| Park Granada LLC | | | | | | | | | | |
| 4/5/06 | | 4.51 | | | | 40,000 | | | | 39,980 |
| 4/24/06 | | 4.73 | | | | 20,000 | | | | 19,940 |
| 5/1/06 | | 4.72 | | | | 8,430 | | | | 8,397 |
| 5/1/06 | | 4.74 | | | | 26,201 | | | | 26,098 |
| 5/9/06 | | 4.80 | | | | 35,000 | | | | 34,824 |
| Park Sienna LLC | | | | | | | | | | |
| 4/5/06 | | 4.66 | | | | 40,506 | | | | 40,485 |
| 4/6/06 | | 4.68 | | | | 25,000 | | | | 24,984 |
| 5/9/06 | | 4.79 | | | | 61,000 | | | | 60,694 |
| 5/9/06 | | 4.81 | | | | 80,000 | | | | 79,596 |
| Sigma Finance, Inc. | | | | | | | | | | |
| 4/18/06 | | 4.70 (b) | | | | 100,000 | | | | 99,992 |
| Skandinaviska Enskilda Banken AB | | | | | | | | | | |
| 4/28/06 | | 4.79 (b) | | | | 50,000 | | | | 50,000 |
| Strand Capital LLC | | | | | | | | | | |
| 4/10/06 | | 4.57 | | | | 10,000 | | | | 9,989 |
| 5/3/06 | | 4.75 | | | | 20,000 | | | | 19,916 |
| 5/10/06 | | 4.70 | | | | 10,000 | | | | 9,950 |
| 5/10/06 | | 4.71 | | | | 10,000 | | | | 9,950 |
| 5/15/06 | | 4.73 | | | | 10,000 | | | | 9,943 |
| Stratford Receivables Co. LLC | | | | | | | | | | |
| 4/3/06 | | 4.62 | | | | 52,079 | | | | 52,066 |
| 4/5/06 | | 4.64 | | | | 20,000 | | | | 19,990 |
| 4/6/06 | | 4.63 | | | | 45,000 | | | | 44,971 |
| 4/10/06 | | 4.65 | | | | 35,000 | | | | 34,960 |
| 4/11/06 | | 4.68 | | | | 121,448 | | | | 121,291 |
| 4/11/06 | | 4.74 | | | | 21,664 | | | | 21,636 |
| 4/12/06 | | 4.68 | | | | 60,000 | | | | 59,915 |
| 4/17/06 | | 4.71 | | | | 55,000 | | | | 54,886 |
| 4/18/06 | | 4.68 | | | | 35,000 | | | | 34,923 |
| 4/19/06 | | 4.71 | | | | 50,000 | | | | 49,883 |
| 4/19/06 | | 4.73 | | | | 25,000 | | | | 24,941 |
| 4/21/06 | | 4.73 | | | | 20,000 | | | | 19,948 |
| 4/24/06 | | 4.66 | | | | 277,868 | | | | 277,048 |
| 5/8/06 | | 4.81 | | | | 35,000 | | | | 34,828 |
| 5/10/06 | | 4.81 | | | | 40,000 | | | | 39,793 |
| 5/15/06 | | 4.79 | | | | 40,000 | | | | 39,768 |
| TOTAL COMMERCIAL PAPER | | | | | | | | 4,191,785 |
| |
| Federal Agencies 0.1% | | | | | | | | | | |
| |
| Agency Coupons – 0.1% | | | | | | | | | | |
| Overseas Private Invt Corp. U.S. Government guaranteed participation | | | | | | | | | | |
| certificates – 0.1% | | | | | | | | |
| 4/7/06 | | 4.80 (b) | | | | 15,450 | | | | 15,450 |
See accompanying notes which are an integral part of the financial statements.
Annual Report 26
| Bank Notes 0.1% | | | | | | | | |
| Due | | Annualized Yield at | | Principal | | Value (Note 1) |
| Date | | Time of Purchase | | Amount (000s) | | (000s) |
| M&I Marshall & Ilsley Bank | | | | | | | | | | |
| 4/18/06 | | 4.73% (b) | | | | $ 11,000 | | $ 11,000 |
| |
| Master Notes 1.6% | | | | | | | | |
| |
| Goldman Sachs Group, Inc. | | | | | | | | |
| 4/10/06 | | 4.74 (b)(d) | | | | 59,000 | | 59,000 |
| 4/10/06 | | 4.76 (b)(d) | | | | 60,000 | | 60,000 |
| 4/11/06 | | 4.78 (b)(d) | | | | 16,000 | | 16,000 |
| 5/30/06 | | 4.85 (b)(d) | | | | 71,000 | | 71,000 |
| TOTAL MASTER NOTES | | | | | | | | 206,000 |
| |
| Medium Term Notes 21.7% | | | | | | | | |
| |
| AIG Matched Funding Corp. | | | | | | | | |
| 4/3/06 | | 4.54 (b) | | | | 50,000 | | 50,000 |
| 4/11/06 | | 4.57 (b) | | | | 50,000 | | 50,000 |
| 4/23/06 | | 4.62 (b) | | | | 55,000 | | 55,000 |
| 6/15/06 | | 4.93 (b) | | | | 55,000 | | 55,000 |
| Allstate Life Global Funding II | | | | | | | | |
| 4/10/06 | | 4.71 (a)(b) | | | | 10,000 | | 10,000 |
| 4/18/06 | | 4.77 (a)(b) | | | | 5,000 | | 5,000 |
| 4/18/06 | | 4.81 (a)(b) | | | | 10,000 | | 10,000 |
| 4/27/06 | | 4.81 (a)(b) | | | | 6,000 | | 6,000 |
| American Express Credit Corp. | | | | | | | | |
| 4/5/06 | | 4.76 (b) | | | | 95,000 | | 95,014 |
| ASIF Global Financing XXX | | | | | | | | |
| 4/24/06 | | 4.81 (a)(b) | | | | 50,000 | | 50,000 |
| Australia & New Zealand Banking Group Ltd. | | | | | | | | |
| 4/24/06 | | 4.78 (a)(b) | | | | 26,000 | | 26,000 |
| Bayerische Landesbank Girozentrale | | | | | | | | |
| 4/18/06 | | 4.58 (b) | | | | 75,000 | | 75,000 |
| 5/19/06 | | 4.78 (b) | | | | 60,000 | | 60,000 |
| BMW U.S. Capital LLC | | | | | | | | |
| 4/18/06 | | 4.72 (b) | | | | 16,000 | | 16,000 |
| BNP Paribas SA | | | | | | | | |
| 4/26/06 | | 4.79 (a)(b) | | | | 100,000 | | 100,000 |
| Commonwealth Bank of Australia | | | | | | | | |
| 4/24/06 | | 4.78 (b) | | | | 26,000 | | 26,000 |
| Cullinan Finance Corp. | | | | | | | | |
| 4/25/06 | | 4.78 (a)(b) | | | | 15,000 | | 14,999 |
| 5/22/06 | | 4.73 (a)(b) | | | | 80,000 | | 79,987 |
| Eli Lilly Services, Inc. | | | | | | | | |
| 4/3/06 | | 4.60 (a)(b) | | | | 25,000 | | 25,000 |
| Due | | Annualized Yield at | | Principal | | Value (Note 1) |
| Date | | Time of Purchase | | Amount (000s) | | (000s) |
| GE Capital Assurance Co. | | | | | | | | | | |
| 4/3/06 | | 4.71% (b)(d) | | | | $ 15,000 | | | | $ 15,000 |
| General Electric Capital Corp. | | | | | | | | | | |
| 4/7/06 | | 4.69 (b) | | | | 127,000 | | | | 127,000 |
| 4/10/06 | | 4.79 (b) | | | | 86,500 | | | | 86,523 |
| 4/18/06 | | 4.85 (b) | | | | 164,000 | | | | 164,076 |
| Hartford Life Global Funding Trust | | | | | | | | | | |
| 4/18/06 | | 4.77 (b) | | | | 35,000 | | | | 35,000 |
| HSBC Finance Corp. | | | | | | | | | | |
| 4/24/06 | | 4.84 (b) | | | | 37,000 | | | | 37,000 |
| HSBC USA, Inc. | | | | | | | | | | |
| 4/18/06 | | 4.73 (b) | | | | 45,000 | | | | 45,000 |
| HSH Nordbank AG | | | | | | | | | | |
| 4/24/06 | | 4.80 (a)(b) | | | | 36,000 | | | | 36,000 |
| ING USA Annuity & Life Insurance Co. | | | | | | | | | | |
| 6/26/06 | | 5.03 (b)(d) | | | | 18,000 | | | | 18,000 |
| Links Finance LLC | | | | | | | | | | |
| 4/18/06 | | 4.70 (a)(b) | | | | 60,000 | | | | 59,994 |
| MBIA Global Funding LLC | | | | | | | | | | |
| 4/18/06 | | 4.56 (a)(b) | | | | 15,000 | | | | 15,000 |
| Merrill Lynch & Co., Inc. | | | | | | | | | | |
| 4/4/06 | | 4.72 (b) | | | | 26,000 | | | | 26,021 |
| 4/11/06 | | 4.92 (b) | | | | 7,000 | | | | 7,012 |
| 4/18/06 | | 4.73 (b) | | | | 64,000 | | | | 64,000 |
| Metropolitan Life Insurance Co. | | | | | | | | | | |
| 4/6/06 | | 4.67 (a)(b) | | | | 29,087 | | | | 29,087 |
| Morgan Stanley | | | | | | | | | | |
| 4/3/06 | | 4.66 (b) | | | | 187,000 | | | | 187,000 |
| 4/3/06 | | 4.91 (b) | | | | 7,000 | | | | 7,000 |
| 4/4/06 | | 4.72 (b) | | | | 15,000 | | | | 15,000 |
| 4/18/06 | | 4.78 (b) | | | | 11,000 | | | | 11,000 |
| 4/27/06 | | 4.89 (b) | | | | 55,000 | | | | 55,006 |
| Nordea Bank AB | | | | | | | | | | |
| 4/9/06 | | 4.68 (a)(b) | | | | 35,000 | | | | 35,000 |
| 4/11/06 | | 4.70 (a)(b) | | | | 48,200 | | | | 48,203 |
| Pacific Life Global Funding | | | | | | | | | | |
| 4/4/06 | | 4.68 (a)(b) | | | | 22,500 | | | | 22,500 |
| 4/13/06 | | 4.74 (b) | | | | 5,000 | | | | 5,000 |
| RACERS | | | | | | | | | | |
| 4/24/06 | | 4.79 (a)(b) | | | | 65,000 | | | | 65,000 |
| Royal Bank of Scotland PLC | | | | | | | | | | |
| 4/21/06 | | 4.75 (a)(b) | | | | 85,000 | | | | 85,000 |
See accompanying notes which are an integral part of the financial statements.
27 Annual Report
| Prime Money Market Portfolio | | | | | | |
| Investments - continued | | | | | | | | |
| |
| |
Medium Term Notes continued
| | | | | | |
| Due | | Annualized Yield at | | Principal | | Value (Note 1) |
| Date | | Time of Purchase | | Amount (000s) | | (000s) |
| SBC Communications, Inc. | | | | | | | | | | |
| 6/5/06 | | 4.02% (a) | | | | $ 21,830 | | | | $ 21,844 |
| Security Life of Denver Insurance Co. | | | | | | | | | | |
| 5/30/06 | | 4.89 (b)(d) | | | | 14,000 | | | | 14,000 |
| SLM Corp. | | | | | | | | | | |
| 4/3/06 | | 4.68 (a)(b) | | | | 30,000 | | | | 30,000 |
| Societe Generale | | | | | | | | | | |
| 4/3/06 | | 4.60 (a)(b) | | | | 76,000 | | | | 76,000 |
| Wachovia Asset Securitization Issuance LLC | | | | | | | | | | |
| 4/25/06 | | 4.81 (a)(b) | | | | 11,251 | | | | 11,251 |
| Washington Mutual Bank FA | | | | | | | | | | |
| 4/18/06 | | 4.73 (b) | | | | 18,000 | | | | 18,000 |
| 4/24/06 | | 4.79 (b) | | | | 40,000 | | | | 40,000 |
| Washington Mutual Bank, California | | | | | | | | | | |
| 4/27/06 | | 4.62 (b) | | | | 80,000 | | | | 80,000 |
| 5/31/06 | | 4.74 (b) | | | | 20,000 | | | | 20,000 |
| 6/20/06 | | 4.91 (b) | | | | 56,000 | | | | 56,000 |
| 7/26/06 | | 4.98 (b) | | | | 65,000 | | | | 64,999 |
| Wells Fargo & Co. | | | | | | | | | | |
| 4/3/06 | | 4.68 (b) | | | | 30,000 | | | | 30,000 |
| 4/18/06 | | 4.74 (b) | | | | 90,000 | | | | 90,001 |
| WestLB AG | | | | | | | | | | |
| 4/10/06 | | 4.74 (a)(b) | | | | 41,000 | | | | 41,000 |
| 6/30/06 | | 4.99 (a)(b) | | | | 51,000 | | | | 51,000 |
| Westpac Banking Corp. | | | | | | | | | | |
| 6/12/06 | | 4.93 (b) | | | | 15,000 | | | | 15,000 |
| White Pine Finance LLC | | | | | | | | | | |
| 4/28/06 | | 4.63 (a)(b) | | | | 40,000 | | | | 40,000 |
| 6/12/06 | | 4.83 (a)(b) | | | | 62,000 | | | | 61,998 |
| TOTAL MEDIUM-TERM NOTES | | | | | | | | 2,870,515 |
| |
| Short Term Notes 1.7% | | | | | | | | | | |
| |
| Hartford Life Insurance Co. | | | | | | | | | | |
| 6/1/06 | | 4.97 (b)(d) | | | | 25,000 | | | | 25,000 |
| Jackson National Life Insurance Co. | | | | | | | | | | |
| 4/1/06 | | 4.67 (b)(d) | | | | 10,000 | | | | 10,000 |
| Metropolitan Life Insurance Co. | | | | | | | | | | |
| 4/3/06 | | 4.65 (b)(d) | | | | 30,000 | | | | 30,000 |
| 4/28/06 | | 4.89 (a)(b) | | | | 10,000 | | | | 10,000 |
| Monumental Life Insurance Co. | | | | | | | | | | |
| 4/3/06 | | 4.77 (b)(d) | | | | 10,000 | | | | 10,000 |
| 4/3/06 | | 4.80 (b)(d) | | | | 10,000 | | | | 10,000 |
| New York Life Insurance Co. | | | | | | | | | | |
| 4/3/06 | | 4.66 (b)(d) | | | | 95,000 | | | | 95,000 |
| Transamerica Occidental Life Insurance Co. | | | | | | | | | | |
| 5/2/06 | | 4.85 (b)(d) | | | | 35,000 | | | | 35,000 |
| TOTAL SHORT TERM NOTES | | | | | | | | | | 225,000 |
| Asset Backed Securities 0.1% | | |
| |
| Due | | Annualized Yield at | | Principal | | Value (Note 1) |
| Date | | Time of Purchase | | Amount (000s) | | (000s) |
| |
| Wind Trust | | | | | | | | |
| 2/25/07 | | 4.82% (a)(b) | | | | $ 12,000 | | $ 12,000 |
| |
| Municipal Securities 0.9% | | | | | | | | |
| |
| California Statewide Cmntys. Dev. | | | | | | | | |
| Auth. Rev. TRAN Series C2, | | | | | | | | |
| 3.9% 6/30/06 | | | | | | 17,600 | | 17,600 |
| LoanStar Assets Partners LP Student Ln. | | | | | | | | |
| Rev. Series A, 4.85%, LOC State | | | | | | | | |
| Street Bank & Trust Co., Boston, | | | | | | | | |
| VRDN | | | | | | 50,000 | | 50,000 |
| Mississippi Gen. Oblig. (Nissan Proj.) | | | | | | | | |
| Series B, 4.89% (Liquidity Facility | | | | | | | | |
| Dexia Cr. Local de France), VRDN | | | | | | 50,115 | | 50,115 |
| |
| TOTAL MUNICIPAL SECURITIES | | | | | | | | 117,715 |
| |
| Repurchase Agreements 18.3% | | | | | | | | |
| |
| | | | | Maturity | | |
| | | | | Amount (000s) | | |
| |
| In a joint trading account | | | | | | | | |
| (Collateralized by U.S. Government | | | | | | | | |
| Obligations dated 3/31/06 due | | | | | | | | |
| 4/3/06 At 4.85%) | | | | | | $ 2,629 | | 2,628 |
| With: | | | | | | | | |
| Banc of America Securities LLC At | | | | | | | | |
| 4.92%, dated 3/31/06 due | | | | | | | | |
| 4/3/06 (Collateralized by | | | | | | | | |
| Mortgage Loan Obligations valued | | | | | | | | |
| at $504,000,001, 0%, 3/15/22) | | | | | | 480,197 | | 480,000 |
| Barclays Capital, Inc. At 4.99%, | | | | | | | | |
| dated 3/31/06 due 4/3/06 | | | | | | | | |
| (Collateralized by U.S. Treasury | | | | | | | | |
| Obligations valued at | | | | | | | | |
| $34,680,095, 0%, 5/15/06 | | | | | | | | |
| 11/15/27 and by Equity Securities | | | | | | | | |
| valued at $174,375,360) | | | | | | 200,083 | | 200,000 |
| Citigroup Global Markets, Inc. At | | | | | | | | |
| 4.94%, dated 3/31/06 due | | | | | | | | |
| 4/3/06 (Collateralized by | | | | | | | | |
| Corporate Obligations valued at | | | | | | | | |
| $638,520,000, 3.5% 7.9%, | | | | | | | | |
| 5/1/07 – 12/25/35) | | | | | | 626,257 | | 626,000 |
| Credit Suisse First Boston, Inc. At | | | | | | | | |
| 4.93%, dated 3/31/06 due | | | | | | | | |
| 4/3/06 (Collateralized by | | | | | | | | |
| Corporate Obligations valued at | | | | | | | | |
| $178,502,096, 4% 8.25%, | | | | | | | | |
| 7/21/06 – 6/15/30) | | | | | | 175,072 | | 175,000 |
See accompanying notes which are an integral part of the financial statements.
Annual Report 28
| Repurchase Agreements continued | | |
| |
| | | Maturity | | Value (Note 1) |
| | | Amount (000s) | | (000s) |
| |
| With: continued | | | | |
| Goldman Sachs & Co. At 4.98%, | | | | |
| dated: | | | | |
| 2/22/06 due 5/23/06 | | | | |
| (Collateralized by Mortgage | | | | |
| Loan Obligations valued at | | | | |
| $306,000,000, 4.59% 8.32%, | | | | |
| 2/5/19 11/25/45) (b)(c) | | $ 303,735 | | $ 300,000 |
| 3/31/06 due 4/3/06 | | | | |
| (Collateralized by Corporate | | | | |
| Obligations valued at | | | | |
| $141,750,000, 0% 7.43%, | | | | |
| 8/1/08 – 3/15/35) | | 135,056 | | 135,000 |
| Lehman Brothers, Inc. At 5%, dated | | | | |
| 3/31/06 due 4/3/06 | | | | |
| (Collateralized by Corporate | | | | |
| Obligations valued at | | | | |
| $279,700,670, 0% 9.5%, | | | | |
| 6/1/06 2/15/36 and by Equity | | | | |
| Securities valued at | | | | |
| $246,688,287) | | 500,208 | | 500,000 |
| |
| TOTAL REPURCHASE AGREEMENTS | | | | 2,418,628 |
| |
| |
| TOTAL INVESTMENT PORTFOLIO 100.1% | | | | |
| (Cost $13,222,969) | | | | 13,222,969 |
| |
| |
| NET OTHER ASSETS (0.1)% | | | | (18,029) |
| |
| NET ASSETS 100% | | | | $ 13,204,940 |
| Security Type Abbreviations |
TRAN | | — | | TAX AND REVENUE ANTICIPATION NOTE |
| VRDN | | — | | VARIABLE RATE DEMAND NOTE |
Legend
(a) Security exempt from registration under Rule 144A of the Securities
Act of 1933. These securities may be resold in transactions exempt from
registration, normally to qualified institutional buyers. At the period end,
the value of these securities amounted to $1,198,283,000 or 9.1% of net
assets.
(b) The coupon rate shown on floating or adjustable rate securities represents
the rate at period end. The due dates on these types of securities reflect
the next interest rate reset date or, when applicable, the final maturity
date.
(c) The maturity amount is based on the rate at period end.
|
(d) Restricted securities – Investment in securities not registered under the
Securities Act of 1933 (excluding 144A issues). At the end of the period,
the value of restricted securities (excluding 144A issues) amounted to
$468,000,000 or 3.5% of net assets.
Additional information on each holding is as follows:
|
| | | Acquisition | | | | Cost |
| Security | | Date | | | | (000s) |
| GE Capital Assurance Co. | | | | | | |
| 4.71%, 4/3/06 | | 7/28/05 | | | | $ 15,000 |
| Goldman Sachs Group, Inc.: | | | | | | |
| 4.74%, 4/10/06 | | 1/9/06 | | | | $ 59,000 |
| 4.76%, 4/10/06 | | 11/10/05 | | | | $ 60,000 |
| 4.78%, 4/11/06 | | 10/11/05 | | | | $ 16,000 |
| 4.85%, 5/30/06 | | 8/26/04 | | | | $ 71,000 |
| Hartford Life Insurance Co. | | | | | | |
| 4.97%, 6/1/06 | | 12/16/03 | | | | $ 25,000 |
| ING USA Annuity & Life Insurance | | | | | | |
| Co. 5.03%, 6/26/06 | | 6/23/05 | | | | $ 18,000 |
| Jackson National Life Insurance Co. | | | | | | |
| 4.67%, 4/1/06 | | 3/31/03 | | | | $ 10,000 |
| Metropolitan Life Insurance Co. | | | | | | |
| 4.65%, 4/3/06 | | 3/26/02 | | | | $ 30,000 |
| Monumental Life Insurance Co.: | | | | | | |
| 4.77%, 4/3/06 | | 9/17/98 | | | | $ 10,000 |
| 4.80%, 4/3/06 | | 3/12/99 | | | | $ 10,000 |
| New York Life Insurance Co. | | 2/28/02 - | | | | |
| 4.66%, 4/3/06 | | 12/19/02 | | | | $ 95,000 |
| Security Life of Denver Insurance Co. | | | | | | |
| 4.89%, 5/30/06 | | 8/26/05 | | | | $ 14,000 |
| Transamerica Occidental Life | | | | | | |
| Insurance Co. 4.85%, 5/2/06 | | 4/28/00 | | | | $ 35,000 |
Income Tax Information
At March 31, 2006, the fund had a capital loss carryforward of approximately $1,353,000 of which $119,000, $500,000 and $734,000 will expire on March 31, 2012, 2013 and 2014, respectively.
See accompanying notes which are an integral part of the financial statements.
29 Annual Report
| Prime Money Market Portfolio | | | | |
| |
| Financial Statements | | | | |
| |
| |
| Statement of Assets and Liabilities | | |
| Amounts in thousands (except per share amounts) | | March 31, 2006 |
| |
| Assets | | | | |
| Investment in securities, at value | | | | |
| (including repurchase agreements | | | | |
| of $2,418,628) — See | | | | |
| accompanying schedule: | | | | |
| Unaffiliated issuers | | | | |
| (cost $13,222,969) | | | | $ 13,222,969 |
| Cash | | | | 1,107 |
| Interest receivable | | | | 35,964 |
| Prepaid expenses | | | | 32 |
| Receivable from investment adviser | | | | |
| for expense reductions | | | | 286 |
| Total assets | | | | 13,260,358 |
| |
| Liabilities | | | | |
| Payable for investments purchased $ | | $ 29,940 | | |
| Payable for fund shares redeemed | | 400 | | |
| Distributions payable | | 21,724 | | |
| Accrued management fee | | 2,249 | | |
| Distribution fees payable | | 662 | | |
| Other affiliated payables | | 262 | | |
| Other payables and accrued | | | | |
| expenses | | 181 | | |
| Total liabilities | | | | 55,418 |
| |
| Net Assets | | | | $ 13,204,940 |
| Net Assets consist of: | | | | |
| Paid in capital | | | | $ 13,206,279 |
| Undistributed net investment income . | | | | 29 |
| Accumulated undistributed net real- | | | | |
| ized gain (loss) on investments | | | | (1,368) |
| Net Assets | | | | $ 13,204,940 |
| Class I: | | | | |
| Net Asset Value, offering price and | | | | |
| redemption price per share | | | | |
| ($8,818,509 ÷ 8,818,760 | | | | |
| shares) | | | | $ 1.00 |
| Class II: | | | | |
| Net Asset Value, offering price and | | | | |
| redemption price per share | | | | |
| ($1,705,677 ÷ 1,705,627 | | | | |
| shares) | | | | $ 1.00 |
| Class III: | | | | |
| Net Asset Value, offering price and | | | | |
| redemption price per share | | | | |
| ($2,549,134 ÷ 2,549,756 | | | | |
| shares) | | | | $ 1.00 |
| Select Class: | | | | |
| Net Asset Value, offering price and | | | | |
| redemption price per share | | | | |
| ($131,620 ÷ 131,630 shares) | | | | $ 1.00 |
| Statement of Operations | | | | |
| Amounts in thousands | | | | Year ended March 31, 2006 |
| |
| Investment Income | | | | �� | | |
| Interest (including $44 from | | | | | | |
| affiliated interfund lending) | | | | | | $ 433,393 |
| |
| Expenses | | | | | | |
| Management fee | | | | $ 22,305 | | |
| Transfer agent fees | | | | 1,784 | | |
| Distribution fees | | | | 5,746 | | |
| Accounting fees and expenses | | | | 907 | | |
| Independent trustees’ compensation | | | | 47 | | |
| Custodian fees and expenses | | | | 149 | | |
| Registration fees | | | | 231 | | |
| Audit | | | | 88 | | |
| Legal | | | | 24 | | |
| Miscellaneous | | | | 80 | | |
| Total expenses before reductions | | | | 31,361 | | |
| Expense reductions | | | | (3,435) | | 27,926 |
| |
| Net investment income | | | | | | 405,467 |
| Realized and Unrealized Gain | | | | | | |
| (Loss) | | | | | | |
| Net realized gain (loss) on: | | | | | | |
| Investment securities: | | | | | | |
| Unaffiliated issuers | | | | | | (209) |
| Net increase in net assets resulting | | | | | | |
| from operations | | | | | | $ 405,258 |
See accompanying notes which are an integral part of the financial statements.
Annual Report 30
| Statement of Changes in Net Assets | | | | | | | | | | | | | | | | | | | | |
| | | | | | | | | | | | | | | Year ended | | | | Year ended |
| | | | | | | | | | | | | | | March 31, | | | | March 31, |
| Amounts in thousands | | | | | | | | | | | | | | 2006 | | | | 2005 |
| Increase (Decrease) in Net Assets | | | | | | | | | | | | | | | | | | | | |
| Operations | | | | | | | | | | | | | | | | | | | | |
| Net investment income | | | | | | | | | | | | | | $ 405,467 | | | | $ 141,920 |
| Net realized gain (loss) | | | | | | | | | | | | | | (209) | | | | (1,040) |
| Net increase in net assets resulting from operations | | | | | | | | | | | | | | 405,258 | | | | 140,880 |
| Distributions to shareholders from net investment income | | | | | | | | | | | | | | (405,498) | | | | (141,941) |
| Share transactions - net increase (decrease) | | | | | | | | | | | | | | 3,156,482 | | | | 2,708,787 |
| Total increase (decrease) in net assets | | | | | | | | | | | | | | 3,156,242 | | | | 2,707,726 |
| |
| Net Assets | | | | | | | | | | | | | | | | | | | | |
| Beginning of period | | | | | | | | | | | | | | 10,048,698 | | | | 7,340,972 |
| End of period (including undistributed net investment income of $29 and undistributed net investment income of $60, | | | | | | | | |
| respectively) | | | | | | | | | | | | | | $ 13,204,940 | | | | $ 10,048,698 |
| |
| Financial Highlights Class I | | | | | | | | | | | | | | | | | | | | |
| Years ended March 31, | | | | 2006 | | | | 2005 | | | | 2004 | | | | 2003 | | | | 2002 |
| Selected Per-Share Data | | | | | | | | | | | | | | | | | | | | |
| Net asset value, beginning of period | | | | $ 1.00 | | | | $ 1.00 | | | | $ 1.00 | | | | $ 1.00 | | | | $ 1.00 |
| Income from Investment Operations | | | | | | | | | | | | | | | | | | | | |
| Net investment income | | | | 036 | | | | .016 | | | | .010 | | | | .016 | | | | .031 |
| Distributions from net investment income | | | | (.036) | | | | (.016) | | | | (.010) | | | | (.016) | | | | (.031) |
| Net asset value, end of period | | | | $ 1.00 | | | | $ 1.00 | | | | $ 1.00 | | | | 1.00 | | | | $ 1.00 |
| Total ReturnA | | | | 3.67% | | | | 1.62% | | | | 1.00% | | | | 1.56% | | | | 3.17% |
| Ratios to Average Net AssetsB | | | | | | | | | | | | | | | | | | | | |
| Expenses before reductions | | | | 23% | | | | .23% | | | | .23% | | | | .23% | | | | .23% |
| Expenses net of fee waivers, if any | | | | 20% | | | | .20% | | | | .20% | | | | .20% | | | | .20% |
| Expenses net of all reductions | | | | 20% | | | | .20% | | | | .20% | | | | .20% | | | | .20% |
| Net investment income | | | | 3.70% | | | | 1.68% | | | | .99% | | | | 1.57% | | | | 3.14% |
| Supplemental Data | | | | | | | | | | | | | | | | | | | | |
| Net assets, end of period (in millions) | | | | $ 8,819 | | | | $ 8,158 | | | | $ 6,153 | | | | $ 4,434 | | | | $ 6,782 |
A Total returns would have been lower had certain expenses not been reduced during the periods shown.
B Expense ratios reflect operating expenses of the class. Expenses before reductions do not reflect amounts reimbursed by the investment adviser or expense offset arrangements and do not represent the amount paid by the class during periods when reimbursements or
reductions occur. Expenses net of fee waivers reflect expenses after reimbursement by the investment adviser but prior to reductions from expense offset arrangements. Expenses net of all reductions represent the net expenses paid by the class.
|
See accompanying notes which are an integral part of the financial statements.
|
31 Annual Report
| Financial Highlights Class II | | | | | | | | | | | | | | | | | | |
| Years ended March 31, | | 2006 | | | | 2005 | | | | 2004 | | | | 2003 | | | | 2002 |
| Selected Per-Share Data | | | | | | | | | | | | | | | | | | |
| Net asset value, beginning of period | | $ 1.00 | | | | $ 1.00 | | | | $ 1.00 | | | | $ 1.00 | | | | $ 1.00 |
| Income from Investment Operations | | | | | | | | | | | | | | | | | | |
| Net investment income | | 035 | | | | .015 | | | | .008 | | | | .014 | | | | .030 |
| Distributions from net investment income | | (.035) | | | | (.015) | | | | (.008) | | | | (.014) | | | | (.030) |
| Net asset value, end of period | | $ 1.00 | | | | $ 1.00 | | | | $ 1.00 | | | | $ 1.00 | | | | $ 1.00 |
| Total ReturnA | | 3.52% | | | | 1.47% | | | | .85% | | | | 1.42% | | | | 3.01% |
| Ratios to Average Net AssetsB | | | | | | | | | | | | | | | | | | |
| Expenses before reductions | | 38% | | | | .38% | | | | .38% | | | | .38% | | | | .38% |
| Expenses net of fee waivers, if any | | 35% | | | | .35% | | | | .35% | | | | .35% | | | | .35% |
| Expenses net of all reductions | | 35% | | | | .35% | | | | .35% | | | | .35% | | | | .35% |
| Net investment income | | 3.55% | | | | 1.53% | | | | .84% | | | | 1.41% | | | | 2.96% |
| Supplemental Data | | | | | | | | | | | | | | | | | | |
| Net assets, end of period (in millions) | | $ 1,706 | | | | $ 661 | | | | $ 176 | | | | $ 188 | | | | $ 886 |
A Total returns would have been lower had certain expenses not been reduced during the periods shown.
B Expense ratios reflect operating expenses of the class. Expenses before reductions do not reflect amounts reimbursed by the investment adviser or expense offset arrangements and do not represent the amount paid by the class during periods when
reimbursements or reductions occur. Expenses net of fee waivers reflect expenses after reimbursement by the investment adviser but prior to reductions from expense offset arrangements. Expenses net of all reductions represent the net expenses
paid by the class.
|
| Financial Highlights Class III | | | | | | | | | | | | | | | | | | |
| Years ended March 31, | | 2006 | | | | 2005 | | | | 2004 | | | | 2003 | | | | 2002 |
| Selected Per-Share Data | | | | | | | | | | | | | | | | | | |
| Net asset value, beginning of period | | $ 1.00 | | | | $ 1.00 | | | | $ 1.00 | | | | $ 1.00 | | | | $ 1.00 |
| Income from Investment Operations | | | | | | | | | | | | | | | | | | |
| Net investment income | | 034 | | | | .014 | | | | .007 | | | | .013 | | | | .029 |
| Distributions from net investment income | | (.034) | | | | (.014) | | | | (.007) | | | | (.013) | | | | (.029) |
| Net asset value, end of period | | $ 1.00 | | | | $ 1.00 | | | | $ 1.00 | | | | $ 1.00 | | | | $ 1.00 |
| Total ReturnA | | 3.41% | | | | 1.36% | | | | .74% | | | | 1.31% | | | | 2.91% |
| Ratios to Average Net AssetsB | | | | | | | | | | | | | | | | | | |
| Expenses before reductions | | 48% | | | | .48% | | | | .48% | | | | .49% | | | | .49% |
| Expenses net of fee waivers, if any | | 45% | | | | .45% | | | | .45% | | | | .45% | | | | .45% |
| Expenses net of all reductions | | 45% | | | | .45% | | | | .45% | | | | .45% | | | | .45% |
| Net investment income | | 3.45% | | | | 1.43% | | | | .74% | | | | 1.32% | | | | 2.81% |
| Supplemental Data | | | | | | | | | | | | | | | | | | |
| Net assets, end of period (in millions) | | $ 2,549 | | | | $ 1,123 | | | | $ 898 | | | | $ 1,187 | | | | $ 1,407 |
A Total returns would have been lower had certain expenses not been reduced during the periods shown.
B Expense ratios reflect operating expenses of the class. Expenses before reductions do not reflect amounts reimbursed by the investment adviser or expense offset arrangements and do not represent the amount paid by the class during periods when
reimbursements or reductions occur. Expenses net of fee waivers reflect expenses after reimbursement by the investment adviser but prior to reductions from expense offset arrangements. Expenses net of all reductions represent the net expenses
paid by the class.
|
See accompanying notes which are an integral part of the financial statements.
| | |
| Annual Report | | 32 |
| Financial Highlights Select Class | | | | | | | | | | | | | | | | | | |
| Years ended March 31, | | 2006 | | | | 2005 | | | | 2004 | | | | 2003 | | | | 2002D |
| Selected Per-Share Data | | | | | | | | | | | | | | | | | | |
| Net asset value, beginning of period | | $ 1.00 | | | | $ 1.00 | | | | $ 1.00 | | | | $ 1.00 | | | | $ 1.00 |
| Income from Investment Operations | | | | | | | | | | | | | | | | | | |
| Net investment income | | 036 | | | | .016 | | | | .009 | | | | .015 | | | | .004 |
| Distributions from net investment income | | (.036) | | | | (.016) | | | | (.009) | | | | (.015) | | | | (.004) |
| Net asset value, end of period | | $ 1.00 | | | | $ 1.00 | | | | $ 1.00 | | | | $ 1.00 | | | | $ 1.00 |
| Total ReturnB,C | | 3.62% | | | | 1.57% | | | | .95% | | | | 1.51% | | | | .37% |
| Ratios to Average Net AssetsE | | | | | | | | | | | | | | | | | | |
| Expenses before reductions | | 28% | | | | .28% | | | | .28% | | | | .29% | | | | .27%A |
| Expenses net of fee waivers, if any | | 25% | | | | .25% | | | | .25% | | | | .25% | | | | .25%A |
| Expenses net of all reductions | | 25% | | | | .25% | | | | .25% | | | | .25% | | | | .25%A |
| Net investment income | | 3.65% | | | | 1.63% | | | | .94% | | | | 1.52% | | | | 1.44%A |
| Supplemental Data | | | | | | | | | | | | | | | | | | |
| Net assets, end of period (in millions) | | $ 132 | | | | $ 106 | | | | $ 114 | | | | $ 134 | | | | $ 5 |
A Annualized
B Total returns for periods of less than one year are not annualized.
C Total returns would have been lower had certain expenses not been reduced during the periods shown.
D For the period January 17, 2002 (commencement of sale of shares) to March 31, 2002.
E Expense ratios reflect operating expenses of the class. Expenses before reductions do not reflect amounts reimbursed by the investment adviser or expense offset arrangements and do not represent the amount paid by the class during periods when
reimbursements or reductions occur. Expense ratios before reductions for start up periods may not be representative of longer term operating periods. Expenses net of fee waivers reflect expenses after reimbursement by the investment adviser but
prior to reductions from expense offset arrangements. Expenses net of all reductions represent the net expenses paid by the class.
|
See accompanying notes which are an integral part of the financial statements.
|
33 Annual Report
| Money Market Portfolio | | | | | | |
| Investment Changes | | | | | | |
| |
| Maturity Diversification | | | | | | |
| Days | | % of fund’s | | % of fund’s | | % of fund’s |
| | | investments | | investments | | investments |
| | | 3/31/06 | | 9/30/05 | | 3/31/05 |
| 0 – 30 | | 62.1 | | 53.0 | | 48.3 |
| 31 – 90 | | 25.2 | | 35.2 | | 37.0 |
| 91 – 180 | | 5.3 | | 7.3 | | 13.5 |
| 181 – 397 | | 7.4 | | 4.5 | | 1.2 |
Weighted Average Maturity | | | | | | |
| | | 3/31/06 | | 9/30/05 | | 3/31/05 |
| Money Market Portfolio | | 45 Days | | 41 Days | | 44 Days |
| All Taxable Money Market Funds Average* | | 38 Days | | 38 Days | | 38 Days |
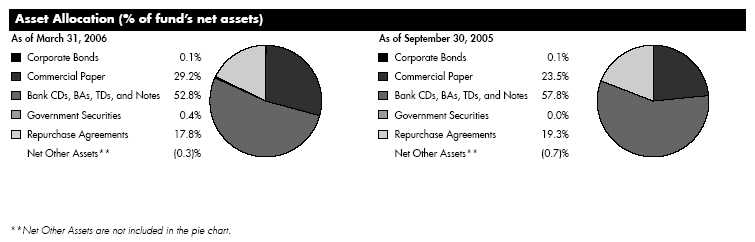
*Source: iMoneyNet, Inc.
Annual Report 34
| Money Market Portfolio | | | | | | | | |
| Investments March 31, 2006 |
| Showing Percentage of Net Assets | | | | | | |
| |
| Corporate Bonds 0.0% | | | | | | | | |
| Due | | Annualized Yield at | | Principal | | Value (Note 1) |
| Date | | Time of Purchase | | Amount (000s) | | (000s) |
| Morgan Stanley | | | | | | | | | | |
| 4/15/06 | | 3.90% | | | | | | $ 10,000 | | $ 10,008 |
| |
| Certificates of Deposit 27.1% | | | | | | | | | | |
| |
| Domestic Certificates Of Deposit 0.6% | | | | | | | | | | |
| Countrywide Bank, Alexandria Virginia | | | | | | | | | | |
| 5/15/06 | | 4.76 (c) | | | | | | 52,000 | | 51,998 |
| Washington Mutual Bank FA | | | | | | | | | | |
| 11/22/06 | | 4.79 | | | | | | 75,000 | | 74,950 |
| | | | | | | | | | | 126,948 |
| London Branch, Eurodollar, Foreign Banks – 10.9% | | | | | | | | | | |
| Calyon | | | | | | | | | | |
| 10/24/06 | | 4.92 | | | | | | 100,000 | | 99,900 |
| 2/12/07 | | 5.00 | | | | | | 105,000 | | 105,000 |
| Credit Industriel et Commercial | | | | | | | | | | |
| 4/20/06 | | 3.95 | | | | | | 75,000 | | 75,000 |
| 4/21/06 | | 3.97 | | | | | | 100,000 | | 100,000 |
| 6/8/06 | | 4.75 | | | | | | 105,000 | | 105,000 |
| 9/11/06 | | 5.01 | | | | | | 135,000 | | 135,000 |
| 10/24/06 | | 4.78 | | | | | | 70,000 | | 70,000 |
| 11/7/06 | | 4.76 | | | | | | 110,000 | | 110,000 |
| 3/30/07 | | 5.22 | | | | | | 85,000 | | 85,000 |
| Deutsche Bank AG | | | | | | | | | | |
| 1/30/07 | | 4.86 | | | | | | 160,000 | | 160,000 |
| HBOS Treasury Services PLC | | | | | | �� | | | | |
| 5/8/06 | | 4.67 | | | | | | 60,000 | | 60,000 |
| Landesbank Hessen Thuringen | | | | | | | | | | |
| 5/8/06 | | 4.67 | | | | | | 130,000 | | 130,000 |
| 5/15/06 | | 4.70 | | | | | | 79,000 | | 78,978 |
| 8/7/06 | | 4.83 | | | | | | 200,000 | | 200,000 |
| Societe Generale | | | | | | | | | | |
| 4/28/06 | | 4.00 | | | | | | 150,000 | | 150,000 |
| 5/10/06 | | 4.80 | | | | | | 325,000 | | 325,000 |
| 11/7/06 | | 4.91 | | | | | | 135,000 | | 135,000 |
| 12/6/06 | | 4.80 | | | | | | 75,000 | | 75,000 |
| Unicredito Italiano Spa | | | | | | | | | | |
| 5/19/06 | | 4.87 | | | | | | 20,000 | | 19,996 |
| | | | | | | | | | | 2,218,874 |
| New York Branch, Yankee Dollar, Foreign Banks – 15.6% | | | | | | | | | | |
| Bank Tokyo Mitsubishi UFJ Ltd. | | | | | | | | | | |
| 4/20/06 | | 4.76 | | | | | | 65,000 | | 65,000 |
| 4/24/06 | | 4.78 | | | | | | 80,000 | | 80,000 |
| 4/28/06 | | 4.81 | | | | | | 95,000 | | 95,000 |
| Barclays Bank PLC | | | | | | | | | | |
| 5/10/06 | | 4.80 | | | | | | 545,000 | | 544,998 |
| BNP Paribas SA | | | | | | | | | | |
| 10/30/06 | | 4.81 | | | | | | 160,000 | | 160,000 |
| 11/8/06 | | 4.93 | | | | | | 110,000 | | 110,000 |
| Due | | Annualized Yield at | | Principal | | Value (Note 1) |
| Date | | Time of Purchase | | Amount (000s) | | (000s) |
| Canadian Imperial Bank of Commerce | | | | | | | | | | |
| 4/18/06 | | 4.83% (c) | | | | $ 155,000 | | | | $ 155,000 |
| 4/24/06 | | 4.78 (c) | | | | 230,000 | | | | 230,000 |
| Credit Suisse First Boston New York Branch | | | | | | | | | | |
| 4/19/06 | | 4.57 (c) | | | | 90,000 | | | | 90,000 |
| 4/19/06 | | 4.76 (c) | | | | 80,000 | | | | 80,000 |
| 11/7/06 | | 4.75 | | | | 20,000 | | | | 20,000 |
| Deutsche Bank AG | | | | | | | | | | |
| 6/5/06 | | 4.80 (c) | | | | 155,000 | | | | 155,000 |
| 2/5/07 | | 4.90 | | | | 105,000 | | | | 105,000 |
| DZ Bank AG Deutsche Genosbank | | | | | | | | | | |
| 4/24/06 | | 4.79 | | | | 35,000 | | | | 35,000 |
| Eurohypo AG | | | | | | | | | | |
| 5/2/06 | | 4.88 | | | | 85,000 | | | | 85,000 |
| 5/8/06 | | 4.90 | | | | 35,000 | | | | 35,000 |
| 6/29/06 | | 4.72 (a) | | | | 87,000 | | | | 87,000 |
| Landesbank Hessen Thuringen | | | | | | | | | | |
| 4/3/06 | | 4.50 | | | | 125,000 | | | | 125,000 |
| Mizuho Corporate Bank Ltd. | | | | | | | | | | |
| 5/8/06 | | 4.82 | | | | 135,000 | | | | 135,000 |
| 5/10/06 | | 4.83 | | | | 140,000 | | | | 140,000 |
| Skandinaviska Enskilda Banken AB | | | | | | | | | | |
| 4/6/06 | | 4.50 (c) | | | | 170,000 | | | | 169,993 |
| Sumitomo Mitsui Banking Corp. | | | | | | | | | | |
| 4/10/06 | | 4.69 | | | | 17,000 | | | | 17,000 |
| 4/17/06 | | 4.75 | | | | 33,000 | | | | 33,000 |
| 4/20/06 | | 4.77 | | | | 27,000 | | | | 27,000 |
| 4/21/06 | | 4.80 | | | | 27,000 | | | | 27,000 |
| 4/24/06 | | 4.80 | | | | 21,000 | | | | 21,000 |
| 4/28/06 | | 4.82 | | | | 28,000 | | | | 28,000 |
| 5/4/06 | | 4.81 | | | | 82,000 | | | | 82,000 |
| Toronto Dominion Bank | | | | | | | | | | |
| 4/7/06 | | 3.86 | | | | 65,000 | | | | 65,000 |
| 4/18/06 | | 3.92 | | | | 75,000 | | | | 75,000 |
| Unicredito Italiano Spa | | | | | | | | | | |
| 5/12/06 | | 4.69 (c) | | | | 105,000 | | | | 104,998 |
| | | | | | | | | | | 3,181,989 |
| |
| TOTAL CERTIFICATES OF DEPOSIT | | | | | | | | 5,527,811 |
| |
| Commercial Paper 29.2% | | | | | | | | | | |
| |
| Bavaria TRR Corp. | | | | | | | | | | |
| 4/4/06 | | 4.66 | | | | 100,000 | | | | 99,961 |
| 4/6/06 | | 4.68 | | | | 60,000 | | | | 59,961 |
| 4/20/06 | | 4.78 | | | | 179,325 | | | | 178,874 |
| 4/26/06 | | 4.82 | | | | 174,661 | | | | 174,079 |
| Capital One Multi Asset Execution Trust | | | | | | | | | | |
| 4/12/06 | | 4.70 | | | | 20,900 | | | | 20,870 |
| 5/15/06 | | 4.81 | | | | 60,000 | | | | 59,650 |
See accompanying notes which are an integral part of the financial statements.
35 Annual Report
| Money Market Portfolio | | | | | | | | |
| Investments - continued | | | | | | | | |
| |
| |
Commercial Paper continued
| | | | |
| Due | | Annualized Yield at | | Principal | | Value (Note 1) |
| Date | | Time of Purchase | | Amount (000s) | | (000s) |
| Charta LLC | | | | | | | | | | |
| 4/19/06 | | 4.66% | | | | $ 150,000 | | | | $ 149,654 |
| 5/16/06 | | 4.71 | | | | 60,000 | | | | 59,650 |
| CIESCO LP | | | | | | | | | | |
| 5/15/06 | | 4.70 | | | | 75,000 | | | | 74,574 |
| Citibank Credit Card Master Trust I (Dakota Certificate Program) | | | | | | | | | | |
| 4/3/06 | | 4.53 | | | | 115,000 | | | | 114,971 |
| 4/4/06 | | 4.53 | | | | 36,000 | | | | 35,987 |
| 4/4/06 | | 4.54 | | | | 35,900 | | | | 35,887 |
| 4/10/06 | | 4.63 | | | | 78,602 | | | | 78,512 |
| 5/8/06 | | 4.81 | | | | 14,000 | | | | 13,931 |
| 5/10/06 | | 4.82 | | | | 30,000 | | | | 29,852 |
| Citigroup Funding, Inc. | | | | | | | | | | |
| 4/6/06 | | 4.53 | | | | 70,000 | | | | 69,956 |
| ConocoPhillips | | | | | | | | | | |
| 5/3/06 | | 4.85 | | | | 8,000 | | | | 7,966 |
| 5/23/06 | | 4.95 | | | | 4,000 | | | | 3,972 |
| 6/19/06 | | 5.02 | | | | 10,000 | | | | 9,891 |
| Countrywide Financial Corp. | | | | | | | | | | |
| 5/26/06 | | 4.81 | | | | 60,000 | | | | 59,565 |
| Credit Suisse First Boston New York Branch | | | | | | | | | | |
| 4/3/06 | | 4.61 | | | | 290,000 | | | | 289,926 |
| Cullinan Finance Corp. | | | | | | | | | | |
| 4/6/06 | | 4.54 (b) | | | | 28,299 | | | | 28,281 |
| 4/7/06 | | 4.54 (b) | | | | 35,000 | | | | 34,974 |
| 5/8/06 | | 4.69 (b) | | | | 12,105 | | | | 12,047 |
| Danske Corp. | | | | | | | | | | |
| 11/10/06 | | 4.89 | | | | 150,000 | | | | 145,577 |
| Emerald (MBNA Credit Card Master Note Trust) | | | | | | | | | | |
| 4/3/06 | | 4.64 | | | | 95,000 | | | | 94,976 |
| 4/4/06 | | 4.52 | | | | 95,000 | | | | 94,965 |
| 4/12/06 | | 4.63 | | | | 20,000 | | | | 19,972 |
| 5/4/06 | | 4.81 | | | | 193,137 | | | | 192,291 |
| 5/11/06 | | 4.71 | | | | 39,000 | | | | 38,799 |
| 5/30/06 | | 4.81 | | | | 20,000 | | | | 19,844 |
| FCAR Owner Trust | | | | | | | | | | |
| 4/3/06 | | 4.50 | | | | 100,000 | | | | 99,975 |
| 4/4/06 | | 4.50 | | | | 35,000 | | | | 34,987 |
| 4/4/06 | | 4.52 | | | | 60,000 | | | | 59,978 |
| 5/4/06 | | 4.80 | | | | 55,000 | | | | 54,760 |
| 6/2/06 | | 4.81 | | | | 49,000 | | | | 48,599 |
| 6/2/06 | | 4.83 | | | | 35,000 | | | | 34,712 |
| 7/17/06 | | 4.76 | | | | 150,000 | | | | 147,927 |
| 7/25/06 | | 4.75 | | | | 35,000 | | | | 34,481 |
| 9/25/06 | | 5.08 | | | | 75,000 | | | | 73,175 |
| Giro Funding US Corp. | | | | | | | | | | |
| 4/3/06 | | 4.62 | | | | 30,000 | | | | 29,992 |
| 5/8/06 | | 4.69 | | | | 26,720 | | | | 26,593 |
| 6/15/06 | | 4.91 | | | | 26,356 | | | | 26,090 |
| Due | | Annualized Yield at | | Principal | | Value (Note 1) |
| Date | | Time of Purchase | | Amount (000s) | | (000s) |
| Grampian Funding LLC | | | | | | | | | | |
| 9/25/06 | | 5.08% | | | | $ 65,000 | | | | $ 63,418 |
| HVB U.S. Finance, Inc. | | | | | | | | | | |
| 4/10/06 | | 4.55 | | | | 65,000 | | | | 64,927 |
| Monument Gardens Funding | | | | | | | | | | |
| 4/19/06 | | 4.80 | | | | 110,000 | | | | 109,737 |
| 4/20/06 | | 4.80 | | | | 207,699 | | | | 207,175 |
| 4/24/06 | | 4.80 | | | | 139,531 | | | | 139,105 |
| 4/25/06 | | 4.80 | | | | 55,000 | | | | 54,825 |
| 5/22/06 | | 4.77 | | | | 10,000 | | | | 9,933 |
| 5/23/06 | | 4.79 | | | | 15,000 | | | | 14,898 |
| Motown Notes Program | | | | | | | | | | |
| 4/5/06 | | 4.66 | | | | 111,500 | | | | 111,443 |
| 4/7/06 | | 4.64 | | | | 60,000 | | | | 59,954 |
| 4/10/06 | | 4.56 | | | | 25,000 | | | | 24,972 |
| 4/10/06 | | 4.69 | | | | 50,000 | | | | 49,942 |
| 5/2/06 | | 4.68 | | | | 12,000 | | | | 11,952 |
| 5/5/06 | | 4.71 | | | | 65,000 | | | | 64,715 |
| 5/8/06 | | 4.84 | | | | 15,000 | | | | 14,926 |
| 5/17/06 | | 4.85 | | | | 15,000 | | | | 14,908 |
| 6/5/06 | | 4.87 | | | | 35,000 | | | | 34,696 |
| Paradigm Funding LLC | | | | | | | | | | |
| 4/4/06 | | 4.64 | | | | 164,657 | | | | 164,594 |
| 4/5/06 | | 4.67 | | | | 77,000 | | | | 76,960 |
| Park Granada LLC | | | | | | | | | | |
| 4/5/06 | | 4.51 | | | | 50,000 | | | | 49,975 |
| 5/1/06 | | 4.74 | | | | 40,000 | | | | 39,843 |
| 5/8/06 | | 4.80 | | | | 140,580 | | | | 139,891 |
| Park Sienna LLC | | | | | | | | | | |
| 4/5/06 | | 4.66 | | | | 55,977 | | | | 55,948 |
| 4/6/06 | | 4.68 | | | | 40,000 | | | | 39,974 |
| 4/24/06 | | 4.74 | | | | 35,000 | | | | 34,895 |
| 5/9/06 | | 4.80 | | | | 61,433 | | | | 61,124 |
| 5/9/06 | | 4.81 | | | | 76,628 | | | | 76,241 |
| Sigma Finance, Inc. | | | | | | | | | | |
| 4/18/06 | | 4.70 (c) | | | | 200,000 | | | | 199,984 |
| Skandinaviska Enskilda Banken AB | | | | | | | | | | |
| 4/28/06 | | 4.79 (c) | | | | 125,000 | | | | 125,000 |
| Strand Capital LLC | | | | | | | | | | |
| 4/10/06 | | 4.57 | | | | 10,000 | | | | 9,989 |
| 5/10/06 | | 4.70 | | | | 15,000 | | | | 14,925 |
| 5/10/06 | | 4.71 | | | | 15,000 | | | | 14,924 |
| 5/15/06 | | 4.73 | | | | 15,000 | | | | 14,914 |
| 9/25/06 | | 5.09 | | | | 165,000 | | | | 160,976 |
| Stratford Receivables Co. LLC | | | | | | | | | | |
| 4/5/06 | | 4.64 | | | | 30,000 | | | | 29,985 |
| 4/10/06 | | 4.65 | | | | 59,783 | | | | 59,714 |
| 4/12/06 | | 4.68 | | | | 85,000 | | | | 84,879 |
| 4/13/06 | | 4.69 | | | | 10,000 | | | | 9,984 |
| 4/18/06 | | 4.68 | | | | 60,000 | | | | 59,869 |
| 4/19/06 | | 4.71 | | | | 80,000 | | | | 79,812 |
See accompanying notes which are an integral part of the financial statements.
Annual Report 36
| Commercial Paper continued | | | | | | | | | | |
| Due | | Annualized Yield at | | Principal | | Value (Note 1) |
| Date | | Time of Purchase | | Amount (000s) | | (000s) |
| Stratford Receivables Co. LLC – continued | | | | | | | | | | |
| 5/4/06 | | 4.83% | | | | $ 30,000 | | | | $ 29,868 |
| 5/8/06 | | 4.81 | | | | 55,000 | | | | 54,730 |
| 5/10/06 | | 4.81 | | | | 58,061 | | | | 57,760 |
| 5/12/06 | | 4.84 | | | | 35,000 | | | | 34,808 |
| 5/15/06 | | 4.79 | | | | 63,544 | | | | 63,175 |
| White Pine Finance LLC | | | | | | | | | | |
| 4/3/06 | | 4.58 (b)(c) | | | | 74,000 | | | | 73,998 |
| TOTAL COMMERCIAL PAPER | | | | | | | | | | 5,950,949 |
| |
| U.S. Treasury Obligations 0.4% | | | | | | | | | | |
| |
| U.S. Treasury Bills – 0.4% | | | | | | | | | | |
| 8/3/06 | | 4.50 | | | | 88,980 | | | | 87,631 |
| |
| Bank Notes 0.1% | | | | | | | | | | |
| |
| M&I Marshall & Ilsley Bank | | | | | | | | | | |
| 4/18/06 | | 4.73 (c) | | | | 15,000 | | | | 15,000 |
| |
| Master Notes 2.1% | | | | | | | | | | |
| |
| Goldman Sachs Group, Inc. | | | | | | | | | | |
| 4/11/06 | | 4.78 (c)(e) | | | | 206,000 | | | | 206,000 |
| 5/30/06 | | 4.85 (c)(e) | | | | 221,000 | | | | 221,000 |
| TOTAL MASTER NOTES | | | | | | | | | | 427,000 |
| |
| Medium Term Notes 20.4% | | | | | | | | | | |
| |
| AIG Matched Funding Corp. | | | | | | | | | | |
| 4/3/06 | | 4.54 (c) | | | | 70,000 | | | | 70,000 |
| 4/11/06 | | 4.57 (c) | | | | 70,000 | | | | 70,000 |
| 4/23/06 | | 4.62 (c) | | | | 75,000 | | | | 75,000 |
| 6/15/06 | | 4.93 (c) | | | | 85,000 | | | | 85,000 |
| Allstate Life Global Funding II | | | | | | | | | | |
| 4/10/06 | | 4.71 (b)(c) | | | | 25,000 | | | | 25,000 |
| 4/18/06 | | 4.77 (b)(c) | | | | 20,000 | | | | 20,000 |
| 4/18/06 | | 4.81 (b)(c) | | | | 25,000 | | | | 25,000 |
| 4/27/06 | | 4.81 (b)(c) | | | | 11,000 | | | | 11,000 |
| Australia & New Zealand Banking Group Ltd. | | | | | | | | | | |
| 4/24/06 | | 4.78 (b)(c) | | | | 44,000 | | | | 44,000 |
| Bayerische Landesbank Girozentrale | | | | | | | | | | |
| 4/18/06 | | 4.58 (c) | | | | 115,000 | | | | 115,000 |
| 5/19/06 | | 4.78 (c) | | | | 155,000 | | | | 155,000 |
| BMW U.S. Capital LLC | | | | | | | | | | |
| 4/18/06 | | 4.72 (c) | | | | 19,000 | | | | 19,000 |
| Commonwealth Bank of Australia | | | | | | | | | | |
| 4/24/06 | | 4.78 (c) | | | | 41,000 | | | | 41,000 |
| Due | | Annualized Yield at | | Principal | | Value (Note 1) |
| Date | | Time of Purchase | | Amount (000s) | | (000s) |
| Countrywide Bank, Alexandria Virginia | | | | | | | | | | |
| 4/18/06 | | 4.76% (c) | | | | $ 44,000 | | | | $ 43,998 |
| Cullinan Finance Corp. | | | | | | | | | | |
| 4/7/06 | | 4.63 (b)(c) | | | | 75,000 | | | | 74,986 |
| 4/18/06 | | 4.71 (b)(c) | | | | 45,000 | | | | 44,998 |
| 4/25/06 | | 4.78 (b)(c) | | | | 25,000 | | | | 24,998 |
| Eli Lilly Services, Inc. | | | | | | | | | | |
| 4/3/06 | | 4.60 (b)(c) | | | | 40,000 | | | | 40,000 |
| GE Capital Assurance Co. | | | | | | | | | | |
| 4/3/06 | | 4.71 (c)(e) | | | | 40,000 | | | | 40,000 |
| General Electric Capital Corp. | | | | | | | | | | |
| 4/7/06 | | 4.69 (c) | | | | 200,000 | | | | 200,000 |
| HBOS Treasury Services PLC | | | | | | | | | | |
| 5/22/06 | | 4.84 (b)(c) | | | | 18,000 | | | | 18,005 |
| 6/26/06 | | 5.00 (c) | | | | 150,000 | | | | 150,000 |
| HSBC Finance Corp. | | | | | | | | | | |
| 4/6/06 | | 4.65 (c) | | | | 250,000 | | | | 250,000 |
| 4/24/06 | | 4.84 (c) | | | | 51,000 | | | | 51,000 |
| HSBC USA, Inc. | | | | | | | | | | |
| 4/18/06 | | 4.73 (c) | | | | 100,000 | | | | 100,000 |
| HSH Nordbank AG | | | | | | | | | | |
| 4/24/06 | | 4.80 (b)(c) | | | | 54,000 | | | | 54,000 |
| ING USA Annuity & Life Insurance Co. | | | | | | | | | | |
| 6/26/06 | | 5.03 (c)(e) | | | | 30,000 | | | | 30,000 |
| Links Finance LLC | | | | | | | | | | |
| 4/18/06 | | 4.70 (b)(c) | | | | 80,000 | | | | 79,992 |
| 4/19/06 | | 4.73 (b)(c) | | | | 80,000 | | | | 79,991 |
| 6/23/06 | | 4.87 (b)(c) | | | | 65,000 | | | | 64,994 |
| MBIA Global Funding LLC | | | | | | | | | | |
| 4/18/06 | | 4.56 (b)(c) | | | | 23,000 | | | | 23,000 |
| Merrill Lynch & Co., Inc. | | | | | | | | |
| 4/4/06 | | 4.72 (c) | | | | 37,000 | | | | 37,029 |
| 4/18/06 | | 4.73 (c) | | | | 82,000 | | | | 82,000 |
| Metropolitan Life Insurance Co. | | | | | | | | | | |
| 4/6/06 | | 4.67 (b)(c) | | | | 40,994 | | | | 40,994 |
| Morgan Stanley | | | | | | | | | | |
| 4/3/06 | | 4.66 (c) | | | | 150,000 | | | | 150,000 |
| 4/3/06 | | 4.91 (c) | | | | 25,000 | | | | 25,000 |
| 4/4/06 | | 4.72 (c) | | | | 40,000 | | | | 40,000 |
| 4/18/06 | | 4.78 (c) | | | | 57,000 | | | | 57,000 |
| 4/27/06 | | 4.89 (c) | | | | 107,000 | | | | 107,003 |
| Nationwide Building Society | | | | | | | | | | |
| 6/28/06 | | 5.02 (b)(c) | | | | 20,000 | | | | 20,010 |
| Nordea Bank AB | | | | | | | | | | |
| 4/9/06 | | 4.68 (b)(c) | | | | 50,000 | | | | 50,000 |
| 4/11/06 | | 4.70 (b)(c) | | | | 45,000 | | | | 45,004 |
| Northern Rock PLC | | | | | | | | | | |
| 4/5/06 | | 4.66 (b)(c) | | | | 45,000 | | | | 45,000 |
| Pacific Life Global Funding | | | | | | | | | | |
| 4/4/06 | | 4.68 (b)(c) | | | | 25,000 | | | | 25,000 |
See accompanying notes which are an integral part of the financial statements.
37 Annual Report
| Money Market Portfolio | | | | | | | | |
| Investments - continued | | | | | | | | |
| |
| |
| Medium Term Notes continued | | | | | | |
| Due | | Annualized Yield at | | Principal | | Value (Note 1) |
| Date | | Time of Purchase | | Amount (000s) | | (000s) |
| Pacific Life Global Funding – continued | | | | | | | | | | |
| 4/13/06 | | 4.74% (c) | | | | $ 10,000 | | | | $ 10,000 |
| RACERS | | | | | | | | | | |
| 4/24/06 | | 4.79 (b)(c) | | | | 170,000 | | | | 170,000 |
| Royal Bank of Canada | | | | | | | | | | |
| 4/10/06 | | 4.73 (c) | | | | 20,000 | | | | 20,000 |
| Royal Bank of Scotland PLC | | | | | | | | | | |
| 4/21/06 | | 4.75 (b)(c) | | | | 100,000 | | | | 100,000 |
| SBC Communications, Inc. | | | | | | | | | | |
| 6/5/06 | | 3.96 (b) | | | | 34,640 | | | | 34,662 |
| Security Life of Denver Insurance Co. | | | | | | | | | | |
| 5/30/06 | | 4.89 (c)(e) | | | | 20,000 | | | | 20,000 |
| SLM Corp. | | | | | | | | | | |
| 9/30/06 | | 4.74 | | | | 25,000 | | | | 24,832 |
| Travelers Insurance Co. | | | | | | | | | | |
| 7/1/06 | | 4.92 (c)(e) | | | | 30,000 | | | | 30,000 |
| Verizon Global Funding Corp. | | | | | | | | | | |
| 6/15/06 | | 5.02 (b)(c) | | | | 272,000 | | | | 272,000 |
| Wachovia Asset Securitization Issuance LLC | | | | | | | | | | |
| 4/25/06 | | 4.81 (b)(c) | | | | 15,002 | | | | 15,002 |
| Washington Mutual Bank FA | | | | | | | | | | |
| 4/18/06 | | 4.73 (c) | | | | 24,000 | | | | 24,000 |
| 4/24/06 | | 4.79 (c) | | | | 60,000 | | | | 60,000 |
| Washington Mutual Bank, California | | | | | | | | | | |
| 4/27/06 | | 4.62 (c) | | | | 100,000 | | | | 100,000 |
| 5/31/06 | | 4.74 (c) | | | | 94,000 | | | | 94,000 |
| 6/20/06 | | 4.91 (c) | | | | 81,000 | | | | 81,000 |
| 7/26/06 | | 4.98 (c) | | | | 100,000 | | | | 99,998 |
| WestLB AG | | | | | | | | | | |
| 4/10/06 | | 4.74 (b)(c) | | | | 58,000 | | | | 58,000 |
| 6/30/06 | | 4.99 (b)(c) | | | | 59,000 | | | | 59,000 |
| Westpac Banking Corp. | | | | | | | | | | |
| 6/12/06 | | 4.93 (c) | | | | 40,000 | | | | 40,000 |
| TOTAL MEDIUM-TERM NOTES | | | | | | | | 4,161,496 |
| |
| Short Term Notes 3.0% | | | | | | | | | | |
| |
| Hartford Life Insurance Co. | | | | | | | | | | |
| 6/1/06 | | 4.97 (c)(e) | | | | 65,000 | | | | 65,000 |
| Jackson National Life Insurance Co. | | | | | | | | | | |
| 4/1/06 | | 4.67 (c)(e) | | | | 47,000 | | | | 47,000 |
| Metropolitan Life Insurance Co. | | | | | | | | | | |
| 4/3/06 | | 4.65 (c)(e) | | | | 65,000 | | | | 65,000 |
| 4/28/06 | | 4.89 (b)(c) | | | | 25,000 | | | | 25,000 |
| Monumental Life Insurance Co. | | | | | | | | | | |
| 4/3/06 | | 4.77 (c)(e) | | | | 36,000 | | | | 36,000 |
| 4/3/06 | | 4.80 (c)(e) | | | | 55,000 | | | | 55,000 |
| Due | | Annualized Yield at | | Principal | | Value (Note 1) |
| Date | | Time of Purchase | | Amount (000s) | | (000s) |
| |
| New York Life Insurance Co. | | | | | | | | | | | | |
| 4/3/06 | | 4.66% (c)(e) | | | | | | $ 215,000 | | | | $ 215,000 |
| Transamerica Occidental Life Insurance Co. | | | | | | | | | | | | |
| 5/2/06 | | 4.85 (c)(e) | | | | | | 95,000 | | | | 95,000 |
| |
| TOTAL SHORT TERM NOTES | | | | | | | | | | | | 603,000 |
| |
| Asset Backed Securities 0.1% | | | | | | | | | | | | |
| |
| Wind Trust | | | | | | | | | | | | |
| 2/25/07 | | 4.82 (b)(c) | | | | | | 19,000 | | | | 19,000 |
| |
| Municipal Securities 0.1% | | | | | | | | | | | | |
| |
| California Statewide Cmntys. Dev. | | | | | | | | | | | | |
| Auth. Rev. TRAN Series C4, | | | | | | | | | | | | |
| 3.93% 6/30/06 | | | | | | | | 28,000 | | | | 28,000 |
| |
| Repurchase Agreements 17.8% | | | | | | | | | | | | |
| |
| | | | | Maturity | | | | |
| | | | | Amount (000s) | | | | |
| |
| In a joint trading account | | | | | | | | | | | | |
| (Collateralized by U.S. Government | | | | | | | | | | | | |
| Obligations dated 3/31/06 due | | | | | | | | | | | | |
| 4/3/06 At 4.85%) | | | | | | | | $ 3,758 | | | | 3,756 |
| With: | | | | | | | | | | | | |
| Banc of America Securities LLC At | | | | | | | | | | | | |
| 4.92%, dated 3/31/06 due | | | | | | | | | | | | |
| 4/3/06 (Collateralized by | | | | | | | | | | | | |
| Mortgage Loan Obligations valued | | | | | | | | | | | | |
| at $561,750,001, 0% 7.18%, | | | | | | | | | | | | |
| 2/25/08 – 7/10/39) | | | | | | | | 535,219 | | | | 535,000 |
| Citigroup Global Markets, Inc. At: | | | | | | | | | | | | |
| 4.94%, dated 3/31/06 due | | | | | | | | | | | | |
| 4/3/06 (Collateralized by | | | | | | | | | | | | |
| Mortgage Loan Obligations | | | | | | | | | | | | |
| valued at $595,350,001, | | | | | | | | | | | | |
| 5.35%, 8/25/35) | | | | | | | | 567,233 | | | | 567,000 |
| 4.98%, dated 3/31/06 due | | | | | | | | | | | | |
| 4/3/06 (Collateralized by | | | | | | | | | | | | |
| Corporate Obligations valued at | | | | | | | | | | | | |
| $79,800,000, 5.39% 11.13%, | | | | | | | | | | | | |
| 10/15/09 – 8/15/31) | | | | | | | | 76,032 | | | | 76,000 |
| Credit Suisse First Boston, Inc. At | | | | | | | | | | | | |
| 4.97%, dated 3/31/06 due | | | | | | | | | | | | |
| 4/3/06 (Collateralized by | | | | | | | | | | | | |
| Mortgage Loan Obligations valued | | | | | | | | | | | | |
| at $528,153,682, 0% 9.25%, | | | | | | | | | | | | |
| 2/15/10 – 3/6/51) | | | | | | | | 503,208 | | | | 503,000 |
| Deutsche Bank Securities, Inc. At | | | | | | | | | | | | |
| 5.01%, dated 3/31/06 due | | | | | | | | | | | | |
| 4/3/06 (Collateralized by | | | | | | | | | | | | |
| Mortgage Loan Obligations | | | | | | | | | | | | |
| valued at $592,200,001, | | | | | | | | | | | | |
| 4.89%, 1/25/46) | | | | | | | | 564,235 | | | | 564,000 |
See accompanying notes which are an integral part of the financial statements.
Annual Report 38
| Repurchase Agreements continued | | |
| |
| | | Maturity | | Value (Note 1) |
| | | Amount (000s) | | (000s) |
| |
| With: continued | | | | |
| Goldman Sachs & Co. At 4.98%, | | | | |
| dated: | | | | |
| 2/22/06 due 5/23/06 | | | | |
| (Collateralized by Mortgage | | | | |
| Loan Obligations valued at | | | | |
| $331,500,001, 0.29% 9.32%, | | | | |
| 7/15/09 8/28/46) (c)(d) | | $ 329,046 | | $ 325,000 |
| 3/31/06 due 4/3/06 | | | | |
| (Collateralized by Corporate | | | | |
| Obligations valued at | | | | |
| $242,550,921, 0% 8.5%, | | | | |
| 6/15/06 – 11/30/35) | | 231,096 | | 231,000 |
| Lehman Brothers, Inc. At: | | | | |
| 4.9%, dated 3/31/06 due 4/3/06 | | | | |
| (Collateralized by Mortgage | | | | |
| Loan Obligations valued at | | | | |
| $579,600,025, 0% 18%, | | | | |
| 6/25/08 – 7/15/56) | | 552,225 | | 552,000 |
| 5%, dated 3/31/06 due 4/3/06 | | | | |
| (Collateralized by Corporate | | | | |
| Obligations valued at | | | | |
| $274,053,951, 0% 10.75%, | | | | |
| 4/10/06 – 12/15/65) | | 261,109 | | 261,000 |
| |
| TOTAL REPURCHASE AGREEMENTS | | | | 3,617,756 |
| |
| |
| TOTAL INVESTMENT PORTFOLIO 100.3% | | | | |
| (Cost $20,447,651) | | | | 20,447,651 |
| |
| |
| NET OTHER ASSETS (0.3)% | | | | (66,339) |
| |
| NET ASSETS 100% | | | | $ 20,381,312 |
| Security Type Abbreviation |
TRAN — TAX AND REVENUE ANTICIPATION NOTE |
Legend
(a) Debt obligation initially issued at one coupon which converts to a higher
coupon at a specified date. The rate shown is the rate at period end.
(b) Security exempt from registration under Rule 144A of the Securities
Act of 1933. These securities may be resold in transactions exempt from
registration, normally to qualified institutional buyers. At the period end,
the value of these securities amounted to $1,757,936,000 or 8.6% of net
assets.
(c) The coupon rate shown on floating or adjustable rate securities represents
the rate at period end. The due dates on these types of securities reflect
the next interest rate reset date or, when applicable, the final maturity
date.
(d) The maturity amount is based on the rate at period end.
|
(e) Restricted securities – Investment in securities not registered under the
Securities Act of 1933 (excluding 144A issues). At the end of the period,
the value of restricted securities (excluding 144A issues) amounted to
$1,125,000,000 or 5.5% of net assets.
Additional information on each holding is as follows:
|
| | | Acquisition | | | | Cost |
| Security | | Date | | | | (000s) |
| GE Capital Assurance Co. | | | | | | |
| 4.71%, 4/3/06 | | 4/1/05 | | | | $ 40,000 |
| Goldman Sachs Group, Inc.: | | | | | | |
| 4.78%, 4/11/06 | | 10/11/05 | | | | $ 206,000 |
| 4.85%, 5/30/06 | | 8/26/04 | | | | $ 221,000 |
| Hartford Life Insurance Co. | | | | | | |
| 4.97%, 6/1/06 | | 12/16/03 | | | | $ 65,000 |
| ING USA Annuity & Life Insurance Co. | | | | | | |
| 5.03%, 6/26/06 | | 6/23/05 | | | | $ 30,000 |
| Jackson National Life Insurance Co. | | | | | | |
| 4.67%, 4/1/06 | | 3/31/03 | | | | $ 47,000 |
| Metropolitan Life Insurance Co. | | | | | | |
| 4.65%, 4/3/06 | | 3/26/02 | | | | $ 65,000 |
| Monumental Life Insurance Co.: | | 7/31/98 - | | | | |
| 4.77%, 4/3/06 | | 9/17/98 | | | | $ 36,000 |
| 4.80%, 4/3/06 | | 3/12/99 | | | | $ 55,000 |
| New York Life Insurance Co. | | 2/28/02 - | | | | |
| 4.66%, 4/3/06 | | 12/19/02 | | | | $ 215,000 |
| Security Life of Denver Insurance Co. | | | | | | |
| 4.89%, 5/30/06 | | 8/26/05 | | | | $ 20,000 |
| Transamerica Occidental Life | | | | | | |
| Insurance Co. 4.85%, 5/2/06 | | 4/28/00 | | | | $ 95,000 |
| Travelers Insurance Co. | | | | | | |
| 4.92%, 7/1/06 | | 3/31/06 | | | | $ 30,000 |
Income Tax Information
At March 31, 2006, the fund had a capital loss carryforward of approximately $3,944,000 of which $414,000, $535,000, $517,000 and $2,478,000 will expire on March 31, 2011, 2012, 2013 and 2014, respectively.
See accompanying notes which are an integral part of the financial statements.
39 Annual Report
| Money Market Portfolio | | | | |
| |
| Financial Statements | | |
| |
| |
| Statement of Assets and Liabilities | | |
| Amounts in thousands (except per share amounts) | | March 31, 2006 |
| |
| Assets | | | | |
| Investment in securities, at value | | | | |
| (including repurchase agreements | | | | |
| of $3,617,756) — See | | | | |
| accompanying schedule: | | | | |
| Unaffiliated issuers | | | | |
| (cost $20,447,651) | | | | $ 20,447,651 |
| Cash | | | | 2,848 |
| Receivable for investments sold | | | | 30,000 |
| Receivable for fund shares sold | | | | 34,340 |
| Interest receivable | | | | 65,600 |
| Prepaid expenses | | | | 50 |
| Receivable from investment adviser | | | | |
| for expense reductions | | | | 736 |
| Other affiliated receivables | | | | 121 |
| Total assets | | | | 20,581,346 |
| |
| Liabilities | | | | |
| Payable for investments purchased | | $ 161,930 | | |
| Payable for fund shares redeemed | | 13,016 | | |
| Distributions payable | | 20,668 | | |
| Accrued management fee | | 3,379 | | |
| Distribution fees payable | | 270 | | |
| Other affiliated payables | | 684 | | |
| Other payables and accrued | | | | |
| expenses | | 87 | | |
| Total liabilities | | | | 200,034 |
| |
| Net Assets | | | | $ 20,381,312 |
| Net Assets consist of: | | | | |
| Paid in capital | | | | $ 20,385,475 |
| Distributions in excess of net invest- | | | | |
| ment income | | | | (126) |
| Accumulated undistributed net real- | | | | |
| ized gain (loss) on investments | | | | (4,037) |
| Net Assets | | | | $ 20,381,312 |
| Class I: | | | | |
| Net Asset Value, offering price and | | | | |
| redemption price per share | | | | |
| ($18,847,676 ÷ 18,850,387 | | | | |
| shares) | | | | $ 1.00 |
| Class II: | | | | |
| Net Asset Value, offering price and | | | | |
| redemption price per share | | | | |
| ($318,779 ÷ 318,855 shares) | | | | $ 1.00 |
| Class III: | | | | |
| Net Asset Value, offering price and | | | | |
| redemption price per share | | | | |
| ($1,073,755 ÷ 1,074,295 | | | | |
| shares) | | | | $ 1.00 |
| Select Class: | | | | |
| Net Asset Value, offering price and | | | | |
| redemption price per share | | | | |
| ($141,102 ÷ 141,126 shares) | | | | $ 1.00 |
| Statement of Operations | | | | |
| Amounts in thousands | | | | Year ended March 31, 2006 |
| |
| Investment Income | | | | | | |
| Interest (including $41 from | | | | | | |
| affiliated interfund lending) | | | | | | $ 612,797 |
| |
| Expenses | | | | | | |
| Management fee | | | | $ 31,624 | | |
| Transfer agent fees | | | | 2,484 | | |
| Distribution fees | | | | 2,799 | | |
| Accounting fees and expenses | | | | 1,122 | | |
| Independent trustees’ compensation | | | | 65 | | |
| Appreciation in deferred trustee | | | | | | |
| compensation account | | | | 7 | | |
| Custodian fees and expenses | | | | 215 | | |
| Registration fees | | | | 243 | | |
| Audit | | | | 108 | | |
| Legal | | | | 35 | | |
| Miscellaneous | | | | 145 | | |
| Total expenses before reductions | | . | | 38,847 | | |
| Expense reductions | | | | (7,731) | | 31,116 |
| |
| Net investment income | | | | | | 581,681 |
| Realized and Unrealized Gain | | | | | | |
| (Loss) | | | | | | |
| Net realized gain (loss) on: | | | | | | |
| Investment securities: | | | | | | |
| Unaffiliated issuers | | | | | | (83) |
| Net increase in net assets resulting | | | | | | |
| from operations | | | | | | $ 581,598 |
See accompanying notes which are an integral part of the financial statements.
Annual Report 40
| Statement of Changes in Net Assets | | | | | | | | | | | | | | | | | | | | |
| | | | | | | | | | | | | | | Year ended | | | | Year ended |
| | | | | | | | | | | | | | | March 31, | | | | March 31, |
| Amounts in thousands | | | | | | | | | | | | | | 2006 | | | | 2005 |
| Increase (Decrease) in Net Assets | | | | | | | | | | | | | | | | | | | | |
| Operations | | | | | | | | | | | | | | | | | | | | |
| Net investment income | | | | | | | | | | | | | | $ 581,681 | | | | $ 266,931 |
| Net realized gain (loss) | | | | | | | | | | | | | | (83) | | | | (2,674) |
| Net increase in net assets resulting from operations | | | | | | | | | | | | | | 581,598 | | | | 264,257 |
| Distributions to shareholders from net investment income | | | | | | | | | | | | | | (581,650) | | | | (267,263) |
| Share transactions - net increase (decrease) | | | | | | | | | | | | | | 7,882,458 | | | | (7,217,115) |
| Total increase (decrease) in net assets | | | | | | | | | | | | | | 7,882,406 | | | | (7,220,121) |
| |
| Net Assets | | | | | | | | | | | | | | | | | | | | |
| Beginning of period | | | | | | | | | | | | | | 12,498,906 | | | | 19,719,027 |
| End of period (including distributions in excess of net investment income of $126 and distributions in excess of net | | | | | | | | |
| investment income of $157, respectively) | | | | | | | | | | | | | | $ 20,381,312 | | | | $ 12,498,906 |
| |
| Financial Highlights Class I | | | | | | | | | | | | | | | | | | | | |
| Years ended March 31, | | | | 2006 | | | | 2005 | | | | 2004 | | | | 2003 | | | | 2002 |
| Selected Per-Share Data | | | | | | | | | | | | | | | | | | | | |
| Net asset value, beginning of period | | | | $ 1.00 | | | | $ 1.00 | | | | $ 1.00 | | | | $ 1.00 | | | | $ 1.00 |
| Income from Investment Operations | | | | | | | | | | | | | | | | | | | | |
| Net investment income | | | | 036 | | | | .016 | | | | .010 | | | | .016 | | | | .032 |
| Distributions from net investment income | | | | (.036) | | | | (.016) | | | | (.010) | | | | (.016) | | | | (.032) |
| Net asset value, end of period | | | | $ 1.00 | | | | $ 1.00 | | | | $ 1.00 | | | | $ 1.00 | | | | $ 1.00 |
| Total ReturnA | | | | 3.69% | | | | 1.58% | | | | 1.03% | | | | 1.59% | | | | 3.20% |
| Ratios to Average Net AssetsB | | | | | | | | | | | | | | | | | | | | |
| Expenses before reductions | | | | 23% | | | | .23% | | | | .23% | | | | .22% | | | | .23% |
| Expenses net of fee waivers, if any | | | | 18% | | | | .18% | | | | .18% | | | | .18% | | | | .18% |
| Expenses net of all reductions | | | | 18% | | | | .18% | | | | .18% | | | | .18% | | | | .18% |
| Net investment income | | | | 3.71% | | | | 1.50% | | | | 1.03% | | | | 1.58% | | | | 3.13% |
| Supplemental Data | | | | | | | | | | | | | | | | | | | | |
| Net assets, end of period (in millions) | | | | $ 18,848 | | | | $ 11,389 | | | | $ 18,841 | | | | $ 16,325 | | | | $ 17,038 |
A Total returns would have been lower had certain expenses not been reduced during the periods shown.
B Expense ratios reflect operating expenses of the class. Expenses before reductions do not reflect amounts reimbursed by the investment adviser or expense offset arrangements and do not represent the amount paid by the class during periods when reimbursements or
reductions occur. Expenses net of fee waivers reflect expenses after reimbursement by the investment adviser but prior to reductions from expense offset arrangements. Expenses net of all reductions represent the net expenses paid by the class.
|
See accompanying notes which are an integral part of the financial statements.
|
41 Annual Report
| Financial Highlights Class II | | | | | | | | | | | | | | | | | | |
| Years ended March 31, | | 2006 | | | | 2005 | | | | 2004 | | | | 2003 | | | | 2002 |
| Selected Per-Share Data | | | | | | | | | | | | | | | | | | |
| Net asset value, beginning of period | | $ 1.00 | | | | $ 1.00 | | | | $ 1.00 | | | | $ 1.00 | | | | $ 1.00 |
| Income from Investment Operations | | | | | | | | | | | | | | | | | | |
| Net investment income | | 035 | | | | .014 | | | | .009 | | | | .014 | | | | .030 |
| Distributions from net investment income | | (.035) | | | | (.014) | | | | (.009) | | | | (.014) | | | | (.030) |
| Net asset value, end of period | | $ 1.00 | | | | $ 1.00 | | | | $ 1.00 | | | | $ 1.00 | | | | $ 1.00 |
| Total ReturnA | | 3.53% | | | | 1.43% | | | | .88% | | | | 1.46% | | | | 3.04% |
| Ratios to Average Net AssetsB | | | | | | | | | | | | | | | | | | |
| Expenses before reductions | | 38% | | | | .38% | | | | .38% | | | | .38% | | | | .37% |
| Expenses net of fee waivers, if any | | 33% | | | | .33% | | | | .33% | | | | .33% | | | | .33% |
| Expenses net of all reductions | | 33% | | | | .33% | | | | .33% | | | | .33% | | | | .33% |
| Net investment income | | 3.56% | | | | 1.35% | | | | .87% | | | | 1.43% | | | | 2.89% |
| Supplemental Data | | | | | | | | | | | | | | | | | | |
| Net assets, end of period (in millions) | | $ 319 | | | | $ 168 | | | | $ 260 | | | | $ 206 | | | | $ 376 |
A Total returns would have been lower had certain expenses not been reduced during the periods shown.
B Expense ratios reflect operating expenses of the class. Expenses before reductions do not reflect amounts reimbursed by the investment adviser or expense offset arrangements and do not represent the amount paid by the class during periods when reimburse
ments or reductions occur. Expenses net of fee waivers reflect expenses after reimbursement by the investment adviser but prior to reductions from expense offset arrangements. Expenses net of all reductions represent the net expenses paid by the class.
|
| Financial Highlights Class III | | | | | | | | | | | | | | | | | | |
| Years ended March 31, | | 2006 | | | | 2005 | | | | 2004 | | | | 2003 | | | | 2002 |
| Selected Per-Share Data | | | | | | | | | | | | | | | | | | |
| Net asset value, beginning of period | | $ 1.00 | | | | $ 1.00 | | | | $ 1.00 | | | | $ 1.00 | | | | $ 1.00 |
| Income from Investment Operations | | | | | | | | | | | | | | | | | | |
| Net investment income | | 034 | | | | .013 | | | | .008 | | | | .013 | | | | .029 |
| Distributions from net investment income | | (.034) | | | | (.013) | | | | (.008) | | | | (.013) | | | | (.029) |
| Net asset value, end of period | | $ 1.00 | | | | $ 1.00 | | | | $ 1.00 | | | | $ 1.00 | | | | $ 1.00 |
| Total ReturnA | | 3.43% | | | | 1.33% | | | | .78% | | | | 1.34% | | | | 2.94% |
| Ratios to Average Net AssetsB | | | | | | | | | | | | | | | | | | |
| Expenses before reductions | | 48% | | | | .48% | | | | .48% | | | | .48% | | | | .48% |
| Expenses net of fee waivers, if any | | 43% | | | | .43% | | | | .43% | | | | .43% | | | | .43% |
| Expenses net of all reductions | | 43% | | | | .43% | | | | .43% | | | | .43% | | | | .43% |
| Net investment income | | 3.46% | | | | 1.25% | | | | .77% | | | | 1.33% | | | | 2.88% |
| Supplemental Data | | | | | | | | | | | | | | | | | | |
| Net assets, end of period (in millions) | | $ 1,074 | | | | $ 926 | | | | $ 456 | | | | $ 439 | | | | $ 784 |
A Total returns would have been lower had certain expenses not been reduced during the periods shown.
B Expense ratios reflect operating expenses of the class. Expenses before reductions do not reflect amounts reimbursed by the investment adviser or expense offset arrangements and do not represent the amount paid by the class during periods when reimburse
ments or reductions occur. Expenses net of fee waivers reflect expenses after reimbursement by the investment adviser but prior to reductions from expense offset arrangements. Expenses net of all reductions represent the net expenses paid by the class.
|
See accompanying notes which are an integral part of the financial statements.
| | |
| Annual Report | | 42 |
| Financial Highlights Select Class | | | | | | | | | | | | | | | | | | |
| Years ended March 31, | | 2006 | | | | 2005 | | | | 2004 | | | | 2003 | | | | 2002D |
| Selected Per-Share Data | | | | | | | | | | | | | | | | | | |
| Net asset value, beginning of period | | $ 1.00 | | | | $ 1.00 | | | | $ 1.00 | | | | $ 1.00 | | | | $ 1.00 |
| Income from Investment Operations | | | | | | | | | | | | | | | | | | |
| Net investment income | | 036 | | | | .015 | | | | .010 | | | | .015 | | | | .004 |
| Distributions from net investment income | | (.036) | | | | (.015) | | | | (.010) | | | | (.015) | | | | (.004) |
| Net asset value, end of period | | $ 1.00 | | | | $ 1.00 | | | | $ 1.00 | | | | $ 1.00 | | | | $ 1.00 |
| Total ReturnB,C | | 3.64% | | | | 1.53% | | | | .98% | | | | 1.54% | | | | .38% |
| Ratios to Average Net AssetsE | | | | | | | | | | | | | | | | | | |
| Expenses before reductions | | 29% | | | | .28% | | | | .28% | | | | .28% | | | | .27%A |
| Expenses net of fee waivers, if any | | 23% | | | | .23% | | | | .23% | | | | .23% | | | | .23%A |
| Expenses net of all reductions | | 23% | | | | .23% | | | | .23% | | | | .23% | | | | .23%A |
| Net investment income | | 3.66% | | | | 1.45% | | | | .98% | | | | 1.53% | | | | 1.90%A |
| Supplemental Data | | | | | | | | | | | | | | | | | | |
| Net assets, end of period (000 omitted) | | $ 141,102 | | | | $ 16,279 | | | | $ 161,505 | | | | $ 24,271 | | | | $ 100 |
A Annualized
B Total returns for periods of less than one year are not annualized.
C Total returns would have been lower had certain expenses not been reduced during the periods shown.
D For the period January 17, 2002 (commencement of sale of shares) to March 31, 2002.
E Expense ratios reflect operating expenses of the class. Expenses before reductions do not reflect amounts reimbursed by the investment adviser or expense offset arrangements and do not represent the amount paid by the class during periods when reimburse
ments or reductions occur. Expense ratios before reductions for start up periods may not be representative of longer term operating periods. Expenses net of fee waivers reflect expenses after reimbursement by the investment adviser but prior to reductions from
expense offset arrangements. Expenses net of all reductions represent the net expenses paid by the class.
|
See accompanying notes which are an integral part of the financial statements.
|
43 Annual Report
| Tax-Exempt Portfolio | | | | | | |
| Investment Changes | | | | | | |
| |
| Maturity Diversification | | | | | | |
| Days | | % of fund’s | | % of fund’s | | % of fund’s |
| | | investments | | investments | | investments |
| | | 3/31/06 | | 9/30/05 | | 3/31/05 |
| 0 – 30 | | 91.0 | | 91.9 | | 93.6 |
| 31 – 90 | | 0.6 | | 0.8 | | 1.8 |
| 91 – 180 | | 6.1 | | 0.4 | | 3.3 |
| 181 – 397 | | 2.3 | | 6.9 | | 1.3 |
Weighted Average Maturity | | | | | | |
| | | 3/31/06 | | 9/30/05 | | 3/31/05 |
| Tax Exempt Portfolio | | 20 Days | | 27 Days | | 14 Days |
| All Tax Free Money Market Funds Average* | | 23 Days | | 28 Days | | 26 Days |
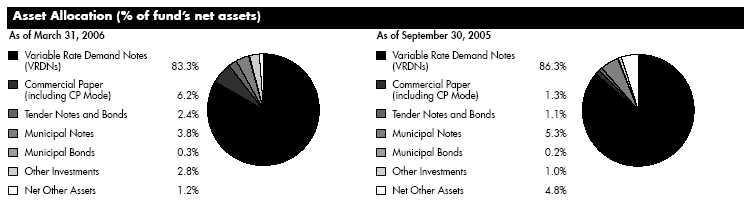
*Source: iMoneyNet, Inc.
Annual Report 44
| Tax-Exempt Portfolio | | | | | | | | |
| |
| Investments March 31, 2006 |
| |
| Showing Percentage of Net Assets | | | | | | |
| |
| Municipal Securities 98.8% | | | | | | |
| | | | | Principal | | Value (Note 1) |
| | | | | Amount (000s) | | (000s) |
| Alabama 1.8% | | | | | | | | | | |
| Alabama Gen. Oblig. Participating | | | | | | | | | | |
| VRDN Series MS 668, 3.2% (Liquidity | | | | | | | | | | |
| Facility Morgan Stanley) (b)(d) | | | | | | $ 6,623 | | | | $ 6,623 |
| Birmingham Spl. Care Facilities Auth. | | | | | | | | | | |
| Rev. Participating VRDN Series AAB | | | | | | | | | | |
| 20, 3.21% (Liquidity Facility | | | | | | | | | | |
| ABN AMRO Bank NV) (b)(d) | | | | | | 17,190 | | | | 17,190 |
| Health Care Auth. for Baptist Health | | | | | | | | | | |
| Series A2, 3.18% (MBIA Insured), | | | | | | | | | | |
| VRDN (b) | | | | | | 50,000 | | | | 50,000 |
| Jefferson County Swr. Rev.: | | | | | | | | | | |
| Participating VRDN Series MS 00 | | | | | | | | | | |
| 397, 3.2% (Liquidity Facility Morgan | | | | | | | | | | |
| Stanley) (b)(d) | | | | | | 8,545 | | | | 8,545 |
| Series 2002 C2, 3.15% (XL Cap. | | | | | | | | | | |
| Assurance, Inc. Insured), VRDN (b) | | | | | | 7,300 | | | | 7,300 |
| Series 2003 B7, 3.19% (XL Cap. | | | | | | | | | | |
| Assurance, Inc. Insured), VRDN (b) | | | | | | 6,000 | | | | 6,000 |
| Mobile Indl. Dev. Board Poll. Cont. Rev. | | | | | | | | | | |
| (Alabama Pwr. Co. Proj.) Series C, | | | | | | | | | | |
| 3.22%, VRDN (b) | | | | | | 12,000 | | | | 12,000 |
| Montgomery AlaHA Spl. Care Facilities | | | | | | | | | | |
| Fing. Auth. Prog. Rev. (Mizell Memorial | | | | | | | | | | |
| Hosp. Proj.) 3.21%, LOC AmSouth | | | | | | | | | | |
| Bank NA, Birmingham, VRDN (b) | | | | | | 5,935 | | | | 5,935 |
| Tuscaloosa Spl. Care Facilities Fing. Auth. | | | | | | | | | | |
| Residential Care Family Mortgage Rev. | | | | | | | | | | |
| (Capstone Village Proj.) Series C, | | | | | | | | | | |
| 3.19%, LOC BNP Paribas SA, | | | | | | | | | | |
| VRDN (b) | | | | | | 19,750 | | | | 19,750 |
| | | | | | | | | | | 133,343 |
| |
| Alaska – 0.6% | | | | | | | | | | |
| Alaska Hsg. Fin. Corp. Participating | | | | | | | | | | |
| VRDN: | | | | | | | | | | |
| Series BA 97 F, 3.27% (Liquidity | | | | | | | | | | |
| Facility Bank of America NA) (b)(d) | | | | | | 1,160 | | | | 1,160 |
| Series DB 131, 3.21% (Liquidity | | | | | | | | | | |
| Facility Deutsche Bank AG) (b)(d) | | | | | | 4,920 | | | | 4,920 |
| Series DB 162, 3.21% (Liquidity | | | | | | | | | | |
| Facility Deutsche Bank AG) (b)(d) | | | | | | 12,045 | | | | 12,045 |
| Series PA 1298, 3.21% (Liquidity | | | | | | | | | | |
| Facility Merrill Lynch & Co., | | | | | | | | | | |
| Inc.) (b)(d) | | | | | | 5,000 | | | | 5,000 |
| Valdez Marine Term. Rev. (BP Pipelines, | | | | | | | | | | |
| Inc. Proj.): | | | | | | | | | | |
| Series 2003 A, 3.19%, VRDN (b) | | | | | | 9,650 | | | | 9,650 |
| Series B, 3.19%, VRDN (b) | | | | | | 13,300 | | | | 13,300 |
| | | | | | | | | | | 46,075 |
| |
| Arizona 1.5% | | | | | | | | | | |
| ABN AMRO Muni. Tops Ctfs. Trust | | | | | | | | | | |
| Participating VRDN SAeries AAB 05 | | | | | | | | | | |
| 54, 3.2% (Liquidity Facility | | | | | | | | | | |
| ABN AMRO Bank NV) (b)(d) | | | | | | 13,785 | | | | 13,785 |
| | | Principal | | Value (Note 1) |
| | | Amount (000s) | | (000s) |
| Arizona School Facilities Board Ctfs. of | | | | | | | | |
| Prtn. Participating VRDN Series IXIS 05 | | | | | | | | |
| 5, 3.21% (Liquidity Facility CDC | | | | | | | | |
| Fin. CDC IXIS) (b)(d) | | | | $ 15,115 | | | | $ 15,115 |
| Arizona Tourism & Sports Auth. Tax Rev. | | | | | | | | |
| Participating VRDN Series Putters 690, | | | | | | | | |
| 3.21% (Liquidity Facility JPMorgan | | | | | | | | |
| Chase & Co.) (b)(d) | | | | 3,530 | | | | 3,530 |
| Arizona Trans. Board Hwy. Rev. | | | | | | | | |
| Participating VRDN Series ROC II | | | | | | | | |
| R1038, 3.21% (Liquidity Facility | | | | | | | | |
| Citigroup Global Markets Hldgs., | | | | | | | | |
| Inc.) (b)(d) | | | | 4,130 | | | | 4,130 |
| Eclipse Fdg. Trust Participating VRDN | | | | | | | | |
| Series Solar 06 23, 3.2% (Liquidity | | | | | | | | |
| Facility U.S. Bank NA, | | | | | | | | |
| Minnesota) (b)(d) | | | | 13,400 | | | | 13,400 |
| Phoenix Civic Impt. Corp. District Rev. | | | | | | | | |
| Participating VRDN Series PZ 85, | | | | | | | | |
| 3.25% (Liquidity Facility Merrill Lynch & | | | | | | | | |
| Co., Inc.) (b)(d) | | | | 6,325 | | | | 6,325 |
| Phoenix Gen. Oblig. Participating VRDN | | | | | | | | |
| Series PT 1436, 3.21% (Liquidity | | | | | | | | |
| Facility Merrill Lynch & Co., Inc.) (b)(d) | | | | 95 | | | | 95 |
| Phoenix Indl. Dev. Auth. Govt. Office | | | | | | | | |
| Lease Rev. Participating VRDN Series | | | | | | | | |
| Putters 1119, 3.21% (Liquidity Facility | | | | | | | | |
| JPMorgan Chase & Co.) (b)(d) | | | | 4,120 | | | | 4,120 |
| Phoenix Indl. Dev. Auth. Multi family Hsg. | | | | | | | | |
| Rev. (Paradise Lakes Apt. Proj.) Series | | | | | | | | |
| 1995, 3.22%, LOC Bank of America | | | | | | | | |
| NA, VRDN (b) | | | | 18,000 | | | | 18,000 |
| Salt River Proj. Agric. Impt. & Pwr. District | | | | | | | | |
| Elec. Sys. Rev.: | | | | | | | | |
| Participating VRDN: | | | | | | | | |
| Series PT 1512, 3.21% (Liquidity | | | | | | | | |
| Facility Merrill Lynch & Co., | | | | | | | | |
| Inc.) (b)(d) | | | | 1,645 | | | | 1,645 |
| Series SG 03 160, 3.21% (Liquidity | | | | | | | | |
| Facility Societe Generale) (b)(d) . | | | | 18,600 | | | | 18,600 |
| Series 1997 A, 3.18% 4/7/06, CP | | | | 10,075 | | | | 10,075 |
| Sun Devil Energy Ctr. LLC Rev. (Arizona | | | | | | | | |
| State Univ. Proj.) 3.2% (FGIC Insured), | | | | | | | | |
| VRDN (b) | | | | 5,000 | | | | 5,000 |
| | | | | | | | | 113,820 |
| |
| Arkansas 0.1% | | | | | | | | |
| Arkansas Hosp. Equip. Fin. Auth. (Baptist | | | | | | | | |
| Health Proj.) Series 1995, 3.22% | | | | | | | | |
| (MBIA Insured), VRDN (b) | | | | 1,950 | | | | 1,950 |
| Eclipse Fdg. Trust Participating VRDN | | | | | | | | |
| Series Solar 06 26, 3.2% (Liquidity | | | | | | | | |
| Facility U.S. Bank NA, | | | | | | | | |
| Minnesota) (b)(d) | | | | 6,375 | | | | 6,375 |
| | | | | | | | | 8,325 |
See accompanying notes which are an integral part of the financial statements.
45 Annual Report
| Tax-Exempt Portfolio | | | | | | | | |
| Investments - continued | | | | | | | | |
| |
| |
| |
| Municipal Securities continued | | | | | | |
| |
| | | Principal | | Value (Note 1) |
| | | Amount (000s) | | (000s) |
| California 2.1% | | | | | | | | |
| California Dept. of Wtr. Resources Pwr. | | | | | | | | |
| Supply Rev. Subseries F2, 3.17%, LOC | | | | | | | | |
| JPMorgan Chase Bank, LOC Societe | | | | | | | | |
| Generale, VRDN (b) | | | | $ 35,000 | | | | $ 35,000 |
| California Gen. Oblig. Series 2005 B | | | | | | | | |
| Subseries B1, 3.14%, LOC Bank of | | | | | | | | |
| America NA, VRDN (b) | | | | 10,700 | | | | 10,700 |
| Garden Grove Agcy. Cmnty. Dev. Tax | | | | | | | | |
| Allocation Rev. Participating VRDN | | | | | | | | |
| Series PT 1979, 3.21% (Liquidity | | | | | | | | |
| Facility Merrill Lynch & Co., Inc.) (b)(d) | | | | 7,835 | | | | 7,835 |
| Los Angeles Dept. of Wtr. & Pwr. Rev. | | | | | | | | |
| Participating VRDN Series EGL | | | | | | | | |
| 7053026 Class A, 3.2% (Liquidity | | | | | | | | |
| Facility Citibank NA) (b)(d) | | | | 35,000 | | | | 35,000 |
| Los Angeles Wastewtr. Sys. Rev. | | | | | | | | |
| Participating VRDN Series EGL | | | | | | | | |
| 7053003 Class A, 3.2% (Liquidity | | | | | | | | |
| Facility Citibank NA) (b)(d) | | | | 22,000 | | | | 22,000 |
| M S R Pub. Pwr. Agcy. San Juan Proj. | | | | | | | | |
| Rev. Participating VRDN ROC II R335, | | | | | | | | |
| 3.2% (Liquidity Facility Citibank | | | | | | | | |
| NA) (b)(d) | | | | 7,500 | | | | 7,500 |
| Pajaro Valley Unified School District | | | | | | | | |
| Participating VRDN Series PA 1182, | | | | | | | | |
| 3.21% (Liquidity Facility Merrill Lynch & | | | | | | | | |
| Co., Inc.) (b)(d) | | | | 4,290 | | | | 4,290 |
| Sacramento Muni. Util. District Elec. Rev. | | | | | | | | |
| Participating VRDN Series EGL | | | | | | | | |
| 7050048 Class A, 3.2% (Liquidity | | | | | | | | |
| Facility Citibank NA) (b)(d) | | | | 5,925 | | | | 5,925 |
| San Francisco City & County Pub. Util. | | | | | | | | |
| Commission Wtr. Rev. Participating | | | | | | | | |
| VRDN Series ROC II R530, 3.2% | | | | | | | | |
| (Liquidity Facility Citibank NA) (b)(d) | | | | 11,455 | | | | 11,455 |
| San Jose Unified School District, Santa | | | | | | | | |
| Clara County Participating VRDN | | | | | | | | |
| Series EGL 7050049 Class A, 3.2% | | | | | | | | |
| (Liquidity Facility Citibank NA) (b)(d) | | | | 5,000 | | | | 5,000 |
| South Orange County Pub. Fing. Auth. | | | | | | | | |
| Spl. Tax Rev. Participating VRDN Series | | | | | | | | |
| PT 3283, 3.21% (Liquidity Facility | | | | | | | | |
| Merrill Lynch & Co., Inc.) (b)(d) | | | | 8,105 | | | | 8,105 |
| Yosemite Cmnty. College District | | | | | | | | |
| Participating VRDN Series EGL | | | | | | | | |
| 7050047 Class A, 3.2% (Liquidity | | | | | | | | |
| Facility Citibank NA) (b)(d) | | | | 5,840 | | | | 5,840 |
| | | | | | | | | 158,650 |
| |
| Colorado 3.2% | | | | | | | | |
| Adams & Arapahoe Counties Joint | | | | | | | | |
| School District #28J Aurora | | | | | | | | |
| Participating VRDN Series PT 3667, | | | | | | | | |
| 3.21% (Liquidity Facility DEPFA BANK | | | | | | | | |
| PLC) (b)(d) | | | | 10,390 | | | | 10,390 |
| Arapahoe Park & Recreation District | | | | | | | | |
| Participating VRDN Series PT 1677, | | | | | | | | |
| 3.22% (Liquidity Facility Merrill Lynch & | | | | | | | | |
| Co., Inc.) (b)(d) | | | | 1,600 | | | | 1,600 |
| | | Principal | | Value (Note 1) |
| | | Amount (000s) | | (000s) |
| Centerra Metropolitan District No. 1 Rev. | | | | | | |
| 3.2%, LOC BNP Paribas SA, VRDN (b) | | $ 12,000 | | | | $ 12,000 |
| Colorado Ed. Ln. Prog. TRAN Series B, | | | | | | |
| 6.25% 8/7/06 | | 42,200 | | | | 42,581 |
| Colorado Health Facilities Auth. | | | | | | |
| Retirement Hsg. Rev. Participating | | | | | | |
| VRDN Series TOC 06 Z2, 3.24% | | | | | | |
| (Liquidity Facility Goldman Sachs | | | | | | |
| Group, Inc.) (b)(d) | | 5,100 | | | | 5,100 |
| Colorado Health Facilities Auth. Rev.: | | | | | | |
| Participating VRDN Series PA 02 | | | | | | |
| 1094, 3.21% (Liquidity Facility | | | | | | |
| Merrill Lynch & Co., Inc.) (b)(d) | | 6,805 | | | | 6,805 |
| (Boulder Cmnty. Hosp. Proj.) Series | | | | | | |
| 2000, 3.32%, LOC JPMorgan | | | | | | |
| Chase Bank, VRDN (b) | | 18,500 | | | | 18,500 |
| Colorado Hsg. & Fin. Auth. Bonds Series | | | | | | |
| A5 Class 1, 3.43% 1/3/07 | | 25,200 | | | | 25,200 |
| Colorado Springs Utils. Rev. Participating | | | | | | |
| VRDN: | | | | | | |
| Series SGA 88, 3.2% (Liquidity Facility | | | | | | |
| Societe Generale) (b)(d) | | 17,000 | | | | 17,000 |
| Series SGB 28, 3.21% (Liquidity | | | | | | |
| Facility Societe Generale) (b)(d) | | 12,000 | | | | 12,000 |
| Colorado State Dept. of Corrections | | | | | | |
| Certificates of Participation | | | | | | |
| Participating VRDN Series Putters | | | | | | |
| 1252, 3.21% (Liquidity Facility | | | | | | |
| JPMorgan Chase Bank) (b)(d) | | 5,660 | | | | 5,660 |
| Colorado Wtr. Resources and Pwr. Dev. | | | | | | |
| Auth. Wastewtr. Rev. Participating | | | | | | |
| VRDN Series PT 2781, 3.21% (Liquidity | | | | | | |
| Facility Dexia Cr. Local de | | | | | | |
| France) (b)(d) | | 14,170 | | | | 14,170 |
| Commerce City Northern Infrastruscture | | | | | | |
| Gen. Impt. District 3.2%, LOC U.S. | | | | | | |
| Bank NA, Minnesota, VRDN (b) | | 5,000 | | | | 5,000 |
| Dawson Ridge Metropolitan District # 1 | | | | | | |
| Participating VRDN Series TOC 06 | | | | | | |
| Z12, 3.24% (Liquidity Facility Goldman | | | | | | |
| Sachs Group, Inc.) (b)(d) | | 12,880 | | | | 12,880 |
| Denver City & County Arpt. Rev. | | | | | | |
| Participating VRDN: | | | | | | |
| Series Merlots 97 Q, 3.21% (Liquidity | | | | | | |
| Facility Wachovia Bank NA) (b)(d) . | | 12,660 | | | | 12,660 |
| Series MS 00 425, 3.2% (Liquidity | | | | | | |
| Facility Morgan Stanley) (b)(d) | | 8,995 | | | | 8,995 |
| Series Stars 104, 3.21% (Liquidity | | | | | | |
| Facility BNP Paribas SA) (b)(d) | | 5,530 | | | | 5,530 |
| Jefferson County School District #R1 | | | | | | |
| Participating VRDN Series PT 2716, | | | | | | |
| 3.21% (Liquidity Facility Merrill Lynch & | | | | | | |
| Co., Inc.) (b)(d) | | 5,285 | | | | 5,285 |
| Mesa County Valley School District #051, | | | | | | |
| Grand Junction Participating VRDN | | | | | | |
| Series PT 2456, 3.21% (Liquidity | | | | | | |
| Facility Merrill Lynch & Co., Inc.) (b)(d) | | 7,660 | | | | 7,660 |
See accompanying notes which are an integral part of the financial statements.
Annual Report 46
| Municipal Securities continued | | | | | | |
| |
| | | | | Principal | | Value (Note 1) |
| | | | | Amount (000s) | | (000s) |
| Colorado – continued | | | | | | | | |
| Reg’l. Trans. District Sales Tax Rev. | | | | | | | | |
| Participating VRDN Series MS 01 679, | | | | | | | | |
| 3.2% (Liquidity Facility Morgan | | | | | | | | |
| Stanley) (b)(d) | | | | $ 6,915 | | | | $ 6,915 |
| Southern Ute Indian Tribe of Southern Ute | | | | | | | | |
| Indian Reservation 3.22%, VRDN (b) . | | | | 3,500 | | | | 3,500 |
| | | | | | | | | 239,431 |
| |
| Delaware 0.3% | | | | | | | | |
| Wilmington Adjustable Rate Demand | | | | | | | | |
| Rev. (Delaware Art Museum, Inc. Proj.) | | | | | | | | |
| 3.22%, LOC Allied Irish Banks PLC, | | | | | | | | |
| VRDN (b) | | | | 20,650 | | | | 20,650 |
| District Of Columbia – 1.2% | | | | | | | | |
| District of Columbia Gen. Oblig.: | | | | | | | | |
| Participating VRDN: | | | | | | | | |
| Series PT 852, 3.21% (Liquidity | | | | | | | | |
| Facility Landesbank | | | | | | | | |
| Hessen Thuringen) (b)(d) | | | | 10,910 | | | | 10,910 |
| Series ROC II 99 10, 3.21% | | | | | | | | |
| (Liquidity Facility Citibank | | | | | | | | |
| NA) (b)(d) | | | | 3,965 | | | | 3,965 |
| TRAN 4% 9/29/06 | | | | 54,500 | | | | 54,687 |
| District of Columbia Hsg. Fin. Auth. Cap. | | | | | | | | |
| Prog. Rev. Participating VRDN Series | | | | | | | | |
| PT 2780, 3.21% (Liquidity Facility | | | | | | | | |
| Merrill Lynch & Co., Inc.) (b)(d) | | | | 5,515 | | | | 5,515 |
| District of Columbia Rev. (DC Preparatory | | | | | | | | |
| Academy Proj.) 3.22%, LOC | | | | | | | | |
| Manufacturers & Traders Trust Co., | | | | | | | | |
| VRDN (b) | | | | 5,500 | | | | 5,500 |
| District of Columbia Wtr. & Swr. Auth. | | | | | | | | |
| Participating VRDN Series PA 612, | | | | | | | | |
| 3.21% (Liquidity Facility Merrill Lynch & | | | | | | | | |
| Co., Inc.) (b)(d) | | | | 5,320 | | | | 5,320 |
| | | | | | | | | 85,897 |
| |
| Florida – 6.2% | | | | | | | | |
| Deltona Util. Sys. Rev. Participating | | | | | | | | |
| VRDN Series PT 2026, 3.21% (Liquidity | | | | | | | | |
| Facility Merrill Lynch & Co., Inc.) (b)(d) | | | | 5,225 | | | | 5,225 |
| Florida Board of Ed. Cap. Outlay | | | | | | | | |
| Participating VRDN: | | | | | | | | |
| Series EGL 01 902, 3.21% (Liquidity | | | | | | | | |
| Facility Citibank NA, New | | | | | | | | |
| York) (b)(d) | | | | 23,360 | | | | 23,360 |
| Series EGL 01 905, 3.21% (Liquidity | | | | | | | | |
| Facility Citibank NA, New | | | | | | | | |
| York) (b)(d) | | | | 5,630 | | | | 5,630 |
| Series EGL 7050031 Class A, 3.21% | | | | | | | | |
| (Liquidity Facility Citibank NA) (b)(d) | | | | 4,600 | | | | 4,600 |
| Series ROC II R344, 3.21% (Liquidity | | | | | | | | |
| Facility Citibank NA) (b)(d) | | | | 3,540 | | | | 3,540 |
| Florida Board of Ed. Lottery Rev. | | | | | | | | |
| Participating VRDN: | | | | | | | | |
| Series EGL 00 904 Class A, 3.21% | | | | | | | | |
| (Liquidity Facility Citibank NA, New | | | | | | | | |
| York) (b)(d) | | | | 5,000 | | | | 5,000 |
| | | Principal | | Value (Note 1) |
| | | Amount (000s) | | (000s) |
| Series EGL 01 904, 3.21% (Liquidity | | | | | | | | |
| Facility Citibank NA, New | | | | | | | | |
| York) (b)(d) | | | | $ 23,375 | | | | $ 23,375 |
| Series EGL 01 906 Class A, 3.21% | | | | | | | | |
| (Liquidity Facility Citibank NA, New | | | | | | | | |
| York) (b)(d) | | | | 3,000 | | | | 3,000 |
| Series MS 01 570, 3.2% (Liquidity | | | | | | | | |
| Facility Morgan Stanley) (b)(d) | | | | 13,455 | | | | 13,455 |
| Florida Board of Ed. Pub. Ed. | | | | | | | | |
| Participating VRDN Series ROC II | | | | | | | | |
| R6037, 3.21% (Liquidity Facility | | | | | | | | |
| Citibank NA) (b)(d) | | | | 2,985 | | | | 2,985 |
| Florida Gen. Oblig.: | | | | | | | | |
| Bonds Series Merlots 05 A22, 3.35%, | | | | | | | | |
| tender 11/14/06 (Liquidity Facility | | | | | | | | |
| Wachovia Bank NA) (b)(d)(e) | | | | 33,975 | | | | 33,975 |
| Participating VRDN Series ROC II | | | | | | | | |
| R1001 3.21% (Liquidity Facility | | | | | | | | |
| Citigroup Global Markets Hldgs., | | | | | | | | |
| Inc.) (b)(d) | | | | 7,530 | | | | 7,530 |
| Highlands County Health Facilities Auth. | | | | | | | | |
| Rev. (Adventist Health Sys./Sunbelt | | | | | | | | |
| Obligated Group Proj.) Series C, | | | | | | | | |
| 3.19%, VRDN (b) | | | | 19,300 | | | | 19,300 |
| Hollywood Gen. Oblig. Bonds Series | | | | | | | | |
| Putters 934, 3.6%, tender 8/24/06 | | | | | | | | |
| (Liquidity Facility JPMorgan Chase | | | | | | | | |
| Bank) (b)(d)(e) | | | | 6,365 | | | | 6,365 |
| Hollywood Wtr. & Swr. Rev. Participating | | | | | | | | |
| VRDN Series ROC II R4055, 3.21% | | | | | | | | |
| (Liquidity Facility Citigroup Global | | | | | | | | |
| Markets Hldgs., Inc.) (b)(d) | | | | 2,750 | | | | 2,750 |
| Jacksonville Hsg. Fin. Auth. Multi family | | | | | | | | |
| Hsg. Rev. (Augustine Apts. Proj.) | | | | | | | | |
| 3.19%, LOC Fannie Mae, VRDN (b) | | | | 3,335 | | | | 3,335 |
| Jacksonville Poll. Cont. Rev. (Florida Pwr. | | | | | | | | |
| & Lt. Co. Proj.) 3.25%, VRDN (b) | | | | 23,250 | | | | 23,250 |
| JEA Elec. Sys. Rev. Participating VRDN | | | | | | | | |
| Series PA 1068, 3.22% (Liquidity | | | | | | | | |
| Facility Merrill Lynch & Co., Inc.) (b)(d) | | | | 5,620 | | | | 5,620 |
| Martin County Poll. Cont. Rev. (Florida | | | | | | | | |
| Pwr. & Lt. Co. Proj.) Series 2000, | | | | | | | | |
| 3.18%, VRDN (b) | | | | 11,150 | | | | 11,150 |
| Miami Dade County Cap. Asset | | | | | | | | |
| Acquisition Participating VRDN Series | | | | | | | | |
| PT 3268, 3.21% (Liquidity Facility | | | | | | | | |
| Merrill Lynch & Co., Inc.) (b)(d) | | | | 12,000 | | | | 12,000 |
| Miami Dade County Edl. Facilities Auth. | | | | | | | | |
| Rev. Participating VRDN Series SG | | | | | | | | |
| 176, 3.21% (Liquidity Facility Societe | | | | | | | | |
| Generale) (b)(d) | | | | 19,000 | | | | 19,000 |
| Miami Dade County Gen. Oblig. | | | | | | | | |
| Participating VRDN Series PT 3376, | | | | | | | | |
| 3.21% (Liquidity Facility DEPFA BANK | | | | | | | | |
| PLC) (b)(d) | | | | 2,865 | | | | 2,865 |
| Miami Dade County Health Facilities | | | | | | | | |
| Auth. Hosp. Rev. Participating VRDN | | | | | | | | |
| Series PT 721, 3.21% (Liquidity Facility | | | | | | | | |
| BNP Paribas SA) (b)(d) | | | | 9,300 | | | | 9,300 |
See accompanying notes which are an integral part of the financial statements.
47 Annual Report
| Tax-Exempt Portfolio | | | | | | | | |
| Investments - continued | | | | | | | | |
| |
| |
| |
| Municipal Securities continued | | | | | | |
| |
| | | Principal | | Value (Note 1) |
| | | Amount (000s) | | (000s) |
| Florida – continued | | | | | | | | |
| Miami Dade County Pub. Svc. Tax Rev. | | | | | | | | |
| Participating VRDN Series MSTC 02 | | | | | | | | |
| 9043, 3.23% (Liquidity Facility Bear | | | | | | | | |
| Stearns Companies, Inc.) (b)(d) | | | | $ 3,160 | | | | $ 3,160 |
| Miami Dade County Wtr. & Swr. Rev. | | | | | | | | |
| 3.17% (FSA Insured), VRDN (b) | | | | 48,000 | | | | 48,000 |
| Orange County Sales Tax Rev. | | | | | | | | |
| Participating VRDN: | | | | | | | | |
| Series PT 1557, 3.21% (Liquidity | | | | | | | | |
| Facility Merrill Lynch & Co., | | | | | | | | |
| Inc.) (b)(d) | | | | 9,675 | | | | 9,675 |
| Series Putters 717, 3.21% (Liquidity | | | | | | | | |
| Facility JPMorgan Chase & | | | | | | | | |
| Co.) (b)(d) | | | | 1,960 | | | | 1,960 |
| Orange County School Board Ctfs. of | | | | | | | | |
| Prtn. Bonds Series ROC II R 2182, | | | | | | | | |
| 3.45%, tender 8/10/06 (Liquidity | | | | | | | | |
| Facility Citigroup Global Markets | | | | | | | | |
| Hldgs., Inc.) (b)(d)(e) | | | | 3,435 | | | | 3,435 |
| Orange County Tourist Dev. Tax Rev. | | | | | | | | |
| Participating VRDN Series MS 817, | | | | | | | | |
| 3.2% (Liquidity Facility Morgan | | | | | | | | |
| Stanley) (b)(d) | | | | 7,315 | | | | 7,315 |
| Orlando & Orange County Expressway | | | | | | | | |
| Auth. Rev. Subseries 2005 D, 3.14% | | | | | | | | |
| (AMBAC Insured), VRDN (b) | | | | 22,440 | | | | 22,440 |
| Palm Beach County Rev. (Morse Oblig. | | | | | | | | |
| Group Proj.) 3.19%, LOC Key Bank | | | | | | | | |
| NA, VRDN (b) | | | | 10,000 | | | | 10,000 |
| Pasco County Indl. Dev. Rev. (Academy | | | | | | | | |
| Lakes Day School Proj.) 3.23%, LOC | | | | | | | | |
| Bank of America NA, VRDN (b) | | | | 1,955 | | | | 1,955 |
| Peace River/Manasota Reg’l. Wtr. Supply | | | | | | | | |
| Auth. Rev. Participating VRDN Series | | | | | | | | |
| EGL 06 33 Class A, 3.21% (Liquidity | | | | | | | | |
| Facility Citibank NA) (b)(d) | | | | 6,270 | | | | 6,270 |
| Polk County Util. Sys. Rev. Participating | | | | | | | | |
| VRDN Series EGL 720050022 | | | | | | | | |
| Class A, 3.21% (Liquidity Facility | | | | | | | | |
| Citibank NA) (b)(d) | | | | 9,705 | | | | 9,705 |
| St. Johns County Ponte Vedra Utils. Sys. | | | | | | | | |
| Rev. Participating VRDN Series PT | | | | | | | | |
| 3378, 3.21% (Liquidity Facility Merrill | | | | | | | | |
| Lynch & Co., Inc.) (b)(d) | | | | 6,610 | | | | 6,610 |
| Sunshine State Govt. Fing. Commission | | | | | | | | |
| Rev.: | | | | | | | | |
| Series A, 3.51% 8/2/06 (AMBAC | | | | | | | | |
| Insured) (FGIC Insured), CP | | | | 33,700 | | | | 33,700 |
| Series D, 3.51% 8/2/06 (FGIC | | | | | | | | |
| Insured) (AMBAC Insured), CP | | | | 14,505 | | | | 14,505 |
| | | Principal | | Value (Note 1) |
| | | Amount (000s) | | (000s) |
| Series I, 3.51% 8/2/06 | | | | | | | | |
| (CIFG North America Insured) | | | | | | | | |
| (AMBAC Insured), CP | | | | $ 28,250 | | | | $ 28,250 |
| Tampa Bay Wtr. Util. Sys. Rev. | | | | | | | | |
| Participating VRDN Series BA 01 N, | | | | | | | | |
| 3.25% (Liquidity Facility Bank of | | | | | | | | |
| America NA) (b)(d) | | | | 5,200 | | | | 5,200 |
| | | | | | | | | 458,790 |
| |
| Georgia – 2.1% | | | | | | | | |
| Athens Clarke County Unified Govt. Dev. | | | | | | | | |
| Auth. Rev. (Univ. of Georgia Athletic | | | | | | | | |
| Assoc. Proj.) Series B, 3.18%, LOC | | | | | | | | |
| Bank of America NA, VRDN (b) | | | | 12,250 | | | | 12,250 |
| Atlanta Arpt. Passenger Facilities Charge | | | | | | | | |
| Rev. Participating VRDN Series EGL | | | | | | | | |
| 7053030 Class A, 3.21% (Liquidity | | | | | | | | |
| Facility Citibank NA) (b)(d) | | | | 11,400 | | | | 11,400 |
| Atlanta Arpt. Rev.: | | | | | | | | |
| Participating VRDN: | | | | | | | | |
| Series EGL 00 1003 Class A, 3.21% | | | | | | | | |
| (Liquidity Facility Citibank NA, | | | | | | | | |
| New York) (b)(d) | | | | 10,000 | | | | 10,000 |
| Series MS 00 375, 3.2% (Liquidity | | | | | | | | |
| Facility Morgan Stanley) (b)(d) | | | | 14,345 | | | | 14,345 |
| Series 2005 B2, 3.12% 4/6/06, LOC | | | | | | | | |
| Bayerische Landesbank (UNGTD), | | | | | | | | |
| LOC Cr. Agricole SA, CP | | | | 10,000 | | | | 10,000 |
| Atlanta Wtr. & Wastewtr. Rev. | | | | | | | | |
| Participating VRDN Series EGL | | | | | | | | |
| 720050009 Class A, 3.21% (Liquidity | | | | | | | | |
| Facility Citibank NA) (b)(d) | | | | 6,000 | | | | 6,000 |
| Carrollton Payroll Dev. Auth. Rev. | | | | | | | | |
| Participating VRDN Series PT 2468, | | | | | | | | |
| 3.21% (Liquidity Facility Merrill Lynch & | | | | | | | | |
| Co., Inc.) (b)(d) | | | | 5,260 | | | | 5,260 |
| College Park Bus. & Indl. Dev. Auth. | | | | | | | | |
| Participating VRDN Series PT 3301, | | | | | | | | |
| 3.21% (Liquidity Facility Merrill Lynch & | | | | | | | | |
| Co., Inc.) (b)(d) | | | | 12,740 | | | | 12,740 |
| DeKalb County Hosp. Auth. Rev. (DeKalb | | | | | | | | |
| Med. Ctr. Proj.) 3.18%, LOC SunTrust | | | | | | | | |
| Banks, Inc., VRDN (b) | | | | 8,000 | | | | 8,000 |
| Eclipse Fdg. Trust Participating VRDN | | | | | | | | |
| Series Solar 06 24, 3.2% (Liquidity | | | | | | | | |
| Facility U.S. Bank NA, | | | | | | | | |
| Minnesota) (b)(d) | | | | 4,500 | | | | 4,500 |
| Georgia Gen. Oblig. Participating VRDN | | | | | | | | |
| Series EGL 01 1001, 3.21% (Liquidity | | | | | | | | |
| Facility Citibank NA, New York) (b)(d) | | | | 10,580 | | | | 10,580 |
| Georgia Muni. Elec. Auth. Pwr. Rev. | | | | | | | | |
| Participating VRDN Series Macon 04 | | | | | | | | |
| E, 3.25% (Liquidity Facility Bank of | | | | | | | | |
| America NA) (b)(d) | | | | 6,810 | | | | 6,810 |
| Georgia Muni. Gas Auth. Rev. (Gas | | | | | | | | |
| Portfolio II Proj.) Series B, 3.2%, LOC | | | | | | | | |
| Wachovia Bank NA, LOC JPMorgan | | | | | | | | |
| Chase Bank, VRDN (b) | | | | 32,000 | | | | 32,000 |
See accompanying notes which are an integral part of the financial statements.
Annual Report 48
| Municipal Securities continued | | | | | | |
| |
| | | Principal | | Value (Note 1) |
| | | Amount (000s) | | (000s) |
| Georgia – continued | | | | | | | | |
| Metropolitan Atlanta Rapid Transit Series | | | | | | | | |
| 2004 B, 3.51% 8/10/06, LOC Dexia | | | | | | | | |
| Cr. Local de France, CP | | | | $ 3,900 | | | | $ 3,900 |
| Putnam County Dev. Auth. Poll. Cont. Rev. | | | | | | | | |
| Bonds (Georgia Pwr. Co. Plant Proj.) | | | | | | | | |
| First Series 1997, 2.83%, tender | | | | | | | | |
| 5/5/06 (b) | | | | 9,200 | | | | 9,200 |
| | | | | | | | | 156,985 |
| |
| Hawaii 0.2% | | | | | | | | |
| Hawaii Gen. Oblig. Participating VRDN: | | | | | | | | |
| Series MS 738, 3.2% (Liquidity Facility | | | | | | | | |
| Morgan Stanley) (b)(d) | | | | 11,705 | | | | 11,705 |
| Series ROC II R153, 3.21% (Liquidity | | | | | | | | |
| Facility Citibank NA) (b)(d) | | | | 3,300 | | | | 3,300 |
| Honolulu City & County Gen. Oblig. | | | | | | | | |
| Participating VRDN Series Putters | | | | | | | | |
| 1176, 3.21% (Liquidity Facility | | | | | | | | |
| JPMorgan Chase & Co.) (b)(d) | | | | 3,410 | | | | 3,410 |
| | | | | | | | | 18,415 |
| |
| Illinois – 7.3% | | | | | | | | |
| Champaign County Cmnty. Unit School | | | | | | | | |
| District #116 Urbana Participating | | | | | | | | |
| VRDN Series Floaters 01 669, 3.2% | | | | | | | | |
| (Liquidity Facility Morgan | | | | | | | | |
| Stanley) (b)(d) | | | | 7,105 | | | | 7,105 |
| Champaign County Gen. Oblig. | | | | | | | | |
| Participating VRDN Series Putters 887, | | | | | | | | |
| 3.21% (Liquidity Facility JPMorgan | | | | | | | | |
| Chase & Co.) (b)(d) | | | | 5,450 | | | | 5,450 |
| Chicago Board of Ed.: | | | | | | | | |
| Participating VRDN: | | | | | | | | |
| Series BA 96 BB, 3.27% (Liquidity | | | | | | | | |
| Facility Bank of America | | | | | | | | |
| NA) (b)(d) | | | | 9,000 | | | | 9,000 |
| Series Merlots 97 E, 3.21% | | | | | | | | |
| (Liquidity Facility Wachovia Bank | | | | | | | | |
| NA) (b)(d) | | | | 8,700 | | | | 8,700 |
| Series MSDW 01 467, 3.2% | | | | | | | | |
| (Liquidity Facility Morgan | | | | | | | | |
| Stanley) (b)(d) | | | | 3,000 | | | | 3,000 |
| Series TOC 05 Z8, 3.24% (Liquidity | | | | | | | | |
| Facility Goldman Sachs Group, | | | | | | | | |
| Inc.) (b)(d) | | | | 7,850 | | | | 7,850 |
| Series TOC 06 Z11, 3.24% | | | | | | | | |
| (Liquidity Facility Goldman Sachs | | | | | | | | |
| Group, Inc.) (b)(d) | | | | 3,300 | | | | 3,300 |
| Series 2005 D2, 3.17% (CIFG North | | | | | | | | |
| America Insured), VRDN (b) | | | | 42,955 | | | | 42,955 |
| Series C1, 3.18% (FSA Insured), | | | | | | | | |
| VRDN (b) | | | | 5,950 | | | | 5,950 |
| Chicago Gen. Oblig. Participating | | | | | | | | |
| VRDN: | | | | | | | | |
| Series EGL 06 01 Class A, 3.21% | | | | | | | | |
| (Liquidity Facility Citibank NA) (b)(d) | | | | 7,150 | | | | 7,150 |
| Series MS 00 426, 3.2% (Liquidity | | | | | | | | |
| Facility Morgan Stanley) (b)(d) | | | | 8,795 | | | | 8,795 |
| | | Principal | | Value (Note 1) |
| | | Amount (000s) | | (000s) |
| Series MS 1026, 3.2% (Liquidity | | | | | | | | |
| Facility Morgan Stanley) (b)(d) | | | | $ 5,100 | | | | $ 5,100 |
| Series PA 643R, 3.21% (Liquidity | | | | | | | | |
| Facility Merrill Lynch & Co., | | | | | | | | |
| Inc.) (b)(d) | | | | 5,895 | | | | 5,895 |
| Series PT 2356, 3.21% (Liquidity | | | | | | | | |
| Facility Dexia Cr. Local de | | | | | | | | |
| France) (b)(d) | | | | 9,495 | | | | 9,495 |
| Series Putters 1050, 3.21% (Liquidity | | | | | | | | |
| Facility JPMorgan Chase | | | | | | | | |
| Bank) (b)(d) | | | | 3,795 | | | | 3,795 |
| Chicago O’Hare Int’l. Arpt. Rev. | | | | | | | | |
| Participating VRDN: | | | | | | | | |
| Series DB 188, 3.21% (Liquidity | | | | | | | | |
| Facility Deutsche Bank AG) (b)(d) | | | | 8,730 | | | | 8,730 |
| Series EGL 06 20 Class A, 3.21% | | | | | | | | |
| (Liquidity Facility Citibank NA) (b)(d) | | | | 33,935 | | | | 33,935 |
| Series EGL 06 56 Class A, 3.21% | | | | | | | | |
| (Liquidity Facility Citibank NA) (b)(d) | | | | 6,445 | | | | 6,445 |
| Series MACN 06 A, 3.21% (Liquidity | | | | | | | | |
| Facility Bank of America NA) (b)(d) | | | | 6,330 | | | | 6,330 |
| Series PT 3334, 3.21% (Liquidity | | | | | | | | |
| Facility Dexia Cr. Local de | | | | | | | | |
| France) (b)(d) | | | | 11,490 | | | | 11,490 |
| Series PT 3356, 3.21% (Liquidity | | | | | | | | |
| Facility Dexia Cr. Local de | | | | | | | | |
| France) (b)(d) | | | | 9,705 | | | | 9,705 |
| Series ROC II R494, 3.21% (Liquidity | | | | | | | | |
| Facility Citibank NA) (b)(d) | | | | 10,900 | | | | 10,900 |
| Chicago Park District Participating VRDN | | | | | | | | |
| Series PT 3195, 3.21% (Liquidity | | | | | | | | |
| Facility Merrill Lynch & Co., Inc.) (b)(d) | | | | 5,880 | | | | 5,880 |
| Chicago Pub. Bldg. Commission Bldg. | | | | | | | | |
| Rev. Participating VRDN Series PT | | | | | | | | |
| 1835, 3.21% (Liquidity Facility Merrill | | | | | | | | |
| Lynch & Co., Inc.) (b)(d) | | | | 5,950 | | | | 5,950 |
| Chicago Sales Tax Rev. 3.22% (FGIC | | | | | | | | |
| Insured), VRDN (b) | | | | 7,600 | | | | 7,600 |
| Chicago Skyway Toll Bridge Rev. | | | | | | | | |
| Participating VRDN Series EGL 01 | | | | | | | | |
| 1304, 3.21% (Liquidity Facility Citibank | | | | | | | | |
| NA, New York) (b)(d) | | | | 3,000 | | | | 3,000 |
| Chicago Wtr. Rev. Participating VRDN | | | | | | | | |
| Series Merlots 00 TT, 3.21% (Liquidity | | | | | | | | |
| Facility Wachovia Bank NA) (b)(d) | | | | 5,200 | | | | 5,200 |
| Clipper Tax Exempt Trust Participating | | | | | | | | |
| VRDN Series Clipper 05 21, 3.25% | | | | | | | | |
| (Liquidity Facility State Street Bank & | | | | | | | | |
| Trust Co., Boston) (b)(d) | | | | 5,040 | | | | 5,040 |
| Cook County Forest Preservation District | | | | | | | | |
| Participating VRDN Series Putters 566, | | | | | | | | |
| 3.21% (Liquidity Facility JPMorgan | | | | | | | | |
| Chase Bank) (b)(d) | | | | 6,300 | | | | 6,300 |
| Cook County Gen. Oblig. Participating | | | | | | | | |
| VRDN: | | | | | | | | |
| Series EGL 01 1302, 3.21% (Liquidity | | | | | | | | |
| Facility Citibank NA, New | | | | | | | | |
| York) (b)(d) | | | | 6,700 | | | | 6,700 |
See accompanying notes which are an integral part of the financial statements.
49 Annual Report
| Tax-Exempt Portfolio | | | | | | | | |
| Investments - continued | | | | | | | | |
| |
| |
| |
| Municipal Securities continued | | | | | | |
| |
| | | Principal | | Value (Note 1) |
| | | Amount (000s) | | (000s) |
| Illinois – continued | | | | | | | | |
| Cook County Gen. Oblig. Participating | | | | | | | | |
| VRDN: continued | | | | | | | | |
| Series PT 2637, 3.21% (Liquidity | | | | | | | | |
| Facility Merrill Lynch & Co., | | | | | | | | |
| Inc.) (b)(d) | | | | $ 5,125 | | | | $ 5,125 |
| Illinois Edl. Facilities Auth. Revs. | | | | | | | | |
| Participating VRDN: | | | | | | | | |
| Series Merlots 97 U, 3.21% (Liquidity | | | | | | | | |
| Facility Wachovia Bank NA) (b)(d) . | | | | 4,250 | | | | 4,250 |
| Series MS 1077, 3.2% (Liquidity | | | | | | | | |
| Facility Morgan Stanley) (b)(d) | | | | 4,995 | | | | 4,995 |
| Illinois Fin. Auth. Rev.: | | | | | | | | |
| Participating VRDN: | | | | | | | | |
| Series PT 3252, 3.21% (Liquidity | | | | | | | | |
| Facility Merrill Lynch & Co., | | | | | | | | |
| Inc.) (b)(d) | | | | 5,015 | | | | 5,015 |
| Series ROC II R6015, 3.21% | | | | | | | | |
| (Liquidity Facility Citibank | | | | | | | | |
| NA) (b)(d) | | | | 4,965 | | | | 4,965 |
| (Central DuPage Hosp. Proj.) Series B, | | | | | | | | |
| 3.2%, VRDN (b) | | | | 20,000 | | | | 20,000 |
| (Rest Haven Christian Services Proj.) | | | | | | | | |
| Series B, 3.19%, LOC KBC Bank NV, | | | | | | | | |
| VRDN (b) | | | | 9,800 | | | | 9,800 |
| Illinois Gen. Oblig.: | | | | | | | | |
| Participating VRDN: | | | | | | | | |
| Series EGL 00 1304, 3.21% | | | | | | | | |
| (Liquidity Facility Citibank NA, | | | | | | | | |
| New York) (b)(d) | | | | 2,300 | | | | 2,300 |
| Series MS 1024, 3.2% (Liquidity | | | | | | | | |
| Facility Morgan Stanley) (b)(d) | | | | 13,425 | | | | 13,425 |
| Series MS 98 143, 3.2% (Liquidity | | | | | | | | |
| Facility Morgan Stanley) (b)(d) | | | | 38,520 | | | | 38,520 |
| Series PT 1975, 3.21% (Liquidity | | | | | | | | |
| Facility Merrill Lynch & Co., | | | | | | | | |
| Inc.) (b)(d) | | | | 3,990 | | | | 3,990 |
| Series PT 3359, 3.21% (Liquidity | | | | | | | | |
| Facility Dexia Cr. Local de | | | | | | | | |
| France) (b)(d) | | | | 8,740 | | | | 8,740 |
| Series Putters 133, 3.21% (Liquidity | | | | | | | | |
| Facility JPMorgan Chase & | | | | | | | | |
| Co.) (b)(d) | | | | 4,940 | | | | 4,940 |
| Series 2003 B, 3.23% (Liquidity | | | | | | | | |
| Facility DEPFA BANK PLC), | | | | | | | | |
| VRDN (b) | | | | 4,300 | | | | 4,300 |
| Illinois Health Facilities Auth. Rev.: | | | | | | | | |
| (Memorial Health Sys. Proj.) 3.23%, | | | | | | | | |
| LOC JPMorgan Chase Bank, | | | | | | | | |
| VRDN (b) | | | | 4,500 | | | | 4,500 |
| (Rehabilitation Inst. of Chicago Proj.) | | | | | | | | |
| Series 1997, 3.22%, LOC Bank of | | | | | | | | |
| America NA, VRDN (b) | | | | 31,300 | | | | 31,300 |
| Illinois Reg’l. Trans. Auth. Participating | | | | | | | | |
| VRDN: | | | | | | | | |
| Series EGL 01 1306, 3.21% (Liquidity | | | | | | | | |
| Facility Citibank NA, New | | | | | | | | |
| York) (b)(d) | | | | 8,600 | | | | 8,600 |
| | | Principal | | Value (Note 1) |
| | | Amount (000s) | | (000s) |
| Series EGL 7050028 Class A, 3.21% | | | | | | |
| (Liquidity Facility Citibank NA) (b)(d) | | $ 2,895 | | | | $ 2,895 |
| Series MACN 06 K, 3.21% (Liquidity | | | | | | |
| Facility Bank of America NA) (b)(d) | | 5,505 | | | | 5,505 |
| Series Merlots 02 A24, 3.21% | | | | | | |
| (Liquidity Facility Bank of New York, | | | | | | |
| New York) (b)(d) | | 4,945 | | | | 4,945 |
| Series PT 2761, 3.21% (Liquidity | | | | | | |
| Facility Dexia Cr. Local de | | | | | | |
| France) (b)(d) | | 19,055 | | | | 19,055 |
| Lake County Cmnty. High School District | | | | | | |
| Participating VRDN Series PT 3383, | | | | | | |
| 3.21% (Liquidity Facility Dexia Cr. Local | | | | | | |
| de France) (b)(d) | | 10,180 | | | | 10,180 |
| Metropolitan Pier & Exposition Auth. | | | | | | |
| Dedicated State Tax Rev. Participating | | | | | | |
| VRDN: | | | | | | |
| Series PZ 44, 3.25% (Liquidity Facility | | | | | | |
| Merrill Lynch & Co., Inc.) (b)(d) | | 6,610 | | | | 6,610 |
| Series PZ 84, 3.25% (Liquidity Facility | | | | | | |
| Merrill Lynch & Co., Inc.) (b)(d) | | 13,465 | | | | 13,465 |
| Quad Cities Reg’l. Econ. Dev. Auth. Rev. | | | | | | |
| (Two Rivers YMCA, Inc. Proj.) 3.23%, | | | | | | |
| LOC U.S. Bank NA, Minnesota, | | | | | | |
| VRDN (b) | | 2,600 | | | | 2,600 |
| Schaumburg Village Gen. Oblig. | | | | | | |
| Participating VRDN Series EGL 04 45 | | | | | | |
| Class A, 3.21% (Liquidity Facility | | | | | | |
| Citibank NA) (b)(d) | | 3,085 | | | | 3,085 |
| Springfield Elec. Rev. Participating VRDN | | | | | | |
| Series EGL 06 26 Class A, 3.21% | | | | | | |
| (Liquidity Facility Citibank NA) (b)(d) . | | 11,085 | | | | 11,085 |
| Univ. of Illinois Auxiliary Facilities Sys. | | | | | | |
| Rev. Participating VRDN: | | | | | | |
| Series EGL 00 1301, 3.21% (Liquidity | | | | | | |
| Facility Citibank NA, New | | | | | | |
| York) (b)(d) | | 6,855 | | | | 6,855 |
| Series SG 65, 3.21% (Liquidity Facility | | | | | | |
| Societe Generale) (b)(d) | | 3,000 | | | | 3,000 |
| Yorkville Svc. Area 2004 106 Tax (MPI | | | | | | |
| Grande Reserve Proj.) 3.2%, LOC | | | | | | |
| Lasalle Bank NA, VRDN (b) | | 6,000 | | | | 6,000 |
| | | | | | | 536,790 |
| |
| Indiana – 1.8% | | | | | | |
| Avon 2000 Cmnty. School Bldg. Corp. | | | | | | |
| Participating VRDN Series Putters | | | | | | |
| 1055, 3.21% (Liquidity Facility | | | | | | |
| JPMorgan Chase & Co.) (b)(d) | | 6,295 | | | | 6,295 |
| Boone County Hosp. Assoc. Lease Rev. | | | | | | |
| Participating VRDN Series DB 149, | | | | | | |
| 3.21% (Liquidity Facility Deutsche Bank | | | | | | |
| AG) (b)(d) | | 8,950 | | | | 8,950 |
| Ctr. Grove 2000 Bldg. Corp. | | | | | | |
| Participating VRDN Series DB 135, | | | | | | |
| 3.21% (Liquidity Facility Deutsche Bank | | | | | | |
| AG) (b)(d) | | 6,040 | | | | 6,040 |
See accompanying notes which are an integral part of the financial statements.
Annual Report 50
| Municipal Securities continued | | | | | | |
| |
| | | Principal | | Value (Note 1) |
| | | Amount (000s) | | (000s) |
| Indiana – continued | | | | | | | | |
| Eclipse Fdg. Trust Participating VRDN | | | | | | | | |
| Series Solar 06 15, 3.2% (Liquidity | | | | | | | | |
| Facility U.S. Bank NA, | | | | | | | | |
| Minnesota) (b)(d) | | | | $ 5,000 | | | | $ 5,000 |
| Indiana Bond Bank RAN 4.5% 2/1/07, | | | | | | | | |
| LOC Bank of New York, New York | | | | 12,115 | | | | 12,231 |
| Indiana Edl. Facilities Auth. Rev. (Earlham | | | | | | | | |
| College Proj.) Series E, 3.2%, LOC U.S. | | | | | | | | |
| Bank NA, Minnesota, VRDN (b) | | | | 7,505 | | | | 7,505 |
| Indiana Health & Edl. Facilities Fing. | | | | | | | | |
| Auth. Hosp. Rev. (Howard Reg’l. Health | | | | | | | | |
| Sys. Proj.): | | | | | | | | |
| Series A, 3.23%, LOC Comerica Bank, | | | | | | | | |
| Detroit, VRDN (b) | | | | 3,400 | | | | 3,400 |
| 3.18%, LOC JPMorgan Chase Bank, | | | | | | | | |
| VRDN (b) | | | | 15,000 | | | | 15,000 |
| Indiana Muni. Pwr. Agcy. Pwr. Supply | | | | | | | | |
| Sys. Rev. Participating VRDN Series PT | | | | | | | | |
| 1412, 3.21% (Liquidity Facility Merrill | | | | | | | | |
| Lynch & Co., Inc.) (b)(d) | | | | 12,380 | | | | 12,380 |
| Indiana Toll Road Commission Toll Road | | | | | | | | |
| Rev. Participating VRDN: | | | | | | | | |
| Series Merlots 01 A104, 3.21% | | | | | | | | |
| (Liquidity Facility Wachovia Bank | | | | | | | | |
| NA) (b)(d) | | | | 3,245 | | | | 3,245 |
| Series Stars 103, 3.19% (Liquidity | | | | | | | | |
| Facility BNP Paribas SA) (b)(d) | | | | 14,705 | | | | 14,705 |
| Indiana Trans. Fin. Auth. Hwy. | | | | | | | | |
| Participating VRDN Series Merlots B18, | | | | | | | | |
| 3.21% (Liquidity Facility Wachovia | | | | | | | | |
| Bank NA) (b)(d) | | | | 4,995 | | | | 4,995 |
| Indianapolis Local Pub. Impt. Bond Bank | | | | | | | | |
| Participating VRDN Series MACN 06 | | | | | | | | |
| S, 3.21% (Liquidity Facility Bank of | | | | | | | | |
| America NA) (b)(d) | | | | 4,240 | | | | 4,240 |
| Mount Vernon of Hancock County | | | | | | | | |
| Multi School Corp. Participating VRDN | | | | | | | | |
| Series DB 137, 3.21% (Liquidity Facility | | | | | | | | |
| Deutsche Bank AG) (b)(d) | | | | 5,500 | | | | 5,500 |
| New Albany Floyd County Independent | | | | | | | | |
| School Bldg. Corp. Participating VRDN | | | | | | | | |
| Series PT 2794, 3.21% (Liquidity | | | | | | | | |
| Facility Merrill Lynch & Co., Inc.) (b)(d) | | | | 8,350 | | | | 8,350 |
| Plainfield Cmnty. High School Bldg. Corp. | | | | | | | | |
| Participating VRDN Series PT 3281, | | | | | | | | |
| 3.21% (Liquidity Facility Merrill Lynch & | | | | | | | | |
| Co., Inc.) (b)(d) | | | | 5,425 | | | | 5,425 |
| Richmond Econ. Dev. Rev. (Friends | | | | | | | | |
| Fellowship Cmnty. Proj.) Series 1993, | | | | | | | | |
| 3.6%, LOC U.S. Bank NA, Minnesota, | | | | | | | | |
| VRDN (b) | | | | 900 | | | | 900 |
| | | Principal | | Value (Note 1) |
| | | Amount (000s) | | (000s) |
| Valparaiso Econ. Dev. Rev. (Indiana | | | | | | | | |
| Retirement Cmnty. Proj.) 3.6%, LOC | | | | | | | | |
| JPMorgan Chase Bank, VRDN (b) | | | | $ 800 | | | | $ 800 |
| Westfield Independent High School Bldg. | | | | | | | | |
| Corp. Participating VRDN Series Putters | | | | | | | | |
| 98 236, 3.21% (Liquidity Facility | | | | | | | | |
| JPMorgan Chase Bank) (b)(d) | | | | 10,065 | | | | 10,065 |
| | | | | | | | | 135,026 |
| |
| Iowa 0.1% | | | | | | | | |
| Grinnell Hosp. Rev. (Grinnell Reg’l. Med. | | | | | | | | |
| Ctr. Proj.) 3.23%, LOC U.S. Bank NA, | | | | | | | | |
| Minnesota, VRDN (b) | | | | 4,535 | | | | 4,535 |
| Iowa Fin. Auth. Wellness Facilities Rev. | | | | | | | | |
| (Cmnty. Y of Marshalltown Proj.) | | | | | | | | |
| 3.23%, LOC Bank of America NA, | | | | | | | | |
| VRDN (b) | | | | 3,400 | | | | 3,400 |
| | | | | | | | | 7,935 |
| |
| Kansas 1.2% | | | | | | | | |
| Kansas Dept. of Trans. Hwy. Rev.: | | | | | | | | |
| Participating VRDN Series EGL 00 | | | | | | | | |
| 1601, 3.21% (Liquidity Facility | | | | | | | | |
| Citibank NA, New York) (b)(d) | | | | 4,000 | | | | 4,000 |
| Series 2002 B1, 3.2% (Liquidity | | | | | | | | |
| Facility Dexia Cr. Local de France) | | | | | | | | |
| (Liquidity Facility WestLB AG), | | | | | | | | |
| VRDN (b) | | | | 10,000 | | | | 10,000 |
| Series 2004 C3, 3.15% (Liquidity | | | | | | | | |
| Facility DEPFA BANK PLC), | | | | | | | | |
| VRDN (b) | | | | 22,875 | | | | 22,875 |
| Kansas Dev. Fin. Auth. Lease Rev. (State | | | | | | | | |
| of Kansas Dept. of Administration 7th | | | | | | | | |
| and Harrison State Office Bldg. Proj.) | | | | | | | | |
| Series 2002 J2, 3.18% (Liquidity | | | | | | | | |
| Facility Kansas Pooled Money Invt. | | | | | | | | |
| Board), VRDN (b) | | | | 10,800 | | | | 10,800 |
| Wichita Hosp. Rev. Bonds Series MT 170, | | | | | | | | |
| 3.43%, tender 2/1/07 (Liquidity | | | | | | | | |
| Facility Landesbank | | | | | | | | |
| Hessen Thuringen) (b)(d)(e) | | | | 27,100 | | | | 27,100 |
| Wyandotte County/Kansas City Unified | | | | | | | | |
| Govt. Gen. Oblig. BAN 3% 4/1/06 . | | | | 10,955 | | | | 10,955 |
| | | | | | | | | 85,730 |
| |
| Kentucky – 1.1% | | | | | | | | |
| Clark County Poll. Cont. Rev. Bonds (East | | | | | | | | |
| Kentucky Pwr. Coop., Inc. Proj.) Series | | | | | | | | |
| J2, 2.95%, tender 4/15/06 (Nat’l. | | | | | | | | |
| Rural Utils. Coop. Fin. Corp. | | | | | | | | |
| Guaranteed) (b) | | | | 2,695 | | | | 2,695 |
| Danville Multi City Lease Rev. Bonds | | | | | | | | |
| (Kentucky Muni. League Pooled Lease | | | | | | | | |
| Fing. Prog.) 3.56% tender 8/2/06, | | | | | | | | |
| LOC Fifth Third Bank, Cincinnati, CP | | | | | | | | |
| mode | | | | 25,675 | | | | 25,675 |
| Kentucky Econ. Dev. Fin. Auth. (Catholic | | | | | | | | |
| Health Initiatives Proj.) Series C, 3.17%, | | | | | | | | |
| VRDN (b) | | | | 26,500 | | | | 26,500 |
See accompanying notes which are an integral part of the financial statements.
51 Annual Report
| Tax-Exempt Portfolio | | | | | | | | |
| Investments - continued | | | | | | | | |
| |
| |
| |
| Municipal Securities continued | | | | | | |
| |
| | | Principal | | Value (Note 1) |
| | | Amount (000s) | | (000s) |
| Kentucky – continued | | | | | | | | |
| Kentucky Property & Bldgs. Commission | | | | | | | | |
| Revs. Participating VRDN Series IXIS | | | | | | | | |
| 05 24, 3.21% (Liquidity Facility CDC | | | | | | | | |
| Fin. CDC IXIS) (b)(d) | | | | $ 6,985 | | | | $ 6,985 |
| Louisville & Jefferson County Metropolitan | | | | | | | | |
| Swr. District Swr. & Drain Sys. Rev. | | | | | | | | |
| Participating VRDN Series EGL 01 | | | | | | | | |
| 1701, 3.21% (Liquidity Facility Citibank | | | | | | | | |
| NA, New York) (b)(d) | | | | 3,915 | | | | 3,915 |
| Mason County Poll. Cont. Rev. (East | | | | | | | | |
| Kentucky Pwr. Coop. Proj.): | | | | | | | | |
| Series 1984 B1, 3.3% (Nat’l. Rural | | | | | | | | |
| Utils. Coop. Fin. Corp. Guaranteed), | | | | | | | | |
| VRDN (b) | | | | 2,250 | | | | 2,250 |
| Series 1984 B2, 3.3% (Nat’l. Rural | | | | | | | | |
| Utils. Coop. Fin. Corp. Guaranteed), | | | | | | | | |
| VRDN (b) | | | | 6,500 | | | | 6,500 |
| Series 1984 B3, 3.3% (Nat’l. Rural | | | | | | | | |
| Utils. Coop. Fin. Corp. Guaranteed), | | | | | | | | |
| VRDN (b) | | | | 6,075 | | | | 6,075 |
| | | | | | | | | 80,595 |
| |
| Louisiana 0.3% | | | | | | | | |
| Louisiana Gas & Fuel Tax Rev. | | | | | | | | |
| Participating VRDN Series PT 2749, | | | | | | | | |
| 3.21% (Liquidity Facility Merrill Lynch & | | | | | | | | |
| Co., Inc.) (b)(d) | | | | 5,265 | | | | 5,265 |
| New Orleans Aviation Board Rev. Series | | | | | | | | |
| 1993 B, 3.3% (MBIA Insured), | | | | | | | | |
| VRDN (b) | | | | 19,345 | | | | 19,345 |
| | | | | | | | | 24,610 |
| |
| Maine – 0.1% | | | | | | | | |
| Maine Health & Higher Ed. Facilities | | | | | | | | |
| Auth. Rev. Participating VRDN Series | | | | | | | | |
| PT 1923, 3.21% (Liquidity Facility | | | | | | | | |
| Merrill Lynch & Co., Inc.) (b)(d) | | | | 2,735 | | | | 2,735 |
| Maine Tpk. Auth. Tpk. Rev. Participating | | | | | | | | |
| VRDN Series EGL 00 1901, 3.21% | | | | | | | | |
| (Liquidity Facility Citibank NA, | | | | | | | | |
| New York) (b)(d) | | | | 3,975 | | | | 3,975 |
| | | | | | | | | 6,710 |
| |
| Maryland – 1.2% | | | | | | | | |
| Baltimore County Gen. Oblig. Series | | | | | | | | |
| 1995, 3.51% 8/1/06, CP | | | | 10,050 | | | | 10,050 |
| Baltimore County Metropolitan District: | | | | | | | | |
| 3.18% 4/7/06 (Liquidity Facility | | | | | | | | |
| WestLB AG), CP | | | | 6,700 | | | | 6,700 |
| 3.25% 4/7/06 (Liquidity Facility | | | | | | | | |
| WestLB AG), CP | | | | 3,000 | | | | 3,000 |
| Baltimore Rev. Participating VRDN Series | | | | | | | | |
| SGA 20, 3.23% (Liquidity Facility | | | | | | | | |
| Societe Generale) (b)(d) | | | | 5,500 | | | | 5,500 |
| | | Principal | | Value (Note 1) |
| | | Amount (000s) | | (000s) |
| Maryland Cmnty. Dev. Administration | | | | | | | | |
| Dept. of Hsg. & Cmnty. Dev. | | | | | | | | |
| Participating VRDN Series MT 160, | | | | | | | | |
| 3.22% (Liquidity Facility Merrill Lynch & | | | | | | | | |
| Co., Inc.) (b)(d) | | | | $ 3,455 | | | | $ 3,455 |
| Maryland Health & Higher Edl. Facilities | | | | | | | | |
| Auth. Rev.: | | | | | | | | |
| (Adventist Health Mid Atlantic Proj.) | | | | | | | | |
| Series 2005 B, 3.18%, LOC | | | | | | | | |
| Manufacturers & Traders Trust Co., | | | | | | | | |
| VRDN (b) | | | | 15,000 | | | | 15,000 |
| Series 2004 C, 3.28% 4/7/06 | | | | | | | | |
| (Liquidity Facility SunTrust Banks, | | | | | | | | |
| Inc.), CP | | | | 6,800 | | | | 6,800 |
| Series A, 3.25% 4/3/06 (Liquidity | | | | | | | | |
| Facility Bank of America NA), CP | | | | 21,170 | | | | 21,170 |
| Montgomery County Econ. Dev. Rev. | | | | | | | | |
| (Riderwood Village, Inc. Proj.) 3.19%, | | | | | | | | |
| LOC Manufacturers & Traders Trust | | | | | | | | |
| Co., VRDN (b) | | | | 20,000 | | | | 20,000 |
| | | | | | | | | 91,675 |
| |
| Massachusetts 4.0% | | | | | | | | |
| Massachusetts Gen. Oblig.: | | | | | | | | |
| Participating VRDN: | | | | | | | | |
| Series EGL 01 2105, 3.21% | | | | | | | | |
| (Liquidity Facility Citibank NA, | | | | | | | | |
| New York) (b)(d) | | | | 21,000 | | | | 21,000 |
| Series EGL 04 5 Class A, 3.21% | | | | | | | | |
| (Liquidity Facility Citibank | | | | | | | | |
| NA) (b)(d) | | | | 12,000 | | | | 12,000 |
| Series EGL 7050062 Class A, | | | | | | | | |
| 3.21% (Liquidity Facility Citibank | | | | | | | | |
| NA) (b)(d) | | | | 16,575 | | | | 16,575 |
| Series PA 945R, 3.19% (Liquidity | | | | | | | | |
| Facility Merrill Lynch & Co., | | | | | | | | |
| Inc.) (b)(d) | | | | 4,995 | | | | 4,995 |
| Series 2005 A, 3.18% (Liquidity | | | | | | | | |
| Facility Citibank NA), VRDN (b) | | | | 50,000 | | | | 50,000 |
| Series 2006 A, 3.19% (Liquidity | | | | | | | | |
| Facility Dexia Cr. Local de France), | | | | | | | | |
| VRDN (b) | | | | 20,100 | | | | 20,100 |
| Series 2006 B, 3.19% (Liquidity | | | | | | | | |
| Facility Bank of America NA), | | | | | | | | |
| VRDN (b) | | | | 69,500 | | | | 69,500 |
| Massachusetts Health & Edl. Facilities | | | | | | | | |
| Auth. Rev. (Baystate Med. Ctr. Proj.) | | | | | | | | |
| Series G, 3.16%, LOC Bank of America | | | | | | | | |
| NA, VRDN (b) | | | | 16,300 | | | | 16,300 |
| Massachusetts School Bldg. Auth. | | | | | | | | |
| Dedicated Sales Tax Rev. Participating | | | | | | | | |
| VRDN Series 720050069, 3.21% | | | | | | | | |
| (Liquidity Facility Citibank NA) (b)(d) . | | | | 21,160 | | | | 21,160 |
See accompanying notes which are an integral part of the financial statements.
Annual Report 52
| Municipal Securities continued | | | | | | |
| |
| | | Principal | | Value (Note 1) |
| | | Amount (000s) | | (000s) |
| Massachusetts – continued | | | | | | |
| Massachusetts Spl. Oblig. Dedicated Tax | | | | | | |
| Rev. Participating VRDN: | | | | | | |
| Series EGL 7050063 Class A, 3.21% | | | | | | |
| (Liquidity Facility Citibank NA) (b)(d) | | $ 54,400 | | | | $ 54,400 |
| Series EGL 7050068 Class A, 3.21% | | | | | | |
| (Liquidity Facility Citibank NA) (b)(d) | | 11,880 | | | | 11,880 |
| | | | | | | 297,910 |
| |
| Michigan – 3.9% | | | | | | |
| Charlotte Pub. School District | | | | | | |
| Participating VRDN Series Putters 860, | | | | | | |
| 3.21% (Liquidity Facility JPMorgan | | | | | | |
| Chase Bank) (b)(d) | | 5,045 | | | | 5,045 |
| Detroit City School District Participating | | | | | | |
| VRDN: | | | | | | |
| ROC II R1033, 3.21% (Liquidity | | | | | | |
| Facility Citigroup Global Markets | | | | | | |
| Hldgs., Inc.) (b)(d) | | 3,665 | | | | 3,665 |
| Series BA 01 P, 3.27% (Liquidity | | | | | | |
| Facility Bank of America NA) (b)(d) | | 6,075 | | | | 6,075 |
| Series PT 1579, 3.2% (Liquidity | | | | | | |
| Facility Merrill Lynch & Co., | | | | | | |
| Inc.) (b)(d) | | 13,030 | | | | 13,030 |
| Detroit Swr. Disp. Rev. Participating | | | | | | |
| VRDN: | | | | | | |
| Series Merlots 00 I, 3.21% (Liquidity | | | | | | |
| Facility Wachovia Bank NA) (b)(d) . | | 7,500 | | | | 7,500 |
| Series PT 2595, 3.2% (Liquidity | | | | | | |
| Facility Dexia Cr. Local de | | | | | | |
| France) (b)(d) | | 11,970 | | | | 11,970 |
| Detroit Wtr. Supply Sys. Rev. Participating | | | | | | |
| VRDN Series Merlots 00 D, 3.21% | | | | | | |
| (Liquidity Facility Wachovia Bank | | | | | | |
| NA) (b)(d) | | 4,100 | | | | 4,100 |
| Eastern Michigan Univ. Revs. Series A, | | | | | | |
| 3.18% (XL Cap. Assurance, Inc. | | | | | | |
| Insured), VRDN (b) | | 35,680 | | | | 35,680 |
| Fraser Pub. School District Participating | | | | | | |
| VRDN Series AAB 05 39, 3.2% | | | | | | |
| (Liquidity Facility ABN AMRO Bank | | | | | | |
| NV) (b)(d) | | 8,000 | | | | 8,000 |
| Huron Valley School District Participating | | | | | | |
| VRDN Series EGL 01 2203, 3.21% | | | | | | |
| (Liquidity Facility Citibank NA, New | | | | | | |
| York) (b)(d) | | 13,375 | | | | 13,375 |
| Kent County Bldg. Auth. Participating | | | | | | |
| VRDN Series PT 3242, 3.2% (Liquidity | | | | | | |
| Facility Dexia Cr. Local de | | | | | | |
| France) (b)(d) | | 11,050 | | | | 11,050 |
| L’Anse Creuse Pub. Schools Participating | | | | | | |
| VRDN Series EGL 06 32 Class A, | | | | | | |
| 3.21% (Liquidity Facility Citibank | | | | | | |
| NA) (b)(d) | | 3,700 | | | | 3,700 |
| Lakeview School District Calhoun County | | | | | | |
| 3.15% (Michigan Gen. Oblig. | | | | | | |
| Guaranteed), VRDN (b) | | 9,500 | | | | 9,500 |
| | | Principal | | Value (Note 1) |
| | | Amount (000s) | | (000s) |
| Michigan Bldg. Auth. Rev.: | | | | | | | | |
| Participating VRDN: | | | | | | | | |
| Series AAB 02 35, 3.2% (Liquidity | | | | | | | | |
| Facility ABN AMRO Bank | | | | | | | | |
| NV) (b)(d) | | | | $ 13,845 | | | | $ 13,845 |
| Series AAB 05 33, 3.2% (Liquidity | | | | | | | | |
| Facility ABN AMRO Bank | | | | | | | | |
| NV) (b)(d) | | | | 5,995 | | | | 5,995 |
| Series EGL 01 2202, 3.21% | | | | | | | | |
| (Liquidity Facility Citibank NA, | | | | | | | | |
| New York) (b)(d) | | | | 8,145 | | | | 8,145 |
| Series PA 889R, 3.2% (Liquidity | | | | | | | | |
| Facility Merrill Lynch & Co., | | | | | | | | |
| Inc.) (b)(d) | | | | 7,795 | | | | 7,795 |
| (Facilities Prog.) Series 2005 IIA, | | | | | | | | |
| 3.22%, LOC DEPFA BANK PLC, | | | | | | | | |
| VRDN (b) | | | | 48,000 | | | | 48,000 |
| Michigan Gen. Oblig.: | | | | | | | | |
| Bonds Series 2005 C, 3.15% tender | | | | | | | | |
| 4/4/06 (Liquidity Facility DEPFA | | | | | | | | |
| BANK PLC), CP mode | | | | 5,300 | | | | 5,300 |
| Participating VRDN Series Putters 125, | | | | | | | | |
| 3.21% (Liquidity Facility JPMorgan | | | | | | | | |
| Chase & Co.) (b)(d) | | | | 17,280 | | | | 17,280 |
| Michigan Hosp. Fin. Auth. Hosp. Rev. | | | | | | | | |
| Series C, 3.22%, LOC Fifth Third Bank, | | | | | | | | |
| Cincinnati, VRDN (b) | | | | 11,900 | | | | 11,900 |
| Michigan Pub. Pwr. Agcy. Rev. | | | | | | | | |
| Participating VRDN Series IXIS 05 28, | | | | | | | | |
| 3.2% (Liquidity Facility CDC Fin. CDC | | | | | | | | |
| IXIS) (b)(d) | | | | 17,805 | | | | 17,805 |
| Michigan Strategic Fund Ltd. Oblig. Rev. | | | | | | | | |
| (The Van Andel Research Institute Proj.) | | | | | | | | |
| Series 1999, 3.22%, LOC Lasalle Bank | | | | | | | | |
| Midwest NA, VRDN (b) | | | | 14,400 | | | | 14,400 |
| West Branch Rose City Area School | | | | | | | | |
| District Participating VRDN Series ROC | | | | | | | | |
| II R7511, 3.21% (Liquidity Facility | | | | | | | | |
| Citibank NA) (b)(d) | | | | 6,105 | | | | 6,105 |
| | | | | | | | | 289,260 |
| |
| Minnesota – 1.7% | | | | | | | | |
| Duluth Econ. Dev. Auth. Health Care | | | | | | | | |
| Facilities Rev. (Miller Dwan Med. Ctr. | | | | | | | | |
| #97 Proj.) 3.23%, LOC U.S. Bank NA, | | | | | | | | |
| Minnesota, VRDN (b) | | | | 3,650 | | | | 3,650 |
| Minneapolis & Saint Paul Hsg. Fin. Board | | | | | | | | |
| Rev. Participating VRDN Series MT | | | | | | | | |
| 120, 3.22% (Liquidity Facility | | | | | | | | |
| Landesbank Hessen Thuringen) (b)(d) . | | | | 4,870 | | | | 4,870 |
| Minneapolis & Saint Paul Metropolitan | | | | | | | | |
| Arpts. Commission Arpt. Rev. | | | | | | | | |
| Participating VRDN: | | | | | | | | |
| Series Merlots 00 ZZ, 3.21% (Liquidity | | | | | | | | |
| Facility Wachovia Bank NA) (b)(d) . | | | | 14,220 | | | | 14,220 |
| Series SGA 121, 3.23% (Liquidity | | | | | | | | |
| Facility Societe Generale) (b)(d) | | | | 3,700 | | | | 3,700 |
See accompanying notes which are an integral part of the financial statements.
53 Annual Report
| Tax-Exempt Portfolio | | | | | | | | |
| Investments - continued | | | | | | | | |
| |
| |
| |
| Municipal Securities continued | | | | | | |
| |
| | | Principal | | Value (Note 1) |
| | | Amount (000s) | | (000s) |
| Minnesota – continued | | | | | | | | |
| Minnesota Gen. Oblig. Participating | | | | | | | | |
| VRDN: | | | | | | | | |
| Series EGL 01 2301 Class A, 3.21% | | | | | | | | |
| (Liquidity Facility Citibank NA, | | | | | | | | |
| New York) (b)(d) | | | | $ 3,300 | | | | $ 3,300 |
| Series MS 01 719, 3.2% (Liquidity | | | | | | | | |
| Facility Morgan Stanley) (b)(d) | | | | 43,120 | | | | 43,120 |
| Series ROC II R4039, 3.21% (Liquidity | | | | | | | | |
| Facility Citigroup Global Markets | | | | | | | | |
| Hldgs., Inc.) (b)(d) | | | | 3,645 | | | | 3,645 |
| Minnetonka Multi family Hsg. Rev. (Cliffs | | | | | | | | |
| at Ridgedale Proj.) Series 1995, | | | | | | | | |
| 3.22%, LOC Fannie Mae, VRDN (b) | | | | 21,400 | | | | 21,400 |
| Roseville Health Care Facilities | | | | | | | | |
| (Presbyterian Homes Proj.) 3.23%, LOC | | | | | | | | |
| U.S. Bank NA, Minnesota, VRDN (b) . | | | | 3,405 | | | | 3,405 |
| Southern Minnesota Muni. Pwr. Agcy. | | | | | | | | |
| Pwr. Supply Sys. Rev. Series A: | | | | | | | | |
| 3.27% 4/5/06 (Liquidity Facility | | | | | | | | |
| Landesbank Hessen Thuringen), CP | | | | 10,000 | | | | 10,000 |
| 3.27% 4/5/06 (Liquidity Facility | | | | | | | | |
| Landesbank Hessen Thuringen), CP | | | | 7,800 | | | | 7,800 |
| West Saint Paul Independent School | | | | | | | | |
| District #197 Participating VRDN | | | | | | | | |
| Series Putters 602, 3.21% (Liquidity | | | | | | | | |
| Facility JPMorgan Chase & Co.) (b)(d) | | | | 3,930 | | | | 3,930 |
| | | | | | | | | 123,040 |
| |
| Mississippi 1.2% | | | | | | | | |
| Claiborne County Poll. Cont. Rev. Bonds | | | | | | | | |
| (South Mississippi Elec. Pwr. Assoc. | | | | | | | | |
| Proj.) Series 1985 G2, 3.43% tender | | | | | | | | |
| 5/2/06 (Nat’l. Rural Utils. Coop. Fin. | | | | | | | | |
| Corp. Guaranteed), CP mode | | | | 6,900 | | | | 6,900 |
| Mississippi Bus. Fin. Corp. Rev. (Jackson | | | | | | | | |
| Med. Mall Foundation Prog.) Series | | | | | | | | |
| 2000 A, 3.22%, LOC JPMorgan Chase | | | | | | | | |
| Bank, VRDN (b) | | | | 24,300 | | | | 24,300 |
| Mississippi Dev. Bank Spl. Oblig. | | | | | | | | |
| Participating VRDN Series ROC II | | | | | | | | |
| R6051, 3.21% (Liquidity Facility | | | | | | | | |
| Citibank NA) (b)(d) | | | | 6,910 | | | | 6,910 |
| Mississippi Gen. Oblig.: | | | | | | | | |
| Participating VRDN: | | | | | | | | |
| Series EGL 99 2401, 3.21% | | | | | | | | |
| (Liquidity Facility Citibank NA, | | | | | | | | |
| New York) (b)(d) | | | | 5,300 | | | | 5,300 |
| Series MS 905, 3.2% (Liquidity | | | | | | | | |
| Facility Morgan Stanley) (b)(d) | | | | 3,325 | | | | 3,325 |
| Series Putters 138, 3.21% (Liquidity | | | | | | | | |
| Facility JPMorgan Chase & | | | | | | | | |
| Co.) (b)(d) | | | | 16,370 | | | | 16,370 |
| 3.17% (Liquidity Facility Bank of | | | | | | | | |
| America NA), VRDN (b) | | | | 26,400 | | | | 26,400 |
| | | | | | | | | 89,505 |
| | | Principal | | Value (Note 1) |
| | | Amount (000s) | | (000s) |
| Missouri 1.2% | | | | | | | | |
| Kansas City Indl. Dev. Auth. (Ewing | | | | | | | | |
| Marion Kauffman Foundation Prog.) | | | | | | | | |
| 3.18%, VRDN (b) | | | | $ 23,600 | | | | $ 23,600 |
| Missouri Board of Pub. Bldgs. State | | | | | | | | |
| Office Bldg. Spl. Oblig. Bonds Series | | | | | | | | |
| Putters 382, 3.6%, tender 8/24/06 | | | | | | | | |
| (Liquidity Facility JPMorgan Chase | | | | | | | | |
| Bank) (b)(d)(e) | | | | 8,010 | | | | 8,010 |
| Missouri Board Pub. Bldgs. Spl. Oblig. | | | | | | | | |
| Participating VRDN Series Merlots B38, | | | | | | | | |
| 3.21% (Liquidity Facility Wachovia | | | | | | | | |
| Bank NA) (b)(d) | | | | 5,995 | | | | 5,995 |
| Missouri Health & Edl. Facilities Auth. | | | | | | | | |
| Edl. Facilities Rev.: | | | | | | | | |
| Participating VRDN Series SG 157, | | | | | | | | |
| 3.21% (Liquidity Facility Societe | | | | | | | | |
| Generale) (b)(d) | | | | 14,840 | | | | 14,840 |
| (DeSmet Jesuit High School Proj.) | | | | | | | | |
| Series 2002, 3.23%, LOC U.S. Bank | | | | | | | | |
| NA, Minnesota, VRDN (b) | | | | 5,900 | | | | 5,900 |
| (Saint Louis Univ. Proj.): | | | | | | | | |
| Series 1999 B, 3.21% (Liquidity | | | | | | | | |
| Facility Bank of America NA), | | | | | | | | |
| VRDN (b) | | | | 4,700 | | | | 4,700 |
| 3.21% (Liquidity Facility U.S. Bank | | | | | | | | |
| NA, Minnesota), VRDN (b) | | | | 3,965 | | | | 3,965 |
| Missouri Health & Edl. Facilities Auth. | | | | | | | | |
| Health Facilities Rev.: | | | | | | | | |
| Participating VRDN Series Putters 847, | | | | | | | | |
| 3.21% (Liquidity Facility JPMorgan | | | | | | | | |
| Chase Bank) (b)(d) | | | | 3,195 | | | | 3,195 |
| (BJC Health Sys. Proj.) Series B, 3.18% | | | | | | | | |
| (Liquidity Facility Bank of Nova | | | | | | | | |
| Scotia, New York Agcy.) (Liquidity | | | | | | | | |
| Facility JPMorgan Chase Bank), | | | | | | | | |
| VRDN (b) | | | | 10,000 | | | | 10,000 |
| Platte County Reorganized School District | | | | | | | | |
| Participating VRDN Series PT 2180, | | | | | | | | |
| 3.21% (Liquidity Facility Merrill Lynch & | | | | | | | | |
| Co., Inc.) (b)(d) | | | | 5,220 | | | | 5,220 |
| | | | | | | | | 85,425 |
| |
| Nebraska 0.5% | | | | | | | | |
| Lancaster County Hosp. Auth. (Immanuel | | | | | | | | |
| Health Sys. Proj.) Series 2000 A, | | | | | | | | |
| 3.21%, VRDN (b) | | | | 4,005 | | | | 4,005 |
| Muni. Energy Agcy. Pwr. Swr. Rev. | | | | | | | | |
| Participating VRDN Series ROC II | | | | | | | | |
| R2051, 3.21% (Liquidity Facility | | | | | | | | |
| Citigroup Global Markets Hldgs., | | | | | | | | |
| Inc.) (b)(d) | | | | 4,365 | | | | 4,365 |
| Omaha Gen. Oblig. | | | | | | | | |
| Participating VRDN: | | | | | | | | |
| Series EGL 00 2701, 3.21% (Liquidity | | | | | | | | |
| Facility Citibank NA, New | | | | | | | | |
| York) (b)(d) | | | | 9,000 | | | | 9,000 |
See accompanying notes which are an integral part of the financial statements.
Annual Report 54
| Municipal Securities continued | | | | | | |
| |
| | | Principal | | Value (Note 1) |
| | | Amount (000s) | | (000s) |
| Nebraska – continued | | | | | | | | |
| Omaha Gen. Oblig. | | | | | | | | |
| Participating VRDN: continued | | | | | | | | |
| Series MSTC 00 108, 3.2% (Liquidity | | | | | | | | |
| Facility Bear Stearns Companies, | | | | | | | | |
| Inc.) (b)(d) | | | | $ 9,495 | | | | $ 9,495 |
| Omaha Pub. Pwr. District Participating | | | | | | | | |
| VRDN Series Solar 06 25, 3.2% | | | | | | | | |
| (Liquidity Facility U.S. Bank NA, | | | | | | | | |
| Minnesota) (b)(d) | | | | 9,000 | | | | 9,000 |
| | | | | | | | | 35,865 |
| |
| Nevada 1.1% | | | | | | | | |
| Clark County Gen. Oblig. Participating | | | | | | | | |
| VRDN: | | | | | | | | |
| Series MS 1282, 3.2% (Liquidity | | | | | | | | |
| Facility Morgan Stanley) (b)(d) | | | | 7,000 | | | | 7,000 |
| Series ROC II R1035, 3.21% (Liquidity | | | | | | | | |
| Facility Citigroup Global Markets | | | | | | | | |
| Hldgs., Inc.) (b)(d) | | | | 5,935 | | | | 5,935 |
| Clark County School District Participating | | | | | | | | |
| VRDN: | | | | | | | | |
| Series Merlots 05 B3, 3.21% (Liquidity | | | | | | | | |
| Facility Wachovia Bank NA) (b)(d) . | | | | 8,785 | | | | 8,785 |
| Series PT 2406, 3.21% (Liquidity | | | | | | | | |
| Facility Merrill Lynch & Co., | | | | | | | | |
| Inc.) (b)(d) | | | | 5,500 | | | | 5,500 |
| Clipper Tax Exempt Trust Participating | | | | | | | | |
| VRDN Series Clipper 05 37, 3.21% | | | | | | | | |
| (Liquidity Facility State Street Bank & | | | | | | | | |
| Trust Co., Boston) (b)(d) | | | | 20,000 | | | | 20,000 |
| Las Vegas Valley Wtr. District | | | | | | | | |
| Participating VRDN Series PT 1675, | | | | | | | | |
| 3.21% (Liquidity Facility Merrill Lynch & | | | | | | | | |
| Co., Inc.) (b)(d) | | | | 11,895 | | | | 11,895 |
| Nevada Gen. Oblig. Participating VRDN: | | | | | | | | |
| Series PT 2762, 3.21% (Liquidity | | | | | | | | |
| Facility Merrill Lynch & Co., | | | | | | | | |
| Inc.) (b)(d) | | | | 7,800 | | | | 7,800 |
| Series SGB 31, 3.21% (Liquidity | | | | | | | | |
| Facility Societe Generale) (b)(d) | | | | 7,600 | | | | 7,600 |
| Washoe County School District Gen. | | | | | | | | |
| Oblig. Participating VRDN Series | | | | | | | | |
| Putters 759, 3.21% (Liquidity Facility | | | | | | | | |
| JPMorgan Chase & Co.) (b)(d) | | | | 6,470 | | | | 6,470 |
| | | | | | | | | 80,985 |
| |
| New Hampshire 0.3% | | | | | | | | |
| New Hampshire Bus. Fin. Auth. Poll. | | | | | | | | |
| Cont. Rev. Participating VRDN Series | | | | | | | | |
| PT 1810, 3.21% (Liquidity Facility | | | | | | | | |
| Merrill Lynch & Co., Inc.) (b)(d) | | | | 5,240 | | | | 5,240 |
| | | Principal | | Value (Note 1) |
| | | Amount (000s) | | (000s) |
| New Hampshire Health & Ed. Facilities | | | | | | | | |
| Auth. Rev. (Riverwoods at Exeter Proj.) | | | | | | | | |
| 3.22%, LOC Fleet Nat’l. Bank, | | | | | | | | |
| VRDN (b) | | | | $ 3,095 | | | | $ 3,095 |
| New Hampshire Higher Edl. & Health | | | | | | | | |
| Facilities Auth. Rev. Participating VRDN | | | | | | | | |
| Series MS 866, 3.2% (Liquidity Facility | | | | | | | | |
| Morgan Stanley) (b)(d) | | | | 10,700 | | | | 10,700 |
| | | | | | | | | 19,035 |
| |
| New Jersey 1.6% | | | | | | | | |
| New Jersey Econ. Dev. Auth. Rev. | | | | | | | | |
| Participating VRDN Series EGL 04 18 | | | | | | | | |
| Class A, 3.2% (Liquidity Facility | | | | | | | | |
| Citibank NA) (b)(d) | | | | 6,900 | | | | 6,900 |
| New Jersey Edl. Facilities Auth. Rev. | | | | | | | | |
| Participating VRDN: | | | | | | | | |
| Series ROC II R2102, 3.2% (Liquidity | | | | | | | | |
| Facility Citigroup Global Markets | | | | | | | | |
| Hldgs., Inc.) (b)(d) | | | | 4,730 | | | | 4,730 |
| Series ROC II R464, 3.21% (Liquidity | | | | | | | | |
| Facility Citibank NA) (b)(d) | | | | 18,320 | | | | 18,320 |
| New Jersey Tpk. Auth. Tpk. Rev. | | | | | | | | |
| Participating VRDN Series PA 613, | | | | | | | | |
| 3.2% (Liquidity Facility Merrill Lynch & | | | | | | | | |
| Co., Inc.) (b)(d) | | | | 3,165 | | | | 3,165 |
| New Jersey Trans. Trust Fund Auth. | | | | | | | | |
| Participating VRDN: | | | | | | | | |
| Series PA 646, 3.2% (Liquidity Facility | | | | | | | | |
| Merrill Lynch & Co., Inc.) (b)(d) | | | | 5,020 | | | | 5,020 |
| Series PT 2494, 3.2% (Liquidity | | | | | | | | |
| Facility Dexia Cr. Local de | | | | | | | | |
| France) (b)(d) | | | | 15,700 | | | | 15,700 |
| Series PT 3291, 3.2% (Liquidity | | | | | | | | |
| Facility Dexia Cr. Local de | | | | | | | | |
| France) (b)(d) | | | | 26,150 | | | | 26,150 |
| Series Putters 1142, 3.21% (Liquidity | | | | | | | | |
| Facility JPMorgan Chase & | | | | | | | | |
| Co.) (b)(d) | | | | 9,445 | | | | 9,445 |
| Series Putters 1166, 3.21% (Liquidity | | | | | | | | |
| Facility JPMorgan Chase | | | | | | | | |
| Bank) (b)(d) | | | | 18,595 | | | | 18,595 |
| Series ROC 4040, 3.2% (Liquidity | | | | | | | | |
| Facility Citigroup Global Markets | | | | | | | | |
| Hldgs., Inc.) (b)(d) | | | | 7,060 | | | | 7,060 |
| | | | | | | | | 115,085 |
| |
| New Jersey/Pennsylvania – 0.1% | | | | | | | | |
| Delaware River Port Auth. Pennsylvania | | | | | | | | |
| & New Jersey Rev. Participating VRDN | | | | | | | | |
| Series SGA 89, 3.2% (Liquidity Facility | | | | | | | | |
| Societe Generale) (b)(d) | | | | 6,545 | | | | 6,545 |
| New Mexico – 0.1% | | | | | | | | |
| New Mexico Fin. Auth. Rev. Participating | | | | | | | | |
| VRDN Series Solar 06 34, 3.2% | | | | | | | | |
| (Liquidity Facility U.S. Bank NA, | | | | | | | | |
| Minnesota) (b)(d) | | | | 4,000 | | | | 4,000 |
See accompanying notes which are an integral part of the financial statements.
55 Annual Report
| Tax-Exempt Portfolio | | | | | | | | |
| Investments - continued | | | | | | | | |
| |
| |
| |
| Municipal Securities continued | | | | | | |
| |
| | | Principal | | Value (Note 1) |
| | | Amount (000s) | | (000s) |
| New York 7.1% | | | | | | | | |
| Metropolitan Trans. Auth. Dedicated Tax | | | | | | | | |
| Fund Series 2004 D2, 3.16% (AMBAC | | | | | | | | |
| Insured), VRDN (b) | | | | $ 8,400 | | | | $ 8,400 |
| Metropolitan Trans. Auth. Rev. | | | | | | | | |
| Participating VRDN: | | | | | | | | |
| Series EGL 02 6023 Class A, 3.2% | | | | | | | | |
| (Liquidity Facility Citibank NA, | | | | | | | | |
| New York) (b)(d) | | | | 13,035 | | | | 13,035 |
| Series MS 724X, 3.19% (Liquidity | | | | | | | | |
| Facility Morgan Stanley) (b)(d) | | | | 6,245 | | | | 6,245 |
| Series PA 1036, 3.2% (Liquidity Facility | | | | | | | | |
| Merrill Lynch & Co., Inc.) (b)(d) | | | | 4,000 | | | | 4,000 |
| Series ROC II R282, 3.2% (Liquidity | | | | | | | | |
| Facility Citibank NA) (b)(d) | | | | 20,135 | | | | 20,135 |
| New York City Indl. Dev. Agcy. Rev. (One | | | | | | | | |
| Bryant Park LLC Proj.) Series B, 3.2%, | | | | | | | | |
| LOC Bank of America NA, LOC | | | | | | | | |
| Citibank NA, VRDN (b) | | | | 13,200 | | | | 13,200 |
| New York City Muni. Wtr. Fin. Auth. Wtr. | | | | | | | | |
| & Swr. Sys. Rev.: | | | | | | | | |
| Participating VRDN: | | | | | | | | |
| Series EGL 04 27 Class A, 3.2% | | | | | | | | |
| (Liquidity Facility Citibank NA) (b)(d) | | | | 8,485 | | | | 8,485 |
| Series EGL 04 35 Class A, 3.2% | | | | | | | | |
| (Liquidity Facility Citibank NA) (b)(d) | | | | 4,950 | | | | 4,950 |
| Series EGL 7050083 Class A, 3.2% | | | | | | | | |
| (Liquidity Facility Citibank NA) (b)(d) | | | | 8,000 | | | | 8,000 |
| Series Merlots 00 DDD, 3.2% | | | | | | | | |
| (Liquidity Facility Wachovia Bank | | | | | | | | |
| NA) (b)(d) | | | | 18,670 | | | | 18,670 |
| Series MS 1025, 3.19% (Liquidity | | | | | | | | |
| Facility Morgan Stanley) (b)(d) | | | | 22,035 | | | | 22,035 |
| Series MS 1083, 3.19% (Liquidity | | | | | | | | |
| Facility Morgan Stanley) (b)(d) | | | | 5,705 | | | | 5,705 |
| Series ROC II R406, 3.2% (Liquidity | | | | | | | | |
| Facility Citibank NA) (b)(d) | | | | 16,960 | | | | 16,960 |
| Series 2006 AA1, 3.18% (Liquidity | | | | | | | | |
| Facility California Teachers | | | | | | | | |
| Retirement Sys.) (Liquidity Facility | | | | | | | | |
| State Street Bank & Trust Co., | | | | | | | | |
| Boston), VRDN (b) | | | | 53,100 | | | | 53,100 |
| Series 5A, 3.18% 4/13/06 (Liquidity | | | | | | | | |
| Facility Bayerische Landesbank | | | | | | | | |
| Girozentrale) (Liquidity Facility | | | | | | | | |
| WestLB AG), CP | | | | 16,200 | | | | 16,200 |
| Series 6, 3.14% 4/7/06 (Liquidity | | | | | | | | |
| Facility Landesbank Baden Wuert) | | | | | | | | |
| (Liquidity Facility Landesbank | | | | | | | | |
| Hessen Thuringen), CP | | | | 27,500 | | | | 27,500 |
| New York Convention Ctr. Dev. Corp. | | | | | | | | |
| Rev. Participating VRDN Serries EGL | | | | | | | | |
| 7050081 Class A, 3.2% (Liquidity | | | | | | | | |
| Facility Citibank NA) (b)(d) | | | | 10,000 | | | | 10,000 |
| New York State Dorm. Auth. Revs. | | | | | | | | |
| Participating VRDN: | | | | | | | | |
| Series EGL 7053001 Class A, 3.2% | | | | | | | | |
| (Liquidity Facility Citibank NA) (b)(d) | | | | 18,950 | | | | 18,950 |
| | | Principal | | Value (Note 1) |
| | | Amount (000s) | | (000s) |
| Series PA 784R, 3.2% (Liquidity | | | | | | | | |
| Facility Merrill Lynch & Co., | | | | | | | | |
| Inc.) (b)(d) | | | | $ 7,025 | | | | $ 7,025 |
| Series ROC II R6052, 3.2% (Liquidity | | | | | | | | |
| Facility Citibank NA) (b)(d) | | | | 9,140 | | | | 9,140 |
| New York State Thruway Auth. State | | | | | | | | |
| Personal Income Tax Rev. Participating | | | | | | | | |
| VRDN Series Putters 1186, 3.21% | | | | | | | | |
| (Liquidity Facility JPMorgan Chase | | | | | | | | |
| Bank) (b)(d) | | | | 6,260 | | | | 6,260 |
| New York State Urban Dev. Corp. Rev. | | | | | | | | |
| Participating VRDN Series EGL 03 57 | | | | | | | | |
| Class A, 3.2% (Liquidity Facility | | | | | | | | |
| Citibank NA, New York) (b)(d) | | | | 9,880 | | | | 9,880 |
| New York Transitional Fin. Auth. Rev. | | | | | | | | |
| Participating VRDN: | | | | | | | | |
| Series EGL 03 52 Class A, 3.2% | | | | | | | | |
| (Liquidity Facility Citibank NA, | | | | | | | | |
| New York) (b)(d) | | | | 10,000 | | | | 10,000 |
| Series FRRI 02 L21, 3.19% (Liquidity | | | | | | | | |
| Facility Lehman Brothers Hldgs., | | | | | | | | |
| Inc.) (b)(d) | | | | 29,675 | | | | 29,675 |
| Series Merlots 99 G, 3.2% (Liquidity | | | | | | | | |
| Facility Wachovia Bank NA) (b)(d) . | | | | 22,695 | | | | 22,695 |
| Series MS 01 698, 3.19% (Liquidity | | | | | | | | |
| Facility Morgan Stanley) (b)(d) | | | | 20,725 | | | | 20,725 |
| Series PT 1814, 3.2% (Liquidity | | | | | | | | |
| Facility Merrill Lynch & Co., | | | | | | | | |
| Inc.) (b)(d) | | | | 5,285 | | | | 5,285 |
| Series PT 3299, 3.2% (Liquidity | | | | | | | | |
| Facility DEPFA BANK PLC) (b)(d) | | | | 22,815 | | | | 22,815 |
| Series Putters 424, 3.21% (Liquidity | | | | | | | | |
| Facility JPMorgan Chase | | | | | | | | |
| Bank) (b)(d) | | | | 6,470 | | | | 6,470 |
| Series ROC II R465, 3.2% (Liquidity | | | | | | | | |
| Facility Citibank NA) (b)(d) | | | | 12,305 | | | | 12,305 |
| Sales Tax Asset Receivables Corp. | | | | | | | | |
| Participating VRDN Series Putters | | | | | | | | |
| 1133Z, 3.21% (Liquidity Facility | | | | | | | | |
| JPMorgan Chase Bank) (b)(d) | | | | 19,360 | | | | 19,360 |
| Triborough Bridge & Tunnel Auth. Revs.: | | | | | | | | |
| Participating VRDN Series EGL 03 4, | | | | | | | | |
| Class A, 3.2% (Liquidity Facility | | | | | | | | |
| Citibank NA, New York) (b)(d) | | | | 10,700 | | | | 10,700 |
| Series B, 3.17% (Liquidity Facility | | | | | | | | |
| Dexia Cr. Local de France), | | | | | | | | |
| VRDN (b) | | | | 54,300 | | | | 54,300 |
| | | | | | | | | 522,205 |
| |
| North Carolina – 1.1% | | | | | | | | |
| Dare County Ctfs. of Prtn. Participating | | | | | | | | |
| VRDN Series PT 3350, 3.21% (Liquidity | | | | | | | | |
| Facility Merrill Lynch & Co., Inc.) (b)(d) | | | | 3,180 | | | | 3,180 |
| Mecklenburg County Ctfs. of Prtn. 3.19% | | | | | | | | |
| (Liquidity Facility Bank of America NA), | | | | | | | | |
| VRDN (b) | | | | 21,125 | | | | 21,125 |
| North Carolina Cap. Facilities Fin. Agcy. | | | | | | | | |
| Ed. Facilities Rev. (Forsyth Country Day | | | | | | | | |
| School, Inc. Proj.) 3.2%, LOC Branch | | | | | | | | |
| Banking & Trust Co., VRDN (b) | | | | 4,900 | | | | 4,900 |
See accompanying notes which are an integral part of the financial statements.
Annual Report 56
| Municipal Securities continued | | | | | | |
| |
| | | Principal | | Value (Note 1) |
| | | Amount (000s) | | (000s) |
| North Carolina – continued | | | | | | | | |
| North Carolina Ctfs. of Prtn. Participating | | | | | | | | |
| VRDN Series Putters 429, 3.21% | | | | | | | | |
| (Liquidity Facility JPMorgan Chase | | | | | | | | |
| Bank) (b)(d) | | | | $ 6,130 | | | | $ 6,130 |
| North Carolina Eastern Muni. Pwr. Agcy. | | | | | | | | |
| Pwr. Sys. Rev. Participating VRDN: | | | | | | | | |
| Series MS 00 209, 3.2% (Liquidity | | | | | | | | |
| Facility Morgan Stanley) (b)(d) | | | | 6,665 | | | | 6,665 |
| Series MT 99, 3.21% (Liquidity Facility | | | | | | | | |
| BNP Paribas SA) (b)(d) | | | | 4,075 | | | | 4,075 |
| Series PA 693, 3.21% (Liquidity | | | | | | | | |
| Facility Merrill Lynch & Co., | | | | | | | | |
| Inc.) (b)(d) | | | | 6,495 | | | | 6,495 |
| North Carolina Gen. Oblig. Participating | | | | | | | | |
| VRDN Series PT 2207, 3.21% (Liquidity | | | | | | | | |
| Facility Merrill Lynch & Co., Inc.) (b)(d) | | | | 8,520 | | | | 8,520 |
| North Carolina Med. Care Commission | | | | | | | | |
| Health Care Facilities Rev. (Carolina | | | | | | | | |
| Meadows, Inc. Proj.) 3.19%, LOC | | | | | | | | |
| Allied Irish Banks PLC, VRDN (b) | | | | 5,000 | | | | 5,000 |
| North Carolina Muni. Pwr. Agcy. #1 | | | | | | | | |
| Catawba Elec. Rev. Participating | | | | | | | | |
| VRDN: | | | | | | | | |
| Series PT 900, 3.21% (Liquidity | | | | | | | | |
| Facility BNP Paribas SA) (b)(d) | | | | 9,695 | | | | 9,695 |
| Series ROC II R211, 3.21% (Liquidity | | | | | | | | |
| Facility Citibank NA) (b)(d) | | | | 4,330 | | | | 4,330 |
| | | | | | | | | 80,115 |
| |
| North Dakota – 0.2% | | | | | | | | |
| North Dakota Muni. Bond Bank | | | | | | | | |
| Participating VRDN Series PT 1919, | | | | | | | | |
| 3.21% (Liquidity Facility Merrill Lynch & | | | | | | | | |
| Co., Inc.) (b)(d) | | | | 6,520 | | | | 6,520 |
| Ward County Health Care Facility Rev. | | | | | | | | |
| Series 2002 A, 3.23%, LOC U.S. Bank | | | | | | | | |
| NA, Minnesota, VRDN (b) | | | | 7,750 | | | | 7,750 |
| | | | | | | | | 14,270 |
| |
| Ohio – 2.7% | | | | | | | | |
| Butler County Health Facilities Rev. | | | | | | | | |
| (LifeSphere Proj.) 3.17%, LOC U.S. | | | | | | | | |
| Bank NA, Minnesota, VRDN (b) | | | | 11,675 | | | | 11,675 |
| Cincinnati City School District | | | | | | | | |
| Participating VRDN Series EGL 04 34 | | | | | | | | |
| Class A, 3.21% (Liquidity Facility | | | | | | | | |
| Citibank NA) (b)(d) | | | | 6,000 | | | | 6,000 |
| Cleveland Muni. School District BAN | | | | | | | | |
| 3.75% 7/27/06 | | | | 11,000 | | | | 11,016 |
| Columbus City School District | | | | | | | | |
| Participating VRDN Series TOC 04 H, | | | | | | | | |
| 3.21% (Liquidity Facility Goldman | | | | | | | | |
| Sachs Group, Inc.) (b)(d) | | | | 8,300 | | | | 8,300 |
| | | Principal | | Value (Note 1) |
| | | Amount (000s) | | (000s) |
| Cuyahoga County Econ. Dev. Rev. | | | | | | | | |
| (Cleveland Botanical Garden Proj.) 3.2%, | | | | | | | | |
| LOC Allied Irish Banks PLC, VRDN (b) . | | | | $ 10,300 | | | | $ 10,300 |
| Cuyahoga County Health Care Facilities | | | | | | | | |
| Rev. (The A.M. McGregor Home Proj.) | | | | | | | | |
| 3.19%, LOC Key Bank NA, VRDN (b) | | | | 4,425 | | | | 4,425 |
| Cuyahoga County Rev. (Cleveland Clinic | | | | | | | | |
| Health Sys. Obligated Group Prog.): | | | | | | | | |
| Subseries B1, 3.21%, VRDN (b) | | | | 17,500 | | | | 17,500 |
| Subseries B3, 3.21%, VRDN (b) | | | | 17,300 | | | | 17,300 |
| Dayton School District Participating | | | | | | | | |
| VRDN Series SG 173, 3.2% (Liquidity | | | | | | | | |
| Facility Societe Generale) (b)(d) | | | | 12,030 | | | | 12,030 |
| Erie County Health Care Facilities Rev. | | | | | | | | |
| (Commons of Providence Proj.) | | | | | | | | |
| Series 1999 B, 3.32%, LOC JPMorgan | | | | | | | | |
| Chase Bank, VRDN (b) | | | | 3,200 | | | | 3,200 |
| Lake County Hosp. Facilities Rev. (Lake | | | | | | | | |
| Hosp. Sys., Inc. Proj.) Series 1996, | | | | | | | | |
| 3.25%, LOC JPMorgan Chase Bank, | | | | | | | | |
| VRDN (b) | | | | 10,170 | | | | 10,170 |
| Ohio Bldg. Auth. Participating VRDN | | | | | | | | |
| Series ROC II R348, 3.21% (Liquidity | | | | | | | | |
| Facility Citibank NA) (b)(d) | | | | 13,435 | | | | 13,435 |
| Ohio Gen. Oblig. Participating VRDN: | | | | | | | | |
| Series PT 1591, 3.2% (Liquidity | | | | | | | | |
| Facility Merrill Lynch & Co., | | | | | | | | |
| Inc.) (b)(d) | | | | 10,365 | | | | 10,365 |
| Series Putters 389, 3.21% (Liquidity | | | | | | | | |
| Facility JPMorgan Chase | | | | | | | | |
| Bank) (b)(d) | | | | 7,395 | | | | 7,395 |
| Ohio Higher Edl. Facility Commission | | | | | | | | |
| Rev. (Pooled Fing. Prog.): | | | | | | | | |
| Series 1997, 3.28%, LOC Fifth Third | | | | | | | | |
| Bank, Cincinnati, VRDN (b) | | | | 4,640 | | | | 4,640 |
| Series 1999, 3.28%, LOC Fifth Third | | | | | | | | |
| Bank, Cincinnati, VRDN (b) | | | | 4,875 | | | | 4,875 |
| Series 2004 B, 3.17%, LOC Fifth Third | | | | | | | | |
| Bank, Cincinnati, VRDN (b) | | | | 6,600 | | | | 6,600 |
| Richland County Health Care Facilities | | | | | | | | |
| Rev. (Wesleyan Sr. Living Proj.) | | | | | | | | |
| Series 2004 A, 3.19%, LOC JPMorgan | | | | | | | | |
| Chase Bank, VRDN (b) | | | | 19,650 | | | | 19,650 |
| Univ. of Toledo Gen. Receipts 3.18% | | | | | | | | |
| (FGIC Insured), VRDN (b) | | | | 7,500 | | | | 7,500 |
| Warren County Health Care Facilities | | | | | | | | |
| Rev. (Otterbein Homes Proj.) | | | | | | | | |
| Series 1998 B, 3.22%, LOC Fifth Third | | | | | | | | |
| Bank, Cincinnati, VRDN (b) | | | | 10,705 | | | | 10,705 |
| | | | | | | | | 197,081 |
| |
| Oklahoma – 0.8% | | | | | | | | |
| Oklahoma Cap. Impt. Auth. Facilities | | | | | | | | |
| Participating VRDN Series PT 3286, | | | | | | | | |
| 3.21% (Liquidity Facility Merrill Lynch & | | | | | | | | |
| Co., Inc.) (b)(d) | | | | 6,585 | | | | 6,585 |
| Oklahoma Dev. Fin. Auth. Rev. | | | | | | | | |
| (Continuing Care Cmnty. Proj.) | | | | | | | | |
| Series 2002 C, 3.23%, LOC KBC Bank | | | | | | | | |
| NV, VRDN (b) | | | | 2,200 | | | | 2,200 |
See accompanying notes which are an integral part of the financial statements.
57 Annual Report
| Tax-Exempt Portfolio | | | | | | | | |
| Investments - continued | | | | | | | | |
| |
| |
| |
| Municipal Securities continued | | | | | | |
| |
| | | Principal | | Value (Note 1) |
| | | Amount (000s) | | (000s) |
| Oklahoma – continued | | | | | | | | |
| Oklahoma Industries Auth. Rev. | | | | | | | | |
| Participating VRDN Series Putters | | | | | | | | |
| 455Z, 3.21% (Liquidity Facility | | | | | | | | |
| JPMorgan Chase Bank) (b)(d) | | | | $ 4,330 | | | | $ 4,330 |
| Payne County Econ. Dev. Auth. Student | | | | | | | | |
| Hsg. Rev. (OSUF Phase III Proj.) 3.19% | | | | | | | | |
| (AMBAC Insured), VRDN (b) | | | | 35,400 | | | | 35,400 |
| Tulsa County Indl. Auth. Health Care Rev. | | | | | | | | |
| Participating VRDN Series LB 06 P7U, | | | | | | | | |
| 3.26% (Liquidity Facility Lehman | | | | | | | | |
| Brothers Hldgs., Inc.) (b)(d) | | | | 8,060 | | | | 8,060 |
| | | | | | | | | 56,575 |
| |
| Oregon – 0.3% | | | | | | | | |
| Oregon Dept. of Trans. Hwy. User Tax | | | | | | | | |
| Rev. Participating VRDN Series Putters | | | | | | | | |
| 469, 3.21% (Liquidity Facility | | | | | | | | |
| JPMorgan Chase Bank) (b)(d) | | | | 9,695 | | | | 9,695 |
| Port Morrow Poll. Cont. Rev. Participating | | | | | | | | |
| VRDN Series FRRI 03 F4J, 3.33% | | | | | | | | |
| (Lehman Brothers Hldgs., Inc. | | | | | | | | |
| Guaranteed) (Liquidity Facility Lehman | | | | | | | | |
| Brothers Hldgs., Inc.) (b)(d) | | | | 10,000 | | | | 10,000 |
| Tri City Metropolitan Trans. District Rev. | | | | | | | | |
| Participating VRDN Series Putters 787, | | | | | | | | |
| 3.21% (Liquidity Facility JPMorgan | | | | | | | | |
| Chase Bank) (b)(d) | | | | 4,235 | | | | 4,235 |
| | | | | | | | | 23,930 |
| |
| Pennsylvania – 3.9% | | | | | | | | |
| Allegheny County Hosp. Dev. Auth. Rev.: | | | | | | | | |
| Bonds Series PT 762, 2.85%, | | | | | | | | |
| tender 6/15/06 (Liquidity | | | | | | | | |
| Facility Landesbank | | | | | | | | |
| Hessen Thuringen) (b)(d)(e) | | | | 10,560 | | | | 10,560 |
| Participating VRDN Series Putters | | | | | | | | |
| 1281, 3.21% (Liquidity Facility | | | | | | | | |
| JPMorgan Chase & Co.) (b)(d) | | | | 8,900 | | | | 8,900 |
| Allegheny County Indl. Dev. Auth. Rev. | | | | | | | | |
| (UPMC Children’s Hosp. Proj.) Series | | | | | | | | |
| 2004 A, 3.32%, VRDN (b) | | | | 12,400 | | | | 12,400 |
| Beaver County Indl. Dev. Auth. Poll. Cont. | | | | | | | | |
| Rev. Participating VRDN Series EGL 95 | | | | | | | | |
| 3503, 3.21% (Liquidity Facility Citibank | | | | | | |
| NA, New York) (b)(d) | | | | 13,100 | | | | 13,100 |
| Chester County Health & Ed. Facilities | | | | | | | | |
| Auth. Retirement Cmnty. Rev. | | | | | | | | |
| (Kendal Crosslands Communities Proj.) | | | | | | | | |
| Series 2003, 3.19%, LOC Allied Irish | | | | | | | | |
| Banks PLC, VRDN (b) | | | | 2,845 | | | | 2,845 |
| Delaware County Auth. Hosp. Rev. | | | | | | | | |
| (Crozer Chester Med. Ctr. Proj.) Series | | | | | | | | |
| 1996, 3.26%, LOC KBC Bank NV, | | | | | | | | |
| VRDN (b) | | | | 4,255 | | | | 4,255 |
| Easton Area School District Series 2006, | | | | | | | | |
| 3.19% (FSA Insured), VRDN (b) | | | | 11,000 | | | | 11,000 |
| Harrisburg Auth. Wtr. Rev. Series 2002 | | | | | | | | |
| B, 3.22% (FSA Insured), VRDN (b) | | | | 13,535 | | | | 13,535 |
| | | Principal | | Value (Note 1) |
| | | Amount (000s) | | (000s) |
| Lancaster County 3.18% (FSA Insured), | | | | | | | | |
| VRDN (b) | | | | $ 10,000 | | | | $ 10,000 |
| Lancaster Higher Ed. Auth. College Rev. | | | | | | | | |
| (Franklin & Marshall College Proj.) | | | | | | | | |
| Series 1997, 3.27%, VRDN (b) | | | | 14,330 | | | | 14,330 |
| Lancaster Indl. Dev. Auth. Rev. (United | | | | | | | | |
| Zion Retirement Cmnty. Proj.) 3.21%, | | | | | | | | |
| LOC Citizens Bank of Pennsylvania, | | | | | | | | |
| VRDN (b) | | | | 5,545 | | | | 5,545 |
| Luzerne County Indl. Dev. Auth. Rev. | | | | | | | | |
| (United Methodist Homes Proj.) 3.23%, | | | | | | | | |
| LOC Bank of New York, New York, | | | | | | | | |
| VRDN (b) | | | | 5,085 | | | | 5,085 |
| Manheim Central School District Series | | | | | | | | |
| 2004, 3.18% (FSA Insured), VRDN (b) | | | | 10,000 | | | | 10,000 |
| Montgomery Higher Ed. & Health Auth. | | | | | | | | |
| Hosp. Rev. Participating VRDN Series | | | | | | | | |
| MSTC 98 31 Class A, 3.25% (Liquidity | | | | | | | | |
| Facility Bear Stearns Companies, | | | | | | | | |
| Inc.) (b)(d) | | | | 10,000 | | | | 10,000 |
| Pennsylvania Econ. Dev. Fing. Auth. Rev. | | | | | | | | |
| (Dr. Gertrude Barber Ctr. Proj.) 3.21%, | | | | | | | | |
| LOC PNC Bank NA, Pittsburgh, | | | | | | | | |
| VRDN (b) | | | | 5,830 | | | | 5,830 |
| Pennsylvania Gen. Oblig. Participating | | | | | | | | |
| VRDN: | | | | | | | | |
| Series IXIS 05 8 Class A, 3.2% | | | | | | | | |
| (Liquidity Facility CDC Fin. CDC | | | | | | | | |
| IXIS) (b)(d) | | | | 34,780 | | | | 34,780 |
| Series MSTC 00 110, 3.2% (Liquidity | | | | | | | | |
| Facility Bear Stearns Companies, | | | | | | | | |
| Inc.) (b)(d) | | | | 1,000 | | | | 1,000 |
| Pennsylvania Higher Edl. Facilities Auth. | | | | | | | | |
| Hosp. Rev. Participating VRDN Series | | | | | | | | |
| MT 42, 3.23% (Liquidity Facility Lloyds | | | | | | | | |
| TSB Bank PLC) (b)(d) | | | | 10,455 | | | | 10,455 |
| Pennsylvania Higher Edl. Facilities Auth. | | | | | | | | |
| Rev.: | | | | | | | | |
| (Honeysuckle Student Hldgs., Inc. | | | | | | | | |
| Student Hsg. Proj.) Series A, 3.19%, | | | | | | | | |
| LOC Allied Irish Banks PLC, | | | | | | | | |
| VRDN (b) | | | | 8,000 | | | | 8,000 |
| (Marywood Univ. Proj.) Series A, | | | | | | | | |
| 3.21%, LOC PNC Bank NA, | | | | | | | | |
| Pittsburgh, VRDN (b) | | | | 7,460 | | | | 7,460 |
| (Student Assoc., Inc. Proj.) Series A, | | | | | | | | |
| 3.17%, LOC Citizens Bank of | | | | | | | | |
| Pennsylvania, VRDN (b) | | | | 19,100 | | | | 19,100 |
| Pennsylvania Pub. School Bldg. Auth. | | | | | | | | |
| School Rev. Participating VRDN: | | | | | | | | |
| Series AAB 03 24, 3.21% (Liquidity | | | | | | | | |
| Facility ABN AMRO Bank NV) (b)(d) | | | | 13,790 | | | | 13,790 |
| Series Stars 124, 3.2% (Liquidity | | | | | | | | |
| Facility BNP Paribas SA) (b)(d) | | | | 8,990 | | | | 8,990 |
| Philadelphia Gas Works Rev. | | | | | | | | |
| Participating VRDN Series Putters 384, | | | | | | | | |
| 3.21% (Liquidity Facility JPMorgan | | | | | | | | |
| Chase Bank) (b)(d) | | | | 3,210 | | | | 3,210 |
| Philadelphia Gen. Oblig. TRAN Series A, | | | | | | | | |
| 4% 6/30/06 | | | | 17,940 | | | | 17,969 |
See accompanying notes which are an integral part of the financial statements.
Annual Report 58
| Municipal Securities continued | | | | | | |
| |
| | | Principal | | Value (Note 1) |
| | | Amount (000s) | | (000s) |
| Pennsylvania – continued | | | | | | | | |
| Philadelphia School District Participating | | | | | | | | |
| VRDN: | | | | | | | | |
| Series Putters 870, 3.21% (Liquidity | | | | | | | | |
| Facility JPMorgan Chase & | | | | | | | | |
| Co.) (b)(d) | | | | $ 5,270 | | | | $ 5,270 |
| Series Stars 04 88, 3.2% (Liquidity | | | | | | | | |
| Facility BNP Paribas SA) (b)(d) | | | | 5,410 | | | | 5,410 |
| Philadelphia Wtr. & Wastewtr. Rev. | | | | | | | | |
| Participating VRDN: | | | | | | | | |
| Series Merlots 05 B4, 3.21% (Liquidity | | | | | | | | |
| Facility Wachovia Bank NA) (b)(d) . | | | | 10,070 | | | | 10,070 |
| Series SG 158, 3.2% (Liquidity Facility | | | | | | | | |
| Societe Generale) (b)(d) | | | | 9,195 | | | | 9,195 |
| | | | | | | | | 292,084 |
| |
| Rhode Island 0.1% | | | | | | | | |
| Rhode Island & Providence Plantations | | | | | | | | |
| Participating VRDN Series MS 01 568, | | | | | | | | |
| 3.2% (Liquidity Facility Morgan | | | | | | | | |
| Stanley) (b)(d) | | | | 9,660 | | | | 9,660 |
| South Carolina – 1.5% | | | | | | | | |
| Charleston Edl. Excellence Fing. Corp. | | | | | | | | |
| Rev. Participating VRDN Series ROC II | | | | | | | | |
| R515, 3.21% (Liquidity Facility Citibank | | | | | | | | |
| NA) (b)(d) | | | | 2,625 | | | | 2,625 |
| Greenville County School District | | | | | | | | |
| Installment Purp. Rev. Participating | | | | | | | | |
| VRDN Series Stars 131, 3.21% | | | | | | | | |
| (Liquidity Facility BNP Paribas | | | | | | | | |
| SA) (b)(d) | | | | 7,575 | | | | 7,575 |
| Richland County School District #1 | | | | | | | | |
| Participating VRDN Series AAB 03 29, | | | | | | | | |
| 3.21% (Liquidity Facility ABN AMRO | | | | | | | | |
| Bank NV) (b)(d) | | | | 10,000 | | | | 10,000 |
| South Carolina Edl. Facilities Auth. for | | | | | | | | |
| Private Nonprofit Institutions of Higher | | | | | | | | |
| Learning Edl. Facilities Rev. (Caflin | | | | | | | | |
| Univ. Proj.) 3.18%, LOC Bank of | | | | | | | | |
| America NA, VRDN (b) | | | | 5,000 | | | | 5,000 |
| South Carolina Gen. Oblig. School | | | | | | | | |
| Facilities Participating VRDN Series MS | | | | | | | | |
| 1078, 3.2% (Liquidity Facility Morgan | | | | | | | | |
| Stanley) (b)(d) | | | | 4,398 | | | | 4,398 |
| South Carolina Pub. Svc. Auth. Rev.: | | | | | | | | |
| Participating VRDN: | | | | | | | | |
| Series EGL 00 4001 Class A, 3.21% | | | | | | | | |
| (Liquidity Facility Citibank NA, | | | | | | | | |
| New York) (b)(d) | | | | 2,000 | | | | 2,000 |
| Series EGL 03 44 Class A, 3.21% | | | | | | | | |
| (Liquidity Facility Citibank NA, | | | | | | | | |
| New York) (b)(d) | | | | 4,200 | | | | 4,200 |
| Series EGL 06 19 Class A, 3.21% | | | | | | | | |
| (Liquidity Facility Citibank | | | | | | | | |
| NA) (b)(d) | | | | 19,110 | | | | 19,110 |
| 3.15% 4/13/06, CP | | | | 8,591 | | | | 8,591 |
| 3.3% 4/5/06, CP | | | | 12,856 | | | | 12,856 |
| | | Principal | | Value (Note 1) |
| | | Amount (000s) | | (000s) |
| South Carolina Trans. Infrastructure Bank | | | | | | | | |
| Rev. Participating VRDN: | | | | | | | | |
| Series IXIS 05 20, 3.21% (Liquidity | | | | | | | | |
| Facility CDC Fin. CDC IXIS) (b)(d) | | | | $ 6,645 | | | | $ 6,645 |
| Series MS 728, 3.2% (Liquidity Facility | | | | | | | | |
| Morgan Stanley) (b)(d) | | | | 12,500 | | | | 12,500 |
| Series PT 3184, 3.21% (Liquidity | | | | | | | | |
| Facility Merrill Lynch & Co., | | | | | | | | |
| Inc.) (b)(d) | | | | 5,365 | | | | 5,365 |
| Series SGA 116, 3.2% (Liquidity | | | | | | | | |
| Facility Societe Generale) (b)(d) | | | | 8,365 | | | | 8,365 |
| | | | | | | | | 109,230 |
| |
| Tennessee 2.8% | | | | | | | | |
| Bristol Health & Edl. Facilities Board Rev. | | | | | | | | |
| Participating VRDN Series LB 03 L42J, | | | | | | | | |
| 3.23% (Liquidity Facility Lehman | | | | | | | | |
| Brothers Hldgs., Inc.) (b)(d) | | | | 37,615 | | | | 37,615 |
| Clarksville Pub. Bldg. Auth. Rev. | | | | | | | | |
| (Tennessee Muni. Bond Fund Proj.): | | | | | | | | |
| 3.17%, LOC Bank of America NA, | | | | | | | | |
| VRDN (b) | | | | 8,000 | | | | 8,000 |
| 3.17%, LOC Bank of America NA, | | | | | | | | |
| VRDN (b) | | | | 5,300 | | | | 5,300 |
| Greeneville Health & Edl. Facilities Board | | | | | | | | |
| (Laughlin Memorial Hosp. Proj.) 3.18%, | | | | | | | | |
| LOC SunTrust Banks, Inc., VRDN (b) | | | | 29,400 | | | | 29,400 |
| Knox County Health Edl. & Hsg. Facilities | | | | | | | | |
| Board Hosp. Facilities Rev. Participating | | | | | | | | |
| VRDN Series PA 750, 3.21% (Liquidity | | | | | | | | |
| Facility Merrill Lynch & Co., Inc.) (b)(d) | | | | 8,935 | | | | 8,935 |
| Knoxville Waste Wtr. Sys. Rev. | | | | | | | | |
| Participating VRDN Series PT 3296, | | | | | | | | |
| 3.21% (Liquidity Facility Merrill Lynch & | | | | | | | | |
| Co., Inc.) (b)(d) | | | | 10,840 | | | | 10,840 |
| Memphis Gen. Oblig.: | | | | | | | | |
| Participating VRDN Series IXIS 05 7, | | | | | | | | |
| 3.21% (Liquidity Facility CDC | | | | | | | | |
| Fin. CDC IXIS) (b)(d) | | | | 5,730 | | | | 5,730 |
| 3.19% 4/6/06 (Liquidity Facility | | | | | | | | |
| WestLB AG), CP | | | | 16,000 | | | | 16,000 |
| 3.55% 8/4/06 (Liquidity Facility | | | | | | | | |
| WestLB AG), CP | | | | 9,000 | | | | 9,000 |
| Metropolitan Govt. Nashville & Davidson | | | | | | | | |
| County Indl. Dev. Board Rev. (Nashville | | | | | | | | |
| Symphony Hall Proj.) 3.18%, LOC | | | | | | | | |
| Bank of America NA, VRDN (b) | | | | 13,000 | | | | 13,000 |
| Montgomery County Pub. Bldg. Auth. | | | | | | | | |
| Pooled Fing. Rev. (Tennessee County Ln. | | | | | | | | |
| Pool Prog.): | | | | | | | | |
| Series 1999, 3.18%, LOC Bank of | | | | | | | | |
| America NA, VRDN (b) | | | | 36,060 | | | | 36,060 |
| 3.17%, LOC Bank of America NA, | | | | | | | | |
| VRDN (b) | | | | 7,425 | | | | 7,425 |
See accompanying notes which are an integral part of the financial statements.
59 Annual Report
| Tax-Exempt Portfolio | | | | | | | | |
| Investments - continued | | | | | | | | |
| |
| |
| |
| Municipal Securities continued | | | | | | |
| |
| | | Principal | | Value (Note 1) |
| | | Amount (000s) | | (000s) |
| Tennessee – continued | | | | | | | | |
| Nashville and Davidson County | | | | | | | | |
| Metropolitan Govt. Gen. Oblig. | | | | | | | | |
| Participating VRDN Series Clipper 06 | | | | | | | | |
| 4, 3.21% (Liquidity Facility State Street | | | | | | | | |
| Bank & Trust Co., Boston) (b)(d) | | | | $ 5,000 | | | | $ 5,000 |
| Sevier County Pub. Bldg. Auth. Rev. | | | | | | | | |
| Series VI F2, 3.19% (XL Cap. | | | | | | | | |
| Assurance, Inc. Insured), VRDN (b) | | | | 6,500 | | | | 6,500 |
| Shelby County Gen. Oblig. Participating | | | | | | | | |
| VRDN Series EGL 00 4201, 3.21% | | | | | | | | |
| (Liquidity Facility Citibank NA, | | | | | | | | |
| New York) (b)(d) | | | | 8,000 | | | | 8,000 |
| | | | | | | | | 206,805 |
| |
| Texas 17.8% | | | | | | | | |
| Alvin Independent School District | | | | | | | | |
| Participating VRDN Series PT 3110, | | | | | | | | |
| 3.21% (Liquidity Facility Merrill Lynch & | | | | | | | | |
| Co., Inc.) (b)(d) | | | | 6,180 | | | | 6,180 |
| Arlington Spl. Oblig. Participating VRDN | | | | | | | | |
| Series LB 05 L19, 3.23% (Liquidity | | | | | | | | |
| Facility Lehman Brothers Hldgs., | | | | | | | | |
| Inc.) (b)(d) | | | | 10,975 | | | | 10,975 |
| Austin Elec. Util. Sys. Rev. Participating | | | | | | | | |
| VRDN: | | | | | | | | |
| Series EGL 01 4302 Class A, 3.21% | | | | | | | | |
| (Liquidity Facility Citibank NA, | | | | | | | | |
| New York) (b)(d) | | | | 10,000 | | | | 10,000 |
| Series PT 1699, 3.21% (Liquidity | | | | | | | | |
| Facility Merrill Lynch & Co., | | | | | | | | |
| Inc.) (b)(d) | | | | 2,750 | | | | 2,750 |
| Series SGA 131, 3.23% (Liquidity | | | | | | | | |
| Facility Societe Generale) (b)(d) | | | | 8,605 | | | | 8,605 |
| 3.21% (Liquidity Facility Merrill Lynch | | | | | | | | |
| & Co., Inc.) (b)(d) | | | | 8,695 | | | | 8,695 |
| Austin Gen. Oblig. Participating VRDN | | | | | | | | |
| Series EGL 00 4305, 3.21% (Liquidity | | | | | | | | |
| Facility Citibank NA, New York) (b)(d) | | | | 5,955 | | | | 5,955 |
| Austin Util. Sys. Rev.: | | | | | | | | |
| Participating VRDN Series BA 98 V, | | | | | | | | |
| 3.25% (Liquidity Facility Bank of | | | | | | | | |
| America NA) (b)(d) | | | | 6,575 | | | | 6,575 |
| Series A: | | | | | | | | |
| 3.2% 4/4/06, LOC JPMorgan | | | | | | | | |
| Chase Bank, LOC State Street | | | | | | | | |
| Bank & Trust Co., Boston, CP | | | | 13,600 | | | | 13,600 |
| 3.3% 4/7/06, LOC JPMorgan | | | | | | | | |
| Chase Bank, LOC State Street | | | | | | | | |
| Bank & Trust Co., Boston, CP | | | | 4,158 | | | | 4,158 |
| 3.51% 8/10/06, LOC JPMorgan | | | | | | | | |
| Chase Bank, LOC State Street | | | | | | | | |
| Bank & Trust Co., Boston, CP | | | | 38,347 | | | | 38,347 |
| Austin Wtr. & Wastewtr. Sys. Rev. | | | | | | | | |
| Participating VRDN: | | | | | | | | |
| Series EGL 00 4303, 3.21% | | | | | | | | |
| (Liquidity Facility Citibank NA, | | | | | | | | |
| New York) (b)(d) | | | | 5,000 | | | | 5,000 |
| | | Principal | | Value (Note 1) |
| | | Amount (000s) | | (000s) |
| Series Merlots 01 A63, 3.21% | | | | | | | | |
| (Liquidity Facility Wachovia Bank | | | | | | | | |
| NA) (b)(d) | | | | $ 6,415 | | | | $ 6,415 |
| Beaumont Wtrwks. & Swr. Sys. | | | | | | | | |
| Participating VRDN Series Putters 859, | | | | | | | | |
| 3.21% (Liquidity Facility JPMorgan | | | | | | | | |
| Chase Bank) (b)(d) | | | | 5,510 | | | | 5,510 |
| Bexar County Health Facilities Dev. Corp. | | | | | | | | |
| Rev. (Warm Springs Rehabilitation | | | | | | | | |
| Proj.) Series 1997, 3.28%, LOC | | | | | | | | |
| JPMorgan Chase Bank, VRDN (b) | | | | 4,000 | | | | 4,000 |
| Canadian River Muni. Wtr. Auth.: | | | | | | | | |
| Bonds Series ROC II R 2204, 3.45%, | | | | | | | | |
| tender 8/10/06 (Liquidity Facility | | | | | | | | |
| Citigroup Global Markets Hldgs., | | | | | | | | |
| Inc.) (b)(d)(e) | | | | 8,595 | | | | 8,595 |
| Participating VRDN: | | | | | | | | |
| Series PT 2792, 3.21% (Liquidity | | | | | | | | |
| Facility Merrill Lynch & Co., | | | | | | | | |
| Inc.) (b)(d) | | | | 5,835 | | | | 5,835 |
| Series PT 3276, 3.21% (Liquidity | | | | | | | | |
| Facility Merrill Lynch & Co., | | | | | | | | |
| Inc.) (b)(d) | | | | 5,290 | | | | 5,290 |
| Canutillo Independent School District | | | | | | | | |
| Participating VRDN Series PT 1936, | | | | | | | | |
| 3.21% (Liquidity Facility Merrill Lynch & | | | | | | | | |
| Co., Inc.) (b)(d) | | | | 4,820 | | | | 4,820 |
| Comal Independent School District | | | | | | | | |
| Participating VRDN Series PT 1676, | | | | | | | | |
| 3.21% (Liquidity Facility Merrill Lynch & | | | | | | | | |
| Co., Inc.) (b)(d) | | | | 5,940 | | | | 5,940 |
| Corpus Christi Gen. Oblig. Participating | | | | | | | | |
| VRDN Series Putters 968, 3.21% | | | | | | | | |
| (Liquidity Facility JPMorgan Chase | | | | | | | | |
| Bank) (b)(d) | | | | 4,405 | | | | 4,405 |
| Crowley Independent School District | | | | | | | | |
| Participating VRDN Series MS 1171, | | | | | | | | |
| 3.2% (Liquidity Facility Morgan | | | | | | | | |
| Stanley) (b)(d) | | | | 5,105 | | | | 5,105 |
| Dallas Area Rapid Transit Sales Tax Rev.: | | | | | | | | |
| Participating VRDN: | | | | | | | | |
| Series EGL 01 4310 Class A, 3.21% | | | | | | | | |
| (Liquidity Facility Citibank NA, | | | | | | | | |
| New York) (b)(d) | | | | 6,290 | | | | 6,290 |
| Series ROC II R3014, 3.21% | | | | | | | | |
| (Liquidity Facility Citigroup Global | | | | | | | | |
| Markets Hldgs., Inc.) (b)(d) | | | | 5,165 | | | | 5,165 |
| Series 2001, 3.28% 4/5/06 (Liquidity | | | | | | | | |
| Facility Bayerische Landesbank | | | | | | | | |
| Girozentrale) (Liquidity Facility | | | | | | | | |
| WestLB AG), CP | | | | 18,000 | | | | 18,000 |
| Dallas County Util. & Reclamation District | | | | | | | | |
| Rev. Participating VRDN Series PA | | | | | | | | |
| 1136R, 3.21% (Liquidity Facility Merrill | | | | | | | | |
| Lynch & Co., Inc.) (b)(d) | | | | 6,570 | | | | 6,570 |
| Dallas Independent School District | | | | | | | | |
| Participating VRDN Series EGL | | | | | | | | |
| 7050034, Class A, 3.21% (Liquidity | | | | | | | | |
| Facility Citibank NA) (b)(d) | | | | 5,300 | | | | 5,300 |
See accompanying notes which are an integral part of the financial statements.
Annual Report 60
| Municipal Securities continued | | | | | | |
| |
| | | Principal | | Value (Note 1) |
| | | Amount (000s) | | (000s) |
| Texas continued | | | | | | | | |
| Denton County Gen. Oblig. Participating | | | | | | | | |
| VRDN Series SGA 117, 3.2% (Liquidity | | | | | | | | |
| Facility Societe Generale) (b)(d) | | | | $ 8,930 | | | | $ 8,930 |
| Denton Util. Sys. Rev. Participating | | | | | | | | |
| VRDN: | | | | | | | | |
| Series MS 00 428, 3.2% (Liquidity | | | | | | | | |
| Facility Morgan Stanley) (b)(d) | | | | 9,835 | | | | 9,835 |
| Series MS 01 635, 3.2% (Liquidity | | | | | | | | |
| Facility Morgan Stanley) (b)(d) | | | | 15,210 | | | | 15,210 |
| Dickinson Independent School District | | | | | | | | |
| Participating VRDN Series DB 152, | | | | | | | | |
| 3.21% (Liquidity Facility Deutsche Bank | | | | | | | | |
| AG) (b)(d) | | | | 6,270 | | | | 6,270 |
| Duncanville Independent School District | | | | | | | | |
| Participating VRDN Series PT 3209, | | | | | | | | |
| 3.21% (Liquidity Facility Merrill Lynch & | | | | | | | | |
| Co., Inc.) (b)(d) | | | | 4,345 | | | | 4,345 |
| Eclipse Fdg. Trust Participating VRDN: | | | | | | | | |
| Series Solar 06 20, 3.2% (Liquidity | | | | | | | | |
| Facility U.S. Bank NA, | | | | | | | | |
| Minnesota) (b)(d) | | | | 14,540 | | | | 14,540 |
| Series Solar 06 32, 3.2% (Liquidity | | | | | | | | |
| Facility U.S. Bank NA, | | | | | | | | |
| Minnesota) (b)(d) | | | | 7,000 | | | | 7,000 |
| Series Solar 06 36, 3.2% (Liquidity | | | | | | | | |
| Facility U.S. Bank NA, | | | | | | | | |
| Minnesota) (b)(d) | | | | 6,695 | | | | 6,695 |
| Edinburg Consolidated Independent | | | | | | | | |
| School District Participating VRDN | | | | | | | | |
| Series SGA 106, 3.23% (Liquidity | | | | | | | | |
| Facility Societe Generale) (b)(d) | | | | 2,485 | | | | 2,485 |
| El Paso Gen. Oblig. 3.25% 4/3/06, CP | | | | 44,700 | | | | 44,700 |
| Elgin Independent School District | | | | | | | | |
| Participating VRDN Series DB 166, | | | | | | | | |
| 3.21% (Liquidity Facility Deutsche Bank | | | | | | | | |
| AG) (b)(d) | | | | 5,675 | | | | 5,675 |
| Frisco Gen. Oblig. Participating VRDN: | | | | | | | | |
| Series MSTC 01 170, 3.23% (Liquidity | | | | | | | | |
| Facility Bear Stearns Companies, | | | | | | | | |
| Inc.) (b)(d) | | | | 13,105 | | | | 13,105 |
| Series PT 1905, 3.21% (Liquidity | | | | | | | | |
| Facility Merrill Lynch & Co., | | | | | | | | |
| Inc.) (b)(d) | | | | 4,060 | | | | 4,060 |
| Frisco Independent School District | | | | | | | | |
| Participating VRDN Series Putters 476, | | | | | | | | |
| 3.21% (Liquidity Facility JPMorgan | | | | | | | | |
| Chase Bank) (b)(d) | | | | 3,155 | | | | 3,155 |
| Harlandale Independent School District | | | | | | | | |
| Participating VRDN Series SGA 100, | | | | | | | | |
| 3.23% (Liquidity Facility Societe | | | | | | | | |
| Generale) (b)(d) | | | | 7,480 | | | | 7,480 |
| Harris County Gen. Oblig.: | | | | | | | | |
| Participating VRDN: | | | | | | | | |
| Series EGL 02 6012 Class A, 3.21% | | | | | | | | |
| (Liquidity Facility Citibank NA, | | | | | | | | |
| New York) (b)(d) | | | | 4,000 | | | | 4,000 |
| | | Principal | | Value (Note 1) |
| | | Amount (000s) | | (000s) |
| Series PA 02 1095, 3.21% (Liquidity | | | | | | | | |
| Facility Merrill Lynch & Co., | | | | | | | | |
| Inc.) (b)(d) | | | | $ 11,185 | | | | $ 11,185 |
| Series Putters 545, 3.21% (Liquidity | | | | | | | | |
| Facility JPMorgan Chase | | | | | | | | |
| Bank) (b)(d) | | | | 4,680 | | | | 4,680 |
| Series Putters 646, 3.21% (Liquidity | | | | | | | | |
| Facility JPMorgan Chase | | | | | | | | |
| Bank) (b)(d) | | | | 4,210 | | | | 4,210 |
| Series D1, 3.15% 4/12/06, CP | | | | 1,281 | | | | 1,281 |
| Harris County Health Facilities Dev. Corp. | | | | | | | | |
| Hosp. Rev. Participating VRDN Series | | | | | | | | |
| LB 05 L15, 3.23% (Liquidity Facility | | | | | | | | |
| Lehman Brothers Hldgs., Inc.) (b)(d) | | | | 6,445 | | | | 6,445 |
| Harris County Health Facilities Dev. Corp. | | | | | | | | |
| Rev.: | | | | | | | | |
| (Methodist Hosp. Proj.) Series B, | | | | | | | | |
| 3.17%, VRDN (b) | | | | 52,200 | | | | 52,200 |
| (Saint Dominic Village Proj.) Series | | | | | | | | |
| 2000, 3.28%, LOC JPMorgan | | | | | | | | |
| Chase Bank, VRDN (b) | | | | 4,805 | | | | 4,805 |
| Harris County Houston Sports Auth. Rev. | | | | | | | | |
| Participating VRDN Series PZ 95, | | | | | | | | |
| 3.25% (Liquidity Facility Merrill Lynch &�� | | | | | | | | |
| Co., Inc.) (b)(d) | | | | 14,885 | | | | 14,885 |
| Harris County Houston Sports Auth. Spl. | | | | | | | | |
| Rev. (Rodeo Proj.) Series 2001 C, | | | | | | | | |
| 3.22% (MBIA Insured), VRDN (b) | | | | 10,900 | | | | 10,900 |
| HFDC of Central Texas, Inc. Hosp. Rev. | | | | | | | | |
| Bonds Series Putters 1233, 3.4%, | | | | | | | | |
| tender 2/15/07 (Liquidity Facility | | | | | | | | |
| JPMorgan Chase & Co.) (b)(d)(e) | | | | 14,990 | | | | 14,990 |
| Houston Arpt. Sys. Rev. Participating | | | | | | | | |
| VRDN: | | | | | | | | |
| Series EGL 01 4306, 3.21% (Liquidity | | | | | | | | |
| Facility Citibank NA, New | | | | | | | | |
| York) (b)(d) | | | | 8,910 | | | | 8,910 |
| Series MS 845, 3.2% (Liquidity Facility | | | | | | | | |
| Morgan Stanley) (b)(d) | | | | 3,010 | | | | 3,010 |
| Series SG 03 161, 3.21% (Liquidity | | | | | | | | |
| Facility Societe Generale) (b)(d) | | | | 3,900 | | | | 3,900 |
| Houston Gen. Oblig.: | | | | | | | | |
| Bonds Series PT 969, 2.95%, tender | | | | | | | | |
| 7/20/06 (Liquidity Facility DEPFA | | | | | | | | |
| BANK PLC) (b)(d)(e) | | | | 18,835 | | | | 18,835 |
| Participating VRDN Series EGL 04 23 | | | | | | | | |
| Class A, 3.21% (Liquidity Facility | | | | | | | | |
| Citibank NA) (b)(d) | | | | 4,950 | | | | 4,950 |
| Series E, 3.17% 4/13/06 (Liquidity | | | | | | | | |
| Facility Bank of America NA), CP | | | | 10,000 | | | | 10,000 |
| Houston Higher Ed. Fin. Corp. Higher Ed. | | | | | | | | |
| Rev. Participating VRDN Series EGL 01 | | | | | | | | |
| 4303 Class A, 3.21% (Liquidity Facility | | | | | | | | |
| Citibank NA, New York) (b)(d) | | | | 7,500 | | | | 7,500 |
| Houston Independent School District | | | | | | | | |
| Bonds: | | | | | | | | |
| Series Putters 1078, 3.6%, tender | | | | | | | | |
| 8/24/06 (Liquidity Facility | | | | | | | | |
| JPMorgan Chase & Co.) (b)(d)(e) | | | | 2,925 | | | | 2,925 |
See accompanying notes which are an integral part of the financial statements.
61 Annual Report
| Tax-Exempt Portfolio | | | | | | | | |
| Investments - continued | | | | | | | | |
| |
| |
| |
| Municipal Securities continued | | | | | | |
| |
| | | Principal | | Value (Note 1) |
| | | Amount (000s) | | (000s) |
| Texas continued | | | | | | | | |
| Houston Independent School District | | | | | | | | |
| Bonds: continued | | | | | | | | |
| 2.77%, tender 6/14/06 (Permanent | | | | | | | | |
| School Fund of Texas | | | | | | | | |
| Guaranteed) (b) | | | | $ 10,600 | | | | $ 10,600 |
| Houston Occupancy Tax and Spl. Rev. | | | | | | | | |
| Participating VRDN Series MSTC 06 | | | | | | | | |
| 254, 3.3% (Liquidity Facility Bear | | | �� | | | | | |
| Stearns Companies, Inc.) (b)(d) | | | | 3,400 | | | | 3,400 |
| Houston Util. Sys. Rev. Participating | | | | | | | | |
| VRDN: | | | | | | | | |
| Series Putters 669, 3.21% (Liquidity | | | | | | | | |
| Facility JPMorgan Chase & | | | | | | | | |
| Co.) (b)(d) | | | | 6,465 | | | | 6,465 |
| Series Putters 906, 3.21% (Liquidity | | | | | | | | |
| Facility JPMorgan Chase | | | | | | | | |
| Bank) (b)(d) | | | | 5,000 | | | | 5,000 |
| Series ROC II R491, 3.21% (Liquidity | | | | | | | | |
| Facility Citibank NA) (b)(d) | | | | 10,325 | | | | 10,325 |
| Houston Wtr. & Swr. Sys. Rev. | | | | | | | | |
| Participating VRDN: | | | | | | | | |
| Series BA 02 F, 3.25% (Liquidity | | | | | | | | |
| Facility Bank of America NA) (b)(d) | | | | 6,525 | | | | 6,525 |
| Series MSTC 01 111, 3.2% (Liquidity | | | | | | | | |
| Facility Bear Stearns Companies, | | | | | | | | |
| Inc.) (b)(d) | | | | 6,000 | | | | 6,000 |
| Series SG 120, 3.21% (Liquidity | | | | | | | | |
| Facility Societe Generale) (b)(d) | | | | 7,705 | | | | 7,705 |
| Keller Independent School District | | | | | | | | |
| Participating VRDN Series PT 2280, | | | | | | | | |
| 3.21% (Liquidity Facility Merrill Lynch & | | | | | | | | |
| Co., Inc.) (b)(d) | | | | 6,330 | | | | 6,330 |
| Leander Independent School District | | | | | | | | |
| Participating VRDN: | | | | | | | | |
| Series PT 2405, 3.21% (Liquidity | | | | | | | | |
| Facility Merrill Lynch & Co., | | | | | | | | |
| Inc.) (b)(d) | | | | 5,270 | | | | 5,270 |
| Series Putters 507, 3.21% (Liquidity | | | | | | | | |
| Facility JPMorgan Chase | | | | | | | | |
| Bank) (b)(d) | | | | 7,220 | | | | 7,220 |
| Liberty Hill Independent School District | | | | | | | | |
| Participating VRDN Series TOC 06 A, | | | | | | | | |
| 3.21% (Liquidity Facility Goldman | | | | | | | | |
| Sachs Group, Inc.) (b)(d) | | | | 7,655 | | | | 7,655 |
| Lower Colorado River Auth. Rev.: | | | | | | | | |
| Participating VRDN Series EGL 00 | | | | | | | | |
| 4302, 3.21% (Liquidity Facility | | | | | | | | |
| Citibank NA, New York) (b)(d) | | | | 5,880 | | | | 5,880 |
| 3.23% 4/3/06, LOC JPMorgan Chase | | | | | | | | |
| Bank, LOC WestLB AG, CP | | | | 11,000 | | | | 11,000 |
| Lower Colorado River Auth. Transmission | | | | | | | | |
| Contract Rev. Participating VRDN | | | | | | | | |
| Series ROC II R4530, 3.21% (Liquidity | | | | | | | | |
| Facility Citigroup Global Markets | | | | | | | | |
| Hldgs., Inc.) (b)(d) | | | | 3,760 | | | | 3,760 |
| Lufkin Health Facilities Dev. Corp. Health | | | | | | | | |
| Sys. Rev. (Memorial Health Sys. of East | | | | | | | | |
| Texas Proj.) Series A, 3.23%, LOC | | | | | | | | |
| Allied Irish Banks PLC, VRDN (b) | | | | 16,185 | | | | 16,185 |
| | | Principal | | Value (Note 1) |
| | | Amount (000s) | | (000s) |
| Mansfield Independent School District | | | | | | | | |
| Participating VRDN Series PA 1174, | | | | | | | | |
| 3.21% (Liquidity Facility Merrill Lynch & | | | | | | | | |
| Co., Inc.) (b)(d) | | | | $ 10,080 | | | | $ 10,080 |
| Mesquite Independent School District | | | | | | | | |
| Participating VRDN Series PT 2192, | | | | | | | | |
| 3.21% (Liquidity Facility Merrill Lynch & | | | | | | | | |
| Co., Inc.) (b)(d) | | | | 6,255 | | | | 6,255 |
| Mission Consolidated Independent School | | | | | | | | |
| District Participating VRDN Series SGA | | | | | | | | |
| 105, 3.23% (Liquidity Facility Societe | | | | | | | | |
| Generale) (b)(d) | | | | 6,000 | | | | 6,000 |
| North Central Health Facilities Dev. Corp. | | | | | | | | |
| Rev. Bonds (Dallas Methodist Hosp. | | | | | | | | |
| Proj.) Series 1999, 3.38% tender | | | | | | | | |
| 8/7/06 (AMBAC Insured) (Liquidity | | | | | | | | |
| Facility Dexia Cr. Local de France), CP | | | | | | | | |
| mode | | | | 12,000 | | | | 12,000 |
| North East Texas Independent School | | | | | | | | |
| District Participating VRDN Series PT | | | | | | | | |
| 1249, 3.21% (Liquidity Facility Merrill | | | | | | | | |
| Lynch & Co., Inc.) (b)(d) | | | | 18,340 | | | | 18,340 |
| North Texas Tollway Auth. Dallas North | | | | | | | | |
| Tollway Sys. Rev. Participating VRDN: | | | | | | | | |
| Series AAB 06 6, 3.22% (Liquidity | | | | | | | | |
| Facility ABN AMRO Bank NV) (b)(d) | | | | 10,015 | | | | 10,015 |
| Series SG 168, 3.21% (Liquidity | | | | | | | | |
| Facility Societe Generale) (b)(d) | | | | 26,100 | | | | 26,100 |
| Odessa Wtr. & Swr. Rev. Participating | | | | | | | | |
| VRDN Series EGL 01 4307, 3.21% | | | | | | | | |
| (Liquidity Facility Citibank NA, New | | | | | | | | |
| York) (b)(d) | | | | 2,085 | | | | 2,085 |
| Plano Independent School District Bonds: | | | | | | | | |
| Series ROC II R2106, 3.45%, tender | | | | | | | | |
| 8/10/06 (Liquidity Facility | | | | | | | | |
| Citigroup Global Markets Hldgs., | | | | | | | | |
| Inc.) (b)(d)(e) | | | | 10,830 | | | | 10,830 |
| 3.35%, tender 8/15/06 (Permanent | | | | | | | | |
| School Fund of Texas | | | | | | | | |
| Guaranteed) (b) | | | | 16,115 | | | | 16,115 |
| Red River Ed. Fin. Corp. Ed. Rev. (Texas | | | | | | | | |
| Christian Univ. Proj.) 3.16%, VRDN (b) | | | | 10,000 | | | | 10,000 |
| Rockwall Independent School District | | | | | | | | |
| Participating VRDN Series MSTC 01 | | | | | | | | |
| 123, 3.2% (Liquidity Facility Bear | | | | | | | | |
| Stearns Companies, Inc.) (b)(d) | | | | 12,100 | | | | 12,100 |
| San Antonio Elec. & Gas Systems Rev.: | | | | | | | | |
| Participating VRDN: | | | | | | | | |
| Series PT 1977, 3.21% (Liquidity | | | | | | | | |
| Facility Merrill Lynch & Co., | | | | | | | | |
| Inc.) (b)(d) | | | | 7,275 | | | | 7,275 |
| Series SG 105, 3.21% (Liquidity | | | | | | | | |
| Facility Societe Generale) (b)(d) . | | | | 44,800 | | | | 44,800 |
| Series Stars 112, 3.21% (Liquidity | | | | | | | | |
| Facility BNP Paribas SA) (b)(d) | | | | 15,020 | | | | 15,020 |
| 3.23% (Liquidity Facility Bank of | | | | | | | | |
| America NA), VRDN (b) | | | | 79,900 | | | | 79,900 |
See accompanying notes which are an integral part of the financial statements.
Annual Report 62
| Municipal Securities continued | | | | | | |
| |
| | | Principal | | Value (Note 1) |
| | | Amount (000s) | | (000s) |
| Texas continued | | | | | | | | |
| San Antonio Hotel Occupancy Tax Rev. | | | | | | | | |
| Participating VRDN Series SG 51, | | | | | | | | |
| 3.21% (Liquidity Facility Societe | | | | | | | | |
| Generale) (b)(d) | | | | $ 6,250 | | | | $ 6,250 |
| San Antonio Independent School District: | | | | | | | | |
| Bonds Series AAB 01 28, 3.22%, | | | | | | | | |
| tender 4/7/06 (Liquidity Facility | | | | | | | | |
| ABN AMRO Bank NV) (b)(d) | | | | 3,400 | | | | 3,400 |
| Participating VRDN Series PT 1600, | | | | | | | | |
| 3.21% (Liquidity Facility Merrill | | | | | | | | |
| Lynch & Co., Inc.) (b)(d) | | | | 12,060 | | | | 12,060 |
| San Antonio Wtr. Sys. Rev. Participating | | | | | | | | |
| VRDN: | | | | | | | | |
| Series EGL 06 5 Class A, 3.21% | | | | | | | | |
| (Liquidity Facility Citibank NA) (b)(d) | | | | 14,500 | | | | 14,500 |
| Series Merlots 00 VV, 3.21% (Liquidity | | | | | | | | |
| Facility Wachovia Bank NA) (b)(d) . | | | | 21,000 | | | | 21,000 |
| Series MS 1237, 3.2% (Liquidity | | | | | | | | |
| Facility Morgan Stanley) (b)(d) | | | | 18,750 | | | | 18,750 |
| Series MSTC 01 132, 3.2% (Liquidity | | | | | | | | |
| Facility Bear Stearns Companies, | | | | | | | | |
| Inc.) (b)(d) | | | | 1,600 | | | | 1,600 |
| Schertz/Seguin Local Govt. Corp. | | | | | | | | |
| Contract Rev. Participating VRDN | | | | | | | | |
| Series MSTC 01 114, 3.23% (Liquidity | | | | | | | | |
| Facility Bear Stearns Companies, | | | | | | | | |
| Inc.) (b)(d) | | | | 9,995 | | | | 9,995 |
| Socorro Independent School District | | | | | | | | |
| Participating VRDN: | | | | | | | | |
| Series EGL 00 4306, 3.21% (Liquidity | | | | | | | | |
| Facility Citibank NA, New | | | | | | | | |
| York) (b)(d) | | | | 5,900 | | | | 5,900 |
| Series PT 2653, 3.21% (Liquidity | | | | | | | | |
| Facility Merrill Lynch & Co., | | | | | | | | |
| Inc.) (b)(d) | | | | 11,035 | | | | 11,035 |
| Series Putters 1036, 3.21% (Liquidity | | | | | | | | |
| Facility JPMorgan Chase & | | | | | | | | |
| Co.) (b)(d) | | | | 9,670 | | | | 9,670 |
| Tarrant County Health Facilities Dev. | | | | | | | | |
| Corp. Health Sys. Rev. Participating | | | | | | | | |
| VRDN Series Merlots 00 BB, 3.21% | | | | | | | | |
| (Liquidity Facility Wachovia Bank | | | | | | | | |
| NA) (b)(d) | | | | 7,880 | | | | 7,880 |
| Temple Independent School District | | | | | | | | |
| Participating VRDN Series DB 136, | | | | | | | | |
| 3.21% (Liquidity Facility Deutsche Bank | | | | | | | | |
| AG) (b)(d) | | | | 8,195 | | | | 8,195 |
| Texas A&M Univ. Rev. Participating | | | | | | | | |
| VRDN Series ROC II R4005, 3.21% | | | | | | | | |
| (Liquidity Facility Citigroup Global | | | | | | | | |
| Markets Hldgs., Inc.) (b)(d) | | | | 4,955 | | | | 4,955 |
| Texas Gen. Oblig.: | | | | | | | | |
| Participating VRDN: | | | | | | | | |
| Series MS 1147, 3.2% (Liquidity | | | | | | | | |
| Facility Morgan Stanley) (b)(d) | | | | 4,005 | | | | 4,005 |
| | | Principal | | Value (Note 1) |
| | | Amount (000s) | | (000s) |
| Series Putters 05 1013A, 3.21% | | | | | | | | |
| (Liquidity Facility JPMorgan Chase | | | | | | | | |
| Bank) (b)(d) | | | | $ 3,660 | | | | $ 3,660 |
| Series SGB 58, 3.21% (Liquidity | | | | | | | | |
| Facility Societe Generale) (b)(d) . | | | | 5,800 | | | | 5,800 |
| TRAN 4.5% 8/31/06 | | | | 125,200 | | | | 125,938 |
| Texas Pub. Fin. Auth. Series 2002 B: | | | | | | | | |
| 3.18% 4/7/06 (Liquidity Facility Texas | | | | | | | | |
| Gen. Oblig.), CP | | | | 5,000 | | | | 5,000 |
| 3.23% 4/7/06 (Liquidity Facility Texas | | | | | | | | |
| Gen. Oblig.), CP | | | | 1,200 | | | | 1,200 |
| 3.4% 4/7/06 (Liquidity Facility Texas | | | | | | | | |
| Gen. Oblig.), CP | | | | 800 | | | | 800 |
| The Colony Wtr. & Swr. Sys. Rev. | | | | | | | | |
| Participating VRDN Series PT 2369, | | | | | | | | |
| 3.21% (Liquidity Facility Merrill Lynch & | | | | | | | | |
| Co., Inc.) (b)(d) | | | | 7,395 | | | | 7,395 |
| Trinity River Auth. Rev. Participating | | | | | | | | |
| VRDN Series Putters 1061, 3.21% | | | | | | | | |
| (Liquidity Facility JPMorgan Chase | | | | | | | | |
| Bank) (b)(d) | | | | 5,650 | | | | 5,650 |
| Tyler Health Facilities Dev. Corp. Hosp. | | | | | | | | |
| Rev. Participating VRDN Series PT 833, | | | | | | | | |
| 3.21% (Liquidity Facility Svenska | | | | | | | | |
| Handelsbanken AB) (b)(d) | | | | 5,220 | | | | 5,220 |
| United Independent School District | | | | | | | | |
| Participating VRDN Series PT 3121, | | | | | | | | |
| 3.21% (Liquidity Facility Merrill Lynch & | | | | | | | | |
| Co., Inc.) (b)(d) | | | | 5,765 | | | | 5,765 |
| Univ. of North Texas Univ. Rev. | | | | | | | | |
| Participating VRDN Series SGA 146, | | | | | | | | |
| 3.23% (Liquidity Facility Societe | | | | | | | | |
| Generale) (b)(d) | | | | 3,000 | | | | 3,000 |
| Univ. of Texas Univ. Revs. Participating | | | | | | | | |
| VRDN: | | | | | | | | |
| Series MS 98 97, 3.2% (Liquidity | | | | | | | | |
| Facility Morgan Stanley) (b)(d) | | | | 5,120 | | | | 5,120 |
| Series Putters 584, 3.21% (Liquidity | | | | | | | | |
| Facility JPMorgan Chase | | | | | | | | |
| Bank) (b)(d) | | | | 7,495 | | | | 7,495 |
| Series Putters 592, 3.21% (Liquidity | | | | | | | | |
| Facility JPMorgan Chase | | | | | | | | |
| Bank) (b)(d) | | | | 5,565 | | | | 5,565 |
| Waco Gen. Oblig. Participating VRDN | | | | | | | | |
| Series PT 2098, 3.21% (Liquidity | | | | | | | | |
| Facility Merrill Lynch & Co., Inc.) (b)(d) | | | | 5,440 | | | | 5,440 |
| West Harris County Reg’l. Wtr. Auth. | | | | | | | | |
| Wtr. Sys. Rev. Participating VRDN | | | | | | | | |
| Series SGA 148, 3.23% (Liquidity | | | | | | | | |
| Facility Societe Generale) (b)(d) | | | | 4,000 | | | | 4,000 |
| White Settlement Independent School | | | | | | | | |
| District Participating VRDN Series PT | | | | | | | | |
| 3047, 3.21% (Liquidity Facility Merrill | | | | | | | | |
| Lynch & Co., Inc.) (b)(d) | | | | 7,095 | | | | 7,095 |
| Ysleta Independent School District | | | | | | | | |
| Participating VRDN Series Putters | | | | | | | | |
| 1051, 3.21% (Liquidity Facility | | | | | | | | |
| JPMorgan Chase Bank) (b)(d) | | | | 5,855 | | | | 5,855 |
| | | | | | | | | 1,316,604 |
See accompanying notes which are an integral part of the financial statements.
63 Annual Report
| Tax-Exempt Portfolio | | | | | | | | |
| Investments - continued | | | | | | | | |
| |
| |
| |
| Municipal Securities continued | | | | | | |
| |
| | | Principal | | Value (Note 1) |
| | | Amount (000s) | | (000s) |
| Utah 0.8% | | | | | | | | |
| Central Utah Wtr. Conservatory District | | | | | | | | |
| Participating VRDN Series PT 2420, | | | | | | | | |
| 3.21% (Liquidity Facility Merrill Lynch & | | | | | | | | |
| Co., Inc.) (b)(d) | | | | $ 5,300 | | | | $ 5,300 |
| Intermountain Pwr. Agcy. Pwr. Supply | | | | | | | | |
| Rev. Participating VRDN Series MS 00 | | | | | | | | |
| 409, 3.2% (Liquidity Facility Morgan | | | | | | | | |
| Stanley) (b)(d) | | | | 13,800 | | | | 13,800 |
| Murray City Hosp. Rev. (IHC Health | | | | | | | | |
| Services, Inc. Proj.) Series C, 3.22% | | | | | | | | |
| (Liquidity Facility Citibank NA), | | | | | | | | |
| VRDN (b) | | | | 25,500 | | | | 25,500 |
| Salt Lake City Sales Tax Rev. 3.23% | | | | | | | | |
| (Liquidity Facility State Street Bank & | | | | | | | | |
| Trust Co., Boston), VRDN (b) | | | | 16,050 | | | | 16,050 |
| | | | | | | | | 60,650 |
| |
| Vermont – 0.2% | | | | | | | | |
| Vermont Edl. & Health Bldgs. Fing. Agcy. | | | | | | | | |
| Rev. Bonds (Middlebury College Proj.) | | | | | | | | |
| 2.91%, tender 5/1/06 (b) | | | | 5,350 | | | | 5,350 |
| Vermont Hsg. Fin. Agcy. Student Hsg. | | | | | | | | |
| Fin. Agcy. (West Block Univ. of Vermont | | | | | | | | |
| Apts. Proj.) Series 2004 A, 3.19%, | | | | | | | | |
| LOC Bank of Nova Scotia, New York | | | | | | | | |
| Agcy., VRDN (b) | | | | 12,075 | | | | 12,075 |
| | | | | | | | | 17,425 |
| |
| Virginia – 1.4% | | | | | | | | |
| Chesterfield County Indl. Dev. Auth. Rev. | | | | | | | | |
| Participating VRDN Series PT 886, | | | | | | | | |
| 3.26% (Liquidity Facility Lloyds TSB | | | | | | | | |
| Bank PLC) (b)(d) | | | | 4,300 | | | | 4,300 |
| Loudoun County Gen. Oblig. | | | | | | | | |
| Participating VRDN Series Putters 451, | | | | | | | | |
| 3.21% (Liquidity Facility JPMorgan | | | | | | | | |
| Chase Bank) (b)(d) | | | | 3,895 | | | | 3,895 |
| Portsmouth Participating VRDN Series | | | | | | | | |
| ROC II R6054, 3.21% (Liquidity Facility | | | | | | | | |
| Citibank NA) (b)(d) | | | | 3,180 | | | | 3,180 |
| Univ. of Virginia Univ. Revs. Participating | | | | | | | | |
| VRDN: | | | | | | | | |
| Series EGL 06 17 Class A, 3.21% | | | | | | | | |
| (Liquidity Facility Citibank NA) (b)(d) | | | | 12,200 | | | | 12,200 |
| Series MS 856, 3.2% (Liquidity Facility | | | | | | | | |
| Morgan Stanley) (b)(d) | | | | 3,000 | | | | 3,000 |
| Upper Occoquan Swr. Auth. Reg’l. Swr. | | | | | | | | |
| Rev. Participating VRDN Series MSTC | | | | | | | | |
| 01 159, 3.2% (Liquidity Facility Bear | | | | | | | | |
| Stearns Companies, Inc.) (b)(d) | | | | 11,495 | | | | 11,495 |
| Virginia College Bldg. Auth. Edl. Facilities | | | | | | | | |
| Rev. Participating VRDN: | | | | | | | | |
| Series MS 01 721, 3.2% (Liquidity | | | | | | | | |
| Facility Morgan Stanley) (b)(d) | | | | 28,105 | | | | 28,105 |
| Series Putters 134, 3.21% (Liquidity | | | | | | | | |
| Facility JPMorgan Chase & | | | | | | | | |
| Co.) (b)(d) | | | | 14,320 | | | | 14,320 |
| | | Principal | | Value (Note 1) |
| | | Amount (000s) | | (000s) |
| Virginia Commonwealth Trans. Board | | | | | | | | |
| Trans. Rev. Participating VRDN Series | | | | | | | | |
| MS 01 727, 3.2% (Liquidity Facility | | | | | | | | |
| Morgan Stanley) (b)(d) | | | | $ 3,665 | | | | $ 3,665 |
| Virginia Pub. School Auth. Participating | | | | | | | | |
| VRDN Series Putters 139, 3.21% | | | | | | | | |
| (Liquidity Facility JPMorgan Chase & | | | | | | | | |
| Co.) (b)(d) | | | | 16,900 | | | | 16,900 |
| | | | | | | | | 101,060 |
| |
| Washington 6.2% | | | | | | | | |
| Clark County Gen. Oblig. Participating | | | | | | | | |
| VRDN Series Putters 541, 3.21% | | | | | | | | |
| (Liquidity Facility JPMorgan Chase | | | | | | | | |
| Bank) (b)(d) | | | | 3,975 | | | | 3,975 |
| Clark County School District #114, | | | | | | | | |
| Evergreen Participating VRDN Series | | | | | | | | |
| PT 1575, 3.21% (Liquidity Facility | | | | | | | | |
| Merrill Lynch & Co., Inc.) (b)(d) | | | | 5,125 | | | | 5,125 |
| Clipper Tax Exempt Trust Participating | | | | | | | | |
| VRDN Series Clipper 05 39, 3.21% | | | | | | | | |
| (Liquidity Facility State Street Bank & | | | | | | | | |
| Trust Co., Boston) (b)(d) | | | | 18,570 | | | | 18,570 |
| Energy Northwest Elec. Rev. Participating | | | | | | | | |
| VRDN: | | | | | | | | |
| Series PA 825, 3.22% (Liquidity | | | | | | | | |
| Facility Merrill Lynch & Co., | | | | | | | | |
| Inc.) (b)(d) | | | | 6,245 | | | | 6,245 |
| Series PT 1978, 3.21% (Liquidity | | | | | | | | |
| Facility Merrill Lynch & Co., | | | | | | | | |
| Inc.) (b)(d) | | | | 6,525 | | | | 6,525 |
| Series PT 2165, 3.21% (Liquidity | | | | | | | | |
| Facility Merrill Lynch & Co., | | | | | | | | |
| Inc.) (b)(d) | | | | 5,365 | | | | 5,365 |
| Series Putters 256, 3.21% (Liquidity | | | | | | | | |
| Facility JPMorgan Chase | | | | | | | | |
| Bank) (b)(d) | | | | 4,545 | | | | 4,545 |
| Series ROC II R4524, 3.21% (Liquidity | | | | | | | | |
| Facility Citigroup Global Markets | | | | | | | | |
| Hldgs., Inc.) (b)(d) | | | | 5,030 | | | | 5,030 |
| Everett Gen. Oblig. 3.23%, LOC Bank of | | | | | | | | |
| America NA, VRDN (b) | | | | 2,600 | | | | 2,600 |
| Grant County Pub. Util. District #2 Elec. | | | | | | | | |
| Rev. Participating VRDN Series PA 952, | | | | | | | | |
| 3.22% (Liquidity Facility Merrill Lynch & | | | | | | | | |
| Co., Inc.) (b)(d) | | | | 10,495 | | | | 10,495 |
| King & Snohomish Counties School | | | | | | | | |
| District #417 Northshore Participating | | | | | | | | |
| VRDN Series PT 1789, 3.21% (Liquidity | | | | | | | | |
| Facility Merrill Lynch & Co., Inc.) (b)(d) | | | | 5,420 | | | | 5,420 |
| King County Gen. Oblig. Participating | | | | | | | | |
| VRDN: | | | | | | | | |
| Series MS 1242, 3.2% (Liquidity | | | | | | | | |
| Facility Morgan Stanley) (b)(d) | | | | 7,000 | | | | 7,000 |
| Series PT 2170, 3.21% (Liquidity | | | | | | | | |
| Facility Merrill Lynch & Co., | | | | | | | | |
| Inc.) (b)(d) | | | | 8,035 | | | | 8,035 |
| King County Pub. Hosp. District #2 | | | | | | | | |
| Participating VRDN Series PT 2469, | | | | | | | | |
| 3.21% (Liquidity Facility Merrill Lynch & | | | | | | | | |
| Co., Inc.) (b)(d) | | | | 7,910 | | | | 7,910 |
See accompanying notes which are an integral part of the financial statements.
Annual Report 64
| Municipal Securities continued | | | | | | |
| |
| | | Principal | | Value (Note 1) |
| | | Amount (000s) | | (000s) |
| Washington – continued | | | | | | | | |
| King County Swr. Rev.: | | | | | | | | |
| Participating VRDN Series MS 01 | | | | | | | | |
| 554, 3.2% (Liquidity Facility Morgan | | | | | | | | |
| Stanley) (b)(d) | | | | $ 9,590 | | | | $ 9,590 |
| Series 2001 A, 3.17%, LOC | | | | | | | | |
| Landesbank Hessen Thuringen, | | | | | | | | |
| VRDN (b) | | | | 11,600 | | | | 11,600 |
| Series A, 3.25% 4/6/06 (Liquidity | | | | | | | | |
| Facility Bayerische Landesbank | | | | | | | | |
| Girozentrale), CP | | | | 13,400 | | | | 13,400 |
| Marysville Wtr. & Swr. Rev. Participating | | | | | | | | |
| VRDN Series Putters 909, 3.21% | | | | | | | | |
| (Liquidity Facility JPMorgan Chase & | | | | | | | | |
| Co.) (b)(d) | | | | 7,335 | | | | 7,335 |
| Port of Seattle Rev. Participating VRDN: | | | | | | | | |
| Series DB 168, 3.21% (Liquidity | | | | | | | | |
| Facility Deutsche Bank AG) (b)(d) | | | | 10,360 | | | | 10,360 |
| Series MS 1232, 3.2% (Liquidity | | | | | | | | |
| Facility Morgan Stanley) (b)(d) | | | | 12,265 | | | | 12,265 |
| Series PT 3043, 3.21% (Liquidity | | | | | | | | |
| Facility Merrill Lynch & Co., | | | | | | | | |
| Inc.) (b)(d) | | | | 8,380 | | | | 8,380 |
| Port of Tacoma Rev. Participating VRDN | | | | | | | | |
| Series PT 2164, 3.21% (Liquidity | | | | | | | | |
| Facility Merrill Lynch & Co., Inc.) (b)(d) | | | | 7,925 | | | | 7,925 |
| Seattle Drain & Wastewtr. Util. Rev. | | | | | | | | |
| Participating VRDN Series SG 00 135, | | | | | | | | |
| 3.21% (Liquidity Facility Societe | | | | | | | | |
| Generale) (b)(d) | | | | 19,885 | | | | 19,885 |
| Seattle Drainage & Wastewtr. Rev. | | | | | | | | |
| Participating VRDN Series PT 1604, | | | | | | | | |
| 3.21% (Liquidity Facility Merrill Lynch & | | | | | | | | |
| Co., Inc.) (b)(d) | | | | 8,745 | | | | 8,745 |
| Seattle Muni. Lt. & Pwr. Rev. Participating | | | | | | | | |
| VRDN: | | | | | | | | |
| Series SGA 85, 3.2% (Liquidity Facility | | | | | | | | |
| Societe Generale) (b)(d) | | | | 16,600 | | | | 16,600 |
| Series SGA 96, 3.2% (Liquidity Facility | | | | | | | | |
| Societe Generale) (b)(d) | | | | 14,955 | | | | 14,955 |
| Snohomish County Hsg. Auth. Hsg. Rev. | | | | | | | | |
| (Ebey Arms Centerhouse Proj.) 3.23%, | | | | | | | | |
| LOC Bank of America NA, VRDN (b) . | | | | 3,000 | | | | 3,000 |
| Spokane County School District #81 | | | | | | | | |
| Participating VRDN Series ROC II | | | | | | | | |
| R4000, 3.21% (Liquidity Facility | | | | | | | | |
| Citigroup Global Markets Hldgs., | | | | | | | | |
| Inc.) (b)(d) | | | | 3,560 | | | | 3,560 |
| Tulalip Tribes of The Tulalip Reservation | | | | | | | | |
| Spl. Rev. 3.2%, LOC Bank of America | | | | | | | | |
| NA, VRDN (b) | | | | 10,430 | | | | 10,430 |
| Washington Gen. Oblig. Participating | | | | | | | | |
| VRDN: | | | | | | | | |
| Series EGL 00 4703, 3.21% (Liquidity | | | | | | | | |
| Facility Citibank NA, New | | | | | | | | |
| York) (b)(d) | | | | 14,140 | | | | 14,140 |
| Series EGL 00 4704, 3.21% (Liquidity | | | | | | | | |
| Facility Citibank NA, New | | | | | | | | |
| York) (b)(d) | | | | 3,065 | | | | 3,065 |
| | | Principal | | Value (Note 1) |
| | | Amount (000s) | | (000s) |
| Series EGL 00 4705, 3.21% (Liquidity | | | | | | | | |
| Facility Citibank NA, New | | | | | | | | |
| York) (b)(d) | | | | $ 8,235 | | | | $ 8,235 |
| Series EGL 96 4701, 3.21% (Liquidity | | | | | | | | |
| Facility Citibank NA, New | | | | | | | | |
| York) (b)(d) | | | | 14,015 | | | | 14,015 |
| Series MS 00 388, 3.2% (Liquidity | | | | | | | | |
| Facility Morgan Stanley) (b)(d) | | | | 12,145 | | | | 12,145 |
| Series PT 2563, 3.21% (Liquidity | | | | | | | | |
| Facility Merrill Lynch & Co., | | | | | | | | |
| Inc.) (b)(d) | | | | 9,440 | | | | 9,440 |
| Series PT 2733, 3.21% (Liquidity | | | | | | | | |
| Facility Merrill Lynch & Co., | | | | | | | | |
| Inc.) (b)(d) | | | | 7,395 | | | | 7,395 |
| Series PT 2734, 3.21% (Liquidity | | | | | | | | |
| Facility Merrill Lynch & Co., | | | | | | | | |
| Inc.) (b)(d) | | | | 5,780 | | | | 5,780 |
| Series PT 2735, 3.21% (Liquidity | | | | | | | | |
| Facility Merrill Lynch & Co., | | | | | | | | |
| Inc.) (b)(d) | | | | 9,960 | | | | 9,960 |
| Series Putters 1165, 3.21% (Liquidity | | | | | | | | |
| Facility JPMorgan Chase & | | | | | | | | |
| Co.) (b)(d) | | | | 6,645 | | | | 6,645 |
| Series Putters 744, 3.21% (Liquidity | | | | | | | | |
| Facility Dresdner Bank AG) (b)(d) | | | | 3,585 | | | | 3,585 |
| Series RobIns 6, 3.21% (Liquidity | | | | | | | | |
| Facility Bank of New York, New | | | | | | | | |
| York) (b)(d) | | | | 13,095 | | | | 13,095 |
| Washington Health Care Facilities Auth. | | | | | | | | |
| Rev.: | | | | | | | | |
| Participating VRDN Series FRRI 02 | | | | | | | | |
| L45J, 3.23% (Liquidity Facility | | | | | | | | |
| Lehman Brothers Hldgs., Inc.) (b)(d) | | | | 41,610 | | | | 41,610 |
| (Seattle Cancer Care Alliance Proj.) | | | | | | | | |
| 3.2%, LOC Key Bank NA, VRDN (b) | | | | 4,250 | | | | 4,250 |
| Washington Hsg. Fin. Commission | | | | | | | | |
| Nonprofit Hsg. Rev. (Horizon House | | | | | | | | |
| Proj.) 3.2%, LOC Bank of America NA, | | | | | | | | |
| VRDN (b) | | | | 24,975 | | | | 24,975 |
| Washington Hsg. Fin. Commission | | | | | | | | |
| Nonprofit Rev. (Wesley Homes Proj.): | | | | | | | | |
| Series A, 3.1%, LOC Bank of America | | | | | | | | |
| NA, VRDN (b) | | | | 19,000 | | | | 19,000 |
| Series B, 3.1%, LOC Bank of America | | | | | | | | |
| NA, VRDN (b) | | | | 4,100 | | | | 4,100 |
| | | | | | | | | 456,305 |
| |
| West Virginia – 0.1% | | | | | | | | |
| West Virginia Gen. Oblig. Participating | | | | | | | | |
| VRDN: | | | | | | | | |
| Series AAB 00 12, 3.2% (Liquidity | | | | | | | | |
| Facility ABN AMRO Bank NV) (b)(d) | | | | 6,000 | | | | 6,000 |
| Series Putters 1114, 3.21% (Liquidity | | | | | | | | |
| Facility JPMorgan Chase & | | | | | | | | |
| Co.) (b)(d) | | | | 4,260 | | | | 4,260 |
| | | | | | | | | 10,260 |
See accompanying notes which are an integral part of the financial statements.
65 Annual Report
| Tax-Exempt Portfolio | | | | | | | | |
| Investments - continued | | | | | | | | |
| |
| |
| |
| Municipal Securities continued | | | | | | |
| | | Principal | | Value (Note 1) |
| | | Amount (000s) | | (000s) |
| Wisconsin – 0.9% | | | | | | | | |
| Green Bay Wtr. Sys. Rev. Participating | | | | | | | | |
| VRDN Series PT 2396, 3.21% (Liquidity | | | | | | | | |
| Facility Merrill Lynch & Co., Inc.) (b)(d) | | | | $ 5,745 | | | | $ 5,745 |
| Manitowoc Elec. Rev. Participating VRDN | | | | | | | | |
| Series DB 110, 3.21% (Liquidity Facility | | | | | | | | |
| Deutsche Bank AG) (b)(d) | | | | 14,365 | | | | 14,365 |
| Milwaukee Redev. Auth. Rev. | | | | | | | | |
| Participating VRDN Series PT 2042, | | | | | | | | |
| 3.21% (Liquidity Facility Merrill Lynch & | | | | | | | | |
| Co., Inc.) (b)(d) | | | | 5,970 | | | | 5,970 |
| Univ. of Wisconsin Hosp. & Clinics Auth. | | | | | | | | |
| Participating VRDN Series Merlots 00 | | | | | | | | |
| RR, 3.21% (Liquidity Facility Wachovia | | | | | | | | |
| Bank NA) (b)(d) | | | | 7,000 | | | | 7,000 |
| Wilmot Union High School District | | | | | | | | |
| Participating VRDN Series PT 2275, | | | | | | | | |
| 3.21% (Liquidity Facility Merrill Lynch & | | | | | | | | |
| Co., Inc.) (b)(d) | | | | 5,175 | | | | 5,175 |
| Wisconsin Gen. Oblig. Participating | | | | | | | | |
| VRDN Series Putters 1116, 3.21% | | | | | | | | |
| (Liquidity Facility JPMorgan Chase & | | | | | | | | |
| Co.) (b)(d) | | | | 2,630 | | | | 2,630 |
| Wisconsin Health & Edl. Facilities Auth. | | | | | | | | |
| Rev.: | | | | | | | | |
| Participating VRDN Series RobIns 03 | | | | | | | | |
| A, 3.23% (Liquidity Facility Bank of | | | | | | | | |
| New York, New York) (b)(d) | | | | 7,450 | | | | 7,450 |
| (Riverview Hosp. Assoc. Proj.) Series | | | | | | | | |
| 2001, 3.23%, LOC U.S. Bank NA, | | | | | | | | |
| Minnesota, VRDN (b) | | | | 7,600 | | | | 7,600 |
| (The Lutheran Home, Inc. Proj.) 3.19%, | | | | | | | | |
| LOC M&I Marshall & Ilsley Bank, | | | | | | | | |
| VRDN (b) | | | | 5,000 | | | | 5,000 |
| Wisconsin Trans. Rev. Series 1997 A: | | | | | | | | |
| 3.22% 4/4/06, CP | | | | 2,400 | | | | 2,400 |
| 3.23% 4/4/06, CP | | | | 5,775 | | | | 5,775 |
| | | | | | | | | 69,110 |
| |
| | | Shares | | | | |
| Other – 2.8% | | | | | | | | |
| Fidelity Tax Free Cash Central Fund, | | | | | | | | |
| 3.17% (a)(c) | | | | 210,562,000 | | | | 210,562 |
| |
| |
| TOTAL INVESTMENT PORTFOLIO 98.8% | | | | | | | | |
| (Cost $7,310,038) | | | | | | | | 7,310,038 |
| |
| |
| NET OTHER ASSETS 1.2% | | | | | | | | 85,248 |
| |
| NET ASSETS 100% | | | | | | $ 7,395,286 |
Security Type Abbreviations
|
| BAN | | — | | BOND ANTICIPATION NOTE |
| CP | | — | | COMMERCIAL PAPER |
| RAN | | — | | REVENUE ANTICIPATION NOTE |
| TRAN | | — | | TAX AND REVENUE ANTICIPATION NOTE |
| VRDN | | — | | VARIABLE RATE DEMAND NOTE |
Legend
(a) Affiliated fund that is available only to investment companies and other
accounts managed by Fidelity Investments. The rate quoted is the
annualized seven-day yield of the fund at period end. A complete
unaudited listing of the fund’s holdings as of its most recent quarter end is
available upon request.
(b) The coupon rate shown on floating or adjustable rate securities represents
the rate at period end.
(c) Information in this report regarding holdings by state and security types
does not reflect the holdings of the Fidelity Tax-Free Cash Central Fund.
(d) Provides evidence of ownership in one or more underlying municipal
bonds.
(e) Restricted securities – Investment in securities not registered under the
Securities Act of 1933 (excluding 144A issues). At the end of the period,
the value of restricted securities (excluding 144A issues) amounted to
$145,620,000 or 2.0% of net assets.
Additional information on each holding is as follows:
|
| Security | | Acquisition Date | | | | Cost (000s) |
| Allegheny County Hosp. Dev. Auth. Rev. | | | | | | |
| Bonds Series PT 762, 2.85%, tender | | | | | | |
| 6/15/06 (Liquidity Facility Landesbank | | | | | | |
| Hessen-Thuringen) | | 6/17/05 | | | | $ 10,560 |
| Canadian River Muni. Wtr. Auth. Bonds | | | | | | |
| Series ROC II R 2204, 3.45%, tender | | | | | | |
| 8/10/06 (Liquidity Facility Citigroup | | | | | | |
| Global Markets Hldgs., Inc.) | | 5/25/05 | | | | $ 8,595 |
| Florida Gen. Oblig. Bonds Series Merlots | | | | | | |
| 05 A22, 3.35%, tender 11/14/06 | | | | | | |
| (Liquidity Facility Wachovia Bank NA) | | 11/16/05 | | | | $ 33,975 |
| HFDC of Central Texas, Inc. Hosp. Rev. | | | | | | |
| Bonds Series Putters 1233, 3.4%, tender | | | | | | |
| 2/15/07 (Liquidity Facility JPMorgan | | | | | | |
| Chase & Co.) | | 1/20/06 | | | | $ 14,990 |
| Hollywood Gen. Oblig. Bonds Series | | | | | | |
| Putters 934, 3.6%, tender 8/24/06 | | | | | | |
| (Liquidity Facility JPMorgan Chase Bank) | | 3/28/06 | | | | $ 6,365 |
| Houston Gen. Oblig. Bonds Series PT | | | | | | |
| 969, 2.95%, tender 7/20/06 (Liquidity | | | | | | |
| Facility DEPFA BANK PLC) | | 5/27/04 | | | | $ 18,835 |
| Houston Independent School District | | | | | | |
| Bonds Series Putters 1078, 3.6%, tender | | | | | | |
| 8/24/06 (Liquidity Facility JPMorgan | | | | | | |
| Chase & Co.) | | 3/28/06 | | | | $ 2,925 |
See accompanying notes which are an integral part of the financial statements.
Annual Report 66
| Security | | Acquisition Date | | | | Cost (000s) |
| Missouri Board of Pub. Bldgs. State Office | | | | | | |
| Bldg. Spl. Oblig. Bonds Series Putters | | | | | | |
| 382, 3.6%, tender 8/24/06 (Liquidity | | 4/27/05 - | | | | |
| Facility JPMorgan Chase Bank) | | 3/16/06 | | | | $ 8,010 |
| Orange County School Board Ctfs. of | | | | | | |
| Prtn. Bonds Series ROC II R 2182, 3.45%, | | | | | | |
| tender 8/10/06 (Liquidity Facility | | | | | | |
| Citigroup Global Markets Hldgs., Inc.) | | 3/14/05 | | | | $ 3,435 |
| Plano Independent School District Bonds | | | | | | |
| Series ROC II R2106, 3.45%, tender | | | | | | |
| 8/10/06 (Liquidity Facility Citigroup | | | | | | |
| Global Markets Hldgs., Inc.) | | 3/8/06 | | | | $ 10,830 |
| Wichita Hosp. Rev. Bonds Series MT 170, | | | | | | |
| 3.43%, tender 2/1/07 (Liquidity Facility | | 11/10/05 - | | | | |
| Landesbank Hessen-Thuringen) | | 2/1/06 | | | | $ 27,100 |
Affiliated Central Funds
Information regarding fiscal year to date income earned by the fund from the affiliated Central funds is as follows:
| Fund | | Income earned |
| | | (Amounts in thousands) |
| Fidelity Tax Free Cash Central Fund | | | | $ 2,165 |
Income Tax Information
At March 31, 2006, the fund had a capital loss carryforward of approximately $141,000 all of which will expire on March 31, 2014.
See accompanying notes which are an integral part of the financial statements.
67 Annual Report
| Tax-Exempt Portfolio | | | | | | | | |
| |
| Financial Statements | | | | |
| |
| |
| Statement of Assets and Liabilities | | | | |
| Amounts in thousands (except per share amounts) | | | | March 31, 2006 |
| |
| Assets | | | | | | | | |
| Investment in securities, at value — | | | | | | | | |
| See accompanying schedule: | | | | | | | | |
| Unaffiliated issuers | | | | | | | | |
| (cost $7,099,476) | | | | $ 7,099,476 | | | | |
| Affiliated Central Funds | | | | | | | | |
| (cost $210,562) | | | | 210,562 | | | | |
| Total Investments (cost $7,310,038) | | . | | | | | | $ 7,310,038 |
| Cash | | | | | | | | 51,769 |
| Receivable for investments sold | | | | | | | | 9,276 |
| Receivable for fund shares sold | | | | | | | | 18,311 |
| Interest receivable | | | | | | | | 47,458 |
| Prepaid expenses | | | | | | | | 19 |
| Receivable from investment adviser | | | | | | | | |
| for expense reductions | | | | | | | | 223 |
| Other receivables | | | | | | | | 146 |
| Total assets | | | | | | | | 7,437,240 |
| |
| Liabilities | | | | | | | | |
| Payable for investments purchased | | | | $ 18,641 | | | | |
| Payable for fund shares redeemed | | | | 15,276 | | | | |
| Distributions payable | | | | 6,354 | | | | |
| Accrued management fee | | | | 1,219 | | | | |
| Distribution fees payable | | | | 93 | | | | |
| Other affiliated payables | | | | 157 | | | | |
| Other payables and accrued | | | | | | | | |
| expenses | | | | 214 | | | | |
| Total liabilities | | | | | | | | 41,954 |
| |
| Net Assets | | | | | | | | $ 7,395,286 |
| Net Assets consist of: | | | | | | | | |
| Paid in capital | | | | | | | | $ 7,395,262 |
| Distributions in excess of net invest- | | | | | | | | |
| ment income | | | | | | | | (9) |
| Accumulated undistributed net real- | | | | | | | | |
| ized gain (loss) on investments | | | | | | | | 33 |
| Net Assets | | | | | | | | $ 7,395,286 |
| Class I: | | | | | | | | |
| Net Asset Value, offering price and | | | | | | | | |
| redemption price per share | | | | | | | | |
| ($6,599,470 ÷ 6,598,202 | | | | | | | | |
| shares) | | | | | | | | $ 1.00 |
| Class II: | | | | | | | | |
| Net Asset Value, offering price and | | | | | | | | |
| redemption price per share | | | | | | | | |
| ($181,577 ÷ 181,560 shares) | | | | | | | | $ 1.00 |
| Class III: | | | | | | | | |
| Net Asset Value, offering price and | | | | | | | | |
| redemption price per share | | | | | | | | |
| ($480,958 ÷ 480,909 shares) | | | | | | | | $ 1.00 |
| Select Class: | | | | | | | | |
| Net Asset Value, offering price and | | | | | | | | |
| redemption price per share | | | | | | | | |
| ($133,281 ÷ 133,236 shares) | | | | | | | | $ 1.00 |
| Statement of Operations | | | | |
| Amounts in thousands | | | | Year ended March 31, 2006 |
| |
| Investment Income | | | | | | |
| Interest | | | | | | $ 163,788 |
| Income from affiliated Central Funds | | | | 2,165 |
| Total income | | | | | | 165,953 |
| |
| Expenses | | | | | | |
| Management fee | | | | $ 11,970 | | |
| Transfer agent fees | | | | 883 | | |
| Distribution fees | | | | 1,025 | | |
| Accounting fees and expenses | | | | 535 | | |
| Independent trustees’ compensation | | | | 25 | | |
| Custodian fees and expenses | | | | 105 | | |
| Registration fees | | | | 432 | | |
| Audit | | | | 62 | | |
| Legal | | | | 13 | | |
| Miscellaneous | | | | 44 | | |
| Total expenses before reductions | | | | 15,094 | | |
| Expense reductions | | | | (3,512) | | 11,582 |
| |
| Net investment income | | | | | | 154,371 |
| Realized and Unrealized Gain | | | | | | |
| (Loss) | | | | | | |
| Net realized gain (loss) on: | | | | | | |
| Investment securities: | | | | | | |
| Unaffiliated issuers | | | | | | 141 |
| Net increase in net assets resulting | | | | | | |
| from operations | | | | | | $ 154,512 |
See accompanying notes which are an integral part of the financial statements.
| | |
| Annual Report | | 68 |
| Statement of Changes in Net Assets | | | | | | | | | | | | | | | | | | | | | | |
| | | | | | | | | | | | | | | Year ended | | | | Year ended |
| | | | | | | | | | | | | | | March 31, | | | | March 31, |
| Amounts in thousands | | | | | | | | | | | | | | 2006 | | | | 2005 |
| Increase (Decrease) in Net Assets | | | | | | | | | | | | | | | | | | | | | | |
| Operations | | | | | | | | | | | | | | | | | | | | | | |
| Net investment income | | | | | | | | | | | | | | | | $ 154,371 | | | | $ 59,744 |
| Net realized gain (loss) | | | | | | | | | | | | | | | | 141 | | | | | | 56 |
| Net increase in net assets resulting from operations | | | | | | | | | | | | | | | | 154,512 | | | | 59,800 |
| Distributions to shareholders from net investment income | | | | | | | | | | | | | | (154,344) | | | | (59,770) |
| Distributions to shareholders from net realized gain | | | | | | | | | | | | | | | | — | | | | | | (689) |
| Total distributions | | | | | | | | | | | | | | (154,344) | | | | (60,459) |
| Share transactions - net increase (decrease) | | | | | | | | | | | | | | 2,975,822 | | | | (67,722) |
| Total increase (decrease) in net assets | | | | | | | | | | | | | | 2,975,990 | | | | (68,381) |
| |
| Net Assets | | | | | | | | | | | | | | | | | | | | | | |
| Beginning of period | | | | | | | | | | | | | | 4,419,296 | | | | 4,487,677 |
| End of period (including distributions in excess of net investment income of $9 and distributions in excess of net | | | | | | | | | | | | |
| investment income of $16, respectively) | | | | | | | | | | | | | | $ 7,395,286 | | | | $ 4,419,296 |
| |
| Financial Highlights Class I | | | | | | | | | | | | | | | | | | | | | | |
| Years ended March 31, | | | | 2006 | | | | 2005 | | | | 2004 | | | | 2003 | | | | 2002 |
| Selected Per-Share Data | | | | | | | | | | | | | | | | | | | | | | |
| Net asset value, beginning of period | | | | $ 1.00 | | | | $ 1.00 | | | | $ 1.00 | | | | $ 1.00 | | | | | | $ 1.00 |
| Income from Investment Operations | | | | | | | | | | | | | | | | | | | | | | |
| Net investment income | | | | 026 | | | | .013 | | | | .009 | | | | .013 | | | | | | .022 |
| Net realized and unrealized gain (loss)C | | | | — | | | | — | | | | — | | | | — | | | | | | — |
| Total from investment operations | | | | 026 | | | | .013 | | | | .009 | | | | .013 | | | | | | .022 |
| Distributions from net investment income | | | | (.026) | | | | (.013) | | | | (.009) | | | | (.013) | | | | | | (.022) |
| Distributions from net realized gain | | | | — | | | | —C | | | | —C | | | | — | | | | | | — |
| Total distributions | | | | (.026) | | | | (.013) | | | | (.009) | | | | (.013) | | | | | | (.022) |
| Net asset value, end of period | | | | $ 1.00 | | | | $ 1.00 | | | | $ 1.00 | | | | $ 1.00 | | | | | | $ 1.00 |
| Total ReturnA | | | | 2.60% | | | | 1.30% | | | | .89% | | | | 1.30% | | | | | | 2.22% |
| Ratios to Average Net AssetsB | | | | | | | | | | | | | | | | | | | | | | |
| Expenses before reductions | | | | 24% | | | | .23% | | | | .23% | | | | .24% | | | | | | .23% |
| Expenses net of fee waivers, if any | | | | 20% | | | | .20% | | | | .20% | | | | .20% | | | | | | .20% |
| Expenses net of all reductions | | | | 18% | | | | .18% | | | | .19% | | | | .19% | | | | | | .18% |
| Net investment income | | | | 2.61% | | | | 1.28% | | | | .88% | | | | 1.28% | | | | | | 2.10% |
| Supplemental Data | | | | | | | | | | | | | | | | | | | | | | |
| Net assets, end of period (in millions) | | | | $ 6,599 | | | | $ 4,041 | | | | $ 4,044 | | | | $ 3,337 | | | | | | $ 2,753 |
A Total returns would have been lower had certain expenses not been reduced during the periods shown.
B Expense ratios reflect operating expenses of the class. Expenses before reductions do not reflect amounts reimbursed by the investment adviser or expense offset arrangements and do not represent the amount paid by the class during periods when reimbursements or
reductions occur. Expenses net of fee waivers reflect expenses after reimbursement by the investment adviser but prior to reductions from expense offset arrangements. Expenses net of all reductions represent the net expenses paid by the class.
C Amount represents less than $.001 per share.
|
See accompanying notes which are an integral part of the financial statements.
|
69 Annual Report
| Financial Highlights Class II | | | | | | | | | | | | | | | | | | |
| Years ended March 31, | | 2006 | | | | 2005 | | | | 2004 | | | | 2003 | | | | 2002 |
| Selected Per-Share Data | | | | | | | | | | | | | | | | | | |
| Net asset value, beginning of period | | $ 1.00 | | | | $ 1.00 | | | | $ 1.00 | | | | $ 1.00 | | | | $ 1.00 |
| Income from Investment Operations | | | | | | | | | | | | | | | | | | |
| Net investment income | | 024 | | | | .011 | | | | .007 | | | | .011 | | | | .020 |
| Net realized and unrealized gain (loss)C | | — | | | | — | | | | — | | | | — | | | | — |
| Total from investment operations | | 024 | | | | .011 | | | | .007 | | | | .011 | | | | .020 |
| Distributions from net investment income | | (.024) | | | | (.011) | | | | (.007) | | | | (.011) | | | | (.020) |
| Distributions from net realized gain | | — | | | | —C | | | | —C | | | | — | | | | — |
| Total distributions | | (.024) | | | | (.011) | | | | (.007) | | | | (.011) | | | | (.020) |
| Net asset value, end of period | | $ 1.00 | | | | $ 1.00 | | | | $ 1.00 | | | | $ 1.00 | | | | $ 1.00 |
| Total ReturnA | | 2.45% | | | | 1.15% | | | | .74% | | | | 1.15% | | | | 2.07% |
| Ratios to Average Net AssetsB | | | | | | | | | | | | | | | | | | |
| Expenses before reductions | | 39% | | | | .38% | | | | .38% | | | | .39% | | | | .38% |
| Expenses net of fee waivers, if any | | 35% | | | | .35% | | | | .35% | | | | .35% | | | | .35% |
| Expenses net of all reductions | | 33% | | | | .33% | | | | .34% | | | | .34% | | | | .33% |
| Net investment income | | 2.46% | | | | 1.13% | | | | .73% | | | | 1.13% | | | | 2.00% |
| Supplemental Data | | | | | | | | | | | | | | | | | | |
| Net assets, end of period (in millions) | | $ 182 | | | | $ 133 | | | | $ 220 | | | | $ 55 | | | | $ 44 |
A Total returns would have been lower had certain expenses not been reduced during the periods shown.
B Expense ratios reflect operating expenses of the class. Expenses before reductions do not reflect amounts reimbursed by the investment adviser or expense offset arrangements and do not represent the amount paid by the class during periods when
reimbursements or reductions occur. Expenses net of fee waivers reflect expenses after reimbursement by the investment adviser but prior to reductions from expense offset arrangements. Expenses net of all reductions represent the net expenses
paid by the class.
C Amount represents less than $.001 per share.
|
| Financial Highlights Class III | | | | | | | | | | | | | | | | | | |
| Years ended March 31, | | 2006 | | | | 2005 | | | | 2004 | | | | 2003 | | | | 2002 |
| Selected Per-Share Data | | | | | | | | | | | | | | | | | | |
| Net asset value, beginning of period | | $ 1.00 | | | | $ 1.00 | | | | $ 1.00 | | | | $ 1.00 | | | | $ 1.00 |
| Income from Investment Operations | | | | | | | | | | | | | | | | | | |
| Net investment income | | 023 | | | | .010 | | | | .006 | | | | .010 | | | | .019 |
| Net realized and unrealized gain (loss)C | | — | | | | — | | | | — | | | | — | | | | — |
| Total from investment operations | | 023 | | | | .010 | | | | .006 | | | | .010 | | | | .019 |
| Distributions from net investment income | | (.023) | | | | (.010) | | | | (.006) | | | | (.010) | | | | (.019) |
| Distributions from net realized gain | | — | | | | —C | | | | —C | | | | — | | | | — |
| Total distributions | | (.023) | | | | (.010) | | | | (.006) | | | | (.010) | | | | (.019) |
| Net asset value, end of period | | $ 1.00 | | | | $ 1.00 | | | | $ 1.00 | | | | $ 1.00 | | | | $ 1.00 |
| Total ReturnA | | 2.35% | | | | 1.05% | | | | .64% | | | | 1.05% | | | | 1.96% |
| Ratios to Average Net AssetsB | | | | | | | | | | | | | | | | | | |
| Expenses before reductions | | 49% | | | | .48% | | | | .48% | | | | .49% | | | | .48% |
| Expenses net of fee waivers, if any | | 45% | | | | .45% | | | | .45% | | | | .45% | | | | .45% |
| Expenses net of all reductions | | 43% | | | | .43% | | | | .44% | | | | .44% | | | | .43% |
| Net investment income | | 2.36% | | | | 1.03% | | | | .63% | | | | 1.02% | | | | 1.87% |
| Supplemental Data | | | | | | | | | | | | | | | | | | |
| Net assets, end of period (in millions) | | $ 481 | | | | $ 174 | | | | $ 162 | | | | $ 123 | | | | $ 113 |
A Total returns would have been lower had certain expenses not been reduced during the periods shown.
B Expense ratios reflect operating expenses of the class. Expenses before reductions do not reflect amounts reimbursed by the investment adviser or expense offset arrangements and do not represent the amount paid by the class during periods when
reimbursements or reductions occur. Expenses net of fee waivers reflect expenses after reimbursement by the investment adviser but prior to reductions from expense offset arrangements. Expenses net of all reductions represent the net expenses
paid by the class.
C Amount represents less than $.001 per share.
|
See accompanying notes which are an integral part of the financial statements.
| | |
| Annual Report | | 70 |
| Financial Highlights Select Class | | | | | | | | | | | | | | | | | | |
| Years ended March 31, | | 2006 | | | | 2005 | | | | 2004 | | | | 2003 | | | | 2002D |
| Selected Per-Share Data | | | | | | | | | | | | | | | | | | |
| Net asset value, beginning of period | | $ 1.00 | | | | $ 1.00 | | | | $ 1.00 | | | | $ 1.00 | | | | $ 1.00 |
| Income from Investment Operations | | | | | | | | | | | | | | | | | | |
| Net investment income | | 025 | | | | .012 | | | | .008 | | | | .012 | | | | .003 |
| Net realized and unrealized gain (loss)F | | — | | | | — | | | | — | | | | — | | | | — |
| Total from investment operations | | 025 | | | | .012 | | | | .008 | | | | .012 | | | | .003 |
| Distributions from net investment income | | (.025) | | | | (.012) | | | | (.008) | | | | (.012) | | | | (.003) |
| Distributions from net realized gain | | — | | | | —F | | | | —F | | | | — | | | | — |
| Total distributions | | (.025) | | | | (.012) | | | | (.008) | | | | (.012) | | | | (.003) |
| Net asset value, end of period | | $ 1.00 | | | | $ 1.00 | | | | $ 1.00 | | | | $ 1.00 | | | | $ 1.00 |
| Total ReturnB,C | | 2.55% | | | | 1.25% | | | | .84% | | | | 1.24% | | | | .26% |
| Ratios to Average Net AssetsE | | | | | | | | | | | | | | | | | | |
| Expenses before reductions | | 29% | | | | .28% | | | | .28% | | | | .29% | | | | .28%A |
| Expenses net of fee waivers, if any | | 25% | | | | .25% | | | | .25% | | | | .25% | | | | .25%A |
| Expenses net of all reductions | | 23% | | | | .23% | | | | .24% | | | | .24% | | | | .23%A |
| Net investment income | | 2.56% | | | | 1.23% | | | | .83% | | | | 1.23% | | | | 1.32%A |
| Supplemental Data | | | | | | | | | | | | | | | | | | |
| Net assets, end of period (000 omitted) | | $ 133,281 | | | | $ 71,516 | | | | $ 61,925 | | | | $ 103,950 | | | | $ 100 |
A Annualized
B Total returns for periods of less than one year are not annualized.
C Total returns would have been lower had certain expenses not been reduced during the periods shown.
D For the period January 17, 2002 (commencement of sale of shares) to March 31, 2002.
E Expense ratios reflect operating expenses of the class. Expenses before reductions do not reflect amounts reimbursed by the investment adviser or expense offset arrangements and do not represent the amount paid by the class during periods when
reimbursements or reductions occur. Expense ratios before reductions for start up periods may not be representative of longer term operating periods. Expenses net of fee waivers reflect expenses after reimbursement by the investment adviser but
prior to reductions from expense offset arrangements. Expenses net of all reductions represent the net expenses paid by the class.
F Amount represents less than $.001 per share.
|
See accompanying notes which are an integral part of the financial statements.
|
71 Annual Report
| Notes to Financial Statements |
| For the period ended March 31, 2006 |
| (Amounts in thousands except ratios) |
| |
| 1. Significant Accounting Policies. |
Treasury Only Portfolio, Treasury Portfolio, Government Portfolio, Prime Money Market Portfolio, Money Market Portfolio and Tax Exempt Portfolio (the funds) are funds of Fidelity Colchester Street Trust (the trust) (formerly Colchester Street Trust). Each fund is authorized to issue an unlimited number of shares. The trust is registered under the Investment Company Act of 1940, as amended (the 1940 Act), as an open end management invest ment company organized as a Delaware statutory trust.
Each fund offers Class I, Class II, and Class III and Select Class shares, each of which has equal rights as to assets and voting privileges. Each class has exclusive voting rights with respect to matters that affect that class. Investment income, realized and unrealized capital gains and losses, the common expenses of the fund, and certain fund level expense reductions, if any, are allocated on a pro rata basis to each class based on the relative net assets of each class to the total net assets of each fund. Each class differs with respect to transfer agent and distribution and service plan fees incurred. Certain expense reductions also differ by class. Certain funds may invest in affiliated money market central funds (Money Market Central Funds), which are open end investment companies available to investment companies and other accounts managed by Fidelity Management & Research Company (FMR) and its affiliates. The financial statements have been prepared in conformity with accounting principles generally accepted in the United States of America, which require management to make certain estimates and assumptions at the date of the financial statements. The following summarizes the significant accounting policies of the funds:
Security Valuation. As permitted by compliance with certain conditions under Rule 2a 7 of the 1940 Act, securities are valued at amortized cost, which approximates value. Investments in open end mutual funds are valued at their closing net asset value each business day.
Investment Transactions and Income. Security transactions are accounted for as of trade date. Gains and losses on securities sold are determined on the basis of identified cost. Interest income is accrued as earned. Interest income includes coupon interest and amortization of premium and accretion of discount on debt securities.
Expenses. Most expenses of the trust can be directly attributed to a fund. Expenses which cannot be directly attributed are apportioned among each fund in the trust.
Deferred Trustee Compensation. Under a Deferred Compensation Plan (the Plan) for Government Portfolio and Money Market Portfolio, indepen dent Trustees must defer receipt of a portion of, and may elect to defer receipt of an additional portion of, their annual compensation. Deferred amounts are treated as though equivalent dollar amounts had been invested in shares of each applicable fund or are invested in a cross section of other Fidelity money market funds, and are marked to market. Deferred amounts remain in the fund until distributed in accordance with the Plan.
Income Tax Information and Distributions to Shareholders. Each year, each fund intends to qualify as a regulated investment company by distributing all of its taxable income and realized gains under Subchapter M of the Internal Revenue Code. As a result, no provision for income taxes is required in the accompanying financial statements.
Dividends are declared daily and paid monthly from net investment income. Distributions from realized gains, if any, are recorded on the ex dividend date. Income dividends and capital gain distributions are declared separately for each class. Income and capital gain distributions are determined in accordance with income tax regulations, which may differ from generally accepted accounting principles. In addition, certain funds will claim a portion of the payment made to redeeming shareholders as a distribution for income tax purposes.
Capital accounts within the financial statements are adjusted for permanent book tax differences. These adjustments have no impact on net assets or the results of operations. Temporary book tax differences will reverse in a subsequent period.
Book tax differences are primarily due to deferred trustees compensation, capital loss carryforwards and losses deferred due to wash sales and excise tax regulations.
The Tax Exempt Portfolio purchases municipal securities whose interest, in the opinion of the issuer, is free from federal income tax. There is no assurance that the Internal Revenue Service (IRS) will agree with this opinion. In the event the IRS determines that the issuer does not comply with relevant tax requirements, interest payments from a security could become federally taxable, possibly retroactively to the date the security was issued.
| The tax basis components of distributable earnings and the federal tax cost as of period end were as follows for each fund: | | | | |
| |
| | | Cost for Federal | | | | | | | | | | Net Unrealized Appreciation/ |
| | | Income Tax Purposes | | | | Unrealized Appreciation | | | | Unrealized Depreciation | | (Depreciation) |
| Treasury Only Portfolio | | $ 1,285,723 | | | | $ — | | | | $ — | | | | $ — |
| Treasury Portfolio | | 8,219,102 | | | | — | | | | — | | | | — |
| Government Portfolio | | 6,953,262 | | | | — | | | | — | | | | — |
| Prime Money Market Portfolio | | 13,222,969 | | | | — | | | | — | | | | — |
| Money Market Portfolio | | 20,447,651 | | | | — | | | | — | | | | — |
| Tax Exempt Portfolio | | 7,310,038 | | | | — | | | | — | | | | — |
| 1. Significant Accounting Policies continued | | | | | | | | | | |
| |
| Income Tax Information and Distributions to Shareholders continued | | | | | | | | |
| |
| | | | | | | | | Undistributed | | Undistributed | | Capital Loss |
| | | | | | | | | Ordinary Income | | Long-term Capital Gain | | Carryforward |
| Treasury Only Portfolio | | | | | | | | $ 121 | | | | $ — | | $ 433 |
| Treasury Portfolio | | | | | | | | 80 | | | | — | | 660 |
| Government Portfolio | | | | | | | | 42 | | | | — | | 555 |
| Prime Money Market Portfolio | | | | | | | | 38 | | | | — | | 1,353 |
| Money Market Portfolio | | | | | | | | 196 | | | | — | | 3,944 |
| Tax Exempt Portfolio | | | | | | | | 174 | | | | — | | 141 |
| |
| The tax character of distributions paid was as follows: | | | | | | | | | | |
| |
| March 31, 2006 | | | | | | | | | | | | | | |
| | | | | Ordinary Income | | Long-term Capital Gains | | Return of Capital | | Total |
| Treasury Only Portfolio | | | | 37,981 | | | | $ — | | | | $ — | | $ 37,981 |
| Treasury Portfolio | | | | 282,242 | | | | — | | | | — | | 282,242 |
| Government Portfolio | | | | 235,235 | | | | — | | | | — | | 235,235 |
| Prime Money Market Portfolio | | | | 405,498 | | | | — | | | | — | | 405,498 |
| Money Market Portfolio | | | | 581,650 | | | | — | | | | — | | 581,650 |
| Tax Exempt Portfolio | | | | 154,344 | | | | — | | | | — | | 154,344 |
| |
| March 31, 2005 | | | | | | | | | | | | | | |
| | | | | Ordinary Income | | Long-term Capital Gains | | Return of Capital | | Total |
| Treasury Only Portfolio | | | | $ 16,110�� | | | | $ — | | | | $ — | | $ 16,110 |
| Treasury Portfolio | | | | 116,452 | | | | — | | | | — | | 116,452 |
| Government Portfolio | | | | 106,199 | | | | — | | | | — | | 106,199 |
| Prime Money Market Portfolio | | | | 141,941 | | | | — | | | | — | | 141,941 |
| Money Market Portfolio | | | | 267,263 | | | | — | | | | — | | 267,263 |
| Tax Exempt Portfolio | | | | 59,781 | | | | 678 | | | | — | | 60,459 |
| |
| 2. Operating Policies. | | | | | | | | | | | | | | |
Repurchase Agreements. FMR has received an Exemptive Order from the Securities and Exchange Commission (the SEC) which permits certain funds and other affiliated entities of FMR to transfer uninvested cash balances into joint trading accounts which are then invested in repurchase agreements. Certain funds may also invest directly with institutions in repurchase agreements. Repurchase agreements are collateralized by government or non government securities. Upon settlement date, collateral is held in segregated accounts with custodian banks and may be obtained in the event of a default of the counterparty. Each applicable fund monitors, on a daily basis, the value of the collateral to ensure it is at least equal to the principal amount of the repurchase agreement (including accrued interest). In the event of a default by the counterparty, realization of the collateral proceeds could be delayed, during which time the value of the collateral may decline.
Restricted Securities. Certain funds may invest in securities that are subject to legal or contractual restrictions on resale. These securities generally may be resold in transactions exempt from registration or to the public if the securities are registered. Disposal of these securities may involve time consuming negotiations and expense, and prompt sale at an acceptable price may be difficult. Information regarding restricted securities is included at the end of each applicable fund’s Schedule of Investments.
Note Purchase Agreements. Tax Exempt Portfolio, together with other affiliated funds, had entered into an agreement representing a commitment to purchase specific notes prior to their issuance. Based on the terms of the agreement, the fund committed to purchase up to $12,028 of notes with a floating rate coupon based on an Index Rate as defined in the agreement and maturing on August 31, 2006.
Payment for the notes is not required and interest does not accrue until the delivery date. The obligation of the fund to purchase these notes is contin gent upon no material adverse changes in the credit quality of the issuer. The issuer may submit a request to the fund to purchase up to the maximum principal amount of the note. The fund does not record a portfolio holding or any entries to its records until the notes are purchased. The notes are subject to market value fluctuations and there is risk the securities will not be issued as anticipated.
According to the terms of the agreement, the issuer may not request a purchase after February 1, 2006, effectively terminating any obligation of the fund to purchase the notes. At period end, the fund had no obligation to purchase any notes.
73 Annual Report
| Notes to Financial Statements continued |
| (Amounts in thousands except ratios) |
| |
| |
| 3. Fees and Other Transactions with Affiliates. |
Management Fee. FMR and its affiliates provide the funds with investment management related services for which the funds pay a monthly manage ment fee that is based on an annual rate of .20% of average net assets.
Distribution and Service Plan. In accordance with Rule 12b 1 of the 1940 Act, the funds have adopted separate Distribution and Service Plans for Class II, Class III and Select Class shares. Class II, Class III and Select Class of each fund pays Fidelity Distributors Corporation (FDC), an affiliate of FMR, a Service fee based on an annual percentage of each class’ average net assets. In addition, FDC may pay financial intermediaries for selling shares of the funds and providing shareholder support services. For the period, the Service fee rates were as follows:
| Class II | | | | | | 15% | | |
| Class III | | | | | | 25% | | |
| Select Class | | | | | | 05% | | |
| |
| The following amounts were paid to and retained by FDC: | | | | | | | | |
| | | | | Paid to | | Retained |
| | | | | FDC | | by FDC |
| Treasury Only Portfolio: | | | | | | | | |
| Class II | | | | $ 194 | | | | $ 1 |
| Class III | | | | 395 | | | | — |
| Select Class | | | | 11 | | | | — |
| | | | | $ 600 | | | | $ 1 |
| Treasury Portfolio: | | | | | | | | |
| Class II | | | | $ 395 | | | | $ 5 |
| Class III | | | | 8,109 | | | | 3 |
| Select Class | | | | 67 | | | | — |
| | | | | $ 8,571 | | | | $ 8 |
| Government Portfolio: | | | | | | | | |
| Class II | | | | $ 737 | | | | $ 6 |
| Class III | | | | 1,763 | | | | 2 |
| Select Class | | | | 18 | | | | — |
| | | | | $ 2,518 | | | | $ 8 |
| Prime Money Market Portfolio: | | | | | | | | |
| Class II | | | | $ 1,369 | | | | $ 7 |
| Class III | | | | 4,314 | | | | 29 |
| Select Class | | | | 63 | | | | 6 |
| | | | | $ 5,746 | | | | $ 42 |
| Money Market Portfolio: | | | | | | | | |
| Class II | | | | $ 363 | | | | $ 9 |
| Class III | | | | 2,397 | | | | 3 |
| Select Class | | | | 39 | | | | — |
| | | | | $ 2,799 | | | | $ 12 |
| Tax Exempt Portfolio: | | | | | | | | |
| Class II | | | | $ 258 | | | | $ — |
| Class III | | | | 720 | | | | — |
| Select Class | | | | 47 | | | | — |
| | | | | $ 1,025 | | | | $ — |
3. Fees and Other Transactions with Affiliates continued
Transfer Agent Fees. Fidelity Investments Institutional Operations Company, Inc. (FIIOC), an affiliate of FMR, is the transfer, dividend disbursing and shareholder servicing agent for the funds except for Tax Exempt Portfolio. Citibank, N.A. (Citibank) is the custodian, transfer and shareholder servicing agent for Tax Exempt Portfolio. Citibank has entered into a sub arrangement with FIIOC to perform the activities associated with the transfer and shareholder servicing agent functions for Tax Exempt Portfolio. FIIOC receives asset based fees with respect to each account. FIIOC pays for typesetting, printing and mailing of all shareholder reports, except proxy statements. Each class pays a transfer agent fee equal to an annual rate of ..015% of their month end net assets. For the period the total transfer agent fees paid by each class to FIIOC were as follows.
| Treasury Only Portfolio | | Class I | | | | | | $ 155 |
| Treasury Only Portfolio | | Class II | | | | | | 21 |
| Treasury Only Portfolio | | Class III | | | | | | 29 |
| Treasury Only Portfolio | | Select Class | | | | 3 |
| | | | | | | | | | | | | $ 208 |
| Treasury Portfolio | | Class I | | | | | | $ 749 |
| Treasury Portfolio | | Class II | | | | | | 33 |
| Treasury Portfolio | | Class III | | | | | | 515 |
| Treasury Portfolio | | Select Class | | | | | | 27 |
| | | | | | | | | | | | | $ 1,324 |
| Government Portfolio | | | | Class I | | | | | | $ 875 |
| Government Portfolio | | | | Class II | | | | | | 95 |
| Government Portfolio | | | | Class III | | | | | | 121 |
| Government Portfolio | | | | Select Class | | | | 5 |
| | | | | | | | | | | | | $ 1,096 |
| Prime Money Market Portfolio | | Class I | | | | $ 1,328 |
| Prime Money Market Portfolio | | Class II | | | | 155 |
| Prime Money Market Portfolio | | Class III | | | | 282 |
| Prime Money Market Portfolio | | Select Class | | | | 19 |
| | | | | | | | | | | | | $ 1,784 |
| Money Market Portfolio | | Class I | | | | $ 2,269 |
| Money Market Portfolio | | Class II | | | | 42 |
| Money Market Portfolio | | Class III | | | | 152 |
| Money Market Portfolio | | Select Class | | | | 21 |
| | | | | | | | | | | | | $ 2,484 |
| Tax Exempt Portfolio | | Class I | | | | | | $ 800 |
| Tax Exempt Portfolio | | Class II | | | | | | 26 |
| Tax Exempt Portfolio | | Class III | | | | | | 43 |
| Tax Exempt Portfolio | | Select Class | | | | 14 |
| | | | | | | | | | | | | $ 883 |
Accounting Fees. Fidelity Service Company, Inc. (FSC), an affiliate of FMR, maintains the accounting records for the funds except for Tax Exempt Portfolio. Citibank has entered into a sub arrangement with FSC to maintain Tax Exempt Portfolio’s accounting records. The fee is based on the level of average net assets for the month.
Affiliated Central Funds. Certain funds may invest in Money Market Central Funds which seek preservation of capital and current income and are managed by Fidelity Investments Money Management, Inc. (FIMM) an affiliate of FMR.
The Money Market Central Funds do not pay a management fee.
|
75 Annual Report
| Notes to Financial Statements continued | | |
| (Amounts in thousands except ratios) | | |
| |
| |
| 3. Fees and Other Transactions with Affiliates continued |
Interfund Lending Program. Pursuant to an Exemptive Order issued by the SEC, the funds, along with other registered investment companies having management contracts with FMR, may participate in an interfund lending program. This program provides an alternative credit facility allowing the funds to borrow from, or lend money to, other participating affiliated funds. At period end, there were no interfund loans outstanding. Each applica ble fund’s activity in this program during the period for which loans were outstanding was as follows:
| | | Borrower | | Average Daily | | Weighted Average |
| | | or Lender | | Loan Balance | | Interest Rate |
| Prime Money Market Portfolio | | Lender | | 154,832 | | 3.55% |
| Money Market Portfolio | | Lender | | 47,175 | | 3.73% |
| |
| 4. Expense Reductions. | | | | | | |
FMR voluntarily agreed to reimburse funds to the extent annual operating expenses exceeded certain levels of average net assets as noted in the table below. Some expenses, for example interest expense, are excluded from this reimbursement.
The following classes of each applicable fund were in reimbursement during the period:
| | | Expense | | Reimbursement |
| | | Limitations | | from adviser |
| Treasury Only Portfolio | | | | | | |
| Class I | | 20% | | | | $ 358 |
| Class II | | 35% | | | | 52 |
| Class III | | 45% | | | | 67 |
| Select Class | | 25% | | | | 8 |
| Treasury Portfolio | | | | | | |
| Class I | | 20% | | | | $ 1,326 |
| Class II | | 35% | | | | 71 |
| Class III | | 45% | | | | 917 |
| Select Class | | .25% | | | | 44 |
| Government Portfolio | | | | | | |
| Class I | | 20% | | | | $ 1,616 |
| Class II | | 35% | | | | 168 |
| Class III | | 45% | | | | 217 |
| Select Class | | 25% | | | | 10 |
| Prime Money Market Portfolio | | | | | | |
| Class I | | 20% | | | | $ 2,531 |
| Class II | | 35% | | | | 287 |
| Class III | | 45% | | | | 566 |
| Select Class | | 25% | | | | 36 |
| Money Market Portfolio | | | | | | |
| Class I | | 18% | | | | $ 7,066 |
| Class II | | 33% | | | | 128 |
| Class III | | 43% | | | | 472 |
| Select Class | | 23% | | | | 45 |
| Tax Exempt Portfolio | | | | | | |
| Class I | | 20% | | | | $ 1,985 |
| Class II | | 35% | | | | 62 |
| Class III | | 45% | | | | 104 |
| Select Class | | 25% | | | | 35 |
4. Expense Reductions - continued
|
In addition, through arrangements with each applicable fund’s custodian, credits realized as a result of uninvested cash balances were used to reduce each fund’s expenses. All of the applicable expense reductions are noted in the table below.
| | | Custody | | Transfer Agent | | | | Accounting |
| | | expense | | expense | | | | expense |
| | | reduction | | reduction | | | | reduction |
| Treasury Only Portfolio | | | | $ 8 | | | | $ — | | | | $ — |
| Government Portfolio | | | | 8 | | | | — | | | | — |
| Prime Money Market Portfolio | | | | 15 | | | | — | | | | — |
| Money Market Portfolio | | | | 20 | | | | — | | | | — |
| Tax Exempt Portfolio | | | | 105 | | | | — | | | | 535 |
| Class I | | | | | | | | 626 | | | | |
| Class II | | | | | | | | 20 | | | | |
| Class III | | | | | | | | 30 | | | | |
| Select Class | | | | | | | | 10 | | | | |
| |
| 5. Other. | | | | | | | | | | | | |
The funds’ organizational documents provide former and current trustees and officers with a limited indemnification against liabilities arising in connection with the performance of their duties to the funds. In the normal course of business, the funds may also enter into contracts that provide general indemnifications. The funds’ maximum exposure under these arrangements is unknown as this would be dependent on future claims that may be made against the funds. The risk of material loss from such claims is considered remote.
| 6. Distributions to Shareholders. | | | | | | |
| |
Distributions to shareholders of each class were as follows:
| | | | | | |
| | | Years ended March 31, |
| From net investment income | | 2006 | | | | 2005 |
| Treasury Only Portfolio — Class I | | $ 28,442 | | | | $ 12,300 |
| Treasury Only Portfolio — Class II | | 4,034 | | | | 2,015 |
| Treasury Only Portfolio — Class III | | 4,795 | | | | 1,488 |
| Treasury Only Portfolio — Select Class | | 710 | | | | 197 |
| Total | | $ 37,981 | | | | $ 16,000 |
| Treasury Portfolio — Class I | | $ 162,681 | | | | $ 68,752 |
| Treasury Portfolio — Class II | | 9,167 | | | | 2,873 |
| Treasury Portfolio — Class III | | 105,396 | | | | 43,620 |
| Treasury Portfolio — Select Class | | 4,998 | | | | 1,207 |
| Total | | $ 282,242 | | | | $ 116,452 |
| Government Portfolio — Class I | | $ 193,639 | | | | $ 87,026 |
| Government Portfolio — Class II | | 16,703 | | | | 9,036 |
| Government Portfolio — Class III | | 23,668 | | | | 9,532 |
| Government Portfolio — Select Class | | 1,225 | | | | 605 |
| Total | | $ 235,235 | | | | $ 106,199 |
| Prime Money Market Portfolio — Class I | | $ 308,722 | | | | $ 118,085 |
| Prime Money Market Portfolio — Class II | | 31,875 | | | | 7,809 |
| Prime Money Market Portfolio — Class III | | 60,285 | | | | 14,479 |
| Prime Money Market Portfolio — Select Class | | 4,616 | | | | 1,568 |
| Total | | $ 405,498 | | | | $ 141,941 |
| Money Market Portfolio — Class I | | $ 537,565 | | | | $ 243,040 |
| Money Market Portfolio — Class II | | 8,646 | | | | 3,050 |
| Money Market Portfolio — Class III | | 32,269 | | | | 20,187 |
| Money Market Portfolio — Select Class | | 3,170 | | | | 986 |
| Total | | $ 581,650 | | | | $ 267,263 |
| Tax Exempt Portfolio — Class I | | $ 141,027 | | | | $ 55,857 |
| Tax Exempt Portfolio — Class II | | 4,157 | | | | 1,649 |
| Tax Exempt Portfolio — Class III | | 6,773 | | | | 1,534 |
| Tax Exempt Portfolio — Select Class | | 2,387 | | | | 730 |
| Total | | $ 154,344 | | | | $ 59,770 |
77 Annual Report
| Notes to Financial Statements continued | | | | | | |
| (Amounts in thousands except ratios) | | | | | | | | |
| |
| |
| 6. Distributions to Shareholders - continued | | | | | | |
| |
| | | | | | | Years ended March 31, |
| From net realized gain | | | | | | 2006 | | 2005 |
| Treasury Only Portfolio — Class I | | | | | | $ — | | $ 81 |
| Treasury Only Portfolio — Class II | | | | | | — | | 17 |
| Treasury Only Portfolio — Class III | | | | | | — | | 11 |
| Treasury Only Portfolio — Select Class | | | | | | — | | 1 |
| Total | | | | | | $ — | | $ 110 |
| Tax Exempt Portfolio — Class I | | | | | | $ — | | $ 632 |
| Tax Exempt Portfolio — Class II | | | | | | — | | 30 |
| Tax Exempt Portfolio — Class III | | | | | | — | | 21 |
| Tax Exempt Portfolio — Select Class | | | | | | — | | 6 |
| Total | | | | | | $ — | | $ 689 |
| |
| 7. Share Transactions. | | | | | | | | |
| |
| Transactions for each class of shares were as follows: | | | | | | |
| |
| | | | | | | Years ended March 31, |
| | | | | | | 2006 | | 2005 |
| Treasury Only Portfolio Class I | | | | | | | | |
| Shares sold | | | | | | 2,672,159 | | 2,485,684 |
| Reinvestment of distributions | | | | | | 14,441 | | 6,060 |
| Shares redeemed | | | | | | (2,466,992) | | (2,637,820) |
| Net increase (decrease) | | | | | | 219,608 | | (146,076) |
| Treasury Only Portfolio Class II | | | | | | | | |
| Shares sold | | | | | | 879,121 | | 1,040,533 |
| Reinvestment of distributions | | | | | | 2,546 | | 1,433 |
| Shares redeemed | | | | | | (901,561) | | (1,039,710) |
| Net increase (decrease) | | | | | | (19,894) | | 2,256 |
| Treasury Only Portfolio Class III | | | | | | | | |
| Shares sold | | | | | | 1,009,693 | | 852,925 |
| Reinvestment of distributions | | | | | | 2,292 | | 901 |
| Shares redeemed | | | | | | (1,027,772) | | (844,270) |
| Net increase (decrease) | | | | | | (15,787) | | 9,556 |
| Treasury Only Portfolio Select Class | | | | | | | | |
| Shares sold | | | | | | 176,797 | | 76,340 |
| Reinvestment of distributions | | | | | | 694 | | 161 |
| Shares redeemed | | | | | | (156,338) | | (70,927) |
| Net increase (decrease) | | | | | | 21,153 | | 5,574 |
| Treasury Portfolio Class I | | | | | | | | |
| Shares sold | | | | | | 53,660,435 | | 51,904,178 |
| Reinvestment of distributions | | | | | | 63,195 | | 30,037 |
| Shares redeemed | | | | | | (54,774,564) | | (51,152,946) |
| Net increase (decrease) | | | | | | (1,050,934) | | 781,269 |
| Treasury Portfolio Class II | | | | | | | | |
| Shares sold | | | | | | 5,263,693 | | 2,039,525 |
| Reinvestment of distributions | | | | | | 5,120 | | 814 |
| Shares redeemed | | | | | | (5,117,769) | | (2,091,843) |
| Net increase (decrease) | | | | | | 151,044 | | (51,504) |
| Treasury Portfolio Class III | | | | | | | | |
| Shares sold | | | | | | 14,278,600 | | 13,933,326 |
| Reinvestment of distributions | | | | | | 17,090 | | 10,308 |
| Shares redeemed | | | | | | (14,435,787) | | (14,635,473) |
| Net increase (decrease) | | | | | | (140,097) | | (691,839) |
| 7. Share Transactions - continued | | | | |
| |
| | | | | | | Years ended March 31, |
| | | | | | | 2006 | | 2005 |
| Treasury Portfolio Select Class | | | | |
| Shares sold | | | | | | 973,672 | | 1,097,946 |
| Reinvestment of distributions | | | | | | 530 | | 87 |
| Shares redeemed | | | | | | (786,494) | | (1,117,315) |
| Net increase (decrease) | | | | | | 187,708 | | (19,282) |
| Government Portfolio Class I | | | | |
| Shares sold | | | | | | 39,313,704 | | 43,403,247 |
| Reinvestment of distributions | | | | | | 99,844 | | 52,121 |
| Shares redeemed | | | | | | (39,746,261) | | (43,889,206) |
| Net increase (decrease) | | | | | | (332,713) | | (433,838) |
| Government Portfolio Class II | | | | |
| Shares sold | | | | | | 6,354,015 | | 4,616,517 |
| Reinvestment of distributions | | | | | | 10,386 | | 5,622 |
| Shares redeemed | | | | | | (5,930,415) | | (4,981,800) |
| Net increase (decrease) | | | | | | 433,986 | | (359,661) |
| Government Portfolio Class III | | | | |
| Shares sold | | | | | | 4,263,296 | | 4,264,565 |
| Reinvestment of distributions | | | | | | 11,035 | | 4,835 |
| Shares redeemed | | | | | | (4,119,189) | | (4,805,917) |
| Net increase (decrease) | | | | | | 155,142 | | (536,517) |
| Government Portfolio Select Class | | | | |
| Shares sold | | | | | | 62,533 | | 112,420 |
| Reinvestment of distributions | | | | | | 365 | | 167 |
| Shares redeemed | | | | | | (83,236) | | (102,342) |
| Net increase (decrease) | | | | | | (20,338) | | 10,245 |
| Prime Money Market Portfolio Class I | | | | |
| Shares sold | | | | | | 83,651,111 | | 73,120,217 |
| Reinvestment of distributions | | | | | | 181,344 | | 67,152 |
| Shares redeemed | | | | | | (83,171,861) | | (71,181,838) |
| Net increase (decrease) | | | | | | 660,594 | | 2,005,531 |
| Prime Money Market Portfolio Class II | | | | |
| Shares sold | | | | | | 10,856,595 | | 5,186,383 |
| Reinvestment of distributions | | | | | | 28,956 | | 7,187 |
| Shares redeemed | | | | | | (9,840,786) | | (4,708,454) |
| Net increase (decrease) | | | | | | 1,044,765 | | 485,116 |
| Prime Money Market Portfolio Class III | | | | |
| Shares sold | | | | | | 17,190,930 | | 10,832,357 |
| Reinvestment of distributions | | | | | | 25,945 | | 12,177 |
| Shares redeemed | | | | | | (15,790,993) | | (10,618,552) |
| Net increase (decrease) | | | | | | 1,425,882 | | 225,982 |
| Prime Money Market Portfolio Select Class | | | | |
| Shares sold | | | | | | 509,980 | | 437,478 |
| Reinvestment of distributions | | | | | | 2,323 | | 828 |
| Shares redeemed | | | | | | (487,062) | | (446,148) |
| Net increase (decrease) | | | | | | 25,241 | | (7,842) |
| Money Market Portfolio Class I | | | | |
| Shares sold | | | | | | 113,995,603 | | 83,014,930 |
| Reinvestment of distributions | | | | | | 383,588 | | 162,686 |
| Shares redeemed | | | | | | (106,920,173) | | (90,627,460) |
| Net increase (decrease) | | | | | | 7,459,018 | | (7,449,844) |
| Money Market Portfolio Class II | | | | |
| Shares sold | | | | | | 3,216,512 | | 2,724,611 |
| Reinvestment of distributions | | | | | | 7,784 | | 2,901 |
| Shares redeemed | | | | | | (3,073,264) | | (2,819,596) |
| Net increase (decrease) | | | | | | 151,032 | | (92,084) |
79 Annual Report
| Notes to Financial Statements continued | | | | |
| (Amounts in thousands except ratios) | | | | |
| |
| |
| 7. Share Transactions - continued | | | | |
| |
| | | | | Years ended March 31, |
| | | | | 2006 | | 2005 |
| Money Market Portfolio Class III | | | | |
| Shares sold | | | | 14,324,194 | | 9,798,088 |
| Reinvestment of distributions | | | | 17,810 | | 4,956 |
| Shares redeemed | | | | (14,194,428) | | (9,333,022) |
| Net increase (decrease) | | | | 147,576 | | 470,022 |
| Money Market Portfolio Select Class | | | | |
| Shares sold | | | | 4,833,631 | | 2,376,845 |
| Reinvestment of distributions | | | | 792 | | 648 |
| Shares redeemed | | | | (4,709,591) | | (2,522,702) |
| Net increase (decrease) | | | | 124,832 | | (145,209) |
| Tax Exempt Portfolio Class I | | | | |
| Shares sold | | | | 30,545,107 | | 20,028,084 |
| Reinvestment of distributions | | | | 83,773 | | 33,465 |
| Shares redeemed | | | | (28,070,335) | | (20,063,770) |
| Net increase (decrease) | | | | 2,558,545 | | (2,221) |
| Tax Exempt Portfolio Class II | | | | |
| Shares sold | | | | 1,055,617 | | 800,247 |
| Reinvestment of distributions | | | | 2,579 | | 1,065 |
| Shares redeemed | | | | (1,009,916) | | (887,794) |
| Net increase (decrease) | | | | 48,280 | | (86,482) |
| Tax Exempt Portfolio Class III | | | | |
| Shares sold | | | | 1,827,148 | | 704,243 |
| Reinvestment of distributions | | | | 4,137 | | 1,123 |
| Shares redeemed | | | | (1,524,034) | | (693,982) |
| Net increase (decrease) | | | | 307,251 | | 11,384 |
| Tax Exempt Portfolio Select Class | | | | |
| Shares sold | | | | 1,213,766 | | 916,879 |
| Reinvestment of distributions | | | | 1,674 | | 490 |
| Shares redeemed | | | | (1,153,694) | | (907,772) |
| Net increase (decrease) | | | | 61,746 | | 9,597 |
Report of Independent Registered Public Accounting Firm
To the Trustees of Fidelity Colchester Street Trust (formerly Colchester Street Trust) and Shareholders of Treasury Only Portfolio, Treasury Portfolio, Government Portfolio, Prime Money Market Portfolio, Money Market Portfolio and Tax Exempt Portfolio:
We have audited the accompanying statements of assets and liabilities of Treasury Only Portfolio, Treasury Portfolio, Government Portfolio, Prime Money Market Portfolio, Money Market Portfolio and Tax Exempt Portfolio(the Funds), each a fund of Fidelity Colchester Street Trust (formerly Colchester Street Trust), including the schedules of investments as of March 31, 2006, and the related statements of operations for the year then ended, the statements of changes in net assets for each of the two years in the period then ended, and the financial highlights for each of the five years in the period then ended. These financial statements and financial highlights are the responsibility of the Funds’ management. Our responsibility is to express an opinion on these financial statements and financial highlights based on our audits.
We conducted our audits in accordance with standards of the Public Company Accounting Oversight Board (United States). Those standards require that we plan and perform the audit to obtain reasonable assurance about whether the financial statements and financial highlights are free of material misstatement. The Funds are not required to have, nor were we engaged to perform, an audit of its internal control over financial reporting. Our audits included consideration of internal control over financial reporting as a basis for designing audit procedures that are appropriate in the circumstances, but not for the purpose of expressing an opinion on the effectiveness of the Funds’ internal control over financial reporting. Accordingly, we express no such opinion. An audit also includes examining, on a test basis, evidence supporting the amounts and disclosures in the financial statements, assessing the accounting principles used and significant estimates made by management, as well as evaluating the overall financial statement presentation. Our procedures included confirmation of securities owned as of March 31, 2006, by correspondence with the custodians and brokers; where replies were not received from brokers, we performed other auditing procedures. We believe that our audits provide a reasonable basis for our opinion.
In our opinion, the financial statements and financial highlights referred to above present fairly, in all material respects, the financial position of the Funds as of March 31, 2006, the results of their operations for the year then ended, the changes in their net assets for each of the two years in the period then ended, and their financial highlights for each of the five years in the period then ended, in conformity with accounting principles generally accepted in the United States of America.
/s/ Deloitte & Touche LLP
DELOITTE & TOUCHE LLP
Boston, Massachusetts
May 16, 2006
|
81 Annual Report
The Trustees, Members of the Advisory Board, and executive officers of the trust and funds, as applicable, are listed below. The Board of Trustees governs each fund and is responsible for protecting the interests of shareholders. The Trustees are experienced executives who meet periodically throughout the year to oversee each fund’s activities, review contractual arrangements with companies that provide services to each fund, and review each fund’s performance. Except for William O. McCoy and Albert R. Gamper, Jr., each of the Trustees oversees 330 funds advised by FMR or an affiliate. Mr. McCoy oversees 332 funds advised by FMR or an affiliate. Mr. Gamper oversees 262 funds advised by FMR or an affiliate.
The Trustees hold office without limit in time except that (a) any Trustee may resign; (b) any Trustee may be removed by written instrument, signed by at least two thirds of the number of Trustees prior to such removal; (c) any Trustee who requests to be retired or who has become incapac itated by illness or injury may be retired by written instrument signed by a majority of the other Trustees; and (d) any Trustee may be removed at any special meeting of shareholders by a two thirds vote of the outstanding voting securities of the trust. Each Trustee who is not an interested person (as defined in the 1940 Act) (Independent Trustee), shall retire not later than the last day of the calendar year in which his or her 72nd birthday occurs. The Independent Trustees may waive this mandatory retirement age policy with respect to individual Trustees. The executive officers and Advisory Board Members hold office without limit in time, except that any officer and Advisory Board Member may resign or may be removed by a vote of a majority of the Trustees at any regular meeting or any special meeting of the Trustees. Except as indicated, each individual has held the office shown or other offices in the same company for the past five years.
The funds’ Statement of Additional Information (SAI) includes more information about the Trustees. To request a free copy, call Fidelity at 1-877-208-0098.
Correspondence intended for each Trustee who is an interested person may be sent to Fidelity Investments, 82 Devonshire Street, Boston, Massachusetts 02109.
| | Name, Age; Principal Occupation
Edward C. Johnson 3d (75)
|
Year of Election or Appointment: 1991
Mr. Johnson is Chairman of the Board of Trustees. Mr. Johnson serves as Chief Executive Officer, Chairman, and a Director of FMR Corp.; a Director and Chairman of the Board and of the Executive Committee of FMR; Chairman and a Director of Fidelity Research & Analysis Company; Chairman and a Director of Fidelity Investments Money Management, Inc.; and Chairman (2001 present) and a Director (2000 present) of FMR Co., Inc.
Year of Election or Appointment: 2005
Mr. Jonas is Senior Vice President of Treasury Only Portfolio (2005 present), Treasury Portfolio (2005 present), Government Port folio (2005 present), Prime Money Market Portfolio (2005 present), Money Market Portfolio (2005 present), and Tax Exempt Portfolio (2005 present). He also serves as Senior Vice President of other Fidelity funds (2005 present). Mr. Jonas is Executive Director of FMR (2005 present). Previously, Mr. Jonas served as President of Fidelity Enterprise Operations and Risk Services (2004 2005), Chief Administrative Officer (2002 2004), and Chief Financial Officer of FMR Co. (1998 2000). Mr. Jonas has been with Fidelity Investments since 1987 and has held various financial and management positions including Chief Financial Officer of FMR. In addition, he serves on the Boards of Boston Ballet (2003 present) and Simmons College (2003 present).
Year of Election or Appointment: 2003
Mr. Reynolds is a Director (2003 present) and Chief Operating Officer (2002 present) of FMR Corp. He also serves on the Board at Fidelity Investments Canada, Ltd. (2000 present). Previously, Mr. Reynolds served as President of Fidelity Investments Institutional Retirement Group (1996 2000).
* Trustees have been determined to be “Interested Trustees” by virtue of, among other things, their affiliation with the trust or various entities under common control with FMR.
Correspondence intended for each Independent Trustee (that is, the Trustees other than the Interested Trustees) may be sent to Fidelity Invest ments, P.O. Box 55235, Boston, Massachusetts 02205-5235.
| | Name, Age; Principal Occupation
Dennis J. Dirks (57)
|
Year of Election or Appointment: 2005
Prior to his retirement in May 2003, Mr. Dirks was Chief Operating Officer and a member of the Board of The Depository Trust & Clearing Corporation (DTCC) (1999 2003). He also served as President, Chief Operating Officer, and Board member of The Depository Trust Company (DTC) (1999 2003) and President and Board member of the National Securities Clearing Corporation (NSCC) (1999 2003). In addition, Mr. Dirks served as Chief Executive Officer and Board member of the Government Securities Clearing Corporation (2001 2003) and Chief Executive Officer and Board member of the Mortgage Backed Securities Clearing Corporation (2001 2003). Mr. Dirks also serves as a Trustee and a member of the Finance Committee of Manhattan College (2005 present) and a Trustee and a member of the Finance Committee of AHRC of Nassau County (2006 present).
| | Albert R. Gamper, Jr. (64)
|
Year of Election or Appointment: 2006
Mr. Gamper also serves as a Trustee (2006 present) or Member of the Advisory Board (2005 present) of other investment compa nies advised by FMR. Prior to his retirement in December 2004, Mr. Gamper served as Chairman of the Board of CIT Group Inc. (commercial finance). During his tenure with CIT Group Inc. Mr. Gamper served in numerous senior management positions, includ ing Chairman (1987 1989; 1999 2001; 2002 2004), Chief Executive Officer (1987 2004), and President (1989 2002). He currently serves as a member of the Board of Directors of Public Service Enterprise Group (utilities, 2001 present), Chairman of the Board of Governors, Rutgers University (2004 present), and Chairman of the Board of Saint Barnabas Health Care System.
Year of Election or Appointment: 1997
Dr. Gates is Chairman of the Independent Trustees (2006 present). Dr. Gates is President of Texas A&M University (2002 present). He was Director of the Central Intelligence Agency (CIA) from 1991 to 1993. From 1989 to 1991, Dr. Gates served as Assistant to the President of the United States and Deputy National Security Advisor. Dr. Gates is a Director of NACCO Industries, Inc. (mining and manufacturing), Parker Drilling Co., Inc. (drilling and rental tools for the energy industry, 2001 present), and Brinker International (restaurant management, 2003 present). Previously, Dr. Gates served as a Director of LucasVarity PLC (automotive components and diesel engines), a Director of TRW Inc. (automotive, space, defense, and information technology), and Dean of the George Bush School of Government and Public Service at Texas A&M University (1999 2001).
Year of Election or Appointment: 2004
Dr. Heilmeier is Chairman Emeritus of Telcordia Technologies (communication software and systems), where prior to his retirement, he served as company Chairman and Chief Executive Officer. He currently serves on the Boards of Directors of The Mitre Corpo ration (systems engineering and information technology support for the government), and HRL Laboratories (private research and development, 2004 present). He is Chairman of the General Motors Science & Technology Advisory Board and a Life Fellow of the Institute of Electrical and Electronics Engineers (IEEE). Dr. Heilmeier is a member of the Defense Science Board and the National Security Agency Advisory Board. He is also a member of the National Academy of Engineering, the American Academy of Arts and Sciences, and the Board of Overseers of the School of Engineering and Applied Science of the University of Pennsylvania. Previously, Dr. Heilmeier served as a Director of TRW Inc. (automotive, space, defense, and information technology, 1992 2002), Compaq (1994 2002), Automatic Data Processing, Inc. (ADP) (technology based business outsourcing, 1995 2002), INET Technologies Inc. (telecommunications network surveillance, 2001 2004), and Teletech Holdings (customer management services). He is the recipient of the 2005 Kyoto Prize in Advanced Technology for his invention of the liquid crystal display.
Year of Election or Appointment: 2001
Prior to Ms. Knowles’ retirement in June 2000, she served as Executive Vice President and Chief Financial Officer of Atlantic Richfield Company (ARCO) (diversified energy, 1996 2000). From 1993 to 1996, she was a Senior Vice President of ARCO and President of ARCO Transportation Company. She served as a Director of ARCO from 1996 to 1998. She currently serves as a Director of Phelps Dodge Corporation (copper mining and manufacturing) and McKesson Corporation (healthcare service, 2002 present). Ms. Knowles is a Trustee of the Brookings Institution and the Catalina Island Conservancy and also serves as a member of the Advisory Board for the School of Engineering of the University of Southern California.
83 Annual Report
Trustees and Officers - continued
|
| | Name, Age; Principal Occupation
Ned C. Lautenbach (62)
|
Year of Election or Appointment: 2000
Mr. Lautenbach has been a partner of Clayton, Dubilier & Rice, Inc. (private equity investment firm) since September 1998. Previously, Mr. Lautenbach was with the International Business Machines Corporation (IBM) from 1968 until his retirement in 1998. Mr. Lautenbach serves as a Director of Italtel Holding S.p.A. (telecommunications (Milan, Italy), 2004 present) and Eaton Corpora tion (diversified industrial) as well as the Philharmonic Center for the Arts in Naples, Florida. He also is a member of the Board of Trustees of Fairfield University (2005 present), as well as a member of the Council on Foreign Relations.
Year of Election or Appointment: 1997
Prior to his retirement in December 1994, Mr. McCoy was Vice Chairman of the Board of BellSouth Corporation (telecommunications) and President of BellSouth Enterprises. He is currently a Director of Duke Realty Corporation (real estate), and Progress Energy, Inc. (electric utility). He is also a partner of Franklin Street Partners (private investment management firm) and a member of the Research Triangle Foundation Board. In addition, Mr. McCoy served as the Interim Chancellor (1999 2000) and a member of the Board of Visitors for the University of North Carolina at Chapel Hill and currently serves as Chairman of the Board of Directors of the University of North Carolina Health Care System and the Board of Visitors of the Kenan Flagler Business School (University of North Carolina at Chapel Hill). He also served as Vice President of Finance for the University of North Carolina (16 school system).
Year of Election or Appointment: 2005
Ms. Small is a member (2000 present) and Chairperson (2002 present) of the Investment Committee, and a member (2002 present) of the Board of Trustees of Smith College. Previously, she served as Chief Investment Officer (1999 2000), Director of Global Equity Investments (1996 1999), and a member of the Board of Directors of Scudder, Stevens & Clark (1990 1997) and Scudder Kemper Investments (1997 1999). In addition, Ms. Small served as Co Chair (2000 2003) of the Annual Fund for the Fletcher School of Law and Diplomacy.
| | William S. Stavropoulos (66)
|
Year of Election or Appointment: 2002
Mr. Stavropoulos is Chairman of the Board (2000 present) and a Member of the Board of Directors of The Dow Chemical Company. Since joining The Dow Chemical Company in 1967, Mr. Stavropoulos served in numerous senior management positions, including President (1993 2000; 2002 2003), CEO (1995 2000; 2002 2004), and Chairman of the Executive Committee (2000 2004). Currently, he is a Director of NCR Corporation (data warehousing and technology solutions), BellSouth Corporation (telecommu nications), Chemical Financial Corporation, Maersk Inc. (industrial conglomerate, 2002 present), and Metalmark Capital (private equity investment firm, 2005 present). He also serves as a member of the Board of Trustees of the American Enterprise Institute for Public Policy Research. In addition, Mr. Stavropoulos is a member of The Business Council, J.P. Morgan International Council and the University of Notre Dame Advisory Council for the College of Science.
Year of Election or Appointment: 2005
Prior to his retirement in 2001, Mr. Wolfe was Chairman and Chief Executive Officer of Hershey Foods Corporation (1993 2001). He currently serves as a member of the boards of Adelphia Communications Corporation (2003 present), Bausch & Lomb, Inc., and Revlon Inc. (2004 present).
Advisory Board Members and Executive Officers:
|
Correspondence intended for Mr. Keyes may be sent to Fidelity Investments, P.O. Box 55235, Boston, Massachusetts 02205-5235. Correspondence intended for each executive officer and Mr. Lynch may be sent to Fidelity Investments, 82 Devonshire Street, Boston, Massachusetts 02109.
| | Name, Age; Principal Occupation
James H. Keyes (65)
|
Year of Election or Appointment: 2006
Member of the Advisory Board of Fidelity Colchester Street Trust. Prior to his retirement in 2003, Mr. Keyes was Chairman, Presi dent, and Chief Executive Officer of Johnson Controls, Inc. (automotive supplier, 1993 2003). He currently serves as a member of the boards of LSI Logic Corporation (semiconductor technologies, 1984 present), Navistar International Corporation (manufacture and sale of trucks, buses, and diesel engines, 2002 present), and Pitney Bowes, Inc. (integrated mail, messaging, and document management solutions, 1998 present).
Year of Election or Appointment: 2003
Member of the Advisory Board of Fidelity Colchester Street Trust. Vice Chairman and a Director of FMR, and Vice Chairman (2001 present) and a Director (2000 present) of FMR Co., Inc. Previously, Mr. Lynch served as a Trustee of the Fidelity funds (1990 2003). In addition, he serves as a Trustee of Boston College, Massachusetts Eye & Ear Infirmary, Historic Deerfield, John F. Kennedy Library, and the Museum of Fine Arts of Boston.
Year of Election or Appointment: 2005
Vice President of Treasury Only Portfolio, Treasury Portfolio, Government Portfolio, Prime Money Market Portfolio, Money Market Portfolio, and Tax Exempt Portfolio. Mr. Donovan also serves as Vice President of Fidelity’s High Income Funds (2005 present), Fidelity’s Fixed Income Funds (2005 present), certain Asset Allocation Funds (2005 present), and certain Balanced Funds (2005 present). Mr. Donovan also serves as Executive Vice President of FMR (2005 present) and FMRC (2005 present). Previously, Mr. Donovan served as Vice President and Director of Fidelity’s International Equity Trading group (1998 2005).
Year of Election or Appointment: 2005
Vice President of Treasury Only Portfolio, Treasury Portfolio, Government Portfolio, Prime Money Market Portfolio, Money Market Portfolio, and Tax Exempt Portfolio. Mr. Morrison also serves as Vice President of Fidelity’s Money Market Funds (2005 present) and certain Asset Allocation Funds (2002 present). Previously, he served as Vice President of Fidelity’s Bond Funds (2002 2005) and certain Balanced Funds (2002 2005). He served as Vice President (2002 2005) and Bond Group Leader (2002 2005) of Fidelity Investments Fixed Income Division. Mr. Morrison is also Vice President of FIMM (2002 present) and FMR (2002 present). Mr. Morrison joined Fidelity Investments in 1987 as a Corporate Bond Analyst in the Fixed Income Research Division.
Year of Election or Appointment: 2002
Vice President of Treasury Only Portfolio, Treasury Portfolio, Government Portfolio, Prime Money Market Portfolio, Money Market Portfolio, and Tax Exempt Portfolio. Mr. Murphy also serves as Vice President of Fidelity’s Money Market Funds (2002 present), certain Asset Allocation Funds (2003 present), Fidelity’s Investment Grade Bond Funds (2005 present), and Fidelity’s Balanced Funds (2005 present). He serves as Senior Vice President (2000 present) and Head (2004 present) of the Fidelity Investments Fixed Income Division. Mr. Murphy is also a Senior Vice President of Fidelity Investments Money Management, Inc. (2003 present) and an Executive Vice President of FMR (2005 present). Previously, Mr. Murphy served as Money Market Group Leader (2002 2004), Bond Group Leader (2000 2002), and Vice President of Fidelity’s Taxable Bond Funds (2000 2002) and Fidelity’s Municipal Bond Funds (2001 2002).
Year of Election or Appointment: 2004
Vice President of Treasury Only Portfolio, Treasury Portfolio, and Government Portfolio. Mr. Huyck also serves as Vice President of other funds advised by FMR. Prior to assuming his current responsibilities, Mr. Huyck worked as a trader and portfolio manager.
Year of Election or Appointment: 2003
Vice President of Prime Money Market Portfolio and Money Market Portfolio. Mr. Miller also serves as Vice President of other funds advised by FMR. Prior to assuming his current responsibilities, Mr. Miller worked as an analyst, bond trader, and portfolio manager.
Year of Election or Appointment: 2005
Vice President of Tax Exempt Portfolio. Mr. Widrig also serves as Vice President of other funds advised by FMR. Prior to assuming his current responsibilities, Mr. Widrig worked as an analyst and manager.
85 Annual Report
Trustees and Officers - continued
|
| | Name, Age; Principal Occupation
Eric D. Roiter (57)
|
Year of Election or Appointment: 1998
Secretary of Treasury Only Portfolio, Treasury Portfolio, Government Portfolio, Prime Money Market Portfolio, Money Market Portfolio, and Tax Exempt Portfolio. He also serves as Secretary of other Fidelity funds; Vice President, General Counsel, and Secretary of FMR Co., Inc. (2001 present) and FMR; Assistant Secretary of Fidelity Management & Research (U.K.) Inc. (2001 present), Fidelity Research & Analysis Company (2001 present), and Fidelity Investments Money Management, Inc. (2001 present). Mr. Roiter is an Adjunct Member, Faculty of Law, at Boston College Law School (2003 present). Previously, Mr. Roiter served as Vice President and Secretary of Fidelity Distributors Corporation (FDC) (1998 2005).
Year of Election or Appointment: 2003
Assistant Secretary of Treasury Only Portfolio, Treasury Portfolio, Government Portfolio, Prime Money Market Portfolio, Money Market Portfolio, and Tax Exempt Portfolio. Mr. Fross also serves as Assistant Secretary of other Fidelity funds (2003 present), Vice President and Secretary of FDC (2005 present), and is an employee of FMR.
Year of Election or Appointment: 2004
President and Treasurer of Treasury Only Portfolio, Treasury Portfolio, Government Portfolio, Prime Money Market Portfolio, Money Market Portfolio, and Tax Exempt Portfolio. Ms. Reynolds also serves as President and Treasurer of other Fidelity funds (2004 present) and is a Vice President (2003 present) and an employee (2002 present) of FMR. Before joining Fidelity Investments, Ms. Reynolds worked at PricewaterhouseCoopers LLP (PwC) (1980 2002), where she was most recently an audit partner with PwC’s investment management practice.
Year of Election or Appointment: 2006
Anti Money Laundering (AML) officer of Treasury Only Portfolio, Treasury Portfolio, Government Portfolio, Prime Money Market Portfolio, Money Market Portfolio, and Tax Exempt Portfolio. Mr. Ganis also serves as AML officer of other Fidelity funds (2006 present) and FMR Corp. (2003 present). Before joining Fidelity Investments, Mr. Ganis practiced law at Goodwin Procter, LLP (2000 2002).
Year of Election or Appointment: 2005
Chief Financial Officer of Treasury Only Portfolio, Treasury Portfolio, Government Portfolio, Prime Money Market Portfolio, Money Market Portfolio, and Tax Exempt Portfolio. Mr. Murphy also serves as Chief Financial Officer of other Fidelity funds (2005 present). He also serves as Senior Vice President of Fidelity Pricing and Cash Management Services Group (FPCMS).
| | Kenneth A. Rathgeber (58)
|
Year of Election or Appointment: 2004
Chief Compliance Officer of Treasury Only Portfolio, Treasury Portfolio, Government Portfolio, Prime Money Market Portfolio, Money Market Portfolio, and Tax Exempt Portfolio. Mr. Rathgeber also serves as Chief Compliance Officer of other Fidelity funds (2004 present) and Executive Vice President of Risk Oversight for Fidelity Investments (2002 present). He is Chief Compliance Officer of FMR (2005 present), FMR Co., Inc. (2005 present), Fidelity Management & Research (U.K.) Inc. (2005 present), Fidelity Research & Analysis Company (2005 present), Fidelity Investments Money Management, Inc. ( 2005 present), and Strategic Advisers, Inc. (2005 present). Previously, Mr. Rathgeber served as Executive Vice President and Chief Operating Officer for Fidelity Investments Institutional Services Company, Inc. (1998 2002).
Year of Election or Appointment: 2005
Deputy Treasurer of Treasury Only Portfolio, Treasury Portfolio, Government Portfolio, Prime Money Market Portfolio, Money Market Portfolio, and Tax Exempt Portfolio. Mr. Mehrmann also serves as Deputy Treasurer of other Fidelity funds (2005 present) and is an employee of FMR. Previously, Mr. Mehrmann served as Vice President of Fidelity Investments Institutional Services Group (FIIS)/Fidelity Investments Institutional Operations Corporation, Inc. (FIIOC) Client Services (1998 2004).
| | Kimberley H. Monasterio (42)
|
Year of Election or Appointment: 2004
Deputy Treasurer of Treasury Only Portfolio, Treasury Portfolio, Government Portfolio, Prime Money Market Portfolio, Money Market Portfolio, and Tax Exempt Portfolio. Ms. Monasterio also serves as Deputy Treasurer of other Fidelity funds (2004) and is an employee of FMR (2004). Before joining Fidelity Investments, Ms. Monasterio served as Treasurer (2000 2004) and Chief Financial Officer (2002 2004) of the Franklin Templeton Funds and Senior Vice President of Franklin Templeton Services, LLC (2000 2004).
Name, Age; Principal Occupation
Kenneth B. Robins (36)
|
Year of Election or Appointment: 2005
Deputy Treasurer of Treasury Only Portfolio, Treasury Portfolio, Government Portfolio, Prime Money Market Portfolio, Money Market Portfolio, and Tax Exempt Portfolio. Mr. Robins also serves as Deputy Treasurer of other Fidelity funds (2005 present) and is an employee of FMR (2004 present). Before joining Fidelity Investments, Mr. Robins worked at KPMG LLP, where he was a part ner in KPMG’s department of professional practice (2002 2004) and a Senior Manager (1999 2000). In addition, Mr. Robins served as Assistant Chief Accountant, United States Securities and Exchange Commission (2000 2002).
Year of Election or Appointment: 2005
Assistant Treasurer of Treasury Only Portfolio, Treasury Portfolio, Government Portfolio, Prime Money Market Portfolio, Money Market Portfolio, and Tax Exempt Portfolio. Mr. Byrnes also serves as Assistant Treasurer of other Fidelity funds (2005 present) and is an employee of FMR (2005 present). Previously, Mr. Byrnes served as Vice President of FPCMS (2003 2005). Before joining Fidelity Investments, Mr. Byrnes worked at Deutsche Asset Management where he served as Vice President of the Investment Operations Group (2000 2003).
Year of Election or Appointment: 1986, 1987, 1989 or 1990
Assistant Treasurer of Treasury Only Portfolio (1990), Treasury Portfolio (1987), Government Portfolio (1986), Prime Money Market Portfolio (1989), Money Market Portfolio (1986), and Tax Exempt Portfolio (1986). Mr. Costello also serves as Assistant Treasurer of other Fidelity funds and is an employee of FMR.
Year of Election or Appointment: 2004
Assistant Treasurer of Treasury Only Portfolio, Treasury Portfolio, Government Portfolio, Prime Money Market Portfolio, Money Market Portfolio, and Tax Exempt Portfolio. Mr. Lydecker also serves as Assistant Treasurer of other Fidelity funds (2004) and is an employee of FMR.
Year of Election or Appointment: 2002
Assistant Treasurer of Treasury Only Portfolio, Treasury Portfolio, Government Portfolio, Prime Money Market Portfolio, Money Market Portfolio, and Tax Exempt Portfolio. Mr. Osterheld also serves as Assistant Treasurer of other Fidelity funds (2002) and is an employee of FMR.
Year of Election or Appointment: 2005
Assistant Treasurer of Treasury Only Portfolio, Treasury Portfolio, Government Portfolio, Prime Money Market Portfolio, Money Market Portfolio, and Tax Exempt Portfolio. Mr. Ryan also serves as Assistant Treasurer of other Fidelity funds (2005 present) and is an employee of FMR (2005 present). Previously, Mr. Ryan served as Vice President of Fund Reporting in FPCMS (1999 2005).
Year of Election or Appointment: 2005
Assistant Treasurer of Treasury Only Portfolio, Treasury Portfolio, Government Portfolio, Prime Money Market Portfolio, Money Market Portfolio, and Tax Exempt Portfolio. Mr. Schiavone also serves as Assistant Treasurer of other Fidelity funds (2005 present) and is an employee of FMR (2005 present). Before joining Fidelity Investments, Mr. Schiavone worked at Deutsche Asset Manage ment, where he most recently served as Assistant Treasurer (2003 2005) of the Scudder Funds and Vice President and Head of Fund Reporting (1996 2003).
87 Annual Report
During the fiscal year ended March 31, 2006, 100% of Tax Exempt’s income dividends was free from federal income tax.
A percentage of the dividends distributed during the fiscal year for the following funds were derived from interest on U.S. Government securities which is generally exempt from state income tax:
| Treasury Only Portfolio | | 100% |
| Treasury Portfolio | | 4.83% |
| Government Portfolio | | 7.96% |
| Prime Money Market Portfolio | | 0.09% |
| Money Market Portfolio | | 0.18% |
The funds hereby designate the amounts noted below as distributions paid during the period January 1, 2006 to March 31, 2006 as qualifying to be taxed as interest related dividends for nonresident alien shareholders:
| Fund | | |
| Treasury Only Portfolio | | $ 11,964,984 |
| Treasury Portfolio | | $ 85,829,695 |
| Government Portfolio | | $ 68,781,527 |
| Prime Money Market Portfolio | | $ 141,331,344 |
| Money Market Portfolio | | $ 207,590,332 |
The funds will notify shareholders in January 2007 of amounts for use in preparing 2006 income tax returns.
Board Approval of Investment Advisory Contracts and Management Fees
FIMM Funds: Government Portfolio / Money Market Portfolio / Prime Money Market Portfolio / Tax-Exempt Portfolio / Treasury Portfolio / Treasury Only Portfolio
On January 19, 2006, the Board of Trustees, including the Independent Trustees (together, the Board), voted to approve a general research services agreement (the Agreement) between FMR, FMR Co., Inc. (FMRC), Fidelity Investments Money Management, Inc. (FIMM), and Fidelity Research & Analysis Company (FRAC) (together, the Investment Advisers) for each fund, effective January 20, 2006, pursuant to which FRAC may provide general research and investment advisory support services to FMRC and FIMM. The Board considered that it has approved previously various sub advisory agreements for each fund with affiliates of FMR that allow FMR to obtain research, non discretionary advice, or discretionary portfolio management at no additional expense to each fund. The Board, assisted by the advice of fund counsel and independent Trustees’ counsel, considered a broad range of information and determined that it would be beneficial for each fund to access the research and investment advisory support services supplied by FRAC at no additional expense to each fund.
The Board reached this determination in part because the new arrangement will involve no changes in (i) the contractual terms of and fees payable under each fund’s management contract or sub advisory agreements; (ii) the investment process or strategies employed in the management of each fund’s assets; (iii) the nature or level of services provided under each fund’s management contract or sub advisory agreements; (iv) the day to day management of each fund or the persons primarily responsible for such management; or (v) the ultimate control or beneficial ownership of FMR, FMRC, or FIMM. The Board also considered that the establishment of each Agreement would not necessitate prior shareholder approval of the Agree ment or result in an assignment and termination of each fund’s management contract or sub advisory agreements under the Investment Company Act of 1940.
Because the Board was approving an arrangement with FRAC under which each fund will not bear any additional management fees or expenses and under which each fund’s portfolio manager would not change, it did not consider each fund’s investment performance, competitiveness of management fee and total expenses, costs of services and profitability, or economies of scale to be significant factors in its decision.
In connection with its future renewal of each fund’s management contract and sub advisory agreements, the Board will consider: (i) the nature, extent, and quality of services provided to each fund, including shareholder and administrative services and investment performance; (ii) the competitiveness of each fund’s management fee and total expenses; (iii) the costs of the services and profitability, including the revenues earned and the expenses incurred by Fidelity in conducting the business of developing, marketing, distributing, managing, administering, and servicing each fund and its shareholders; and (iv) whether there have been economies of scale in respect of the management of the Fidelity funds, whether the Fidelity funds (including each fund) have appropriately benefited from any such economies of scale, and whether there is potential for realization of any further economies.
Based on its evaluation of all of the conclusions noted above, and after considering all material factors, the Board ultimately concluded that each fund’s Agreement is fair and reasonable, and that each fund’s Agreement should be approved.
89 Annual Report
91 Annual Report
Investment Advisor
Fidelity Management & Research Company
Boston, MA
Investment Sub-Advisor
Fidelity Investments Money Management, Inc.
Fidelity International Investment Advisors
Fidelity International Investment Advisors
(U.K.) Limited
Fidelity Research & Analysis Company
(formerly Fidelity Management & Research (Far East) Inc.)
General Distributor
Fidelity Distributors Corporation
Boston, MA
Transfer and Shareholder
Servicing Agents
Fidelity Investments Institutional Operations Company, Inc.
Boston, MA
Treasury Only Portfolio, Treasury Portfolio,
Government Portfolio, Prime Money Market Portfolio
and Money Market Portfolio
Citibank, N.A.
New York, NY
Tax-Exempt Portfolio
Custodians
The Bank of New York
New York, NY
Treasury Only Portfolio, Treasury Portfolio,
Government Portfolio, Prime Money Market Portfolio
and Money Market Portfolio
Citibank, N.A.
New York, NY
Tax-Exempt Portfolio
|
IMM-ANN-0506 431408.1.0
1.701843.108
|

Item 2. Code of Ethics
As of the end of the period, March 31, 2006, Fidelity Colchester Street Trust (the trust) has adopted a code of ethics, as defined in Item 2 of Form N-CSR, that applies to its President and Treasurer and its Chief Financial Officer. A copy of the code of ethics is filed as an exhibit to this Form N-CSR.
Item 3. Audit Committee Financial Expert
The Board of Trustees of the trust has determined that Marie L. Knowles is an audit committee financial expert, as defined in Item 3 of Form N-CSR. Ms. Knowles is independent for purposes of Item 3 of Form N-CSR.
Item 4. Principal Accountant Fees and Services
(a) Audit Fees.
For the fiscal years ended March 31, 2006 and March 31, 2005, the aggregate Audit Fees billed by Deloitte & Touche LLP, the member firms of Deloitte Touche Tohmatsu, and their respective affiliates (collectively, "Deloitte Entities") for professional services rendered for the audits of the financial statements, or services that are normally provided in connection with statutory and regulatory filings or engagements for those fiscal years, for the Government Portfolio, Money Market Portfolio, Prime Money Market Portfolio, Tax-Exempt Portfolio, Treasury Only Portfolio and Treasury Portfolio (the funds) and for all funds in the Fidelity Group of Funds are shown in the table below.
Fund | 2006A | 2005A |
Government Portfolio | $34,000 | $33,000 |
Money Market Portfolio | $45,000 | $46,000 |
Prime Money Market Portfolio | $39,000 | $34,000 |
Tax-Exempt Portfolio | $32,000 | $33,000 |
Treasury Only Portfolio | $27,000 | $29,000 |
Treasury Portfolio | $36,000 | $35,000 |
All funds in the Fidelity Group of Funds audited by Deloitte Entities | $5,900,000 | $4,600,000 |
A | Aggregate amounts may reflect rounding. |
(b) Audit-Related Fees.
In each of the fiscal years ended March 31, 2006 and March 31, 2005, the aggregate Audit-Related Fees billed by Deloitte Entities for services rendered for assurance and related services to each fund that are reasonably related to the performance of the audit or review of the fund's financial statements, but not reported as Audit Fees, are shown in the table below.
Fund | 2006A | 2005A |
Government Portfolio | $0 | $0 |
Money Market Portfolio | $0 | $0 |
Prime Money Market Portfolio | $0 | $0 |
Tax-Exempt Portfolio | $0 | $0 |
Treasury Only Portfolio | $0 | $0 |
Treasury Portfolio | $0 | $0 |
A | Aggregate amounts may reflect rounding. |
In each of the fiscal years ended March 31, 2006 and March 31, 2005, the aggregate Audit-Related Fees that were billed by Deloitte Entities that were required to be approved by the Audit Committee for services rendered on behalf of Fidelity Management & Research Company (FMR) and entities controlling, controlled by, or under common control with FMR (not including any sub-adviser whose role is primarily portfolio management and is subcontracted with or overseen by another investment adviser) that provide ongoing services to the funds ("Fund Service Providers") for assurance and related services that relate directly to the operations and financial reporting of each fund that are reasonably related to the performance of the audit or review of the fund's financial statements, but not reported as Audit Fees, are shown in the table below.
Billed By | 2006A | 2005A |
Deloitte Entities | $0 | $0 |
A | Aggregate amounts may reflect rounding. |
Fees included in the audit-related category comprise assurance and related services (e.g., due diligence services) that are traditionally performed by the independent registered public accounting firm. These audit-related services include due diligence related to mergers and acquisitions, accounting consultations and audits in connection with acquisitions, internal control reviews, attest services that are not required by statute or regulation and consultation concerning financial accounting and reporting standards.
(c) Tax Fees.
In each of the fiscal years ended March 31, 2006 and March 31, 2005, the aggregate Tax Fees billed by Deloitte Entities for professional services rendered for tax compliance, tax advice, and tax planning for each fund is shown in the table below.
Fund | 2006A | 2005A |
Government Portfolio | $3,500 | $3,400 |
Money Market Portfolio | $3,500 | $3,400 |
Prime Money Market Portfolio | $3,500 | $3,400 |
Tax-Exempt Portfolio | $3,500 | $3,400 |
Treasury Only Portfolio | $3,500 | $3,400 |
Treasury Portfolio | $3,500 | $3,400 |
A | Aggregate amounts may reflect rounding. |
In each of the fiscal years ended March 31, 2006 and March 31, 2005, the aggregate Tax Fees billed by Deloitte Entities that were required to be approved by the Audit Committee for professional services rendered on behalf of the Fund Service Providers for tax compliance, tax advice, and tax planning that relate directly to the operations and financial reporting of each fund is shown in the table below.
Billed By | 2006A | 2005A |
Deloitte Entities | $0 | $0 |
A | Aggregate amounts may reflect rounding. |
Fees included in the Tax Fees category comprise all services performed by professional staff in the independent registered public accounting firm's tax division except those services related to the audit. Typically, this category would include fees for tax compliance, tax planning, and tax advice. Tax compliance, tax advice, and tax planning services include preparation of original and amended tax returns, claims for refund and tax payment-planning services, assistance with tax audits and appeals, tax advice related to mergers and acquisitions and requests for rulings or technical advice from taxing authorities.
(d) All Other Fees.
In each of the fiscal years ended March 31, 2006 and March 31, 2005, the aggregate Other Fees billed by Deloitte Entities for all other non-audit services rendered to the funds is shown in the table below.
Fund | 2006A | 2005A |
Government Portfolio | $0 | $0 |
Money Market Portfolio | $0 | $0 |
Prime Money Market Portfolio | $0 | $0 |
Tax-Exempt Portfolio | $0 | $0 |
Treasury Only Portfolio | $0 | $0 |
Treasury Portfolio | $0 | $0 |
A | Aggregate amounts may reflect rounding. |
In each of the fiscal years ended March 31, 2006 and March 31, 2005, the aggregate Other Fees billed by Deloitte Entities that were required to be approved by the Audit Committee for all other non-audit services rendered on behalf of the Fund Service Providers that relate directly to the operations and financial reporting of each fund is shown in the table below.
Billed By | 2006A | 2005A |
Deloitte Entities | $160,000 | $510,000 |
A | Aggregate amounts may reflect rounding. |
Fees included in the All Other Fees category include services related to internal control reviews, strategy and other consulting, financial information systems design and implementation, consulting on other information systems, and other tax services unrelated to the fund.
(e) (1) | Audit Committee Pre-Approval Policies and Procedures: |
The trust's Audit Committee must pre-approve all audit and non-audit services provided by the independent registered public accounting firm relating to the operations or financial reporting of the funds. Prior to the commencement of any audit or non-audit services to a fund, the Audit Committee reviews the services to determine whether they are appropriate and permissible under applicable law.
The trust's Audit Committee has adopted policies and procedures to, among other purposes, provide a framework for the Committee's consideration of non-audit services by the audit firms that audit the Fidelity funds. The policies and procedures require that any non-audit service provided by a fund audit firm to a Fidelity Fund and any non-audit service provided by a fund auditor to a Fund Service Provider that relates directly to the operations and financial reporting of a Fidelity fund (Covered Service) are subject to approval by the Audit Committee before such service is provided. Non-audit services provided by a fund audit firm for a Fund Service Provider that do not relate directly to the operations and financial reporting of a Fidelity fund (Non-Covered Service) but that are expected to exceed $50,000 are also subject to pre-approval by the Audit Committee.
All Covered Services, as well as Non-Covered Services that are expected to exceed $50,000, must be approved in advance of provision of the service either: (i) by formal resolution of the Audit Committee, or (ii) by oral or written approval of the service by the Chair of the Audit Committee (or if the Chair is unavailable, such other member of the Audit Committee as may be designated by the Chair to act in the Chair's absence). The approval contemplated by (ii) above is permitted where the Treasurer determines that action on such an engagement is necessary before the next meeting of the Audit Committee. Neither pre-approval nor advance notice of Non-Covered Service engagements for which fees are not expected to exceed $50,000 is required; such engagements are to be reported to the Audit Committee monthly.
(e) (2) | Services approved pursuant to paragraph (c)(7)(i)(C) of Rule 2-01 of Regulation S-X: |
Audit-Related Fees:
There were no amounts that were approved by the Audit Committee pursuant to the de minimis exception for the fiscal years ended March 31, 2006 and March 31, 2005 on behalf of each fund.
There were no amounts that were required to be approved by the Audit Committee pursuant to the de minimis exception for the fiscal years ended March 31, 2006 and March 31, 2005 on behalf of the Fund Service Providers that relate directly to the operations and financial reporting of each fund.
Tax Fees:
There were no amounts that were approved by the Audit Committee pursuant to the de minimis exception for the fiscal years ended March 31, 2006 and March 31, 2005 on behalf of each fund.
There were no amounts that were required to be approved by the Audit Committee pursuant to the de minimis exception for the fiscal years ended March 31, 2006 and March 31, 2005 on behalf of the Fund Service Providers that relate directly to the operations and financial reporting of each fund.
All Other Fees:
There were no amounts that were approved by the Audit Committee pursuant to the de minimis exception for the fiscal years ended March 31, 2006 and March 31, 2005 on behalf of each fund.
There were no amounts that were required to be approved by the Audit Committee pursuant to the de minimis exception for the fiscal years ended March 31, 2006 and March 31, 2005 on behalf of the Fund Service Providers that relate directly to the operations and financial reporting of each fund.
(f) Not Applicable.
(g) For the fiscal years ended March 31, 2006 and March 31, 2005, the aggregate fees billed by Deloitte Entities of $360,000A and $850,000A,B for non-audit services rendered on behalf of the funds, FMR (not including any sub-adviser whose role is primarily portfolio management and is subcontracted with or overseen by another investment adviser) and Fund Service Providers relating to Covered Services and Non-Covered Services are shown in the table below.
| 2006A | 2005A |
Covered Services | $185,000 | $550,000 |
Non-Covered Services | $175,000 | $300,000B |
A | Aggregate amounts may reflect rounding. |
B | Reflects current period presentation. |
(h) The trust's Audit Committee has considered Non-Covered Services that were not pre-approved that were provided by Deloitte Entities to Fund Service Providers to be compatible with maintaining the independence of Deloitte Entities in its audit of the funds, taking into account representations from Deloitte Entities, in accordance with Independence Standards Board Standard No.1, regarding its independence from the funds and their related entities.
Item 5. Audit Committee of Listed Registrants
Not applicable.
Item 6. Schedule of Investments
Not applicable.
Item 7. Disclosure of Proxy Voting Policies and Procedures for Closed-End Management Investment Companies
Not applicable.
Item 8. Portfolio Managers of Closed-End Management Investment Companies
Not applicable.
Item 9. Purchase of Equity Securities by Closed-End Management Investment Company and Affiliated Purchasers
Not applicable.
Item 10. Submission of Matters to a Vote of Security Holders
There were no material changes to the procedures by which shareholders may recommend nominees to the trust's Board of Trustees.
Item 11. Controls and Procedures
(a)(i) The President and Treasurer and the Chief Financial Officer have concluded that the trust's disclosure controls and procedures (as defined in Rule 30a-3(c) under the Investment Company Act) provide reasonable assurances that material information relating to the trust is made known to them by the appropriate persons, based on their evaluation of these controls and procedures as of a date within 90 days of the filing date of this report.
(a)(ii) There was no change in the trust's internal control over financial reporting (as defined in Rule 30a-3(d) under the Investment Company Act) that occurred during the second fiscal quarter of the period covered by this report that has materially affected, or is reasonably likely to materially affect, the trust's internal control over financial reporting.
Item 12. Exhibits
(a) | (1) | Code of Ethics pursuant to Item 2 of Form N-CSR is filed and attached hereto as EX-99.CODE ETH. |
(a) | (2) | Certification pursuant to Rule 30a-2(a) under the Investment Company Act of 1940 (17 CFR 270.30a-2(a)) is filed and attached hereto as Exhibit 99.CERT. |
(a) | (3) | Not applicable. |
(b) | | Certification pursuant to Rule 30a-2(b) under the Investment Company Act of 1940 (17 CFR 270.30a-2(b)) is furnished and attached hereto as Exhibit 99.906CERT. |
SIGNATURES
Pursuant to the requirements of the Securities Exchange Act of 1934 and the Investment Company Act of 1940, the registrant has duly caused this report to be signed on its behalf by the undersigned, thereunto duly authorized.
Fidelity Colchester Street Trust
By: | /s/Christine Reynolds |
| Christine Reynolds |
| President and Treasurer |
| |
Date: | May 17, 2006 |
Pursuant to the requirements of the Securities Exchange Act of 1934 and the Investment Company Act of 1940, this report has been signed below by the following persons on behalf of the registrant and in the capacities and on the dates indicated.
By: | /s/Christine Reynolds |
| Christine Reynolds |
| President and Treasurer |
| |
Date: | May 17, 2006 |
By: | /s/Paul M. Murphy |
| Paul M. Murphy |
| Chief Financial Officer |
| |
Date: | May 17, 2006 |