UNITED STATES
SECURITIES AND EXCHANGE COMMISSION
Washington, D.C. 20549
FORM N-CSR
CERTIFIED SHAREHOLDER REPORT OF REGISTERED
MANAGEMENT INVESTMENT COMPANIES
Investment Company Act file number 811-03320
Fidelity Colchester Street Trust
(Exact name of registrant as specified in charter)
245 Summer St., Boston, Massachusetts 02210
(Address of principal executive offices) (Zip code)
Margaret Carey, Secretary
245 Summer St.
Boston, Massachusetts 02210
(Name and address of agent for service)
Registrant's telephone number, including area code:
617-563-7000
Date of fiscal year end: | March 31 |
Date of reporting period: | March 31, 2023 |
Item 1.
Reports to Stockholders


Contents
| Current 7-Day Yields | ||
| Class I | 4.41% | |
| Class II | 4.26% | |
| Class III | 4.16% | |
| Class IV | 3.91% | |
| Select Class | 4.36% | |
| Institutional Class | 4.45% | |
Yield refers to the income paid by the Fund over a given period. Yield for money market funds is usually for seven-day periods, as it is here, though it is expressed as an annual percentage rate. Past performance is no guarantee of future results. Yield will vary and it's possible to lose money investing in the Fund. A portion of the Fund's expenses was reimbursed and/or waived. Absent such reimbursements and/or waivers the yield for the period ending March 31, 2023, the most recent period shown in the table, would have been 4.30% for Class I, 4.15% for Class II, 4.05% for Class III, 3.81% for Class IV, 4.25% for Select Class, and 4.33% for Institutional Class. | ||
| Effective Maturity Diversification (% of Fund's Investments) | ||
| Days | ||
| 1 - 7 | 12.5 | |
| 8 - 30 | 29.9 | |
| 31 - 60 | 57.0 | |
| 61 - 90 | 0.6 | |
| Effective maturity is determined in accordance with the requirements of Rule 2a-7 under the Investment Company Act of 1940. | ||
Asset Allocation (% of Fund's net assets) |
 |
Net Other Assets (Liabilities) - (9.9)% |
Net Other Assets (Liabilities) are not available in the pie chart. |
| U.S. Treasury Debt - 109.9% | ||||
| Yield (%)(a) | Principal Amount (b) (000s) | Value ($) (000s) | ||
| U.S. Treasury Inflation Protected Obligations - 0.6% | ||||
| U.S. Treasury Notes | ||||
| 4/15/23 | 5.11 to 5.40 | 333,621 | 334,065 | |
| U.S. Treasury Obligations - 109.3% | ||||
| U.S. Treasury Bills | ||||
| 4/4/23 to 6/1/23 | 3.55 to 4.96 | 54,234,590 | 54,016,701 | |
| U.S. Treasury Notes | ||||
| 4/30/23 to 10/31/24 (c) | 4.66 to 4.95 | 2,396,787 | 2,393,696 | |
TOTAL U.S. TREASURY OBLIGATIONS | 56,410,397 | |||
| TOTAL U.S. TREASURY DEBT (Cost $56,744,462) | 56,744,462 | |||
| TOTAL INVESTMENT IN SECURITIES - 109.9% (Cost $56,744,462) | 56,744,462 |
NET OTHER ASSETS (LIABILITIES) - (9.9)% | (5,129,016) |
| NET ASSETS - 100.0% | 51,615,446 |
| (a) | Yield represents either the annualized yield at the date of purchase, or the stated coupon rate, or, for floating and adjustable rate securities, the rate at period end. |
| (b) | Amount is stated in United States dollars unless otherwise noted. |
| (c) | Coupon rates for floating and adjustable rate securities reflect the rates in effect at period end. |
| Statement of Assets and Liabilities | ||||
| Amounts in thousands (except per-share amounts) | March 31, 2023 | |||
| Assets | ||||
Investment in securities, at value - See accompanying schedule Unaffiliated issuers (cost $56,744,462): | $ | 56,744,462 | ||
| Receivable for investments sold | 184,235 | |||
| Receivable for fund shares sold | 348,140 | |||
| Interest receivable | 16,522 | |||
| Prepaid expenses | 17 | |||
| Receivable from investment adviser for expense reductions | 1,957 | |||
| Other receivables | 579 | |||
Total assets | 57,295,912 | |||
| Liabilities | ||||
| Payable for investments purchased | $ | 5,398,206 | ||
| Payable for fund shares redeemed | 211,026 | |||
| Distributions payable | 61,592 | |||
| Accrued management fee | 5,146 | |||
| Distribution and service plan fees payable | 1,078 | |||
| Other affiliated payables | 1,722 | |||
| Other payables and accrued expenses | 1,696 | |||
| Total Liabilities | 5,680,466 | |||
| Net Assets | $ | 51,615,446 | ||
| Net Assets consist of: | ||||
| Paid in capital | $ | 51,616,105 | ||
| Total accumulated earnings (loss) | (659) | |||
| Net Assets | $ | 51,615,446 | ||
| Net Asset Value and Maximum Offering Price | ||||
| Class I : | ||||
Net Asset Value , offering price and redemption price per share ($14,612,028 ÷ 14,610,159 shares) | $ | 1.00 | ||
| Class II : | ||||
Net Asset Value , offering price and redemption price per share ($2,196,009 ÷ 2,196,308 shares) | $ | 1.00 | ||
| Class III : | ||||
Net Asset Value , offering price and redemption price per share ($2,484,121 ÷ 2,483,715 shares) | $ | 1.00 | ||
| Class IV : | ||||
Net Asset Value , offering price and redemption price per share ($795,014 ÷ 794,967 shares) | $ | 1.00 | ||
| Select Class : | ||||
Net Asset Value , offering price and redemption price per share ($1,271,129 ÷ 1,271,205 shares) | $ | 1.00 | ||
| Institutional Class : | ||||
Net Asset Value , offering price and redemption price per share ($30,257,145 ÷ 30,257,840 shares) | $ | 1.00 | ||
| Statement of Operations | ||||
| Amounts in thousands | Year ended March 31, 2023 | |||
| Investment Income | ||||
| Interest | $ | 968,806 | ||
| Expenses | ||||
| Management fee | $ | 50,031 | ||
| Transfer agent fees | 15,478 | |||
| Distribution and service plan fees | 7,932 | |||
| Accounting fees and expenses | 1,638 | |||
| Custodian fees and expenses | 318 | |||
| Independent trustees' fees and expenses | 128 | |||
| Registration fees | 1,314 | |||
| Audit | 43 | |||
| Legal | 24 | |||
| Miscellaneous | 90 | |||
| Total expenses before reductions | 76,996 | |||
| Expense reductions | (12,751) | |||
| Total expenses after reductions | 64,245 | |||
| Net Investment income (loss) | 904,561 | |||
| Realized and Unrealized Gain (Loss) | ||||
| Net realized gain (loss) on: | ||||
| Investment Securities: | ||||
| Unaffiliated issuers | 52 | |||
| Total net realized gain (loss) | 52 | |||
| Net increase in net assets resulting from operations | $ | 904,613 | ||
| Statement of Changes in Net Assets | ||||
| Amount in thousands | Year ended March 31, 2023 | Year ended March 31, 2022 | ||
| Increase (Decrease) in Net Assets | ||||
| Operations | ||||
| Net investment income (loss) | $ | 904,561 | $ | 6,315 |
| Net realized gain (loss) | 52 | (484) | ||
Net increase in net assets resulting from operations | 904,613 | 5,831 | ||
| Distributions to shareholders | (904,209) | (6,108) | ||
| Share transactions - net increase (decrease) | 17,734,453 | 999,223 | ||
| Total increase (decrease) in net assets | 17,734,857 | 998,946 | ||
| Net Assets | ||||
| Beginning of period | 33,880,589 | 32,881,643 | ||
| End of period | $ | 51,615,446 | $ | 33,880,589 |
| Treasury Only Portfolio Class I |
| Years ended March 31, | 2023 | 2022 | 2021 | 2020 | 2019 | |||||
Selected Per-Share Data | ||||||||||
| Net asset value, beginning of period | $ | 1.00 | $ | 1.00 | $ | 1.00 | $ | 1.00 | $ | 1.00 |
| Income from Investment Operations | ||||||||||
Net investment income (loss) A | .025 | - B | - B | .018 | .019 | |||||
Net realized and unrealized gain (loss) B | - | - | - | - | - | |||||
| Total from investment operations | .025 | - B | - B | .018 | .019 | |||||
| Distributions from net investment income | (.025) | - B | - B | (.018) | (.019) | |||||
| Distributions from net realized gain | - | - B | - | - | - | |||||
| Total distributions | (.025) | - B | - B | (.018) | (.019) | |||||
| Net asset value, end of period | $ | 1.00 | $ | 1.00 | $ | 1.00 | $ | 1.00 | $ | 1.00 |
Total Return C | 2.50% | .02% | .04% | 1.80% | 1.96% | |||||
Ratios to Average Net Assets A,D,E | ||||||||||
| Expenses before reductions | .21% | .21% | .21% | .22% | .21% | |||||
| Expenses net of fee waivers, if any | .18% | .08% | .15% | .18% | .18% | |||||
| Expenses net of all reductions | .18% | .08% | .15% | .18% | .18% | |||||
| Net investment income (loss) | 2.53% | .02% | .05% | 1.72% | 1.97% | |||||
| Supplemental Data | ||||||||||
| Net assets, end of period (in millions) | $ | 14,612 | $ | 12,146 | $ | 10,871 | $ | 15,058 | $ | 7,033 |
| Treasury Only Portfolio Class II |
| Years ended March 31, | 2023 | 2022 | 2021 | 2020 | 2019 | |||||
Selected Per-Share Data | ||||||||||
| Net asset value, beginning of period | $ | 1.00 | $ | 1.00 | $ | 1.00 | $ | 1.00 | $ | 1.00 |
| Income from Investment Operations | ||||||||||
Net investment income (loss) A | .023 | - B | - B | .016 | .018 | |||||
Net realized and unrealized gain (loss) B | - | - | - | - | - | |||||
| Total from investment operations | .023 | - B | - B | .016 | .018 | |||||
| Distributions from net investment income | (.023) | - B | - B | (.016) | (.018) | |||||
| Distributions from net realized gain | - | - B | - | - | - | |||||
| Total distributions | (.023) | - B | - B | (.016) | (.018) | |||||
| Net asset value, end of period | $ | 1.00 | $ | 1.00 | $ | 1.00 | $ | 1.00 | $ | 1.00 |
Total Return C | 2.34% | .01% | .02% | 1.65% | 1.81% | |||||
Ratios to Average Net Assets A,D,E | ||||||||||
| Expenses before reductions | .36% | .36% | .36% | .37% | .36% | |||||
| Expenses net of fee waivers, if any | .33% | .09% | .16% | .33% | .33% | |||||
| Expenses net of all reductions | .33% | .09% | .16% | .33% | .33% | |||||
| Net investment income (loss) | 2.38% | .01% | .03% | 1.57% | 1.82% | |||||
| Supplemental Data | ||||||||||
| Net assets, end of period (in millions) | $ | 2,196 | $ | 1,126 | $ | 943 | $ | 830 | $ | 525 |
| Treasury Only Portfolio Class III |
| Years ended March 31, | 2023 | 2022 | 2021 | 2020 | 2019 | |||||
Selected Per-Share Data | ||||||||||
| Net asset value, beginning of period | $ | 1.00 | $ | 1.00 | $ | 1.00 | $ | 1.00 | $ | 1.00 |
| Income from Investment Operations | ||||||||||
Net investment income (loss) A | .022 | - B | - B | .015 | �� | .017 | ||||
Net realized and unrealized gain (loss) B | - | - | - | - | - | |||||
| Total from investment operations | .022 | - B | - B | .015 | .017 | |||||
| Distributions from net investment income | (.022) | - B | - B | (.015) | (.017) | |||||
| Distributions from net realized gain | - | - B | - | - | - | |||||
| Total distributions | (.022) | - B | - B | (.015) | (.017) | |||||
| Net asset value, end of period | $ | 1.00 | $ | 1.00 | $ | 1.00 | $ | 1.00 | $ | 1.00 |
Total Return C | 2.25% | .01% | .01% | 1.54% | 1.70% | |||||
Ratios to Average Net Assets A,D,E | ||||||||||
| Expenses before reductions | .46% | .46% | .46% | .47% | .46% | |||||
| Expenses net of fee waivers, if any | .43% | .08% | .17% | .43% | .43% | |||||
| Expenses net of all reductions | .43% | .08% | .17% | .43% | .43% | |||||
| Net investment income (loss) | 2.28% | .02% | .02% | 1.47% | 1.72% | |||||
| Supplemental Data | ||||||||||
| Net assets, end of period (in millions) | $ | 2,484 | $ | 1,155 | $ | 1,349 | $ | 824 | $ | 1,044 |
| Treasury Only Portfolio Class IV |
| Years ended March 31, | 2023 | 2022 | 2021 | 2020 | 2019 | |||||
Selected Per-Share Data | ||||||||||
| Net asset value, beginning of period | $ | 1.00 | $ | 1.00 | $ | 1.00 | $ | 1.00 | $ | 1.00 |
| Income from Investment Operations | ||||||||||
Net investment income (loss) A | .020 | - B | - B | .013 | .014 | |||||
Net realized and unrealized gain (loss) B | - | - | - | - | - | |||||
| Total from investment operations | .020 | - B | - B | .013 | .014 | |||||
| Distributions from net investment income | (.020) | - B | - B | (.013) | (.014) | |||||
| Distributions from net realized gain | - | - B | - | - | - | |||||
| Total distributions | (.020) | - B | - B | (.013) | (.014) | |||||
| Net asset value, end of period | $ | 1.00 | $ | 1.00 | $ | 1.00 | $ | 1.00 | $ | 1.00 |
Total Return C | 2.02% | .01% | .01% | 1.29% | 1.45% | |||||
Ratios to Average Net Assets A,D,E | ||||||||||
| Expenses before reductions | .71% | .71% | .71% | .72% | .71% | |||||
| Expenses net of fee waivers, if any | .66% | .08% | .17% | .68% | .68% | |||||
| Expenses net of all reductions | .66% | .08% | .17% | .68% | .68% | |||||
| Net investment income (loss) | 2.05% | .01% | .02% | 1.22% | 1.47% | |||||
| Supplemental Data | ||||||||||
| Net assets, end of period (in millions) | $ | 795 | $ | 196 | $ | 334 | $ | 109 | $ | 155 |
| Treasury Only Portfolio Select Class |
| Years ended March 31, | 2023 | 2022 | 2021 | 2020 | 2019 | |||||
Selected Per-Share Data | ||||||||||
| Net asset value, beginning of period | $ | 1.00 | $ | 1.00 | $ | 1.00 | $ | 1.00 | $ | 1.00 |
| Income from Investment Operations | ||||||||||
Net investment income (loss) A | .024 | - B | - B | .017 | .019 | |||||
Net realized and unrealized gain (loss) B | - | - | - | - | - | |||||
| Total from investment operations | .024 | - B | - B | .017 | .019 | |||||
| Distributions from net investment income | (.024) | - B | - B | (.017) | (.019) | |||||
| Distributions from net realized gain | - | - B | - | - | - | |||||
| Total distributions | (.024) | - B | - B | (.017) | (.019) | |||||
| Net asset value, end of period | $ | 1.00 | $ | 1.00 | $ | 1.00 | $ | 1.00 | $ | 1.00 |
Total Return C | 2.45% | .01% | .03% | 1.75% | 1.91% | |||||
Ratios to Average Net Assets A,D,E | ||||||||||
| Expenses before reductions | .26% | .26% | .26% | .27% | .26% | |||||
| Expenses net of fee waivers, if any | .23% | .08% | .16% | .23% | .23% | |||||
| Expenses net of all reductions | .23% | .08% | .16% | .23% | .23% | |||||
| Net investment income (loss) | 2.49% | .01% | .03% | 1.67% | 1.92% | |||||
| Supplemental Data | ||||||||||
| Net assets, end of period (in millions) | $ | 1,271 | $ | 325 | $ | 264 | $ | 399 | $ | 176 |
| Treasury Only Portfolio Institutional Class |
| Years ended March 31, | 2023 | 2022 | 2021 | 2020 | 2019 | |||||
Selected Per-Share Data | ||||||||||
| Net asset value, beginning of period | $ | 1.00 | $ | 1.00 | $ | 1.00 | $ | 1.00 | $ | 1.00 |
| Income from Investment Operations | ||||||||||
Net investment income (loss) A | .025 | - B | .001 | .018 | .020 | |||||
Net realized and unrealized gain (loss) B | - | - | - | - | - | |||||
| Total from investment operations | .025 | - B | .001 | .018 | .020 | |||||
| Distributions from net investment income | (.025) | - B | (.001) | (.018) | (.020) | |||||
| Distributions from net realized gain | - | - B | - | - | - | |||||
| Total distributions | (.025) | - B | (.001) | (.018) | (.020) | |||||
| Net asset value, end of period | $ | 1.00 | $ | 1.00 | $ | 1.00 | $ | 1.00 | $ | 1.00 |
Total Return C | 2.54% | .02% | .06% | 1.84% | 2.00% | |||||
Ratios to Average Net Assets A,D,E | ||||||||||
| Expenses before reductions | .18% | .18% | .18% | .19% | .18% | |||||
| Expenses net of fee waivers, if any | .14% | .07% | .13% | .14% | .14% | |||||
| Expenses net of all reductions | .14% | .07% | .13% | .14% | .14% | |||||
| Net investment income (loss) | 2.57% | .02% | .06% | 1.76% | 2.01% | |||||
| Supplemental Data | ||||||||||
| Net assets, end of period (in millions) | $ | 30,257 | $ | 18,932 | $ | 19,120 | $ | 26,551 | $ | 11,774 |
| Current 7-Day Yields | ||
| Class I | 4.70% | |
| Class II | 4.55% | |
| Class III | 4.45% | |
| Class IV | 4.20% | |
| Select Class | 4.65% | |
| Institutional Class | 4.74% | |
Yield refers to the income paid by the Fund over a given period. Yield for money market funds is usually for seven-day periods, as it is here, though it is expressed as an annual percentage rate. Past performance is no guarantee of future results. Yield will vary and it's possible to lose money investing in the Fund. A portion of the Fund's expenses was reimbursed and/or waived. Absent such reimbursements and/or waivers the yield for the period ending March 31, 2023, the most recent period shown in the table, would have been 4.57% for Class I, 4.43% for Class II, 4.33% for Class III, 4.08% for Class IV, 4.52% for Select Class, and 4.60% for Institutional Class. | ||
| Effective Maturity Diversification (% of Fund's Investments) | ||
| Days | ||
| 1 - 7 | 98.2 | |
| 8 - 30 | 0.9 | |
| 31 - 60 | 0.9 | |
| Effective maturity is determined in accordance with the requirements of Rule 2a-7 under the Investment Company Act of 1940. | ||
Asset Allocation (% of Fund's net assets) |
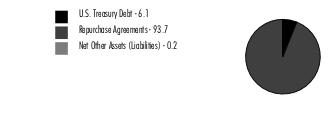 |
| U.S. Treasury Debt - 6.1% | ||||
| Yield (%)(a) | Principal Amount (b) (000s) | Value ($) (000s) | ||
| U.S. Treasury Inflation Protected Obligations - 0.8% | ||||
| U.S. Treasury Notes | ||||
| 4/15/23 | 5.11 | 488,999 | 489,684 | |
| U.S. Treasury Obligations - 5.3% | ||||
| U.S. Treasury Bills | ||||
| 4/6/23 to 5/9/23 | 4.80 to 4.86 | 306,000 | 304,536 | |
| U.S. Treasury Notes | ||||
| 4/30/23 to 10/31/24 (c) | 4.66 to 4.87 | 2,804,231 | 2,803,893 | |
TOTAL U.S. TREASURY OBLIGATIONS | 3,108,429 | |||
| TOTAL U.S. TREASURY DEBT (Cost $3,598,113) | 3,598,113 | |||
| U.S. Treasury Repurchase Agreement - 93.7% | |||
Maturity Amount ($) (000s) | Value ($) (000s) | ||
| In a joint trading account at: | |||
| 4.8% dated 3/31/23 due 4/3/23 (Collateralized by U.S. Treasury Obligations) # | 575,781 | 575,551 | |
| 4.8% dated 3/31/23 due 4/3/23 (Collateralized by U.S. Treasury Obligations) # | 963,970 | 963,585 | |
| With: | |||
| ABN AMRO Bank NV at 4.8%, dated 3/31/23 due 4/3/23 (Collateralized by U.S. Treasury Obligations valued at $116,614,609, 0.38% - 2.88%, 1/31/24 - 5/15/49) | 114,046 | 114,000 | |
| Barclays Bank PLC at 4.8%, dated 3/31/23 due 4/3/23 (Collateralized by U.S. Treasury Obligations valued at $243,177,273, 3.00%, 2/15/49) | 236,094 | 236,000 | |
| CIBC Bank U.S.A. at 4.81%, dated 3/23/23 due 4/7/23 (Collateralized by U.S. Treasury Obligations valued at $190,967,598, 0.75% - 4.38%, 2/29/24 - 2/15/47) | 187,043 | 186,000 | |
| Federal Reserve Bank of New York at 4.8%, dated 3/31/23 due 4/3/23 (Collateralized by U.S. Treasury Obligations valued at $51,982,784,867, 0.25% - 4.38%, 5/31/23 - 8/15/42) | 51,982,785 | 51,962,000 | |
| Fixed Income Clearing Corp. - BNYM at 4.81%, dated 3/31/23 due 4/3/23 (Collateralized by U.S. Treasury Obligations valued at $325,380,062, 0.13% - 3.50%, 9/15/25 - 1/15/30) | 319,128 | 319,000 | |
| Fixed Income Clearing Corp. - SSB at: | |||
4.81%, dated 3/31/23 due 4/3/23 (Collateralized by U.S. Treasury Obligations valued at $194,820,081, 3.13%, 11/15/28) | 191,077 | 191,000 | |
4.88%, dated 3/31/23 due 4/3/23 (Collateralized by U.S. Treasury Obligations valued at $126,751,517, 2.50% - 3.00%, 5/15/46 - 8/15/48) | 124,050 | 124,000 | |
| ING Financial Markets LLC at 4.81%, dated 3/31/23 due 4/3/23 (Collateralized by U.S. Treasury Obligations valued at $96,985,382, 1.00%, 12/15/24) | 95,038 | 95,000 | |
| Lloyds Bank PLC at: | |||
4.75%, dated: | |||
| 2/6/23 due 5/9/23 (Collateralized by U.S. Treasury Obligations valued at $27,731,281, 2.25% - 2.88%, 8/15/24 - 8/15/27) | 27,328 | 27,000 | |
| 2/7/23 due 5/9/23 (Collateralized by U.S. Treasury Obligations valued at $17,453,600, 2.50% - 3.25%, 1/31/25 - 6/30/27) | 17,204 | 17,000 | |
4.77%, dated 3/2/23 due 5/2/23 (Collateralized by U.S. Treasury Obligations valued at $36,850,275, 0.75% - 2.88%, 11/15/24 - 11/30/25) | 36,291 | 36,000 | |
4.82%, dated 3/9/23 due 5/9/23 (Collateralized by U.S. Treasury Obligations valued at $36,820,521, 3.25%, 6/30/27) | 36,294 | 36,000 | |
4.83%, dated 3/23/23 due 4/24/23 (Collateralized by U.S. Treasury Obligations valued at $36,782,358, 1.50% - 2.88%, 11/30/25 - 11/30/28) | 36,155 | 36,000 | |
4.84%, dated 3/27/23 due 5/4/23 (Collateralized by U.S. Treasury Obligations valued at $31,626,821, 2.50% - 2.88%, 1/31/25 - 11/30/25) | 31,158 | 31,000 | |
4.86%, dated 3/16/23 due 5/16/23 (Collateralized by U.S. Treasury Obligations valued at $18,392,785, 3.25%, 6/30/27) | 18,148 | 18,000 | |
4.87%, dated 2/22/23 due 5/22/23 (Collateralized by U.S. Treasury Obligations valued at $28,711,762, 0.38%, 7/31/27) | 28,337 | 28,000 | |
4.9%, dated 2/28/23 due 5/30/23 (Collateralized by U.S. Treasury Obligations valued at $33,795,043, 3.25%, 6/30/27) | 33,409 | 33,000 | |
| MUFG Securities (Canada), Ltd. at 4.81%, dated 3/23/23 due 4/7/23 (Collateralized by U.S. Treasury Obligations valued at $37,795,982, 0.88% - 2.88%, 4/30/24 - 8/15/46) | 37,158 | 37,000 | |
| MUFG Securities EMEA PLC at: | |||
4.82%, dated: | |||
| 3/31/23 due 4/3/23 (Collateralized by U.S. Treasury Obligations valued at $97,947,705, 1.13% - 2.25%, 8/15/27 - 2/29/28) | 96,039 | 96,000 | |
| 4/3/23 due 4/4/23 (d) | 96,013 | 96,000 | |
4.83%, dated 3/31/23 due 4/3/23 (Collateralized by U.S. Treasury Obligations valued at $195,519,569, 0.63% - 3.63%, 12/31/24 - 2/15/53) | 191,077 | 191,000 | |
| NatWest Markets Securities Inc. at 4.8%, dated 3/31/23 due 4/3/23 (Collateralized by U.S. Treasury Obligations valued at $20,451,245, 1.75% - 6.88%, 8/15/25 - 5/15/52) | 20,008 | 20,000 | |
| Norinchukin Bank at 4.9%, dated 3/28/23 due 4/4/23 (Collateralized by U.S. Treasury Obligations valued at $8,163,355, 2.75%, 5/31/29) | 8,008 | 8,000 | |
| Prudential Insurance Co. of America at 4.82%, dated 3/31/23 due 4/3/23 (Collateralized by U.S. Treasury Obligations valued at $111,578,015, 1.25% - 6.63%, 8/31/23 - 2/15/36) | 109,359 | 109,315 | |
| Societe Generale at 4.81%, dated 3/30/23 due 4/6/23 (Collateralized by U.S. Treasury Obligations valued at $182,226,886, 1.25% - 3.50%, 4/30/28 - 5/15/43) | 178,166 | 178,000 | |
| Sumitomo Mitsui Trust Bank Ltd. at 4.85%, dated 3/29/23 due 4/7/23 (Collateralized by U.S. Treasury Obligations valued at $13,332,510, 1.63% - 3.25%, 8/31/24 - 8/15/29) | 13,025 | 13,000 | |
| TOTAL U.S. TREASURY REPURCHASE AGREEMENT (Cost $55,776,451) | 55,776,451 | ||
| TOTAL INVESTMENT IN SECURITIES - 99.8% (Cost $59,374,564) | 59,374,564 |
NET OTHER ASSETS (LIABILITIES) - 0.2% | 136,474 |
| NET ASSETS - 100.0% | 59,511,038 |
| (a) | Yield represents either the annualized yield at the date of purchase, or the stated coupon rate, or, for floating and adjustable rate securities, the rate at period end. |
| (b) | Amount is stated in United States dollars unless otherwise noted. |
| (c) | Coupon rates for floating and adjustable rate securities reflect the rates in effect at period end. |
| (d) | Represents a forward settling transaction and therefore no collateral securities had been allocated as of period end. The agreement contemplated the delivery of U.S. Treasury Obligations as collateral on settlement date. |
| Other Information | ||
| # Additional information on each counterparty to the repurchase agreement is as follows: | ||
| Repurchase Agreement / Counterparty | Value ($) (000's) | |
| $575,551,000 due 4/03/23 at 4.80% | ||
| BNP Paribas, S.A. | 200,000 | |
| Bank of Nova Scotia | 8,881 | |
| BofA Securities, Inc. | 4,461 | |
| Credit Agricole CIB New York Branch | 17,782 | |
| ING Financial Markets LLC | 12,747 | |
| Nomura Securities International | 31,269 | |
| Sumitomo Mitsui Banking Corp. NY | 300,411 | |
| 575,551 | ||
| $963,585,000 due 4/03/23 at 4.80% | ||
| BNP Paribas, S.A. | 12,965 | |
| Bank of Nova Scotia | 5,638 | |
| BofA Securities, Inc. | 3,941 | |
| Credit Agricole CIB New York Branch | 13,729 | |
| ING Financial Markets LLC | 8,093 | |
| Nomura Securities International | 19,852 | |
| Sumitomo Mitsui Banking Corp. NY | 899,367 | |
| 963,585 | ||
| Statement of Assets and Liabilities | ||||
| Amounts in thousands (except per-share amounts) | March 31, 2023 | |||
| Assets | ||||
Investment in securities, at value (including repurchase agreements of $55,776,451) - See accompanying schedule Unaffiliated issuers (cost $59,374,564): | $ | 59,374,564 | ||
| Cash | 302,358 | |||
| Receivable for fund shares sold | 260,405 | |||
| Interest receivable | 32,002 | |||
| Prepaid expenses | 13 | |||
| Receivable from investment adviser for expense reductions | 2,345 | |||
| Other receivables | 373 | |||
Total assets | 59,972,060 | |||
| Liabilities | ||||
| Payable for investments purchased | $ | 96,000 | ||
| Payable for fund shares redeemed | 249,362 | |||
| Distributions payable | 104,212 | |||
| Accrued management fee | 6,163 | |||
| Distribution and service plan fees payable | 1,131 | |||
| Other affiliated payables | 2,107 | |||
| Other payables and accrued expenses | 2,047 | |||
| Total Liabilities | 461,022 | |||
| Net Assets | $ | 59,511,038 | ||
| Net Assets consist of: | ||||
| Paid in capital | $ | 59,510,965 | ||
| Total accumulated earnings (loss) | 73 | |||
| Net Assets | $ | 59,511,038 | ||
| Net Asset Value and Maximum Offering Price | ||||
| Class I : | ||||
Net Asset Value , offering price and redemption price per share ($22,833,975 ÷ 22,827,120 shares) | $ | 1.00 | ||
| Class II : | ||||
Net Asset Value , offering price and redemption price per share ($513,108 ÷ 512,791 shares) | $ | 1.00 | ||
| Class III : | ||||
Net Asset Value , offering price and redemption price per share ($3,040,858 ÷ 3,040,771 shares) | $ | 1.00 | ||
| Class IV : | ||||
Net Asset Value , offering price and redemption price per share ($975,132 ÷ 974,901 shares) | $ | 1.00 | ||
| Select Class : | ||||
Net Asset Value , offering price and redemption price per share ($213,589 ÷ 213,553 shares) | $ | 1.00 | ||
| Institutional Class : | ||||
Net Asset Value , offering price and redemption price per share ($31,934,376 ÷ 31,937,249 shares) | $ | 1.00 | ||
| Statement of Operations | ||||
| Amounts in thousands | Year ended March 31, 2023 | |||
| Investment Income | ||||
| Interest | $ | 1,082,202 | ||
| Expenses | ||||
| Management fee | $ | 48,416 | ||
| Transfer agent fees | 15,771 | |||
| Distribution and service plan fees | 11,888 | |||
| Accounting fees and expenses | 1,616 | |||
| Custodian fees and expenses | 100 | |||
| Independent trustees' fees and expenses | 117 | |||
| Registration fees | 2,128 | |||
| Audit | 49 | |||
| Legal | 19 | |||
| Miscellaneous | 68 | |||
| Total expenses before reductions | 80,172 | |||
| Expense reductions | (13,251) | |||
| Total expenses after reductions | 66,921 | |||
| Net Investment income (loss) | 1,015,281 | |||
| Realized and Unrealized Gain (Loss) | ||||
| Net realized gain (loss) on: | ||||
| Investment Securities: | ||||
| Unaffiliated issuers | (66) | |||
| Total net realized gain (loss) | (66) | |||
| Net increase in net assets resulting from operations | $ | 1,015,215 | ||
| Statement of Changes in Net Assets | ||||
| Amount in thousands | Year ended March 31, 2023 | Year ended March 31, 2022 | ||
| Increase (Decrease) in Net Assets | ||||
| Operations | ||||
| Net investment income (loss) | $ | 1,015,281 | $ | 4,079 |
| Net realized gain (loss) | (66) | (124) | ||
Net increase in net assets resulting from operations | 1,015,215 | 3,955 | ||
| Distributions to shareholders | (1,014,763) | (4,495) | ||
| Share transactions - net increase (decrease) | 35,490,794 | (3,072,354) | ||
| Total increase (decrease) in net assets | 35,491,246 | (3,072,894) | ||
| Net Assets | ||||
| Beginning of period | 24,019,792 | 27,092,686 | ||
| End of period | $ | 59,511,038 | $ | 24,019,792 |
| Treasury Portfolio Class I |
| Years ended March 31, | 2023 | 2022 | 2021 | 2020 | 2019 | |||||
Selected Per-Share Data | ||||||||||
| Net asset value, beginning of period | $ | 1.00 | $ | 1.00 | $ | 1.00 | $ | 1.00 | $ | 1.00 |
| Income from Investment Operations | ||||||||||
Net investment income (loss) A | .026 | - B | - B | .018 | .019 | |||||
Net realized and unrealized gain (loss) B | - | - | - | - | - | |||||
| Total from investment operations | .026 | - B | - B | .018 | .019 | |||||
| Distributions from net investment income | (.026) | - B | - B | (.018) | (.019) | |||||
| Distributions from net realized gain | - | - B | - | - | - | |||||
| Total distributions | (.026) | - B | - B | (.018) | (.019) | |||||
| Net asset value, end of period | $ | 1.00 | $ | 1.00 | $ | 1.00 | $ | 1.00 | $ | 1.00 |
Total Return C | 2.62% | .02% | .05% | 1.82% | 1.96% | |||||
Ratios to Average Net Assets A,D,E | ||||||||||
| Expenses before reductions | .21% | .21% | .21% | .21% | .21% | |||||
| Expenses net of fee waivers, if any | .18% | .08% | .15% | .18% | .18% | |||||
| Expenses net of all reductions | .18% | .08% | .15% | .18% | .18% | |||||
| Net investment income (loss) | 2.96% | .01% | .06% | 1.77% | 1.96% | |||||
| Supplemental Data | ||||||||||
| Net assets, end of period (in millions) | $ | 22,834 | $ | 9,402 | $ | 10,411 | $ | 12,043 | $ | 9,862 |
| Treasury Portfolio Class II |
| Years ended March 31, | 2023 | 2022 | 2021 | 2020 | 2019 | |||||
Selected Per-Share Data | ||||||||||
| Net asset value, beginning of period | $ | 1.00 | $ | 1.00 | $ | 1.00 | $ | 1.00 | $ | 1.00 |
| Income from Investment Operations | ||||||||||
Net investment income (loss) A | .024 | - B | - B | .017 | .018 | |||||
Net realized and unrealized gain (loss) B | - | - | - | - | - | |||||
| Total from investment operations | .024 | - B | - B | .017 | .018 | |||||
| Distributions from net investment income | (.024) | - B | - B | (.017) | (.018) | |||||
| Distributions from net realized gain | - | - B | - | - | - | |||||
| Total distributions | (.024) | - B | - B | (.017) | (.018) | |||||
| Net asset value, end of period | $ | 1.00 | $ | 1.00 | $ | 1.00 | $ | 1.00 | $ | 1.00 |
Total Return C | 2.46% | .01% | .01% | 1.67% | 1.81% | |||||
Ratios to Average Net Assets A,D,E | ||||||||||
| Expenses before reductions | .36% | .36% | .36% | .36% | .36% | |||||
| Expenses net of fee waivers, if any | .33% | .08% | .19% | .33% | .33% | |||||
| Expenses net of all reductions | .33% | .08% | .19% | .33% | .33% | |||||
| Net investment income (loss) | 2.81% | .01% | .02% | 1.62% | 1.81% | |||||
| Supplemental Data | ||||||||||
| Net assets, end of period (in millions) | $ | 513 | $ | 411 | $ | 648 | $ | 884 | $ | 659 |
| Treasury Portfolio Class III |
| Years ended March 31, | 2023 | 2022 | 2021 | 2020 | 2019 | |||||
Selected Per-Share Data | ||||||||||
| Net asset value, beginning of period | $ | 1.00 | $ | 1.00 | $ | 1.00 | $ | 1.00 | $ | 1.00 |
| Income from Investment Operations | ||||||||||
Net investment income (loss) A | .023 | - B | - B | .016 | .017 | |||||
Net realized and unrealized gain (loss) B | - | - | - | - | - | |||||
| Total from investment operations | .023 | - B | - B | .016 | .017 | |||||
| Distributions from net investment income | (.023) | - B | - B | (.016) | (.017) | |||||
| Distributions from net realized gain | - | - B | - | - | - | |||||
| Total distributions | (.023) | - B | - B | (.016) | (.017) | |||||
| Net asset value, end of period | $ | 1.00 | $ | 1.00 | $ | 1.00 | $ | 1.00 | $ | 1.00 |
Total Return C | 2.37% | .01% | .01% | 1.56% | 1.71% | |||||
Ratios to Average Net Assets A,D,E | ||||||||||
| Expenses before reductions | .46% | .46% | .46% | .46% | .46% | |||||
| Expenses net of fee waivers, if any | .42% | .08% | .19% | .43% | .43% | |||||
| Expenses net of all reductions | .42% | .08% | .19% | .43% | .43% | |||||
| Net investment income (loss) | 2.71% | .01% | .02% | 1.52% | 1.71% | |||||
| Supplemental Data | ||||||||||
| Net assets, end of period (in millions) | $ | 3,041 | $ | 2,612 | $ | 2,309 | $ | 2,469 | $ | 2,448 |
| Treasury Portfolio Class IV |
| Years ended March 31, | 2023 | 2022 | 2021 | 2020 | 2019 | |||||
Selected Per-Share Data | ||||||||||
| Net asset value, beginning of period | $ | 1.00 | $ | 1.00 | $ | 1.00 | $ | 1.00 | $ | 1.00 |
| Income from Investment Operations | ||||||||||
Net investment income (loss) A | .021 | - B | - B | .013 | .014 | |||||
Net realized and unrealized gain (loss) B | - | - | - | - | - | |||||
| Total from investment operations | .021 | - B | - B | .013 | .014 | |||||
| Distributions from net investment income | (.021) | - B | - B | (.013) | (.014) | |||||
| Distributions from net realized gain | - | - B | - | - | - | |||||
| Total distributions | (.021) | - B | - B | (.013) | (.014) | |||||
| Net asset value, end of period | $ | 1.00 | $ | 1.00 | $ | 1.00 | $ | 1.00 | $ | 1.00 |
Total Return C | 2.14% | .01% | .01% | 1.32% | 1.46% | |||||
Ratios to Average Net Assets A,D,E | ||||||||||
| Expenses before reductions | .71% | .71% | .71% | .71% | .71% | |||||
| Expenses net of fee waivers, if any | .65% | .08% | .19% | .67% | .68% | |||||
| Expenses net of all reductions | .65% | .08% | .19% | .67% | .68% | |||||
| Net investment income (loss) | 2.49% | .01% | .02% | 1.28% | 1.46% | |||||
| Supplemental Data | ||||||||||
| Net assets, end of period (in millions) | $ | 975 | $ | 1,146 | $ | 988 | $ | 1,033 | $ | 1,217 |
| Treasury Portfolio Select Class |
| Years ended March 31, | 2023 | 2022 | 2021 | 2020 | 2019 | |||||
Selected Per-Share Data | ||||||||||
| Net asset value, beginning of period | $ | 1.00 | $ | 1.00 | $ | 1.00 | $ | 1.00 | $ | 1.00 |
| Income from Investment Operations | ||||||||||
Net investment income (loss) A | .025 | - B | - B | .018 | .019 | |||||
Net realized and unrealized gain (loss) B | - | - | - | - | - | |||||
| Total from investment operations | .025 | - B | - B | .018 | .019 | |||||
| Distributions from net investment income | (.025) | - B | - B | (.018) | (.019) | |||||
| Distributions from net realized gain | - | - B | - | - | - | |||||
| Total distributions | (.025) | - B | - B | (.018) | (.019) | |||||
| Net asset value, end of period | $ | 1.00 | $ | 1.00 | $ | 1.00 | $ | 1.00 | $ | 1.00 |
Total Return C | 2.56% | .01% | .03% | 1.77% | 1.91% | |||||
Ratios to Average Net Assets A,D,E | ||||||||||
| Expenses before reductions | .26% | .26% | .26% | .26% | .26% | |||||
| Expenses net of fee waivers, if any | .23% | .08% | .17% | .23% | .23% | |||||
| Expenses net of all reductions | .23% | .08% | .17% | .23% | .23% | |||||
| Net investment income (loss) | 2.91% | .01% | .03% | 1.72% | 1.91% | |||||
| Supplemental Data | ||||||||||
| Net assets, end of period (in millions) | $ | 214 | $ | 254 | $ | 198 | $ | 424 | $ | 239 |
| Treasury Portfolio Institutional Class |
| Years ended March 31, | 2023 | 2022 | 2021 | 2020 | 2019 | |||||
Selected Per-Share Data | ||||||||||
| Net asset value, beginning of period | $ | 1.00 | $ | 1.00 | $ | 1.00 | $ | 1.00 | $ | 1.00 |
| Income from Investment Operations | ||||||||||
Net investment income (loss) A | .026 | - B | .001 | .018 | .020 | |||||
Net realized and unrealized gain (loss) B | - | - | - | - | - | |||||
| Total from investment operations | .026 | - B | .001 | .018 | .020 | |||||
| Distributions from net investment income | (.026) | - B | (.001) | (.018) | (.020) | |||||
| Distributions from net realized gain | - | - B | - | - | - | |||||
| Total distributions | (.026) | - B | (.001) | (.018) | (.020) | |||||
| Net asset value, end of period | $ | 1.00 | $ | 1.00 | $ | 1.00 | $ | 1.00 | $ | 1.00 |
Total Return C | 2.66% | .02% | .07% | 1.86% | 2.00% | |||||
Ratios to Average Net Assets A,D,E | ||||||||||
| Expenses before reductions | .18% | .18% | .18% | .18% | .18% | |||||
| Expenses net of fee waivers, if any | .14% | .07% | .13% | .14% | .14% | |||||
| Expenses net of all reductions | .14% | .07% | .13% | .14% | .14% | |||||
| Net investment income (loss) | 3.00% | .02% | .07% | 1.81% | 2.00% | |||||
| Supplemental Data | ||||||||||
| Net assets, end of period (in millions) | $ | 31,934 | $ | 10,195 | $ | 12,539 | $ | 19,926 | $ | 10,505 |
| Current 7-Day Yields | ||
| Class I | 4.72% | |
| Class II | 4.57% | |
| Class III | 4.47% | |
| Select Class | 4.67% | |
| Institutional Class | 4.76% | |
Yield refers to the income paid by the Fund over a given period. Yield for money market funds is usually for seven-day periods, as it is here, though it is expressed as an annual percentage rate. Past performance is no guarantee of future results. Yield will vary and it's possible to lose money investing in the Fund. A portion of the Fund's expenses was reimbursed and/or waived. Absent such reimbursements and/or waivers the yield for the period ending March 31, 2023, the most recent period shown in the table, would have been 4.65% for Class I, 4.51% for Class II, 4.41% for Class III, 4.60% for Select Class, and 4.68% for Institutional Class. | ||
| Effective Maturity Diversification (% of Fund's Investments) | ||
| Days | ||
| 1 - 7 | 96.1 | |
| 8 - 30 | 0.9 | |
| 31 - 60 | 0.9 | |
| 61 - 90 | 0.8 | |
| 91 - 180 | 0.4 | |
| > 180 | 0.9 | |
| Effective maturity is determined in accordance with the requirements of Rule 2a-7 under the Investment Company Act of 1940. | ||
Asset Allocation (% of Fund's net assets) |
 |
Net Other Assets (Liabilities) - (0.1)% |
Net Other Assets (Liabilities) are not available in the pie chart. |
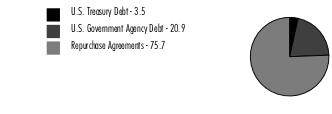
| U.S. Treasury Debt - 3.5% | ||||
| Yield (%)(a) | Principal Amount (b) (000s) | Value ($) (000s) | ||
| U.S. Treasury Inflation Protected Obligations - 0.8% | ||||
| U.S. Treasury Notes | ||||
| 4/15/23 | 5.11 | 1,424,841 | 1,426,838 | |
| U.S. Treasury Obligations - 2.7% | ||||
| U.S. Treasury Bills | ||||
| 4/6/23 | 4.80 | 61,000 | 60,959 | |
| U.S. Treasury Notes | ||||
| 4/30/23 to 10/31/24 (c) | 4.66 to 4.87 | 4,566,283 | 4,565,045 | |
TOTAL U.S. TREASURY OBLIGATIONS | 4,626,004 | |||
| TOTAL U.S. TREASURY DEBT (Cost $6,052,842) | 6,052,842 | |||
| U.S. Government Agency Debt - 20.9% | ||||
| Yield (%)(a) | Principal Amount (b) (000s) | Value ($) (000s) | ||
| Federal Agencies - 20.9% | ||||
| Federal Farm Credit Bank | ||||
| 6/7/23 to 3/10/25 (c) | 2.59 to 5.02 | 2,183,000 | 2,182,923 | |
| Federal Home Loan Bank | ||||
| 4/3/23 to 11/22/24 (c) | 4.83 to 5.28 | 33,321,670 | 33,302,447 | |
| Federal Home Loan Bank | ||||
| 4/5/23 to 4/12/23 | 4.81 to 4.84 | 94,000 | 93,954 | |
| Freddie Mac | ||||
| 5/3/24 (c)(d) | 4.95 | 410,000 | 410,000 | |
| TOTAL U.S. GOVERNMENT AGENCY DEBT (Cost $35,989,324) | 35,989,324 | |||
| U.S. Government Agency Repurchase Agreement - 12.8% | |||
Maturity Amount ($) (000s) | Value ($) (000s) | ||
| In a joint trading account at: | |||
| 4.81% dated 3/31/23 due 4/3/23 (Collateralized by U.S. Government Obligations) # | 2,843,673 | 2,842,535 | |
| 4.82% dated 3/31/23 due 4/3/23 (Collateralized by U.S. Government Obligations) # | 5,428,364 | 5,426,187 | |
| With: | |||
| ABN AMRO Bank NV at 4.81%, dated 3/31/23 due 4/3/23 (Collateralized by U.S. Government Obligations valued at $308,163,473, 0.38% - 6.00%, 2/15/25 - 3/1/53) | 302,121 | 302,000 | |
| BMO Harris Bank NA at 4.81%, dated 3/23/23 due 4/7/23 | |||
(Collateralized by U.S. Government Obligations valued at $174,676,349, 2.50% - 7.00%, 12/20/41 - 12/20/62) | 171,457 | 171,000 | |
(Collateralized by U.S. Government Obligations valued at $146,074,374, 3.00% - 4.50%, 11/20/42 - 4/20/52) | 143,611 | 143,000 | |
(Collateralized by U.S. Government Obligations valued at $194,084,832, 2.50% - 5.00%, 8/20/40 - 2/20/52) | 191,066 | 190,000 | |
| BNP Paribas, SA at: | |||
4.75%, dated 2/28/23 due 4/7/23 (Collateralized by U.S. Government Obligations valued at $900,278,432, 0.00% - 7.00%, 4/11/23 - 3/15/62) | 884,835 | 878,000 | |
4.8%, dated 2/17/23 due 4/7/23 (Collateralized by U.S. Government Obligations valued at $325,280,065, 0.00% - 6.50%, 6/29/23 - 1/15/63) | 320,762 | 317,000 | |
4.81%, dated: | |||
| 3/6/23 due 4/7/23 (Collateralized by U.S. Government Obligations valued at $1,006,551,387, 0.00% - 7.50%, 4/6/23 - 3/1/53) | 991,266 | 983,000 | |
| 3/27/23 due 4/7/23 (Collateralized by U.S. Government Obligations valued at $109,249,437, 0.00% - 6.00%, 7/27/23 - 3/1/53) | 107,200 | 107,000 | |
| 3/30/23 due 4/6/23 (Collateralized by U.S. Government Obligations valued at $1,547,146,443, 0.13% - 7.50%, 7/15/24 - 3/20/53) | 1,517,418 | 1,516,000 | |
4.91%, dated 3/3/23 due 4/7/23 (Collateralized by U.S. Government Obligations valued at $362,605,121, 0.00% - 6.50%, 6/29/23 - 3/1/53) | 358,534 | 354,000 | |
| BofA Securities, Inc. at: | |||
4.75%, dated 2/28/23 due 4/7/23 (Collateralized by U.S. Treasury Obligations valued at $205,939,821, 0.38% - 3.88%, 11/30/25 - 11/30/27) | 202,724 | 201,000 | |
4.82%, dated 3/28/23 due 4/4/23 (Collateralized by U.S. Government Obligations valued at $399,140,386, 2.00% - 6.00%, 6/20/37 - 3/20/53) | 391,366 | 391,000 | |
4.87%, dated: | |||
| 3/17/23 due 4/7/23 (Collateralized by U.S. Treasury Obligations valued at $143,120,977, 2.25% - 4.00%, 4/30/24 - 10/31/29) (c)(d)(e) | 140,606 | 140,000 | |
| 3/20/23 due 4/7/23 (Collateralized by U.S. Treasury Obligations valued at $95,036,673, 2.88% - 4.50%, 11/30/24 - 4/30/29) (c)(d)(e) | 93,365 | 93,000 | |
| 3/21/23 due 4/7/23 (Collateralized by U.S. Treasury Obligations valued at $95,024,614, 4.50%, 11/30/24) (c)(d)(e) | 93,428 | 93,000 | |
| 3/24/23 due 4/7/23 (Collateralized by U.S. Treasury Obligations valued at $193,040,474, 0.25% - 2.50%, 4/30/24 - 5/15/24) (c)(d)(e) | 189,844 | 189,000 | |
| CIBC Bank U.S.A. at: | |||
4.81%, dated 3/23/23 due 4/7/23 (Collateralized by U.S. Government Obligations valued at $501,556,066, 2.00% - 7.00%, 2/25/36 - 4/1/59) | 493,755 | 491,000 | |
4.87%, dated 3/23/23 due 5/4/23 (Collateralized by U.S. Treasury Obligations valued at $12,304,169, 0.00% - 7.00%, 3/31/30 - 2/1/53) | 12,068 | 12,000 | |
| Citibank NA at 4.83%, dated 3/30/23 due 4/6/23 (Collateralized by U.S. Treasury Obligations valued at $308,506,535, 0.00% - 7.50%, 4/3/23 - 4/1/53) | 300,282 | 300,000 | |
| Citigroup Global Capital Markets, Inc. at: | |||
4.81%, dated 3/23/23 due 4/7/23 (Collateralized by U.S. Government Obligations valued at $290,105,763, 2.25% - 6.50%, 10/31/24 - 10/20/52) | 285,594 | 284,000 | |
4.83%, dated 3/30/23 due 4/6/23 (Collateralized by U.S. Treasury Obligations valued at $255,136,926, 0.38% - 0.88%, 1/31/26 - 6/30/26) | 250,235 | 250,000 | |
| Goldman Sachs & Co. at 4.81%, dated: | |||
3/27/23 due 4/3/23 (Collateralized by U.S. Government Obligations valued at $798,386,016, 0.25% - 7.50%, 7/2/24 - 6/15/64) | 782,731 | 782,000 | |
3/29/23 due 4/5/23 (Collateralized by U.S. Government Obligations valued at $808,379,683, 0.00% - 7.00%, 4/17/23 - 2/1/53) | 792,741 | 792,000 | |
3/30/23 due: | |||
| 4/4/23 (Collateralized by U.S. Government Obligations valued at $613,347,626, 0.50% - 6.50%, 10/1/26 - 3/1/53) | 601,402 | 601,000 | |
| 4/6/23 (Collateralized by U.S. Government Obligations valued at $408,218,054, 1.13% - 5.75%, 5/20/30 - 10/15/64) | 400,374 | 400,000 | |
| Mitsubishi UFJ Securities (U.S.A.), Inc. at 4.84%, dated 3/23/23 due 6/5/23 (Collateralized by U.S. Government Obligations valued at $784,518,519, 0.00% - 6.50%, 1/1/24 - 4/1/53) | 775,641 | 768,000 | |
| RBC Dominion Securities at 4.81%, dated 3/23/23 due 4/7/23 (Collateralized by U.S. Government Obligations valued at $927,521,358, 0.00% - 5.50%, 9/24/26 - 2/20/53) | 913,095 | 908,000 | |
| RBC Financial Group at 4.81%, dated 3/23/23 due 4/7/23 (Collateralized by U.S. Treasury Obligations valued at $1,751,861,325, 0.00% - 6.50%, 4/15/23 - 2/16/64) | 1,719,596 | 1,710,000 | |
| TD Securities (U.S.A.) at 4.82%, dated 3/31/23 due 4/3/23 (Collateralized by U.S. Government Obligations valued at $452,041,497, 2.00% - 7.00%, 3/1/32 - 3/1/53) | 443,178 | 443,000 | |
| TOTAL U.S. GOVERNMENT AGENCY REPURCHASE AGREEMENT (Cost $22,077,722) | 22,077,722 | ||
| U.S. Treasury Repurchase Agreement - 62.9% | |||
Maturity Amount ($) (000s) | Value ($) (000s) | ||
| With: | |||
| ABN AMRO Bank NV at 4.8%, dated 3/31/23 due 4/3/23 (Collateralized by U.S. Treasury Obligations valued at $332,389,792, 0.38% - 3.25%, 1/31/24 - 6/30/29) | 324,270 | 324,140 | |
| Barclays Bank PLC at 4.8%, dated 3/31/23 due 4/3/23 (Collateralized by U.S. Treasury Obligations valued at $681,632,565, 2.38% - 4.00%, 7/31/27 - 11/30/29) | 668,267 | 668,000 | |
| CIBC Bank U.S.A. at 4.81%, dated 3/23/23 due 4/7/23 (Collateralized by U.S. Treasury Obligations valued at $542,807,943, 0.75% - 4.63%, 7/31/24 - 2/15/47) | 533,977 | 531,000 | |
| Federal Reserve Bank of New York at 4.8%, dated 3/31/23 due 4/3/23 (Collateralized by U.S. Treasury Obligations valued at $101,842,720,830, 0.13% - 4.50%, 6/30/23 - 5/15/42) | 101,842,721 | 101,802,000 | |
| Fixed Income Clearing Corp. - BNYM at 4.81%, dated 3/31/23 due 4/3/23 (Collateralized by U.S. Treasury Obligations valued at $922,080,078, 1.13% - 4.00%, 2/15/31 - 11/15/52) | 904,362 | 904,000 | |
| Fixed Income Clearing Corp. - SSB at: | |||
4.81%, dated 3/31/23 due 4/3/23 (Collateralized by U.S. Treasury Obligations valued at $552,764,756, 1.38% - 3.13%, 10/31/28 - 11/15/28) | 542,217 | 542,000 | |
4.88%, dated 3/31/23 due 4/3/23 (Collateralized by U.S. Treasury Obligations valued at $359,793,494, 2.00% - 2.38%, 11/15/41 - 2/15/42) | 352,143 | 352,000 | |
| ING Financial Markets LLC at 4.81%, dated 3/31/23 due 4/3/23 (Collateralized by U.S. Treasury Obligations valued at $275,762,435, 1.88% - 3.63%, 7/31/26 - 3/31/30) | 270,108 | 270,000 | |
| Lloyds Bank PLC at: | |||
4.75%, dated: | |||
| 2/6/23 due 5/9/23 (Collateralized by U.S. Treasury Obligations valued at $78,057,835, 2.25% - 2.88%, 8/15/24 - 8/15/27) | 76,923 | 76,000 | |
| 2/7/23 due 5/9/23 (Collateralized by U.S. Treasury Obligations valued at $49,280,354, 2.50% - 2.88%, 1/31/25 - 11/30/25) | 48,576 | 48,000 | |
4.77%, dated 3/2/23 due 5/2/23 (Collateralized by U.S. Treasury Obligations valued at $104,408,412, 0.75% - 2.88%, 11/15/24 - 11/30/25) | 102,824 | 102,000 | |
4.82%, dated 3/9/23 due 5/9/23 (Collateralized by U.S. Treasury Obligations valued at $104,325,938, 2.88% - 3.25%, 6/30/27 - 8/15/28) | 102,833 | 102,000 | |
4.83%, dated 3/23/23 due 4/24/23 (Collateralized by U.S. Treasury Obligations valued at $108,224,235, 0.38% - 2.88%, 11/30/25 - 7/31/27) | 106,455 | 106,000 | |
4.84%, dated 3/27/23 due 5/4/23 (Collateralized by U.S. Treasury Obligations valued at $88,761,063, 2.50% - 2.88%, 1/31/25 - 11/30/25) | 87,444 | 87,000 | |
4.86%, dated 3/16/23 due 5/16/23 (Collateralized by U.S. Treasury Obligations valued at $53,136,820, 3.25%, 6/30/27) | 52,428 | 52,000 | |
4.87%, dated 2/22/23 due 5/22/23 (Collateralized by U.S. Treasury Obligations valued at $83,056,720, 0.38%, 7/31/27) | 81,975 | 81,000 | |
4.9%, dated 2/28/23 due 5/30/23 (Collateralized by U.S. Treasury Obligations valued at $94,217,042, 3.25%, 6/30/27) | 93,140 | 92,000 | |
| MUFG Securities (Canada), Ltd. at 4.81%, dated 3/23/23 due 4/7/23 (Collateralized by U.S. Treasury Obligations valued at $108,280,619, 0.25% - 6.38%, 4/30/24 - 2/15/52) | 106,453 | 106,000 | |
| MUFG Securities EMEA PLC at: | |||
4.82%, dated: | |||
| 3/31/23 due 4/3/23 (Collateralized by U.S. Treasury Obligations valued at $274,240,462, 0.63% - 4.13%, 9/15/25 - 2/15/49) | 269,108 | 269,000 | |
| 4/3/23 due 4/4/23 (f) | 271,036 | 271,000 | |
4.83%, dated 3/31/23 due 4/3/23 (Collateralized by U.S. Treasury Obligations valued at $553,097,446, 0.00% - 4.63%, 5/31/23 - 11/15/52) | 542,218 | 542,000 | |
| NatWest Markets Securities Inc. at 4.8%, dated 3/31/23 due 4/3/23 (Collateralized by U.S. Treasury Obligations valued at $58,163,314, 3.13%, 8/31/29) | 57,023 | 57,000 | |
| Norinchukin Bank at 4.9%, dated 3/28/23 due 4/4/23 (Collateralized by U.S. Treasury Obligations valued at $22,449,225, 2.75%, 5/31/29) | 22,021 | 22,000 | |
| Prudential Insurance Co. of America at 4.82%, dated 3/31/23 due 4/3/23 (Collateralized by U.S. Treasury Obligations valued at $305,731,002, 1.25% - 7.50%, 9/30/24 - 2/15/31) | 299,639 | 299,519 | |
| Societe Generale at 4.81%, dated 3/30/23 due 4/6/23 (Collateralized by U.S. Treasury Obligations valued at $512,721,098, 0.38% - 4.25%, 8/15/24 - 2/15/52) | 502,470 | 502,000 | |
| Sumitomo Mitsui Trust Bank Ltd. at 4.85%, dated 3/29/23 due 4/7/23 (Collateralized by U.S. Treasury Obligations valued at $39,698,651, 1.63% - 3.25%, 8/31/24 - 8/15/29) | 38,823 | 38,750 | |
| TOTAL U.S. TREASURY REPURCHASE AGREEMENT (Cost $108,246,409) | 108,246,409 | ||
| TOTAL INVESTMENT IN SECURITIES - 100.1% (Cost $172,366,297) | 172,366,297 |
NET OTHER ASSETS (LIABILITIES) - (0.1)% | (218,215) |
| NET ASSETS - 100.0% | 172,148,082 |
| (a) | Yield represents either the annualized yield at the date of purchase, or the stated coupon rate, or, for floating and adjustable rate securities, the rate at period end. |
| (b) | Amount is stated in United States dollars unless otherwise noted. |
| (c) | Coupon rates for floating and adjustable rate securities reflect the rates in effect at period end. |
| (d) | Coupon is indexed to a floating interest rate which may be multiplied by a specified factor and/or subject to caps or floors. |
| (e) | The maturity amount is based on the rate at period end. |
| (f) | Represents a forward settling transaction and therefore no collateral securities had been allocated as of period end. The agreement contemplated the delivery of U.S. Treasury Obligations as collateral on settlement date. |
| Other Information | ||
| # Additional information on each counterparty to the repurchase agreement is as follows: | ||
| Repurchase Agreement / Counterparty | Value ($) (000's) | |
| $2,842,535,000 due 4/03/23 at 4.81% | ||
| BNP Paribas, S.A. | 36,762 | |
| Bank of Nova Scotia | 15,987 | |
| BofA Securities, Inc. | 11,176 | |
| Credit Agricole CIB New York Branch | 38,928 | |
| ING Financial Markets LLC | 22,946 | |
| Nomura Securities International | 56,288 | |
| Sumitomo Mitsui Banking Corp. | 1,336,794 | |
| Sumitomo Mitsui Banking Corp. NY | 1,323,654 | |
| 2,842,535 | ||
| $5,426,187,000 due 4/03/23 at 4.82% | ||
| Bank of America, N.A. | 727,012 | |
| BofA Securities, Inc. | 100,974 | |
| Citigroup Global Markets, Inc. | 504,869 | |
| HSBC Securities (USA), Inc. | 90,876 | |
| Mitsubishi UFJ Securities Holdings Ltd | 151,461 | |
| Mizuho Securities USA, Inc. | 50,487 | |
| Nomura Securities International | 807,791 | |
| RBC Dominion Securities, Inc. | 605,844 | |
| Sumitomo Mitsui Banking Corp. | 1,376,655 | |
| Sumitomo Mitsui Banking Corp. NY | 478 | |
| Wells Fargo Securities LLC | 1,009,740 | |
| 5,426,187 | ||
| Statement of Assets and Liabilities | ||||
| Amounts in thousands (except per-share amounts) | March 31, 2023 | |||
| Assets | ||||
Investment in securities, at value (including repurchase agreements of $130,324,131) - See accompanying schedule Unaffiliated issuers (cost $172,366,297): | $ | 172,366,297 | ||
| Cash | 2 | |||
| Receivable for fund shares sold | 485,266 | |||
| Interest receivable | 243,634 | |||
| Prepaid expenses | 59 | |||
| Receivable from investment adviser for expense reductions | 4,949 | |||
| Other receivables | 1,340 | |||
Total assets | 173,101,547 | |||
| Liabilities | ||||
| Payable for investments purchased | $ | 343,306 | ||
| Payable for fund shares redeemed | 335,647 | |||
| Distributions payable | 247,733 | |||
| Accrued management fee | 17,726 | |||
| Distribution and service plan fees payable | 969 | |||
| Other affiliated payables | 5,187 | |||
| Other payables and accrued expenses | 2,897 | |||
| Total Liabilities | 953,465 | |||
| Net Assets | $ | 172,148,082 | ||
| Net Assets consist of: | ||||
| Paid in capital | $ | 172,148,031 | ||
| Total accumulated earnings (loss) | 51 | |||
| Net Assets | $ | 172,148,082 | ||
| Net Asset Value and Maximum Offering Price | ||||
| Class I : | ||||
Net Asset Value , offering price and redemption price per share ($44,904,989 ÷ 44,892,566 shares) | $ | 1.00 | ||
| Class II : | ||||
Net Asset Value , offering price and redemption price per share ($942,328 ÷ 941,850 shares) | $ | 1.00 | ||
| Class III : | ||||
Net Asset Value , offering price and redemption price per share ($4,188,981 ÷ 4,186,864 shares) | $ | 1.00 | ||
| Select Class : | ||||
Net Asset Value , offering price and redemption price per share ($218,451 ÷ 218,422 shares) | $ | 1.00 | ||
| Institutional Class : | ||||
Net Asset Value , offering price and redemption price per share ($121,893,333 ÷ 121,897,782 shares) | $ | 1.00 | ||
| Statement of Operations | ||||
| Amounts in thousands | Year ended March 31, 2023 | |||
| Investment Income | ||||
| Interest | $ | 3,469,901 | ||
| Expenses | ||||
| Management fee | $ | 174,141 | ||
| Transfer agent fees | 48,561 | |||
| Distribution and service plan fees | 11,315 | |||
| Accounting fees and expenses | 3,322 | |||
| Custodian fees and expenses | 380 | |||
| Independent trustees' fees and expenses | 451 | |||
| Registration fees | 2,099 | |||
| Audit | 51 | |||
| Legal | 83 | |||
| Miscellaneous | 315 | |||
| Total expenses before reductions | 240,718 | |||
| Expense reductions | (40,500) | |||
| Total expenses after reductions | 200,218 | |||
| Net Investment income (loss) | 3,269,683 | |||
| Realized and Unrealized Gain (Loss) | ||||
| Net realized gain (loss) on: | ||||
| Investment Securities: | ||||
| Unaffiliated issuers | (684) | |||
| Total net realized gain (loss) | (684) | |||
| Net increase in net assets resulting from operations | $ | 3,268,999 | ||
| Statement of Changes in Net Assets | ||||
| Amount in thousands | Year ended March 31, 2023 | Year ended March 31, 2022 | ||
| Increase (Decrease) in Net Assets | ||||
| Operations | ||||
| Net investment income (loss) | $ | 3,269,683 | $ | 20,326 |
| Net realized gain (loss) | (684) | 29 | ||
Net increase in net assets resulting from operations | 3,268,999 | 20,355 | ||
| Distributions to shareholders | (3,268,145) | (21,170) | ||
| Share transactions - net increase (decrease) | 44,414,081 | (3,545,947) | ||
| Total increase (decrease) in net assets | 44,414,935 | (3,546,762) | ||
| Net Assets | ||||
| Beginning of period | 127,733,147 | 131,279,909 | ||
| End of period | $ | 172,148,082 | $ | 127,733,147 |
| Government Portfolio Class I |
| Years ended March 31, | 2023 | 2022 | 2021 | 2020 | 2019 | |||||
Selected Per-Share Data | ||||||||||
| Net asset value, beginning of period | $ | 1.00 | $ | 1.00 | $ | 1.00 | $ | 1.00 | $ | 1.00 |
| Income from Investment Operations | ||||||||||
Net investment income (loss) A | .025 | - B | - B | .018 | .020 | |||||
Net realized and unrealized gain (loss) B | - | - | - | - | - | |||||
| Total from investment operations | .025 | - B | - B | .018 | .020 | |||||
| Distributions from net investment income | (.025) | - B | - B | (.018) | (.020) | |||||
| Distributions from net realized gain | - | - B | - | - | - | |||||
| Total distributions | (.025) | - B | - B | (.018) | (.020) | |||||
| Net asset value, end of period | $ | 1.00 | $ | 1.00 | $ | 1.00 | $ | 1.00 | $ | 1.00 |
Total Return C | 2.57% | .02% | .04% | 1.83% | 1.97% | |||||
Ratios to Average Net Assets A,D,E | ||||||||||
| Expenses before reductions | .21% | .20% | .20% | .21% | .21% | |||||
| Expenses net of fee waivers, if any | .18% | .08% | .15% | .18% | .18% | |||||
| Expenses net of all reductions | .18% | .08% | .15% | .18% | .18% | |||||
| Net investment income (loss) | 2.61% | .01% | .05% | 1.77% | 1.96% | |||||
| Supplemental Data | ||||||||||
| Net assets, end of period (in millions) | $ | 44,905 | $ | 30,836 | $ | 33,508 | $ | 45,360 | $ | 29,352 |
| Government Portfolio Class II |
| Years ended March 31, | 2023 | 2022 | 2021 | 2020 | 2019 | |||||
Selected Per-Share Data | ||||||||||
| Net asset value, beginning of period | $ | 1.00 | $ | 1.00 | $ | 1.00 | $ | 1.00 | $ | 1.00 |
| Income from Investment Operations | ||||||||||
Net investment income (loss) A | .024 | - B | - B | .017 | .018 | |||||
Net realized and unrealized gain (loss) B | - | - | - | - | - | |||||
| Total from investment operations | .024 | - B | - B | .017 | .018 | |||||
| Distributions from net investment income | (.024) | - B | - B | (.017) | (.018) | |||||
| Distributions from net realized gain | - | - B | - | - | - | |||||
| Total distributions | (.024) | - B | - B | (.017) | (.018) | |||||
| Net asset value, end of period | $ | 1.00 | $ | 1.00 | $ | 1.00 | $ | 1.00 | $ | 1.00 |
Total Return C | 2.41% | .01% | .01% | 1.68% | 1.82% | |||||
Ratios to Average Net Assets A,D,E | ||||||||||
| Expenses before reductions | .36% | .35% | .35% | .36% | .36% | |||||
| Expenses net of fee waivers, if any | .33% | .08% | .17% | .33% | .33% | |||||
| Expenses net of all reductions | .33% | .08% | .17% | .33% | .33% | |||||
| Net investment income (loss) | 2.46% | .01% | .03% | 1.62% | 1.81% | |||||
| Supplemental Data | ||||||||||
| Net assets, end of period (in millions) | $ | 942 | $ | 959 | $ | 1,366 | $ | 697 | $ | 836 |
| Government Portfolio Class III |
| Years ended March 31, | 2023 | 2022 | 2021 | 2020 | 2019 | |||||
Selected Per-Share Data | ||||||||||
| Net asset value, beginning of period | $ | 1.00 | $ | 1.00 | $ | 1.00 | $ | 1.00 | $ | 1.00 |
| Income from Investment Operations | ||||||||||
Net investment income (loss) A | .023 | - B | - B | .016 | .017 | |||||
Net realized and unrealized gain (loss) B | - | - | - | - | - | |||||
| Total from investment operations | .023 | - B | - B | .016 | .017 | |||||
| Distributions from net investment income | (.023) | - B | - B | (.016) | (.017) | |||||
| Distributions from net realized gain | - | - B | - | - | - | |||||
| Total distributions | (.023) | - B | - B | (.016) | (.017) | |||||
| Net asset value, end of period | $ | 1.00 | $ | 1.00 | $ | 1.00 | $ | 1.00 | $ | 1.00 |
Total Return C | 2.32% | .01% | .01% | 1.57% | 1.72% | |||||
Ratios to Average Net Assets A,D,E | ||||||||||
| Expenses before reductions | .46% | .45% | .45% | .46% | .46% | |||||
| Expenses net of fee waivers, if any | .42% | .08% | .19% | .43% | .43% | |||||
| Expenses net of all reductions | .42% | .08% | .19% | .43% | .43% | |||||
| Net investment income (loss) | 2.37% | .01% | .02% | 1.52% | 1.71% | |||||
| Supplemental Data | ||||||||||
| Net assets, end of period (in millions) | $ | 4,189 | $ | 3,764 | $ | 3,234 | $ | 3,704 | $ | 3,397 |
| Government Portfolio Select Class |
| Years ended March 31, | 2023 | 2022 | 2021 | 2020 | 2019 | |||||
Selected Per-Share Data | ||||||||||
| Net asset value, beginning of period | $ | 1.00 | $ | 1.00 | $ | 1.00 | $ | 1.00 | $ | 1.00 |
| Income from Investment Operations | ||||||||||
Net investment income (loss) A | .025 | - B | - B | .018 | .019 | |||||
Net realized and unrealized gain (loss) B | - | - | - | - | - | |||||
| Total from investment operations | .025 | - B | - B | .018 | .019 | |||||
| Distributions from net investment income | (.025) | - B | - B | (.018) | (.019) | |||||
| Distributions from net realized gain | - | - B | - | - | - | |||||
| Total distributions | (.025) | - B | - B | (.018) | (.019) | |||||
| Net asset value, end of period | $ | 1.00 | $ | 1.00 | $ | 1.00 | $ | 1.00 | $ | 1.00 |
Total Return C | 2.51% | .01% | .03% | 1.78% | 1.92% | |||||
Ratios to Average Net Assets A,D,E | ||||||||||
| Expenses before reductions | .26% | .25% | .25% | .26% | .25% | |||||
| Expenses net of fee waivers, if any | .23% | .08% | .17% | .23% | .23% | |||||
| Expenses net of all reductions | .23% | .08% | .17% | .23% | .23% | |||||
| Net investment income (loss) | 2.56% | .02% | .03% | 1.72% | 1.91% | |||||
| Supplemental Data | ||||||||||
| Net assets, end of period (in millions) | $ | 218 | $ | 293 | $ | 367 | $ | 498 | $ | 335 |
| Government Portfolio Institutional Class |
| Years ended March 31, | 2023 | 2022 | 2021 | 2020 | 2019 | |||||
Selected Per-Share Data | ||||||||||
| Net asset value, beginning of period | $ | 1.00 | $ | 1.00 | $ | 1.00 | $ | 1.00 | $ | 1.00 |
| Income from Investment Operations | ||||||||||
Net investment income (loss) A | .026 | - B | .001 | .019 | .020 | |||||
Net realized and unrealized gain (loss) B | - | - | - | - | - | |||||
| Total from investment operations | .026 | - B | .001 | .019 | .020 | |||||
| Distributions from net investment income | (.026) | - B | (.001) | (.019) | (.020) | |||||
| Distributions from net realized gain | - | - B | - | - | - | |||||
| Total distributions | (.026) | - B | (.001) | (.019) | (.020) | |||||
| Net asset value, end of period | $ | 1.00 | $ | 1.00 | $ | 1.00 | $ | 1.00 | $ | 1.00 |
Total Return C | 2.61% | .02% | .07% | 1.87% | 2.01% | |||||
Ratios to Average Net Assets A,D,E | ||||||||||
| Expenses before reductions | .18% | .17% | .17% | .18% | .18% | |||||
| Expenses net of fee waivers, if any | .14% | .07% | .13% | .14% | .14% | |||||
| Expenses net of all reductions | .14% | .07% | .13% | .14% | .14% | |||||
| Net investment income (loss) | 2.65% | .02% | .07% | 1.81% | 2.00% | |||||
| Supplemental Data | ||||||||||
| Net assets, end of period (in millions) | $ | 121,893 | $ | 91,881 | $ | 92,805 | $ | 122,312 | $ | 75,150 |
| Current 7-Day Yields | ||
| Class I | 4.79% | |
| Class II | 4.64% | |
| Class III | 4.54% | |
| Select Class | 4.74% | |
| Institutional Class | 4.83% | |
Yield refers to the income paid by the Fund over a given period. Yield for money market funds is usually for seven-day periods, as it is here, though it is expressed as an annual percentage rate. Past performance is no guarantee of future results. Yield will vary and it's possible to lose money investing in the Fund. A portion of the Fund's expenses was reimbursed and/or waived. Absent such reimbursements and/or waivers the yield for the period ending March 31, 2023, the most recent period shown in the table, would have been 4.70% for Class I, 4.55% for Class II, 4.45% for Class III, 4.65% for Select Class, and 4.73% for Institutional Class. | ||
| Effective Maturity Diversification (% of Fund's Investments) | ||
| Days | ||
| 1 - 7 | 84.5 | |
| 8 - 30 | 1.1 | |
| 31 - 60 | 8.9 | |
| 61 - 90 | 2.9 | |
| 91 - 180 | 2.6 | |
| Effective maturity is determined in accordance with the requirements of Rule 2a-7 under the Investment Company Act of 1940. | ||
Asset Allocation (% of Fund's net assets) |
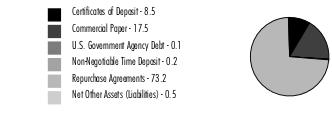 |
| Certificate of Deposit - 8.5% | ||||
| Yield (%)(a) | Principal Amount (b) (000s) | Value ($) (000s) | ||
| Domestic Certificates Of Deposit - 0.5% | ||||
| Bank of America NA | ||||
| 7/11/23 to 8/31/23 (c) | 5.12 to 5.14 | 534,000 | 534,000 | |
| New York Branch, Yankee Dollar, Foreign Banks - 8.0% | ||||
| Bank of Montreal | ||||
| 4/4/23 (c)(d) | 5.24 | 109,000 | 109,000 | |
| Canadian Imperial Bank of Commerce | ||||
| 4/4/23 (c)(d) | 5.23 | 543,000 | 543,000 | |
| Credit Agricole CIB | ||||
| 5/2/23 to 6/15/23 | 4.82 to 5.02 | 1,662,000 | 1,662,000 | |
| Mitsubishi UFJ Trust & Banking Corp. | ||||
| 5/4/23 to 5/5/23 | 4.82 to 4.82 | 966,000 | 966,000 | |
| Mizuho Corporate Bank Ltd. | ||||
| 5/5/23 to 5/12/23 | 4.81 to 4.85 | 2,227,000 | 2,227,000 | |
| MUFG Bank Ltd. | ||||
| 4/19/23 to 4/21/23 (c)(d) | 5.17 to 5.19 | 1,051,000 | 1,051,000 | |
| Sumitomo Mitsui Trust Bank Ltd. | ||||
| 5/8/23 to 6/15/23 | 4.82 to 5.00 | 1,220,000 | 1,220,000 | |
TOTAL NEW YORK BRANCH, YANKEE DOLLAR, FOREIGN BANKS | 7,778,000 | |||
| TOTAL CERTIFICATE OF DEPOSIT (Cost $8,312,000) | 8,312,000 | |||
| Financial Company Commercial Paper - 16.9% | ||||
| Yield (%)(a) | Principal Amount (b) (000s) | Value ($) (000s) | ||
| Australia & New Zealand Banking Group Ltd. | ||||
| 4/5/23 to 4/12/23 (c)(d) | 5.19 to 5.22 | 822,000 | 822,000 | |
| Bank of Montreal | ||||
| 5/2/23 to 9/5/23 (c) | 5.17 to 5.52 | 1,607,000 | 1,594,926 | |
| Bank of Nova Scotia | ||||
| 4/20/23 to 7/17/23 (c) | 5.13 to 5.52 | 1,860,000 | 1,855,991 | |
| Barclays Bank PLC/Barclays U.S. CCP Funding LLC | ||||
| 5/5/23 to 6/1/23 (e) | 4.84 to 5.02 | 412,000 | 409,449 | |
| BofA Securities, Inc. | ||||
| 4/17/23 to 8/7/23 (c)(d) | 5.20 to 5.52 | 1,033,000 | 1,033,000 | |
| Commonwealth Bank of Australia | ||||
| 4/27/23 to 4/28/23 (c)(d) | 5.22 to 5.22 | 405,000 | 405,000 | |
| Credit Agricole CIB | ||||
| 5/3/23 | 4.84 | 194,000 | 193,177 | |
| DNB Bank ASA | ||||
| 4/10/23 (c)(d) | 5.19 | 270,000 | 270,000 | |
| Federation des caisses Desjardin | ||||
| 4/17/23 to 7/19/23 (c) | 5.04 to 5.20 | 332,000 | 329,512 | |
| J.P. Morgan Securities, LLC | ||||
| 5/10/23 to 5/24/23 (c)(d) | 5.41 to 5.41 | 486,000 | 486,000 | |
| Lloyds Bank PLC | ||||
| 5/11/23 to 5/12/23 | 4.92 to 4.92 | 221,000 | 219,796 | |
| Mitsubishi UFJ Trust & Banking Corp. | ||||
| 4/13/23 | 4.82 | 110,000 | 109,825 | |
| Mizuho Bank Ltd. Singapore Branch | ||||
| 4/6/23 to 6/9/23 | 4.80 to 5.04 | 1,558,000 | 1,551,573 | |
| National Australia Bank Ltd. | ||||
| 4/13/23 to 4/28/23 (c)(d) | 5.19 to 5.22 | 1,198,000 | 1,198,000 | |
| National Bank of Canada | ||||
| 5/25/23 | 5.26 | 539,000 | 534,860 | |
| Royal Bank of Canada | ||||
| 4/3/23 to 4/21/23 (c)(d) | 5.23 to 5.48 | 958,000 | 958,000 | |
| Sumitomo Mitsui Trust Bank Ltd. | ||||
| 4/11/23 to 5/24/23 | 4.81 to 4.92 | 717,000 | 712,875 | |
| Svenska Handelsbanken AB | ||||
| 4/13/23 to 9/5/23 (c) | 5.08 to 5.32 | 1,210,000 | 1,197,870 | |
| Svenska Handelsbanken, Inc. | ||||
| 7/24/23 (c)(d) | 5.23 | 275,000 | 275,000 | |
| The Toronto-Dominion Bank | ||||
| 4/6/23 to 9/5/23 (c) | 5.18 to 5.53 | 2,069,000 | 2,050,790 | |
| Toyota Motor Credit Corp. | ||||
| 8/30/23 | 5.33 | 110,000 | 107,605 | |
| UBS AG London Branch | ||||
| 5/23/23 | 5.45 | 162,000 | 160,760 | |
| TOTAL FINANCIAL COMPANY COMMERCIAL PAPER (Cost $16,476,009) | 16,476,009 | |||
| Asset Backed Commercial Paper - 0.6% | ||||
| Yield (%)(a) | Principal Amount (b) (000s) | Value ($) (000s) | ||
| Gotham Funding Corp. (Liquidity Facility Bank of Tokyo-Mitsubishi UFJ Ltd.) | ||||
| 4/10/23 to 5/1/23 | 4.81 to 4.83 | 523,574 | 523,574 | |
| TOTAL ASSET BACKED COMMERCIAL PAPER (Cost $523,574) | 523,574 | |||
| U.S. Government Agency Debt - 0.1% | ||||
| Yield (%)(a) | Principal Amount (b) (000s) | Value ($) (000s) | ||
| Federal Agencies - 0.1% | ||||
| Federal Home Loan Bank | ||||
| 9/19/23 | 5.11 | 124,500 | 121,555 | |
| TOTAL U.S. GOVERNMENT AGENCY DEBT (Cost $121,555) | 121,555 | |||
| Non-Negotiable Time Deposit - 0.2% | ||||
| Yield (%)(a) | Principal Amount (b) (000s) | Value ($) (000s) | ||
| Time Deposits - 0.2% | ||||
| Royal Bank of Canada | ||||
| 4/3/23 | 4.81 | 222,473 | 222,473 | |
| TOTAL NON-NEGOTIABLE TIME DEPOSIT (Cost $222,473) | 222,473 | |||
| U.S. Government Agency Repurchase Agreement - 11.1% | |||
Maturity Amount ($) (000s) | Value ($) (000s) | ||
| In a joint trading account at 4.81% dated 3/31/23 due 4/3/23 (Collateralized by U.S. Government Obligations) # | 4,481,152 | 4,479,355 | |
| With: | |||
| ABN AMRO Bank NV at 4.81%, dated 3/31/23 due 4/3/23 (Collateralized by U.S. Government Obligations valued at $178,571,639, 2.00% - 5.50%, 8/15/25 - 1/20/53) | 175,070 | 175,000 | |
| BMO Harris Bank NA at 4.81%, dated 3/23/23 due 4/7/23 | |||
(Collateralized by U.S. Government Obligations valued at $113,386,403, 3.00% - 4.00%, 4/20/46 - 7/20/51) | 111,297 | 111,000 | |
(Collateralized by U.S. Government Obligations valued at $93,977,919, 3.00% - 4.50%, 6/20/47 - 5/20/51) | 92,393 | 92,000 | |
(Collateralized by U.S. Government Obligations valued at $125,644,392, 2.50% - 4.50%, 12/20/42 - 4/20/52) | 123,690 | 123,000 | |
| BNP Paribas, SA at 4.81%, dated: | |||
3/27/23 due 4/7/23 (Collateralized by U.S. Government Obligations valued at $66,364,479, 0.00% - 6.50%, 5/15/32 - 3/1/53) | 65,122 | 65,000 | |
3/30/23 due 4/6/23 (Collateralized by U.S. Government Obligations valued at $905,271,922, 0.00% - 7.50%, 5/25/23 - 2/1/56) | 887,830 | 887,000 | |
| BofA Securities, Inc. at: | |||
4.82%, dated 3/28/23 due 4/4/23 (Collateralized by U.S. Treasury Obligations valued at $241,934,218, 1.13%, 8/31/28) | 237,222 | 237,000 | |
4.87%, dated: | |||
| 3/17/23 due 4/7/23 (Collateralized by U.S. Treasury Obligations valued at $95,073,189, 1.38% - 4.50%, 11/30/24 - 11/15/31) (c)(d)(f) | 93,403 | 93,000 | |
| 3/20/23 due 4/7/23 (Collateralized by U.S. Treasury Obligations valued at $63,357,779, 2.50%, 3/31/27) (c)(d)(f) | 62,243 | 62,000 | |
| 3/21/23 due 4/7/23 (Collateralized by U.S. Treasury Obligations valued at $63,349,752, 0.63% - 2.50%, 3/31/27 - 11/30/27) (c)(d)(f) | 62,285 | 62,000 | |
| 3/24/23 due 4/7/23 (Collateralized by U.S. Treasury Obligations valued at $124,608,219, 1.75% - 4.13%, 7/31/24 - 11/15/32) (c)(d)(f) | 122,545 | 122,000 | |
| CIBC Bank U.S.A. at 4.81%, dated 3/23/23 due 4/7/23 (Collateralized by U.S. Government Obligations valued at $325,858,219, 2.00% - 6.50%, 1/1/33 - 3/1/53) | 320,790 | 319,000 | |
| Citibank NA at 4.83%, dated 3/30/23 due 4/6/23 (Collateralized by U.S. Treasury Obligations valued at $180,706,783, 0.00% - 7.00%, 5/1/23 - 4/1/53) | 176,165 | 176,000 | |
| Citigroup Global Capital Markets, Inc. at: | |||
4.81%, dated 3/23/23 due 4/7/23 (Collateralized by U.S. Government Obligations valued at $187,955,897, 2.25% - 5.50%, 10/31/24 - 10/20/52) | 185,033 | 184,000 | |
4.83%, dated 3/30/23 due 4/6/23 (Collateralized by U.S. Government Obligations valued at $148,999,928, 2.25% - 5.50%, 10/31/24 - 10/20/52) | 146,137 | 146,000 | |
| Goldman Sachs & Co. at 4.81%, dated: | |||
3/27/23 due 4/3/23 (Collateralized by U.S. Treasury Obligations valued at $484,953,144, 0.00% - 4.50%, 6/29/23 - 6/20/52) | 475,444 | 475,000 | |
3/29/23 due 4/5/23 (Collateralized by U.S. Government Obligations valued at $479,720,266, 1.50% - 6.00%, 4/1/36 - 10/15/57) | 470,440 | 470,000 | |
3/30/23 due: | |||
| 4/4/23 (Collateralized by U.S. Government Obligations valued at $358,211,342, 2.00% - 6.50%, 6/1/25 - 2/1/53) | 351,234 | 351,000 | |
| 4/6/23 (Collateralized by U.S. Government Obligations valued at $238,807,562, 0.00% - 7.50%, 11/27/23 - 7/1/60) | 234,219 | 234,000 | |
| RBC Dominion Securities at 4.81%, dated 3/23/23 due 4/7/23 (Collateralized by U.S. Government Obligations valued at $601,663,019, 1.50% - 6.00%, 12/31/24 - 2/20/53) | 592,305 | 589,000 | |
| RBC Financial Group at 4.81%, dated 3/23/23 due 4/7/23 (Collateralized by U.S. Treasury Obligations valued at $1,134,926,863, 0.00% - 7.63%, 8/31/23 - 4/1/53) | 1,115,223 | 1,109,000 | |
| TD Securities (U.S.A.) at 4.82%, dated 3/31/23 due 4/3/23 (Collateralized by U.S. Government Obligations valued at $262,245,293, 2.50% - 6.00%, 2/1/52 - 1/1/53) | 257,103 | 257,000 | |
| TOTAL U.S. GOVERNMENT AGENCY REPURCHASE AGREEMENT (Cost $10,818,355) | 10,818,355 | ||
| U.S. Treasury Repurchase Agreement - 59.2% | |||
Maturity Amount ($) (000s) | Value ($) (000s) | ||
| With: | |||
| Federal Reserve Bank of New York at 4.8%, dated 3/31/23 due 4/3/23 (Collateralized by U.S. Treasury Obligations valued at $54,718,878,808, 0.13% - 2.75%, 5/31/23 - 11/15/31) | 54,718,879 | 54,697,000 | |
| Fixed Income Clearing Corp. - BNYM at 4.81%, dated 3/31/23 due 4/3/23 (Collateralized by U.S. Treasury Obligations valued at $535,500,034, 1.38%, 11/15/31) | 525,210 | 525,000 | |
| Fixed Income Clearing Corp. - SSB at: | |||
4.81%, dated 3/31/23 due 4/3/23 (Collateralized by U.S. Treasury Obligations valued at $321,224,449, 1.13% - 1.25%, 8/31/28 - 9/30/28) | 315,126 | 315,000 | |
4.88%, dated 3/31/23 due 4/3/23 (Collateralized by U.S. Treasury Obligations valued at $218,981,338, 2.38% - 4.00%, 2/15/42 - 11/15/42) | 213,087 | 213,000 | |
| ING Financial Markets LLC at 4.81%, dated 3/31/23 due 4/3/23 (Collateralized by U.S. Treasury Obligations valued at $160,320,928, 0.75% - 2.63%, 11/15/24 - 12/31/25) | 157,063 | 157,000 | |
| MUFG Securities EMEA PLC at: | |||
4.82%, dated: | |||
| 3/31/23 due 4/3/23 (Collateralized by U.S. Treasury Obligations valued at $161,126,101, 2.25% - 3.50%, 9/15/25 - 8/15/27) | 158,063 | 158,000 | |
| 4/3/23 due 4/4/23 (g) | 157,021 | 157,000 | |
4.83%, dated 3/31/23 due 4/3/23 (Collateralized by U.S. Treasury Obligations valued at $321,167,465, 1.13% - 4.00%, 12/31/24 - 11/15/42) | 315,127 | 315,000 | |
| NatWest Markets Securities Inc. at 4.82%, dated 3/30/23 due 4/6/23 (Collateralized by U.S. Treasury Obligations valued at $212,273,705, 0.13% - 3.50%, 4/30/23 - 1/31/30) | 208,195 | 208,000 | |
| SMBC Nikko Securities America, Inc. at 4.81%, dated 3/31/23 due 4/3/23 (Collateralized by U.S. Treasury Obligations valued at $714,255,682, 0.88% - 2.88%, 3/15/25 - 8/15/32) | 700,281 | 700,000 | |
| Societe Generale at 4.81%, dated 3/30/23 due 4/6/23 (Collateralized by U.S. Treasury Obligations valued at $300,040,333, 0.00% - 4.13%, 6/29/23 - 2/15/51) | 294,275 | 294,000 | |
| TOTAL U.S. TREASURY REPURCHASE AGREEMENT (Cost $57,739,000) | 57,739,000 | ||
| Other Repurchase Agreement - 2.9% | |||
Maturity Amount ($) (000s) | Value ($) (000s) | ||
| Other Repurchase Agreement - 2.9% | |||
| With: | |||
| BMO Capital Markets Corp. at: | |||
4.96%, dated 3/31/23 due 4/3/23 (Collateralized by Corporate Obligations valued at $115,547,748, 0.65% - 6.63%, 12/1/23 - 9/9/52) | 110,045 | 110,000 | |
5.02%, dated 3/31/23 due 4/3/23 (Collateralized by Corporate Obligations valued at $117,650,784, 2.25% - 8.63%, 1/10/25 - 5/1/48) | 110,046 | 110,000 | |
| BMO Chicago Branch at 5.02%, dated 3/31/23 due 4/3/23 (Collateralized by Corporate Obligations valued at $14,042,715, 1.38% - 9.50%, 6/15/24 - 3/25/50) | 13,005 | 13,000 | |
| BNP Paribas Prime Brokerage, Inc. at: | |||
5.07%, dated 3/31/23 due 4/3/23 (Collateralized by Equity Securities valued at $176,114,392) | 163,069 | 163,000 | |
5.08%, dated 3/31/23 due 4/6/23 (Collateralized by Equity Securities valued at $234,459,238) (c)(d)(f) | 217,184 | 217,000 | |
5.27%, dated 3/29/23 due 5/5/23 (Collateralized by Corporate Obligations valued at $411,471,320, 0.00% - 8.00%, 6/1/23 - 6/30/51) (c)(d)(f) | 384,458 | 381,000 | |
| HSBC Securities, Inc. at 5.05%, dated 3/31/23 due 4/3/23 (Collateralized by Corporate Obligations valued at $29,172,265, 0.00% - 10.25%, 2/15/25 - 2/15/47) | 27,011 | 27,000 | |
| ING Financial Markets LLC at 5.05%, dated 3/31/23 due 4/3/23 (Collateralized by Equity Securities valued at $102,643,178) | 95,040 | 95,000 | |
| J.P. Morgan Securities, LLC at 5.39%, dated 3/27/23 due 6/29/23 (Collateralized by Corporate Obligations valued at $911,847,956, 0.00% - 8.50%, 12/1/23 - 8/15/62) (c)(d)(f) | 861,200 | 846,000 | |
| Mitsubishi UFJ Securities (U.S.A.), Inc. at: | |||
5.05%, dated 3/31/23 due 4/3/23 (Collateralized by Equity Securities valued at $73,470,835) | 68,029 | 68,000 | |
5.34%, dated 3/31/23 due 4/3/23 (Collateralized by Corporate Obligations valued at $10,697,952, 0.00% - 3.88%, 7/1/23 - 1/15/30) | 10,004 | 10,000 | |
| Mizuho Securities U.S.A., Inc. at: | |||
5.09%, dated 3/31/23 due 4/3/23 (Collateralized by Equity Securities valued at $105,884,896) | 98,042 | 98,000 | |
5.32%, dated 3/7/23 due 5/8/23 (Collateralized by Corporate Obligations valued at $118,055,243, 1.40% - 6.68%, 11/3/23 - 7/1/53) (c)(d)(f) | 113,026 | 112,000 | |
| NatWest Markets Securities Inc. at 5.07%, dated 3/31/23 due 4/3/23 (Collateralized by Corporate Obligations valued at $56,658,142, 1.59% - 6.69%, 1/22/24 - 2/27/37) | 54,023 | 54,000 | |
| RBC Capital Markets Co. at 5.32%, dated 3/27/23 due 5/26/23 (Collateralized by Corporate Obligations valued at $114,259,623, 0.00% - 8.18%, 9/22/25 - 11/15/68) (c)(d)(f) | 109,966 | 109,000 | |
| Truist Securities, Inc. at: | |||
5.1%, dated 3/31/23 due 4/3/23 (Collateralized by Municipal Bond Obligations valued at $100,056,132, 0.00% - 6.50%, 4/1/24 - 8/1/59) | 95,040 | 95,000 | |
5.35%, dated 3/31/23 due 4/3/23 (Collateralized by Corporate Obligations valued at $10,785,016, 0.13% - 6.13%, 6/1/23 - 6/1/42) | 10,004 | 10,000 | |
| Wells Fargo Securities, LLC at: | |||
4.98%, dated 3/31/23 due 4/3/23 (Collateralized by Commercial Paper valued at $195,781,216, 4/12/23 - 9/19/23) | 190,079 | 190,000 | |
5.37%, dated 1/26/23 due 4/26/23 (Collateralized by Commercial Paper valued at $60,282,734, 4/6/23 - 2/15/30) | 56,752 | 56,000 | |
5.4%, dated 2/3/23 due 5/4/23 (Collateralized by Commercial Paper valued at $88,980,571, 1/12/23 - 8/7/23) | 85,134 | 84,000 | |
| TOTAL OTHER REPURCHASE AGREEMENT (Cost $2,848,000) | 2,848,000 | ||
| TOTAL INVESTMENT IN SECURITIES - 99.5% (Cost $97,060,966) | 97,060,966 |
NET OTHER ASSETS (LIABILITIES) - 0.5% | 468,729 |
| NET ASSETS - 100.0% | 97,529,695 |
| (a) | Yield represents either the annualized yield at the date of purchase, or the stated coupon rate, or, for floating and adjustable rate securities, the rate at period end. |
| (b) | Amount is stated in United States dollars unless otherwise noted. |
| (c) | Coupon rates for floating and adjustable rate securities reflect the rates in effect at period end. |
| (d) | Coupon is indexed to a floating interest rate which may be multiplied by a specified factor and/or subject to caps or floors. |
| (e) | Security exempt from registration under Rule 144A of the Securities Act of 1933. These securities may be resold in transactions exempt from registration, normally to qualified institutional buyers. At the end of the period, the value of these securities amounted to $409,449,000 or 0.4% of net assets. |
| (f) | The maturity amount is based on the rate at period end. |
| (g) | Represents a forward settling transaction and therefore no collateral securities had been allocated as of period end. The agreement contemplated the delivery of U.S. Treasury Obligations as collateral on settlement date. |
| Other Information | ||
| # Additional information on each counterparty to the repurchase agreement is as follows: | ||
| Repurchase Agreement / Counterparty | Value ($) (000's) | |
| $4,479,355,000 due 4/03/23 at 4.81% | ||
| BNP Paribas, S.A. | 33,623 | |
| BNY Mellon Capital Markets LLC | 146,937 | |
| Bank of America, N.A. | 422,150 | |
| Bank of Nova Scotia | 14,622 | |
| BofA Securities, Inc. | 65,978 | |
| Citigroup Global Markets, Inc. | 293,160 | |
| Credit Agricole CIB New York Branch | 29,277 | |
| HSBC Securities (USA), Inc. | 52,769 | |
| ING Financial Markets LLC | 20,987 | |
| Mitsubishi UFJ Securities Holdings Ltd | 87,948 | |
| Mizuho Securities USA, Inc. | 29,316 | |
| Nomura Securities International | 520,538 | |
| RBC Dominion Securities, Inc. | 351,792 | |
| Sumitomo Mitsui Banking Corp. | 1,618,370 | |
| Sumitomo Mitsui Banking Corp. NY | 205,569 | |
| Wells Fargo Securities LLC | 586,319 | |
| 4,479,355 | ||
| Statement of Assets and Liabilities | ||||
| Amounts in thousands (except per-share amounts) | March 31, 2023 | |||
| Assets | ||||
Investment in securities, at value (including repurchase agreements of $71,405,355) - See accompanying schedule Unaffiliated issuers (cost $97,060,966): | $ | 97,060,966 | ||
| Cash | 1 | |||
| Receivable for fund shares sold | 1,086,980 | |||
| Interest receivable | 121,567 | |||
| Prepaid expenses | 24 | |||
| Receivable from investment adviser for expense reductions | 3,684 | |||
| Other receivables | 927 | |||
Total assets | 98,274,149 | |||
| Liabilities | ||||
| Payable for investments purchased | $ | 157,000 | ||
| Payable for fund shares redeemed | 525,807 | |||
| Distributions payable | 42,797 | |||
| Accrued management fee | 11,705 | |||
| Distribution and service plan fees payable | 18 | |||
| Other affiliated payables | 3,817 | |||
| Other payables and accrued expenses | 3,310 | |||
| Total Liabilities | 744,454 | |||
| Net Assets | $ | 97,529,695 | ||
| Net Assets consist of: | ||||
| Paid in capital | $ | 97,529,476 | ||
| Total accumulated earnings (loss) | 219 | |||
| Net Assets | $ | 97,529,695 | ||
| Net Asset Value and Maximum Offering Price | ||||
| Class I : | ||||
Net Asset Value , offering price and redemption price per share ($42,431,573 ÷ 42,422,765 shares) | $ | 1.00 | ||
| Class II : | ||||
Net Asset Value , offering price and redemption price per share ($80,507 ÷ 80,497 shares) | $ | 1.00 | ||
| Class III : | ||||
Net Asset Value , offering price and redemption price per share ($31,354 ÷ 31,363 shares) | $ | 1.00 | ||
| Select Class : | ||||
Net Asset Value , offering price and redemption price per share ($40,260 ÷ 40,255 shares) | $ | 1.00 | ||
| Institutional Class : | ||||
Net Asset Value , offering price and redemption price per share ($54,946,001 ÷ 54,933,440 shares) | $ | 1.00 | ||
| Statement of Operations | ||||
| Amounts in thousands | Year ended March 31, 2023 | |||
| Investment Income | ||||
| Interest (including $1,417 from affiliated interfund lending) | $ | 2,252,186 | ||
| Expenses | ||||
| Management fee | $ | 92,177 | ||
| Transfer agent fees | 28,279 | |||
| Distribution and service plan fees | 186 | |||
| Accounting fees and expenses | 2,210 | |||
| Custodian fees and expenses | 444 | |||
| Independent trustees' fees and expenses | 220 | |||
| Registration fees | 4,408 | |||
| Audit | 49 | |||
| Legal | 33 | |||
| Miscellaneous | 121 | |||
| Total expenses before reductions | 128,127 | |||
| Expense reductions | (24,448) | |||
| Total expenses after reductions | 103,679 | |||
| Net Investment income (loss) | 2,148,507 | |||
| Realized and Unrealized Gain (Loss) | ||||
| Net realized gain (loss) on: | ||||
| Investment Securities: | ||||
| Unaffiliated issuers | 6 | |||
| Total net realized gain (loss) | 6 | |||
| Net increase in net assets resulting from operations | $ | 2,148,513 | ||
| Statement of Changes in Net Assets | ||||
| Amount in thousands | Year ended March 31, 2023 | Year ended March 31, 2022 | ||
| Increase (Decrease) in Net Assets | ||||
| Operations | ||||
| Net investment income (loss) | $ | 2,148,507 | $ | 12,412 |
| Net realized gain (loss) | 6 | 281 | ||
Net increase in net assets resulting from operations | 2,148,513 | 12,693 | ||
| Distributions to shareholders | (2,148,294) | (12,407) | ||
| Share transactions - net increase (decrease) | 58,562,981 | (12,025,622) | ||
| Total increase (decrease) in net assets | 58,563,200 | (12,025,336) | ||
| Net Assets | ||||
| Beginning of period | 38,966,495 | 50,991,831 | ||
| End of period | $ | 97,529,695 | $ | 38,966,495 |
| Money Market Portfolio Class I |
| Years ended March 31, | 2023 | 2022 | 2021 | 2020 | 2019 | |||||
Selected Per-Share Data | ||||||||||
| Net asset value, beginning of period | $ | 1.00 | $ | 1.00 | $ | 1.00 | $ | 1.00 | $ | 1.00 |
| Income from Investment Operations | ||||||||||
Net investment income (loss) A | .028 | - B | .002 | .020 | .022 | |||||
Net realized and unrealized gain (loss) B | - | - | - | - | - | |||||
| Total from investment operations | .028 | - B | .002 | .020 | .022 | |||||
| Distributions from net investment income | (.028) | - B | (.002) | (.020) | (.022) | |||||
| Total distributions | (.028) | - B | (.002) | (.020) | (.022) | |||||
| Net asset value, end of period | $ | 1.00 | $ | 1.00 | $ | 1.00 | $ | 1.00 | $ | 1.00 |
Total Return C | 2.81% | .02% | .15% | 2.01% | 2.23% | |||||
Ratios to Average Net Assets A,D,E | ||||||||||
| Expenses before reductions | .21% | .21% | .21% | .21% | .21% | |||||
| Expenses net of fee waivers, if any | .18% | .16% | .18% | .18% | .18% | |||||
| Expenses net of all reductions | .18% | .16% | .18% | .18% | .18% | |||||
| Net investment income (loss) | 3.25% | .02% | .16% | 1.96% | 2.25% | |||||
| Supplemental Data | ||||||||||
| Net assets, end of period (in millions) | $ | 42,432 | $ | 16,745 | $ | 21,937 | $ | 25,801 | $ | 22,140 |
| Money Market Portfolio Class II |
| Years ended March 31, | 2023 | 2022 | 2021 | 2020 | 2019 | |||||
Selected Per-Share Data | ||||||||||
| Net asset value, beginning of period | $ | 1.00 | $ | 1.00 | $ | 1.00 | $ | 1.00 | $ | 1.00 |
| Income from Investment Operations | ||||||||||
Net investment income (loss) A | .026 | - B | .001 | .018 | .021 | |||||
Net realized and unrealized gain (loss) B | - | - | - | - | - | |||||
| Total from investment operations | .026 | - B | .001 | .018 | .021 | |||||
| Distributions from net investment income | (.026) | - B | (.001) | (.018) | (.021) | |||||
| Total distributions | (.026) | - B | (.001) | (.018) | (.021) | |||||
| Net asset value, end of period | $ | 1.00 | $ | 1.00 | $ | 1.00 | $ | 1.00 | $ | 1.00 |
Total Return C | 2.65% | .01% | .09% | 1.86% | 2.08% | |||||
Ratios to Average Net Assets A,D,E | ||||||||||
| Expenses before reductions | .36% | .36% | .36% | .36% | .36% | |||||
| Expenses net of fee waivers, if any | .33% | .16% | .26% | .33% | .33% | |||||
| Expenses net of all reductions | .33% | .16% | .26% | .33% | .33% | |||||
| Net investment income (loss) | 3.10% | .01% | .08% | 1.81% | 2.10% | |||||
| Supplemental Data | ||||||||||
| Net assets, end of period (in millions) | $ | 81 | $ | 90 | $ | 179 | $ | 394 | $ | 368 |
| Money Market Portfolio Class III |
| Years ended March 31, | 2023 | 2022 | 2021 | 2020 | 2019 | |||||
Selected Per-Share Data | ||||||||||
| Net asset value, beginning of period | $ | 1.00 | $ | 1.00 | $ | 1.00 | $ | 1.00 | $ | 1.00 |
| Income from Investment Operations | ||||||||||
Net investment income (loss) A | .025 | - B | .001 | .017 | .020 | |||||
Net realized and unrealized gain (loss) B | - | - | - | - | - | |||||
| Total from investment operations | .025 | - B | .001 | .017 | .020 | |||||
| Distributions from net investment income | (.025) | - B | (.001) | (.017) | (.020) | |||||
| Total distributions | (.025) | - B | (.001) | (.017) | (.020) | |||||
| Net asset value, end of period | $ | 1.00 | $ | 1.00 | $ | 1.00 | $ | 1.00 | $ | 1.00 |
Total Return C | 2.55% | .01% | .06% | 1.76% | 1.98% | |||||
Ratios to Average Net Assets A,D,E | ||||||||||
| Expenses before reductions | .46% | .46% | .46% | .46% | .46% | |||||
| Expenses net of fee waivers, if any | .43% | .17% | .27% | .43% | .43% | |||||
| Expenses net of all reductions | .43% | .17% | .27% | .43% | .43% | |||||
| Net investment income (loss) | 3.00% | .01% | .07% | 1.71% | 2.00% | |||||
| Supplemental Data | ||||||||||
| Net assets, end of period (in millions) | $ | 31 | $ | 9 | $ | 13 | $ | 13 | $ | 33 |
| Money Market Portfolio Select Class |
| Years ended March 31, | 2023 | 2022 | 2021 | 2020 | 2019 | |||||
Selected Per-Share Data | ||||||||||
| Net asset value, beginning of period | $ | 1.00 | $ | 1.00 | $ | 1.00 | $ | 1.00 | $ | 1.00 |
| Income from Investment Operations | ||||||||||
Net investment income (loss) A | .027 | - B | .001 | .019 | .022 | |||||
Net realized and unrealized gain (loss) B | - | - | - | - | - | |||||
| Total from investment operations | .027 | - B | .001 | .019 | .022 | |||||
| Distributions from net investment income | (.027) | - B | (.001) | (.019) | (.022) | |||||
| Total distributions | (.027) | - B | (.001) | (.019) | (.022) | |||||
| Net asset value, end of period | $ | 1.00 | $ | 1.00 | $ | 1.00 | $ | 1.00 | $ | 1.00 |
Total Return C | 2.76% | .02% | .12% | 1.96% | 2.18% | |||||
Ratios to Average Net Assets A,D,E | ||||||||||
| Expenses before reductions | .26% | .26% | .26% | .26% | .26% | |||||
| Expenses net of fee waivers, if any | .23% | .16% | .21% | .23% | .23% | |||||
| Expenses net of all reductions | .23% | .16% | .21% | .23% | .23% | |||||
| Net investment income (loss) | 3.20% | .02% | .13% | 1.91% | 2.20% | |||||
| Supplemental Data | ||||||||||
| Net assets, end of period (in millions) | $ | 40 | $ | 15 | $ | 26 | $ | 59 | $ | 33 |
| Money Market Portfolio Institutional Class |
| Years ended March 31, | 2023 | 2022 | 2021 | 2020 | 2019 | |||||
Selected Per-Share Data | ||||||||||
| Net asset value, beginning of period | $ | 1.00 | $ | 1.00 | $ | 1.00 | $ | 1.00 | $ | 1.00 |
| Income from Investment Operations | ||||||||||
Net investment income (loss) A | .028 | - B | .002 | .020 | .022 | |||||
| Net realized and unrealized gain (loss) | - B | - B | - B | - B | .001 | |||||
| Total from investment operations | .028 | - B | .002 | .020 | .023 | |||||
| Distributions from net investment income | (.028) | - B | (.002) | (.020) | (.023) | |||||
| Total distributions | (.028) | - B | (.002) | (.020) | (.023) | |||||
| Net asset value, end of period | $ | 1.00 | $ | 1.00 | $ | 1.00 | $ | 1.00 | $ | 1.00 |
Total Return C | 2.85% | .04% | .19% | 2.05% | 2.28% | |||||
Ratios to Average Net Assets A,D,E | ||||||||||
| Expenses before reductions | .18% | .18% | .18% | .18% | .18% | |||||
| Expenses net of fee waivers, if any | .14% | .14% | .14% | .14% | .14% | |||||
| Expenses net of all reductions | .14% | .14% | .14% | .14% | .14% | |||||
| Net investment income (loss) | 3.29% | .04% | .20% | 2.00% | 2.29% | |||||
| Supplemental Data | ||||||||||
| Net assets, end of period (in millions) | $ | 54,946 | $ | 22,108 | $ | 28,837 | $ | 35,852 | $ | 33,002 |
| Current 7-Day Yields | ||
| Class I | 3.99% | |
| Class II | 3.84% | |
| Class III | 3.74% | |
| Select Class | 3.94% | |
Yield refers to the income paid by the Fund over a given period. Yield for money market funds is usually for seven-day periods, as it is here, though it is expressed as an annual percentage rate. Past performance is no guarantee of future results. Yield will vary and it's possible to lose money investing in the Fund. A portion of the Fund's expenses was reimbursed and/or waived. Absent such reimbursements and/or waivers the yield for the period ending March 31, 2023, the most recent period shown in the table, would have been 3.95% for Class I, 3.81% for Class II, 3.71% for Class III, and 3.90% for Select Class. | ||
| Effective Maturity Diversification (% of Fund's Investments) | ||
| Days | ||
| 1 - 7 | 91.3 | |
| 8 - 30 | 2.4 | |
| 31 - 60 | 2.1 | |
| 61 - 90 | 2.2 | |
| 91 - 180 | 0.9 | |
| > 180 | 1.1 | |
| Effective maturity is determined in accordance with the requirements of Rule 2a-7 under the Investment Company Act of 1940. | ||
Asset Allocation (% of Fund's net assets) |
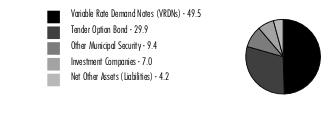 |
| Variable Rate Demand Note - 49.5% | |||
Principal Amount (a) (000s) | Value ($) (000s) | ||
| Alabama - 1.8% | |||
| Columbia Indl. Dev. Board Poll. Cont. Rev. (Alabama Pwr. Co. Proj.): | |||
| Series 2014 A, 3.95% 4/3/23, VRDN (b) | 14,700 | 14,700 | |
| Series 2014 B, 3.95% 4/3/23, VRDN (b) | 23,775 | 23,775 | |
| Mobile Downtown Redev. Auth. Gulf Opportunity Zone Series 2011 B, 3.9% 4/7/23, LOC Bank of America NA, VRDN (b)(c) | 19,270 | 19,270 | |
| Mobile Indl. Dev. Board Dock & Wharf Rev. (Holnam, Inc. Proj.) Series 1999 A, 4.08% 4/7/23, LOC Bayerische Landesbank, VRDN (b) | 19,800 | 19,800 | |
| Mobile Indl. Dev. Board Poll. Cont. Rev. (Alabama Pwr. Co. Barry Plant Proj.) Series 2007 C, 4.09% 4/7/23, VRDN (b) | 17,050 | 17,050 | |
| Mobile Indl. Dev. Board Solid Waste Disp. Rev. (Alabama Pwr. Co. Barry Plant Proj.) Second Series 2009, 3.98% 4/3/23, VRDN (b) | 10,600 | 10,600 | |
| West Jefferson Indl. Dev. Series 2008, 4.09% 4/7/23, VRDN (b) | 8,500 | 8,500 | |
TOTAL ALABAMA | 113,695 | ||
| Alaska - 1.6% | |||
| Valdez Marine Term. Rev.: | |||
| (ConocoPhillips Proj.) Series 1994 A, 4.15% 4/7/23 (ConocoPhillips Co. Guaranteed), VRDN (b) | 25,000 | 25,000 | |
| (Phillips Trans. Alaska, Inc. Proj.): | |||
Series 1994 B, 4.15% 4/7/23 (ConocoPhillips Co. Guaranteed), VRDN (b) | 35,250 | 35,250 | |
Series 1994 C, 4.05% 4/7/23 (ConocoPhillips Co. Guaranteed), VRDN (b) | 35,500 | 35,500 | |
Series 2002, 4.15% 4/7/23 (ConocoPhillips Co. Guaranteed), VRDN (b) | 5,300 | 5,300 | |
TOTAL ALASKA | 101,050 | ||
| Arizona - 0.5% | |||
| Maricopa County Poll. Cont. Rev.: | |||
| (Arizona Pub. Svc. Co. Palo Verde Proj.) Series 2009 A, 4.3% 4/7/23, VRDN (b) | 13,900 | 13,900 | |
| Series 2009 B, 4.3% 4/7/23, VRDN (b) | 14,500 | 14,500 | |
TOTAL ARIZONA | 28,400 | ||
| Colorado - 0.2% | |||
| Colorado Edl. & Cultural Facilities Auth. Rev. (Clyfford Still Museum Proj.) Series 2008, 4.05% 4/7/23, LOC Wells Fargo Bank NA, VRDN (b) | 690 | 690 | |
| Colorado Health Facilities Auth. Rev. Bonds Series 2020 B, 3.95% 4/7/23, LOC The Toronto-Dominion Bank, VRDN (b) | 6,580 | 6,580 | |
| Mesa County Econ. Dev. Rev. (Leitner-Poma of America, Inc. Proj.) Series 2009, 4.05% 4/7/23, LOC Wells Fargo Bank NA, VRDN (b) | 3,165 | 3,165 | |
TOTAL COLORADO | 10,435 | ||
| Connecticut - 4.1% | |||
| Connecticut Gen. Oblig. Series 2016 C, 3.94% 4/7/23 (Liquidity Facility Bank of America NA), VRDN (b) | 115,060 | 115,060 | |
| Connecticut Health & Edl. Facilities Auth. Rev.: | |||
| (Gaylord Hosp. Proj.) Series B, 3.91% 4/7/23, LOC Bank of America NA, VRDN (b) | 10,960 | 10,960 | |
| (Greenwich Hosp. Proj.) Series C, 3.95% 4/7/23, VRDN (b) | 9,910 | 9,910 | |
| Series 2013 O, 4.02% 4/7/23, VRDN (b) | 24,200 | 24,200 | |
| Connecticut Hsg. Fin. Auth.: | |||
| (Ct Gen. Hsg. 9/27/72 Proj.) 2017 Subseries A-3, 3.9% 4/7/23 (Liquidity Facility State Street Bank & Trust Co., Boston), VRDN (b) | 18,700 | 18,700 | |
| Series 2013 B6, 3.95% 4/7/23 (Liquidity Facility Sumitomo Mitsui Banking Corp.), VRDN (b) | 12,965 | 12,965 | |
| Series 2016 A, 3.88% 4/7/23 (Liquidity Facility Royal Bank of Canada), VRDN (b) | 9,730 | 9,730 | |
| Series 2018 A3, 3.89% 4/7/23 (Liquidity Facility Bank of America NA), VRDN (b) | 42,600 | 42,600 | |
| Series E 3, 3.9% 4/7/23 (Liquidity Facility State Street Bank & Trust Co., Boston), VRDN (b) | 12,930 | 12,930 | |
TOTAL CONNECTICUT | 257,055 | ||
| Delaware - 0.5% | |||
| Delaware Econ. Dev. Auth. Rev. (Delmarva Pwr. & Lt. Co. Proj.): | |||
| Series 1993 C, 3.95% 4/7/23, VRDN (b) | 9,500 | 9,500 | |
| Series 1999 A, 4.28% 4/7/23, VRDN (b) | 18,830 | 18,830 | |
TOTAL DELAWARE | 28,330 | ||
| District Of Columbia - 0.4% | |||
| District of Columbia Rev.: | |||
| (The AARP Foundation Proj.) Series 2004, 3.91% 4/7/23, LOC Bank of America NA, VRDN (b) | 13,945 | 13,945 | |
| (The Pew Charitable Trust Proj.) Series 2008 A, 3.97% 4/7/23, LOC PNC Bank NA, VRDN (b) | 3,695 | 3,695 | |
| District of Columbia Univ. Rev. (Georgetown Univ. Proj.) Series 2007 C2, 3.96% 4/7/23, LOC Sumitomo Mitsui Banking Corp., VRDN (b) | 8,955 | 8,955 | |
TOTAL DISTRICT OF COLUMBIA | 26,595 | ||
| Florida - 3.0% | |||
| Escambia County Solid Waste Disp. Rev. (Gulf Pwr. Co. Proj.) Series 2009, 4.1% 4/3/23, VRDN (b) | 27,800 | 27,800 | |
| Highlands County Health Facilities Auth. Rev.: | |||
| (Adventist Health Sys./Sunbelt, Inc. Prog.) Series 2007 A1, 3.93% 4/7/23, VRDN (b) | 18,705 | 18,705 | |
| Series 2021 D, 3.91% 4/7/23, VRDN (b) | 77,350 | 77,350 | |
| Jacksonville Poll. Cont. Rev. (Florida Pwr. & Lt. Co. Proj.) Series 1995, 3.97% 4/3/23, VRDN (b) | 15,460 | 15,460 | |
| Martin County Rev. (Florida Pwr. & Lt. Co. Proj.) Series 2022, 4.08% 4/7/23, VRDN (b) | 27,300 | 27,300 | |
| Orange County Health Facilities Auth. Rev. (Orlando Reg'l. Health Care Sys. Proj.) Series 2008 E, 4% 4/7/23, LOC TD Banknorth, NA, VRDN (b) | 8,150 | 8,150 | |
| Palm Beach County Rev. (Raymond F. Kravis Ctr. Proj.) Series 2002, 3.98% 4/7/23, LOC Northern Trust Co., VRDN (b) | 10,470 | 10,470 | |
| FNMA Florida Hsg. Fin. Corp. Multi-family Mtg. Rev. (Mariner's Cay Apts. Proj.) Series 2008 M, 3.85% 4/7/23, LOC Fannie Mae, VRDN (b) | 1,950 | 1,950 | |
TOTAL FLORIDA | 187,185 | ||
| Georgia - 1.4% | |||
| Burke County Indl. Dev. Auth. Poll. Cont. Rev. (Georgia Pwr. Co. Plant Vogtle Proj.) Series 2018, 4.05% 4/3/23, VRDN (b) | 32,370 | 32,370 | |
| Coweta County Dev. Auth. Poll. Cont. Rev. (Georgia Pwr. Co. Plant Yates Proj.) Series 2006, 4.1% 4/3/23, VRDN (b) | 7,900 | 7,900 | |
| Monroe County Dev. Auth. Poll. Cont. Rev. (Georgia Pwr. Co. Plant Scherer Proj.): | |||
| Series 1997, 4.1% 4/3/23, VRDN (b) | 7,100 | 7,100 | |
| Series 2008, 4.1% 4/3/23, VRDN (b) | 27,700 | 27,700 | |
| Private Colleges & Univs. Auth. Rev. Series 2022 B, 3.9% 4/7/23, VRDN (b) | 11,400 | 11,400 | |
TOTAL GEORGIA | 86,470 | ||
| Illinois - 0.9% | |||
| Illinois Dev. Fin. Auth. Rev. (Lyric Opera of Chicago Proj.) Series 1994, 3.97% 4/7/23, LOC BMO Harris Bank NA, LOC Northern Trust Co., VRDN (b) | 5,500 | 5,500 | |
| Illinois Fin. Auth. Rev.: | |||
| (Chicago Symphony Orchestra Proj.) Series 2008, 3.97% 4/7/23, LOC PNC Bank NA, VRDN (b) | 14,300 | 14,300 | |
| (Little Co. of Mary Hosp. Proj.) Series 2008 B, 3.95% 4/7/23, LOC TD Banknorth, NA, VRDN (b) | 22,710 | 22,710 | |
| (Richard H. Driehaus Museum Proj.) Series 2005, 4.2% 4/7/23, LOC Northern Trust Co., VRDN (b) | 3,800 | 3,800 | |
| Series 2009 E2, 4% 4/7/23, LOC Sumitomo Mitsui Banking Corp., VRDN (b) | 5,000 | 5,000 | |
| Series 2011 B, 3.95% 4/7/23, LOC Sumitomo Mitsui Banking Corp., VRDN (b) | 2,650 | 2,650 | |
TOTAL ILLINOIS | 53,960 | ||
| Indiana - 1.8% | |||
| Indiana Dev. Fin. Auth. Econ. (Archer-Daniels-Midland Co. Proj.) Series 2012, 3.91% 4/7/23 (Archer Daniels Midland Co. Guaranteed), VRDN (b) | 29,840 | 29,840 | |
| Indiana Dev. Fin. Auth. Envir. Rev. Series 2005, 4.15% 4/7/23, LOC Rabobank Nederland New York Branch, VRDN (b) | 10,000 | 10,000 | |
| Indiana Fin. Auth. Rev.: | |||
| (Ascension Health Proj.) Series 2008 E8, 3.93% 4/7/23, VRDN (b) | 10,350 | 10,350 | |
| (Ascension Health Subordinate Cr. Proj.) Series 2008 E5, 3.95% 4/7/23, VRDN (b) | 20,340 | 20,340 | |
| (Trinity Health Cr. Group Proj.) Series 2008 D1, 3.9% 4/7/23, VRDN (b) | 11,000 | 11,000 | |
| Series 2008 E7, 3.95% 4/7/23, VRDN (b) | 30,775 | 30,775 | |
TOTAL INDIANA | 112,305 | ||
| Iowa - 1.4% | |||
| Iowa Fin. Auth. Econ. Dev. Rev.: | |||
| Series 2009 A, 4% 4/7/23, VRDN (b) | 11,700 | 11,700 | |
| Series 2011 A, 4% 4/7/23, VRDN (b) | 30,100 | 30,100 | |
| Iowa Fin. Auth. Midwestern Disaster Area Econ. Dev. Series 2012 A, 4.01% 4/7/23, VRDN (b) | 13,800 | 13,800 | |
| Iowa Fin. Auth. Midwestern Disaster Area Rev. (Archer-Daniels-Midland Co. Proj.) Series 2012, 3.91% 4/7/23 (Archer Daniels Midland Co. Guaranteed), VRDN (b) | 7,265 | 7,265 | |
| Iowa Fin. Auth. Rev. Series 2018 C, 4% 4/7/23, LOC JPMorgan Chase Bank, VRDN (b) | 27,180 | 27,180 | |
TOTAL IOWA | 90,045 | ||
| Kansas - 0.8% | |||
| Cygne Poll. Cont. Rev. (Kansas Gas and Elec. Co. Proj.) Series 1994 B, 4% 4/7/23, VRDN (b) | 1,300 | 1,300 | |
| Burlington Envir. Impt. Rev. (Kansas City Pwr. and Lt. Co. Proj.): | |||
| Series 2007 A, 4.05% 4/7/23, VRDN (b) | 7,600 | 7,600 | |
| Series 2007 B, 4.05% 4/7/23, VRDN (b) | 12,500 | 12,500 | |
| St. Mary's Kansas Poll. Cont. Rev.: | |||
| (Kansas Gas and Elec. Co. Proj.) Series 1994, 4% 4/7/23, VRDN (b) | 4,500 | 4,500 | |
| Series 1994, 4% 4/7/23, VRDN (b) | 16,400 | 16,400 | |
| Wamego Kansas Poll. Cont. Rfdg. Rev.: | |||
| (Kansas Gas & Elec. Co. Proj.) Series 1994, 4% 4/7/23, VRDN (b) | 2,300 | 2,300 | |
| (Western Resources, Inc. Proj.) Series 1994, 4% 4/7/23, VRDN (b) | 5,300 | 5,300 | |
TOTAL KANSAS | 49,900 | ||
| Louisiana - 1.9% | |||
| Louisiana Offshore Term. Auth. Deepwater Port Rev. (LOOP LLC Proj.) Series 2013 B, 4% 4/7/23, LOC JPMorgan Chase Bank, VRDN (b) | 21,340 | 21,340 | |
| Louisiana Pub. Facilities Auth. Rev.: | |||
| (Air Products & Chemicals, Inc. Proj.) Series 2004, 3.98% 4/7/23, VRDN (b) | 6,300 | 6,300 | |
| (Christus Health Proj.): | |||
Series 2008 B, 3.95% 4/7/23, VRDN (b) | 22,700 | 22,700 | |
Series 2009 B3, 4% 4/7/23, LOC Bank of New York, New York, VRDN (b) | 12,975 | 12,975 | |
| Saint James Parish Gen. Oblig. (Nucor Steel Louisiana LLC Proj.): | |||
| Series 2010 A1, 4.36% 4/7/23, VRDN (b) | 53,175 | 53,175 | |
| Series 2010 B1, 4.4% 4/7/23, VRDN (b) | 5,810 | 5,810 | |
TOTAL LOUISIANA | 122,300 | ||
| Massachusetts - 1.1% | |||
| Massachusetts Bay Trans. Auth.: | |||
| Series 2000 A2, 3.93% 4/7/23 (Liquidity Facility TD Banknorth, NA), VRDN (b) | 5,960 | 5,960 | |
| Series 2022 A1, 4.05% 4/7/23 (Liquidity Facility TD Banknorth, NA), VRDN (b) | 15,300 | 15,300 | |
| Massachusetts Bay Trans. Auth. Sales Tax Rev. Series 2022 A, 4.05% 4/7/23 (Liquidity Facility TD Banknorth, NA), VRDN (b) | 29,750 | 29,750 | |
| Massachusetts Dept. of Trans. Metropolitan Hwy. Sys. Rev. Series 2022 A1, 3.91% 4/7/23 (Liquidity Facility TD Banknorth, NA), VRDN (b) | 19,650 | 19,650 | |
TOTAL MASSACHUSETTS | 70,660 | ||
| Michigan - 1.2% | |||
| Grand Traverse County Hosp. Fin. Auth. Series 2011 B, 3.88% 4/7/23, LOC JPMorgan Chase Bank, VRDN (b) | 13,925 | 13,925 | |
| Kent Hosp. Fin. Auth. Hosp. Facilities Rev. (Spectrum Health Sys. Proj.) Series 2008 B3, 4.05% 4/7/23 (Liquidity Facility Wells Fargo Bank NA), VRDN (b) | 5,250 | 5,250 | |
| Lakeview School District Calhoun County Series B, 3.95% (b) | 6,905 | 6,905 | |
| Michigan Fin. Auth. Rev.: | |||
| (Hosp. Proj.) Series 2016 E2, 3.93% 4/7/23, VRDN (b) | 2,450 | 2,450 | |
| Series 2016 E3, 3.95% 4/7/23, VRDN (b) | 22,800 | 22,800 | |
| Michigan State Univ. Revs. Series 2000 A, 4.1% 4/7/23 (Liquidity Facility Northern Trust Co.), VRDN (b) | 6,660 | 6,660 | |
| Michigan Strategic Fund Ltd. Oblig. Rev. (The Kroger Co. Recovery Zone Facilities Bond Proj.) Series 2010, 4.02% 4/7/23, LOC Bank of Nova Scotia, VRDN (b) | 7,660 | 7,660 | |
| FHLMC Livonia Econ. Dev. Corp. (Madonna Univ. Proj.) Series 2009, 4.01% 4/7/23, LOC Fed. Home Ln. Bank Chicago, VRDN (b) | 6,765 | 6,765 | |
TOTAL MICHIGAN | 72,415 | ||
| Minnesota - 0.6% | |||
| Hennepin County Gen. Oblig. Series 2018 B, 3.85% 4/7/23 (Liquidity Facility TD Banknorth, NA), VRDN (b) | 21,900 | 21,900 | |
| Minneapolis Health Care Sys. Rev. (Fairview Health Svcs.) Series 2018 B, 3.95% 4/7/23, LOC JPMorgan Chase Bank, VRDN (b) | 18,230 | 18,230 | |
TOTAL MINNESOTA | 40,130 | ||
| Missouri - 0.6% | |||
| Missouri Health & Edl. Facilities Auth. Rev.: | |||
| (Ascension Health Cr. Group Proj.) Series 2003 C3, 3.93% 4/7/23, VRDN (b) | 26,400 | 26,400 | |
| (Ascension Health Sr. Cr. Group Proj.) Series 2008 C4, 3.93% 4/7/23, VRDN (b) | 14,145 | 14,145 | |
TOTAL MISSOURI | 40,545 | ||
| Nebraska - 0.6% | |||
| Nebraska Invt. Fin. Auth. Single Family Hsg. Rev.: | |||
| (NE Sf Mbs Gen. 7/1/94 Proj.) Series 2017 C, 3.95% 4/7/23 (Liquidity Facility Fed. Home Ln. Bank Topeka), VRDN (b) | 5,795 | 5,795 | |
| Series 2019 C, 4% 4/7/23 (Liquidity Facility Fed. Home Ln. Bank Topeka), VRDN (b) | 15,100 | 15,100 | |
| Series 2022 E, 3.95% 4/7/23 (Liquidity Facility Fed. Home Ln. Bank Topeka), VRDN (b) | 19,200 | 19,200 | |
TOTAL NEBRASKA | 40,095 | ||
| Nevada - 0.0% | |||
| Clark County Arpt. Rev. Series 2008 D3, 4% 4/7/23, LOC Bank of America NA, VRDN (b) | 2,200 | 2,200 | |
| New Jersey - 0.1% | |||
| New Jersey Econ. Dev. Auth. Rev. (Cooper Health Sys. Proj.) Series 2008 A, 3.95% 4/7/23, LOC TD Banknorth, NA, VRDN (b) | 7,200 | 7,200 | |
| New York - 5.5% | |||
| Battery Park City Auth. Rev. Series 2019 D1, 3.92% 4/7/23 (Liquidity Facility TD Banknorth, NA), VRDN (b) | 4,550 | 4,550 | |
| New York City Gen. Oblig.: | |||
| Series 2013 A4, 3.9% 4/7/23 (Liquidity Facility Sumitomo Mitsui Banking Corp.), VRDN (b) | 43,965 | 43,965 | |
| Series 2013 A5, 3.97% 4/7/23 (Liquidity Facility Sumitomo Mitsui Banking Corp.), VRDN (b) | 3,675 | 3,675 | |
| Series D5, 3.97% 4/7/23, LOC PNC Bank NA, VRDN (b) | 28,870 | 28,870 | |
| New York City Health & Hosp. Corp. Rev. Series 2008 B, 3.92% 4/7/23, LOC TD Banknorth, NA, VRDN (b) | 7,650 | 7,650 | |
| New York City Muni. Wtr. Fin. Auth. Wtr. & Swr. Sys. Rev.: | |||
| Series 2000 C, 3.97% 4/7/23 (Liquidity Facility Sumitomo Mitsui Banking Corp.), VRDN (b) | 22,500 | 22,500 | |
| Series 2015 BB3, 3.98% 4/7/23 (Liquidity Facility Sumitomo Mitsui Banking Corp.), VRDN (b) | 3,000 | 3,000 | |
| Series 2016 AA2, 3.98% 4/7/23 (Liquidity Facility PNC Bank NA), VRDN (b) | 25,300 | 25,300 | |
| New York City Transitional Fin. Auth. Rev.: | |||
| Series 2014 D4, 3.98% 4/7/23 (Liquidity Facility Mizuho Corporate Bank Ltd.), VRDN (b) | 25,600 | 25,600 | |
| Series 2018 C6, 4% 4/7/23 (Liquidity Facility Sumitomo Mitsui Banking Corp.), VRDN (b) | 44,710 | 44,710 | |
| New York Hsg. Fin. Agcy. Rev.: | |||
| (8 East 102nd Street Hsg. Proj.) Series 2010 A, 3.97% 4/7/23, LOC TD Banknorth, NA, VRDN (b) | 21,060 | 21,060 | |
| Series 2010 A: | |||
4% 4/7/23, LOC Landesbank Hessen-Thuringen, VRDN (b) | 2,300 | 2,300 | |
4% 4/7/23, LOC Landesbank Hessen-Thuringen, VRDN (b) | 17,000 | 17,000 | |
| New York Metropolitan Trans. Auth. Rev. Series 2012 G2, 3.9% 4/7/23, LOC TD Banknorth, NA, VRDN (b) | 38,285 | 38,285 | |
| New York State Energy Research & Dev. Auth. Facilities Rev. (Consolidated Edison Co. of New York, Inc. Proj.) Series 2005 A3, 3.95% 4/7/23, LOC Mizuho Bank Ltd., VRDN (b) | 7,300 | 7,300 | |
| FNMA: | |||
| New York City Hsg. Dev. Corp. Multi-family Rental Hsg. Rev. (Two Gold Street Proj.) Series 2006 A, 3.9% 4/7/23, LOC Fannie Mae, VRDN (b) | 26,900 | 26,900 | |
| New York Hsg. Fin. Agcy. Rev. Series 2009 A, 4.05% 4/7/23, LOC Fannie Mae, VRDN (b) | 25,000 | 25,000 | |
TOTAL NEW YORK | 347,665 | ||
| New York And New Jersey - 0.1% | |||
| Port Auth. of New York & New Jersey Series 1997 2, 4.02% 5/1/23, VRDN (b)(d) | 7,300 | 7,300 | |
| North Carolina - 0.7% | |||
| Durham County Indl. and Poll. Cont. Auth. Rev. Series 2007, 3.95% 4/7/23, LOC TD Banknorth, NA, VRDN (b) | 9,840 | 9,840 | |
| Parson County Indl. Facilities and Poll. Cont. Fing. Auth. (CertainTeed Gypsum NC, Inc. Proj.) Series 2010, 3.96% 4/7/23, LOC Cr. Industriel et Commercial, VRDN (b) | 21,590 | 21,590 | |
| Raleigh Combined Enterprise Sys. Rev.: | |||
| Series 2008 A, 3.87% 4/7/23 (Liquidity Facility Bank of America NA), VRDN (b) | 8,725 | 8,725 | |
| Series 2008 B, 3.87% 4/7/23 (Liquidity Facility Bank of America NA), VRDN (b) | 1,000 | 1,000 | |
TOTAL NORTH CAROLINA | 41,155 | ||
| Ohio - 1.9% | |||
| Cuyahoga County Health Care Facilities Rev. (The A.M. McGregor Home Proj.) Series 2014, 4.05% 4/7/23, LOC Northern Trust Co., VRDN (b) | 4,500 | 4,500 | |
| Franklin County Hosp. Facilities Rev.: | |||
| Series 2013 A, 3.95% 4/7/23 (Liquidity Facility JPMorgan Chase Bank), VRDN (b) | 14,550 | 14,550 | |
| Series 2013 B, 3.95% 4/7/23 (Liquidity Facility JPMorgan Chase Bank), VRDN (b) | 8,510 | 8,510 | |
| Series 2014, 3.95% 4/7/23 (Liquidity Facility JPMorgan Chase Bank), VRDN (b) | 5,525 | 5,525 | |
| Montgomery County Hosp. Rev. Series 2019 B, 3.97% 4/7/23, LOC PNC Bank NA, VRDN (b) | 40,970 | 40,970 | |
| Ohio Cap. Facilities Lease (Adult Correctional Bldg. Fund Proj.) Series 2019 C, 3.85% 4/7/23, VRDN (b) | 21,500 | 21,500 | |
| Ohio Hosp. Rev. Series 2021 D, 3.9% 4/7/23, LOC U.S. Bank NA, Cincinnati, VRDN (b) | 4,000 | 4,000 | |
| Ohio Spl. Oblig. Series 2016 B, 3.9% 4/7/23, VRDN (b) | 16,700 | 16,700 | |
| Ohio State Univ. Gen. Receipts Series 2010 E, 3.84% 4/7/23, VRDN (b) | 3,555 | 3,555 | |
TOTAL OHIO | 119,810 | ||
| Pennsylvania - 1.7% | |||
| Allegheny County Hosp. Dev. Auth. Rev. Series 2016 A, 4.3% 4/7/23, LOC Truist Bank, VRDN (b) | 4,200 | 4,200 | |
| Beaver County Indl. Dev. Auth. Series 2018 A, 4.3% 4/7/23, LOC Truist Bank, VRDN (b) | 600 | 600 | |
| Delaware Valley Reg'l. Fin. Auth. Local Govt. Rev. Series 2020 D, 4% 4/7/23, LOC TD Banknorth, NA, VRDN (b) | 14,700 | 14,700 | |
| Lancaster Indl. Dev. Auth. Rev. (Willow Valley Retirement Cmntys. Proj.) Series 2009 C, 4.01% 4/7/23, LOC PNC Bank NA, VRDN (b) | 7,400 | 7,400 | |
| Lehigh County Gen. Purp. Hosp. Rev. Series 2019 B, 3.9% 4/7/23, LOC Bank of America NA, VRDN (b) | 54,450 | 54,450 | |
| Philadelphia Auth. Indl. Dev. Lease Rev. Series 2007 B2, 3.95% 4/7/23, LOC TD Banknorth, NA, VRDN (b) | 12,785 | 12,785 | |
| Philadelphia Gas Works Rev. (1998 Gen. Ordinance Proj.) Eighth Series E, 3.95% 4/7/23, LOC TD Banknorth, NA, VRDN (b) | 10,170 | 10,170 | |
| FNMA Montgomery County Redev. Auth. Multi-family Hsg. Rev. (Kingswood Apts. Proj.) Series 2001 A, 4.05% 4/7/23, LOC Fannie Mae, VRDN (b) | 4,300 | 4,300 | |
TOTAL PENNSYLVANIA | 108,605 | ||
| Rhode Island - 0.2% | |||
| Rhode Island Health and Edl. Bldg. Corp. Higher Ed. Facility Rev.: | |||
| (Bryant Univ. Proj.) Series 2008, 4% 4/7/23, LOC TD Banknorth, NA, VRDN (b) | 12,360 | 12,360 | |
| (Roger Williams Univ. Proj.) Series 2008 B, 3.92% 4/7/23, LOC U.S. Bank NA, Cincinnati, VRDN (b) | 2,975 | 2,975 | |
TOTAL RHODE ISLAND | 15,335 | ||
| Tennessee - 0.0% | |||
| Clarksville Pub. Bldg. Auth. Rev. (Tennessee Muni. Bond Fund Proj.) Series 2005, 3.9% 4/3/23, LOC Bank of America NA, VRDN (b) | 2,970 | 2,970 | |
| Texas - 9.0% | |||
| Harris County Cultural Ed. Facilities Fin. Corp. Rev.: | |||
| Series 2014 D, 4.06% 4/7/23, VRDN (b) | 18,700 | 18,700 | |
| Series 2016 C, 3.9% 4/7/23, VRDN (b) | 37,970 | 37,970 | |
| Series 2016 D, 4.06% 4/7/23, VRDN (b) | 18,400 | 18,400 | |
| Harris County Hosp. District Rev. Series 2010, 4% 4/7/23, LOC JPMorgan Chase Bank, VRDN (b) | 6,410 | 6,410 | |
| Houston Util. Sys. Rev.: | |||
| Series 2004 B2, 3.9% 4/7/23, LOC Sumitomo Mitsui Banking Corp., VRDN (b) | 28,455 | 28,455 | |
| Series 2004 B3, 3.9% 4/7/23, LOC Sumitomo Mitsui Banking Corp., VRDN (b) | 5,450 | 5,450 | |
| Series 2004 B5, 3.9% 4/7/23 (Liquidity Facility UBS AG), VRDN (b) | 63,390 | 63,390 | |
| Series 2004 B6, 3.9% 4/7/23, LOC Sumitomo Mitsui Banking Corp., VRDN (b) | 3,275 | 3,275 | |
| Port Arthur Navigation District Exempt Facilities (Var-Total Petrochemicals Proj.) Series 2009, 3.95% 4/7/23 (TotalEnergies SE Guaranteed), VRDN (b) | 700 | 700 | |
| Port Arthur Navigation District Indl. Dev. Corp. Exempt Facilities Rev.: | |||
| (Air Products Proj.): | |||
Series 2010 A, 3.85% 4/7/23 (TotalEnergies SE Guaranteed), VRDN (b) | 62,265 | 62,265 | |
Series 2012, 3.95% 4/7/23 (TotalEnergies SE Guaranteed), VRDN (b) | 113,600 | 113,600 | |
| (Total Petrochemicals & Refining U.S.A., Inc. Proj.) Series 2012 B, 3.95% 4/7/23 (TotalEnergies SE Guaranteed), VRDN (b) | 4,200 | 4,200 | |
| (Total Petrochemicals and Refining U.S.A., Inc. Proj.) Series 2012 A, 3.95% 4/7/23 (TotalEnergies SE Guaranteed), VRDN (b) | 4,100 | 4,100 | |
| Tarrant County Cultural Ed. Facilities Fin. Corp. Rev. (Christus Health Proj.): | |||
| Series 2008 C1, 4% 4/7/23, LOC Sumitomo Mitsui Banking Corp., VRDN (b) | 13,300 | 13,300 | |
| Series 2008 C2, 4.15% 4/7/23, LOC Bank of New York, New York, VRDN (b) | 1,500 | 1,500 | |
| Series 2008 C3, 4% 4/7/23, LOC Bank of Montreal, VRDN (b) | 12,910 | 12,910 | |
| Texas Gen. Oblig.: | |||
| (Texas Veterans Land Board Proj.) Series 2017, 4.4% 4/7/23 (Liquidity Facility Sumitomo Mitsui Banking Corp.), VRDN (b) | 14,100 | 14,100 | |
| Series 2011 B, 4.35% 4/7/23 (Liquidity Facility State Street Bank & Trust Co., Boston), VRDN (b) | 16,400 | 16,400 | |
| Series 2012 B, 4.35% 4/7/23 (Liquidity Facility State Street Bank & Trust Co., Boston), VRDN (b) | 14,795 | 14,795 | |
| Series 2013 B, 4.35% 4/7/23 (Liquidity Facility State Street Bank & Trust Co., Boston), VRDN (b) | 23,965 | 23,965 | |
| Series 2014 A, 4.35% 4/7/23 (Liquidity Facility State Street Bank & Trust Co., Boston), VRDN (b) | 29,590 | 29,590 | |
| Series 2019, 4% 4/7/23 (Liquidity Facility JPMorgan Chase Bank), VRDN (b) | 17,820 | 17,820 | |
| Univ. of Texas Board of Regents Sys. Rev. Series 2008 B, 3.9% 4/7/23 (Liquidity Facility Univ. of Texas Invt. Mgmt. Co.), VRDN (b) | 54,390 | 54,390 | |
TOTAL TEXAS | 565,685 | ||
| Utah - 1.3% | |||
| Emery County Poll. Cont. Rev. (PacifiCorp Proj.) Series 1994, 4.15% 4/7/23, VRDN (b) | 83,500 | 83,500 | |
| Virginia - 1.5% | |||
| Fairfax County Indl. Dev. Auth.: | |||
| (Inova Health Sys. Proj.) Series 2018 C, 4% 4/7/23, VRDN (b) | 6,425 | 6,425 | |
| Series 2016 C, 4% 4/7/23, VRDN (b) | 8,975 | 8,975 | |
| Norfolk Econ. Dev. Auth. Hosp. Facilities Rev. Series 2016, 4% 4/7/23, VRDN (b) | 51,315 | 51,315 | |
| Virginia Small Bus. Fin. Auth. Hosp. Rev. Series 2008 A, 3.97% 4/7/23, LOC PNC Bank NA, VRDN (b) | 28,600 | 28,600 | |
TOTAL VIRGINIA | 95,315 | ||
| Washington - 0.7% | |||
| Port of Vancouver Rev. (United Grain Corp. of Oregon Proj.) Series 2009, 3.94% 4/7/23, LOC Bank of America NA, VRDN (b) | 7,000 | 7,000 | |
| FHLMC: | |||
| Vancouver Hsg. Auth. Rev. Series 2008, 3.95% 4/7/23, LOC Freddie Mac, VRDN (b) | 10,600 | 10,600 | |
| Washington Hsg. Fin. Commission Multi-family Hsg. Rev. (Reserve at Renton Apts. Proj.) Series 2014, 3.99% 4/7/23, LOC Fed. Home Ln. Bank, San Francisco, VRDN (b) | 24,000 | 24,000 | |
TOTAL WASHINGTON | 41,600 | ||
| West Virginia - 0.9% | |||
| West Virginia Hosp. Fin. Auth. Hosp. Rev.: | |||
| (Cabell Huntington Hosp. Proj.) Series 2008 B, 4.15% 4/7/23, LOC Truist Bank, VRDN (b) | 6,400 | 6,400 | |
| Series 2018 C, 3.93% 4/7/23, LOC TD Banknorth, NA, VRDN (b) | 6,770 | 6,770 | |
| West Virginia Hosp. Fin. Auth. Rev. (Charleston Area Med. Ctr., Inc. Proj.) Series 2008 A, 4.08% 4/7/23, LOC Truist Bank, VRDN (b) | 44,600 | 44,600 | |
TOTAL WEST VIRGINIA | 57,770 | ||
| Wisconsin - 1.2% | |||
| Wisconsin Health & Edl. Facilities Series 2021 B, 3.9% 4/7/23 (Liquidity Facility U.S. Bank NA, Cincinnati), VRDN (b) | 36,925 | 36,925 | |
| Wisconsin Health & Edl. Facilities Auth. Rev. Series 2004, 4% 4/7/23, LOC JPMorgan Chase Bank, VRDN (b) | 2,555 | 2,555 | |
| Wisconsin Hsg. & Econ. Dev. Auth.: | |||
| Series 2021 B, 3.88% 4/7/23 (Liquidity Facility Fed. Home Ln. Bank Chicago), VRDN (b) | 22,600 | 22,600 | |
| Series 2022 B, 3.88% 4/7/23 (Liquidity Facility Fed. Home Ln. Bank Chicago), VRDN (b) | 15,000 | 15,000 | |
TOTAL WISCONSIN | 77,080 | ||
| Wyoming - 0.3% | |||
| Converse County Poll. Cont. Rev. (PacifiCorp Projs.) Series 1994, 4.2% 4/7/23, VRDN (b) | 4,800 | 4,800 | |
| Lincoln County Poll. Cont. Rev. (PacifiCorp Proj.) Series 1994, 4.2% 4/7/23, VRDN (b) | 2,100 | 2,100 | |
| Sweetwater County Poll. Cont. Rev. (PacifiCorp Proj.) Series 1994, 4.2% 4/7/23, VRDN (b) | 11,000 | 11,000 | |
TOTAL WYOMING | 17,900 | ||
| TOTAL VARIABLE RATE DEMAND NOTE (Cost $3,122,660) | 3,122,660 | ||
| Tender Option Bond - 29.9% | |||
Principal Amount (a) (000s) | Value ($) (000s) | ||
| Arizona - 0.4% | |||
| Arizona Indl. Dev. Auth. Hosp. Rev. Participating VRDN Series XM 10 13, 4.09% 4/7/23 (Liquidity Facility JPMorgan Chase Bank) (b)(e)(f) | 1,050 | 1,050 | |
| Arizona Tourism & Sports Auth. Tax Rev. Participating VRDN Series Floaters E85, 4% 4/7/23 (Liquidity Facility Royal Bank of Canada) (b)(e)(f) | 700 | 700 | |
| Lake Havasu City Ariz Participating VRDN Series Floaters G 103, 4% 4/7/23 (Liquidity Facility Royal Bank of Canada) (b)(e)(f) | 2,500 | 2,500 | |
| Maricopa County Rev. Participating VRDN Series ZM 06 51, 4% 4/7/23 (Liquidity Facility Morgan Stanley Bank, West Valley City Utah) (b)(e)(f) | 4,000 | 4,000 | |
| Mesa Util. Sys. Rev. Participating VRDN: | |||
| Series Floaters XL 00 71, 4% 4/7/23 (Liquidity Facility JPMorgan Chase Bank) (b)(e)(f) | 7,000 | 7,000 | |
| Series Solar 17 0026, 4.02% 4/7/23 (Liquidity Facility U.S. Bank NA, Cincinnati) (b)(e)(f) | 1,150 | 1,150 | |
| Series XM 10 12, 4.02% 4/7/23 (Liquidity Facility Toronto-Dominion Bank) (b)(e)(f) | 1,400 | 1,400 | |
| Salt Verde Finl. Corp. Sr. Gas Rev. Participating VRDN Series Floaters XF 25 37, 4.01% 4/7/23 (Liquidity Facility Barclays Bank PLC) (b)(e)(f) | 1,200 | 1,200 | |
| Tempe Union High School District #213 Participating VRDN Series XF 23 31, 4.02% 4/7/23 (Liquidity Facility Toronto-Dominion Bank) (b)(e)(f) | 3,440 | 3,440 | |
TOTAL ARIZONA | 22,440 | ||
| California - 0.2% | |||
| La Canada Unified School District Participating VRDN Series Floaters XF 26 42, 4.01% 4/7/23 (Liquidity Facility Bank of America NA) (b)(e)(f) | 8,100 | 8,100 | |
| Los Angeles Dept. of Wtr. & Pwr. Rev. Participating VRDN Series MS 3345, 4% 4/7/23 (Liquidity Facility Morgan Stanley Bank, West Valley City Utah) (b)(e)(f) | 1,760 | 1,760 | |
| Lucile Salter Packard Children's Hosp. Participating VRDN Series Floaters XG 01 48, 4% 4/7/23 (Liquidity Facility Morgan Stanley Bank, West Valley City Utah) (b)(e)(f) | 4,015 | 4,015 | |
TOTAL CALIFORNIA | 13,875 | ||
| Colorado - 0.7% | |||
| Children's Hosp. Assoc., Co. Participating VRDN Series Floaters XF 23 05, 4.01% 4/7/23 (Liquidity Facility Barclays Bank PLC) (b)(e)(f) | 745 | 745 | |
| Colorado Ctfs. of Prtn. Participating VRDN Series XG 04 26, 4% 4/7/23 (Liquidity Facility UBS AG) (b)(e)(f) | 2,905 | 2,905 | |
| Colorado Health Facilities Auth. Rev. Bonds Participating VRDN: | |||
| Series 2022 004, 4.17% (e)(f) | 15,595 | 15,595 | |
| Series 2022 XM 10 28, 4% 4/7/23 (Liquidity Facility JPMorgan Chase Bank) (b)(e)(f) | 4,000 | 4,000 | |
| Series XG 02 51, 4.02% 4/7/23 (Liquidity Facility Bank of America NA) (b)(e)(f) | 4,955 | 4,955 | |
| Series XM 08 29, 4.01% 4/7/23 (Liquidity Facility Barclays Bank PLC) (b)(e)(f) | 4,400 | 4,400 | |
| Series XM 09 97, 4% 4/7/23 (Liquidity Facility Royal Bank of Canada) (b)(e)(f) | 4,665 | 4,665 | |
| Colorado State Bldg. Excellent Schools Today Ctfs. of Prtn. Participating VRDN Series Floaters XF 07 25, 4% 4/7/23 (Liquidity Facility Royal Bank of Canada) (b)(e)(f) | 5,250 | 5,250 | |
| Univ. of Colorado Enterprise Sys. Rev. Participating VRDN Series Floaters XM 06 71, 4% 4/7/23 (Liquidity Facility Wells Fargo Bank NA) (b)(e)(f) | 3,335 | 3,335 | |
TOTAL COLORADO | 45,850 | ||
| Connecticut - 1.0% | |||
| Connecticut Gen. Oblig. Participating VRDN: | |||
| Series 15 XF0222, 4.01% 4/7/23 (Liquidity Facility Toronto-Dominion Bank) (b)(e)(f) | 8,000 | 8,000 | |
| Series 2017, 3.76% 4/7/23 (Liquidity Facility Barclays Bank PLC) (b)(e)(f) | 12,005 | 12,005 | |
| Series Floaters 014, 4.17% 5/12/23 (Liquidity Facility Barclays Bank PLC) (b)(e)(f) | 12,860 | 12,860 | |
| Series Floaters 016, 4.17% 5/12/23 (Liquidity Facility Barclays Bank PLC) (b)(e)(f) | 15,000 | 15,000 | |
| Series Floaters YX 10 95, 4% 4/7/23 (Liquidity Facility Barclays Bank PLC) (b)(e)(f) | 4,500 | 4,500 | |
| Connecticut Health & Edl. Facilities Auth. Rev. Participating VRDN Series YX 12 91, 4.01% 4/7/23 (Liquidity Facility Barclays Bank PLC) (b)(e)(f) | 8,100 | 8,100 | |
| Connecticut Spl. Tax Oblig. Trans. Infrastructure Rev. Bonds Series Floaters G 110, 4.15%, tender 10/2/23 (Liquidity Facility Royal Bank of Canada) (b)(d)(e)(f) | 3,300 | 3,300 | |
TOTAL CONNECTICUT | 63,765 | ||
| District Of Columbia - 0.7% | |||
| District of Columbia Gen. Oblig. Participating VRDN: | |||
| Series Floaters E 108, 4% 4/7/23 (Liquidity Facility Royal Bank of Canada) (b)(e)(f) | 2,980 | 2,980 | |
| Series Floaters XF 05 47, 4% 4/7/23 (Liquidity Facility JPMorgan Chase Bank) (b)(e)(f) | 4,665 | 4,665 | |
| Series MS 4301, 4% 4/7/23 (Liquidity Facility Morgan Stanley Bank, West Valley City Utah) (b)(e)(f) | 10,900 | 10,900 | |
| Series XF 27 59, 4% 4/7/23 (Liquidity Facility JPMorgan Chase Bank) (b)(e)(f) | 9,600 | 9,600 | |
| District of Columbia Income Tax Rev. Participating VRDN Series XM 10 77, 4% 4/7/23 (Liquidity Facility UBS AG) (b)(e)(f) | 3,750 | 3,750 | |
| Metropolitan Washington Arpts. Auth. Dulles Toll Road Rev. Participating VRDN: | |||
| Series XF 08 53, 4.02% 4/7/23 (Liquidity Facility Toronto-Dominion Bank) (b)(e)(f) | 3,850 | 3,850 | |
| Series XF 09 19, 4% 4/7/23 (Liquidity Facility JPMorgan Chase Bank) (b)(e)(f) | 1,355 | 1,355 | |
| Series XG 02 67, 4.02% 4/7/23 (Liquidity Facility Bank of America NA) (b)(e)(f) | 5,715 | 5,715 | |
TOTAL DISTRICT OF COLUMBIA | 42,815 | ||
| Florida - 1.1% | |||
| Broward County Convention Ctr. Bonds Series MS 00 11, 3.95%, tender 5/25/23 (Liquidity Facility Morgan Stanley Bank, West Valley City Utah) (b)(d)(e)(f) | 15,945 | 15,945 | |
| County of Broward Tourist Dev. Tax Rev. Participating VRDN: | |||
| Series XL 04 12, 4.05% 4/7/23 (Liquidity Facility Wells Fargo Bank NA) (b)(e)(f) | 4,000 | 4,000 | |
| Series XL 04 29, 4.08% 4/7/23 (Liquidity Facility Wells Fargo Bank NA) (b)(e)(f) | 1,415 | 1,415 | |
| Escambia County Health Facilities Auth. Health Facilities Rev. Participating VRDN: | |||
| Series XG 02 75, 3.37% 4/7/23 (Liquidity Facility Bank of America NA) (b)(e)(f) | 4,580 | 4,580 | |
| Series XG 02 81, 3.46% 4/7/23 (Liquidity Facility Bank of America NA) (b)(e)(f) | 635 | 635 | |
| Series ZF 09 31, 4.01% 4/7/23 (Liquidity Facility Bank of America NA) (b)(e)(f) | 1,605 | 1,605 | |
| Florida Gen. Oblig. Participating VRDN Series Floaters XF 06 80, 4.02% 4/7/23 (Liquidity Facility Toronto-Dominion Bank) (b)(e)(f) | 2,300 | 2,300 | |
| Gainesville Utils. Sys. Rev. Participating VRDN Series YX 12 84, 4% 4/7/23 (Liquidity Facility Barclays Bank PLC) (b)(e)(f) | 7,815 | 7,815 | |
| Lee Memorial Health Sys. Hosp. Rev. Participating VRDN Series Floaters XG 02 34, 4.02% 4/7/23 (Liquidity Facility Bank of America NA) (b)(e)(f) | 150 | 150 | |
| Miami-Dade County Edl. Facilities Rev. Participating VRDN Series Floaters XG 01 92, 4.01% 4/7/23 (Liquidity Facility Royal Bank of Canada) (b)(e)(f) | 2,575 | 2,575 | |
| Miami-Dade County Expressway Auth. Participating VRDN Series Floaters XG 02 52, 4.02% 4/7/23 (Liquidity Facility Bank of America NA) (b)(e)(f) | 3,500 | 3,500 | |
| Miami-Dade County Wtr. & Swr. Rev. Participating VRDN Series XF 30 80, 4% 4/7/23 (Liquidity Facility Barclays Bank PLC) (b)(e)(f) | 6,000 | 6,000 | |
| Palm Beach County Health Facilities Auth. Hosp. Rev. Participating VRDN: | |||
| Series XG 03 70, 4.07% 4/7/23 (Liquidity Facility Bank of America NA) (b)(e)(f) | 4,770 | 4,770 | |
| Series XM 07 82, 3.76% 4/7/23 (Liquidity Facility Barclays Bank PLC) (b)(e)(f) | 5,390 | 5,390 | |
| South Broward Hosp. District Rev. Participating VRDN Series XG 03 45, 4% 4/7/23 (Liquidity Facility Wells Fargo Bank NA) (b)(e)(f) | 400 | 400 | |
| South Miami Health Facilities Auth. Hosp. Rev. Participating VRDN Series XM 08 68, 4.12% 4/7/23 (Liquidity Facility JPMorgan Chase Bank) (b)(e)(f) | 830 | 830 | |
| Tampa Health Sys. Rev. Participating VRDN: | |||
| Series 16 XF2214, 4.02% 4/7/23 (Liquidity Facility Toronto-Dominion Bank) (b)(e)(f) | 4,800 | 4,800 | |
| Series 2022 ZF 14 10, 4% 4/7/23 (Liquidity Facility JPMorgan Chase Bank) (b)(e)(f) | 2,625 | 2,625 | |
| Tampa-Hillsborough County Expressway Auth. Rev. Bonds Series G-113, 4.17%, tender 7/3/23 (Liquidity Facility Royal Bank of Canada) (b)(d)(e)(f) | 700 | 700 | |
TOTAL FLORIDA | 70,035 | ||
| Georgia - 2.1% | |||
| Atlanta Wtr. & Wastewtr. Rev. Participating VRDN: | |||
| Series Floaters XF 07 05, 4% 4/7/23 (Liquidity Facility JPMorgan Chase Bank) (b)(e)(f) | 3,200 | 3,200 | |
| Series Floaters XF 26 49, 4% 4/7/23 (Liquidity Facility JPMorgan Chase Bank) (b)(e)(f) | 4,000 | 4,000 | |
| Brookhaven Dev. Auth. Rev. Participating VRDN: | |||
| Series XG 02 44, 4% 4/7/23 (Liquidity Facility Bank of America NA) (b)(e)(f) | 170 | 170 | |
| Series XX 12 80, 4% 4/7/23 (Liquidity Facility Barclays Bank PLC) (b)(e)(f) | 10,000 | 10,000 | |
| Burke County Indl. Dev. Auth. Poll. Cont. Rev. Participating VRDN: | |||
| Series E 155, 4% 4/7/23 (Liquidity Facility Royal Bank of Canada) (b)(e)(f) | 30,695 | 30,695 | |
| Series Floaters E 107, 4.02% 4/7/23 (Liquidity Facility Royal Bank of Canada) (b)(e)(f) | 8,400 | 8,400 | |
| Fayette County Hosp. Auth. Rev. Participating VRDN Series Floaters XF 06 44, 4.12% 4/7/23 (Liquidity Facility JPMorgan Chase Bank) (b)(e)(f) | 2,300 | 2,300 | |
| Fulton County Dev. Auth. Rev. Participating VRDN Series XL 02 68, 4.07% 4/7/23 (Liquidity Facility Bank of America NA) (b)(e)(f) | 1,500 | 1,500 | |
| Georgia Muni. Elec. Auth. Pwr. Rev. Participating VRDN: | |||
| Series XF 08 23, 4.02% 4/7/23 (Liquidity Facility Bank of America NA) (b)(e)(f) | 3,175 | 3,175 | |
| Series XF 08 30, 4.02% 4/7/23 (Liquidity Facility Toronto-Dominion Bank) (b)(e)(f) | 7,135 | 7,135 | |
| Series XG 04 70, 4.02% 4/7/23 (Liquidity Facility Bank of America NA) (b)(e)(f) | 3,800 | 3,800 | |
| Georgia Road & Thruway Auth. Rev. Participating VRDN Series 2021 XM 09 61, 4% 4/7/23 (Liquidity Facility Wells Fargo Bank NA) (b)(e)(f) | 1,910 | 1,910 | |
| Main Street Natural Gas, Inc. Participating VRDN: | |||
| Series 2022 ZL 03 05, 4.02% 4/7/23 (Liquidity Facility Royal Bank of Canada) (b)(e)(f) | 2,190 | 2,190 | |
| Series Floaters XF 07 51, 4% 4/7/23 (Liquidity Facility JPMorgan Chase Bank) (b)(e)(f) | 18,585 | 18,585 | |
| Series ZL 03 08, 4.02% 4/7/23 (Liquidity Facility Royal Bank of Canada) (b)(e)(f) | 1,875 | 1,875 | |
| Muni. Elec. Auth. of Georgia Participating VRDN Series XG 02 54, 4.02% 4/7/23 (Liquidity Facility Bank of America NA) (b)(e)(f) | 11,450 | 11,450 | |
| Private Colleges & Univs. Auth. Rev. Participating VRDN Series XF 07 07, 4% 4/7/23 (Liquidity Facility JPMorgan Chase Bank) (b)(e)(f) | 1,600 | 1,600 | |
| Wyandotte County Unified School District 500 Participating VRDN Series Floater 2018 G23A, 3.4% 4/7/23 (Liquidity Facility Royal Bank of Canada) (b)(e)(f) | 20,000 | 20,000 | |
TOTAL GEORGIA | 131,985 | ||
| Hawaii - 0.2% | |||
| Hawaii Gen. Oblig. Participating VRDN Series Solar 17 0031, 4.02% 4/7/23 (Liquidity Facility U.S. Bank NA, Cincinnati) (b)(e)(f) | 980 | 980 | |
| Honolulu City & County Gen. Oblig. Participating VRDN Series Floaters XM 07 18, 4% 4/7/23 (Liquidity Facility Morgan Stanley Bank, West Valley City Utah) (b)(e)(f) | 3,590 | 3,590 | |
| Honolulu City and County Wastewtr. Sys. Participating VRDN Series 15 XM0080, 4% 4/7/23 (Liquidity Facility Citibank NA) (b)(e)(f) | 7,960 | 7,960 | |
TOTAL HAWAII | 12,530 | ||
| Illinois - 3.6% | |||
| Chicago Board of Ed. Participating VRDN: | |||
| Series Floaters XG 02 17, 4% 4/7/23 (Liquidity Facility JPMorgan Chase Bank) (b)(e)(f) | 5,625 | 5,625 | |
| Series XG 04 69, 4.03% 4/7/23 (Liquidity Facility Bank of America NA) (b)(e)(f) | 3,260 | 3,260 | |
| Chicago Gen. Oblig. Participating VRDN: | |||
| Series 2022 XF 30 42, 4.01% 4/7/23 (Liquidity Facility Barclays Bank PLC) (b)(e)(f) | 2,545 | 2,545 | |
| Series 2022 XF 30 45, 4.01% 4/7/23 (Liquidity Facility Barclays Bank PLC) (b)(e)(f) | 27,580 | 27,580 | |
| Series Floaters XL 01 05, 4.01% 4/7/23 (Liquidity Facility Barclays Bank PLC) (b)(e)(f) | 4,000 | 4,000 | |
| Series XX 12 64, 4.01% 4/7/23 (Liquidity Facility Barclays Bank PLC) (b)(e)(f) | 6,580 | 6,580 | |
| Series XX 12 65, 4.01% 4/7/23 (Liquidity Facility Barclays Bank PLC) (b)(e)(f) | 2,660 | 2,660 | |
| Chicago O'Hare Int'l. Arpt. Rev. Participating VRDN Series Floaters XF 07 36, 4% 4/7/23 (Liquidity Facility JPMorgan Chase Bank) (b)(e)(f) | 3,655 | 3,655 | |
| Chicago Transit Auth. Participating VRDN Series XL 01 45, 4.01% 4/7/23 (Liquidity Facility Barclays Bank PLC) (b)(e)(f) | 10,685 | 10,685 | |
| Chicago Wastewtr. Transmission Rev. Participating VRDN Series Floaters XL 00 94, 4% 4/7/23 (Liquidity Facility JPMorgan Chase Bank) (b)(e)(f) | 11,170 | 11,170 | |
| Deutsche Bank Spears/Lifers Trust Participating VRDN Series Floaters XF 10 12, 4.01% 4/7/23 (Liquidity Facility Barclays Bank PLC) (b)(e)(f) | 9,400 | 9,400 | |
| Illinois Fin. Auth. Participating VRDN Series XG 04 31, 4.01% 4/7/23 (Liquidity Facility Barclays Bank PLC) (b)(e)(f) | 4,500 | 4,500 | |
| Illinois Fin. Auth. Rev. Participating VRDN: | |||
| Series 15 XF0253, 4.07% 4/7/23 (Liquidity Facility JPMorgan Chase Bank) (b)(e)(f) | 4,745 | 4,745 | |
| Series 17 XM 0492, 4% 4/7/23 (Liquidity Facility JPMorgan Chase Bank) (b)(e)(f) | 23,850 | 23,850 | |
| Series 2022 ZL 03 54, 4% 4/7/23 (Liquidity Facility Morgan Stanley Bank, West Valley City Utah) (b)(e)(f) | 2,500 | 2,500 | |
| Series XF 07 11, 4% 4/7/23 (Liquidity Facility JPMorgan Chase Bank) (b)(e)(f) | 9,900 | 9,900 | |
| Illinois Gen. Oblig. Participating VRDN: | |||
| Series 15 XF 1006, 4.01% 4/7/23 (Liquidity Facility Barclays Bank PLC) (b)(e)(f) | 2,990 | 2,990 | |
| Series Floaters XL 00 54, 4.01% 4/7/23 (Liquidity Facility Barclays Bank PLC) (b)(e)(f) | 7,000 | 7,000 | |
| Series Floaters YX 10 72, 4.01% 4/7/23 (Liquidity Facility Barclays Bank PLC) (b)(e)(f) | 6,820 | 6,820 | |
| Series Floaters YX 10 86, 4.01% 4/7/23 (Liquidity Facility Barclays Bank PLC) (b)(e)(f) | 1,245 | 1,245 | |
| Series XF 10 10, 4.01% 4/7/23 (Liquidity Facility Barclays Bank PLC) (b)(e)(f) | 10,595 | 10,595 | |
| Series XL 02 60, 4.01% 4/7/23 (Liquidity Facility Barclays Bank PLC) (b)(e)(f) | 7,400 | 7,400 | |
| Series XM 07 59, 4.02% 4/7/23 (Liquidity Facility Bank of America NA) (b)(e)(f) | 1,425 | 1,425 | |
| Series XM 10 49, 4.02% 4/7/23 (Liquidity Facility Bank of America NA) (b)(e)(f) | 6,500 | 6,500 | |
| Series XX 11 41, 4.01% 4/7/23 (Liquidity Facility Barclays Bank PLC) (b)(e)(f) | 1,800 | 1,800 | |
| Illinois Toll Hwy. Auth. Toll Hwy. Rev. Participating VRDN: | |||
| Series 15 XF0277, 4.03% 4/7/23 (Liquidity Facility JPMorgan Chase Bank) (b)(e)(f) | 2,665 | 2,665 | |
| Series 15 XF2202, 4.02% 4/7/23 (Liquidity Facility Toronto-Dominion Bank) (b)(e)(f) | 5,720 | 5,720 | |
| Series Floaters XF 27 67, 4.03% 4/7/23 (Liquidity Facility JPMorgan Chase Bank) (b)(e)(f) | 9,600 | 9,600 | |
| Series Floaters ZF 03 73, 4.03% 4/7/23 (Liquidity Facility JPMorgan Chase Bank) (b)(e)(f) | 9,525 | 9,525 | |
| Series XM 00 78, 4.02% 4/7/23 (Liquidity Facility Royal Bank of Canada) (b)(e)(f) | 5,180 | 5,180 | |
| Series XM 04 75, 4% 4/7/23 (Liquidity Facility Morgan Stanley Bank, West Valley City Utah) (b)(e)(f) | 4,695 | 4,695 | |
| Series ZL 03 32, 4.03% 4/7/23 (Liquidity Facility JPMorgan Chase Bank) (b)(e)(f) | 1,310 | 1,310 | |
| JPMorgan Chase Bank Participating VRDN Series ZF 13 88, 4.03% 4/7/23 (Liquidity Facility JPMorgan Chase Bank) (b)(e)(f) | 2,000 | 2,000 | |
| Metropolitan Pier & Exposition Participating VRDN Series XL 01 37, 4.01% 4/7/23 (Liquidity Facility Barclays Bank PLC) (b)(e)(f) | 1,550 | 1,550 | |
| Will County Illinois Participating VRDN Series XF 26 91, 3.96% 4/7/23 (Liquidity Facility Citibank NA) (b)(e)(f) | 8,100 | 8,100 | |
TOTAL ILLINOIS | 228,775 | ||
| Indiana - 0.3% | |||
| Indiana Health Facility Fing. Auth. Rev. Bonds Series MS 00 12, 4.07%, tender 4/13/23 (Liquidity Facility Morgan Stanley Bank, West Valley City Utah) (b)(d)(e)(f) | 20,400 | 20,400 | |
| Kansas - 0.1% | |||
| Wyandotte County/Kansas City Unified Govt. Util. Sys. Rev. Participating VRDN Series YX 12 23, 4.01% 4/7/23 (Liquidity Facility Barclays Bank PLC) (b)(e)(f) | 5,400 | 5,400 | |
| Kentucky - 0.4% | |||
| CommonSpirit Health Participating VRDN Series MIZ 90 21, 4.07% 4/7/23 (Liquidity Facility Mizuho Cap. Markets LLC) (b)(e)(f) | 5,200 | 5,200 | |
| Kentucky Bd Dev. Corp. Indl. Bldg. Participating VRDN Series XX 11 24, 4.01% 4/7/23 (Liquidity Facility Barclays Bank PLC) (b)(e)(f) | 9,910 | 9,910 | |
| Kentucky Econ. Dev. Fin. Auth. Hosp. Rev. Participating VRDN Series Floaters XG 01 23, 4.01% 4/7/23 (Liquidity Facility Barclays Bank PLC) (b)(e)(f) | 5,195 | 5,195 | |
| Kentucky State Property & Buildings Commission Rev. Participating VRDN Series XG 0113, 4.01% 4/7/23 (Liquidity Facility Barclays Bank PLC) (b)(e)(f) | 1,865 | 1,865 | |
TOTAL KENTUCKY | 22,170 | ||
| Louisiana - 0.4% | |||
| Louisiana Gas & Fuel Tax Rev. Participating VRDN Series EGL 14 0049, 4% 4/7/23 (Liquidity Facility Citibank NA) (b)(e)(f) | 13,600 | 13,600 | |
| Louisiana Pub. Facilities Auth. Lease Rev. Participating VRDN Series XM 08 56, 4% 4/7/23 (Liquidity Facility JPMorgan Chase Bank) (b)(e)(f) | 7,500 | 7,500 | |
| Louisiana Pub. Facilities Auth. Rev. Participating VRDN Series YX 12 95, 4.01% 4/7/23 (Liquidity Facility Barclays Bank PLC) (b)(e)(f) | 5,590 | 5,590 | |
| New Orleans Wtr. Participating VRDN Series XM 07 35, 4.02% 4/7/23 (Liquidity Facility Bank of America NA) (b)(e)(f) | 750 | 750 | |
TOTAL LOUISIANA | 27,440 | ||
| Maryland - 0.6% | |||
| Baltimore County Gen. Oblig. Participating VRDN Series Solar 17 22, 4% 4/7/23 (Liquidity Facility U.S. Bank NA, Cincinnati) (b)(e)(f) | 11,445 | 11,445 | |
| Baltimore Proj. Rev. Bonds Series Floaters G 28, 4.17%, tender 7/3/23 (Liquidity Facility Royal Bank of Canada) (b)(d)(e)(f) | 700 | 700 | |
| Maryland Health & Higher Edl. Facilities Auth. Rev. Participating VRDN: | |||
| Series Floaters XG 01 77, 4.01% 4/7/23 (Liquidity Facility Barclays Bank PLC) (b)(e)(f) | 1,900 | 1,900 | |
| Series Floaters XG 02 16, 4.01% 4/7/23 (Liquidity Facility Bank of America NA) (b)(e)(f) | 2,605 | 2,605 | |
| Montgomery County Gen. Oblig. Participating VRDN: | |||
| Series 15 XF0110, 4% 4/7/23 (Liquidity Facility JPMorgan Chase Bank) (b)(e)(f) | 7,975 | 7,975 | |
| Series Floaters XG 02 15, 4.01% 4/7/23 (Liquidity Facility Bank of America NA) (b)(e)(f) | 13,080 | 13,080 | |
TOTAL MARYLAND | 37,705 | ||
| Michigan - 1.2% | |||
| Detroit Downtown Dev. Auth. Tax Participating VRDN Series Floaters XX 11 01, 4.01% 4/7/23 (Liquidity Facility Barclays Bank PLC) (b)(e)(f) | 8,000 | 8,000 | |
| Grand Rapids San. Swr. Sys. Rev. Participating VRDN Series Floaters XF 26 12, 3.72% 4/7/23 (Liquidity Facility Citibank NA) (b)(e)(f) | 4,000 | 4,000 | |
| Mclaren Health Care Corp. Participating VRDN Series XL 02 71, 4.07% 4/7/23 (Liquidity Facility Bank of America NA) (b)(e)(f) | 1,010 | 1,010 | |
| Michigan Bldg. Auth. Rev. Participating VRDN: | |||
| Series Floaters XF 26 09, 3.94% 4/7/23 (Liquidity Facility Citibank NA) (b)(e)(f) | 3,240 | 3,240 | |
| Series Floaters XM 04 65, 4% 4/7/23 (Liquidity Facility Morgan Stanley Bank, West Valley City Utah) (b)(e)(f) | 10,635 | 10,635 | |
| Michigan Fin. Auth. Rev. Participating VRDN: | |||
| Series Floaters XF 26 48, 4% 4/7/23 (Liquidity Facility Bank of America NA) (b)(e)(f) | 6,460 | 6,460 | |
| Series XF 07 82, 4% 4/7/23 (Liquidity Facility JPMorgan Chase Bank) (b)(e)(f) | 3,730 | 3,730 | |
| Series XG 04 33, 4% 4/7/23 (Liquidity Facility JPMorgan Chase Bank) (b)(e)(f) | 9,425 | 9,425 | |
| Series XM 04 72, 4% 4/7/23 (Liquidity Facility Citibank NA) (b)(e)(f) | 2,000 | 2,000 | |
| Series ZF 30 32, 4% 4/7/23 (Liquidity Facility UBS AG) (b)(e)(f) | 2,560 | 2,560 | |
| Michigan Hosp. Fin. Auth. Rev. Bonds Series MS 00 15, 4.07%, tender 6/1/23 (Liquidity Facility Morgan Stanley Bank, West Valley City Utah) (b)(d)(e)(f) | 17,700 | 17,700 | |
| Pittsburg WTSW Participating VRDN Series 50 49 3.78% 4/3/23 (Liquidity Facility JPMorgan Chase Bank) (b)(e)(f) | 7,000 | 7,000 | |
| Trenton Pub. Schools School District Participating VRDN Series Floaters CTFS G 102, 4% 4/7/23 (Liquidity Facility Royal Bank of Canada) (b)(e)(f) | 1,900 | 1,900 | |
TOTAL MICHIGAN | 77,660 | ||
| Missouri - 1.3% | |||
| Kansas City Spl. Oblig. Participating VRDN: | |||
| Series XG 03 61, 4.01% 4/7/23 (Liquidity Facility Barclays Bank PLC) (b)(e)(f) | 4,140 | 4,140 | |
| Series YX 11 93, 4.01% 4/7/23 (Liquidity Facility Barclays Bank PLC) (b)(e)(f) | 5,810 | 5,810 | |
| Missouri Health & Edl. Facilities Participating VRDN Series Floaters XF 10 15, 4.01% 4/7/23 (Liquidity Facility Barclays Bank PLC) (b)(e)(f) | 24,805 | 24,805 | |
| Missouri Health & Edl. Facilities Auth. Edl. Facilities Rev. Participating VRDN Series Floaters XF 07 63, 4.01% 4/7/23 (Liquidity Facility Bank of America NA) (b)(e)(f) | 10,460 | 10,460 | |
| Missouri Health & Edl. Facilities Auth. Rev. Participating VRDN Series Floaters C16, 4.02% 4/7/23 (Liquidity Facility Royal Bank of Canada) (b)(e)(f) | 22,500 | 22,500 | |
| Missouri Health & Edl. Facilities Rev. Participating VRDN Series Floaters C17, 4.01% 4/7/23 (Liquidity Facility Royal Bank of Canada) (b)(e)(f) | 5,200 | 5,200 | |
| RBC Muni. Products, Inc. Trust Bonds Series 2023, 4.17%, tender 6/1/23 (Liquidity Facility Royal Bank of Canada) (b)(e)(f) | 3,320 | 3,320 | |
| St Louis County Spl. Oblig. Participating VRDN Series XG 03 82, 4% 4/7/23 (Liquidity Facility Wells Fargo Bank NA) (b)(e)(f) | 6,000 | 6,000 | |
TOTAL MISSOURI | 82,235 | ||
| Nebraska - 0.3% | |||
| Central Plains Energy Proj. Rev. Participating VRDN: | |||
| Series 2022 ZL 03 01, 4.02% 4/7/23 (Liquidity Facility Royal Bank of Canada) (b)(e)(f) | 2,000 | 2,000 | |
| Series 2022 ZL 03 04, 4.02% 4/7/23 (Liquidity Facility Royal Bank of Canada) (b)(e)(f) | 3,160 | 3,160 | |
| Nebraska Invt. Fin. Auth. Single Family Hsg. Rev. Participating VRDN Series XF 26 71, 4% 4/7/23 (Liquidity Facility Morgan Stanley Bank, West Valley City Utah) (b)(e)(f) | 2,675 | 2,675 | |
| Univ. of Nebraska Facilities Corp. Participating VRDN Series XL 04 15, 4% 4/7/23 (Liquidity Facility Barclays Bank PLC) (b)(e)(f) | 9,180 | 9,180 | |
TOTAL NEBRASKA | 17,015 | ||
| Nevada - 0.4% | |||
| Clark County Fuel Tax Participating VRDN Series Floaters XF 25 80, 4% 4/7/23 (Liquidity Facility Morgan Stanley Bank, West Valley City Utah) (b)(e)(f) | 15,725 | 15,725 | |
| Clark County School District Participating VRDN Series XF 14 73, 4.09% 4/7/23 (Liquidity Facility JPMorgan Chase Bank) (b)(e)(f) | 2,395 | 2,395 | |
| Las Vegas Convention & Visitors Auth. Participating VRDN Series XM 08 66, 4% 4/7/23 (Liquidity Facility Royal Bank of Canada) (b)(e)(f) | 8,100 | 8,100 | |
TOTAL NEVADA | 26,220 | ||
| New Jersey - 0.5% | |||
| New Jersey Econ. Dev. Auth. Rev. Participating VRDN: | |||
| Series Floaters XF 10 48, 4.01% 4/7/23 (Liquidity Facility Barclays Bank PLC) (b)(e)(f) | 3,400 | 3,400 | |
| Series Floaters XG 01 68, 4.01% 4/7/23 (Liquidity Facility Barclays Bank PLC) (b)(e)(f) | 6,025 | 6,025 | |
| Series YX 12 87, 4.01% 4/7/23 (Liquidity Facility Barclays Bank PLC) (b)(e)(f) | 2,725 | 2,725 | |
| New Jersey Tpk. Auth. Tpk. Rev. Participating VRDN Series XM 10 96, 4.01% 4/7/23 (Liquidity Facility Royal Bank of Canada) (b)(e)(f) | 5,100 | 5,100 | |
| New Jersey Trans. Trust Fund Auth. Participating VRDN: | |||
| Series Floaters XG 02 05, 4.01% 4/7/23 (Liquidity Facility Barclays Bank PLC) (b)(e)(f) | 8,115 | 8,115 | |
| Series Floaters XG 02 29, 4% 4/7/23 (Liquidity Facility Bank of America NA) (b)(e)(f) | 1,200 | 1,200 | |
| Series YX 12 68, 4.01% 4/7/23 (Liquidity Facility Barclays Bank PLC) (b)(e)(f) | 5,800 | 5,800 | |
TOTAL NEW JERSEY | 32,365 | ||
| New Mexico - 0.1% | |||
| New Mexico Mtg. Fin. Auth. Participating VRDN Series YX 11 89, 4.02% 4/7/23 (Liquidity Facility Barclays Bank PLC) (b)(e)(f) | 3,475 | 3,475 | |
| New York - 3.0% | |||
| New York City Gen. Oblig. Participating VRDN: | |||
| Series 15 ZF0197, 4% 4/7/23 (Liquidity Facility JPMorgan Chase Bank) (b)(e)(f) | 2,500 | 2,500 | |
| Series 2020 003, 4.12% 5/12/23 (Liquidity Facility Wells Fargo Bank NA) (b)(e)(f) | 1,300 | 1,300 | |
| Series Floaters E87, 4% 4/7/23 (Liquidity Facility Royal Bank of Canada) (b)(e)(f) | 8,200 | 8,200 | |
| Series Floaters E88, 4% 4/7/23 (Liquidity Facility Royal Bank of Canada) (b)(e)(f) | 2,000 | 2,000 | |
| Series Floaters XM 07 06, 4% 4/7/23 (Liquidity Facility Royal Bank of Canada) (b)(e)(f) | 1,900 | 1,900 | |
| Series XF 13 08, 4% 4/7/23 (Liquidity Facility JPMorgan Chase Bank) (b)(e)(f) | 2,520 | 2,520 | |
| Series XF 13 27, 4% 4/7/23 (Liquidity Facility JPMorgan Chase Bank) (b)(e)(f) | 4,000 | 4,000 | |
| New York City Muni. Wtr. Fin. Auth. Wtr. & Swr. Sys. Rev. Participating VRDN: | |||
| Series Floaters E 129, 4% 4/7/23 (Liquidity Facility Royal Bank of Canada) (b)(e)(f) | 22,800 | 22,800 | |
| Series XF 13 36, 4% 4/7/23 (Liquidity Facility JPMorgan Chase Bank) (b)(e)(f) | 6,200 | 6,200 | |
| Series ZL 02 48, 4% 4/7/23 (Liquidity Facility Royal Bank of Canada) (b)(e)(f) | 7,000 | 7,000 | |
| New York City Transitional Fin. Auth. Rev. Participating VRDN Series Floaters XF 07 17, 4% 4/7/23 (Liquidity Facility Toronto-Dominion Bank) (b)(e)(f) | 4,925 | 4,925 | |
| New York Dorm. Auth. Personal Income Tax Rev. Participating VRDN Series 15 XF1030, 4% 4/7/23 (Liquidity Facility Wells Fargo Bank NA) (b)(e)(f) | 2,700 | 2,700 | |
| New York Dorm. Auth. Rev. Bonds Series MS 00 09, 4.05%, tender 5/25/23 (Liquidity Facility Morgan Stanley Bank, West Valley City Utah) (b)(e)(f) | 4,200 | 4,200 | |
| New York Metropolitan Trans. Auth. Rev. Participating VRDN: | |||
| Series RBC E 126, 4.02% 4/7/23 (Liquidity Facility Royal Bank of Canada) (b)(e)(f) | 32,420 | 32,420 | |
| Series XF 28 78, 4.01% 4/7/23 (Liquidity Facility Barclays Bank PLC) (b)(e)(f) | 4,000 | 4,000 | |
| Series XF 30 00, 4.01% 4/7/23 (Liquidity Facility Barclays Bank PLC) (b)(e)(f) | 40,805 | 40,805 | |
| Triborough Bridge & Tunnel Auth. Participating VRDN: | |||
| Series 2022 XM 09 75, 4% 4/7/23 (Liquidity Facility JPMorgan Chase Bank) (b)(e)(f) | 10,400 | 10,400 | |
| Series XF 13 32, 4% 4/7/23 (Liquidity Facility JPMorgan Chase Bank) (b)(e)(f) | 32,625 | 32,625 | |
TOTAL NEW YORK | 190,495 | ||
| New York And New Jersey - 0.1% | |||
| Port Auth. of New York & New Jersey Participating VRDN Series Floaters XF 06 97, 4% 4/7/23 (Liquidity Facility Bank of America NA) (b)(e)(f) | 5,835 | 5,835 | |
| Non-State Specific - 0.1% | |||
| Monroeville Fin. Auth. UPMC Rev. Participating VRDN Series YX 11 85, 4.01% 4/7/23 (Liquidity Facility Barclays Bank PLC) (b)(e)(f) | 6,550 | 6,550 | |
| North Carolina - 0.4% | |||
| Charlotte Int'l. Arpt. Rev. Participating VRDN: | |||
| Series Floaters XG 02 07, 4% 4/7/23 (Liquidity Facility Bank of America NA) (b)(e)(f) | 3,500 | 3,500 | |
| Series ZL 04 05, 4.02% 4/7/23 (Liquidity Facility Morgan Stanley Bank, West Valley City Utah) (b)(e)(f) | 3,335 | 3,335 | |
| Charlotte Wtr. & Swr. Sys. Rev. Participating VRDN Series Floaters XG 01 70, 4% 4/7/23 (Liquidity Facility Royal Bank of Canada) (b)(e)(f) | 6,000 | 6,000 | |
| North Carolina Hsg. Fin. Agcy. Participating VRDN Series Floaters YX 10 52, 3.87% 4/7/23 (Liquidity Facility Barclays Bank PLC) (b)(e)(f) | 7,565 | 7,565 | |
| North Carolina Med. Care Commission Health Care Facilities Rev. Participating VRDN: | |||
| Series XF 13 52, 4% 4/7/23 (Liquidity Facility JPMorgan Chase Bank) (b)(e)(f) | 2,500 | 2,500 | |
| Series ZL 02 61, 4% 4/7/23 (Liquidity Facility JPMorgan Chase Bank) (b)(e)(f) | 5,000 | 5,000 | |
TOTAL NORTH CAROLINA | 27,900 | ||
| Ohio - 1.0% | |||
| Allen County Hosp. Facilities Rev. Participating VRDN: | |||
| Series Floaters E 134, 4% 4/7/23 (Liquidity Facility Royal Bank of Canada) (b)(e)(f) | 2,830 | 2,830 | |
| Series Floaters XF 25 16, 4.06% 4/7/23 (Liquidity Facility Toronto-Dominion Bank) (b)(e)(f) | 3,600 | 3,600 | |
| Berea Ohio City School District Participating VRDN Series RBC G 54, 3.97% 4/7/23 (Liquidity Facility Royal Bank of Canada) (b)(e)(f) | 2,400 | 2,400 | |
| Cuyahoga County Ctfs. of Prtn. Participating VRDN Series Floaters XG 02 06, 4.07% 4/7/23 (Liquidity Facility Bank of America NA) (b)(e)(f) | 955 | 955 | |
| Cuyahoga County Hosp. Rev. Participating VRDN Series 2022 XX 12 67, 4.01% 4/7/23 (Liquidity Facility Barclays Bank PLC) (b)(e)(f) | 13,905 | 13,905 | |
| Elyria City School District Participating VRDN Series Floaters G 107, 3.93% 4/7/23 (Liquidity Facility Royal Bank of Canada) (b)(e)(f) | 4,985 | 4,985 | |
| Hamilton County Hosp. Facilities Rev. Participating VRDN Series XG 04 22, 4% 4/7/23 (Liquidity Facility Royal Bank of Canada) (b)(e)(f) | 2,535 | 2,535 | |
| Miami County Hosp. Facilities Rev. Participating VRDN Series Floaters XG 02 25, 4% 4/7/23 (Liquidity Facility Royal Bank of Canada) (b)(e)(f) | 6,000 | 6,000 | |
| Montgomery County Hosp. Rev. Participating VRDN Series Floaters E 132, 4% 4/7/23 (Liquidity Facility Royal Bank of Canada) (b)(e)(f) | 14,685 | 14,685 | |
| Ohio Hosp. Rev. Participating VRDN Series C18, 4.01% 4/7/23 (Liquidity Facility Royal Bank of Canada) (b)(e)(f) | 2,100 | 2,100 | |
| Ohio Hsg. Fin. Agcy. Residential Mtg. Rev. Participating VRDN Series Floaters XF 27 11, 4% 4/7/23 (Liquidity Facility Morgan Stanley Bank, West Valley City Utah) (b)(e)(f) | 4,265 | 4,265 | |
| Ohio Univ. Gen. Receipts Athens Bonds Series Floaters G 27, 4.17%, tender 6/1/23 (Liquidity Facility Royal Bank of Canada) (b)(d)(e)(f) | 1,700 | 1,700 | |
| Univ. of Cincinnati Gen. Receipts Participating VRDN Series Floaters XF 24 38, 4% 4/7/23 (Liquidity Facility JPMorgan Chase Bank) (b)(e)(f) | 4,000 | 4,000 | |
TOTAL OHIO | 63,960 | ||
| Oklahoma - 0.2% | |||
| Edmond Pub. Works Auth. Sales Tax & Util. Sys. Rev. Participating VRDN Series Floaters XM 05 59, 4% 4/7/23 (Liquidity Facility Morgan Stanley Bank, West Valley City Utah) (b)(e)(f) | 7,265 | 7,265 | |
| Norman Reg'l. Hosp. Auth. Hosp. Rev. Participating VRDN Series XF 28 84, 4.01% 4/7/23 (Liquidity Facility Barclays Bank PLC) (b)(e)(f) | 1,370 | 1,370 | |
| Oklahoma Dev. Fin. Auth. Health Sys. Rev. Participating VRDN Series E 140, 4% 4/7/23 (Liquidity Facility Royal Bank of Canada) (b)(e)(f) | 3,300 | 3,300 | |
TOTAL OKLAHOMA | 11,935 | ||
| Oregon - 0.2% | |||
| Beaverton School District Participating VRDN Series 2022 XF 14 19, 4% 4/7/23 (Liquidity Facility JPMorgan Chase Bank) (b)(e)(f) | 6,230 | 6,230 | |
| Oregon Facilities Auth. Rev. Participating VRDN Series DB 15 XF1049, 4.07% 4/7/23 (Liquidity Facility Wells Fargo Bank NA) (b)(e)(f) | 3,470 | 3,470 | |
TOTAL OREGON | 9,700 | ||
| Pennsylvania - 1.0% | |||
| Commonwealth Fing. Auth. Tobacco Participating VRDN: | |||
| Series XL 00 60, 4.01% 4/7/23 (Liquidity Facility Barclays Bank PLC) (b)(e)(f) | 3,150 | 3,150 | |
| Series XX 10 80, 4.01% 4/7/23 (Liquidity Facility Barclays Bank PLC) (b)(e)(f) | 1,800 | 1,800 | |
| Cumberland County Muni. Auth. Rev. Participating VRDN Series YX 12 73, 4.01% 4/7/23 (Liquidity Facility Barclays Bank PLC) (b)(e)(f) | 5,985 | 5,985 | |
| Geisinger Auth. Health Sys. Rev. Participating VRDN: | |||
| Series Floaters XF 05 43, 4.04% 4/7/23 (Liquidity Facility Royal Bank of Canada) (b)(e)(f) | 2,290 | 2,290 | |
| Series XG 04 68, 4% 4/7/23 (Liquidity Facility Wells Fargo Bank NA) (b)(e)(f) | 6,760 | 6,760 | |
| Series XM 08 87, 4.12% 4/7/23 (Liquidity Facility JPMorgan Chase Bank) (b)(e)(f) | 2,125 | 2,125 | |
| Pennsylvania Gen. Oblig. Participating VRDN Series Floaters ZM 06 50, 4% 4/7/23 (Liquidity Facility Bank of America NA) (b)(e)(f) | 2,280 | 2,280 | |
| Pennsylvania Higher Edl. Facilities Auth. Rev. Participating VRDN Series XG 02 63, 4% 4/7/23 (Liquidity Facility Bank of America NA) (b)(e)(f) | 7,840 | 7,840 | |
| Pennsylvania State Univ. Participating VRDN Series XM 08 27, 4% 4/7/23 (Liquidity Facility JPMorgan Chase Bank) (b)(e)(f) | 2,700 | 2,700 | |
| Pennsylvania Tpk. Commission Tpk. Rev. Participating VRDN: | |||
| Series XM 10 08, 4% 4/7/23 (Liquidity Facility Royal Bank of Canada) (b)(e)(f) | 835 | 835 | |
| Series XX 10 44, 4.01% 4/7/23 (Liquidity Facility Barclays Bank PLC) (b)(e)(f) | 6,365 | 6,365 | |
| Philadelphia Auth. for Indl. Dev. Participating VRDN Series XG 02 53, 4.02% 4/7/23 (Liquidity Facility Bank of America NA) (b)(e)(f) | 2,520 | 2,520 | |
| Philadelphia Wtr. & Wastewtr. Rev. Participating VRDN: | |||
| Series 2017, 4.01% 4/7/23 (Liquidity Facility Barclays Bank PLC) (b)(e)(f) | 6,320 | 6,320 | |
| Series Floaters XF 07 19, 4% 4/7/23 (Liquidity Facility Royal Bank of Canada) (b)(e)(f) | 2,000 | 2,000 | |
| Southcentral Pennsylvania Gen. Auth. Rev. Participating VRDN Series XL 01 04, 4% 4/7/23 (Liquidity Facility Morgan Stanley Bank, West Valley City Utah) (b)(e)(f) | 4,320 | 4,320 | |
| Southeastern Pennsylvania Trans. Auth. Rev. Participating VRDN Series 2022 XG 04 12, 4% 4/7/23 (Liquidity Facility Royal Bank of Canada) (b)(e)(f) | 3,115 | 3,115 | |
| Westmoreland County Muni. Auth. Muni. Svc. Rev. Participating VRDN Series XF 10 58, 4.01% 4/7/23 (Liquidity Facility Barclays Bank PLC) (b)(e)(f) | 3,270 | 3,270 | |
TOTAL PENNSYLVANIA | 63,675 | ||
| Rhode Island - 0.1% | |||
| Rhode Island Health and Edl. Bldg. Corp. Higher Ed. Facility Rev. Participating VRDN Series Floaters XM 07 21, 4% 4/7/23 (Liquidity Facility Wells Fargo Bank NA) (b)(e)(f) | 4,750 | 4,750 | |
| South Carolina - 1.3% | |||
| Columbia Wtrwks. & Swr. Rev. Participating VRDN Series 2016 21, 4.02% 4/7/23 (Liquidity Facility U.S. Bank NA, Cincinnati) (b)(e)(f) | 960 | 960 | |
| Lancaster County School District Participating VRDN Series XF 25 28, 4% 4/7/23 (Liquidity Facility Morgan Stanley Bank, West Valley City Utah) (b)(e)(f) | 9,415 | 9,415 | |
| South Carolina Jobs-Econ. Dev. Auth. Participating VRDN Series 2018 Floaters XL 00 79, 4% 4/7/23 (Liquidity Facility JPMorgan Chase Bank) (b)(e)(f) | 4,800 | 4,800 | |
| South Carolina Pub. Svc. Auth. Rev. Participating VRDN: | |||
| Series 2017 XF 2425, 4.01% 4/7/23 (Liquidity Facility Barclays Bank PLC) (b)(e)(f) | 29,825 | 29,825 | |
| Series Floaters XG 01 49, 4.01% 4/7/23 (Liquidity Facility Barclays Bank PLC) (b)(e)(f) | 6,080 | 6,080 | |
| Series YX 12 69, 4.01% 4/7/23 (Liquidity Facility Barclays Bank PLC) (b)(e)(f) | 4,000 | 4,000 | |
| South Carolina Trans. Infrastructure Bank Rev.: | |||
| Bonds Series Floaters G 109, 4.17%, tender 10/2/23 (Liquidity Facility Royal Bank of Canada) (b)(d)(e)(f) | 1,000 | 1,000 | |
| Participating VRDN Series Floaters XM 06 91, 4% 4/7/23 (Liquidity Facility JPMorgan Chase Bank) (b)(e)(f) | 27,035 | 27,035 | |
TOTAL SOUTH CAROLINA | 83,115 | ||
| South Dakota - 0.1% | |||
| South Dakota Health & Edl. Facilities Auth. Rev. Participating VRDN Series 2022 XF 14 09, 4% 4/7/23 (Liquidity Facility Royal Bank of Canada) (b)(e)(f) | 5,625 | 5,625 | |
| Tennessee - 0.2% | |||
| Greeneville Health & Edl. Facilities Board Participating VRDN: | |||
| Series Floaters XF 25 76, 4.01% 4/7/23 (Liquidity Facility Barclays Bank PLC) (b)(e)(f) | 7,600 | 7,600 | |
| Series Floaters XG 01 94, 4.01% 4/7/23 (Liquidity Facility Royal Bank of Canada) (b)(e)(f) | 5,535 | 5,535 | |
| Tennessee Gen. Oblig. Participating VRDN Series XF 08 04, 4% 4/7/23 (Liquidity Facility JPMorgan Chase Bank) (b)(e)(f) | 1,690 | 1,690 | |
TOTAL TENNESSEE | 14,825 | ||
| Texas - 2.2% | |||
| Alamo Cmnty. College District Rev. Bonds Series G-111, 4.17%, tender 5/1/23 (Liquidity Facility Royal Bank of Canada) (b)(d)(e)(f) | 1,300 | 1,300 | |
| Aldine Independent School District Participating VRDN Series Floaters XL 00 87, 4% 4/7/23 (Liquidity Facility Wells Fargo Bank NA) (b)(e)(f) | 6,600 | 6,600 | |
| Dallas Wtrwks. & Swr. Sys. Rev. Participating VRDN Series XF 27 28, 4% 4/7/23 (Liquidity Facility JPMorgan Chase Bank) (b)(e)(f) | 6,395 | 6,395 | |
| El Paso Wtr. & Swr. Rev.: | |||
| Bonds Series 2022 MS 00 10, 4.07%, tender 5/18/23 (Liquidity Facility Morgan Stanley Bank, West Valley City Utah) (b)(e)(f) | 7,800 | 7,800 | |
| Participating VRDN Series XM 10 74, 4% 4/7/23 (Liquidity Facility Wells Fargo Bank NA) (b)(e)(f) | 3,730 | 3,730 | |
| Forney Independent School District Participating VRDN Series 2022 XL 03 62, 4% 4/7/23 (Liquidity Facility Bank of America NA) (b)(e)(f) | 3,120 | 3,120 | |
| Goose Creek Consolidated Independent School District Participating VRDN Series XM 10 56, 4% 4/7/23 (Liquidity Facility Morgan Stanley Bank, West Valley City Utah) (b)(e)(f) | 3,750 | 3,750 | |
| Harris County Health Facilities Dev. Corp. Rev. Participating VRDN Series 16 ZF 03 12, 4% 4/7/23 (Liquidity Facility JPMorgan Chase Bank) (b)(e)(f) | 8,825 | 8,825 | |
| Houston Gen. Oblig. Participating VRDN Series Floater 2018 G21, 4% 4/7/23 (Liquidity Facility Royal Bank of Canada) (b)(e)(f) | 3,300 | 3,300 | |
| New Braunfels Independent School District Participating VRDN Series 2022 XM 10 63, 4% 4/7/23 (Liquidity Facility Bank of America NA) (b)(e)(f) | 1,250 | 1,250 | |
| New Hope Cultural Ed. Facilities Fin. Corp. Participating VRDN Series Floaters XF 07 10, 4% 4/7/23 (Liquidity Facility JPMorgan Chase Bank) (b)(e)(f) | 3,985 | 3,985 | |
| North Ft. Bend Wtr. Auth. Participating VRDN Series 2022 XF 30 23, 4% 4/7/23 (Liquidity Facility Wells Fargo Bank NA) (b)(e)(f) | 7,620 | 7,620 | |
| North Texas Tollway Auth. Rev.: | |||
| Bonds Series G-112, 4.17%, tender 7/3/23 (Liquidity Facility Royal Bank of Canada) (b)(d)(e)(f) | 1,000 | 1,000 | |
| Participating VRDN Series XG 04 23, 3.55% 4/7/23 (Liquidity Facility Royal Bank of Canada) (b)(e)(f) | 4,295 | 4,295 | |
| RBC Muni. Products, Inc. Trust Bonds Series G 124, 4.17%, tender 9/1/23 (Liquidity Facility Royal Bank of Canada) (b)(d)(e)(f)(g) | 2,000 | 2,000 | |
| San Antonio Wtr. Sys. Rev. Participating VRDN Series XF 14 47, 4% 4/7/23 (Liquidity Facility Bank of America NA) (b)(e)(f) | 2,000 | 2,000 | |
| Tarrant County Cultural Ed. Facilities Fin. Corp. Hosp. Rev. Participating VRDN: | |||
| Series 16 XF0411, 4% 4/7/23 (Liquidity Facility JPMorgan Chase Bank) (b)(e)(f) | 2,000 | 2,000 | |
| Series 16 ZF 0282, 4.02% 4/7/23 (Liquidity Facility Toronto-Dominion Bank) (b)(e)(f) | 6,150 | 6,150 | |
| Series E 141, 4% 4/7/23 (Liquidity Facility Royal Bank of Canada) (b)(e)(f) | 10,320 | 10,320 | |
| Series XL 03 60, 4% 4/7/23 (Liquidity Facility Wells Fargo Bank NA) (b)(e)(f) | 2,745 | 2,745 | |
| Tarrant County Cultural Ed. Facilities Fin. Corp. Rev. Participating VRDN Series Floaters XM 06 98, 4.01% 4/7/23 (Liquidity Facility UBS AG) (b)(e)(f) | 2,785 | 2,785 | |
| Texas Gen. Oblig. Participating VRDN Series MS 3390, 4.02% 4/7/23 (Liquidity Facility Toronto-Dominion Bank) (b)(e)(f) | 4,000 | 4,000 | |
| Texas Wtr. Dev. Board Rev. Participating VRDN: | |||
| Series 2022 XM 1066, 3.99% 4/7/23 (Liquidity Facility Citibank NA) (b)(e)(f) | 9,380 | 9,380 | |
| Series Floaters XF 07 13, 4% 4/7/23 (Liquidity Facility Toronto-Dominion Bank) (b)(e)(f) | 4,400 | 4,400 | |
| Series Floaters XF 25 57, 4.02% 4/7/23 (Liquidity Facility Toronto-Dominion Bank) (b)(e)(f) | 5,600 | 5,600 | |
| Series Floaters XF 27 30, 4% 4/7/23 (Liquidity Facility JPMorgan Chase Bank) (b)(e)(f) | 4,310 | 4,310 | |
| Series Floaters XG 02 11, 4% 4/7/23 (Liquidity Facility Bank of America NA) (b)(e)(f) | 10,000 | 10,000 | |
| Series XM 10 82, 4% 4/7/23 (Liquidity Facility JPMorgan Chase Bank) (b)(e)(f) | 5,000 | 5,000 | |
| Whitehouse Independent School District Participating VRDN Series Floaters G10, 3.7% 4/7/23 (Liquidity Facility Royal Bank of Canada) (b)(e)(f) | 2,700 | 2,700 | |
| Ysleta Tex Independent School District Participating VRDN Series XF 13 38, 4% 4/7/23 (Liquidity Facility Bank of America NA) (b)(e)(f) | 2,000 | 2,000 | |
TOTAL TEXAS | 138,360 | ||
| Utah - 0.3% | |||
| Intermountain Pwr. Agcy. Pwr. Supply Rev. Participating VRDN Series E152, 4% 4/7/23 (Liquidity Facility Royal Bank of Canada) (b)(e)(f) | 14,075 | 14,075 | |
| Utah County Hosp. Rev. Participating VRDN: | |||
| Series Floaters XG 01 71, 4% 4/7/23 (Liquidity Facility Royal Bank of Canada) (b)(e)(f) | 3,050 | 3,050 | |
| Series XM 10 03, 4% 4/7/23 (Liquidity Facility JPMorgan Chase Bank) (b)(e)(f) | 2,435 | 2,435 | |
TOTAL UTAH | 19,560 | ||
| Virginia - 1.1% | |||
| Chesapeake Bay Bridge and Tunnel District Gen. Resolution Rev. Participating VRDN Series XF 30 64, 4.01% 4/7/23 (Liquidity Facility Barclays Bank PLC) (b)(e)(f) | 4,200 | 4,200 | |
| Fairfax County Indl. Dev. Auth. Participating VRDN Series Floaters XG 01 91, 4% 4/7/23 (Liquidity Facility Morgan Stanley Bank, West Valley City Utah) (b)(e)(f) | 22,783 | 22,783 | |
| Hampton Roads Trans. Accountability Commission Participating VRDN: | |||
| Series XF 13 20, 4% 4/7/23 (Liquidity Facility JPMorgan Chase Bank) (b)(e)(f) | 5,000 | 5,000 | |
| Series ZL 02 67, 4% 4/7/23 (Liquidity Facility Wells Fargo Bank NA) (b)(e)(f) | 2,250 | 2,250 | |
| Lynchburg Econ. Dev. Participating VRDN Series Floaters XG 01 47, 4.01% 4/7/23 (Liquidity Facility Barclays Bank PLC) (b)(e)(f) | 595 | 595 | |
| Norfolk Econ. Dev. Health Care Facilities Participating VRDN Series 2022 C20, 4.01% 4/7/23 (Liquidity Facility Royal Bank of Canada) (b)(e)(f) | 5,000 | 5,000 | |
| Roanoke Econ. Dev. Authority. Participating VRDN Series 20 XG 02 97, 4% 4/7/23 (Liquidity Facility Royal Bank of Canada) (b)(e)(f) | 1,930 | 1,930 | |
| Univ. of Virginia Gen. Rev. Participating VRDN: | |||
| Series Solar 17 17, 4.02% 4/7/23 (Liquidity Facility U.S. Bank NA, Cincinnati) (b)(e)(f) | 10,325 | 10,325 | |
| Series XG 04 08, 4% 4/7/23 (Liquidity Facility Morgan Stanley Bank, West Valley City Utah) (b)(e)(f) | 3,375 | 3,375 | |
| Virginia Commonwealth Trans. Board Rev. Participating VRDN Series Floaters XF 06 59, 4% 4/7/23 (Liquidity Facility Royal Bank of Canada) (b)(e)(f) | 6,035 | 6,035 | |
| Virginia Pub. Bldg. Auth. Pub. Facilities Rev. Bonds Series Floaters G 40, 4.17%, tender 8/1/23 (Liquidity Facility Royal Bank of Canada) (b)(d)(e)(f) | 700 | 700 | |
| Virginia Small Bus. Fing. Auth. Health Care Facilities Rev. Participating VRDN: | |||
| Series XF 09 26, 4.12% 4/7/23 (Liquidity Facility JPMorgan Chase Bank) (b)(e)(f) | 1,935 | 1,935 | |
| Series XL 04 37, 3.8% 4/3/23 (Liquidity Facility JPMorgan Chase Bank) (b)(e)(f) | 7,200 | 7,200 | |
TOTAL VIRGINIA | 71,328 | ||
| Washington - 2.4% | |||
| Central Puget Sound Reg'l. Trans. Auth. Sales & Use Tax Rev. Participating VRDN: | |||
| Series Floaters XF 23 97, 4.02% 4/7/23 (Liquidity Facility Toronto-Dominion Bank) (b)(e)(f) | 5,335 | 5,335 | |
| Series XM 11 01, 3.98% 4/7/23 (Liquidity Facility Citibank NA) (b)(e)(f) | 4,200 | 4,200 | |
| Centralia School District No. 401 Participating VRDN Series Floaters G74, 4% 4/7/23 (Liquidity Facility Royal Bank of Canada) (b)(e)(f) | 4,500 | 4,500 | |
| CommonSpirit Health Participating VRDN Series XF 1017, 4.01% 4/7/23 (Liquidity Facility Barclays Bank PLC) (b)(e)(f) | 6,000 | 6,000 | |
| Multicare Health Sys. Participating VRDN Series E 153, 4% 4/7/23 (Liquidity Facility Royal Bank of Canada) (b)(e)(f) | 16,340 | 16,340 | |
| Pierce County School District #10 Tacoma Participating VRDN Series 15 XF2166, 3.99% 4/7/23 (Liquidity Facility Bank of America NA) (b)(e)(f) | 8,000 | 8,000 | |
| RBC Muni. Products, Inc. Trust Bonds Series G 123, 4.17%, tender 11/1/23 (Liquidity Facility Royal Bank of Canada) (b)(d)(e)(f) | 1,560 | 1,560 | |
| Seattle Muni. Lt. & Pwr. Rev. Participating VRDN Series Floaters XF 06 64, 4% 4/7/23 (Liquidity Facility Royal Bank of Canada) (b)(e)(f) | 5,165 | 5,165 | |
| Washington Convention Ctr. Pub. Facilities Participating VRDN: | |||
| Series 2022 XX 12 38, 4.01% 4/7/23 (Liquidity Facility Barclays Bank PLC) (b)(e)(f) | 19,715 | 19,715 | |
| Series Floaters XM 06 80, 4.01% 4/7/23 (Liquidity Facility Barclays Bank PLC) (b)(e)(f) | 9,400 | 9,400 | |
| Series XG 02 87, 4.01% 4/7/23 (Liquidity Facility Barclays Bank PLC) (b)(e)(f) | 2,100 | 2,100 | |
| Washington Gen. Oblig. Participating VRDN: | |||
| Series Floaters G33, 4% 4/7/23 (Liquidity Facility Royal Bank of Canada) (b)(e)(f) | 1,250 | 1,250 | |
| Series Floaters XF 25 39, 4.02% 4/7/23 (Liquidity Facility Toronto-Dominion Bank) (b)(e)(f) | 8,000 | 8,000 | |
| Series Floaters XM 06 94, 4% 4/7/23 (Liquidity Facility Citibank NA) (b)(e)(f) | 4,985 | 4,985 | |
| Washington Health Care Facilities Auth. Rev. Participating VRDN: | |||
| Series 15 XF0132, 4.07% 4/7/23 (Liquidity Facility JPMorgan Chase Bank) (b)(e)(f) | 16,400 | 16,400 | |
| Series 15 XF0148, 4.07% 4/7/23 (Liquidity Facility Bank of America NA) (b)(e)(f) | 15,625 | 15,625 | |
| Series 2015 XF0150, 4.07% 4/7/23 (Liquidity Facility Bank of America NA) (b)(e)(f) | 3,655 | 3,655 | |
| Series Floaters XF 25 27, 4.07% 4/7/23 (Liquidity Facility Citibank NA) (b)(e)(f) | 4,750 | 4,750 | |
| Series XF 15 14, 2.9% 4/7/23 (Liquidity Facility Toronto-Dominion Bank) (b)(e)(f) | 4,015 | 4,015 | |
| Series XF 30 62, 4.01% 4/7/23 (Liquidity Facility Barclays Bank PLC) (b)(e)(f) | 1,300 | 1,300 | |
| Series XG 04 75, 4.02% 4/7/23 (Liquidity Facility Toronto-Dominion Bank) (b)(e)(f) | 2,790 | 2,790 | |
| Series YX 12 10, 4.07% 4/7/23 (Liquidity Facility Barclays Bank PLC) (b)(e)(f) | 4,590 | 4,590 | |
TOTAL WASHINGTON | 149,675 | ||
| Wisconsin - 0.5% | |||
| Univ. of Wisconsin Hosp. & Clinics Auth. Participating VRDN Series XL 02 96, 4% 4/7/23 (Liquidity Facility Morgan Stanley Bank, West Valley City Utah) (b)(e)(f) | 4,000 | 4,000 | |
| Wisconsin Health & Edl. Facilities Participating VRDN: | |||
| Series Floaters XF 07 41, 4% 4/7/23 (Liquidity Facility JPMorgan Chase Bank) (b)(e)(f) | 6,820 | 6,820 | |
| Series Floaters XF 24 18, 4% 4/7/23 (Liquidity Facility Citibank NA) (b)(e)(f) | 5,000 | 5,000 | |
| Series Floaters XF 25 41, 4% 4/7/23 (Liquidity Facility JPMorgan Chase Bank) (b)(e)(f) | 10,000 | 10,000 | |
| Wisconsin Hsg. & Econ. Dev. Auth. Participating VRDN Series Floaters YX 26 90, 4% 4/7/23 (Liquidity Facility Morgan Stanley Bank, West Valley City Utah) (b)(e)(f) | 3,755 | 3,755 | |
TOTAL WISCONSIN | 29,575 | ||
| Wyoming - 0.1% | |||
| Wyoming Muni. Pwr. Agcy. Pwr. Supply Sys. Rev. Participating VRDN Series XL 00 70, 4% 4/7/23 (Liquidity Facility JPMorgan Chase Bank) (b)(e)(f) | 6,730 | 6,730 | |
| TOTAL TENDER OPTION BOND (Cost $1,887,748) | 1,887,748 | ||
| Other Municipal Security - 9.4% | |||
Principal Amount (a) (000s) | Value ($) (000s) | ||
| Alabama - 0.3% | |||
| Huntsville Health Care Auth. Rev. Series 2023, 3.4% 4/5/23, CP | 18,300 | 18,300 | |
| California - 0.1% | |||
| California Gen. Oblig. Series 2023, 4% 4/11/23, LOC Bank of America NA, CP | 5,330 | 5,330 | |
| Connecticut - 0.0% | |||
| Connecticut Gen. Oblig. Bonds Series 2021 A, 5% 4/15/23 | 1,860 | 1,861 | |
| Florida - 0.6% | |||
| Alachua County Health Facilities Auth. Health Facilities Rev. Bonds Series 2023 A, 3.54% tender 4/6/23, LOC Bank of America NA, CP mode | 14,000 | 14,000 | |
| Florida Local Govt. Fin. Cmnty. Series 2023 A1, 3% 4/4/23, LOC JPMorgan Chase Bank, CP | 15,200 | 15,200 | |
| Polk County Indl. Dev. Auth. Health Sys. Rev. Bonds: | |||
| Series 2014 A, SIFMA Municipal Swap Index + 0.300% 4.27%, tender 10/27/23 (b)(g) | 1,000 | 1,000 | |
| Series 2014 A1, SIFMA Municipal Swap Index + 0.250% 4.22%, tender 10/27/23 (b)(g) | 3,800 | 3,800 | |
| Tampa Health Sys. Rev. Bonds Series 2012 B, SIFMA Municipal Swap Index + 0.300% 4.27%, tender 10/27/23 (b)(g) | 5,300 | 5,300 | |
TOTAL FLORIDA | 39,300 | ||
| Illinois - 0.0% | |||
| Illinois Fin. Auth. Rev. Bonds (Advocate Health Care Network Proj.) Series 2011 B, SIFMA Municipal Swap Index + 0.300% 4.3%, tender 10/27/23 (b)(g) | 600 | 600 | |
| Kentucky - 0.0% | |||
| Kentucky State Property & Buildings Commission Rev. Bonds Series 2017, 5% 4/1/23 | 500 | 500 | |
| Maryland - 0.1% | |||
| Montgomery County Gen. Oblig. Bonds Series 2013 MD, 3.28%, tender 6/1/23 (b) | 4,900 | 4,900 | |
| Michigan - 0.9% | |||
| Kent Hosp. Fin. Auth. Hosp. Facilities Rev. Bonds (Spectrum Health Sys. Proj.) Series 2015 A, SIFMA Municipal Swap Index + 0.250% 4.22%, tender 10/27/23 (b)(g) | 2,815 | 2,815 | |
| Michigan Bldg. Auth. Rev. Series 2023, 3.4% 4/20/23, LOC JPMorgan Chase Bank, CP | 50,200 | 50,200 | |
| Michigan Fin. Auth. Rev. Bonds Series 2013 M1, 3.28%, tender 6/1/23 (b) | 3,500 | 3,500 | |
TOTAL MICHIGAN | 56,515 | ||
| Nebraska - 0.2% | |||
| Omaha Pub. Pwr. District Elec. Rev.: | |||
| Series 2023 A: | |||
3.15% 6/5/23, CP | 4,100 | 4,100 | |
3.35% 4/3/23, CP | 2,800 | 2,800 | |
| Series 2023, 3.05% 4/6/23, CP | 6,900 | 6,900 | |
TOTAL NEBRASKA | 13,800 | ||
| New Jersey - 0.6% | |||
| Beachwood BAN Series 2023 A, 5% 2/28/24 | 4,700 | 4,758 | |
| Evesham Township BAN Series 2022 B, 4% 9/20/23 | 3,900 | 3,920 | |
| New Jersey Econ. Dev. Auth. Rev. Bonds Series 2005 N1, 5.5% 9/1/23 | 19,800 | 19,986 | |
| New Jersey Edl. Facility Bonds Series 2014 A, 5% 9/1/23 | 2,790 | 2,807 | |
| Wood-Ridge Gen. Oblig. BAN Series 2023, 5.5% 2/27/24 | 3,000 | 3,048 | |
TOTAL NEW JERSEY | 34,519 | ||
| New York - 0.6% | |||
| Babylon Union Free School District TAN Series 2022, 5% 4/14/23 | 4,000 | 4,002 | |
| Elwood Union Free School District TAN Series 2023, 4.25% 6/23/23 | 7,500 | 7,514 | |
| North Hempstead Gen. Oblig. BAN Series 2022 C, 4.5% 9/22/23 | 14,445 | 14,547 | |
| Sag Hbr. Union Free School District TAN Series 2022, 5% 5/18/23 | 4,500 | 4,509 | |
| Webster Central School District BAN Series 2022, 4% 6/28/23 | 7,000 | 7,014 | |
TOTAL NEW YORK | 37,586 | ||
| Ohio - 0.1% | |||
| Allen County Hosp. Facilities Rev. Bonds Series 2020 A, 5% 12/1/23 | 500 | 505 | |
| Ohio Higher Edl. Facility Commission Rev. Bonds Series 2023: | |||
| 2.6% tender 4/13/23, CP mode | 2,000 | 2,000 | |
| 3.7% tender 5/23/23, CP mode | 3,700 | 3,700 | |
TOTAL OHIO | 6,205 | ||
| Oklahoma - 0.1% | |||
| Oklahoma City Wtr. Utils. Series 2023 A: | |||
| 3.1% 4/5/23 (Liquidity Facility State Street Bank & Trust Co., Boston), CP | 8,100 | 8,100 | |
| 4.2% 4/5/23 (Liquidity Facility State Street Bank & Trust Co., Boston), CP | 1,000 | 1,000 | |
TOTAL OKLAHOMA | 9,100 | ||
| Oregon - 0.1% | |||
| Oregon St Dept. Trans. Rev.: | |||
| Series 2023 A1, 3.55% 5/4/23, LOC Wells Fargo Bank NA, CP | 5,600 | 5,600 | |
| Series 2023 A2, 3.65% 5/4/23, LOC Bank of Montreal, CP | 3,000 | 3,000 | |
TOTAL OREGON | 8,600 | ||
| Pennsylvania - 0.0% | |||
| Commonwealth Fing. Auth. Tobacco Bonds Series 2018, 5% 6/1/23 | 935 | 937 | |
| Philadelphia Wtr. Series 2023 C, 4.5% 5/4/23, LOC The Toronto-Dominion Bank, CP | 1,000 | 1,000 | |
TOTAL PENNSYLVANIA | 1,937 | ||
| South Carolina - 0.0% | |||
| Berkeley County School District Bonds Series 2022 A, 5% 6/1/23 | 560 | 562 | |
| Charleston County School District BAN Series 2022 B, 4% 5/10/23 | 305 | 305 | |
TOTAL SOUTH CAROLINA | 867 | ||
| Tennessee - 0.2% | |||
| Metropolitan Govt. Nashville & Davidson County Wtr. & Swr. Sys. Rev. Series 2023 A, 3.45% 5/17/23, LOC TD Banknorth, NA, CP | 9,300 | 9,300 | |
| Texas - 5.0% | |||
| Austin Elec. Util. Sys. Rev. Series 2023 A: | |||
| 2.84% 4/4/23 (Liquidity Facility JPMorgan Chase Bank), CP | 2,725 | 2,725 | |
| 2.92% 4/5/23 (Liquidity Facility JPMorgan Chase Bank), CP | 55,675 | 55,675 | |
| Fort Bend Independent School District Series 2023: | |||
| 3.38% 4/26/23 (Liquidity Facility JPMorgan Chase Bank), CP | 3,900 | 3,900 | |
| 3.51% 6/23/23 (Liquidity Facility JPMorgan Chase Bank), CP | 9,600 | 9,600 | |
| 3.6% 4/26/23 (Liquidity Facility JPMorgan Chase Bank), CP | 4,600 | 4,600 | |
| Harris County Cultural Ed. Facilities Fin. Corp. Rev. Bonds: | |||
| Series 2023 B1, 3.23% tender 6/1/23, CP mode | 15,000 | 15,000 | |
| Series 2023, 3.2% tender 4/4/23, CP mode | 19,300 | 19,300 | |
| Harris County Gen. Oblig.: | |||
| Series 2023 A1: | |||
2.92% 4/5/23 (Liquidity Facility State Street Bank & Trust Co., Boston), CP | 2,930 | 2,930 | |
3.3% 6/6/23 (Liquidity Facility State Street Bank & Trust Co., Boston), CP | 7,330 | 7,330 | |
| Series 2023 D: | |||
2.84% 4/4/23 (Liquidity Facility JPMorgan Chase Bank), CP | 6,200 | 6,200 | |
3.3% 6/6/23 (Liquidity Facility JPMorgan Chase Bank), CP | 11,600 | 11,600 | |
| Series 2023 D3, 3% 4/3/23 (Liquidity Facility Wells Fargo Bank NA), CP | 3,970 | 3,970 | |
| Series 2023 K, 3.68% 4/21/23, LOC PNC Bank NA, CP | 4,160 | 4,160 | |
| Lower Colorado River Auth. Rev.: | |||
| Series 2023 B, 3.35% 4/27/23, LOC State Street Bank & Trust Co., Boston, CP | 7,459 | 7,459 | |
| Series 2023, 3.55% 4/25/23, LOC JPMorgan Chase Bank, LOC State Street Bank & Trust Co., Boston, CP | 36,300 | 36,300 | |
| Tarrant County Cultural Ed. Facilities Fin. Corp. Hosp. Rev. Bonds (Baylor Health Care Sys. Proj.): | |||
| Series 2011 B, SIFMA Municipal Swap Index + 0.300% 4.3%, tender 10/27/23 (b)(g) | 8,400 | 8,400 | |
| Series 2013 B, SIFMA Municipal Swap Index + 0.300% 4.3%, tender 10/27/23 (b)(g) | 2,400 | 2,400 | |
| Univ. of Texas Board of Regents Sys. Rev. Series 2023 A: | |||
| 3% 4/4/23 (Liquidity Facility Univ. of Texas Invt. Mgmt. Co.), CP | 7,100 | 7,100 | |
| 3.2% 4/5/23 (Liquidity Facility Univ. of Texas Invt. Mgmt. Co.), CP | 6,600 | 6,600 | |
| 3.2% 8/1/23 (Liquidity Facility Univ. of Texas Invt. Mgmt. Co.), CP | 4,700 | 4,700 | |
| 3.5% 4/6/23 (Liquidity Facility Univ. of Texas Invt. Mgmt. Co.), CP | 11,000 | 11,000 | |
| 3.6% 4/21/23 (Liquidity Facility Univ. of Texas Invt. Mgmt. Co.), CP | 6,900 | 6,900 | |
| 3.65% 5/25/23 (Liquidity Facility Univ. of Texas Invt. Mgmt. Co.), CP | 13,500 | 13,500 | |
| Univ. of Texas Permanent Univ. Fund Rev. Series 2023 A: | |||
| 3.25% 4/3/23, CP | 23,200 | 23,200 | |
| 3.35% 6/26/23, CP | 17,300 | 17,300 | |
| 3.45% 6/26/23, CP | 11,100 | 11,100 | |
| 3.45% 6/26/23, CP | 11,200 | 11,200 | |
TOTAL TEXAS | 314,149 | ||
| Virginia - 0.0% | |||
| Fairfax County Indl. Dev. Auth. Bonds (Inova Health Sys. Proj.) Series 2018 B, 5%, tender 5/15/23 (b) | 1,025 | 1,026 | |
| Wisconsin - 0.5% | |||
| Wisconsin Gen. Oblig. Series 2023: | |||
| 3.12% 11/27/23, CP | 22,600 | 22,600 | |
| 3.28% 12/1/23, CP | 6,800 | 6,800 | |
TOTAL WISCONSIN | 29,400 | ||
| TOTAL OTHER MUNICIPAL SECURITY (Cost $593,795) | 593,795 | ||
| Investment Company - 7.0% | |||
| Shares | Value ($) (000s) | ||
Fidelity Tax-Free Cash Central Fund 4.13% (h)(i) (Cost $440,577) | 440,443 | 440,577 | |
| TOTAL INVESTMENT IN SECURITIES - 95.8% (Cost $6,044,780) | 6,044,780 |
NET OTHER ASSETS (LIABILITIES) - 4.2% | 267,600 |
| NET ASSETS - 100.0% | 6,312,380 |
| BAN | - | BOND ANTICIPATION NOTE |
| CP | - | COMMERCIAL PAPER |
| TAN | - | TAX ANTICIPATION NOTE |
| VRDN | - | VARIABLE RATE DEMAND NOTE (A debt instrument that is payable upon demand, either daily, weekly or monthly) |
| (a) | Amount is stated in United States dollars unless otherwise noted. |
| (b) | Coupon rates for floating and adjustable rate securities reflect the rates in effect at period end. |
| (c) | Security exempt from registration under Rule 144A of the Securities Act of 1933. These securities may be resold in transactions exempt from registration, normally to qualified institutional buyers. At the end of the period, the value of these securities amounted to $19,270,000 or 0.3% of net assets. |
| (d) | Restricted securities (including private placements) - Investment in securities not registered under the Securities Act of 1933 (excluding 144A issues). At the end of the period, the value of restricted securities (excluding 144A issues) amounted to $75,305,000 or 1.2% of net assets. |
| (e) | Provides evidence of ownership in one or more underlying municipal bonds. |
| (f) | Coupon rates are determined by re-marketing agents based on current market conditions. |
| (g) | Coupon is indexed to a floating interest rate which may be multiplied by a specified factor and/or subject to caps or floors. |
| (h) | Information in this report regarding holdings by state and security types does not reflect the holdings of the Fidelity Tax-Free Cash Central Fund. |
| (i) | Affiliated fund that is generally available only to investment companies and other accounts managed by Fidelity Investments. The rate quoted is the annualized seven-day yield of the fund at period end. A complete unaudited listing of the fund's holdings as of its most recent quarter end is available upon request. In addition, each Fidelity Central Fund's financial statements, which are not covered by the Fund's Report of Independent Registered Public Accounting Firm, are available on the SEC's website or upon request. |
| Additional information on each restricted holding is as follows: | ||
| Security | Acquisition Date | Cost ($) (000s) |
| Alamo Cmnty. College District Rev. Bonds Series G-111, 4.17%, tender 5/1/23 (Liquidity Facility Royal Bank of Canada) | 5/03/21 - 12/20/22 | 1,300 |
| Baltimore Proj. Rev. Bonds Series Floaters G 28, 4.17%, tender 7/3/23 (Liquidity Facility Royal Bank of Canada) | 1/03/23 | 700 |
| Broward County Convention Ctr. Bonds Series MS 00 11, 3.95%, tender 5/25/23 (Liquidity Facility Morgan Stanley Bank, West Valley City Utah) | 1/19/23 | 15,945 |
| Connecticut Spl. Tax Oblig. Trans. Infrastructure Rev. Bonds Series Floaters G 110, 4.15%, tender 10/2/23 (Liquidity Facility Royal Bank of Canada) | 4/01/21 - 12/20/22 | 3,300 |
| Indiana Health Facility Fing. Auth. Rev. Bonds Series MS 00 12, 4.07%, tender 4/13/23 (Liquidity Facility Morgan Stanley Bank, West Valley City Utah) | 2/09/23 | 20,400 |
| Michigan Hosp. Fin. Auth. Rev. Bonds Series MS 00 15, 4.07%, tender 6/1/23 (Liquidity Facility Morgan Stanley Bank, West Valley City Utah) | 3/23/23 | 17,700 |
| North Texas Tollway Auth. Rev. Bonds Series G-112, 4.17%, tender 7/3/23 (Liquidity Facility Royal Bank of Canada) | 1/03/23 | 1,000 |
| Ohio Univ. Gen. Receipts Athens Bonds Series Floaters G 27, 4.17%, tender 6/1/23 (Liquidity Facility Royal Bank of Canada) | 12/01/22 | 1,700 |
| Port Auth. of New York & New Jersey Series 1997 2, 4.02% 5/1/23, VRDN | 7/15/20 | 7,300 |
| RBC Muni. Products, Inc. Trust Bonds Series G 123, 4.17%, tender 11/1/23 (Liquidity Facility Royal Bank of Canada) | 2/09/23 | 1,560 |
| RBC Muni. Products, Inc. Trust Bonds Series G 124, 4.17%, tender 9/1/23 (Liquidity Facility Royal Bank of Canada) | 2/09/23 | 2,000 |
| South Carolina Trans. Infrastructure Bank Rev. Bonds Series Floaters G 109, 4.17%, tender 10/2/23 (Liquidity Facility Royal Bank of Canada) | 4/01/21 - 12/20/22 | 1,000 |
| Tampa-Hillsborough County Expressway Auth. Rev. Bonds Series G-113, 4.17%, tender 7/3/23 (Liquidity Facility Royal Bank of Canada) | 1/03/23 | 700 |
| Virginia Pub. Bldg. Auth. Pub. Facilities Rev. Bonds Series Floaters G 40, 4.17%, tender 8/1/23 (Liquidity Facility Royal Bank of Canada) | 2/01/21 | 700 |
| Affiliate (Amounts in thousands) | Value, beginning of period ($) | Purchases ($) | Sales Proceeds ($) | Dividend Income ($) | Realized Gain (loss) ($) | Change in Unrealized appreciation (depreciation) ($) | Value, end of period ($) | % ownership, end of period |
| Fidelity Tax-Free Cash Central Fund 4.13% | 375,522 | 3,160,340 | 3,095,333 | 9,587 | 48 | - | 440,577 | 49.9% |
| Total | 375,522 | 3,160,340 | 3,095,333 | 9,587 | 48 | - | 440,577 | |
| Statement of Assets and Liabilities | ||||
| Amounts in thousands (except per-share amounts) | March 31, 2023 | |||
| Assets | ||||
| Investment in securities, at value - See accompanying schedule: | ||||
Unaffiliated issuers (cost $5,604,203) | $ | 5,604,203 | ||
Fidelity Central Funds (cost $440,577) | 440,577 | |||
| Total Investment in Securities (cost $6,044,780) | $ | 6,044,780 | ||
| Cash | 2,434 | |||
| Receivable for investments sold | ||||
Regular delivery | 2,600 | |||
Delayed delivery | 87,565 | |||
| Receivable for fund shares sold | 179,402 | |||
| Interest receivable | 26,976 | |||
| Distributions receivable from Fidelity Central Funds | 800 | |||
| Prepaid expenses | 3 | |||
| Receivable from investment adviser for expense reductions | 166 | |||
| Other receivables | 87 | |||
Total assets | 6,344,813 | |||
| Liabilities | ||||
| Payable for investments purchased | $ | 4,134 | ||
| Payable for fund shares redeemed | 23,767 | |||
| Distributions payable | 3,332 | |||
| Accrued management fee | 711 | |||
| Distribution and service plan fees payable | 4 | |||
| Other affiliated payables | 348 | |||
| Other payables and accrued expenses | 137 | |||
| Total Liabilities | 32,433 | |||
| Net Assets | $ | 6,312,380 | ||
| Net Assets consist of: | ||||
| Paid in capital | $ | 6,311,864 | ||
| Total accumulated earnings (loss) | 516 | |||
| Net Assets | $ | 6,312,380 | ||
| Net Asset Value and Maximum Offering Price | ||||
| Class I : | ||||
Net Asset Value , offering price and redemption price per share ($6,275,122 ÷ 6,270,347 shares) | $ | 1.00 | ||
| Class II : | ||||
Net Asset Value , offering price and redemption price per share ($17,089 ÷ 17,077 shares) | $ | 1.00 | ||
| Class III : | ||||
Net Asset Value , offering price and redemption price per share ($5,624 ÷ 5,621 shares) | $ | 1.00 | ||
| Select Class : | ||||
Net Asset Value , offering price and redemption price per share ($14,545 ÷ 14,534 shares) | $ | 1.00 | ||
| Statement of Operations | ||||
| Amounts in thousands | Year ended March 31, 2023 | |||
| Investment Income | ||||
| Interest | $ | 108,526 | ||
| Income from Fidelity Central Funds | 9,571 | |||
| Total Income | 118,097 | |||
| Expenses | ||||
| Management fee | $ | 8,660 | ||
| Transfer agent fees | 3,711 | |||
| Distribution and service plan fees | 30 | |||
| Accounting fees and expenses | 521 | |||
| Custodian fees and expenses | 57 | |||
| Independent trustees' fees and expenses | 22 | |||
| Registration fees | 350 | |||
| Audit | 44 | |||
| Legal | 4 | |||
| Miscellaneous | 62 | |||
| Total expenses before reductions | 13,461 | |||
| Expense reductions | (2,240) | |||
| Total expenses after reductions | 11,221 | |||
| Net Investment income (loss) | 106,876 | |||
| Realized and Unrealized Gain (Loss) | ||||
| Net realized gain (loss) on: | ||||
| Investment Securities: | ||||
| Unaffiliated issuers | (125) | |||
| Fidelity Central Funds | 48 | |||
| Capital gain distributions from Fidelity Central Funds | 16 | |||
| Total net realized gain (loss) | (61) | |||
| Net increase in net assets resulting from operations | $ | 106,815 | ||
| Statement of Changes in Net Assets | ||||
| Amount in thousands | Year ended March 31, 2023 | Year ended March 31, 2022 | ||
| Increase (Decrease) in Net Assets | ||||
| Operations | ||||
| Net investment income (loss) | $ | 106,876 | $ | 1,075 |
| Net realized gain (loss) | (61) | 1,039 | ||
Net increase in net assets resulting from operations | 106,815 | 2,114 | ||
| Distributions to shareholders | (106,820) | (1,074) | ||
| Share transactions - net increase (decrease) | 1,847,410 | (288,962) | ||
| Total increase (decrease) in net assets | 1,847,405 | (287,922) | ||
| Net Assets | ||||
| Beginning of period | 4,464,975 | 4,752,897 | ||
| End of period | $ | 6,312,380 | $ | 4,464,975 |
| Tax-Exempt Portfolio Class I |
| Years ended March 31, | 2023 | 2022 | 2021 | 2020 | 2019 | |||||
Selected Per-Share Data | ||||||||||
| Net asset value, beginning of period | $ | 1.00 | $ | 1.00 | $ | 1.00 | $ | 1.00 | $ | 1.00 |
| Income from Investment Operations | ||||||||||
Net investment income (loss) A | .017 | - B | .001 | .013 | .014 | |||||
| Net realized and unrealized gain (loss) | - B | - B | - B | .001 | - B | |||||
| Total from investment operations | .017 | - B | .001 | .014 | .014 | |||||
| Distributions from net investment income | (.017) | - B | (.001) | (.013) | (.014) | |||||
| Distributions from net realized gain | - | - | - | - B | - | |||||
| Total distributions | (.017) | - B | (.001) | (.014) C | (.014) | |||||
| Net asset value, end of period | $ | 1.00 | $ | 1.00 | $ | 1.00 | $ | 1.00 | $ | 1.00 |
Total Return D | 1.72% | .03% | .12% | 1.36% | 1.40% | |||||
Ratios to Average Net Assets A,E,F | ||||||||||
| Expenses before reductions | .22% | .22% | .22% | .21% | .22% | |||||
| Expenses net of fee waivers, if any | .18% | .10% | .17% | .18% | .18% | |||||
| Expenses net of all reductions | .18% | .10% | .17% | .18% | .18% | |||||
| Net investment income (loss) | 1.73% | .03% | .13% | 1.34% | 1.40% | |||||
| Supplemental Data | ||||||||||
| Net assets, end of period (in millions) | $ | 6,275 | $ | 4,457 | $ | 4,748 | $ | 6,568 | $ | 7,113 |
| Tax-Exempt Portfolio Class II |
| Years ended March 31, | 2023 | 2022 | 2021 | 2020 | 2019 | |||||
Selected Per-Share Data | ||||||||||
| Net asset value, beginning of period | $ | 1.00 | $ | 1.00 | $ | 1.00 | $ | 1.00 | $ | 1.00 |
| Income from Investment Operations | ||||||||||
Net investment income (loss) A | .016 | - B | .001 | .012 | .012 | |||||
Net realized and unrealized gain (loss) B | - | - | - | - | - | |||||
| Total from investment operations | .016 | - B | .001 | .012 | .012 | |||||
| Distributions from net investment income | (.016) | - B | (.001) | (.012) | (.012) | |||||
| Distributions from net realized gain | - | - | - | - B | - | |||||
| Total distributions | (.016) | - B | (.001) | (.012) | (.012) | |||||
| Net asset value, end of period | $ | 1.00 | $ | 1.00 | $ | 1.00 | $ | 1.00 | $ | 1.00 |
Total Return C | 1.57% | .02% | .06% | 1.21% | 1.24% | |||||
Ratios to Average Net Assets A,D,E | ||||||||||
| Expenses before reductions | .37% | .37% | .37% | .36% | .36% | |||||
| Expenses net of fee waivers, if any | .33% | .11% | .21% | .33% | .33% | |||||
| Expenses net of all reductions | .33% | .11% | .21% | .33% | .33% | |||||
| Net investment income (loss) | 1.58% | .01% | .08% | 1.19% | 1.25% | |||||
| Supplemental Data | ||||||||||
| Net assets, end of period (in millions) | $ | 17 | $ | - F | $ | - F | $ | - F | $ | - F |
| Tax-Exempt Portfolio Class III |
| Years ended March 31, | 2023 | 2022 | 2021 | 2020 | 2019 | |||||
Selected Per-Share Data | ||||||||||
| Net asset value, beginning of period | $ | 1.00 | $ | 1.00 | $ | 1.00 | $ | 1.00 | $ | 1.00 |
| Income from Investment Operations | ||||||||||
Net investment income (loss) A | .015 | - B | - B | .011 | .011 | |||||
Net realized and unrealized gain (loss) B | - | - | - | - | - | |||||
| Total from investment operations | .015 | - B | - B | .011 | .011 | |||||
| Distributions from net investment income | (.015) | - B | - B | (.011) | (.011) | |||||
| Distributions from net realized gain | - | - | - | - B | - | |||||
| Total distributions | (.015) | - B | - B | (.011) | (.011) | |||||
| Net asset value, end of period | $ | 1.00 | $ | 1.00 | $ | 1.00 | $ | 1.00 | $ | 1.00 |
Total Return C | 1.46% | .01% | .05% | 1.11% | 1.14% | |||||
Ratios to Average Net Assets A,D,E | ||||||||||
| Expenses before reductions | .47% | .48% | .46% | .46% | .46% | |||||
| Expenses net of fee waivers, if any | .43% | .13% | .23% | .43% | .43% | |||||
| Expenses net of all reductions | .43% | .13% | .23% | .43% | .43% | |||||
| Net investment income (loss) | 1.48% | (.01)% | .07% | 1.09% | 1.15% | |||||
| Supplemental Data | ||||||||||
| Net assets, end of period (in millions) | $ | 6 | $ | 7 | $ | 2 | $ | 2 | $ | 2 |
| Tax-Exempt Portfolio Select Class |
| Years ended March 31, | 2023 | 2022 | 2021 | 2020 | 2019 | |||||
Selected Per-Share Data | ||||||||||
| Net asset value, beginning of period | $ | 1.00 | $ | 1.00 | $ | 1.00 | $ | 1.00 | $ | 1.00 |
| Income from Investment Operations | ||||||||||
Net investment income (loss) A | .017 | - B | .001 | .013 | .013 | |||||
Net realized and unrealized gain (loss) B | - | - | - | - | - | |||||
| Total from investment operations | .017 | - B | .001 | .013 | .013 | |||||
| Distributions from net investment income | (.017) | - B | (.001) | (.013) | (.013) | |||||
| Distributions from net realized gain | - | - | - | - B | - | |||||
| Total distributions | (.017) | - B | (.001) | (.013) | (.013) | |||||
| Net asset value, end of period | $ | 1.00 | $ | 1.00 | $ | 1.00 | $ | 1.00 | $ | 1.00 |
Total Return C | 1.67% | .02% | .09% | 1.31% | 1.35% | |||||
Ratios to Average Net Assets A,D,E | ||||||||||
| Expenses before reductions | .27% | .27% | .27% | .26% | .27% | |||||
| Expenses net of fee waivers, if any | .23% | .10% | .19% | .23% | .23% | |||||
| Expenses net of all reductions | .23% | .10% | .19% | .23% | .23% | |||||
| Net investment income (loss) | 1.68% | .03% | .11% | 1.29% | 1.35% | |||||
| Supplemental Data | ||||||||||
| Net assets, end of period (in millions) | $ | 15 | $ | 1 | $ | 3 | $ | 3 | $ | 10 |
| Fidelity Central Fund | Investment Manager | Investment Objective | Investment Practices | Expense Ratio A |
| Fidelity Money Market Central Funds | Fidelity Management & Research Company LLC (FMR) | Each fund seeks to obtain a high level of current income consistent with the preservation of capital and liquidity. | Short-term Investments | Less than .005% |
| Treasury Only Portfolio | $580 |
| Treasury Portfolio | 373 |
| Government Portfolio | 1,341 |
| Money Market Portfolio | 927 |
| Tax-Exempt Portfolio | 80 |
| Tax cost | Gross unrealized appreciation | Gross unrealized depreciation | Net unrealized appreciation (depreciation) | |
| Treasury Only Portfolio | $56,744,462 | $- | $- | $- |
| Treasury Portfolio | 59,374,564 | - | - | - |
| Government Portfolio | 172,366,297 | - | - | - |
| Money Market Portfolio | 97,060,966 | - | - | - |
| Tax-Exempt Portfolio | 6,044,780 | - | - | - |
| Undistributed tax-exempt income | Undistributed ordinary income | Capital loss carryforward | Net unrealized appreciation (depreciation) on securities and other investments | |
| Treasury Only Portfolio | $- | $- | $(516) | $- |
| Treasury Portfolio | - | 5 | (194) | - |
| Government Portfolio | - | - | (710) | - |
| Money Market Portfolio | - | 219 | - | - |
| Tax-Exempt Portfolio | 531 | - | (16) | - |
| Short-term | Long-term | Total capital loss carryforward | |
| Treasury Only Portfolio | $(455) | $(61) | $(516) |
| Treasury Portfolio | (26) | (168) | (194) |
| Government Portfolio | (15) | (695) | (710) |
| Tax-Exempt Portfolio | (16) | (-) | (16) |
| March 31, 2023 | |||
| Tax-Exempt Income | Ordinary Income | Total | |
| Treasury Only Portfolio | $- | $904,209 | $904,209 |
| Treasury Portfolio | - | 1,014,763 | 1,014,763 |
| Government Portfolio | - | 3,268,145 | 3,268,145 |
| Money Market Portfolio | - | 2,148,294 | 2,148,294 |
| Tax-Exempt Portfolio | 106,820 | - | 106,820 |
| March 31, 2022 | |||
| Tax-Exempt Income | Ordinary Income | Total | |
| Treasury Only Portfolio | $- | $6,108 | $6,108 |
| Treasury Portfolio | - | 4,495 | 4,495 |
| Government Portfolio | - | 21,170 | 21,170 |
| Money Market Portfolio | - | 12,407 | 12,407 |
| Tax-Exempt Portfolio | 1,074 | - | 1,074 |
| Distribution Fee | Service Fee | |
Class II | .00% | .15% |
| Class III | .00% | .25% |
| Class IV | .25% | .25% |
Select Class | .00% | .05% |
| Total Fees | Retained by FDC | |
| Treasury Only Portfolio: | ||
Class II | $2,164 | $32 |
Class III | 3,925 | 259 |
Class IV | 1,627 | 65 |
Select Class | 216 | 30 |
| $7,932 | $386 | |
| Treasury Portfolio: | ||
Class II | $548 | $103 |
Class III | 6,305 | 748 |
Class IV | 4,909 | 372 |
Select Class | 126 | 6 |
| $11,888 | $1,229 | |
| Government Portfolio: | ||
Class II | $1,347 | $832 |
Class III | 9,850 | 2,216 |
Select Class | 118 | 6 |
| $11,315 | $3,054 | |
| Money Market Portfolio: | ||
Class II | $137 | $3 |
Class III | 34 | 9 |
Select Class | 15 | 1 |
| $186 | $13 | |
| Tax-Exempt Portfolio: | ||
Class II | $15 | $10 |
Class III | 12 | 3 |
Select Class | 3 | 1 |
| $30 | $14 |
| Treasury Only Portfolio | |
| Class I | $7,251 |
| Class II | 866 |
| Class III | 942 |
| Class IV | 195 |
| Select Class | 260 |
| Institutional Class | 5,964 |
| $15,478 | |
| Treasury Portfolio | |
| Class I | $8,319 |
| Class II | 219 |
| Class III | 1,513 |
| Class IV | 589 |
| Select Class | 152 |
| Institutional Class | 4,979 |
| $15,771 | |
| Government Portfolio | |
| Class I | $19,446 |
| Class II | 539 |
| Class III | 2,364 |
| Select Class | 141 |
| Institutional Class | 26,071 |
| $48,561 | |
| Money Market Portfolio | |
| Class I | $16,973 |
| Class II | 55 |
| Class III | 8 |
| Select Class | 18 |
| Institutional Class | 11,225 |
| $28,279 | |
| Tax-Exempt Portfolio | |
| Class I | $3,698 |
| Class II | 6 |
| Class III | 3 |
| Select Class | 4 |
| $3,711 |
| % of Average Net Assets | |
| Treasury Only Portfolio | - A |
| Treasury Portfolio | - A |
| Government Portfolio | - A |
| Money Market Portfolio | - A |
| Tax-Exempt Portfolio | .01 |
| Average Loan Balance | Weighted Average Interest Rate | ||
| Money Market Portfolio | Lender | 30,220 | 3.02% |
| Purchases ($) | Sales ($) | Realized Gain (Loss) ($) | |
| Treasury Only Portfolio | - | - | - |
| Treasury Portfolio | - | - | - |
| Government Portfolio | - | - | - |
| Money Market Portfolio | - | - | - |
| Tax-Exempt Portfolio | 848,081 | 1,072,685 | - |
| Expense Limitations | Reimbursement | |
| Treasury Only Portfolio | ||
| Class I | .18% | $3,519 |
| Class II | .33% | 435 |
| Class III | .43% | 475 |
| Class IV | .68% | 100 |
| Select Class | .23% | 151 |
| Institutional Class | .14% | 7,900 |
| Treasury Portfolio | ||
| Class I | .18% | $4,395 |
| Class II | .33% | 111 |
| Class III | .43% | 779 |
| Class IV | .68% | 289 |
| Select Class | .23% | 76 |
| Institutional Class | .14% | 7,052 |
| Government Portfolio | ||
| Class I | .18% | $8,154 |
| Class II | .33% | 220 |
| Class III | .43% | 984 |
| Select Class | .23% | 58 |
| Institutional Class | .14% | 30,608 |
| Money Market Portfolio | ||
| Class I | .18% | $8,901 |
| Class II | .33% | 27 |
| Class III | .43% | 4 |
| Select Class | .23% | 10 |
| Institutional Class | .14% | 15,506 |
| Tax-Exempt Portfolio | ||
| Class I | .18% | $2,217 |
| Class II | .33% | 3 |
| Class III | .43% | 2 |
| Select Class | .23% | 2 |
| Treasury Only Portfolio | |
| Class III | 43 |
| Class IV | 61 |
| Treasury Portfolio | |
| Class II | - A |
| Class III | 181 |
| Class IV | 346 |
| Government Portfolio | |
| Class II | 14 |
| Class III | 394 |
| Money Market Portfolio | |
| Class III | - A |
| Custodian credits | |
| Treasury Only Portfolio | $67 |
| Treasury Portfolio | 22 |
| Government Portfolio | 68 |
| Tax-Exempt Portfolio | 16 |
Year ended March 31, 2023 | Year ended March 31, 2022 | |
| Treasury Only Portfolio | ||
| Distributions to shareholders | ||
| Class I | $292,089 | $2,096 |
| Class II | 36,661 | 114 |
| Class III | 39,816 | 151 |
| Class IV | 8,738 | 25 |
| Select Class | 13,274 | 47 |
| Institutional Class | 513,631 | 3,675 |
Total | $904,209 | $6,108 |
| Treasury Portfolio | ||
| Distributions to shareholders | ||
| Class I | $406,305 | $1,661 |
| Class II | 8,604 | 60 |
| Class III | 62,273 | 298 |
| Class IV | 20,442 | 132 |
| Select Class | 6,353 | 36 |
| Institutional Class | 510,786 | 2,308 |
Total | $1,014,763 | $4,495 |
| Government Portfolio | ||
| Distributions to shareholders | ||
| Class I | $850,204 | $5,017 |
| Class II | 20,557 | 127 |
| Class III | 92,362 | 441 |
| Select Class | 5,537 | 25 |
| Institutional Class | 2,299,485 | 15,560 |
Total | $3,268,145 | $21,170 |
| Money Market Portfolio | ||
| Distributions to shareholders | ||
| Class I | $908,704 | $3,535 |
| Class II | 2,450 | 15 |
| Class III | 413 | 1 |
| Select Class | 1,028 | 3 |
| Institutional Class | 1,235,699 | 8,853 |
Total | $2,148,294 | $12,407 |
| Tax-Exempt Portfolio | ||
| Distributions to shareholders | ||
| Class I | $106,405 | $1,074 |
| Class II | 211 | - A |
| Class III | 73 | - A |
| Select Class | 131 | - A |
Total | $106,820 | $1,074 |
| Shares | Shares | Dollars | Dollars | |
Year ended March 31, 2023 | Year ended March 31, 2022 | Year ended March 31, 2023 | Year ended March 31, 2022 | |
| Treasury Only Portfolio | ||||
| Class I | ||||
| Shares sold | 71,045,216 | 42,371,552 | $71,045,216 | $42,371,552 |
| Reinvestment of distributions | 163,747 | 1,204 | 163,747 | 1,204 |
| Shares redeemed | (68,743,099) | (41,098,519) | (68,743,099) | (41,098,519) |
| Net increase (decrease) | 2,465,864 | 1,274,237 | $2,465,864 | $1,274,237 |
| Class II | ||||
| Shares sold | 5,203,559 | 1,455,676 | $5,203,559 | $1,455,676 |
| Reinvestment of distributions | 1,799 | 7 | 1,799 | 7 |
| Shares redeemed | (4,135,452) | (1,272,623) | (4,135,452) | (1,272,623) |
| Net increase (decrease) | 1,069,906 | 183,060 | $1,069,906 | $183,060 |
| Class III | ||||
| Shares sold | 5,754,811 | 5,128,725 | $5,754,811 | $5,128,725 |
| Reinvestment of distributions | 11,907 | 50 | 11,907 | 50 |
| Shares redeemed | (4,438,239) | (5,322,788) | (4,438,239) | (5,322,788) |
| Net increase (decrease) | 1,328,479 | (194,013) | $1,328,479 | $(194,013) |
| Class IV | ||||
| Shares sold | 1,847,197 | 464,291 | $1,847,197 | $464,291 |
| Reinvestment of distributions | 8,738 | 25 | 8,738 | 25 |
| Shares redeemed | (1,256,999) | (602,298) | (1,256,999) | (602,298) |
| Net increase (decrease) | 598,936 | (137,982) | $598,936 | $(137,982) |
| Select Class | ||||
| Shares sold | 2,472,295 | 1,941,123 | $2,472,295 | $1,941,123 |
| Reinvestment of distributions | 5,479 | 35 | 5,479 | 35 |
| Shares redeemed | (1,532,071) | (1,879,644) | (1,532,071) | (1,879,644) |
| Net increase (decrease) | 945,703 | 61,514 | $945,703 | $61,514 |
| Institutional Class | ||||
| Shares sold | 64,828,670 | 30,006,613 | $64,828,670 | $30,006,613 |
| Reinvestment of distributions | 366,152 | 2,765 | 366,152 | 2,765 |
| Shares redeemed | (53,869,257) | (30,196,971) | (53,869,257) | (30,196,971) |
| Net increase (decrease) | 11,325,565 | (187,593) | $11,325,565 | $(187,593) |
| Treasury Portfolio | ||||
| Class I | ||||
| Shares sold | 87,123,200 | 55,496,790 | $87,123,200 | $55,496,790 |
| Reinvestment of distributions | 147,955 | 605 | 147,955 | 605 |
| Shares redeemed | (73,842,449) | (56,506,079) | (73,842,449) | (56,506,079) |
| Net increase (decrease) | 13,428,706 | (1,008,684) | $13,428,706 | $(1,008,684) |
| Class II | ||||
| Shares sold | 1,710,950 | 1,914,597 | $1,710,950 | $1,914,597 |
| Reinvestment of distributions | 2,617 | 13 | 2,617 | 13 |
| Shares redeemed | (1,611,265) | (2,151,333) | (1,611,265) | (2,151,333) |
| Net increase (decrease) | 102,302 | (236,723) | $102,302 | $(236,723) |
| Class III | ||||
| Shares sold | 8,240,069 | 7,364,179 | $8,240,069 | $7,364,179 |
| Reinvestment of distributions | 7,486 | 36 | 7,486 | 36 |
| Shares redeemed | (7,818,278) | (7,061,778) | (7,818,278) | (7,061,778) |
| Net increase (decrease) | 429,277 | 302,437 | $429,277 | $302,437 |
| Class IV | ||||
| Shares sold | 2,992,995 | 1,609,791 | $2,992,995 | $1,609,791 |
| Reinvestment of distributions | 1,570 | 16 | 1,570 | 16 |
| Shares redeemed | (3,165,464) | (1,451,642) | (3,165,464) | (1,451,642) |
| Net increase (decrease) | (170,899) | 158,165 | $(170,899) | $158,165 |
| Select Class | ||||
| Shares sold | 1,640,167 | 886,222 | $1,640,167 | $886,222 |
| Reinvestment of distributions | 3,035 | 8 | 3,035 | 8 |
| Shares redeemed | (1,683,699) | (830,034) | (1,683,699) | (830,034) |
| Net increase (decrease) | (40,497) | 56,196 | $(40,497) | $56,196 |
| Institutional Class | ||||
| Shares sold | 136,786,830 | 100,841,623 | $136,786,829 | $100,841,623 |
| Reinvestment of distributions | 327,421 | 1,512 | 327,421 | 1,512 |
| Shares redeemed | (115,372,345) | (103,186,880) | (115,372,345) | (103,186,880) |
| Net increase (decrease) | 21,741,906 | (2,343,745) | $21,741,905 | $(2,343,745) |
| Government Portfolio | ||||
| Class I | ||||
| Shares sold | 284,824,099 | 370,761,643 | $284,824,099 | $370,761,643 |
| Reinvestment of distributions | 241,258 | 1,367 | 241,258 | 1,367 |
| Shares redeemed | (271,000,112) | (373,433,589) | (271,000,112) | (373,433,589) |
| Net increase (decrease) | 14,065,245 | (2,670,579) | $14,065,245 | $(2,670,579) |
| Class II | ||||
| Shares sold | 2,161,514 | 1,597,642 | $2,161,514 | $1,597,642 |
| Reinvestment of distributions | 653 | 5 | 653 | 5 |
| Shares redeemed | (2,179,277) | (2,003,501) | (2,179,277) | (2,003,501) |
| Net increase (decrease) | (17,110) | (405,854) | $(17,110) | $(405,854) |
| Class III | ||||
| Shares sold | 9,279,947 | 10,777,453 | $9,279,947 | $10,777,453 |
| Reinvestment of distributions | 28,464 | 120 | 28,464 | 120 |
| Shares redeemed | (8,883,759) | (10,247,647) | (8,883,759) | (10,247,647) |
| Net increase (decrease) | 424,652 | 529,926 | $424,652 | $529,926 |
| Select Class | ||||
| Shares sold | 770,569 | 1,417,838 | $770,569 | $1,417,838 |
| Reinvestment of distributions | 2,576 | 15 | 2,576 | 15 |
| Shares redeemed | (847,393) | (1,492,381) | (847,393) | (1,492,381) |
| Net increase (decrease) | (74,248) | (74,528) | $(74,248) | $(74,528) |
| Institutional Class | ||||
| Shares sold | 471,547,341 | 541,380,260 | $471,547,341 | $541,370,951 |
| Reinvestment of distributions | 1,539,790 | 10,252 | 1,539,790 | 10,252 |
| Shares redeemed | (443,071,589) | (542,315,424) | (443,071,589) | (542,306,115) |
| Net increase (decrease) | 30,015,542 | (924,912) | $30,015,542 | $(924,912) |
| Money Market Portfolio | ||||
| Class I | �� | |||
| Shares sold | 59,955,626 | 4,483,398 | $59,955,626 | $4,483,398 |
| Reinvestment of distributions | 778,109 | 3,159 | 778,109 | 3,159 |
| Shares redeemed | (35,047,364) | (9,678,091) | (35,047,364) | (9,678,091) |
| Net increase (decrease) | 25,686,371 | (5,191,534) | $25,686,371 | $(5,191,534) |
| Class II | ||||
| Shares sold | 69,630 | 2,801 | $69,630 | $2,801 |
| Reinvestment of distributions | 2,346 | 14 | 2,346 | 14 |
| Shares redeemed | (81,091) | (92,582) | (81,091) | (92,582) |
| Net increase (decrease) | (9,115) | (89,767) | $(9,115) | $(89,767) |
| Class III | ||||
| Shares sold | 46,641 | - A | $46,641 | $- B |
| Reinvestment of distributions | 381 | 1 | 381 | 1 |
| Shares redeemed | (24,441) | (4,106) | (24,441) | (4,106) |
| Net increase (decrease) | 22,581 | (4,105) | $22,581 | $(4,105) |
| Select Class | ||||
| Shares sold | 71,281 | 339 | $71,281 | $339 |
| Reinvestment of distributions | 850 | 3 | 850 | 3 |
| Shares redeemed | (46,643) | (11,631) | (46,643) | (11,631) |
| Net increase (decrease) | 25,488 | (11,289) | $25,488 | $(11,289) |
| Institutional Class | ||||
| Shares sold | 83,999,868 | 20,002,563 | $83,999,867 | $20,002,563 |
| Reinvestment of distributions | 1,152,023 | 8,143 | 1,152,023 | 8,143 |
| Shares redeemed | (52,314,234) | (26,739,633) | (52,314,234) | (26,739,633) |
| Net increase (decrease) | 32,837,657 | (6,728,927) | $32,837,656 | $(6,728,927) |
| Tax-Exempt Portfolio | ||||
| Class I | ||||
| Shares sold | 14,924,698 | 2,403,202 | $14,924,697 | $2,403,202 |
| Reinvestment of distributions | 82,845 | 875 | 82,845 | 875 |
| Shares redeemed | (13,189,237) | (2,696,545) | (13,189,237) | (2,696,545) |
| Net increase (decrease) | 1,818,306 | (292,468) | $1,818,305 | $(292,468) |
| Class II | ||||
| Shares sold | 22,079 | - | $22,079 | $- |
| Reinvestment of distributions | 165 | - A | 165 | - B |
| Shares redeemed | (5,561) | - | (5,561) | - |
| Net increase (decrease) | 16,683 | - A | $16,683 | $- B |
| Class III | ||||
| Shares sold | 11,966 | 13,906 | $11,966 | $13,906 |
| Reinvestment of distributions | 40 | - A | 40 | - B |
| Shares redeemed | (13,048) | (8,897) | (13,048) | (8,897) |
| Net increase (decrease) | (1,042) | 5,009 | $(1,042) | $5,009 |
| Select Class | ||||
| Shares sold | 34,583 | - | $34,583 | $- |
| Reinvestment of distributions | 129 | - A | 129 | - B |
| Shares redeemed | (21,248) | (1,503) | (21,248) | (1,503) |
| Net increase (decrease) | 13,464 | (1,503) | $13,464 | $(1,503) |
| The Example is based on an investment of $1,000 invested at the beginning of the period and held for the entire period (October 1, 2022 to March 31, 2023). |
Annualized Expense Ratio- A | Beginning Account Value October 1, 2022 | Ending Account Value March 31, 2023 | Expenses Paid During Period- C October 1, 2022 to March 31, 2023 | |||||||
| Treasury Only Portfolio | ||||||||||
| Class I | .18% | |||||||||
| Actual | $ 1,000 | $ 1,019.00 | $ .91 | |||||||
Hypothetical- B | $ 1,000 | $ 1,024.03 | $ .91 | |||||||
| Class II | .33% | |||||||||
| Actual | $ 1,000 | $ 1,018.20 | $ 1.66 | |||||||
Hypothetical- B | $ 1,000 | $ 1,023.29 | $ 1.66 | |||||||
| Class III | .43% | |||||||||
| Actual | $ 1,000 | $ 1,017.70 | $ 2.16 | |||||||
Hypothetical- B | $ 1,000 | $ 1,022.79 | $ 2.17 | |||||||
| Class IV | .68% | |||||||||
| Actual | $ 1,000 | $ 1,016.50 | $ 3.42 | |||||||
Hypothetical- B | $ 1,000 | $ 1,021.54 | $ 3.43 | |||||||
| Select Class | .22% | |||||||||
| Actual | $ 1,000 | $ 1,018.70 | $ 1.11 | |||||||
Hypothetical- B | $ 1,000 | $ 1,023.83 | $ 1.11 | |||||||
| Institutional Class | .14% | |||||||||
| Actual | $ 1,000 | $ 1,019.20 | $ .70 | |||||||
Hypothetical- B | $ 1,000 | $ 1,024.23 | $ .71 | |||||||
| Treasury Portfolio | ||||||||||
| Class I | .18% | |||||||||
| Actual | $ 1,000 | $ 1,019.70 | $ .91 | |||||||
Hypothetical- B | $ 1,000 | $ 1,024.03 | $ .91 | |||||||
| Class II | .33% | |||||||||
| Actual | $ 1,000 | $ 1,019.00 | $ 1.66 | |||||||
Hypothetical- B | $ 1,000 | $ 1,023.29 | $ 1.66 | |||||||
| Class III | .43% | |||||||||
| Actual | $ 1,000 | $ 1,018.40 | $ 2.16 | |||||||
Hypothetical- B | $ 1,000 | $ 1,022.79 | $ 2.17 | |||||||
| Class IV | .68% | |||||||||
| Actual | $ 1,000 | $ 1,017.20 | $ 3.42 | |||||||
Hypothetical- B | $ 1,000 | $ 1,021.54 | $ 3.43 | |||||||
| Select Class | .23% | |||||||||
| Actual | $ 1,000 | $ 1,019.50 | $ 1.16 | |||||||
Hypothetical- B | $ 1,000 | $ 1,023.78 | $ 1.16 | |||||||
| Institutional Class | .14% | |||||||||
| Actual | $ 1,000 | $ 1,019.90 | $ .71 | |||||||
Hypothetical- B | $ 1,000 | $ 1,024.23 | $ .71 | |||||||
| Government Portfolio | ||||||||||
| Class I | .18% | |||||||||
| Actual | $ 1,000 | $ 1,019.50 | $ .91 | |||||||
Hypothetical- B | $ 1,000 | $ 1,024.03 | $ .91 | |||||||
| Class II | .33% | |||||||||
| Actual | $ 1,000 | $ 1,018.70 | $ 1.66 | |||||||
Hypothetical- B | $ 1,000 | $ 1,023.29 | $ 1.66 | |||||||
| Class III | .43% | |||||||||
| Actual | $ 1,000 | $ 1,018.20 | $ 2.16 | |||||||
Hypothetical- B | $ 1,000 | $ 1,022.79 | $ 2.17 | |||||||
| Select Class | .23% | |||||||||
| Actual | $ 1,000 | $ 1,019.20 | $ 1.16 | |||||||
Hypothetical- B | $ 1,000 | $ 1,023.78 | $ 1.16 | |||||||
| Institutional Class | .14% | |||||||||
| Actual | $ 1,000 | $ 1,019.70 | $ .70 | |||||||
Hypothetical- B | $ 1,000 | $ 1,024.23 | $ .71 | |||||||
| Money Market Portfolio | ||||||||||
| Class I | .18% | |||||||||
| Actual | $ 1,000 | $ 1,020.70 | $ .91 | |||||||
Hypothetical- B | $ 1,000 | $ 1,024.03 | $ .91 | |||||||
| Class II | .33% | |||||||||
| Actual | $ 1,000 | $ 1,020.00 | $ 1.66 | |||||||
Hypothetical- B | $ 1,000 | $ 1,023.29 | $ 1.66 | |||||||
| Class III | .43% | |||||||||
| Actual | $ 1,000 | $ 1,019.40 | $ 2.16 | |||||||
Hypothetical- B | $ 1,000 | $ 1,022.79 | $ 2.17 | |||||||
| Select Class | .23% | |||||||||
| Actual | $ 1,000 | $ 1,020.50 | $ 1.16 | |||||||
Hypothetical- B | $ 1,000 | $ 1,023.78 | $ 1.16 | |||||||
| Institutional Class | .14% | |||||||||
| Actual | $ 1,000 | $ 1,020.90 | $ .71 | |||||||
Hypothetical- B | $ 1,000 | $ 1,024.23 | $ .71 | |||||||
| Tax-Exempt Portfolio | ||||||||||
| Class I | .18% | |||||||||
| Actual | $ 1,000 | $ 1,012.70 | $ .90 | |||||||
Hypothetical- B | $ 1,000 | $ 1,024.03 | $ .91 | |||||||
| Class II | .33% | |||||||||
| Actual | $ 1,000 | $ 1,011.90 | $ 1.66 | |||||||
Hypothetical- B | $ 1,000 | $ 1,023.29 | $ 1.66 | |||||||
| Class III | .43% | |||||||||
| Actual | $ 1,000 | $ 1,011.40 | $ 2.16 | |||||||
Hypothetical- B | $ 1,000 | $ 1,022.79 | $ 2.17 | |||||||
| Select Class | .23% | |||||||||
| Actual | $ 1,000 | $ 1,012.40 | $ 1.15 | |||||||
Hypothetical- B | $ 1,000 | $ 1,023.78 | $ 1.16 | |||||||
| Treasury Only Portfolio | 100.00% |
| Treasury Portfolio | 16.29% |
| Government Portfolio | 24.79% |
| Money Market Portfolio | 0.25% |
| Treasury Only Portfolio | $501,487,219 |
| Treasury Portfolio | $475,719,214 |
| Government Portfolio | $1,676,562,255 |
| Money Market Portfolio | $801,952,071 |
| Treasury Only Portfolio | $904,209,418 |
| Treasury Portfolio | $1,014,763,341 |
| Government Portfolio | $3,268,142,766 |
| Money Market Portfolio | $2,148,293,642 |
 |
Item 2.
Code of Ethics
As of the end of the period, March 31, 2023, Fidelity Colchester Street Trust (the trust) has adopted a code of ethics, as defined in Item 2 of Form N-CSR, that applies to its President and Treasurer and its Chief Financial Officer. A copy of the code of ethics is filed as an exhibit to this Form N-CSR.
Item 3.
Audit Committee Financial Expert
The Board of Trustees of the trust has determined that Elizabeth S. Acton is an audit committee financial expert, as defined in Item 3 of Form N-CSR. Ms. Acton is independent for purposes of Item 3 of Form N-CSR.
Item 4.
Principal Accountant Fees and Services
Fees and Services
The following table presents fees billed by Deloitte & Touche LLP, the member firms of Deloitte Touche Tohmatsu, and their respective affiliates (collectively, “Deloitte Entities”) in each of the last two fiscal years for services rendered to Government Portfolio, Money Market Portfolio, Tax-Exempt Portfolio, Treasury Only Portfolio and Treasury Portfolio (the “Funds”):
Services Billed by Deloitte Entities
March 31, 2023 FeesA
Audit Fees | Audit-Related Fees | Tax Fees | All Other Fees | |
Government Portfolio | $38,100 | $- | $5,600 | $900 |
Money Market Portfolio | $36,900 | $- | $5,600 | $900 |
Tax-Exempt Portfolio | $31,300 | $- | $8,400 | $700 |
Treasury Only Portfolio | $32,100 | $- | $5,600 | $800 |
Treasury Portfolio | $37,900 | $- | $5,600 | $900 |
March 31, 2022 FeesA
Audit Fees | Audit-Related Fees | Tax Fees | All Other Fees | |
Government Portfolio | $37,700 | $- | $5,200 | $800 |
Money Market Portfolio | $36,600 | $- | $5,200 | $800 |
Tax-Exempt Portfolio | $30,900 | $- | $5,200 | $700 |
Treasury Only Portfolio | $31,700 | $- | $5,200 | $700 |
Treasury Portfolio | $37,500 | $- | $5,200 | $800 |
A Amounts may reflect rounding.
The following table(s) present(s) fees billed by Deloitte Entities that were required to be approved by the Audit Committee for services that relate directly to the operations and financial reporting of the Fund(s) and that are rendered on behalf of Fidelity Management & Research Company LLC ("FMR") and entities controlling, controlled by, or under common control with FMR (not including any sub-adviser whose role is primarily portfolio management and is subcontracted with or overseen by another investment adviser) that provide ongoing services to the Fund(s) (“Fund Service Providers”):
Services Billed by Deloitte Entities
March 31, 2023A | March 31, 2022A | |
Audit-Related Fees | $- | $- |
Tax Fees | $- | $- |
All Other Fees | $- | $- |
A Amounts may reflect rounding.
“Audit-Related Fees” represent fees billed for assurance and related services that are reasonably related to the performance of the fund audit or the review of the fund's financial statements and that are not reported under Audit Fees.
“Tax Fees” represent fees billed for tax compliance, tax advice or tax planning that relate directly to the operations and financial reporting of the fund.
“All Other Fees” represent fees billed for services provided to the fund or Fund Service Provider, a significant portion of which are assurance related, that relate directly to the operations and financial reporting of the fund, excluding those services that are reported under Audit Fees, Audit-Related Fees or Tax Fees.
Assurance services must be performed by an independent public accountant.
* * *
The aggregate non-audit fees billed by Deloitte Entities for services rendered to the Fund(s), FMR (not including any sub-adviser whose role is primarily portfolio management and is subcontracted with or overseen by another investment adviser), and any Fund Service Provider for each of the last two fiscal years of the Fund(s) are as follows:
Billed By | March 31, 2023A | March 31, 2022A |
Deloitte Entities | $277,600 | $487,400 |
A Amounts may reflect rounding.
The trust's Audit Committee has considered non-audit services that were not pre-approved that were provided by Deloitte Entities to Fund Service Providers to be compatible with maintaining the independence of Deloitte Entities in its(their) audit of the Fund(s), taking into account representations from Deloitte Entities, in accordance with Public Company Accounting Oversight Board rules, regarding its independence from the Fund(s) and its(their) related entities and FMR’s review of the appropriateness and permissibility under applicable law of such non-audit services prior to their provision to the Fund(s) Service Providers.
Audit Committee Pre-Approval Policies and Procedures
The trust’s Audit Committee must pre-approve all audit and non-audit services provided by a fund’s independent registered public accounting firm relating to the operations or financial reporting of the fund. Prior to the commencement of any audit or non-audit services to a fund, the Audit Committee reviews the services to determine whether they are appropriate and permissible under applicable law.
The Audit Committee has adopted policies and procedures to, among other purposes, provide a framework for the Committee’s consideration of non-audit services by the audit firms that audit the Fidelity funds. The policies and procedures require that any non-audit service provided by a fund audit firm to a Fidelity fund and any non-audit service provided by a fund auditor to a Fund Service Provider that relates directly to the operations and financial reporting of a Fidelity fund (“Covered Service”) are subject to approval by the Audit Committee before such service is provided.
All Covered Services must be approved in advance of provision of the service either: (i) by formal resolution of the Audit Committee, or (ii) by oral or written approval of the service by the Chair of the Audit Committee (or if the Chair is unavailable, such other member of the Audit Committee as may be designated by the Chair to act in the Chair’s absence). The approval contemplated by (ii) above is permitted where the Treasurer determines that action on such an engagement is necessary before the next meeting of the Audit Committee.
Non-audit services provided by a fund audit firm to a Fund Service Provider that do not relate directly to the operations and financial reporting of a Fidelity fund are reported to the Audit Committee periodically.
Non-Audit Services Approved Pursuant to Rule 2-01(c)(7)(i)(C) and (ii) of Regulation S-X (“De Minimis Exception”)
There were no non-audit services approved or required to be approved by the Audit Committee pursuant to the De Minimis Exception during the Fund’s(s’) last two fiscal years relating to services provided to (i) the Fund(s) or (ii) any Fund Service Provider that relate directly to the operations and financial reporting of the Fund(s).
Item 5.
Audit Committee of Listed Registrants
Not applicable.
Item 6.
Investments
(a)
Not applicable.
(b)
Not applicable.
Item 7.
Disclosure of Proxy Voting Policies and Procedures for Closed-End Management Investment Companies
Not applicable.
Item 8.
Portfolio Managers of Closed-End Management Investment Companies
Not applicable.
Item 9.
Purchase of Equity Securities by Closed-End Management Investment Company and Affiliated Purchasers
Not applicable.
Item 10.
Submission of Matters to a Vote of Security Holders
There were no material changes to the procedures by which shareholders may recommend nominees to the trust’s Board of Trustees.
Item 11.
Controls and Procedures
(a)(i) The President and Treasurer and the Chief Financial Officer have concluded that the trust’s disclosure controls and procedures (as defined in Rule 30a-3(c) under the Investment Company Act) provide reasonable assurances that material information relating to the trust is made known to them by the appropriate persons, based on their evaluation of these controls and procedures as of a date within 90 days of the filing date of this report.
(a)(ii) There was no change in the trust’s internal control over financial reporting (as defined in Rule 30a-3(d) under the Investment Company Act) that occurred during the
period covered by this report that has materially affected, or is reasonably likely to materially affect, the trust’s internal control over financial reporting.
Item 12.
Disclosure of Securities Lending Activities for Closed-End Management
Investment Companies
Not applicable.
Item 13.
Exhibits
(a) | (1) | Code of Ethics pursuant to Item 2 of Form N-CSR is filed and attached hereto as EX-99.CODE ETH. |
(a) | (2) | |
(a) | (3) | Not applicable. |
(b) |
SIGNATURES
Pursuant to the requirements of the Securities Exchange Act of 1934 and the Investment Company Act of 1940, the registrant has duly caused this report to be signed on its behalf by the undersigned, thereunto duly authorized.
Fidelity Colchester Street Trust
By: | /s/Laura M. Del Prato |
Laura M. Del Prato | |
President and Treasurer | |
Date: | May 19, 2023 |
Pursuant to the requirements of the Securities Exchange Act of 1934 and the Investment Company Act of 1940, this report has been signed below by the following persons on behalf of the registrant and in the capacities and on the dates indicated.
By: | /s/Laura M. Del Prato |
Laura M. Del Prato | |
President and Treasurer | |
Date: | May 19, 2023 |
By: | /s/John J. Burke III |
John J. Burke III | |
Chief Financial Officer | |
Date: | May 19, 2023 |