UNITED STATES
SECURITIES AND EXCHANGE COMMISSION
Washington, D.C. 20549
FORM N-CSR
CERTIFIED SHAREHOLDER REPORT OF REGISTERED
MANAGEMENT INVESTMENT COMPANIES
Investment Company Act file number 811-03320
Fidelity Colchester Street Trust
(Exact name of registrant as specified in charter)
245 Summer St., Boston, MA 02210
(Address of principal executive offices) (Zip code)
Margaret Carey, Secretary
245 Summer St.
Boston, Massachusetts 02210
(Name and address of agent for service)
Registrant's telephone number, including area code:
617-563-7000
Date of fiscal year end: | March 31 |
Date of reporting period: | September 30, 2023 |
Item 1.
Reports to Stockholders


Contents
| Current 7-Day Yields | ||
| Class I | 5.20% | |
| Class II | 5.05% | |
| Class III | 4.95% | |
| Class IV | 4.70% | |
| Select Class | 5.14% | |
| Institutional Class | 5.23% | |
Yield refers to the income paid by the Fund over a given period. Yield for money market funds is usually for seven-day periods, as it is here, though it is expressed as an annual percentage rate. Past performance is no guarantee of future results. Yield will vary and it's possible to lose money investing in the Fund. A portion of the Fund's expenses was reimbursed and/or waived. Absent such reimbursements and/or waivers the yield for the period ending September 30, 2023, the most recent period shown in the table, would have been 5.14% for Class I, 4.99% for Class II, 4.89% for Class III, 4.64% for Class IV, 5.09% for Select Class, and 5.17% for Institutional Class. | ||
| Effective Maturity Diversification (% of Fund's Investments) | ||
| Days | ||
| 1 - 7 | 21.3 | |
| 8 - 30 | 33.0 | |
| 31 - 60 | 32.3 | |
| 61 - 90 | 8.2 | |
| 91 - 180 | 5.2 | |
| Effective maturity is determined in accordance with the requirements of Rule 2a-7 under the Investment Company Act of 1940. | ||
Asset Allocation (% of Fund's net assets) |
 |
Net Other Assets (Liabilities) - (7.0)% |
| U.S. Treasury Debt - 107.0% | ||||
Yield (%)(a) | Principal Amount (b) (000s) | Value ($) (000s) | ||
| U.S. Treasury Obligations - 107.0% | ||||
| U.S. Treasury Bills | ||||
| 10/3/23 to 3/7/24 | 5.04 to 5.48 | 53,589,682 | 53,321,928 | |
| U.S. Treasury Notes | ||||
| 10/31/23 to 1/31/25 (c) | 5.33 to 5.60 | 4,003,971 | 4,004,672 | |
| TOTAL U.S. TREASURY DEBT (Cost $57,326,600) | 57,326,600 | |||
| TOTAL INVESTMENT IN SECURITIES - 107.0% (Cost $57,326,600) | 57,326,600 |
NET OTHER ASSETS (LIABILITIES) - (7.0)% | (3,734,149) |
| NET ASSETS - 100.0% | 53,592,451 |
| (a) | Yield represents either the annualized yield at the date of purchase, or the stated coupon rate, or, for floating and adjustable rate securities, the rate at period end. |
| (b) | Amount is stated in United States dollars unless otherwise noted. |
| (c) | Coupon rates for floating and adjustable rate securities reflect the rates in effect at period end. |
| Statement of Assets and Liabilities | ||||
| Amounts in thousands (except per-share amounts) | September 30, 2023 (Unaudited) | |||
| Assets | ||||
Investment in securities, at value - See accompanying schedule Unaffiliated issuers (cost $57,326,600): | $ | 57,326,600 | ||
| Cash | 286,000 | |||
| Receivable for fund shares sold | 138,329 | |||
| Interest receivable | 37,888 | |||
| Prepaid expenses | 64 | |||
| Receivable from investment adviser for expense reductions | 1,749 | |||
| Other receivables | 647 | |||
Total assets | 57,791,277 | |||
| Liabilities | ||||
| Payable for investments purchased | $ | 4,000,614 | ||
| Payable for fund shares redeemed | 94,630 | |||
| Distributions payable | 93,031 | |||
| Accrued management fee | 6,075 | |||
| Distribution and service plan fees payable | 1,187 | |||
| Other affiliated payables | 1,992 | |||
| Other payables and accrued expenses | 1,297 | |||
| Total Liabilities | 4,198,826 | |||
| Net Assets | $ | 53,592,451 | ||
| Net Assets consist of: | ||||
| Paid in capital | $ | 53,592,006 | ||
| Total accumulated earnings (loss) | 445 | |||
| Net Assets | $ | 53,592,451 | ||
| Net Asset Value and Maximum Offering Price | ||||
| Class I : | ||||
Net Asset Value, offering price and redemption price per share ($14,207,242 ÷ 14,205,146 shares) | $ | 1.00 | ||
| Class II : | ||||
Net Asset Value, offering price and redemption price per share ($2,426,628 ÷ 2,426,913 shares) | $ | 1.00 | ||
| Class III : | ||||
Net Asset Value, offering price and redemption price per share ($2,521,450 ÷ 2,520,998 shares) | $ | 1.00 | ||
| Class IV : | ||||
Net Asset Value, offering price and redemption price per share ($694,938 ÷ 694,886 shares) | $ | 1.00 | ||
| Select Class : | ||||
Net Asset Value, offering price and redemption price per share ($1,289,056 ÷ 1,289,110 shares) | $ | 1.00 | ||
| Institutional Class : | ||||
Net Asset Value, offering price and redemption price per share ($32,453,137 ÷ 32,453,043 shares) | $ | 1.00 | ||
| Statement of Operations | ||||
| Amounts in thousands | Six months ended September 30, 2023 (Unaudited) | |||
| Investment Income | ||||
| Interest | $ | 1,232,050 | ||
| Expenses | ||||
| Management fee | $ | 34,672 | ||
| Transfer agent fees | 10,524 | |||
| Distribution and service plan fees | 7,545 | |||
| Accounting fees and expenses | 950 | |||
| Custodian fees and expenses | 214 | |||
| Independent trustees' fees and expenses | 79 | |||
| Registration fees | 1,126 | |||
| Audit | 23 | |||
| Legal | 14 | |||
| Miscellaneous | 93 | |||
| Total expenses before reductions | 55,240 | |||
| Expense reductions | (8,968) | |||
| Total expenses after reductions | 46,272 | |||
| Net Investment income (loss) | 1,185,778 | |||
| Realized and Unrealized Gain (Loss) | ||||
| Net realized gain (loss) on: | ||||
| Investment Securities: | ||||
| Unaffiliated issuers | 1,174 | |||
| Total net realized gain (loss) | 1,174 | |||
| Net increase in net assets resulting from operations | $ | 1,186,952 | ||
| Statement of Changes in Net Assets | ||||
| Amount in thousands | Six months ended September 30, 2023 (Unaudited) | Year ended March 31, 2023 | ||
| Increase (Decrease) in Net Assets | ||||
| Operations | ||||
| Net investment income (loss) | $ | 1,185,778 | $ | 904,561 |
| Net realized gain (loss) | 1,174 | 52 | ||
Net increase in net assets resulting from operations | 1,186,952 | 904,613 | ||
| Distributions to shareholders | (1,185,848) | (904,209) | ||
| Share transactions - net increase (decrease) | 1,975,901 | 17,734,453 | ||
| Total increase (decrease) in net assets | 1,977,005 | 17,734,857 | ||
| Net Assets | ||||
| Beginning of period | 51,615,446 | 33,880,589 | ||
| End of period | $ | 53,592,451 | $ | 51,615,446 |
| Treasury Only Portfolio Class I |
Six months ended (Unaudited) September 30, 2023 | Years ended March 31, 2023 | 2022 | 2021 | 2020 | 2019 | |||||||
Selected Per-Share Data | ||||||||||||
| Net asset value, beginning of period | $ | 1.00 | $ | 1.00 | $ | 1.00 | $ | 1.00 | $ | 1.00 | $ | 1.00 |
| Income from Investment Operations | ||||||||||||
Net investment income (loss) A | .024 | .025 | - B | - B | .018 | .019 | ||||||
Net realized and unrealized gain (loss) B | - | - | - | - | - | - | ||||||
| Total from investment operations | .024 | .025 | - B | - B | .018 | .019 | ||||||
| Distributions from net investment income | (.024) | (.025) | - B | - B | (.018) | (.019) | ||||||
| Distributions from net realized gain | - | - | - B | - | - | - | ||||||
| Total distributions | (.024) | (.025) | - B | - B | (.018) | (.019) | ||||||
| Net asset value, end of period | $ | 1.00 | $ | 1.00 | $ | 1.00 | $ | 1.00 | $ | 1.00 | $ | 1.00 |
Total Return C,D | 2.42% | 2.50% | .02% | .04% | 1.80% | 1.96% | ||||||
Ratios to Average Net Assets A,E,F | ||||||||||||
| Expenses before reductions | .21% G,H | .21% | .21% | .21% | .22% | .21% | ||||||
| Expenses net of fee waivers, if any | .18% G,H | .18% | .08% | .15% | .18% | .18% | ||||||
| Expenses net of all reductions | .18% G,H | .18% | .08% | .15% | .18% | .18% | ||||||
| Net investment income (loss) | 4.80% G,H | 2.53% | .02% | .05% | 1.72% | 1.97% | ||||||
| Supplemental Data | ||||||||||||
| Net assets, end of period (in millions) | $ | 14,207 | $ | 14,612 | $ | 12,146 | $ | 10,871 | $ | 15,058 | $ | 7,033 |
| Treasury Only Portfolio Class II |
Six months ended (Unaudited) September 30, 2023 | Years ended March 31, 2023 | 2022 | 2021 | 2020 | 2019 | |||||||
Selected Per-Share Data | ||||||||||||
| Net asset value, beginning of period | $ | 1.00 | $ | 1.00 | $ | 1.00 | $ | 1.00 | $ | 1.00 | $ | 1.00 |
| Income from Investment Operations | ||||||||||||
Net investment income (loss) A | .023 | .023 | - B | - B | .016 | .018 | ||||||
Net realized and unrealized gain (loss) B | - | - | - | - | - | - | ||||||
| Total from investment operations | .023 | .023 | - B | - B | .016 | .018 | ||||||
| Distributions from net investment income | (.023) | (.023) | - B | - B | (.016) | (.018) | ||||||
| Distributions from net realized gain | - | - | - B | - | - | - | ||||||
| Total distributions | (.023) | (.023) | - B | - B | (.016) | (.018) | ||||||
| Net asset value, end of period | $ | 1.00 | $ | 1.00 | $ | 1.00 | $ | 1.00 | $ | 1.00 | $ | 1.00 |
Total Return C,D | 2.35% | 2.34% | .01% | .02% | 1.65% | 1.81% | ||||||
Ratios to Average Net Assets A,E,F | ||||||||||||
| Expenses before reductions | .36% G,H | .36% | .36% | .36% | .37% | .36% | ||||||
| Expenses net of fee waivers, if any | .33% G,H | .33% | .09% | .16% | .33% | .33% | ||||||
| Expenses net of all reductions | .33% G,H | .33% | .09% | .16% | .33% | .33% | ||||||
| Net investment income (loss) | 4.65% G,H | 2.38% | .01% | .03% | 1.57% | 1.82% | ||||||
| Supplemental Data | ||||||||||||
| Net assets, end of period (in millions) | $ | 2,427 | $ | 2,196 | $ | 1,126 | $ | 943 | $ | 830 | $ | 525 |
| Treasury Only Portfolio Class III |
Six months ended (Unaudited) September 30, 2023 | Years ended March 31, 2023 | 2022 | 2021 | 2020 | 2019 | |||||||
Selected Per-Share Data | ||||||||||||
| Net asset value, beginning of period | $ | 1.00 | $ | 1.00 | $ | 1.00 | $ | 1.00 | $ | 1.00 | $ | 1.00 |
| Income from Investment Operations | ||||||||||||
Net investment income (loss) A | .023 | .022 | - B | - B | .015 | .017 | ||||||
Net realized and unrealized gain (loss) B | - | - | - | - | - | - | ||||||
| Total from investment operations | .023 | .022 | - B | - B | .015 | .017 | ||||||
| Distributions from net investment income | (.023) | (.022) | - B | - B | (.015) | (.017) | ||||||
| Distributions from net realized gain | - | - | - B | - | - | - | ||||||
| Total distributions | (.023) | (.022) | - B | - B | (.015) | (.017) | ||||||
| Net asset value, end of period | $ | 1.00 | $ | 1.00 | $ | 1.00 | $ | 1.00 | $ | 1.00 | $ | 1.00 |
Total Return C,D | 2.30% | 2.25% | .01% | .01% | 1.54% | 1.70% | ||||||
Ratios to Average Net Assets A,E,F | ||||||||||||
| Expenses before reductions | .46% G,H | .46% | .46% | .46% | .47% | .46% | ||||||
| Expenses net of fee waivers, if any | .43% G,H | .43% | .08% | .17% | .43% | .43% | ||||||
| Expenses net of all reductions | .43% G,H | .43% | .08% | .17% | .43% | .43% | ||||||
| Net investment income (loss) | 4.55% G,H | 2.28% | .02% | .02% | 1.47% | 1.72% | ||||||
| Supplemental Data | ||||||||||||
| Net assets, end of period (in millions) | $ | 2,521 | $ | 2,484 | $ | 1,155 | $ | 1,349 | $ | 824 | $ | 1,044 |
| Treasury Only Portfolio Class IV |
Six months ended (Unaudited) September 30, 2023 | Years ended March 31, 2023 | 2022 | 2021 | 2020 | 2019 | |||||||
Selected Per-Share Data | ||||||||||||
| Net asset value, beginning of period | $ | 1.00 | $ | 1.00 | $ | 1.00 | $ | 1.00 | $ | 1.00 | $ | 1.00 |
| Income from Investment Operations | ||||||||||||
Net investment income (loss) A | .022 | .020 | - B | - B | .013 | .014 | ||||||
Net realized and unrealized gain (loss) B | - | - | - | - | - | - | ||||||
| Total from investment operations | .022 | .020 | - B | - B | .013 | .014 | ||||||
| Distributions from net investment income | (.022) | (.020) | - B | - B | (.013) | (.014) | ||||||
| Distributions from net realized gain | - | - | - B | - | - | - | ||||||
| Total distributions | (.022) | (.020) | - B | - B | (.013) | (.014) | ||||||
| Net asset value, end of period | $ | 1.00 | $ | 1.00 | $ | 1.00 | $ | 1.00 | $ | 1.00 | $ | 1.00 |
Total Return C,D | 2.17% | 2.02% | .01% | .01% | 1.29% | 1.45% | ||||||
Ratios to Average Net Assets A,E,F | ||||||||||||
| Expenses before reductions | .71% G,H | .71% | .71% | .71% | .72% | .71% | ||||||
| Expenses net of fee waivers, if any | .68% G,H | .66% | .08% | .17% | .68% | .68% | ||||||
| Expenses net of all reductions | .68% G,H | .66% | .08% | .17% | .68% | .68% | ||||||
| Net investment income (loss) | 4.30% G,H | 2.05% | .01% | .02% | 1.22% | 1.47% | ||||||
| Supplemental Data | ||||||||||||
| Net assets, end of period (in millions) | $ | 695 | $ | 795 | $ | 196 | $ | 334 | $ | 109 | $ | 155 |
| Treasury Only Portfolio Select Class |
Six months ended (Unaudited) September 30, 2023 | Years ended March 31, 2023 | 2022 | 2021 | 2020 | 2019 | |||||||
Selected Per-Share Data | ||||||||||||
| Net asset value, beginning of period | $ | 1.00 | $ | 1.00 | $ | 1.00 | $ | 1.00 | $ | 1.00 | $ | 1.00 |
| Income from Investment Operations | ||||||||||||
Net investment income (loss) A | .024 | .024 | - B | - B | .017 | .019 | ||||||
Net realized and unrealized gain (loss) B | - | - | - | - | - | - | ||||||
| Total from investment operations | .024 | .024 | - B | - B | .017 | .019 | ||||||
| Distributions from net investment income | (.024) | (.024) | - B | - B | (.017) | (.019) | ||||||
| Distributions from net realized gain | - | - | - B | - | - | - | ||||||
| Total distributions | (.024) | (.024) | - B | - B | (.017) | (.019) | ||||||
| Net asset value, end of period | $ | 1.00 | $ | 1.00 | $ | 1.00 | $ | 1.00 | $ | 1.00 | $ | 1.00 |
Total Return C,D | 2.40% | 2.45% | .01% | .03% | 1.75% | 1.91% | ||||||
Ratios to Average Net Assets A,E,F | ||||||||||||
| Expenses before reductions | .26% G,H | .26% | .26% | .26% | .27% | .26% | ||||||
| Expenses net of fee waivers, if any | .23% G,H | .23% | .08% | .16% | .23% | .23% | ||||||
| Expenses net of all reductions | .23% G,H | .23% | .08% | .16% | .23% | .23% | ||||||
| Net investment income (loss) | 4.75% G,H | 2.49% | .01% | .03% | 1.67% | 1.92% | ||||||
| Supplemental Data | ||||||||||||
| Net assets, end of period (in millions) | $ | 1,289 | $ | 1,271 | $ | 325 | $ | 264 | $ | 399 | $ | 176 |
| Treasury Only Portfolio Institutional Class |
Six months ended (Unaudited) September 30, 2023 | Years ended March 31, 2023 | 2022 | 2021 | 2020 | 2019 | |||||||
Selected Per-Share Data | ||||||||||||
| Net asset value, beginning of period | $ | 1.00 | $ | 1.00 | $ | 1.00 | $ | 1.00 | $ | 1.00 | $ | 1.00 |
| Income from Investment Operations | ||||||||||||
Net investment income (loss) A | .024 | .025 | - B | .001 | .018 | .020 | ||||||
Net realized and unrealized gain (loss) B | - | - | - | - | - | - | ||||||
| Total from investment operations | .024 | .025 | - B | .001 | .018 | .020 | ||||||
| Distributions from net investment income | (.024) | (.025) | - B | (.001) | (.018) | (.020) | ||||||
| Distributions from net realized gain | - | - | - B | - | - | - | ||||||
| Total distributions | (.024) | (.025) | - B | (.001) | (.018) | (.020) | ||||||
| Net asset value, end of period | $ | 1.00 | $ | 1.00 | $ | 1.00 | $ | 1.00 | $ | 1.00 | $ | 1.00 |
Total Return C,D | 2.44% | 2.54% | .02% | .06% | 1.84% | 2.00% | ||||||
Ratios to Average Net Assets A,E,F | ||||||||||||
| Expenses before reductions | .18% G,H | .18% | .18% | .18% | .19% | .18% | ||||||
| Expenses net of fee waivers, if any | .14% G,H | .14% | .07% | .13% | .14% | .14% | ||||||
| Expenses net of all reductions | .14% G,H | .14% | .07% | .13% | .14% | .14% | ||||||
| Net investment income (loss) | 4.84% G,H | 2.57% | .02% | .06% | 1.76% | 2.01% | ||||||
| Supplemental Data | ||||||||||||
| Net assets, end of period (in millions) | $ | 32,453 | $ | 30,257 | $ | 18,932 | $ | 19,120 | $ | 26,551 | $ | 11,774 |
| Current 7-Day Yields | ||
| Class I | 5.22% | |
| Class II | 5.07% | |
| Class III | 4.97% | |
| Class IV | 4.72% | |
| Select Class | 5.17% | |
| Institutional Class | 5.26% | |
Yield refers to the income paid by the Fund over a given period. Yield for money market funds is usually for seven-day periods, as it is here, though it is expressed as an annual percentage rate. Past performance is no guarantee of future results. Yield will vary and it's possible to lose money investing in the Fund. A portion of the Fund's expenses was reimbursed and/or waived. Absent such reimbursements and/or waivers the yield for the period ending September 30, 2023, the most recent period shown in the table, would have been 5.18% for Class I, 5.02% for Class II, 4.92% for Class III, 4.67% for Class IV, 5.13% for Select Class, and 5.21% for Institutional Class. | ||
| Effective Maturity Diversification (% of Fund's Investments) | ||
| Days | ||
| 1 - 7 | 67.6 | |
| 8 - 30 | 7.8 | |
| 31 - 60 | 15.4 | |
| 61 - 90 | 4.9 | |
| 91 - 180 | 4.3 | |
| Effective maturity is determined in accordance with the requirements of Rule 2a-7 under the Investment Company Act of 1940. | ||
Asset Allocation (% of Fund's net assets) |
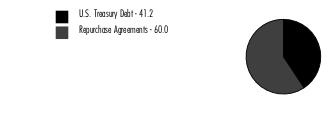 |
Net Other Assets (Liabilities) - (1.2)% |
| U.S. Treasury Debt - 41.2% | ||||
Yield (%)(a) | Principal Amount (b) (000s) | Value ($) (000s) | ||
| U.S. Treasury Obligations - 41.2% | ||||
| U.S. Treasury Bills | ||||
| 10/3/23 to 3/7/24 | 5.19 to 5.48 | 19,743,500 | 19,606,139 | |
| U.S. Treasury Notes | ||||
| 10/31/23 to 7/31/25 (c) | 5.33 to 5.60 | 4,144,165 | 4,143,345 | |
| TOTAL U.S. TREASURY DEBT (Cost $23,749,484) | 23,749,484 | |||
| U.S. Treasury Repurchase Agreement - 60.0% | |||
Maturity Amount ($) (000s) | Value ($) (000s) | ||
| In a joint trading account at: | |||
| 5.3% dated 9/29/23 due 10/2/23 (Collateralized by U.S. Treasury Obligations) # | 529,316 | 529,082 | |
| 5.3% dated 9/29/23 due 10/2/23 (Collateralized by U.S. Treasury Obligations) # | 281,083 | 280,959 | |
| With: | |||
| ABN AMRO Bank NV at 5.31%, dated 9/29/23 due 10/2/23 (Collateralized by U.S. Treasury Obligations valued at $72,455,850, 0.63% - 2.25%, 3/15/25 - 8/15/46) | 71,031 | 71,000 | |
| Barclays Bank PLC at: | |||
5.3%, dated 9/29/23 due 10/2/23 (Collateralized by U.S. Treasury Obligations valued at $182,660,657, 2.25% - 4.63%, 9/15/26 - 11/15/27) | 179,079 | 179,000 | |
5.32%, dated 9/21/23 due 10/6/23 (Collateralized by U.S. Treasury Obligations valued at $211,483,302, 3.13% - 4.63%, 2/28/25 - 9/15/26) | 208,285 | 207,000 | |
| BMO Harris Bank NA at 5.31%, dated 9/28/23 due 10/5/23 (Collateralized by U.S. Treasury Obligations valued at $91,854,166, 0.00%, 11/2/23 - 6/13/24) | 90,093 | 90,000 | |
| BNP Paribas, SA at 5.38%, dated 9/1/23 due 12/1/23 (Collateralized by U.S. Treasury Obligations valued at $148,584,703, 0.00% - 7.50%, 11/30/23 - 2/15/47) (c)(d)(e) | 146,972 | 145,000 | |
| BofA Securities, Inc. at: | |||
5.33%, dated 9/21/23 due 10/6/23 (Collateralized by U.S. Treasury Obligations valued at $14,303,273, 0.75%, 3/31/26) | 14,087 | 14,000 | |
5.38%, dated 8/28/23 due 10/6/23 (Collateralized by U.S. Treasury Obligations valued at $47,165,430, 1.75%, 1/31/29) | 46,433 | 46,000 | |
| CIBC Bank U.S.A. at: | |||
5.31%, dated 9/21/23 due 10/6/23 (Collateralized by U.S. Treasury Obligations valued at $86,840,936, 0.63% - 4.38%, 12/31/25 - 5/15/53) | 85,251 | 85,000 | |
5.32%, dated 9/21/23 due 10/6/23 (Collateralized by U.S. Treasury Obligations valued at $63,345,615, 1.13% - 4.50%, 8/31/27 - 5/15/53) | 62,384 | 62,000 | |
| Credit AG at: | |||
5.31%, dated: | |||
| 9/26/23 due 10/3/23 (Collateralized by U.S. Treasury Obligations valued at $60,233,334, 2.75%, 5/31/29) | 59,061 | 59,000 | |
| 9/28/23 due 10/2/23 (Collateralized by U.S. Treasury Obligations valued at $58,174,387, 2.75%, 5/31/29) | 57,034 | 57,000 | |
5.32%, dated 9/21/23 due 10/6/23 (Collateralized by U.S. Treasury Obligations valued at $29,628,126, 1.88%, 2/28/29) | 29,180 | 29,000 | |
| Federal Reserve Bank of New York at 5.3%, dated 9/29/23 due 10/2/23 (Collateralized by U.S. Treasury Obligations valued at $27,549,162,204, 1.63% - 3.63%, 6/30/24 - 8/15/43) | 27,549,162 | 27,537,000 | |
| Fixed Income Clearing Corp. - BNP at 5.3%, dated 9/29/23 due 10/2/23 (Collateralized by U.S. Treasury Obligations valued at $182,660,655, 1.13% - 6.38%, 10/31/24 - 8/15/53) | 179,079 | 179,000 | |
| Fixed Income Clearing Corp. - BNYM at 5.31%, dated 9/29/23 due 10/2/23 (Collateralized by U.S. Treasury Obligations valued at $1,004,700,060, 0.00% - 3.63%, 3/28/24 - 6/30/27) | 985,436 | 985,000 | |
| Fixed Income Clearing Corp. - SSB at 5.31%, dated 9/29/23 due 10/2/23 (Collateralized by U.S. Treasury Obligations valued at $1,457,601,674, 0.50% - 3.25%, 5/31/27 - 6/30/27) | 1,429,632 | 1,429,000 | |
| ING Financial Markets LLC at: | |||
5.3%, dated 9/29/23 due 10/2/23 (Collateralized by U.S. Treasury Obligations valued at $29,590,865, 2.63%, 4/15/25) | 29,013 | 29,000 | |
5.31%, dated: | |||
| 9/26/23 due 10/3/23 (Collateralized by U.S. Treasury Obligations valued at $9,188,367, 0.63% - 3.63%, 10/15/24 - 2/15/53) | 9,009 | 9,000 | |
| 9/29/23 due 10/6/23 (Collateralized by U.S. Treasury Obligations valued at $34,706,557, 0.63% - 4.50%, 10/15/24 - 2/15/53) | 34,035 | 34,000 | |
5.34%, dated 9/21/23 due 11/2/23 (Collateralized by U.S. Treasury Obligations valued at $68,462,272, 0.00% - 3.63%, 10/5/23 - 2/15/53) | 67,417 | 67,000 | |
| Lloyds Bank PLC at: | |||
5.39%, dated 7/24/23 due 10/24/23 (Collateralized by U.S. Treasury Obligations valued at $36,073,984, 2.38% - 3.50%, 8/15/24 - 2/15/33) | 35,482 | 35,000 | |
5.42%, dated 8/29/23 due 10/30/23 (Collateralized by U.S. Treasury Obligations valued at $49,190,927, 2.38% - 3.25%, 8/15/24 - 6/30/27) | 48,448 | 48,000 | |
5.43%, dated: | |||
| 9/20/23 due 11/20/23 (Collateralized by U.S. Treasury Obligations valued at $27,589,900, 0.75% - 2.38%, 8/15/24 - 11/15/24) | 27,248 | 27,000 | |
| 9/29/23 due 11/29/23 (Collateralized by U.S. Treasury Obligations valued at $25,532,899, 2.88%, 6/15/25) | 25,230 | 25,000 | |
| Mitsubishi UFJ Securities (U.S.A.), Inc. at 5.33%, dated 9/21/23 due 12/6/23 (Collateralized by U.S. Treasury Obligations valued at $75,602,956, 0.75% - 4.63%, 2/15/25 - 7/31/28) | 74,833 | 74,000 | |
| Mizuho Bank, Ltd. at 5.31%, dated 9/29/23 due 10/2/23 (Collateralized by U.S. Treasury Obligations valued at $146,303,797, 3.63%, 3/31/28) | 143,063 | 143,000 | |
| MUFG Securities (Canada), Ltd. at 5.33%, dated 9/21/23 due: | |||
10/6/23 (Collateralized by U.S. Treasury Obligations valued at $29,628,247, 0.25% - 4.63%, 2/28/25 - 2/15/49) | 29,180 | 29,000 | |
12/6/23 (Collateralized by U.S. Treasury Obligations valued at $57,301,444, 0.63% - 4.13%, 10/31/24 - 11/15/52) | 56,630 | 56,000 | |
| MUFG Securities EMEA PLC at 5.31%, dated 9/29/23 due 10/2/23 (Collateralized by U.S. Treasury Obligations valued at $262,432,518, 2.88% - 4.13%, 5/15/28 - 8/31/30) | 257,114 | 257,000 | |
| Natixis SA at: | |||
5.3%, dated 9/29/23 due 10/2/23 (Collateralized by U.S. Treasury Obligations valued at $73,721,621, 0.00% - 6.00%, 10/12/23 - 8/15/53) | 72,032 | 72,000 | |
5.34%, dated 9/21/23 due 11/2/23 (Collateralized by U.S. Treasury Obligations valued at $228,115,876, 0.00% - 6.38%, 10/12/23 - 8/15/53) | 224,389 | 223,000 | |
| NatWest Markets Securities, Inc. at 5.31%, dated 9/28/23 due 10/5/23 (Collateralized by U.S. Treasury Obligations valued at $143,904,915, 0.63% - 0.75%, 1/31/28 - 8/15/30) | 141,146 | 141,000 | |
| Norinchukin Bank at: | |||
5.34%, dated 9/25/23 due 10/2/23 (Collateralized by U.S. Treasury Obligations valued at $29,597,570, 3.88%, 2/15/43) | 29,030 | 29,000 | |
5.35%, dated 9/26/23 due 10/3/23 (Collateralized by U.S. Treasury Obligations valued at $29,593,234, 3.88%, 2/15/43) | 29,030 | 29,000 | |
| Prudential Insurance Co. of America at 5.32%, dated 9/29/23 due 10/2/23 (Collateralized by U.S. Treasury Obligations valued at $92,824,004, 1.25% - 6.63%, 11/15/23 - 2/15/36) | 91,055 | 91,015 | |
| RBC Dominion Securities at 5.32%, dated 9/21/23 due 10/6/23 (Collateralized by U.S. Treasury Obligations valued at $44,952,980, 0.00% - 6.88%, 11/7/23 - 5/15/53) | 44,273 | 44,000 | |
| Royal Bank of Canada at 5.31%, dated 9/29/23 due 10/5/23 (Collateralized by U.S. Treasury Obligations valued at $23,470,401, 2.25%, 2/15/27) | 23,020 | 23,000 | |
| SMBC Nikko Securities America, Inc. at 5.3%, dated 9/29/23 due 10/2/23 (Collateralized by U.S. Treasury Obligations valued at $716,781,128, 0.00% - 5.53%, 10/5/23 - 5/15/53) | 700,309 | 700,000 | |
| Societe Generale at 5.31%, dated: | |||
9/26/23 due 10/3/23 (Collateralized by U.S. Treasury Obligations valued at $135,049,459, 4.00%, 11/15/52) | 131,135 | 131,000 | |
9/28/23 due 10/5/23 (Collateralized by U.S. Treasury Obligations valued at $175,543,511, 0.75% - 4.13%, 4/30/26 - 11/15/27) | 172,178 | 172,000 | |
| Sumitomo Mitsui Trust Bank Ltd. at 5.37%, dated 9/27/23 due 10/6/23 (Collateralized by U.S. Treasury Obligations valued at $13,398,598, 1.63% - 3.25%, 8/31/24 - 8/15/29) | 13,027 | 13,000 | |
| Wells Fargo Bank NA at 5.36%, dated 9/13/23 due 10/11/23 (Collateralized by U.S. Treasury Obligations valued at $76,357,236, 0.88% - 4.50%, 2/29/24 - 5/15/53) | 74,308 | 74,000 | |
| TOTAL U.S. TREASURY REPURCHASE AGREEMENT (Cost $34,559,056) | 34,559,056 | ||
| TOTAL INVESTMENT IN SECURITIES - 101.2% (Cost $58,308,540) | 58,308,540 |
NET OTHER ASSETS (LIABILITIES) - (1.2)% | (682,213) |
| NET ASSETS - 100.0% | 57,626,327 |
| (a) | Yield represents either the annualized yield at the date of purchase, or the stated coupon rate, or, for floating and adjustable rate securities, the rate at period end. |
| (b) | Amount is stated in United States dollars unless otherwise noted. |
| (c) | Coupon rates for floating and adjustable rate securities reflect the rates in effect at period end. |
| (d) | The maturity amount is based on the rate at period end. |
| (e) | Coupon is indexed to a floating interest rate which may be multiplied by a specified factor and/or subject to caps or floors. |
| Other Information | ||
| # Additional information on each counterparty to the repurchase agreement is as follows: | ||
| Repurchase Agreement / Counterparty | Value ($) (000's) | |
| $529,082,000 due 10/02/23 at 5.30% | ||
| BofA Securities, Inc. | 4,002 | |
| ING Financial Markets LLC | 200,000 | |
| JP Morgan Securities LLC | 56,870 | |
| Royal Bank of Canada | 72,896 | |
| Sumitomo Mitsui Banking Corp. NY | 195,314 | |
| 529,082 | ||
| $280,959,000 due 10/02/23 at 5.30% | ||
| BofA Securities, Inc. | 3,598 | |
| JP Morgan Securities LLC | 36,771 | |
| Royal Bank of Canada | 50,833 | |
| Sumitomo Mitsui Banking Corp. NY | 189,757 | |
| 280,959 | ||
| Statement of Assets and Liabilities | ||||
| Amounts in thousands (except per-share amounts) | September 30, 2023 (Unaudited) | |||
| Assets | ||||
Investment in securities, at value (including repurchase agreements of $34,559,056) - See accompanying schedule Unaffiliated issuers (cost $58,308,540): | $ | 58,308,540 | ||
| Cash | 326,000 | |||
| Receivable for investments sold | 125,481 | |||
| Receivable for fund shares sold | 355,018 | |||
| Interest receivable | 52,014 | |||
| Prepaid expenses | 76 | |||
| Receivable from investment adviser for expense reductions | 1,816 | |||
| Other receivables | 433 | |||
Total assets | 59,169,378 | |||
| Liabilities | ||||
| Payable for investments purchased | $ | 1,339,591 | ||
| Payable for fund shares redeemed | 78,521 | |||
| Distributions payable | 113,406 | |||
| Accrued management fee | 6,849 | |||
| Distribution and service plan fees payable | 1,270 | |||
| Other affiliated payables | 2,361 | |||
| Other payables and accrued expenses | 1,053 | |||
| Total Liabilities | 1,543,051 | |||
| Net Assets | $ | 57,626,327 | ||
| Net Assets consist of: | ||||
| Paid in capital | $ | 57,626,390 | ||
| Total accumulated earnings (loss) | (63) | |||
| Net Assets | $ | 57,626,327 | ||
| Net Asset Value and Maximum Offering Price | ||||
| Class I : | ||||
Net Asset Value, offering price and redemption price per share ($21,455,042 ÷ 21,448,864 shares) | $ | 1.00 | ||
| Class II : | ||||
Net Asset Value, offering price and redemption price per share ($696,718 ÷ 696,289 shares) | $ | 1.00 | ||
| Class III : | ||||
Net Asset Value, offering price and redemption price per share ($3,972,264 ÷ 3,972,149 shares) | $ | 1.00 | ||
| Class IV : | ||||
Net Asset Value, offering price and redemption price per share ($879,489 ÷ 879,276 shares) | $ | 1.00 | ||
| Select Class : | ||||
Net Asset Value, offering price and redemption price per share ($327,760 ÷ 327,703 shares) | $ | 1.00 | ||
| Institutional Class : | ||||
Net Asset Value, offering price and redemption price per share ($30,295,054 ÷ 30,297,528 shares) | $ | 1.00 | ||
| Statement of Operations | ||||
| Amounts in thousands | Six months ended September 30, 2023 (Unaudited) | |||
| Investment Income | ||||
| Interest | $ | 1,464,010 | ||
| Expenses | ||||
| Management fee | $ | 39,402 | ||
| Transfer agent fees | 12,559 | |||
| Distribution and service plan fees | 7,289 | |||
| Accounting fees and expenses | 1,014 | |||
| Custodian fees and expenses | 42 | |||
| Independent trustees' fees and expenses | 92 | |||
| Registration fees | 1,403 | |||
| Audit | 27 | |||
| Legal | 16 | |||
| Miscellaneous | 81 | |||
| Total expenses before reductions | 61,925 | |||
| Expense reductions | (9,677) | |||
| Total expenses after reductions | 52,248 | |||
| Net Investment income (loss) | 1,411,762 | |||
| Realized and Unrealized Gain (Loss) | ||||
| Net realized gain (loss) on: | ||||
| Investment Securities: | ||||
| Unaffiliated issuers | 103 | |||
| Total net realized gain (loss) | 103 | |||
| Net increase in net assets resulting from operations | $ | 1,411,865 | ||
| Statement of Changes in Net Assets | ||||
| Amount in thousands | Six months ended September 30, 2023 (Unaudited) | Year ended March 31, 2023 | ||
| Increase (Decrease) in Net Assets | ||||
| Operations | ||||
| Net investment income (loss) | $ | 1,411,762 | $ | 1,015,281 |
| Net realized gain (loss) | 103 | (66) | ||
Net increase in net assets resulting from operations | 1,411,865 | 1,015,215 | ||
| Distributions to shareholders | (1,412,001) | (1,014,763) | ||
| Share transactions - net increase (decrease) | (1,884,575) | 35,490,794 | ||
| Total increase (decrease) in net assets | (1,884,711) | 35,491,246 | ||
| Net Assets | ||||
| Beginning of period | 59,511,038 | 24,019,792 | ||
| End of period | $ | 57,626,327 | $ | 59,511,038 |
| Treasury Portfolio Class I |
Six months ended (Unaudited) September 30, 2023 | Years ended March 31, 2023 | 2022 | 2021 | 2020 | 2019 | |||||||
Selected Per-Share Data | ||||||||||||
| Net asset value, beginning of period | $ | 1.00 | $ | 1.00 | $ | 1.00 | $ | 1.00 | $ | 1.00 | $ | 1.00 |
| Income from Investment Operations | ||||||||||||
Net investment income (loss) A | .025 | .026 | - B | - B | .018 | .019 | ||||||
Net realized and unrealized gain (loss) B | - | - | - | - | - | - | ||||||
| Total from investment operations | .025 | .026 | - B | - B | .018 | .019 | ||||||
| Distributions from net investment income | (.025) | (.026) | - B | - B | (.018) | (.019) | ||||||
| Distributions from net realized gain | - | - | - B | - | - | - | ||||||
| Total distributions | (.025) | (.026) | - B | - B | (.018) | (.019) | ||||||
| Net asset value, end of period | $ | 1.00 | $ | 1.00 | $ | 1.00 | $ | 1.00 | $ | 1.00 | $ | 1.00 |
Total Return C,D | 2.54% | 2.62% | .02% | .05% | 1.82% | 1.96% | ||||||
Ratios to Average Net Assets A,E,F | ||||||||||||
| Expenses before reductions | .21% G,H | .21% | .21% | .21% | .21% | .21% | ||||||
| Expenses net of fee waivers, if any | .18% G,H | .18% | .08% | .15% | .18% | .18% | ||||||
| Expenses net of all reductions | .18% G,H | .18% | .08% | .15% | .18% | .18% | ||||||
| Net investment income (loss) | 5.03% G,H | 2.96% | .01% | .06% | 1.77% | 1.96% | ||||||
| Supplemental Data | ||||||||||||
| Net assets, end of period (in millions) | $ | 21,455 | $ | 22,834 | $ | 9,402 | $ | 10,411 | $ | 12,043 | $ | 9,862 |
| Treasury Portfolio Class II |
Six months ended (Unaudited) September 30, 2023 | Years ended March 31, 2023 | 2022 | 2021 | 2020 | 2019 | |||||||
Selected Per-Share Data | ||||||||||||
| Net asset value, beginning of period | $ | 1.00 | $ | 1.00 | $ | 1.00 | $ | 1.00 | $ | 1.00 | $ | 1.00 |
| Income from Investment Operations | ||||||||||||
Net investment income (loss) A | .024 | .024 | - B | - B | .017 | .018 | ||||||
Net realized and unrealized gain (loss) B | - | - | - | - | - | - | ||||||
| Total from investment operations | .024 | .024 | - B | - B | .017 | .018 | ||||||
| Distributions from net investment income | (.024) | (.024) | - B | - B | (.017) | (.018) | ||||||
| Distributions from net realized gain | - | - | - B | - | - | - | ||||||
| Total distributions | (.024) | (.024) | - B | - B | (.017) | (.018) | ||||||
| Net asset value, end of period | $ | 1.00 | $ | 1.00 | $ | 1.00 | $ | 1.00 | $ | 1.00 | $ | 1.00 |
Total Return C,D | 2.46% | 2.46% | .01% | .01% | 1.67% | 1.81% | ||||||
Ratios to Average Net Assets A,E,F | ||||||||||||
| Expenses before reductions | .36% G,H | .36% | .36% | .36% | .36% | .36% | ||||||
| Expenses net of fee waivers, if any | .33% G,H | .33% | .08% | .19% | .33% | .33% | ||||||
| Expenses net of all reductions | .33% G,H | .33% | .08% | .19% | .33% | .33% | ||||||
| Net investment income (loss) | 4.88% G,H | 2.81% | .01% | .02% | 1.62% | 1.81% | ||||||
| Supplemental Data | ||||||||||||
| Net assets, end of period (in millions) | $ | 697 | $ | 513 | $ | 411 | $ | 648 | $ | 884 | $ | 659 |
| Treasury Portfolio Class III |
Six months ended (Unaudited) September 30, 2023 | Years ended March 31, 2023 | 2022 | 2021 | 2020 | 2019 | |||||||
Selected Per-Share Data | ||||||||||||
| Net asset value, beginning of period | $ | 1.00 | $ | 1.00 | $ | 1.00 | $ | 1.00 | $ | 1.00 | $ | 1.00 |
| Income from Investment Operations | ||||||||||||
Net investment income (loss) A | .024 | .023 | - B | - B | .016 | .017 | ||||||
Net realized and unrealized gain (loss) B | - | - | - | - | - | - | ||||||
| Total from investment operations | .024 | .023 | - B | - B | .016 | .017 | ||||||
| Distributions from net investment income | (.024) | (.023) | - B | - B | (.016) | (.017) | ||||||
| Distributions from net realized gain | - | - | - B | - | - | - | ||||||
| Total distributions | (.024) | (.023) | - B | - B | (.016) | (.017) | ||||||
| Net asset value, end of period | $ | 1.00 | $ | 1.00 | $ | 1.00 | $ | 1.00 | $ | 1.00 | $ | 1.00 |
Total Return C,D | 2.41% | 2.37% | .01% | .01% | 1.56% | 1.71% | ||||||
Ratios to Average Net Assets A,E,F | ||||||||||||
| Expenses before reductions | .46% G,H | .46% | .46% | .46% | .46% | .46% | ||||||
| Expenses net of fee waivers, if any | .43% G,H | .42% | .08% | .19% | .43% | .43% | ||||||
| Expenses net of all reductions | .43% G,H | .42% | .08% | .19% | .43% | .43% | ||||||
| Net investment income (loss) | 4.78% G,H | 2.71% | .01% | .02% | 1.52% | 1.71% | ||||||
| Supplemental Data | ||||||||||||
| Net assets, end of period (in millions) | $ | 3,972 | $ | 3,041 | $ | 2,612 | $ | 2,309 | $ | 2,469 | $ | 2,448 |
| Treasury Portfolio Class IV |
Six months ended (Unaudited) September 30, 2023 | Years ended March 31, 2023 | 2022 | 2021 | 2020 | 2019 | |||||||
Selected Per-Share Data | ||||||||||||
| Net asset value, beginning of period | $ | 1.00 | $ | 1.00 | $ | 1.00 | $ | 1.00 | $ | 1.00 | $ | 1.00 |
| Income from Investment Operations | ||||||||||||
Net investment income (loss) A | .023 | .021 | - B | - B | .013 | .014 | ||||||
Net realized and unrealized gain (loss) B | - | - | - | - | - | - | ||||||
| Total from investment operations | .023 | .021 | - B | - B | .013 | .014 | ||||||
| Distributions from net investment income | (.023) | (.021) | - B | - B | (.013) | (.014) | ||||||
| Distributions from net realized gain | - | - | - B | - | - | - | ||||||
| Total distributions | (.023) | (.021) | - B | - B | (.013) | (.014) | ||||||
| Net asset value, end of period | $ | 1.00 | $ | 1.00 | $ | 1.00 | $ | 1.00 | $ | 1.00 | $ | 1.00 |
Total Return C,D | 2.28% | 2.14% | .01% | .01% | 1.32% | 1.46% | ||||||
Ratios to Average Net Assets A,E,F | ||||||||||||
| Expenses before reductions | .71% G,H | .71% | .71% | .71% | .71% | .71% | ||||||
| Expenses net of fee waivers, if any | .68% G,H | .65% | .08% | .19% | .67% | .68% | ||||||
| Expenses net of all reductions | .68% G,H | .65% | .08% | .19% | .67% | .68% | ||||||
| Net investment income (loss) | 4.53% G,H | 2.49% | .01% | .02% | 1.28% | 1.46% | ||||||
| Supplemental Data | ||||||||||||
| Net assets, end of period (in millions) | $ | 879 | $ | 975 | $ | 1,146 | $ | 988 | $ | 1,033 | $ | 1,217 |
| Treasury Portfolio Select Class |
Six months ended (Unaudited) September 30, 2023 | Years ended March 31, 2023 | 2022 | 2021 | 2020 | 2019 | |||||||
Selected Per-Share Data | ||||||||||||
| Net asset value, beginning of period | $ | 1.00 | $ | 1.00 | $ | 1.00 | $ | 1.00 | $ | 1.00 | $ | 1.00 |
| Income from Investment Operations | ||||||||||||
Net investment income (loss) A | .025 | .025 | - B | - B | .018 | .019 | ||||||
Net realized and unrealized gain (loss) B | - | - | - | - | - | - | ||||||
| Total from investment operations | .025 | .025 | - B | - B | .018 | .019 | ||||||
| Distributions from net investment income | (.025) | (.025) | - B | - B | (.018) | (.019) | ||||||
| Distributions from net realized gain | - | - | - B | - | - | - | ||||||
| Total distributions | (.025) | (.025) | - B | - B | (.018) | (.019) | ||||||
| Net asset value, end of period | $ | 1.00 | $ | 1.00 | $ | 1.00 | $ | 1.00 | $ | 1.00 | $ | 1.00 |
Total Return C,D | 2.51% | 2.56% | .01% | .03% | 1.77% | 1.91% | ||||||
Ratios to Average Net Assets A,E,F | ||||||||||||
| Expenses before reductions | .26% G,H | .26% | .26% | .26% | .26% | .26% | ||||||
| Expenses net of fee waivers, if any | .23% G,H | .23% | .08% | .17% | .23% | .23% | ||||||
| Expenses net of all reductions | .23% G,H | .23% | .08% | .17% | .23% | .23% | ||||||
| Net investment income (loss) | 4.98% G,H | 2.91% | .01% | .03% | 1.72% | 1.91% | ||||||
| Supplemental Data | ||||||||||||
| Net assets, end of period (in millions) | $ | 328 | $ | 214 | $ | 254 | $ | 198 | $ | 424 | $ | 239 |
| Treasury Portfolio Institutional Class |
Six months ended (Unaudited) September 30, 2023 | Years ended March 31, 2023 | 2022 | 2021 | 2020 | 2019 | |||||||
Selected Per-Share Data | ||||||||||||
| Net asset value, beginning of period | $ | 1.00 | $ | 1.00 | $ | 1.00 | $ | 1.00 | $ | 1.00 | $ | 1.00 |
| Income from Investment Operations | ||||||||||||
Net investment income (loss) A | .025 | .026 | - B | .001 | .018 | .020 | ||||||
Net realized and unrealized gain (loss) B | - | - | - | - | - | - | ||||||
| Total from investment operations | .025 | .026 | - B | .001 | .018 | .020 | ||||||
| Distributions from net investment income | (.025) | (.026) | - B | (.001) | (.018) | (.020) | ||||||
| Distributions from net realized gain | - | - | - B | - | - | - | ||||||
| Total distributions | (.025) | (.026) | - B | (.001) | (.018) | (.020) | ||||||
| Net asset value, end of period | $ | 1.00 | $ | 1.00 | $ | 1.00 | $ | 1.00 | $ | 1.00 | $ | 1.00 |
Total Return C,D | 2.56% | 2.66% | .02% | .07% | 1.86% | 2.00% | ||||||
Ratios to Average Net Assets A,E,F | ||||||||||||
| Expenses before reductions | .18% G,H | .18% | .18% | .18% | .18% | .18% | ||||||
| Expenses net of fee waivers, if any | .14% G,H | .14% | .07% | .13% | .14% | .14% | ||||||
| Expenses net of all reductions | .14% G,H | .14% | .07% | .13% | .14% | .14% | ||||||
| Net investment income (loss) | 5.07% G,H | 3.00% | .02% | .07% | 1.81% | 2.00% | ||||||
| Supplemental Data | ||||||||||||
| Net assets, end of period (in millions) | $ | 30,295 | $ | 31,934 | $ | 10,195 | $ | 12,539 | $ | 19,926 | $ | 10,505 |
| Current 7-Day Yields | ||
| Class I | 5.23% | |
| Class II | 5.08% | |
| Class III | 4.98% | |
| Select Class | 5.18% | |
| Institutional Class | 5.27% | |
Yield refers to the income paid by the Fund over a given period. Yield for money market funds is usually for seven-day periods, as it is here, though it is expressed as an annual percentage rate. Past performance is no guarantee of future results. Yield will vary and it's possible to lose money investing in the Fund. A portion of the Fund's expenses was reimbursed and/or waived. Absent such reimbursements and/or waivers the yield for the period ending September 30, 2023, the most recent period shown in the table, would have been 5.18% for Class I, 5.03% for Class II, 4.93% for Class III, 5.13% for Select Class, and 5.21% for Institutional Class. | ||
| Effective Maturity Diversification (% of Fund's Investments) | ||
| Days | ||
| 1 - 7 | 64.6 | |
| 8 - 30 | 3.8 | |
| 31 - 60 | 16.4 | |
| 61 - 90 | 6.4 | |
| 91 - 180 | 5.4 | |
| > 180 | 3.4 | |
| Effective maturity is determined in accordance with the requirements of Rule 2a-7 under the Investment Company Act of 1940. | ||
Asset Allocation (% of Fund's net assets) |
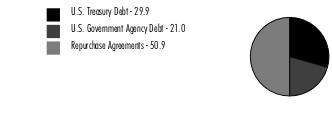 |
Net Other Assets (Liabilities) - (1.8)% |
| U.S. Treasury Debt - 29.9% | ||||
Yield (%)(a) | Principal Amount (b) (000s) | Value ($) (000s) | ||
| U.S. Treasury Obligations - 29.9% | ||||
| U.S. Treasury Bills | ||||
| 10/3/23 to 3/7/24 | 5.28 to 5.48 | 51,715,010 | 51,333,692 | |
| U.S. Treasury Notes | ||||
| 10/31/23 to 10/31/24 (c) | 5.33 to 5.54 | 3,319,000 | 3,315,787 | |
| TOTAL U.S. TREASURY DEBT (Cost $54,649,479) | 54,649,479 | |||
| U.S. Government Agency Debt - 21.0% | ||||
Yield (%)(a) | Principal Amount (b) (000s) | Value ($) (000s) | ||
| Federal Agencies - 21.0% | ||||
| Federal Farm Credit Bank | ||||
| 10/4/23 to 9/15/25 (c) | 5.35 to 5.51 | 4,503,925 | 4,503,460 | |
| Federal Home Loan Bank | ||||
| 10/2/23 to 9/2/25 (c) | 5.13 to 5.50 | 33,242,458 | 33,183,654 | |
| Freddie Mac | ||||
| 6/12/24 | 5.35 | 794,000 | 794,000 | |
| TOTAL U.S. GOVERNMENT AGENCY DEBT (Cost $38,481,114) | 38,481,114 | |||
| U.S. Government Agency Repurchase Agreement - 16.4% | |||
Maturity Amount ($) (000s) | Value ($) (000s) | ||
| In a joint trading account at: | |||
| 5.3% dated 9/29/23 due 10/2/23 (Collateralized by U.S. Government Obligations) # | 2,301,097 | 2,300,081 | |
| 5.31% dated 9/29/23 due 10/2/23 (Collateralized by U.S. Government Obligations) # | 7,453,432 | 7,450,138 | |
| With: | |||
| ABN AMRO Bank NV at 5.31%, dated 9/29/23 due 10/2/23 (Collateralized by U.S. Government Obligations valued at $381,667,942, 2.25% - 6.00%, 3/1/25 - 9/1/53) | 374,165 | 374,000 | |
| BMO Harris Bank NA at 5.32%, dated: | |||
9/14/23 due 10/6/23 (Collateralized by U.S. Government Obligations valued at $202,497,214, 2.00% - 7.00%, 9/1/33 - 10/1/53) | 198,819 | 198,000 | |
9/21/23 due 10/6/23 (Collateralized by U.S. Government Obligations valued at $103,187,465, 2.50% - 5.50%, 8/1/38 - 6/1/53) | 101,627 | 101,000 | |
| BNP Paribas, SA at: | |||
5.32%, dated 9/21/23 due 10/6/23 (Collateralized by U.S. Treasury Obligations valued at $2,676,499,054, 0.00% - 7.50%, 11/24/23 - 9/15/64) | 2,634,249 | 2,618,000 | |
5.36%, dated: | |||
| 7/25/23 due 10/6/23 (Collateralized by U.S. Government Obligations valued at $204,876,430, 0.00% - 7.00%, 1/31/25 - 5/15/58) (c)(d)(e) | 200,712 | 198,000 | |
| 8/1/23 due 10/6/23 (Collateralized by U.S. Treasury Obligations valued at $203,546,745, 0.00% - 7.00%, 10/12/23 - 9/1/53) (c)(d)(e) | 200,578 | 197,000 | |
| 8/4/23 due 10/6/23 (Collateralized by U.S. Treasury Obligations valued at $208,513,380, 0.00% - 7.00%, 10/12/23 - 9/20/53) (c)(d)(e) | 205,669 | 202,000 | |
| 8/23/23 due 10/6/23 (Collateralized by U.S. Treasury Obligations valued at $209,763,711, 0.00% - 7.00%, 1/31/24 - 9/1/53) (c)(d)(e) | 207,136 | 203,500 | |
5.38%, dated: | |||
| 9/5/23 due 12/5/23 (Collateralized by U.S. Treasury Obligations valued at $531,534,374, 0.00% - 7.00%, 11/2/23 - 9/20/53) (c)(d)(e) | 524,031 | 517,000 | |
| 9/13/23 due 12/13/23 (Collateralized by U.S. Treasury Obligations valued at $549,397,690, 0.00% - 7.00%, 10/31/23 - 9/20/53) (c)(d)(e) | 542,269 | 535,000 | |
| 9/18/23 due 12/18/23 (Collateralized by U.S. Treasury Obligations valued at $268,273,944, 0.00% - 6.50%, 1/31/24 - 11/15/64) (c)(d)(e) | 265,560 | 262,000 | |
| 9/21/23 due 12/20/23 (Collateralized by U.S. Government Obligations valued at $1,064,584,421, 0.25% - 7.00%, 6/1/24 - 9/15/58) (c)(d)(e) | 1,056,002 | 1,042,000 | |
5.39%, dated: | |||
| 8/1/23 due 12/1/23 (Collateralized by U.S. Government Obligations valued at $262,785,510, 0.00% - 7.50%, 4/30/25 - 7/20/53) (c)(d)(e) | 259,658 | 255,000 | |
| 8/4/23 due 12/4/23 (Collateralized by U.S. Treasury Obligations valued at $268,746,534, 0.00% - 7.50%, 1/31/24 - 9/20/53) (c)(d)(e) | 264,749 | 260,000 | |
| 8/23/23 due 12/21/23 (Collateralized by U.S. Treasury Obligations valued at $270,432,143, 0.00% - 7.50%, 10/31/23 - 9/20/53) (c)(d)(e) | 267,725 | 263,000 | |
| BofA Securities, Inc. at: | |||
5.37%, dated: | |||
| 7/18/23 due 10/6/23 (Collateralized by U.S. Government Obligations valued at $66,015,001, 2.54% - 5.72%, 3/8/24 - 8/16/46) (c)(d)(e) | 64,878 | 64,000 | |
| 9/27/23 due 10/6/23 (Collateralized by U.S. Government Obligations valued at $105,138,387, 3.50% - 6.50%, 7/20/47 - 9/20/63) (c)(d)(e) | 104,859 | 103,000 | |
5.39%, dated 9/28/23 due 1/25/24 (Collateralized by U.S. Government Obligations valued at $135,741,283, 4.00% - 6.50%, 8/20/52 - 9/20/53) (c)(d)(e) | 135,370 | 133,000 | |
5.41%, dated 8/28/23 due 10/6/23 (Collateralized by U.S. Government Obligations valued at $956,665,467, 3.50% - 5.50%, 5/1/52 - 7/1/53) | 941,833 | 933,000 | |
| CIBC Bank U.S.A. at: | |||
5.32%, dated 9/21/23 due 10/6/23 (Collateralized by U.S. Government Obligations valued at $574,170,958, 2.00% - 6.50%, 7/1/27 - 9/1/53) | 563,742 | 562,000 | |
5.36%, dated 9/21/23 due 11/2/23 (Collateralized by U.S. Government Obligations valued at $13,544,661, 0.00% - 5.93%, 9/20/45 - 10/16/62) | 13,081 | 13,000 | |
| Citibank NA at 5.31%, dated 9/28/23 due 10/5/23 (Collateralized by U.S. Treasury Obligations valued at $311,477,708, 0.00% - 7.63%, 12/29/23 - 9/20/52) | 305,315 | 305,000 | |
| Citigroup Global Capital Markets, Inc. at: | |||
5.31%, dated 9/28/23 due 10/5/23 (Collateralized by U.S. Government Obligations valued at $363,334,241, 3.00% - 6.00%, 4/1/52 - 8/1/53) | 356,368 | 356,000 | |
5.32%, dated 9/21/23 due 10/6/23 (Collateralized by U.S. Government Obligations valued at $309,567,311, 0.00% - 7.50%, 1/1/33 - 8/15/40) | 304,433 | 303,000 | |
| FICC State Street GC (GOV REPO) at 5.31%, dated 9/29/23 due 10/2/23 (Collateralized by U.S. Government Obligations valued at $314,625,194, 3.50% - 6.50%, 3/1/46 - 8/1/53) | 305,135 | 305,000 | |
| Goldman Sachs & Co. at 5.31%, dated: | |||
9/25/23 due 10/2/23 (Collateralized by U.S. Treasury Obligations valued at $311,421,235, 1.25% - 3.25%, 5/31/27 - 8/15/41) | 305,315 | 305,000 | |
9/26/23 due 10/3/23 (Collateralized by U.S. Treasury Obligations valued at $1,255,710,332, 0.50% - 3.63%, 1/31/27 - 8/15/43) | 1,231,270 | 1,230,000 | |
9/27/23 due 10/4/23 (Collateralized by U.S. Treasury Obligations valued at $1,252,463,027, 1.25% - 4.63%, 7/31/26 - 2/15/40) | 1,228,267 | 1,227,000 | |
9/28/23 due 10/5/23 (Collateralized by U.S. Treasury Obligations valued at $414,364,348, 2.25%, 11/15/27) | 406,419 | 406,000 | |
9/29/23 due 10/6/23 (Collateralized by U.S. Treasury Obligations valued at $1,545,983,812, 0.00% - 5.25%, 1/23/24 - 2/15/43) | 1,516,564 | 1,515,000 | |
| ING Financial Markets LLC at 5.35%, dated 9/21/23 due 11/2/23 (Collateralized by U.S. Government Obligations valued at $67,430,050, 2.00% - 3.50%, 5/20/49 - 5/20/51) | 66,412 | 66,000 | |
| Mitsubishi UFJ Securities (U.S.A.), Inc. at 5.35%, dated 9/21/23 due 12/6/23 (Collateralized by U.S. Government Obligations valued at $844,919,048, 2.00% - 6.50%, 7/1/25 - 7/1/60) | 836,341 | 827,000 | |
| RBC Dominion Securities at 5.32%, dated 9/21/23 due 10/6/23 (Collateralized by U.S. Government Obligations valued at $991,232,205, 0.00% - 7.50%, 11/15/23 - 9/1/53) | 976,020 | 970,000 | |
| RBC Financial Group at 5.33%, dated 9/21/23 due 10/6/23 (Collateralized by U.S. Treasury Obligations valued at $2,166,474,379, 0.13% - 7.50%, 10/31/23 - 9/20/63) | 2,128,152 | 2,115,000 | |
| TD Securities (U.S.A.) at 5.31%, dated 9/29/23 due 10/2/23 (Collateralized by U.S. Government Obligations valued at $454,100,851, 2.00% - 6.50%, 6/1/48 - 9/1/53) | 445,197 | 445,000 | |
| Wells Fargo Securities, LLC at: | |||
5.32%, dated 9/29/23 due 10/6/23 (Collateralized by U.S. Government Obligations valued at $412,262,689, 2.50% - 7.50%, 12/15/23 - 5/20/52) | 404,418 | 404,000 | |
5.36%, dated 9/21/23 due 10/6/23 (Collateralized by U.S. Government Obligations valued at $412,754,438, 1.50% - 8.50%, 6/15/24 - 7/20/63) (c)(d)(e) | 407,669 | 404,000 | |
| TOTAL U.S. GOVERNMENT AGENCY REPURCHASE AGREEMENT (Cost $29,966,719) | 29,966,719 | ||
| U.S. Treasury Repurchase Agreement - 34.5% | |||
Maturity Amount ($) (000s) | Value ($) (000s) | ||
| With: | |||
| ABN AMRO Bank NV at 5.31%, dated 9/29/23 due 10/2/23 (Collateralized by U.S. Treasury Obligations valued at $232,389,301, 1.25% - 3.50%, 3/15/25 - 4/30/30) | 228,101 | 228,000 | |
| Barclays Bank PLC at: | |||
5.3%, dated 9/29/23 due 10/2/23 (Collateralized by U.S. Treasury Obligations valued at $585,738,632, 0.75% - 3.88%, 11/15/24 - 8/15/32) | 574,254 | 574,000 | |
5.32%, dated 9/21/23 due 10/6/23 (Collateralized by U.S. Treasury Obligations valued at $652,839,511, 0.00% - 4.00%, 12/28/23 - 7/31/30) | 642,966 | 639,000 | |
| BMO Harris Bank NA at 5.31%, dated 9/28/23 due 10/5/23 (Collateralized by U.S. Treasury Obligations valued at $293,933,387, 0.38% - 3.25%, 8/15/24 - 8/15/30) | 288,297 | 288,000 | |
| BNP Paribas, SA at 5.38%, dated 9/1/23 due 12/1/23 (Collateralized by U.S. Treasury Obligations valued at $461,132,127, 0.38% - 5.57%, 1/31/24 - 2/15/53) (c)(d)(e) | 456,120 | 450,000 | |
| BofA Securities, Inc. at: | |||
5.33%, dated 9/21/23 due 10/6/23 (Collateralized by U.S. Treasury Obligations valued at $44,953,108, 1.75%, 1/31/29) | 44,274 | 44,000 | |
5.38%, dated 8/28/23 due 10/6/23 (Collateralized by U.S. Treasury Obligations valued at $145,597,664, 1.38%, 12/31/28) | 143,337 | 142,000 | |
| CIBC Bank U.S.A. at: | |||
5.31%, dated 9/21/23 due 10/6/23 (Collateralized by U.S. Treasury Obligations valued at $266,659,102, 1.13% - 4.50%, 2/15/25 - 5/15/53) | 261,770 | 261,000 | |
5.32%, dated 9/21/23 due 10/6/23 (Collateralized by U.S. Treasury Obligations valued at $193,093,126, 0.50% - 4.38%, 5/15/25 - 8/15/42) | 190,172 | 189,000 | |
| Credit AG at: | |||
5.31%, dated: | |||
| 9/26/23 due 10/3/23 (Collateralized by U.S. Treasury Obligations valued at $191,929,734, 1.25% - 4.13%, 9/30/27 - 4/30/28) | 188,194 | 188,000 | |
| 9/28/23 due 10/2/23 (Collateralized by U.S. Treasury Obligations valued at $186,770,205, 0.25% - 1.25%, 9/30/25 - 4/30/28) | 183,108 | 183,000 | |
5.32%, dated 9/21/23 due 10/6/23 (Collateralized by U.S. Treasury Obligations valued at $92,970,942, 2.75%, 7/31/27) | 91,565 | 91,000 | |
| Federal Reserve Bank of New York at 5.3%, dated 9/29/23 due 10/2/23 (Collateralized by U.S. Treasury Obligations valued at $44,973,854,703, 1.00% - 3.75%, 8/15/29 - 11/15/46) | 44,973,855 | 44,954,000 | |
| Fixed Income Clearing Corp. - BNP at 5.3%, dated 9/29/23 due 10/2/23 (Collateralized by U.S. Treasury Obligations valued at $585,738,603, 0.00% - 6.00%, 10/31/23 - 8/15/53) | 574,254 | 574,000 | |
| Fixed Income Clearing Corp. - BNYM at 5.31%, dated 9/29/23 due 10/2/23 (Collateralized by U.S. Treasury Obligations valued at $3,215,040,011, 1.13% - 2.88%, 12/31/26 - 4/30/29) | 3,153,395 | 3,152,000 | |
| Fixed Income Clearing Corp. - SSB at 5.31%, dated 9/29/23 due 10/2/23 (Collateralized by U.S. Treasury Obligations valued at $4,686,418,676, 0.38% - 3.88%, 6/30/27 - 11/30/28) | 4,575,024 | 4,573,000 | |
| ING Financial Markets LLC at: | |||
5.3%, dated 9/29/23 due 10/2/23 (Collateralized by U.S. Treasury Obligations valued at $93,835,575, 3.88%, 12/31/29) | 92,041 | 92,000 | |
5.31%, dated: | |||
| 9/26/23 due 10/3/23 (Collateralized by U.S. Treasury Obligations valued at $27,584,100, 0.00% - 4.25%, 11/28/23 - 2/15/53) | 27,028 | 27,000 | |
| 9/29/23 due 10/6/23 (Collateralized by U.S. Treasury Obligations valued at $111,229,987, 0.00% - 4.38%, 3/28/24 - 11/15/44) | 109,113 | 109,000 | |
5.34%, dated 9/21/23 due 11/2/23 (Collateralized by U.S. Treasury Obligations valued at $210,914,325, 0.25% - 4.63%, 12/31/24 - 11/15/52) | 207,283 | 206,000 | |
| Lloyds Bank PLC at: | |||
5.39%, dated 7/24/23 due 10/24/23 (Collateralized by U.S. Treasury Obligations valued at $115,393,023, 0.75% - 2.50%, 8/15/24 - 1/31/25) | 113,543 | 112,000 | |
5.42%, dated 8/29/23 due 10/30/23 (Collateralized by U.S. Treasury Obligations valued at $150,694,890, 2.25% - 3.25%, 8/15/24 - 8/15/27) | 148,372 | 147,000 | |
5.43%, dated: | |||
| 9/20/23 due 11/20/23 (Collateralized by U.S. Treasury Obligations valued at $83,792,946, 0.75% - 2.38%, 8/15/24 - 11/15/24) | 82,754 | 82,000 | |
| 9/29/23 due 11/29/23 (Collateralized by U.S. Treasury Obligations valued at $82,835,546, 2.25%, 8/15/27) | 81,745 | 81,000 | |
| Mitsubishi UFJ Securities (U.S.A.), Inc. at 5.33%, dated 9/21/23 due 12/6/23 (Collateralized by U.S. Treasury Obligations valued at $233,960,426, 0.00% - 4.13%, 11/2/23 - 2/15/33) | 231,577 | 229,000 | |
| Mizuho Bank, Ltd. at 5.31%, dated 9/29/23 due 10/2/23 (Collateralized by U.S. Treasury Obligations valued at $467,117,997, 3.50%, 4/30/28) | 457,202 | 457,000 | |
| MUFG Securities (Canada), Ltd. at 5.33%, dated 9/21/23 due: | |||
10/6/23 (Collateralized by U.S. Treasury Obligations valued at $92,971,411, 0.25% - 6.38%, 9/30/24 - 5/15/52) | 91,566 | 91,000 | |
12/6/23 (Collateralized by U.S. Treasury Obligations valued at $175,928,736, 0.25% - 6.38%, 3/31/24 - 11/15/52) | 173,935 | 172,000 | |
| MUFG Securities EMEA PLC at 5.31%, dated 9/29/23 due 10/2/23 (Collateralized by U.S. Treasury Obligations valued at $839,595,158, 2.38% - 4.13%, 5/15/27 - 2/15/43) | 822,364 | 822,000 | |
| Natixis SA at: | |||
5.3%, dated 9/29/23 due 10/2/23 (Collateralized by U.S. Treasury Obligations valued at $234,162,556, 0.50% - 6.63%, 11/30/23 - 11/15/52) | 229,101 | 229,000 | |
5.34%, dated 9/21/23 due 11/2/23 (Collateralized by U.S. Treasury Obligations valued at $696,868,976, 0.25% - 6.63%, 1/31/24 - 2/15/52) | 686,249 | 682,000 | |
| NatWest Markets Securities, Inc. at 5.31%, dated 9/28/23 due 10/5/23 (Collateralized by U.S. Treasury Obligations valued at $458,250,281, 0.13% - 4.50%, 10/15/23 - 11/15/32) | 449,464 | 449,000 | |
| Norinchukin Bank at: | |||
5.34%, dated 9/25/23 due 10/2/23 (Collateralized by U.S. Treasury Obligations valued at $93,895,752, 3.88%, 2/15/43) | 92,096 | 92,000 | |
5.35%, dated 9/26/23 due 10/3/23 (Collateralized by U.S. Treasury Obligations valued at $94,902,292, 3.88%, 2/15/43) | 93,097 | 93,000 | |
| Prudential Insurance Co. of America at 5.32%, dated 9/29/23 due 10/2/23 (Collateralized by U.S. Treasury Obligations valued at $308,616,480, 1.25% - 7.50%, 11/15/24 - 5/15/32) | 302,681 | 302,547 | |
| RBC Dominion Securities at 5.32%, dated 9/21/23 due 10/6/23 (Collateralized by U.S. Treasury Obligations valued at $138,953,696, 0.00% - 6.88%, 11/15/23 - 5/15/48) | 136,844 | 136,000 | |
| Royal Bank of Canada at 5.31%, dated 9/29/23 due 10/5/23 (Collateralized by U.S. Treasury Obligations valued at $74,493,018, 1.00% - 3.88%, 2/29/28 - 2/15/30) | 73,065 | 73,000 | |
| SMBC Nikko Securities America, Inc. at 5.3%, dated 9/29/23 due 10/2/23 (Collateralized by U.S. Treasury Obligations valued at $715,857,535, 0.00% - 4.38%, 10/10/23 - 8/15/51) | 700,309 | 700,000 | |
| Societe Generale at 5.31%, dated: | |||
9/26/23 due 10/3/23 (Collateralized by U.S. Treasury Obligations valued at $428,248,710, 2.75% - 3.50%, 2/15/39 - 5/15/52) | 417,431 | 417,000 | |
9/28/23 due 10/5/23 (Collateralized by U.S. Treasury Obligations valued at $562,045,210, 0.25% - 3.88%, 3/31/25 - 2/15/53) | 550,568 | 550,000 | |
| Sumitomo Mitsui Trust Bank Ltd. at 5.37%, dated 9/27/23 due 10/6/23 (Collateralized by U.S. Treasury Obligations valued at $39,901,056, 1.63% - 3.25%, 8/31/24 - 8/15/29) | 39,081 | 39,000 | |
| Wells Fargo Bank NA at 5.36%, dated 9/13/23 due 10/11/23 (Collateralized by U.S. Treasury Obligations valued at $240,196,514, 0.00% - 4.50%, 10/26/23 - 5/15/53) | 233,971 | 233,000 | |
| TOTAL U.S. TREASURY REPURCHASE AGREEMENT (Cost $63,152,547) | 63,152,547 | ||
| TOTAL INVESTMENT IN SECURITIES - 101.8% (Cost $186,249,859) | 186,249,859 |
NET OTHER ASSETS (LIABILITIES) - (1.8)% | (3,273,041) |
| NET ASSETS - 100.0% | 182,976,818 |
| (a) | Yield represents either the annualized yield at the date of purchase, or the stated coupon rate, or, for floating and adjustable rate securities, the rate at period end. |
| (b) | Amount is stated in United States dollars unless otherwise noted. |
| (c) | Coupon rates for floating and adjustable rate securities reflect the rates in effect at period end. |
| (d) | The maturity amount is based on the rate at period end. |
| (e) | Coupon is indexed to a floating interest rate which may be multiplied by a specified factor and/or subject to caps or floors. |
| Other Information | ||
| # Additional information on each counterparty to the repurchase agreement is as follows: | ||
| Repurchase Agreement / Counterparty | Value ($) (000's) | |
| $2,300,081,000 due 10/02/23 at 5.30% | ||
| Bank of America, N.A. | 1,976 | |
| BofA Securities, Inc. | 12,609 | |
| HSBC Securities (USA), Inc. | 247 | |
| JP Morgan Securities LLC | 117,654 | |
| Mitsubishi UFJ Securities Holdings Ltd | 1,262 | |
| Nomura Securities International | 257,019 | |
| RBC Dominion Securities, Inc. | 1,015,813 | |
| Royal Bank of Canada | 162,647 | |
| Sumitomo Mitsui Banking Corp. | 3,449 | |
| Sumitomo Mitsui Banking Corp. NY | 727,405 | |
| 2,300,081 | ||
| $7,450,138,000 due 10/02/23 at 5.31% | ||
| Bank of America, N.A. | 730,238 | |
| BofA Securities, Inc. | 405,688 | |
| Citigroup Global Markets, Inc. | 507,110 | |
| HSBC Securities (USA), Inc. | 91,280 | |
| ING Financial Markets LLC | 81,138 | |
| JP Morgan Securities LLC | 202,844 | |
| Mitsubishi UFJ Securities Holdings Ltd | 466,541 | |
| Mizuho Securities USA, Inc. | 202,844 | |
| Nomura Securities International | 1,516,547 | |
| Sumitomo Mitsui Banking Corp. | 2,839,815 | |
| Sumitomo Mitsui Banking Corp. NY | 405 | |
| Wells Fargo Securities LLC | 405,688 | |
| 7,450,138 | ||
| Statement of Assets and Liabilities | ||||
| Amounts in thousands (except per-share amounts) | September 30, 2023 (Unaudited) | |||
| Assets | ||||
Investment in securities, at value (including repurchase agreements of $93,119,266) - See accompanying schedule Unaffiliated issuers (cost $186,249,859): | $ | 186,249,859 | ||
| Cash | 1,025,000 | |||
| Receivable for investments sold | 399,518 | |||
| Receivable for fund shares sold | 318,243 | |||
| Interest receivable | 418,788 | |||
| Prepaid expenses | 251 | |||
| Receivable from investment adviser for expense reductions | 5,866 | |||
| Other receivables | 1,539 | |||
Total assets | 188,419,064 | |||
| Liabilities | ||||
| Payable for investments purchased | $ | 4,861,409 | ||
| Payable for fund shares redeemed | 229,757 | |||
| Distributions payable | 318,990 | |||
| Accrued management fee | 21,360 | |||
| Distribution and service plan fees payable | 1,345 | |||
| Other affiliated payables | 6,108 | |||
| Other payables and accrued expenses | 3,277 | |||
| Total Liabilities | 5,442,246 | |||
| Net Assets | $ | 182,976,818 | ||
| Net Assets consist of: | ||||
| Paid in capital | $ | 182,977,704 | ||
| Total accumulated earnings (loss) | (886) | |||
| Net Assets | $ | 182,976,818 | ||
| Net Asset Value and Maximum Offering Price | ||||
| Class I : | ||||
Net Asset Value, offering price and redemption price per share ($38,159,503 ÷ 38,149,174 shares) | $ | 1.00 | ||
| Class II : | ||||
Net Asset Value, offering price and redemption price per share ($1,369,345 ÷ 1,368,650 shares) | $ | 1.00 | ||
| Class III : | ||||
Net Asset Value, offering price and redemption price per share ($5,682,108 ÷ 5,679,288 shares) | $ | 1.00 | ||
| Select Class : | ||||
Net Asset Value, offering price and redemption price per share ($192,623 ÷ 192,598 shares) | $ | 1.00 | ||
| Institutional Class : | ||||
Net Asset Value, offering price and redemption price per share ($137,573,239 ÷ 137,577,446 shares) | $ | 1.00 | ||
| Statement of Operations | ||||
| Amounts in thousands | Six months ended September 30, 2023 (Unaudited) | |||
| Investment Income | ||||
| Interest | $ | 4,637,227 | ||
| Expenses | ||||
| Management fee | $ | 124,486 | ||
| Transfer agent fees | 33,690 | |||
| Distribution and service plan fees | 7,348 | |||
| Accounting fees and expenses | 2,169 | |||
| Custodian fees and expenses | 215 | |||
| Independent trustees' fees and expenses | 285 | |||
| Registration fees | 2,735 | |||
| Audit | 31 | |||
| Legal | 48 | |||
| Miscellaneous | 329 | |||
| Total expenses before reductions | 171,336 | |||
| Expense reductions | (29,917) | |||
| Total expenses after reductions | 141,419 | |||
| Net Investment income (loss) | 4,495,808 | |||
| Realized and Unrealized Gain (Loss) | ||||
| Net realized gain (loss) on: | ||||
| Investment Securities: | ||||
| Unaffiliated issuers | (576) | |||
| Total net realized gain (loss) | (576) | |||
| Net increase in net assets resulting from operations | $ | 4,495,232 | ||
| Statement of Changes in Net Assets | ||||
| Amount in thousands | Six months ended September 30, 2023 (Unaudited) | Year ended March 31, 2023 | ||
| Increase (Decrease) in Net Assets | ||||
| Operations | ||||
| Net investment income (loss) | $ | 4,495,808 | $ | 3,269,683 |
| Net realized gain (loss) | (576) | (684) | ||
Net increase in net assets resulting from operations | 4,495,232 | 3,268,999 | ||
| Distributions to shareholders | (4,496,169) | (3,268,145) | ||
| Share transactions - net increase (decrease) | 10,829,673 | 44,414,081 | ||
| Total increase (decrease) in net assets | 10,828,736 | 44,414,935 | ||
| Net Assets | ||||
| Beginning of period | 172,148,082 | 127,733,147 | ||
| End of period | $ | 182,976,818 | $ | 172,148,082 |
| Government Portfolio Class I |
Six months ended (Unaudited) September 30, 2023 | Years ended March 31, 2023 | 2022 | 2021 | 2020 | 2019 | |||||||
Selected Per-Share Data | ||||||||||||
| Net asset value, beginning of period | $ | 1.00 | $ | 1.00 | $ | 1.00 | $ | 1.00 | $ | 1.00 | $ | 1.00 |
| Income from Investment Operations | ||||||||||||
Net investment income (loss) A | .025 | .025 | - B | - B | .018 | .020 | ||||||
Net realized and unrealized gain (loss) B | - | - | - | - | - | - | ||||||
| Total from investment operations | .025 | .025 | - B | - B | .018 | .020 | ||||||
| Distributions from net investment income | (.025) | (.025) | - B | - B | (.018) | (.020) | ||||||
| Distributions from net realized gain | - | - | - B | - | - | - | ||||||
| Total distributions | (.025) | (.025) | - B | - B | (.018) | (.020) | ||||||
| Net asset value, end of period | $ | 1.00 | $ | 1.00 | $ | 1.00 | $ | 1.00 | $ | 1.00 | $ | 1.00 |
Total Return C,D | 2.54% | 2.57% | .02% | .04% | 1.83% | 1.97% | ||||||
Ratios to Average Net Assets A,E,F | ||||||||||||
| Expenses before reductions | .21% G,H | .21% | .20% | .20% | .21% | .21% | ||||||
| Expenses net of fee waivers, if any | .18% G,H | .18% | .08% | .15% | .18% | .18% | ||||||
| Expenses net of all reductions | .18% G,H | .18% | .08% | .15% | .18% | .18% | ||||||
| Net investment income (loss) | 5.04% G,H | 2.61% | .01% | .05% | 1.77% | 1.96% | ||||||
| Supplemental Data | ||||||||||||
| Net assets, end of period (in millions) | $ | 38,160 | $ | 44,905 | $ | 30,836 | $ | 33,508 | $ | 45,360 | $ | 29,352 |
| Government Portfolio Class II |
Six months ended (Unaudited) September 30, 2023 | Years ended March 31, 2023 | 2022 | 2021 | 2020 | 2019 | |||||||
Selected Per-Share Data | ||||||||||||
| Net asset value, beginning of period | $ | 1.00 | $ | 1.00 | $ | 1.00 | $ | 1.00 | $ | 1.00 | $ | 1.00 |
| Income from Investment Operations | ||||||||||||
Net investment income (loss) A | .024 | .024 | - B | - B | .017 | .018 | ||||||
Net realized and unrealized gain (loss) B | - | - | - | - | - | - | ||||||
| Total from investment operations | .024 | .024 | - B | - B | .017 | .018 | ||||||
| Distributions from net investment income | (.024) | (.024) | - B | - B | (.017) | (.018) | ||||||
| Distributions from net realized gain | - | - | - B | - | - | - | ||||||
| Total distributions | (.024) | (.024) | - B | - B | (.017) | (.018) | ||||||
| Net asset value, end of period | $ | 1.00 | $ | 1.00 | $ | 1.00 | $ | 1.00 | $ | 1.00 | $ | 1.00 |
Total Return C,D | 2.47% | 2.41% | .01% | .01% | 1.68% | 1.82% | ||||||
Ratios to Average Net Assets A,E,F | ||||||||||||
| Expenses before reductions | .36% G,H | .36% | .35% | .35% | .36% | .36% | ||||||
| Expenses net of fee waivers, if any | .33% G,H | .33% | .08% | .17% | .33% | .33% | ||||||
| Expenses net of all reductions | .33% G,H | .33% | .08% | .17% | .33% | .33% | ||||||
| Net investment income (loss) | 4.89% G,H | 2.46% | .01% | .03% | 1.62% | 1.81% | ||||||
| Supplemental Data | ||||||||||||
| Net assets, end of period (in millions) | $ | 1,369 | $ | 942 | $ | 959 | $ | 1,366 | $ | 697 | $ | 836 |
| Government Portfolio Class III |
Six months ended (Unaudited) September 30, 2023 | Years ended March 31, 2023 | 2022 | 2021 | 2020 | 2019 | |||||||
Selected Per-Share Data | ||||||||||||
| Net asset value, beginning of period | $ | 1.00 | $ | 1.00 | $ | 1.00 | $ | 1.00 | $ | 1.00 | $ | 1.00 |
| Income from Investment Operations | ||||||||||||
Net investment income (loss) A | .024 | .023 | - B | - B | .016 | .017 | ||||||
Net realized and unrealized gain (loss) B | - | - | - | - | - | - | ||||||
| Total from investment operations | .024 | .023 | - B | - B | .016 | .017 | ||||||
| Distributions from net investment income | (.024) | (.023) | - B | - B | (.016) | (.017) | ||||||
| Distributions from net realized gain | - | - | - B | - | - | - | ||||||
| Total distributions | (.024) | (.023) | - B | - B | (.016) | (.017) | ||||||
| Net asset value, end of period | $ | 1.00 | $ | 1.00 | $ | 1.00 | $ | 1.00 | $ | 1.00 | $ | 1.00 |
Total Return C,D | 2.42% | 2.32% | .01% | .01% | 1.57% | 1.72% | ||||||
Ratios to Average Net Assets A,E,F | ||||||||||||
| Expenses before reductions | .46% G,H | .46% | .45% | .45% | .46% | .46% | ||||||
| Expenses net of fee waivers, if any | .43% G,H | .42% | .08% | .19% | .43% | .43% | ||||||
| Expenses net of all reductions | .43% G,H | .42% | .08% | .19% | .43% | .43% | ||||||
| Net investment income (loss) | 4.79% G,H | 2.37% | .01% | .02% | 1.52% | 1.71% | ||||||
| Supplemental Data | ||||||||||||
| Net assets, end of period (in millions) | $ | 5,682 | $ | 4,189 | $ | 3,764 | $ | 3,234 | $ | 3,704 | $ | 3,397 |
| Government Portfolio Select Class |
Six months ended (Unaudited) September 30, 2023 | Years ended March 31, 2023 | 2022 | 2021 | 2020 | 2019 | |||||||
Selected Per-Share Data | ||||||||||||
| Net asset value, beginning of period | $ | 1.00 | $ | 1.00 | $ | 1.00 | $ | 1.00 | $ | 1.00 | $ | 1.00 |
| Income from Investment Operations | ||||||||||||
Net investment income (loss) A | .025 | .025 | - B | - B | .018 | .019 | ||||||
Net realized and unrealized gain (loss) B | - | - | - | - | - | - | ||||||
| Total from investment operations | .025 | .025 | - B | - B | .018 | .019 | ||||||
| Distributions from net investment income | (.025) | (.025) | - B | - B | (.018) | (.019) | ||||||
| Distributions from net realized gain | - | - | - B | - | - | - | ||||||
| Total distributions | (.025) | (.025) | - B | - B | (.018) | (.019) | ||||||
| Net asset value, end of period | $ | 1.00 | $ | 1.00 | $ | 1.00 | $ | 1.00 | $ | 1.00 | $ | 1.00 |
Total Return C,D | 2.52% | 2.51% | .01% | .03% | 1.78% | 1.92% | ||||||
Ratios to Average Net Assets A,E,F | ||||||||||||
| Expenses before reductions | .26% G,H | .26% | .25% | .25% | .26% | .25% | ||||||
| Expenses net of fee waivers, if any | .23% G,H | .23% | .08% | .17% | .23% | .23% | ||||||
| Expenses net of all reductions | .23% G,H | .23% | .08% | .17% | .23% | .23% | ||||||
| Net investment income (loss) | 4.99% G,H | 2.56% | .02% | .03% | 1.72% | 1.91% | ||||||
| Supplemental Data | ||||||||||||
| Net assets, end of period (in millions) | $ | 193 | $ | 218 | $ | 293 | $ | 367 | $ | 498 | $ | 335 |
| Government Portfolio Institutional Class |
Six months ended (Unaudited) September 30, 2023 | Years ended March 31, 2023 | 2022 | 2021 | 2020 | 2019 | |||||||
Selected Per-Share Data | ||||||||||||
| Net asset value, beginning of period | $ | 1.00 | $ | 1.00 | $ | 1.00 | $ | 1.00 | $ | 1.00 | $ | 1.00 |
| Income from Investment Operations | ||||||||||||
Net investment income (loss) A | .025 | .026 | - B | .001 | .019 | .020 | ||||||
Net realized and unrealized gain (loss) B | - | - | - | - | - | - | ||||||
| Total from investment operations | .025 | .026 | - B | .001 | .019 | .020 | ||||||
| Distributions from net investment income | (.025) | (.026) | - B | (.001) | (.019) | (.020) | ||||||
| Distributions from net realized gain | - | - | - B | - | - | - | ||||||
| Total distributions | (.025) | (.026) | - B | (.001) | (.019) | (.020) | ||||||
| Net asset value, end of period | $ | 1.00 | $ | 1.00 | $ | 1.00 | $ | 1.00 | $ | 1.00 | $ | 1.00 |
Total Return C,D | 2.56% | 2.61% | .02% | .07% | 1.87% | 2.01% | ||||||
Ratios to Average Net Assets A,E,F | ||||||||||||
| Expenses before reductions | .18% G,H | .18% | .17% | .17% | .18% | .18% | ||||||
| Expenses net of fee waivers, if any | .14% G,H | .14% | .07% | .13% | .14% | .14% | ||||||
| Expenses net of all reductions | .14% G,H | .14% | .07% | .13% | .14% | .14% | ||||||
| Net investment income (loss) | 5.08% G,H | 2.65% | .02% | .07% | 1.81% | 2.00% | ||||||
| Supplemental Data | ||||||||||||
| Net assets, end of period (in millions) | $ | 137,573 | $ | 121,893 | $ | 91,881 | $ | 92,805 | $ | 122,312 | $ | 75,150 |
| Current 7-Day Yields | ||
| Class I | 5.30% | |
| Class II | 5.15% | |
| Class III | 5.05% | |
| Select Class | 5.25% | |
| Institutional Class | 5.34% | |
Yield refers to the income paid by the Fund over a given period. Yield for money market funds is usually for seven-day periods, as it is here, though it is expressed as an annual percentage rate. Past performance is no guarantee of future results. Yield will vary and it's possible to lose money investing in the Fund. A portion of the Fund's expenses was reimbursed and/or waived. Absent such reimbursements and/or waivers the yield for the period ending September 30, 2023, the most recent period shown in the table, would have been 5.24% for Class I, 5.08% for Class II, 4.98% for Class III, 5.18% for Select Class, and 5.27% for Institutional Class. | ||
| Effective Maturity Diversification (% of Fund's Investments) | ||
| Days | ||
| 1 - 7 | 68.0 | |
| 8 - 30 | 9.4 | |
| 31 - 60 | 13.8 | |
| 61 - 90 | 6.4 | |
| 91 - 180 | 2.4 | |
| Effective maturity is determined in accordance with the requirements of Rule 2a-7 under the Investment Company Act of 1940. | ||
Asset Allocation (% of Fund's net assets) |
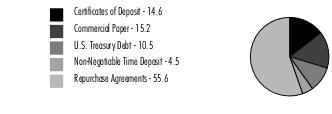 |
Net Other Assets (Liabilities) - (0.4)% |
| Certificate of Deposit - 14.6% | ||||
Yield (%)(a) | Principal Amount (b) (000s) | Value ($) (000s) | ||
| Domestic Certificates Of Deposit - 3.7% | ||||
| Bank of America NA | ||||
| 11/9/23 to 2/28/24 | 5.57 to 5.75 | 3,208,000 | 3,208,000 | |
| BMO Harris Bank NA | ||||
| 12/5/23 to 1/12/24 (c)(d) | 5.75 to 5.77 | 532,500 | 532,500 | |
| State Street Bank & Trust Co., Boston | ||||
| 2/20/24 to 2/22/24 (c)(d) | 5.65 to 5.65 | 424,000 | 424,000 | |
TOTAL DOMESTIC CERTIFICATES OF DEPOSIT | 4,164,500 | |||
| New York Branch, Yankee Dollar, Foreign Banks - 10.9% | ||||
| Bank of Nova Scotia | ||||
| 3/7/24 (c)(d) | 5.65 | 267,000 | 267,000 | |
| Canadian Imperial Bank of Commerce | ||||
| 10/17/23 to 11/9/23 (c) | 5.47 to 5.66 | 909,000 | 909,000 | |
| Credit Agricole CIB | ||||
| 10/31/23 to 11/3/23 | 5.58 to 5.61 | 1,174,000 | 1,174,000 | |
| Landesbank Baden-Wuerttemberg New York Branch | ||||
| 10/2/23 to 10/6/23 | 5.38 to 5.38 | 1,057,000 | 1,057,000 | |
| Mitsubishi UFJ Trust & Banking Corp. | ||||
| 10/2/23 to 12/15/23 (c) | 5.58 to 5.64 | 3,998,000 | 3,998,000 | |
| Mizuho Corporate Bank Ltd. | ||||
| 11/13/23 to 12/22/23 (c) | 5.55 to 5.58 | 2,526,000 | 2,526,000 | |
| MUFG Bank Ltd. | ||||
| 10/23/23 to 11/24/23 | 5.60 to 5.67 | 1,014,500 | 1,014,500 | |
| Sumitomo Mitsui Banking Corp. | ||||
| 10/10/23 to 1/9/24 (c)(d) | 5.51 to 5.66 | 1,333,500 | 1,333,500 | |
TOTAL NEW YORK BRANCH, YANKEE DOLLAR, FOREIGN BANKS | 12,279,000 | |||
| TOTAL CERTIFICATE OF DEPOSIT (Cost $16,443,500) | 16,443,500 | |||
| Financial Company Commercial Paper - 14.3% | ||||
Yield (%)(a) | Principal Amount (b) (000s) | Value ($) (000s) | ||
| Australia & New Zealand Banking Group Ltd. | ||||
| 11/13/23 | 5.61 | 106,000 | 105,304 | |
| Bank of Montreal | ||||
| 11/9/23 to 3/18/24 (c) | 5.66 to 5.75 | 1,671,000 | 1,665,459 | |
| Barclays Bank PLC/Barclays U.S. CCP Funding LLC | ||||
| 10/20/23 (e) | 5.49 | 79,000 | 78,772 | |
| Bayerische Landesbank | ||||
| 10/26/23 to 11/10/23 | 5.52 to 5.54 | 2,595,500 | 2,582,927 | |
| Bedford Row Funding Corp. | ||||
| 3/20/24 (c)(d) | 5.66 | 133,000 | 133,000 | |
| 3/26/24 (c)(d) | 5.66 | 138,000 | 138,000 | |
| 4/15/24 (c)(d) | 0.00 | 80,000 | 80,000 | |
| 4/8/24 (c)(d) | 5.66 | 67,000 | 67,000 | |
| BPCE SA | ||||
| 10/12/23 to 12/14/23 | 5.56 to 5.63 | 2,365,000 | 2,354,249 | |
| Canadian Imperial Bank of Commerce | ||||
| 11/9/23 to 12/22/23 (c) | 5.66 to 5.68 | 288,000 | 284,668 | |
| Credit Agricole CIB | ||||
| 10/5/23 | 5.53 | 318,000 | 317,808 | |
| Federation des caisses Desjardin | ||||
| 11/9/23 to 1/22/24 | 5.58 to 5.80 | 790,000 | 779,333 | |
| Landesbank Baden-Wurttemberg | ||||
| 10/2/23 | 5.35 | 2,643,000 | 2,642,607 | |
| Mitsubishi UFJ Trust & Banking Corp. | ||||
| 11/10/23 | 5.61 | 106,000 | 105,349 | |
| Mizuho Bank Ltd. Singapore Branch | ||||
| 11/17/23 | 5.52 | 265,000 | 263,108 | |
| National Bank of Canada | ||||
| 1/19/24 | 5.77 | 531,000 | 521,914 | |
| Podium Funding Trust | ||||
| 12/8/23 (c)(d) | 5.76 | 105,000 | 105,000 | |
| 2/22/24 (c)(d) | 5.67 | 105,500 | 105,500 | |
| Podium Funding Trust (Liquidity Facility Bank of Montreal) | ||||
| 1/12/24 | 5.81 | 79,000 | 77,725 | |
| 1/17/24 | 5.73 | 47,000 | 46,212 | |
| Royal Bank of Canada | ||||
| 11/9/23 (c)(d) | 5.66 | 265,000 | 265,000 | |
| Skandinaviska Enskilda Banken AB | ||||
| 12/14/23 | 5.54 | 265,000 | 262,026 | |
| Sumitomo Mitsui Trust Bank Ltd. | ||||
| 10/11/23 to 11/27/23 | 5.52 to 5.53 | 2,539,500 | 2,524,892 | |
| The Toronto-Dominion Bank | ||||
| 10/16/23 to 10/17/23 | 5.38 to 5.38 | 532,000 | 530,799 | |
| TOTAL FINANCIAL COMPANY COMMERCIAL PAPER (Cost $16,036,652) | 16,036,652 | |||
| Asset Backed Commercial Paper - 0.9% | ||||
Yield (%)(a) | Principal Amount (b) (000s) | Value ($) (000s) | ||
| Cabot Trail Funding LLC (Liquidity Facility The Toronto-Dominion Bank) | ||||
| 10/18/23 | 5.56 | 25,000 | 24,935 | |
| 12/13/23 | 5.69 | 20,000 | 19,776 | |
| 2/9/24 | 5.76 | 53,000 | 51,920 | |
| Gotham Funding Corp. (Liquidity Facility Bank of Tokyo-Mitsubishi UFJ Ltd.) | ||||
| 10/10/23 | 5.55 | 185,000 | 184,747 | |
| 10/10/23 | 5.56 | 53,000 | 52,927 | |
| 10/11/23 | 5.55 | 51,000 | 50,922 | |
| 10/11/23 | 5.55 | 55,000 | 54,916 | |
| 12/19/23 | 5.59 | 25,000 | 24,698 | |
| 12/20/23 | 5.59 | 96,000 | 94,825 | |
| Liberty Street Funding LLC (Liquidity Facility Bank of Nova Scotia) | ||||
| 12/18/23 | 5.56 | 153,000 | 151,180 | |
| 12/19/23 | 5.56 | 55,000 | 54,337 | |
| 12/19/23 | 5.56 | 110,000 | 108,675 | |
| Victory Receivables Corp. (Liquidity Facility Bank of Tokyo-Mitsubishi UFJ Ltd.) | ||||
| 12/20/23 | 5.60 | 54,000 | 53,338 | |
| 12/21/23 | 5.60 | 81,000 | 79,994 | |
| TOTAL ASSET BACKED COMMERCIAL PAPER (Cost $1,007,190) | 1,007,190 | |||
| U.S. Treasury Debt - 10.5% | ||||
Yield (%)(a) | Principal Amount (b) (000s) | Value ($) (000s) | ||
| U.S. Treasury Obligations - 10.5% | ||||
| U.S. Treasury Bills | ||||
| 10/5/23 to 11/30/23 | 5.31 to 5.41 | 11,885,500 | 11,837,455 | |
| TOTAL U.S. TREASURY DEBT (Cost $11,885,500) | 11,837,455 | |||
| Non-Negotiable Time Deposit - 4.5% | ||||
Yield (%)(a) | Principal Amount (b) (000s) | Value ($) (000s) | ||
| Time Deposits - 4.5% | ||||
| Barclays Bank PLC | ||||
| 10/2/23 | 5.37 | 2,060,642 | 2,060,642 | |
| Landesbank Hessen-Thuringen London Branch | ||||
| 10/2/23 to 10/4/23 | 5.37 to 5.37 | 688,000 | 688,000 | |
| Mizuho Bank Ltd. Canada Branch | ||||
| 10/3/23 | 5.34 | 1,218,305 | 1,218,305 | |
| Royal Bank of Canada | ||||
| 10/2/23 | 5.32 | 531,000 | 531,000 | |
| The Toronto-Dominion Bank | ||||
| 10/2/23 | 5.32 | 531,000 | 531,000 | |
| TOTAL NON-NEGOTIABLE TIME DEPOSIT (Cost $5,028,947) | 5,028,947 | |||
| U.S. Government Agency Repurchase Agreement - 13.3% | |||
Maturity Amount ($) (000s) | Value ($) (000s) | ||
| In a joint trading account at 5.3% dated 9/29/23 due 10/2/23 (Collateralized by U.S. Government Obligations) # | 5,956,212 | 5,953,580 | |
| With: | |||
| ABN AMRO Bank NV at 5.31%, dated 9/29/23 due 10/2/23 (Collateralized by U.S. Treasury Obligations valued at $232,663,841, 2.25% - 6.00%, 5/15/27 - 4/1/53) | 228,101 | 228,000 | |
| BMO Harris Bank NA at 5.32%, dated 9/21/23 due 10/6/23 (Collateralized by U.S. Government Obligations valued at $63,342,800, 3.50% - 4.00%, 1/20/43 - 9/20/51) | 62,385 | 62,000 | |
| BNP Paribas, SA at: | |||
5.32%, dated 9/21/23 due 10/6/23 (Collateralized by U.S. Treasury Obligations valued at $1,644,629,922, 0.00% - 8.00%, 10/26/23 - 9/15/56) | 1,617,980 | 1,608,000 | |
5.36%, dated: | |||
| 7/25/23 due 10/6/23 (Collateralized by U.S. Government Obligations valued at $123,688,811, 0.00% - 6.50%, 12/7/23 - 9/15/64) (c)(d)(f) | 121,644 | 120,000 | |
| 8/1/23 due 10/6/23 (Collateralized by U.S. Treasury Obligations valued at $124,906,527, 0.00% - 7.00%, 12/28/23 - 4/20/53) (c)(d)(f) | 123,198 | 121,000 | |
| 8/4/23 due 10/6/23 (Collateralized by U.S. Government Obligations valued at $123,795,508, 0.00% - 6.00%, 7/31/24 - 5/15/53) (c)(d)(f) | 122,180 | 120,000 | |
| 8/23/23 due 10/6/23 (Collateralized by U.S. Treasury Obligations valued at $125,005,709, 0.00% - 7.00%, 1/31/24 - 6/20/53) (c)(d)(f) | 123,162 | 121,000 | |
| BofA Securities, Inc. at 5.37%, dated 9/27/23 due 10/6/23 (Collateralized by U.S. Government Obligations valued at $63,288,088, 4.37% - 4.95%, 5/17/32 - 8/10/37) (c)(d)(f) | 63,119 | 62,000 | |
| CIBC Bank U.S.A. at 5.32%, dated 9/21/23 due 10/6/23 (Collateralized by U.S. Government Obligations valued at $352,471,496, 2.00% - 6.50%, 10/1/29 - 10/1/53) | 346,070 | 345,000 | |
| Citibank NA at 5.31%, dated 9/28/23 due 10/5/23 (Collateralized by U.S. Treasury Obligations valued at $189,221,968, 0.00% - 6.38%, 10/12/23 - 2/15/52) | 185,191 | 185,000 | |
| Citigroup Global Capital Markets, Inc. at: | |||
5.31%, dated 9/28/23 due 10/5/23 (Collateralized by U.S. Government Obligations valued at $220,451,253, 0.00% - 7.00%, 8/15/40 - 9/20/53) | 216,223 | 216,000 | |
5.32%, dated 9/21/23 due 10/6/23 (Collateralized by U.S. Government Obligations valued at $189,009,743, 0.00% - 7.32%, 6/1/36 - 8/15/40) | 185,875 | 185,000 | |
| FICC State Street GC (GOV REPO) at 5.31%, dated 9/29/23 due 10/2/23 (Collateralized by U.S. Government Obligations valued at $191,705,950, 2.00% - 6.00%, 6/1/51 - 9/1/53) | 186,082 | 186,000 | |
| Goldman Sachs & Co. at 5.31%, dated: | |||
9/25/23 due 10/2/23 (Collateralized by U.S. Treasury Obligations valued at $188,894,876, 1.13% - 4.00%, 12/31/26 - 8/15/40) | 185,191 | 185,000 | |
9/26/23 due 10/3/23 (Collateralized by U.S. Treasury Obligations valued at $754,447,167, 0.50% - 4.25%, 2/28/27 - 11/15/40) | 739,763 | 739,000 | |
9/27/23 due 10/4/23 (Collateralized by U.S. Treasury Obligations valued at $753,315,194, 0.75% - 4.00%, 8/31/26 - 5/15/33) | 738,762 | 738,000 | |
9/28/23 due 10/5/23 (Collateralized by U.S. Treasury Obligations valued at $252,088,690, 1.13% - 4.38%, 5/15/40 - 8/15/43) | 247,255 | 247,000 | |
9/29/23 due 10/6/23 (Collateralized by U.S. Treasury Obligations valued at $943,917,523, 0.50% - 3.88%, 2/28/26 - 5/15/43) | 925,955 | 925,000 | |
| RBC Dominion Securities at 5.32%, dated 9/21/23 due 10/6/23 (Collateralized by U.S. Government Obligations valued at $606,151,887, 0.00% - 7.00%, 11/14/23 - 9/1/53) | 596,681 | 593,000 | |
| RBC Financial Group at 5.33%, dated 9/21/23 due 10/6/23 (Collateralized by U.S. Treasury Obligations valued at $1,332,446,158, 0.13% - 7.00%, 10/15/23 - 9/20/63) | 1,307,078 | 1,299,000 | |
| TD Securities (U.S.A.) at 5.31%, dated 9/29/23 due 10/2/23 (Collateralized by U.S. Government Obligations valued at $276,542,316, 3.00% - 6.50%, 1/1/47 - 9/1/53) | 271,120 | 271,000 | |
| Wells Fargo Securities, LLC at: | |||
5.32%, dated 9/29/23 due 10/6/23 (Collateralized by U.S. Government Obligations valued at $251,031,241, 1.50% - 7.00%, 11/1/25 - 10/1/53) | 246,254 | 246,000 | |
5.36%, dated 9/21/23 due 10/6/23 (Collateralized by U.S. Government Obligations valued at $253,211,246, 0.38% - 10.93%, 10/25/23 - 9/15/65) (c)(d)(f) | 249,243 | 247,000 | |
| TOTAL U.S. GOVERNMENT AGENCY REPURCHASE AGREEMENT (Cost $15,002,580) | 15,002,580 | ||
| U.S. Treasury Repurchase Agreement - 39.7% | |||
Maturity Amount ($) (000s) | Value ($) (000s) | ||
| With: | |||
| ABN AMRO Bank NV at 5.31%, dated 9/29/23 due 10/2/23 (Collateralized by U.S. Treasury Obligations valued at $141,864,906, 0.63% - 4.50%, 3/15/25 - 8/15/46) | 139,062 | 139,000 | |
| Barclays Bank PLC at 5.32%, dated 9/21/23 due 10/6/23 (Collateralized by U.S. Treasury Obligations valued at $398,446,697, 0.38% - 3.13%, 4/30/25 - 11/15/28) | 392,421 | 390,000 | |
| BMO Harris Bank NA at 5.31%, dated 9/28/23 due 10/5/23 (Collateralized by U.S. Treasury Obligations valued at $178,605,322, 2.88% - 3.75%, 6/30/30 - 5/15/32) | 175,181 | 175,000 | |
| BofA Securities, Inc. at 5.33%, dated 9/21/23 due 10/6/23 (Collateralized by U.S. Treasury Obligations valued at $27,584,905, 3.50%, 9/15/25) | 27,168 | 27,000 | |
| CIBC Bank U.S.A. at: | |||
5.31%, dated 9/21/23 due 10/6/23 (Collateralized by U.S. Treasury Obligations valued at $163,600,101, 1.13% - 4.38%, 3/31/28 - 5/15/50) | 160,472 | 160,000 | |
5.32%, dated 9/21/23 due 10/6/23 (Collateralized by U.S. Treasury Obligations valued at $118,517,133, 0.63% - 5.44%, 7/31/24 - 5/15/53) | 116,719 | 116,000 | |
| Credit AG at: | |||
5.31%, dated: | |||
| 9/26/23 due 10/3/23 (Collateralized by U.S. Treasury Obligations valued at $115,362,032, 0.75%, 5/31/26 - 1/31/28) | 113,117 | 113,000 | |
| 9/28/23 due 10/2/23 (Collateralized by U.S. Treasury Obligations valued at $113,286,837, 0.75%, 1/31/28) | 111,065 | 111,000 | |
5.32%, dated 9/21/23 due 10/6/23 (Collateralized by U.S. Treasury Obligations valued at $57,212,919, 2.25% - 2.75%, 8/15/27 - 5/31/29) | 56,348 | 56,000 | |
| Federal Reserve Bank of New York at 5.3%, dated 9/29/23 due 10/2/23 (Collateralized by U.S. Treasury Obligations valued at $37,227,434,892, 0.25% - 4.38%, 11/15/23 - 2/15/46) | 37,227,435 | 37,211,000 | |
| Fixed Income Clearing Corp. - BNYM at 5.31%, dated 9/29/23 due 10/2/23 (Collateralized by U.S. Treasury Obligations valued at $1,297,440,047, 0.13% - 1.25%, 10/15/24 - 1/15/31) | 1,272,563 | 1,272,000 | |
| Fixed Income Clearing Corp. - SSB at 5.31%, dated 9/29/23 due 10/2/23 (Collateralized by U.S. Treasury Obligations valued at $2,846,976,652, 0.50% - 2.75%, 3/31/27 - 5/31/27) | 2,792,235 | 2,791,000 | |
| ING Financial Markets LLC at 5.31%, dated: | |||
9/26/23 due 10/3/23 (Collateralized by U.S. Treasury Obligations valued at $17,355,354, 1.63% - 4.13%, 2/28/27 - 11/15/50) | 17,018 | 17,000 | |
9/29/23 due 10/6/23 (Collateralized by U.S. Treasury Obligations valued at $67,366,030, 1.88% - 4.50%, 11/15/25 - 8/15/45) | 66,068 | 66,000 | |
| Mizuho Bank, Ltd. at 5.31%, dated 9/29/23 due 10/2/23 (Collateralized by U.S. Treasury Obligations valued at $285,446,061, 3.63%, 3/31/28) | 279,123 | 279,000 | |
| MUFG Securities (Canada), Ltd. at 5.33%, dated 9/21/23 due 10/6/23 (Collateralized by U.S. Treasury Obligations valued at $57,295,314, 0.25% - 6.38%, 3/31/24 - 8/15/52) | 56,348 | 56,000 | |
| MUFG Securities EMEA PLC at 5.31%, dated 9/29/23 due 10/2/23 (Collateralized by U.S. Treasury Obligations valued at $512,300,690, 0.50% - 4.63%, 5/15/24 - 5/15/44) | 502,222 | 502,000 | |
| NatWest Markets Securities, Inc. at 5.31%, dated 9/28/23 due 10/5/23 (Collateralized by U.S. Treasury Obligations valued at $278,624,298, 1.50% - 2.75%, 6/30/24 - 5/31/29) | 273,282 | 273,000 | |
| Norinchukin Bank at: | |||
5.34%, dated 9/25/23 due 10/2/23 (Collateralized by U.S. Treasury Obligations valued at $57,153,959, 3.88%, 2/15/43) | 56,058 | 56,000 | |
5.35%, dated 9/26/23 due 10/3/23 (Collateralized by U.S. Treasury Obligations valued at $57,145,546, 3.88%, 2/15/43) | 56,058 | 56,000 | |
| RBC Dominion Securities at 5.32%, dated 9/21/23 due 10/6/23 (Collateralized by U.S. Treasury Obligations valued at $84,806,235, 0.00% - 6.88%, 10/15/23 - 5/15/53) | 83,515 | 83,000 | |
| Royal Bank of Canada at 5.31%, dated 9/29/23 due 10/5/23 (Collateralized by U.S. Treasury Obligations valued at $45,059,849, 0.00% - 4.13%, 10/12/23 - 8/15/53) | 44,039 | 44,000 | |
| Societe Generale at 5.31%, dated: | |||
9/26/23 due 10/3/23 (Collateralized by U.S. Treasury Obligations valued at $256,600,894, 1.88% - 3.88%, 2/15/41 - 11/15/44) | 251,259 | 251,000 | |
9/28/23 due 10/5/23 (Collateralized by U.S. Treasury Obligations valued at $340,881,011, 0.25% - 3.88%, 5/31/24 - 11/15/51) | 334,345 | 334,000 | |
| TOTAL U.S. TREASURY REPURCHASE AGREEMENT (Cost $44,578,000) | 44,578,000 | ||
| Other Repurchase Agreement - 2.6% | |||
Maturity Amount ($) (000s) | Value ($) (000s) | ||
| Other Repurchase Agreement - 2.6% | |||
| With: | |||
| BMO Capital Markets Corp. at: | |||
5.46%, dated 9/29/23 due 10/2/23 (Collateralized by Corporate Obligations valued at $114,502,415, 0.99% - 5.87%, 2/16/24 - 8/1/50) | 109,050 | 109,000 | |
5.52%, dated 9/29/23 due 10/2/23 (Collateralized by Corporate Obligations valued at $117,770,374, 3.88% - 8.63%, 8/1/28 - 11/14/48) | 109,050 | 109,000 | |
| BMO Chicago Branch at 5.52%, dated 9/29/23 due 10/2/23 (Collateralized by Corporate Obligations valued at $13,605,109, 0.00% - 10.50%, 9/23/24 - 11/20/68) | 13,006 | 13,000 | |
| BNP Paribas Prime Brokerage, Inc. at 5.57%, dated 9/29/23 due 10/2/23 (Collateralized by Equity Securities valued at $175,073,951) | 162,075 | 162,000 | |
| HSBC Securities, Inc. at 5.55%, dated 9/29/23 due 10/2/23 (Collateralized by Corporate Obligations valued at $28,093,697, 3.00% - 7.08%, 12/15/27 - 4/1/53) | 26,012 | 26,000 | |
| ING Financial Markets LLC at 5.55%, dated 9/29/23 due 10/2/23 (Collateralized by Equity Securities valued at $276,607,875) | 256,118 | 256,000 | |
| J.P. Morgan Securities, LLC at: | |||
5.82%, dated 9/6/23 due 12/28/23 (Collateralized by Equity Securities valued at $292,825,208) (c)(d)(f) | 275,238 | 270,000 | |
5.89%, dated 8/31/23 due 10/2/23 (Collateralized by Corporate Obligations valued at $903,792,863, 0.00% - 9.25%, 1/15/24 - 9/15/53) (c)(d)(f) | 842,387 | 838,000 | |
| Mitsubishi UFJ Securities (U.S.A.), Inc. at: | |||
5.55%, dated 9/29/23 due 10/2/23 (Collateralized by Equity Securities valued at $72,393,468) | 67,031 | 67,000 | |
5.84%, dated 9/29/23 due 10/2/23 (Collateralized by Corporate Obligations valued at $10,805,231, 0.00% - 5.20%, 2/1/24 - 10/15/30) | 10,005 | 10,000 | |
| Mizuho Securities U.S.A., Inc. at: | |||
5.59%, dated 9/29/23 due 10/2/23 (Collateralized by Equity Securities valued at $104,808,804) | 97,045 | 97,000 | |
5.8%, dated 8/28/23 due 10/27/23 (Collateralized by Corporate Obligations valued at $235,681,123, 0.00% - 5.75%, 10/1/24 - 3/31/53) (c)(d)(f) | 219,098 | 217,000 | |
5.82%, dated 9/26/23 due 11/27/23 (Collateralized by Corporate Obligations valued at $368,907,494, 1.32% - 8.28%, 10/17/23 - 9/15/15) (c)(d)(f) | 354,518 | 351,000 | |
| NatWest Markets Securities, Inc. at 5.57%, dated 9/29/23 due 10/2/23 (Collateralized by Corporate Obligations valued at $56,190,267, 2.03% - 6.11%, 3/15/25 - 3/13/51) | 54,025 | 54,000 | |
| RBC Capital Markets Co. at 5.82%, dated 9/26/23 due 11/27/23 (Collateralized by Corporate Obligations valued at $113,509,999, 1.26% - 9.34%, 2/13/26 - 7/15/70) (c)(d)(f) | 109,083 | 108,000 | |
| Wells Fargo Securities, LLC at: | |||
5.48%, dated 9/29/23 due 10/2/23 (Collateralized by Commercial Paper valued at $194,758,900, 0.00%, 10/13/23 - 8/15/24) | 189,086 | 189,000 | |
6.05%, dated 7/24/23 due 10/20/23 (Collateralized by Equity Securities valued at $59,006,166) | 54,799 | 54,000 | |
| TOTAL OTHER REPURCHASE AGREEMENT (Cost $2,930,000) | 2,930,000 | ||
| TOTAL INVESTMENT IN SECURITIES - 100.4% (Cost $112,864,324) | 112,864,324 |
NET OTHER ASSETS (LIABILITIES) - (0.4)% | (412,083) |
| NET ASSETS - 100.0% | 112,452,241 |
| (a) | Yield represents either the annualized yield at the date of purchase, or the stated coupon rate, or, for floating and adjustable rate securities, the rate at period end. |
| (b) | Amount is stated in United States dollars unless otherwise noted. |
| (c) | Coupon rates for floating and adjustable rate securities reflect the rates in effect at period end. |
| (d) | Coupon is indexed to a floating interest rate which may be multiplied by a specified factor and/or subject to caps or floors. |
| (e) | Security exempt from registration under Rule 144A of the Securities Act of 1933. These securities may be resold in transactions exempt from registration, normally to qualified institutional buyers. At the end of the period, the value of these securities amounted to $78,772,000 or 0.1% of net assets. |
| (f) | The maturity amount is based on the rate at period end. |
| Other Information | ||
| # Additional information on each counterparty to the repurchase agreement is as follows: | ||
| Repurchase Agreement / Counterparty | Value ($) (000's) | |
| $5,953,580,000 due 10/02/23 at 5.30% | ||
| BNY Mellon Capital Markets LLC | 155,274 | |
| Bank of America, N.A. | 445,598 | |
| BofA Securities, Inc. | 255,368 | |
| Citigroup Global Markets, Inc. | 309,443 | |
| HSBC Securities (USA), Inc. | 55,700 | |
| ING Financial Markets LLC | 49,511 | |
| JP Morgan Securities LLC | 234,814 | |
| Mitsubishi UFJ Securities Holdings Ltd | 284,688 | |
| Mizuho Securities USA, Inc. | 123,777 | |
| Nomura Securities International | 1,115,877 | |
| RBC Dominion Securities, Inc. | 619,858 | |
| Royal Bank of Canada | 142,327 | |
| Sumitomo Mitsui Banking Corp. | 1,732,881 | |
| Sumitomo Mitsui Banking Corp. NY | 180,910 | |
| Wells Fargo Securities LLC | 247,554 | |
| 5,953,580 | ||
| Statement of Assets and Liabilities | ||||
| Amounts in thousands (except per-share amounts) | September 30, 2023 (Unaudited) | |||
| Assets | ||||
Investment in securities, at value (including repurchase agreements of $62,510,580) - See accompanying schedule Unaffiliated issuers (cost $112,864,324): | $ | 112,864,324 | ||
| Cash | 613,000 | |||
| Receivable for fund shares sold | 497,372 | |||
| Interest receivable | 158,435 | |||
| Prepaid expenses | 139 | |||
| Receivable from investment adviser for expense reductions | 3,907 | |||
| Other receivables | 1,048 | |||
Total assets | 114,138,225 | |||
| Liabilities | ||||
| Payable for investments purchased | $ | 1,195,392 | ||
| Payable for fund shares redeemed | 423,614 | |||
| Distributions payable | 46,616 | |||
| Accrued management fee | 12,963 | |||
| Distribution and service plan fees payable | 15 | |||
| Other affiliated payables | 4,248 | |||
| Other payables and accrued expenses | 3,136 | |||
| Total Liabilities | 1,685,984 | |||
| Net Assets | $ | 112,452,241 | ||
| Net Assets consist of: | ||||
| Paid in capital | $ | 112,451,762 | ||
| Total accumulated earnings (loss) | 479 | |||
| Net Assets | $ | 112,452,241 | ||
| Net Asset Value and Maximum Offering Price | ||||
| Class I : | ||||
Net Asset Value, offering price and redemption price per share ($48,961,513 ÷ 48,953,245 shares) | $ | 1.00 | ||
| Class II : | ||||
Net Asset Value, offering price and redemption price per share ($72,043 ÷ 72,036 shares) | $ | 1.00 | ||
| Class III : | ||||
Net Asset Value, offering price and redemption price per share ($16,321 ÷ 16,326 shares) | $ | 1.00 | ||
| Select Class : | ||||
Net Asset Value, offering price and redemption price per share ($54,572 ÷ 54,567 shares) | $ | 1.00 | ||
| Institutional Class : | ||||
Net Asset Value, offering price and redemption price per share ($63,347,792 ÷ 63,334,432 shares) | $ | 1.00 | ||
| Statement of Operations | ||||
| Amounts in thousands | Six months ended September 30, 2023 (Unaudited) | |||
| Investment Income | ||||
| Interest (including $1,192 from affiliated interfund lending) | $ | 2,734,348 | ||
| Expenses | ||||
| Management fee | $ | 72,450 | ||
| Transfer agent fees | 22,338 | |||
| Distribution and service plan fees | 110 | |||
| Accounting fees and expenses | 1,463 | |||
| Custodian fees and expenses | 139 | |||
| Independent trustees' fees and expenses | 169 | |||
| Registration fees | 2,991 | |||
| Audit | 28 | |||
| Legal | 30 | |||
| Miscellaneous | 299 | |||
| Total expenses before reductions | 100,017 | |||
| Expense reductions | (18,104) | |||
| Total expenses after reductions | 81,913 | |||
| Net Investment income (loss) | 2,652,435 | |||
| Realized and Unrealized Gain (Loss) | ||||
| Net realized gain (loss) on: | ||||
| Investment Securities: | ||||
| Unaffiliated issuers | (22) | |||
| Total net realized gain (loss) | (22) | |||
| Net increase in net assets resulting from operations | $ | 2,652,413 | ||
| Statement of Changes in Net Assets | ||||
| Amount in thousands | Six months ended September 30, 2023 (Unaudited) | Year ended March 31, 2023 | ||
| Increase (Decrease) in Net Assets | ||||
| Operations | ||||
| Net investment income (loss) | $ | 2,652,435 | $ | 2,148,507 |
| Net realized gain (loss) | (22) | 6 | ||
Net increase in net assets resulting from operations | 2,652,413 | 2,148,513 | ||
| Distributions to shareholders | (2,652,153) | (2,148,294) | ||
| Share transactions - net increase (decrease) | 14,922,286 | 58,562,981 | ||
| Total increase (decrease) in net assets | 14,922,546 | 58,563,200 | ||
| Net Assets | ||||
| Beginning of period | 97,529,695 | 38,966,495 | ||
| End of period | $ | 112,452,241 | $ | 97,529,695 |
| Money Market Portfolio Class I |
Six months ended (Unaudited) September 30, 2023 | Years ended March 31, 2023 | 2022 | 2021 | 2020 | 2019 | |||||||
Selected Per-Share Data | ||||||||||||
| Net asset value, beginning of period | $ | 1.00 | $ | 1.00 | $ | 1.00 | $ | 1.00 | $ | 1.00 | $ | 1.00 |
| Income from Investment Operations | ||||||||||||
Net investment income (loss) A | .025 | .028 | - B | .002 | .020 | .022 | ||||||
Net realized and unrealized gain (loss) B | - | - | - | - | - | - | ||||||
| Total from investment operations | .025 | .028 | - B | .002 | .020 | .022 | ||||||
| Distributions from net investment income | (.025) | (.028) | - B | (.002) | (.020) | (.022) | ||||||
| Total distributions | (.025) | (.028) | - B | (.002) | (.020) | (.022) | ||||||
| Net asset value, end of period | $ | 1.00 | $ | 1.00 | $ | 1.00 | $ | 1.00 | $ | 1.00 | $ | 1.00 |
Total Return C,D | 2.58% | 2.81% | .02% | .15% | 2.01% | 2.23% | ||||||
Ratios to Average Net Assets A,E,F | ||||||||||||
| Expenses before reductions | .21% G,H | .21% | .21% | .21% | .21% | .21% | ||||||
| Expenses net of fee waivers, if any | .18% G,H | .18% | .16% | .18% | .18% | .18% | ||||||
| Expenses net of all reductions | .18% G,H | .18% | .16% | .18% | .18% | .18% | ||||||
| Net investment income (loss) | 5.10% G,H | 3.25% | .02% | .16% | 1.96% | 2.25% | ||||||
| Supplemental Data | ||||||||||||
| Net assets, end of period (in millions) | $ | 48,962 | $ | 42,432 | $ | 16,745 | $ | 21,937 | $ | 25,801 | $ | 22,140 |
| Money Market Portfolio Class II |
Six months ended (Unaudited) September 30, 2023 | Years ended March 31, 2023 | 2022 | 2021 | 2020 | 2019 | |||||||
Selected Per-Share Data | ||||||||||||
| Net asset value, beginning of period | $ | 1.00 | $ | 1.00 | $ | 1.00 | $ | 1.00 | $ | 1.00 | $ | 1.00 |
| Income from Investment Operations | ||||||||||||
Net investment income (loss) A | .025 | .026 | - B | .001 | .018 | .021 | ||||||
Net realized and unrealized gain (loss) B | - | - | - | - | - | - | ||||||
| Total from investment operations | .025 | .026 | - B | .001 | .018 | .021 | ||||||
| Distributions from net investment income | (.025) | (.026) | - B | (.001) | (.018) | (.021) | ||||||
| Total distributions | (.025) | (.026) | - B | (.001) | (.018) | (.021) | ||||||
| Net asset value, end of period | $ | 1.00 | $ | 1.00 | $ | 1.00 | $ | 1.00 | $ | 1.00 | $ | 1.00 |
Total Return C,D | 2.50% | 2.65% | .01% | .09% | 1.86% | 2.08% | ||||||
Ratios to Average Net Assets A,E,F | ||||||||||||
| Expenses before reductions | .36% G,H | .36% | .36% | .36% | .36% | .36% | ||||||
| Expenses net of fee waivers, if any | .33% G,H | .33% | .16% | .26% | .33% | .33% | ||||||
| Expenses net of all reductions | .33% G,H | .33% | .16% | .26% | .33% | .33% | ||||||
| Net investment income (loss) | 4.95% G,H | 3.10% | .01% | .08% | 1.81% | 2.10% | ||||||
| Supplemental Data | ||||||||||||
| Net assets, end of period (in millions) | $ | 72 | $ | 81 | $ | 90 | $ | 179 | $ | 394 | $ | 368 |
| Money Market Portfolio Class III |
Six months ended (Unaudited) September 30, 2023 | Years ended March 31, 2023 | 2022 | 2021 | 2020 | 2019 | |||||||
Selected Per-Share Data | ||||||||||||
| Net asset value, beginning of period | $ | 1.00 | $ | 1.00 | $ | 1.00 | $ | 1.00 | $ | 1.00 | $ | 1.00 |
| Income from Investment Operations | ||||||||||||
Net investment income (loss) A | .024 | .025 | - B | .001 | .017 | .020 | ||||||
Net realized and unrealized gain (loss) B | - | - | - | - | - | - | ||||||
| Total from investment operations | .024 | .025 | - B | .001 | .017 | .020 | ||||||
| Distributions from net investment income | (.024) | (.025) | - B | (.001) | (.017) | (.020) | ||||||
| Distributions from net realized gain | - | - | - B | - | - | - | ||||||
| Total distributions | (.024) | (.025) | - B | (.001) | (.017) | (.020) | ||||||
| Net asset value, end of period | $ | 1.00 | $ | 1.00 | $ | 1.00 | $ | 1.00 | $ | 1.00 | $ | 1.00 |
Total Return C,D | 2.45% | 2.55% | .01% | .06% | 1.76% | 1.98% | ||||||
Ratios to Average Net Assets A,E,F | ||||||||||||
| Expenses before reductions | .46% G,H | .46% | .46% | .46% | .46% | .46% | ||||||
| Expenses net of fee waivers, if any | .43% G,H | .43% | .17% | .27% | .43% | .43% | ||||||
| Expenses net of all reductions | .43% G,H | .43% | .17% | .27% | .43% | .43% | ||||||
| Net investment income (loss) | 4.85% G,H | 3.00% | .01% | .07% | 1.71% | 2.00% | ||||||
| Supplemental Data | ||||||||||||
| Net assets, end of period (in millions) | $ | 16 | $ | 31 | $ | 9 | $ | 13 | $ | 13 | $ | 33 |
| Money Market Portfolio Select Class |
Six months ended (Unaudited) September 30, 2023 | Years ended March 31, 2023 | 2022 | 2021 | 2020 | 2019 | |||||||
Selected Per-Share Data | ||||||||||||
| Net asset value, beginning of period | $ | 1.00 | $ | 1.00 | $ | 1.00 | $ | 1.00 | $ | 1.00 | $ | 1.00 |
| Income from Investment Operations | ||||||||||||
Net investment income (loss) A | .025 | .027 | - B | .001 | .019 | .022 | ||||||
Net realized and unrealized gain (loss) B | - | - | - | - | - | - | ||||||
| Total from investment operations | .025 | .027 | - B | .001 | .019 | .022 | ||||||
| Distributions from net investment income | (.025) | (.027) | - B | (.001) | (.019) | (.022) | ||||||
| Total distributions | (.025) | (.027) | - B | (.001) | (.019) | (.022) | ||||||
| Net asset value, end of period | $ | 1.00 | $ | 1.00 | $ | 1.00 | $ | 1.00 | $ | 1.00 | $ | 1.00 |
Total Return C,D | 2.55% | 2.76% | .02% | .12% | 1.96% | 2.18% | ||||||
Ratios to Average Net Assets A,E,F | ||||||||||||
| Expenses before reductions | .26% G,H | .26% | .26% | .26% | .26% | .26% | ||||||
| Expenses net of fee waivers, if any | .23% G,H | .23% | .16% | .21% | .23% | .23% | ||||||
| Expenses net of all reductions | .23% G,H | .23% | .16% | .21% | .23% | .23% | ||||||
| Net investment income (loss) | 5.05% G,H | 3.20% | .02% | .13% | 1.91% | 2.20% | ||||||
| Supplemental Data | ||||||||||||
| Net assets, end of period (in millions) | $ | 55 | $ | 40 | $ | 15 | $ | 26 | $ | 59 | $ | 33 |
| Money Market Portfolio Institutional Class |
Six months ended (Unaudited) September 30, 2023 | Years ended March 31, 2023 | 2022 | 2021 | 2020 | 2019 | |||||||
Selected Per-Share Data | ||||||||||||
| Net asset value, beginning of period | $ | 1.00 | $ | 1.00 | $ | 1.00 | $ | 1.00 | $ | 1.00 | $ | 1.00 |
| Income from Investment Operations | ||||||||||||
Net investment income (loss) A | .026 | .028 | - B | .002 | .020 | .022 | ||||||
| Net realized and unrealized gain (loss) | - B | - B | - B | - B | - B | .001 | ||||||
| Total from investment operations | .026 | .028 | - B | .002 | .020 | .023 | ||||||
| Distributions from net investment income | (.026) | (.028) | - B | (.002) | (.020) | (.023) | ||||||
| Total distributions | (.026) | (.028) | - B | (.002) | (.020) | (.023) | ||||||
| Net asset value, end of period | $ | 1.00 | $ | 1.00 | $ | 1.00 | $ | 1.00 | $ | 1.00 | $ | 1.00 |
Total Return C,D | 2.60% | 2.85% | .04% | .19% | 2.05% | 2.28% | ||||||
Ratios to Average Net Assets A,E,F | ||||||||||||
| Expenses before reductions | .18% G,H | .18% | .18% | .18% | .18% | .18% | ||||||
| Expenses net of fee waivers, if any | .14% G,H | .14% | .14% | .14% | .14% | .14% | ||||||
| Expenses net of all reductions | .14% G,H | .14% | .14% | .14% | .14% | .14% | ||||||
| Net investment income (loss) | 5.14% G,H | 3.29% | .04% | .20% | 2.00% | 2.29% | ||||||
| Supplemental Data | ||||||||||||
| Net assets, end of period (in millions) | $ | 63,348 | $ | 54,946 | $ | 22,108 | $ | 28,837 | $ | 35,852 | $ | 33,002 |
| Current 7-Day Yields | ||
| Class I | 3.96% | |
| Class II | 3.81% | |
| Class III | 3.71% | |
| Select Class | 3.91% | |
Yield refers to the income paid by the Fund over a given period. Yield for money market funds is usually for seven-day periods, as it is here, though it is expressed as an annual percentage rate. Past performance is no guarantee of future results. Yield will vary and it's possible to lose money investing in the Fund. A portion of the Fund's expenses was reimbursed and/or waived. Absent such reimbursements and/or waivers the yield for the period ending September 30, 2023, the most recent period shown in the table, would have been 3.88% for Class I, 3.73% for Class II, 3.64% for Class III, and 3.83% for Select Class. | ||
| Effective Maturity Diversification (% of Fund's Investments) | ||
| Days | ||
| 1 - 7 | 85.0 | |
| 8 - 30 | 1.6 | |
| 31 - 60 | 2.9 | |
| 61 - 90 | 2.3 | |
| 91 - 180 | 2.7 | |
| > 180 | 5.5 | |
| Effective maturity is determined in accordance with the requirements of Rule 2a-7 under the Investment Company Act of 1940. | ||
Asset Allocation (% of Fund's net assets) |
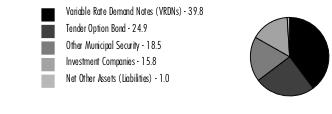 |
| Variable Rate Demand Note - 39.8% | |||
Principal Amount (a) (000s) | Value ($) (000s) | ||
| Alabama - 0.8% | |||
| Mobile Downtown Redev. Auth. Gulf Opportunity Zone Series 2011 B, 3.87% 10/6/23, LOC Bank of America NA, VRDN (b)(c) | 34,770 | 34,770 | |
| Mobile Indl. Dev. Board Dock & Wharf Rev. (Holnam, Inc. Proj.) Series 1999 A, 4.35% (c) | 19,800 | 19,800 | |
TOTAL ALABAMA | 54,570 | ||
| Alaska - 1.2% | |||
| Valdez Marine Term. Rev.: | |||
| (ConocoPhillips Proj.) Series 1994 A, 3.95% 10/6/23 (ConocoPhillips Co. Guaranteed), VRDN (c) | 25,000 | 25,000 | |
| (Phillips Trans. Alaska, Inc. Proj.): | |||
Series 1994 B, 4.2% 10/6/23 (ConocoPhillips Co. Guaranteed), VRDN (c) | 35,250 | 35,250 | |
Series 1994 C, 4% 10/6/23 (ConocoPhillips Co. Guaranteed), VRDN (c) | 21,700 | 21,700 | |
Series 2002, 3.95% 10/6/23 (ConocoPhillips Co. Guaranteed), VRDN (c) | 5,300 | 5,300 | |
TOTAL ALASKA | 87,250 | ||
| Arizona - 0.8% | |||
| Maricopa County Poll. Cont. Rev.: | |||
| (Arizona Pub. Svc. Co. Palo Verde Proj.) Series 2009 A, 4.24% 10/6/23, VRDN (c) | 13,900 | 13,900 | |
| Series 2009 B, 4.24% 10/6/23, VRDN (c) | 14,500 | 14,500 | |
| Maricopa County Rev. Series 2023 B, 4.1% 10/6/23, VRDN (c) | 30,700 | 30,700 | |
TOTAL ARIZONA | 59,100 | ||
| Colorado - 0.1% | |||
| Colorado Edl. & Cultural Facilities Auth. Rev. (Clyfford Still Museum Proj.) Series 2008, 4% 10/6/23, LOC Wells Fargo Bank NA, VRDN (c) | 690 | 690 | |
| Colorado Health Facilities Auth. Rev. Bonds Series 2022 F, 3.95% 10/6/23, VRDN (c) | 5,000 | 5,000 | |
| Mesa County Econ. Dev. Rev. (Leitner-Poma of America, Inc. Proj.) Series 2009, 4% 10/6/23, LOC Wells Fargo Bank NA, VRDN (c) | 3,165 | 3,165 | |
TOTAL COLORADO | 8,855 | ||
| Connecticut - 3.4% | |||
| Connecticut Gen. Oblig. Series 2016 C, 3.88% 10/6/23 (Liquidity Facility Bank of America NA), VRDN (c) | 122,100 | 122,100 | |
| Connecticut Health & Edl. Facilities Auth. Rev.: | |||
| Series 2013 O, 4.07% 10/6/23, VRDN (c) | 25,310 | 25,310 | |
| Series 2014 C, 4.07% 10/6/23, VRDN (c) | 9,615 | 9,615 | |
| Connecticut Hsg. Fin. Auth.: | |||
| (Mtg. Fin. Prog.) Series C3, 3.93% 10/6/23 (Liquidity Facility Royal Bank of Canada), VRDN (c) | 2,085 | 2,085 | |
| Series 2012 C2, 3.9% 10/6/23 (Liquidity Facility Sumitomo Mitsui Banking Corp.), VRDN (c) | 5,300 | 5,300 | |
| Series 2013 B6, 3.9% 10/6/23 (Liquidity Facility Sumitomo Mitsui Banking Corp.), VRDN (c) | 12,700 | 12,700 | |
| Series 2018 A3, 3.83% 10/6/23 (Liquidity Facility Bank of America NA), VRDN (c) | 27,090 | 27,090 | |
| Series 2018 E2, 3.83% 10/6/23 (Liquidity Facility Bank of America NA), VRDN (c) | 38,550 | 38,550 | |
TOTAL CONNECTICUT | 242,750 | ||
| Delaware - 0.4% | |||
| Delaware Econ. Dev. Auth. Rev. (Delmarva Pwr. & Lt. Co. Proj.): | |||
| Series 1993 C, 3.86% 10/6/23, VRDN (c) | 9,500 | 9,500 | |
| Series 1999 A, 4.3% 10/6/23, VRDN (c) | 18,830 | 18,830 | |
TOTAL DELAWARE | 28,330 | ||
| District Of Columbia - 0.3% | |||
| District of Columbia Rev.: | |||
| (The AARP Foundation Proj.) Series 2004, 3.89% 10/6/23, LOC Bank of America NA, VRDN (c) | 15,315 | 15,315 | |
| (The Pew Charitable Trust Proj.) Series 2008 A, 3.94% 10/6/23, LOC PNC Bank NA, VRDN (c) | 3,595 | 3,595 | |
TOTAL DISTRICT OF COLUMBIA | 18,910 | ||
| Florida - 1.3% | |||
| Escambia County Solid Waste Disp. Rev. (Gulf Pwr. Co. Proj.) Series 2009, 3.9% 10/6/23, VRDN (c) | 6,900 | 6,900 | |
| Highlands County Health Facilities Auth. Rev. (Adventist Health Sys./Sunbelt, Inc. Prog.) Series 2007 A1, 3.9% 10/6/23, VRDN (c) | 18,705 | 18,705 | |
| Jacksonville Poll. Cont. Rev. (Florida Pwr. & Lt. Co. Proj.) Series 1995, 4.45% 10/6/23, VRDN (c) | 16,400 | 16,400 | |
| Martin County Rev. (Florida Pwr. & Lt. Co. Proj.) Series 2022, 4.17% 10/6/23, VRDN (c) | 27,300 | 27,300 | |
| Mississippi Bus. Fin. Corp. Poll. Cont. Rev. (Gulf Pwr. Co. Proj.) Series 2014, 4.45% 10/6/23, VRDN (c) | 6,000 | 6,000 | |
| Orange County Health Facilities Auth. Rev. (Orlando Reg'l. Health Care Sys. Proj.) Series 2008 E, 3.8% 10/6/23, LOC TD Banknorth, NA, VRDN (c) | 1,810 | 1,810 | |
| Palm Beach County Rev. (Raymond F. Kravis Ctr. Proj.) Series 2002, 3.93% 10/6/23, LOC Northern Trust Co., VRDN (c) | 14,235 | 14,235 | |
| FNMA Florida Hsg. Fin. Corp. Multi-family Mtg. Rev. (Mariner's Cay Apts. Proj.) Series 2008 M, 3.95% 10/6/23, LOC Fannie Mae, VRDN (c) | 1,850 | 1,850 | |
TOTAL FLORIDA | 93,200 | ||
| Georgia - 0.9% | |||
| Burke County Indl. Dev. Auth. Poll. Cont. Rev. (Georgia Pwr. Co. Plant Vogtle Proj.): | |||
| First Series 2009, 4.75% 10/2/23, VRDN (c) | 1,300 | 1,300 | |
| Series 2018, 4.8% 10/2/23, VRDN (c) | 38,475 | 38,475 | |
| Coweta County Dev. Auth. Poll. Cont. Rev. (Georgia Pwr. Co. Plant Yates Proj.) Series 2006, 4.8% 10/2/23, VRDN (c) | 9,125 | 9,125 | |
| Heard County Dev. Auth. Poll. Cont. Rev. (Georgia Pwr. Co. Plant Wansley Proj.) First Series 1997, 4.6% 10/2/23, VRDN (c) | 12,700 | 12,700 | |
| Monroe County Dev. Auth. Poll. Cont. Rev. (Gulf Pwr. Co. Plant Scherer Proj.) Series 2010, 4.1% 10/6/23, VRDN (c) | 3,400 | 3,400 | |
TOTAL GEORGIA | 65,000 | ||
| Illinois - 2.3% | |||
| Illinois Dev. Fin. Auth. Rev.: | |||
| (Glenwood School for Boys Proj.) Series 1998, 4.18% 10/6/23, LOC Northern Trust Co., VRDN (c) | 4,600 | 4,600 | |
| (Lyric Opera of Chicago Proj.) Series 1994, 4% 10/6/23, LOC BMO Harris Bank NA, LOC Northern Trust Co., VRDN (c) | 5,500 | 5,500 | |
| Illinois Fin. Auth.: | |||
| Series 2021 C, 4.08% 10/6/23, LOC Barclays Bank PLC, VRDN (c) | 23,800 | 23,800 | |
| Series 2021 D, 3.95% 10/6/23, VRDN (c) | 12,000 | 12,000 | |
| Series 2021 E, 4.05% 10/6/23, VRDN (c) | 9,780 | 9,780 | |
| Illinois Fin. Auth. Rev.: | |||
| (Chicago Symphony Orchestra Proj.) Series 2008, 3.94% 10/6/23, LOC PNC Bank NA, VRDN (c) | 15,100 | 15,100 | |
| (Little Co. of Mary Hosp. Proj.): | |||
Series 2008 A, 3.9% 10/6/23, LOC TD Banknorth, NA, VRDN (c) | 11,940 | 11,940 | |
Series 2008 B, 3.9% 10/6/23, LOC TD Banknorth, NA, VRDN (c) | 21,100 | 21,100 | |
| (Richard H. Driehaus Museum Proj.) Series 2005, 4.15% 10/6/23, LOC Northern Trust Co., VRDN (c) | 3,800 | 3,800 | |
| Series 2009 E2, 4% 10/6/23, LOC Sumitomo Mitsui Banking Corp., VRDN (c) | 5,000 | 5,000 | |
| Series 2011 B, 3.85% 10/6/23, LOC Sumitomo Mitsui Banking Corp., VRDN (c) | 21,360 | 21,360 | |
| FHLMC Lake County Multi-family Hsg. Rev. (Whispering Oaks Apts. Proj.) Series 2008, 3.87% 10/6/23, LOC Freddie Mac, VRDN (c) | 25,750 | 25,750 | |
TOTAL ILLINOIS | 159,730 | ||
| Indiana - 2.0% | |||
| Indiana Dev. Fin. Auth. Envir. Rev.: | |||
| (Duke Energy Indiana, Inc. Proj.) Series 2009 A3, 3.75% 10/6/23, LOC Mizuho Bank Ltd., VRDN (c) | 22,500 | 22,500 | |
| Series 2005, 4.25% 10/6/23, LOC Rabobank Nederland New York Branch, VRDN (c) | 11,500 | 11,500 | |
| Indiana Fin. Auth. Hosp. Rev. (Parkview Health Sys. Oblig. Group Proj.) Series 2009 C, 4.2% 10/6/23, LOC Sumitomo Mitsui Banking Corp., VRDN (c) | 27,450 | 27,450 | |
| Indiana Fin. Auth. Rev.: | |||
| (Ascension Health Proj.): | |||
Series 2008 E4, 4.1% 10/6/23, VRDN (c) | 12,185 | 12,185 | |
Series 2008 E8, 3.75% 10/6/23, VRDN (c) | 10,350 | 10,350 | |
| (Trinity Health Cr. Group Proj.) Series 2008 D1, 3.98% 10/6/23, VRDN (c) | 40,815 | 40,815 | |
| Series 2008 E7, 4.15% 10/6/23, VRDN (c) | 13,500 | 13,500 | |
| Indiana Health Facility Fing. Auth. Rev. Series 2003 E6, 4.1% 10/6/23, VRDN (c) | 4,515 | 4,515 | |
TOTAL INDIANA | 142,815 | ||
| Iowa - 1.4% | |||
| Iowa Fin. Auth. Econ. Dev. Rev.: | |||
| Series 2009 A, 4.01% 10/6/23, VRDN (c) | 11,700 | 11,700 | |
| Series 2011 A, 4.01% 10/6/23, VRDN (c) | 30,100 | 30,100 | |
| Iowa Fin. Auth. Midwestern Disaster Area Econ. Dev. Series 2012 A, 4.01% 10/6/23, VRDN (c) | 13,800 | 13,800 | |
| Iowa Fin. Auth. Midwestern Disaster Area Rev. (Archer-Daniels-Midland Co. Proj.) Series 2012, 3.7% 10/6/23 (Archer Daniels Midland Co. Guaranteed), VRDN (c) | 21,820 | 21,820 | |
| Iowa Fin. Auth. Rev. Series 2018 C, 4.05% 10/6/23, LOC JPMorgan Chase Bank, VRDN (c) | 21,485 | 21,485 | |
TOTAL IOWA | 98,905 | ||
| Kansas - 0.7% | |||
| Cygne Poll. Cont. Rev. (Kansas Gas and Elec. Co. Proj.) Series 1994 B, 3.9% 10/6/23, VRDN (c) | 1,300 | 1,300 | |
| Burlington Envir. Impt. Rev. (Kansas City Pwr. and Lt. Co. Proj.): | |||
| Series 2007 A, 4.03% 10/6/23, VRDN (c) | 7,600 | 7,600 | |
| Series 2007 B, 4.03% 10/6/23, VRDN (c) | 12,500 | 12,500 | |
| St. Mary's Kansas Poll. Cont. Rev.: | |||
| (Kansas Gas and Elec. Co. Proj.) Series 1994, 3.9% 10/6/23, VRDN (c) | 4,500 | 4,500 | |
| Series 1994, 3.9% 10/6/23, VRDN (c) | 16,400 | 16,400 | |
| Wamego Kansas Poll. Cont. Rfdg. Rev.: | |||
| (Kansas Gas & Elec. Co. Proj.) Series 1994, 3.9% 10/6/23, VRDN (c) | 2,300 | 2,300 | |
| (Western Resources, Inc. Proj.) Series 1994, 3.9% 10/6/23, VRDN (c) | 5,300 | 5,300 | |
TOTAL KANSAS | 49,900 | ||
| Kentucky - 0.0% | |||
| Louisville & Jefferson County: | |||
| Series 2011 A, 4.11% (c) | 300 | 300 | |
| Series 2013 C, 4.2% 10/6/23, LOC PNC Bank NA, VRDN (c) | 3,005 | 3,005 | |
TOTAL KENTUCKY | 3,305 | ||
| Louisiana - 1.8% | |||
| Louisiana Offshore Term. Auth. Deepwater Port Rev. (LOOP LLC Proj.) Series 2013 B, 4.05% 10/6/23, LOC JPMorgan Chase Bank, VRDN (c) | 22,340 | 22,340 | |
| Louisiana Pub. Facilities Auth. Rev.: | |||
| (Air Products & Chemicals, Inc. Proj.): | |||
Series 2004, 3.86% 10/6/23, VRDN (c) | 4,850 | 4,850 | |
Series 2010, 4% 10/6/23, VRDN (c) | 16,500 | 16,500 | |
| (Christus Health Proj.) Series 2009 B3, 4.05% 10/6/23, LOC Bank of New York, New York, VRDN (c) | 14,390 | 14,390 | |
| Saint James Parish Gen. Oblig. (Nucor Steel Louisiana LLC Proj.): | |||
| Series 2010 A1, 4.2% 10/6/23, VRDN (c) | 53,175 | 53,175 | |
| Series 2010 B1, 4.3% 10/6/23, VRDN (c) | 5,810 | 5,810 | |
| FHLMC Louisiana Pub. Facilities Auth. Rev. (River View Villas Proj.) Series 2006, 4.16% 10/6/23, LOC Freddie Mac, VRDN (c) | 8,885 | 8,885 | |
TOTAL LOUISIANA | 125,950 | ||
| Massachusetts - 0.2% | |||
| Massachusetts Bay Trans. Auth. Series 2000 A2, 3.71% 10/6/23 (Liquidity Facility TD Banknorth, NA), VRDN (c) | 7,430 | 7,430 | |
| Massachusetts Dept. of Trans. Metropolitan Hwy. Sys. Rev. Series 2022 A1, 4.12% 10/6/23 (Liquidity Facility TD Banknorth, NA), VRDN (c) | 7,900 | 7,900 | |
TOTAL MASSACHUSETTS | 15,330 | ||
| Michigan - 0.8% | |||
| Grand Traverse County Hosp. Fin. Auth. Series 2011 B, 3.88% 10/6/23, LOC JPMorgan Chase Bank, VRDN (c) | 12,030 | 12,030 | |
| Kent Hosp. Fin. Auth. Hosp. Facilities Rev. (Spectrum Health Sys. Proj.) Series 2008 B3, 3.9% 10/6/23 (Liquidity Facility Wells Fargo Bank NA), VRDN (c) | 19,580 | 19,580 | |
| Michigan Fin. Auth. Rev.: | |||
| (Hosp. Proj.) Series 2016 E2, 3.75% (c) | 2,450 | 2,450 | |
| Series 2016 E3, 4.15% 10/6/23, VRDN (c) | 10,000 | 10,000 | |
| Michigan Strategic Fund Ltd. Oblig. Rev. (The Kroger Co. Recovery Zone Facilities Bond Proj.) Series 2010, 4.02% 10/6/23, LOC Bank of Nova Scotia, VRDN (c) | 7,660 | 7,660 | |
| FHLMC Livonia Econ. Dev. Corp. (Madonna Univ. Proj.) Series 2009, 4.02% 10/6/23, LOC Fed. Home Ln. Bank Chicago, VRDN (c) | 6,455 | 6,455 | |
TOTAL MICHIGAN | 58,175 | ||
| Minnesota - 0.5% | |||
| Minneapolis Health Care Sys. Rev. (Fairview Health Svcs.) Series 2018 B, 4.1% 10/6/23, LOC JPMorgan Chase Bank, VRDN (c) | 38,215 | 38,215 | |
| Missouri - 0.6% | |||
| Missouri Health & Edl. Facilities Auth. Rev.: | |||
| (Ascension Health Cr. Group Proj.) Series 2003 C3, 3.75% 10/6/23, VRDN (c) | 26,900 | 26,900 | |
| (Ascension Health Sr. Cr. Group Proj.) Series 2008 C4, 3.75% 10/6/23, VRDN (c) | 14,145 | 14,145 | |
TOTAL MISSOURI | 41,045 | ||
| Nebraska - 0.2% | |||
| Nebraska Invt. Fin. Auth. Single Family Hsg. Rev. Series 2019 C, 4.05% 10/6/23 (Liquidity Facility Fed. Home Ln. Bank Topeka), VRDN (c) | 15,100 | 15,100 | |
| Nevada - 0.3% | |||
| Clark County Arpt. Rev.: | |||
| Series 2008 D 2B, 3.95% 10/6/23, LOC Sumitomo Mitsui Banking Corp., VRDN (c) | 7,450 | 7,450 | |
| Series 2008 D3, 4.1% 10/6/23, LOC Bank of America NA, VRDN (c) | 12,680 | 12,680 | |
TOTAL NEVADA | 20,130 | ||
| New York - 4.8% | |||
| New York City Gen. Oblig.: | |||
| Series 2010 G4, 4.1% 10/6/23 (Liquidity Facility Barclays Bank PLC), VRDN (c) | 23,160 | 23,160 | |
| Series 2013 A5, 3.94% 10/6/23 (Liquidity Facility Sumitomo Mitsui Banking Corp.), VRDN (c) | 18,305 | 18,305 | |
| Series 2017 A, 4.06% 10/6/23 (Liquidity Facility Citibank NA), VRDN (c) | 38,420 | 38,420 | |
| Series D5, 3.94% 10/6/23, LOC PNC Bank NA, VRDN (c) | 28,870 | 28,870 | |
| New York City Muni. Wtr. Fin. Auth. Wtr. & Swr. Sys. Rev.: | |||
| Series 2000 C, 3.72% 10/6/23 (Liquidity Facility Sumitomo Mitsui Banking Corp.), VRDN (c) | 4,200 | 4,200 | |
| Series 2013 AA-1, 3.95% 10/6/23 (Liquidity Facility PNC Bank NA), VRDN (c) | 8,390 | 8,390 | |
| Series 2015 BB3, 4.09% 10/6/23 (Liquidity Facility Sumitomo Mitsui Banking Corp.), VRDN (c) | 9,620 | 9,620 | |
| Series 2016 AA2, 3.95% 10/6/23 (Liquidity Facility PNC Bank NA), VRDN (c) | 25,300 | 25,300 | |
| New York City Transitional Fin. Auth. Rev.: | |||
| Series 2014 D4, 3.95% 10/6/23 (Liquidity Facility Mizuho Corporate Bank Ltd.), VRDN (c) | 25,600 | 25,600 | |
| Series 2018 C6, 3.9% 10/6/23 (Liquidity Facility Sumitomo Mitsui Banking Corp.), VRDN (c) | 68,375 | 68,375 | |
| New York Hsg. Fin. Agcy. Rev.: | |||
| (8 East 102nd Street Hsg. Proj.) Series 2010 A, 3.8% 10/6/23, LOC TD Banknorth, NA, VRDN (c) | 24,360 | 24,360 | |
| Series 2010 A: | |||
4.15% 10/6/23, LOC Landesbank Hessen-Thuringen, VRDN (c) | 2,300 | 2,300 | |
4.15% 10/6/23, LOC Landesbank Hessen-Thuringen, VRDN (c) | 6,900 | 6,900 | |
| New York Metropolitan Trans. Auth. Rev. Series 2005 E1, 4.1% 10/6/23, LOC Barclays Bank PLC, VRDN (c) | 47,710 | 47,710 | |
| Triborough Bridge & Tunnel Auth. Revs. Series 2005 A, 4.1% 10/6/23, LOC Barclays Bank PLC, VRDN (c) | 9,280 | 9,280 | |
TOTAL NEW YORK | 340,790 | ||
| New York And New Jersey - 0.1% | |||
| Port Auth. of New York & New Jersey Series 1997 2, 4.03% 10/30/23, VRDN (c)(d) | 7,300 | 7,300 | |
| North Carolina - 0.5% | |||
| Durham County Indl. and Poll. Cont. Auth. Rev. Series 2007, 4.05% 10/6/23, LOC TD Banknorth, NA, VRDN (c) | 11,935 | 11,935 | |
| Parson County Indl. Facilities and Poll. Cont. Fing. Auth. (CertainTeed Gypsum NC, Inc. Proj.) Series 2010, 3.92% 10/6/23, LOC Cr. Industriel et Commercial, VRDN (c) | 21,590 | 21,590 | |
TOTAL NORTH CAROLINA | 33,525 | ||
| Ohio - 2.8% | |||
| Cuyahoga County Health Care Facilities Rev. (The A.M. McGregor Home Proj.) Series 2014, 4.05% 10/6/23, LOC Northern Trust Co., VRDN (c) | 4,400 | 4,400 | |
| Franklin County Hosp. Facilities Rev.: | |||
| Series 2009 A, 4.08% 10/6/23 (Liquidity Facility Barclays Bank PLC), VRDN (c) | 15,000 | 15,000 | |
| Series 2009 B, 4.08% 10/6/23 (Liquidity Facility Barclays Bank PLC), VRDN (c) | 39,300 | 39,300 | |
| Series 2013 A, 4.15% 10/6/23 (Liquidity Facility JPMorgan Chase Bank), VRDN (c) | 17,255 | 17,255 | |
| Series 2018 C, 4.05% 10/6/23, VRDN (c) | 10,400 | 10,400 | |
| Hamilton County Hosp. Facilities Rev. Series 2018 AA, 4.08% 10/6/23, VRDN (c) | 13,795 | 13,795 | |
| Montgomery County Hosp. Rev. Series 2019 B, 3.94% 10/6/23, LOC PNC Bank NA, VRDN (c) | 40,970 | 40,970 | |
| Ohio Higher Edl. Facility Commission Rev. Series 2013 B1, 4.05% 10/6/23, VRDN (c) | 5,400 | 5,400 | |
| Ohio Hosp. Facilities Rev. Series 2019 D1, 4.05% 10/6/23, VRDN (c) | 7,900 | 7,900 | |
| Ohio Parks & Recreation Cap. Facilities (Parks and Recreation Impt. Fund Projs.) Series 2020 B, 4.05% 10/6/23, VRDN (c) | 43,215 | 43,215 | |
TOTAL OHIO | 197,635 | ||
| Pennsylvania - 1.4% | |||
| Delaware County Indl. Dev. Auth. Arpt. Facilities Rev. (United Parcel Svc. Proj.) Series 2015, 4.4% 10/2/23, VRDN (c) | 3,400 | 3,400 | |
| Delaware Valley Reg'l. Fin. Auth. Local Govt. Rev.: | |||
| Series 2020 D, 3.8% 10/6/23, LOC TD Banknorth, NA, VRDN (c) | 14,890 | 14,890 | |
| Series 2022 E, 3.8% 10/6/23, LOC TD Banknorth, NA, VRDN (c) | 9,125 | 9,125 | |
| Lancaster Indl. Dev. Auth. Rev. (Willow Valley Retirement Cmntys. Proj.) Series 2009 C, 4% 10/6/23, LOC PNC Bank NA, VRDN (c) | 7,400 | 7,400 | |
| Lehigh County Gen. Purp. Hosp. Rev. Series 2019 B, 3.88% 10/6/23, LOC Bank of America NA, VRDN (c) | 59,560 | 59,560 | |
| FNMA Montgomery County Redev. Auth. Multi-family Hsg. Rev. (Kingswood Apts. Proj.) Series 2001 A, 4.06% 10/6/23, LOC Fannie Mae, VRDN (c) | 4,000 | 4,000 | |
TOTAL PENNSYLVANIA | 98,375 | ||
| Rhode Island - 0.2% | |||
| Rhode Island Health and Edl. Bldg. Corp. Higher Ed. Facility Rev. (Bryant Univ. Proj.) Series 2008, 4.1% 10/6/23, LOC TD Banknorth, NA, VRDN (c) | 12,140 | 12,140 | |
| Texas - 6.5% | |||
| Harris County Cultural Ed. Facilities Fin. Corp. Rev.: | |||
| Series 2014 D, 4.11% 10/6/23, VRDN (c) | 19,340 | 19,340 | |
| Series 2016 D, 4.11% 10/6/23, VRDN (c) | 18,400 | 18,400 | |
| Series 2019 E, 4.1% 10/6/23, VRDN (c) | 10,200 | 10,200 | |
| Series 2019 F, 4.11% 10/6/23, VRDN (c) | 24,300 | 24,300 | |
| Harris County Hosp. District Rev. Series 2010, 4.01% 10/6/23, LOC JPMorgan Chase Bank, VRDN (c) | 6,410 | 6,410 | |
| Houston Util. Sys. Rev.: | |||
| Series 2004 B2, 4% 10/6/23, LOC Sumitomo Mitsui Banking Corp., VRDN (c) | 28,455 | 28,455 | |
| Series 2004 B3, 4% 10/6/23, LOC Sumitomo Mitsui Banking Corp., VRDN (c) | 7,650 | 7,650 | |
| Series 2004 B4, 4% 10/6/23 (Liquidity Facility JPMorgan Chase Bank), VRDN (c) | 21,300 | 21,300 | |
| Series 2004 B5, 3.98% 10/6/23 (Liquidity Facility UBS AG), VRDN (c) | 67,990 | 67,990 | |
| Series 2004 B6, 4% 10/6/23, LOC Sumitomo Mitsui Banking Corp., VRDN (c) | 27,640 | 27,640 | |
| Port Arthur Navigation District Exempt Facilities (Var-Total Petrochemicals Proj.) Series 2009, 3.99% 10/6/23 (TotalEnergies SE Guaranteed), VRDN (c) | 700 | 700 | |
| Port Arthur Navigation District Indl. Dev. Corp. Exempt Facilities Rev.: | |||
| (Air Products Proj.) Series 2012, 4% 10/6/23 (TotalEnergies SE Guaranteed), VRDN (c) | 38,600 | 38,600 | |
| (Total Petrochemicals & Refining U.S.A., Inc. Proj.) Series 2012 B, 3.99% 10/6/23 (TotalEnergies SE Guaranteed), VRDN (c) | 4,200 | 4,200 | |
| (Total Petrochemicals and Refining U.S.A., Inc. Proj.) Series 2012 A, 3.99% 10/6/23 (TotalEnergies SE Guaranteed), VRDN (c) | 4,100 | 4,100 | |
| Tarrant County Cultural Ed. Facilities Fin. Corp. Rev. (Christus Health Proj.): | |||
| Series 2008 C1, 4.05% 10/6/23, LOC Sumitomo Mitsui Banking Corp., VRDN (c) | 13,300 | 13,300 | |
| Series 2008 C3, 4.05% 10/6/23, LOC Bank of Montreal, VRDN (c) | 12,910 | 12,910 | |
| Series 2008 C4, 4.05% 10/6/23, LOC Bank of Montreal, VRDN (c) | 1,100 | 1,100 | |
| Texas Gen. Oblig.: | |||
| (Texas Veterans Land Board Proj.) Series 2017, 4.1% 10/6/23 (Liquidity Facility Sumitomo Mitsui Banking Corp.), VRDN (c) | 7,515 | 7,515 | |
| Series 2011 B, 3.95% 10/6/23 (Liquidity Facility State Street Bank & Trust Co., Boston), VRDN (c) | 15,900 | 15,900 | |
| Series 2012 B, 3.95% 10/6/23 (Liquidity Facility State Street Bank & Trust Co., Boston), VRDN (c) | 14,310 | 14,310 | |
| Series 2013 B, 3.95% 10/6/23 (Liquidity Facility State Street Bank & Trust Co., Boston), VRDN (c) | 33,020 | 33,020 | |
| Series 2014 A, 3.95% 10/6/23 (Liquidity Facility State Street Bank & Trust Co., Boston), VRDN (c) | 32,435 | 32,435 | |
| Series 2015 A, 3.95% 10/6/23 (Liquidity Facility State Street Bank & Trust Co., Boston), VRDN (c) | 6,700 | 6,700 | |
| Series 2019, 4.05% 10/6/23 (Liquidity Facility JPMorgan Chase Bank), VRDN (c) | 47,345 | 47,345 | |
TOTAL TEXAS | 463,820 | ||
| Utah - 1.2% | |||
| Emery County Poll. Cont. Rev. (PacifiCorp Proj.) Series 1994, 4.2% 10/6/23, VRDN (c) | 83,500 | 83,500 | |
| Virginia - 0.9% | |||
| Fairfax County Indl. Dev. Auth.: | |||
| (Inova Health Sys. Proj.) Series 2018 C, 4.09% 10/6/23, VRDN (c) | 6,425 | 6,425 | |
| Series 2016 C, 4.09% 10/6/23, VRDN (c) | 8,975 | 8,975 | |
| Norfolk Econ. Dev. Auth. Hosp. Facilities Rev. Series 2016 B, 3.8% 10/6/23, VRDN (c) | 17,200 | 17,200 | |
| Virginia Small Bus. Fin. Auth. Hosp. Rev. Series 2008 A, 3.94% 10/6/23, LOC PNC Bank NA, VRDN (c) | 28,600 | 28,600 | |
TOTAL VIRGINIA | 61,200 | ||
| Washington - 0.5% | |||
| Port of Vancouver Rev. (United Grain Corp. of Oregon Proj.) Series 2009, 3.92% 10/6/23, LOC Bank of America NA, VRDN (c) | 7,000 | 7,000 | |
| Snohomish County Hsg. Auth. Hsg. Rev. (Ebey Arms Centerhouse Proj.) Series 2003, 3.9% 10/6/23, LOC Bank of America NA, VRDN (c) | 2,515 | 2,515 | |
| FHLMC: | |||
| Vancouver Hsg. Auth. Rev. Series 2008, 3.9% 10/6/23, LOC Freddie Mac, VRDN (c) | 10,600 | 10,600 | |
| Washington Hsg. Fin. Commission Multi-family Hsg. Rev. (Reserve at Renton Apts. Proj.) Series 2014, 4.12% 10/6/23, LOC Fed. Home Ln. Bank, San Francisco, VRDN (c) | 16,200 | 16,200 | |
TOTAL WASHINGTON | 36,315 | ||
| Wisconsin - 0.6% | |||
| Wisconsin Hsg. & Econ. Dev. Auth.: | |||
| Series 2021 B, 3.95% 10/6/23 (Liquidity Facility Fed. Home Ln. Bank Chicago), VRDN (c) | 22,600 | 22,600 | |
| Series 2022 B, 3.95% 10/6/23 (Liquidity Facility Fed. Home Ln. Bank Chicago), VRDN (c) | 22,500 | 22,500 | |
TOTAL WISCONSIN | 45,100 | ||
| Wyoming - 0.3% | |||
| Converse County Poll. Cont. Rev. (PacifiCorp Projs.) Series 1994, 4.25% 10/6/23, VRDN (c) | 4,800 | 4,800 | |
| Lincoln County Poll. Cont. Rev. (PacifiCorp Proj.) Series 1994, 4.25% 10/6/23, VRDN (c) | 2,100 | 2,100 | |
| Sweetwater County Poll. Cont. Rev. (PacifiCorp Proj.) Series 1994, 4.25% 10/6/23, VRDN (c) | 11,000 | 11,000 | |
TOTAL WYOMING | 17,900 | ||
| TOTAL VARIABLE RATE DEMAND NOTE (Cost $2,824,165) | 2,824,165 | ||
| Tender Option Bond - 24.9% | |||
Principal Amount (a) (000s) | Value ($) (000s) | ||
| Alabama - 0.1% | |||
| Southeast Energy Auth. Coop. Dis Participating VRDN Series XM 11 35, 4.01% 10/6/23 (Liquidity Facility Royal Bank of Canada) (c)(e)(f) | 4,000 | 4,000 | |
| Southeast Energy Auth. Rev. Bonds Participating VRDN Series ZL 04 68, 4.01% 10/6/23 (Liquidity Facility JPMorgan Chase Bank) (c)(e)(f) | 2,340 | 2,340 | |
TOTAL ALABAMA | 6,340 | ||
| Arizona - 0.2% | |||
| Arizona Indl. Dev. Auth. Hosp. Rev. Participating VRDN Series XM 10 13, 4.1% 10/6/23 (Liquidity Facility JPMorgan Chase Bank) (c)(e)(f) | 1,050 | 1,050 | |
| Arizona Tourism & Sports Auth. Tax Rev. Participating VRDN Series Floaters E85, 4.01% 10/6/23 (Liquidity Facility Royal Bank of Canada) (c)(e)(f) | 300 | 300 | |
| Jefferson County Ala Board Ed. Pubs Participating VRDN Series YX 13 19, 4.02% 10/6/23 (Liquidity Facility Barclays Bank PLC) (c)(e)(f) | 2,025 | 2,025 | |
| Mesa Util. Sys. Rev. Participating VRDN Series XM 10 12, 4.03% 10/6/23 (Liquidity Facility Toronto-Dominion Bank) (c)(e)(f) | 6,200 | 6,200 | |
| Salt Verde Finl. Corp. Sr. Gas Rev. Participating VRDN Series Floaters XF 25 37, 4.02% 10/6/23 (Liquidity Facility Barclays Bank PLC) (c)(e)(f) | 1,200 | 1,200 | |
TOTAL ARIZONA | 10,775 | ||
| California - 0.4% | |||
| California Health Facilities Fing. Auth. Rev. Participating VRDN Series Floaters 013, 4.01% 10/6/23 (Liquidity Facility Barclays Bank PLC) (c)(e)(f) | 4,665 | 4,665 | |
| California State Univ. Rev. Participating VRDN Series 2022 XX 12 63, 4% 10/6/23 (Liquidity Facility Barclays Bank PLC) (c)(e)(f) | 3,750 | 3,750 | |
| Lucile Salter Packard Children's Hosp. Participating VRDN Series Floaters XG 01 48, 4.01% 10/6/23 (Liquidity Facility Morgan Stanley Bank, West Valley City Utah) (c)(e)(f) | 4,015 | 4,015 | |
| San Francisco Bay Area Rapid Transit Fing. Auth. Participating VRDN Series XX 12 68, 4% 10/6/23 (Liquidity Facility Barclays Bank PLC) (c)(e)(f) | 2,795 | 2,795 | |
| Univ. of California Regents Med. Ctr. Pool Rev. Participating VRDN Series XX 12 75, 4% 10/6/23 (Liquidity Facility Barclays Bank PLC) (c)(e)(f) | 2,685 | 2,685 | |
| Univ. of California Revs. Participating VRDN: | |||
| Series 2022 XX 12 58, 4% 10/6/23 (Liquidity Facility Barclays Bank PLC) (c)(e)(f) | 2,000 | 2,000 | |
| Series Floaters YX 10 98, 4% 10/6/23 (Liquidity Facility Barclays Bank PLC) (c)(e)(f) | 7,600 | 7,600 | |
TOTAL CALIFORNIA | 27,510 | ||
| Colorado - 0.3% | |||
| Colorado Ctfs. of Prtn. Participating VRDN Series XG 04 26, 4.01% 10/6/23 (Liquidity Facility UBS AG) (c)(e)(f) | 2,905 | 2,905 | |
| Colorado Health Facilities Auth. Rev. Bonds Participating VRDN: | |||
| Series 2022 XM 10 28, 4.01% 10/6/23 (Liquidity Facility JPMorgan Chase Bank) (c)(e)(f) | 4,000 | 4,000 | |
| Series XG 02 51, 4.03% 10/6/23 (Liquidity Facility Bank of America NA) (c)(e)(f) | 720 | 720 | |
| Series XM 08 29, 4.02% 10/6/23 (Liquidity Facility Barclays Bank PLC) (c)(e)(f) | 4,400 | 4,400 | |
| Series XM 09 97, 4.01% 10/6/23 (Liquidity Facility Royal Bank of Canada) (c)(e)(f) | 4,665 | 4,665 | |
| Series XM 11 24, 4.01% 10/6/23 (Liquidity Facility Barclays Bank PLC) (c)(e)(f) | 2,345 | 2,345 | |
TOTAL COLORADO | 19,035 | ||
| Connecticut - 1.4% | |||
| Connecticut Gen. Oblig. Participating VRDN: | |||
| Series 15 XF0222, 4.02% 10/6/23 (Liquidity Facility Toronto-Dominion Bank) (c)(e)(f) | 8,000 | 8,000 | |
| Series Floaters 014, 4.02% 10/6/23 (Liquidity Facility Barclays Bank PLC) (c)(e)(f) | 28,355 | 28,355 | |
| Series Floaters 016, 4.02% 10/6/23 (Liquidity Facility Barclays Bank PLC) (c)(e)(f) | 25,000 | 25,000 | |
| Series Floaters YX 10 95, 4.01% 10/6/23 (Liquidity Facility Barclays Bank PLC) (c)(e)(f) | 4,000 | 4,000 | |
| Series XM 10 35, 4.01% 10/6/23 (Liquidity Facility JPMorgan Chase Bank) (c)(e)(f) | 2,705 | 2,705 | |
| Connecticut Health & Edl. Facilities Auth. Rev. Participating VRDN Series YX 12 91, 4.02% 10/6/23 (Liquidity Facility Barclays Bank PLC) (c)(e)(f) | 8,100 | 8,100 | |
| Connecticut Spl. Tax Oblig. Trans. Infrastructure Rev.: | |||
| Bonds Series Floaters G 110, 4.16%, tender (c)(d)(e)(f) | 3,300 | 3,300 | |
| Participating VRDN Series Floaters YX 10 77, 3.8% 10/6/23 (Liquidity Facility Barclays Bank PLC) (c)(e)(f) | 22,560 | 22,560 | |
TOTAL CONNECTICUT | 102,020 | ||
| District Of Columbia - 0.5% | |||
| District of Columbia Gen. Oblig. Participating VRDN: | |||
| Series Floaters E 108, 4.01% 10/6/23 (Liquidity Facility Royal Bank of Canada) (c)(e)(f) | 2,975 | 2,975 | |
| Series MS 4301, 4.01% 10/6/23 (Liquidity Facility Morgan Stanley Bank, West Valley City Utah) (c)(e)(f) | 10,900 | 10,900 | |
| District of Columbia Income Tax Rev. Participating VRDN Series XM 10 77, 4.01% 10/6/23 (Liquidity Facility UBS AG) (c)(e)(f) | 3,750 | 3,750 | |
| Metropolitan Washington Arpts. Auth. Dulles Toll Road Rev. Participating VRDN: | |||
| Series XF 08 53, 4.03% 10/6/23 (Liquidity Facility Toronto-Dominion Bank) (c)(e)(f) | 9,475 | 9,475 | |
| Series XF 09 19, 4.01% 10/6/23 (Liquidity Facility JPMorgan Chase Bank) (c)(e)(f) | 1,355 | 1,355 | |
| Series XG 02 67, 4.03% 10/6/23 (Liquidity Facility Bank of America NA) (c)(e)(f) | 9,710 | 9,710 | |
TOTAL DISTRICT OF COLUMBIA | 38,165 | ||
| Florida - 1.3% | |||
| Broward County Convention Ctr. Bonds Series MS 00 11, 3.83%, tender 11/2/23 (Liquidity Facility Morgan Stanley Bank, West Valley City Utah) (c)(d)(e)(f) | 15,910 | 15,910 | |
| Cape Coral Wtr. & Swr. Rev. Participating VRDN Series YX 13 17, 4.02% 10/6/23 (Liquidity Facility Barclays Bank PLC) (c)(e)(f) | 5,200 | 5,200 | |
| County of Broward Tourist Dev. Tax Rev. Participating VRDN: | |||
| Series XL 04 12, 4.06% 10/6/23 (Liquidity Facility Wells Fargo Bank NA) (c)(e)(f) | 4,000 | 4,000 | |
| Series XL 04 29, 4.09% 10/6/23 (Liquidity Facility Wells Fargo Bank NA) (c)(e)(f) | 1,415 | 1,415 | |
| Escambia County Health Facilities Auth. Health Facilities Rev. Participating VRDN Series ZF 09 31, 4.02% 10/6/23 (Liquidity Facility Bank of America NA) (c)(e)(f) | 1,605 | 1,605 | |
| Florida Dept. of Trans. Tpk. Rev. Participating VRDN Series XF 31 00, 4.01% 10/6/23 (Liquidity Facility Barclays Bank PLC) (c)(e)(f) | 4,265 | 4,265 | |
| Gainesville Utils. Sys. Rev. Participating VRDN Series YX 12 84, 4.01% 10/6/23 (Liquidity Facility Barclays Bank PLC) (c)(e)(f) | 7,815 | 7,815 | |
| Miami-Dade County Edl. Facilities Rev. Participating VRDN Series Floaters XG 01 92, 4.02% 10/6/23 (Liquidity Facility Royal Bank of Canada) (c)(e)(f) | 5,130 | 5,130 | |
| Miami-Dade County Expressway Auth. Participating VRDN Series Floaters XG 02 52, 4.03% 10/6/23 (Liquidity Facility Bank of America NA) (c)(e)(f) | 7,400 | 7,400 | |
| Miami-Dade County Wtr. & Swr. Rev. Participating VRDN: | |||
| Series XF 30 80, 4.01% 10/6/23 (Liquidity Facility Barclays Bank PLC) (c)(e)(f) | 6,000 | 6,000 | |
| Series XM 11 22, 4.01% 10/6/23 (Liquidity Facility Barclays Bank PLC) (c)(e)(f) | 13,900 | 13,900 | |
| Series XX 12 71, 4.01% 10/6/23 (Liquidity Facility Barclays Bank PLC) (c)(e)(f) | 6,000 | 6,000 | |
| Palm Beach County Health Facilities Auth. Hosp. Rev. Participating VRDN Series XG 03 70, 4.08% 10/6/23 (Liquidity Facility Bank of America NA) (c)(e)(f) | 4,770 | 4,770 | |
| Reedy Creek Impt. District Participating VRDN Series Floater RBC G-75, 3.84% 10/6/23 (Liquidity Facility Royal Bank of Canada) (c)(e)(f) | 1,700 | 1,700 | |
| South Broward Hosp. District Rev. Participating VRDN Series XG 03 45, 4.01% 10/6/23 (Liquidity Facility Wells Fargo Bank NA) (c)(e)(f) | 400 | 400 | |
| South Miami Health Facilities Auth. Hosp. Rev. Participating VRDN Series XM 08 68, 3.97% 10/6/23 (Liquidity Facility JPMorgan Chase Bank) (c)(e)(f) | 830 | 830 | |
| Tampa Health Sys. Rev. Participating VRDN: | |||
| Series 2022 ZF 14 10, 4.01% 10/6/23 (Liquidity Facility JPMorgan Chase Bank) (c)(e)(f) | 2,625 | 2,625 | |
| Series XF 31 46, 4.03% 10/6/23 (Liquidity Facility Wells Fargo Bank NA) (c)(e)(f) | 2,315 | 2,315 | |
TOTAL FLORIDA | 91,280 | ||
| Georgia - 1.8% | |||
| Atlanta Wtr. & Wastewtr. Rev. Participating VRDN Series Floaters XF 07 05, 4.01% 10/6/23 (Liquidity Facility JPMorgan Chase Bank) (c)(e)(f) | 3,200 | 3,200 | |
| Brookhaven Dev. Auth. Rev. Participating VRDN: | |||
| Series XG 02 44, 4.01% 10/6/23 (Liquidity Facility Bank of America NA) (c)(e)(f) | 170 | 170 | |
| Series XX 12 80, 4.01% 10/6/23 (Liquidity Facility Barclays Bank PLC) (c)(e)(f) | 10,000 | 10,000 | |
| Burke County Indl. Dev. Auth. Poll. Cont. Rev. Participating VRDN: | |||
| Series E 155, 4.02% 10/6/23 (Liquidity Facility Royal Bank of Canada) (c)(e)(f) | 30,695 | 30,695 | |
| Series Floaters E 107, 4.03% 10/6/23 (Liquidity Facility Royal Bank of Canada) (c)(e)(f) | 8,400 | 8,400 | |
| Fayette County Hosp. Auth. Rev. Participating VRDN Series Floaters XF 06 44, 4.18% 10/6/23 (Liquidity Facility JPMorgan Chase Bank) (c)(e)(f) | 2,300 | 2,300 | |
| Fulton County Dev. Auth. Rev. Participating VRDN Series XL 02 68, 4.08% 10/6/23 (Liquidity Facility Bank of America NA) (c)(e)(f) | 1,500 | 1,500 | |
| Georgia Gen. Oblig. Participating VRDN Series 2023 D7, 4% 10/6/23 (Liquidity Facility Citibank NA) (c)(e)(f) | 9,375 | 9,375 | |
| Georgia Muni. Elec. Auth. Pwr. Rev. Participating VRDN: | |||
| Series XF 28 47, 3.69% 10/6/23 (Liquidity Facility Barclays Bank PLC) (c)(e)(f) | 8,625 | 8,625 | |
| Series XF 31 06, 4.02% 10/6/23 (Liquidity Facility Barclays Bank PLC) (c)(e)(f) | 8,085 | 8,085 | |
| Series XG 04 70, 4.03% 10/6/23 (Liquidity Facility Bank of America NA) (c)(e)(f) | 3,800 | 3,800 | |
| Main Street Natural Gas, Inc. Participating VRDN: | |||
| Series Floaters XF 07 51, 4.01% 10/6/23 (Liquidity Facility JPMorgan Chase Bank) (c)(e)(f) | 27,135 | 27,135 | |
| Series XF 16 01, 4.01% 10/6/23 (Liquidity Facility Royal Bank of Canada) (c)(e)(f) | 4,900 | 4,900 | |
| Muni. Elec. Auth. of Georgia Participating VRDN Series XG 02 54, 4.03% 10/6/23 (Liquidity Facility Bank of America NA) (c)(e)(f) | 4,710 | 4,710 | |
| Private Colleges & Univs. Auth. Rev. Participating VRDN Series XF 07 07, 4.01% 10/6/23 (Liquidity Facility JPMorgan Chase Bank) (c)(e)(f) | 1,600 | 1,600 | |
TOTAL GEORGIA | 124,495 | ||
| Hawaii - 0.0% | |||
| Honolulu City & County Gen. Oblig. Participating VRDN Series Floaters XM 07 18, 4.01% 10/6/23 (Liquidity Facility Morgan Stanley Bank, West Valley City Utah) (c)(e)(f) | 3,590 | 3,590 | |
| Illinois - 3.1% | |||
| Chicago Board of Ed. Participating VRDN: | |||
| Series Floaters XG 02 17, 4.01% 10/6/23 (Liquidity Facility JPMorgan Chase Bank) (c)(e)(f) | 5,625 | 5,625 | |
| Series XG 04 69, 4.04% 10/6/23 (Liquidity Facility Bank of America NA) (c)(e)(f) | 3,260 | 3,260 | |
| Chicago Gen. Oblig. Participating VRDN: | |||
| Series 2022 XF 30 42, 4.02% 10/6/23 (Liquidity Facility Barclays Bank PLC) (c)(e)(f) | 2,545 | 2,545 | |
| Series 2022 XF 30 45, 4.02% 10/6/23 (Liquidity Facility Barclays Bank PLC) (c)(e)(f) | 31,330 | 31,330 | |
| Series Floaters XL 01 05, 4.02% 10/6/23 (Liquidity Facility Barclays Bank PLC) (c)(e)(f) | 4,000 | 4,000 | |
| Series XX 12 64, 4.02% 10/6/23 (Liquidity Facility Barclays Bank PLC) (c)(e)(f) | 11,580 | 11,580 | |
| Series XX 12 65, 4.02% 10/6/23 (Liquidity Facility Barclays Bank PLC) (c)(e)(f) | 2,660 | 2,660 | |
| Chicago O'Hare Int'l. Arpt. Rev. Participating VRDN Series Floaters XF 07 36, 4.01% 10/6/23 (Liquidity Facility JPMorgan Chase Bank) (c)(e)(f) | 3,160 | 3,160 | |
| Chicago Transit Auth. Participating VRDN Series XL 01 45, 4.02% 10/6/23 (Liquidity Facility Barclays Bank PLC) (c)(e)(f) | 10,685 | 10,685 | |
| Illinois Fin. Auth. Participating VRDN Series XG 04 31, 4.02% 10/6/23 (Liquidity Facility Barclays Bank PLC) (c)(e)(f) | 3,500 | 3,500 | |
| Illinois Fin. Auth. Rev. Participating VRDN: | |||
| Series 15 XF0253, 4.08% 10/6/23 (Liquidity Facility JPMorgan Chase Bank) (c)(e)(f) | 4,745 | 4,745 | |
| Series 17 XM 0492, 4.01% 10/6/23 (Liquidity Facility JPMorgan Chase Bank) (c)(e)(f) | 12,265 | 12,265 | |
| Series 2022 ZL 03 54, 4.01% 10/6/23 (Liquidity Facility Morgan Stanley Bank, West Valley City Utah) (c)(e)(f) | 2,500 | 2,500 | |
| Series Floaters 017, 4.02% 10/6/23 (Liquidity Facility Barclays Bank PLC) (c)(e)(f) | 18,800 | 18,800 | |
| Series XF 07 11, 4.01% 10/6/23 (Liquidity Facility JPMorgan Chase Bank) (c)(e)(f) | 9,900 | 9,900 | |
| Series XF 15 40, 4.01% 10/6/23 (Liquidity Facility Royal Bank of Canada) (c)(e)(f) | 2,500 | 2,500 | |
| Series YX 12 26, 4.02% 10/6/23 (Liquidity Facility Barclays Bank PLC) (c)(e)(f) | 4,575 | 4,575 | |
| Illinois Gen. Oblig. Participating VRDN: | |||
| Series 15 XF 1006, 4.02% 10/5/23 (Liquidity Facility Barclays Bank PLC) (c)(e)(f) | 2,990 | 2,990 | |
| Series Floaters XL 00 54, 4.02% 10/6/23 (Liquidity Facility Barclays Bank PLC) (c)(e)(f) | 7,000 | 7,000 | |
| Series XF 10 10, 4.02% 10/6/23 (Liquidity Facility Barclays Bank PLC) (c)(e)(f) | 10,595 | 10,595 | |
| Series XL 02 60, 4.02% 10/6/23 (Liquidity Facility Barclays Bank PLC) (c)(e)(f) | 7,400 | 7,400 | |
| Series XM 07 59, 4.03% 10/6/23 (Liquidity Facility Bank of America NA) (c)(e)(f) | 1,425 | 1,425 | |
| Series XM 10 48, 4.03% 10/6/23 (Liquidity Facility Bank of America NA) (c)(e)(f) | 4,500 | 4,500 | |
| Series XM 10 49, 4.03% 10/6/23 (Liquidity Facility Bank of America NA) (c)(e)(f) | 9,200 | 9,200 | |
| Series XX 11 41, 4.02% 10/6/23 (Liquidity Facility Barclays Bank PLC) (c)(e)(f) | 1,800 | 1,800 | |
| Illinois Hsg. Dev. Auth. Participating VRDN Series 2023, 4.01% 10/6/23 (Liquidity Facility Citibank NA) (c)(e)(f) | 2,500 | 2,500 | |
| Illinois Toll Hwy. Auth. Toll Hwy. Rev. Participating VRDN: | |||
| Series 15 XF0277, 4.04% 10/6/23 (Liquidity Facility JPMorgan Chase Bank) (c)(e)(f) | 2,665 | 2,665 | |
| Series Floaters XF 27 67, 4.04% 10/6/23 (Liquidity Facility JPMorgan Chase Bank) (c)(e)(f) | 9,600 | 9,600 | |
| Series Floaters ZF 03 73, 4.04% 10/6/23 (Liquidity Facility JPMorgan Chase Bank) (c)(e)(f) | 9,525 | 9,525 | |
| Series XF 15 33, 4.04% 10/6/23 (Liquidity Facility Bank of America NA) (c)(e)(f) | 2,700 | 2,700 | |
| Series XM 00 78, 4.03% 10/6/23 (Liquidity Facility Royal Bank of Canada) (c)(e)(f) | 5,180 | 5,180 | |
| Series XM 04 75, 4.01% 10/6/23 (Liquidity Facility Morgan Stanley Bank, West Valley City Utah) (c)(e)(f) | 4,695 | 4,695 | |
| Series ZL 03 32, 4.04% 10/6/23 (Liquidity Facility JPMorgan Chase Bank) (c)(e)(f) | 1,310 | 1,310 | |
| JPMorgan Chase Bank Participating VRDN Series ZF 13 88, 4.04% 10/6/23 (Liquidity Facility JPMorgan Chase Bank) (c)(e)(f) | 2,000 | 2,000 | |
| Metropolitan Pier & Exposition Participating VRDN Series Floaters XF 10 45, 4.1% 10/6/23 (Liquidity Facility Barclays Bank PLC) (c)(e)(f) | 2,120 | 2,120 | |
TOTAL ILLINOIS | 220,835 | ||
| Indiana - 0.1% | |||
| Indiana Fin. Auth. Health Facilities Rev. Participating VRDN Series XF 15 69, 4.01% 10/6/23 (Liquidity Facility Royal Bank of Canada) (c)(e)(f) | 4,000 | 4,000 | |
| Iowa - 0.1% | |||
| Iowa Fin. Auth. Single Family Mtg. Participating VRDN Series XG 05 22, 4.01% 10/6/23 (Liquidity Facility Royal Bank of Canada) (c)(e)(f) | 4,250 | 4,250 | |
| Kansas - 0.1% | |||
| Wyandotte County/Kansas City Unified Govt. Util. Sys. Rev. Participating VRDN Series YX 12 23, 4.02% 10/6/23 (Liquidity Facility Barclays Bank PLC) (c)(e)(f) | 5,400 | 5,400 | |
| Kentucky - 0.4% | |||
| CommonSpirit Health Participating VRDN Series MIZ 90 21, 4.08% 10/6/23 (Liquidity Facility Mizuho Cap. Markets LLC) (c)(e)(f) | 4,500 | 4,500 | |
| Kentucky Bd Dev. Corp. Indl. Bldg. Participating VRDN Series XX 11 24, 4.02% 10/6/23 (Liquidity Facility Barclays Bank PLC) (c)(e)(f) | 9,910 | 9,910 | |
| Kentucky Econ. Dev. Fin. Auth. Hosp. Rev. Participating VRDN Series Floaters XG 01 23, 4.02% 10/6/23 (Liquidity Facility Barclays Bank PLC) (c)(e)(f) | 5,195 | 5,195 | |
| Kentucky State Property & Buildings Commission Rev. Participating VRDN Series XG 0113, 3.85% 10/6/23 (Liquidity Facility Barclays Bank PLC) (c)(e)(f) | 5,600 | 5,600 | |
TOTAL KENTUCKY | 25,205 | ||
| Louisiana - 1.1% | |||
| Louisiana Pub. Facilities Auth. Lease Rev. Participating VRDN Series XM 08 56, 3.82% 10/6/23 (Liquidity Facility JPMorgan Chase Bank) (c)(e)(f) | 7,500 | 7,500 | |
| Louisiana Pub. Facilities Auth. Rev. Participating VRDN: | |||
| Series Floater BAML 5041 D1, 4.57% 10/2/23 (Liquidity Facility Bank of America NA) (c)(e)(f) | 12,745 | 12,745 | |
| Series YX 12 95, 4.02% 10/6/23 (Liquidity Facility Barclays Bank PLC) (c)(e)(f) | 8,605 | 8,605 | |
| Louisiana Stadium and Exposition District Participating VRDN Series XF 15 56, 4.01% 10/6/23 (Liquidity Facility Royal Bank of Canada) (c)(e)(f) | 3,000 | 3,000 | |
| RIB Floater Trust Various States Participating VRDN Series Floater 2023, 4.02% 10/6/23 (Liquidity Facility Barclays Bank PLC) (c)(e)(f) | 46,400 | 46,400 | |
TOTAL LOUISIANA | 78,250 | ||
| Maryland - 0.2% | |||
| Baltimore Proj. Rev. Bonds Series Floaters G 28, 4.18%, tender 1/2/24 (Liquidity Facility Royal Bank of Canada) (c)(d)(e)(f) | 700 | 700 | |
| Maryland Health & Higher Edl. Facilities Auth. Rev. Participating VRDN Series Floaters XG 02 16, 4.02% 10/6/23 (Liquidity Facility Bank of America NA) (c)(e)(f) | 2,605 | 2,605 | |
| Montgomery County Gen. Oblig. Participating VRDN Series Floaters XG 02 15, 4.02% 10/6/23 (Liquidity Facility Bank of America NA) (c)(e)(f) | 12,020 | 12,020 | |
TOTAL MARYLAND | 15,325 | ||
| Michigan - 0.7% | |||
| Holly Area School District Participating VRDN Series XG 04 86, 4.03% 10/6/23 (Liquidity Facility Wells Fargo Bank NA) (c)(e)(f) | 6,755 | 6,755 | |
| Mclaren Health Care Corp. Participating VRDN Series XL 02 71, 4.08% 10/6/23 (Liquidity Facility Bank of America NA) (c)(e)(f) | 1,010 | 1,010 | |
| Michigan Bldg. Auth. Rev. Participating VRDN: | |||
| Series Floaters XM 04 65, 4.01% 10/6/23 (Liquidity Facility Morgan Stanley Bank, West Valley City Utah) (c)(e)(f) | 10,635 | 10,635 | |
| Series XG 05 03, 4.01% 10/6/23 (Liquidity Facility Barclays Bank PLC) (c)(e)(f) | 6,635 | 6,635 | |
| Michigan Fin. Auth. Rev. Participating VRDN: | |||
| Series XF 07 82, 4.01% 10/6/23 (Liquidity Facility JPMorgan Chase Bank) (c)(e)(f) | 3,730 | 3,730 | |
| Series XG 04 33, 4.01% 10/6/23 (Liquidity Facility JPMorgan Chase Bank) (c)(e)(f) | 9,425 | 9,425 | |
| Series XM 04 72, 4.01% 10/6/23 (Liquidity Facility Citibank NA) (c)(e)(f) | 2,000 | 2,000 | |
| Series ZF 30 32, 4.01% 10/6/23 (Liquidity Facility UBS AG) (c)(e)(f) | 2,560 | 2,560 | |
| Michigan Hsg. Dev. Auth. Single Family Mtg. Rev. Participating VRDN: | |||
| Series XF 15 81, 4.03% 10/6/23 (Liquidity Facility Toronto-Dominion Bank) (c)(e)(f) | 2,400 | 2,400 | |
| Series XL 04 67, 4.01% 10/6/23 (Liquidity Facility Barclays Bank PLC) (c)(e)(f) | 2,000 | 2,000 | |
| Trenton Pub. Schools School District Participating VRDN Series Floaters CTFS G 102, 3.96% 10/6/23 (Liquidity Facility Royal Bank of Canada) (c)(e)(f) | 1,900 | 1,900 | |
TOTAL MICHIGAN | 49,050 | ||
| Minnesota - 0.0% | |||
| Duluth Econ. Dev. Auth. Health Care Facilities Rev. Participating VRDN Series XG 05 23, 4.02% 10/6/23 (Liquidity Facility Barclays Bank PLC) (c)(e)(f) | 2,000 | 2,000 | |
| Missouri - 1.4% | |||
| Kansas City Spl. Oblig. Participating VRDN: | |||
| Series XG 03 61, 4.02% 10/6/23 (Liquidity Facility Barclays Bank PLC) (c)(e)(f) | 6,090 | 6,090 | |
| Series YX 11 93, 4.02% 10/6/23 (Liquidity Facility Barclays Bank PLC) (c)(e)(f) | 9,115 | 9,115 | |
| Missouri Health & Edl. Facilities Auth. Rev. Participating VRDN Series Floaters C16, 4.03% 10/6/23 (Liquidity Facility Royal Bank of Canada) (c)(e)(f) | 22,500 | 22,500 | |
| Missouri Health & Edl. Facilities Rev.: | |||
| Bonds Series 2023 G 121, 4.18%, tender 12/1/23 (Liquidity Facility Royal Bank of Canada) (c)(e)(f) | 3,320 | 3,320 | |
| Participating VRDN: | |||
Series Floaters 14, 3.83% 10/6/23 (Liquidity Facility Barclays Bank PLC) (c)(e)(f) | 46,310 | 46,310 | |
Series Floaters C17, 4.02% 10/6/23 (Liquidity Facility Royal Bank of Canada) (c)(e)(f) | 5,200 | 5,200 | |
| St Louis County Spl. Oblig. Participating VRDN Series XG 03 82, 4.01% 10/6/23 (Liquidity Facility Wells Fargo Bank NA) (c)(e)(f) | 6,000 | 6,000 | |
TOTAL MISSOURI | 98,535 | ||
| Nebraska - 0.2% | |||
| Central Plains Energy Proj. Rev. Participating VRDN Series 2022 ZL 03 01, 4.03% 10/6/23 (Liquidity Facility Royal Bank of Canada) (c)(e)(f) | 2,000 | 2,000 | |
| Univ. of Nebraska Facilities Corp. Participating VRDN Series XL 04 15, 4.01% 10/6/23 (Liquidity Facility Barclays Bank PLC) (c)(e)(f) | 9,180 | 9,180 | |
TOTAL NEBRASKA | 11,180 | ||
| Nevada - 0.4% | |||
| Clark County Fuel Tax Participating VRDN Series Floaters XF 25 80, 4.01% 10/6/23 (Liquidity Facility Morgan Stanley Bank, West Valley City Utah) (c)(e)(f) | 15,725 | 15,725 | |
| Clark County Hwy. Impt. Rev. Participating VRDN Series XG 04 94, 4.01% 10/6/23 (Liquidity Facility UBS AG) (c)(e)(f) | 3,995 | 3,995 | |
| Clark County School District Participating VRDN Series XF 14 73, 4.1% 10/6/23 (Liquidity Facility JPMorgan Chase Bank) (c)(e)(f) | 2,395 | 2,395 | |
| Clark County Wtr. Reclamation District Participating VRDN Series XF 15 85, 4.01% 10/6/23 (Liquidity Facility Bank of America NA) (c)(e)(f) | 6,400 | 6,400 | |
TOTAL NEVADA | 28,515 | ||
| New Jersey - 0.4% | |||
| New Jersey Econ. Dev. Auth. Rev. Participating VRDN: | |||
| Series Floaters XF 10 48, 4.02% 10/6/23 (Liquidity Facility Barclays Bank PLC) (c)(e)(f) | 3,400 | 3,400 | |
| Series YX 12 87, 4.02% 10/6/23 (Liquidity Facility Barclays Bank PLC) (c)(e)(f) | 2,725 | 2,725 | |
| New Jersey Tpk. Auth. Tpk. Rev. Participating VRDN Series XM 10 96, 4.03% 10/6/23 (Liquidity Facility Royal Bank of Canada) (c)(e)(f) | 7,500 | 7,500 | |
| New Jersey Trans. Trust Fund Auth. Participating VRDN: | |||
| Series Floaters XG 02 05, 4.02% 10/6/23 (Liquidity Facility Barclays Bank PLC) (c)(e)(f) | 8,115 | 8,115 | |
| Series YX 12 68, 4.02% 10/6/23 (Liquidity Facility Barclays Bank PLC) (c)(e)(f) | 5,800 | 5,800 | |
TOTAL NEW JERSEY | 27,540 | ||
| New Mexico - 0.0% | |||
| New Mexico Mtg. Fin. Auth. Participating VRDN Series YX 11 89, 3.93% 10/6/23 (Liquidity Facility Barclays Bank PLC) (c)(e)(f) | 3,475 | 3,475 | |
| New York - 2.1% | |||
| New York City Gen. Oblig. Participating VRDN: | |||
| Series 15 ZF0197, 4.01% (c)(e)(f) | 2,500 | 2,500 | |
| Series Floaters E87, 4.01% 10/6/23 (Liquidity Facility Royal Bank of Canada) (c)(e)(f) | 8,200 | 8,200 | |
| Series Floaters E88, 4.01% 10/6/23 (Liquidity Facility Royal Bank of Canada) (c)(e)(f) | 2,000 | 2,000 | |
| Series Floaters XM 07 06, 3.94% 10/6/23 (Liquidity Facility Royal Bank of Canada) (c)(e)(f) | 1,900 | 1,900 | |
| Series XF 13 08, 4.01% 10/6/23 (Liquidity Facility JPMorgan Chase Bank) (c)(e)(f) | 2,520 | 2,520 | |
| Series XF 13 27, 4.01% 10/6/23 (Liquidity Facility JPMorgan Chase Bank) (c)(e)(f) | 4,000 | 4,000 | |
| Series XX 12 31, 4.01% 10/6/23 (Liquidity Facility Barclays Bank PLC) (c)(e)(f) | 1,000 | 1,000 | |
| New York City Muni. Wtr. Fin. Auth. Wtr. & Swr. Sys. Rev. Participating VRDN: | |||
| Series Floaters E 129, 4.01% 10/6/23 (Liquidity Facility Royal Bank of Canada) (c)(e)(f) | 22,800 | 22,800 | |
| Series XF 13 36, 4.01% 10/6/23 (Liquidity Facility JPMorgan Chase Bank) (c)(e)(f) | 6,200 | 6,200 | |
| Series XF 30 66, 4.01% 10/6/23 (Liquidity Facility Barclays Bank PLC) (c)(e)(f) | 2,500 | 2,500 | |
| Series XF 30 71, 4.01% 10/6/23 (Liquidity Facility Barclays Bank PLC) (c)(e)(f) | 2,670 | 2,670 | |
| New York City Transitional Fin. Auth. Rev. Participating VRDN Series Floaters XF 07 17, 4.01% 10/6/23 (Liquidity Facility Toronto-Dominion Bank) (c)(e)(f) | 4,925 | 4,925 | |
| New York Dorm. Auth. Rev. Bonds Series MS 00 09, 4.13%, tender 10/26/23 (Liquidity Facility Morgan Stanley Bank, West Valley City Utah) (c)(e)(f) | 4,200 | 4,200 | |
| New York Metropolitan Trans. Auth. Rev. Participating VRDN: | |||
| Series XF 28 78, 4.02% 10/6/23 (Liquidity Facility Barclays Bank PLC) (c)(e)(f) | 3,000 | 3,000 | |
| Series XF 30 00, 4.02% 10/6/23 (Liquidity Facility Barclays Bank PLC) (c)(e)(f) | 40,805 | 40,805 | |
| Triborough Bridge & Tunnel Auth. Participating VRDN: | |||
| Series 2022 XM 09 75, 4.01% 10/6/23 (Liquidity Facility JPMorgan Chase Bank) (c)(e)(f) | 10,400 | 10,400 | |
| Series XF 13 32, 4.01% 10/6/23 (Liquidity Facility JPMorgan Chase Bank) (c)(e)(f) | 32,625 | 32,625 | |
TOTAL NEW YORK | 152,245 | ||
| New York And New Jersey - 0.0% | |||
| Port Auth. of New York & New Jersey Participating VRDN Series Floaters XF 06 97, 4.01% 10/6/23 (Liquidity Facility Bank of America NA) (c)(e)(f) | 1,925 | 1,925 | |
| Non-State Specific - 0.1% | |||
| Monroeville Fin. Auth. UPMC Rev. Participating VRDN Series YX 11 85, 3.99% 10/6/23 (Liquidity Facility Barclays Bank PLC) (c)(e)(f) | 6,550 | 6,550 | |
| North Carolina - 0.3% | |||
| Charlotte Int'l. Arpt. Rev. Participating VRDN: | |||
| Series Floaters XG 02 07, 4.01% 10/6/23 (Liquidity Facility Bank of America NA) (c)(e)(f) | 3,500 | 3,500 | |
| Series XF 16 03, 0% 10/6/23 (Liquidity Facility Bank of America NA) (c)(e)(f) | 2,940 | 2,940 | |
| North Carolina Hsg. Fin. Agcy. Home Ownership Rev. Participating VRDN Series YX 13 16, 4.01% 10/6/23 (Liquidity Facility Barclays Bank PLC) (c)(e)(f) | 10,800 | 10,800 | |
| North Carolina Med. Care Commission Health Care Facilities Rev. Participating VRDN Series XF 13 52, 4.01% 10/6/23 (Liquidity Facility JPMorgan Chase Bank) (c)(e)(f) | 2,500 | 2,500 | |
TOTAL NORTH CAROLINA | 19,740 | ||
| Ohio - 0.8% | |||
| Allen County Hosp. Facilities Rev. Participating VRDN: | |||
| Series Floaters E 134, 4.01% 10/6/23 (Liquidity Facility Royal Bank of Canada) (c)(e)(f) | 8,010 | 8,010 | |
| Series Floaters XF 25 16, 4.07% 10/6/23 (Liquidity Facility Toronto-Dominion Bank) (c)(e)(f) | 3,600 | 3,600 | |
| Berea Ohio City School District Participating VRDN Series RBC G 54, 3.83% 10/6/23 (Liquidity Facility Royal Bank of Canada) (c)(e)(f) | 2,400 | 2,400 | |
| Brunswick Ohio City School District Participating VRDN Series XF 15 47, 4.01% 10/6/23 (Liquidity Facility Royal Bank of Canada) (c)(e)(f) | 2,750 | 2,750 | |
| Cuyahoga County Ctfs. of Prtn. Participating VRDN Series Floaters XG 02 06, 4.08% 10/6/23 (Liquidity Facility Bank of America NA) (c)(e)(f) | 955 | 955 | |
| Cuyahoga County Hosp. Rev. Participating VRDN Series Floater BAML 23 5043, 4.06% 10/6/23 (Liquidity Facility Bank of America NA) (c)(e)(f) | 2,900 | 2,900 | |
| Franklin County Hosp. Facilities Rev. Participating VRDN Series XG 05 07, 4.01% 10/6/23 (Liquidity Facility Royal Bank of Canada) (c)(e)(f) | 2,810 | 2,810 | |
| Hamilton County Hosp. Facilities Rev. Participating VRDN: | |||
| Series XG 04 22, 4.01% 10/6/23 (Liquidity Facility Royal Bank of Canada) (c)(e)(f) | 2,535 | 2,535 | |
| Series XG 05 25, 4.01% 10/6/23 (Liquidity Facility Royal Bank of Canada) (c)(e)(f) | 6,775 | 6,775 | |
| Montgomery County Hosp. Rev. Participating VRDN Series Floaters E 132, 4.01% 10/6/23 (Liquidity Facility Royal Bank of Canada) (c)(e)(f) | 14,685 | 14,685 | |
| Ohio Higher Edl. Facility Commission Rev. Participating VRDN Series XF 31 14, 4.01% 10/6/23 (Liquidity Facility Morgan Stanley Bank, West Valley City Utah) (c)(e)(f) | 2,875 | 2,875 | |
| Ohio Hosp. Rev. Participating VRDN Series C18, 4.02% 10/6/23 (Liquidity Facility Royal Bank of Canada) (c)(e)(f) | 2,100 | 2,100 | |
| Ohio Hsg. Fin. Agcy. Residential Mtg. Rev. Participating VRDN: | |||
| Series Floaters XF 27 11, 4.01% 10/6/23 (Liquidity Facility Morgan Stanley Bank, West Valley City Utah) (c)(e)(f) | 3,955 | 3,955 | |
| Series XF 31 45, 4.01% 10/6/23 (Liquidity Facility Wells Fargo Bank NA) (c)(e)(f) | 3,200 | 3,200 | |
TOTAL OHIO | 59,550 | ||
| Oklahoma - 0.1% | |||
| Edmond Pub. Works Auth. Sales Tax & Util. Sys. Rev. Participating VRDN Series Floaters XM 05 59, 4.01% 10/6/23 (Liquidity Facility Morgan Stanley Bank, West Valley City Utah) (c)(e)(f) | 5,450 | 5,450 | |
| Oklahoma Dev. Fin. Auth. Health Sys. Rev. Participating VRDN Series E 140, 4.01% 10/6/23 (Liquidity Facility Royal Bank of Canada) (c)(e)(f) | 3,300 | 3,300 | |
TOTAL OKLAHOMA | 8,750 | ||
| Oregon - 0.2% | |||
| Beaverton School District Participating VRDN Series 2022 XF 14 19, 4.01% 10/6/23 (Liquidity Facility JPMorgan Chase Bank) (c)(e)(f) | 6,230 | 6,230 | |
| Multnomah County School District #1J Portland Participating VRDN Series XF 15 30, 4.01% 10/6/23 (Liquidity Facility JPMorgan Chase Bank) (c)(e)(f) | 10,135 | 10,135 | |
TOTAL OREGON | 16,365 | ||
| Pennsylvania - 0.9% | |||
| Commonwealth Fing. Auth. Tobacco Participating VRDN: | |||
| Series XL 00 60, 4.02% 10/6/23 (Liquidity Facility Barclays Bank PLC) (c)(e)(f) | 3,150 | 3,150 | |
| Series XX 10 80, 4.02% 10/6/23 (Liquidity Facility Barclays Bank PLC) (c)(e)(f) | 1,800 | 1,800 | |
| Cumberland County Muni. Auth. Rev. Participating VRDN Series YX 12 73, 4.02% 10/6/23 (Liquidity Facility Barclays Bank PLC) (c)(e)(f) | 5,985 | 5,985 | |
| Geisinger Auth. Health Sys. Rev. Participating VRDN: | |||
| Series XG 04 68, 4.01% 10/6/23 (Liquidity Facility Wells Fargo Bank NA) (c)(e)(f) | 6,760 | 6,760 | |
| Series XM 08 87, 4.18% 10/6/23 (Liquidity Facility JPMorgan Chase Bank) (c)(e)(f) | 2,125 | 2,125 | |
| Lehigh County Gen. Purp. Hosp. Rev. Participating VRDN Series BAML 23 50 39, 4.06% 11/3/23 (Liquidity Facility Bank of America NA) (c)(e)(f) | 2,900 | 2,900 | |
| Pennsylvania Higher Edl. Facilities Auth. Rev. Participating VRDN Series XG 02 63, 4.01% 10/6/23 (Liquidity Facility Bank of America NA) (c)(e)(f) | 7,840 | 7,840 | |
| Pennsylvania State Univ. Participating VRDN Series XM 08 27, 4.01% 10/6/23 (Liquidity Facility JPMorgan Chase Bank) (c)(e)(f) | 2,700 | 2,700 | |
| Pennsylvania Tpk. Commission Tpk. Rev. Participating VRDN: | |||
| Series XM 10 08, 4.01% 10/6/23 (Liquidity Facility Royal Bank of Canada) (c)(e)(f) | 835 | 835 | |
| Series XX 10 44, 4.02% 10/6/23 (Liquidity Facility Barclays Bank PLC) (c)(e)(f) | 6,365 | 6,365 | |
| Philadelphia Wtr. & Wastewtr. Rev. Participating VRDN: | |||
| Series 2017, 4.02% 10/6/23 (Liquidity Facility Barclays Bank PLC) (c)(e)(f) | 6,320 | 6,320 | |
| Series Floaters XF 07 19, 4.01% 10/6/23 (Liquidity Facility Royal Bank of Canada) (c)(e)(f) | 2,000 | 2,000 | |
| Series XF 16 06, 4.03% 10/6/23 (Liquidity Facility Toronto-Dominion Bank) (c)(e)(f) | 4,400 | 4,400 | |
| Southcentral Pennsylvania Gen. Auth. Rev. Participating VRDN Series XL 01 04, 4.01% 10/6/23 (Liquidity Facility Morgan Stanley Bank, West Valley City Utah) (c)(e)(f) | 4,320 | 4,320 | |
| Southeastern Pennsylvania Trans. Auth. Rev. Participating VRDN Series 2022 XG 04 12, 4.01% 10/6/23 (Liquidity Facility Royal Bank of Canada) (c)(e)(f) | 3,115 | 3,115 | |
TOTAL PENNSYLVANIA | 60,615 | ||
| Rhode Island - 0.0% | |||
| Rhode Island Health and Edl. Bldg. Corp. Higher Ed. Facility Rev. Participating VRDN Series Floaters XM 07 21, 4.01% 10/6/23 (Liquidity Facility Wells Fargo Bank NA) (c)(e)(f) | 2,865 | 2,865 | |
| South Carolina - 1.0% | |||
| Lancaster County School District Participating VRDN Series XF 25 28, 4.01% 10/6/23 (Liquidity Facility Morgan Stanley Bank, West Valley City Utah) (c)(e)(f) | 9,415 | 9,415 | |
| South Carolina Jobs-Econ. Dev. Auth. Participating VRDN Series XF 15 31, 4.03% 10/6/23 (Liquidity Facility Toronto-Dominion Bank) (c)(e)(f) | 4,635 | 4,635 | |
| South Carolina Pub. Svc. Auth. Rev. Participating VRDN: | |||
| Series 2017 XF 2425, 4.02% 10/6/23 (Liquidity Facility Barclays Bank PLC) (c)(e)(f) | 22,815 | 22,815 | |
| Series XF 15 48, 4.01% 10/6/23 (Liquidity Facility Royal Bank of Canada) (c)(e)(f) | 3,000 | 3,000 | |
| Series YX 12 69, 4.02% 10/6/23 (Liquidity Facility Barclays Bank PLC) (c)(e)(f) | 4,000 | 4,000 | |
| South Carolina Trans. Infrastructure Bank Rev.: | |||
| Bonds Series Floaters G 109, 4.18%, tender (c)(d)(e)(f) | 1,790 | 1,790 | |
| Participating VRDN Series Floaters XM 06 91, 4.01% 10/6/23 (Liquidity Facility JPMorgan Chase Bank) (c)(e)(f) | 27,035 | 27,035 | |
TOTAL SOUTH CAROLINA | 72,690 | ||
| South Dakota - 0.1% | |||
| South Dakota Health & Edl. Facilities Auth. Rev. Participating VRDN Series 2022 XF 14 09, 4.01% 10/6/23 (Liquidity Facility Royal Bank of Canada) (c)(e)(f) | 5,625 | 5,625 | |
| Tennessee - 0.2% | |||
| Greeneville Health & Edl. Facilities Board Participating VRDN: | |||
| Series Floaters XF 25 76, 4.02% 10/6/23 (Liquidity Facility Barclays Bank PLC) (c)(e)(f) | 6,700 | 6,700 | |
| Series Floaters XG 01 94, 4.02% 10/6/23 (Liquidity Facility Royal Bank of Canada) (c)(e)(f) | 5,535 | 5,535 | |
| Metropolitan Govt. Nashville & Davidson County Sports Auth. Rev. Participating VRDN Series XG 05 17, 4.01% 10/6/23 (Liquidity Facility Royal Bank of Canada) (c)(e)(f) | 2,000 | 2,000 | |
| Tennessee Gen. Oblig. Participating VRDN Series XF 08 04, 4.01% 10/6/23 (Liquidity Facility JPMorgan Chase Bank) (c)(e)(f) | 1,690 | 1,690 | |
TOTAL TENNESSEE | 15,925 | ||
| Texas - 2.6% | |||
| Aldine Independent School District Participating VRDN Series Floaters XL 00 87, 4.01% 10/6/23 (Liquidity Facility Wells Fargo Bank NA) (c)(e)(f) | 6,600 | 6,600 | |
| Austin Elec. Util. Sys. Rev. Participating VRDN Series XF 31 12, 4.01% 10/6/23 (Liquidity Facility Barclays Bank PLC) (c)(e)(f) | 8,000 | 8,000 | |
| Crowley Independent School Dis Participating VRDN Series XG 05 13, 4.01% 10/6/23 (Liquidity Facility Bank of America NA) (c)(e)(f) | 2,000 | 2,000 | |
| Dallas Wtrwks. & Swr. Sys. Rev. Participating VRDN Series XF 27 28, 4.01% 10/6/23 (Liquidity Facility JPMorgan Chase Bank) (c)(e)(f) | 6,395 | 6,395 | |
| Denton Independent School District Participating VRDN: | |||
| Series XF 15 52, 4.03% 10/6/23 (Liquidity Facility Toronto-Dominion Bank) (c)(e)(f) | 4,000 | 4,000 | |
| Series XF 31 28, 4% 10/6/23 (Liquidity Facility UBS AG) (c)(e)(f) | 4,000 | 4,000 | |
| Series XF 31 39, 4.01% 10/6/23 (Liquidity Facility Barclays Bank PLC) (c)(e)(f) | 6,000 | 6,000 | |
| El Paso Wtr. & Swr. Rev. Bonds: | |||
| Series 2022 MS 00 10, 4.15%, tender 10/5/23 (Liquidity Facility Morgan Stanley Bank, West Valley City Utah) (c)(e)(f) | 11,800 | 11,800 | |
| Series G 124, 4.18%, tender 3/1/24 (Liquidity Facility Royal Bank of Canada) (c)(d)(e)(f)(g) | 2,305 | 2,305 | |
| Forney Independent School District Participating VRDN Series 2022 XL 03 62, 4.01% 10/6/23 (Liquidity Facility Bank of America NA) (c)(e)(f) | 3,120 | 3,120 | |
| Goose Creek Consolidated Independent School District Participating VRDN Series XM 10 56, 4.01% 10/6/23 (Liquidity Facility Morgan Stanley Bank, West Valley City Utah) (c)(e)(f) | 3,750 | 3,750 | |
| Harris County Health Facilities Dev. Corp. Rev. Participating VRDN Series 16 ZF 03 12, 4.01% 10/6/23 (Liquidity Facility JPMorgan Chase Bank) (c)(e)(f) | 8,430 | 8,430 | |
| Katy Independent School District Participating VRDN Series XF 31 16, 4.01% 10/6/23 (Liquidity Facility Barclays Bank PLC) (c)(e)(f) | 8,000 | 8,000 | |
| Lamar Consolidated Independent School District Participating VRDN: | |||
| Series XF 15 67, 4.03% 10/6/23 (Liquidity Facility Toronto-Dominion Bank) (c)(e)(f) | 2,350 | 2,350 | |
| Series XF 31 31, 4.01% 10/6/23 (Liquidity Facility Barclays Bank PLC) (c)(e)(f) | 7,000 | 7,000 | |
| New Braunfels Independent School District Participating VRDN Series 2022 XM 10 63, 4.01% 10/6/23 (Liquidity Facility Bank of America NA) (c)(e)(f) | 1,250 | 1,250 | |
| New Hope Cultural Ed. Facilities Fin. Corp. Participating VRDN Series Floaters XF 07 10, 4.01% 10/6/23 (Liquidity Facility JPMorgan Chase Bank) (c)(e)(f) | 3,985 | 3,985 | |
| North Ft. Bend Wtr. Auth. Participating VRDN Series 2022 XF 30 23, 4.01% 10/6/23 (Liquidity Facility Wells Fargo Bank NA) (c)(e)(f) | 7,620 | 7,620 | |
| Northwest Independent School District Participating VRDN Series XF 15 76, 4.01% 10/6/23 (Liquidity Facility Royal Bank of Canada) (c)(e)(f) | 4,550 | 4,550 | |
| Red Oak Independent School District Participating VRDN Series XG 05 12, 4.01% 10/6/23 (Liquidity Facility Bank of America NA) (c)(e)(f) | 3,385 | 3,385 | |
| San Antonio Wtr. Sys. Rev. Participating VRDN: | |||
| Series XF 14 47, 4.01% 10/6/23 (Liquidity Facility Bank of America NA) (c)(e)(f) | 2,000 | 2,000 | |
| Series XF 31 36, 4.01% 10/6/23 (Liquidity Facility Barclays Bank PLC) (c)(e)(f) | 6,605 | 6,605 | |
| Spring Tex Independent School District Participating VRDN Series XF 30 89, 4.01% 10/6/23 (Liquidity Facility Barclays Bank PLC) (c)(e)(f) | 4,630 | 4,630 | |
| Tarrant County Cultural Ed. Facilities Fin. Corp. Hosp. Rev. Participating VRDN: | |||
| Series 16 XF0411, 4.01% 10/6/23 (Liquidity Facility JPMorgan Chase Bank) (c)(e)(f) | 2,000 | 2,000 | |
| Series E 141, 4.01% 10/6/23 (Liquidity Facility Royal Bank of Canada) (c)(e)(f) | 10,320 | 10,320 | |
| Series XL 03 60, 4.01% 10/6/23 (Liquidity Facility Wells Fargo Bank NA) (c)(e)(f) | 2,745 | 2,745 | |
| Tarrant County Cultural Ed. Facilities Fin. Corp. Rev. Participating VRDN: | |||
| Series 2021 E1 50, 4.01% 10/6/23 (Liquidity Facility Royal Bank of Canada) (c)(e)(f) | 4,000 | 4,000 | |
| Series Floaters XM 06 98, 4.02% 10/6/23 (Liquidity Facility UBS AG) (c)(e)(f) | 2,785 | 2,785 | |
| Texas Wtr. Dev. Board Rev. Participating VRDN: | |||
| Series 2022 XM 1066, 4% 10/6/23 (Liquidity Facility Citibank NA) (c)(e)(f) | 9,380 | 9,380 | |
| Series Floaters XF 07 13, 4.01% 10/6/23 (Liquidity Facility Toronto-Dominion Bank) (c)(e)(f) | 4,400 | 4,400 | |
| Series Floaters XF 25 57, 4.03% 10/6/23 (Liquidity Facility Toronto-Dominion Bank) (c)(e)(f) | 5,600 | 5,600 | |
| Series Floaters XF 27 30, 4.01% 10/6/23 (Liquidity Facility JPMorgan Chase Bank) (c)(e)(f) | 4,310 | 4,310 | |
| Series Floaters XG 02 11, 4.01% 10/6/23 (Liquidity Facility Bank of America NA) (c)(e)(f) | 10,000 | 10,000 | |
| Series XM 10 82, 4.01% 10/6/23 (Liquidity Facility JPMorgan Chase Bank) (c)(e)(f) | 5,000 | 5,000 | |
| Waxahachie Independent School District Participating VRDN Series XF 15 53, 4.03% 10/6/23 (Liquidity Facility Toronto-Dominion Bank) (c)(e)(f) | 4,560 | 4,560 | |
| Ysleta Tex Independent School District Participating VRDN Series XF 13 38, 4.01% 10/6/23 (Liquidity Facility Bank of America NA) (c)(e)(f) | 2,000 | 2,000 | |
TOTAL TEXAS | 184,875 | ||
| Utah - 0.0% | |||
| Utah County Hosp. Rev. Participating VRDN Series XM 10 03, 4.01% 10/6/23 (Liquidity Facility JPMorgan Chase Bank) (c)(e)(f) | 2,435 | 2,435 | |
| Virginia - 0.6% | |||
| Chesapeake Bay Bridge and Tunnel District Gen. Resolution Rev. Participating VRDN Series XF 30 64, 4.02% 10/6/23 (Liquidity Facility Barclays Bank PLC) (c)(e)(f) | 4,200 | 4,200 | |
| Fairfax County Indl. Dev. Auth. Participating VRDN Series Floaters XG 01 91, 4.01% 10/6/23 (Liquidity Facility Morgan Stanley Bank, West Valley City Utah) (c)(e)(f) | 7,678 | 7,678 | |
| Hampton Roads Trans. Accountability Commission Participating VRDN Series ZL 02 67, 4.01% 10/6/23 (Liquidity Facility Wells Fargo Bank NA) (c)(e)(f) | 2,250 | 2,250 | |
| Norfolk Econ. Dev. Health Care Facilities Participating VRDN Series 2022 C20, 4.02% 10/6/23 (Liquidity Facility Royal Bank of Canada) (c)(e)(f) | 5,000 | 5,000 | |
| Roanoke Econ. Dev. Authority. Participating VRDN Series 20 XG 02 97, 4.01% 10/6/23 (Liquidity Facility Royal Bank of Canada) (c)(e)(f) | 1,395 | 1,395 | |
| Suffolk Econ. Dev. Auth. Hosp. Facilities Rev. Participating VRDN Series MIZ 90 25, 4.08% 10/6/23 (Liquidity Facility Mizuho Cap. Markets LLC) (c)(e)(f) | 7,835 | 7,835 | |
| Univ. of Virginia Gen. Rev. Participating VRDN Series XG 04 08, 4.01% 10/6/23 (Liquidity Facility Morgan Stanley Bank, West Valley City Utah) (c)(e)(f) | 3,375 | 3,375 | |
| Virginia Commonwealth Trans. Board Rev. Participating VRDN Series Floaters XF 06 59, 4.01% 10/6/23 (Liquidity Facility Royal Bank of Canada) (c)(e)(f) | 6,035 | 6,035 | |
| Williamsburg Econ. Dev. Participating VRDN Series XF 15 46, 4.01% 10/6/23 (Liquidity Facility Royal Bank of Canada) (c)(e)(f) | 4,050 | 4,050 | |
TOTAL VIRGINIA | 41,818 | ||
| Washington - 1.1% | |||
| Central Puget Sound Reg'l. Trans. Auth. Sales & Use Tax Rev.: | |||
| Bonds Series G 123, 4.18%, tender 11/1/23 (Liquidity Facility Royal Bank of Canada) (c)(d)(e)(f) | 1,560 | 1,560 | |
| Participating VRDN Series XM 11 01, 3.99% 10/6/23 (Liquidity Facility Citibank NA) (c)(e)(f) | 4,200 | 4,200 | |
| CommonSpirit Health Participating VRDN Series XF 1017, 4.02% 10/6/23 (Liquidity Facility Barclays Bank PLC) (c)(e)(f) | 6,000 | 6,000 | |
| Multicare Health Sys. Participating VRDN Series E 153, 4.01% 10/6/23 (Liquidity Facility Royal Bank of Canada) (c)(e)(f) | 20,940 | 20,940 | |
| Washington Convention Ctr. Pub. Facilities Participating VRDN: | |||
| Series 2022 XX 12 38, 4.02% 10/6/23 (Liquidity Facility Barclays Bank PLC) (c)(e)(f) | 19,715 | 19,715 | |
| Series XG 02 87, 4.02% 10/6/23 (Liquidity Facility Barclays Bank PLC) (c)(e)(f) | 2,100 | 2,100 | |
| Washington Health Care Facilities Auth. Rev. Participating VRDN: | |||
| Series 15 XF0132, 4.08% 10/4/23 (Liquidity Facility JPMorgan Chase Bank) (c)(e)(f) | 7,225 | 7,225 | |
| Series 2015 XF0150, 4.08% 10/6/23 (Liquidity Facility Bank of America NA) (c)(e)(f) | 2,675 | 2,675 | |
| Series XF 15 14, 4.03% 10/6/23 (Liquidity Facility Toronto-Dominion Bank) (c)(e)(f) | 4,015 | 4,015 | |
| Series XF 30 62, 4.02% 10/6/23 (Liquidity Facility Barclays Bank PLC) (c)(e)(f) | 1,300 | 1,300 | |
| Series XG 04 75, 4.03% 10/6/23 (Liquidity Facility Toronto-Dominion Bank) (c)(e)(f) | 2,790 | 2,790 | |
| Series XG 04 81, 4.03% 10/6/23 (Liquidity Facility Toronto-Dominion Bank) (c)(e)(f) | 3,905 | 3,905 | |
| Series YX 12 10, 4.08% 10/6/23 (Liquidity Facility Barclays Bank PLC) (c)(e)(f) | 4,590 | 4,590 | |
TOTAL WASHINGTON | 81,015 | ||
| West Virginia - 0.1% | |||
| West Virginia Hosp. Fin. Auth. Hosp. Rev. Participating VRDN Series XF 15 37, 4.03% 10/6/23 (Liquidity Facility Toronto-Dominion Bank) (c)(e)(f) | 5,525 | 5,525 | |
| Wisconsin - 0.5% | |||
| Univ. of Wisconsin Hosp. & Clinics Auth. Participating VRDN Series XL 02 96, 4.01% 10/6/23 (Liquidity Facility Morgan Stanley Bank, West Valley City Utah) (c)(e)(f) | 4,000 | 4,000 | |
| Wisconsin Health & Edl. Facilities Participating VRDN: | |||
| Series Floaters XF 07 41, 4.01% 10/6/23 (Liquidity Facility JPMorgan Chase Bank) (c)(e)(f) | 6,820 | 6,820 | |
| Series Floaters XF 25 41, 4.01% 10/6/23 (Liquidity Facility JPMorgan Chase Bank) (c)(e)(f) | 10,000 | 10,000 | |
| Wisconsin Health & Edl. Facilities Auth. Rev. Participating VRDN Series BAML 50 35, 4.55% 10/2/23 (Liquidity Facility Bank of America NA) (c)(e)(f) | 11,790 | 11,790 | |
TOTAL WISCONSIN | 32,610 | ||
| TOTAL TENDER OPTION BOND (Cost $1,767,893) | 1,767,893 | ||
| Other Municipal Security - 18.5% | |||
Principal Amount (a) (000s) | Value ($) (000s) | ||
| Guam - 0.0% | |||
| Guam Int'l. Arpt. Auth. Rev. Bonds Series 2013 B, 5.75% 10/1/23 (Pre-Refunded to 10/1/23 @ 100) | 225 | 225 | |
| Alabama - 0.7% | |||
| Black Belt Energy Gas District Bonds Series 2018 A, 4%, tender 11/30/23 (c) | 31,935 | 31,934 | |
| Huntsville Health Care Auth. Rev. Series 2023, 3.51% 11/9/23, CP | 20,200 | 20,200 | |
TOTAL ALABAMA | 52,134 | ||
| Alaska - 0.1% | |||
| Anchorage Gen. Oblig. TAN Series 2023, 4.25% 12/15/23 | 7,925 | 7,940 | |
| Arizona - 0.1% | |||
| Arizona Indl. Dev. Auth. Hosp. Rev. Bonds Series 2021 A, 5% 2/1/24 | 1,300 | 1,305 | |
| Phoenix Civic Impt. Board Arpt. Rev. Bonds Series 2017 D, 5% 7/1/24 | 425 | 429 | |
| Salt River Proj. Agricultural Impt. & Pwr. District Elec. Sys. Rev. Series 2023 C, 3.48% 10/3/23, CP | 4,900 | 4,900 | |
TOTAL ARIZONA | 6,634 | ||
| Colorado - 0.1% | |||
| Colorado Ctfs. of Prtn. Bonds: | |||
| Series 2020 A, 5% 12/15/23 | 1,165 | 1,167 | |
| Series 2021 A, 5% 12/15/23 | 1,490 | 1,494 | |
| Colorado Ed. Ln. Prog. TRAN Series 2023 A, 5% 6/28/24 | 415 | 419 | |
| Colorado Health Facilities Auth. Rev. Bonds Series 2013 A, 5.75% 12/1/23 (Pre-Refunded to 12/1/23 @ 100) | 615 | 617 | |
| Denver City & County Arpt. Rev. Bonds Series 2016 A, 5% 11/15/23 | 655 | 656 | |
TOTAL COLORADO | 4,353 | ||
| Connecticut - 0.6% | |||
| Connecticut Gen. Oblig. Bonds Series 2013 A, 5% 10/15/23 (Escrowed to Maturity) | 5,355 | 5,358 | |
| Danbury Gen. Oblig. BAN Series 2023, 5% 1/24/24 | 22,200 | 22,290 | |
| Stratford Gen. Oblig. BAN Series 2023, 4.5% 10/3/23 | 14,385 | 14,386 | |
TOTAL CONNECTICUT | 42,034 | ||
| District Of Columbia - 0.2% | |||
| District of Columbia Gen. Oblig. Bonds Series 2019 A, 5% 10/15/23 | 530 | 530 | |
| District of Columbia Wtr. & Swr. Auth. Pub. Util. Rev. Bonds Series 2013 A: | |||
| 5% 10/1/23 (Pre-Refunded to 10/1/23 @ 100) | 6,860 | 6,860 | |
| 5% 10/1/23 (Pre-Refunded to 10/1/23 @ 100) | 3,500 | 3,500 | |
TOTAL DISTRICT OF COLUMBIA | 10,890 | ||
| Florida - 0.8% | |||
| Broward County Arpt. Sys. Rev. Bonds Series 2013 C: | |||
| 5.25% 10/1/23 (Pre-Refunded to 10/1/23 @ 100) | 7,300 | 7,300 | |
| 5.25% 10/1/23 (Pre-Refunded to 10/1/23 @ 100) | 655 | 655 | |
| Broward County School Board Ctfs. of Prtn. Bonds Series 2015 A, 5% 7/1/24 | 1,295 | 1,306 | |
| Florida Local Govt. Fin. Cmnty. Series 2023 A1: | |||
| 3.6% 10/4/23, LOC JPMorgan Chase Bank, CP | 14,600 | 14,600 | |
| 3.65% 11/2/23, LOC JPMorgan Chase Bank, CP | 9,600 | 9,600 | |
| Martin County Health Facilities Bonds Series 2015, 5% 11/15/23 (Escrowed to Maturity) | 1,000 | 1,002 | |
| Miami-Dade County Bonds Series 2013 A: | |||
| 5.5% 10/1/23 (Pre-Refunded to 10/1/23 @ 100) | 4,455 | 4,455 | |
| 5.75% 10/1/23 (Pre-Refunded to 10/1/23 @ 100) | 1,500 | 1,500 | |
| Miami-Dade County School Board Ctfs. of Prtn. Bonds Series 2015 A, 5% 5/1/24 | 4,000 | 4,023 | |
| Miami-Dade County Wtr. & Swr. Rev. Bonds Series 2013 B, 5% 10/1/23 (Pre-Refunded to 10/1/23 @ 100) | 5,000 | 5,000 | |
| Polk County Indl. Dev. Auth. Health Sys. Rev. Bonds: | |||
| Series 2014 A, SIFMA Municipal Swap Index + 0.300% 4.28%, tender 4/26/24 (c)(g) | 1,000 | 1,000 | |
| Series 2014 A1, SIFMA Municipal Swap Index + 0.250% 4.23%, tender 4/26/24 (c)(g) | 3,800 | 3,800 | |
| Tampa Health Sys. Rev. Bonds Series 2012 B, SIFMA Municipal Swap Index + 0.300% 4.28%, tender 4/26/24 (c)(g) | 5,300 | 5,300 | |
TOTAL FLORIDA | 59,541 | ||
| Georgia - 0.1% | |||
| Atlanta Wtr. & Wastewtr. Rev. Bonds Series 2013 B, 5% 11/1/23 | 700 | 701 | |
| Cobb County School District TAN Series 2023, 4% 12/14/23 | 790 | 790 | |
| Fayette County Hosp. Auth. Rev. Bonds (Piedmont Healthcare, Inc. Proj.) Series 2019 A, 5%, tender 7/1/24 (c) | 2,000 | 2,010 | |
| Fulton County Gen. Oblig. TAN Series 2023, 5% 12/29/23 | 1,470 | 1,475 | |
| Houston County Hosp. Auth. Rev. Bonds Series 2016 B, 5% 4/1/24 (Pre-Refunded to 4/1/24 @ 100) (c) | 2,500 | 2,500 | |
TOTAL GEORGIA | 7,476 | ||
| Hawaii - 0.0% | |||
| Hawaii Gen. Oblig. Bonds Series 2016 FH, 5% 10/1/23 | 1,400 | 1,400 | |
| Honolulu City & County Gen. Oblig. Bonds Series 2015 A, 5% 10/1/23 | 1,000 | 1,000 | |
TOTAL HAWAII | 2,400 | ||
| Illinois - 1.2% | |||
| Chicago Metropolitan Wtr. Reclamation District of Greater Chicago Bonds: | |||
| Series 2016 B, 5% 12/1/23 | 2,370 | 2,375 | |
| Series 2021 C, 5% 12/1/23 | 1,975 | 1,977 | |
| Cook County Gen. Oblig. Bonds: | |||
| Series 2013 B, 5% 11/15/23 | 1,000 | 1,002 | |
| Series 2016 A, 5% 11/15/23 | 725 | 726 | |
| Illinois Fin. Auth. Rev. Bonds: | |||
| (Advocate Health Care Network Proj.) Series 2011 B, SIFMA Municipal Swap Index + 0.300% 4.31%, tender 4/26/24 (c)(g) | 600 | 600 | |
| Series 2016 A, 5% 8/15/24 (Escrowed to Maturity) | 2,185 | 2,211 | |
| Series 2016 C, 5% 2/15/24 | 3,925 | 3,944 | |
| Illinois Gen. Oblig. Bonds: | |||
| Series 2014, 5% 2/1/24 | 400 | 401 | |
| Series 2016: | |||
5% 2/1/24 | 5,300 | 5,314 | |
5% 6/1/24 | 1,975 | 1,989 | |
| Series 2017 B, 5% 12/1/23 | 1,000 | 1,002 | |
| Series 2017 D, 5% 11/1/23 | 25,405 | 25,423 | |
| Series 2018 A: | |||
4% 5/1/24 | 660 | 661 | |
5% 10/1/23 | 2,000 | 2,000 | |
| Series 2021 A, 5% 3/1/24 | 2,250 | 2,261 | |
| Series 2021 C, 4% 3/1/24 | 2,900 | 2,904 | |
| Series 2022 A, 5% 3/1/24 | 2,475 | 2,488 | |
| Series 2022 B, 5% 3/1/24 | 1,150 | 1,155 | |
| Series 2023 C, 5% 5/1/24 | 1,125 | 1,134 | |
| Series 2023 D, 5% 7/1/24 | 1,500 | 1,514 | |
| Illinois Hsg. Dev. Auth. Bonds Series 2023 G, 3.5%, tender 6/4/24 (c) | 18,600 | 18,600 | |
| Illinois Toll Hwy. Auth. Toll Hwy. Rev. Bonds: | |||
| Series 2014 D, 5% 1/1/24 | 4,800 | 4,811 | |
| Series 2018 A, 5% 1/1/24 | 775 | 776 | |
| Southwestern Dev. Auth. Heath Facility Rev. Bonds Series 2013, 7.125% 11/1/23 (Pre-Refunded to 11/1/23 @ 100) | 2,570 | 2,577 | |
TOTAL ILLINOIS | 87,845 | ||
| Kansas - 0.1% | |||
| Wichita Gen. Oblig. BAN: | |||
| Series 2023 312, 5% 10/13/23 | 7,100 | 7,104 | |
| Series 310, 5% 10/13/23 | 1,000 | 1,000 | |
TOTAL KANSAS | 8,104 | ||
| Kentucky - 0.3% | |||
| Kentucky Asset/Liability Commission Gen. Fund Rev. Bonds Series 2021 A, 5% 11/1/23 | 2,410 | 2,412 | |
| Kentucky State Property & Buildings Commission Rev. Bonds: | |||
| Series 2013 A: | |||
5% 10/1/23 (Pre-Refunded to 10/1/23 @ 100) | 1,250 | 1,250 | |
5% 10/1/23 (Pre-Refunded to 10/1/23 @ 100) | 2,155 | 2,155 | |
5% 10/1/23 (Pre-Refunded to 10/1/23 @ 100) | 2,100 | 2,100 | |
5% 10/1/23 (Pre-Refunded to 10/1/23 @ 100) | 2,500 | 2,500 | |
5% 10/1/23 (Pre-Refunded to 10/1/23 @ 100) | 3,100 | 3,100 | |
| Series 2015, 5% 8/1/24 | 1,850 | 1,870 | |
| Series B, 5% 8/1/24 | 2,645 | 2,674 | |
TOTAL KENTUCKY | 18,061 | ||
| Massachusetts - 0.6% | |||
| Ashland Gen. Oblig. BAN Series 2023, 5% 10/10/24 (h) | 8,788 | 8,888 | |
| Boston Wtr. & Swr. Commission Rev. Series 2023 A, 3.53% 11/14/23, LOC TD Banknorth, NA, CP | 19,600 | 19,600 | |
| Chicopee Gen. Oblig. BAN Series 2023, 5% 6/13/24 | 3,929 | 3,962 | |
| Scituate Gen. Oblig. BAN Series 2023, 4.5% 12/15/23 | 5,565 | 5,573 | |
| Southbridge BAN Series 2023, 5% 5/31/24 | 5,000 | 5,042 | |
TOTAL MASSACHUSETTS | 43,065 | ||
| Michigan - 0.5% | |||
| Kent Hosp. Fin. Auth. Hosp. Facilities Rev. Bonds (Spectrum Health Sys. Proj.) Series 2015 A, SIFMA Municipal Swap Index + 0.250% 4.23%, tender 4/26/24 (c)(g) | 2,815 | 2,815 | |
| Michigan Bldg. Auth. Rev. Series 2023, 3.48% 10/5/23, LOC JPMorgan Chase Bank, CP | 25,600 | 25,600 | |
| Michigan Fin. Auth. Rev. Bonds Series 2022 A, 5% 4/15/24 | 490 | 493 | |
| Royal Oak Hosp. Fin. Auth. Hosp. Rev. Bonds Series 2014 D, 5% 3/1/24 (Pre-Refunded to 3/1/24 @ 100) | 410 | 411 | |
| Univ. of Michigan Rev. Series 2023 L1, 3.5% 10/4/23, CP | 8,400 | 8,400 | |
TOTAL MICHIGAN | 37,719 | ||
| Minnesota - 0.5% | |||
| Minneapolis Gen. Oblig. Bonds Series 2023, 5.5% 12/1/23 (h) | 17,020 | 17,068 | |
| Minnesota Gen. Oblig. Bonds Series 2013 E, 5% 10/1/23 | 1,575 | 1,575 | |
| Univ. of Minnesota Gen. Oblig. Series 2023, 3.62% 10/10/23, CP | 17,400 | 17,400 | |
TOTAL MINNESOTA | 36,043 | ||
| Montana - 0.0% | |||
| Montana Board of Regents Higher Ed. Rev. Bonds Series 2013 A, 5% 11/15/23 (Pre-Refunded to 11/15/23 @ 100) | 500 | 501 | |
| Nebraska - 0.4% | |||
| Omaha Pub. Pwr. District Elec. Rev.: | |||
| Series 2023 A: | |||
3.35% 10/3/23, CP | 4,200 | 4,200 | |
3.42% 10/10/23, CP | 4,950 | 4,950 | |
3.65% 12/6/23, CP | 5,750 | 5,750 | |
3.75% 11/28/23, CP | 9,700 | 9,700 | |
| Series 2023, 3.7% 11/28/23, CP | 6,200 | 6,200 | |
TOTAL NEBRASKA | 30,800 | ||
| Nevada - 0.0% | |||
| Clark County School District Bonds: | |||
| Series 2016 A, 5% 6/15/24 | 400 | 404 | |
| Series 2020 A, 3% 6/15/24 | 575 | 572 | |
TOTAL NEVADA | 976 | ||
| New Jersey - 2.5% | |||
| Beachwood BAN Series 2023 A, 5% 2/28/24 | 4,700 | 4,726 | |
| Bergen County Impt. Auth. Rev. Bonds Series 2023, 4.5% 5/31/24 (Bergen County Gen. Oblig. Guaranteed) | 15,800 | 15,902 | |
| Branchburg Township BAN Series 2023, 5% 10/10/24 (h) | 6,300 | 6,368 | |
| Brick Township Gen. Oblig. BAN Series 2023, 5% 6/12/24 | 11,233 | 11,335 | |
| East Brunswick Township Gen. Oblig. BAN Series 2023, 5% 7/17/24 | 24,500 | 24,769 | |
| Florence Township BAN Series 2023, 5% 5/31/24 | 6,782 | 6,848 | |
| Jefferson Township Gen. Oblig. BAN Series 2023, 5% 6/14/24 | 4,800 | 4,840 | |
| Monroe Township Middlesex County Gen. Oblig. BAN Series 2023, 5% 6/4/24 | 14,525 | 14,662 | |
| New Jersey Econ. Dev. Auth. Bonds: | |||
| (Portal North Bridge Proj.) Series 2022 A, 5% 11/1/23 | 630 | 630 | |
| Series 2023 RRR, 5% 3/1/24 | 10,200 | 10,267 | |
| New Jersey Sports & Exposition Auth. Contract Rev. Bonds Series 2018 A, 5% 9/1/24 | 500 | 506 | |
| New Jersey Trans. Trust Fund Auth. Bonds Series 2010 D, 5.25% 12/15/23 | 275 | 276 | |
| Tenafly BAN Series 2023, 4.25% 5/24/24 | 7,100 | 7,138 | |
| Union County Gen. Oblig. BAN Series 2023, 5% 6/14/24 | 48,400 | 48,869 | |
| Wood-Ridge Gen. Oblig. BAN Series 2023, 5.5% 2/27/24 | 3,000 | 3,022 | |
| Woolwich Township BAN Series 2023, 5% 5/23/24 | 17,202 | 17,389 | |
TOTAL NEW JERSEY | 177,547 | ||
| New York - 1.0% | |||
| Hempstead Town Gen. Oblig. BAN Series 2023, 5% 5/24/24 | 8,807 | 8,897 | |
| Horseheads Central School District BAN Series 2023, 4.75% 6/21/24 | 11,451 | 11,542 | |
| Lancaster Central School District BAN Series 2023, 5% 6/7/24 | 12,540 | 12,647 | |
| Saratoga County Gen. Oblig. BAN Series 2023, 5% 9/20/24 | 26,275 | 26,599 | |
| Webster Town BAN Series 2023, 5% 8/28/24 | 11,300 | 11,428 | |
TOTAL NEW YORK | 71,113 | ||
| North Carolina - 0.2% | |||
| East Carolina Univ. Univ. Rev. Bonds Series 2014 A: | |||
| 5% 10/1/23 (Pre-Refunded to 10/1/23 @ 100) | 1,000 | 1,000 | |
| 5% 10/1/23 (Pre-Refunded to 10/1/23 @ 100) | 1,000 | 1,000 | |
| 5% 10/1/23 (Pre-Refunded to 10/1/23 @ 100) | 1,305 | 1,305 | |
| North Carolina Med. Care Commission Retirement Facilities Rev. Bonds Series 2017 A, 5% 10/1/23 (Pre-Refunded to 10/1/23 @ 103) | 1,550 | 1,597 | |
| North Carolina Tpk. Auth. Triangle Expressway Sys. Bonds Series 2020 C, 5% 2/1/24 (Escrowed to Maturity) | 11,315 | 11,367 | |
TOTAL NORTH CAROLINA | 16,269 | ||
| Ohio - 0.2% | |||
| Allen County Hosp. Facilities Rev. Bonds Series 2020 A, 5% 12/1/23 | 500 | 501 | |
| Montgomery County Rev. Bonds Series 2009 B, 5.25% 11/13/23 (Pre-Refunded to 11/13/23 @ 100) | 2,400 | 2,404 | |
| Ohio Gen. Oblig. Bonds Series 2014 R: | |||
| 5% 5/1/24 (Pre-Refunded to 5/1/24 @ 100) | 275 | 277 | |
| 5% 5/1/24 (Pre-Refunded to 5/1/24 @ 100) | 820 | 825 | |
| Ohio Higher Edl. Facility Commission Rev. Bonds: | |||
| Series 2023 B5, 3.55% tender 11/2/23, CP mode | 2,945 | 2,945 | |
| Series 2023, 3.65% tender 12/1/23, CP mode | 3,750 | 3,750 | |
| Ohio Parks & Recreation Cap. Facilities Bonds (Park and Recreation Impovement Fund Pojects) Series 2020 A, 5% 12/1/23 | 575 | 576 | |
| Wyoming City School District BAN Series 2023, 5.5% 5/15/24 | 2,300 | 2,322 | |
TOTAL OHIO | 13,600 | ||
| Oklahoma - 0.3% | |||
| Oklahoma City Wtr. Utils. Series 2023 A: | |||
| 3.37% 10/3/23 (Liquidity Facility State Street Bank & Trust Co., Boston), CP | 17,400 | 17,400 | |
| 3.6% 10/3/23 (Liquidity Facility State Street Bank & Trust Co., Boston), CP | 2,250 | 2,250 | |
TOTAL OKLAHOMA | 19,650 | ||
| Pennsylvania - 0.2% | |||
| Commonwealth Fing. Auth. Rev. Bonds Series 2015 B1, 5% 6/1/24 | 475 | 478 | |
| Univ. of Pittsburgh Commonwealth Sys. of Higher Ed. Bonds Series 2023 B1, 3.7% tender 1/18/24, CP mode | 11,600 | 11,600 | |
TOTAL PENNSYLVANIA | 12,078 | ||
| South Carolina - 0.4% | |||
| South Carolina Assoc. of Governmental Organizations Ctfs. of Prtn. Bonds Series 2023 B, 5% 3/1/24 | 25,665 | 25,807 | |
| Tennessee - 0.3% | |||
| Memphis Gen. Oblig.: | |||
| Bonds Series 2014 A, 5% 11/1/23 | 750 | 751 | |
| Series 2023 A, 3.4% 10/3/23 (Liquidity Facility State Street Bank & Trust Co., Boston), CP | 12,200 | 12,200 | |
| Metropolitan Govt. of Nashville & Davidson County Series 2023, 3.6% 2/7/24, CP | 6,200 | 6,200 | |
TOTAL TENNESSEE | 19,151 | ||
| Texas - 5.3% | |||
| Austin Elec. Util. Sys. Rev.: | |||
| Series 2023 A: | |||
3.42% 10/3/23 (Liquidity Facility JPMorgan Chase Bank), CP | 39,045 | 39,045 | |
3.46% 10/4/23 (Liquidity Facility JPMorgan Chase Bank), CP | 9,600 | 9,600 | |
| Series 2023, 3.57% 10/3/23 (Liquidity Facility JPMorgan Chase Bank), CP | 9,800 | 9,800 | |
| Dallas Wtrwks. & Swr. Sys. Rev. Bonds Series 2020 C, 5% 10/1/23 | 1,690 | 1,690 | |
| El Paso Wtr. & Swr. Rev. Bonds Series 2015, 5% 3/1/24 | 1,000 | 1,006 | |
| Fort Worth Independent School District Bonds Series 2014, 5% 2/15/24 (Permanent School Fund of Texas Guaranteed) (Pre-Refunded to 2/15/24 @ 100) | 1,745 | 1,754 | |
| Frenship Independent School District Bonds Series 2014, 5% 2/15/24 (Pre-Refunded to 2/15/24 @ 100) | 2,220 | 2,232 | |
| Harris County Cultural Ed. Facilities Fin. Corp. Rev. Bonds: | |||
| Series 2019 A, 5% 12/1/23 | 315 | 316 | |
| Series 2023 B1, 3.55% tender 10/2/23, CP mode | 15,200 | 15,200 | |
| Series 2023 B2, 3.7% tender 12/1/23, CP mode | 18,100 | 18,100 | |
| Series 2023 B3, 3.7% tender 1/4/24, CP mode | 35,000 | 35,000 | |
| Harris County Gen. Oblig.: | |||
| Series 2023 C, 3.47% 10/4/23, LOC Sumitomo Mitsui Banking Corp., CP | 2,840 | 2,840 | |
| Series 2023 D, 3.47% 10/4/23 (Liquidity Facility JPMorgan Chase Bank), CP | 5,300 | 5,300 | |
| Series 2023, 3.69% 11/2/23 (Liquidity Facility State Street Bank & Trust Co., Boston), CP | 3,000 | 3,000 | |
| Harris County Metropolitan Trans. Auth. Bonds Series 2017 B, 5% 11/1/23 | 875 | 876 | |
| Houston Higher Ed. Fin. Corp. Higher Ed. Rev.: | |||
| Series 2023 A: | |||
3.55% 10/3/23, CP | 6,900 | 6,900 | |
3.6% 12/5/23, CP | 5,000 | 5,000 | |
3.75% 11/3/23, CP | 6,900 | 6,900 | |
| Series 2023, 3.43% 10/17/23, CP | 6,900 | 6,900 | |
| Houston Util. Sys. Rev. Bonds: | |||
| Series 2014 C, 5% 5/15/24 | 400 | 403 | |
| Series 2014 D, 5% 11/15/23 | 3,090 | 3,094 | |
| Pflugerville Independent School District Bonds Series 2014, 4% 2/15/24 (Pre-Refunded to 2/15/24 @ 100) | 5,220 | 5,223 | |
| Tarrant County Cultural Ed. Facilities Fin. Corp. Hosp. Rev. Bonds: | |||
| (Baylor Health Care Sys. Proj.): | |||
Series 2011 B, SIFMA Municipal Swap Index + 0.300% 4.31%, tender 4/26/24 (c)(g) | 8,400 | 8,400 | |
Series 2013 B, SIFMA Municipal Swap Index + 0.300% 4.31%, tender 4/26/24 (c)(g) | 2,400 | 2,400 | |
| Series 2020, 5% 12/1/23 | 380 | 381 | |
| Texas A&M Univ. Rev. Series 2023 B, 3.6% 11/3/23, CP | 9,000 | 9,000 | |
| Texas Gen. Oblig. Bonds Series 2018 A, 5% 10/1/23 | 2,340 | 2,340 | |
| Univ. of Texas Board of Regents Sys. Rev.: | |||
| Series 2023 A: | |||
3.47% 11/3/23 (Liquidity Facility Univ. of Texas Invt. Mgmt. Co.), CP | 12,300 | 12,300 | |
3.5% 10/4/23 (Liquidity Facility Univ. of Texas Invt. Mgmt. Co.), CP | 9,500 | 9,500 | |
3.5% 11/2/23 (Liquidity Facility Univ. of Texas Invt. Mgmt. Co.), CP | 12,100 | 12,100 | |
3.55% 10/18/23 (Liquidity Facility Univ. of Texas Invt. Mgmt. Co.), CP | 10,300 | 10,300 | |
3.6% 12/1/23 (Liquidity Facility Univ. of Texas Invt. Mgmt. Co.), CP | 12,500 | 12,500 | |
3.6% 12/5/23 (Liquidity Facility Univ. of Texas Invt. Mgmt. Co.), CP | 12,600 | 12,600 | |
3.68% 10/31/23 (Liquidity Facility Univ. of Texas Invt. Mgmt. Co.), CP | 4,800 | 4,800 | |
3.7% 2/22/24 (Liquidity Facility Univ. of Texas Invt. Mgmt. Co.), CP | 6,700 | 6,700 | |
3.75% 11/10/23 (Liquidity Facility Univ. of Texas Invt. Mgmt. Co.), CP | 12,300 | 12,300 | |
3.8% 12/13/23 (Liquidity Facility Univ. of Texas Invt. Mgmt. Co.), CP | 10,000 | 10,000 | |
| Series 2023: | |||
3.55% 10/19/23 (Liquidity Facility Univ. of Texas Invt. Mgmt. Co.), CP | 17,000 | 17,000 | |
3.6% 10/11/23 (Liquidity Facility Univ. of Texas Invt. Mgmt. Co.), CP | 11,800 | 11,800 | |
3.7% 2/14/24 (Liquidity Facility Univ. of Texas Invt. Mgmt. Co.), CP | 12,100 | 12,100 | |
| Univ. of Texas Permanent Univ. Fund Rev.: | |||
| Series 2023 A: | |||
3.43% 10/12/23, CP | 12,400 | 12,400 | |
3.75% 11/10/23, CP | 12,300 | 12,300 | |
| Series 2023, 3.7% 10/6/23, CP | 4,900 | 4,900 | |
TOTAL TEXAS | 376,300 | ||
| Utah - 0.0% | |||
| Utah County Hosp. Rev. Bonds: | |||
| Series 2018 B2, 5%, tender 8/1/24 (c) | 400 | 402 | |
| Series 2020 B1, 5%, tender 8/1/24 (c) | 225 | 227 | |
TOTAL UTAH | 629 | ||
| Virginia - 0.1% | |||
| Suffolk Bonds: | |||
| Series 2013: | |||
4.5% 12/1/23 (Pre-Refunded to 12/1/23 @ 100) | 1,830 | 1,832 | |
4.5% 12/1/23 (Pre-Refunded to 12/1/23 @ 100) | 2,100 | 2,102 | |
4.5% 12/1/23 (Pre-Refunded to 12/1/23 @ 100) | 1,975 | 1,977 | |
| Series 2023, 4.5% 12/1/23 (Pre-Refunded to 12/1/23 @ 100) | 1,900 | 1,902 | |
TOTAL VIRGINIA | 7,813 | ||
| Washington - 0.2% | |||
| Alderwood Wtr. & Wastewtr. D Bonds Series 2013: | |||
| 4% 12/1/23 (Pre-Refunded to 12/1/23 @ 100) | 705 | 705 | |
| 4% 12/1/23 (Pre-Refunded to 12/1/23 @ 100) | 795 | 795 | |
| 4% 12/1/23 (Pre-Refunded to 12/1/23 @ 100) | 765 | 765 | |
| 4.5% 12/1/23 (Pre-Refunded to 12/1/23 @ 100) | 935 | 936 | |
| 4.5% 12/1/23 (Pre-Refunded to 12/1/23 @ 100) | 860 | 861 | |
| Port of Seattle Rev. Bonds Series 2021 A, 5% 12/1/23 | 3,600 | 3,608 | |
| Univ. of Washington Univ. Revs. Series 2023, 3.5% 10/16/23, CP | 9,000 | 9,000 | |
TOTAL WASHINGTON | 16,670 | ||
| Wisconsin - 1.5% | |||
| Madison Metropolitan School District TRAN Series 2023, 5% 9/3/24 (h) | 15,100 | 15,257 | |
| Wisconsin Clean Wtr. Rev. Bonds Series 2015 1, 5% 6/1/24 (Pre-Refunded to 6/1/24 @ 100) | 2,500 | 2,517 | |
| Wisconsin Gen. Oblig.: | |||
| Bonds Series 2022 3, 5% 11/1/23 | 835 | 836 | |
| Series 2023: | |||
3.45% 10/3/23, CP | 30,600 | 30,600 | |
3.45% 4/29/24, CP | 15,600 | 15,600 | |
3.55% 4/9/24, CP | 13,254 | 13,254 | |
3.55% 4/9/24, CP | 23,408 | 23,408 | |
| Wisconsin Health & Edl. Facilities Bonds Series 2013 B2, 4% 11/15/23 | 850 | 850 | |
TOTAL WISCONSIN | 102,322 | ||
| TOTAL OTHER MUNICIPAL SECURITY (Cost $1,315,690) | 1,315,690 | ||
| Investment Company - 15.8% | |||
| Shares | Value ($) (000s) | ||
Fidelity Tax-Free Cash Central Fund 4.42% (i)(j) (Cost $1,121,811) | 1,121,407 | 1,121,811 | |
| TOTAL INVESTMENT IN SECURITIES - 99.0% (Cost $7,029,559) | 7,029,559 |
NET OTHER ASSETS (LIABILITIES) - 1.0% | 68,323 |
| NET ASSETS - 100.0% | 7,097,882 |
| BAN | - | BOND ANTICIPATION NOTE |
| CP | - | COMMERCIAL PAPER |
| TAN | - | TAX ANTICIPATION NOTE |
| TRAN | - | TAX AND REVENUE ANTICIPATION NOTE |
| VRDN | - | VARIABLE RATE DEMAND NOTE (A debt instrument that is payable upon demand, either daily, weekly or monthly) |
| (a) | Amount is stated in United States dollars unless otherwise noted. |
| (b) | Security exempt from registration under Rule 144A of the Securities Act of 1933. These securities may be resold in transactions exempt from registration, normally to qualified institutional buyers. At the end of the period, the value of these securities amounted to $34,770,000 or 0.5% of net assets. |
| (c) | Coupon rates for floating and adjustable rate securities reflect the rates in effect at period end. |
| (d) | Restricted securities (including private placements) - Investment in securities not registered under the Securities Act of 1933 (excluding 144A issues). At the end of the period, the value of restricted securities (excluding 144A issues) amounted to $32,865,000 or 0.5% of net assets. |
| (e) | Provides evidence of ownership in one or more underlying municipal bonds. |
| (f) | Coupon rates are determined by re-marketing agents based on current market conditions. |
| (g) | Coupon is indexed to a floating interest rate which may be multiplied by a specified factor and/or subject to caps or floors. |
| (h) | Security or a portion of the security purchased on a delayed delivery or when-issued basis. |
| (i) | Information in this report regarding holdings by state and security types does not reflect the holdings of the Fidelity Tax-Free Cash Central Fund. |
| (j) | Affiliated fund that is generally available only to investment companies and other accounts managed by Fidelity Investments. The rate quoted is the annualized seven-day yield of the fund at period end. A complete unaudited listing of the fund's holdings as of its most recent quarter end is available upon request. In addition, each Fidelity Central Fund's financial statements are available on the SEC's website or upon request. |
| Additional information on each restricted holding is as follows: | ||
| Security | Acquisition Date | Cost ($) (000s) |
| Baltimore Proj. Rev. Bonds Series Floaters G 28, 4.18%, tender 1/2/24 (Liquidity Facility Royal Bank of Canada) | 1/03/23 | 700 |
| Broward County Convention Ctr. Bonds Series MS 00 11, 3.83%, tender 11/2/23 (Liquidity Facility Morgan Stanley Bank, West Valley City Utah) | 1/19/23 | 15,910 |
| Central Puget Sound Reg'l. Trans. Auth. Sales & Use Tax Rev. Bonds Series G 123, 4.18%, tender 11/1/23 (Liquidity Facility Royal Bank of Canada) | 2/09/23 | 1,560 |
| Connecticut Spl. Tax Oblig. Trans. Infrastructure Rev. Bonds Series Floaters G 110, 4.16%, tender 10/5/23 (Liquidity Facility Royal Bank of Canada) | 4/01/21 - 12/20/22 | 3,300 |
| El Paso Wtr. & Swr. Rev. Bonds Series G 124, 4.18%, tender 3/1/24 (Liquidity Facility Royal Bank of Canada) | 9/01/23 | 2,305 |
| Port Auth. of New York & New Jersey Series 1997 2, 4.03% 10/30/23, VRDN | 7/15/20 | 7,300 |
| South Carolina Trans. Infrastructure Bank Rev. Bonds Series Floaters G 109, 4.18%, tender 10/5/23 (Liquidity Facility Royal Bank of Canada) | 4/01/21 - 6/01/23 | 1,790 |
| Affiliate (Amounts in thousands) | Value, beginning of period ($) | Purchases ($) | Sales Proceeds ($) | Dividend Income ($) | Realized Gain (loss) ($) | Change in Unrealized appreciation (depreciation) ($) | Value, end of period ($) | % ownership, end of period |
| Fidelity Tax-Free Cash Central Fund 4.42% | 440,577 | 2,402,545 | 1,721,311 | 10,948 | - | - | 1,121,811 | 77.6% |
| Total | 440,577 | 2,402,545 | 1,721,311 | 10,948 | - | - | 1,121,811 | |
| Statement of Assets and Liabilities | ||||
| Amounts in thousands (except per-share amounts) | September 30, 2023 (Unaudited) | |||
| Assets | ||||
| Investment in securities, at value - See accompanying schedule: | ||||
Unaffiliated issuers (cost $5,907,748) | $ | 5,907,748 | ||
Fidelity Central Funds (cost $1,121,811) | 1,121,811 | |||
| Total Investment in Securities (cost $7,029,559) | $ | 7,029,559 | ||
| Cash | 10,021 | |||
| Receivable for investments sold | 20,198 | |||
| Receivable for fund shares sold | 119,266 | |||
| Interest receivable | 38,461 | |||
| Distributions receivable from Fidelity Central Funds | 2,752 | |||
| Prepaid expenses | 9 | |||
| Receivable from investment adviser for expense reductions | 198 | |||
| Other receivables | 90 | |||
Total assets | 7,220,554 | |||
| Liabilities | ||||
| Payable for investments purchased | ||||
Regular delivery | $ | 22,955 | ||
Delayed delivery | 47,580 | |||
| Payable for fund shares redeemed | 46,770 | |||
| Distributions payable | 4,047 | |||
| Accrued management fee | 794 | |||
| Distribution and service plan fees payable | 4 | |||
| Other affiliated payables | 388 | |||
| Other payables and accrued expenses | 134 | |||
| Total Liabilities | 122,672 | |||
| Net Assets | $ | 7,097,882 | ||
| Net Assets consist of: | ||||
| Paid in capital | $ | 7,097,380 | ||
| Total accumulated earnings (loss) | 502 | |||
| Net Assets | $ | 7,097,882 | ||
| Net Asset Value and Maximum Offering Price | ||||
| Class I : | ||||
Net Asset Value, offering price and redemption price per share ($7,057,138 ÷ 7,052,378 shares) | $ | 1.00 | ||
| Class II : | ||||
Net Asset Value, offering price and redemption price per share ($15,437 ÷ 15,428 shares) | $ | 1.00 | ||
| Class III : | ||||
Net Asset Value, offering price and redemption price per share ($3,501 ÷ 3,500 shares) | $ | 1.00 | ||
| Select Class : | ||||
Net Asset Value, offering price and redemption price per share ($21,806 ÷ 21,789 shares) | $ | 1.00 | ||
| Statement of Operations | ||||
| Amounts in thousands | Six months ended September 30, 2023 (Unaudited) | |||
| Investment Income | ||||
| Interest | $ | 97,913 | ||
| Income from Fidelity Central Funds | 10,948 | |||
| Total Income | 108,861 | |||
| Expenses | ||||
| Management fee | $ | 4,473 | ||
| Transfer agent fees | 1,917 | |||
| Distribution and service plan fees | 22 | |||
| Accounting fees and expenses | 269 | |||
| Custodian fees and expenses | 30 | |||
| Independent trustees' fees and expenses | 10 | |||
| Registration fees | 154 | |||
| Audit | 21 | |||
| Legal | 2 | |||
| Miscellaneous | 13 | |||
| Total expenses before reductions | 6,911 | |||
| Expense reductions | (1,138) | |||
| Total expenses after reductions | 5,773 | |||
| Net Investment income (loss) | 103,088 | |||
| Realized and Unrealized Gain (Loss) | ||||
| Net realized gain (loss) on: | ||||
| Investment Securities: | ||||
| Unaffiliated issuers | (31) | |||
| Total net realized gain (loss) | (31) | |||
| Net increase in net assets resulting from operations | $ | 103,057 | ||
| Statement of Changes in Net Assets | ||||
| Amount in thousands | Six months ended September 30, 2023 (Unaudited) | Year ended March 31, 2023 | ||
| Increase (Decrease) in Net Assets | ||||
| Operations | ||||
| Net investment income (loss) | $ | 103,088 | $ | 106,876 |
| Net realized gain (loss) | (31) | (61) | ||
Net increase in net assets resulting from operations | 103,057 | 106,815 | ||
| Distributions to shareholders | (103,071) | (106,820) | ||
| Share transactions - net increase (decrease) | 785,516 | 1,847,410 | ||
| Total increase (decrease) in net assets | 785,502 | 1,847,405 | ||
| Net Assets | ||||
| Beginning of period | 6,312,380 | 4,464,975 | ||
| End of period | $ | 7,097,882 | $ | 6,312,380 |
| Tax-Exempt Portfolio Class I |
Six months ended (Unaudited) September 30, 2023 | Years ended March 31, 2023 | 2022 | 2021 | 2020 | 2019 | |||||||
Selected Per-Share Data | ||||||||||||
| Net asset value, beginning of period | $ | 1.00 | $ | 1.00 | $ | 1.00 | $ | 1.00 | $ | 1.00 | $ | 1.00 |
| Income from Investment Operations | ||||||||||||
Net investment income (loss) A | .016 | .017 | - B | .001 | .013 | .014 | ||||||
| Net realized and unrealized gain (loss) | - B | - B | - B | - B | .001 | - B | ||||||
| Total from investment operations | .016 | .017 | - B | .001 | .014 | .014 | ||||||
| Distributions from net investment income | (.016) | (.017) | - B | (.001) | (.013) | (.014) | ||||||
| Distributions from net realized gain | - | - | - | - | - B | - | ||||||
| Total distributions | (.016) | (.017) | - B | (.001) | (.014) C | (.014) | ||||||
| Net asset value, end of period | $ | 1.00 | $ | 1.00 | $ | 1.00 | $ | 1.00 | $ | 1.00 | $ | 1.00 |
Total Return D,E | 1.62% | 1.72% | .03% | .12% | 1.36% | 1.40% | ||||||
Ratios to Average Net Assets A,F,G | ||||||||||||
| Expenses before reductions | .22% H,I | .22% | .22% | .22% | .21% | .22% | ||||||
| Expenses net of fee waivers, if any | .18% H,I | .18% | .10% | .17% | .18% | .18% | ||||||
| Expenses net of all reductions | .18% H,I | .18% | .10% | .17% | .18% | .18% | ||||||
| Net investment income (loss) | 3.23% H,I | 1.73% | .03% | .13% | 1.34% | 1.40% | ||||||
| Supplemental Data | ||||||||||||
| Net assets, end of period (in millions) | $ | 7,057 | $ | 6,275 | $ | 4,457 | $ | 4,748 | $ | 6,568 | $ | 7,113 |
| Tax-Exempt Portfolio Class II |
Six months ended (Unaudited) September 30, 2023 | Years ended March 31, 2023 | 2022 | 2021 | 2020 | 2019 | |||||||
Selected Per-Share Data | ||||||||||||
| Net asset value, beginning of period | $ | 1.00 | $ | 1.00 | $ | 1.00 | $ | 1.00 | $ | 1.00 | $ | 1.00 |
| Income from Investment Operations | ||||||||||||
Net investment income (loss) A | .015 | .016 | - B | .001 | .012 | .012 | ||||||
Net realized and unrealized gain (loss) B | - | - | - | - | - | - | ||||||
| Total from investment operations | .015 | .016 | - B | .001 | .012 | .012 | ||||||
| Distributions from net investment income | (.015) | (.016) | - B | (.001) | (.012) | (.012) | ||||||
| Distributions from net realized gain | - | - | - | - | - B | - | ||||||
| Total distributions | (.015) | (.016) | - B | (.001) | (.012) | (.012) | ||||||
| Net asset value, end of period | $ | 1.00 | $ | 1.00 | $ | 1.00 | $ | 1.00 | $ | 1.00 | $ | 1.00 |
Total Return C,D | 1.55% | 1.57% | .02% | .06% | 1.21% | 1.24% | ||||||
Ratios to Average Net Assets A,E,F | ||||||||||||
| Expenses before reductions | .37% G,H | .37% | .37% | .37% | .36% | .36% | ||||||
| Expenses net of fee waivers, if any | .33% G,H | .33% | .11% | .21% | .33% | .33% | ||||||
| Expenses net of all reductions | .33% G,H | .33% | .11% | .21% | .33% | .33% | ||||||
| Net investment income (loss) | 3.08% G,H | 1.58% | .01% | .08% | 1.19% | 1.25% | ||||||
| Supplemental Data | ||||||||||||
| Net assets, end of period (in millions) | $ | 15 | $ | 17 | $ | - I | $ | - I | $ | - I | $ | - I |
| Tax-Exempt Portfolio Class III |
Six months ended (Unaudited) September 30, 2023 | Years ended March 31, 2023 | 2022 | 2021 | 2020 | 2019 | |||||||
Selected Per-Share Data | ||||||||||||
| Net asset value, beginning of period | $ | 1.00 | $ | 1.00 | $ | 1.00 | $ | 1.00 | $ | 1.00 | $ | 1.00 |
| Income from Investment Operations | ||||||||||||
Net investment income (loss) A | .015 | .015 | - B | - B | .011 | .011 | ||||||
Net realized and unrealized gain (loss) B | - | - | - | - | - | - | ||||||
| Total from investment operations | .015 | .015 | - B | - B | .011 | .011 | ||||||
| Distributions from net investment income | (.015) | (.015) | - B | - B | (.011) | (.011) | ||||||
| Distributions from net realized gain | - | - | - | - | - B | - | ||||||
| Total distributions | (.015) | (.015) | - B | - B | (.011) | (.011) | ||||||
| Net asset value, end of period | $ | 1.00 | $ | 1.00 | $ | 1.00 | $ | 1.00 | $ | 1.00 | $ | 1.00 |
Total Return C,D | 1.50% | 1.46% | .01% | .05% | 1.11% | 1.14% | ||||||
Ratios to Average Net Assets A,E,F | ||||||||||||
| Expenses before reductions | .47% G,H | .47% | .48% | .46% | .46% | .46% | ||||||
| Expenses net of fee waivers, if any | .43% G,H | .43% | .13% | .23% | .43% | .43% | ||||||
| Expenses net of all reductions | .43% G,H | .43% | .13% | .23% | .43% | .43% | ||||||
| Net investment income (loss) | 2.98% G,H | 1.48% | (.01)% | .07% | 1.09% | 1.15% | ||||||
| Supplemental Data | ||||||||||||
| Net assets, end of period (in millions) | $ | 4 | $ | 6 | $ | 7 | $ | 2 | $ | 2 | $ | 2 |
| Tax-Exempt Portfolio Select Class |
Six months ended (Unaudited) September 30, 2023 | Years ended March 31, 2023 | 2022 | 2021 | 2020 | 2019 | |||||||
Selected Per-Share Data | ||||||||||||
| Net asset value, beginning of period | $ | 1.00 | $ | 1.00 | $ | 1.00 | $ | 1.00 | $ | 1.00 | $ | 1.00 |
| Income from Investment Operations | ||||||||||||
Net investment income (loss) A | .016 | .017 | - B | .001 | .013 | .013 | ||||||
Net realized and unrealized gain (loss) B | - | - | - | - | - | - | ||||||
| Total from investment operations | .016 | .017 | - B | .001 | .013 | .013 | ||||||
| Distributions from net investment income | (.016) | (.017) | - B | (.001) | (.013) | (.013) | ||||||
| Distributions from net realized gain | - | - | - | - | - B | - | ||||||
| Total distributions | (.016) | (.017) | - B | (.001) | (.013) | (.013) | ||||||
| Net asset value, end of period | $ | 1.00 | $ | 1.00 | $ | 1.00 | $ | 1.00 | $ | 1.00 | $ | 1.00 |
Total Return C,D | 1.60% | 1.67% | .02% | .09% | 1.31% | 1.35% | ||||||
Ratios to Average Net Assets A,E,F | ||||||||||||
| Expenses before reductions | .27% G,H | .27% | .27% | .27% | .26% | .27% | ||||||
| Expenses net of fee waivers, if any | .23% G,H | .23% | .10% | .19% | .23% | .23% | ||||||
| Expenses net of all reductions | .23% G,H | .23% | .10% | .19% | .23% | .23% | ||||||
| Net investment income (loss) | 3.18% G,H | 1.68% | .03% | .11% | 1.29% | 1.35% | ||||||
| Supplemental Data | ||||||||||||
| Net assets, end of period (in millions) | $ | 22 | $ | 15 | $ | 1 | $ | 3 | $ | 3 | $ | 10 |
| Fidelity Central Fund | Investment Manager | Investment Objective | Investment Practices | Expense RatioA |
| Fidelity Money Market Central Funds | Fidelity Management & Research Company LLC (FMR) | Each fund seeks to obtain a high level of current income consistent with the preservation of capital and liquidity. | Short-term Investments | Less than .005% |
| Treasury Only Portfolio | $647 |
| Treasury Portfolio | 433 |
| Government Portfolio | 1,540 |
| Money Market Portfolio | 1,048 |
| Tax-Exempt Portfolio | 88 |
| Tax cost | Gross unrealized appreciation | Gross unrealized depreciation | Net unrealized appreciation (depreciation) | |
| Treasury Only Portfolio | $57,326,600 | $- | $- | $- |
| Treasury Portfolio | 58,308,540 | - | - | - |
| Government Portfolio | 186,249,859 | - | - | - |
| Money Market Portfolio | 112,864,324 | - | - | - |
| Tax-Exempt Portfolio | 7,029,559 | - | - | - |
| Short-term | Long-term | Total capital loss carryforward | |
| Treasury Only Portfolio | $ (455) | $ (61) | $ (516) |
| Treasury Portfolio | (26) | (168) | (194) |
| Government Portfolio | (15) | (695) | (710) |
| Tax-Exempt Portfolio | (16) | - | (16) |
| Distribution Fee | Service Fee | |
Class II | .00% | .15% |
| Class III | .00% | .25% |
| Class IV | .25% | .25% |
Select Class | .00% | .05% |
| Total Fees | Retained by FDC | |
| Treasury Only Portfolio: | ||
| Class II | $1,791 | $- |
| Class III | 3,316 | - |
| Class IV | 2,127 | - |
| Select Class | 311 | - |
| $7,545 | $- | |
Treasury Portfolio: | ||
| Class II | $423 | $- |
| Class III | 4,447 | - |
| Class IV | 2,353 | - |
| Select Class | 66 | - |
| $7,289 | $- | |
Government Portfolio: | ||
| Class II | $1,034 | $- |
| Class III | 6,262 | - |
| Select Class | 52 | - |
| $7,348 | $- | |
Money Market Portfolio: | ||
| Class II | $67 | $-A |
| Class III | 29 | -A |
| Select Class | 14 | - |
| $110 | $-A | |
Tax-Exempt Portfolio: | ||
| Class II | $12 | $- |
| Class III | 6 | -A |
| Select Class | 4 | -A |
| $22 | $-A |
| Treasury Only Portfolio | |
| Class I | $4,049 |
| Class II | 717 |
| Class III | 796 |
| Class IV | 255 |
| Select Class | 373 |
| Institutional Class | 4,334 |
| $10,524 | |
| Treasury Portfolio | |
| Class I | $6,634 |
| Class II | 169 |
| Class III | 1,067 |
| Class IV | 282 |
| Select Class | 79 |
| Institutional Class | 4,328 |
| $12,559 | |
| Government Portfolio | |
| Class I | $12,049 |
| Class II | 414 |
| Class III | 1,503 |
| Select Class | 63 |
| Institutional Class | 19,661 |
| $33,690 | |
| Money Market Portfolio | |
| Class I | $13,575 |
| Class II | 27 |
| Class III | 7 |
| Select Class | 17 |
| Institutional Class | 8,712 |
| $22,338 | |
| Tax-Exempt Portfolio | |
| Class I | $1,906 |
| Class II | 5 |
| Class III | 1 |
| Select Class | 5 |
| $1,917 |
| % of Average Net Assets | |
| Treasury Only Portfolio | - A |
| Treasury Portfolio | - A |
| Government Portfolio | - A |
| Money Market Portfolio | - A |
| Tax-Exempt Portfolio | .01 |
| Average Loan Balance | Weighted Average Interest Rate | ||
| Money Market Portfolio | Lender | 43,239 | 5.45% |
| Purchases ($) | Sales ($) | Realized Gain (Loss) ($) | |
| Treasury Only Portfolio | - | - | - |
| Treasury Portfolio | - | - | - |
| Government Portfolio | - | - | - |
| Money Market Portfolio | - | - | - |
| Tax-Exempt Portfolio | 95,553 | 192,415 | - |
| Amount ($) | |
| Money Market Portfolio | 2 |
| Expense Limitations | Reimbursement | |
| Treasury Only Portfolio | ||
| Class I | .18% | $2,020 |
| Class II | .33% | 358 |
| Class III | .43% | 403 |
| Class IV | .68% | 121 |
| Select Class | .23% | 187 |
| Institutional Class | .14% | 5,769 |
| Treasury Portfolio | ||
| Class I | .18% | $3,235 |
| Class II | .33% | 84 |
| Class III | .43% | 523 |
| Class IV | .68% | 133 |
| Select Class | .23% | 38 |
| Institutional Class | .14% | 5,644 |
| Government Portfolio | ||
| Class I | .18% | $5,244 |
| Class II | .33% | 177 |
| Class III | .43% | 655 |
| Select Class | .23% | 27 |
| Institutional Class | .14% | 23,692 |
| Money Market Portfolio | ||
| Class I | .18% | $6,608 |
| Class II | .33% | 13 |
| Class III | .43% | 3 |
| Select Class | .23% | 8 |
| Institutional Class | .14% | 11,391 |
| Tax-Exempt Portfolio | ||
| Class I | .18% | $1,121 |
| Class II | .33% | 3 |
| Class III | .43% | 1 |
| Select Class | .23% | 3 |
| Custodian credits | Transfer Agent credits | |
| Treasury Only Portfolio | $110 | $ - |
| Class I | - | -A |
| Class II | - | -A |
| Class III | - | -A |
| Class IV | - | -A |
| Select Class | - | -A |
| Treasury Portfolio | 20 | - |
| Class II | - | -A |
| Class III | - | -A |
| Class IV | - | -A |
| Select Class | - | -A |
| Government Portfolio | 122 | - |
| Class II | - | -A |
| Class III | - | -A |
| Select Class | - | -A |
| Money Market Portfolio | 81 | - |
| Class I | - | -A |
| Class II | - | -A |
| Institutional Class | - | -A |
| Tax-Exempt Portfolio | 10 | - |
| Class I | - | -A |
| Class III | - | -A |
Six months ended September 30, 2023 | Year ended March 31, 2023 | |
| Treasury Only Portfolio | ||
| Distributions to shareholders | ||
| Class I | $323,265 | $292,089 |
| Class II | 55,557 | 36,661 |
| Class III | 60,351 | 39,816 |
| Class IV | 18,320 | 8,738 |
| Select Class | 29,464 | 13,274 |
| Institutional Class | 698,891 | 513,631 |
Total | $1,185,848 | $904,209 |
| Treasury Portfolio | ||
| Distributions to shareholders | ||
| Class I | $555,823 | $406,305 |
| Class II | 13,769 | 8,604 |
| Class III | 85,161 | 62,273 |
| Class IV | 21,312 | 20,442 |
| Select Class | 6,577 | 6,353 |
| Institutional Class | 729,359 | 510,786 |
Total | $1,412,001 | $1,014,763 |
| Government Portfolio | ||
| Distributions to shareholders | ||
| Class I | $1,010,161 | $850,204 |
| Class II | 33,880 | 20,557 |
| Class III | 120,153 | 92,362 |
| Select Class | 5,200 | 5,537 |
| Institutional Class | 3,326,775 | 2,299,485 |
Total | $4,496,169 | $3,268,145 |
| Money Market Portfolio | ||
| Distributions to shareholders | ||
| Class I | $1,154,662 | $908,704 |
| Class II | 2,197 | 2,450 |
| Class III | 553 | 413 |
| Select Class | 1,427 | 1,028 |
| Institutional Class | 1,493,314 | 1,235,699 |
Total | $2,652,153 | $2,148,294 |
| Tax-Exempt Portfolio | ||
| Distributions to shareholders | ||
| Class I | $102,490 | $106,405 |
| Class II | 244 | 211 |
| Class III | 71 | 73 |
| Select Class | 266 | 131 |
Total | $103,071 | $106,820 |
| Shares | Shares | Dollars | Dollars | |
Six months ended September 30, 2023 | Year ended March 31, 2023 | Six months ended September 30, 2023 | Year ended March 31, 2023 | |
| Treasury Only Portfolio | ||||
| Class I | ||||
| Shares sold | 16,003,132 | 71,045,216 | $16,003,132 | $71,045,216 |
| Reinvestment of distributions | 193,037 | 163,747 | 193,037 | 163,747 |
| Shares redeemed | (16,601,182) | (68,743,099) | (16,601,182) | (68,743,099) |
| Net increase (decrease) | (405,013) | 2,465,864 | $(405,013) | $2,465,864 |
| Class II | ||||
| Shares sold | 3,470,001 | 5,203,559 | $3,470,001 | $5,203,559 |
| Reinvestment of distributions | 1,543 | 1,799 | 1,543 | 1,799 |
| Shares redeemed | (3,240,939) | (4,135,452) | (3,240,939) | (4,135,452) |
| Net increase (decrease) | 230,605 | 1,069,906 | $230,605 | $1,069,906 |
| Class III | ||||
| Shares sold | 3,345,255 | 5,754,811 | $3,345,255 | $5,754,811 |
| Reinvestment of distributions | 15,691 | 11,907 | 15,691 | 11,907 |
| Shares redeemed | (3,323,663) | (4,438,239) | (3,323,663) | (4,438,239) |
| Net increase (decrease) | 37,283 | 1,328,479 | $37,283 | $1,328,479 |
| Class IV | ||||
| Shares sold | 1,358,206 | 1,847,197 | $1,358,206 | $1,847,197 |
| Reinvestment of distributions | 18,320 | 8,738 | 18,320 | 8,738 |
| Shares redeemed | (1,476,607) | (1,256,999) | (1,476,607) | (1,256,999) |
| Net increase (decrease) | (100,081) | 598,936 | $(100,081) | $598,936 |
| Select Class | ||||
| Shares sold | 826,812 | 2,472,295 | $826,812 | $2,472,295 |
| Reinvestment of distributions | 10,812 | 5,479 | 10,812 | 5,479 |
| Shares redeemed | (819,719) | (1,532,071) | (819,719) | (1,532,071) |
| Net increase (decrease) | 17,905 | 945,703 | $17,905 | $945,703 |
| Institutional Class | ||||
| Shares sold | 34,107,366 | 64,828,670 | $34,107,365 | $64,828,670 |
| Reinvestment of distributions | 459,705 | 366,152 | 459,705 | 366,152 |
| Shares redeemed | (32,371,868) | (53,869,257) | (32,371,868) | (53,869,257) |
| Net increase (decrease) | 2,195,203 | 11,325,565 | $2,195,202 | $11,325,565 |
| Treasury Portfolio | ||||
| Class I | ||||
| Shares sold | 50,542,439 | 87,123,200 | $50,542,439 | $87,123,200 |
| Reinvestment of distributions | 208,936 | 147,955 | 208,936 | 147,955 |
| Shares redeemed | (52,129,631) | (73,842,449) | (52,129,631) | (73,842,449) |
| Net increase (decrease) | (1,378,256) | 13,428,706 | $(1,378,256) | $13,428,706 |
| Class II | ||||
| Shares sold | 887,582 | 1,710,950 | $887,582 | $1,710,950 |
| Reinvestment of distributions | 6,510 | 2,617 | 6,510 | 2,617 |
| Shares redeemed | (710,594) | (1,611,265) | (710,594) | (1,611,265) |
| Net increase (decrease) | 183,498 | 102,302 | $183,498 | $102,302 |
| Class III | ||||
| Shares sold | 5,892,101 | 8,240,069 | $5,892,101 | $8,240,069 |
| Reinvestment of distributions | 10,721 | 7,486 | 10,721 | 7,486 |
| Shares redeemed | (4,971,444) | (7,818,278) | (4,971,444) | (7,818,278) |
| Net increase (decrease) | 931,378 | 429,277 | $931,378 | $429,277 |
| Class IV | ||||
| Shares sold | 847,634 | 2,992,995 | $847,634 | $2,992,995 |
| Reinvestment of distributions | 756 | 1,570 | 756 | 1,570 |
| Shares redeemed | (944,015) | (3,165,464) | (944,015) | (3,165,464) |
| Net increase (decrease) | (95,625) | (170,899) | $(95,625) | $(170,899) |
| Select Class | ||||
| Shares sold | 574,035 | 1,640,167 | $574,035 | $1,640,167 |
| Reinvestment of distributions | 3,450 | 3,035 | 3,450 | 3,035 |
| Shares redeemed | (463,335) | (1,683,699) | (463,335) | (1,683,699) |
| Net increase (decrease) | 114,150 | (40,497) | $114,150 | $(40,497) |
| Institutional Class | ||||
| Shares sold | 69,945,881 | 136,786,830 | $69,945,882 | $136,786,829 |
| Reinvestment of distributions | 495,749 | 327,421 | 495,749 | 327,421 |
| Shares redeemed | (72,081,351) | (115,372,345) | (72,081,351) | (115,372,345) |
| Net increase (decrease) | (1,639,721) | 21,741,906 | $(1,639,720) | $21,741,905 |
| Government Portfolio | ||||
| Class I | ||||
| Shares sold | 172,534,283 | 284,824,099 | $172,534,283 | $284,824,099 |
| Reinvestment of distributions | 351,664 | 241,258 | 351,664 | 241,258 |
| Shares redeemed | (179,629,339) | (271,000,112) | (179,629,339) | (271,000,112) |
| Net increase (decrease) | (6,743,392) | 14,065,245 | $(6,743,392) | $14,065,245 |
| Class II | ||||
| Shares sold | 2,031,416 | 2,161,514 | $2,031,416 | $2,161,514 |
| Reinvestment of distributions | 1,497 | 653 | 1,497 | 653 |
| Shares redeemed | (1,606,113) | (2,179,277) | (1,606,113) | (2,179,277) |
| Net increase (decrease) | 426,800 | (17,110) | $426,800 | $(17,110) |
| Class III | ||||
| Shares sold | 7,366,331 | 9,279,947 | $7,366,331 | $9,279,947 |
| Reinvestment of distributions | 34,806 | 28,464 | 34,806 | 28,464 |
| Shares redeemed | (5,908,713) | (8,883,759) | (5,908,713) | (8,883,759) |
| Net increase (decrease) | 1,492,424 | 424,652 | $1,492,424 | $424,652 |
| Select Class | ||||
| Shares sold | 270,795 | 770,569 | $270,795 | $770,569 |
| Reinvestment of distributions | 3,531 | 2,576 | 3,531 | 2,576 |
| Shares redeemed | (300,150) | (847,393) | (300,150) | (847,393) |
| Net increase (decrease) | (25,824) | (74,248) | $(25,824) | $(74,248) |
| Institutional Class | ||||
| Shares sold | 314,692,806 | 471,547,341 | $314,692,807 | $471,547,341 |
| Reinvestment of distributions | 2,204,788 | 1,539,790 | 2,204,788 | 1,539,790 |
| Shares redeemed | (301,217,930) | (443,071,589) | (301,217,930) | (443,071,589) |
| Net increase (decrease) | 15,679,664 | 30,015,542 | $15,679,665 | $30,015,542 |
| Money Market Portfolio | ||||
| Class I | ||||
| Shares sold | 30,971,685 | 59,955,626 | $30,971,685 | $59,955,626 |
| Reinvestment of distributions | 979,098 | 778,109 | 979,098 | 778,109 |
| Shares redeemed | (25,420,303) | (35,047,364) | (25,420,303) | (35,047,364) |
| Net increase (decrease) | 6,530,480 | 25,686,371 | $6,530,480 | $25,686,371 |
| Class II | ||||
| Shares sold | 46,913 | 69,630 | $46,913 | $69,630 |
| Reinvestment of distributions | 2,051 | 2,346 | 2,051 | 2,346 |
| Shares redeemed | (57,425) | (81,091) | (57,425) | (81,091) |
| Net increase (decrease) | (8,461) | (9,115) | $(8,461) | $(9,115) |
| Class III | ||||
| Shares sold | 8,288 | 46,641 | $8,288 | $46,641 |
| Reinvestment of distributions | 532 | 381 | 532 | 381 |
| Shares redeemed | (23,857) | (24,441) | (23,857) | (24,441) |
| Net increase (decrease) | (15,037) | 22,581 | $(15,037) | $22,581 |
| Select Class | ||||
| Shares sold | 51,187 | 71,281 | $51,187 | $71,281 |
| Reinvestment of distributions | 1,181 | 850 | 1,181 | 850 |
| Shares redeemed | (38,056) | (46,643) | (38,056) | (46,643) |
| Net increase (decrease) | 14,312 | 25,488 | $14,312 | $25,488 |
| Institutional Class | ||||
| Shares sold | 38,465,463 | 83,999,868 | $38,465,463 | $83,999,867 |
| Reinvestment of distributions | 1,408,718 | 1,152,023 | 1,408,718 | 1,152,023 |
| Shares redeemed | (31,473,189) | (52,314,234) | (31,473,189) | (52,314,234) |
| Net increase (decrease) | 8,400,992 | 32,837,657 | $8,400,992 | $32,837,656 |
| Tax-Exempt Portfolio | ||||
| Class I | ||||
| Shares sold | 7,984,205 | 14,924,698 | $7,984,205 | $14,924,697 |
| Reinvestment of distributions | 80,244 | 82,845 | 80,244 | 82,845 |
| Shares redeemed | (7,282,418) | (13,189,237) | (7,282,418) | (13,189,237) |
| Net increase (decrease) | 782,031 | 1,818,306 | $782,031 | $1,818,305 |
| Class II | ||||
| Shares sold | 537 | 22,079 | $537 | $22,079 |
| Reinvestment of distributions | 228 | 165 | 228 | 165 |
| Shares redeemed | (2,414) | (5,561) | (2,414) | (5,561) |
| Net increase (decrease) | (1,649) | 16,683 | $(1,649) | $16,683 |
| Class III | ||||
| Shares sold | 602 | 11,966 | $602 | $11,966 |
| Reinvestment of distributions | 47 | 40 | 47 | 40 |
| Shares redeemed | (2,770) | (13,048) | (2,770) | (13,048) |
| Net increase (decrease) | (2,121) | (1,042) | $(2,121) | $(1,042) |
| Select Class | ||||
| Shares sold | 26,788 | 34,583 | $26,788 | $34,583 |
| Reinvestment of distributions | 247 | 129 | 247 | 129 |
| Shares redeemed | (19,780) | (21,248) | (19,780) | (21,248) |
| Net increase (decrease) | 7,255 | 13,464 | $7,255 | $13,464 |
| The Example is based on an investment of $1,000 invested at the beginning of the period and held for the entire period (April 1, 2023 to September 30, 2023). |
Annualized Expense Ratio- A | Beginning Account Value April 1, 2023 | Ending Account Value September 30, 2023 | Expenses Paid During Period- C April 1, 2023 to September 30, 2023 | |||||||
| Treasury Only Portfolio | ||||||||||
| Class I | .18% | |||||||||
| Actual | $ 1,000 | $ 1,024.20 | $ .91 | |||||||
Hypothetical-B | $ 1,000 | $ 1,024.10 | $ .91 | |||||||
| Class II | .33% | |||||||||
| Actual | $ 1,000 | $ 1,023.50 | $ 1.67 | |||||||
Hypothetical-B | $ 1,000 | $ 1,023.35 | $ 1.67 | |||||||
| Class III | .43% | |||||||||
| Actual | $ 1,000 | $ 1,023.00 | $ 2.17 | |||||||
Hypothetical-B | $ 1,000 | $ 1,022.85 | $ 2.17 | |||||||
| Class IV | .68% | |||||||||
| Actual | $ 1,000 | $ 1,021.70 | $ 3.44 | |||||||
Hypothetical-B | $ 1,000 | $ 1,021.60 | $ 3.44 | |||||||
| Select Class | .23% | |||||||||
| Actual | $ 1,000 | $ 1,024.00 | $ 1.16 | |||||||
Hypothetical-B | $ 1,000 | $ 1,023.85 | $ 1.16 | |||||||
| Institutional Class | .14% | |||||||||
| Actual | $ 1,000 | $ 1,024.40 | $ .71 | |||||||
Hypothetical-B | $ 1,000 | $ 1,024.30 | $ .71 | |||||||
| Treasury Portfolio | ||||||||||
| Class I | .18% | |||||||||
| Actual | $ 1,000 | $ 1,025.40 | $ .91 | |||||||
Hypothetical-B | $ 1,000 | $ 1,024.10 | $ .91 | |||||||
| Class II | .33% | |||||||||
| Actual | $ 1,000 | $ 1,024.60 | $ 1.67 | |||||||
Hypothetical-B | $ 1,000 | $ 1,023.35 | $ 1.67 | |||||||
| Class III | .43% | |||||||||
| Actual | $ 1,000 | $ 1,024.10 | $ 2.18 | |||||||
Hypothetical-B | $ 1,000 | $ 1,022.85 | $ 2.17 | |||||||
| Class IV | .68% | |||||||||
| Actual | $ 1,000 | $ 1,022.80 | $ 3.44 | |||||||
Hypothetical-B | $ 1,000 | $ 1,021.60 | $ 3.44 | |||||||
| Select Class | .23% | |||||||||
| Actual | $ 1,000 | $ 1,025.10 | $ 1.16 | |||||||
Hypothetical-B | $ 1,000 | $ 1,023.85 | $ 1.16 | |||||||
| Institutional Class | .14% | |||||||||
| Actual | $ 1,000 | $ 1,025.60 | $ .71 | |||||||
Hypothetical-B | $ 1,000 | $ 1,024.30 | $ .71 | |||||||
| Government Portfolio | ||||||||||
| Class I | .18% | |||||||||
| Actual | $ 1,000 | $ 1,025.40 | $ .91 | |||||||
Hypothetical-B | $ 1,000 | $ 1,024.10 | $ .91 | |||||||
| Class II | .33% | |||||||||
| Actual | $ 1,000 | $ 1,024.70 | $ 1.67 | |||||||
Hypothetical-B | $ 1,000 | $ 1,023.35 | $ 1.67 | |||||||
| Class III | .43% | |||||||||
| Actual | $ 1,000 | $ 1,024.20 | $ 2.18 | |||||||
Hypothetical-B | $ 1,000 | $ 1,022.85 | $ 2.17 | |||||||
| Select Class | .23% | |||||||||
| Actual | $ 1,000 | $ 1,025.20 | $ 1.16 | |||||||
Hypothetical-B | $ 1,000 | $ 1,023.85 | $ 1.16 | |||||||
| Institutional Class | .14% | |||||||||
| Actual | $ 1,000 | $ 1,025.60 | $ .71 | |||||||
Hypothetical-B | $ 1,000 | $ 1,024.30 | $ .71 | |||||||
| Money Market Portfolio | ||||||||||
| Class I | .18% | |||||||||
| Actual | $ 1,000 | $ 1,025.80 | $ .91 | |||||||
Hypothetical-B | $ 1,000 | $ 1,024.10 | $ .91 | |||||||
| Class II | .33% | |||||||||
| Actual | $ 1,000 | $ 1,025.00 | $ 1.67 | |||||||
Hypothetical-B | $ 1,000 | $ 1,023.35 | $ 1.67 | |||||||
| Class III | .43% | |||||||||
| Actual | $ 1,000 | $ 1,024.50 | $ 2.18 | |||||||
Hypothetical-B | $ 1,000 | $ 1,022.85 | $ 2.17 | |||||||
| Select Class | .23% | |||||||||
| Actual | $ 1,000 | $ 1,025.50 | $ 1.16 | |||||||
Hypothetical-B | $ 1,000 | $ 1,023.85 | $ 1.16 | |||||||
| Institutional Class | .14% | |||||||||
| Actual | $ 1,000 | $ 1,026.00 | $ .71 | |||||||
Hypothetical-B | $ 1,000 | $ 1,024.30 | $ .71 | |||||||
| Tax-Exempt Portfolio | ||||||||||
| Class I | .18% | |||||||||
| Actual | $ 1,000 | $ 1,016.20 | $ .91 | |||||||
Hypothetical-B | $ 1,000 | $ 1,024.10 | $ .91 | |||||||
| Class II | .33% | |||||||||
| Actual | $ 1,000 | $ 1,015.50 | $ 1.66 | |||||||
Hypothetical-B | $ 1,000 | $ 1,023.35 | $ 1.67 | |||||||
| Class III | .43% | |||||||||
| Actual | $ 1,000 | $ 1,015.00 | $ 2.17 | |||||||
Hypothetical-B | $ 1,000 | $ 1,022.85 | $ 2.17 | |||||||
| Select Class | .23% | |||||||||
| Actual | $ 1,000 | $ 1,016.00 | $ 1.16 | |||||||
Hypothetical-B | $ 1,000 | $ 1,023.85 | $ 1.16 | |||||||
 |
Item 2.
Code of Ethics
Not applicable.
Item 3.
Audit Committee Financial Expert
Not applicable.
Item 4.
Principal Accountant Fees and Services
Not applicable.
Item 5.
Audit Committee of Listed Registrants
Not applicable.
Item 6.
Investments
(a)
Not applicable.
(b)
Not applicable
Item 7.
Disclosure of Proxy Voting Policies and Procedures for Closed-End Management Investment Companies
Not applicable.
Item 8.
Portfolio Managers of Closed-End Management Investment Companies
Not applicable.
Item 9.
Purchase of Equity Securities by Closed-End Management Investment Company and Affiliated Purchasers
Not applicable.
Item 10.
Submission of Matters to a Vote of Security Holders
There were no material changes to the procedures by which shareholders may recommend nominees to the Fidelity Colchester Street Trust’s Board of Trustees.
Item 11.
Controls and Procedures
(a)(i) The President and Treasurer and the Chief Financial Officer have concluded that the Fidelity Colchester Street Trust’s (the “Trust”) disclosure controls and procedures (as defined in Rule 30a-3(c) under the Investment Company Act) provide reasonable assurances that material information relating to the Trust is made known to them by the appropriate persons, based on their evaluation of these controls and procedures as of a date within 90 days of the filing date of this report.
(a)(ii) There was no change in the Trust’s internal control over financial reporting (as defined in Rule 30a-3(d) under the Investment Company Act) that occurred during the period covered by this report that has materially affected, or is reasonably likely to materially affect, the Trust’s internal control over financial reporting.
Item 12.
Disclosure of Securities Lending Activities for Closed-End Management
Investment Companies
Not applicable.
Item 13.
Exhibits
(a) | (1) | Not applicable. |
(a) | (2) | |
(a) | (3) | Not applicable. |
(b) |
SIGNATURES
Pursuant to the requirements of the Securities Exchange Act of 1934 and the Investment Company Act of 1940, the registrant has duly caused this report to be signed on its behalf by the undersigned, thereunto duly authorized.
Fidelity Colchester Street Trust
By: | /s/Laura M. Del Prato |
Laura M. Del Prato | |
President and Treasurer | |
Date: | November 21, 2023 |
Pursuant to the requirements of the Securities Exchange Act of 1934 and the Investment Company Act of 1940, this report has been signed below by the following persons on behalf of the registrant and in the capacities and on the dates indicated.
By: | /s/Laura M. Del Prato |
Laura M. Del Prato | |
President and Treasurer | |
Date: | November 21, 2023 |
By: | /s/John J. Burke III |
John J. Burke III | |
Chief Financial Officer | |
Date: | November 21, 2023 |