UNITED STATES
SECURITIES AND EXCHANGE COMMISSION
Washington, D.C. 20549
FORM N-CSR
CERTIFIED SHAREHOLDER REPORT OF REGISTERED
MANAGEMENT INVESTMENT COMPANIES
Investment Company Act file number 811-3320
Fidelity Colchester Street Trust
(Exact name of registrant as specified in charter)
82 Devonshire St., Boston, Massachusetts 02109
(Address of principal executive offices) (Zip code)
Scott C. Goebel, Secretary
82 Devonshire St.
Boston, Massachusetts 02109
(Name and address of agent for service)
Registrant's telephone number, including area code: 617-563-7000
Date of fiscal year end: | March 31 |
| |
Date of reporting period: | March 31, 2011 |
Item 1. Reports to Stockholders
Fidelity ®
Institutional
Money Market
Funds
Annual Report
March 31, 2011
(2_fidelity_logos) (Registered_Trademark)
Contents
Fund Goals:
Treasury Only Portfolio seeks as high a level of current income as is consistent with the security of principal and liquidity.
Treasury Portfolio, Government Portfolio, Prime Money Market Portfolio, and Money Market Portfolio seek to obtain as high a level of current income as is consistent with the preservation of principal and liquidity within the limitations prescribed for the fund.
Tax-Exempt Portfolio seeks to obtain as high a level of interest income exempt from federal income tax as is consistent with liquidity and stability of principal.
To view a fund's proxy voting guidelines and proxy voting record for the 12-month period ended June 30, visit http://www.fidelity.com/proxyvotingresults or visit the Securities and Exchange Commission's (SEC) web site at http://www.sec.gov. You may also call 1-877-297-2952, or for Class F, call 1-800-835-5092, to request a free copy of the proxy voting guidelines.
Standard & Poor's, S&P and S&P 500 are registered service marks of The McGraw-Hill Companies, Inc. and have been licensed for use by Fidelity Distributors Corporation.
Other third party marks appearing herein are the property of their respective owners.
All other marks appearing herein are registered or unregistered trademarks or service marks of FMR LLC or an affiliated company.
The general research services agreement with Fidelity Research & Analysis Company has been terminated and is no longer in effect for the funds.
Annual Report
As a shareholder of a Fund, you incur two types of costs: (1) transaction costs, and (2) ongoing costs, including management fees, distribution and/or service (12b-1) fees and other Fund expenses. This Example is intended to help you understand your ongoing costs (in dollars) of investing in the Funds and to compare these costs with the ongoing costs of investing in other mutual funds.
The Example is based on an investment of $1,000 invested at the beginning of the period and held for the entire period (October 1, 2010 to March 31, 2011).
Actual Expenses
The first line of the accompanying table for each class of each fund provides information about actual account values and actual expenses. You may use the information in this line, together with the amount you invested, to estimate the expenses that you paid over the period. Simply divide your account value by $1,000.00 (for example, an $8,600 account value divided by $1,000.00 = 8.6), then multiply the result by the number in the first line for a class of the fund under the heading entitled "Expenses Paid During Period" to estimate the expenses you paid on your account during this period. A small balance maintenance fee of $12.00 that is charged once a year may apply for certain accounts with a value of less than $2,000. This fee is not included in the table below. If it was, the estimate of expenses you paid during the period would be higher, and your ending account value lower, by this amount. In addition, each Fund, as a shareholder in the underlying Fidelity Central Funds, will indirectly bear its pro-rata share of the fees and expenses incurred by the underlying Fidelity Central Funds. These fees and expenses are not included in the Fund's annualized expense ratio used to calculate the expense estimate in the table below.
Hypothetical Example for Comparison Purposes
The second line of the accompanying table for each class of each fund provides information about hypothetical account values and hypothetical expenses based on a Class' actual expense ratio and an assumed rate of return of 5% per year before expenses, which is not the Class' actual return. The hypothetical account values and expenses may not be used to estimate the actual ending account balance or expenses you paid for the period. You may use this information to compare the ongoing costs of investing in the Fund and other funds. To do so, compare this 5% hypothetical example with the 5% hypothetical examples that appear in the shareholder reports of the other funds. A small balance maintenance fee of $12.00 that is charged once a year may apply for certain accounts with a value of less than $2,000. This fee is not included in the table below. If it was, the estimate of expenses you paid during the period would be higher, and your ending account value lower, by this amount. In addition, each Fund, as a shareholder in the underlying Fidelity Central Funds, will indirectly bear its pro-rata share of the fees and expenses incurred by the underlying Fidelity Central Funds. These fees and expenses are not included in the Fund's annualized expense ratio used to calculate the expense estimate in the table below.
Please note that the expenses shown in the table are meant to highlight your ongoing costs only and do not reflect any transaction costs. Therefore, the second line of the table is useful in comparing ongoing costs only, and will not help you determine the relative total costs of owning different funds.
| Annualized
Expense Ratio | Beginning
Account Value
October 1, 2010 | Ending
Account Value
March 31, 2011 | Expenses Paid
During Period*
October 1, 2010 to
March 31, 2011 |
Treasury Only Portfolio | | | | |
Class I | .16% | | | |
Actual | | $ 1,000.00 | $ 1,000.10 | $ .80** |
HypotheticalA | | $ 1,000.00 | $ 1,024.13 | $ .81** |
Class II | .16% | | | |
Actual | | $ 1,000.00 | $ 1,000.10 | $ .80** |
HypotheticalA | | $ 1,000.00 | $ 1,024.13 | $ .81** |
Class III | .16% | | | |
Actual | | $ 1,000.00 | $ 1,000.10 | $ .80** |
HypotheticalA | | $ 1,000.00 | $ 1,024.13 | $ .81** |
Class IV | .15% | | | |
Actual | | $ 1,000.00 | $ 1,000.10 | $ .75** |
HypotheticalA | | $ 1,000.00 | $ 1,024.18 | $ .76** |
Select Class | .16% | | | |
Actual | | $ 1,000.00 | $ 1,000.10 | $ .80** |
HypotheticalA | | $ 1,000.00 | $ 1,024.13 | $ .81** |
Treasury Portfolio | | | | |
Class I | .19% | | | |
Actual | | $ 1,000.00 | $ 1,000.10 | $ .95 |
HypotheticalA | | $ 1,000.00 | $ 1,023.98 | $ .96 |
Class II | .20% | | | |
Actual | | $ 1,000.00 | $ 1,000.00 | $ 1.00** |
HypotheticalA | | $ 1,000.00 | $ 1,023.93 | $ 1.01** |
| Annualized
Expense Ratio | Beginning
Account Value
October 1, 2010 | Ending
Account Value
March 31, 2011 | Expenses Paid
During Period*
October 1, 2010 to
March 31, 2011 |
Treasury Portfolio | | | | |
Class III | .20% | | | |
Actual | | $ 1,000.00 | $ 1,000.00 | $ 1.00** |
HypotheticalA | | $ 1,000.00 | $ 1,023.93 | $ 1.01** |
Class IV | .20% | | | |
Actual | | $ 1,000.00 | $ 1,000.00 | $ 1.00** |
HypotheticalA | | $ 1,000.00 | $ 1,023.93 | $ 1.01** |
Select Class | .20% | | | |
Actual | | $ 1,000.00 | $ 1,000.00 | $ 1.00** |
HypotheticalA | | $ 1,000.00 | $ 1,023.93 | $ 1.01** |
Government Portfolio | | | | |
Class I | .21% | | | |
Actual | | $ 1,000.00 | $ 1,000.20 | $ 1.05 |
HypotheticalA | | $ 1,000.00 | $ 1,023.88 | $ 1.06 |
Class II | .23% | | | |
Actual | | $ 1,000.00 | $ 1,000.10 | $ 1.15** |
HypotheticalA | | $ 1,000.00 | $ 1,023.78 | $ 1.16** |
Class III | .23% | | | |
Actual | | $ 1,000.00 | $ 1,000.10 | $ 1.15** |
HypotheticalA | | $ 1,000.00 | $ 1,023.78 | $ 1.16** |
Select Class | .24% | | | |
Actual | | $ 1,000.00 | $ 1,000.10 | $ 1.20 |
HypotheticalA | | $ 1,000.00 | $ 1,023.73 | $ 1.21 |
Prime Money Market Portfolio | | | | |
Class I | .20% | | | |
Actual | | $ 1,000.00 | $ 1,000.90 | $ 1.00 |
HypotheticalA | | $ 1,000.00 | $ 1,023.93 | $ 1.01 |
Class II | .35% | | | |
Actual | | $ 1,000.00 | $ 1,000.10 | $ 1.75 |
HypotheticalA | | $ 1,000.00 | $ 1,023.19 | $ 1.77 |
Class III | .36% | | | |
Actual | | $ 1,000.00 | $ 1,000.00 | $ 1.80** |
HypotheticalA | | $ 1,000.00 | $ 1,023.14 | $ 1.82** |
Class IV | .36% | | | |
Actual | | $ 1,000.00 | $ 1,000.00 | $ 1.80** |
HypotheticalA | | $ 1,000.00 | $ 1,023.14 | $ 1.82** |
Select Class | .25% | | | |
Actual | | $ 1,000.00 | $ 1,000.60 | $ 1.25 |
HypotheticalA | | $ 1,000.00 | $ 1,023.68 | $ 1.26 |
Institutional Class | .14% | | | |
Actual | | $ 1,000.00 | $ 1,001.20 | $ .70 |
HypotheticalA | | $ 1,000.00 | $ 1,024.23 | $ .71 |
Money Market Portfolio | | | | |
Class I | .18% | | | |
Actual | | $ 1,000.00 | $ 1,001.10 | $ .90 |
HypotheticalA | | $ 1,000.00 | $ 1,024.03 | $ .91 |
Class II | .33% | | | |
Actual | | $ 1,000.00 | $ 1,000.30 | $ 1.65 |
HypotheticalA | | $ 1,000.00 | $ 1,023.29 | $ 1.66 |
| Annualized
Expense Ratio | Beginning
Account Value
October 1, 2010 | Ending
Account Value
March 31, 2011 | Expenses Paid
During Period*
October 1, 2010 to
March 31, 2011 |
Money Market Portfolio | | | | |
Class III | .39% | | | |
Actual | | $ 1,000.00 | $ 1,000.00 | $ 1.94** |
HypotheticalA | | $ 1,000.00 | $ 1,022.99 | $ 1.97** |
Select Class | .23% | | | |
Actual | | $ 1,000.00 | $ 1,000.80 | $ 1.15 |
HypotheticalA | | $ 1,000.00 | $ 1,023.78 | $ 1.16 |
Class F | .14% | | | |
Actual | | $ 1,000.00 | $ 1,001.30 | $ .70 |
HypotheticalA | | $ 1,000.00 | $ 1,024.23 | $ .71 |
Institutional Class | .14% | | | |
Actual | | $ 1,000.00 | $ 1,001.30 | $ .70 |
HypotheticalA | | $ 1,000.00 | $ 1,024.23 | $ .71 |
Tax-Exempt Portfolio | | | | |
Class I | .22% | | | |
Actual | | $ 1,000.00 | $ 1,000.40 | $ 1.10 |
HypotheticalA | | $ 1,000.00 | $ 1,023.83 | $ 1.11 |
Class II | .29% | | | |
Actual | | $ 1,000.00 | $ 1,000.00 | $ 1.45** |
HypotheticalA | | $ 1,000.00 | $ 1,023.49 | $ 1.46** |
Class III | .29% | | | |
Actual | | $ 1,000.00 | $ 1,000.00 | $ 1.45** |
HypotheticalA | | $ 1,000.00 | $ 1,023.49 | $ 1.46** |
Select Class | .25% | | | |
Actual | | $ 1,000.00 | $ 1,000.20 | $ 1.25 |
HypotheticalA | | $ 1,000.00 | $ 1,023.68 | $ 1.26 |
A 5% return per year before expenses
* Expenses are equal to each Class' annualized expense ratio, multiplied by the average account value over the period, multiplied by 182/ 365 (to reflect the one-half year period).
** If certain fees were not voluntarily waived by FMR or its affiliates during the period, the annualized expense ratio and the expenses paid in the actual and hypothetical examples above would have been as follows:
| Annualized
Expense Ratio | Expenses Paid |
Treasury Only Portfolio | | |
Class I | .21% | |
Actual | | $ 1.05 |
HypotheticalA | | $ 1.06 |
Class II | .36% | |
Actual | | $ 1.79 |
HypotheticalA | | $ 1.82 |
Class III | .47% | |
Actual | | $ 2.34 |
HypotheticalA | | $ 2.37 |
Class IV | .71% | |
Actual | | $ 3.54 |
HypotheticalA | | $ 3.58 |
| Annualized
Expense Ratio | Expenses Paid |
Select Class | .26% | |
Actual | | $ 1.30 |
HypotheticalA | | $ 1.31 |
Treasury Portfolio | | |
Class II | .36% | |
Actual | | $ 1.79 |
HypotheticalA | | $ 1.82 |
Class III | .46% | |
Actual | | $ 2.29 |
HypotheticalA | | $ 2.32 |
Class IV | .71% | |
Actual | | $ 3.54 |
HypotheticalA | | $ 3.58 |
Select Class | .26% | |
Actual | | $ 1.30 |
HypotheticalA | | $ 1.31 |
Government Portfolio | | |
Class II | .36% | |
Actual | | $ 1.79 |
HypotheticalA | | $ 1.82 |
Class III | .46% | |
Actual | | $ 2.29 |
HypotheticalA | | $ 2.32 |
Prime Money Market Portfolio | | |
Class III | .45% | |
Actual | | $ 2.24 |
HypotheticalA | | $ 2.27 |
Class IV | .70% | |
Actual | | $ 3.49 |
HypotheticalA | | $ 3.53 |
Money Market Portfolio | | |
Class III | .43% | |
Actual | | $ 2.14 |
HypotheticalA | | $ 2.17 |
Tax-Exempt Portfolio | | |
Class II | .35% | |
Actual | | $ 1.74 |
HypotheticalA | | $ 1.77 |
Class III | .45% | |
Actual | | $ 2.24 |
HypotheticalA | | $ 2.27 |
A 5% return per year before expenses
Annual Report
Treasury Only Portfolio
Investment Changes (Unaudited)
Weighted Average Maturity Diversification |
Days | % of fund's
investments
3/31/11 | % of fund's
investments
9/30/10 | % of fund's
investments
3/31/10 |
0 - 30 | 34.3 | 49.8 | 34.5 |
31 - 90 | 43.7 | 38.4 | 49.8 |
91 - 180 | 18.8 | 7.7 | 12.6 |
181 - 397 | 3.2 | 4.1 | 3.1 |
Effective maturity is determined in accordance with the requirements of Rule 2a-7 under the Investment Company Act of 1940. |
Weighted Average Maturity |
| 3/31/11 | 9/30/10 | 3/31/10 |
Treasury Only Portfolio | 58 Days | 52 Days | 55 Days |
All Taxable Money Market Fund Average* | 45 Days | 44 Days | 44 Days |
This is a weighted average of all the maturities of the securities held in a fund. Weighted Average Maturity (WAM) can be used as a measure of sensitivity to interest rate changes and markets changes. Generally, the longer the maturity, the greater the sensitivity to such changes. WAM is based on the dollar-weighted average length of time until principal payments must be paid. Depending on the types of securities held in a fund, certain maturity shortening devices (e.g., demand features, interest rate resets, and call options) may be taken into account when calculating the WAM. |
Weighted Average Life |
| 3/31/11 | 9/30/10 | 3/31/10 |
Treasury Only Portfolio | 58 Days | 52 Days | n/a** |
Weighted Average Life (WAL) is the weighted average of the life of the securities held in a fund or portfolio and can be used as a measure of sensitivity to changes in liquidity and/or credit risk. Generally, the higher the value, the greater the sensitivity. WAL is based on the dollar-weighted average length of time until principal payments must be paid, taking into account any call options exercised by the issuer and any permissible maturity shortening features other than interest rate resets. The difference between WAM and WAL is that WAM takes into account interest rate resets and WAL does not. WAL for money market funds is not the same as WAL of a mortgage- or asset-backed security. |
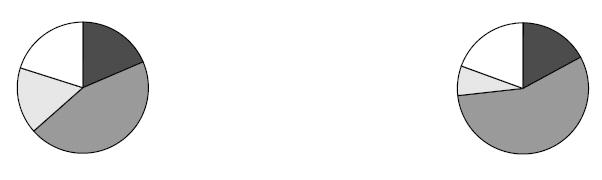
Asset Allocation (% of fund's net assets) |
As of March 31, 2011 | As of September 30, 2010 |
 | U.S. Treasury Obligations 99.9% | | | U.S. Treasury Obligations 100.1% | |
 | Net Other Assets 0.1% | |  | Net Other Assets*** (0.1)% | |

* Source: iMoneyNet, Inc.
** Information not available
*** Net Other Assets not included in the pie chart.
Annual Report
Treasury Only Portfolio
Investments March 31, 2011
Showing Percentage of Net Assets
U.S. Treasury Obligations - 96.4% |
| | Yield (a) | Principal
Amount (000s) | Value (000s) |
U.S. Treasury Bills - 73.7% |
| 4/7/11 to 7/21/11 | 0.08 to 0.23% | $ 5,451,328 | $ 5,450,318 |
U.S. Treasury Notes - 22.7% |
| 4/30/11 to 11/30/11 | 0.11 to 0.43 | 1,676,788 | 1,679,623 |
TOTAL U.S. TREASURY OBLIGATIONS | 7,129,941 |
U.S. Treasury Inflation Protected Obligations - 3.5% |
|
U.S. Treasury Notes - 3.5% |
| 4/15/11 | 0.15 | 260,695 | 261,563 |
TOTAL INVESTMENT PORTFOLIO - 99.9% (Cost $7,391,504) | | 7,391,504 |
NET OTHER ASSETS (LIABILITIES) - 0.1% | | 6,448 |
NET ASSETS - 100% | $ 7,397,952 |
Legend |
(a) Yield represents either the annualized yield at the date of purchase, or the stated coupon rate, or, for floating and adjustable rate securities, the rate at period end. |
Other Information |
The date shown for securities represents the date when principal payments must be paid, taking into account any call options exercised by the issuer and any permissible maturity shortening features other than interest rate resets. |
All investments are categorized as Level 2 under the Fair Value Hierarchy. The inputs or methodology used for valuing securities may not be an indication of the risk associated with investing in those securities. For more information on valuation inputs, please refer to the Security Valuation section in the accompanying Notes to Financial Statements. |
See accompanying notes which are an integral part of the financial statements.
Annual Report
Treasury Only Portfolio
Financial Statements
Statement of Assets and Liabilities
Amounts in thousands (except per-share amounts) | March 31, 2011 |
| | |
Assets | | |
Investment in securities, at value - See accompanying schedule: Unaffiliated issuers (cost $7,391,504) | | $ 7,391,504 |
Receivable for fund shares sold | | 22,132 |
Interest receivable | | 7,761 |
Prepaid expenses | | 13 |
Other receivables | | 4 |
Total assets | | 7,421,414 |
| | |
Liabilities | | |
Payable for fund shares redeemed | $ 22,499 | |
Distributions payable | 14 | |
Accrued management fee | 844 | |
Other affiliated payables | 53 | |
Other payables and accrued expenses | 52 | |
Total liabilities | | 23,462 |
| | |
Net Assets | | $ 7,397,952 |
Net Assets consist of: | | |
Paid in capital | | $ 7,397,952 |
Net Assets | | $ 7,397,952 |
| | |
Class I:
Net Asset Value, offering price and redemption price per share ($6,149,343 ÷ 6,148,308 shares) | | $ 1.00 |
| | |
Class II:
Net Asset Value, offering price and redemption price per share ($585,312 ÷ 585,356 shares) | | $ 1.00 |
| | |
Class III:
Net Asset Value, offering price and redemption price per share ($391,653 ÷ 391,544 shares) | | $ 1.00 |
| | |
Class IV:
Net Asset Value, offering price and redemption price per share ($62,492 ÷ 62,488 shares) | | $ 1.00 |
| | |
Select Class:
Net Asset Value, offering price and redemption price per share ($209,152 ÷ 209,157 shares) | | $ 1.00 |
Statement of Operations
Amounts in thousands | Year ended March 31, 2011 |
| | |
Investment Income | | |
Interest | | $ 15,902 |
| | |
Expenses | | |
Management fee | $ 11,959 | |
Transfer agent fees | 5,171 | |
Distribution and service plan fees | 2,569 | |
Accounting fees and expenses | 705 | |
Custodian fees and expenses | 97 | |
Independent trustees' compensation | 33 | |
Registration fees | 116 | |
Audit | 51 | |
Legal | 28 | |
Miscellaneous | 95 | |
Total expenses before reductions | 20,824 | |
Expense reductions | (5,778) | 15,046 |
Net investment income (loss) | | 856 |
Realized and Unrealized Gain (Loss) Net realized gain (loss) on: | | |
Investment securities: | | |
Unaffiliated issuers | | 101 |
Net increase in net assets resulting from operations | | $ 957 |
See accompanying notes which are an integral part of the financial statements.
Annual Report
Statement of Changes in Net Assets
Amounts in thousands | Year ended
March 31,
2011 | Year ended
March 31,
2010 |
Increase (Decrease) in Net Assets | | |
Operations | | |
Net investment income (loss) | $ 856 | $ 13,232 |
Net realized gain (loss) | 101 | 523 |
Net increase in net assets resulting from operations | 957 | 13,755 |
Distributions to shareholders from net investment income | (854) | (13,235) |
Distributions to shareholders from net realized gain | (245) | (361) |
Total distributions | (1,099) | (13,596) |
Share transactions - net increase (decrease) | (2,775,464) | (8,004,814) |
Total increase (decrease) in net assets | (2,775,606) | (8,004,655) |
| | |
Net Assets | | |
Beginning of period | 10,173,558 | 18,178,213 |
End of period | $ 7,397,952 | $ 10,173,558 |
Financial Highlights - Class I
Years ended March 31, | 2011 | 2010 | 2009 | 2008 | 2007 |
Selected Per-Share Data | | | | | |
Net asset value, beginning of period | $ 1.00 | $ 1.00 | $ 1.00 | $ 1.00 | $ 1.00 |
Income from Investment Operations | | | | | |
Net investment income (loss) | - C | .001 | .010 | .040 | .048 |
Net realized and unrealized gain (loss) C | - | - | - | - | - |
Total from investment operations | - C | .001 | .010 | .040 | .048 |
Distributions from net investment income | - C | (.001) | (.010) | (.040) | (.048) |
Distributions from net realized gain | - C | - C | - | - | - |
Total distributions | - C | (.001) | (.010) | (.040) | (.048) |
Net asset value, end of period | $ 1.00 | $ 1.00 | $ 1.00 | $ 1.00 | $ 1.00 |
Total Return A | .01% | .09% | 1.05% | 4.03% | 4.87% |
Ratios to Average Net Assets B | | | | | |
Expenses before reductions | .21% | .21% | .24% | .24% | .24% |
Expenses net of fee waivers, if any | .18% | .20% | .23% | .20% | .20% |
Expenses net of all reductions | .18% | .20% | .23% | .20% | .20% |
Net investment income (loss) | .01% | .10% | .81% | 3.48% | 4.78% |
Supplemental Data | | | | | |
Net assets, end of period (in millions) | $ 6,149 | $ 8,371 | $ 15,535 | $ 6,775 | $ 1,425 |
A Total returns would have been lower had certain expenses not been reduced during the periods shown.
B Expense ratios reflect operating expenses of the class. Expenses before reductions do not reflect amounts reimbursed or waived or reductions from expense offset arrangements and do not represent the amount paid by the class during periods when reimbursements, waivers or reductions occur. Expenses net of fee waivers reflect expenses after reimbursement and waivers but prior to reductions from expense offset arrangements. Expenses net of all reductions represent the net expenses paid by the class.
C Amount represents less than $.001 per share.
See accompanying notes which are an integral part of the financial statements.
Annual Report
Financial Highlights - Class II
Years ended March 31, | 2011 | 2010 | 2009 | 2008 | 2007 |
Selected Per-Share Data | | | | | |
Net asset value, beginning of period | $ 1.00 | $ 1.00 | $ 1.00 | $ 1.00 | $ 1.00 |
Income from Investment Operations | | | | | |
Net investment income (loss) | - C | - C | .009 | .038 | .046 |
Net realized and unrealized gain (loss) C | - | - | - | - | - |
Total from investment operations | - C | - C | .009 | .038 | .046 |
Distributions from net investment income | - C | - C | (.009) | (.038) | (.046) |
Distributions from net realized gain | - C | - C | - | - | - |
Total distributions | - C | - C | (.009) | (.038) | (.046) |
Net asset value, end of period | $ 1.00 | $ 1.00 | $ 1.00 | $ 1.00 | $ 1.00 |
Total Return A | .01% | .03% | .89% | 3.88% | 4.71% |
Ratios to Average Net Assets B | | | | | |
Expenses before reductions | .36% | .36% | .39% | .39% | .39% |
Expenses net of fee waivers, if any | .17% | .27% | .38% | .35% | .35% |
Expenses net of all reductions | .17% | .27% | .38% | .35% | .35% |
Net investment income (loss) | .01% | .03% | .66% | 3.58% | 4.63% |
Supplemental Data | | | | | |
Net assets, end of period (in millions) | $ 585 | $ 649 | $ 906 | $ 514 | $ 210 |
A Total returns would have been lower had certain expenses not been reduced during the periods shown.
B Expense ratios reflect operating expenses of the class. Expenses before reductions do not reflect amounts reimbursed or waived or reductions from expense offset arrangements and do not represent the amount paid by the class during periods when reimbursements, waivers or reductions occur. Expenses net of fee waivers reflect expenses after reimbursement and waivers but prior to reductions from expense offset arrangements. Expenses net of all reductions represent the net expenses paid by the class.
C Amount represents less than $.001 per share.
Financial Highlights - Class III
Years ended March 31, | 2011 | 2010 | 2009 | 2008 | 2007 |
Selected Per-Share Data | | | | | |
Net asset value, beginning of period | $ 1.00 | $ 1.00 | $ 1.00 | $ 1.00 | $ 1.00 |
Income from Investment Operations | | | | | |
Net investment income (loss) | - C | - C | .008 | .037 | .045 |
Net realized and unrealized gain (loss) C | - | - | - | - | - |
Total from investment operations | - C | - C | .008 | .037 | .045 |
Distributions from net investment income | - C | - C | (.008) | (.037) | (.045) |
Distributions from net realized gain | - C | - C | - | - | - |
Total distributions | - C | - C | (.008) | (.037) | (.045) |
Net asset value, end of period | $ 1.00 | $ 1.00 | $ 1.00 | $ 1.00 | $ 1.00 |
Total Return A | .01% | .01% | .80% | 3.77% | 4.61% |
Ratios to Average Net Assets B | | | | | |
Expenses before reductions | .46% | .46% | .49% | .49% | .49% |
Expenses net of fee waivers, if any | .18% | .28% | .47% | .45% | .45% |
Expenses net of all reductions | .18% | .28% | .47% | .45% | .45% |
Net investment income (loss) | .01% | .02% | .57% | 3.46% | 4.53% |
Supplemental Data | | | | | |
Net assets, end of period (in millions) | $ 392 | $ 615 | $ 835 | $ 514 | $ 187 |
A Total returns would have been lower had certain expenses not been reduced during the periods shown.
B Expense ratios reflect operating expenses of the class. Expenses before reductions do not reflect amounts reimbursed or waived or reductions from expense offset arrangements and do not represent the amount paid by the class during periods when reimbursements, waivers or reductions occur. Expenses net of fee waivers reflect expenses after reimbursement and waivers but prior to reductions from expense offset arrangements. Expenses net of all reductions represent the net expenses paid by the class.
C Amount represents less than $.001 per share.
See accompanying notes which are an integral part of the financial statements.
Annual Report
Financial Highlights - Class IV
Years ended March 31, | 2011 | 2010 | 2009 | 2008 D |
Selected Per-Share Data | | | | |
Net asset value, beginning of period | $ 1.00 | $ 1.00 | $ 1.00 | $ 1.00 |
Income from Investment Operations | | | | |
Net investment income (loss) | - F | - F | .006 | .007 |
Net realized and unrealized gain (loss) F | - | - | - | - |
Total from investment operations | - F | - F | .006 | .007 |
Distributions from net investment income | - F | - F | (.006) | (.007) |
Distributions from net realized gain | - F | - F | - | - |
Total distributions | - F | - F | (.006) | (.007) |
Net asset value, end of period | $ 1.00 | $ 1.00 | $ 1.00 | $ 1.00 |
Total Return B, C | .01% | .01% | .60% | .71% |
Ratios to Average Net Assets E | | | | |
Expenses before reductions | .71% | .72% | .74% | .77% A |
Expenses net of fee waivers, if any | .17% | .30% | .65% | .70% A |
Expenses net of all reductions | .17% | .30% | .65% | .70% A |
Net investment income (loss) | .01% | .01% | .39% | 1.70% A |
Supplemental Data | | | | |
Net assets, end of period (in millions) | $ 62 | $ 60 | $ 140 | $ 39 |
A Annualized
B Total returns for periods of less than one year are not annualized.
C Total returns would have been lower had certain expenses not been reduced during the periods shown.
D For the period December 12, 2007 (commencement of sale of shares) to March 31, 2008.
E Expense ratios reflect operating expenses of the class. Expenses before reductions do not reflect amounts reimbursed or waived or reductions from expense offset arrangements and do not represent the amount paid by the class during periods when reimbursements, waivers or reductions occur. Expense ratios before reductions for start-up periods may not be representative of longer-term operating periods. Expenses net of fee waivers reflect expenses after reimbursement and waivers but prior to reductions from expense offset arrangements. Expenses net of all reductions represent the net expenses paid by the class.
F Amount represents less than $.001 per share.
Financial Highlights - Select Class
Years ended March 31, | 2011 | 2010 | 2009 | 2008 | 2007 |
Selected Per-Share Data | | | | | |
Net asset value, beginning of period | $ 1.00 | $ 1.00 | $ 1.00 | $ 1.00 | $ 1.00 |
Income from Investment Operations | | | | | |
Net investment income (loss) | - C | .001 | .010 | .039 | .047 |
Net realized and unrealized gain (loss) C | - | - | - | - | - |
Total from investment operations | - C | .001 | .010 | .039 | .047 |
Distributions from net investment income | - C | (.001) | (.010) | (.039) | (.047) |
Distributions from net realized gain | - C | - C | - | - | - |
Total distributions | - C | (.001) | (.010) | (.039) | (.047) |
Net asset value, end of period | $ 1.00 | $ 1.00 | $ 1.00 | $ 1.00 | $ 1.00 |
Total Return A | .01% | .07% | .99% | 3.98% | 4.81% |
Ratios to Average Net Assets B | | | | | |
Expenses before reductions | .26% | .26% | .29% | .29% | .29% |
Expenses net of fee waivers, if any | .18% | .23% | .28% | .25% | .25% |
Expenses net of all reductions | .18% | .23% | .28% | .25% | .25% |
Net investment income (loss) | .01% | .07% | .76% | 3.50% | 4.73% |
Supplemental Data | | | | | |
Net assets, end of period (in millions) | $ 209 | $ 478 | $ 763 | $ 174 | $ 17 |
A Total returns would have been lower had certain expenses not been reduced during the periods shown.
B Expense ratios reflect operating expenses of the class. Expenses before reductions do not reflect amounts reimbursed or waived or reductions from expense offset arrangements and do not represent the amount paid by the class during periods when reimbursements, waivers or reductions occur. Expenses net of fee waivers reflect expenses after reimbursement and waivers but prior to reductions from expense offset arrangements. Expenses net of all reductions represent the net expenses paid by the class.
C Amount represents less than $.001 per share.
See accompanying notes which are an integral part of the financial statements.
Annual Report
Treasury Portfolio
Investment Changes (Unaudited)
Weighted Average Maturity Diversification |
Days | % of fund's
investments
3/31/11 | % of fund's
investments
9/30/10 | % of fund's
investments
3/31/10 |
0 - 30 | 68.1 | 71.2 | 64.8 |
31 - 90 | 3.7 | 4.5 | 23.0 |
91 - 180 | 14.7 | 12.1 | 8.6 |
181 - 397 | 13.5 | 12.2 | 3.6 |
Effective maturity is determined in accordance with the requirements of Rule 2a-7 under the Investment Company Act of 1940. |
Weighted Average Maturity |
| 3/31/11 | 9/30/10 | 3/31/10 |
Treasury Portfolio | 51 Days | 54 Days | 37 Days |
All Taxable Money Market Funds Average* | 45 Days | 44 Days | 44 Days |
This is a weighted average of all the maturities of the securities held in a fund. Weighted Average Maturity (WAM) can be used as a measure of sensitivity to interest rate changes and markets changes. Generally, the longer the maturity, the greater the sensitivity to such changes. WAM is based on the dollar-weighted average length of time until principal payments must be paid. Depending on the types of securities held in a fund, certain maturity shortening devices (e.g., demand features, interest rate resets, and call options) may be taken into account when calculating the WAM. |
Weighted Average Life |
| 3/31/11 | 9/30/10 | 3/31/10 |
Treasury Portfolio | 51 Days | 54 Days | n/a** |
Weighted Average Life (WAL) is the weighted average of the life of the securities held in a fund or portfolio and can be used as a measure of sensitivity to changes in liquidity and/or credit risk. Generally, the higher the value, the greater the sensitivity. WAL is based on the dollar-weighted average length of time until principal payments must be paid, taking into account any call options exercised by the issuer and any permissible maturity shortening features other than interest rate resets. The difference between WAM and WAL is that WAM takes into account interest rate resets and WAL does not. WAL for money market funds is not the same as WAL of a mortgage- or asset-backed security. |
Asset Allocation (% of fund's net assets) |
As of March 31, 2011 | As of September 30, 2010 |
| U.S. Treasury Obligations 37.0% | | | U.S. Treasury Obligations 30.5% | |
 | Repurchase Agreements 62.9% | | | Repurchase Agreements 69.5% | |
| Net Other Assets 0.1% | | | Net Other Assets 0.0% | |

* Source: iMoneyNet, Inc.
** Information not available
Annual Report
Treasury Portfolio
Investments March 31, 2011
Showing Percentage of Net Assets
U.S. Treasury Obligations - 33.3% |
| | Yield (a) | Principal
Amount (000s) | Value (000s) |
U.S. Treasury Bills - 9.1% |
| 5/26/11 to 12/15/11 | 0.17 to 0.30% | $ 1,215,000 | $ 1,214,140 |
U.S. Treasury Notes - 24.2% |
| 4/30/11 to 11/30/11 | 0.18 to 0.43 | 3,222,000 | 3,234,188 |
TOTAL U.S. TREASURY OBLIGATIONS | 4,448,328 |
U.S. Treasury Inflation Protected Obligations - 3.7% |
|
U.S. Treasury Notes - 3.7% |
| 4/15/11 | 0.15 | 489,219 | 490,848 |
Repurchase Agreements - 62.9% |
| Maturity
Amount
(000s) | |
In a joint trading account at: | | |
0.11% dated 3/31/11 due 4/1/11 (Collateralized by U.S. Treasury Obligations) # | $ 509,909 | 509,907 |
0.13% dated 3/31/11 due 4/1/11 (Collateralized by U.S. Treasury Obligations) # | 5,878,480 | 5,878,459 |
With: | | |
BNP Paribas Securities Corp. at: | | |
0.15%, dated 2/25/11 due 4/7/11 (Collateralized by U.S. Treasury Obligations valued at $406,376,958, 0%- 9.13%, 4/7/11 - 2/15/39) | 398,149 | 398,000 |
0.2%, dated 1/5/11 due 4/4/11 (Collateralized by U.S. Treasury Obligations valued at $415,338,347, 0%- 6.63%, 5/5/11 - 2/15/27) | 407,201 | 407,000 |
Commerz Markets LLC at 0.16%, dated 2/16/11 due 4/7/11 (Collateralized by U.S. Treasury Obligations valued at $407,250,531, 0%- 10.63%, 4/30/11 - 2/15/41) | 399,158 | 399,000 |
Federal Reserve Bank of New York at: | | |
0.1%, dated 3/29/11 due 4/5/11 (Collateralized by U.S. Treasury Obligations valued at $10,000,434, 1%, 7/31/11) | 10,000 | 10,000 |
0.14%, dated 3/31/11 due 4/4/11 (Collateralized by U.S. Treasury Obligations valued at $10,000,113, 4.88%, 4/30/11) | 10,000 | 10,000 |
|
| Maturity
Amount
(000s) | | Value (000s) |
Morgan Stanley & Co., Inc. at 0.14%, dated: | | | |
3/8/11 due 4/7/11 (Collateralized by U.S. Treasury Obligations valued at $407,440,521, 0%- 11.25%, 4/28/11 - 11/15/40) | $ 399,047 | | $ 399,000 |
3/9/11 due 4/7/11 (Collateralized by U.S. Treasury Obligations valued at $407,016,503, 0%- 8.75%, 6/30/11 - 8/15/27) | 399,090 | | 399,000 |
TOTAL REPURCHASE AGREEMENTS | 8,410,366 |
TOTAL INVESTMENT PORTFOLIO - 99.9% (Cost $13,349,542) | | 13,349,542 |
NET OTHER ASSETS (LIABILITIES) - 0.1% | | 15,164 |
NET ASSETS - 100% | $ 13,364,706 |
Legend |
(a) Yield represents either the annualized yield at the date of purchase, or the stated coupon rate, or, for floating and adjustable rate securities, the rate at period end. |
# Additional information on each counterparty to the repurchase agreement is as follows: |
Repurchase Agreement / Counterparty | Value
(Amounts in
thousands) |
$509,907,000 due 4/01/11 at 0.11% |
BNP Paribas Securities Corp. | $ 224,633 |
Barclays Capital, Inc. | 195,148 |
Merrill Lynch, Pierce, Fenner & Smith, Inc. | 90,126 |
| $ 509,907 |
$5,878,459,000 due 4/01/11 at 0.13% |
Barclays Capital, Inc. | $ 1,079,955 |
Citigroup Global Markets, Inc. | 799,967 |
Commerz Markets LLC | 399,983 |
Credit Agricole Securities (USA), Inc. | 2,399,902 |
HSBC Securities (USA), Inc. | 318,689 |
RBS Securities, Inc. | 399,983 |
UBS Securities LLC | 399,983 |
Wells Fargo Securities LLC | 79,997 |
| $ 5,878,459 |
Other Information |
The date shown for securities represents the date when principal payments must be paid, taking into account any call options exercised by the issuer and any permissible maturity shortening features other than interest rate resets. |
All investments are categorized as Level 2 under the Fair Value Hierarchy. The inputs or methodology used for valuing securities may not be an indication of the risk associated with investing in those securities. For more information on valuation inputs, please refer to the Security Valuation section in the accompanying Notes to Financial Statements. |
See accompanying notes which are an integral part of the financial statements.
Annual Report
Treasury Portfolio
Financial Statements
Statement of Assets and Liabilities
Amounts in thousands (except per-share amounts) | March 31, 2011 |
| | |
Assets | | |
Investment in securities, at value (including repurchase agreements of $8,410,366) - See accompanying schedule: Unaffiliated issuers (cost $13,349,542) | | $ 13,349,542 |
Receivable for fund shares sold | | 2,635 |
Interest receivable | | 14,680 |
Prepaid expenses | | 18 |
Other receivables | | 117 |
Total assets | | 13,366,992 |
| | |
Liabilities | | |
Payable for fund shares redeemed | $ 260 | |
Distributions payable | 61 | |
Accrued management fee | 1,521 | |
Transfer agent fee payable | 210 | |
Other affiliated payables | 86 | |
Other payables and accrued expenses | 148 | |
Total liabilities | | 2,286 |
| | |
Net Assets | | $ 13,364,706 |
Net Assets consist of: | | |
Paid in capital | | $ 13,364,709 |
Accumulated undistributed net realized gain (loss) on investments | | (3) |
Net Assets | | $ 13,364,706 |
| | |
Class I:
Net Asset Value, offering price and redemption price per share ($8,784,097 ÷ 8,781,047 shares) | | $ 1.00 |
| | |
Class II:
Net Asset Value, offering price and redemption price per share ($155,144 ÷ 155,042 shares) | | $ 1.00 |
| | |
Class III:
Net Asset Value, offering price and redemption price per share ($3,768,489 ÷ 3,768,074 shares) | | $ 1.00 |
| | |
Class IV:
Net Asset Value, offering price and redemption price per share ($304,950 ÷ 304,858 shares) | | $ 1.00 |
| | |
| | |
Select Class:
Net Asset Value, offering price and redemption price per share ($352,026 ÷ 351,948 shares) | | $ 1.00 |
Statement of Operations
Amounts in thousands | Year ended March 31, 2011 |
| | |
Investment Income | | |
Interest | | $ 29,599 |
| | |
Expenses | | |
Management fee | $ 18,211 | |
Transfer agent fees | 7,839 | |
Distribution and service plan fees | 11,630 | |
Accounting fees and expenses | 942 | |
Custodian fees and expenses | 46 | |
Independent trustees' compensation | 50 | |
Registration fees | 148 | |
Audit | 60 | |
Legal | 40 | |
Miscellaneous | 128 | |
Total expenses before reductions | 39,094 | |
Expense reductions | (12,080) | 27,014 |
Net investment income (loss) | | 2,585 |
Realized and Unrealized Gain (Loss) Net realized gain (loss) on: | | |
Investment securities: | | |
Unaffiliated issuers | | 25 |
Net increase in net assets resulting from operations | | $ 2,610 |
See accompanying notes which are an integral part of the financial statements.
Annual Report
Treasury Portfolio
Financial Statements - continued
Statement of Changes in Net Assets
Amounts in thousands | Year ended
March 31,
2011 | Year ended
March 31,
2010 |
Increase (Decrease) in Net Assets | | |
Operations | | |
Net investment income (loss) | $ 2,585 | $ 16,682 |
Net realized gain (loss) | 25 | 405 |
Net increase in net assets resulting from operations | 2,610 | 17,087 |
Distributions to shareholders from net investment income | (2,569) | (16,684) |
Distributions to shareholders from net realized gain | - | (335) |
Total distributions | (2,569) | (17,019) |
Share transactions - net increase (decrease) | (212,937) | (9,452,344) |
Total increase (decrease) in net assets | (212,896) | (9,452,276) |
| | |
Net Assets | | |
Beginning of period | 13,577,602 | 23,029,878 |
End of period | $ 13,364,706 | $ 13,577,602 |
Financial Highlights - Class I
Years ended March 31, | 2011 | 2010 | 2009 | 2008 | 2007 |
Selected Per-Share Data | | | | | |
Net asset value, beginning of period | $ 1.00 | $ 1.00 | $ 1.00 | $ 1.00 | $ 1.00 |
Income from Investment Operations | | | | | |
Net investment income (loss) | - C | .001 | .011 | .041 | .050 |
Net realized and unrealized gain (loss) C | - | - | - | - | - |
Total from investment operations | - C | .001 | .011 | .041 | .050 |
Distributions from net investment income | - C | (.001) | (.011) | (.041) | (.050) |
Distributions from net realized gain | - | - C | - | - | - |
Total distributions | - C | (.001) | (.011) | (.041) | (.050) |
Net asset value, end of period | $ 1.00 | $ 1.00 | $ 1.00 | $ 1.00 | $ 1.00 |
Total Return A | .03% | .10% | 1.11% | 4.20% | 5.11% |
Ratios to Average Net Assets B | | | | | |
Expenses before reductions | .21% | .21% | .23% | .22% | .23% |
Expenses net of fee waivers, if any | .20% | .21% | .22% | .20% | .20% |
Expenses net of all reductions | .20% | .21% | .22% | .20% | .20% |
Net investment income (loss) | .03% | .11% | 1.04% | 3.71% | 5.01% |
Supplemental Data | | | | | |
Net assets, end of period (in millions) | $ 8,784 | $ 8,650 | $ 16,236 | $ 15,037 | $ 5,491 |
A Total returns would have been lower had certain expenses not been reduced during the periods shown.
B Expense ratios reflect operating expenses of the class. Expenses before reductions do not reflect amounts reimbursed or waived or reductions from expense offset arrangements and do not represent the amount paid by the class during periods when reimbursements, waivers or reductions occur. Expenses net of fee waivers reflect expenses after reimbursement and waivers but prior to reductions from expense offset arrangements. Expenses net of all reductions represent the net expenses paid by the class.
C Amount represents less than $.001 per share.
See accompanying notes which are an integral part of the financial statements.
Annual Report
Financial Highlights - Class II
Years ended March 31, | 2011 | 2010 | 2009 | 2008 | 2007 |
Selected Per-Share Data | | | | | |
Net asset value, beginning of period | $ 1.00 | $ 1.00 | $ 1.00 | $ 1.00 | $ 1.00 |
Income from Investment Operations | | | | | |
Net investment income (loss) | - C | - C | .010 | .040 | .048 |
Net realized and unrealized gain (loss) C | - | - | - | - | - |
Total from investment operations | - C | - C | .010 | .040 | .048 |
Distributions from net investment income | - C | - C | (.010) | (.040) | (.048) |
Distributions from net realized gain | - | - C | - | - | - |
Total distributions | - C | - C | (.010) | (.040) | (.048) |
Net asset value, end of period | $ 1.00 | $ 1.00 | $ 1.00 | $ 1.00 | $ 1.00 |
Total Return A | .01% | .03% | .96% | 4.04% | 4.96% |
Ratios to Average Net Assets B | | | | | |
Expenses before reductions | .36% | .36% | .38% | .37% | .39% |
Expenses net of fee waivers, if any | .22% | .29% | .36% | .35% | .35% |
Expenses net of all reductions | .22% | .29% | .36% | .35% | .35% |
Net investment income (loss) | .01% | .03% | .90% | 3.90% | 4.86% |
Supplemental Data | | | | | |
Net assets, end of period (in millions) | $ 155 | $ 164 | $ 407 | $ 305 | $ 355 |
A Total returns would have been lower had certain expenses not been reduced during the periods shown.
B Expense ratios reflect operating expenses of the class. Expenses before reductions do not reflect amounts reimbursed or waived or reductions from expense offset arrangements and do not represent the amount paid by the class during periods when reimbursements, waivers or reductions occur. Expenses net of fee waivers reflect expenses after reimbursement and waivers but prior to reductions from expense offset arrangements. Expenses net of all reductions represent the net expenses paid by the class.
C Amount represents less than $.001 per share.
Financial Highlights - Class III
Years ended March 31, | 2011 | 2010 | 2009 | 2008 | 2007 |
Selected Per-Share Data | | | | | |
Net asset value, beginning of period | $ 1.00 | $ 1.00 | $ 1.00 | $ 1.00 | $ 1.00 |
Income from Investment Operations | | | | | |
Net investment income (loss) | - C | - C | .009 | .039 | .047 |
Net realized and unrealized gain (loss) C | - | - | - | - | - |
Total from investment operations | - C | - C | .009 | .039 | .047 |
Distributions from net investment income | - C | - C | (.009) | (.039) | (.047) |
Distributions from net realized gain | - | - C | - | - | - |
Total distributions | - C | - C | (.009) | (.039) | (.047) |
Net asset value, end of period | $ 1.00 | $ 1.00 | $ 1.00 | $ 1.00 | $ 1.00 |
Total Return A | .01% | .01% | .87% | 3.94% | 4.85% |
Ratios to Average Net Assets B | | | | | |
Expenses before reductions | .46% | .46% | .48% | .47% | .48% |
Expenses net of fee waivers, if any | .22% | .30% | .46% | .45% | .45% |
Expenses net of all reductions | .22% | .30% | .46% | .45% | .45% |
Net investment income (loss) | .01% | .02% | .80% | 3.74% | 4.76% |
Supplemental Data | | | | | |
Net assets, end of period (in millions) | $ 3,768 | $ 3,907 | $ 5,051 | $ 5,329 | $ 3,663 |
A Total returns would have been lower had certain expenses not been reduced during the periods shown.
B Expense ratios reflect operating expenses of the class. Expenses before reductions do not reflect amounts reimbursed or waived or reductions from expense offset arrangements and do not represent the amount paid by the class during periods when reimbursements, waivers or reductions occur. Expenses net of fee waivers reflect expenses after reimbursement and waivers but prior to reductions from expense offset arrangements. Expenses net of all reductions represent the net expenses paid by the class.
C Amount represents less than $.001 per share.
See accompanying notes which are an integral part of the financial statements.
Annual Report
Financial Highlights - Class IV
Years ended March 31, | 2011 | 2010 | 2009 | 2008 D |
Selected Per-Share Data | | | | |
Net asset value, beginning of period | $ 1.00 | $ 1.00 | $ 1.00 | $ 1.00 |
Income from Investment Operations | | | | |
Net investment income (loss) | - F | - F | .007 | .007 |
Net realized and unrealized gain (loss) F | - | - | - | - |
Total from investment operations | - F | - F | .007 | .007 |
Distributions from net investment income | - F | - F | (.007) | (.007) |
Distributions from net realized gain | - | - F | - | - |
Total distributions | - F | - F | (.007) | (.007) |
Net asset value, end of period | $ 1.00 | $ 1.00 | $ 1.00 | $ 1.00 |
Total Return B, C | .01% | .01% | .71% | .68% |
Ratios to Average Net Assets E | | | | |
Expenses before reductions | .71% | .71% | .73% | .72% A |
Expenses net of fee waivers, if any | .22% | .30% | .62% | .70% A |
Expenses net of all reductions | .22% | .30% | .62% | .70% A |
Net investment income (loss) | .01% | .03% | .64% | 2.19% A |
Supplemental Data | | | | |
Net assets, end of period (000 omitted) | $ 304,950 | $ 492,495 | $ 453,724 | $ 117 |
A Annualized
B Total returns for periods of less than one year are not annualized.
C Total returns would have been lower had certain expenses not been reduced during the periods shown.
D For the period December 12, 2007 (commencement of sale of shares) to March 31, 2008.
E Expense ratios reflect operating expenses of the class. Expenses before reductions do not reflect amounts reimbursed or waived or reductions from expense offset arrangements and do not represent the amount paid by the class during periods when reimbursements, waivers or reductions occur. Expense ratios before reductions for start-up periods may not be representative of longer-term operating periods. Expenses net of fee waivers reflect expenses after reimbursement and waivers but prior to reductions from expense offset arrangements. Expenses net of all reductions represent the net expenses paid by the class.
F Amount represents less than $.001 per share.
Financial Highlights - Select Class
Years ended March 31, | 2011 | 2010 | 2009 | 2008 | 2007 |
Selected Per-Share Data | | | | | |
Net asset value, beginning of period | $ 1.00 | $ 1.00 | $ 1.00 | $ 1.00 | $ 1.00 |
Income from Investment Operations | | | | | |
Net investment income (loss) | - C | .001 | .011 | .041 | .049 |
Net realized and unrealized gain (loss) C | - | - | - | - | - |
Total from investment operations | - C | .001 | .011 | .041 | .049 |
Distributions from net investment income | - C | (.001) | (.011) | (.041) | (.049) |
Distributions from net realized gain | - | - C | - | - | - |
Total distributions | - C | (.001) | (.011) | (.041) | (.049) |
Net asset value, end of period | $ 1.00 | $ 1.00 | $ 1.00 | $ 1.00 | $ 1.00 |
Total Return A | .01% | .07% | 1.06% | 4.15% | 5.06% |
Ratios to Average Net Assets B | | | | | |
Expenses before reductions | .26% | .26% | .28% | .27% | .28% |
Expenses net of fee waivers, if any | .22% | .24% | .27% | .25% | .25% |
Expenses net of all reductions | .22% | .24% | .27% | .25% | .25% |
Net investment income (loss) | .01% | .08% | .99% | 3.95% | 4.96% |
Supplemental Data | | | | | |
Net assets, end of period (in millions) | $ 352 | $ 365 | $ 882 | $ 513 | $ 296 |
A Total returns would have been lower had certain expenses not been reduced during the periods shown.
B Expense ratios reflect operating expenses of the class. Expenses before reductions do not reflect amounts reimbursed or waived or reductions from expense offset arrangements and do not represent the amount paid by the class during periods when reimbursements, waivers or reductions occur. Expenses net of fee waivers reflect expenses after reimbursement and waivers but prior to reductions from expense offset arrangements. Expenses net of all reductions represent the net expenses paid by the class.
C Amount represents less than $.001 per share.
See accompanying notes which are an integral part of the financial statements.
Annual Report
Government Portfolio
Investment Changes (Unaudited)
Weighted Average Maturity Diversification |
Days | % of fund's
investments
3/31/11 | % of fund's
investments
9/30/10 | % of fund's
investments
3/31/10 |
0 - 30 | 68.0 | 70.3 | 78.5 |
31 - 90 | 11.3 | 13.6 | 14.2 |
91 - 180 | 9.6 | 5.0 | 5.6 |
181 - 397 | 11.1 | 11.1 | 1.7 |
Effective maturity is determined in accordance with the requirements of Rule 2a-7 under the Investment Company Act of 1940. |
Weighted Average Maturity |
| 3/31/11 | 9/30/10 | 3/31/10 |
Government Portfolio | 48 Days | 48 Days | 24 Days |
All Taxable Money Market Fund Average* | 45 Days | 44 Days | 44 Days |
This is a weighted average of all the maturities of the securities held in a fund. Weighted Average Maturity (WAM) can be used as a measure of sensitivity to interest rate changes and markets changes. Generally, the longer the maturity, the greater the sensitivity to such changes. WAM is based on the dollar-weighted average length of time until principal payments must be paid. Depending on the types of securities held in a fund, certain maturity shortening devices (e.g., demand features, interest rate resets, and call options) may be taken into account when calculating the WAM. |
Weighted Average Life |
| 3/31/11 | 9/30/10 | 3/31/10 |
Government Portfolio | 88 Days | 112 Days | n/a** |
Weighted Average Life (WAL) is the weighted average of the life of the securities held in a fund or portfolio and can be used as a measure of sensitivity to changes in liquidity and/or credit risk. Generally, the higher the value, the greater the sensitivity. WAL is based on the dollar-weighted average length of time until principal payments must be paid, taking into account any call options exercised by the issuer and any permissible maturity shortening features other than interest rate resets. The difference between WAM and WAL is that WAM takes into account interest rate resets and WAL does not. WAL for money market funds is not the same as WAL of a mortgage- or asset-backed security. |
Asset Allocation (% of fund's net assets) |
As of March 31, 2011 | As of September 30, 2010 |
| Federal Agency Issues 43.9% | | | Federal Agency Issues 38.0% | |
 | U.S. Treasury Obligations 5.4% | | | U.S. Treasury Obligations 5.3% | |
 | Repurchase Agreements 50.6% | | | Repurchase Agreements 55.8% | |
| Net Other Assets 0.1% | | | Net Other Assets 0.9% | |

* Source: iMoneyNet, Inc.
** Information not available
Annual Report
Government Portfolio
Investments March 31, 2011
Showing Percentage of Net Assets
Federal Agencies - 43.9% |
| | Yield (a) | Principal
Amount (000s) | Value (000s) |
Fannie Mae - 2.8% |
| 4/11/11 to
9/17/12 | 0.21 to
0.28% (b) | $ 923,078 | $ 929,492 |
Federal Home Loan Bank - 35.9% |
| 4/12/11 to 2/17/12 | 0.17 to 0.60 (b) | 11,794,220 | 11,796,696 |
Freddie Mac - 5.2% |
| 4/11/11 to 11/2/12 | 0.20 to 0.35 (b) | 1,706,000 | 1,710,256 |
TOTAL FEDERAL AGENCIES | 14,436,444 |
U.S. Treasury Obligations - 5.4% |
|
U.S. Treasury Bills - 3.0% |
| 9/22/11 to 9/29/11 | 0.15 to 0.18 | 1,010,000 | 1,009,219 |
U.S. Treasury Notes - 2.4% |
| 8/31/11 to 1/31/12 | 0.30 to 0.33 | 782,000 | 784,534 |
TOTAL U.S. TREASURY OBLIGATIONS | 1,793,753 |
Repurchase Agreements - 50.6% |
| Maturity
Amount
(000s) | |
In a joint trading account at: | | |
0.18% dated 3/31/11 due 4/1/11 (Collateralized by U.S. Government Obligations) # | $ 575,398 | 575,395 |
0.2% dated 3/31/11 due 4/1/11 (Collateralized by U.S. Government Obligations) # | 11,901,323 | 11,901,258 |
With: | | |
BNP Paribas Securities Corp. at: | | |
0.21%, dated 2/11/11 due 4/7/11 (Collateralized by U.S. Government Obligations valued at $88,765,365, 1.39% - 7%, 6/1/19 - 9/1/46) | 87,091 | 87,000 |
0.23%, dated 11/24/10 due 4/7/11 (Collateralized by U.S. Government Obligations valued at $822,980,501, 1.75% - 7%, 11/1/13 - 4/25/41) | 803,908 | 803,000 |
Deutsche Bank Securities, Inc. at: | | |
0.19%, dated 3/1/11 due 4/7/11 (Collateralized by U.S. Government Obligations valued at $174,448,537, 4% - 6.5%, 1/1/26 - 3/1/41) | 171,079 | 171,000 |
0.21%, dated 1/27/11 due 4/7/11 (Collateralized by U.S. Government Obligations valued at $610,187,718, 2.1% - 6.3%, 4/1/14 - 12/1/47) | 598,314 | 598,000 |
0.23%, dated: | | |
10/26/10 due 4/7/11 (Collateralized by U.S. Government Obligations valued at $100,060,266, 3.5% - 4%, 10/1/25 - 10/1/40) | 98,113 | 98,000 |
|
| Maturity
Amount
(000s) | | Value (000s) |
11/4/10 due 4/7/11 (Collateralized by U.S. Government Obligations valued at $159,270,458, 3.21% - 7%, 1/1/26 - 2/1/41) | $ 156,175 | | $ 156,000 |
0.24%, dated 11/15/10 due 4/7/11 (Collateralized by U.S. Government Obligations valued at $95,967,571, 3.5% - 5%, 10/1/25 - 11/1/40) | 94,114 | | 94,000 |
0.25%, dated 12/1/10 due 4/7/11 (Collateralized by U.S. Government Obligations valued at $94,939,709, 3.21% - 6%, 12/1/37 - 11/1/40) | 93,121 | | 93,000 |
ING Financial Markets LLC at: | | | |
0.2%, dated 3/2/11 due: | | | |
4/7/11 (Collateralized by U.S. Government Obligations valued at $162,209,730, 2.23% - 6.06%, 4/1/18 - 3/1/41) | 159,080 | | 159,000 |
4/7/11 (Collateralized by U.S. Government Obligations valued at $198,826,661, 0.5% - 6%, 9/25/21 - 8/25/40) | 193,129 | | 193,000 |
0.22%, dated: | | | |
1/24/11 due 4/7/11 (Collateralized by U.S. Government Obligations valued at $59,184,474, 2.46% - 5.7%, 9/1/25 - 4/1/40) | 58,043 | | 58,000 |
2/7/11 due 4/7/11 (Collateralized by U.S. Government Obligations valued at $181,491,433, 0.69% - 6.35%, 7/1/19 - 9/1/40) | 177,197 | | 177,000 |
2/11/11 due 4/7/11 (Collateralized by U.S. Government Obligations valued at $43,873,122, 2.82% - 4.71%, 8/1/36 - 5/1/38) | 43,047 | | 43,000 |
0.23%, dated: | | | |
11/8/10 due 4/7/11 (Collateralized by U.S. Government Obligations valued at $85,758,837, 1.96% - 5.72%, 7/1/24 - 1/1/41) | 84,098 | | 84,000 |
1/18/11 due 4/7/11 (Collateralized by U.S. Government Obligations valued at $414,251,439, 0.49% - 1.25%, 10/25/14 - 4/25/39) | 402,308 | | 402,000 |
0.24%, dated: | | | |
10/13/10 due 4/7/11 (Collateralized by U.S. Government Obligations valued at $413,495,383, 0.51% - 6%, 2/15/17 - 12/25/39) | 401,481 | | 401,000 |
Repurchase Agreements - continued |
| Maturity
Amount
(000s) | | Value (000s) |
With: - continued | | | |
ING Financial Markets LLC at: | | | |
0.24%, dated: - continued | | | |
10/18/10 due 4/7/11 (Collateralized by U.S. Government Obligations valued at $50,037,553, 2.15% - 6.11%, 2/1/23 - 2/1/40) | $ 49,059 | | $ 49,000 |
10/25/10 due 4/7/11 (Collateralized by U.S. Government Obligations valued at $46,969,210, 2.22% - 4.97%, 3/1/33 - 4/1/40) | 46,056 | | 46,000 |
11/15/10 due 4/7/11 (Collateralized by U.S. Government Obligations valued at $24,502,589, 3.68%, 8/1/40) | 24,029 | | 24,000 |
0.25%, dated 10/1/10 due 4/1/11 (Collateralized by U.S. Government Obligations valued at $51,065,476, 2.12% - 6.11%, 11/1/24 - 4/1/38) | 50,063 | | 50,000 |
RBC Capital Markets Corp. at 0.19%, dated 3/1/11 due 4/7/11 (Collateralized by U.S. Government Obligations valued at $326,563,421, 0.62% - 7%, 11/25/20 - 12/15/40) | 317,154 | | 317,000 |
|
| Maturity
Amount
(000s) | | Value (000s) |
RBS Securities, Inc. at 0.25%, dated 10/27/10 due 4/7/11 (Collateralized by U.S. Government Obligations valued at $46,973,384, 2.59% - 5.08%, 4/1/30 - 3/1/41) | $ 46,058 | | $ 46,000 |
Wells Fargo Securities, LLC at 0.25%, dated 10/21/10 due 4/7/11 (Collateralized by U.S. Government Obligations valued at $23,486,393, 4.5%, 3/1/41) | 23,029 | | 23,000 |
TOTAL REPURCHASE AGREEMENTS | 16,648,653 |
TOTAL INVESTMENT PORTFOLIO - 99.9% (Cost $32,878,850) | | 32,878,850 |
NET OTHER ASSETS (LIABILITIES) - 0.1% | | 24,702 |
NET ASSETS - 100% | $ 32,903,552 |
Legend |
(a) Yield represents either the annualized yield at the date of purchase, or the stated coupon rate, or, for floating and adjustable rate securities, the rate at period end. |
(b) Coupon rates for floating and adjustable rate securities reflect the rates in effect at period end. |
# Additional information on each counterparty to the repurchase agreement is as follows: |
Repurchase Agreement / Counterparty | Value
(Amounts in thousands) |
$575,395,000 due 4/01/11 at 0.18% |
Bank of America NA | $ 257,413 |
Barclays Capital, Inc. | 113,565 |
Merrill Lynch, Pierce, Fenner & Smith, Inc. | 52,997 |
UBS Securities LLC | 151,420 |
| $ 575,395 |
$11,901,258,000 due 4/01/11 at 0.20% |
Bank of America NA | $ 3,315,878 |
Citibank NA | 191,638 |
Citigroup Global Markets, Inc. | 1,533,104 |
Deutsche Bank Securities, Inc. | 2,874,569 |
J.P. Morgan Securities, Inc. | 383,276 |
RBC Capital Markets Corp. | 191,638 |
UBS Securities LLC | 996,517 |
Wells Fargo Securities LLC | 2,414,638 |
| $ 11,901,258 |
Other Information |
The date shown for securities represents the date when principal payments must be paid, taking into account any call options exercised by the issuer and any permissible maturity shortening features other than interest rate resets. |
All investments are categorized as Level 2 under the Fair Value Hierarchy. The inputs or methodology used for valuing securities may not be an indication of the risk associated with investing in those securities. For more information on valuation inputs, please refer to the Security Valuation section in the accompanying Notes to Financial Statements. |
Income Tax Information |
At March 31, 2011, the Fund had a capital loss carryforward of approximately $2,305,890, all of which will expire in fiscal 2019. Capital loss carryforwards are only available to offset future capital gains of the Fund to the extent provided by regulations and may be limited. |
See accompanying notes which are an integral part of the financial statements.
Annual Report
Government Portfolio
Financial Statements
Statement of Assets and Liabilities
Amounts in thousands (except per-share amounts) | March 31, 2011 |
| | |
Assets | | |
Investment in securities, at value (including repurchase agreements of $16,648,653) - See accompanying schedule: Unaffiliated issuers (cost $32,878,850) | | $ 32,878,850 |
Receivable for fund shares sold | | 4,824 |
Interest receivable | | 27,665 |
Prepaid expenses | | 50 |
Other receivables | | 341 |
Total assets | | 32,911,730 |
| | |
Liabilities | | |
Payable for fund shares redeemed | $ 1,898 | |
Distributions payable | 284 | |
Accrued management fee | 3,779 | |
Transfer agent fee payable | 1,636 | |
Distribution and service plan fees payable | 34 | |
Other affiliated payables | 136 | |
Other payables and accrued expenses | 411 | |
Total liabilities | | 8,178 |
| | |
Net Assets | | $ 32,903,552 |
Net Assets consist of: | | |
Paid in capital | | $ 32,906,043 |
Distributions in excess of net investment income | | (185) |
Accumulated undistributed net realized gain (loss) on investments | | (2,306) |
Net Assets | | $ 32,903,552 |
| | |
Class I:
Net Asset Value, offering price and redemption price per share ($29,686,553 ÷ 29,678,592 shares) | | $ 1.00 |
| | |
Class II:
Net Asset Value, offering price and redemption price per share ($806,828 ÷ 806,525 shares) | | $ 1.00 |
| | |
Class III:
Net Asset Value, offering price and redemption price per share ($2,050,218 ÷ 2,049,507 shares) | | $ 1.00 |
| | |
Select Class:
Net Asset Value, offering price and redemption price per share ($359,953 ÷ 359,951 shares) | | $ 1.00 |
Statement of Operations
Amounts in thousands | Year ended March 31, 2011 |
| | |
Investment Income | | |
Interest | | $ 90,228 |
| | |
Expenses | | |
Management fee | $ 48,829 | |
Transfer agent fees | 21,038 | |
Distribution and service plan fees | 6,902 | |
Accounting fees and expenses | 1,622 | |
Custodian fees and expenses | 163 | |
Independent trustees' compensation | 140 | |
Registration fees | 307 | |
Audit | 51 | |
Legal | 126 | |
Interest | 11 | |
Miscellaneous | 383 | |
Total expenses before reductions | 79,572 | |
Expense reductions | (5,530) | 74,042 |
Net investment income (loss) | | 16,186 |
Realized and Unrealized Gain (Loss) Net realized gain (loss) on: | | |
Investment securities: | | |
Unaffiliated issuers | | (2,304) |
Net increase in net assets resulting from operations | | $ 13,882 |
See accompanying notes which are an integral part of the financial statements.
Annual Report
Government Portfolio
Financial Statements - continued
Statement of Changes in Net Assets
Amounts in thousands | Year ended
March 31,
2011 | Year ended
March 31,
2010 |
Increase (Decrease) in Net Assets | | |
Operations | | |
Net investment income (loss) | $ 16,186 | $ 107,151 |
Net realized gain (loss) | (2,304) | 5,349 |
Net increase in net assets resulting from operations | 13,882 | 112,500 |
Distributions to shareholders from net investment income | (16,201) | (107,137) |
Distributions to shareholders from net realized gain | (976) | - |
Total distributions | (17,177) | (107,137) |
Share transactions - net increase (decrease) | (16,132,135) | (11,476,819) |
Total increase (decrease) in net assets | (16,135,430) | (11,471,456) |
| | |
Net Assets | | |
Beginning of period | 49,038,982 | 60,510,438 |
End of period (including distributions in excess of net investment income of $185 and $0, respectively). | $ 32,903,552 | $ 49,038,982 |
Financial Highlights - Class I
Years ended March 31, | 2011 | 2010 | 2009 | 2008 | 2007 |
Selected Per-Share Data | | | | | |
Net asset value, beginning of period | $ 1.00 | $ 1.00 | $ 1.00 | $ 1.00 | $ 1.00 |
Income from Investment Operations | | | | | |
Net investment income (loss) | - C | .002 | .017 | .046 | .050 |
Net realized and unrealized gain (loss) | - C | - | - | - | - |
Total from investment operations | - C | .002 | .017 | .046 | .050 |
Distributions from net investment income | - C | (.002) | (.017) | (.046) | (.050) |
Distribution from net realized gain | - C | - | - | - | - |
Total distributions | - C | (.002) | (.017) | (.046) | (.050) |
Net asset value, end of period | $ 1.00 | $ 1.00 | $ 1.00 | $ 1.00 | $ 1.00 |
Total Return A | .05% | .17% | 1.70% | 4.74% | 5.15% |
Ratios to Average Net Assets B | | | | | |
Expenses before reductions | .21% | .21% | .23% | .22% | .23% |
Expenses net of fee waivers, if any | .21% | .21% | .23% | .20% | .20% |
Expenses net of all reductions | .21% | .21% | .23% | .20% | .20% |
Net investment income (loss) | .05% | .18% | 1.44% | 4.39% | 5.04% |
Supplemental Data | | | | | |
Net assets, end of period (in millions) | $ 29,687 | $ 45,414 | $ 54,931 | $ 18,583 | $ 5,711 |
A Total returns would have been lower had certain expenses not been reduced during the periods shown.
B Expense ratios reflect operating expenses of the class. Expenses before reductions do not reflect amounts reimbursed or waived or reductions from expense offset arrangements and do not represent the amount paid by the class during periods when reimbursements, waivers or reductions occur. Expenses net of fee waivers reflect expenses after reimbursement and waivers but prior to reductions from expense offset arrangements. Expenses net of all reductions represent the net expenses paid by the class.
C Amount represents less than $.001 per share.
See accompanying notes which are an integral part of the financial statements.
Annual Report
Financial Highlights - Class II
Years ended March 31, | 2011 | 2010 | 2009 | 2008 | 2007 |
Selected Per-Share Data | | | | | |
Net asset value, beginning of period | $ 1.00 | $ 1.00 | $ 1.00 | $ 1.00 | $ 1.00 |
Income from Investment Operations | | | | | |
Net investment income (loss) | - C | .001 | .015 | .045 | .049 |
Net realized and unrealized gain (loss) | - C | - | - | - | - |
Total from investment operations | - C | .001 | .015 | .045 | .049 |
Distributions from net investment income | - C | (.001) | (.015) | (.045) | (.049) |
Distribution from net realized gain | - C | - | - | - | - |
Total distributions | - C | (.001) | (.015) | (.045) | (.049) |
Net asset value, end of period | $ 1.00 | $ 1.00 | $ 1.00 | $ 1.00 | $ 1.00 |
Total Return A | .01% | .08% | 1.55% | 4.59% | 5.00% |
Ratios to Average Net Assets B | | | | | |
Expenses before reductions | .36% | .36% | .38% | .38% | .39% |
Expenses net of fee waivers, if any | .25% | .31% | .38% | .35% | .35% |
Expenses net of all reductions | .25% | .31% | .38% | .35% | .35% |
Net investment income (loss) | .01% | .07% | 1.29% | 4.32% | 4.89% |
Supplemental Data | | | | | |
Net assets, end of period (in millions) | $ 807 | $ 1,413 | $ 1,936 | $ 1,342 | $ 536 |
A Total returns would have been lower had certain expenses not been reduced during the periods shown.
B Expense ratios reflect operating expenses of the class. Expenses before reductions do not reflect amounts reimbursed or waived or reductions from expense offset arrangements and do not represent the amount paid by the class during periods when reimbursements, waivers or reductions occur. Expenses net of fee waivers reflect expenses after reimbursement and waivers but prior to reductions from expense offset arrangements. Expenses net of all reductions represent the net expenses paid by the class.
C Amount represents less than $.001 per share.
Financial Highlights - Class III
Years ended March 31, | 2011 | 2010 | 2009 | 2008 | 2007 |
Selected Per-Share Data | | | | | |
Net asset value, beginning of period | $ 1.00 | $ 1.00 | $ 1.00 | $ 1.00 | $ 1.00 |
Income from Investment Operations | | | | | |
Net investment income (loss) | - C | - C | .014 | .044 | .048 |
Net realized and unrealized gain (loss) | - C | - | - | - | - |
Total from investment operations | - C | - C | .014 | .044 | .048 |
Distributions from net investment income | - C | - C | (.014) | (.044) | (.048) |
Distribution from net realized gain | - C | - | - | - | - |
Total distributions | - C | - C | (.014) | (.044) | (.048) |
Net asset value, end of period | $ 1.00 | $ 1.00 | $ 1.00 | $ 1.00 | $ 1.00 |
Total Return A | .01% | .04% | 1.44% | 4.48% | 4.89% |
Ratios to Average Net Assets B | | | | | |
Expenses before reductions | .46% | .46% | .49% | .48% | .48% |
Expenses net of fee waivers, if any | .25% | .35% | .48% | .45% | .45% |
Expenses net of all reductions | .25% | .35% | .48% | .45% | .45% |
Net investment income (loss) | .01% | .03% | 1.19% | 4.27% | 4.79% |
Supplemental Data | | | | | |
Net assets, end of period (in millions) | $ 2,050 | $ 1,910 | $ 3,031 | $ 1,763 | $ 814 |
A Total returns would have been lower had certain expenses not been reduced during the periods shown.
B Expense ratios reflect operating expenses of the class. Expenses before reductions do not reflect amounts reimbursed or waived or reductions from expense offset arrangements and do not represent the amount paid by the class during periods when reimbursements, waivers or reductions occur. Expenses net of fee waivers reflect expenses after reimbursement and waivers but prior to reductions from expense offset arrangements. Expenses net of all reductions represent the net expenses paid by the class.
C Amount represents less than $.001 per share.
See accompanying notes which are an integral part of the financial statements.
Annual Report
Financial Highlights - Select Class
Years ended March 31, | 2011 | 2010 | 2009 | 2008 | 2007 |
Selected Per-Share Data | | | | | |
Net asset value, beginning of period | $ 1.00 | $ 1.00 | $ 1.00 | $ 1.00 | $ 1.00 |
Income from Investment Operations | | | | | |
Net investment income (loss) | - C | .001 | .016 | .046 | .050 |
Net realized and unrealized gain (loss) | - C | - | - | - | - |
Total from investment operations | - C | .001 | .016 | .046 | .050 |
Distributions from net investment income | - C | (.001) | (.016) | (.046) | (.050) |
Distribution from net realized gain | - C | - | - | - | - |
Total distributions | - C | (.001) | (.016) | (.046) | (.050) |
Net asset value, end of period | $ 1.00 | $ 1.00 | $ 1.00 | $ 1.00 | $ 1.00 |
Total Return A | .02% | .13% | 1.65% | 4.69% | 5.10% |
Ratios to Average Net Assets B | | | | | |
Expenses before reductions | .26% | .26% | .28% | .27% | .28% |
Expenses net of fee waivers, if any | .24% | .25% | .28% | .25% | .25% |
Expenses net of all reductions | .24% | .25% | .28% | .25% | .25% |
Net investment income (loss) | .01% | .13% | 1.39% | 4.30% | 4.99% |
Supplemental Data | | | | | |
Net assets, end of period (in millions) | $ 360 | $ 302 | $ 612 | $ 266 | $ 45 |
A Total returns would have been lower had certain expenses not been reduced during the periods shown.
B Expense ratios reflect operating expenses of the class. Expenses before reductions do not reflect amounts reimbursed or waived or reductions from expense offset arrangements and do not represent the amount paid by the class during periods when reimbursements, waivers or reductions occur. Expenses net of fee waivers reflect expenses after reimbursement and waivers but prior to reductions from expense offset arrangements. Expenses net of all reductions represent the net expenses paid by the class.
C Amount represents less than $.001 per share.
See accompanying notes which are an integral part of the financial statements.
Annual Report
Prime Money Market Portfolio
Investment Changes (Unaudited)
Weighted Average Maturity Diversification |
Days | % of fund's
investments
3/31/11 | % of fund's
investments
9/30/10 | % of fund's
investments
3/31/10 |
0 - 30 | 57.0 | 52.6 | 59.3 |
31 - 90 | 22.4 | 30.1 | 22.6 |
91 - 180 | 13.8 | 14.2 | 13.2 |
181 - 397 | 6.8 | 3.1 | 4.9 |
Effective maturity is determined in accordance with the requirements of Rule 2a-7 under the Investment Company Act of 1940. |
Weighted Average Maturity |
| 3/31/11 | 9/30/10 | 3/31/10 |
Prime Money Market Portfolio | 50 Days | 51 Days | 52 Days |
All Taxable Money Market Fund Average* | 45 Days | 44 Days | 44 Days |
This is a weighted average of all the maturities of the securities held in a fund. Weighted Average Maturity (WAM) can be used as a measure of sensitivity to interest rate changes and markets changes. Generally, the longer the maturity, the greater the sensitivity to such changes. WAM is based on the dollar-weighted average length of time until principal payments must be paid. Depending on the types of securities held in a fund, certain maturity shortening devices (e.g., demand features, interest rate resets, and call options) may be taken into account when calculating the WAM. |
Weighted Average Life |
| 3/31/11 | 9/30/10 | 3/31/10 |
Prime Money Market Portfolio | 107 Days | 81 Days | n/a** |
Weighted Average Life (WAL) is the weighted average of the life of the securities held in a fund or portfolio and can be used as a measure of sensitivity to changes in liquidity and/or credit risk. Generally, the higher the value, the greater the sensitivity. WAL is based on the dollar-weighted average length of time until principal payments must be paid, taking into account any call options exercised by the issuer and any permissible maturity shortening features other than interest rate resets. The difference between WAM and WAL is that WAM takes into account interest rate resets and WAL does not. WAL for money market funds is not the same as WAL of a mortgage- or asset-backed security. |
Asset Allocation (% of fund's net assets) |
As of March 31, 2011 | As of September 30, 2010 |
| Corporate Bonds 0.1% | | | Corporate Bonds 0.1% | |
| Commercial Paper 18.5% | | | Commercial Paper 17.4% | |
 | Bank CDs, BAs, TDs,
and Notes 45.0% | | | Bank CDs, BAs, TDs,
and Notes 57.4% | |
 | Government Securities† 16.4% | | | Government Securities†† 7.5% | |
| Repurchase Agreements 20.1% | | | Repurchase Agreements 19.9% | |
| Net Other Assets*** (0.1)% | | | Net Other Assets*** (2.3)% | |
* Source: iMoneyNet, Inc.
** Information not available
*** Net Other Assets are not included in the pie chart.
† Includes Federal Financing Bank Supported Student Loan Short-Term Notes.
†† Includes FDIC Guaranteed Corporate Securities.
Annual Report
Prime Money Market Portfolio
Investments March 31, 2011
Showing Percentage of Net Assets
Corporate Bonds - 0.1% |
| | Yield (a) | Principal
Amount (000s) | Value (000s) |
Florida Timber Finance III LLC Taxable VRDN, LOC Wells Fargo Bank NA |
| 4/7/11 | 0.26% (d) | $ 25,155 | $ 25,155 |
LP Pinewood SPV LLC Taxable VRDN, LOC Wells Fargo Bank NA |
| 4/7/11 | 0.26 (d) | 37,000 | 37,000 |
TOTAL CORPORATE BONDS | 62,155 |
Certificates of Deposit - 37.7% |
|
London Branch, Eurodollar, Foreign Banks - 11.9% |
Commonwealth Bank of Australia |
| 4/4/11 to 6/7/11 | 0.30 | 339,000 | 339,000 |
Credit Agricole SA |
| 4/8/11 to 5/9/11 | 0.37 to 0.45 | 2,138,000 | 2,138,000 |
Credit Industriel et Commercial |
| 5/3/11 to 7/1/11 | 0.40 to 0.45 | 1,200,000 | 1,200,000 |
Danske Bank A/S |
| 4/11/11 | 0.33 | 225,000 | 225,000 |
HSBC Bank PLC |
| 4/14/11 to 3/15/12 | 0.32 to 0.55 | 751,000 | 751,000 |
ING Bank NV |
| 5/4/11 to 5/9/11 | 0.30 | 930,000 | 930,000 |
Landesbank Hessen-Thuringen |
| 4/18/11 to 4/26/11 | 0.33 | 929,000 | 929,000 |
National Australia Bank Ltd. |
| 6/6/11 to 7/18/11 | 0.30 to 0.43 | 1,910,000 | 1,910,001 |
| | 8,422,001 |
New York Branch, Yankee Dollar, Foreign Banks - 25.8% |
Bank of Montreal |
| 5/25/11 to 11/22/11 | 0.35 to 0.40 (d) | 267,000 | 267,000 |
Bank of Nova Scotia |
| 4/13/11 to 3/16/12 | 0.26 to 0.38 (d) | 281,000 | 281,000 |
Bank of Tokyo-Mitsubishi |
| 4/4/11 to 8/15/11 | 0.25 to 0.50 | 2,000,000 | 2,000,000 |
BNP Paribas New York Branch |
| 5/12/11 to 6/8/11 | 0.37 to 0.41 | 1,600,000 | 1,600,000 |
BNP Paribas SA |
| 9/27/11 | 0.51 (d) | 1,500,000 | 1,500,000 |
Canadian Imperial Bank of Commerce New York Branch |
| 4/1/11 to 4/20/12 | 0.35 to 0.50 (d) | 2,258,000 | 2,258,000 |
Commerzbank AG New York Branch |
| 5/13/11 | 0.43 | 280,000 | 280,000 |
Credit Suisse |
| 7/25/11 to 9/2/11 | 0.31 to 0.32 (d) | 684,000 | 684,000 |
Deutsche Bank |
| 7/25/11 | 0.35 (d) | 750,000 | 750,000 |
DnB NOR Bank ASA |
| 8/4/11 | 0.31 (d) | 223,000 | 223,000 |
Intesa Sanpaolo SpA New York Branch |
| 4/7/11 | 0.40 | 168,000 | 168,000 |
|
| | Yield (a) | Principal
Amount (000s) | Value (000s) |
Mitsubishi UFJ Trust & Banking Corp. |
| 4/18/11 | 0.35% | $ 269,000 | $ 269,000 |
Mizuho Corporate Bank Ltd. |
| 4/6/11 | 0.25 | 234,000 | 234,000 |
Natexis Banques Populaires New York Branch |
| 6/1/11 | 0.40 | 705,000 | 705,000 |
National Bank Canada |
| 11/4/11 | 0.41 (d) | 585,000 | 585,000 |
Natixis SA |
| 5/3/11 to 6/22/11 | 0.40 to 2.01 (d) | 355,000 | 355,000 |
Rabobank Nederland New York Branch |
| 6/8/11 to 4/2/12 | 0.30 to 0.50 (d) | 2,112,000 | 2,112,000 |
Royal Bank of Canada |
| 3/30/12 | 0.64 (d) | 190,000 | 190,000 |
Skandinaviska Enskilda Banken |
| 6/6/11 | 0.35 | 92,000 | 92,000 |
Societe Generale |
| 4/11/11 to 5/16/11 | 0.35 to 1.71 (d) | 821,000 | 821,000 |
Sumitomo Mitsui Banking Corp. |
| 4/6/11 to 5/18/11 | 0.23 to 0.30 | 810,000 | 810,000 |
Svenska Handelsbanken |
| 5/3/11 | 0.35 | 455,000 | 455,002 |
Toronto-Dominion Bank New York Branch |
| 1/12/12 | 0.34 (d) | 195,000 | 195,000 |
UBS AG |
| 5/2/11 to 7/21/11 | 0.30 to 0.36 (d) | 1,446,000 | 1,446,000 |
| | 18,280,002 |
TOTAL CERTIFICATES OF DEPOSIT | 26,702,003 |
Commercial Paper - 18.5% |
|
ASB Finance Ltd. |
| 2/3/12 | 0.41 (d) | 150,000 | 149,994 |
Australia & New Zealand Banking Group Ltd. |
| 4/4/11 to 4/11/11 | 0.32 | 224,000 | 223,985 |
Autobahn Funding (Liquidity Facility DZ BANK AG) |
| 4/5/11 | | 7,832 | 7,832 |
Barclays Bank PLC/Barclays US CCP Funding LLC |
| 4/15/11 to 4/19/11 | 0.32 | 223,000 | 222,968 |
BP Capital Markets PLC |
| 6/7/11 | 0.33 | 68,000 | 67,958 |
Commerzbank U.S. Finance, Inc. |
| 5/6/11 | 0.42 | 394,000 | 393,839 |
Commonwealth Bank of Australia |
| 6/2/11 to 11/21/11 | 0.35 to 0.36 (d) | 682,000 | 681,995 |
Danske Corp. |
| 4/11/11 to 5/16/11 | 0.32 | 1,221,250 | 1,220,914 |
Deutsche Bank Financial LLC |
| 4/4/11 | 0.30 | 350,000 | 349,991 |
Commercial Paper - continued |
| | Yield (a) | Principal
Amount (000s) | Value (000s) |
DnB NOR Bank ASA |
| 7/25/11 to 8/22/11 | 0.30% (d) | $ 421,000 | $ 421,000 |
Gotham Funding Corp. (Liquidity Facility Bank Tokyo-Mitsubishi UFJ Ltd.) |
| 4/1/11-4/5/11 | 0.25 | 340,000 | 339,996 |
Hannover Funding Co. LLC (Liquidity Facility Norddeutsche Landesbank Girozentrale) (Liquidity Facility U.S. Bank NA, Minnesota) |
| 4/4/11 | 0.45 | 67,000 | 66,997 |
Intesa Funding LLC |
| 4/6/11 to 4/18/11 | 0.40 to 0.41 | 942,000 | 941,882 |
Landesbank Hessen-Thuringen |
| 4/11/11 | 0.32 | 293,000 | 292,974 |
Manhattan Asset Funding Co. LLC (Liquidity Facility Sumitomo Mitsui Banking Corp.) |
| 4/5/11-4/8/11 | 0.25 | 303,000 | 302,989 |
Natexis Banques Populaires U.S. Finance Co. LLC |
| 5/2/11 to 7/1/11 | 0.40 to 0.45 | 1,538,000 | 1,536,799 |
Nationwide Building Society |
| 6/3/11 | 0.34 | 74,000 | 73,956 |
Natixis US Finance Co. LLC |
| 5/3/11 | 0.40 (d) | 364,000 | 364,000 |
Royal Bank of Canada |
| 6/16/11 | 0.40 | 463,000 | 462,609 |
Skandinaviska Enskilda Banken AB |
| 4/4/11 to 4/8/11 | 0.32 | 525,000 | 524,968 |
Societe Generale North America, Inc. |
| 4/1/11 to 5/2/11 | 0.35 to 0.40 | 1,449,000 | 1,448,858 |
Sumitomo Mitsui Banking Corp. |
| 4/7/11 | 0.24 | 206,000 | 205,992 |
Total Capital Canada Ltd. |
| 8/19/11 to 12/15/11 | 0.40 to 0.42 | 310,500 | 309,815 |
Toyota Motor Credit Corp. |
| 4/12/11 to 4/15/11 | 0.35 | 57,000 | 56,993 |
UniCredito Italiano Bank (Ireland) PLC |
| 4/1/11 to 4/18/11 | 0.30 to 0.42 | 968,000 | 967,933 |
Westpac Banking Corp. |
| 4/19/11 to 10/7/11 | 0.30 to 0.45 (d) | 1,474,000 | 1,473,526 |
TOTAL COMMERCIAL PAPER | 13,110,763 |
U.S. Government and Government Agency Obligations - 1.2% |
|
Other Government Related - 1.2% |
Straight-A Funding LLC (Liquidity Facility Federal Financing Bank) |
| 5/10/11-6/9/11 | 0.25 (c) | 878,738 | 878,444 |
TOTAL U.S. GOVERNMENT AND GOVERNMENT AGENCY OBLIGATIONS | 878,444 |
Federal Agencies - 4.0% |
| | Yield (a) | Principal
Amount (000s) | Value (000s) |
Federal Home Loan Bank - 1.3% |
| 8/12/11 to 9/26/11 | 0.17 to 0.22% (d) | $ 934,000 | $ 933,797 |
Freddie Mac - 2.7% |
| 8/10/12 to 11/2/12 | 0.20 to 0.22 (d) | 1,870,000 | 1,868,235 |
TOTAL FEDERAL AGENCIES | 2,802,032 |
U.S. Treasury Obligations - 11.2% |
|
U.S. Treasury Bills - 5.8% |
| 6/30/11 to 2/9/12 | 0.15 to 0.31 | 4,129,000 | 4,124,766 |
U.S. Treasury Notes - 5.4% |
| 4/30/11 to 2/29/12 | 0.20 to 0.45 | 3,781,500 | 3,809,422 |
TOTAL U.S. TREASURY OBLIGATIONS | 7,934,188 |
Bank Notes - 0.5% |
|
Bank of America NA |
| 5/12/11 | 0.30 | 324,000 | 324,000 |
Medium-Term Notes - 4.8% |
|
BP Capital Markets PLC |
| 4/11/11 | 0.45 (d) | 65,849 | 65,849 |
Commonwealth Bank of Australia |
| 2/10/12 | 0.36 (b)(d) | 236,000 | 236,000 |
Metropolitan Life Global Funding I |
| 7/1/11 | 2.05 (b)(d) | 63,500 | 63,500 |
Metropolitan Life Insurance Co. |
| 6/29/11 | 0.60 (d)(h) | 30,000 | 30,000 |
Royal Bank of Canada |
| 3/30/12 to 4/13/12 | 0.30 to 0.70 (b)(d) | 841,000 | 841,000 |
| 2/6/12 | 0.31 (d) | 714,000 | 713,696 |
Westpac Banking Corp. |
| 12/23/11 to 4/13/12 | 0.31 to 0.36 (b)(d) | 1,484,000 | 1,484,000 |
TOTAL MEDIUM-TERM NOTES | 3,434,045 |
Municipal Securities - 2.0% |
|
ABAG Fin. Auth. for Nonprofit Corps. Rev. (Sharp HealthCare Proj.) Series 2009 A, LOC Bank of America NA, VRDN |
4/7/11 | 0.24 (d) | 27,865 | 27,865 |
Arizona Health Facilities Auth. Rev. (Catholic Healthcare West Proj.) Series 2008 A, LOC JPMorgan Chase Bank, VRDN |
4/7/11 | 0.22 (d) | 27,100 | 27,100 |
Bay Area Toll Auth. San Francisco Bay Toll Bridge Rev. Participating VRDN Series EGL 06 83 Class A, (Liquidity Facility Citibank NA) |
4/7/11 | 0.25 (d)(f) | 35,600 | 35,600 |
California Gen. Oblig. Series 2003 C2, LOC Bank of Nova Scotia New York Branch, VRDN |
4/7/11 | 0.23 (d) | 16,850 | 16,850 |
Municipal Securities - continued |
| Yield (a) | Principal
Amount (000s) | | Value
(000s) |
California Hsg. Fin. Agcy. Rev. (Home Mtg. Prog.) Series 2005 B1, (Liquidity Facility Fannie Mae) (Liquidity Facility Freddie Mac), VRDN |
4/7/11 | 0.22% (d)(e) | $ 12,475 | | $ 12,475 |
California Hsg. Fin. Agcy. Rev. (Multifamily Hsg. Prog.) Series III 2001 E, (Liquidity Facility Fannie Mae) (Liquidity Facility Freddie Mac), VRDN |
4/7/11 | 0.23 (d)(e) | 19,500 | | 19,500 |
California Hsg. Fin. Agcy. Rev. Series 2000 A, (Liquidity Facility Fannie Mae) (Liquidity Facility Freddie Mac), VRDN |
4/7/11 | 0.21 (d)(e) | 31,780 | | 31,780 |
California Hsg. Fin. Agcy. Rev. Series 2001 G, (Liquidity Facility Fannie Mae) (Liquidity Facility Freddie Mac), VRDN |
4/7/11 | 0.23 (d)(e) | 26,365 | | 26,365 |
California Poll. Cont. Fing. Auth. Solid Waste Disp. Rev. (Recology, Inc. Proj.) Series 2010 A, LOC Bank of America NA, VRDN |
4/7/11 | 0.25 (d) | 20,495 | | 20,495 |
California Statewide Cmntys. Dev. Auth. Multi-family Hsg. Rev. (Canyon Creek Apts. Proj.) Series 1995 C, LOC Fannie Mae, VRDN |
4/7/11 | 0.24 (d)(e) | 38,800 | | 38,800 |
California Statewide Cmntys. Dev. Auth. Multi-family Hsg. Rev. (Heritage Park Apts. Proj.) Series 2008 C, LOC Freddie Mac, VRDN |
4/7/11 | 0.24 (d)(e) | 9,000 | | 9,000 |
California Statewide Cmntys. Dev. Auth. Multi-family Hsg. Rev. (Vineyard Creek Apts. Proj.) Series 2003 W, LOC Fannie Mae, VRDN |
4/7/11 | 0.24 (d)(e) | 19,500 | | 19,500 |
Chester County Indl. Dev. Auth. Student Hsg. Rev. Series 2008 A, LOC Fed. Home Ln. Bank Pittsburgh, VRDN |
4/7/11 | 0.23 (d) | 64,525 | | 64,525 |
Chula Vista Multi-Family Hsg. Rev. (Teresina Apts. Proj.) Series 2006 A, LOC Fannie Mae, VRDN |
4/7/11 | 0.23 (d)(e) | 18,970 | | 18,970 |
Clark County McCarran Int'l. Arpt. Passenger Facility Charge Rev. Series 2010 F2, LOC Union Bank of California, VRDN |
4/7/11 | 0.27 (d) | 20,000 | | 20,000 |
Cobb County Kennestone Hosp. Auth. Rev. (WellStar Health Sys. Proj.) Series 2005 A, LOC Bank of America NA, VRDN |
4/7/11 | 0.27 (d) | 10,000 | | 10,000 |
Contra Costa County Multi-family Hsg. Rev. (Park Regency Proj.) Series 2003 F, LOC Fannie Mae, VRDN |
4/7/11 | 0.23 (d)(e) | 12,800 | | 12,800 |
Hamilton County Hosp. Facilities Rev. (Childrens Hosp. Med. Ctr. Proj.) Series 1997 A, LOC PNC Bank NA, VRDN |
4/7/11 | 0.25 (d) | 11,100 | | 11,100 |
Highlands County Health Facilities Auth. Rev. (Adventist Health Sys./Sunbelt Obligated Group Proj.) Series 2005 H, LOC U.S. Bank NA, Minnesota, VRDN |
4/7/11 | 0.21 (d) | 14,700 | | 14,700 |
Idaho Health Facilities Auth. Rev. (St. Luke's Health Sys. Proj.) Series 2009 B, LOC Harris NA, VRDN |
4/7/11 | 0.24 (d) | 18,000 | | 18,000 |
Illinois Edl. Facilities Auth. Revs. (Field Museum of Natural History Proj.) Series 2000, LOC JPMorgan Chase Bank, VRDN |
4/7/11 | 0.23 (d) | 11,200 | | 11,200 |
|
| Yield (a) | Principal
Amount (000s) | | Value
(000s) |
Illinois Fin. Auth. Poll. Cont. Rev. (Commonwealth Edison Co. Proj.) Series 2008 F, LOC JPMorgan Chase Bank, VRDN |
4/7/11 | 0.23% (d) | $ 10,100 | | $ 10,100 |
Illinois Fin. Auth. Rev. (Rehabilitation Institute of Chicago Proj.) Series 2009 B, LOC JPMorgan Chase Bank, VRDN |
4/7/11 | 0.21 (d) | 17,500 | | 17,500 |
Indiana Dev. Fin. Auth. Solid Waste Disp. Rev. (Waste Mgmt., Inc. Proj.) Series 2002 A, LOC JPMorgan Chase Bank, VRDN |
4/7/11 | 0.30 (d)(e) | 25,000 | | 25,000 |
Indiana Fin. Auth. Health Sys. Rev. (Sisters of Saint Francis Health Svcs., Inc. Obligated Group Proj.) Series 2008 D, LOC Bank of America NA, VRDN |
4/7/11 | 0.25 (d) | 11,500 | | 11,500 |
Kentucky Muni. Pwr. Agcy. Pwr. Sys. Rev. Participating VRDN Series Solar 07 107, (Liquidity Facility U.S. Bank NA, Minnesota) |
4/7/11 | 0.24 (d)(f) | 20,635 | | 20,635 |
Los Angeles Dept. of Wtr. & Pwr. Rev. Series 2002 A2, (Liquidity Facility JPMorgan Chase Bank), VRDN |
4/7/11 | 0.25 (d) | 17,200 | | 17,200 |
Massachusetts Gen. Oblig. Series 1998 A, (Liquidity Facility JPMorgan Chase Bank), VRDN |
4/7/11 | 0.21 (d) | 55,700 | | 55,700 |
Monroe County Dev. Auth. Poll. Cont. Rev. (Oglethorpe Pwr. Corp. Proj.) Series 2009 B, LOC JPMorgan Chase Bank, VRDN |
4/7/11 | 0.21 (d) | 17,500 | | 17,500 |
Nassau Health Care Corp. Rev. Series 2009 D1, LOC JPMorgan Chase Bank, VRDN |
4/7/11 | 0.24 (d) | 22,660 | | 22,660 |
New Jersey Gen. Oblig. Participating VRDN Series Putters 3808, (Liquidity Facility JPMorgan Chase & Co.) |
4/1/11 | 0.23 (d)(f) | 40,000 | | 40,000 |
New York City Hsg. Dev. Corp. Multi-family Rental Hsg. Rev. (Morris Avenue Apts. Proj.) Series A, LOC Fannie Mae, VRDN |
4/7/11 | 0.24 (d)(e) | 39,400 | | 39,400 |
New York City Hsg. Dev. Corp. Multi-family Rental Hsg. Rev. (One Columbus Place Dev. Proj.) Series A, LOC Fannie Mae, VRDN |
4/7/11 | 0.24 (d)(e) | 17,500 | | 17,500 |
New York City Hsg. Dev. Corp. Multi-family Rental Hsg. Rev. (Two Gold Street Proj.) Series 2006 A, LOC Fannie Mae, VRDN |
4/7/11 | 0.24 (d) | 33,000 | | 33,000 |
New York City Transitional Fin. Auth. Rev. Series 1999 A2, (Liquidity Facility JPMorgan Chase Bank), VRDN |
4/7/11 | 0.21 (d) | 20,600 | | 20,600 |
New York Dorm. Auth. Revs. (Univ. of Rochester Proj.) Series 2003 C, LOC JPMorgan Chase Bank, VRDN |
4/7/11 | 0.25 (d) | 9,400 | | 9,400 |
New York Hsg. Fin. Agcy. Rev. (150 East 44th Street Hsg. Proj.) Series 2000 A, LOC Fannie Mae, VRDN |
4/7/11 | 0.23 (d)(e) | 20,800 | | 20,800 |
New York Hsg. Fin. Agcy. Rev. (360 West 43rd Street Hsg. Proj.) Series A, LOC Fannie Mae, VRDN |
4/7/11 | 0.25 (d)(e) | 18,800 | | 18,800 |
Municipal Securities - continued |
| Yield (a) | Principal
Amount (000s) | | Value
(000s) |
New York Hsg. Fin. Agcy. Rev. (600 West 42nd Street Hsg. Proj.) Series 2007 A, LOC Bank of New York, New York, VRDN |
4/7/11 | 0.23% (d)(e) | $ 45,000 | | $ 45,000 |
New York Hsg. Fin. Agcy. Rev. (Kew Garden Hills Apts. Hsg. Proj.) Series 2003 A, LOC Fannie Mae, VRDN |
4/7/11 | 0.27 (d)(e) | 21,800 | | 21,800 |
New York Hsg. Fin. Agcy. Rev. (Tower 31 Hsg. Proj.) Series 2005 A, LOC Freddie Mac, VRDN |
4/7/11 | 0.25 (d)(e) | 31,800 | | 31,800 |
New York Hsg. Fin. Agcy. Rev. (Union Square South Proj.) Series 1996 A, LOC Fannie Mae, VRDN |
4/7/11 | 0.24 (d)(e) | 26,300 | | 26,300 |
New York Local Govt. Assistance Corp. Series 2008 B3V, (Liquidity Facility JPMorgan Chase Bank), VRDN |
4/7/11 | 0.25 (d) | 25,500 | | 25,500 |
New York Local Govt. Assistance Corp. Series 2008 B7V, (Liquidity Facility JPMorgan Chase Bank), VRDN |
4/7/11 | 0.21 (d) | 12,400 | | 12,400 |
North Texas Tollway Auth. Rev. Series 2009 D, LOC JPMorgan Chase Bank, VRDN |
4/7/11 | 0.22 (d) | 28,000 | | 28,000 |
Northwest Texas Independent School District Participating VRDN Series Solar 06 47, (Liquidity Facility U.S. Bank NA, Minnesota) |
4/7/11 | 0.24 (d)(f) | 14,365 | | 14,365 |
Ohio Hsg. Fin. Agcy. Residential Mtg. Rev. Series 2008 B, (Liquidity Facility Fed. Home Ln. Bank, Cincinnati), VRDN |
4/7/11 | 0.23 (d)(e) | 38,900 | | 38,900 |
Pennsylvania Hsg. Fin. Agcy. Single Family Mtg. Rev. Series 2008 102C, (Liquidity Facility Bank of America NA), VRDN |
4/7/11 | 0.25 (d)(e) | 39,000 | | 39,000 |
Philadelphia Arpt. Rev. Series 2005 C, LOC TD Banknorth, NA, VRDN |
4/7/11 | 0.23 (d)(e) | 30,875 | | 30,875 |
Phoenix Indl. Dev. Auth. Multi-family Hsg. Rev. (Paradise Lakes Apt. Proj.) Series 2007 A, LOC Wells Fargo Bank NA, VRDN |
4/7/11 | 0.23 (d) | 10,125 | | 10,125 |
Pinellas County Health Facilities Auth. Rev. (BayCare Health Sys. Proj.) Series 2009 A2, LOC Northern Trust Co., VRDN |
4/7/11 | 0.24 (d) | 10,000 | | 10,000 |
Port of Portland Arpt. Rev. Series Eighteen A, LOC Lloyds TSB Bank PLC, VRDN |
4/7/11 | 0.23 (d)(e) | 27,340 | | 27,340 |
Rhode Island Health and Edl. Bldg. Corp. Higher Ed. Facility Rev. (Rhode Island School of Design Proj.) Series 2008 B, LOC Bank of America NA, VRDN |
4/7/11 | 0.22 (d) | 11,000 | | 11,000 |
Saint Joseph County Hosp. Auth. Health Sys. Rev. (Memorial Health Sys. Proj.) Series 2008 B, LOC JPMorgan Chase Bank, VRDN |
4/7/11 | 0.24 (d) | 38,105 | | 38,105 |
South Miami Health Facilities Auth. Hosp. Rev. Participating VRDN Series BA 07 1025, (Liquidity Facility Bank of America NA) |
4/7/11 | 0.32 (d)(f) | 10,000 | | 10,000 |
Southern California Pub. Pwr. Auth. Rev. (Magnolia Pwr. Proj.) Series 2009-1, LOC KBC Bank NV, VRDN |
4/7/11 | 0.25 (d) | 13,255 | | 13,255 |
|
| Yield (a) | Principal
Amount (000s) | | Value
(000s) |
Stockton Pub. Fing. Auth. Wtr. Rev. (Delta Wtr. Supply Proj.) Series 2010 A, LOC Union Bank of California, VRDN |
4/7/11 | 0.25% (d) | $ 12,900 | | $ 12,900 |
Travis County Health Facilities Dev. (Longhorn Village Proj.) Series 2008 B, LOC Bank of Scotland PLC, VRDN |
4/7/11 | 0.23 (d) | 18,700 | | 18,700 |
Triborough Bridge & Tunnel Auth. Revs. Series 2002 F, (Liquidity Facility Royal Bank of Scotland NV), VRDN |
4/7/11 | 0.23 (d) | 70,925 | | 70,925 |
Triborough Bridge & Tunnel Auth. Revs. Series 2005 B3, (Liquidity Facility Bank of America NA), VRDN |
4/7/11 | 0.24 (d) | 10,000 | | 10,000 |
Washington Econ. Dev. Fin. Auth. Solid Waste Disp. Rev. (Waste Mgmt., Inc. Proj.) Series E, LOC JPMorgan Chase Bank, VRDN |
4/7/11 | 0.30 (d)(e) | 20,000 | | 20,000 |
TOTAL MUNICIPAL SECURITIES | 1,430,210 |
Repurchase Agreements - 20.1% |
| Maturity
Amount
(000s) | | |
In a joint trading account at: | | | |
0.18% dated 3/31/11 due 4/1/11 (Collateralized by U.S. Government Obligations) # | $ 783,008 | | 783,004 |
0.2% dated 3/31/11 due 4/1/11 (Collateralized by U.S. Government Obligations) # | 640,588 | | 640,584 |
With: | | | |
Banc of America Securities LLC at 0.77%, dated 10/28/10 due 5/5/11 (Collateralized by Mortgage Obligations valued at $505,450,811, .34% - 7.63%, 4/25/32 - 4/7/52)(d)(g) | 471,729 | | 468,000 |
Barclays Capital, Inc. at: | | | |
0.24%, dated 3/31/11 due 4/1/11 (Collateralized by Corporate Obligations valued at $731,882,440, 0% - 13%, 5/20/11 - 10/1/53) | 725,005 | | 725,000 |
0.32%, dated 3/31/11 due 4/1/11 (Collateralized by Equity Securities valued at $139,216,426) | 129,001 | | 129,000 |
0.37%, dated: | | | |
3/25/11 due 4/1/11 (Collateralized by Equity Securities valued at $243,017,491) | 225,016 | | 225,000 |
3/28/11 due 4/4/11 (Collateralized by Equity Securities valued at $193,327,962) | 179,013 | | 179,000 |
3/29/11 due 4/5/11 (Collateralized by Equity Securities valued at $195,486,034) | 181,013 | | 181,000 |
Repurchase Agreements - continued |
| Maturity
Amount
(000s) | | Value (000s) |
With: - continued | | | |
Barclays Capital, Inc. at: | | | |
0.37%, dated: | | | |
3/31/11 due: | | | |
4/1/11 (Collateralized by Commercial Paper Obligations valued at $57,477,317, 0% - 8%, 4/28/11 - 11/15/21) | $ 56,001 | | $ 56,000 |
4/7/11 (Collateralized by Equity Securities valued at $97,201,043) | 90,006 | | 90,000 |
0.42%, dated: | | | |
3/29/11 due 4/7/11 (Collateralized by Corporate Obligations valued at $146,885,141, 0.47% - 6.8%, 1/10/28 - 9/25/45) | 136,022 | | 136,000 |
3/31/11 due 4/1/11 (Collateralized by Corporate Obligations valued at $222,482,596, 0% - 12.5%, 8/17/11 - 3/31/56) | 206,002 | | 206,000 |
0.57%, dated 3/31/11 due 4/1/11 (Collateralized by Corporate Obligations valued at $20,520,326, 2.5% - 5.75%, 9/15/29 - 10/15/29) | 19,000 | | 19,000 |
1%, dated: | | | |
8/24/10 due 7/5/11 (Collateralized by Mortgage Loan Obligations valued at $233,468,084, 0.41% - 7.78%, 7/15/13 - 3/17/51) | 223,241 | | 221,000 |
9/9/10 due 7/5/11 (Collateralized by Mortgage Loan Obligations valued at $237,950,937, 0.47% - 6.5%, 12/12/11 - 9/15/45) | 223,235 | | 221,000 |
10/13/10 due 7/5/11 (Collateralized by Corporate Obligations valued at $155,169,300, 1.5% - 5.75%, 8/1/13 - 1/1/49) | 144,442 | | 143,000 |
BNP Paribas Securities Corp. at 0.21%, dated 2/11/11 due 4/7/11 (Collateralized by U.S. Goverment Obligations valued at $204,135,560, 0.45% - 8%, 11/15/16 - 2/20/41) | 199,208 | | 199,000 |
Citigroup Global Markets, Inc. at: | | | |
0.32%, dated 3/31/11 due 4/1/11 (Collateralized by U.S. Government Obligations valued at $80,340,714, 0% - 6.51%, 2/20/35 - 2/20/41) | 78,001 | | 78,000 |
0.52%, dated 3/31/11 due 4/1/11 (Collateralized by Mortgage Obligations valued at $108,001,560, 0.45% - 5.8%, 11/1/15 - 12/25/46) | 100,001 | | 100,000 |
|
| Maturity
Amount
(000s) | | Value (000s) |
Credit Suisse Securities (USA) LLC at 0.25%, dated 3/31/11 due 4/1/11 (Collateralized by Equity Securities valued at $3,030,585,930) | $ 2,806,019 | | $ 2,806,000 |
Deutsche Bank Securities, Inc. at: | | | |
0.19%, dated 3/1/11 due 4/7/11 (Collateralized by U.S. Government Obligations valued at $411,127,254, 1.83% - 7%, 2/1/23 - 3/1/41) | 403,185 | | 403,000 |
0.23%, dated 10/26/10 due 4/7/11 (Collateralized by U.S. Government Obligations valued at $221,562,017, 2.68% - 6%, 8/1/35 - 12/1/40) | 217,251 | | 217,000 |
0.24%, dated 11/15/10 due 4/7/11 (Collateralized by U.S. Government Obligations valued at $200,102,595, 2.98% - 6.5%, 1/1/26 - 1/1/41) | 196,238 | | 196,000 |
0.25%, dated 12/1/10 due 4/7/11 (Collateralized by U.S. Government Obligations valued at $207,233,988, 3.81% - 5.5%, 8/1/24 - 12/1/40) | 203,264 | | 203,000 |
0.32%, dated 3/31/11 due 4/1/11 (Collateralized by Equity Securities valued at $84,240,751) | 78,001 | | 78,000 |
0.4%, dated 1/28/11 due 4/7/11 (Collateralized by Mortgage Loan Obligations valued at $123,535,892, 0.33% - 37.5%, 4/1/11 - 10/15/49) | 115,121 | | 115,000 |
0.41%, dated: | | | |
1/19/11 due 4/7/11 (Collateralized by Corporate Obligations valued at $127,456,019, 0% - 11.88%, 3/1/12 - 12/10/49) | 118,121 | | 118,000 |
2/7/11 due 4/7/11 (Collateralized by Corporate Obligations valued at $60,404,192, 0% - 13%, 4/1/11 - 11/20/48) | 56,058 | | 56,000 |
2/17/11 due 4/7/11 (Collateralized by Corporate Obligations valued at $61,587,771, 0% - 13%, 4/1/11 - 6/13/41) | 57,058 | | 57,000 |
2/25/11 due 4/7/11 (Collateralized by Corporate Obligations valued at $124,343,400, 0.15% - 14%, 3/1/12 - 1/15/49) | 116,119 | | 116,000 |
3/7/11 due 4/7/11 (Collateralized by Corporate Obligations valued at $123,152,468, 0% - 13%, 8/1/11 - 4/5/56) | 114,119 | | 114,000 |
Repurchase Agreements - continued |
| Maturity
Amount
(000s) | | Value (000s) |
With: - continued | | | |
Deutsche Bank Securities, Inc. at: | | | |
0.47%, dated 3/31/11 due 4/1/11 (Collateralized by Corporate Obligations valued at $135,001,763, 0.34% - 14%, 4/1/11 - 12/11/49) | $ 125,002 | | $ 125,000 |
0.52%, dated 3/31/11 due 4/1/11 (Collateralized by Equity Securities valued at $58,320,844) | 54,001 | | 54,000 |
Goldman Sachs & Co. at 0.27%, dated 3/30/11 due 4/6/11 (Collateralized by U.S. Government Obligations valued at $174,422,617, 4% - 7%, 6/1/35 - 2/1/41) | 171,009 | | 171,000 |
ING Financial Markets LLC at: | | | |
0.22%, dated: | | | |
1/24/11 due 4/7/11 (Collateralized by U.S. Government Obligations valued at $143,878,790, 2.13% - 6.15%, 1/1/23 - 2/1/41) | 141,103 | | 141,000 |
2/7/11 due 4/7/11 (Collateralized by U.S. Government Obligations valued at $411,104,469, 2% - 6%, 9/25/11 - 10/15/46) | 399,444 | | 399,000 |
2/11/11 due 4/7/11 (Collateralized by U.S. Government Obligations valued at $102,031,180, 5%, 5/1/39 - 3/1/40) | 100,110 | | 100,000 |
0.23%, dated 11/8/10 due 4/7/11 (Collateralized by U.S. Government Obligations valued at $183,581,207, 4.5% - 7%, 6/1/35 - 2/25/40) | 179,208 | | 179,000 |
0.24%, dated: | | | |
10/18/10 due 4/7/11 (Collateralized by U.S. Government Obligations valued at $101,090,962, 2.12% - 6.29%, 1/1/27 - 5/1/40) | 99,120 | | 99,000 |
10/25/10 due 4/7/11 (Collateralized by U.S. Government Obligations valued at $101,087,038, 2.04% - 6.58%, 7/1/14 - 11/1/40) | 99,120 | | 99,000 |
11/15/10 due 4/7/11 (Collateralized by U.S. Government Obligations valued at $50,027,289, 5%, 3/1/40) | 49,058 | | 49,000 |
|
| Maturity
Amount
(000s) | | Value (000s) |
0.25%, dated 10/1/10 due 4/1/11 (Collateralized by U.S. Goverment Obligations valued at $107,238,256, 1.36% - 6.15%, 2/1/18 - 4/1/41) | $ 105,133 | | $ 105,000 |
Merrill Lynch, Pierce, Fenner & Smith at: | | | |
0.32%, dated 3/31/11 due 4/1/11 (Collateralized by Equity Securities valued at $: | | | |
189,001,683) | 175,002 | | 175,000 |
648,005,785) | 600,005 | | 600,000 |
0.35%, dated 3/31/11 due 4/1/11 (Collateralized by Corporate Obligations valued at $407,403,961, 0% - 5.81%, 1/26/15 - 6/24/50) | 388,004 | | 388,000 |
0.4%, dated 3/31/11 due 4/1/11 (Collateralized by Corporate Obligations valued at $605,856,733, 0% - 9.1%, 4/4/14 - 12/25/48) | 577,006 | | 577,000 |
0.52%, dated 3/31/11 due 4/1/11 (Collateralized by Corporate Obligations valued at $324,004,681, 0% - 15%, 4/15/11 - 3/31/56) | 300,004 | | 300,000 |
0.62%, dated 3/31/11 due 4/1/11 (Collateralized by Mortgage Loan Obligations valued at $599,410,323, 0.32% - 7.4%, 10/9/13 - 8/25/47) | 555,010 | | 555,000 |
RBS Securities, Inc. at: | | | |
0.25%, dated 10/27/10 due 4/7/11 (Collateralized by U.S. Government Obligations valued at $103,135,634, 2.47% - 6.36%, 2/1/33 - 4/1/41) | 101,126 | | 101,000 |
0.61%, dated 3/22/11 due 4/7/11 (Collateralized by Corporate Obligations valued at $267,882,132, 0.18% - 8.3%, 6/12/17 - 4/7/52) | 248,126 | | 248,000 |
0.76%, dated 8/5/10 due 5/5/11 (Collateralized by Mortgage Loan Obligations valued at $237,602,705, 0% - 6.28%, 4/25/14 - 11/25/47) (d)(g) | 221,686 | | 220,000 |
Royal Bank of Scotland PLC at 0.61%, dated 3/22/11 due 4/7/11 (Collateralized by Mortgage Loan Obligations valued at $244,118,349, 0% - 8.57%, 1/15/12 - 7/25/47) | 226,115 | | 226,000 |
Wells Fargo Securities, LLC at 0.25%, dated 10/21/10 due 4/7/11 (Collateralized by U.S. Government Obligations valued at $51,057,375, 4.5%, 3/1/41 - 3/1/49) | 50,063 | | 50,000 |
Repurchase Agreements - continued |
| Maturity
Amount
(000s) | | Value (000s) |
TOTAL REPURCHASE AGREEMENTS | 14,239,588 |
TOTAL INVESTMENT PORTFOLIO - 100.1% (Cost $70,917,428) | | 70,917,428 |
NET OTHER ASSETS (LIABILITIES) - (0.1)% | | (74,101) |
NET ASSETS - 100% | $ 70,843,327 |
Security Type Abbreviations |
CP COMMERCIAL PAPER |
VRDN VARIABLE RATE DEMAND NOTE (A debt instrument that is payable upon demand, either daily, weekly or monthly) |
Legend |
(a) Yield represents either the annualized yield at the date of purchase, or the stated coupon rate, or, for floating and adjustable rate securities, the rate at period end. |
(b) Security exempt from registration under Rule 144A of the Securities Act of 1933. These securities may be resold in transactions exempt from registration, normally to qualified institutional buyers. At the end of the period, the value of these securities amounted to $2,624,500,000 or 3.7% of net assets. |
(c) The Federal Financing Bank, an instrumentality of the U.S. Government acting under the supervision of the Secretary of the Treasury (FFB), has entered into a Liquidity Loan Agreement with Straight-A Funding LLC (Issuer), pursuant to which the FFB has committed, subject to certain conditions, to provide financing to the Issuer to cover any payment deficiencies in respect of notes on their legal final maturity dates. At the end of the period, these securities amounted to $878,444,000, or 1.2% of net assets. |
(d) Coupon rates for floating and adjustable rate securities reflect the rates in effect at period end. |
(e) Private activity obligations whose interest is subject to the federal alternative minimum tax for individuals. |
(f) Provides evidence of ownership in one or more underlying municipal bonds. |
(g) The maturity amount is based on the rate at period end. |
(h) Restricted securities - Investment in securities not registered under the Securities Act of 1933 (excluding 144A issues). At the end of the period, the value of restricted securities (excluding 144A issues) amounted to $30,000,000 or 0.0% of net assets. |
Additional information on each restricted holding is as follows: |
Security | Acquisition Date | Cost (000s) |
Metropolitan Life Insurance Co. 0.6%, 4/1/11 | 3/26/02 | $ 30,000 |
# Additional information on each counterparty to the repurchase agreement is as follows: |
Repurchase Agreement / Counterparty | Value
(Amounts in
thousands) |
$783,004,000 due 4/01/11 at 0.18% |
Bank of America NA | $ 350,291 |
Barclays Capital, Inc. | 154,540 |
Merrill Lynch, Pierce, Fenner & Smith, Inc. | 72,119 |
UBS Securities LLC | 206,054 |
| $ 783,004 |
$640,584,000 due 4/01/11 at 0.20% |
Bank of America NA | $ 178,477 |
Citibank NA | 10,315 |
Citigroup Global Markets, Inc. | 82,519 |
Deutsche Bank Securities, Inc. | 154,723 |
J.P. Morgan Securities, Inc. | 20,630 |
RBC Capital Markets Corp. | 10,315 |
UBS Securities LLC | 53,637 |
Wells Fargo Securities LLC | 129,968 |
| $ 640,584 |
Other Information |
The date shown for securities represents the date when principal payments must be paid, taking into account any call options exercised by the issuer and any permissible maturity shortening features other than interest rate resets. |
All investments are categorized as Level 2 under the Fair Value Hierarchy. The inputs or methodology used for valuing securities may not be an indication of the risk associated with investing in those securities. For more information on valuation inputs, please refer to the Security Valuation section in the accompanying Notes to Financial Statements. |
See accompanying notes which are an integral part of the financial statements.
Annual Report
Prime Money Market Portfolio
Financial Statements
Statement of Assets and Liabilities
Amounts in thousands (except per-share amounts) | March 31, 2011 |
| | |
Assets | | |
Investment in securities, at value (including repurchase agreements of $14,239,588) - See accompanying schedule: Unaffiliated issuers (cost $70,917,428) | | $ 70,917,428 |
Cash | | 10 |
Receivable for fund shares sold | | 924 |
Interest receivable | | 40,788 |
Prepaid expenses | | 94 |
Receivable from investment adviser for expense reductions | | 1,203 |
Other receivables | | 173 |
Total assets | | 70,960,620 |
| | |
Liabilities | | |
Payable for investments purchased | $ 99,995 | |
Payable for fund shares redeemed | 702 | |
Distributions payable | 4,836 | |
Accrued management fee | 8,239 | |
Distribution and service plan fees payable | 487 | |
Other affiliated payables | 2,644 | |
Other payables and accrued expenses | 390 | |
Total liabilities | | 117,293 |
| | |
Net Assets | | $ 70,843,327 |
Net Assets consist of: | | |
Paid in capital | | $ 70,843,327 |
Net Assets | | $ 70,843,327 |
Class I:
Net Asset Value, offering price and redemption price per share ($21,760,723 ÷ 21,758,346 shares) | | $ 1.00 |
| | |
Class II:
Net Asset Value, offering price and redemption price per share ($776,065 ÷ 775,938 shares) | | $ 1.00 |
| | |
Class III:
Net Asset Value, offering price and redemption price per share ($2,731,842 ÷ 2,732,032 shares) | | $ 1.00 |
| | |
Class IV:
Net Asset Value, offering price and redemption price per share ($189,568 ÷ 189,552 shares) | | $ 1.00 |
| | |
Select Class:
Net Asset Value, offering price and redemption price per share ($1,271,940 ÷ 1,271,825 shares) | | $ 1.00 |
| | |
Institutional Class:
Net Asset Value, offering price and redemption price per share ($44,113,189 ÷ 44,108,672 shares) | | $ 1.00 |
Statement of Operations
Amounts in thousands | Year ended March 31, 2011 |
| | |
Investment Income | | |
Interest | | $ 273,482 |
| | |
Expenses | | |
Management fee | $ 98,386 | |
Transfer agent fees | 30,464 | |
Distribution and service plan fees | 9,092 | |
Accounting fees and expenses | 2,294 | |
Custodian fees and expenses | 854 | |
Independent trustees' compensation | 262 | |
Registration fees | 338 | |
Audit | 57 | |
Legal | 198 | |
Interest | 6 | |
Miscellaneous | 49 | |
Total expenses before reductions | 142,000 | |
Expense reductions | (18,450) | 123,550 |
Net investment income (loss) | | 149,932 |
Realized and Unrealized Gain (Loss) Net realized gain (loss) on: | | |
Investment securities: | | |
Unaffiliated issuers | | 1,710 |
Net increase in net assets resulting from operations | | $ 151,642 |
See accompanying notes which are an integral part of the financial statements.
Annual Report
Prime Money Market Portfolio
Financial Statements - continued
Statement of Changes in Net Assets
Amounts in thousands | Year ended
March 31,
2011 | Year ended
March 31,
2010 |
Increase (Decrease) in Net Assets | | |
Operations | | |
Net investment income (loss) | $ 149,932 | $ 156,754 |
Net realized gain (loss) | 1,710 | 4,970 |
Net increase in net assets resulting from operations | 151,642 | 161,724 |
Distributions to shareholders from net investment income | (149,918) | (156,764) |
Share transactions - net increase (decrease) | (1,908,509) | 42,588,910 |
Total increase (decrease) in net assets | (1,906,785) | 42,593,870 |
| | |
Net Assets | | |
Beginning of period | 72,750,112 | 30,156,242 |
End of period | $ 70,843,327 | $ 72,750,112 |
Financial Highlights - Class I
Years ended March 31, | 2011 | 2010 | 2009 | 2008 | 2007 |
Selected Per-Share Data | | | | | |
Net asset value, beginning of period | $ 1.00 | $ 1.00 | $ 1.00 | $ 1.00 | $ 1.00 |
Income from Investment Operations | | | | | |
Net investment income (loss) | .002 | .003 | .022 | .049 | .051 |
Distributions from net investment income | (.002) | (.003) | (.022) | (.049) | (.051) |
Net asset value, end of period | $ 1.00 | $ 1.00 | $ 1.00 | $ 1.00 | $ 1.00 |
Total Return A | .19% | .33% | 2.23% | 4.96% | 5.22% |
Ratios to Average Net Assets B | | | | | |
Expenses before reductions | .21% | .22% | .23% | .22% | .23% |
Expenses net of fee waivers, if any | .20% | .21% | .22% | .20% | .20% |
Expenses net of all reductions | .20% | .21% | .22% | .20% | .20% |
Net investment income (loss) | .19% | .29% | 2.14% | 4.84% | 5.09% |
Supplemental Data | | | | | |
Net assets, end of period (in millions) | $ 21,761 | $ 30,823 | $ 11,953 | $ 7,810 | $ 9,075 |
A Total returns would have been lower had certain expenses not been reduced during the periods shown.
B Expense ratios reflect operating expenses of the class. Expenses before reductions do not reflect amounts reimbursed or waived or reductions from expense offset arrangements and do not represent the amount paid by the class during periods when reimbursements, waivers or reductions occur. Expenses net of fee waivers reflect expenses after reimbursement and waivers but prior to reductions from expense offset arrangements. Expenses net of all reductions represent the net expenses paid by the class.
See accompanying notes which are an integral part of the financial statements.
Annual Report
Financial Highlights - Class II
Years ended March 31, | 2011 | 2010 | 2009 | 2008 | 2007 |
Selected Per-Share Data | | | | | |
Net asset value, beginning of period | $ 1.00 | $ 1.00 | $ 1.00 | $ 1.00 | $ 1.00 |
Income from Investment Operations | | | | | |
Net investment income (loss) | - C | .002 | .021 | .047 | .049 |
Distributions from net investment income | - C | (.002) | (.021) | (.047) | (.049) |
Net asset value, end of period | $ 1.00 | $ 1.00 | $ 1.00 | $ 1.00 | $ 1.00 |
Total Return A | .04% | .19% | 2.08% | 4.81% | 5.06% |
Ratios to Average Net Assets B | | | | | |
Expenses before reductions | .36% | .37% | .38% | .37% | .38% |
Expenses net of fee waivers, if any | .35% | .35% | .37% | .35% | .35% |
Expenses net of all reductions | .35% | .35% | .37% | .35% | .35% |
Net investment income (loss) | .04% | .14% | 1.99% | 4.72% | 4.94% |
Supplemental Data | | | | | |
Net assets, end of period (in millions) | $ 776 | $ 959 | $ 1,475 | $ 1,363 | $ 1,152 |
A Total returns would have been lower had certain expenses not been reduced during the periods shown.
B Expense ratios reflect operating expenses of the class. Expenses before reductions do not reflect amounts reimbursed or waived or reductions from expense offset arrangements and do not represent the amount paid by the class during periods when reimbursements, waivers or reductions occur. Expenses net of fee waivers reflect expenses after reimbursement and waivers but prior to reductions from expense offset arrangements. Expenses net of all reductions represent the net expenses paid by the class.
C Amount represents less than $.001 per share.
Financial Highlights - Class III
Years ended March 31, | 2011 | 2010 | 2009 | 2008 | 2007 |
Selected Per-Share Data | | | | | |
Net asset value, beginning of period | $ 1.00 | $ 1.00 | $ 1.00 | $ 1.00 | $ 1.00 |
Income from Investment Operations | | | | | |
Net investment income (loss) | - C | .001 | .020 | .046 | .048 |
Distributions from net investment income | - C | (.001) | (.020) | (.046) | (.048) |
Net asset value, end of period | $ 1.00 | $ 1.00 | $ 1.00 | $ 1.00 | $ 1.00 |
Total Return A | .01% | .13% | 1.98% | 4.70% | 4.96% |
Ratios to Average Net Assets B | | | | | |
Expenses before reductions | .46% | .47% | .48% | .47% | .48% |
Expenses net of fee waivers, if any | .38% | .42% | .47% | .45% | .45% |
Expenses net of all reductions | .38% | .42% | .47% | .45% | .45% |
Net investment income (loss) | .01% | .07% | 1.89% | 4.60% | 4.84% |
Supplemental Data | | | | | |
Net assets, end of period (in millions) | $ 2,732 | $ 2,851 | $ 3,539 | $ 2,911 | $ 3,053 |
A Total returns would have been lower had certain expenses not been reduced during the periods shown.
B Expense ratios reflect operating expenses of the class. Expenses before reductions do not reflect amounts reimbursed or waived or reductions from expense offset arrangements and do not represent the amount paid by the class during periods when reimbursements, waivers or reductions occur. Expenses net of fee waivers reflect expenses after reimbursement and waivers but prior to reductions from expense offset arrangements. Expenses net of all reductions represent the net expenses paid by the class.
C Amount represents less than $.001 per share.
See accompanying notes which are an integral part of the financial statements.
Annual Report
Financial Highlights - Class IV
Years ended March 31, | 2011 | 2010 | 2009 | 2008 D |
Selected Per-Share Data | | | | |
Net asset value, beginning of period | $ 1.00 | $ 1.00 | $ 1.00 | $ 1.00 |
Income from Investment Operations | | | | |
Net investment income (loss) | - F | - F | .017 | .011 |
Distributions from net investment income | - F | - F | (.017) | (.011) |
Net asset value, end of period | $ 1.00 | $ 1.00 | $ 1.00 | $ 1.00 |
Total Return B, C | .01% | .04% | 1.72% | 1.10% |
Ratios to Average Net Assets E | | | | |
Expenses before reductions | .71% | .72% | .73% | .73% A |
Expenses net of fee waivers, if any | .38% | .49% | .72% | .70% A |
Expenses net of all reductions | .38% | .49% | .72% | .70% A |
Net investment income (loss) | .01% | -% G | 1.64% | 3.54% A |
Supplemental Data | | | | |
Net assets, end of period (in millions) | $ 190 | $ 272 | $ 67 | $ 1 |
A Annualized
B Total returns for periods of less than one year are not annualized.
C Total returns would have been lower had certain expenses not been reduced during the periods shown.
D For the period December 12, 2007 (commencement of sale of shares) to March 31, 2008.
E Expense ratios reflect operating expenses of the class. Expenses before reductions do not reflect amounts reimbursed or waived or reductions from expense offset arrangements and do not represent the amount paid by the class during periods when reimbursements, waivers or reductions occur. Expense ratios before reductions for start-up periods may not be representative of longer-term operating periods. Expenses net of fee waivers reflect expenses after reimbursement and waivers but prior to reductions from expense offset arrangements. Expenses net of all reductions represent the net expenses paid by the class.
F Amount represents less than $.001 per share.
G Amount represents less than .01%.
Financial Highlights - Select Class
Years ended March 31, | 2011 | 2010 | 2009 | 2008 | 2007 |
Selected Per-Share Data | | | | | |
Net asset value, beginning of period | $ 1.00 | $ 1.00 | $ 1.00 | $ 1.00 | $ 1.00 |
Income from Investment Operations | | | | | |
Net investment income (loss) | .001 | .003 | .022 | .048 | .050 |
Distributions from net investment income | (.001) | (.003) | (.022) | (.048) | (.050) |
Net asset value, end of period | $ 1.00 | $ 1.00 | $ 1.00 | $ 1.00 | $ 1.00 |
Total Return A | .14% | .28% | 2.18% | 4.91% | 5.17% |
Ratios to Average Net Assets B | | | | | |
Expenses before reductions | .26% | .27% | .28% | .27% | .28% |
Expenses net of fee waivers, if any | .25% | .26% | .27% | .25% | .25% |
Expenses net of all reductions | .25% | .26% | .27% | .25% | .25% |
Net investment income (loss) | .14% | .24% | 2.09% | 4.76% | 5.04% |
Supplemental Data | | | | | |
Net assets, end of period (in millions) | $ 1,272 | $ 752 | $ 600 | $ 501 | $ 381 |
A Total returns would have been lower had certain expenses not been reduced during the periods shown.
B Expense ratios reflect operating expenses of the class. Expenses before reductions do not reflect amounts reimbursed or waived or reductions from expense offset arrangements and do not represent the amount paid by the class during periods when reimbursements, waivers or reductions occur. Expenses net of fee waivers reflect expenses after reimbursement and waivers but prior to reductions from expense offset arrangements. Expenses net of all reductions represent the net expenses paid by the class.
See accompanying notes which are an integral part of the financial statements.
Annual Report
Financial Highlights - Institutional Class
Years ended March 31, | 2011 | 2010 | 2009 | 2008 D |
Selected Per-Share Data | | | | |
Net asset value, beginning of period | $ 1.00 | $ 1.00 | $ 1.00 | $ 1.00 |
Income from Investment Operations | | | | |
Net investment income (loss) | .003 | .004 | .023 | .013 |
Distributions from net investment income | (.003) | (.004) | (.023) | (.013) |
Net asset value, end of period | $ 1.00 | $ 1.00 | $ 1.00 | $ 1.00 |
Total Return B, C | .25% | .39% | 2.29% | 1.27% |
Ratios to Average Net Assets E | | | | |
Expenses before reductions | .18% | .19% | .20% | .19% A |
Expenses net of fee waivers, if any | .14% | .15% | .16% | .14% A |
Expenses net of all reductions | .14% | .15% | .16% | .14% A |
Net investment income (loss) | .25% | .35% | 2.20% | 4.02% A |
Supplemental Data | | | | |
Net assets, end of period (in millions) | $ 44,113 | $ 37,092 | $ 12,523 | $ 7,174 |
A Annualized
B Total returns for periods of less than one year are not annualized.
C Total returns would have been lower had certain expenses not been reduced during the periods shown.
D For the period December 12, 2007 (commencement of sale of shares) to March 31, 2008.
E Expense ratios reflect operating expenses of the class. Expenses before reductions do not reflect amounts reimbursed or waived or reductions from expense offset arrangements and do not represent the amount paid by the class during periods when reimbursements, waivers or reductions occur. Expense ratios before reductions for start-up periods may not be representative of longer-term operating periods. Expenses net of fee waivers reflect expenses after reimbursement and waivers but prior to reductions from expense offset arrangements. Expenses net of all reductions represent the net expenses paid by the class.
See accompanying notes which are an integral part of the financial statements.
Annual Report
Money Market Portfolio
Investment Changes (Unaudited)
Weighted Average Maturity Diversification |
Days | % of fund's
investments
3/31/11 | % of fund's
investments
9/30/10 | % of fund's
investments
3/31/10 |
0 - 30 | 56.1 | 53.6 | 43.9 |
31 - 90 | 24.4 | 31.6 | 31.0 |
91 - 180 | 14.0 | 12.0 | 15.2 |
181 - 397 | 5.5 | 2.8 | 9.9 |
Effective maturity is determined in accordance with the requirements of Rule 2a-7 under the Investment Company Act of 1940. |
Weighted Average Maturity |
| 3/31/11 | 9/30/10 | 3/31/10 |
Money Market Portfolio | 48 Days | 49 Days | 71 Days |
All Taxable Money Market Fund Average* | 45 Days | 44 Days | 44 Days |
This is a weighted average of all the maturities of the securities held in a fund. Weighted Average Maturity (WAM) can be used as a measure of sensitivity to interest rate changes and markets changes. Generally, the longer the maturity, the greater the sensitivity to such changes. WAM is based on the dollar-weighted average length of time until principal payments must be paid. Depending on the types of securities held in a fund, certain maturity shortening devices (e.g., demand features, interest rate resets, and call options) may be taken into account when calculating the WAM. |
Weighted Average Life |
| 3/31/11 | 9/30/10 | 3/31/10 |
Money Market Portfolio | 92 Days | 82 Days | n/a** |
Weighted Average Life (WAL) is the weighted average of the life of the securities held in a fund or portfolio and can be used as a measure of sensitivity to changes in liquidity and/or credit risk. Generally, the higher the value, the greater the sensitivity. WAL is based on the dollar-weighted average length of time until principal payments must be paid, taking into account any call options exercised by the issuer and any permissible maturity shortening features other than interest rate resets. The difference between WAM and WAL is that WAM takes into account interest rate resets and WAL does not. WAL for money market funds is not the same as WAL of a mortgage- or asset-backed security. |
Asset Allocation (% of fund's net assets) |
As of March 31, 2011 | As of September 30, 2010 |
| Corporate Bonds 0.1% | | | Corporate Bonds 0.1% | |
| Commercial Paper 20.0% | | | Commercial Paper 17.3% | |
| Bank CDs, BAs,
TDs, and Notes 51.0% | | | Bank CDs, BAs,
TDs, and Notes 59.3% | |
| Government Securities† 6.4% | | | Government Securities†† 7.0% | |
| Repurchase Agreements 23.7% | | | Repurchase Agreements 18.7% | |
| Net Other Assets*** (1.2)% | | | Net Other Assets*** (2.4)% | |
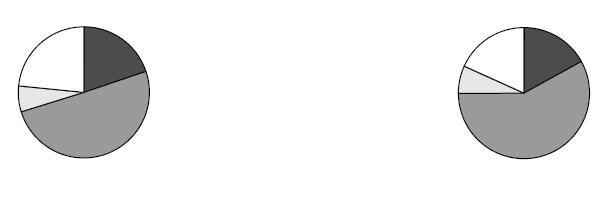
* Source: iMoneyNet, Inc.
** Information not available
*** Net Other Assets are not included in the pie chart.
† Includes Federal Financing Bank Supported Student Loan Short-Term Notes.
†† Includes FDIC Guaranteed Corporate Securities.
Annual Report
Money Market Portfolio
Investments March 31, 2011
Showing Percentage of Net Assets
Corporate Bonds - 0.1% |
| | Yield (a) | Principal
Amount (000s) | Value (000s) |
LP Pinewood SPV LLC Taxable VRDN, LOC Wells Fargo Bank NA |
| 4/7/11 | 0.26% (d) | $ 67,000 | $ 67,000 |
Certificates of Deposit - 43.4% |
|
London Branch, Eurodollar, Foreign Banks - 15.2% |
Bank of Montreal |
| 5/3/11 | 0.21 | 250,000 | 250,000 |
Commonwealth Bank of Australia |
| 4/4/11 to 6/7/11 | 0.30 | 320,000 | 320,000 |
Credit Agricole SA |
| 4/8/11 to 5/9/11 | 0.37 to 0.45 | 1,976,000 | 1,976,000 |
Credit Industriel et Commercial |
| 5/3/11 to 7/1/11 | 0.40 to 0.45 | 1,347,000 | 1,347,000 |
Danske Bank A/S |
| 4/11/11 | 0.33 | 213,000 | 213,000 |
HSBC Bank PLC |
| 4/14/11 to 3/15/12 | 0.32 to 0.55 | 739,000 | 739,000 |
ING Bank NV |
| 4/1/11 to 7/5/11 | 0.30 to 0.33 | 2,178,000 | 2,178,000 |
Landesbank Hessen-Thuringen |
| 4/18/11 to 4/26/11 | 0.33 | 859,000 | 859,000 |
National Australia Bank Ltd. |
| 6/6/11 to 7/18/11 | 0.30 to 0.43 | 2,223,000 | 2,223,001 |
| | 10,105,001 |
New York Branch, Yankee Dollar, Foreign Banks - 28.2% |
Bank of Montreal |
| 5/25/11 to 11/22/11 | 0.34 to 0.40 (d) | 496,500 | 496,500 |
Bank of Nova Scotia |
| 3/16/12 | 0.38 (d) | 95,000 | 95,000 |
Bank of Tokyo-Mitsubishi |
| 7/7/11 to 8/15/11 | 0.40 to 0.50 | 2,826,000 | 2,825,998 |
BNP Paribas New York Branch |
| 5/12/11 to 6/8/11 | 0.37 to 0.41 | 2,044,000 | 2,044,000 |
BNP Paribas SA |
| 9/26/11 to 9/27/11 | 0.51 (d) | 868,000 | 868,000 |
Canadian Imperial Bank of Commerce New York Branch |
| 4/1/11 to 4/20/12 | 0.35 to 0.50 (d) | 2,088,000 | 2,088,000 |
Commerzbank AG New York Branch |
| 5/13/11 | 0.43 | 625,000 | 625,000 |
Credit Suisse |
| 7/25/11 to 9/2/11 | 0.31 to 0.32 (d) | 635,000 | 635,000 |
Deutsche Bank |
| 7/25/11 | 0.35 (d) | 934,000 | 934,000 |
Deutsche Bank AG New York Branch |
| 4/4/11 | 0.30 | 100,000 | 100,000 |
DnB NOR Bank ASA |
| 8/4/11 | 0.31 (d) | 217,000 | 217,000 |
Intesa Sanpaolo SpA New York Branch |
| 4/7/11 | 0.40 | 159,000 | 159,000 |
|
| | Yield (a) | Principal
Amount (000s) | Value (000s) |
Mitsubishi UFJ Trust & Banking Corp. |
| 4/18/11 | 0.35% | $ 247,000 | $ 247,000 |
Mizuho Corporate Bank Ltd. |
| 4/6/11 | 0.25 | 222,000 | 222,000 |
Natexis Banques Populaires New York Branch |
| 6/1/11 | 0.40 | 620,000 | 620,000 |
National Bank Canada |
| 11/4/11 | 0.41 (d) | 566,000 | 566,000 |
Natixis SA |
| 6/22/11 | 2.01 (d) | 286,000 | 286,000 |
Rabobank Nederland New York Branch |
| 6/8/11 to 4/2/12 | 0.30 to 0.50 (d) | 1,869,000 | 1,869,000 |
Royal Bank of Canada |
| 3/30/12 | 0.64 (d) | 383,000 | 383,000 |
Skandinaviska Enskilda Banken |
| 6/6/11 | 0.35 | 85,000 | 85,000 |
Societe Generale |
| 4/11/11 to 5/16/11 | 0.35 to 1.71 (d) | 813,000 | 813,000 |
Sumitomo Mitsui Banking Corp. |
| 4/6/11 to 5/17/11 | 0.23 to 0.30 | 742,000 | 742,000 |
Svenska Handelsbanken |
| 5/3/11 | 0.35 | 436,000 | 436,002 |
Toronto-Dominion Bank New York Branch |
| 1/12/12 | 0.34 (d) | 171,000 | 171,000 |
UBS AG |
| 4/20/11 to 7/21/11 | 0.30 to 0.36 (d) | 1,322,000 | 1,322,000 |
| | 18,849,500 |
TOTAL CERTIFICATES OF DEPOSIT | 28,954,501 |
Commercial Paper - 20.0% |
|
ASB Finance Ltd. |
| 2/1/12 | 0.41 (d) | 150,000 | 149,994 |
Australia & New Zealand Banking Group Ltd. |
| 4/4/11 | 0.32 | 215,000 | 214,994 |
Barclays Bank PLC/Barclays US CCP Funding LLC |
| 4/8/11 to 4/15/11 | 0.32 | 356,000 | 355,964 |
BP Capital Markets PLC |
| 4/12/11 to 6/7/11 | 0.33 to 0.40 | 242,000 | 241,940 |
Commonwealth Bank of Australia |
| 6/2/11 to 11/21/11 | 0.35 to 0.36 (d) | 663,000 | 662,995 |
Credit Suisse New York Branch |
| 5/25/11 | 0.33 | 560,000 | 559,723 |
Danske Corp. |
| 4/11/11 to 5/17/11 | 0.32 | 821,000 | 820,777 |
Deutsche Bank Financial LLC |
| 4/4/11 | 0.30 | 366,000 | 365,991 |
DnB NOR Bank ASA |
| 7/21/11 to 8/22/11 | 0.30 (d) | 548,000 | 548,000 |
Commercial Paper - continued |
| | Yield (a) | Principal
Amount (000s) | Value (000s) |
Gotham Funding Corp. (Liquidity Facility Bank Tokyo-Mitsubishi UFJ Ltd.) |
| 4/4/11-4/5/11 | 0.25% | $ 131,000 | $ 130,997 |
Hannover Funding Co. LLC (Liquidity Facility Norddeutsche Landesbank Girozentrale) (Liquidity Facility U.S. Bank NA, Minnesota) |
| 4/4/11 | 0.45 | 63,000 | 62,998 |
Intesa Funding LLC |
| 4/6/11 to 4/18/11 | 0.40 to 0.41 | 873,000 | 872,891 |
Landesbank Hessen-Thuringen |
| 4/11/11 | 0.32 | 269,000 | 268,976 |
Manhattan Asset Funding Co. LLC (Liquidity Facility Sumitomo Mitsui Banking Corp.) |
| 4/5/11-4/8/11 | 0.25 | 297,000 | 296,989 |
Natexis Banques Populaires U.S. Finance Co. LLC |
| 5/2/11 to 7/1/11 | 0.40 to 0.45 | 1,462,000 | 1,461,072 |
Natixis US Finance Co. LLC |
| 5/3/11 | 0.40 (d) | 516,000 | 516,000 |
PB Finance (Delaware), Inc. |
| 4/18/11 to 5/2/11 | 0.48 | 118,153 | 118,114 |
Royal Bank of Canada |
| 6/16/11 | 0.40 | 447,000 | 446,623 |
Skandinaviska Enskilda Banken AB |
| 4/1/11 to 4/4/11 | 0.32 | 504,000 | 503,987 |
Societe Generale North America, Inc. |
| 4/1/11 to 5/2/11 | 0.35 to 0.40 | 1,357,000 | 1,356,866 |
Sumitomo Mitsui Banking Corp. |
| 4/7/11 | 0.24 | 194,000 | 193,992 |
Sumitomo Trust & Banking Co. Ltd. |
| 4/15/11 | 0.35 | 194,000 | 193,974 |
Total Capital Canada Ltd. |
| 8/9/11 to 12/15/11 | 0.39 to 0.42 | 412,000 | 411,178 |
Toyota Motor Credit Corp. |
| 4/12/11 to 6/15/11 | 0.30 to 0.35 | 245,000 | 244,882 |
UniCredito Italiano Bank (Ireland) PLC |
| 4/1/11 to 4/18/11 | 0.30 to 0.42 | 895,000 | 894,938 |
Westpac Banking Corp. |
| 4/19/11 to 10/7/11 | 0.30 to 0.45 (d) | 1,453,000 | 1,452,563 |
TOTAL COMMERCIAL PAPER | 13,347,418 |
U.S. Government and Government Agency Obligations - 0.3% |
| | Yield (a) | Principal
Amount (000s) | Value (000s) |
Other Government Related - 0.3% |
Straight-A Funding LLC (Liquidity Facility Federal Financing Bank) |
| 6/8/11 - 6/9/11 | 0.25% (c) | $ 183,000 | $ 182,918 |
Federal Agencies - 0.7% |
|
Federal Home Loan Bank - 0.7% |
| 3/14/12 | 0.46 | 459,500 | 459,490 |
U.S. Treasury Obligations - 5.4% |
|
U.S. Treasury Bills - 1.8% |
| 6/30/11 to 2/9/12 | 0.23 to 0.30 | 1,197,000 | 1,195,297 |
U.S. Treasury Notes - 3.6% |
| 7/31/11 to 12/31/11 | 0.22 to 0.32 | 2,404,000 | 2,425,629 |
TOTAL U.S. TREASURY OBLIGATIONS | 3,620,926 |
Bank Notes - 0.4% |
|
Bank of America NA |
| 4/26/11 | 0.30 | 300,000 | 300,000 |
Medium-Term Notes - 5.6% |
|
BP Capital Markets PLC |
| 4/11/11 | 0.45 (d) | 148,160 | 148,160 |
Commonwealth Bank of Australia |
| 2/10/12 | 0.36 (b)(d) | 207,000 | 207,000 |
Metropolitan Life Global Funding I |
| 7/1/11 | 2.05 (b)(d) | 100,000 | 100,000 |
Metropolitan Life Insurance Co. |
| 6/29/11 | 0.60 (d)(h) | 65,000 | 65,000 |
Royal Bank of Canada |
| 3/30/12 to 4/13/12 | 0.30 to 0.70 (b)(d) | 1,005,000 | 1,005,000 |
| 2/6/12 | 0.31 (d) | 630,000 | 629,732 |
Westpac Banking Corp. |
| 12/23/11 to 4/13/12 | 0.31 to 0.36 (b)(d) | 1,583,000 | 1,583,000 |
TOTAL MEDIUM-TERM NOTES | 3,737,892 |
Municipal Securities - 1.6% |
|
Allen County Hosp. Facilities Rev. (Catholic Healthcare Partners Proj.) Series 2010 D, LOC JPMorgan Chase Bank, VRDN |
| 4/7/11 | 0.25 (d) | 23,000 | 23,000 |
Municipal Securities - continued |
| Yield (a) | Principal
Amount (000s) | | Value
(000s) |
Anaheim Hsg. Auth. Multi-family Hsg. Rev. (Park Vista Apt. Proj.) Series 2000 D, LOC Freddie Mac, VRDN |
4/7/11 | 0.23% (d)(e) | $ 14,580 | | $ 14,580 |
California Hsg. Fin. Agcy. Rev. (Home Mtg. Prog.) Series 2005 A, (Liquidity Facility Fannie Mae) (Liquidity Facility Freddie Mac), VRDN |
4/7/11 | 0.25 (d)(e) | 25,700 | | 25,700 |
District of Columbia Rev. (Washington Drama Society, Inc. Proj.) Series 2008, LOC JPMorgan Chase Bank, VRDN |
4/7/11 | 0.24 (d) | 37,065 | | 37,065 |
Fredericksburg Econ. Dev. Auth. (Eagle Village I Proj.) Series 2009 A, LOC Bank of America NA, VRDN |
4/7/11 | 0.26 (d) | 70,780 | | 70,780 |
Highlands County Health Facilities Auth. Rev. (Adventist Health Sys./Sunbelt, Inc. Prog.) Series 2007 A1, VRDN |
4/7/11 | 0.22 (d) | 5,000 | | 5,000 |
Highlands County Health Facilities Auth. Rev. (Adventist Health Sys./Sunbelt Obligated Group Proj.) Series 2005 H, LOC U.S. Bank NA, Minnesota, VRDN |
4/7/11 | 0.21 (d) | 24,725 | | 24,725 |
Humble Independent School District Participating VRDN Series Solar 06 20, (Liquidity Facility U.S. Bank NA, Minnesota) |
4/7/11 | 0.24 (d)(f) | 14,740 | | 14,740 |
Illinois Fin. Auth. Rev. (Children's Memorial Hosp. Proj.) Series 2008 C, LOC JPMorgan Chase Bank, VRDN |
4/7/11 | 0.25 (d) | 34,100 | | 34,100 |
Illinois Fin. Auth. Rev. (Little Co. of Mary Hosp. Proj.) Series 2008 A, LOC JPMorgan Chase Bank, VRDN |
4/7/11 | 0.24 (d) | 45,740 | | 45,740 |
Illinois Fin. Auth. Rev. (Rockford Mem. Hosp. Proj.) LOC JPMorgan Chase Bank, VRDN |
4/7/11 | 0.25 (d) | 40,600 | | 40,600 |
Indiana Fin. Auth. Health Sys. Rev. (Sisters of Saint Francis Health Svcs., Inc. Obligated Group Proj.) Series 2008 B, LOC JPMorgan Chase Bank, VRDN |
4/7/11 | 0.23 (d) | 10,900 | | 10,900 |
Indiana Health & Edl. Facilities Fing. Auth. Rev. Participating VRDN Series Solar 07 63, (Liquidity Facility U.S. Bank NA, Minnesota) |
4/7/11 | 0.24 (d)(f) | 15,245 | | 15,245 |
Los Angeles Dept. of Wtr. & Pwr. Rev. Series 2002 A8, (Liquidity Facility JPMorgan Chase Bank), VRDN |
4/7/11 | 0.25 (d) | 18,300 | | 18,300 |
Louisiana Pub. Facilities Auth. Hosp. Rev. (Franciscan Missionaries of Our Lady Health Sys. Proj.) Series 2005 B, LOC JPMorgan Chase Bank, VRDN |
4/7/11 | 0.23 (d) | 25,000 | | 25,000 |
Louisiana Pub. Facilities Auth. Rev. (CommCare Corp. Proj.) Series 2008 B, LOC JPMorgan Chase Bank, VRDN |
4/7/11 | 0.24 (d) | 14,900 | | 14,900 |
Massachusetts Bay Trans. Auth. Sales Tax Rev. Participating VRDN Series PT 4368, (Liquidity Facility Wells Fargo & Co.) |
4/7/11 | 0.25 (d)(f) | 10,060 | | 10,060 |
|
| Yield (a) | Principal
Amount (000s) | | Value
(000s) |
Missouri Health & Edl. Facilities Auth. Health Facilities Rev. (SSM Health Care Sys. Proj.) Series 2005 A1, LOC Bank of America NA, VRDN |
4/7/11 | 0.24% (d) | $ 9,100 | | $ 9,100 |
Moffat County Poll. Cont. Rev. (Tri-State Generation and Transmission Assoc., Inc. Proj.) Series 2009, LOC Bank of America NA, VRDN |
4/7/11 | 0.23 (d) | 11,175 | | 11,175 |
Monroe County Dev. Auth. Poll. Cont. Rev. (Oglethorpe Pwr. Corp. Proj.) Series 2009 B, LOC JPMorgan Chase Bank, VRDN |
4/7/11 | 0.21 (d) | 12,000 | | 12,000 |
New York City Hsg. Dev. Corp. Multi-family Rental Hsg. Rev. (255 West 9th Street Proj.) Series 2001 A, LOC Fannie Mae, VRDN |
4/7/11 | 0.24 (d)(e) | 58,235 | | 58,235 |
New York City Hsg. Dev. Corp. Multi-family Rental Hsg. Rev. (West 43rd Street Proj.) Series 1999 A, LOC Fannie Mae, VRDN |
4/7/11 | 0.24 (d)(e) | 24,200 | | 24,200 |
New York Hsg. Fin. Agcy. Rev. (240 East 39th Street Hsg. Proj.) Series 1997 A, LOC Fannie Mae, VRDN |
4/7/11 | 0.24 (d)(e) | 62,700 | | 62,700 |
New York Hsg. Fin. Agcy. Rev. (360 West 43rd Street Hsg. Proj.) Series A, LOC Fannie Mae, VRDN |
4/7/11 | 0.25 (d)(e) | 9,900 | | 9,900 |
New York Hsg. Fin. Agcy. Rev. (Clinton Green South Hsg. Proj.) Series 2005 A, LOC Freddie Mac, VRDN |
4/7/11 | 0.25 (d)(e) | 13,000 | | 13,000 |
New York Hsg. Fin. Agcy. Rev. (East 39th Street Hsg. Proj.) Series 1999 A, LOC Fannie Mae, VRDN |
4/7/11 | 0.25 (d)(e) | 33,700 | | 33,700 |
New York Hsg. Fin. Agcy. Rev. (Normandie Court II Hsg. Proj.) Series 1999 A, LOC Freddie Mac, VRDN |
4/7/11 | 0.24 (d)(e) | 30,770 | | 30,770 |
Ohio Air Quality Dev. Auth. Rev. (Dayton Pwr. & Lt. Co. Proj.) Series 2008 B, LOC JPMorgan Chase Bank, VRDN |
4/7/11 | 0.23 (d)(e) | 20,200 | | 20,200 |
Ohio Hsg. Fin. Agcy. Residential Mtg. Rev. Series 2006 I, (Liquidity Facility Citibank NA), VRDN |
4/7/11 | 0.25 (d)(e) | 15,875 | | 15,875 |
Pennsylvania Higher Edl. Facilities Auth. Rev. (Thomas Jefferson Univ. Proj.) Series 2008 A, LOC JPMorgan Chase Bank, VRDN |
4/7/11 | 0.23 (d) | 18,040 | | 18,040 |
Pennsylvania Hsg. Fin. Agcy. Single Family Mtg. Rev. Series 2004 84D, (Liquidity Facility Fannie Mae) (Liquidity Facility Freddie Mac), VRDN |
4/7/11 | 0.24 (d)(e) | 18,450 | | 18,450 |
Municipal Securities - continued |
| Yield (a) | Principal Amount (000s) | | Value (000s) |
Pennsylvania Hsg. Fin. Agcy. Single Family Mtg. Rev. Series 2004 86C, (Liquidity Facility Fannie Mae) (Liquidity Facility Freddie Mac), VRDN |
4/7/11 | 0.24% (d)(e) | $ 16,640 | | $ 16,640 |
Pennsylvania Hsg. Fin. Agcy. Single Family Mtg. Rev. Series 2005-89, (Liquidity Facility Fannie Mae) (Liquidity Facility Freddie Mac), VRDN |
4/7/11 | 0.24 (d)(e) | 10,000 | | 10,000 |
Pennsylvania Hsg. Fin. Agcy. Single Family Mtg. Rev. Series 2005-91B, (Liquidity Facility Fannie Mae) (Liquidity Facility Freddie Mac), VRDN |
4/7/11 | 0.24 (d)(e) | 21,350 | | 21,350 |
Port of Portland Arpt. Rev. Series Eighteen A, LOC Lloyds TSB Bank PLC, VRDN |
4/7/11 | 0.23 (d)(e) | 9,800 | | 9,800 |
Sacramento Muni. Util. District Elec. Rev. Series 2008 K, LOC Bank of America NA, VRDN |
4/7/11 | 0.21 (d) | 40,000 | | 40,000 |
Saint Joseph County Hosp. Auth. Health Sys. Rev. (Memorial Health Sys. Proj.) Series 2008 A, LOC JPMorgan Chase Bank, VRDN |
4/7/11 | 0.24 (d) | 19,280 | | 19,280 |
San Diego Hsg. Auth. Multi-family Hsg. Rev. (Villa Nueva Apts. Proj.) Series 2007 F, LOC Freddie Mac, VRDN |
4/7/11 | 0.24 (d)(e) | 37,500 | | 37,500 |
San Francisco City & County Arpts. Commission Int'l. Arpt. Rev. Series 2010 A3, LOC JPMorgan Chase Bank, VRDN |
4/7/11 | 0.23 (d)(e) | 14,000 | | 14,000 |
Simi Valley Multi-family Hsg. Rev. (Parker Ranch Proj.) Series A, LOC Fannie Mae, VRDN |
4/7/11 | 0.25 (d)(e) | 17,500 | | 17,500 |
South Carolina Trans. Infrastructure Bank Rev. Series 2003 B2, LOC Branch Banking & Trust Co., VRDN |
4/7/11 | 0.24 (d) | 23,800 | | 23,800 |
Tarrant County Cultural Ed. Facilities Fin. Corp. Hosp. Rev. (Scott and White Memorial Hosp. and Scott, Sherwood and Brindley Foundation Proj.) Series 2008 1, LOC Bank of America NA, VRDN |
4/7/11 | 0.24 (d) | 27,220 | | 27,220 |
Tarrant County Cultural Ed. Facilities Fin. Corp. Rev. (Christus Health Proj.) Series 2008 C2, LOC Bank of America NA, VRDN |
4/7/11 | 0.25 (d) | 17,565 | | 17,565 |
Texas Gen. Oblig. (Veterans Land Proj.) Series A, 0.22%, VRDN |
4/7/11 | 0.22 (d)(e) | 23,140 | | 23,140 |
Univ. of California Revs. Participating VRDN Putters 3668Z, (Liquidity Facility JPMorgan Chase Bank) |
4/7/11 | 0.25 (d)(f) | 10,000 | | 10,000 |
|
| Yield (a) | Principal Amount (000s) | | Value (000s) |
Univ. of Texas Board of Regents Sys. Rev. Participating VRDN Series BBT 08 25, (Liquidity Facility Branch Banking & Trust Co.) |
4/7/11 | 0.24% (d)(f) | $ 10,110 | | $ 10,110 |
TOTAL MUNICIPAL SECURITIES | 1,065,685 |
Repurchase Agreements - 23.7% |
| Maturity Amount (000s) | | |
In a joint trading account at: | | | |
0.18% dated 3/31/11 due 4/1/11 (Collateralized by U.S. Government Obligations) # | $ 251,956 | | 251,955 |
0.2% dated 3/31/11 due 4/1/11 (Collateralized by U.S. Government Obligations) # | 878,242 | | 878,237 |
With: | | | |
Banc of America Securities LLC at 0.77%, dated 10/28/10 due 5/5/11 (d)(g)
(Collateralized by U.S. Government Obligations valued at $467,650,003, 0.38% - 5.87%, 3/15/19 - 10/25/46) | 436,450 | | 433,000 |
Barclays Capital, Inc. at: | | | |
0.37%, dated: | | | |
3/25/11 due 4/1/11 (Collateralized by Equity valued at $228,976,547) | 212,015 | | 212,000 |
3/28/11 due 4/4/11 (Collateralized by Equity valued at $183,607,551) | 170,012 | | 170,000 |
3/29/11 due 4/5/11 (Collateralized by Equity valued at $183,605,723) | 170,012 | | 170,000 |
3/31/11 due 4/7/11 (Collateralized by Equity valued at $91,800,946) | 85,006 | | 85,000 |
0.42%, dated 3/29/11 due 4/7/11 (Collateralized by Mortgage Loan Obligations valued at $138,244,839, 0.4% - 7.36%, 9/1/23 - 10/23/37) | 128,021 | | 128,000 |
1%, dated: | | | |
8/24/10 due 7/5/11 (Collateralized by Mortgage Loan Obligations valued at $223,839,600, 0.3% - 8%, 11/25/20 - 9/25/46) | 208,089 | | 206,000 |
9/9/10 due 7/5/11 (Collateralized by Mortgage Loan Obligations valued at $221,341,707, 0% - 8.56%, 1/2/16 - 4/25/47) | 209,093 | | 207,000 |
10/13/10 due 7/5/11 (Collateralized by Corporate Obligations valued at $148,669,148, 1.5% - 4.5%, 10/15/14 - 3/15/47) | 138,381 | | 137,000 |
Repurchase Agreements - continued |
| Maturity Amount (000s) | | Value (000s) |
With: - continued | | | |
BNP Paribas Securities Corp. at: | | | |
0.21%, dated 2/11/11 due 4/7/11 (Collateralized by U.S. Government Obligations valued at $194,875,686, 1.44% - 6.5%, 8/15/15 - 8/1/46) | $ 191,199 | | $ 191,000 |
0.23%, dated 3/31/11 due 4/1/11 (Collateralized by Corporate Obligations valued at $398,955,203, 0.26% - 9.8%, 4/1/11 - 11/25/42) | 380,002 | | 380,000 |
Credit Suisse Securities (USA) LLC at 0.25%, dated 3/31/11 due 4/1/11 (Collateralized by Equity valued at $1,865,225,270 | 1,727,012 | | 1,727,000 |
Deutsche Bank Securities, Inc. at: | | | |
0.19%, dated 3/1/11 due 4/7/11 (Collateralized by U.S. Government Obligations valued at $387,663,416, 2.14% - 7%, 4/1/25 - 12/1/48) | 380,174 | | 380,000 |
0.23%, dated: | | | |
10/26/10 due 4/7/11 (Collateralized by U.S. Government Obligations valued at $205,225,647, 3.1% - 7.5%, 11/1/25 - 12/1/40) | 201,232 | | 201,000 |
11/4/10 due 4/7/11 (Collateralized by U.S. Government Obligations valued at $313,436,092, 2.5% - 7%, 8/1/25 - 2/20/41) | 307,345 | | 307,000 |
0.24%, dated 11/15/10 due 4/7/11 (Collateralized by U.S. Government Obligations valued at $194,997,935, 4% - 7%, 1/1/31 - 12/1/40) | 191,232 | | 191,000 |
0.25%, dated 12/1/10 due 4/7/11 (Collateralized by U.S. Government Obligations valued at $197,025,417, 3.11% - 6%, 12/1/36 - 3/1/41) | 193,251 | | 193,000 |
0.4%, dated 1/28/11 due 4/7/11 (Collateralized by Corporate Obligations valued at $115,685,838, 0.32% - 11.25%, 4/1/11 - 6/28/47) | 107,113 | | 107,000 |
0.41%, dated: | | | |
1/19/11 due 4/7/11 (Collateralized by Corporate Obligations valued at $112,412,103, 0.31% - 13%, 4/1/11 - 6/25/50) | 104,107 | | 104,000 |
2/7/11 due 4/7/11 (Collateralized by Corporate Obligations valued at $56,828,679, 0.15% - 13%, 4/1/11 - 3/25/47) | 53,055 | | 53,000 |
|
| Maturity Amount (000s) | | Value (000s) |
2/17/11 due 4/7/11 (Collateralized by Mortgage Loan Obligations valued at $57,379,789, 0.26% - 12%, 4/1/11 - 7/10/43) | $ 53,054 | | $ 53,000 |
2/25/11 due 4/7/11 (Collateralized by U.S. Treasury Obligations valued at $115,374,241, 0.39% - 13%, 4/1/11 - 6/10/48) | 107,110 | | 107,000 |
3/7/11 due 4/7/11 (Collateralized by Corporate Obligations valued at $114,503,755, 0.15% - 13%, 8/15/13 - 2/25/47) | 106,111 | | 106,000 |
Goldman Sachs & Co. at 0.27%, dated 3/30/11 due 4/6/11 (Collateralized by U.S. Government Obligations valued at $165,242,479, 4% - 5.5%, 1/1/38 - 3/1/41) | 162,009 | | 162,000 |
HSBC Securities, Inc. at 0.27%, dated 3/31/11 due 4/1/11 (Collateralized by Corporate Obligations valued at $161,702,025, 2.25% - 9.95%, 7/1/11 - 4/1/41) | 154,001 | | 154,000 |
ING Financial Markets LLC at: | | | |
0.22%, dated: | | | |
2/7/11 due 4/7/11 (Collateralized by U.S. Government Obligations valued at $391,525,572, 3.5% - 4%, 2/25/37 - 7/25/40) | 380,423 | | 380,000 |
2/11/11 due 4/7/11 (Collateralized by U.S. Government Obligations valued at $98,912,476, 4.5% - 6%, 5/25/18 - 2/25/40) | 96,106 | | 96,000 |
0.23%, dated 11/8/10 due 4/7/11 (Collateralized by U.S. Government Obligations valued at $175,600,353, 1.95% - 6.01%, 8/1/18 - 11/1/40) | 172,200 | | 172,000 |
0.24%, dated: | | | |
10/18/10 due 4/7/11 (Collateralized by U.S. Government Obligations valued at $97,006,308, 1.43% - 6.03%, 11/1/18 - 2/1/41) | 95,115 | | 95,000 |
10/25/10 due 4/7/11 (Collateralized by U.S. Government Obligations valued at $95,982,536, 1.53% - 6.01%, 11/1/21 - 7/1/40) | 94,114 | | 94,000 |
11/15/10 due 4/7/11 (Collateralized by U.S. Government Obligations valued at $49,015,080, 4.5%, 3/1/41) | 48,057 | | 48,000 |
Repurchase Agreements - continued |
| Maturity Amount (000s) | | Value (000s) |
With: - continued | | | |
ING Financial Markets LLC at: | | | |
0.25%, dated 10/1/10 due 4/1/11 (Collateralized by U.S. Government Obligations valued at $102,128,582, 1.46% - 6.37%, 6/1/22 - 9/1/48) | $ 100,126 | | $ 100,000 |
0.26%, dated 3/31/11 due 4/1/11 (Collateralized by Corporate Obligations valued at $1,051,666, 7.83%, 12/1/27) | 1,000 | | 1,000 |
0.36%, dated 3/9/11 due 4/7/11 (Collateralized by Corporate Obligations valued at $82,970,886, 2% - 10.25%, 5/20/11 - 4/20/67) | 79,024 | | 79,000 |
J.P. Morgan Clearing Corp. at: | | | |
0.32%, dated 3/31/11 due 4/1/11 (Collateralized by Equity valued at $1,306,533,397 | 1,202,011 | | 1,202,000 |
0.46%, dated 3/22/11 due 4/21/11 (Collateralized by Equity valued at $319,606,053 | 294,113 | | 294,000 |
0.61%, dated 1/25/11 due 4/25/11 (Collateralized by Equity valued at $80,524,786 | 74,113 | | 74,000 |
0.7%, dated 10/27/10 due 4/25/11 (Collateralized by Equity valued at $80,678,770 | 74,259 | | 74,000 |
0.72%, dated 3/7/11 due 9/1/11 (Collateralized by Equity valued at $324,075,005 | 299,061 | | 298,000 |
0.75%, dated 1/31/11 due 7/27/11 (Collateralized by Equity valued at $347,173,452 | 320,176 | | 319,000 |
J.P. Morgan Securities, Inc. at: | | | |
0.32%, dated 3/31/11 due 4/1/11 (Collateralized by Corporate Obligations valued at $175,352,585, 0% - 9.88%, 6/30/14 - 12/16/50) | 167,001 | | 167,000 |
0.62%, dated 3/31/11 due 4/1/11 (Collateralized by Mortgage Loan Obligations valued at $806,760,573, 0.25% - 7.21%, 4/25/14 - 12/11/49) | 747,013 | | 747,000 |
0.75%, dated 10/12/10 due 4/11/11 (Collateralized by Corporate Obligations valued at $126,808,557, 1% - 4.5%, 6/1/12 - 6/15/26) | 117,441 | | 117,000 |
Merrill Lynch, Pierce, Fenner & Smith at: | | | |
0.32%, dated 3/31/11 due 4/1/11 (Collateralized by Equity valued at $216,001,923 | 200,002 | | 200,000 |
0.62%, dated 3/31/11 due 4/1/11 (Collateralized by Mortgage Loan Obligations valued at $394,206,789, 0.4% - 6.2%, 8/25/33 - 3/25/47) | 365,006 | | 365,000 |
|
| Maturity Amount (000s) | | Value (000s) |
0.67%, dated 11/19/10 due 5/5/11 (Collateralized by Corporate Obligations valued at $167,050,346, 2.5% - 5.25%, 9/15/11 - 10/15/29) (d)(g) | $ 158,078 | | $ 157,000 |
0.72%, dated 1/31/11 due 5/5/11 (Collateralized by U.S. Government Obligations valued at $342,341,841, 0% - 11.38%, 4/15/11 - 4/1/63) (d)(g) | 320,132 | | 319,000 |
1%, dated 1/5/11 due 5/5/11 (Collateralized by Corporate Obligations valued at $165,244,590, 0% - 7.6%, 8/1/17 - 8/15/56) | 154,547 | | 153,000 |
Mizuho Securities USA, Inc. at: | | | |
0.3%, dated 3/31/11 due 4/1/11 (Collateralized by U.S. Government Obligations valued at $308,799,585, 0% - 9%, 7/21/11 - 3/25/41) | 300,003 | | 300,000 |
0.44%, dated 3/7/11 due 4/7/11 (Collateralized by Corporate Obligations valued at $93,523,494, 1.25% - 5.88%, 4/15/12 - 12/15/37) | 89,034 | | 89,000 |
0.5%, dated 1/24/11 due 4/4/11 (Collateralized by Corporate Obligations valued at $63,058,627, 0% - 9%, 5/15/11 - 7/1/38) | 60,058 | | 60,000 |
0.65%, dated 3/1/11 due 4/7/11 (Collateralized by Corporate Obligations valued at $31,517,633, 1.63% - 8.5%, 4/15/12 - 12/15/36) | 30,099 | | 30,000 |
RBC Capital Markets Co. at: | | | |
0.19%, dated 3/31/11 due 4/1/11 (Collateralized by U.S. Government Obligations valued at $38,110,201, 5.75% - 6.29%, 10/15/39 - 9/20/40) | 37,000 | | 37,000 |
0.4%, dated 1/5/11 due 4/5/11 (Collateralized by Corporate Obligations valued at $77,782,925, 1.16% - 6.88%, 3/3/12 - 3/1/41) | 74,074 | | 74,000 |
0.46%, dated 3/3/11 due 4/6/11 (Collateralized by Corporate Obligations valued at $80,740,904, 0.31% - 6.02%, 8/25/34 - 7/25/37) | 75,033 | | 75,000 |
RBS Securities, Inc. at: | | | |
0.25%, dated 10/27/10 due 4/7/11 (Collateralized by U.S. Government Obligations valued at $94,965,212, 2.65% - 6.2%, 3/1/36 - 1/1/41) | 93,116 | | 93,000 |
0.61%, dated 3/22/11 due 4/7/11 (Collateralized by Corporate Obligations valued at $249,518,262, 0.34% - 9.5%, 10/1/14 - 6/11/50) | 231,117 | | 231,000 |
Repurchase Agreements - continued |
| Maturity Amount (000s) | | Value (000s) |
With: - continued | | | |
0.76%, dated 8/5/10 due 5/5/11 (Collateralized by Mortgage Loan Obligations valued at $225,721,143, 0% - 6.42%, 4/25/14 - 6/25/47) (d)(g) | $ 210,601 | | $ 209,000 |
Royal Bank of Scotland PLC at 0.61%, dated 3/22/11 due 4/7/11 (Collateralized by Corporate Obligations valued at $226,111,500, 0% - 6.03%, 7/1/12 - 6/25/47) | 210,107 | | 210,000 |
UBS Securities LLC at: | | | |
0.41%, dated 2/25/11 due 4/7/11 (Collateralized by Corporate Obligations valued at $63,025,113, 1.15% - 7.75%, 6/15/11 - 3/1/39) | 60,062 | | 60,000 |
0.47%, dated 3/14/11 due 4/7/11 (Collateralized by Corporate Obligations valued at $100,463,605, 0.8% - 11%, 10/1/12 - 5/15/38) | 93,112 | | 93,000 |
Wells Fargo Securities, LLC at: | | | |
0.23%, dated 3/31/11 due 4/1/11 (Collateralized by U.S. Government Obligations valued at $998,615,189, 0% - 9.63%, 4/1/11 - 9/25/43) | 956,006 | | 956,000 |
0.25%, dated 10/21/10 due 4/7/11 (Collateralized by U.S. Government Obligations valued at $49,015,080, 4.5%, 3/1/41) | 48,060 | | 48,000 |
0.36%, dated 1/11/11 due 4/7/11 (Collateralized by Commercial Paper Obligations valued at $79,721,372, 5/27/11 - 12/16/11) | 77,069 | | 77,000 |
0.37%, dated 3/31/11 due 4/1/11 (Collateralized by Corporate Obligations valued at $405,004,163, 0% - 13.25%, 4/1/11 - 3/30/67) | 375,004 | | 375,000 |
TOTAL REPURCHASE AGREEMENTS | 15,862,192 |
TOTAL INVESTMENT PORTFOLIO - 101.2% (Cost $67,598,022) | | 67,598,022 |
NET OTHER ASSETS (LIABILITIES) - (1.2)% | | (817,389) |
NET ASSETS - 100% | $ 66,780,633 |
Security Type Abbreviations |
CP COMMERCIAL PAPER |
VRDN VARIABLE RATE DEMAND NOTE (A debt instrument that is payable upon demand, either daily, weekly or monthly) |
Legend |
(a) Yield represents either the annualized yield at the date of purchase, or the stated coupon rate, or, for floating and adjustable rate securities, the rate at period end. |
(b) Security exempt from registration under Rule 144A of the Securities Act of 1933. These securities may be resold in transactions exempt from registration, normally to qualified institutional buyers. At the end of the period, the value of these securities amounted to $2,895,000,000 or 4.3% of net assets. |
(c) The Federal Financing Bank, an instrumentality of the U.S. Government acting under the supervision of the Secretary of the Treasury (FFB), has entered into a Liquidity Loan Agreement with Straight-A Funding LLC (Issuer), pursuant to which the FFB has committed, subject to certain conditions, to provide financing to the Issuer to cover any payment deficiencies in respect of notes on their legal final maturity dates. At the end of the period, these securities amounted to $182,918,000, or .30% of net assets. |
(d) Coupon rates for floating and adjustable rate securities reflect the rates in effect at period end. |
(e) Private activity obligations whose interest is subject to the federal alternative minimum tax for individuals. |
(f) Provides evidence of ownership in one or more underlying municipal bonds. |
(g) The maturity amount is based on the rate at period end. |
(h) Restricted securities - Investment in securities not registered under the Securities Act of 1933 (excluding 144A issues). At the end of the period, the value of restricted securities (excluding 144A issues) amounted to $65,000,000 or 0.1% of net assets. |
Additional information on each restricted holding is as follows: |
Security | Acquisition Date | Cost (000s) |
Metropolitan Life Insurance Co. 0.6%, 4/1/11 | 3/26/02 | $ 65,000 |
# Additional information on each counterparty to the repurchase agreement is as follows: |
Repurchase Agreement / Counterparty | Value
(Amounts in thousands) |
$251,955,000 due 4/01/11 at 0.18% |
Bank of America NA | $ 112,717 |
Barclays Capital, Inc. | 49,728 |
Merrill Lynch, Pierce, Fenner & Smith, Inc. | 23,206 |
UBS Securities LLC | 66,304 |
| $ 251,955 |
$878,237,000 due 4/01/11 at 0.20% |
Bank of America NA | $ 244,690 |
Citibank NA | 14,142 |
Citigroup Global Markets, Inc. | 113,133 |
Deutsche Bank Securities, Inc. | 212,125 |
J.P. Morgan Securities, Inc. | 28,283 |
RBC Capital Markets Corp. | 14,142 |
UBS Securities LLC | 73,537 |
Wells Fargo Securities LLC | 178,185 |
| $ 878,237 |
Other Information |
The date shown for securities represents the date when principal payments must be paid, taking into account any call options exercised by the issuer and any permissible maturity shortening features other than interest rate resets. |
All investments are categorized as Level 2 under the Fair Value Hierarchy. The inputs or methodology used for valuing securities may not be an indication of the risk associated with investing in those securities. For more information on valuation inputs, please refer to the Security Valuation section in the accompanying Notes to Financial Statements. |
See accompanying notes which are an integral part of the financial statements.
Annual Report
Money Market Portfolio
Financial Statements
Statement of Assets and Liabilities
Amounts in thousands (except per-share amounts) | March 31, 2011 |
| | |
Assets | | |
Investment in securities, at value (including repurchase agreements of $15,862,192) - See accompanying schedule: Unaffiliated issuers (cost $67,598,022) | | $ 67,598,022 |
Cash | | 24 |
Receivable for fund shares sold | | 282,833 |
Interest receivable | | 41,032 |
Prepaid expenses | | 95 |
Receivable from investment adviser for expense reductions | | 1,507 |
Other receivables | | 541 |
Total assets | | 67,924,054 |
| | |
Liabilities | | |
Payable for investments purchased | $ 899,995 | |
Payable for fund shares redeemed | 229,105 | |
Distributions payable | 2,495 | |
Accrued management fee | 7,669 | |
Distribution and service plan fees payable | 621 | |
Other affiliated payables | 2,730 | |
Other payables and accrued expenses | 806 | |
Total liabilities | | 1,143,421 |
| | |
Net Assets | | $ 66,780,633 |
Net Assets consist of: | | |
Paid in capital | | $ 66,780,633 |
Net Assets | | $ 66,780,633 |
Class I:
Net Asset Value, offering price and redemption price per share ($31,063,155 ÷ 31,054,690 shares) | | $ 1.00 |
| | |
Class II:
Net Asset Value, offering price and redemption price per share ($420,426 ÷ 420,358 shares) | | $ 1.00 |
| | |
Class III:
Net Asset Value, offering price and redemption price per share ($3,524,204 ÷ 3,525,069 shares) | | $ 1.00 |
| | |
Select Class:
Net Asset Value, offering price and redemption price per share ($2,160,867 ÷ 2,160,446 shares) | | $ 1.00 |
| | |
Class F:
Net Asset Value, offering price and redemption price per share ($821,600 ÷ 821,598 shares) | | $ 1.00 |
| | |
Institutional Class:
Net Asset Value, offering price and redemption price per share ($28,790,381 ÷ 28,782,627 shares) | | $ 1.00 |
Statement of Operations
Amounts in thousands | Year ended March 31, 2011 |
| | |
Investment Income | | |
Interest | | $ 275,835 |
| | |
Expenses | | |
Management fee | $ 93,320 | |
Transfer agent fees | 31,544 | |
Distribution and service plan fees | 9,892 | |
Accounting fees and expenses | 2,225 | |
Custodian fees and expenses | 785 | |
Independent trustees' compensation | 251 | |
Registration fees | 377 | |
Audit | 55 | |
Legal | 191 | |
Interest | 15 | |
Miscellaneous | 494 | |
Total expenses before reductions | 139,149 | |
Expense reductions | (21,631) | 117,518 |
Net investment income (loss) | | 158,317 |
Realized and Unrealized Gain (Loss) Net realized gain (loss) on: | | |
Investment securities: | | |
Unaffiliated issuers | | 659 |
Net increase in net assets resulting from operations | | $ 158,976 |
See accompanying notes which are an integral part of the financial statements.
Annual Report
Statement of Changes in Net Assets
Amounts in thousands | Year ended
March 31,
2011 | Year ended
March 31,
2010 |
Increase (Decrease) in Net Assets | | |
Operations | | |
Net investment income (loss) | $ 158,317 | $ 289,543 |
Net realized gain (loss) | 659 | 1,902 |
Net increase in net assets resulting from operations | 158,976 | 291,445 |
Distributions to shareholders from net investment income | (158,301) | (289,559) |
Share transactions - net increase (decrease) | 2,348,365 | 7,807,346 |
Total increase (decrease) in net assets | 2,349,040 | 7,809,232 |
| | |
Net Assets | | |
Beginning of period | 64,431,593 | 56,622,361 |
End of period | $ 66,780,633 | $ 64,431,593 |
Financial Highlights - Class I
Years ended March 31, | 2011 | 2010 | 2009 | 2008 | 2007 |
Selected Per-Share Data | | | | | |
Net asset value, beginning of period | $ 1.00 | $ 1.00 | $ 1.00 | $ 1.00 | $ 1.00 |
Income from Investment Operations | | | | | |
Net investment income (loss) | .002 | .005 | .023 | .049 | .051 |
Distributions from net investment income | (.002) | (.005) | (.023) | (.049) | (.051) |
Net asset value, end of period | $ 1.00 | $ 1.00 | $ 1.00 | $ 1.00 | $ 1.00 |
Total Return A | .23% | .47% | 2.37% | 5.01% | 5.24% |
Ratios to Average Net Assets B | | | | | |
Expenses before reductions | .21% | .22% | .23% | .22% | .23% |
Expenses net of fee waivers, if any | .18% | .19% | .20% | .18% | .18% |
Expenses net of all reductions | .18% | .19% | .20% | .18% | .18% |
Net investment income (loss) | .23% | .45% | 2.31% | 4.91% | 5.14% |
Supplemental Data | | | | | |
Net assets, end of period (in millions) | $ 31,063 | $ 34,386 | $ 35,613 | $ 28,573 | $ 28,969 |
A Total returns would have been lower had certain expenses not been reduced during the periods shown.
B Expense ratios reflect operating expenses of the class. Expenses before reductions do not reflect amounts reimbursed or waived or reductions from expense offset arrangements and do not represent the amount paid by the class during periods when reimbursements, waivers or reductions occur. Expenses net of fee waivers reflect expenses after reimbursement and waivers but prior to reductions from expense offset arrangements. Expenses net of all reductions represent the net expenses paid by the class.
See accompanying notes which are an integral part of the financial statements.
Annual Report
Financial Highlights - Class II
Years ended March 31, | 2011 | 2010 | 2009 | 2008 | 2007 |
Selected Per-Share Data | | | | | |
Net asset value, beginning of period | $ 1.00 | $ 1.00 | $ 1.00 | $ 1.00 | $ 1.00 |
Income from Investment Operations | | | | | |
Net investment income (loss) | .001 | .003 | .022 | .047 | .050 |
Distributions from net investment income | (.001) | (.003) | (.022) | (.047) | (.050) |
Net asset value, end of period | $ 1.00 | $ 1.00 | $ 1.00 | $ 1.00 | $ 1.00 |
Total Return A | .08% | .31% | 2.21% | 4.85% | 5.08% |
Ratios to Average Net Assets B | | | | | |
Expenses before reductions | .36% | .37% | .38% | .37% | .38% |
Expenses net of fee waivers, if any | .33% | .34% | .35% | .33% | .33% |
Expenses net of all reductions | .33% | .34% | .35% | .33% | .33% |
Net investment income (loss) | .08% | .30% | 2.16% | 4.70% | 4.99% |
Supplemental Data | | | | | |
Net assets, end of period (in millions) | $ 420 | $ 835 | $ 680 | $ 699 | $ 637 |
A Total returns would have been lower had certain expenses not been reduced during the periods shown.
B Expense ratios reflect operating expenses of the class. Expenses before reductions do not reflect amounts reimbursed or waived or reductions from expense offset arrangements and do not represent the amount paid by the class during periods when reimbursements, waivers or reductions occur. Expenses net of fee waivers reflect expenses after reimbursement and waivers but prior to reductions from expense offset arrangements. Expenses net of all reductions represent the net expenses paid by the class.
Financial Highlights - Class III
Years ended March 31, | 2011 | 2010 | 2009 | 2008 | 2007 |
Selected Per-Share Data | | | | | |
Net asset value, beginning of period | $ 1.00 | $ 1.00 | $ 1.00 | $ 1.00 | $ 1.00 |
Income from Investment Operations | | | | | |
Net investment income (loss) | - C | .002 | .021 | .046 | .049 |
Distributions from net investment income | - C | (.002) | (.021) | (.046) | (.049) |
Net asset value, end of period | $ 1.00 | $ 1.00 | $ 1.00 | $ 1.00 | $ 1.00 |
Total Return A | .01% | .22% | 2.11% | 4.74% | 4.98% |
Ratios to Average Net Assets B | | | | | |
Expenses before reductions | .46% | .47% | .48% | .47% | .48% |
Expenses net of fee waivers, if any | .40% | .44% | .45% | .43% | .43% |
Expenses net of all reductions | .40% | .44% | .45% | .43% | .43% |
Net investment income (loss) | .01% | .21% | 2.06% | 4.49% | 4.89% |
Supplemental Data | | | | | |
Net assets, end of period (in millions) | $ 3,524 | $ 3,766 | $ 4,184 | $ 5,256 | $ 1,701 |
A Total returns would have been lower had certain expenses not been reduced during the periods shown.
B Expense ratios reflect operating expenses of the class. Expenses before reductions do not reflect amounts reimbursed or waived or reductions from expense offset arrangements and do not represent the amount paid by the class during periods when reimbursements, waivers or reductions occur. Expenses net of fee waivers reflect expenses after reimbursement and waivers but prior to reductions from expense offset arrangements. Expenses net of all reductions represent the net expenses paid by the class.
C Amount represents less than $.001 per share.
See accompanying notes which are an integral part of the financial statements.
Annual Report
Financial Highlights - Select Class
Years ended March 31, | 2011 | 2010 | 2009 | 2008 | 2007 |
Selected Per-Share Data | | | | | |
Net asset value, beginning of period | $ 1.00 | $ 1.00 | $ 1.00 | $ 1.00 | $ 1.00 |
Income from Investment Operations | | | | | |
Net investment income (loss) | .002 | .004 | .023 | .048 | .051 |
Distributions from net investment income | (.002) | (.004) | (.023) | (.048) | (.051) |
Net asset value, end of period | $ 1.00 | $ 1.00 | $ 1.00 | $ 1.00 | $ 1.00 |
Total Return A | .18% | .42% | 2.31% | 4.96% | 5.19% |
Ratios to Average Net Assets B | | | | | |
Expenses before reductions | .26% | .27% | .28% | .27% | .28% |
Expenses net of fee waivers, if any | .23% | .24% | .25% | .23% | .23% |
Expenses net of all reductions | .23% | .24% | .25% | .23% | .23% |
Net investment income (loss) | .18% | .40% | 2.25% | 4.60% | 5.08% |
Supplemental Data | | | | | |
Net assets, end of period (in millions) | $ 2,161 | $ 622 | $ 619 | $ 1,626 | $ 470 |
A Total returns would have been lower had certain expenses not been reduced during the periods shown.
B Expense ratios reflect operating expenses of the class. Expenses before reductions do not reflect amounts reimbursed or waived or reductions from expense offset arrangements and do not represent the amount paid by the class during periods when reimbursements, waivers or reductions occur. Expenses net of fee waivers reflect expenses after reimbursement and waivers but prior to reductions from expense offset arrangements. Expenses net of all reductions represent the net expenses paid by the class.
Financial Highlights - Class F
Years ended March 31, | 2011 | 2010 D |
Selected Per-Share Data | | |
Net asset value, beginning of period | $ 1.00 | $ 1.00 |
Income from Investment Operations | | |
Net investment income (loss) | .003 | .003 |
Distributions from net investment income | (.003) | (.003) |
Net asset value, end of period | $ 1.00 | $ 1.00 |
Total Return B, C | .27% | .29% |
Ratios to Average Net Assets E | | |
Expenses before reductions | .15% | .16% A |
Expenses net of fee waivers, if any | .14% | .15% A |
Expenses net of all reductions | .14% | .15% A |
Net investment income (loss) | .27% | .26% A |
Supplemental Data | | |
Net assets, end of period (in millions) | $ 822 | $ 149 |
A Annualized
B Total returns for periods of less than one year are not annualized.
C Total returns would have been lower had certain expenses not been reduced during the periods shown.
D For the period June 26, 2009 (commencement of sale of shares) to March 31, 2010.
E Expense ratios reflect operating expenses of the class. Expenses before reductions do not reflect amounts reimbursed or waived or reductions from expense offset arrangements and do not represent the amount paid by the class during periods when reimbursements, waivers or reductions occur. Expense ratios before reductions for start-up periods may not be representative of longer-term operating periods. Expenses net of fee waivers reflect expenses after reimbursement and waivers but prior to reductions from expense offset arrangements. Expenses net of all reductions represent the net expenses paid by the class.
See accompanying notes which are an integral part of the financial statements.
Annual Report
Financial Highlights - Institutional Class
Years ended March 31, | 2011 | 2010 | 2009 | 2008 D |
Selected Per-Share Data | | | | |
Net asset value, beginning of period | $ 1.00 | $ 1.00 | $ 1.00 | $ 1.00 |
Income from Investment Operations | | | | |
Net investment income (loss) | .003 | .005 | .024 | .013 |
Distributions from net investment income | (.003) | (.005) | (.024) | (.013) |
Net asset value, end of period | $ 1.00 | $ 1.00 | $ 1.00 | $ 1.00 |
Total Return B, C | .27% | .51% | 2.41% | 1.29% |
Ratios to Average Net Assets E | | | | |
Expenses before reductions | .18% | .19% | .20% | .19% A |
Expenses net of fee waivers, if any | .14% | .15% | .16% | .14% A |
Expenses net of all reductions | .14% | .15% | .16% | .14% A |
Net investment income (loss) | .27% | .49% | 2.35% | 4.03% A |
Supplemental Data | | | | |
Net assets, end of period (in millions) | $ 28,790 | $ 24,674 | $ 15,526 | $ 11,578 |
A Annualized
B Total returns for periods of less than one year are not annualized.
C Total returns would have been lower had certain expenses not been reduced during the periods shown.
D For the period December 12, 2007 (commencement of sale of shares) to March 31, 2008.
E Expense ratios reflect operating expenses of the class. Expenses before reductions do not reflect amounts reimbursed or waived or reductions from expense offset arrangements and do not represent the amount paid by the class during periods when reimbursements, waivers or reductions occur. Expense ratios before reductions for start-up periods may not be representative of longer-term operating periods. Expenses net of fee waivers reflect expenses after reimbursement and waivers but prior to reductions from expense offset arrangements. Expenses net of all reductions represent the net expenses paid by the class.
See accompanying notes which are an integral part of the financial statements.
Annual Report
Tax-Exempt Portfolio
Investment Changes (Unaudited)
Weighted Average Maturity Diversification |
Days | % of fund's
investments
3/31/11 | % of fund's
investments
9/30/10 | % of fund's
investments
3/31/10 |
0 - 30 | 85.4 | 88.2 | 82.8 |
31 - 90 | 6.5 | 6.4 | 10.4 |
91 - 180 | 6.3 | 2.7 | 6.0 |
181 - 397 | 1.8 | 2.7 | 0.8 |
Effective maturity is determined in accordance with the requirements of Rule 2a-7 under the Investment Company Act of 1940. |
Weighted Average Maturity |
| 3/31/11 | 9/30/10 | 3/31/10 |
Tax-Exempt Portfolio | 21 Days | 20 Days | 21 Days |
All Tax-Free Money Market Funds Average* | 27 Days | 33 Days | 27 Days |
This is a weighted average of all the maturities of the securities held in a fund. Weighted Average Maturity (WAM) can be used as a measure of sensitivity to interest rate changes and markets changes. Generally, the longer the maturity, the greater the sensitivity to such changes. WAM is based on the dollar-weighted average length of time until principal payments must be paid. Depending on the types of securities held in a fund, certain maturity shortening devices (e.g., demand features, interest rate resets, and call options) may be taken into account when calculating the WAM. |
Weighted Average Life |
| 3/31/11 | 9/30/10 | 3/31/10 |
Tax-Exempt Portfolio | 21 Days | 20 Days | n/a** |
Weighted Average Life (WAL) is the weighted average of the life of the securities held in a fund or portfolio and can be used as a measure of sensitivity to changes in liquidity and/or credit risk. Generally, the higher the value, the greater the sensitivity. WAL is based on the dollar-weighted average length of time until principal payments must be paid, taking into account any call options exercised by the issuer and any permissible maturity shortening features other than interest rate resets. The difference between WAM and WAL is that WAM takes into account interest rate resets and WAL does not. WAL for money market funds is not the same as WAL of a mortgage- or asset-backed security. |
Asset Allocation (% of fund's net assets) |
As of March 31, 2011 | As of September 30, 2010 |
| Variable Rate Demand Notes (VRDNs) 71.2% | | | Variable Rate Demand Notes (VRDNs) 74.9% | |
 | Commercial Paper (including CP
Mode) 12.9% | | | Commercial Paper (including CP
Mode) 15.1% | |
| Tender Notes
and Bonds 1.1% | | | Tender Notes
and Bonds 0.6% | |
| Municipal Notes 3.6% | | | Municipal Notes 1.4% | |
| Municipal Bonds 2.7% | | | Municipal Bonds 1.4% | |
 | Tax-Free Cash
Central 8.7% | |  | Tax-Free Cash
Central 5.3% | |
 | Net Other Assets*** (0.2)% | | | Net Other Assets 1.3% | |

* Source: iMoneyNet, Inc.
** Information not available
*** Net Other Assets are not included in the pie chart.
Annual Report
Tax-Exempt Portfolio
Investments March 31, 2011
Showing Percentage of Net Assets
Municipal Securities - 100.2% |
| Principal Amount (000s) | | Value (000s) |
Alabama - 0.8% |
Daphne-Villa Mercy Spl. Care Facilities Fing. Auth. Rev. (Mercy Med. Proj.) Series 1997, 0.28%, LOC Bank of America NA, VRDN (c) | $ 7,100 | | $ 7,100 |
Mobile Indl. Dev. Board Solid Waste Disp. Rev. (Alabama Pwr. Co. Barry Plant Proj.) Second Series 2009, 0.28%, VRDN (c) | 1,700 | | 1,700 |
Pell City Spl. Care Facilities Rev. (Noland Health Svcs., Inc. Proj.) Series 2009 A, 0.25%, LOC U.S. Bank NA, Minnesota, VRDN (c) | 10,350 | | 10,350 |
Univ. of Alabama at Birmingham Hosp. Rev. Participating VRDN Series Solar 07 108, 0.24% (Liquidity Facility U.S. Bank NA, Minnesota) (c)(f) | 15,975 | | 15,975 |
| | 35,125 |
Alaska - 0.2% |
North Slope Borough Gen. Oblig. Bonds: | | | |
Series 2000 B, 6/30/11 | 1,000 | | 999 |
Series 2003 A, 6/30/11 | 3,750 | | 3,745 |
Valdez Marine Term. Rev. (Phillips Trans. Alaska, Inc. Proj.) Series 1994 C, 0.4% (ConocoPhillips Guaranteed), VRDN (c) | 4,500 | | 4,500 |
| | 9,244 |
Arizona - 1.0% |
Arizona Health Facilities Auth. Rev. (Catholic Healthcare West Proj.) Series 2009 F, 0.23%, LOC Citibank NA, VRDN (c) | 2,000 | | 2,000 |
Maricopa County Cmnty. College District Bonds Series 2003C, 5.25% 7/1/11 | 3,925 | | 3,973 |
Phoenix Civic Impt. Corp. Series 2009, 0.32% 4/7/11, LOC Bank of America NA, CP | 16,200 | | 16,200 |
Phoenix Civic Impt. Corp. Wtr. Sys. Rev. Participating VRDN Series Putters 3458, 0.25% (Liquidity Facility JPMorgan Chase Bank) (c)(f) | 1,000 | | 1,000 |
Phoenix Indl. Dev. Auth. Multi-family Hsg. Rev. (Paradise Lakes Apt. Proj.) Series 2007 A, 0.23%, LOC Wells Fargo Bank NA, VRDN (c) | 6,150 | | 6,150 |
Pima County Indl. Dev. Auth. Rev. (Broadway Proper Congregate Proj.) Series 2000 A, 0.25%, LOC State Street Bank & Trust Co., Boston, VRDN (c) | 1,960 | | 1,960 |
Salt River Proj. Agricultural Impt. & Pwr. District Elec. Sys. Rev. Participating VRDN: | | | |
Series Putters 3307, 0.25% (Liquidity Facility JPMorgan Chase Bank) (c)(f) | 6,600 | | 6,600 |
Series Putters 3708Z, 0.25% (Liquidity Facility JPMorgan Chase Bank) (c)(f) | 2,000 | | 2,000 |
|
| Principal Amount (000s) | | Value (000s) |
Tempe Gen. Oblig. Bonds Series 2010 C, 1.25% 7/1/11 | $ 2,215 | | $ 2,220 |
Tempe Indl. Dev. Auth. Rev. (ASUF Brickyard Proj.) Series 2004 A, 0.32%, LOC Bank of America NA, VRDN (c) | 1,000 | | 1,000 |
| | 43,103 |
Arkansas - 0.9% |
Arkansas Gen. Oblig. Bonds Series 2010, 4% 8/1/11 | 4,575 | | 4,631 |
Boone Co. Hosp. Rev. (North Arkansas Reg'l. Med. Ctr. Proj.) Series 2006, 0.28%, LOC Bank of America NA, VRDN (c) | 22,530 | | 22,530 |
Univ. of Arizona Univ. Revs. Participating VRDN Series Solar 06 26, 0.24% (Liquidity Facility U.S. Bank NA, Minnesota) (c)(f) | 11,130 | | 11,130 |
| | 38,291 |
California - 2.9% |
California Edl. Facilities Auth. Rev. (Univ. of San Francisco Proj.) Series 2005 B, 0.21%, LOC JPMorgan Chase Bank, VRDN (c) | 2,600 | | 2,600 |
California Gen. Oblig.: | | | |
Series 2003 B4, 0.24%, LOC JPMorgan Chase Bank, LOC California Pub. Employees Retirement Sys., VRDN (c) | 5,800 | | 5,800 |
Series 2005 B3, 0.2%, LOC Barclays Bank PLC, VRDN (c) | 1,200 | | 1,200 |
California Health Facilities Fing. Auth. Rev. (Scripps Health Proj.) Series 2008 C, 0.25%, LOC Union Bank of California, VRDN (c) | 7,100 | | 7,100 |
California Statewide Cmntys. Dev. Auth. Gas Supply Rev. Series 2010, 0.24% (Liquidity Facility Royal Bank of Canada), VRDN (c) | 7,500 | | 7,500 |
California Statewide Cmntys. Dev. Auth. Rev. (Los Angeles County Museum of Art Proj.) Series 2008 A, 0.22%, LOC Wells Fargo Bank NA, VRDN (c) | 2,000 | | 2,000 |
Elk Grove Unified School District Spl. Tax Participating VRDN Series Solar 06-80, 0.24% (Liquidity Facility U.S. Bank NA, Minnesota) (c)(f) | 9,565 | | 9,565 |
Loma Linda Hosp. Rev. (Loma Linda Univ. Med. Ctr. Proj.) Series 2007 B1, 0.26%, LOC Union Bank of California, VRDN (c) | 18,000 | | 18,000 |
Los Angeles Gen. Oblig. TRAN 2% 4/21/11 | 5,200 | | 5,204 |
Los Angeles Unified School District TRAN Series A, 2% 6/30/11 | 11,200 | | 11,236 |
Orange County Sanitation District Rev. BAN Series 2010 B, 2% 11/23/11 | 11,400 | | 11,520 |
Municipal Securities - continued |
| Principal Amount (000s) | | Value (000s) |
California - continued |
Richmond Wastewtr. Rev. Series 2008 A, 0.32%, LOC Union Bank of California, VRDN (c) | $ 2,000 | | $ 2,000 |
Riverside County Asset Leasing Corp. Leasehold Rev. (Southwest Justice Ctr. Proj.) Series 2008 A, 0.25%, LOC Union Bank of California, VRDN (c) | 8,000 | | 8,000 |
San Francisco Bay Area Rapid Transit Fing. Auth. Participating VRDN Series ROC II R 11251, 0.24% (Liquidity Facility Citibank NA) (c)(f) | 3,030 | | 3,030 |
Santa Clara County Fing. Auth. Rev. (El Camino Hosp. Proj.) Series 2009 A, 0.22%, LOC Wells Fargo Bank NA, VRDN (c) | 13,800 | | 13,800 |
South Placer Wastewtr. Auth. Rev. Series 2008 B, 0.22%, LOC State Street Bank & Trust Co., Boston, LOC California Teachers Retirement Sys., VRDN (c) | 2,000 | | 2,000 |
Stockton Pub. Fing. Auth. Wtr. Rev. (Delta Wtr. Supply Proj.) Series 2010 A, 0.25%, LOC Union Bank of California, VRDN (c) | 7,500 | | 7,500 |
| | 118,055 |
Colorado - 3.3% |
Colorado Ed. Ln. Prog. TRAN Series 2010 D, 2% 6/30/11 | 34,800 | | 34,944 |
Colorado Health Facilities Auth. Retirement Hsg. Rev. Participating VRDN Series Putters 1390, 0.25% (Liquidity Facility JPMorgan Chase Bank) (c)(f) | 1,775 | | 1,775 |
Colorado Health Facilities Auth. Rev.: | | | |
(Catholic Health Initiatives Proj.): | | | |
Series 2004 B, 0.25% (Liquidity Facility Landesbank Hessen-Thuringen), VRDN (c) | 950 | | 950 |
Series 2004 B1, 0.26% (Liquidity Facility Bayerische Landesbank Girozentrale), VRDN (c) | 6,545 | | 6,545 |
(NCMC, Inc. Proj.) Series 2009 A, 0.22%, LOC Wells Fargo Bank NA, VRDN (c) | 6,640 | | 6,640 |
Participating VRDN Series BA 08 1090, 0.32% (Liquidity Facility Bank of America NA) (c)(f) | 10,700 | | 10,700 |
Colorado Reg'l. Trans. District Sales Tax Rev. Participating VRDN: | | | |
Series EGL 07 0039, 0.25% (Liquidity Facility Citibank NA) (c)(f) | 16,000 | | 16,000 |
Series EGL 07 0040, 0.25% (Liquidity Facility Citibank NA) (c)(f) | 11,700 | | 11,700 |
Series ROC II R 12312, 0.25% (Liquidity Facility Citibank NA) (c)(f) | 6,000 | | 6,000 |
|
| Principal Amount (000s) | | Value (000s) |
Denver City & County Wtr. Participating VRDN Series PZ 232, 0.28% (Liquidity Facility Wells Fargo & Co.) (c)(f) | $ 15,905 | | $ 15,905 |
Denver Urban Renewal Auth. Tax Increment Rev.: | | | |
Series 2008 A1, 0.25%, LOC U.S. Bank NA, Minnesota, VRDN (c) | 14,460 | | 14,460 |
Series 2008 A2, 0.25%, LOC U.S. Bank NA, Minnesota, VRDN (c) | 9,420 | | 9,420 |
| | 135,039 |
Connecticut - 0.7% |
Connecticut Gen. Oblig. BAN: | | | |
Series 2009 B, 4% 6/1/11 | 5,700 | | 5,734 |
Series 2010 A, 2% 5/19/11 | 14,500 | | 14,529 |
Connecticut Health & Edl. Facilities Auth. Rev. (Masonicare Corp. Proj.) Series D, 0.22%, LOC Wells Fargo Bank NA, VRDN (c) | 8,300 | | 8,300 |
| | 28,563 |
Delaware - 0.8% |
Delaware Health Facilities Auth. Rev. (Bayhealth Med. Ctr. Proj.) Series 2009 C, 0.22%, LOC Wells Fargo Bank NA, VRDN (c) | 26,875 | | 26,875 |
Wilmington Adjustable Rate Demand Rev. (Delaware Art Museum, Inc. Proj.) 0.25%, LOC Wells Fargo Bank NA, VRDN (c) | 4,600 | | 4,600 |
| | 31,475 |
District Of Columbia - 1.2% |
District of Columbia Gen. Oblig. Series 2008 C, 0.23%, LOC TD Banknorth, NA, VRDN (c) | 5,800 | | 5,800 |
District of Columbia Income Tax Rev. Participating VRDN Series Putters 3354, 0.25% (Liquidity Facility JPMorgan Chase Bank) (c)(f) | 7,700 | | 7,700 |
District of Columbia Rev.: | | | |
(American Psychological Assoc. Proj.) Series 2003, 0.32%, LOC Bank of America NA, VRDN (c) | 2,220 | | 2,220 |
(Defenders of Wildlife Proj.) 0.32%, LOC Bank of America NA, VRDN (c) | 6,090 | | 6,090 |
(Friends Legal Svcs. Corp. Proj.) 0.32%, LOC Bank of America NA, VRDN (c) | 10,485 | | 10,485 |
(The AARP Foundation Proj.) Series 2004, 0.25%, LOC Bank of America NA, VRDN (c) | 9,900 | | 9,900 |
Municipal Securities - continued |
| Principal Amount (000s) | | Value (000s) |
District Of Columbia - continued |
District of Columbia Rev.: - continued | | | |
(The Phillips Collection Issue Proj.) Series 2003, 0.39%, LOC Bank of America NA, VRDN (c) | $ 2,675 | | $ 2,675 |
(The Washington Ctr. for Internships and Academic Seminars Proj.) Series 2009, 0.26%, LOC Branch Banking & Trust Co., VRDN (c) | 4,000 | | 4,000 |
| | 48,870 |
Florida - 9.3% |
Broward County Edl. Facilities Auth. Rev. (Nova Southeastern Univ. Proj.) Series 2008 A, 0.25%, LOC Bank of America NA, VRDN (c) | 5,350 | | 5,350 |
Cape Coral Wtr. & Swr. Rev. Participating VRDN Series Solar 07 60, 0.25% (Liquidity Facility U.S. Bank NA, Minnesota) (c)(f) | 20,430 | | 20,430 |
Collier County Indl. Dev. Auth. (Cmnty. School of Naples Proj.) 0.32%, LOC Bank of America NA, VRDN (c) | 13,680 | | 13,680 |
Davie Gen. Oblig. Rev. (United Jewish Cmnty. Proj.) 0.26%, LOC Bank of America NA, VRDN (c) | 14,755 | | 14,755 |
Florida Board of Ed. Bonds Series 2002 G, 5.25% 6/1/11 | 4,400 | | 4,436 |
Florida Board of Ed. Pub. Ed. Cap. Outlay Participating VRDN: | | | |
Series EGL 07 48, 0.24% (Liquidity Facility Citibank NA) (c)(f) | 21,445 | | 21,445 |
Series ROC II R 817, 0.24% (Liquidity Facility Citibank NA) (c)(f) | 10,005 | | 10,005 |
Florida Dept. of Envir. Protection Rev. Bonds: | | | |
Series 2010 C, 4% 7/1/11 | 5,150 | | 5,196 |
Series 2010 D, 4% 7/1/11 | 15,845 | | 15,981 |
Florida Dept. of Trans. Tpk. Rev.: | | | |
Bonds Series 2010 A, 3% 7/1/11 | 1,000 | | 1,006 |
Participating VRDN Series Solar 07 30, 0.24% (Liquidity Facility U.S. Bank NA, Minnesota) (c)(f) | 15,010 | | 15,010 |
Florida Gen. Oblig. Participating VRDN Series PZ 130, 0.28% (Liquidity Facility Wells Fargo & Co.) (c)(f) | 7,070 | | 7,070 |
Florida Hsg. Fin. Corp. Multi-family Mtg. Rev. (Victoria Park Apts. Proj.) Series 2002 J, 0.26%, LOC Fannie Mae, VRDN (c) | 1,050 | | 1,050 |
Florida Local Govt. Fin. Commission Auth. Rev. Series A, 0.32% 4/4/11, LOC Wells Fargo Bank NA, CP | 3,839 | | 3,839 |
Fort Myers Util. Sys. Rev. Series 2009, 0.25%, LOC Bank of America NA, VRDN (c) | 6,000 | | 6,000 |
|
| Principal Amount (000s) | | Value (000s) |
Highlands County Health Facilities Auth. Rev.: | | | |
(Adventist Health Sys./Sunbelt, Inc. Accounts Receivable Prog.) Series 2009 A, 0.22%, LOC PNC Bank NA, VRDN (c) | $ 2,000 | | $ 2,000 |
Participating VRDN Series MS 3251, 0.26% (Liquidity Facility Morgan Stanley Bank, West Valley City Utah) (c)(f) | 5,625 | | 5,625 |
Jacksonville Elec. Auth. Elec. Sys. Rev. Bonds Series F, 0.32% tender 6/16/11 (Liquidity Facility Landesbank Hessen-Thuringen), CP mode | 34,900 | | 34,900 |
Jacksonville Health Facilities Auth. Hosp. Rev. (Baptist Med. Ctr. Proj.) Series 2001, 0.22%, LOC Wells Fargo Bank NA, VRDN (c) | 8,435 | | 8,435 |
Nassau County Poll. Cont. Rev. (Rayonier Proj.) 0.32%, LOC Bank of America NA, VRDN (c) | 11,910 | | 11,910 |
Orange County Indl. Dev. Auth. Indl. Dev. Rev. (Central Florida YMCA Proj.) Series 2002 A, 0.28%, LOC Bank of America NA, VRDN (c) | 3,375 | | 3,375 |
Orlando & Orange County Expressway Auth. Rev. Series 2008 B1, 0.24%, LOC Bank of America NA, VRDN (c) | 5,810 | | 5,810 |
Palm Beach County Edl. Facilities Auth. (Lynn Univ. Proj.) Series 2001, 0.28%, LOC Bank of America NA, VRDN (c) | 7,565 | | 7,565 |
Palm Beach County Pub. Impt. Rev. Participating VRDN Series BBT 08 53, 0.24% (Liquidity Facility Branch Banking & Trust Co.) (c)(f) | 8,600 | | 8,600 |
Palm Beach County Rev.: | | | |
(Benjamin Private School Proj.) 0.32%, LOC Bank of America NA, VRDN (c) | 4,035 | | 4,035 |
(Raymond F. Kravis Ctr. Proj.) Series 2002, 0.24%, LOC Northern Trust Co., VRDN (c) | 1,900 | | 1,900 |
(Saint Andrew's School of Boca Raton, Inc. Proj.) Series 2007, 0.28%, LOC Bank of America NA, VRDN (c) | 18,940 | | 18,940 |
(The Norton Gallery and School of Arts, Inc. Proj.) Series 2000, 0.28%, LOC Bank of America NA, VRDN (c) | 3,075 | | 3,075 |
Palm Beach County Wtr. & Swr. Rev. Participating VRDN Series Putters 2622, 0.25% (Liquidity Facility JPMorgan Chase Bank) (c)(f) | 1,775 | | 1,775 |
Pasco County School Board Ctfs. of Prtn. Series 2008 C, 0.28%, LOC Bank of America NA, VRDN (c) | 20,420 | | 20,420 |
Pinellas County Swr. Rev. Participating VRDN Series Putters 2917 Z, 0.3% (Liquidity Facility JPMorgan Chase Bank) (c)(f) | 3,000 | | 3,000 |
Municipal Securities - continued |
| Principal Amount (000s) | | Value (000s) |
Florida - continued |
Pinellas County Health Facilities Auth. Rev. (BayCare Health Sys. Proj.) Series 2009 A3, 0.24%, LOC Wells Fargo Bank NA, VRDN (c) | $ 15,975 | | $ 15,975 |
Polk County School Board Ctfs. of Prtn. (Master Lease Prog.): | | | |
Series 2009 A, 0.22%, LOC Wells Fargo Bank NA, VRDN (c) | 5,000 | | 5,000 |
Series 2009 B, 0.22%, LOC Wells Fargo Bank NA, VRDN (c) | 14,245 | | 14,245 |
South Florida Wtr. Mgmt. District Ctfs. of Prtn. Participating VRDN Series ROC II R 12313, 0.25% (Liquidity Facility Citibank NA) (c)(f) | 13,090 | | 13,090 |
South Miami Health Facilities Auth. Hosp. Rev. Participating VRDN Series BA 07 1030, 0.32% (Liquidity Facility Bank of America NA) (c)(f) | 1,540 | | 1,540 |
Tallahassee Consolidated Util. Sys. Rev. Participating VRDN Series ROC II R 11306, 0.25% (Liquidity Facility Citibank NA) (c)(f) | 13,520 | | 13,520 |
Univ. of North Florida Parking Sys. Rev. Series 1998, 0.26%, LOC Wells Fargo Bank NA, VRDN (c) | 2,200 | | 2,200 |
Volusia County Hsg. Fin. Auth. Multi-family Hsg. Rev. (Fisherman's Landing Apts. Proj.) 0.25%, LOC Fannie Mae, VRDN (c) | 2,615 | | 2,615 |
Volusia County School Board Ctfs. of Prtn. Participating VRDN Series Solar 06 8, 0.24% (Liquidity Facility U.S. Bank NA, Minnesota) (c)(f) | 20,865 | | 20,865 |
Winter Haven Util. Sys. Impt. & Rfdg. Rev. Participating VRDN Series Solar 06 54, 0.24% (Liquidity Facility U.S. Bank NA, Minnesota) (c)(f) | 8,035 | | 8,035 |
| | 383,703 |
Georgia - 2.5% |
Atlanta Arpt. Rev. Series 2010 B1, 0.35% 5/25/11, LOC Wells Fargo Bank NA, CP | 17,500 | | 17,500 |
Atlanta Tax Allocation (Westside Proj.): | | | |
Series 2005 B, 0.24%, LOC Wells Fargo Bank NA, VRDN (c) | 1,200 | | 1,200 |
Series 2008, 0.24%, LOC Wells Fargo Bank NA, VRDN (c) | 14,820 | | 14,820 |
Series A, 0.24%, LOC Wells Fargo Bank NA, VRDN (c) | 5,455 | | 5,455 |
Burke County Indl. Dev. Auth. Poll. Cont. Rev. (Oglethorpe Pwr. Corp. Projects) Series 2010 A, 0.24%, LOC Bank of America NA, VRDN (c) | 5,000 | | 5,000 |
|
| Principal Amount (000s) | | Value (000s) |
DeKalb County Hsg. Auth. Multi-family Hsg. Rev. (Timber Trace Apts. Proj.) Series 2003, 0.23%, LOC Freddie Mac, VRDN (c) | $ 1,500 | | $ 1,500 |
Fulton County Dev. Auth. (Mount Vernon Presbyterian School Proj.) Series 2005, 0.26%, LOC Branch Banking & Trust Co., VRDN (c) | 2,700 | | 2,700 |
Fulton County Hosp. Auth. Rev. (Northside Hosp. Proj.) Series 2003 B, 0.22%, LOC Wells Fargo Bank NA, VRDN (c) | 7,790 | | 7,790 |
Georgia Gen. Oblig. Participating VRDN Series 85TP, 0.25% (Liquidity Facility Wells Fargo & Co.) (c)(f) | 200 | | 200 |
Glynn-Brunswick Memorial Hosp. Auth. Rev. (Southeast Georgia Health Sys. Proj.) Series 2008 B, 0.25%, LOC Branch Banking & Trust Co., VRDN (c) | 12,380 | | 12,380 |
Main Street Natural Gas, Inc. Georgia Gas Proj. Rev. Series 2010 A, 0.25% (Liquidity Facility Royal Bank of Canada), VRDN (c) | 12,500 | | 12,500 |
Metropolitan Atlanta Rapid Transit Auth. Sales Tax Rev. Participating VRDN Series Solar 08 0001, 0.24% (Liquidity Facility U.S. Bank NA, Minnesota) (c)(f) | 10,275 | | 10,275 |
Thomasville Hosp. Auth. Rev. (Archbold Memorial Hosp. Proj.) Series 2009 B, 0.26%, LOC Branch Banking & Trust Co., VRDN (c) | 3,510 | | 3,510 |
Whitfield County Residential Care Facilities Auth. Rev. (Royal Oaks Sr. Living Cmnty. Proj.) 0.3%, LOC Wells Fargo Bank NA, VRDN (c) | 6,750 | | 6,750 |
| | 101,580 |
Hawaii - 0.6% |
Hawaii Dept. of Budget & Fin. Spl. Purp. Rev. (Queen's Health Sys. Proj.) Series 2009 A, 0.24%, LOC Bank of America NA, VRDN (c) | 5,000 | | 5,000 |
Hawaii Gen. Oblig. Participating VRDN Series ROC II R 11021 PB, 0.29% (Liquidity Facility Deutsche Postbank AG) (c)(f) | 20,355 | | 20,355 |
| | 25,355 |
Idaho - 0.2% |
Idaho Gen. Oblig. TAN 2% 6/30/11 | 6,800 | | 6,827 |
Illinois - 5.0% |
Chicago Board of Ed. Series 2009 A2, 0.25%, LOC Northern Trust Co., VRDN (c) | 5,900 | | 5,900 |
Chicago Gen. Oblig. Participating VRDN Series Solar 06 38, 0.24% (Liquidity Facility U.S. Bank NA, Minnesota) (c)(f) | 7,865 | | 7,865 |
Municipal Securities - continued |
| Principal Amount (000s) | | Value (000s) |
Illinois - continued |
Chicago Wtr. Rev.: | | | |
Series 2004 A1, 0.26%, LOC California Pub. Employees Retirement Sys., VRDN (c) | $ 19,720 | | $ 19,720 |
Series 2004 A2, 0.26%, LOC California Pub. Employees Retirement Sys., VRDN (c) | 19,625 | | 19,625 |
DuPage County Rev. (Morton Arboretum Proj.) 0.32%, LOC Bank of America NA, VRDN (c) | 24,050 | | 24,050 |
Illinois Edl. Facilities Auth. Revs. Participating VRDN Series ROC II R 12278, 0.24% (Liquidity Facility Citibank NA) (c)(f) | 5,195 | | 5,195 |
Illinois Fin. Auth. Poll. Cont. Rev. (Commonwealth Edison Co. Proj.) Series 2008 E, 0.26%, LOC JPMorgan Chase Bank, VRDN (c) | 8,305 | | 8,305 |
Illinois Fin. Auth. Rev.: | | | |
(Chicago Symphony Orchestra Proj.) Series 2008, 0.22%, LOC U.S. Bank NA, Minnesota, VRDN (c) | 2,150 | | 2,150 |
(Concordia Univ. Proj.) Series 2009, 0.27%, LOC Fed. Home Ln. Bank Chicago, VRDN (c) | 14,800 | | 14,800 |
(North Central College Proj.) Series 2008, 0.28%, LOC Bank of America NA, VRDN (c) | 8,500 | | 8,500 |
(Northwest Cmnty. Hosp. Proj.) Series 2008 C, 0.24%, LOC Wells Fargo Bank NA, VRDN (c) | 7,635 | | 7,635 |
(Provena Health Proj.) Series 2010 D, 0.23%, LOC Union Bank of California, VRDN (c) | 8,300 | | 8,300 |
(Saint Xavier Univ. Proj.) Series 2008, 0.26%, LOC Bank of America NA, VRDN (c) | 3,745 | | 3,745 |
Participating VRDN: | | | |
Series DB 601, 0.25% (Liquidity Facility Deutsche Bank AG) (c)(f) | 10,240 | | 10,240 |
Series EGL 06 115, 0.24% (Liquidity Facility Citibank NA) (c)(f) | 13,615 | | 13,615 |
Series Putters 3174, 0.25% (Liquidity Facility JPMorgan Chase Bank) (c)(f) | 1,130 | | 1,130 |
Series Putters 3379, 0.25% (Liquidity Facility JPMorgan Chase Bank) (c)(f) | 4,995 | | 4,995 |
Illinois Hsg. Dev. Auth. Multi-family Hsg. Rev. (Lakeshore Plaza Proj.) Series 2008 B, 0.25%, LOC JPMorgan Chase Bank, VRDN (c) | 15,520 | | 15,520 |
Illinois Toll Hwy. Auth. Toll Hwy. Rev. Series 2007 A 2B, 0.19%, LOC Harris NA, VRDN (c) | 11,000 | | 11,000 |
|
| Principal Amount (000s) | | Value (000s) |
Lake County Multi-family Hsg. Rev. (Whispering Oaks Apts. Proj.) Series 2008, 0.23%, LOC Freddie Mac, VRDN (c) | $ 3,250 | | $ 3,250 |
Metropolitan Pier & Exposition Participating VRDN Series MS 3216, 0.25% (Liquidity Facility Morgan Stanley Bank, West Valley City Utah) (c)(f) | 10,000 | | 10,000 |
Yorkville Svc. Area 2004-106 Tax (MPI Grande Reserve Proj.) 0.39%, LOC Bank of America NA, VRDN (c) | 1,622 | | 1,622 |
| | 207,162 |
Indiana - 2.8% |
Elkhart County Hosp. Auth. Rev. (Elkhart Gen. Hosp. Proj.) Series 2008, 0.24%, LOC JPMorgan Chase Bank, VRDN (c) | 13,150 | | 13,150 |
Indiana Dev. Fin. Auth. Envir. Rev. (Duke Energy Indiana, Inc. Proj.) Series 2009 A5, 0.22%, LOC Bank of America NA, VRDN (c) | 7,725 | | 7,725 |
Indiana Dev. Fin. Auth. Poll. Cont. Rev. (Southern Indiana Gas and Elec. Co. Proj.) Series 1998 A, 0.25%, LOC JPMorgan Chase Bank, VRDN (c) | 5,000 | | 5,000 |
Indiana Dev. Fin. Auth. Rev. (Indianapolis Museum of Art, Inc. Proj.) Series 2002, 0.25%, LOC JPMorgan Chase Bank, VRDN (c) | 3,800 | | 3,800 |
Indiana Fin. Auth. Health Sys. Rev.: | | | |
(Sisters of Saint Francis Health Svcs., Inc. Obligated Group Proj.): | | | |
Series 2008 E, 0.23%, LOC Bank of America NA, VRDN (c) | 33,000 | | 33,000 |
Series 2008 J, 0.22%, LOC Wells Fargo Bank NA, VRDN (c) | 2,000 | | 2,000 |
Participating VRDN Series 3654 Z, 0.25% (Liquidity Facility JPMorgan Chase Bank) (c)(f) | 6,880 | | 6,880 |
Indiana Fin. Auth. Hosp. Rev. (Parkview Health Sys. Oblig. Group Proj.) Series 2009 D, 0.23%, LOC Citibank NA, VRDN (c) | 3,300 | | 3,300 |
Indiana Health & Edl. Facilities Fing. Auth. Hosp. Rev. (Howard Reg'l. Health Sys. Proj.) Series A, 0.24%, LOC Comerica Bank, VRDN (c) | 5,480 | | 5,480 |
Indiana Health Facilities Fing. Auth. Hosp. Rev. (Cmnty. Hospitals Proj.): | | | |
Series 1997 A, 0.25%, LOC JPMorgan Chase Bank, VRDN (c) | 7,000 | | 7,000 |
Series 1997 B, 0.25%, LOC JPMorgan Chase Bank, VRDN (c) | 15,000 | | 15,000 |
Municipal Securities - continued |
| Principal Amount (000s) | | Value (000s) |
Indiana - continued |
Marion Econ. Dev. Rev. (Indiana Wesleyan Univ. Proj.) Series 2006, 0.26%, LOC Bank of America NA, VRDN (c) | $ 2,600 | | $ 2,600 |
Marshall County Econ. Dev. Rev. (Culver Edl. Foundation Prog.) Series 2000, 0.24%, LOC Northern Trust Co., VRDN (c) | 8,300 | | 8,300 |
| | 113,235 |
Iowa - 0.3% |
Iowa Fin. Auth. Rev. Bonds Series 2010 A, 2% 8/1/11 | 3,755 | | 3,776 |
Iowa Fin. Auth. Wellness Facilities Rev. (Cmnty. Y of Marshalltown Proj.) Series 2001, 0.28%, LOC Bank of America NA, VRDN (c) | 7,475 | | 7,475 |
| | 11,251 |
Kansas - 0.3% |
Kansas Dept. of Trans. Hwy. Rev.: | | | |
Bonds Series 2003 A, 5% 9/1/11 | 2,000 | | 2,039 |
Participating VRDN Series BBT 08 51, 0.24% (Liquidity Facility Branch Banking & Trust Co.) (c)(f) | 6,300 | | 6,300 |
Overland Park Gen. Oblig. Participating VRDN Series SG 01 155, 0.25% (Liquidity Facility Societe Generale) (c)(f) | 3,000 | | 3,000 |
| | 11,339 |
Louisiana - 0.7% |
East Baton Rouge Parish Indl. Dev. Board Rev. (Stupp Bros., Inc. Proj.) Series 2008, 0.32%, LOC Bank of America NA, VRDN (c) | 5,205 | | 5,205 |
Louisiana Gas & Fuel Tax Rev. Participating VRDN Series WF 10 11C, 0.25% (Liquidity Facility Wells Fargo Bank NA) (c)(f) | 5,540 | | 5,540 |
Louisiana Gen. Oblig. Bonds Series 2009 B, 3% 4/15/11 | 9,675 | | 9,685 |
Louisiana Offshore Term. Auth. Deepwater Port Rev. (LOOP LLC Proj.) Series 2003 B, 0.25%, LOC JPMorgan Chase Bank, VRDN (c) | 2,900 | | 2,900 |
Louisiana Pub. Facilities Auth. Rev. (C-Port LLC Proj.) Series 2008, 0.28%, LOC Bank of America NA, VRDN (c) | 4,500 | | 4,500 |
| | 27,830 |
|
| Principal Amount (000s) | | Value (000s) |
Maine - 0.4% |
Maine Health & Higher Ed. Facilities Auth. Rev.: | | | |
Participating VRDN Series Solar 06 122, 0.24% (Liquidity Facility U.S. Bank NA, Minnesota) (c)(f) | $ 14,925 | | $ 14,925 |
Series 2008 B, 0.3%, LOC KBC Bank NV, VRDN (c) | 1,400 | | 1,400 |
| | 16,325 |
Maryland - 1.0% |
Anne Arundel County Gen. Oblig. Bonds Series 2011, 3% 4/1/12 (b) | 6,290 | | 6,446 |
Baltimore County Econ. Dev. Rev. (The Bais Yaakov School for Girls Proj.) Series 2003, 0.36%, LOC Bank of America NA, VRDN (c) | 5,180 | | 5,180 |
Baltimore County Gen. Oblig. Series 1995, 0.31% 5/6/11 (Liquidity Facility BNP Paribas SA), CP | 4,000 | | 4,000 |
Maryland Cmnty. Dev. Administration Multi-family Dev. Rev. (Avalon Lea Apt. Proj.) Series 1997, 0.24%, LOC Fannie Mae, VRDN (c) | 1,800 | | 1,800 |
Maryland Econ. Dev. Auth. Rev. (Associated Projs.) Series A, 0.26%, LOC Bank of America NA, VRDN (c) | 1,415 | | 1,415 |
Maryland Health & Higher Edl. Facilities Auth. Rev.: | | | |
(Mercy Med. Ctr. Proj.) Series 2007 B, 0.26%, LOC Bank of America NA, VRDN (c) | 535 | | 535 |
Participating VRDN Series BBT 08 46, 0.24% (Liquidity Facility Branch Banking & Trust Co.) (c)(f) | 3,835 | | 3,835 |
Maryland Trans. Auth. Trans. Facility Projects Rev. Participating VRDN Series ROC II R 11437, 0.26% (Liquidity Facility Citibank NA) (c)(f) | 7,785 | | 7,785 |
Montgomery County Econ. Dev. Rev. (Georgetown Preparatory School, Inc. Proj.) Series 2005, 0.28%, LOC Bank of America NA, VRDN (c) | 6,960 | | 6,960 |
Montgomery County Hsg. Opportunity Commission Single Family Mtg. Rev. Series 2002 C, 0.24% (Liquidity Facility Fannie Mae) (Liquidity Facility Freddie Mac), VRDN (c) | 1,300 | | 1,300 |
| | 39,256 |
Massachusetts - 4.3% |
Massachusetts Bay Trans. Auth. Sales Tax Rev. Series 2008 A2, 0.25% (Liquidity Facility JPMorgan Chase Bank), VRDN (c) | 3,000 | | 3,000 |
Municipal Securities - continued |
| Principal Amount (000s) | | Value (000s) |
Massachusetts - continued |
Massachusetts Gen. Oblig.: | | | |
Participating VRDN: | | | |
Series Clipper 07 39, 0.28% (Liquidity Facility State Street Bank & Trust Co., Boston) (c)(f) | $ 8,000 | | $ 8,000 |
Series Clipper 07 41, 0.28% (Liquidity Facility State Street Bank & Trust Co., Boston) (c)(f) | 131,350 | | 131,350 |
RAN Series 2010 A, 2% 4/28/11 | 9,000 | | 9,011 |
Massachusetts Health & Edl. Facilities Auth. Rev. Participating VRDN Series ROC II R 11824, 0.25% (Liquidity Facility Citibank NA) (c)(f) | 2,000 | | 2,000 |
Massachusetts School Bldg. Auth. Dedicated Sales Tax Rev. Participating VRDN Series EGL 07 0031, 0.25% (Liquidity Facility Citibank NA) (c)(f) | 10,000 | | 10,000 |
Massachusetts Wtr. Resources Auth. Wtr. & Swr. Rev.: | | | |
Participating VRDN Series EGL 06 0054, 0.25% (Liquidity Facility Citibank NA) (c)(f) | 3,000 | | 3,000 |
Series 2008 C, 0.24% (Liquidity Facility Bayerische Landesbank), VRDN (c) | 10,600 | | 10,600 |
| | 176,961 |
Michigan - 1.1% |
Chelsea Econ. Dev. Corp. Ltd. Oblig. Rev. (Silver Maples of Chelsea Proj.) 0.26%, LOC Comerica Bank, VRDN (c) | 5,485 | | 5,485 |
Detroit Econ. Dev. Corp. Rev. (Michigan Opera Theatre Proj.) Series 1999, 0.45%, LOC JPMorgan Chase Bank, VRDN (c) | 900 | | 900 |
Eastern Michigan Univ. Revs. Series 2009 A, 0.24%, LOC JPMorgan Chase Bank, VRDN (c) | 1,700 | | 1,700 |
Michigan Bldg. Auth. Rev. Series 6, 0.35% 6/2/11, LOC State Street Bank & Trust Co., Boston, LOC U.S. Bank NA, Minnesota, CP | 1,200 | | 1,200 |
Michigan Gen. Oblig. TRAN Series A, 2% 9/30/11 | 11,700 | | 11,791 |
Michigan Hosp. Fin. Auth. Rev. Bonds: | | | |
(Ascension Health Sr. Cr. Group Proj.) Series 2010 F: | | | |
0.34%, tender 10/27/11 (c) | 11,200 | | 11,200 |
0.34%, tender 10/27/11 (c) | 5,140 | | 5,140 |
(Trinity Health Sys. Proj.) Series 2008 C, 0.34% tender 6/6/11, CP mode | 2,700 | | 2,700 |
Ottawa County Wtr. Supply Sys. Rev. Participating VRDN Series Putters 3360, 0.3% (Liquidity Facility JPMorgan Chase Bank) (c)(f) | 6,620 | | 6,620 |
| | 46,736 |
|
| Principal Amount (000s) | | Value (000s) |
Minnesota - 0.7% |
Bloomington Sr. Hsg. Rev. (Presbyterian Homes Proj.) Series 2008, 0.27%, LOC Freddie Mac, VRDN (c) | $ 4,075 | | $ 4,075 |
Minneapolis Gen. Oblig. Bonds Series 2011, 3% 12/1/11 (b) | 4,800 | | 4,883 |
Minnetonka Multi-family Hsg. Rev. (Cliffs at Ridgedale Proj.) Series 1995, 0.26%, LOC Fannie Mae, VRDN (c) | 21,550 | | 21,550 |
| | 30,508 |
Mississippi - 0.9% |
Mississippi Dev. Bank Spl. Oblig. (Harrison County Proj.) Series 2008 A2, 0.25%, LOC Bank of America NA, VRDN (c) | 14,000 | | 14,000 |
Mississippi Gen. Oblig. Series 2007, 0.22% (Liquidity Facility Bank of America NA), VRDN (c) | 22,400 | | 22,400 |
| | 36,400 |
Missouri - 1.5% |
Cape Girardeau County Indl. Dev. Auth. (St. Francis Med. Ctr. Proj.) Series 2009 B, 0.28%, LOC Wells Fargo Bank NA, VRDN (c) | 4,200 | | 4,200 |
Golden Valley Memorial Hosp. District Series 2006, 0.28%, LOC Bank of America NA, VRDN (c) | 9,165 | | 9,165 |
Missouri Health & Edl. Facilities Auth. Edl. Facilities Rev. Participating VRDN: | | | |
Series EGL 07 0001, 0.25% (Liquidity Facility Citibank NA) (c)(f) | 8,000 | | 8,000 |
Series PT 4624, 0.24% (Liquidity Facility Deutsche Postbank AG) (c)(f) | 11,070 | | 11,070 |
Series Putters 3605, 0.25% (Liquidity Facility JPMorgan Chase Bank) (c)(f) | 5,245 | | 5,245 |
Missouri Health & Edl. Facilities Auth. Health Facilities Rev. (Cox Health Sys. Proj.) Series 2008 C, 0.25%, LOC Bank of America NA, VRDN (c) | 2,000 | | 2,000 |
Missouri Highways & Trans. Commission State Road Rev.: | | | |
Participating VRDN Series PT 4625, 0.24% (Liquidity Facility Deutsche Postbank AG) (c)(f) | 10,265 | | 10,265 |
Series 2005 B, 0.25%, LOC State Street Bank & Trust Co., Boston, VRDN (c) | 11,400 | | 11,400 |
| | 61,345 |
Nebraska - 2.2% |
Central Plains Energy Proj. Rev. (Nebraska Gas Proj.) Series 2009, 0.25% (Liquidity Facility Royal Bank of Canada), VRDN (c) | 16,000 | | 16,000 |
Nebraska Pub. Pwr. District Rev. Series A, 0.31% 4/8/11, CP | 17,000 | | 17,000 |
Municipal Securities - continued |
| Principal Amount (000s) | | Value (000s) |
Nebraska - continued |
Nebraska Pub. Pwr. Generation Agcy. Rev. Participating VRDN Series Solar 07 20, 0.24% (Liquidity Facility U.S. Bank NA, Minnesota) (c)(f) | $ 32,125 | | $ 32,125 |
Omaha Pub. Pwr. District Elec. Rev.: | | | |
Series A: | | | |
0.32% 8/18/11, CP | 7,300 | | 7,300 |
0.33% 7/8/11, CP | 3,500 | | 3,500 |
0.32% 8/17/11, CP | 15,000 | | 15,000 |
| | 90,925 |
Nevada - 0.7% |
Clark County Arpt. Rev. Series 2008 D3, 0.25%, LOC Bank of America NA, VRDN (c) | 1,600 | | 1,600 |
Clark County McCarran Int'l. Arpt. Passenger Facility Charge Rev. Series 2010 F2, 0.27%, LOC Union Bank of California, VRDN (c) | 11,000 | | 11,000 |
Clark County School District Bonds Series 2009 B, 4% 6/15/11 | 3,000 | | 3,022 |
Las Vegas Valley Wtr. District Wtr. Impt. Gen. Oblig. Participating VRDN Series Solar 06 93, 0.24% (Liquidity Facility U.S. Bank NA, Minnesota) (c)(f) | 13,895 | | 13,895 |
| | 29,517 |
New Jersey - 0.5% |
New Jersey Gen. Oblig. Bonds Series Putters 3850, 0.3%, tender 5/12/11 (Liquidity Facility JPMorgan Chase & Co.) (c)(f)(g) | 20,000 | | 20,000 |
New Mexico - 0.6% |
New Mexico Muni. Energy Acquisition Auth. Gas Supply Rev. Series 2009, 0.25% (Liquidity Facility Royal Bank of Canada), VRDN (c) | 25,800 | | 25,800 |
New York - 4.4% |
Long Island Pwr. Auth. Elec. Sys. Rev. 0.3% 4/8/11, LOC State Street Bank & Trust Co., Boston, CP | 13,250 | | 13,250 |
Nassau County Interim Fin. Auth. Series 2008 A, 0.23% (Liquidity Facility BNP Paribas SA), VRDN (c) | 4,135 | | 4,135 |
New York City Gen. Oblig.: | | | |
Participating VRDN: | | | |
Series BA 08 1064, 0.31% (Liquidity Facility Bank of America NA) (c)(f) | 5,500 | | 5,500 |
Series Putters 2951, 0.25% (Liquidity Facility JPMorgan Chase Bank) (c)(f) | 1,400 | | 1,400 |
Series 2008 J11, 0.27% (Liquidity Facility KBC Bank NV), VRDN (c) | 5,100 | | 5,100 |
|
| Principal Amount (000s) | | Value (000s) |
New York City Hsg. Dev. Corp. Multi-family Hsg. Mtg. Rev. (The Crest Proj.) Series 2005 A, 0.29%, LOC Landesbank Hessen-Thuringen, VRDN (c) | $ 3,900 | | $ 3,900 |
New York City Muni. Wtr. Fin. Auth. Wtr. & Swr. Sys. Rev. Participating VRDN: | | | |
Series EGL 07 116, 0.25% (Liquidity Facility Citibank NA) (c)(f) | 19,800 | | 19,800 |
Series PT 3992, 0.24% (Liquidity Facility Wells Fargo & Co.) (c)(f) | 3,495 | | 3,495 |
New York Dorm. Auth. Personal Income Tax Rev. Participating VRDN Series Putters 3698 Z, 0.25% (Liquidity Facility JPMorgan Chase Bank) (c)(f) | 2,225 | | 2,225 |
New York Dorm. Auth. Revs.: | | | |
(Rockefeller Univ. Proj.) Series 2009 B, 0.21% (Liquidity Facility U.S. Bank NA, Minnesota), VRDN (c) | 12,300 | | 12,300 |
Participating VRDN Series EGL 07 0003, 0.25% (Liquidity Facility Citibank NA) (c)(f) | 15,560 | | 15,560 |
New York Envir. Facilities Corp. Clean Wtr. & Drinking Wtr. Participating VRDN Series Putters 3376, 0.25% (Liquidity Facility JPMorgan Chase Bank) (c)(f) | 4,425 | | 4,425 |
New York Envir. Facilities Corp. State Personal Income Tax Rev. Participating VRDN Series Putters 2666, 0.25% (Liquidity Facility JPMorgan Chase Bank) (c)(f) | 3,185 | | 3,185 |
New York Hsg. Fin. Agcy. Rev.: | | | |
(505 West 37th Street Proj.): | | | |
Series 2009 A, 0.25%, LOC Landesbank Hessen-Thuringen, VRDN (c) | 28,000 | | 28,000 |
Series 2009 B, 0.25%, LOC Landesbank Hessen-Thuringen, VRDN (c) | 4,200 | | 4,200 |
(West 37th St. Hsg. Proj.) Series 2009 B, 0.23%, LOC Wells Fargo Bank NA, VRDN (c) | 2,900 | | 2,900 |
New York Hsg. Fin. Svc. Contract Rev. Series 2003 I, 0.26%, LOC Landesbank Hessen-Thuringen, VRDN (c) | 4,900 | | 4,900 |
New York Pwr. Auth.: | | | |
Series 1, 0.34% 10/24/11, CP | 14,950 | | 14,950 |
Series 2, 0.3% 4/6/11, CP | 22,810 | | 22,810 |
New York Urban Dev. Corp. Rev. Participating VRDN Series Putters 2283, 0.28% (Liquidity Facility JPMorgan Chase Bank) (c)(f) | 7,100 | | 7,100 |
| | 179,135 |
Municipal Securities - continued |
| Principal Amount (000s) | | Value (000s) |
New York & New Jersey - 0.2% |
Port Auth. of New York & New Jersey Participating VRDN: | | | |
Series Putters 1546, 0.25% (Liquidity Facility JPMorgan Chase Bank) (c)(f) | $ 1,405 | | $ 1,405 |
Series Solar 06 16, 0.23% (Liquidity Facility U.S. Bank NA, Minnesota) (c)(f) | 8,425 | | 8,425 |
| | 9,830 |
North Carolina - 2.2% |
Charlotte Wtr. & Swr. Sys. Rev. Participating VRDN Series ROC II R 11906, 0.24% (Liquidity Facility Citibank NA) (c)(f) | 2,755 | | 2,755 |
Guilford County Gen. Oblig. Series 2007 B, 0.23% (Liquidity Facility Branch Banking & Trust Co.), VRDN (c) | 2,200 | | 2,200 |
North Carolina Cap. Facilities Fin. Agcy. Edl. Facilities Rev. (Campbell Univ. Proj.) Series 2009, 0.26%, LOC Branch Banking & Trust Co., VRDN (c) | 1,465 | | 1,465 |
North Carolina Cap. Facilities Fin. Agcy. Rev. Participating VRDN: | | | |
Series EGL 06 0139, 0.25% (Liquidity Facility Citibank NA) (c)(f) | 1,900 | | 1,900 |
Series EGL 07 0015, 0.25% (Liquidity Facility Citibank NA) (c)(f) | 10,890 | | 10,890 |
Series EGL 7053004 Class A, 0.25% (Liquidity Facility Citibank NA) (c)(f) | 13,105 | | 13,105 |
North Carolina Cap. Impt. Ltd. Participating VRDN Series BBT 08 52, 0.24% (Liquidity Facility Branch Banking & Trust Co.) (c)(f) | 3,555 | | 3,555 |
North Carolina Med. Care Commission Health Care Facilities Rev.: | | | |
(Friends Homes, Inc. Proj.) Series 2003, 0.25%, LOC Bank of America NA, VRDN (c) | 14,535 | | 14,535 |
(Univ. Health Systems of Eastern Carolina Proj.) Series 2008 A2, 0.22%, LOC Bank of America NA, VRDN (c) | 5,990 | | 5,990 |
(WakeMed Proj.): | | | |
Series 2009 B, 0.24%, LOC Wells Fargo Bank NA, VRDN (c) | 1,000 | | 1,000 |
Series 2009 C, 0.24%, LOC Wells Fargo Bank NA, VRDN (c) | 6,400 | | 6,400 |
North Carolina Med. Care Commission Hosp. Rev. (Iredell Memorial Hosp. Proj.) Series 2007, 0.22%, LOC Wells Fargo Bank NA, VRDN (c) | 12,345 | | 12,345 |
Piedmont Triad Arpt. Auth. Series 2008 A, 0.22%, LOC Branch Banking & Trust Co., VRDN (c) | 7,650 | | 7,650 |
|
| Principal Amount (000s) | | Value (000s) |
Raleigh Combined Enterprise Sys. Rev. Participating VRDN Series EGL 07 0010, 0.25% (Liquidity Facility Citibank NA) (c)(f) | $ 4,950 | | $ 4,950 |
Wake County Gen. Oblig. Series 2003 C, 0.22% (Liquidity Facility Wells Fargo Bank NA), VRDN (c) | 3,440 | | 3,440 |
| | 92,180 |
Ohio - 2.1% |
Akron Bath Copley Hosp. District Rev. (Akron Gen. Health Systems Proj.) Series 2008, 0.23%, LOC JPMorgan Chase Bank, VRDN (c) | 10,000 | | 10,000 |
Columbus Gen. Oblig. Participating VRDN Series Clipper 08 2, 0.25% (Liquidity Facility State Street Bank & Trust Co., Boston) (c)(f) | 11,985 | | 11,985 |
Columbus Swr. Sys. Rev. Participating VRDN Series BBT 08 5, 0.24% (Liquidity Facility Branch Banking & Trust Co.) (c)(f) | 5,235 | | 5,235 |
Hamilton County Hosp. Facilities Rev. (Children's Hosp. Med. Ctr. Proj.) Series 2000, 0.25%, LOC JPMorgan Chase Bank, VRDN (c) | 1,180 | | 1,180 |
Lake County Hosp. Facilities Rev. (Lake Hosp. Sys., Inc. Proj.) Series 2002, 0.35%, LOC JPMorgan Chase Bank, VRDN (c) | 7,200 | | 7,200 |
Lorain County Hosp. Rev. (EMH Reg'l. Med. Ctr. Proj.) Series 2008, 0.25%, LOC JPMorgan Chase Bank, VRDN (c) | 2,800 | | 2,800 |
Ohio Higher Edl. Facility Commission Rev. Bonds (Cleveland Clinic Foundation Proj.): | | | |
Series 2008 B5, 0.32% tender 6/22/11, CP mode | 13,450 | | 13,450 |
Series 2008 B6: | | | |
0.36% tender 6/15/11, CP mode | 9,200 | | 9,200 |
0.37% tender 8/8/11, CP mode | 15,000 | | 15,000 |
Ohio Wtr. Dev. Auth. Poll. Cont. Facilities Rev. (First Energy Nuclear Generation Corp. Proj.) Series 2006 B, 0.22%, LOC Wells Fargo Bank NA, VRDN (c) | 8,845 | | 8,845 |
| | 84,895 |
Oklahoma - 0.1% |
Univ. Hospitals Trust Rev. Series 2005 A, 0.25%, LOC Bank of America NA, VRDN (c) | 4,100 | | 4,100 |
Oregon - 1.2% |
Clackamas County Hosp. Facility Auth. Bonds (Providence Health Sys. Proj.): | | | |
Series 2003 D: | | | |
0.3% tender 6/10/11, CP mode | 12,500 | | 12,500 |
0.34% tender 4/5/11, CP mode | 13,000 | | 13,000 |
Municipal Securities - continued |
| Principal Amount (000s) | | Value (000s) |
Oregon - continued |
Clackamas County Hosp. Facility Auth. Bonds (Providence Health Sys. Proj.): - continued | | | |
Series F, 0.36% tender 7/11/11, CP mode | $ 5,000 | | $ 5,000 |
Oregon Facilities Auth. Rev. (PeaceHealth Proj.) Series 2008 C, 0.22%, LOC Wells Fargo Bank NA, VRDN (c) | 18,500 | | 18,500 |
| | 49,000 |
Pennsylvania - 3.3% |
Allegheny County Higher Ed. Bldg. Auth. Univ. Rev. (Point Park Univ. Proj.) Series 2008 C, 0.24%, LOC PNC Bank NA, VRDN (c) | 6,670 | | 6,670 |
Allegheny County Hosp. Dev. Auth. Rev. (Jefferson Reg'l. Med. Ctr. Proj.) Series 2008 A, 0.24%, LOC PNC Bank NA, VRDN (c) | 1,750 | | 1,750 |
Allegheny County Indl. Dev. Auth. Rev. (Zoological Society of Pittsburgh Proj.) Series 1999 B, 0.24%, LOC PNC Bank NA, VRDN (c) | 2,800 | | 2,800 |
Allegheny County Port Auth. Spl. Rev. Bonds 2% 3/1/12 | 2,760 | | 2,792 |
Clearfield County Indl. Dev. Auth. Rev. (Dubois Area Catholic School Proj.) 0.24%, LOC PNC Bank NA, VRDN (c) | 900 | | 900 |
Haverford Township School District Series 2009, 0.25%, LOC TD Banknorth, NA, VRDN (c) | 965 | | 965 |
Lancaster County Hosp. Auth. Health Ctr. Rev. (Masonic Homes Proj.) Series 2008 D, 0.22%, LOC JPMorgan Chase Bank, VRDN (c) | 2,000 | | 2,000 |
Montgomery County Higher Ed. & Health Auth. Rev. (William Penn Charter School Proj.) Series 2001, 0.24%, LOC PNC Bank NA, VRDN (c) | 5,510 | | 5,510 |
Montgomery County Redev. Auth. Multi-family Hsg. Rev.: | | | |
(Brookside Manor Apts. Proj.) Series 2001 A, 0.25%, LOC Fannie Mae, VRDN (c) | 9,170 | | 9,170 |
(Kingswood Apts. Proj.) Series 2001 A, 0.25%, LOC Fannie Mae, VRDN (c) | 10,725 | | 10,725 |
Pennsylvania Gen. Oblig.: | | | |
Participating VRDN: | | | |
Series ROC II R 11056, 0.25% (Liquidity Facility Citibank NA) (c)(f) | 3,700 | | 3,700 |
Series ROC II R 11505, 0.25% (Liquidity Facility Citibank NA) (c)(f) | 4,510 | | 4,510 |
TAN First Series 2010-2011, 2.5% 6/30/11 | 31,290 | | 31,458 |
|
| Principal Amount (000s) | | Value (000s) |
Pennsylvania Higher Edl. Facilities Auth. Rev.: | | | |
(Keystone College Proj.) Series 2001 H5, 0.24%, LOC PNC Bank NA, VRDN (c) | $ 3,400 | | $ 3,400 |
(King's College Proj.) Series 2002 J3, 0.24%, LOC PNC Bank NA, VRDN (c) | 1,505 | | 1,505 |
Philadelphia Auth. for Indl. Dev. Rev. (The Franklin Institute Proj.) Series 2006, 0.25%, LOC Bank of America NA, VRDN (c) | 9,495 | | 9,495 |
Philadelphia Gas Works Rev. (1998 Gen. Ordinance Proj.): | | | |
Eighth Series B, 0.22%, LOC Wells Fargo Bank NA, VRDN (c) | 6,900 | | 6,900 |
Eighth Series E, 0.23%, LOC JPMorgan Chase Bank, VRDN (c) | 7,000 | | 7,000 |
Somerset County Gen. Oblig. Series 2009 A, 0.24%, LOC PNC Bank NA, VRDN (c) | 3,445 | | 3,445 |
South Fork Muni. Auth. Hosp. Rev. (Conemaugh Health Ctr. Proj.) Series A, 0.25%, LOC PNC Bank NA, VRDN (c) | 7,195 | | 7,195 |
Washington County Auth. Rev. 0.21%, VRDN (c) | 5,165 | | 5,165 |
Westmoreland County Indl. Dev. Auth. Rev. (Excela Health Proj.) Series 2010 B, 0.24%, LOC PNC Bank NA, VRDN (c) | 5,290 | | 5,290 |
Wilkes Barre Gen. Oblig. Series 2004 B, 0.24%, LOC PNC Bank NA, VRDN (c) | 2,845 | | 2,845 |
| | 135,190 |
Rhode Island - 0.6% |
Rhode Island Health and Edl. Bldg. Corp. Higher Ed. Facility Rev. (Roger Williams Univ. Proj.) Series 2008 B, 0.26%, LOC Bank of America NA, VRDN (c) | 23,700 | | 23,700 |
South Carolina - 1.5% |
Charleston County Hosp. Facilities (Care Alliance Health Svcs. Proj.) Series 2004 B2, 0.22%, LOC Wells Fargo Bank NA, VRDN (c) | 4,500 | | 4,500 |
Horry County School District Participating VRDN Series ROC II R 754 PB, 0.29% (Liquidity Facility Deutsche Postbank AG) (c)(f) | 5,545 | | 5,545 |
South Carolina Edl. Facilities Auth. for Private Nonprofit Institutions of Higher Learning Edl. Facilities Rev.: | | | |
(Claflin Univ. Proj.) 0.28%, LOC Bank of America NA, VRDN (c) | 8,269 | | 8,269 |
(Converse College Proj.) Series 2009, 0.24%, LOC Wells Fargo Bank NA, VRDN (c) | 2,000 | | 2,000 |
Municipal Securities - continued |
| Principal Amount (000s) | | Value (000s) |
South Carolina - continued |
South Carolina Edl. Facilities Auth. for Private Nonprofit Institutions of Higher Learning Edl. Facilities Rev.: - continued | | | |
(Newberry College Proj.) Series 2008, 0.26%, LOC Branch Banking & Trust Co., VRDN (c) | $ 12,490 | | $ 12,490 |
South Carolina Jobs-Econ. Dev. Auth. (The Reg'l. Med. Ctr. of Orangeburg and Calhoun Counties Proj.) Series 2009, 0.26%, LOC Branch Banking & Trust Co., VRDN (c) | 2,565 | | 2,565 |
South Carolina Pub. Svc. Auth. Rev.: | | | |
Bonds Series 2002 D, 5.25% 1/1/12 | 1,000 | | 1,036 |
Participating VRDN Series ROC II R 11426, 0.26% (Liquidity Facility Citibank NA) (c)(f) | 12,645 | | 12,645 |
Series 2010 A: | | | |
0.3% 5/16/11, CP | 3,890 | | 3,890 |
0.3% 6/7/11, CP | 6,100 | | 6,100 |
South Carolina Trans. Infrastructure Bank Rev. Series 2003 B3, 0.23%, LOC Wells Fargo Bank NA, VRDN (c) | 1,500 | | 1,500 |
| | 60,540 |
South Dakota - 0.2% |
South Dakota Hsg. Dev. Auth. Series 2009 C, 0.23% (Liquidity Facility Fed. Home Ln. Bank-Des Moines), VRDN (c) | 9,000 | | 9,000 |
Tennessee - 3.4% |
Blount County Pub. Bldg. Auth.: | | | |
(Local Govt. Pub. Impt. Proj.): | | | |
Series 2009 E8A, 0.26%, LOC Branch Banking & Trust Co., VRDN (c) | 1,400 | | 1,400 |
Series 2009 E9A, 0.26%, LOC Branch Banking & Trust Co., VRDN (c) | 8,335 | | 8,335 |
Series E7A, 0.26%, LOC Branch Banking & Trust Co., VRDN (c) | 5,335 | | 5,335 |
Clarksville Pub. Bldg. Auth. Rev. (Tennessee Muni. Bond Fund Proj.) Series 1994, 0.3%, LOC Bank of America NA, VRDN (c) | 6,255 | | 6,255 |
Memphis Health, Edl. & Hsg. Facilities Board (Watergrove Apts. Proj.) Series 2004, 0.25%, LOC Freddie Mac, VRDN (c) | 18,170 | | 18,170 |
Metropolitan Govt. Nashville & Davidson County Indl. Dev. Board Rev. (Nashville Symphony Hall Proj.) Series 2004, 0.28%, LOC Bank of America NA, VRDN (c) | 45,915 | | 45,915 |
Montgomery County Pub. Bldg. Auth. Pooled Fing. Rev. (Tennessee County Ln. Pool Prog.) Series 1999, 0.28%, LOC Bank of America NA, VRDN (c) | 9,540 | | 9,540 |
|
| Principal Amount (000s) | | Value (000s) |
Nashville and Davidson County Metropolitan Govt. Gen. Oblig. Participating VRDN Series Clipper 06 4, 0.28% (Liquidity Facility State Street Bank & Trust Co., Boston) (c)(f) | $ 5,000 | | $ 5,000 |
Shelby County Gen. Oblig. Series 2004 B, 0.28% (Liquidity Facility Landesbank Hessen-Thuringen), VRDN (c) | 37,875 | | 37,875 |
| | 137,825 |
Texas - 13.6% |
Alamo Cmnty. College District Participating VRDN Series Solar 06 42, 0.24% (Liquidity Facility U.S. Bank NA, Minnesota) (c)(f) | 10,235 | | 10,235 |
Austin Elec. Util. Sys. Rev.: | | | |
Participating VRDN Series Solar 06 91, 0.24% (Liquidity Facility U.S. Bank NA, Minnesota) (c)(f) | 10,180 | | 10,180 |
Series A, 0.3% 5/3/11, LOC JPMorgan Chase Bank, LOC State Street Bank & Trust Co., Boston, CP | 11,000 | | 11,000 |
Beaumont Independent School District Participating VRDN Series Putters 3225, 0.28% (Liquidity Facility JPMorgan Chase Bank) (c)(f) | 11,115 | | 11,115 |
Brownsville Util. Sys. Rev. Series A, 0.3% 6/15/11, LOC State Street Bank & Trust Co., Boston, CP | 7,500 | | 7,500 |
Dallas Area Rapid Transit Sales Tax Rev. Participating VRDN Series MS 06 1654, 0.34% (Liquidity Facility Bayerische Hypo-und Vereinsbank AG) (c)(f) | 23,045 | | 23,045 |
Dallas Wtr. & Swr. Sys. Rev.: | | | |
Participating VRDN Series Solar 06 60, 0.24% (Liquidity Facility U.S. Bank NA, Minnesota) (c)(f) | 19,220 | | 19,220 |
Series C: | | | |
0.33% 7/21/11, CP | 8,500 | | 8,500 |
0.34% 5/4/11, CP | 2,500 | | 2,500 |
Dallas Wtrwks. & Swr. Sys. Rev. Participating VRDN: | | | |
Series Putters 3227, 0.25% (Liquidity Facility JPMorgan Chase Bank) (c)(f) | 15,005 | | 15,005 |
Series Putters 3742, 0.25% (Liquidity Facility JPMorgan Chase Bank) (c)(f) | 5,000 | | 5,000 |
Denton Independent School District Participating VRDN Series DB 513, 0.25% (Liquidity Facility Deutsche Bank AG) (c)(f) | 31,200 | | 31,200 |
Forney Independent School District Participating VRDN Series ROC II R 11729, 0.26% (Liquidity Facility Citibank NA) (c)(f) | 3,350 | | 3,350 |
Friendswood Independent School District Participating VRDN Series Putters 3221, 0.28% (Liquidity Facility JPMorgan Chase Bank) (c)(f) | 8,185 | | 8,185 |
Municipal Securities - continued |
| Principal Amount (000s) | | Value (000s) |
Texas - continued |
Goose Creek Consolidated Independent School District Participating VRDN Series PZ 219, 0.28% (Liquidity Facility Wells Fargo & Co.) (c)(f) | $ 10,385 | | $ 10,385 |
Gulf Coast Waste Disp. Auth. Envir. Facilities Rev. (Air Products Proj.) Series 2004, 0.33% (Air Products & Chemicals, Inc. Guaranteed), VRDN (c) | 5,000 | | 5,000 |
Harris County Gen. Oblig.: | | | |
Participating VRDN: | | | |
Series Clipper 07 46, 0.28% (Liquidity Facility State Street Bank & Trust Co., Boston) (c)(f) | 40,000 | | 40,000 |
Series ROC II R 718 PB, 0.29% (Liquidity Facility Deutsche Postbank AG) (c)(f) | 9,725 | | 9,725 |
Series A1, 0.32% 8/18/11 (Liquidity Facility State Street Bank & Trust Co., Boston), CP | 6,550 | | 6,550 |
Harris County Metropolitan Trans. Auth.: | | | |
Series A1: | | | |
0.31% 6/7/11 (Liquidity Facility JPMorgan Chase Bank), CP | 11,700 | | 11,700 |
0.32% 4/7/11 (Liquidity Facility JPMorgan Chase Bank), CP | 17,350 | | 17,350 |
Series A3, 0.29% 5/5/11 (Liquidity Facility State Street Bank & Trust Co., Boston), CP | 5,000 | | 5,000 |
Harris County Tex Indl. Dev. Corp. (HFOTCO LLC Proj.) Series 2010, 0.25%, LOC Bank of America NA, VRDN (c) | 6,000 | | 6,000 |
Houston Higher Ed. Fin. Corp. Higher Ed. Rev. Series A, 0.31% 4/7/11, CP | 5,000 | | 5,000 |
Houston Util. Sys. Rev.: | | | |
Bonds Series 2010 C, 2% 11/15/11 | 2,000 | | 2,019 |
Participating VRDN: | | | |
Series ROC II R 11411, 0.25% (Liquidity Facility Citibank NA) (c)(f) | 10,000 | | 10,000 |
Series ROC II R 11885X, 0.25% (Liquidity Facility Citibank NA) (c)(f) | 5,180 | | 5,180 |
Series B1: | | | |
0.3% 6/7/11, LOC JPMorgan Chase Bank, CP | 5,000 | | 5,000 |
0.31% 6/7/11, LOC JPMorgan Chase Bank, CP | 15,905 | | 15,905 |
Series B2, 0.31% 5/6/11, LOC Wells Fargo Bank NA, San Francisco, CP | 3,250 | | 3,250 |
Series B4, 0.32% 6/7/11, LOC Barclays Bank PLC, CP | 3,000 | | 3,000 |
Judson Independent School District Participating VRDN Series DB 423, 0.28% (Liquidity Facility Deutsche Bank AG) (c)(f) | 12,745 | | 12,745 |
|
| Principal Amount (000s) | | Value (000s) |
North Central Texas Health Facilities Dev. Corp. Bonds Series WF 09 33C, 0.38%, tender 8/18/11 (Liquidity Facility Wells Fargo & Co.) (c)(f)(g) | $ 7,200 | | $ 7,200 |
North East Texas Independent School District Participating VRDN Series PT 3951, 0.25% (Liquidity Facility Bayerische Hypo-und Vereinsbank AG) (c)(f) | 14,280 | | 14,280 |
North Texas Muni. Wtr. District Wtr. Sys. Rev. Participating VRDN: | | | |
Series BA 08 1174, 0.32% (Liquidity Facility Bank of America NA) (c)(f) | 5,460 | | 5,460 |
Series ROC II R 593 PB, 0.29% (Liquidity Facility Deutsche Postbank AG) (c)(f) | 16,825 | | 16,825 |
Red River Ed. Fin. Corp. Ed. Rev. (Texas Christian Univ. Proj.) 0.23%, VRDN (c) | 26,000 | | 26,000 |
San Antonio Elec. & Gas Sys. Rev.: | | | |
Participating VRDN: | | | |
Series BBT 08 26, 0.24% (Liquidity Facility Branch Banking & Trust Co.) (c)(f) | 5,335 | | 5,335 |
Series Putters 3688Z, 0.25% (Liquidity Facility JPMorgan Chase Bank) (c)(f) | 4,605 | | 4,605 |
Series A: | | | |
0.33% 4/6/11, CP | 8,700 | | 8,700 |
0.34% 4/6/11, CP | 5,000 | | 5,000 |
San Antonio Hotel Occupancy Tax Rev. Series 2008, 0.25%, LOC Wells Fargo Bank NA, VRDN (c) | 1,000 | | 1,000 |
San Antonio Wtr. Sys. Rev.: | | | |
Participating VRDN Series EGL 06 5, 0.25% (Liquidity Facility Citibank NA) (c)(f) | 3,000 | | 3,000 |
Series 2001A, 0.27% 4/14/11, CP | 9,000 | | 9,000 |
Sherman Higher Ed. Fin. Corp. (Austin College Proj.) Series 1997, 0.28%, LOC Bank of America NA, VRDN (c) | 12,900 | | 12,900 |
Spring Branch Independent School District Participating VRDN Series Putters 3377, 0.25% (Liquidity Facility JPMorgan Chase Bank) (c)(f) | 1,500 | | 1,500 |
Spring Independent School District Participating VRDN Series DB 603, 0.25% (Liquidity Facility Deutsche Bank AG) (c)(f) | 3,800 | | 3,800 |
Tarrant County Cultural Ed. Facilities Fin. Corp. Hosp. Rev. (Methodist Hospitals of Dallas Proj.) Series 2008, 0.25%, LOC JPMorgan Chase Bank, VRDN (c) | 1,100 | | 1,100 |
Tarrant County Health Facilities Dev. Corp. Rev. (Carter Blood Care Proj.) Series 1998, 0.25%, LOC JPMorgan Chase Bank, VRDN (c) | 7,140 | | 7,140 |
Municipal Securities - continued |
| Principal Amount (000s) | | Value (000s) |
Texas - continued |
Texas A&M Univ. Rev.: | | | |
Participating VRDN: | | | |
Series BC 10 39W, 0.26% (Liquidity Facility Barclays Bank PLC) (c)(f) | $ 1,580 | | $ 1,580 |
Series ROC II R 11804, 0.25% (Liquidity Facility Citibank NA) (c)(f) | 4,010 | | 4,010 |
0.25% (Liquidity Facility Wells Fargo Bank NA) (a)(c)(f) | 4,575 | | 4,575 |
Series 1993 B, 0.31% 8/8/11, CP | 5,025 | | 5,025 |
Texas Gen. Oblig. Participating VRDN: | | | |
Series Putters 3480, 0.25% (Liquidity Facility JPMorgan Chase Bank) (c)(f) | 7,495 | | 7,495 |
Series Solar 06 57, 0.24% (Liquidity Facility U.S. Bank NA, Minnesota) (c)(f) | 10,185 | | 10,185 |
Texas Pub. Fin. Auth. Series 2002 A, 0.29% 4/6/11, CP | 5,000 | | 5,000 |
Texas Pub. Fin. Auth. Rev.: | | | |
Bonds Series 2010 A, 2% 7/1/11 | 10,800 | | 10,846 |
Series 2003, 0.32% 8/4/11, CP | 4,000 | | 4,000 |
0.3% 4/8/11, CP | 7,850 | | 7,850 |
Univ. of Texas Board of Regents Sys. Rev.: | | | |
Bonds Series B, 5.25% 8/15/11 | 2,700 | | 2,750 |
Participating VRDN Series ROC II R 11077, 0.24% (Liquidity Facility Citibank NA) (c)(f) | 9,010 | | 9,010 |
Series 2002 A, 0.3% 9/8/11 (Liquidity Facility Univ. of Texas Invt. Mgmt. Co.), CP | 5,750 | | 5,750 |
Upper Trinity Reg'l. Wtr. District Series A: | | | |
0.32% 4/7/11, LOC Bank of America NA, CP | 8,000 | | 8,000 |
0.35% 4/13/11, LOC Bank of America NA, CP | 2,000 | | 2,000 |
| | 560,765 |
Utah - 2.1% |
Carbon County Poll. Cont. Rev. (PacifiCorp Proj.) Series 1994, 0.23%, LOC Wells Fargo Bank NA, VRDN (c) | 3,800 | | 3,800 |
Emery County Poll. Cont. Rev. (PacifiCorp Proj.) Series 1994, 0.25%, LOC Wells Fargo Bank NA, VRDN (c) | 6,490 | | 6,490 |
Intermountain Pwr. Agcy. Pwr. Supply Rev.: | | | |
Series 1997 B1, 0.3% 6/17/11 (Liquidity Facility Bank of Nova Scotia), CP | 6,535 | | 6,535 |
Series 1997 B2, 0.32% 6/9/11 (Liquidity Facility Bank of Nova Scotia), CP | 18,490 | | 18,490 |
Series 1997 B3, 0.3% 6/17/11 (Liquidity Facility JPMorgan Chase Bank), CP | 3,700 | | 3,700 |
|
| Principal Amount (000s) | | Value (000s) |
Series 1998 B4, 0.3% 6/16/11 (Liquidity Facility JPMorgan Chase Bank), CP | $ 9,760 | | $ 9,760 |
Riverton Hosp. Rev. Participating VRDN: | | | |
Series Putters 1762, 0.25% (Liquidity Facility JPMorgan Chase & Co.) (c)(f) | 19,000 | | 19,000 |
Series WF 11 35C, 0.25% (Liquidity Facility Wells Fargo Bank NA) (c)(f) | 5,530 | | 5,530 |
Utah State Board of Regents Rev. Participating VRDN Series Solar 06 140, 0.24% (Liquidity Facility U.S. Bank NA, Minnesota) (c)(f) | 4,800 | | 4,800 |
Utah Wtr. Fin. Agcy. Rev. Series B3, 0.27% (Liquidity Facility Landesbank Hessen-Thuringen), VRDN (c) | 7,100 | | 7,100 |
| | 85,205 |
Virginia - 1.4% |
Fairfax County Econ. Dev. Auth. Student Hsg. Rev. (George Mason Univ. Foundation, Inc., Proj.) 0.25%, LOC Bank of America NA, VRDN (c) | 8,500 | | 8,500 |
Fairfax County Gen. Oblig. Bonds Series 2008 A, 4% 4/1/11 | 1,675 | | 1,675 |
Lexington Indl. Dev. Auth. Edl. Facilities Rev. Series 2010, 0.22%, VRDN (c) | 2,955 | | 2,955 |
Newport News Indl. Dev. Auth. (CNU Warwick LLC Student Apts. Proj.) 0.28%, LOC Bank of America NA, VRDN (c) | 7,635 | | 7,635 |
Norfolk BAN Series 2010 C, 1.5% 4/1/11 | 4,900 | | 4,900 |
Norfolk Econ. Dev. Auth. Rev. Series 1997, 0.32% 8/18/11, CP | 15,000 | | 15,000 |
Univ. of Virginia Gen. Rev. Participating VRDN Series BBT 08 30, 0.24% (Liquidity Facility Branch Banking & Trust Co.) (c)(f) | 7,520 | | 7,520 |
Virginia College Bldg. Auth. Edl. Facilities Rev. Bonds 4% 2/1/12 | 2,000 | | 2,060 |
Virginia Resources Auth. Clean Wtr. Rev. Bonds Series 2010 A, 1% 4/1/11 | 6,680 | | 6,680 |
| | 56,925 |
Washington - 5.6% |
Central Puget Sound Reg'l. Trans. Auth. Sales & Use Tax Rev. Participating VRDN: | | | |
Series BBT 08 34, 0.24% (Liquidity Facility Branch Banking & Trust Co.) (c)(f) | 3,055 | | 3,055 |
Series Putters 2866, 0.25% (Liquidity Facility JPMorgan Chase Bank) (c)(f) | 7,280 | | 7,280 |
Energy Northwest Elec. Rev. Bonds (#1 Proj.) Series 2006 A, 5% 7/1/11 | 5,000 | | 5,059 |
Everett Gen. Oblig. Series 2001, 0.26%, LOC Bank of America NA, VRDN (c) | 4,600 | | 4,600 |
Municipal Securities - continued |
| Principal Amount (000s) | | Value (000s) |
Washington - continued |
King County Gen. Oblig. Participating VRDN Series BC 10 66W, 0.26% (Liquidity Facility Barclays Bank PLC) (c)(f) | $ 2,500 | | $ 2,500 |
NJB Properties Lease Rev. Participating VRDN Series Solar 07 106, 0.24% (Liquidity Facility U.S. Bank NA, Minnesota) (c)(f) | 3,360 | | 3,360 |
Pierce County Econ. Dev. Corp. Spl. Rev. (Weyerhaeuser Real Estate Proj.) Series 1997 A, 0.26%, LOC Bank of America NA, VRDN (c) | 4,400 | | 4,400 |
Port Bellingham Indl. Dev. Corp. Envir. Facilities Indl. Rev. Bonds (BP West Coast Products LLC Proj.) 0.32% tender 6/17/11 (BP PLC Guaranteed), CP mode | 1,500 | | 1,500 |
Port of Vancouver Rev. (United Grain Corp. of Oregon Proj.) Series 2009, 0.26%, LOC Bank of America NA, VRDN (c) | 19,000 | | 19,000 |
Seattle Gen. Oblig. Participating VRDN Series SGA 03 142, 0.25% (Liquidity Facility Societe Generale) (c)(f) | 5,000 | | 5,000 |
Snohomish County Hsg. Auth. Hsg. Rev. (Ebey Arms Centerhouse Proj.) Series 2003, 0.26%, LOC Bank of America NA, VRDN (c) | 8,360 | | 8,360 |
Univ. of Washington Univ. Revs. Participating VRDN: | | | |
Series Solar 07 75, 0.24% (Liquidity Facility U.S. Bank NA, Minnesota) (c)(f) | 38,350 | | 38,350 |
Series Solar 07 94, 0.24% (Liquidity Facility U.S. Bank NA, Minnesota) (c)(f) | 18,304 | | 18,304 |
Washington Econ. Dev. Fin. Auth. Econ. Dev. Rev. (Puget Sound Blood Ctr. Proj.) Series 2008 D, 0.24%, LOC Wells Fargo Bank NA, VRDN (c) | 7,395 | | 7,395 |
Washington Gen. Oblig. Participating VRDN: | | | |
Series Clipper 05 39, 0.3% (Liquidity Facility State Street Bank & Trust Co., Boston) (c)(f) | 37,230 | | 37,230 |
Series GS 06 7T, 0.25% (Liquidity Facility Wells Fargo & Co.) (c)(f) | 23,785 | | 23,785 |
Series Putters 3054, 0.25% (Liquidity Facility JPMorgan Chase Bank) (c)(f) | 3,035 | | 3,035 |
Series Putters 3539, 0.25% (Liquidity Facility JPMorgan Chase Bank) (c)(f) | 4,330 | | 4,330 |
Washington Health Care Facilities Auth. Rev.: | | | |
(Children's Hosp. Reg'l. Med. Ctr. Proj.) Series 2008 A, 0.28%, LOC Bank of America NA, VRDN (c) | 17,235 | | 17,235 |
|
| Principal Amount (000s) | | Value (000s) |
(MultiCare Health Sys. Proj.) Series 2009 B, 0.22%, LOC Wells Fargo Bank NA, VRDN (c) | $ 1,650 | | $ 1,650 |
(Southwest Washington Med. Ctr.) Series 2008 A, 0.29%, LOC Union Bank of California, VRDN (c) | 5,600 | | 5,600 |
Participating VRDN Series Putters 3403V, 0.25% (Liquidity Facility JPMorgan Chase Bank) (c)(f) | 7,995 | | 7,995 |
| | 229,023 |
Wisconsin - 2.2% |
Appleton Redev. Auth. Rev. (Fox Cities Performing Arts Ctr. Proj.) Series 2001 B, 0.25%, LOC JPMorgan Chase Bank, VRDN (c) | 18,300 | | 18,300 |
Wisconsin Ctr. District Tax Rev. Series 2001 A, 0.25%, LOC U.S. Bank NA, Minnesota, VRDN (c) | 2,000 | | 2,000 |
Wisconsin Gen. Oblig.: | | | |
Participating VRDN Series BC 11 12B, 0.26% (Liquidity Facility Barclays Bank PLC) (a)(c)(f) | 4,600 | | 4,600 |
Series 2006 A, 0.31% 8/15/11 (Liquidity Facility State Street Bank & Trust Co., Boston) (Liquidity Facility California Teachers Retirement Sys.), CP | 4,000 | | 4,000 |
Wisconsin Health & Edl. Facilities Auth. Rev.: | | | |
(Wausau Hosp., Inc. Proj.) Series 2000, 0.25%, LOC JPMorgan Chase Bank, VRDN (c) | 1,200 | | 1,200 |
Bonds: | | | |
(Alexian Brothers Health Sys. Proj.) 0.35% tender 7/8/11, LOC JPMorgan Chase Bank, CP mode | 5,700 | | 5,700 |
(Ministry Health Care Proj.) 0.3% tender 6/10/11, LOC U.S. Bank NA, Minnesota, CP mode | 11,500 | | 11,500 |
Wisconsin Hsg. and Econ. Dev. Auth. Multifamily Hsg. Rev. Series 2006 A, 0.26% (Liquidity Facility Fannie Mae) (Liquidity Facility Freddie Mac), VRDN (c) | 5,005 | | 5,005 |
Wisconsin Trans. Rev.: | | | |
Series 1997 A, 0.31% 4/7/11 (Liquidity Facility State Street Bank & Trust Co., Boston) (Liquidity Facility California Teachers Retirement Sys.), CP | 18,000 | | 18,000 |
Series 2006 A: | | | |
0.31% 8/17/11 (Liquidity Facility State Street Bank & Trust Co., Boston) (Liquidity Facility California Teachers Retirement Sys.), CP | 1,500 | | 1,500 |
Municipal Securities - continued |
| Principal Amount (000s) | | Value (000s) |
Wisconsin - continued |
Wisconsin Trans. Rev.: - continued | | | |
0.34% 9/8/11 (Liquidity Facility State Street Bank & Trust Co., Boston) (Liquidity Facility California Teachers Retirement Sys.), CP | $ 3,371 | | $ 3,371 |
0.3% 4/8/11 (Liquidity Facility State Street Bank & Trust Co., Boston) (Liquidity Facility California Teachers Retirement Sys.), CP | 16,474 | | 16,474 |
| | 91,650 |
| Shares | | |
Other - 8.7% |
Fidelity Tax-Free Cash Central Fund, 0.21% (d)(e) | 357,088 | | 357,088 |
TOTAL INVESTMENT PORTFOLIO - 100.2% (Cost $4,115,871) | | 4,115,871 |
NET OTHER ASSETS (LIABILITIES) - (0.2)% | | (8,226) |
NET ASSETS - 100% | $ 4,107,645 |
Security Type Abbreviations |
BAN BOND ANTICIPATION NOTE |
CP COMMERCIAL PAPER |
RAN REVENUE ANTICIPATION NOTE |
TAN TAX ANTICIPATION NOTE |
TRAN TAX AND REVENUE ANTICIPATION N |
VRDN VARIABLE RATE DEMAND NOTE (A debt instrument that is payable upon demand, either daily, weekly or monthly) |
Legend |
(a) Security exempt from registration under Rule 144A of the Securities Act of 1933. These securities may be resold in transactions exempt from registration, normally to qualified institutional buyers. At the end of the period, the value of these securities amounted to $9,175,000 or 0.2% of net assets. |
(b) Security or a portion of the security purchased on a delayed delivery or when-issued basis. |
(c) Coupon rates for floating and adjustable rate securities reflect the rates in effect at period end. |
(d) Information in this report regarding holdings by state and security types does not reflect the holdings of the Fidelity Tax-Free Cash Central Fund. |
(e) Affiliated fund that is available only to investment companies and other accounts managed by Fidelity Investments. The rate quoted is the annualized seven-day yield of the fund at period end. A complete unaudited listing of the fund's holdings as of its most recent quarter end is available upon request. In addition, each Fidelity Central Fund's financial statements, which are not covered by the Fund's Report of Independent Registered Public Accounting Firm, are available on the SEC's website or upon request. |
(f) Provides evidence of ownership in one or more underlying municipal bonds. |
(g) Restricted securities - Investment in securities not registered under the Securities Act of 1933 (excluding 144A issues). At the end of the period, the value of restricted securities (excluding 144A issues) amounted to $27,200,000 or 0.7% of net assets. |
Additional information on each restricted holding is as follows: |
Security | Acquisition Date | Cost (000s) |
New Jersey Gen. Oblig. Bonds Series Putters 3850, 0.3%, tender 5/12/11 (Liquidity Facility JPMorgan Chase & Co.) | 12/6/10 | $ 20,000 |
North Central Texas Health Facilities Dev. Corp. Bonds Series WF 09 33C, 0.38%, tender 8/18/11 (Liquidity Facility Wells Fargo & Co.) | 5/26/10 | $ 7,200 |
Affiliated Central Funds |
Information regarding fiscal year to date income earned by the Fund from investments in Fidelity Central Funds is as follows: |
Fund | Income earned (Amounts in thousands) |
Fidelity Tax-Free Cash Central Fund | $ 733 |
Other Information |
The date shown for securities represents the date when principal payments must be paid, taking into account any call options exercised by the issuer and any permissible maturity shortening features other than interest rate resets. |
All investments are categorized as Level 2 under the Fair Value Hierarchy. The inputs or methodology used for valuing securities may not be an indication of the risk associated with investing in those securities. For more information on valuation inputs, please refer to the Security Valuation section in the accompanying Notes to Financial Statements. |
See accompanying notes which are an integral part of the financial statements.
Annual Report
Tax-Exempt Portfolio
Financial Statements
Statement of Assets and Liabilities
Amounts in thousands (except per-share amounts) | March 31, 2011 |
| | |
Assets | | |
Investment in securities, at value - See accompanying schedule: Unaffiliated issuers (cost $3,758,783) | $ 3,758,783 | |
Fidelity Central Funds (cost $357,088) | 357,088 | |
Total Investments (cost $4,115,871) | | $ 4,115,871 |
Cash | | 636 |
Receivable for fund shares sold | | 1,535 |
Interest receivable | | 3,986 |
Distributions receivable from Fidelity Central Funds | | 56 |
Prepaid expenses | | 7 |
Receivable from investment adviser for expense reductions | | 2 |
Other receivables | | 38 |
Total assets | | 4,122,131 |
| | |
Liabilities | | |
Payable for investments purchased on a delayed delivery basis | $ 11,329 | |
Payable for fund shares redeemed | 1,746 | |
Distributions payable | 84 | |
Accrued management fee | 488 | |
Distribution and service plan fees payable | 15 | |
Other affiliated payables | 740 | |
Other payables and accrued expenses | 84 | |
Total liabilities | | 14,486 |
| | |
Net Assets | | $ 4,107,645 |
Net Assets consist of: | | |
Paid in capital | | $ 4,107,510 |
Accumulated undistributed net realized gain (loss) on investments | | 135 |
Net Assets | | $ 4,107,645 |
| | |
Class I:
Net Asset Value, offering price and redemption price per share ($3,813,949 ÷ 3,811,597 shares) | | $ 1.00 |
| | |
Class II:
Net Asset Value, offering price and redemption price per share ($21,913 ÷ 21,902 shares) | | $ 1.00 |
| | |
Class III:
Net Asset Value, offering price and redemption price per share ($198,430 ÷ 198,293 shares) | | $ 1.00 |
| | |
Select Class:
Net Asset Value, offering price and redemption price per share ($73,353 ÷ 73,294 shares) | | $ 1.00 |
Statement of Operations
Amounts in thousands | Year ended March 31, 2011 |
| | |
Investment Income | | |
Interest | | $ 13,350 |
Income from Fidelity Central Funds | | 733 |
Total income | | 14,083 |
| | |
Expenses | | |
Management fee | $ 6,484 | |
Transfer agent fees | 2,798 | |
Distribution and service plan fees | 572 | |
Accounting fees and expenses | 400 | |
Custodian fees and expenses | 82 | |
Independent trustees' compensation | 18 | |
Registration fees | 109 | |
Audit | 44 | |
Legal | 14 | |
Miscellaneous | 46 | |
Total expenses before reductions | 10,567 | |
Expense reductions | (387) | 10,180 |
Net investment income (loss) | | 3,903 |
Realized and Unrealized Gain (Loss) Net realized gain (loss) on: | | |
Investment securities: | | |
Unaffiliated issuers | | 40 |
Net increase in net assets resulting from operations | | $ 3,943 |
See accompanying notes which are an integral part of the financial statements.
Annual Report
Tax-Exempt Portfolio
Financial Statements - continued
Statement of Changes in Net Assets
Amounts in thousands | Year ended
March 31,
2011 | Year ended
March 31,
2010 |
Increase (Decrease) in Net Assets | | |
Operations | | |
Net investment income (loss) | $ 3,903 | $ 10,154 |
Net realized gain (loss) | 40 | 668 |
Net increase in net assets resulting from operations | 3,943 | 10,822 |
Distributions to shareholders from net investment income | (3,906) | (10,152) |
Distributions to shareholders from net realized gain | (147) | (78) |
Total distributions | (4,053) | (10,230) |
Share transactions - net increase (decrease) | (971,972) | (3,033,794) |
Total increase (decrease) in net assets | (972,082) | (3,033,202) |
| | |
Net Assets | | |
Beginning of period | 5,079,727 | 8,112,929 |
End of period | $ 4,107,645 | $ 5,079,727 |
Financial Highlights - Class I
Years ended March 31, | 2011 | 2010 | 2009 | 2008 | 2007 |
Selected Per-Share Data | | | | | |
Net asset value, beginning of period | $ 1.00 | $ 1.00 | $ 1.00 | $ 1.00 | $ 1.00 |
Income from Investment Operations | | | | | |
Net investment income (loss) | .001 | .001 | .015 | .033 | .034 |
Net realized and unrealized gain (loss) D | - | - | - | - | - |
Total from investment operations | .001 | .001 | .015 | .033 | .034 |
Distributions from net investment income | (.001) | (.001) | (.015) | (.033) | (.034) |
Distribution from net realized gain | - D | - D | - D | - D | - |
Total distributions | (.001) | (.001) | (.015) | (.033) | (.034) |
Net asset value, end of period | $ 1.00 | $ 1.00 | $ 1.00 | $ 1.00 | $ 1.00 |
Total Return A | .09% | .15% | 1.50% | 3.33% | 3.44% |
Ratios to Average Net Assets B,C | | | | | |
Expenses before reductions | .22% | .25% | .24% | .23% | .23% |
Expenses net of fee waivers, if any | .22% | .23% | .22% | .20% | .20% |
Expenses net of all reductions | .22% | .23% | .20% | .17% | .18% |
Net investment income (loss) | .09% | .16% | 1.55% | 3.27% | 3.39% |
Supplemental Data | | | | | |
Net assets, end of period (in millions) | $ 3,814 | $ 4,828 | $ 7,738 | $ 10,463 | $ 8,976 |
A Total returns would have been lower had certain expenses not been reduced during the periods shown.
B Fees and expenses of the underlying Fidelity Central Funds are not included in the Fund's expense ratio. The Fund indirectly bears its proportionate share of the expenses of any underlying Fidelity Central Funds.
C Expense ratios reflect operating expenses of the class. Expenses before reductions do not reflect amounts reimbursed or waived or reductions from expense offset arrangements and do not represent the amount paid by the class during periods when reimbursements, waivers or reductions occur. Expenses net of fee waivers reflect expenses after reimbursement and waivers but prior to reductions from expense offset arrangements. Expenses net of all reductions represent the net expenses paid by the class.
D Amount represents less than $.001 per share.
See accompanying notes which are an integral part of the financial statements.
Annual Report
Financial Highlights - Class II
Years ended March 31, | 2011 | 2010 | 2009 | 2008 | 2007 |
Selected Per-Share Data | | | | | |
Net asset value, beginning of period | $ 1.00 | $ 1.00 | $ 1.00 | $ 1.00 | $ 1.00 |
Income from Investment Operations | | | | | |
Net investment income (loss) | - D | .001 | .013 | .031 | .032 |
Net realized and unrealized gain (loss) D | - | - | - | - | - |
Total from investment operations | - D | .001 | .013 | .031 | .032 |
Distributions from net investment income | - D | (.001) | (.013) | (.031) | (.032) |
Distributions from net realized gain | - D | - D | - D | - D | - |
Total distributions | - D | (.001) | (.013) | (.031) | (.032) |
Net asset value, end of period | $ 1.00 | $ 1.00 | $ 1.00 | $ 1.00 | $ 1.00 |
Total Return A | .01% | .05% | 1.35% | 3.18% | 3.29% |
Ratios to Average Net Assets B,C | | | | | |
Expenses before reductions | .37% | .40% | .39% | .38% | .38% |
Expenses net of fee waivers, if any | .29% | .34% | .37% | .35% | .35% |
Expenses net of all reductions | .29% | .34% | .35% | .32% | .32% |
Net investment income (loss) | .01% | .06% | 1.40% | 3.12% | 3.24% |
Supplemental Data | | | | | |
Net assets, end of period (in millions) | $ 22 | $ 26 | $ 54 | $ 111 | $ 116 |
A Total returns would have been lower had certain expenses not been reduced during the periods shown.
B Fees and expenses of the underlying Fidelity Central Funds are not included in the Fund's expense ratio. The Fund indirectly bears its proportionate share of the expenses of any underlying Fidelity Central Funds.
C Expense ratios reflect operating expenses of the class. Expenses before reductions do not reflect amounts reimbursed or waived or reductions from expense offset arrangements and do not represent the amount paid by the class during periods when reimbursements, waivers or reductions occur. Expenses net of fee waivers reflect expenses after reimbursement and waivers but prior to reductions from expense offset arrangements. Expenses net of all reductions represent the net expenses paid by the class.
D Amount represents less than $.001 per share.
Financial Highlights - Class III
Years ended March 31, | 2011 | 2010 | 2009 | 2008 | 2007 |
Selected Per-Share Data | | | | | |
Net asset value, beginning of period | $ 1.00 | $ 1.00 | $ 1.00 | $ 1.00 | $ 1.00 |
Income from Investment Operations | | | | | |
Net investment income (loss) | - D | - D | .012 | .030 | .031 |
Net realized and unrealized gain (loss) D | - | - | - | - | - |
Total from investment operations | - D | - D | .012 | .030 | .031 |
Distributions from net investment income | - D | - D | (.012) | (.030) | (.031) |
Distributions from net realized gain | - D | - D | - D | - D | - |
Total distributions | - D | - D | (.012) | (.030) | (.031) |
Net asset value, end of period | $ 1.00 | $ 1.00 | $ 1.00 | $ 1.00 | $ 1.00 |
Total Return A | .01% | .03% | 1.25% | 3.07% | 3.18% |
Ratios to Average Net Assets B,C | | | | | |
Expenses before reductions | .47% | .50% | .49% | .48% | .48% |
Expenses net of fee waivers, if any | .29% | .37% | .47% | .45% | .45% |
Expenses net of all reductions | .29% | .37% | .45% | .42% | .42% |
Net investment income (loss) | .01% | .02% | 1.30% | 3.02% | 3.14% |
Supplemental Data | | | | | |
Net assets, end of period (in millions) | $ 198 | $ 166 | $ 272 | $ 459 | $ 360 |
A Total returns would have been lower had certain expenses not been reduced during the periods shown.
B Fees and expenses of the underlying Fidelity Central Funds are not included in the Fund's expense ratio. The Fund indirectly bears its proportionate share of the expenses of any underlying Fidelity Central Funds.
C Expense ratios reflect operating expenses of the class. Expenses before reductions do not reflect amounts reimbursed or waived or reductions from expense offset arrangements and do not represent the amount paid by the class during periods when reimbursements, waivers or reductions occur. Expenses net of fee waivers reflect expenses after reimbursement and waivers but prior to reductions from expense offset arrangements. Expenses net of all reductions represent the net expenses paid by the class.
D Amount represents less than $.001 per share.
See accompanying notes which are an integral part of the financial statements.
Annual Report
Financial Highlights - Select Class
Years ended March 31, | 2011 | 2010 | 2009 | 2008 | 2007 |
Selected Per-Share Data | | | | | |
Net asset value, beginning of period | $ 1.00 | $ 1.00 | $ 1.00 | $ 1.00 | $ 1.00 |
Income from Investment Operations | | | | | |
Net investment income (loss) | .001 | .001 | .014 | .032 | .033 |
Net realized and unrealized gain (loss) D | - | - | - | - | - |
Total from investment operations | .001 | .001 | .014 | .032 | .033 |
Distributions from net investment income | (.001) | (.001) | (.014) | (.032) | (.033) |
Distributions from net realized gain | - D | - D | - D | - D | - |
Total distributions | (.001) | (.001) | (.014) | (.032) | (.033) |
Net asset value, end of period | $ 1.00 | $ 1.00 | $ 1.00 | $ 1.00 | $ 1.00 |
Total Return A | .06% | .11% | 1.45% | 3.28% | 3.39% |
Ratios to Average Net Assets B,C | | | | | |
Expenses before reductions | .27% | .30% | .29% | .28% | .29% |
Expenses net of fee waivers, if any | .25% | .28% | .27% | .25% | .25% |
Expenses net of all reductions | .25% | .28% | .25% | .22% | .23% |
Net investment income (loss) | .05% | .12% | 1.50% | 3.22% | 3.34% |
Supplemental Data | | | | | |
Net assets, end of period (in millions) | $ 73 | $ 60 | $ 48 | $ 92 | $ 85 |
A Total returns would have been lower had certain expenses not been reduced during the periods shown.
B Fees and expenses of the underlying Fidelity Central Funds are not included in the Fund's expense ratio. The Fund indirectly bears its proportionate share of the expenses of any underlying Fidelity Central Funds.
C Expense ratios reflect operating expenses of the class. Expenses before reductions do not reflect amounts reimbursed or waived or reductions from expense offset arrangements and do not represent the amount paid by the class during periods when reimbursements, waivers or reductions occur. Expenses net of fee waivers reflect expenses after reimbursement and waivers but prior to reductions from expense offset arrangements. Expenses net of all reductions represent the net expenses paid by the class.
D Amount represents less than $.001 per share.
See accompanying notes which are an integral part of the financial statements.
Annual Report
Notes to Financial Statements
For the period ended March 31, 2011
(Amounts in thousands except ratios)
1. Organization.
Treasury Only Portfolio, Treasury Portfolio, Government Portfolio, Prime Money Market Portfolio, Money Market Portfolio and Tax-Exempt Portfolio (the Funds) are funds of Fidelity Colchester Street Trust (the Trust). Each Fund is authorized to issue an unlimited number of shares. The Trust is registered under the Investment Company Act of 1940, as amended (the 1940 Act), as an open-end management investment company organized as a Delaware statutory trust. Each Fund offers Class I, Class II, Class III and Select Class shares. Treasury Only Portfolio and Treasury Portfolio also offer Class IV shares. Prime Money Market Portfolio also offers Class IV and Institutional Class. Money Market Portfolio also offers Class F and Institutional Class. All classes have equal rights as to assets and voting privileges. Prime Money Market Portfolio and Money Market Portfolio offer conversion privileges between classes within each fund to eligible shareholders of the existing classes of shares. Class F shares of the Fund are only available for purchase by mutual funds for which Fidelity Management & Research Company (FMR) or an affiliate serves as investment manager. Each class has exclusive voting rights with respect to matters that affect that class. Investment income, realized and unrealized capital gains and losses, the common expenses of the Fund, and certain fund-level expense reductions, if any, are allocated on a pro-rata basis to each class based on the relative net assets of each class to the total net assets of each Fund. Each class differs with respect to transfer agent and distribution and service plan fees incurred. Certain expense reductions may also differ by class.
2. Investments in Fidelity Central Funds.
The Funds may invest in Fidelity Central Funds, which are open-end investment companies available only to other investment companies and accounts managed by FMR and its affiliates. The Funds' Schedules of Investments list each of the Fidelity Central Funds held as of period end, if any, as an investment of each Fund, but does not include the underlying holdings of each Fidelity Central Fund. As an Investing Fund, the Funds indirectly bear their proportionate share of the expenses of the underlying Fidelity Central Funds.
The Money Market Central Funds seek preservation of capital and current income and are managed by Fidelity Investments Money Management, Inc. (FIMM), an affiliate of FMR.
A complete unaudited list of holdings for each Fidelity Central Fund is available upon request or at the Securities and Exchange Commission (the SEC) web site at www.sec.gov. In addition, the financial statements of the Fidelity Central Funds, which are not covered by the Funds' Report of Independent Registered Public Accounting Firm, are available on the SEC web site or upon request.
3. Significant Accounting Policies.
The financial statements have been prepared in conformity with accounting principles generally accepted in the United States of America (GAAP), which require management to make certain estimates and assumptions at the date of the financial statements. Actual results could differ from those estimates. Subsequent events, if any, through the date that the financial statements were issued have been evaluated in the preparation of the financial statements. The following summarizes the significant accounting policies of the Funds:
Security Valuation. Each Fund categorizes the inputs to valuation techniques used to value their investments into a disclosure hierarchy consisting of three levels as shown below.
Level 1 - quoted prices in active markets for identical investments
Level 2 - other significant observable inputs (including quoted prices for similar investments, interest rates, prepayment speeds, etc.)
Level 3 - unobservable inputs (including the Fund's own assumptions based on the best information available)
As permitted by compliance with certain conditions under Rule 2a-7 of the 1940 Act, securities are valued at amortized cost, which approximates fair value, and are categorized as Level 2 in the hierarchy.
Investment Transactions and Income. Security transactions, including the Funds' investment activity in the Fidelity Central Funds, are accounted for as of trade date. Gains and losses on securities sold are determined on the basis of identified cost. Interest income and distributions from the Fidelity Central Funds are accrued as earned. Interest income includes coupon interest and amortization of premium and accretion of discount on debt securities.
Expenses. Expenses directly attributable to a fund are charged to that fund. Expenses attributable to more than one fund are allocated among the respective funds on the basis of relative net assets or other appropriate methods. Expense estimates are accrued in the period to which they relate and adjustments are made when actual amounts are known.
Deferred Trustee Compensation. Under a Deferred Compensation Plan (the Plan) for Government Portfolio and Money Market Portfolio, independent Trustees may elect to defer receipt of a portion of their annual compensation. Deferred amounts are invested in a cross-section of Fidelity funds, are marked-to-market and remain in the Fund until distributed in accordance with the Plan. The investment of deferred amounts and the offsetting payable to the Trustees are included in the accompanying Statement of Assets and Liabilities.
Annual Report
3. Significant Accounting Policies - continued
Income Tax Information and Distributions to Shareholders. Each year each Fund intends to qualify as a regulated investment company, including distributing substantially all of its taxable income and realized gains under Subchapter M of the Internal Revenue Code and filing its U.S. federal tax return. As a result, no provision for income taxes is required. As of March 31, 2011, each Fund did not have any unrecognized tax benefits in the accompanying financial statements. A fund's federal tax return is subject to examination by the Internal Revenue Service (IRS) for a period of three years.
Dividends are declared and recorded daily and paid monthly from net investment income. Distributions from realized gains, if any, are declared and recorded on the ex-dividend date. Income dividends and capital gain distributions are declared separately for each class. Income and capital gain distributions are determined in accordance with income tax regulations, which may differ from GAAP. In addition, Certain Funds claimed a portion of the payment made to redeeming shareholders as a distribution for income tax purposes.
Capital accounts within the financial statements are adjusted for permanent book-tax differences. These adjustments have no impact on net assets or the results of operations. Temporary book-tax differences will reverse in a subsequent period.
Book-tax differences are primarily due to deferred trustees compensation, capital loss carryforwards, and losses deferred due to excise tax regulations and wash sales.
The Tax-Exempt Portfolio purchases municipal securities whose interest, in the opinion of the issuer, is free from federal income tax. There is no assurance that the IRS will agree with this opinion. In the event the IRS determines that the issuer does not comply with relevant tax requirements, interest payments from a security could become federally taxable, possibly retroactively to the date the security was issued.
The federal tax cost of investment securities and unrealized appreciation (depreciation) as of period end were as follows for each Fund:
| Tax cost | Gross unrealized
appreciation | Gross unrealized
depreciation | Net unrealized
appreciation
(depreciation) on
securities and other
investments |
Treasury Only Portfolio | $ 7,391,504 | $ - | $ - | $ - |
Treasury Portfolio | 13,349,542 | - | - | - |
Government Portfolio | 32,878,850 | - | - | - |
Prime Money Market Portfolio | 70,917,428 | - | - | - |
Money Market Portfolio | 67,598,022 | - | - | - |
Tax Exempt Portfolio | 4,115,871 | - | - | - |
The tax-based components of distributable earnings as of period end were as follows for each Fund:
| Undistributed
tax-exempt income | Undistributed
ordinary income | Undistributed
long-term
capital gain | Capital loss
carryforward | Net unrealized
appreciation
(depreciation) |
Treasury Only Portfolio | $ - | $ 1 | $ - | $ - | $ - |
Treasury Portfolio | - | 112 | - | - | - |
Government Portfolio | - | 161 | - | (2,306) | - |
Prime Money Market Portfolio | - | 175 | - | - | - |
Money Market Portfolio | - | 609 | - | - | - |
Tax Exempt Portfolio | 176 | - | - | - | - |
The tax character of distributions paid was as follows:
March 31, 2011 | Tax-Exempt
Income | Ordinary Income | Long-term
Capital Gains | Tax Return of Capital | Total |
Treasury Only Portfolio | $ - | $ 1,099 | $ - | $ - | $ 1,099 |
Treasury Portfolio | - | 2,569 | - | - | 2,569 |
Government Portfolio | - | 17,177 | - | - | 17,177 |
Prime Money Market Portfolio | - | 149,918 | - | - | 149,918 |
Money Market Portfolio | - | 158,301 | - | - | 158,301 |
Tax-Exempt Portfolio | 3,906 | - | 147 | - | 4,053 |
Annual Report
Notes to Financial Statements - continued
(Amounts in thousands except ratios)
3. Significant Accounting Policies - continued
Income Tax Information and Distributions to Shareholders - continued
March 31, 2010 | Tax-Exempt
Income | Ordinary Income | Long-term
Capital Gains | Tax Return of Capital | Total |
Treasury Only Portfolio | $ - | $ 13,596 | $ - | $ - | $ 13,596 |
Treasury Portfolio | - | 17,019 | - | - | 17,019 |
Government Portfolio | - | 107,137 | - | - | 107,137 |
Prime Money Market Portfolio | - | 156,764 | - | - | 156,764 |
Money Market Portfolio | - | 289,559 | - | - | 289,559 |
Tax-Exempt Portfolio | 10,152 | - | 78 | - | 10,230 |
4. Operating Policies.
Repurchase Agreements. FMR has received an Exemptive Order from the SEC which permits the Funds and other affiliated entities of FMR to transfer uninvested cash balances into joint trading accounts which are then invested in repurchase agreements. The Funds may also invest directly with institutions in repurchase agreements. Repurchase agreements are collateralized by government or non-government securities. Upon settlement date, collateral is held in segregated accounts with custodian banks and may be obtained in the event of a default of the counterparty. Each applicable Fund monitors, on a daily basis, the value of the collateral to ensure it is at least equal to the principal amount of the repurchase agreement (including accrued interest). In the event of a default by the counterparty, realization of the collateral proceeds could be delayed, during which time the value of the collateral may decline.
Reverse Repurchase Agreements. To enhance their yield, the Funds may enter into reverse repurchase agreements whereby a fund transfers securities to a counterparty who then agrees to transfer them back to the applicable fund at a future date and agreed upon price, reflecting a rate of interest below market rate. Securities sold under a reverse repurchase agreement are recorded as a liability in each applicable fund's accompanying Statement of Assets and Liabilities. A fund receives cash proceeds, which are invested in other securities, and agrees to repay the proceeds plus any accrued interest in return for the same securities transferred. A fund continues to receive interest payments on the transferred securities during the term of the reverse repurchase agreement. During the period that a reverse repurchase agreement is outstanding each applicable fund identifies cash and liquid securities as segregated in its custodian records with a value at least equal to its obligation under the agreement. If the counterparty defaults on its obligation, because of insolvency or other reasons, the Fund could experience delays and costs in recovering the security or in gaining access to the collateral. At period end, there were no reverse repurchase agreements outstanding. Information related to reverse repurchase agreements for which each applicable fund was subject to interest is as follows:
| Average Daily Loan
Balance | Weighted Average
Interest Rate |
Government Portfolio | $ 235,356 | .07% |
Prime Money Market Portfolio | 176,209 | .02% |
Money Market Portfolio | 182,762 | .05% |
Delayed Delivery Transactions and When-Issued Securities. The Funds may purchase or sell securities on a delayed delivery or when-issued basis. Payment and delivery may take place after the customary settlement period for that security. The price of the underlying securities and the date when the securities will be delivered and paid for are fixed at the time the transaction is negotiated. During the time a delayed delivery sell is outstanding, equivalent deliverable securities are held for the transaction. The securities purchased on a delayed delivery or when-issued basis are identified as such in each applicable Fund's Schedule of Investments. The Funds may receive compensation for interest forgone in the purchase of a delayed delivery or when-issued security. With respect to purchase commitments, each applicable Fund identifies securities as segregated in its records with a value at least equal to the amount of the commitment. Losses may arise due to changes in the value of the underlying securities or if the counterparty does not perform under the contract's terms, or if the issuer does not issue the securities due to political, economic, or other factors.
Restricted Securities. The Funds may invest in securities that are subject to legal or contractual restrictions on resale. These securities generally may be resold in transactions exempt from registration or to the public if the securities are registered. Disposal of these securities may involve time-consuming negotiations and expense, and prompt sale at an acceptable price may be difficult. Information regarding restricted securities is included at the end of each applicable Fund's Schedule of Investments.
Annual Report
5. Fees and Other Transactions with Affiliates.
Management Fee. FMR and its affiliates provide the Funds with investment management related services for which the Funds pay a monthly management fee that is based on an annual rate of .14% of average net assets.
Distribution and Service Plan Fees. In accordance with Rule 12b-1 of the 1940 Act, the Funds have adopted separate Distribution and Service Plans for each class of shares. Class II, Class III and Select Class of each Fund pays Fidelity Distributors Corporation (FDC), an affiliate of FMR, a Service fee based on an annual percentage of each class' average net assets. Class IV of Treasury Only Portfolio, Treasury Portfolio and Prime Money Market Portfolio pays FDC separate Distribution and Service Fees, each of which is based on an annual percentage of each class' average net assets. FDC may pay financial intermediaries for selling shares of the Funds and providing shareholder support services. For the period, the Distribution and Service fee rates, total fees and amounts retained by FDC were as follows:
| Distribution
Fee | Service
Fee |
Class II | .00% | .15% |
Class III | .00% | .25% |
Class IV | .25% | .25% |
Select Class | .00% | .05% |
| Total Fees | Retained
by FDC |
Treasury Only Portfolio: Class II | $ 950 | $ - |
Class III | 1,187 | - |
Class IV | 293 | - |
Select Class | 139 | - |
| $ 2,569 | $ - |
Treasury Portfolio: Class II | $ 249 | $ - |
Class III | 9,717 | - |
Class IV | 1,479 | - |
Select Class | 185 | - |
| $ 11,630 | $ - |
Government Portfolio: Class II | $ 1,472 | $ - |
Class III | 5,206 | - |
Select Class | 224 | - |
| $ 6,902 | $ - |
Prime Money Market Portfolio: Class II | $ 1,377 | $ 6 |
Class III | 6,289 | 22 |
Class IV | 992 | 1 |
Select Class | 434 | 6 |
| $ 9,092 | $ 35 |
Money Market Portfolio: Class II | $ 880 | $ 1 |
Class III | 8,732 | 88 |
Select Class | 280 | -* |
| $ 9,892 | $ 89 |
Tax-Exempt Portfolio: Class II | $ 30 | $ 6 |
Class III | 510 | 4 |
Select Class | 32 | 1 |
| $ 572 | $ 11 |
* Amount represents two hundred ten dollars.
During the period, FMR or its affiliates waived a portion of these fees.
Annual Report
Notes to Financial Statements - continued
(Amounts in thousands except ratios)
5. Fees and Other Transactions with Affiliates - continued
Transfer Agent Fees. Fidelity Investments Institutional Operations Company, Inc. (FIIOC), an affiliate of FMR, is the transfer, dividend disbursing and shareholder servicing agent for the Funds except for Tax-Exempt Portfolio. Citibank, N.A. (Citibank) is the custodian, transfer and servicing agent for Tax-Exempt Portfolio. Citibank has entered into a sub-arrangement with FIIOC to perform the activities associated with the transfer agency and shareholder servicing functions for Tax-Exempt Portfolio. FIIOC receives asset-based fees with respect to each account. FIIOC pays for typesetting, printing and mailing of all shareholder reports, except proxy statements. Each class, with the exception of Institutional Class and Class F, pays a transfer agent fee equal to an annual rate of .06% of average net assets. Institutional Class pays a transfer agent fee equal to an annual rate of .03% of average net assets. FIIOC receives no fees for providing transfer agency services to Class F. For the period, transfer agent fees for each class were as follows:
Treasury Only Portfolio - Class I | $ 4,294 |
Treasury Only Portfolio - Class II | 382 |
Treasury Only Portfolio - Class III | 290 |
Treasury Only Portfolio - Class IV | 36 |
Treasury Only Portfolio - Select Class | 169 |
| $ 5,171 |
Treasury Portfolio - Class I | $ 4,999 |
Treasury Portfolio - Class II | 100 |
Treasury Portfolio - Class III | 2,339 |
Treasury Portfolio - Class IV | 178 |
Treasury Portfolio - Select Class | 223 |
| $ 7,839 |
Government Portfolio - Class I | $ 18,896 |
Government Portfolio - Class II | 602 |
Government Portfolio - Class III | 1,262 |
Government Portfolio - Select Class | 278 |
| $ 21,038 |
Prime Money Market Portfolio - Class I | $ 15,858 |
Prime Money Market Portfolio - Class II | 560 |
Prime Money Market Portfolio - Class III | 1,525 |
Prime Money Market Portfolio - Class IV | 123 |
Prime Money Market Portfolio - Select Class | 533 |
Prime Money Market Portfolio - Institutional Class | 11,865 |
| $ 30,464 |
Money Market Portfolio - Class I | $ 20,408 |
Money Market Portfolio - Class II | 359 |
Money Market Portfolio - Class III | 2,104 |
Money Market Portfolio - Select Class | 339 |
Money Market Portfolio - Institutional Class | 8,334 |
| $ 31,544 |
Tax-Exempt Portfolio - Class I | $ 2,621 |
Tax-Exempt Portfolio - Class II | 12 |
Tax-Exempt Portfolio - Class III | 126 |
Tax-Exempt Portfolio - Select Class | 39 |
| $ 2,798 |
During the period, FMR or its affiliates waived a portion of these fees.
Accounting Fees. Fidelity Service Company, Inc. (FSC), an affiliate of FMR, maintains the accounting records for the Funds except for Tax-Exempt Portfolio. Citibank has entered into a sub-arrangement with FSC to maintain Tax-Exempt Portfolio's accounting records. The fee is based on the level of average net assets for the month.
Annual Report
6. Expense Reductions.
FMR voluntarily agreed to reimburse funds to the extent annual operating expenses exceeded certain levels of average net assets as noted in the table below. Some expenses, for example interest expense, are excluded from this reimbursement.
The following classes of each applicable Fund were in reimbursement during the period:
| Expense
Limitations | Reimbursement
from adviser |
Prime Money Market Portfolio | | |
Class I | .20% | $ 1,606 |
Class II | .35% | 70 |
Class III | .45% | 134 |
Class IV | .70% | 16 |
Select Class | .25% | 65 |
Institutional Class | .14% | 14,169 |
Money Market Portfolio | | |
Class I | .18% | $ 9,079 |
Class II | .33% | 161 |
Class III | .43% | 953 |
Select Class | .23% | 152 |
Class F | .14% | 31 |
Institutional Class | .14% | 10,167 |
Tax-Exempt Portfolio | | |
Class II | .35% | $ 3 |
Class III | .45% | 35 |
Select Class | .25% | 10 |
Additionally, FMR or its affiliates voluntarily agreed to waive certain fees in order to maintain a minimum annualized yield of .01%. Such arrangements may be discontinued by FMR at any time. For the period, the amount of the waiver for each class was as follows:
Treasury Only Portfolio | | |
Class I | | $ 2,650 |
Class II | | 1,206 |
Class III | | 1,365 |
Class IV | | 317 |
Select Class | | 240 |
Treasury Portfolio | | |
Class I | | $ 733 |
Class II | | 236 |
Class III | | 9,497 |
Class IV | | 1,462 |
Select Class | | 152 |
Government Portfolio | | |
Class II | | $ 1,073 |
Class III | | 4,389 |
Select Class | | 68 |
Prime Money Market Portfolio | | |
Class II | | $ 21 |
Class III | | 1,739 |
Class IV | | 627 |
Annual Report
Notes to Financial Statements - continued
(Amounts in thousands except ratios)
6. Expense Reductions - continued
Money Market Portfolio | | |
Class III | | $ 1,087 |
Tax-Exempt Portfolio | | |
Class II | | $ 11 |
Class III | | 320 |
Select Class | | -* |
* Amount represents one hundred eight dollars.
In addition, through arrangements with each applicable Fund's custodian, credits realized as a result of uninvested cash balances were used to reduce each Fund's expenses. All of the applicable expense reductions are noted in the table below.
| Custody
expense
reduction |
Prime Money Market Portfolio | $ 3 |
Money Market Portfolio | 1 |
Tax-Exempt Portfolio | 8 |
7. Distributions to Shareholders.
Distributions to shareholders of each class were as follows:
Years ended March 31, | 2011 | 2010 A |
From net investment income | | |
Treasury Only Portfolio - Class I | $ 710 | $ 12,423 |
Treasury Only Portfolio - Class II | 63 | 201 |
Treasury Only Portfolio - Class III | 47 | 80 |
Treasury Only Portfolio - Class IV | 6 | 7 |
Treasury Only Portfolio - Select Class | 28 | 524 |
Total | $ 854 | $ 13,235 |
Treasury Portfolio - Class I | $ 2,096 | $ 15,399 |
Treasury Portfolio - Class II | 17 | 101 |
Treasury Portfolio - Class III | 388 | 575 |
Treasury Portfolio - Class IV | 30 | 44 |
Treasury Portfolio - Select Class | 38 | 565 |
Total | $ 2,569 | $ 16,684 |
Government Portfolio - Class I | $ 15,825 | $ 103,670 |
Government Portfolio - Class II | 98 | 1,376 |
Government Portfolio - Class III | 208 | 1,314 |
Government Portfolio - Select Class | 70 | 777 |
Total | $ 16,201 | $ 107,137 |
Prime Money Market Portfolio - Class I | $ 49,946 | $ 66,000 |
Prime Money Market Portfolio - Class II | 392 | 2,824 |
Prime Money Market Portfolio - Class III | 254 | 4,391 |
Prime Money Market Portfolio - Class IV | 20 | 73 |
Prime Money Market Portfolio - Select Class | 1,195 | 2,897 |
Prime Money Market Portfolio - Institutional Class | 98,111 | 80,579 |
Total | $ 149,918 | $ 156,764 |
Money Market Portfolio - Class I | $ 79,474 | $ 167,465 |
Money Market Portfolio - Class II | 503 | 2,548 |
Money Market Portfolio - Class III | 497 | 10,090 |
Money Market Portfolio - Select Class | 1,043 | 2,101 |
Money Market Portfolio - Class F | 1,190 | 98 |
Money Market Portfolio - Institutional Class | 75,594 | 107,257 |
Total | $ 158,301 | $ 289,559 |
Annual Report
7. Distributions to Shareholders - continued
Years ended March 31, | 2011 | 2010 A |
From net investment income | | |
Tax-Exempt Portfolio - Class I | $ 3,849 | $ 10,004 |
Tax Exempt Portfolio - Class II | 2 | 24 |
Tax Exempt Portfolio - Class III | 20 | 55 |
Tax Exempt Portfolio - Select Class | 35 | 69 |
Total | $ 3,906 | $ 10,152 |
| | |
From net realized gain | | |
Treasury Only Portfolio - Class I | $ 202 | $ 298 |
Treasury Only Portfolio - Class II | 21 | 21 |
Treasury Only Portfolio - Class III | 12 | 20 |
Treasury Only Portfolio - Class IV | 2 | 2 |
Treasury Only Portfolio - Select Class | 8 | 20 |
Total | $ 245 | $ 361 |
Treasury Portfolio - Class I | $ - | $ 231 |
Treasury Portfolio - Class II | - | 4 |
Treasury Portfolio - Class III | - | 80 |
Treasury Portfolio - Class IV | - | 9 |
Treasury Portfolio - Select Class | - | 11 |
Total | $ - | $ 335 |
Government Portfolio - Class I | $ 875 | $ - |
Government Portfolio - Class II | 24 | - |
Government Portfolio - Class III | 62 | - |
Government Portfolio - Select Class | 15 | - |
Total | $ 976 | $ - |
Tax-Exempt Portfolio - Class I | $ 139 | $ 73 |
Tax Exempt Portfolio - Class II | 1 | 1 |
Tax Exempt Portfolio - Class III | 5 | 3 |
Tax Exempt Portfolio - Select Class | 2 | 1 |
Total | $ 147 | $ 78 |
A Distributions for Class F are for the period June 26, 2009 (commencement of sale of shares) to March 31, 2010.
8. Share Transactions.
Transactions for each class of shares at a $1.00 per share were as follows:
Years ended March 31, | 2011 | 2010 A |
Treasury Only Portfolio - Class I Shares sold | 9,325,356 | 11,097,181 |
Reinvestment of distributions | 753 | 10,090 |
Shares redeemed | (11,547,791) | (18,270,773) |
Net increase (decrease) | (2,221,682) | (7,163,502) |
Treasury Only Portfolio - Class II Shares sold | 1,267,446 | 843,648 |
Reinvestment of distributions | 36 | 142 |
Shares redeemed | (1,331,000) | (1,101,177) |
Net increase (decrease) | (63,518) | (257,387) |
Treasury Only Portfolio - Class III Shares sold | 1,906,451 | 2,323,268 |
Reinvestment of distributions | 30 | 45 |
Shares redeemed | (2,129,824) | (2,543,200) |
Net increase (decrease) | (223,343) | (219,887) |
Annual Report
Notes to Financial Statements - continued
(Amounts in thousands except ratios)
8. Share Transactions - continued
Years ended March 31, | 2011 | 2010 A |
Treasury Only Portfolio - Class IV Shares sold | 94,822 | 128,804 |
Reinvestment of distributions | 8 | 9 |
Shares redeemed | (92,410) | (208,294) |
Net increase (decrease) | 2,420 | (79,481) |
Treasury Only Portfolio - Select Class Shares sold | 938,799 | 807,972 |
Reinvestment of distributions | 29 | 511 |
Shares redeemed | (1,208,169) | (1,093,040) |
Net increase (decrease) | (269,341) | (284,557) |
Treasury Portfolio - Class I Shares sold | 30,159,804 | 25,929,433 |
Reinvestment of distributions | 1,182 | 9,104 |
Shares redeemed | (30,026,808) | (33,523,809) |
Net increase (decrease) | 134,178 | (7,585,272) |
Treasury Portfolio - Class II Shares sold | 1,387,389 | 851,706 |
Reinvestment of distributions | 5 | 30 |
Shares redeemed | (1,395,982) | (1,095,067) |
Net increase (decrease) | (8,588) | (243,331) |
Treasury Portfolio - Class III Shares sold | 13,151,252 | 9,498,048 |
Reinvestment of distributions | 62 | 150 |
Shares redeemed | (13,289,612) | (10,643,362) |
Net increase (decrease) | (138,298) | (1,145,164) |
Treasury Portfolio - Class IV Shares sold | 852,681 | 626,217 |
Reinvestment of distributions | - | 1 |
Shares redeemed | (1,040,182) | (587,517) |
Net increase (decrease) | (187,501) | 38,701 |
Treasury Portfolio - Select Class Shares sold | 1,342,798 | 1,660,459 |
Reinvestment of distributions | 25 | 411 |
Shares redeemed | (1,355,551) | (2,178,148) |
Net increase (decrease) | (12,728) | (517,278) |
Government Portfolio - Class I Shares sold | 275,569,247 | 407,076,631 |
Reinvestment of distributions | 7,778 | 47,904 |
Shares redeemed | (291,301,004) | (416,647,297) |
Net increase (decrease) | (15,723,979) | (9,522,762) |
Government Portfolio - Class II Shares sold | 32,387,366 | 71,417,522 |
Reinvestment of distributions | 47 | 586 |
Shares redeemed | (32,993,501) | (71,941,274) |
Net increase (decrease) | (606,088) | (523,166) |
Government Portfolio - Class III Shares sold | 10,260,061 | 14,312,162 |
Reinvestment of distributions | 78 | 366 |
Shares redeemed | (10,120,411) | (15,433,083) |
Net increase (decrease) | 139,728 | (1,120,555) |
Government Portfolio - Select Class Shares sold | 2,433,017 | 3,075,337 |
Reinvestment of distributions | 60 | 537 |
Shares redeemed | (2,374,873) | (3,386,210) |
Net increase (decrease) | 58,204 | (310,336) |
Annual Report
8. Share Transactions - continued
Years ended March 31, | 2011 | 2010 A |
Prime Money Market Portfolio - Class I Shares sold | 121,991,182 | 133,063,619 |
Reinvestment of distributions | 15,993 | 31,426 |
Shares redeemed | (131,069,568) | (114,226,477) |
Net increase (decrease) | (9,062,393) | 18,868,568 |
Prime Money Market Portfolio - Class II Shares sold | 4,959,880 | 6,653,068 |
Reinvestment of distributions | 223 | 1,892 |
Shares redeemed | (5,143,074) | (7,170,685) |
Net increase (decrease) | (182,971) | (515,725) |
Prime Money Market Portfolio - Class III Shares sold | 11,890,436 | 15,028,417 |
Reinvestment of distributions | 87 | 1,223 |
Shares redeemed | (12,010,007) | (15,717,418) |
Net increase (decrease) | (119,484) | (687,778) |
Prime Money Market Portfolio - Class IV Shares sold | 926,637 | 762,826 |
Reinvestment of distributions | 18 | 58 |
Shares redeemed | (1,009,268) | (557,761) |
Net increase (decrease) | (82,613) | 205,123 |
Prime Money Market Portfolio - Select Class Shares sold | 36,008,539 | 9,843,017 |
Reinvestment of distributions | 949 | 2,219 |
Shares redeemed | (35,489,685) | (9,693,502) |
Net increase (decrease) | 519,803 | 151,734 |
Prime Money Market Portfolio - Institutional Class Shares sold | 412,304,054 | 206,611,372 |
Reinvestment of distributions | 61,224 | 52,805 |
Shares redeemed | (405,346,129) | (182,097,189) |
Net increase (decrease) | 7,019,149 | 24,566,988 |
Money Market Portfolio - Class I Shares sold | 129,654,262 | 99,361,678 |
Reinvestment of distributions | 56,221 | 131,935 |
Shares redeemed | (133,032,330) | (100,720,738) |
Net increase (decrease) | (3,321,847) | (1,227,125) |
Money Market Portfolio - Class II Shares sold | 2,109,859 | 2,933,382 |
Reinvestment of distributions | 370 | 2,183 |
Shares redeemed | (2,525,235) | (2,780,049) |
Net increase (decrease) | (415,006) | 155,516 |
Money Market Portfolio - Class III Shares sold | 19,592,821 | 20,897,591 |
Reinvestment of distributions | 227 | 4,474 |
Shares redeemed | (19,835,254) | (21,320,216) |
Net increase (decrease) | (242,206) | (418,151) |
Money Market Portfolio - Select Class Shares sold | 9,007,280 | 6,597,641 |
Reinvestment of distributions | 672 | 1,027 |
Shares redeemed | (7,468,913) | (6,595,815) |
Net increase (decrease) | 1,539,039 | 2,853 |
Money Market Portfolio - Class F Shares sold | 741,144 | 152,471 |
Reinvestment of distributions | 1,190 | 98 |
Shares redeemed | (69,774) | (3,531) |
Net increase (decrease) | 672,560 | 149,038 |
Annual Report
Notes to Financial Statements - continued
(Amounts in thousands except ratios)
8. Share Transactions - continued
Years ended March 31, | 2011 | 2010 A |
Money Market Portfolio - Institutional Class Shares sold | 154,730,887 | 123,612,866 |
Reinvestment of distributions | 61,838 | 75,566 |
Shares redeemed | (150,676,900) | (114,543,217) |
Net increase (decrease) | 4,115,825 | 9,145,215 |
Tax-Exempt Portfolio - Class I Shares sold | 7,263,950 | 8,679,961 |
Reinvestment of distributions | 2,550 | 6,687 |
Shares redeemed | (8,280,573) | (11,597,462) |
Net increase (decrease) | (1,014,073) | (2,910,814) |
Tax-Exempt Portfolio - Class II Shares sold | 17,896 | 66,279 |
Reinvestment of distributions | 3 | 23 |
Shares redeemed | (22,093) | (94,375) |
Net increase (decrease) | (4,194) | (28,073) |
Tax-Exempt Portfolio - Class III Shares sold | 1,370,264 | 950,167 |
Reinvestment of distributions | 12 | 34 |
Shares redeemed | (1,337,626) | (1,056,365) |
Net increase (decrease) | 32,650 | (106,164) |
Tax-Exempt Portfolio - Select Class Shares sold | 75,375 | 83,177 |
Reinvestment of distributions | 30 | 65 |
Shares redeemed | (61,760) | (71,985) |
Net increase (decrease) | 13,645 | 11,257 |
A Share transactions for class F are for the period June 26, 2009 (commencement of sale of shares) to March 31, 2010.
9. Other.
The Funds' organizational documents provide former and current trustees and officers with a limited indemnification against liabilities arising in connection with the performance of their duties to the Funds. In the normal course of business, the Funds may also enter into contracts that provide general indemnifications. The Funds' maximum exposure under these arrangements is unknown as this would be dependent on future claims that may be made against the Funds. The risk of material loss from such claims is considered remote.
Annual Report
Report of Independent Registered Public Accounting Firm
To the Trustees of Fidelity Colchester Street Trust and the Shareholders of Treasury Only Portfolio, Treasury Portfolio, Government Portfolio, Prime Money Market Portfolio, Money Market Portfolio and Tax-Exempt Portfolio:
We have audited the accompanying statements of assets and liabilities of Treasury Only Portfolio, Treasury Portfolio, Government Portfolio, Prime Money Market Portfolio, Money Market Portfolio and Tax-Exempt Portfolio (the Funds), each a fund of Fidelity Colchester Street Trust, including the schedules of investments, as of March 31, 2011, and the related statements of operations for the year then ended, the statements of changes in net assets for each of the two years in the period then ended, and the financial highlights for each of the five years in the period then ended. These financial statements and financial highlights are the responsibility of the Funds' management. Our responsibility is to express an opinion on these financial statements and financial highlights based on our audits.
We conducted our audits in accordance with the standards of the Public Company Accounting Oversight Board (United States). Those standards require that we plan and perform the audit to obtain reasonable assurance about whether the financial statements and financial highlights are free of material misstatement. The Funds are not required to have, nor were we engaged to perform, an audit of their internal control over financial reporting. Our audits included consideration of internal control over financial reporting as a basis for designing audit procedures that are appropriate in the circumstances, but not for the purpose of expressing an opinion on the effectiveness of the Funds' internal control over financial reporting. Accordingly, we express no such opinion. An audit also includes examining, on a test basis, evidence supporting the amounts and disclosures in the financial statements, assessing the accounting principles used and significant estimates made by management, as well as evaluating the overall financial statement presentation. Our procedures included confirmation of securities owned as of March 31, 2011, by correspondence with the custodians and brokers; where replies were not received from brokers, we performed other auditing procedures. We believe that our audits provide a reasonable basis for our opinion.
In our opinion, the financial statements and financial highlights referred to above present fairly, in all material respects, the financial position of the Funds as of March 31, 2011, the results of their operations for the year then ended, the changes in their net assets for each of the two years in the period then ended, and their financial highlights for each of the five years in the period then ended, in conformity with accounting principles generally accepted in the United States of America.
/s/ Deloitte & Touche LLP
DELOITTE & TOUCHE LLP
Boston, Massachusetts
May 12, 2011
Annual Report
The Trustees and executive officers of the trust and fund, as applicable, are listed below. The Board of Trustees governs the fund and is responsible for protecting the interests of shareholders. The Trustees are experienced executives who meet periodically throughout the year to oversee the fund's activities, review contractual arrangements with companies that provide services to the fund, oversee management of the risks associated with such activities and contractual arrangements, and review the fund's performance. Except for James C. Curvey, each of the Trustees oversees 190 funds advised by FMR or an affiliate. Mr. Curvey oversees 410 funds advised by FMR or an affiliate.
The Trustees hold office without limit in time except that (a) any Trustee may resign; (b) any Trustee may be removed by written instrument, signed by at least two-thirds of the number of Trustees prior to such removal; (c) any Trustee who requests to be retired or who has become incapacitated by illness or injury may be retired by written instrument signed by a majority of the other Trustees; and (d) any Trustee may be removed at any special meeting of shareholders by a two-thirds vote of the outstanding voting securities of the trust. Each Trustee who is not an interested person (as defined in the 1940 Act) (Independent Trustee), shall retire not later than the last day of the calendar year in which his or her 75th birthday occurs. The Independent Trustees may waive this mandatory retirement age policy with respect to individual Trustees. The executive officers hold office without limit in time, except that any officer may resign or may be removed by a vote of a majority of the Trustees at any regular meeting or any special meeting of the Trustees. Except as indicated, each individual has held the office shown or other offices in the same company for the past five years.
Experience, Skills, Attributes, and Qualifications of the Funds' Trustees. The Governance and Nominating Committee has adopted a statement of policy that describes the experience, qualifications, attributes, and skills that are necessary and desirable for potential Independent Trustee candidates (Statement of Policy). The Board believes that each Trustee satisfied at the time he or she was initially elected or appointed a Trustee, and continues to satisfy, the standards contemplated by the Statement of Policy. The Governance and Nominating Committee also engages professional search firms to help identify potential Independent Trustee candidates who have the experience, qualifications, attributes, and skills consistent with the Statement of Policy. From time to time, additional criteria based on the composition and skills of the current Independent Trustees, as well as experience or skills that may be appropriate in light of future changes to board composition, business conditions, and regulatory or other developments, have also been considered by the professional search firms and the Governance and Nominating Committee. In addition, the Board takes into account the Trustees' commitment and participation in Board and committee meetings, as well as their leadership of standing and ad hoc committees throughout their tenure.
In determining that a particular Trustee was and continues to be qualified to serve as a Trustee, the Board has considered a variety of criteria, none of which, in isolation, was controlling. The Board believes that, collectively, the Trustees have balanced and diverse experience, qualifications, attributes, and skills, which allow the Board to operate effectively in governing the fund and protecting the interests of shareholders. Information about the specific experience, skills, attributes, and qualifications of each Trustee, which in each case led to the Board's conclusion that the Trustee should serve (or continue to serve) as a trustee of the fund, is provided below.
Board Structure and Oversight Function. Abigail P. Johnson is an interested person (as defined in the 1940 Act) and currently serves as Chairman. The Trustees have determined that an interested Chairman is appropriate and benefits shareholders because an interested Chairman has a personal and professional stake in the quality and continuity of services provided to the fund. Independent Trustees exercise their informed business judgment to appoint an individual of their choosing to serve as Chairman, regardless of whether the Trustee happens to be independent or a member of management. The Independent Trustees have determined that they can act independently and effectively without having an Independent Trustee serve as Chairman and that a key structural component for assuring that they are in a position to do so is for the Independent Trustees to constitute a substantial majority for the Board. The Independent Trustees also regularly meet in executive session. Kenneth L. Wolfe serves as Chairman of the Independent Trustees and as such (i) acts as a liaison between the Independent Trustees and management with respect to matters important to the Independent Trustees and (ii) with management prepares agendas for Board meetings.
Fidelity funds are overseen by different Boards of Trustees. The fund's Board oversees Fidelity's investment-grade bond, money market, and asset allocation funds and another Board oversees Fidelity's equity and high income funds. The asset allocation funds may invest in Fidelity funds that are overseen by such other Board. The use of separate Boards, each with its own committee structure, allows the Trustees of each group of Fidelity funds to focus on the unique issues of the funds they oversee, including common research, investment, and operational issues. On occasion, the separate Boards establish joint committees to address issues of overlapping consequences for the Fidelity funds overseen by each Board.
The Trustees operate using a system of committees to facilitate the timely and efficient consideration of all matters of importance to the Trustees, the fund, and fund shareholders and to facilitate compliance with legal and regulatory requirements and oversight of the fund's activities and associated risks. The Board, acting through its committees, has charged FMR and its affiliates with (i) identifying events or circumstances the occurrence of which could have demonstrably adverse effects on the fund's business and/or reputation; (ii) implementing processes and controls to lessen the possibility that such events or circumstances occur or to mitigate the effects of such events or circumstances if they do occur; and (iii) creating and maintaining a system designed to evaluate continuously business and market conditions in order to facilitate the identification and implementation processes described in (i) and (ii) above. Because the day-to-day operations and activities of the fund are carried out by or through FMR, its affiliates and other service providers, the fund's exposure to risks is mitigated but not eliminated by the processes overseen by the Trustees. While each of the Board's committees has responsibility for overseeing different aspects of the fund's activities, oversight is exercised primarily through the Operations and Audit Committees. Appropriate personnel, including but not limited to the fund's Chief Compliance Officer (CCO), FMR's internal auditor, the independent accountants, the fund's Treasurer and portfolio management personnel, make periodic reports to the Board's committees, as appropriate. The responsibilities of each committee, including their oversight responsibilities, are described further under "Standing Committees of the Funds' Trustees."
Annual Report
The funds' Statements of Additional Information (SAIs) include more information about the Trustees. To request a free copy, call Fidelity at 1-877-297-2952, or for Class F, call 1-800-835-5092.
Interested Trustees*:
Correspondence intended for each Trustee who is an interested person may be sent to Fidelity Investments, 82 Devonshire Street, Boston, Massachusetts 02109.
Name, Age; Principal Occupations and Other Relevant Experience+ |
Abigail P. Johnson (49) |
| Year of Election or Appointment: 2009 Ms. Johnson is Trustee and Chairman of the Board of Trustees of certain Trusts. Ms. Johnson serves as President of Personal, Workplace and Institutional Services (2005-present). Ms. Johnson is the Vice Chairman and Director (2007-present) of FMR LLC. Previously, Ms. Johnson served as President and a Director of FMR (2001-2005), a Trustee of other investment companies advised by FMR, Fidelity Investments Money Management, Inc., and FMR Co., Inc. (2001-2005), Senior Vice President of the Fidelity funds (2001-2005), and managed a number of Fidelity funds. Ms. Abigail P. Johnson and Mr. Arthur E. Johnson are not related. |
James C. Curvey (75) |
| Year of Election or Appointment: 2007 Mr. Curvey also serves as Trustee (2007-present) of other investment companies advised by FMR. Mr. Curvey is a Director of Fidelity Investments Money Management, Inc. (2009-present), Director of Fidelity Research & Analysis Co. (2009-present) and Director of FMR and FMR Co., Inc. (2007-present). Mr. Curvey is also Vice Chairman (2007-present) and Director of FMR LLC. In addition, Mr. Curvey serves as an Overseer for the Boston Symphony Orchestra and a member of the Trustees of Villanova University. Previously, Mr. Curvey was the Vice Chairman (2006-2007) and Director (2000-2007) of FMR Corp. |
* Trustees have been determined to be "Interested Trustees" by virtue of, among other things, their affiliation with the trust or various entities under common control with FMR.
+ The information above includes each Trustee's principal occupation during the last five years and other information relating to the experience, attributes, and skills relevant to each Trustee's qualifications to serve as a Trustee, which led to the conclusion that each Trustee should serve as a Trustee for the fund.
Independent Trustees:
Correspondence intended for each Independent Trustee (that is, the Trustees other than the Interested Trustees) may be sent to Fidelity Investments, P.O. Box 55235, Boston, Massachusetts 02205-5235.
Name, Age; Principal Occupations and Other Relevant Experience+ |
Albert R. Gamper, Jr. (69) |
| Year of Election or Appointment: 2006 Prior to his retirement in December 2004, Mr. Gamper served as Chairman of the Board of CIT Group Inc. (commercial finance). During his tenure with CIT Group Inc. Mr. Gamper served in numerous senior management positions, including Chairman (1987-1989; 1999-2001; 2002-2004), Chief Executive Officer (1987-2004), and President (2002-2003). He also served as President and Chief Executive Officer of Tyco Capital Corporation (2001-2002). Mr. Gamper currently serves as a member of the Board of Directors of Public Service Enterprise Group (utilities, 2000-present), a member of the Board of Trustees, Rutgers University (2004-present), and Chairman of the Board of Saint Barnabas Health Care System. Previously, Mr. Gamper served as Chairman of the Board of Governors, Rutgers University (2004-2007). |
Robert F. Gartland (59) |
| Year of Election or Appointment: 2010 Mr. Gartland is a partner and investor of Vietnam Partners LLC (investments and consulting, 2008-present) and is Chairman and an investor in Gartland and Mellina Group Corp. (consulting, 2009-present). Prior to his retirement, Mr. Gartland held a variety of positions at Morgan Stanley (financial services, 1979-2007) including Managing Director (1987-2007). |
Arthur E. Johnson (64) |
| Year of Election or Appointment: 2008 Mr. Johnson serves as a member of the Board of Directors of Eaton Corporation (diversified power management, 2009-present) and AGL Resources, Inc. (holding company). Prior to his retirement, Mr. Johnson served as Senior Vice President of Corporate Strategic Development of Lockheed Martin Corporation (defense contractor, 1999-2009). He previously served on the Board of Directors of IKON Office Solutions, Inc. (1999-2008) and Delta Airlines (2005-2007). Mr. Arthur E. Johnson and Ms. Abigail P. Johnson are not related. |
Michael E. Kenneally (57) |
| Year of Election or Appointment: 2009 Previously, Mr. Kenneally served as a Member of the Advisory Board for certain Fidelity Fixed Income and Asset Allocation Funds (2008-2009). Prior to his retirement, Mr. Kenneally served as Chairman and Global Chief Executive Officer of Credit Suisse Asset Management (2003-2005). Mr. Kenneally was a Director of the Credit Suisse Funds (U.S. mutual funds, 2004-2008) and certain other closed-end funds (2004-2005) and was awarded the Chartered Financial Analyst (CFA) designation in 1991. |
James H. Keyes (70) |
| Year of Election or Appointment: 2007 Mr. Keyes serves as a member of the Boards of Navistar International Corporation (manufacture and sale of trucks, buses, and diesel engines, since 2002) and Pitney Bowes, Inc. (integrated mail, messaging, and document management solutions, since 1998). Prior to his retirement, Mr. Keyes served as Chairman and Chief Executive Officer of Johnson Controls (automotive, building, and energy, 1998-2002) and as a member of the Board of LSI Logic Corporation (semiconductor technologies, 1984-2008). |
Marie L. Knowles (64) |
| Year of Election or Appointment: 2001 Prior to Ms. Knowles' retirement in June 2000, she served as Executive Vice President and Chief Financial Officer of Atlantic Richfield Company (ARCO) (diversified energy, 1996-2000). From 1993 to 1996, she was a Senior Vice President of ARCO and President of ARCO Transportation Company. She served as a Director of ARCO from 1996 to 1998. Ms. Knowles currently serves as a Director and Chairman of the Audit Committee of McKesson Corporation (healthcare service, since 2002). Ms. Knowles is an Honorary Trustee of the Brookings Institution and a member of the Board of the Catalina Island Conservancy and of the Santa Catalina Island Company (2009-present). She also serves as a member of the Advisory Board for the School of Engineering of the University of Southern California and the Foundation Board of the School of Architecture at the University of Virginia (2007-present). Previously, Ms. Knowles served as a Director of Phelps Dodge Corporation (copper mining and manufacturing, 1994-2007). |
Kenneth L. Wolfe (72) |
| Year of Election or Appointment: 2005 Mr. Wolfe is Chairman of the Independent Trustees of the Fixed Income and Asset Allocation Funds (2008-present). Prior to his retirement, Mr. Wolfe served as Chairman and a Director (2007-2009) and Chairman and Chief Executive Officer (1994-2001) of Hershey Foods Corporation. He also served as a member of the Boards of Adelphia Communications Corporation (telecommunications, 2003-2006), Bausch & Lomb, Inc. (medical/pharmaceutical, 1993-2007), and Revlon, Inc. (personal care products, 2004-2009). |
+ The information above includes each Trustee's principal occupation during the last five years and other information relating to the experience, attributes, and skills relevant to each Trustee's qualifications to serve as a Trustee, which led to the conclusion that each Trustee should serve as a Trustee for the fund.
Executive Officers:
Correspondence intended for each executive officer may be sent to Fidelity Investments, 82 Devonshire Street, Boston, Massachusetts 02109.
Name, Age; Principal Occupation |
John R. Hebble (52) |
| Year of Election or Appointment: 2008 President and Treasurer of Fidelity's Fixed Income and Asset Allocation Funds. Mr. Hebble also serves as Treasurer and Chief Financial Officer of The North Carolina Capital Management Trust: Cash and Term Portfolios (2008-present), Assistant Treasurer of other Fidelity funds (2009-present) and is an employee of Fidelity Investments. |
Boyce I. Greer (55) |
| Year of Election or Appointment: 2005 Vice President of Fidelity's Fixed Income Funds and Asset Allocation Funds (2005). Mr. Greer is also a Trustee of other investment companies advised by FMR. Mr. Greer is head of Institutional Investments for Fidelity Asset Management and Vice Chairman of Pyramis Global Advisors, LLC (2011-present), President of The North Carolina Capital Management Trust: Cash and Term Portfolios (2003-present), the Asset Allocation Division (2008-present), President and a Director of Strategic Advisers, Inc. (2008-present), President of FIMM 130/30 LLC (2008-present), Director of Ballyrock Investment Advisors LLC (2006-present), and an Executive Vice President of FMR (2005-present). Previously, Mr. Greer served as Executive Vice President of FMR Co., Inc. (2005-2009), President and Director of Fidelity Investments Money Management, Inc. (2007-2009) and as a Director and Managing Director of Strategic Advisers, Inc. (2002-2005). |
Robert P. Brown (47) |
| Year of Election or Appointment: 2010 Vice President of Fidelity's Money Market Funds and Executive Vice President of Fidelity Investments Money Management, Inc. (2010-present). Mr. Brown also serves as President, Money Market Group of FMR (2010-present), Managing Director of Research, Director of Fidelity Management & Research (U.K.) Inc. (2008-present) and is an employee of Fidelity Investments. |
Scott C. Goebel (43) |
| Year of Election or Appointment: 2008 Secretary and Chief Legal Officer (CLO) of the Fidelity funds. Mr. Goebel also serves as Secretary and CLO of The North Carolina Capital Management Trust: Cash and Term Portfolios (2008-present); General Counsel, Secretary, and Senior Vice President of FMR (2008-present) and FMR Co., Inc. (2008-present); Deputy General Counsel of FMR LLC; Chief Legal Officer of Fidelity Management & Research (Hong Kong) Limited (2008-present) and Assistant Secretary of Fidelity Management & Research (Japan) Inc. (2008-present), Fidelity Investments Money Management, Inc. (2008-present), Fidelity Management & Research (U.K.) Inc. (2008-present), and Fidelity Research and Analysis Company (2008-present). Previously, Mr. Goebel served as Assistant Secretary of the Funds (2007-2008) and as Vice President and Secretary of Fidelity Distributors Corporation (FDC) (2005-2007). |
David J. Carter (37) |
| Year of Election or Appointment: 2010 Assistant Secretary of Fidelity's Fixed Income and Asset Allocation Funds. Mr. Carter also serves as Vice President, Associate General Counsel (2010-present) and is an employee of Fidelity Investments (2005-present). |
Holly C. Laurent (56) |
| Year of Election or Appointment: 2008 Anti-Money Laundering (AML) Officer of the Fidelity funds. Ms. Laurent also serves as AML Officer of The North Carolina Capital Management Trust: Cash and Term Portfolios (2008-present) and is an employee of Fidelity Investments. Previously, Ms. Laurent was Senior Vice President and Head of Legal for Fidelity Business Services India Pvt. Ltd. (2006-2008), and Senior Vice President, Deputy General Counsel and Group Head for FMR LLC (2005-2006). |
Christine Reynolds (52) |
| Year of Election or Appointment: 2008 Chief Financial Officer of the Fidelity funds. Ms. Reynolds became President of Fidelity Pricing and Cash Management Services (FPCMS) in August 2008. Ms. Reynolds served as Chief Operating Officer of FPCMS (2007-2008). Previously, Ms. Reynolds served as President, Treasurer, and Anti-Money Laundering officer of the Fidelity funds (2004-2007). |
Michael H. Whitaker (43) |
| Year of Election or Appointment: 2008 Chief Compliance Officer of Fidelity's Fixed Income and Asset Allocation Funds. Mr. Whitaker also serves as Chief Compliance Officer of The North Carolina Capital Management Trust: Cash and Term Portfolios (2008-present). Mr. Whitaker is an employee of Fidelity Investments (2007-present). Prior to joining Fidelity Investments, Mr. Whitaker worked at MFS Investment Management where he served as Senior Vice President and Chief Compliance Officer (2004-2006), and Assistant General Counsel. |
Jeffrey S. Christian (49) |
| Year of Election or Appointment: 2009 Deputy Treasurer of the Fidelity funds. Mr. Christian is an employee of Fidelity Investments. Previously, Mr. Christian served as Chief Financial Officer (2008-2009) of certain Fidelity funds and Senior Vice President of Fidelity Pricing and Cash Management Services (FPCMS) (2004-2009). |
Bryan A. Mehrmann (49) |
| Year of Election or Appointment: 2005 Deputy Treasurer of the Fidelity funds. Mr. Mehrmann is an employee of Fidelity Investments. |
Stephanie J. Dorsey (41) |
| Year of Election or Appointment: 2008 Deputy Treasurer of Fidelity's Fixed Income and Asset Allocation Funds. Ms. Dorsey also serves as Assistant Treasurer of other Fidelity funds (2010-present) and is an employee of Fidelity Investments (2008-present). Previously, Ms. Dorsey served as Treasurer (2004-2008) of the JPMorgan Mutual Funds and Vice President (2004-2008) of JPMorgan Chase Bank. |
Adrien E. Deberghes (43) |
| Year of Election or Appointment: 2010 Assistant Treasurer of Fidelity's Fixed Income and Asset Allocation Funds. Mr. Deberghes also serves as Deputy Treasurer of other Fidelity funds (2008-present) and is an employee of Fidelity Investments (2008-present). Previously, Mr. Deberghes served as Senior Vice President of Mutual Fund Administration at State Street Corporation (2007-2008), Senior Director of Mutual Fund Administration at Investors Bank & Trust (2005-2007), and Director of Finance for Dunkin' Brands (2000-2005). |
Kenneth B. Robins (41) |
| Year of Election or Appointment: 2009 Assistant Treasurer of the Fidelity Fixed Income and Asset Allocation Funds. Mr. Robins also serves as President and Treasurer of other Fidelity funds (2008-present; 2010-present) and is an employee of Fidelity Investments (2004-present). Previously, Mr. Robins served as Deputy Treasurer of the Fidelity funds (2005-2008) and Treasurer and Chief Financial Officer of The North Carolina Capital Management Trust: Cash and Term Portfolios (2006-2008). |
Gary W. Ryan (52) |
| Year of Election or Appointment: 2005 Assistant Treasurer of the Fidelity funds. Mr. Ryan is an employee of Fidelity Investments. Previously, Mr. Ryan served as Vice President of Fund Reporting in Fidelity Pricing and Cash Management Services (FPCMS) (1999-2005). |
Jonathan Davis (42) |
| Year of Election or Appointment: 2010 Assistant Treasurer of the Fidelity funds. Mr. Davis is an employee of Fidelity Investments. Previously, Mr. Davis served as Vice President and Associate General Counsel of FMR LLC (2003-2010). |
Annual Report
The funds hereby designate as capital gain dividend the amounts noted below for the taxable year ended March 31, 2011, or, if subsequently determined to be different, the net capital gain of such year.
Treasury Portfolio | $15 |
Tax-Exempt Portfolio | $17,153 |
The funds hereby designate the amounts noted below as distributions paid during the period January 1, 2011 to March 31, 2011 as qualifying to be taxed as interest-related dividends for nonresident alien shareholders:
Treasury Only Portfolio | $190,870 |
Treasury Portfolio | $328,113 |
Government Portfolio | $1,782,870 |
Prime Money Market Portfolio | $25,283,980 |
Money Market Portfolio | $26,508,110 |
A percentage of the dividends distributed during the fiscal year for the following funds were derived from interest on U.S. Government securities which is generally exempt from state income tax:
Treasury Only Portfolio | 100% |
Treasury Portfolio | 39.34% |
Government Portfolio | 42.47% |
Prime Money Market Portfolio | 6.41% |
Money Market Portfolio | 6.94% |
During fiscal year ended 2011, 100% of Tax Exempt Portfolio's income dividends were free from federal income tax, and .02% of the fund's income dividends were subject to the federal alternative minimum tax.
The funds will notify shareholders in January 2012 of amounts for use in preparing 2011 income tax returns.
Annual Report
Investment Adviser
Fidelity Management & Research Company
Boston, MA
Investment Sub-Advisers
Fidelity Investments Money Management, Inc.
Fidelity Management & Research (U.K.) Inc.
Fidelity Management & Research (Hong Kong) Limited
Fidelity Management & Research (Japan) Inc.
General Distributor
Fidelity Distributors Corporation
Boston, MA
Transfer and Service Agents
Fidelity Investments Institutional Operations Company, Inc.
Boston, MA
Citibank, N.A.
New York, NY
Tax-Exempt Portfolio
Fidelity Service Company, Inc.
Boston, MA
Treasury Only Portfolio, Treasury Portfolio,
Government Portfolio, Prime Money Market
Portfolio, and Money Market Portfolio
Custodians
The Bank of New York Mellon
New York, NY
Treasury Only Portfolio, Treasury Portfolio,
Government Portfolio, Prime Money Market
Portfolio, and Money Market Portfolio
Citibank, N.A.
New York, NY
Tax-Exempt Portfolio
IMM-ANN-0511
1.701843.113

Item 2. Code of Ethics
As of the end of the period, March 31, 2011, Fidelity Colchester Street Trust (the trust) has adopted a code of ethics, as defined in Item 2 of Form N-CSR, that applies to its President and Treasurer and its Chief Financial Officer. A copy of the code of ethics is filed as an exhibit to this Form N-CSR.
Item 3. Audit Committee Financial Expert
The Board of Trustees of the trust has determined that Marie L. Knowles is an audit committee financial expert, as defined in Item 3 of Form N-CSR. Ms. Knowles is independent for purposes of Item 3 of Form N-CSR.
Item 4. Principal Accountant Fees and Services
Fees and Services
The following table presents fees billed by Deloitte & Touche LLP, the member firms of Deloitte Touche Tohmatsu, and their respective affiliates (collectively, "Deloitte Entities") in each of the last two fiscal years for services rendered to Government Portfolio, Money Market Portfolio, Prime Money Market Portfolio, Tax-Exempt Portfolio, Treasury Only Portfolio and Treasury Portfolio (the "Funds"):
Services Billed by Deloitte Entities
March 31, 2011 FeesA
| Audit Fees | Audit-Related Fees | Tax Fees | All Other Fees |
Government Portfolio | $27,000 | $- | $4,600 | $600 |
Money Market Portfolio | $26,000 | $- | $4,600 | $1,200 |
Prime Money Market Portfolio | $26,000 | $- | $4,600 | $1,300 |
Tax-Exempt Portfolio | $26,000 | $- | $4,600 | $100 |
Treasury Only Portfolio | $26,000 | $- | $4,600 | $200 |
Treasury Portfolio | $26,000 | $- | $4,600 | $300 |
March 31, 2010 FeesA
| Audit Fees | Audit-Related Fees | Tax Fees | All Other Fees |
Government Portfolio | $28,000 | $- | $4,500 | $- |
Money Market Portfolio | $27,000 | $- | $4,500 | $- |
Prime Money Market Portfolio | $29,000 | $- | $4,500 | $- |
Tax-Exempt Portfolio | $27,000 | $- | $4,500 | $- |
Treasury Only Portfolio | $27,000 | $- | $4,500 | $- |
Treasury Portfolio | $29,000 | $- | $4,500 | $- |
A Amounts may reflect rounding.
The following table presents fees billed by Deloitte Entities that were required to be approved by the Audit Committee for services that relate directly to the operations and financial reporting of the Funds and that are rendered on behalf of Fidelity Management & Research Company ("FMR") and entities controlling, controlled by, or under common control with FMR (not including any sub-adviser whose role is primarily portfolio management and is subcontracted with or overseen by another investment adviser) that provide ongoing services to the Funds ("Fund Service Providers"):
Services Billed by Deloitte Entities
| March 31, 2011A | March 31, 2010A |
Audit-Related Fees | $645,000 | $725,000 |
Tax Fees | $- | $- |
All Other Fees | $730,000 | $450,000 |
A Amounts may reflect rounding.
"Audit-Related Fees" represent fees billed for assurance and related services that are reasonably related to the performance of the fund audit or the review of the fund's financial statements and that are not reported under Audit Fees.
"Tax Fees" represent fees billed for tax compliance, tax advice or tax planning that relate directly to the operations and financial reporting of the fund.
"All Other Fees" represent fees billed for services provided to the fund or Fund Service Provider, a significant portion of which are assurance related, that relate directly to the operations and financial reporting of the fund, excluding those services that are reported under Audit Fees, Audit-Related Fees or Tax Fees.
Assurance services must be performed by an independent public accountant.
* * *
The aggregate non-audit fees billed by Deloitte Entities for services rendered to the Funds, FMR (not including any sub-adviser whose role is primarily portfolio management and is subcontracted with or overseen by another investment adviser), and any Fund Service Provider for each of the last two fiscal years of the Funds are as follows:
Billed By | March 31, 2011 A | March 31, 2010 A |
Deloitte Entities | $1,500,000 | $1,220,000B |
A Amounts may reflect rounding.
B Reflects current period presentation.
The trust's Audit Committee has considered non-audit services that were not pre-approved that were provided by Deloitte Entities to Fund Service Providers to be compatible with maintaining the independence of Deloitte Entities in its audit of the Funds, taking into account representations from Deloitte Entities, in accordance with Public Company Accounting Oversight Board rules, regarding its independence from the Funds and their related entities and FMR's review of the appropriateness and permissibility under applicable law of such non-audit services prior to their provision to the Fund Service Providers.
Audit Committee Pre-Approval Policies and Procedures
The trust's Audit Committee must pre-approve all audit and non-audit services provided by a fund's independent registered public accounting firm relating to the operations or financial reporting of the fund. Prior to the commencement of any audit or non-audit services to a fund, the Audit Committee reviews the services to determine whether they are appropriate and permissible under applicable law.
The Audit Committee has adopted policies and procedures to, among other purposes, provide a framework for the Committee's consideration of non-audit services by the audit firms that audit the Fidelity funds. The policies and procedures require that any non-audit service provided by a fund audit firm to a Fidelity fund and any non-audit service provided by a fund auditor to a Fund Service Provider that relates directly to the operations and financial reporting of a Fidelity fund ("Covered Service") are subject to approval by the Audit Committee before such service is provided.
All Covered Services must be approved in advance of provision of the service either: (i) by formal resolution of the Audit Committee, or (ii) by oral or written approval of the service by the Chair of the Audit Committee (or if the Chair is unavailable, such other member of the Audit Committee as may be designated by the Chair to act in the Chair's absence). The approval contemplated by (ii) above is permitted where the Treasurer determines that action on such an engagement is necessary before the next meeting of the Audit Committee.
Non-audit services provided by a fund audit firm to a Fund Service Provider that do not relate directly to the operations and financial reporting of a Fidelity fund are reported to the Audit Committee on a periodic basis.
Non-Audit Services Approved Pursuant to Rule 2-01(c)(7)(i)(C) and (ii) of Regulation S-X ("De Minimis Exception")
There were no non-audit services approved or required to be approved by the Audit Committee pursuant to the De Minimis Exception during the Funds' last two fiscal years relating to services provided to (i) the Funds or (ii) any Fund Service Provider that relate directly to the operations and financial reporting of the Funds.
Item 5. Audit Committee of Listed Registrants
Not applicable.
Item 6. Investments
(a) Not applicable.
(b) Not applicable
Item 7. Disclosure of Proxy Voting Policies and Procedures for Closed-End Management Investment Companies
Not applicable.
Item 8. Portfolio Managers of Closed-End Management Investment Companies
Not applicable.
Item 9. Purchase of Equity Securities by Closed-End Management Investment Company and Affiliated Purchasers
Not applicable.
Item 10. Submission of Matters to a Vote of Security Holders
There were no material changes to the procedures by which shareholders may recommend nominees to the trust's Board of Trustees.
Item 11. Controls and Procedures
(a)(i) The President and Treasurer and the Chief Financial Officer have concluded that the trust's disclosure controls and procedures (as defined in Rule 30a-3(c) under the Investment Company Act) provide reasonable assurances that material information relating to the trust is made known to them by the appropriate persons, based on their evaluation of these controls and procedures as of a date within 90 days of the filing date of this report.
(a)(ii) There was no change in the trust's internal control over financial reporting (as defined in Rule 30a-3(d) under the Investment Company Act) that occurred during the second fiscal quarter of the period covered by this report that has materially affected, or is reasonably likely to materially affect, the trust's internal control over financial reporting.
Item 12. Exhibits
(a) | (1) | Code of Ethics pursuant to Item 2 of Form N-CSR is filed and attached hereto as EX-99.CODE ETH. |
(a) | (2) | Certification pursuant to Rule 30a-2(a) under the Investment Company Act of 1940 (17 CFR 270.30a-2(a)) is filed and attached hereto as Exhibit 99.CERT. |
(a) | (3) | Not applicable. |
(b) | | Certification pursuant to Rule 30a-2(b) under the Investment Company Act of 1940 (17 CFR 270.30a-2(b)) is furnished and attached hereto as Exhibit 99.906CERT. |
SIGNATURES
Pursuant to the requirements of the Securities Exchange Act of 1934 and the Investment Company Act of 1940, the registrant has duly caused this report to be signed on its behalf by the undersigned, thereunto duly authorized.
Fidelity Colchester Street Trust
By: | /s/John R. Hebble |
| John R. Hebble |
| President and Treasurer |
| |
Date: | May 25, 2011 |
Pursuant to the requirements of the Securities Exchange Act of 1934 and the Investment Company Act of 1940, this report has been signed below by the following persons on behalf of the registrant and in the capacities and on the dates indicated.
By: | /s/John R. Hebble |
| John R. Hebble |
| President and Treasurer |
| |
Date: | May 25, 2011 |
By: | /s/Christine Reynolds |
| Christine Reynolds |
| Chief Financial Officer |
| |
Date: | May 25, 2011 |