PINNACLE SM
ENTERTAINMENT
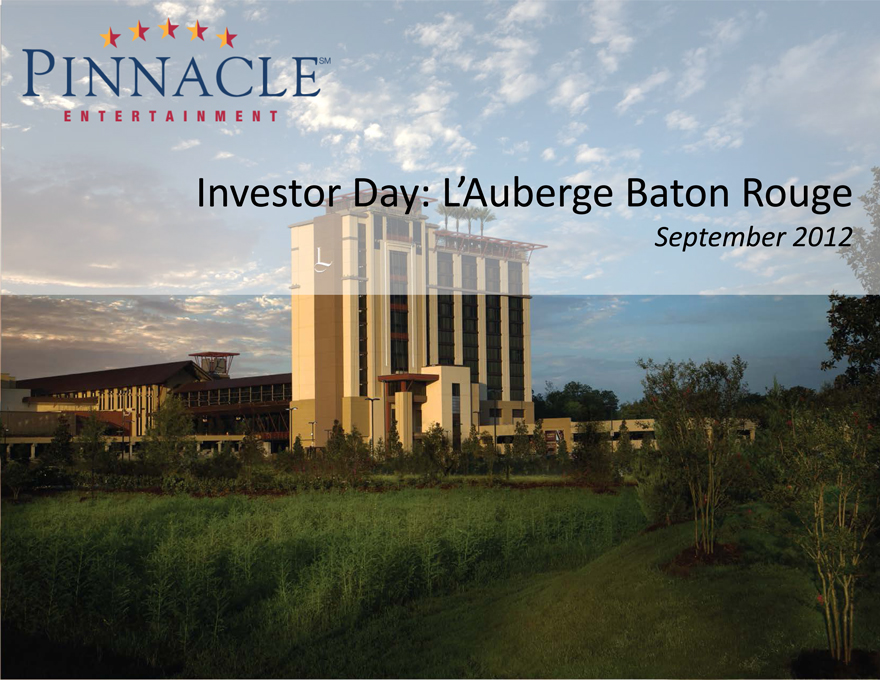
Investor Day: L’Auberge Baton Rouge
September 2012
Safe Harbor/Non-GAAP Financial Disclosures
All statements included in this presentation, other than historical information or statements of historical fact, are “forward-looking statements” within the meaning of the Private Securities Litigation Reform Act of 1995. These forward-looking statements, including statements regarding the Company’s future operating performance, future growth, anticipated milestones, completion and opening schedules of various projects, construction schedules and budgets of the various projects, amenities and features of the various projects, continued improvement of operations at our properties, the Ho Tram Strip, potential growth for ACDL and potential growth of the gaming markets in Vietnam and throughout Asia, the completion of the first and second integrated resort of the Ho Tram Strip, the expected returns of the Company’s various development projects and investments, and the ability of the Company to borrow as it constructs its various projects under its Credit Facility, are based on management’s current expectations and are subject to risks, uncertainties and changes in circumstances that could significantly affect future results. Accordingly, Pinnacle cautions that the forward-looking statements contained herein are qualified by important factors that could cause actual results to differ materially from those reflected by such statements. Such factors include, but are not limited to: (a) the Company’s business is particularly sensitive to reductions in consumers’ discretionary spending as a result of downturns in the economy or other changes it cannot accurately predict; (b) the gaming industry is very competitive and increased competition could adversely affect our profitability; (c) many factors could prevent the Company from completing its construction and development projects as planned, including the escalation of construction costs beyond increments anticipated in construction budgets; (d) the Company’s substantial development plans for capital-intensive projects will require the Company to borrow significant amounts under the Company’s credit facility and, depending on which projects are pursued to completion, may cause the Company to incur substantial additional indebtedness; (e) the Company is subject to risks associated with geographic market concentration in Louisiana; (f) insufficient or lower-than-expected results generated from the Company’s new developments and acquired properties may not yield adequate or expected returns on the Company’s substantial investments; (g) the Company’s industry is highly regulated, which makes the Company dependent on obtaining and maintaining gaming licenses and subjects the Company to potentially significant fines and penalties; (h) we face many risks associated with our investment in a privately held company, ACDL, that is developing a complex of integrated resorts in Vietnam, such as ACDL’s ability to raise capital to complete the first phase of first integrated resort and to fund the development of subsequent phases of the planned resort complex, among other risks; (i) the Company operates in a highly taxed industry and may be subject to higher taxes in the future; (j) the Company may not realize gains on the Company’s proposed investment in a joint venture that is planning to develop gaming resorts in Vietnam; the Company’s involvement in Vietnam could expose us to risks associated with violations of the Foreign Corrupt Practices Act or applicable anti-money laundering regulations, which could have a negative impact on the Company; (k) the global financial crisis and recession has affected the Company’s business and financial condition, and may continue to affect the Company in ways that the Company currently cannot accurately predict; (l) adverse weather conditions, road construction, gasoline shortages and other factors affecting the Company’s facilities and the areas in which the Company operates could make it more difficult for potential customers to travel to the Company’s properties and deter customers from visiting the Company’s properties; and (m) other risks, including those as may be detailed from time to time in the Company’s filings with the Securities and Exchange Commission (“SEC”). For more information on the potential factors that could affect the Company’s financial results and business, review the Company’s filings with the SEC, including, but not limited to, its Annual Report on Form 10-K, its Quarterly Reports on Form 10-Q and its Current Reports on Form 8 -K.
*** Statements in this presentation may include adjusted financial measures governed by Regulation G. For a reconciliation of these measures, please see the end of this presentation or visit the Investor Relations section of our corporate website at www.pnkinc.com.
2
Opening Remarks
Anthony Sanfilippo, President & CEO
3
Management Presenters
Anthony Sanfilippo Carlos Ruisanchez Ginny Shanks
President & Chief Executive Officer Executive Vice President & Chief Financial Officer Executive Vice President & Chief Marketing Officer
Geno Iafrate Neil Walkoff
EVP of Regional Operations EVP of Regional Operations
4
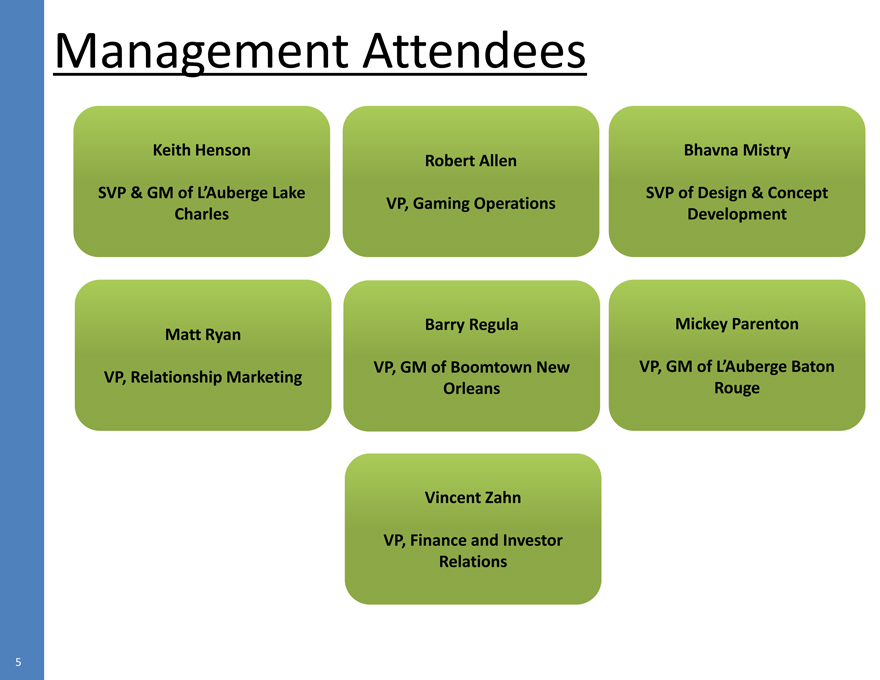
Management Attendees
Keith Henson Bhavna Mistry
Robert Allen
SVP & GM of L’Auberge Lake Charles VP, Gaming Operations SVP of Design & Concept Development
Matt Ryan Barry Regula Mickey Parenton
VP, Relationship Marketing VP, GM of Boomtown New Orleans VP, GM of L’Auberge Baton Rouge
Vincent Zahn
VP, Finance and Investor Relations
5
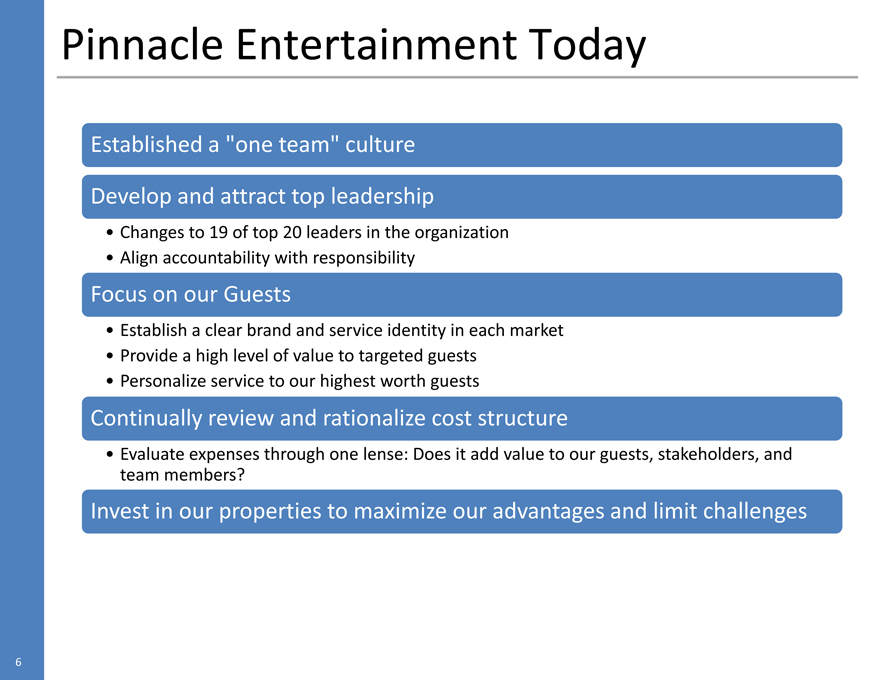
Pinnacle Entertainment Today
Established a “one team” culture Develop and attract top leadership
• Changes to 19 of top 20 leaders in the organization
• Align accountability with responsibility
Focus on our Guests
• Establish a clear brand and service identity in each market
• Provide a high level of value to targeted guests
• Personalize service to our highest worth guests
Continually review and rationalize cost structure
• Evaluate expenses through one lense: Does it add value to our guests, stakeholders, and team members?
Invest in our properties to maximize our advantages and limit challenges
6
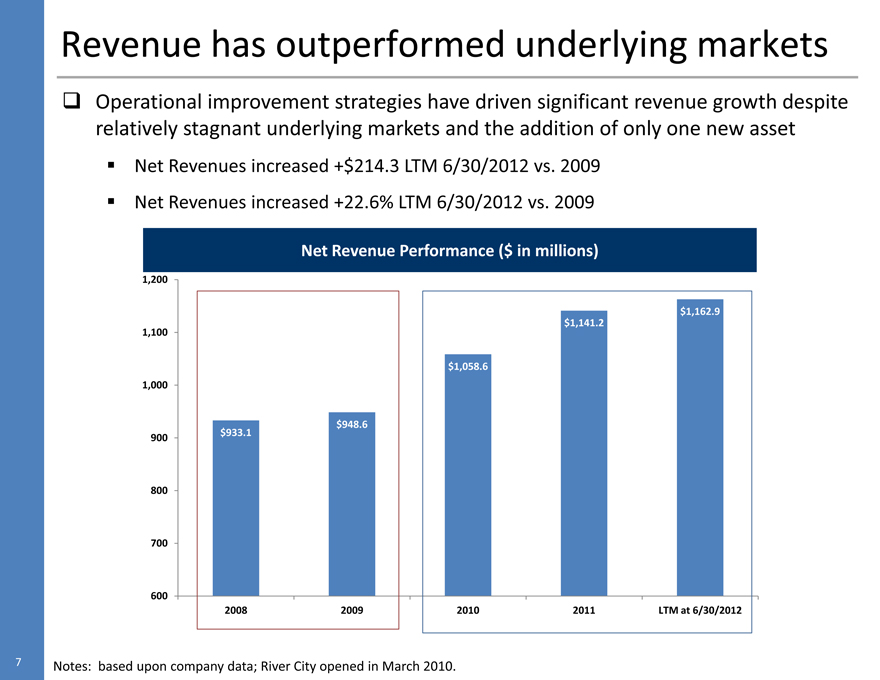
Revenue has outperformed underlying markets
Operational improvement strategies have driven significant revenue growth despite relatively stagnant underlying markets and the addition of only one new asset
Net Revenues increased +$214.3 LTM 6/30/2012 vs. 2009
Net Revenues increased +22.6% LTM 6/30/2012 vs. 2009
Net Revenue Performance ($ in millions)
1,200
$1,162.9
$1,141.2
1,100
$1,058.6
1,000
$948.6
900 $933.1
800
700
600
2008 2009 2010 2011 LTM at 6/30/2012
Notes: based upon company data; River City opened in March 2010.
7
EBITDA has improved dramatically
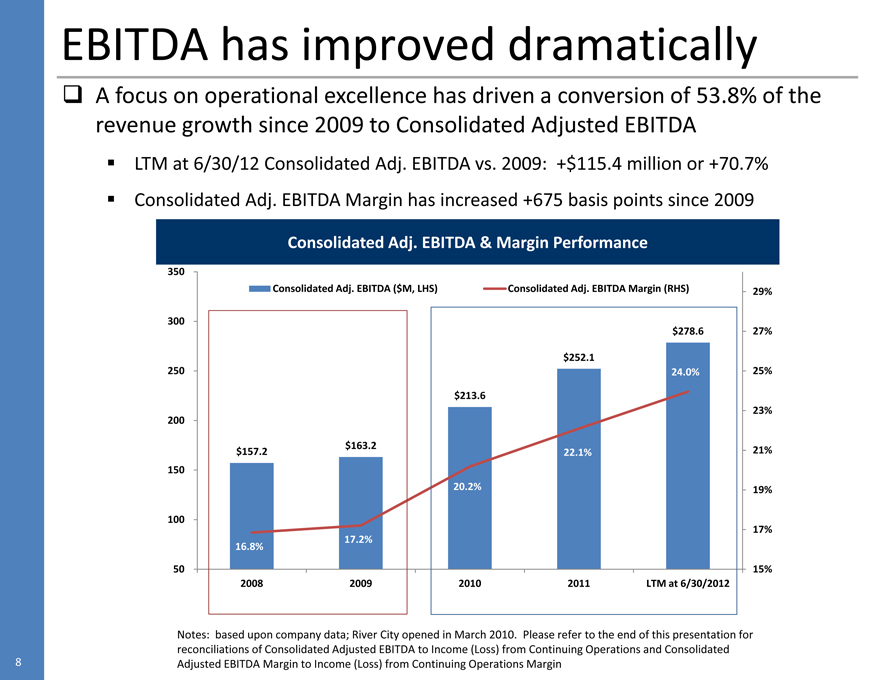
A focus on operational excellence has driven a conversion of 53.8% of the revenue growth since 2009 to Consolidated Adjusted EBITDA
LTM at 6/30/12 Consolidated Adj. EBITDA vs. 2009: +$115.4 million or +70.7%
• Consolidated Adj. EBITDA Margin has increased +675 basis points since 2009
• Consolidated Adj. EBITDA & Margin Performance
350
Consolidated Adj. EBITDA ($M, LHS)
300
250
200
$157.2 $163.2
150
100
16.8% 17.2%
50
2008 2009
Consolidated Adj. EBITDA Margin (RHS) 29%
$278.6 27%
$252.1
24.0% 25%
$213.6
23%
22.1% 21%
20.2% 19%
17%
15%
2010 2011 LTM at 6/30/2012
Notes: based upon company data; River City opened in March 2010. Please refer to the end of this presentation for reconciliations of Consolidated Adjusted EBITDA to Income (Loss) from Continuing Operations and Consolidated Adjusted EBITDA Margin to Income (Loss) from Continuing Operations Margin
8
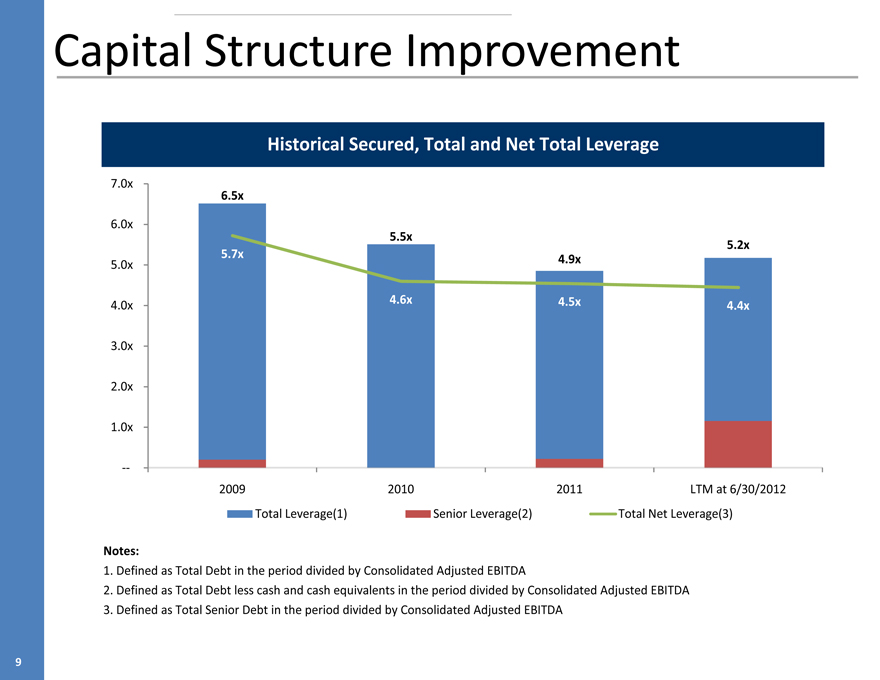
Capital Structure Improvement
Historical Secured, Total and Net Total Leverage
7.0x
6.5x
6.0x
5.5x 5.2x
5.7x 4.9x
5.0x
4.0x 4.6x 4.5x 4.4x
3.0x
2.0x
1.0x
--
2009 2010 2011 LTM at 6/30/2012
Total Leverage(1)
Senior Leverage(2)
Total Net Leverage(3)
Notes:
1. Defined as Total Debt in the period divided by Consolidated Adjusted EBITDA
2. Defined as Total Debt less cash and cash equivalents in the period divided by Consolidated Adjusted EBITDA
3. Defined as Total Senior Debt in the period divided by Consolidated Adjusted EBITDA
9
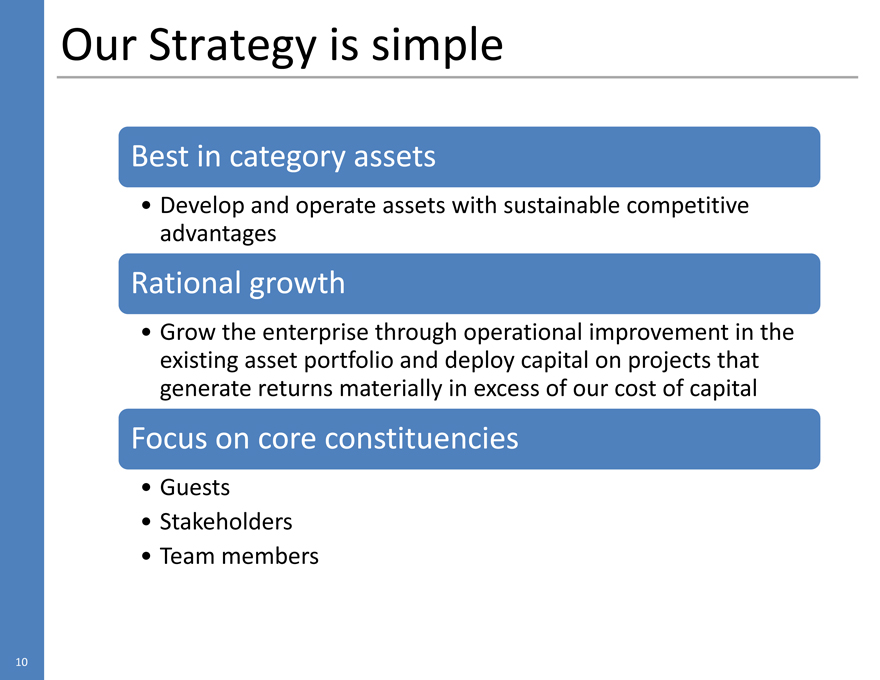
Our Strategy is simple
Best in category assets
• Develop and operate assets with sustainable competitive advantages
Rational growth
• Grow the enterprise through operational improvement in the existing asset portfolio and deploy capital on projects that generate returns materially in excess of our cost of capital
Focus on core constituencies
• Guests
• Stakeholders
• Team members
10
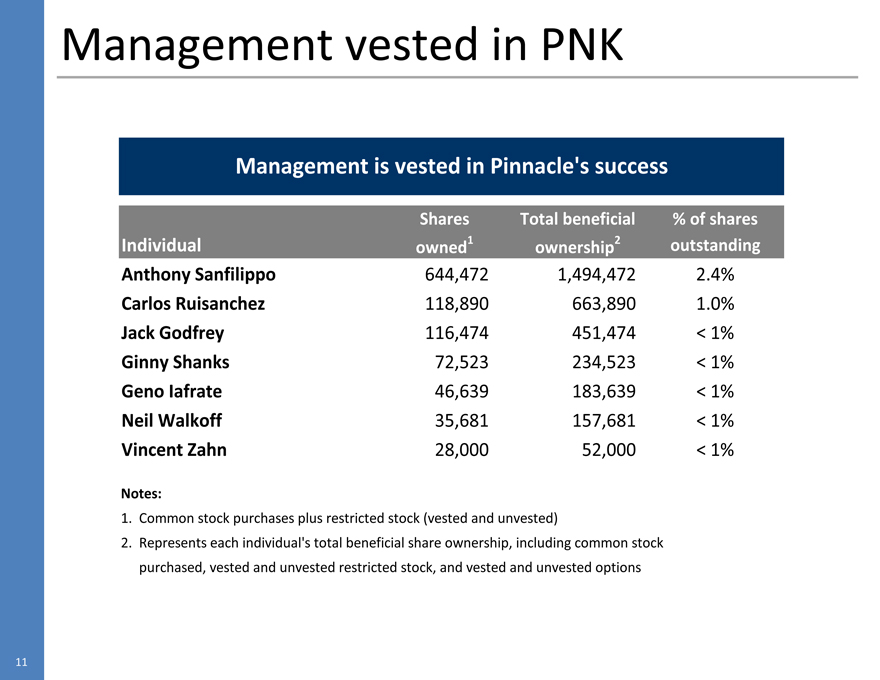
Management vested in PNK
Management is vested in Pinnacle’s success
Shares Total beneficial % of shares
Individual owned1 ownership2 outstanding
Anthony Sanfilippo 644,472 1,494,472 2.4%
Carlos Ruisanchez 118,890 663,890 1.0%
Jack Godfrey 116,474 451,474 < 1%
Ginny Shanks 72,523 234,523 < 1%
Geno Iafrate 46,639 183,639 < 1%
Neil Walkoff 35,681 157,681 < 1%
Vincent Zahn 28,000 52,000 < 1%
Notes:
1. Common stock purchases plus restricted stock (vested and unvested)
2. Represents each individual’s total beneficial share ownership, including common stock purchased, vested and unvested restricted stock, and vested and unvested options
11
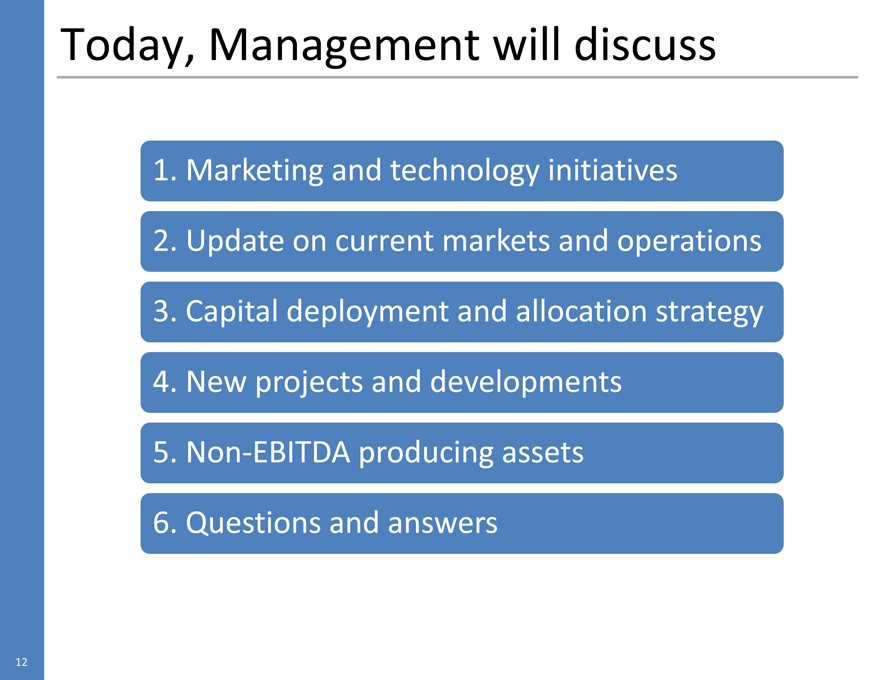
Today, Management will discuss
1. Marketing and technology initiatives
2. Update on current markets and operations
3. Capital deployment and allocation strategy
4. New projects and developments
5. Non-EBITDA producing assets
6. Questions and answers
12
Marketing & Technology
Ginny Shanks, Chief Marketing Officer
13
Marketing priorities
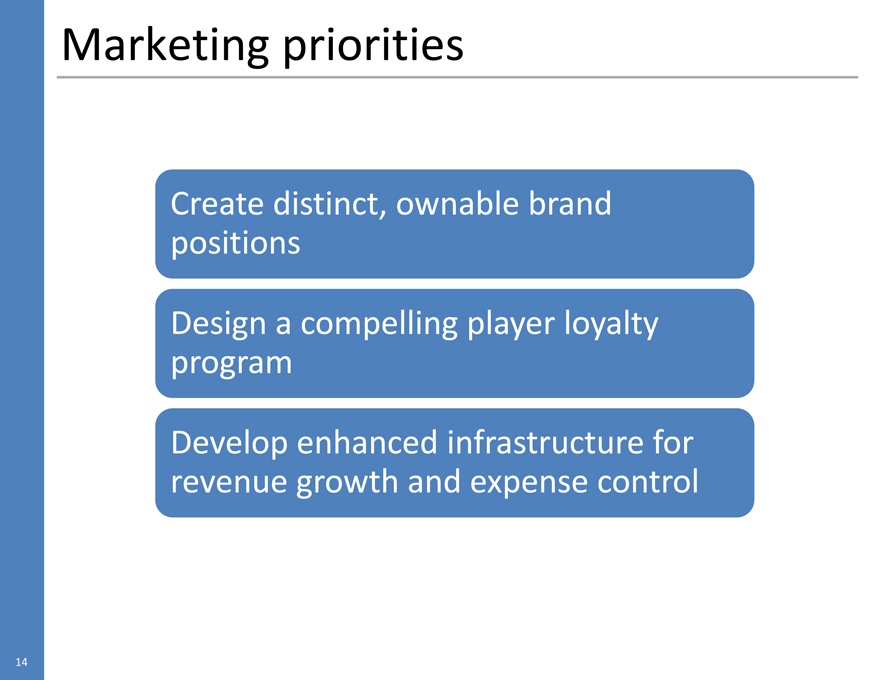
Create distinct, ownable brand positions
Design a compelling player loyalty program
Develop enhanced infrastructure for revenue growth and expense control
14
Develop Brands…Not Just Casinos
All-You-Can-Eat
Whole Maine Lobster Buffet
$24.99 Friday & Saturday 5pm-11pm
($26.99 without mychoicesm card)
Ready for a tasty dinner deal? Then come fill your weekend with
an all-you-can-eat, buffet feast, which includes all the whole Maine lobster
you can handle and endless plates of all your buffet favorites!
BOOMTOWN
CASINO HOTEL
It just feels right.
Boomtownbossier.com 1.866.GO2TOWN (462-8696)
Generic casino
“Boomtown” – centric
IN HERE,
everyone’s a winner.
EXCEPT
YOUR DIET.
WELCOME TO
BOOMTOWN
CASINO HOTEL
15
Distinct Brand Positions
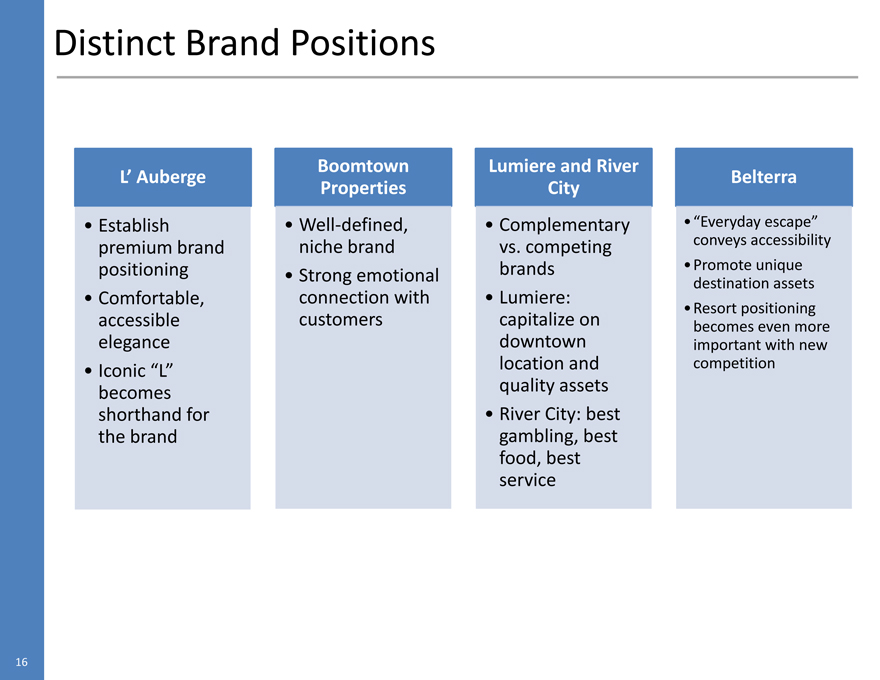
L’ Auberge
Establish premium brand positioning
Comfortable, accessible elegance
Iconic “L” becomes shorthand for the brand
Boomtown Properties
Well-defined, niche brand
Strong emotional connection with customers
Lumiere and River City
Complementary vs. competing brands
Lumiere: capitalize on downtown location and quality assets
River City: best gambling, best food, best service
Belterra
”Everyday escape” conveys accessibility
Promote unique destination assets
Resort positioning becomes even more important with new competition
16
mychoice: Why Change?
Parity in the market place
No industry loyalty program had a true competitive advantage
Created opportunity for differentiation
Opportunity for improvement
Void of real, valuable choices for consumers
Relatively low retention rate of best guests
Lacked standardization across enterprise
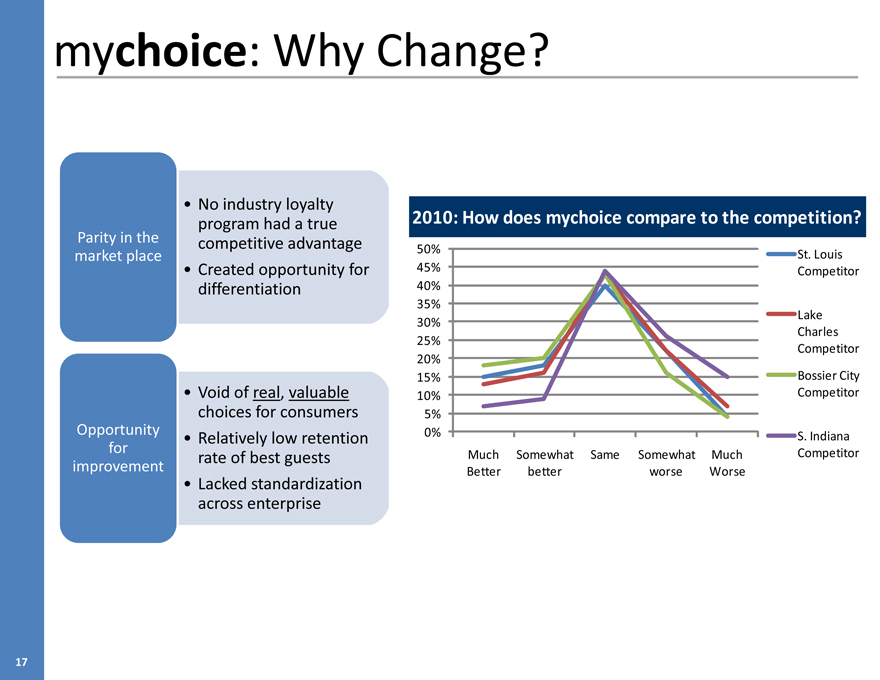
2010: How does mychoice compare to the competition?
50% St. Louis
45% Competitor
40%
35%
30% Lake
Charles
25% Competitor
20%
15% Bossier City
10% Competitor
5%
0% S. Indiana
Much Somewhat Same Somewhat Much Competitor
Better better worse Worse
17
mychoice: what changed?
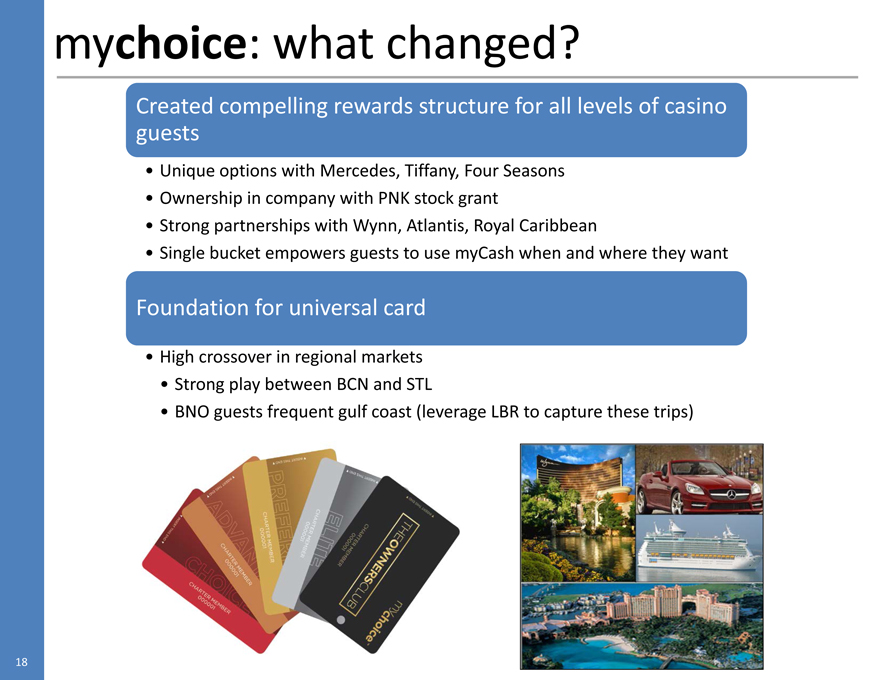
Created compelling rewards structure for all levels of casino guests
Unique options with Mercedes, Tiffany, Four Seasons
Ownership in company with PNK stock grant
Strong partnerships with Wynn, Atlantis, Royal Caribbean
Single bucket empowers guests to use myCash when and where they want
Foundation for universal card
High crossover in regional markets
Strong play between BCN and STL
BNO guests frequent gulf coast (leverage LBR to capture these trips)
18
mychoice: Results
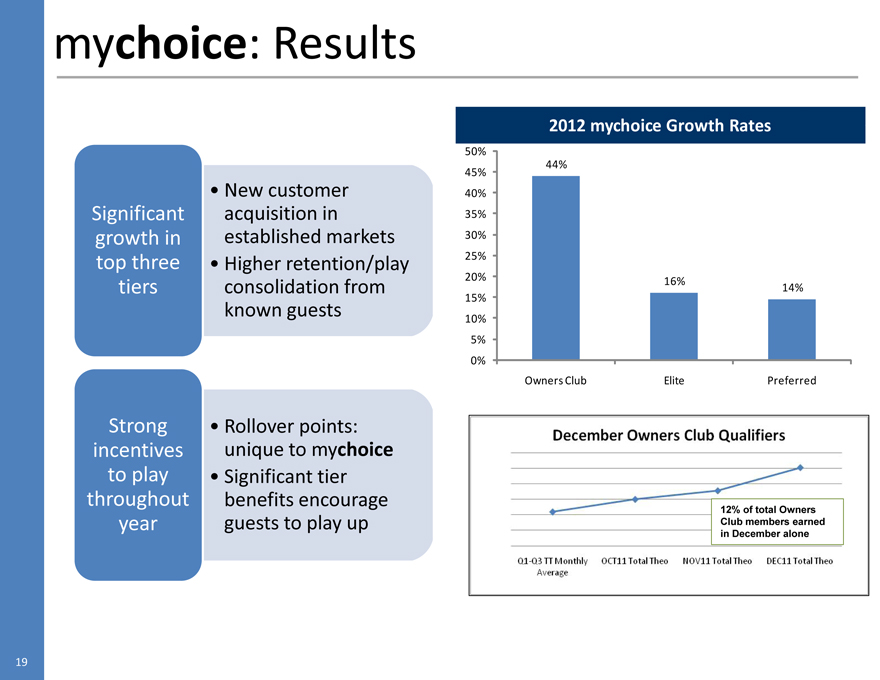
Significant growth in top three tiers
New customer acquisition in established markets
Higher retention/play consolidation from known guests
Strong incentives to play throughout year
Rollover points: unique to mychoice
Significant tier benefits encourage guests to play up
2012 mychoice Growth Rates
50%
45% 44%
40%
35%
30%
25%
20%
16%
14%
15%
10%
5%
0%
Owners Club
Elite Preferred
December Owners Club Qualifiers
12% of total Owners Club members earned in December alone
Q1-Q3 TT Monthly Average
OCT11 Total Theo
NOV11 Total Theo
DEC11 Total Theo
19
Improved Marketing Systems
Overhauled infrastructure to create unified marketing and analytics
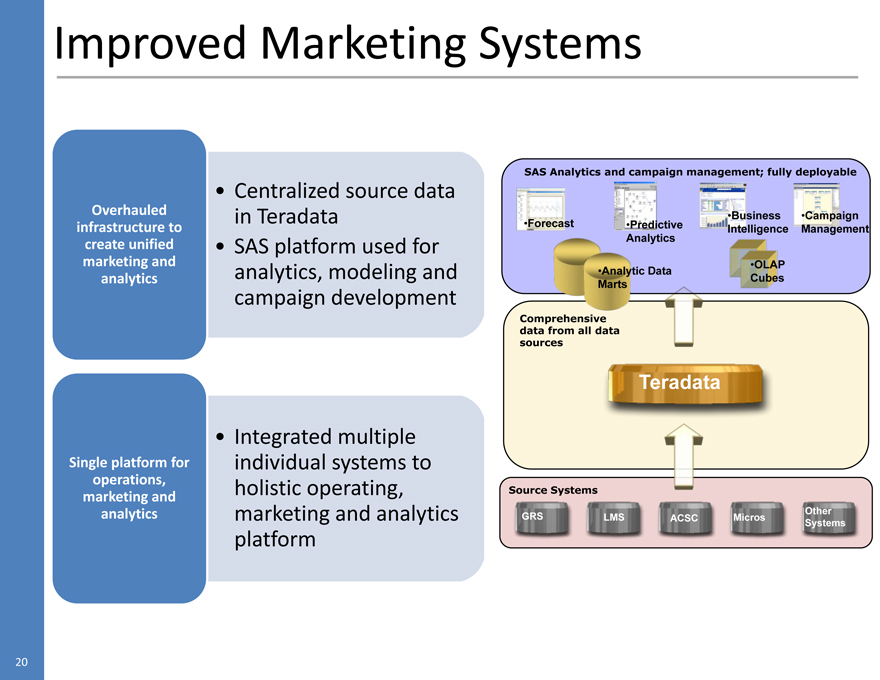
Centralized source data in Teradata
SAS platform used for analytics, modeling and campaign development
Single platform for operations, marketing and analytics
Integrated multiple individual systems to holistic operating, marketing and analytics platform
SAS Analytics and campaign management; fully deployable
Forecast
Predictive
Business Intelligence
Analytics
Campaign Management
Analytic Data
OLAP
Marts
Cubes
Comprehensive
data from all data
sources
Teradata
Source Systems
Other
GRS
LMS
ACSC
Micros
Systems
20
Engage Guests Through Multiple Channels
SAS decision science applied to
On Premise:
every card-in
Real Time
Business rules applied to decide
contact/offer strategy
Decision
Modeling
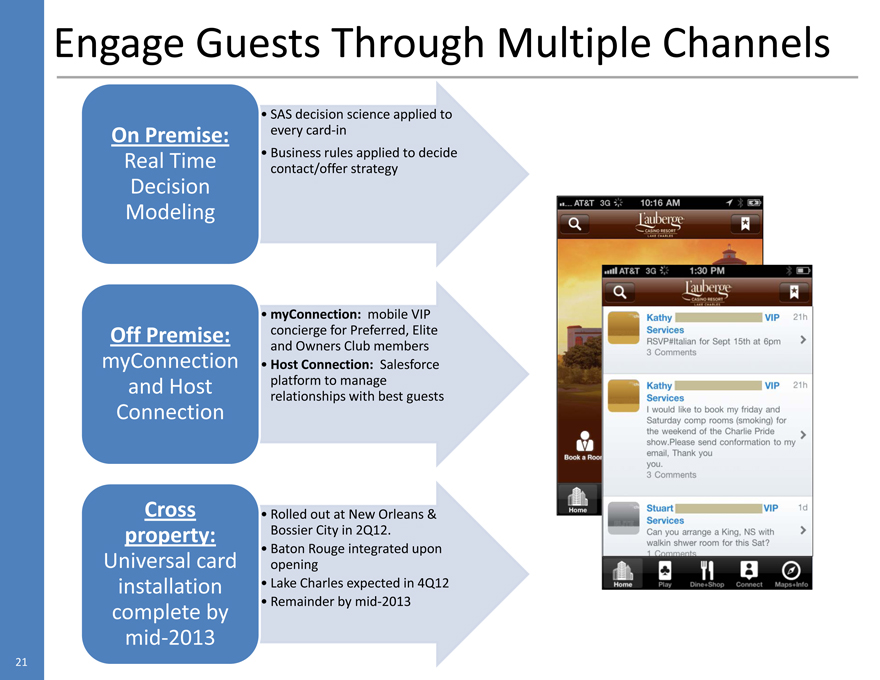
myConnection: mobile VIP
Off Premise:
concierge for Preferred, Elite
and Owners Club members
myConnection
Host Connection: Salesforce
and Host
platform to manage
relationships with best guests
Connection
Cross
Rolled out at New Orleans &
property:
Bossier City in 2Q12.
Baton Rouge integrated upon
Universal card
opening
installation
Lake Charles expected in 4Q12
complete by
Remainder by mid-2013
mid-2013
Kathy VIP 21h
Services RSVP#Italian for Sept 15th at 6pm 3 Comments
Kathy VIP 21h Services
I would like to book my friday and Saturday comp rooms (smoking) for the weekend of the Charlie Pride show.Please send conformation to my email. Thank you
you.
3 comments
Stuart VIP 1d Services
Can you arrange a King, NS with walkin shwer room for this Sat? 1 Comments
Home Play Dine-Shop Connect Maps-info
21
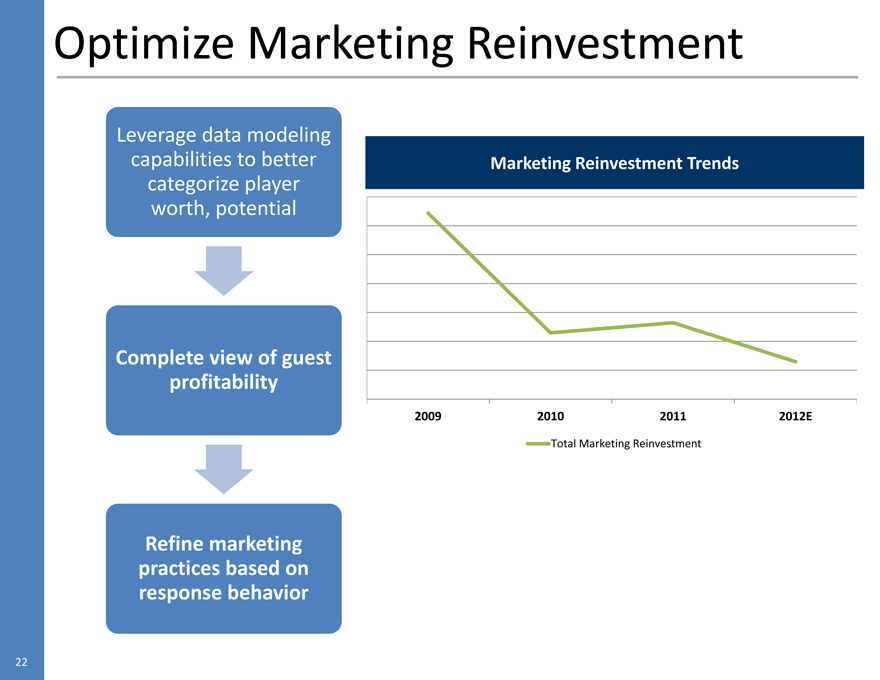
Optimize Marketing Reinvestment
Leverage data modeling capabilities to better categorize player worth, potential
Complete view of guest profitability
Refine marketing practices based on response behavior
Marketing Reinvestment Trends
2009
2010
2011
2012E
Total Marketing Reinvestment
22
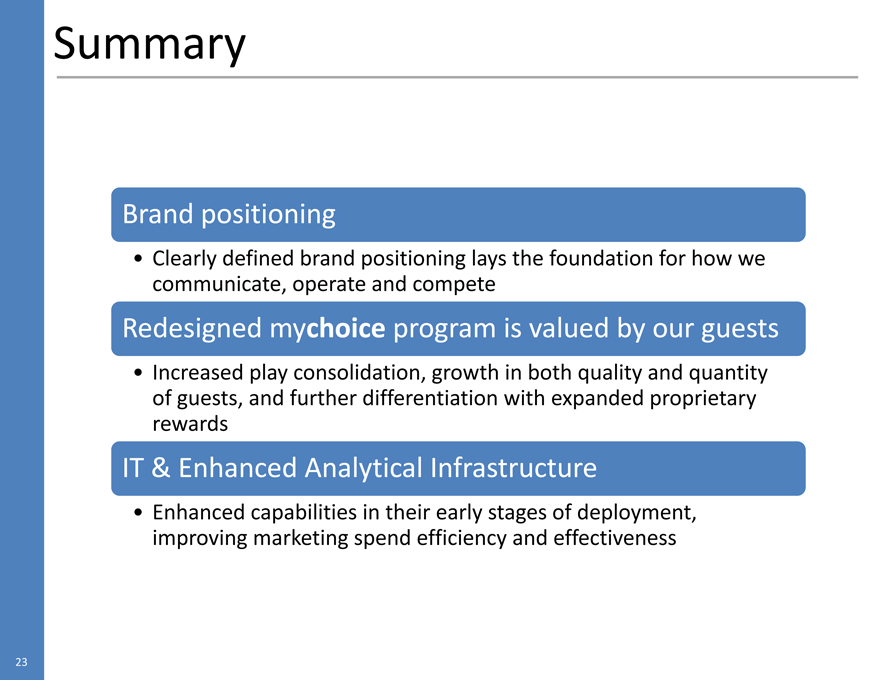
Summary
Brand positioning
Clearly defined brand positioning lays the foundation for how we communicate, operate and compete
Redesigned mychoice program is valued by our guests
Increased play consolidation, growth in both quality and quantity of guests, and further differentiation with expanded proprietary rewards
IT & Enhanced Analytical Infrastructure
Enhanced capabilities in their early stages of deployment, improving marketing spend efficiency and effectiveness
23
Operations
24
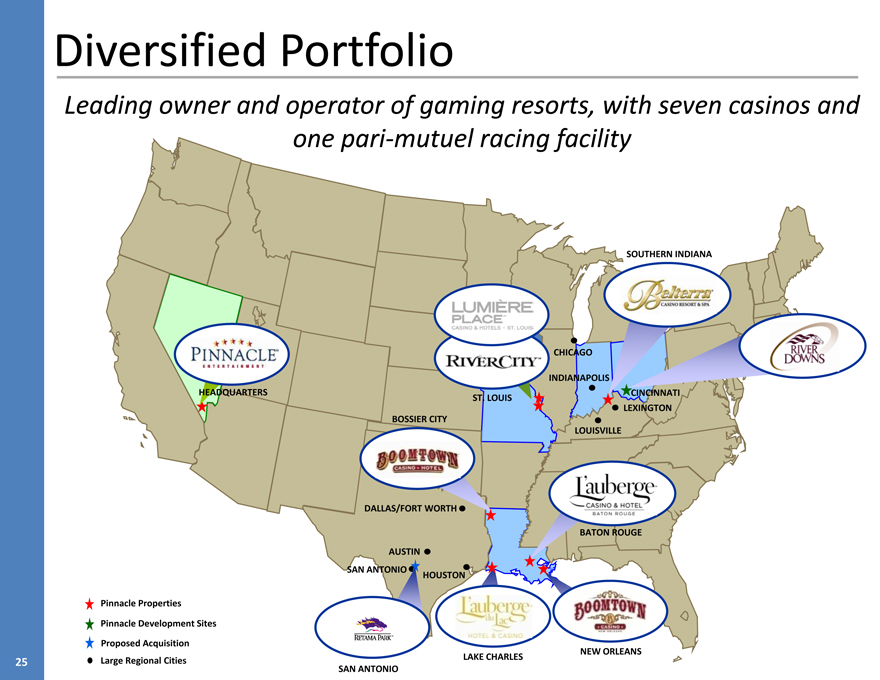
Diversified Portfolio
Leading owner and operator of gaming resorts, with seven casinos and one pari-mutuel racing facility
Pinnacle Properties
Pinnacle Development Sites Proposed Acquisition Large Regional Cities
25
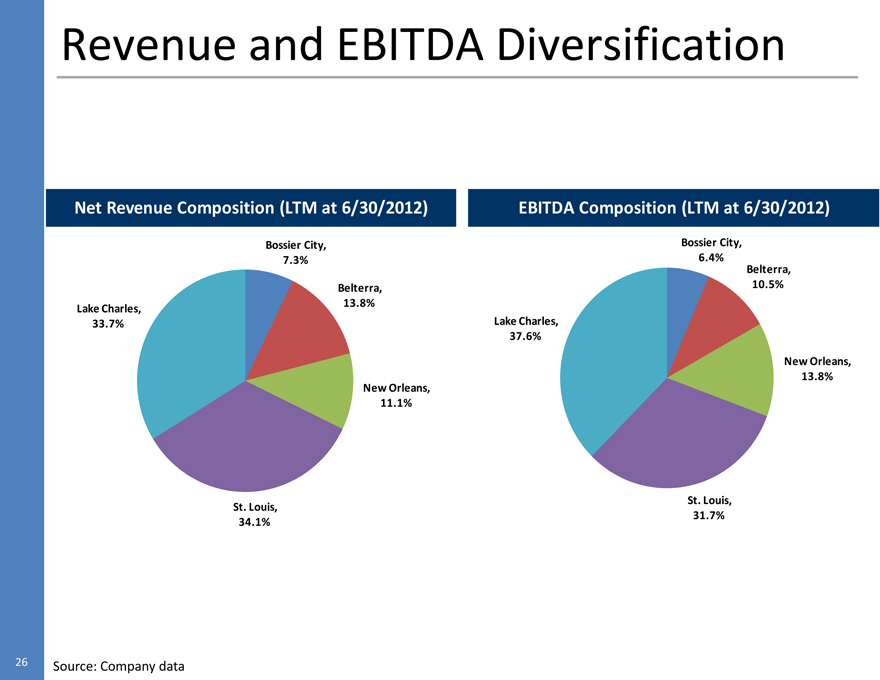
Revenue and EBITDA Diversification
Net Revenue Composition (LTM at 6/30/2012)
Bossier City,
7.3%
Belterra,
Lake Charles,
13.8%
33.7%
New Orleans,
11.1%
St. Louis,
34.1%
EBITDA Composition (LTM at 6/30/2012)
Bossier City,
6.4%
Belterra,
New Orleans,
10.5%
13.8%
Lake Charles,
37.6%
St. Louis,
31.7%
26
Louisiana
Geno Iafrate, EVP of Regional Operations
27
Baton Rouge
28
Overview
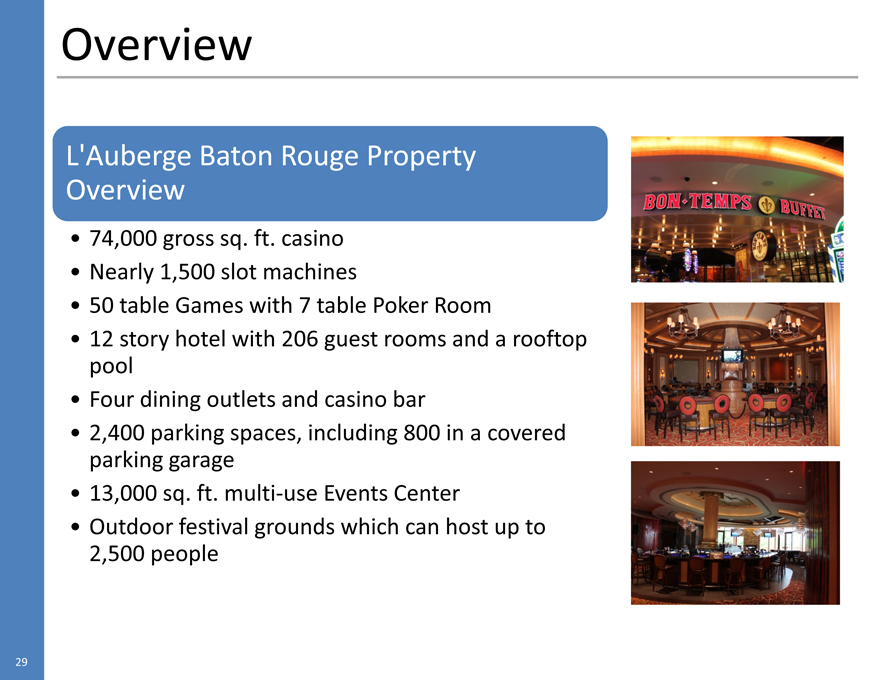
L’Auberge Baton Rouge Property Overview
74,000 gross sq. ft. casino Nearly 1,500 slot machines
50 table Games with 7 table Poker Room
12 story hotel with 206 guest rooms and a rooftop pool
Four dining outlets and casino bar
2,400 parking spaces, including 800 in a covered parking garage
13,000 sq. ft. multi-use Events Center
Outdoor festival grounds which can host up to 2,500 people
29
Baton Rouge Population Overview
2010 Census Data:
East Baton Rouge Parish, where L’Auberge Baton Rouge is located, is now the largest parish in the State with 440,000 and 6.6% growth.
Our two neighboring parishes had the most growth in the State with 39% each (Ascension and Livingston).
The nine parish capital region is now considered a major market with over 800,000 in population.
2.4M people live within a 90 minute drive of L’Auberge Baton Rouge
30
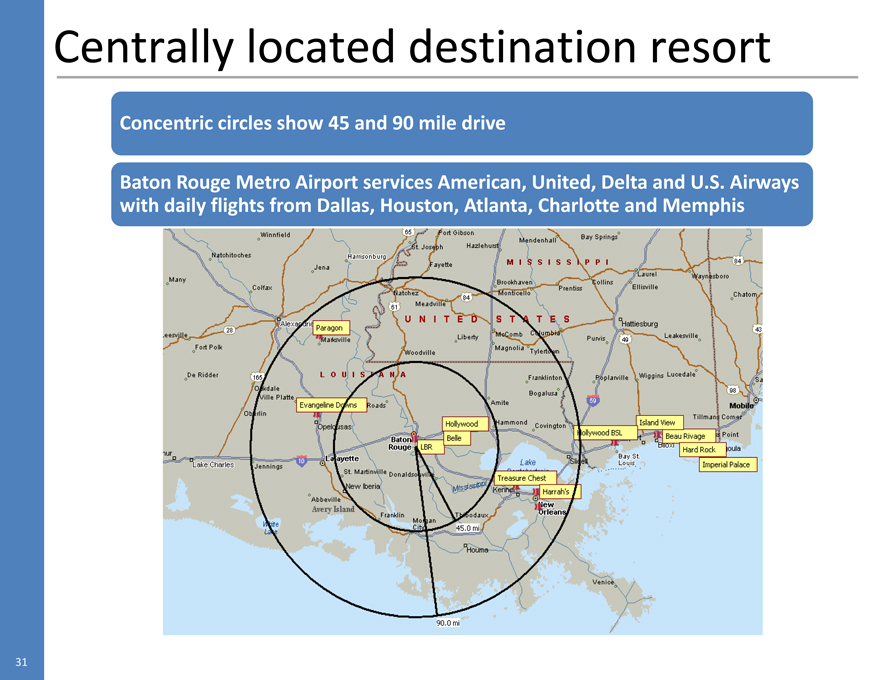
Centrally located destination resort
Concentric circles show 45 and 90 mile drive
Baton Rouge Metro Airport services American, United, Delta and U.S. Airways with daily flights from Dallas, Houston, Atlanta, Charlotte and Memphis
31
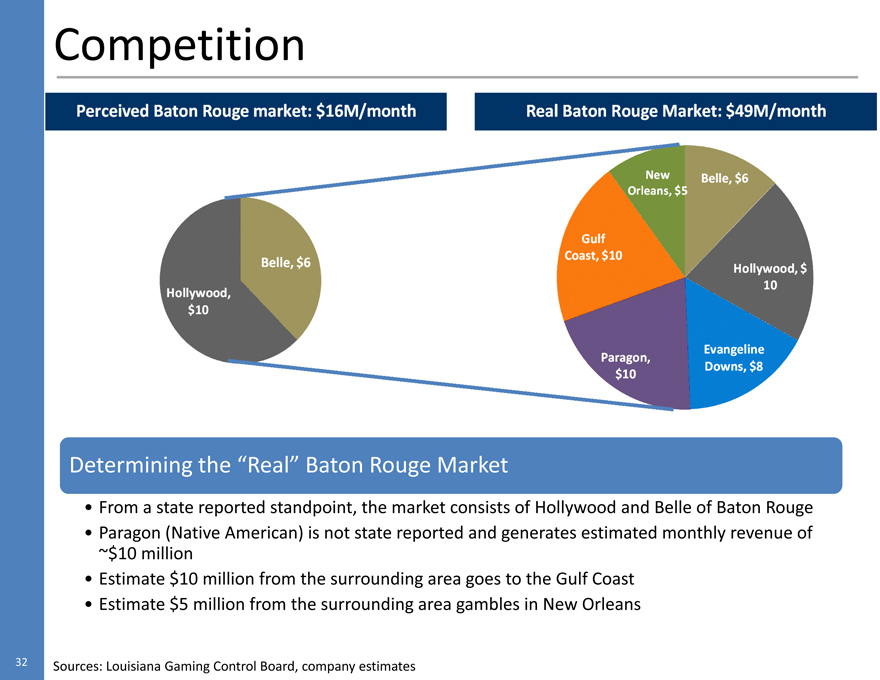
Competition
Perceived Baton Rouge market: $16M/month
Real Baton Rouge Market: $49M/month
Hollywood, $10
Gulf Coast, $10 New Orleans, $5 Belle, $6
Belle, $6
Paragon, $10 Evangeline Downs, $8 Hollywood, $10
Determining the ���Real” Baton Rouge Market
From a state reported standpoint, the market consists of Hollywood and Belle of Baton Rouge
Paragon (Native American) is not state reported and generates estimated monthly revenue of ~$10 million
Estimate $10 million from the surrounding area goes to the Gulf Coast
Estimate $5 million from the surrounding area gambles in New Orleans
32 Sources: Louisiana Gaming Control Board, company estimates
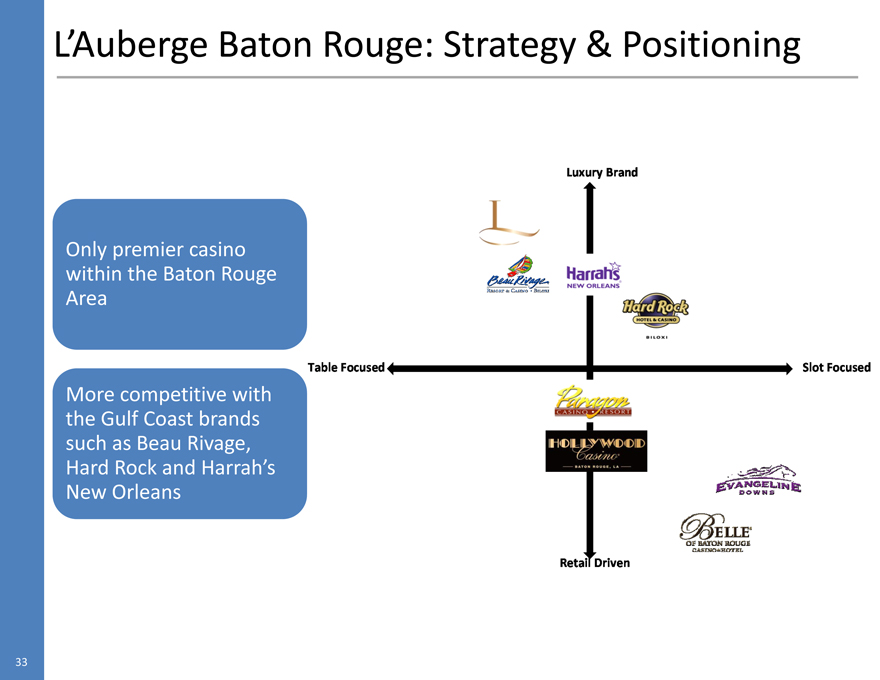
L’Auberge Baton Rouge: Strategy & Positioning
Only premier casino within the Baton Rouge Area
More competitive with the Gulf Coast brands such as Beau Rivage, Hard Rock and Harrah’s New Orleans
Luxury Brand Table Focused Retail Driven Slot Focused
33
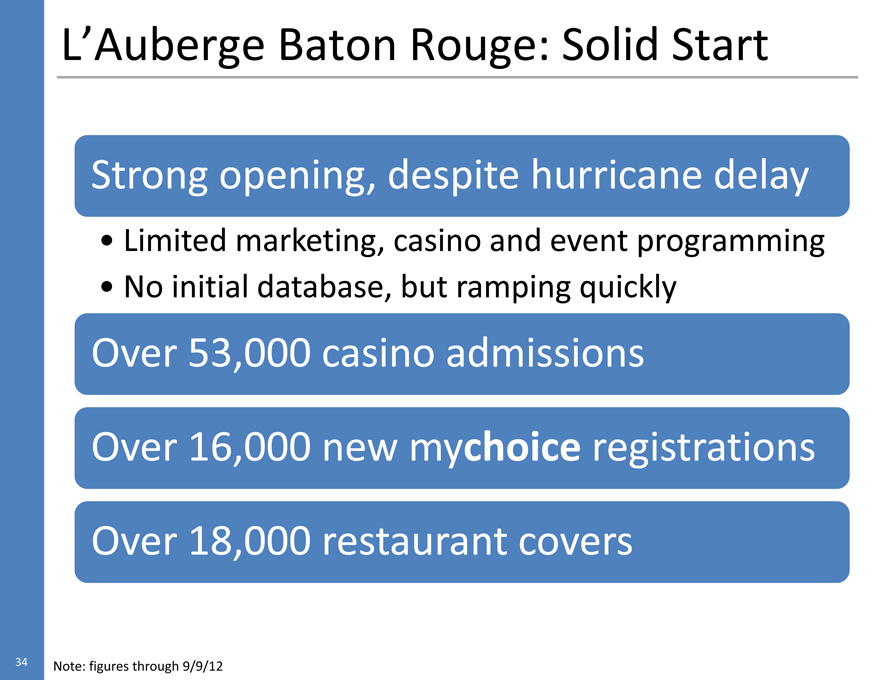
L’Auberge Baton Rouge: Solid Start
Strong opening, despite hurricane delay
Limited marketing, casino and event programming
No initial database, but ramping quickly
Over 53,000 casino admissions
Over 16,000 new mychoice registrations Over 18,000 restaurant covers
34 Note: figures through 9/9/12
Lake Charles
Geno Iafrate, EVP of Regional Operations
35
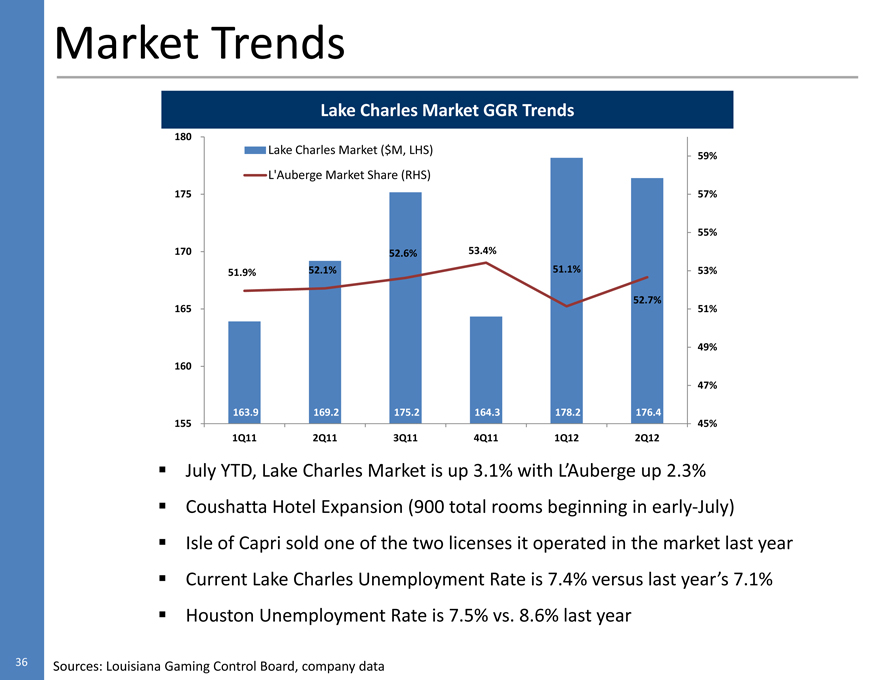
Market Trends
Lake Charles Market GGR Trends 180
Lake Charles Market ($M, LHS) 59%
L’Auberge Market Share (RHS)
175 57% 55% 170 52.6% 53.4%
51.9%
52.1% 51.1% 53% 52.7% 165 51%
49% 160 47% 163.9 169.2 175.2 164.3
178.2 176.4 155 45% 1Q11
2Q11 3Q11 4Q11 1Q12 2Q12
July YTD, Lake Charles Market is up 3.1% with L’Auberge up 2.3%
Coushatta Hotel Expansion (900 total rooms beginning in early-July)
Isle of Capri sold one of the two licenses it operated in the market last year
Current Lake Charles Unemployment Rate is 7.4% versus last year’s 7.1%
Houston Unemployment Rate is 7.5% vs. 8.6% last year
36 Sources: Louisiana Gaming Control Board, company data
L’Auberge Lake Charles Property Trends
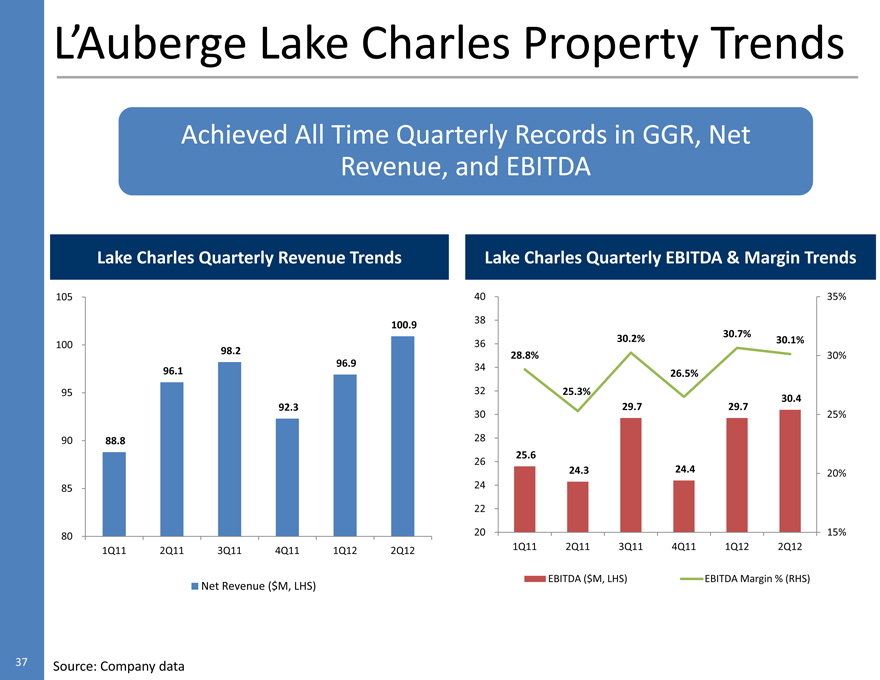
Achieved All Time Quarterly Records in GGR, Net Revenue, and EBITDA
105 100 95 90 85 80
Lake Charles Quarterly Revenue Trends 100.9 98.2 96.1 96.9 92.3 88.8
1Q11 2Q11 3Q11 4Q11 1Q12 2Q12
Net Revenue ($M, LHS)
Lake Charles Quarterly EBITDA & Margin Trends
40 35% 38 36 30.2% 30.7% 30.1% 28.8%
30%
34 26.5% 32 25.3% 30.4 29.7
29.7 30 25% 28 26 25.6
24.3 24.4 20% 24 22 20
15% 1Q11 2Q11 3Q11 4Q11 1Q12 2Q12
EBITDA ($M, LHS)
EBITDA Margin % (RHS)
37 Source: Company data
L’Auberge Lake Charles Property Trends
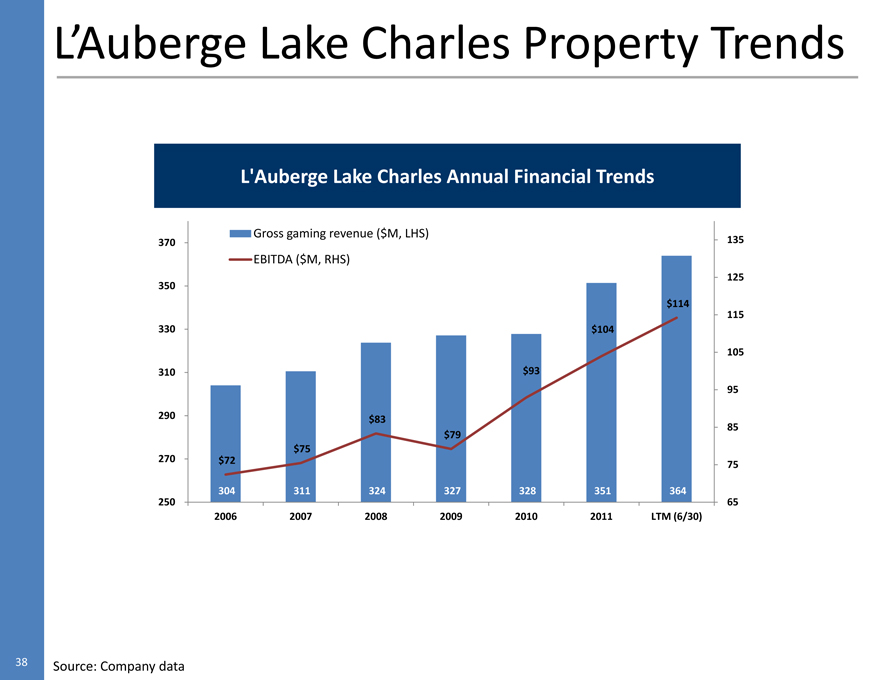
L’Auberge Lake Charles Annual Financial Trends
Gross gaming revenue ($M, LHS)
370 135
EBITDA ($M, RHS)
125 350 $114 115 330 $104 105 310 $93 95 290 $83 $79 85 $75 270 $72 75 304 311 324
327 328 351 364 250 65 2006 2007 2008 2009 2010 2011
LTM (6/30)
38 Source: Company data
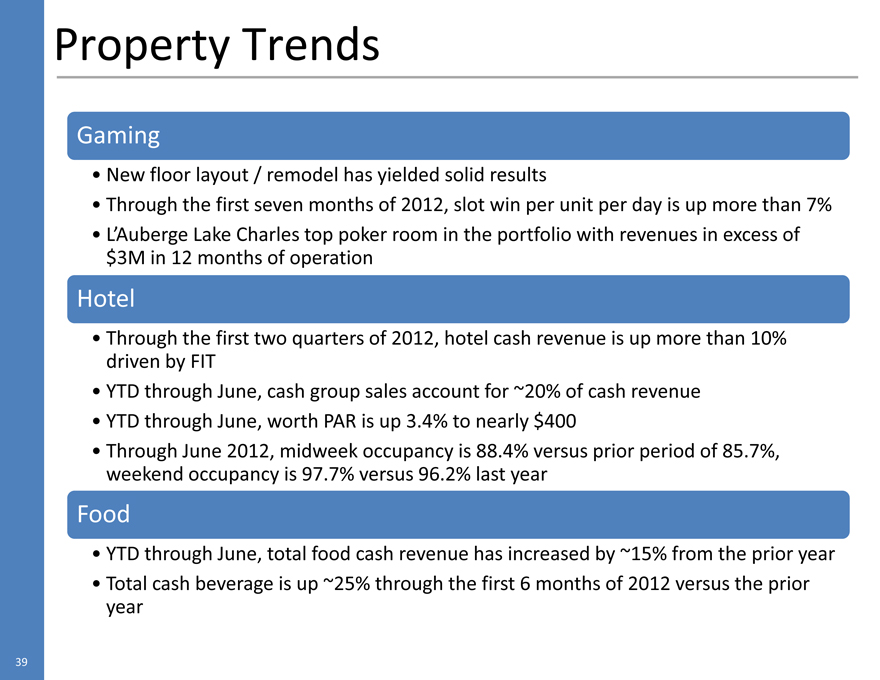
Property Trends
Gaming
New floor layout / remodel has yielded solid results
Through the first seven months of 2012, slot win per unit per day is up more than 7% L’Auberge Lake Charles top poker room in the portfolio with revenues in excess of $3M in 12 months of operation
Hotel
Through the first two quarters of 2012, hotel cash revenue is up more than 10% driven by FIT
YTD through June, cash group sales account for ~20% of cash revenue YTD through June, worth PAR is up 3.4% to nearly $400
Through June 2012, midweek occupancy is 88.4% versus prior period of 85.7%, weekend occupancy is 97.7% versus 96.2% last year
Food
YTD through June, total food cash revenue has increased by ~15% from the prior year Total cash beverage is up ~25% through the first 6 months of 2012 versus the prior year
39
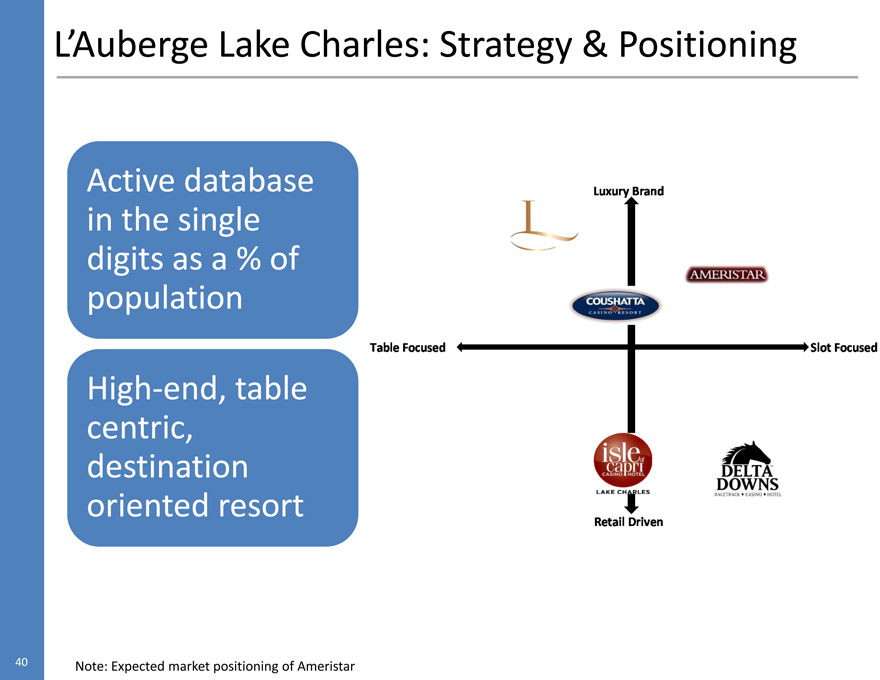
L’Auberge Lake Charles: Strategy & Positioning
Active database in the single digits as a % of population
High-end, table centric, destination oriented resort
Luxury Brand Table Focused Retail Driven Slot Focused
40 Note: Expected market positioning of Ameristar
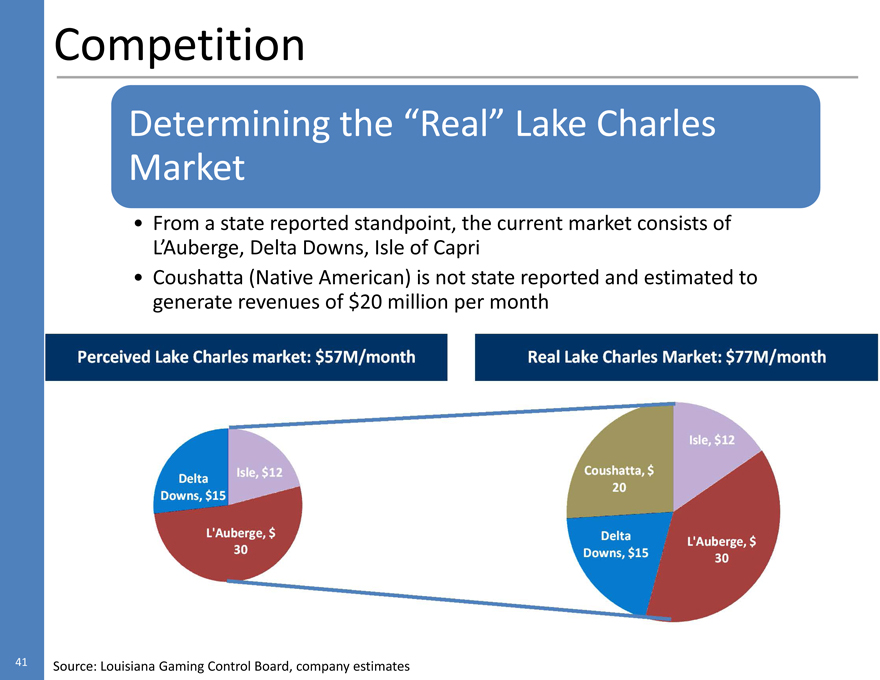
Competition
Determining the “Real” Lake Charles Market
From a state reported standpoint, the current market consists of L’Auberge, Delta Downs, Isle of Capri
Coushatta (Native American) is not state reported and estimated to generate revenues of $20 million per month
Perceived Lake Charles market: $57m/month Real Lake Charles Market: $77M/month
Delta Downs, $15 Isle $12 L’Auberge, $30 Coushatta, $20 Isle, $12 Delta Downs, $15 L’Auberge, $30
Source: Louisiana Gaming Control Board, company estimates
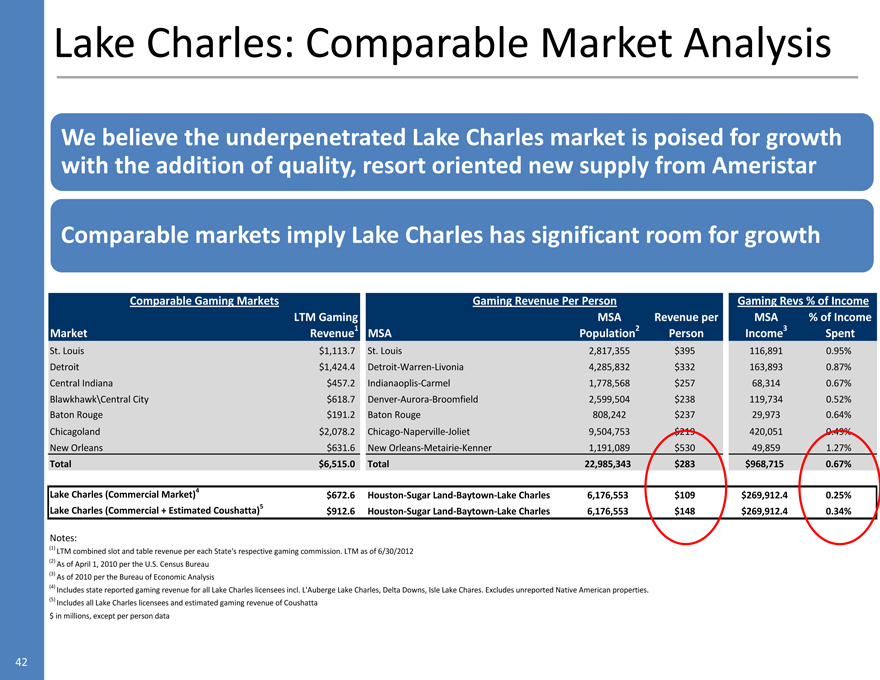
Lake Charles: Comparable Market Analysis
We believe the underpenetrated Lake Charles market is poised for growth with the addition of quality, resort oriented new supply from Ameristar
Comparable markets imply Lake Charles has significant room for growth
Comparable Gaming Markets
Gaming Revenue Per Person
Gaming Revs % of Income LTM Gaming
MSA Revenue per MSA % of Income
Market Revenue1
MSA Population2 Person Income3
Spent St. Louis $1,113.7 St. Louis
2,817,355 $395 116,891 0.95% Detroit $1,424.4
Detroit-Warren-Livonia 4,285,832 $332 163,893 0.87%
Central Indiana $457.2 Indianaoplis-Carmel 1,778,568 $257 68,314
0.67% Blawkhawk\Central City $618.7 Denver-Aurora-Broomfield
2,599,504 $238 119,734 0.52% Baton Rouge $191.2 Baton Rouge 808,242 $237
29,973 0.64% Chicagoland $2,078.2 Chicago-Naperville-Joliet 9,504,753 $219
420,051 0.49% New Orleans $631.6 New Orleans-Metairie-Kenner 1,191,089
$530 49,859 1.27% Total $6,515.0 Total 22,985,343 $283 $968,715 0.67%
Lake Charles (Commercial Market)4 $672.6 Houston-Sugar Land-Baytown-Lake Charles
6,176,553 $109 $269,912.4 0.25%
Lake Charles (Commercial + Estimated Coushatta)5 $912.6
Houston-Sugar Land-Baytown-Lake Charles 6,176,553 $148 $269,912.4 0.34%
Notes:
(1) LTM combined slot and table revenue per each State’s respective gaming commission. LTM as of 6/30/2012 (2) As of April 1, 2010 per the U.S. Census Bureau (3) As of 2010 per the Bureau of Economic Analysis
(4) Includes state reported gaming revenue for all Lake Charles licensees incl. L’Auberge Lake Charles, Delta Downs, Isle Lake Chares. Excludes unreported Native American properties.
(5) Includes all Lake Charles licensees and estimated gaming revenue of Coushatta $ in millions, except per person data
Capital Project: Room Remodel
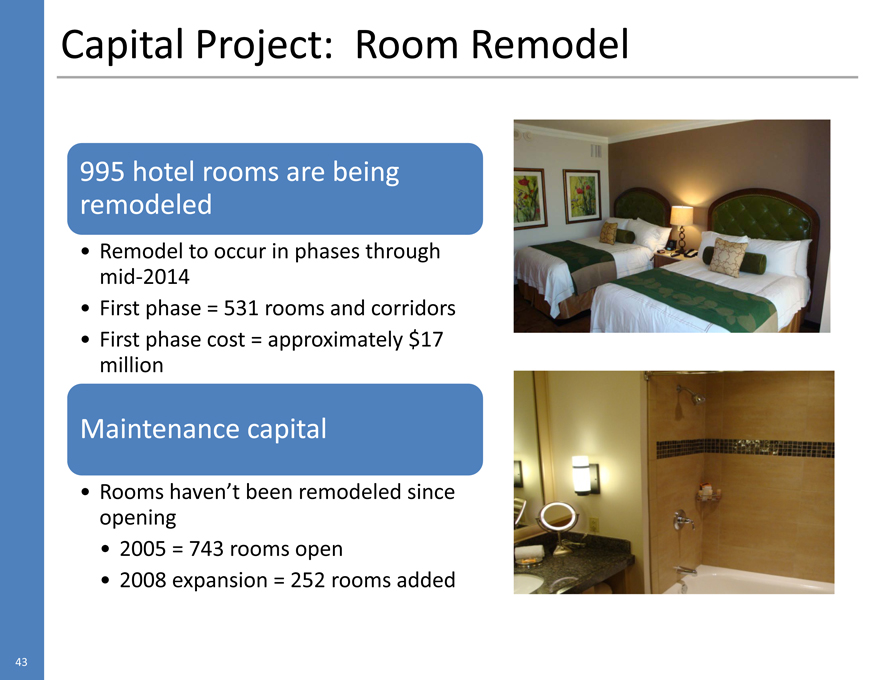
995 hotel rooms are being remodeled
Remodel to occur in phases through mid-2014 First phase = 531 rooms and corridors First phase cost = approximately $17 million
Maintenance capital
Rooms haven’t been remodeled since opening 2005 = 743 rooms open 2008 expansion = 252 rooms added
New Orleans
44
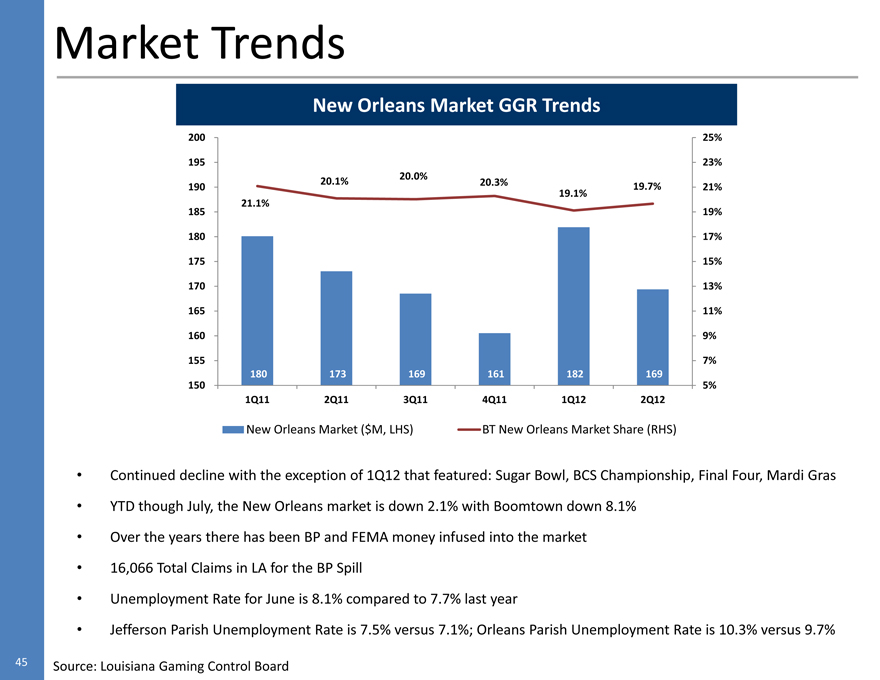
Market Trends
New Orleans Market GGR Trends
200 25% 195 23%
20.1% 20.0% 20.3%
190 19.7% 21%
19.1% 21.1% 185
19% 180 17% 175
15% 170 13% 165
11% 160 9% 155
7% 180 173 169
161 182 169 150 5%
1Q11
2Q11
3Q11
4Q11
1Q12
2Q12
New Orleans Market ($M, LHS) BT New Orleans Market Share (RHS)
Continued decline with the exception of 1Q12 that featured: Sugar Bowl, BCS Championship, Final Four, Mardi Gras
YTD though July, the New Orleans market is down 2.1% with Boomtown down 8.1%
Over the years there has been BP and FEMA money infused into the market
16,066 Total Claims in LA for the BP Spill
Unemployment Rate for June is 8.1% compared to 7.7% last year
Jefferson Parish Unemployment Rate is 7.5% versus 7.1%; Orleans Parish Unemployment Rate is 10.3% versus 9.7%
Source: Louisiana Gaming Control Board
45
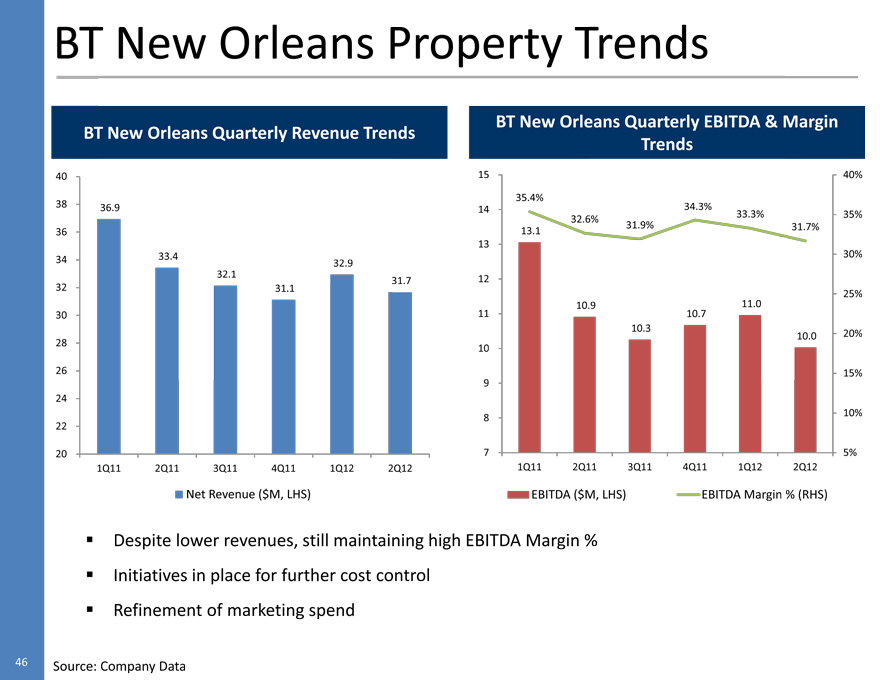
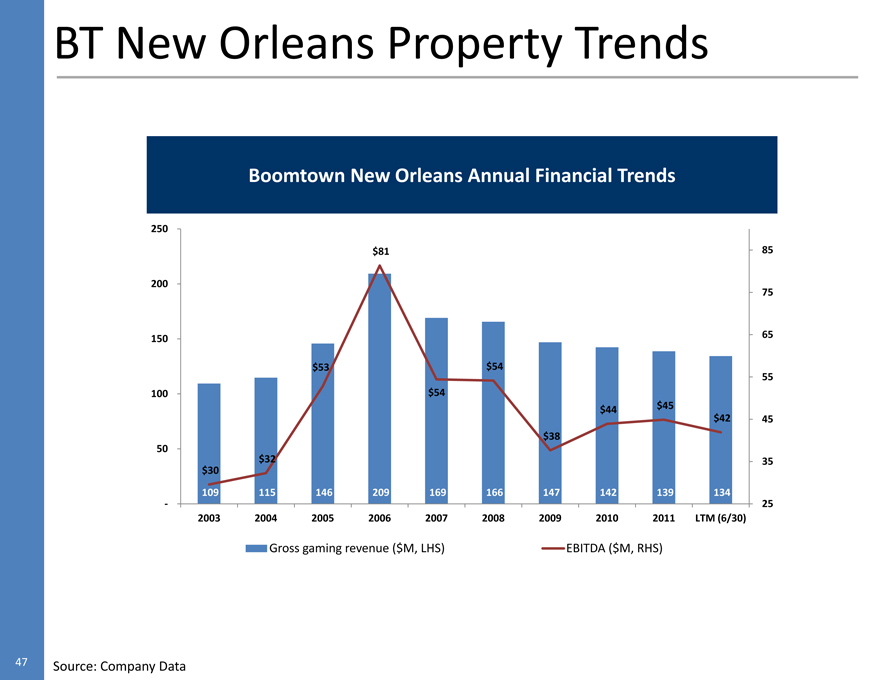
BT New Orleans Property Trends
BT New Orleans Quarterly Revenue Trends
40 38 36.9 36 34 33.4 32.9 32.1 31.7 32
31.1 30 28 26 24 22 20
1Q11 2Q11 3Q11 4Q11 1Q12 2Q12
Net Revenue ($M, LHS)
BT New Orleans Quarterly EBITDA & Margin
Trends
15 40% 35.4% 14 34.3%
33.3% 35% 32.6% 13.1
31.9% 31.7% 13 30% 12
25% 10.9 11.0 11 10.7 10.3
10.0 20% 10 15%
9 8 10% 7 5%
1Q11
2Q11
3Q11
4Q11
1Q12
2Q12
EBITDA ($M, LHS)
EBITDA Margin % (RHS)
Despite lower revenues, still maintaining high EBITDA Margin %
Initiatives in place for further cost control
Refinement of marketing spend
45 Source: Company Data
BT New Orleans Property Trends
Boomtown New Orleans Annual Financial Trends
250 $81 85 200
75 150 65 $53
$54 55 100 $54
$44 $45 $42
45 $38 50 $32 35
$30 109 115 146 209
169 166 147 142 139 134
— 25
2003 2004 2005 2006 2007 2008 2009 2010 2011
LTM (6/30)
Gross gaming revenue ($M, LHS)
EBITDA ($M, RHS)
Source: Company Data
47
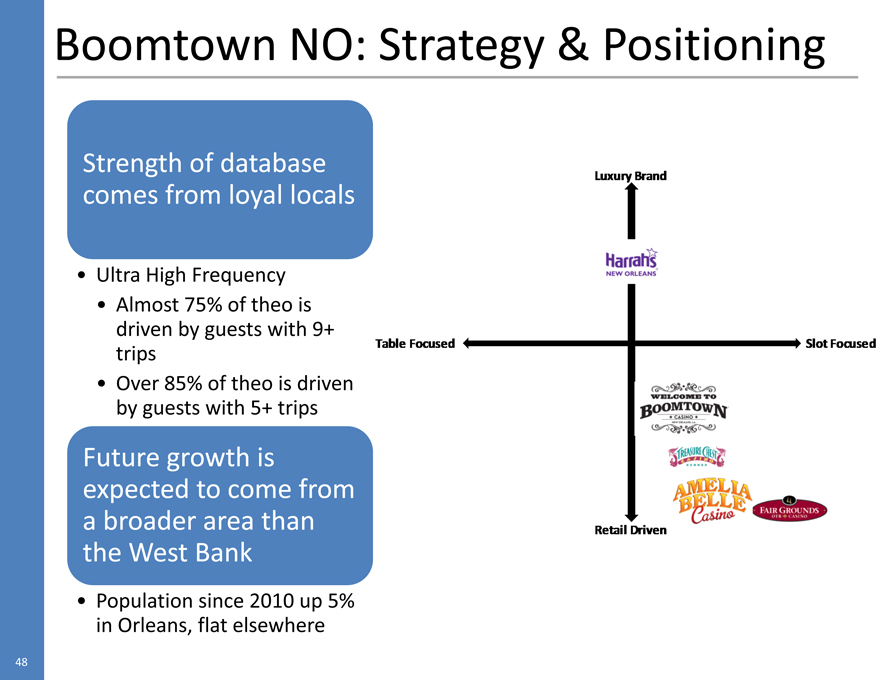
Boomtown NO: Strategy & Positioning
Strength of database comes from loyal locals
Ultra High Frequency
Almost 75% of theo is driven by guests with 9+ trips Over 85% of theo is driven by guests with 5+ trips
Future growth is expected to come from a broader area than the West Bank
Population since 2010 up 5% in Orleans, flat elsewhere
Luxury Brand
Harrahs New Orleans
Table Focused
Slot Focused
Retail Driven
48
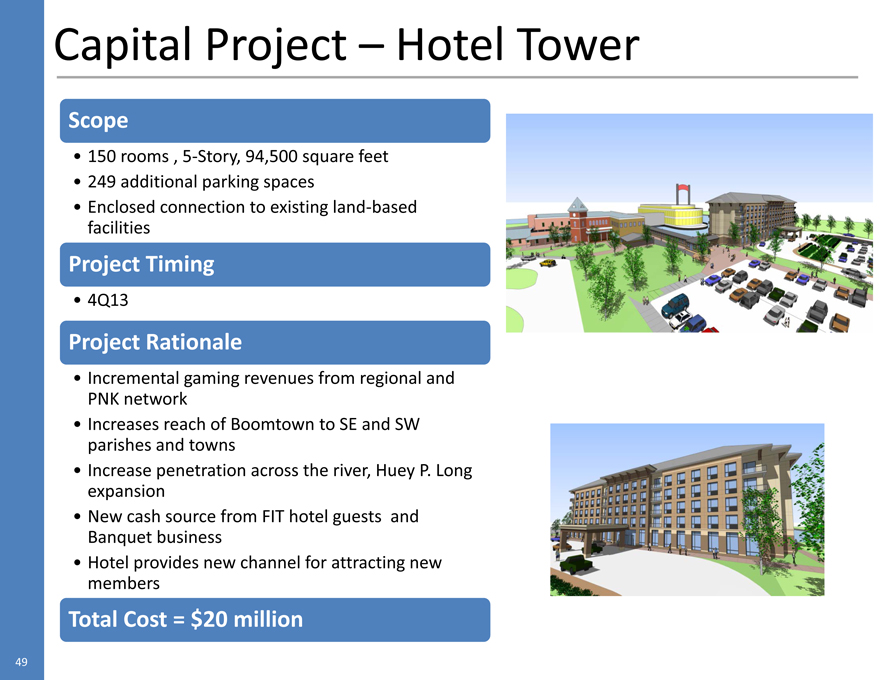
Capital Project – Hotel Tower
Scope
150 rooms , 5-Story, 94,500 square feet
249 additional parking spaces
Enclosed connection to existing land-based facilities
Project Timing
4Q13
Project Rationale
Incremental gaming revenues from regional and PNK network
Increases reach of Boomtown to SE and SW parishes and towns
Increase penetration across the river, Huey P. Long expansion
New cash source from FIT hotel guests and Banquet business
Hotel provides new channel for attracting new members
Total Cost = $20 million
49
Bossier City
50
Market Trends
Bossier City Market GGR Trends
Bossier City Market ($M, LHS)
BT Bossier City Market Share (RHS)
15% 195 185
12.5% 12.5% 12.4%
13% 12.7% 11.5% 11.6%
175 11% 165
155 9% 145 7%
135 185.7 187.7 184.9
165.1 190.4 176.4
125 5% 1Q11 2Q11 3Q11 4Q11 1Q12 2Q12
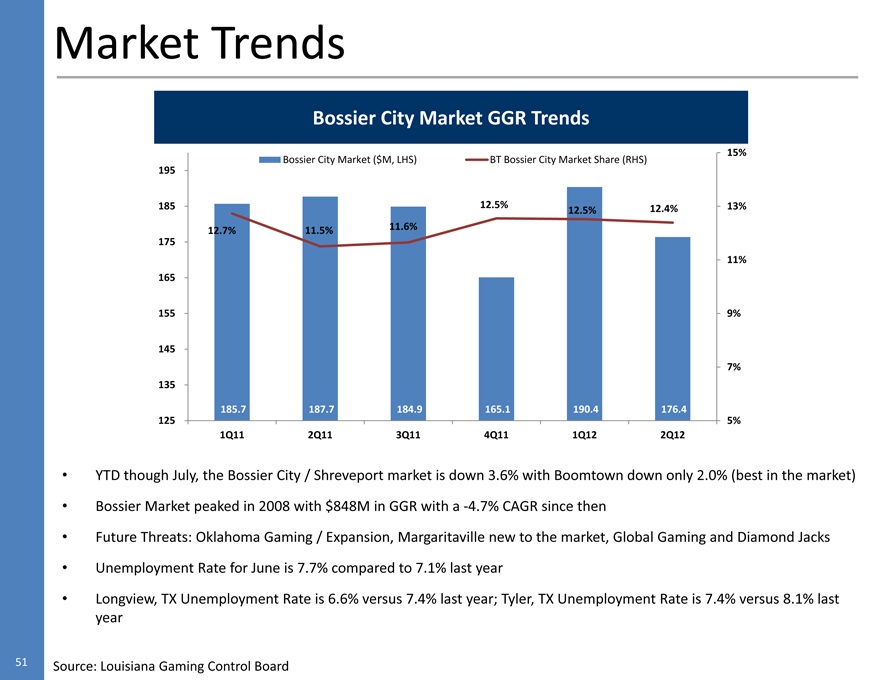
YTD though July, the Bossier City / Shreveport market is down 3.6% with Boomtown down only 2.0% (best in the market)
Bossier Market peaked in 2008 with $848M in GGR with a -4.7% CAGR since then
Future Threats: Oklahoma Gaming / Expansion, Margaritaville new to the market, Global Gaming and Diamond Jacks
Unemployment Rate for June is 7.7% compared to 7.1% last year
Longview, TX Unemployment Rate is 6.6% versus 7.4% last year; Tyler, TX Unemployment Rate is 7.4% versus 8.1% last year
Source: Louisiana Gaming Control Board
51
Property Trends
BT Bossier City Quarterly Revenue Trends
25 24 23.1 23 22.6
22 21.2 21.1
21 20.3
20 19.6 19 18
1Q11 2Q11 3Q11 4Q11 1Q12 2Q12
Net Revenue ($M, LHS)
BT Bossier City Quarterly EBITDA & Margin Trends
7 30% 26.2%
7 25.0% 21.3%
22.7% 25% 6
5.8 20.0% 21.9% 5.9
20% 6 5 15%
4.6 4.6 5
4.3 4.2 10%
4 5% 4 3 0%
1Q11
2Q11
3Q11
4Q11
1Q12
2Q12
EBITDA ($M, LHS)
EBITDA Margin % (RHS)
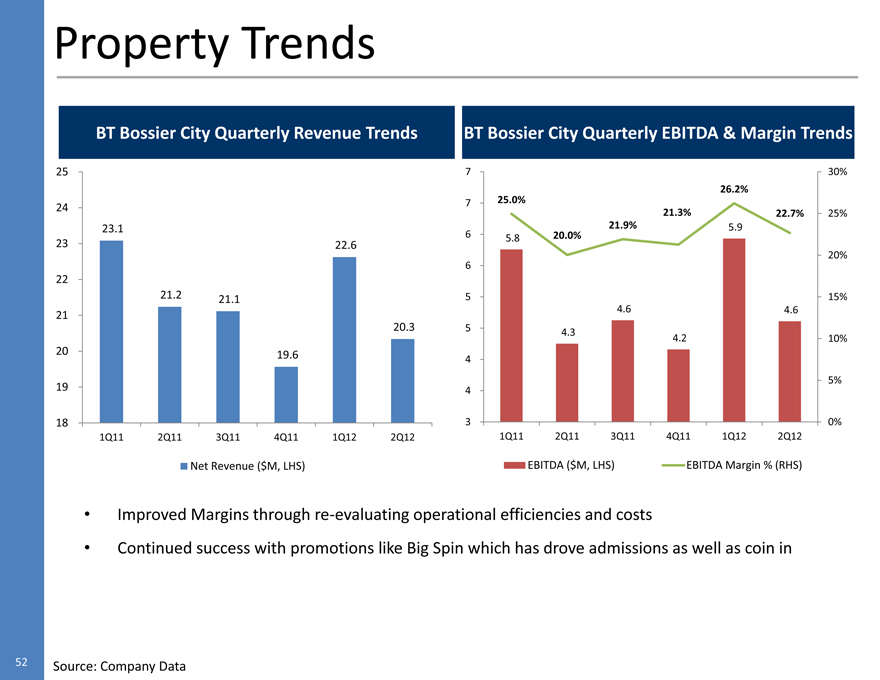
Improved Margins through re-evaluating operational efficiencies and costs
Continued success with promotions like Big Spin which has drove admissions as well as coin in
Source: Company Data
52
BT Bossier City Property Trends
Boomtown Bossier City Annual Financial Trends
150 25
$23
140 $21 23
$20 $20
130 $19 $19 $19 21
$16 $18 19
120 $17
17
110
15
100
13
90 11
80 9
70 7
109 105 99 99 93 92 93 89 87 88
60 5
2003 2004 2005 2006 2007 2008 2009 2010 2011 LTM (6/30)
Gross gaming revenue ($M, LHS) EBITDA ($M, RHS)
53 Source: Company Data
Strategy & Positioning
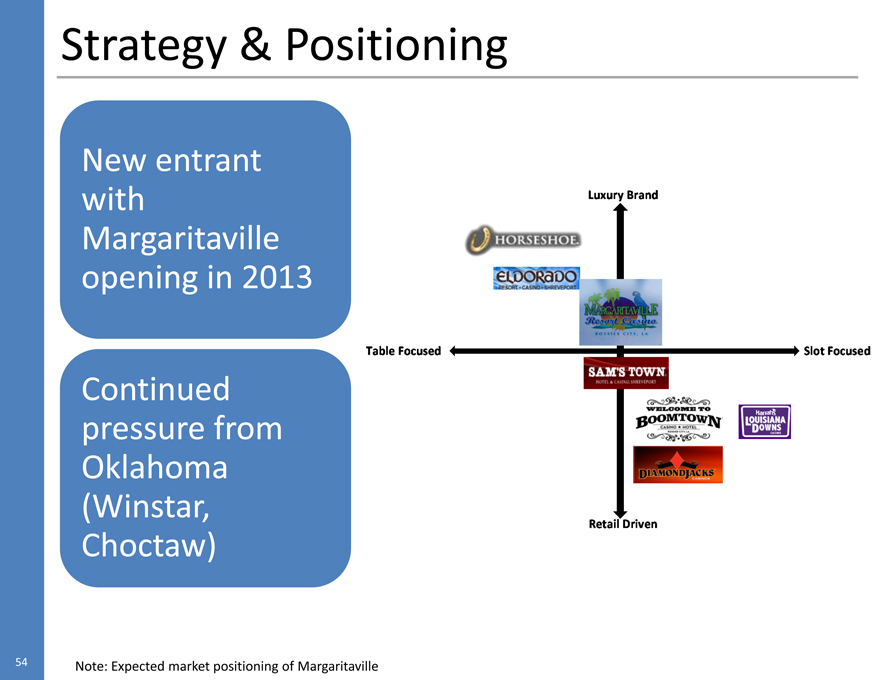
New entrant with Margaritaville opening in 2013
Continued pressure from Oklahoma (Winstar, Choctaw)
Luxury Brand
Table Focused Slot Focused
Retail Driven
54 Note: Expected market positioning of Margaritaville
Midwest
Neil Walkoff, EVP of Regional Operations
55
St. Louis
56
Property Trends
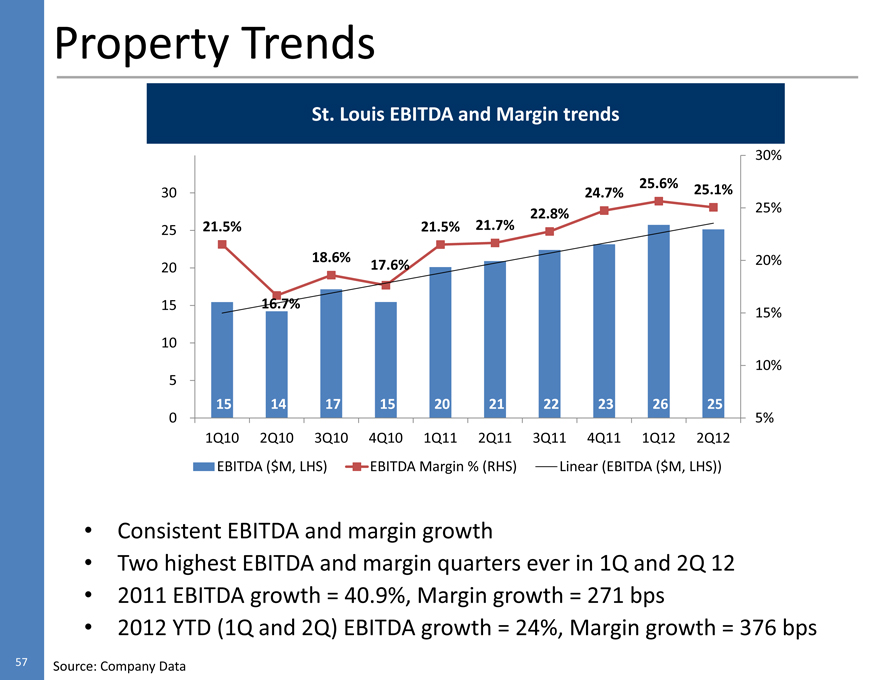
St. Louis EBITDA and Margin trends
30%
30 24.7% 25.6% 25.1%
22.8% 25%
25 21.5% 21.5% 21.7%
20 18.6% 17.6% 20%
15 16.7% 15%
10
10%
5
15 14 17 15 20 21 22 23 26 25
0 5%
1Q10 2Q10 3Q10 4Q10 1Q11 2Q11 3Q11 4Q11 1Q12 2Q12
EBITDA ($M, LHS) EBITDA Margin % (RHS) Linear (EBITDA ($M, LHS))
Consistent EBITDA and margin growth
Two highest EBITDA and margin quarters ever in 1Q and 2Q 12
2011 EBITDA growth = 40.9%, Margin growth = 271 bps
2012 YTD (1Q and 2Q) EBITDA growth = 24%, Margin growth = 376 bps
Source: Company Data
57
Market Share
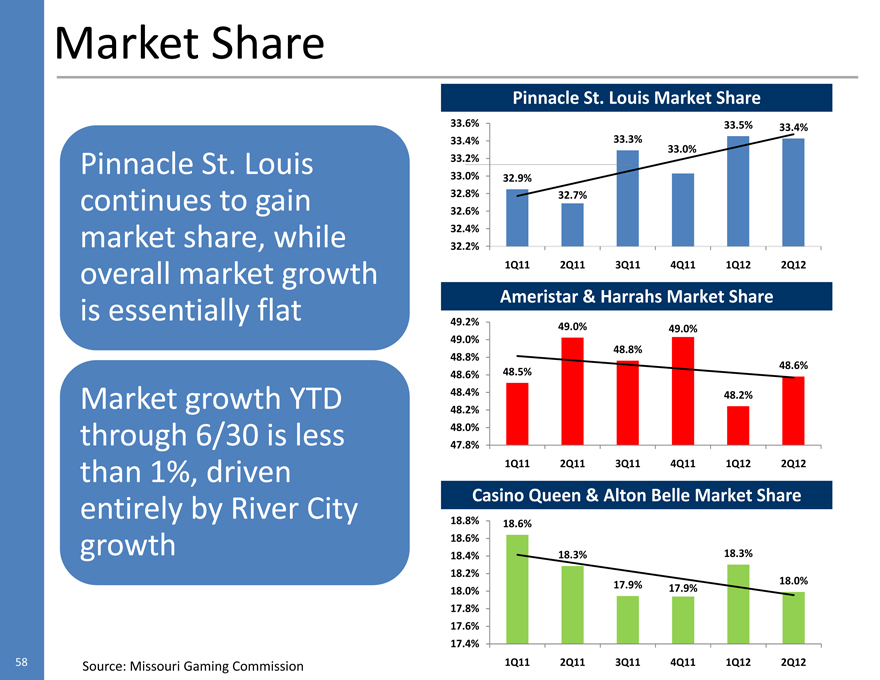
Pinnacle St. Louis continues to gain market share, while overall market growth is essentially flat
Market growth YTD through 6/30 is less than 1%, driven entirely by River City growth
Pinnacle St. Louis Market Share
33.6%
33.5%
33.4%
33.4%
33.3%
33.0%
33.2%
33.0%
32.9%
32.8%
32.7%
32.6%
32.4%
32.2%
Ameristar & Harrahs Market Share
49.2%
49.0%
49.0%
49.0%
48.8%
48.8%
48.6%
48.5%
48.6%
48.4%
48.2%
48.2%
48.0%
47.8%
1Q11
2Q11
3Q11
4Q11
1Q12
2Q12
1Q11
2Q11
3Q11
4Q11
1Q12
2Q12
Casino Queen & Alton Belle Market Share
18.8%
18.6%
18.6%
18.4%
18.3%
18.3%
18.2%
18.0%
17.9%
17.9%
18.0%
17.8%
17.6%
17.4%
1Q11
2Q11
3Q11
4Q11
1Q12
2Q12
Source: Missouri Gaming Commission
58
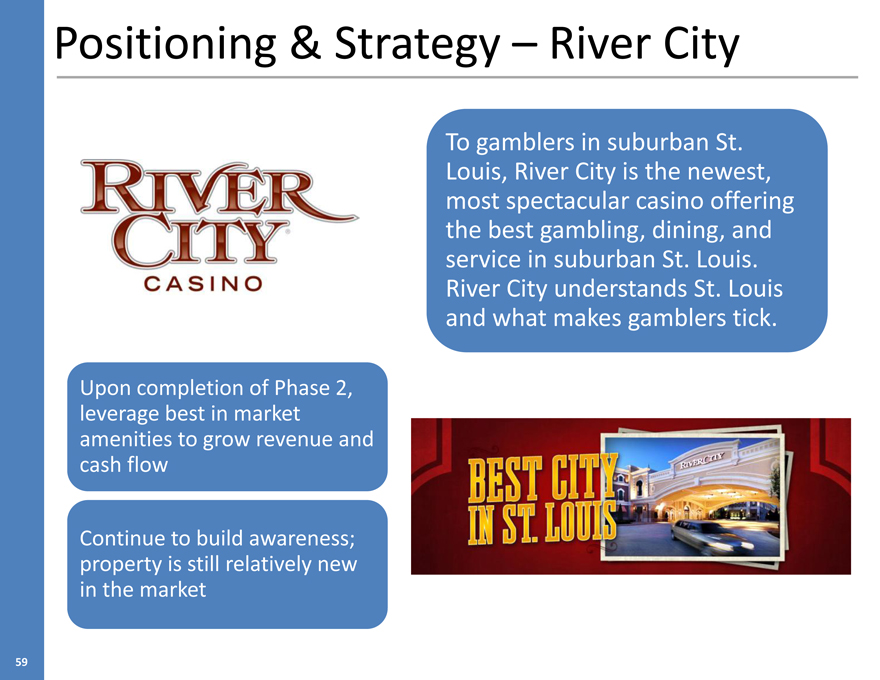
Positioning & Strategy – River City
River City CASINO
Upon completion of Phase 2, leverage best in market amenities to grow revenue and cash flow
Continue to build awareness; property is still relatively new in the market
To gamblers in suburban St. Louis, River City is the newest, most spectacular casino offering the best gambling, dining, and service in suburban St. Louis. River City understands St. Louis and what makes gamblers tick.
BEST CITY IN ST. LOUIS
59
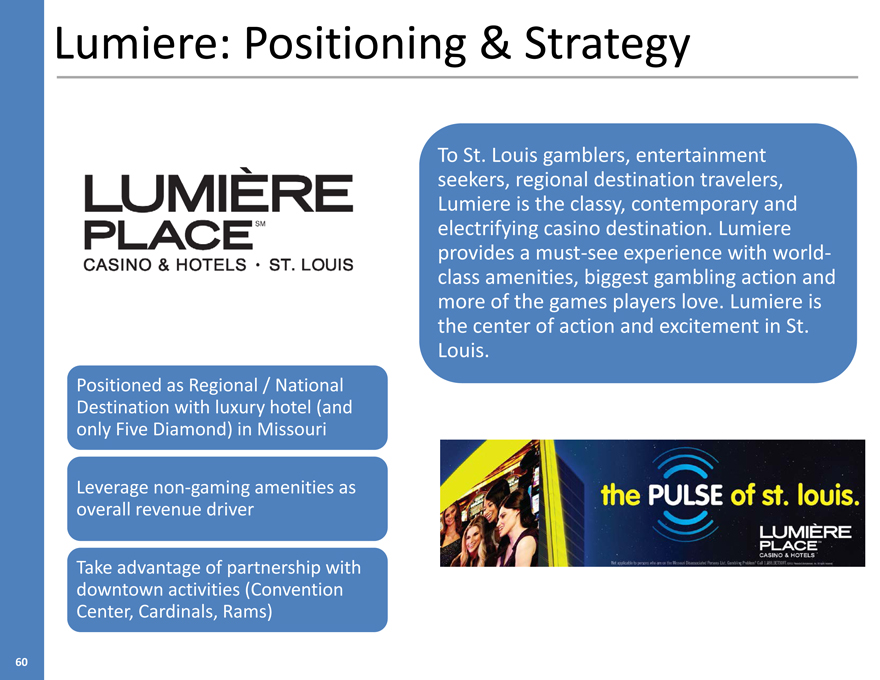
Lumiere: Positioning & Strategy
LUMIERE PLACESM CASINO & HOTELS ST. LOUIS
Positioned as Regional / National Destination with luxury hotel (and only Five Diamond) in Missouri
Leverage non-gaming amenities as overall revenue driver
Take advantage of partnership with downtown activities (Convention Center, Cardinals, Rams)
To St. Louis gamblers, entertainment seekers, regional destination travelers, Lumiere is the classy, contemporary and electrifying casino destination. Lumiere provides a must-see experience with world-class amenities, biggest gambling action and more of the games players love. Lumiere is the center of action and excitement in St. Louis.
the PULSE of st. louis. LUMIERE PLACE CASINO & HOTELS
60
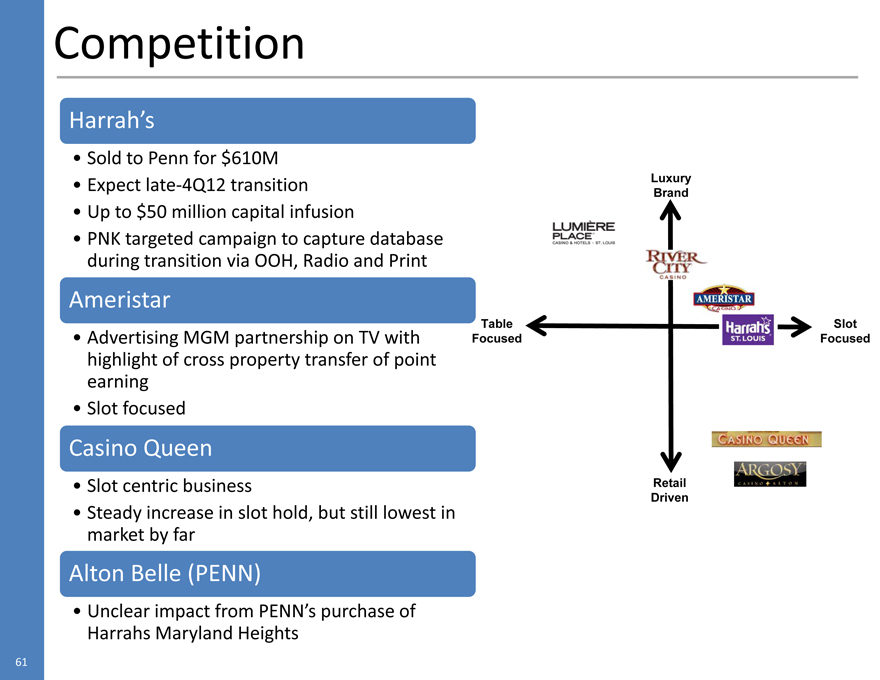
Competition
Harrah’s
Sold to Penn for $610M Expect late-4Q12 transition Up to $50 million capital infusion
PNK targeted campaign to capture database during transition via OOH, Radio and Print
Ameristar
Advertising MGM partnership on TV with highlight of cross property transfer of point earning Slot focused
Casino Queen
Slot centric business
Steady increase in slot hold, but still lowest in market by far
Alton Belle (PENN)
Unclear impact from PENN’s purchase of Harrahs Maryland Heights
Luxury Brand
Table Focused
Slot Focused
Retail Driven
61
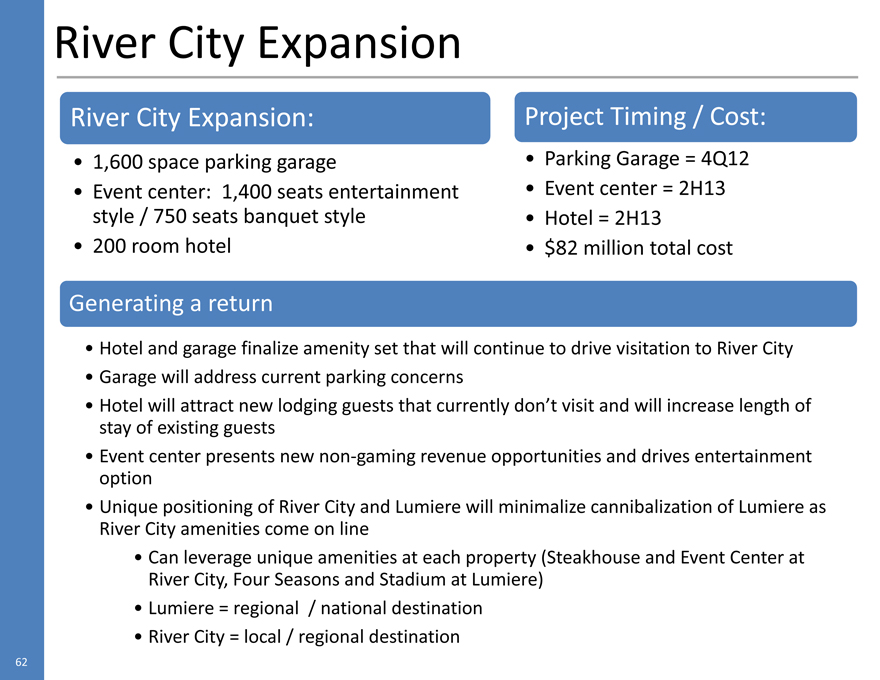
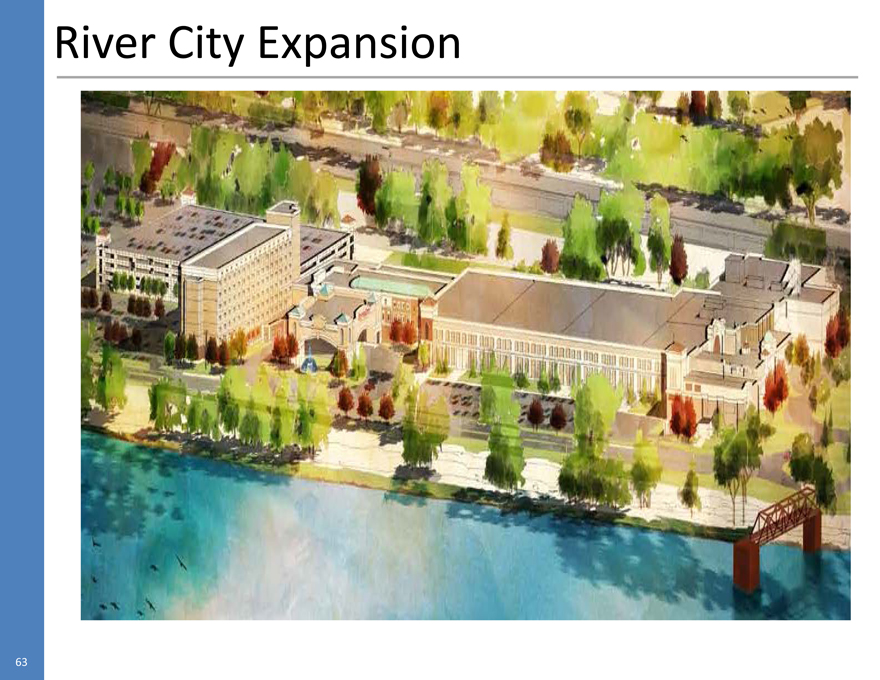
River City Expansion
River City Expansion:
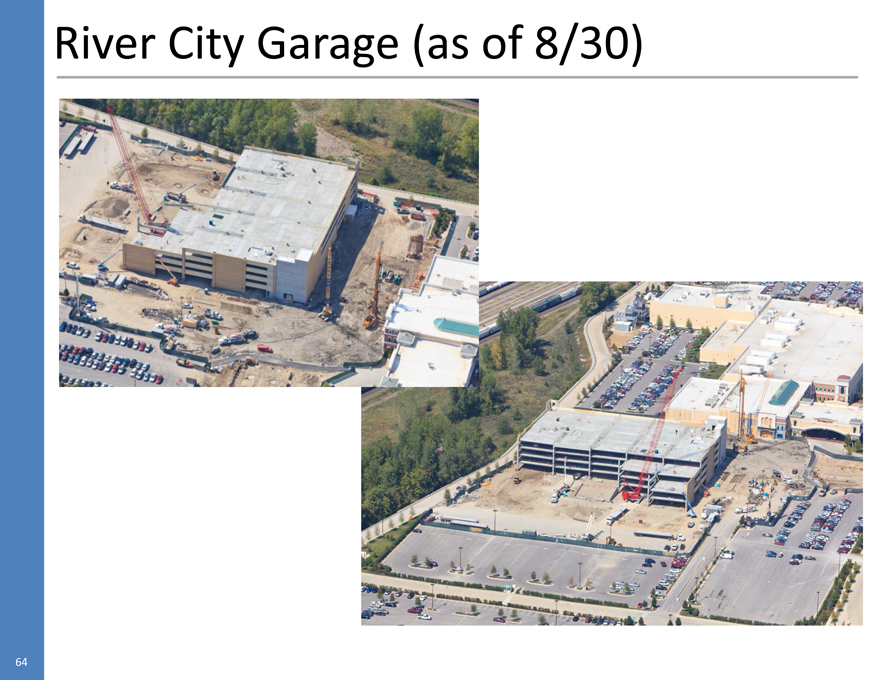
1,600 space parking garage
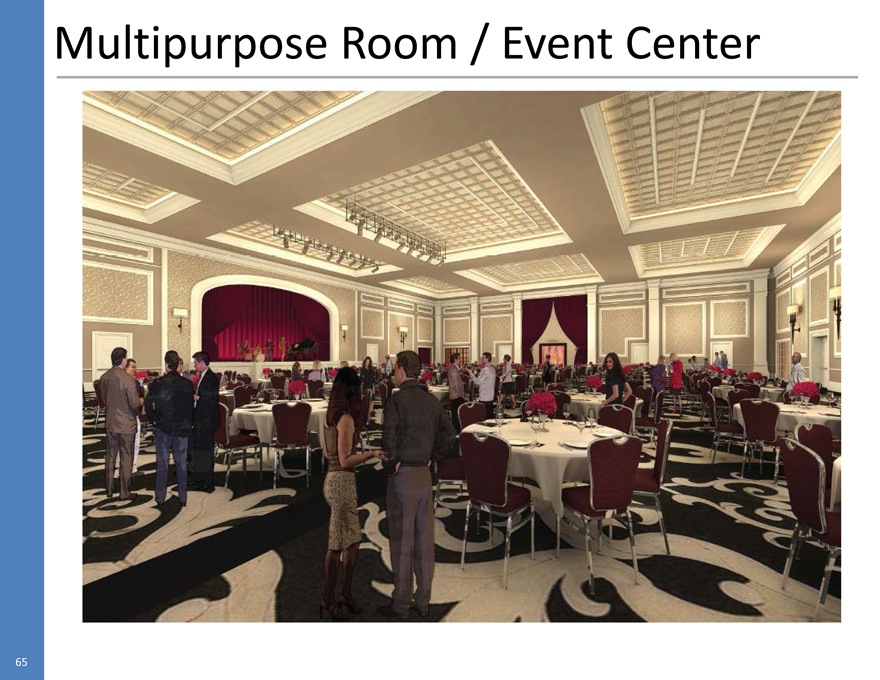
Event center: 1,400 seats entertainment style / 750 seats banquet style
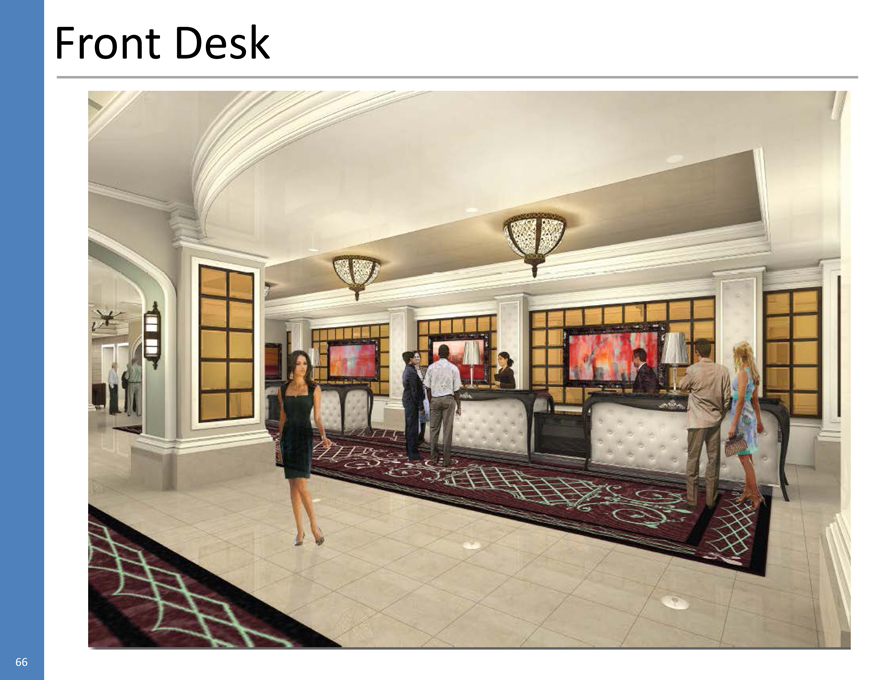
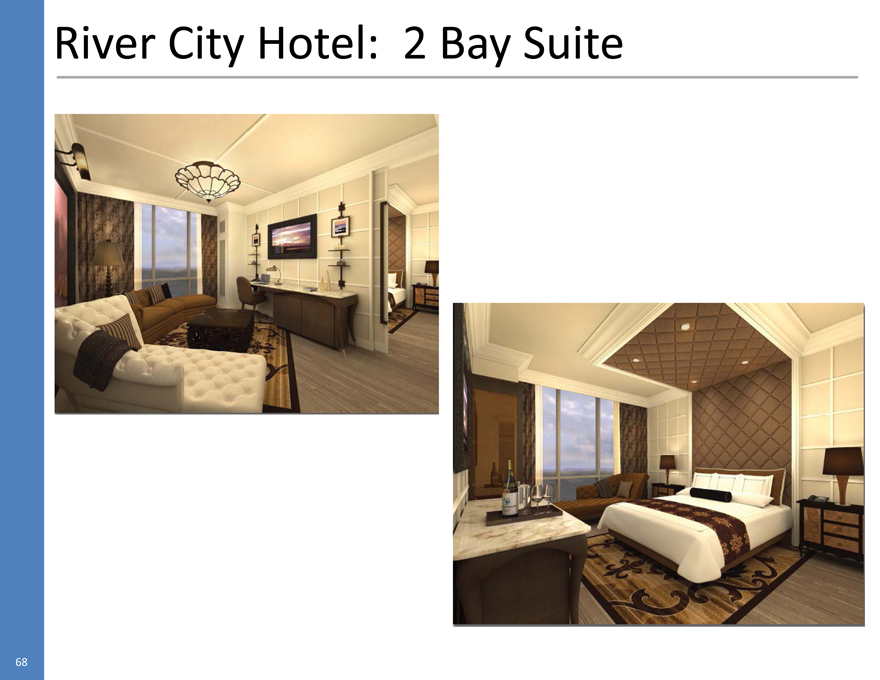
200 room hotel
Project Timing / Cost:
Parking Garage = 4Q12
Event center = 2H13
Hotel = 2H13
$82 million total cost
Generating a return
Hotel and garage finalize amenity set that will continue to drive visitation to River City
Garage will address current parking concerns
Hotel will attract new lodging guests that currently don’t visit and will increase length of stay of existing guests
Event center presents new non-gaming revenue opportunities and drives entertainment option
Unique positioning of River City and Lumiere will minimalize cannibalization of Lumiere as River City amenities come on line
Can leverage unique amenities at each property (Steakhouse and Event Center at River City, Four Seasons and Stadium at Lumiere)
Lumiere = regional / national destination
River City = local / regional destination
62
River City Expansion
63
River City Garage (as of 8/30)
64
Multipurpose Room / Event Center
65
Front Desk
66
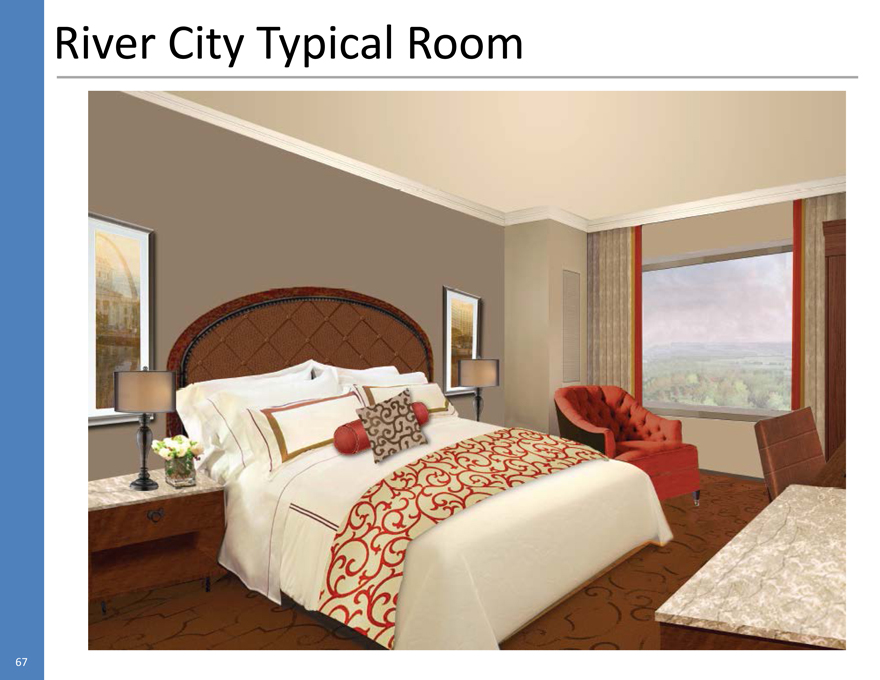
River City Typical Room
67
River City Hotel: 2 Bay Suite
68
Belterra
69
Property Trends
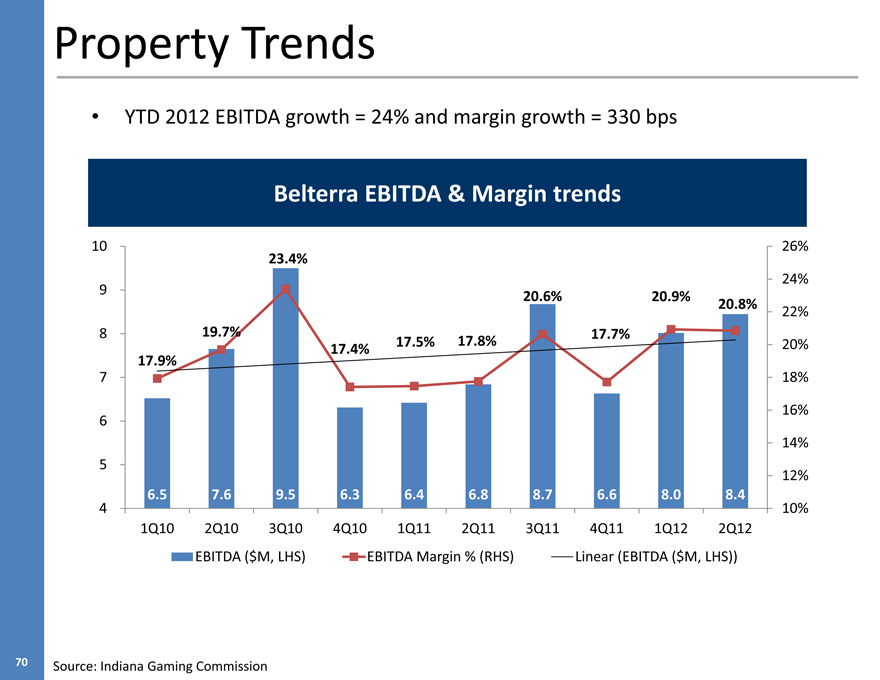
YTD 2012 EBITDA growth = 24% and margin growth = 330 bps
Belterra EBITDA & Margin trends
10 26%
23.4%
24%
9 20.6% 20.9% 20.8%
22%
8 19.7% 17.7%
17.5% 17.8% 20% 17.4% 17.9%
7 18% 16%
6
14%
5
12%
6.5 7.6 9.5 6.3 6.4 6.8 8.7 6.6 8.0 8.4
4 10% 1Q10 2Q10 3Q10 4Q10 1Q11 2Q11 3Q11 4Q11 1Q12 2Q12 EBITDA ($M, LHS) EBITDA Margin % (RHS) Linear (EBITDA ($M, LHS))
70 Source: Indiana Gaming Commission
|
P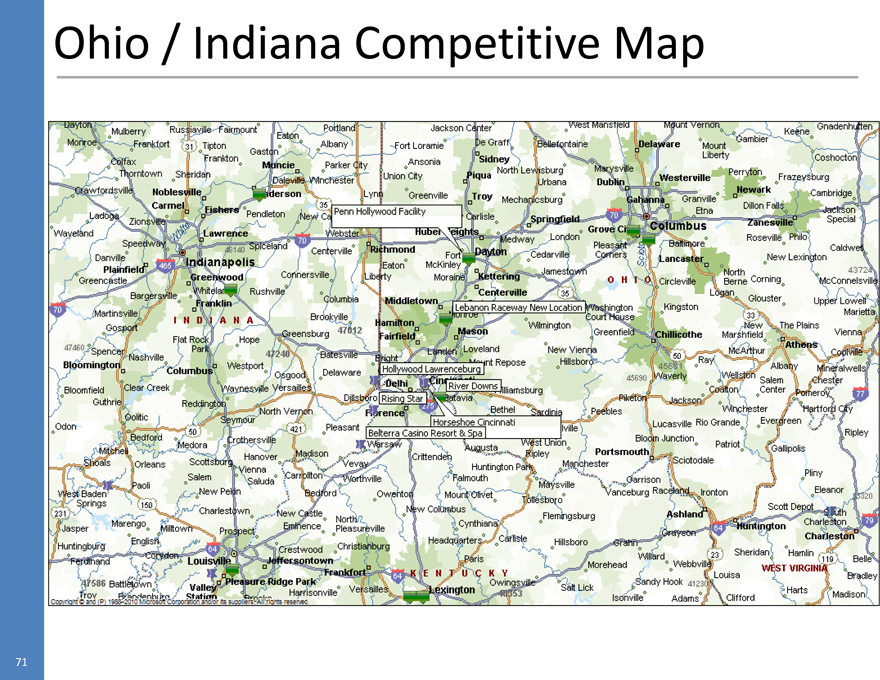 |
Ohio / Indiana Competitive Map
71
Positioning & Strategy
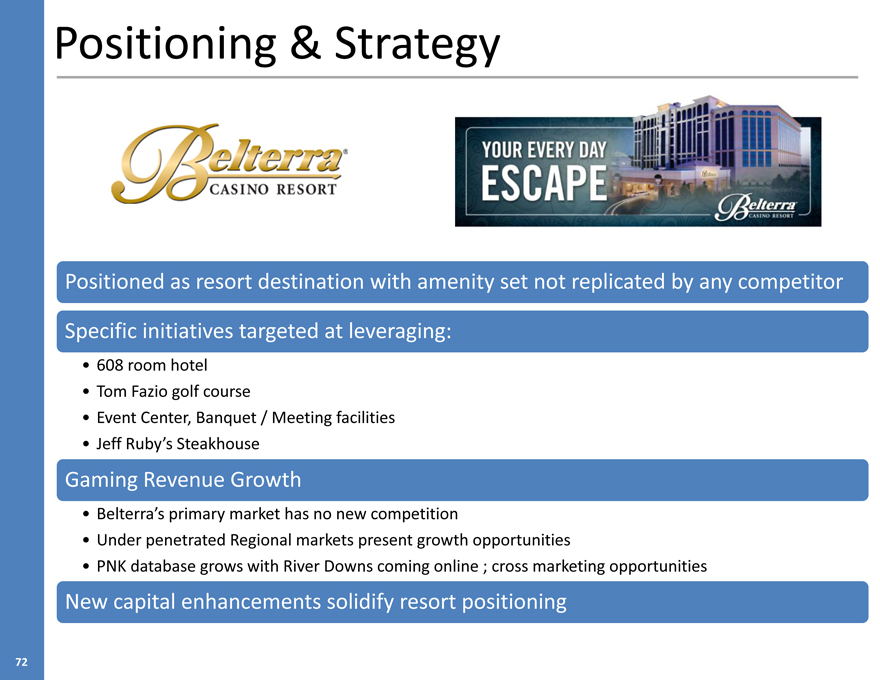
Positioned as resort destination with amenity set not replicated by any competitor Specific initiatives targeted at leveraging:
608 room hotel
Tom Fazio golf course
Event Center, Banquet / Meeting facilities
Jeff Ruby’s Steakhouse
Gaming Revenue Growth
Belterra’s primary market has no new competition
Under penetrated Regional markets present growth opportunities
PNK database grows with River Downs coming online ; cross marketing opportunities
New capital enhancements solidify resort positioning
72
Targeted Capital Investment
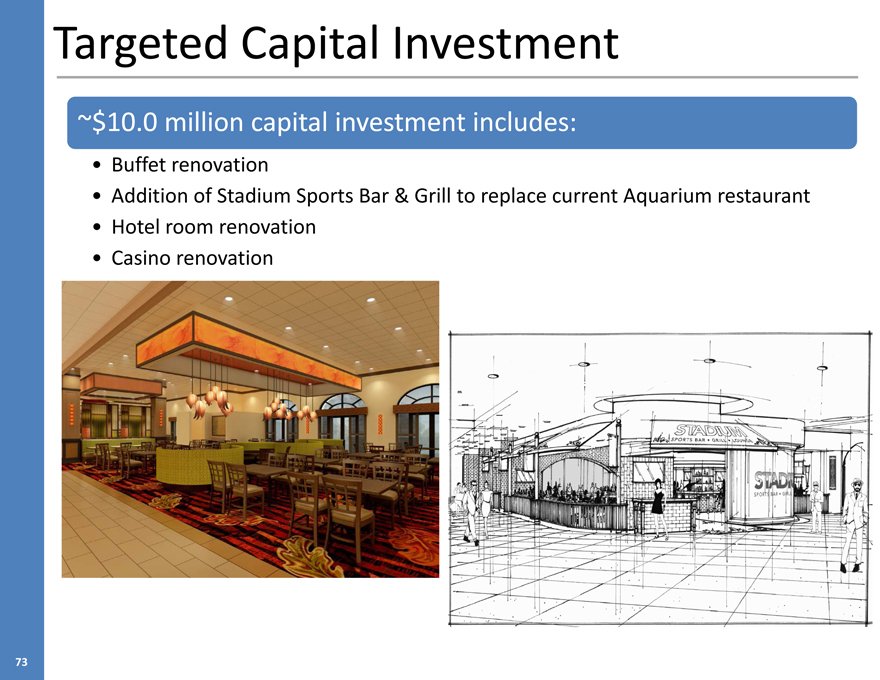
~$10.0 million capital investment includes:
Buffet renovation
Addition of Stadium Sports Bar & Grill to replace current Aquarium restaurant
Hotel room renovation
Casino renovation
73
Summary – Midwest Region Focus
River City
Leverage new amenities that will make property truly best in market in every aspect; continue to increase market share
Manage disruption as construction progresses
Capitalize on transition of Harrahs to PENN and the exit of Total Rewards from St. Louis
Continue financial discipline
Lumiere
Position as regional destination with nicest hotel in downtown St. Louis and Missouri
Leverage non-gaming amenities to grow revenue
Continue financial discipline
Belterra
Capitalize on resort destination positioning
Own primary market and defend Cincinnati
Shared services and revenue opportunities with River Downs
Continue financial discipline
74
Capital Structure, Liquidity and Capital Allocation
Carlos Ruisanchez, EVP & Chief Financial Officer
75
Capital Structure Overview
76
Executive Summary
Capitalization
Strong balance sheet positioned for safety and flexibility
Debt seniority and term structure to balance cost of capital, while looking to match LT assets with LT liabilities
Will continue to actively and opportunistically manage the balance sheet
Maturities
Staggered capital commitments
Nearest significant funded maturity in 2017
Cash Flow & Liquidity
Ample available liquidity to fund existing growth pipeline and other capital initiatives
Current available liquidity is approximately $500 million post Baton Rouge
Cash on hand and cash flow generation represent significant liquidity resources, reducing reliance on revolver use
Term Loan introduces pre-payable debt to the capital structure
Leverage
Operational improvements and cash flow generation has permitted $465 million of investment in growth initiatives while being leverage neutral
Targeting net leverage in the 3.5x-5.0x range on a go forward basis, depending on timing of capital uses
77
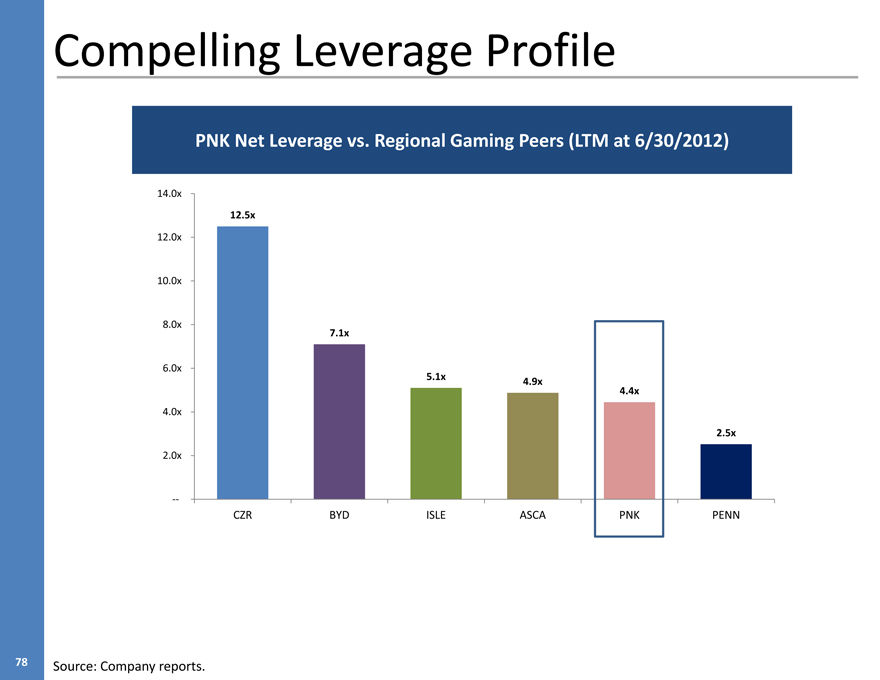
Compelling Leverage Profile
PNK Net Leverage vs. Regional Gaming Peers (LTM at 6/30/2012)
14.0x
12.5x
12.0x
10.0x
8.0x
7.1x
6.0x
5.1x 4.9x
4.4x
4.0x
2.5x
2.0x
—
CZR BYD ISLE ASCA PNK PENN
78 Source: Company reports.
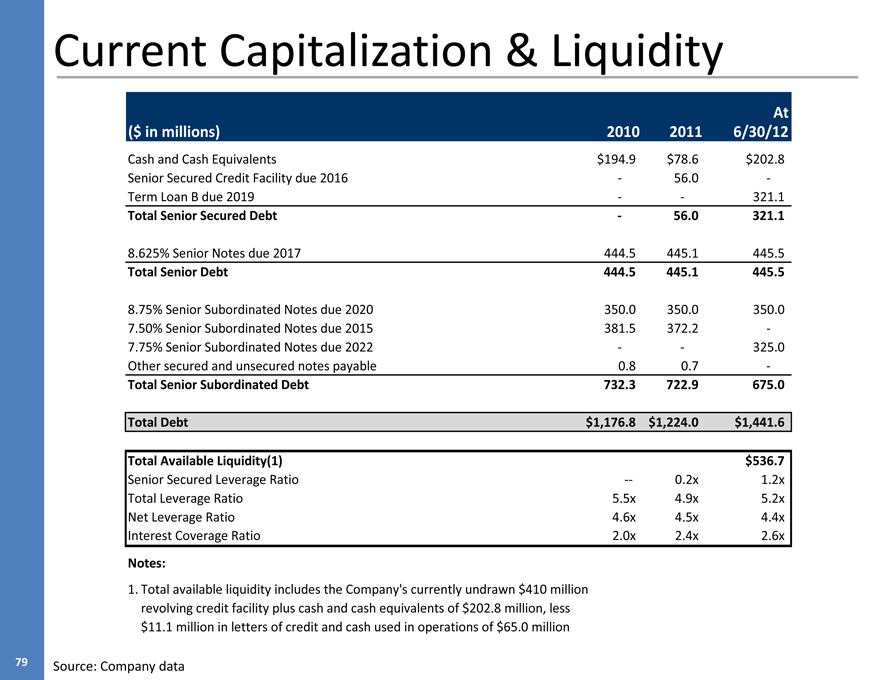
Current Capitalization & Liquidity
At ($ in millions) 2010 2011 6/30/12
Cash and Cash Equivalents $194.9 $78.6 $202.8 Senior Secured Credit Facility due 2016 — 56.0 — Term Loan B due 2019 — — 321.1
Total Senior Secured Debt — 56.0 321.1
8.625% Senior Notes due 2017 444.5 445.1 445.5
Total Senior Debt 444.5 445.1 445.5
8.75% Senior Subordinated Notes due 2020 350.0 350.0 350.0 7.50% Senior Subordinated Notes due 2015 381.5 372.2 — 7.75% Senior Subordinated Notes due 2022 — — 325.0 Other secured and unsecured notes payable 0.8 0.7 —
Total Senior Subordinated Debt 732.3 722.9 675.0
Total Debt $1,176.8 $1,224.0 $1,441.6
Total Available Liquidity(1) $536.7
Senior Secured Leverage Ratio — 0.2x 1.2x Total Leverage Ratio 5.5x 4.9x 5.2x Net Leverage Ratio 4.6x 4.5x 4.4x Interest Coverage Ratio 2.0x 2.4x 2.6x
Notes:
1. Total available liquidity includes the Company’s currently undrawn $410 million revolving credit facility plus cash and cash equivalents of $202.8 million, less $11.1 million in letters of credit and cash used in operations of $65.0 million
79 Source: Company data
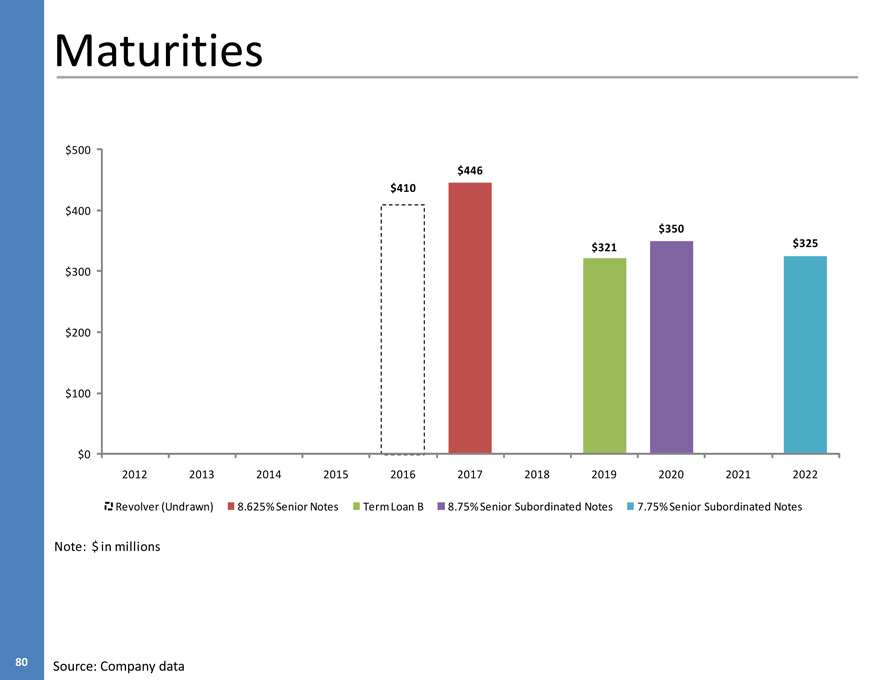
Maturities
$500 $446 $410 $400 $350 $321 $325 $300
$200
$100
$0
2012 2013 2014 2015 2016 2017 2018 2019 2020 2021 2022
Revolver (Undrawn) 8.625% Senior Notes Term Loan B 8.75% Senior Subordinated Notes 7.75% Senior Subordinated Notes
Note: $ in millions
80 Source: Company data
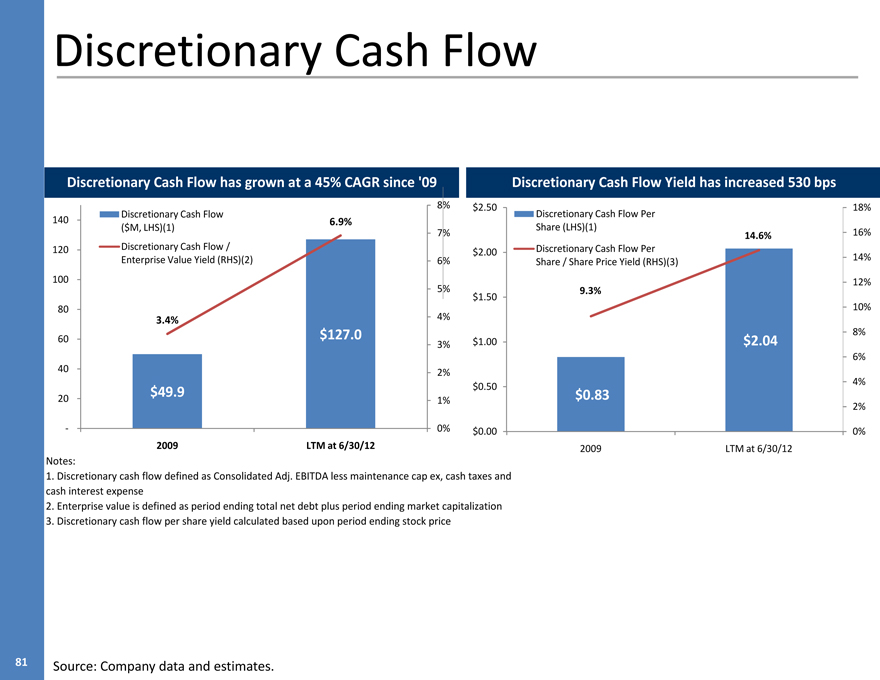
Discretionary Cash Flow
Discretionary Cash Flow has grown at a 45% CAGR since ‘09
8% Discretionary Cash Flow 140 6.9% ($M, LHS)(1) 7% 120 Discretionary Cash Flow / Enterprise Value Yield (RHS)(2) 6% 100 5% 80
3.4% 4%
60 $127.0
3%
40 2%
20 $49.9
1%
- 0%
2009 LTM at 6/30/12
Discretionary Cash Flow Yield has increased 530 bps
$2.50 18% Discretionary Cash Flow Per Share (LHS)(1) 16%
14.6% $2.00 Discretionary Cash Flow Per
Share / Share Price Yield (RHS)(3) 14% 12%
9.3% $1.50 10% $1.00 8%
$2.04
6%
$0.50 $0.83 4% 2%
$0.00 0% 2009 LTM at 6/30/12
Notes:
1. Discretionary cash flow defined as Consolidated Adj. EBITDA less maintenance cap ex, cash taxes and cash interest expense
2. Enterprise value is defined as period ending total net debt plus period ending market capitalization
3. Discretionary cash flow per share yield calculated based upon period ending stock price
81 Source: Company data and estimates.
Capital Allocation & Deployment Strategy
82
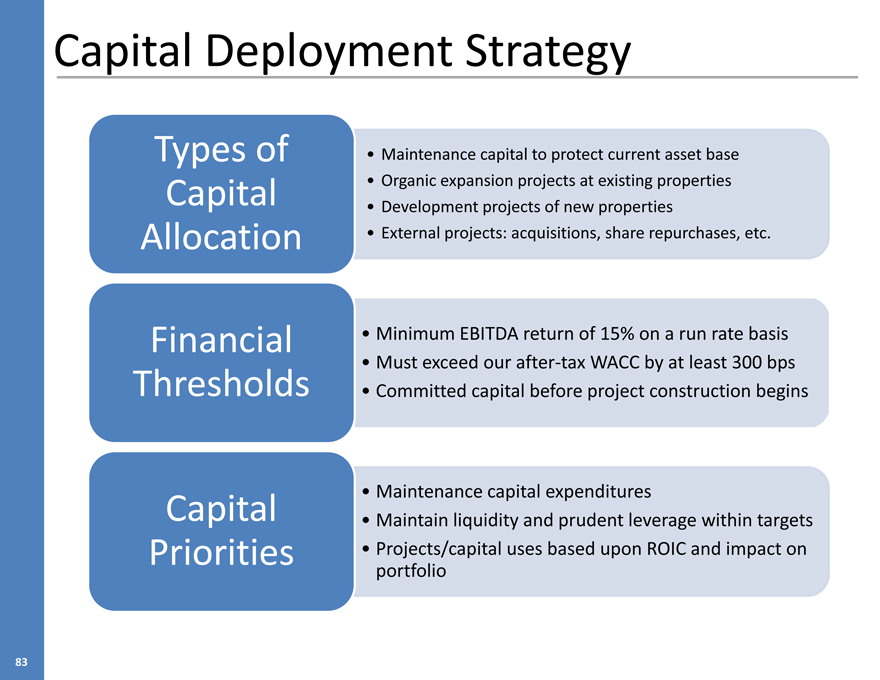
Capital Deployment Strategy
Types of
Maintenance capital to protect current asset base Capital
Organic expansion projects at existing properties
Development projects of new properties Allocation
External projects: acquisitions, share repurchases, etc.
Financial
Minimum EBITDA return of 15% on a run rate basis Thresholds
Must exceed our after-tax WACC by at least 300 bps
Committed capital before project construction begins
Capital
Maintenance capital expenditures
Maintain liquidity and prudent leverage within targets Priorities
Projects/capital uses based upon ROIC and impact on portfolio
83
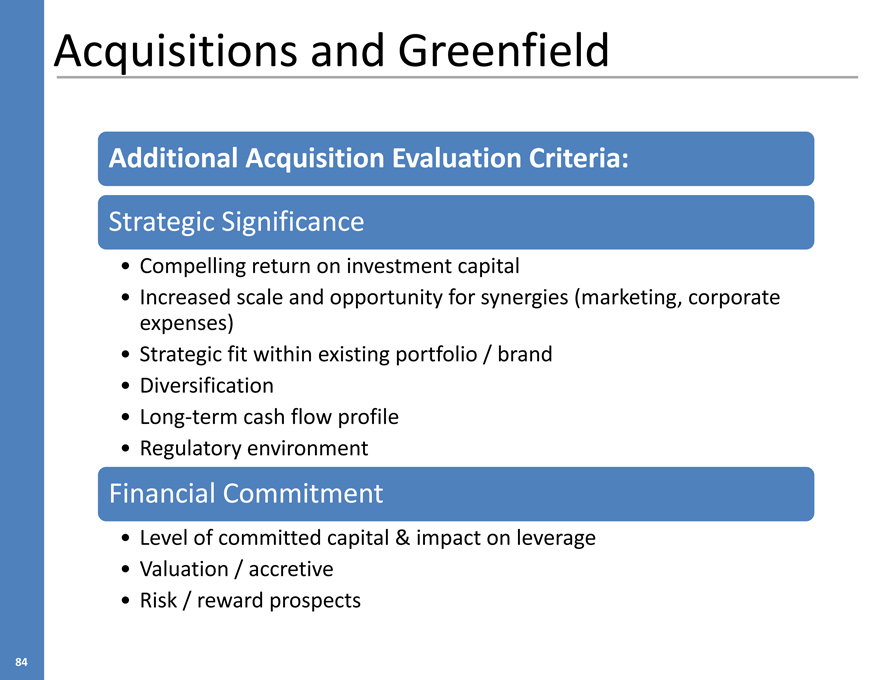
Acquisitions and Greenfield
Additional Acquisition Evaluation Criteria:
Strategic Significance
Compelling return on investment capital
Increased scale and opportunity for synergies (marketing, corporate expenses)
Strategic fit within existing portfolio / brand
Diversification
Long-term cash flow profile
Regulatory environment
Financial Commitment
Level of committed capital & impact on leverage
Valuation / accretive
Risk / reward prospects
84
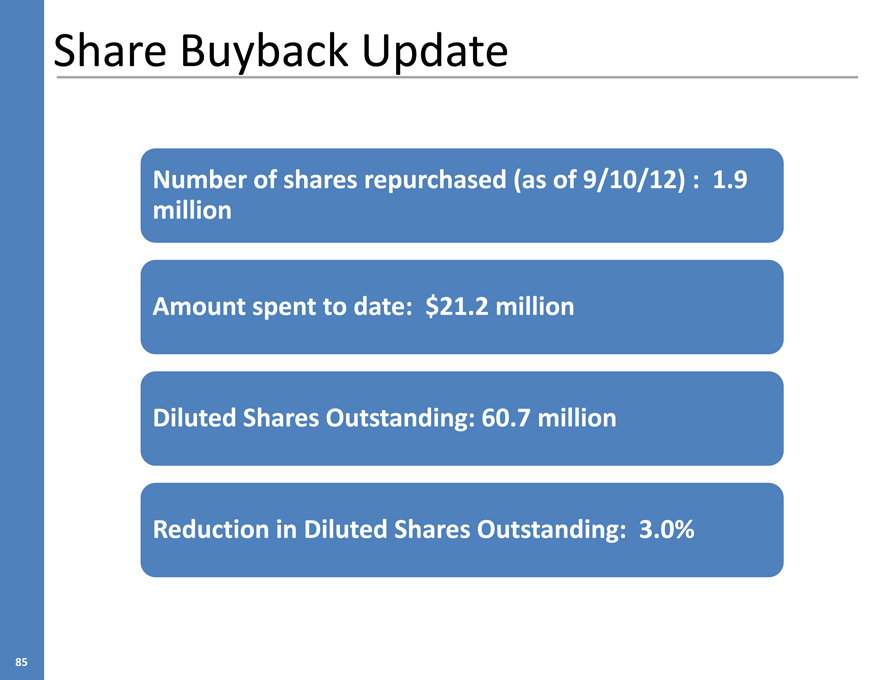
Share Buyback Update
Number of shares repurchased (as of 9/10/12) : 1.9 million
Amount spent to date: $21.2 million Diluted Shares Outstanding: 60.7 million Reduction in Diluted Shares Outstanding: 3.0%
85
Enterprise Growth & Development
86
River Downs
Neil Walkoff, EVP of Regional Operations
87
Cincinnati Population & Segmentation
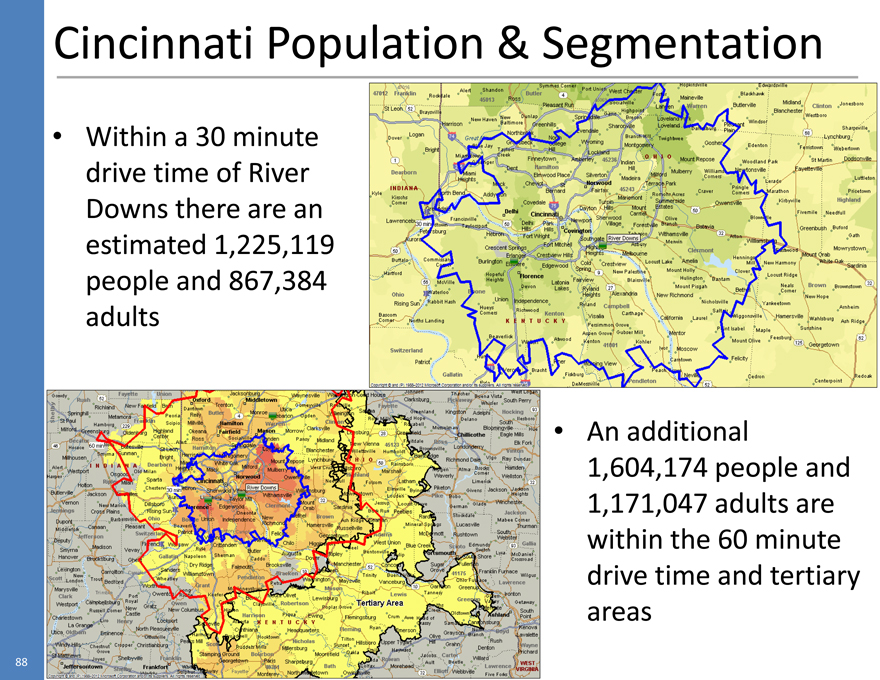
Within a 30 minute drive time of River Downs there are an estimated 1,225,119 people and 867,384 adults
An additional 1,604,174 people and 1,171,047 adults are within the 60 minute drive time and tertiary areas
88
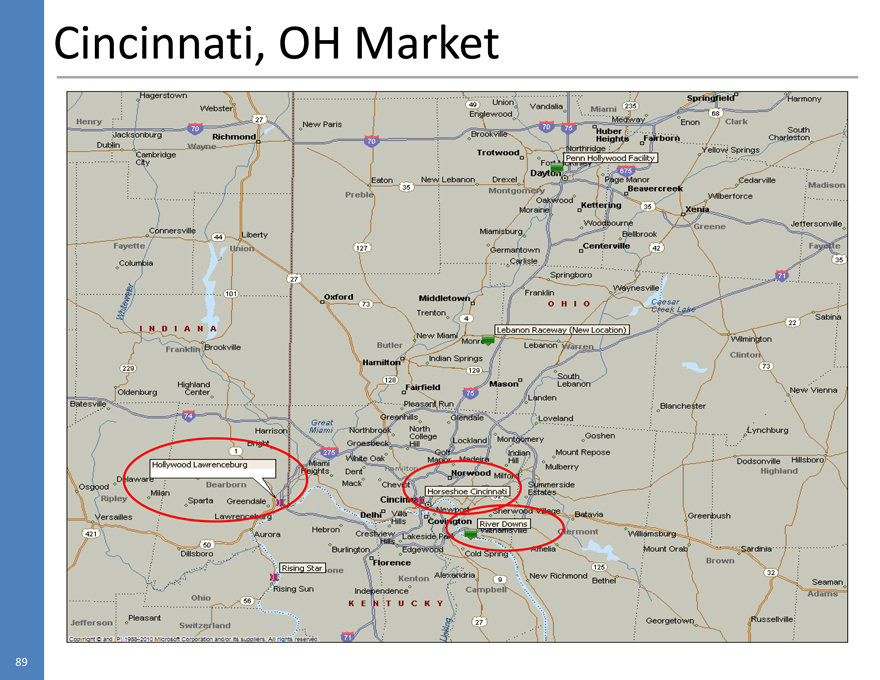
Cincinnati, OH Market
89
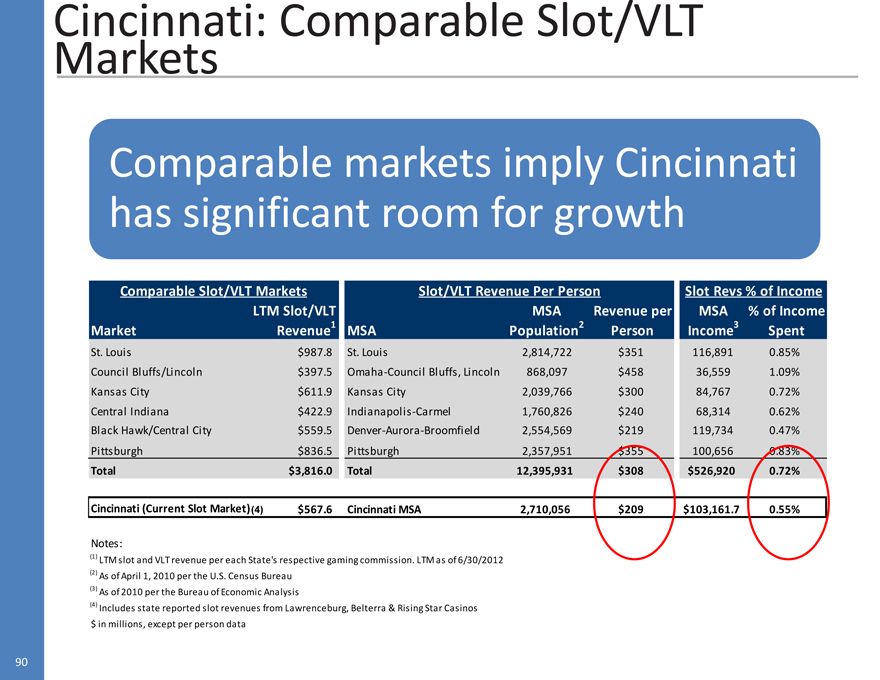
Cincinnati: Comparable Slot/VLI
Markets
Comparable markets imply Cincinnati has significant room for growth
Comparable Slot/VLT Markets Slot/VLT Revenue Per Person Slot Revs % of Income LTM Slot/VLT MSA Revenue per MSA % of Income Market Revenue1 MSA Population2 Person Income3 Spent
St. Louis $987.8 St. Louis 2,814,722 $351 116,891 0.85% Council Bluffs/Lincoln $397.5 Omaha-Council Bluffs, Lincoln 868,097 $458 36,559 1.09% Kansas City $611.9 Kansas City 2,039,766 $300 84,767 0.72% Central Indiana $422.9 Indianapolis-Carmel 1,760,826 $240 68,314 0.62% Black Hawk/Central City $559.5 Denver-Aurora-Broomfield 2,554,569 $219 119,734 0.47% Pittsburgh $836.5 Pittsburgh 2,357,951 $355 100,656 0.83%
Total $3,816.0 Total 12,395,931 $308 $526,920 0.72%
Cincinnati (Current Slot Market)(4) $567.6 Cincinnati MSA 2,710,056 $209 $103,161.7 0.55%
Notes:
(1) LTM slot and VLT revenue per each State’s respective gaming commission. LTM as of 6/30/2012 (2) As of April 1, 2010 per the U.S. Census Bureau (3) As of 2010 per the Bureau of Economic Analysis (4) Includes state reported slot revenues from Lawrenceburg, Belterra & Rising Star Casinos $ in millions, except per person data
90
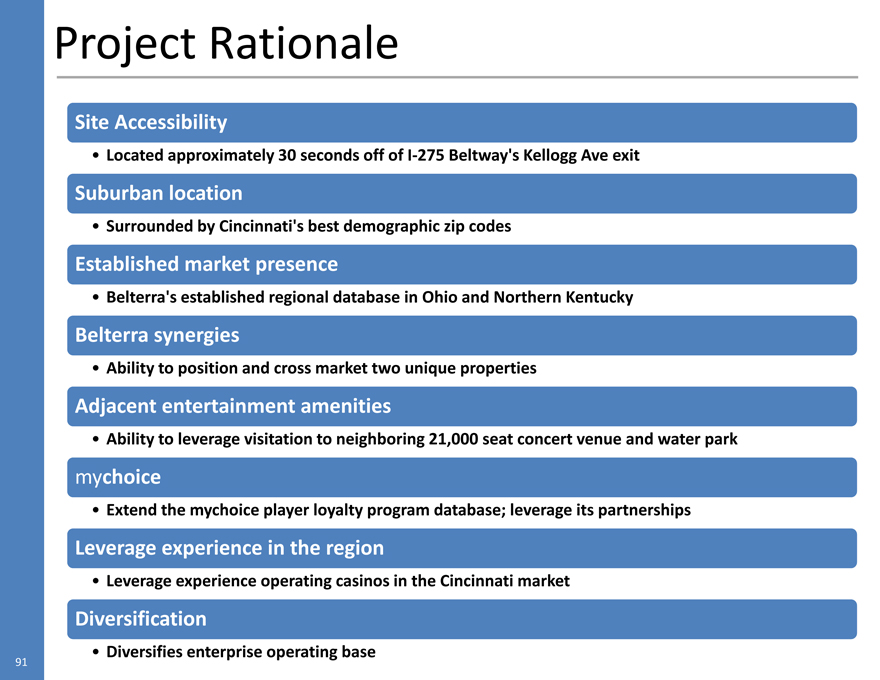
Project Rationale
Site Accessibility
Located approximately 30 seconds off of I-275 Beltway’s Kellogg Ave exit
Suburban location
Surrounded by Cincinnati’s best demographic zip codes
Established market presence
Belterra’s established regional database in Ohio and Northern Kentucky
Belterra synergies
Ability to position and cross market two unique properties
Adjacent entertainment amenities
Ability to leverage visitation to neighboring 21,000 seat concert venue and water park
mychoice
Extend the mychoice player loyalty program database; leverage its partnerships
Leverage experience in the region
Leverage experience operating casinos in the Cincinnati market
Diversification
Diversifies enterprise operating base
91
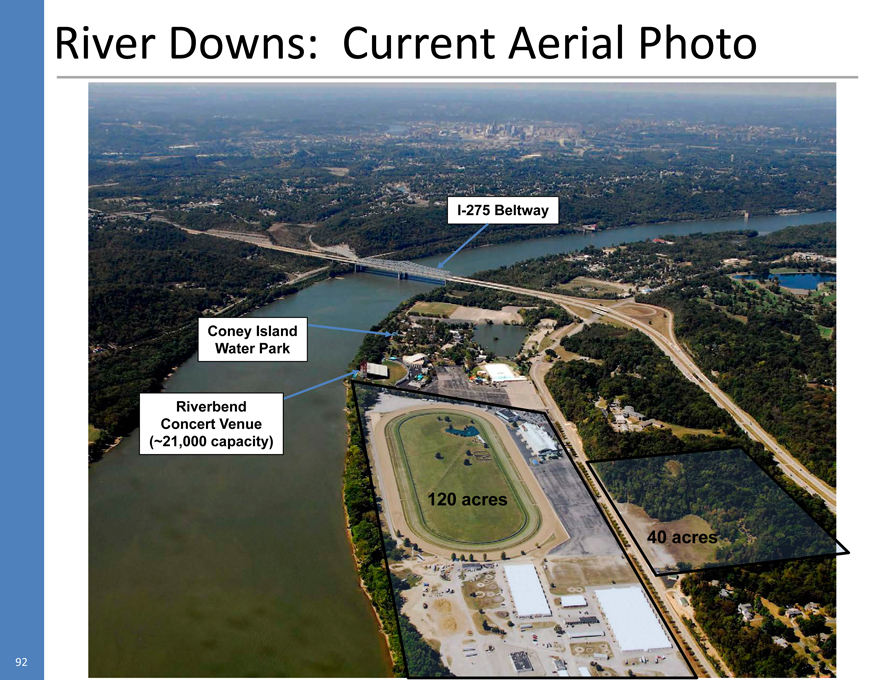
River Downs: Current Aerial Photo
I-275 Beltway
Coney Island Water Park
Riverbend Concert Venue (~21,000 capacity)
120 acres
40 acres
92
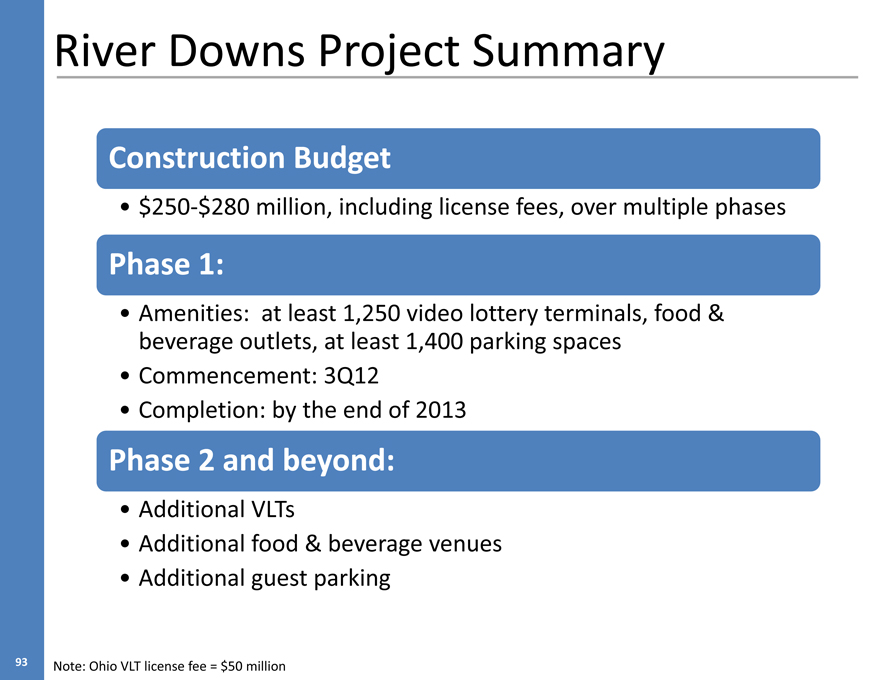
River Downs Project Summary
Construction Budget
$250-$280 million, including license fees, over multiple phases
Phase 1:
Amenities: at least 1,250 video lottery terminals, food & beverage outlets, at least 1,400 parking spaces
Commencement: 3Q12
Completion: by the end of 2013
Phase 2 and beyond:
Additional VLTs
Additional food & beverage venues
Additional guest parking
93 Note: Ohio VLT license fee = $50 million
Asian Coast Development (ACDL)
Anthony Sanfilippo, President & CEO
94
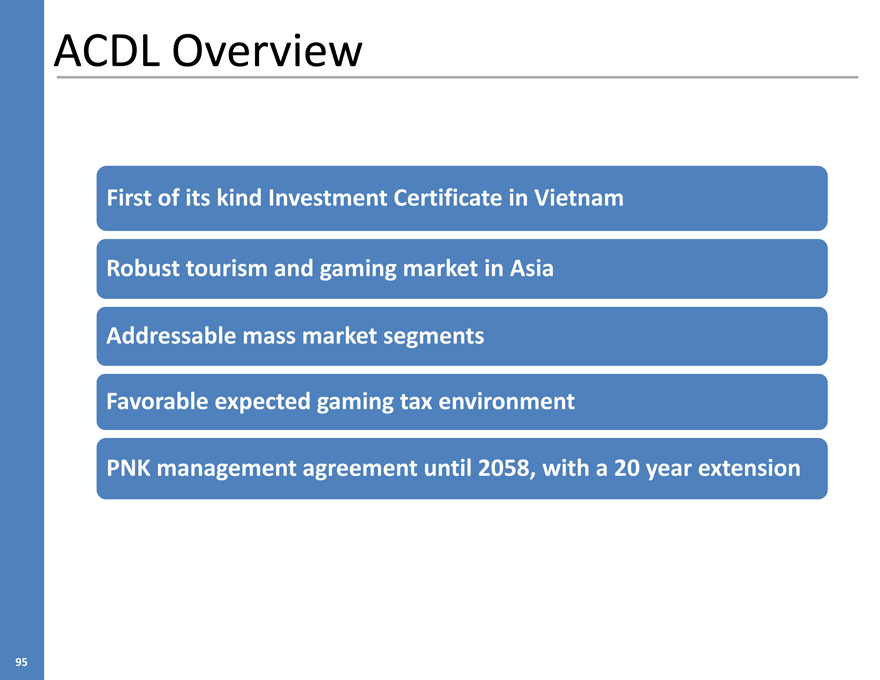
ACDL Overview
First of its kind Investment Certificate in Vietnam Robust tourism and gaming market in Asia Addressable mass market segments Favorable expected gaming tax environment
PNK management agreement until 2058, with a 20 year extension
95
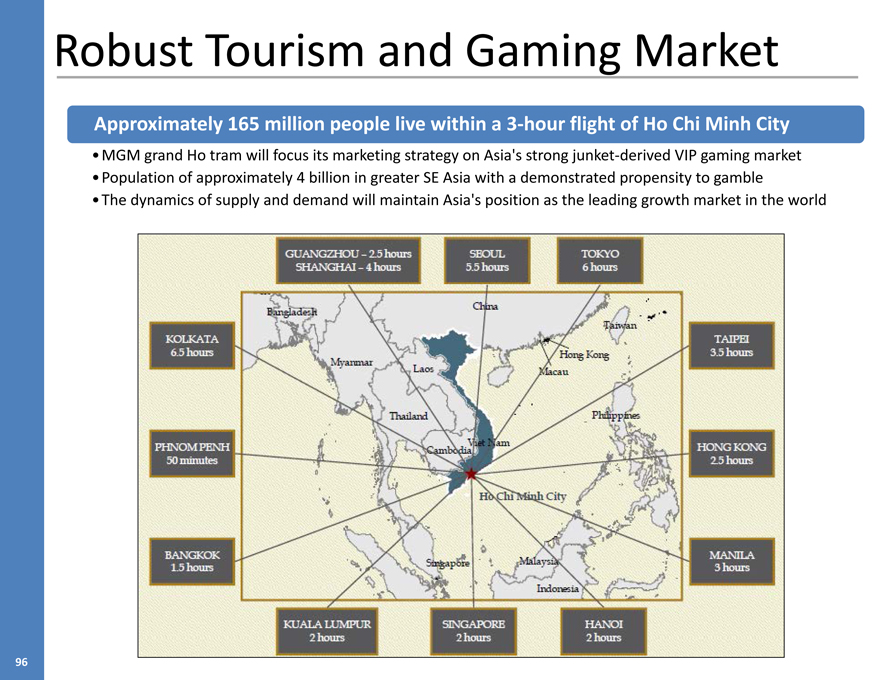
Robust Tourism and Gaming Market
Approximately 165 million people live within a 3-hour flight of Ho Chi Minh City
MGM grand Ho tram will focus its marketing strategy on Asia’s strong junket-derived VIP gaming market
Population of approximately 4 billion in greater SE Asia with a demonstrated propensity to gamble
The dynamics of supply and demand will maintain Asia’s position as the leading growth market in the world
96
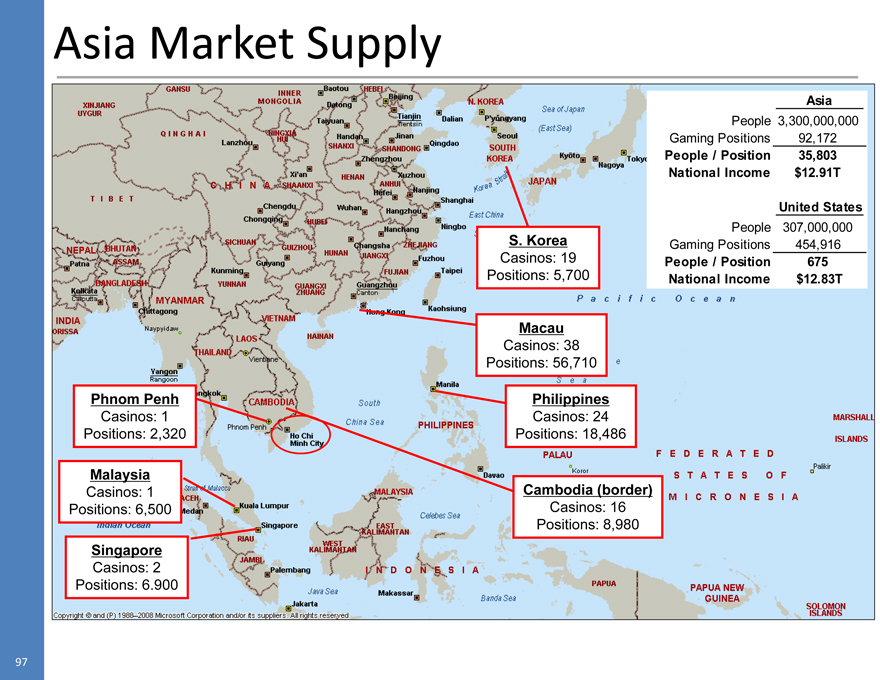
Asia Market Supply
Asia
People 3,300,000,000 Gaming Positions 92,172
People / Position 35,803 National Income $12.91T
United States
People 307,000,000 Gaming Positions 454,916
People / Position 675 National Income $12.83T
Phnom Penh
Casinos: 1 Positions: 2,320
Malaysia
Casinos: 1 Positions: 6,500
Singapore
Casinos: 2 Positions: 6.900
S. Korea
Casinos: 19 Positions: 5,700
Macau
Casinos: 38 Positions: 56,710
Philippines
Casinos: 24 Positions: 18,486
Cambodia (border)
Casinos: 16 Positions: 8,980
97
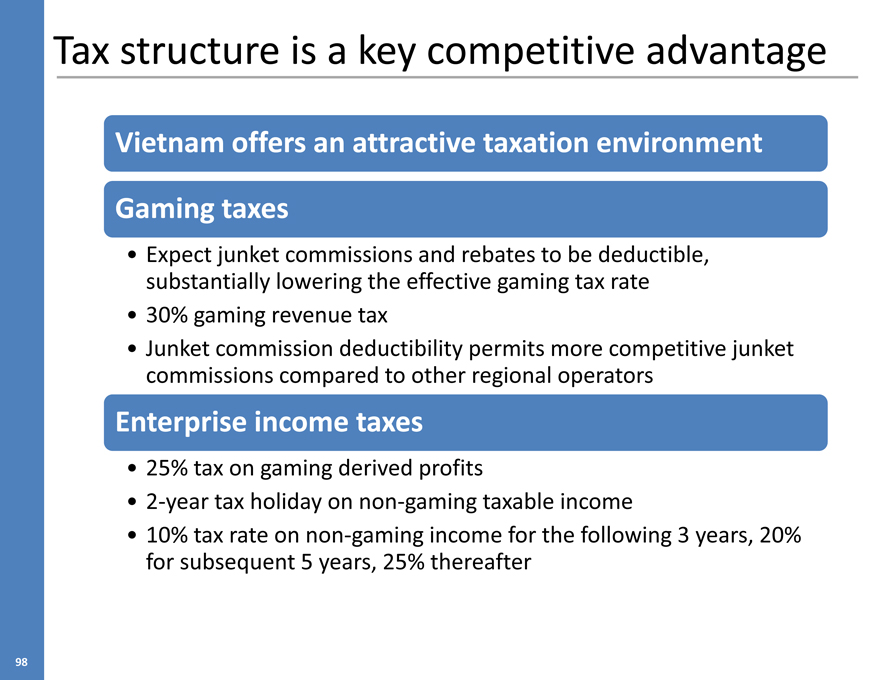
Tax structure is a key competitive advantage
Vietnam offers an attractive taxation environment Gaming taxes
Expect junket commissions and rebates to be deductible, substantially lowering the effective gaming tax rate
30% gaming revenue tax
Junket commission deductibility permits more competitive junket commissions compared to other regional operators
Enterprise income taxes
25% tax on gaming derived profits
2-year tax holiday on non-gaming taxable income
10% tax rate on non-gaming income for the following 3 years, 20% for subsequent 5 years, 25% thereafter
98
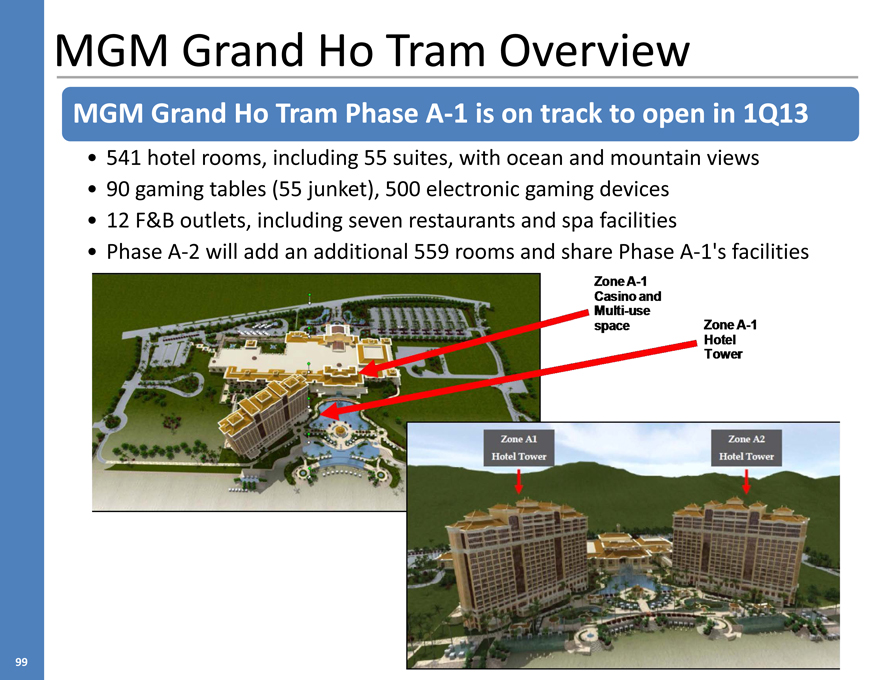
MGM Grand Ho Tram Overview
MGM Grand Ho Tram Phase A-1 is on track to open in 1Q13
541 hotel rooms, including 55 suites, with ocean and mountain views
90 gaming tables (55 junket), 500 electronic gaming devices
12 F&B outlets, including seven restaurants and spa facilities
Phase A-2 will add an additional 559 rooms and share Phase A-1’s facilities
99
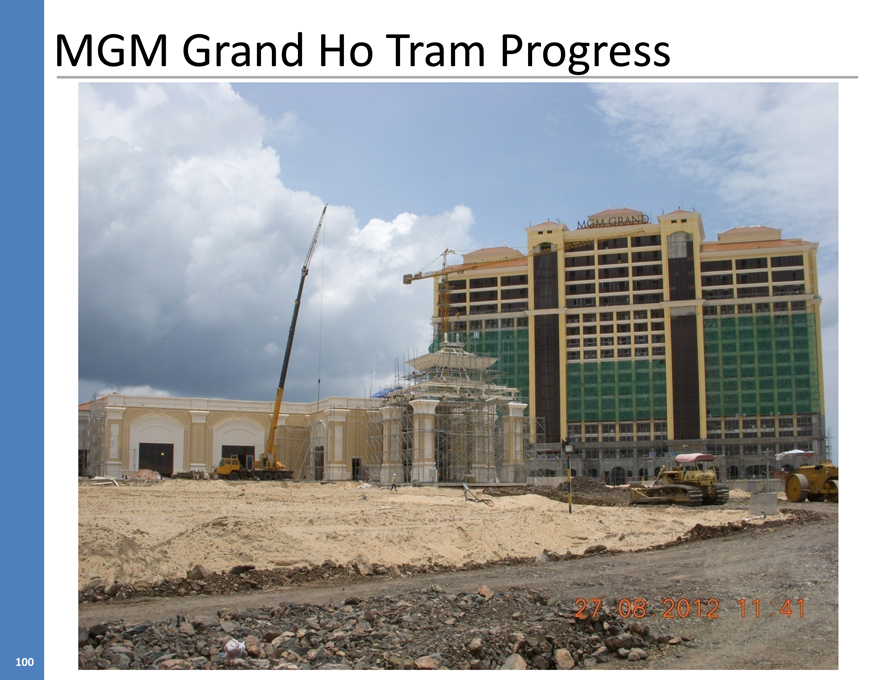
MGM Grand Ho Tram Progress
100
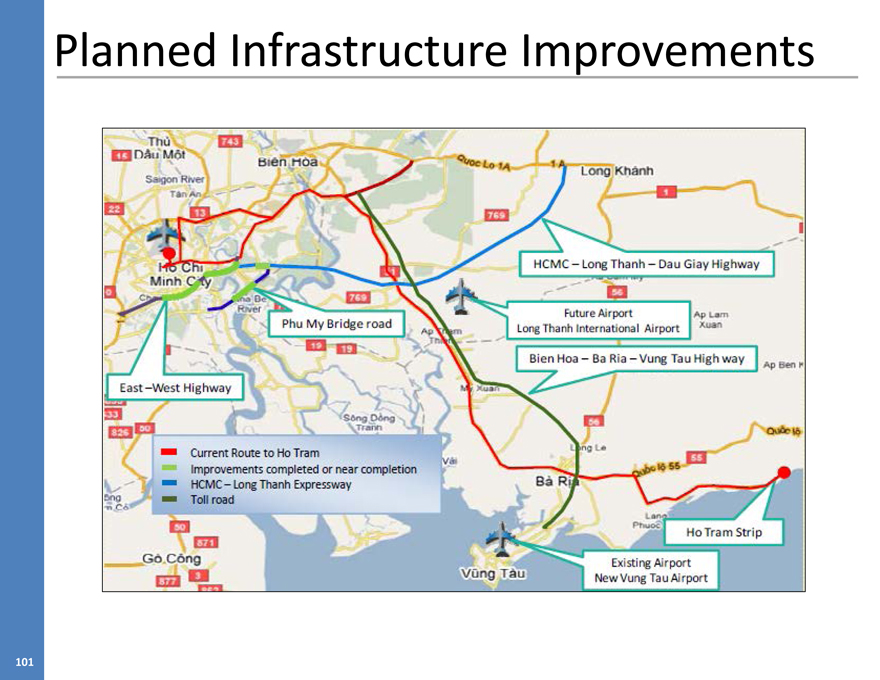
Planned Infrastructure Improvements
101
PNK Investment Timeline & Rationale
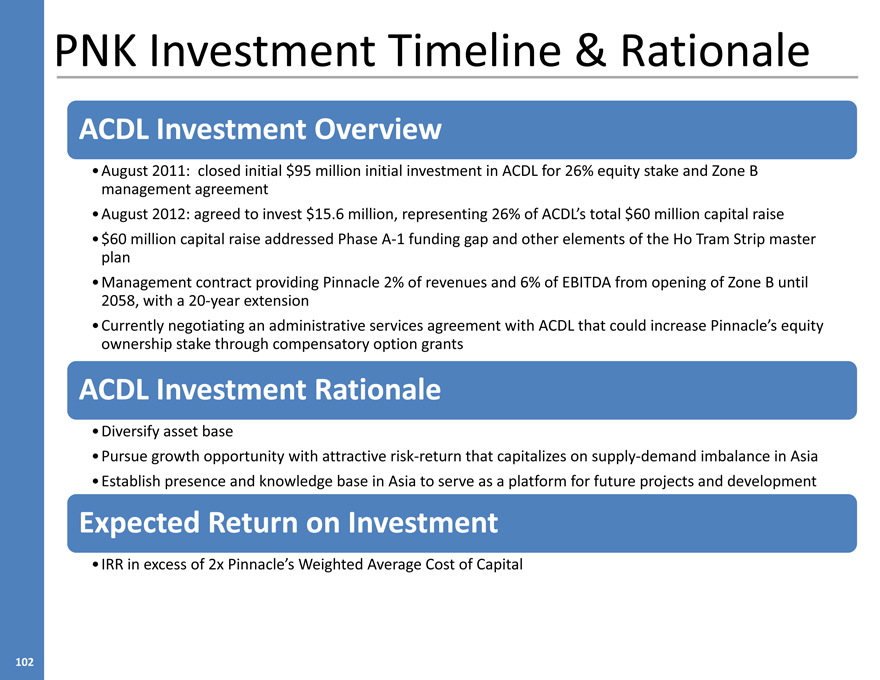
ACDL Investment Overview
August 2011: closed initial $95 million initial investment in ACDL for 26% equity stake and Zone B management agreement
August 2012: agreed to invest $15.6 million, representing 26% of ACDL’s total $60 million capital raise
$60 million capital raise addressed Phase A-1 funding gap and other elements of the Ho Tram Strip master plan
Management contract providing Pinnacle 2% of revenues and 6% of EBITDA from opening of Zone B until 2058, with a 20-year extension
Currently negotiating an administrative services agreement with ACDL that could increase Pinnacle’s equity ownership stake through compensatory option grants
ACDL Investment Rationale
Diversify asset base
Pursue growth opportunity with attractive risk-return that capitalizes on supply-demand imbalance in Asia
Establish presence and knowledge base in Asia to serve as a platform for future projects and development
Expected Return on Investment
IRR in excess of 2x Pinnacle’s Weighted Average Cost of Capital
102
ACDL Capital Structure
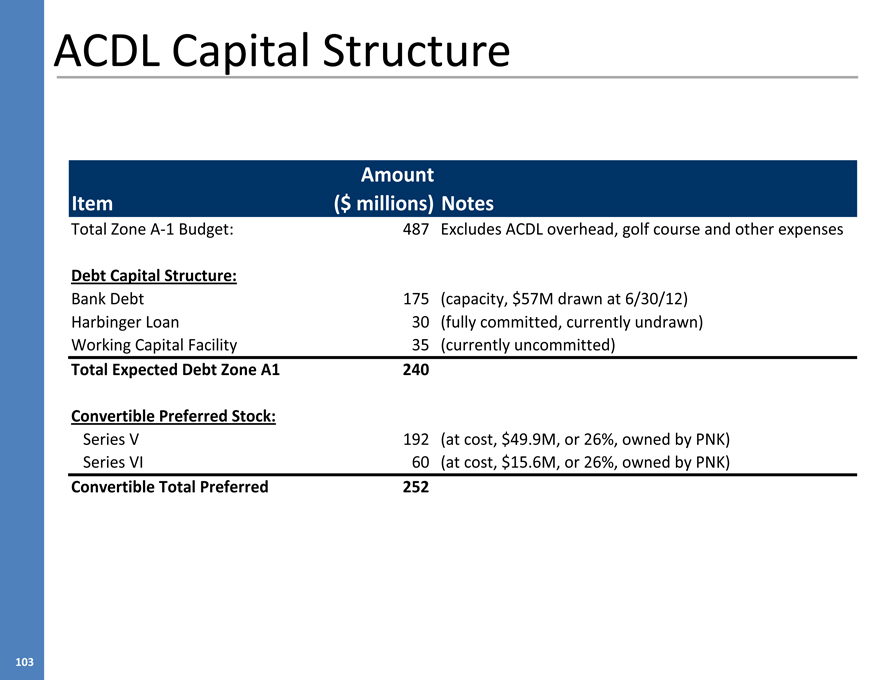
Amount Item ($ millions) Notes
Total Zone A-1 Budget: 487 Excludes ACDL overhead, golf course and other expenses
Debt Capital Structure:
Bank Debt 175 (capacity, $57M drawn at 6/30/12) Harbinger Loan 30 (fully committed, currently undrawn) Working Capital Facility 35 (currently uncommitted)
Total Expected Debt Zone A1 240
Convertible Preferred Stock:
Series V 192 (at cost, $49.9M, or 26%, owned by PNK) Series VI 60 (at cost, $15.6M, or 26%, owned by PNK)
Convertible Total Preferred 252
103
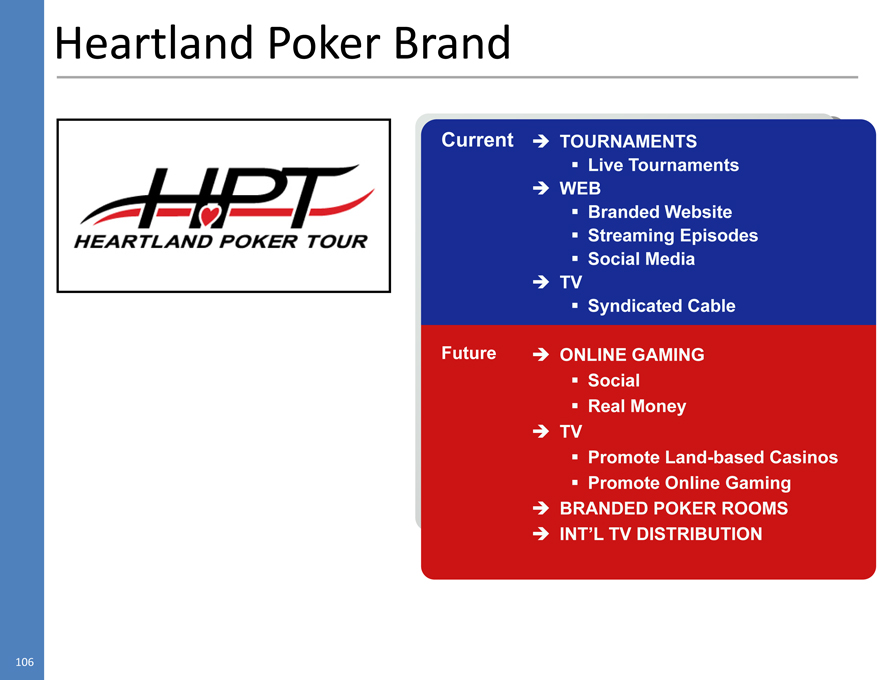
Heartland Poker Tour
104
Heartland Poker Tour
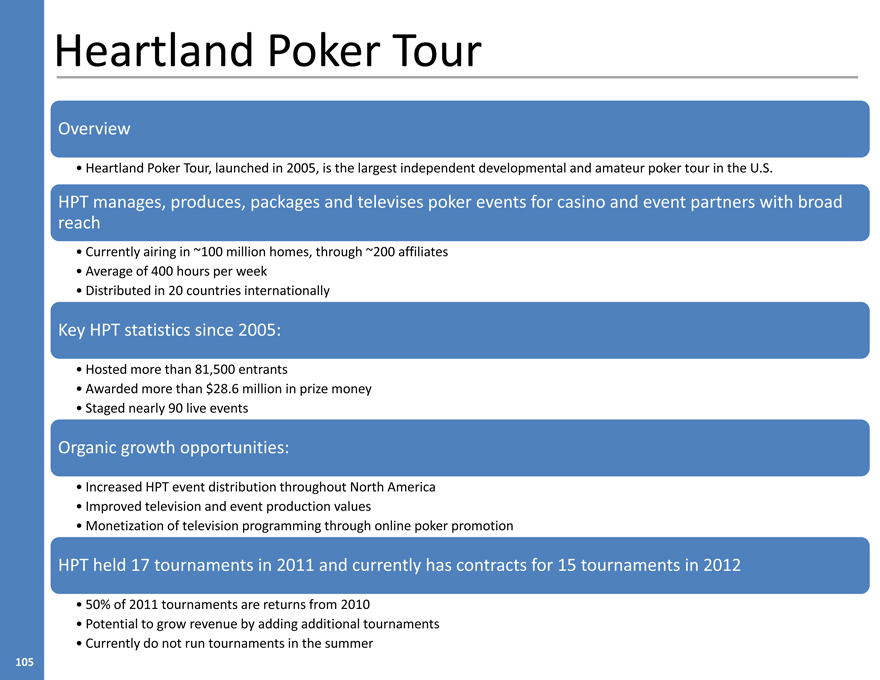
Overview
Heartland Poker Tour, launched in 2005, is the largest independent developmental and amateur poker tour in the U.S.
HPT manages, produces, packages and televises poker events for casino and event partners with broad reach
Currently airing in ~100 million homes, through ~200 affiliates
Average of 400 hours per week Distributed in 20 countries internationally
Key HPT statistics since 2005:
Hosted more than 81,500 entrants
Awarded more than $28.6 million in prize money
Staged nearly 90 live events
Organic growth opportunities:
Increased HPT event distribution throughout North America
Improved television and event production values
Monetization of television programming through online poker promotion
HPT held 17 tournaments in 2011 and currently has contracts for 15 tournaments in 2012
50% of 2011 tournaments are returns from 2010
Potential to grow revenue by adding additional tournaments
Currently do not run tournaments in the summer
105
Heartland Poker Brand
HEARTLAND POKER TOUR
Current
TOURNAMENTS
Live Tournaments
WEB
Branded Website
Streaming Episodes
Social Media
TV
Syndicated Cable
Future
ONLINE GAMING
Social
Real Money
TV
Promote Land-based Casinos
Promote Online Gaming
BRANDED POKER ROOMS
INT’L TV DISTRIBUTION
106
Non-EBITDA Producing Assets
Carlos Ruisanchez, EVP & Chief Financial Officer
107
Non-EBITDA Producing Assets (NEPA)
Pinnacle currently has a substantial asset base that does not produce EBITDA, but potentially provides incremental value to shareholders. Those include:
Net Operating Loss Carry Forward
Currently $240 million
Excess Land
More than 1,360 acres of excess land throughout portfolio
LAGCB Baton Rouge Performance Guarantee
$25 million escrow released to Pinnacle on 9/5/2012
Retama Park Investment
108
NOLs to Benefit Cash Flow
Pinnacle currently has $240 million of net operating loss carry forwards to limit taxes paid in the 2012 tax year and beyond
LTM pre-tax income of $44.5 million expected to grow meaningfully in coming years
Total cumulative potential cash flow benefit of approximately $4.00 per share once benefits are fully realized
Tax rate of approximately 40.25%, comprised of a 35% Federal corporate rate and 5.25% state tax rate
109
Excess Land Holdings
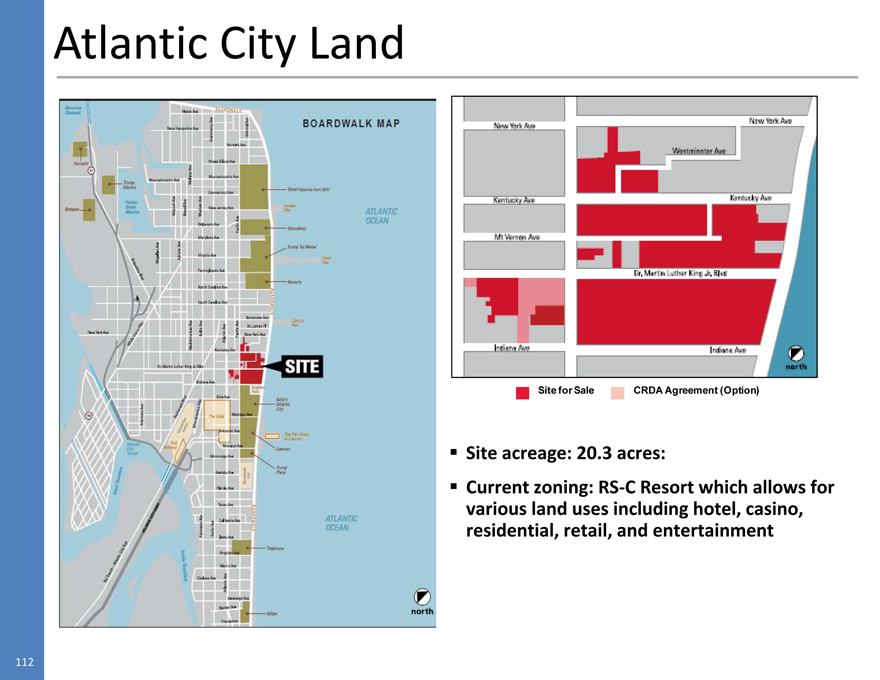
Atlantic City
Approximately 20 acres of land with boardwalk/beach frontage
Marketing of the land for sale is ongoing, with several parties interested in purchasing the site
Property tax relief and other modifications have nearly eliminated the cash drag of this land holding
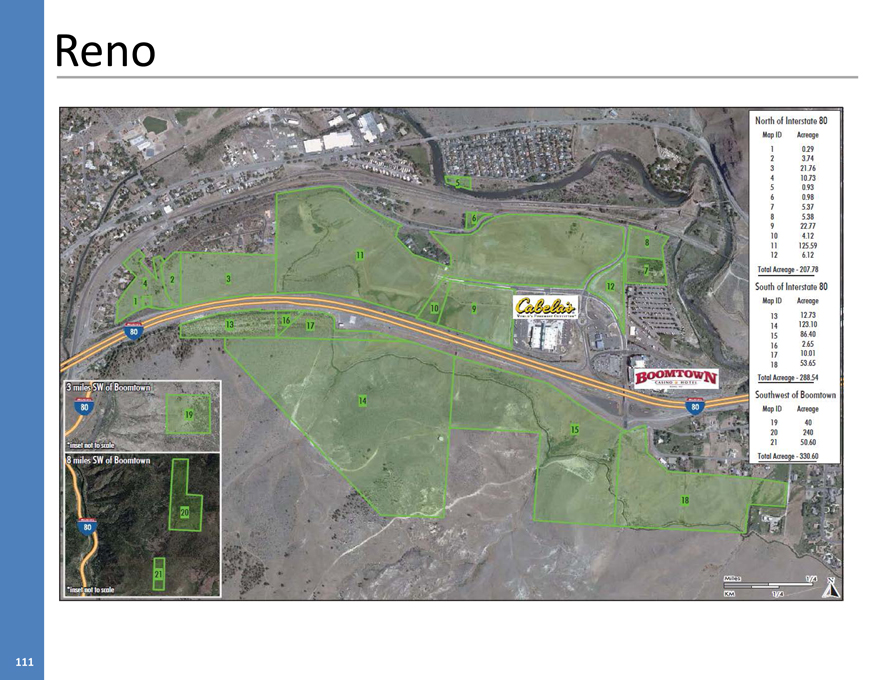
Reno
Approximately 800 acres of excess land held as discontinued operation
Continue to market land
Significant value in water rights associated with the property
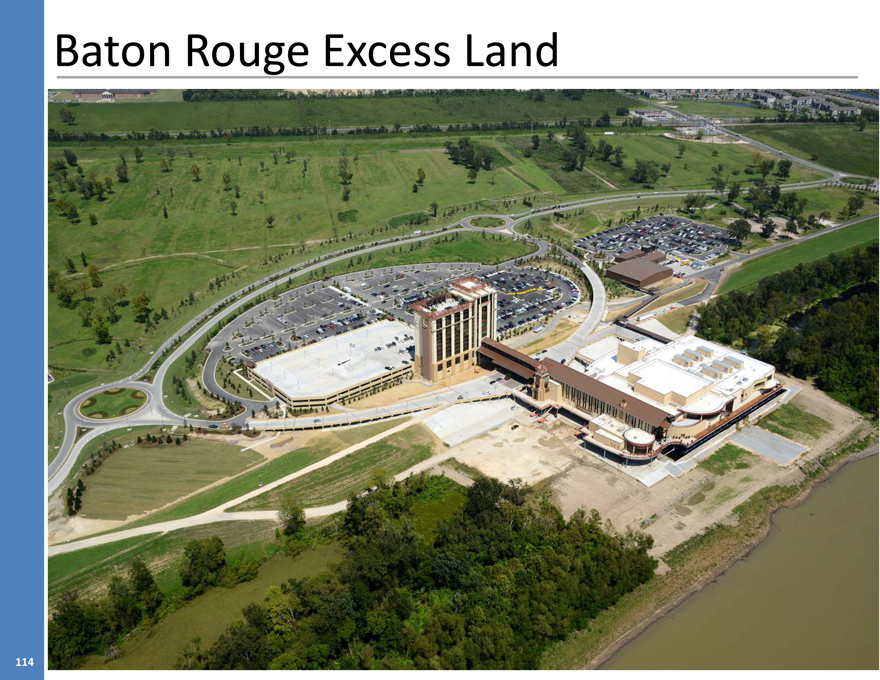
Baton Rouge
Approximately 499 acres of excess land
Additional F&B, hotel or other amenities adjacent to L’Auberge Baton Rouge if demand warrants
Additional development with third-party capital
Lake Charles
Approximately 44 acres of excess land
Potential to add additional resort amenities to increase attractiveness of property
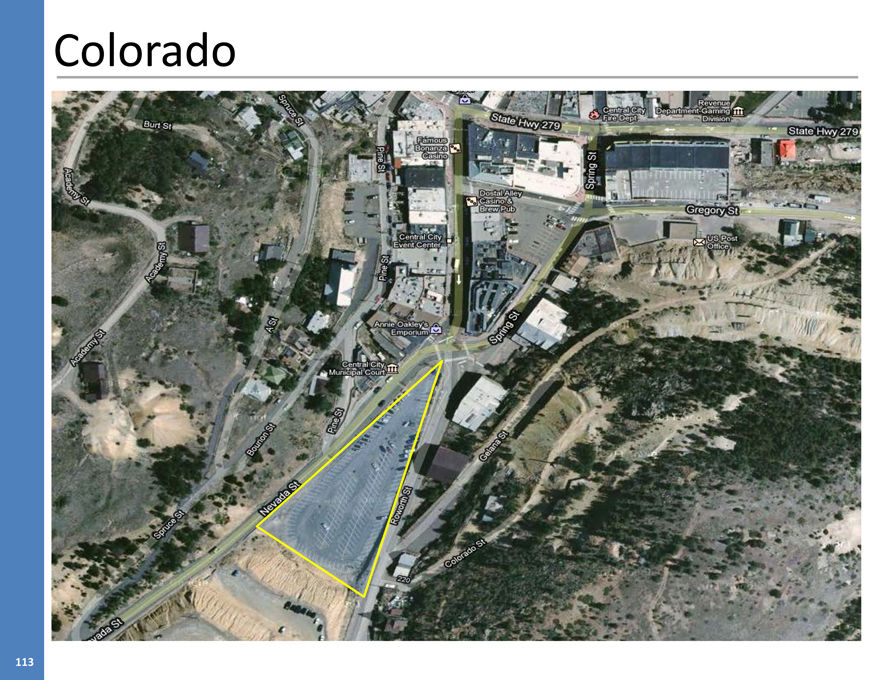
Colorado
Approximately 1.5 acres of excess land current under lease for parking lot
Significant value in water rights associated with the property
110
Reno
111
Atlantic City Land
Site for Sale
CRDA Agreement (Option)
Site acreage: 20.3 acres:
Current zoning: RS-C Resort which allows for various land uses including hotel, casino, residential, retail, and entertainment
112
Colorado
113
Baton Rouge Excess Land
114
Retama Park
Transaction overview
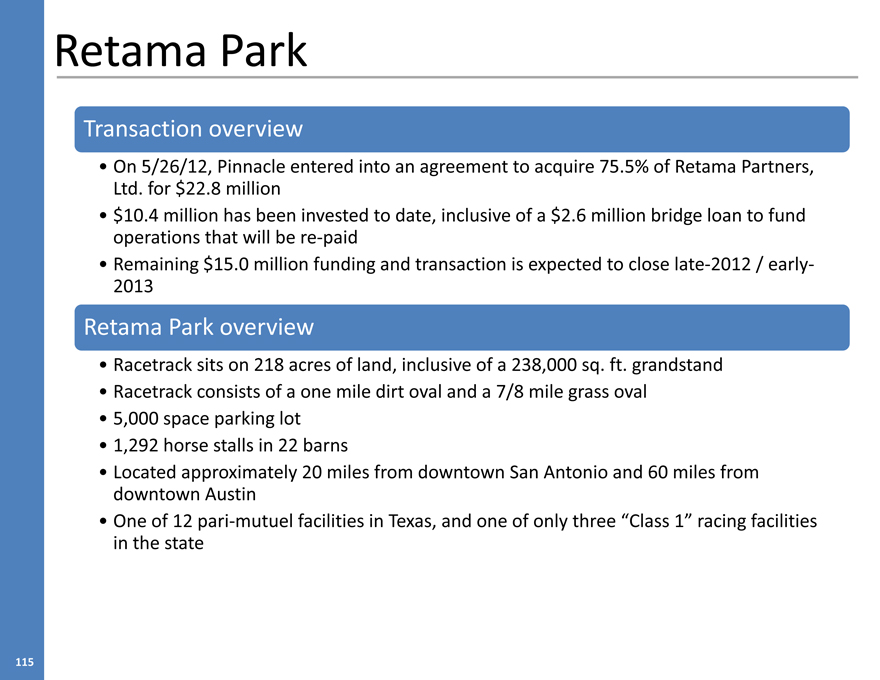
On 5/26/12, Pinnacle entered into an agreement to acquire 75.5% of Retama Partners, Ltd. for $22.8 million
$10.4 million has been invested to date, inclusive of a $2.6 million bridge loan to fund operations that will be re-paid
Remaining $15.0 million funding and transaction is expected to close late-2012 / early-2013
Retama Park overview
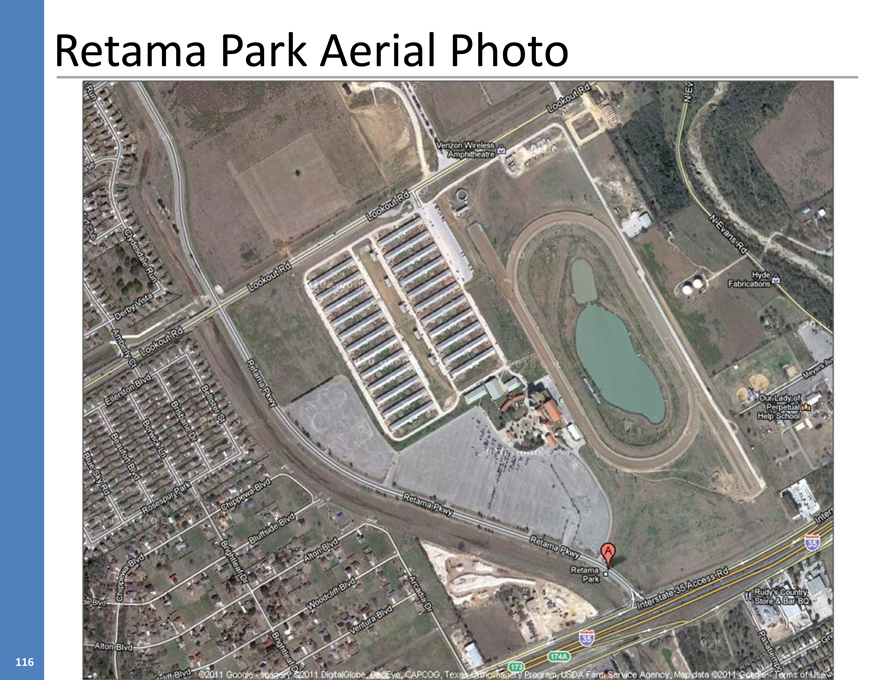
Racetrack sits on 218 acres of land, inclusive of a 238,000 sq. ft. grandstand
Racetrack consists of a one mile dirt oval and a 7/8 mile grass oval
5,000 space parking lot
1,292 horse stalls in 22 barns
Located approximately 20 miles from downtown San Antonio and 60 miles from downtown Austin
One of 12 pari-mutuel facilities in Texas, and one of only three “Class 1” racing facilities in the state
115
Retama Park Aerial Photo
116
Retama Park
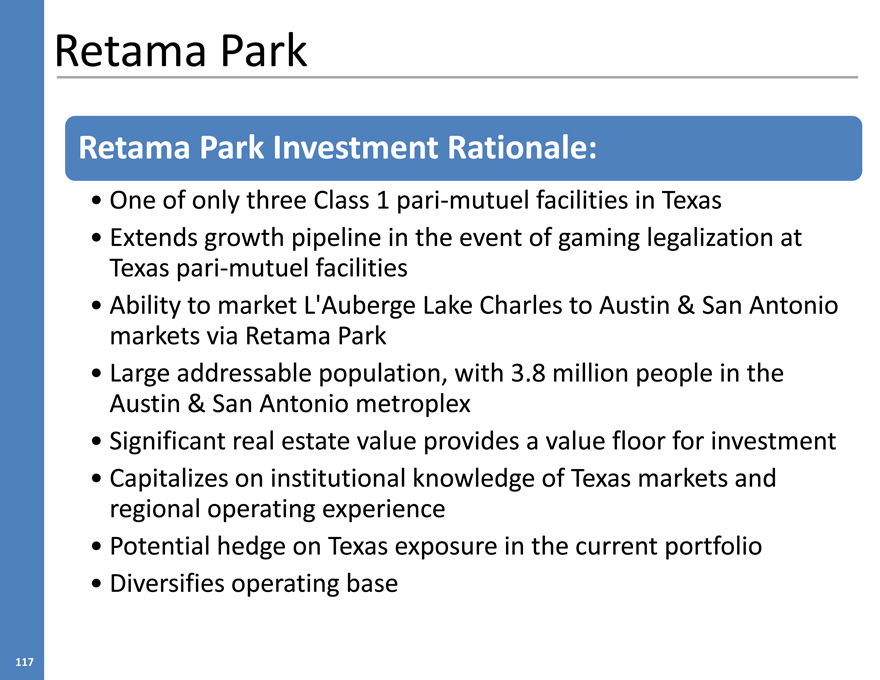
Retama Park Investment Rationale:
One of only three Class 1 pari-mutuel facilities in Texas
Extends growth pipeline in the event of gaming legalization at Texas pari-mutuel facilities
Ability to market L’Auberge Lake Charles to Austin & San Antonio markets via Retama Park
Large addressable population, with 3.8 million people in the Austin & San Antonio metroplex
Significant real estate value provides a value floor for investment
Capitalizes on institutional knowledge of Texas markets and regional operating experience
Potential hedge on Texas exposure in the current portfolio
Diversifies operating base
117
Closing Remarks
Anthony Sanfilippo, President & CEO
118
Closing Remarks
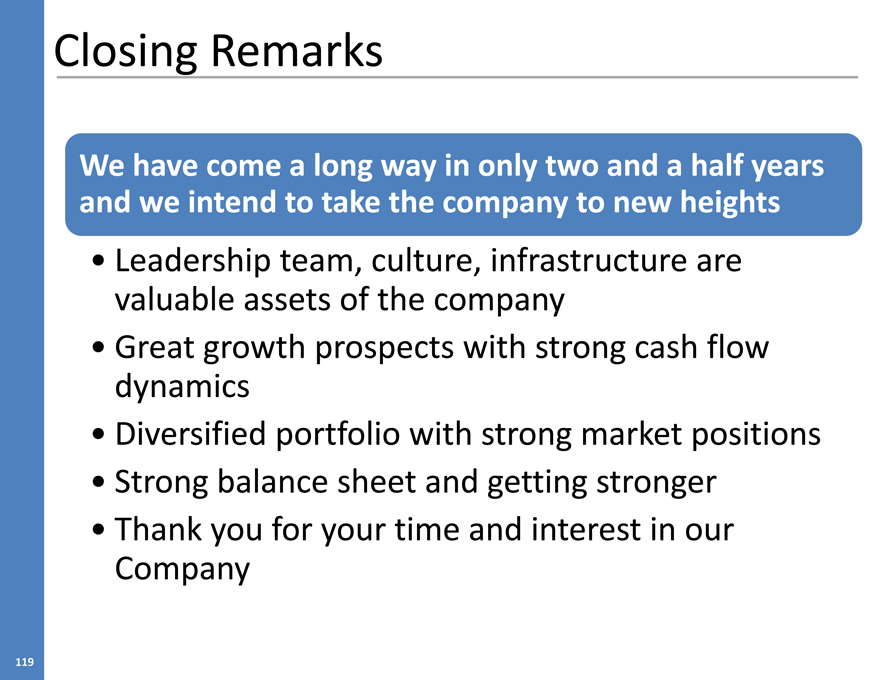
We have come a long way in only two and a half years and we intend to take the company to new heights
Leadership team, culture, infrastructure are valuable assets of the company
Great growth prospects with strong cash flow dynamics
Diversified portfolio with strong market positions
Strong balance sheet and getting stronger
Thank you for your time and interest in our Company
119
Non-GAAP Financial Measures
Consolidated Adjusted EBITDA and Consolidated Adjusted EBITDA margin are non-GAAP measurements. The Company defines Consolidated Adjusted EBITDA as earnings before interest income and expense, income taxes, depreciation, amortization, pre-opening and development expenses, non-cash share-based compensation, asset impairment costs, write-downs, reserves, recoveries, corporate-level litigation settlement costs, gain (loss) on sale of certain assets, loss on early extinguishment of debt, gain (loss) on sale of equity security investments, minority interest and discontinued operations. The Company defines Consolidated Adjusted EBITDA margin as Consolidated Adjusted EBITDA divided by revenues on a consolidated basis. Not all of the aforementioned benefits and costs occur in each reporting period, but have been included in the definition based on historical activity.
The Company uses Consolidated Adjusted EBITDA and Consolidated Adjusted EBITDA margin as relevant and useful measures to compare operating results between accounting periods. The presentation of Consolidated Adjusted EBITDA has economic substance because it is used by management as a performance measure to analyze the performance of its business and is especially relevant in evaluating large, long-lived casino-hotel projects because it provides a perspective on the current effects of operating decisions separated from the substantial, non-operational depreciation charges and financing costs of such projects. Management eliminates the results from discontinued operations as they are discontinued. Management also reviews pre-opening and development expenses separately, as such expenses are also included in total project costs when assessing budgets and project returns, and because such costs relate to anticipated future revenues and income. Management believes some investors consider Consolidated Adjusted EBITDA to be a useful measure in determining a company’s ability to service or incur indebtedness, service debt, and fund capital expenditures, acquisitions and operations and for estimating a company’s underlying cash flows from operations before capital costs, taxes and capital expenditures. These calculations are commonly used as a basis for investors, analysts and credit rating agencies to evaluate and compare operating performance and value of companies within our industry. Consolidated Adjusted EBITDA also approximates the measures used in the debt covenants within the Company’s debt agreements. Consolidated Adjusted EBITDA does not include depreciation or interest expense and therefore does not reflect current or future capital expenditures or the cost of capital. The Company compensates for these limitations by using other comparative measures to assist in the evaluation of operating performance.
EBITDA measures, such as Consolidated Adjusted EBITDA and Consolidated Adjusted EBITDA margin are not calculated in the same manner by all companies and, accordingly, may not be an appropriate measure of comparing performance among different companies. See the attached “supplemental information” tables for a reconciliation of Consolidated Adjusted EBITDA to Income (loss) from continuing operations and a reconciliation of Consolidated Adjusted EBITDA margin to Income (loss) from continuing operations margin.
The Company defines Adjusted EBITDA for each operating segment as earnings before interest income and expense, income taxes, depreciation, amortization, pre-opening and development expenses, non-cash share-based compensation, asset impairment costs, write-downs, reserves, recoveries, gain (loss) on sale of certain assets, gain (loss) on early extinguishment of debt, gain (loss) on sale of discontinued operations, and discontinued operations. The Company defines Adjusted EBITDA margin for each operating segment as Adjusted EBITDA divided by revenues for such segment. The Company uses Adjusted EBITDA and Adjusted EBITDA margin to compare operating results among its properties and between accounting periods.
120
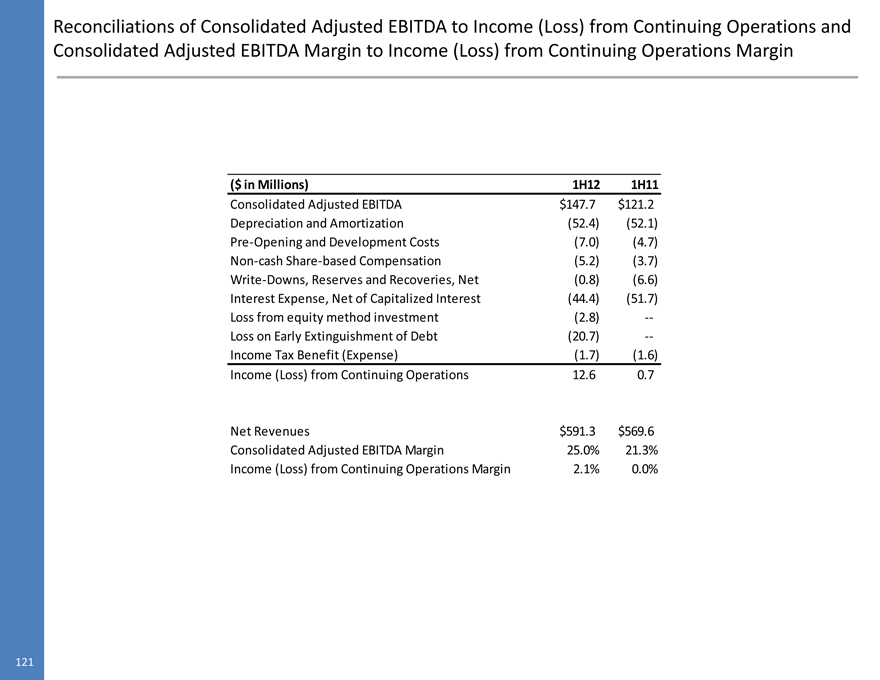
Reconciliations of Consolidated Adjusted EBITDA to Income (Loss) from Continuing Operations and Consolidated Adjusted EBITDA Margin to Income (Loss) from Continuing Operations Margin
($ in Millions) 1H12 1H11
Consolidated Adjusted EBITDA $147.7 $121.2 Depreciation and Amortization (52.4) (52.1) Pre-Opening and Development Costs (7.0) (4.7) Non-cash Share-based Compensation (5.2) (3.7) Write-Downs, Reserves and Recoveries, Net (0.8) (6.6) Interest Expense, Net of Capitalized Interest (44.4) (51.7) Loss from equity method investment (2.8) — Loss on Early Extinguishment of Debt (20.7) —Income Tax Benefit (Expense) (1.7) (1.6) Income (Loss) from Continuing Operations 12.6 0.7
Net Revenues $591.3 $569.6 Consolidated Adjusted EBITDA Margin 25.0% 21.3% Income (Loss) from Continuing Operations Margin 2.1% 0.0%
121
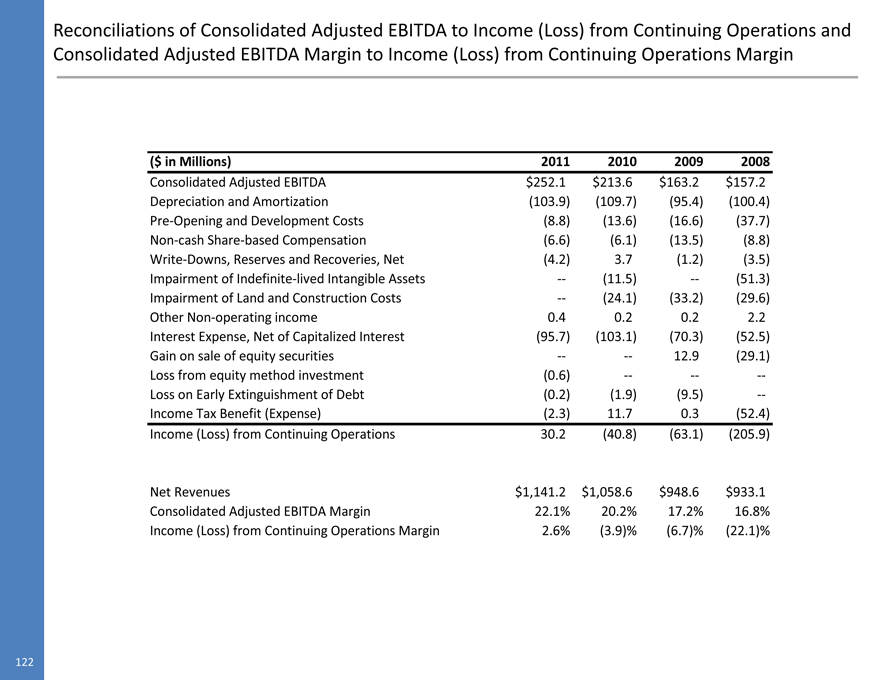
Reconciliations of Consolidated Adjusted EBITDA to Income (Loss) from Continuing Operations and Consolidated Adjusted EBITDA Margin to Income (Loss) from Continuing Operations Margin
($ in Millions) 2011 2010 2009 2008
Consolidated Adjusted EBITDA $252.1 $213.6 $163.2 $157.2 Depreciation and Amortization (103.9) (109.7) (95.4) (100.4) Pre-Opening and Development Costs (8.8) (13.6) (16.6) (37.7) Non-cash Share-based Compensation (6.6) (6.1) (13.5) (8.8) Write-Downs, Reserves and Recoveries, Net (4.2) 3.7 (1.2) (3.5) Impairment of Indefinite-lived Intangible Assets — (11.5) — (51.3) Impairment of Land and Construction Costs — (24.1) (33.2) (29.6) Other Non-operating income 0.4 0.2 0.2 2.2 Interest Expense, Net of Capitalized Interest (95.7) (103.1) (70.3) (52.5) Gain on sale of equity securities — — 12.9 (29.1) Loss from equity method investment (0.6) — — — Loss on Early Extinguishment of Debt (0.2) (1.9) (9.5) — Income Tax Benefit (Expense) (2.3) 11.7 0.3 (52.4) Income (Loss) from Continuing Operations 30.2 (40.8) (63.1) (205.9)
Net Revenues $1,141.2 $1,058.6 $948.6 $933.1 Consolidated Adjusted EBITDA Margin 22.1% 20.2% 17.2% 16.8% Income (Loss) from Continuing Operations Margin 2.6% (3.9)% (6.7)% (22.1)%
122
