
January 16, 2009
Via IDEA and Facsimile
| United States Securities and Exchange Commission | ||
| Division of Corporation Finance | ||
| 100 F Street N.E. | ||
| Washington, D.C. 20549-3561 | ||
| Attention: | Mr. Lyn Shenk | |
| Branch Chief | ||
| Re: | Pinnacle Entertainment, Inc. File No. 001-13641 Form 10-K: For the Fiscal Year Ended December 31, 2007 Form 10-Q: For the Quarterly Period Ended September 30, 2008 |
Dear Mr. Shenk:
This letter is being filed in response to comments received by Pinnacle Entertainment, Inc. (the “Company”) from the Staff of the Securities and Exchange Commission (the “Commission”) by letter dated December 4, 2008 with respect to the Company’s Form 10-K for the fiscal year ended December 31, 2007 and Form 10-Q for the quarterly period ended September 30, 2008. The numbered paragraph and headings below correspond to the numbering and headings set forth in the comment letter. To assist in your review, the Staff’s comments are highlighted in bold below and are followed by the responses of the Company.
Form 10-K: For the fiscal year ended December 31, 2007
Notes to the Consolidated Financial Statements, page F-7
Note 1: Summary of Significant Accounting Policies, page F-7
Property and Equipment, page F-8
Goodwill and Other Intangible Assets, page F-9
Goodwill and Other Intangible Assets, page F-9
| 1. | We note that your common share price and overall market capitalization have significantly declined during the interim periods in fiscal 2008. In addition, your total market capitalization currently approximates $345 million, which is significantly below your September 30, 2008 book value of $1.038 billion. We also note that significant adverse changes in business climate and economic conditions through a sluggish economy, shaky consumer confidence, and a credit crunch has impacted your results of operations as significant operating losses have been incurred in the last four quarters commencing in the fourth quarter of fiscal 2007. Furthermore, the gaming industry appears headed for a difficult operating environment for the near term as the economic slowdown and softening economy makes realizing anticipated yield amounts more difficult to obtain. |
The material decline in the Company’s market capitalization and its disparity with book value coupled with continuing operating losses and the adverse changes in business climate through the economic slowdown may be indicative of a potential impairment of the Company’s recorded investment in its property and equipment and goodwill and other intangible assets. We believe these material adverse events and changes that have occurred may have required the testing of impairment of the aforementioned assetsbefore the annual testing period that is generally used by the company in its impairment assessment. In this regard, please refer to the guidance in paragraphs 28 and 8 of SFAS 142 and 144, respectively. As such, please provide us with a current detailed impairment analysis and advise us what consideration was given to recognizing an impairment of the Company’s recorded investment in property and equipment and goodwill and other intangible assets through this analysis for the quarterly period ended September 30, 2008.
As part of your response, please also specifically provide us a summary of the material relevant significant assumptions and estimates underlying your previous impairment analyses and how the assumptions, estimates, and projections have changed over the past two years and how the assumptions, estimates and projections used in the previous two years compare with the actual operating results that occurred in fiscal 2007 and nine month fiscal 2008 interim period ended September 30th. In addition, please provide us with any other information that you believe would assist us in our review.
Response:
Current Impairment Analysis
The effective date of the Company’s SFAS 142 annual impairment analysis is October 1. During the fourth quarter of 2008, the Company began the process of performing this impairment analysis, engaging outside valuation specialists to assist in the process. The Company’s goodwill and indefinite-lived intangible assets, by reporting unit, as of October 1, 2008 are as follows:
2
| Gaming | ||||||||
| Reporting Units | Goodwill | License | ||||||
| (in millions) | ||||||||
Boomtown New Orleans | $ | 16.8 | $ | — | ||||
Boomtown Reno | 9.9 | — | ||||||
Boomtown Bossier | — | 15.7 | ||||||
The Admiral Riverboat Casino | 18.6 | 1.9 | ||||||
Sugarcane Bay Casino Development Project | — | 32.3 | ||||||
Baton Rouge Casino Development Project | — | 23.4 | ||||||
| $ | 45.3 | $ | 73.3 | |||||
Given the complexity of the analysis, and the sensitivity of the inputs involved, the Company is still in the process of finalizing its SFAS 142 impairment analysis. As we finalize the analysis over the coming weeks, the Company would be pleased to provide the Staff with the detailed results.
As of September 30, 2008, the Company had long-lived assets with an aggregate carrying value of $1.9 billion. In accordance with SFAS 144, we continually assess whether events or changes in circumstances have occurred that may indicate that the carrying value of the Company’s long-lived assets may not be recoverable and thus should be tested for recoverability, and noted no such events or changes at September 30, 2008.
Considerations of Recognizing Impairment as of September 30, 2008
In response to the Staff’s request regarding the consideration given to recognizing an impairment of the Company’s recorded investment in property and equipment, goodwill and indefinite-lived intangible assets for the quarterly period ended September 30, 2008, management carefully considered throughout the interim periods of 2008 whether events had occurred or circumstances had changed which would require the Company to perform interim period testing for impairment of goodwill and indefinite-lived intangible assets in accordance with SFAS 142 paragraph No. 28 or to perform impairment testing of long-lived assets in accordance with SFAS 144 paragraph No. 8. In reviewing each of the events and circumstances indicated therein, management noted no significant indication that we believed would trigger interim impairment analyses. The only indicator from paragraph 28 of SFAS 142 or paragraph 8 from SFAS 144 with potential relevance to the interim periods of 2008 was a change in the business climate, and the impact of this change has been wide-spread to virtually all industries. After considering several qualitative and quantitative factors, the Company determined that the changes to the business climate were not significant enough to represent a triggering event. The following factors were considered in making this determination:
3
Current and Projected Operating Results
Despite experiencing operating losses in the interim periods in the current year, the Company has a history of positive operating cash flow, it has generated positive operating cash flow in each of the interim quarterly periods of 2008, and it anticipates continuing positive operating cash flow in the future. Management uses Adjusted EBITDA1 to both measure and manage the Company, and Wall Street generally uses the same metric for analyzing period results and valuing companies within the gaming industry. Management believes the Company’s Adjusted EBITDA results for the interim quarterly periods of 2008, though impacted somewhat by recessionary economic conditions, have remained solid. We also note that the Company is an owner and operator of casino and hotel properties in various regional markets, and management believes these markets have, in general, been impacted less than Las Vegas Strip operations in the current economic downturn.
Company’s Stock Price and Market Capitalization relative to Net Book Value
Public equity market valuations have experienced significant declines in recent periods and equity market volatility has risen sharply (please see attached Exhibits A & B). This “valuation dislocation” has been wide spread across many industries. The Company’s stock price has been unusually and highly volatile throughout 2008, reflecting a 66% decline in stock price and market capitalization for the nine months ended September 30, 2008. This decline is generally in tandem with our peers in the gaming sector. This significant market capitalization decline bears no discernable relationship to the Company’s core operating performance, as judged by Wall Street’s historical valuation criterion of Adjusted EBITDA. In addition, management’s observation is that the Company is one of only a few gaming companies with a balance sheet demonstrating both liquidity and a longer-term maturity structure to its outstanding debt.
During the last several fiscal quarters, management has believed that the variance between the Company’s market and net book values is predominantly attributable to an unjustifiably low market equity valuation resulting from unusual and extreme conditions in the economy and financial markets. It appears to us that this variance is symptomatic of a national economy very concerned about deep and fundamental issues now facing our economic system. These issues include, among others, the current residential mortgage crisis, the stressed nature of the U.S. housing market, significant strain within our financial services sector, the current credit crisis in its many permutations, the specter of expanding U.S. government deficits, a lack of consumer confidence, and from all of this the resultant flight to quality across the financial markets, which we believe has dramatically affected the trading prices of our equity and debt securities.
| 1 | We define Adjusted EBITDA as earnings before interest income and expense, income taxes, depreciation, amortization, pre-opening and development costs, asset impairment costs, non-cash share-based compensation, write-downs, reserves, recoveries, gain (loss) on sale of certain assets, gain (loss) on sale of equity security investments, minority interest, loss on early extinguishment of debt and discontinued operations. |
4
By the numbers we reach the same conclusion. As of September 30, 2008, if we apply an estimated market EBITDA multiple of 7.5 times2 to the Company’s consolidated trailing twelve month (“TTM”) property-level Adjusted EBITDA of $185.4 million, the result is a “fair value” estimate of TTM property-level Adjusted EBITDA of approximately $1.4 billion. Deducting from this result total outstanding indebtedness (net of cash balances) of approximately $790 million, the implied “fair value” estimate of the Company’s TTM property-level Adjusted EBITDA is approximately $600 million. To this result must be added at least three other valuation estimates: 1) the non-earning assets3 of the Company, which are significant in number and scope; 2) the value of our newest hotel-casino operation, Lumiere Place in St. Louis, MO, which includes a Four Seasons hotel and has only recently started to generate positive Adjusted EBITDA results; and 3) a control premium. As such, management believes the true and longer-term equity value of the Company to be substantially in excess of the approximately $450 million market capitalization reflected by the Company’s stock price at September 30, 2008.
Finally, as of September 30, 2008, management assessed the volatility in the Company’s stock price. Given the recent extreme and largely unprecedented levels of volatility stemming from the economic conditions mentioned above, management concluded that the recent decline in the Company’s stock price and market capitalization was probably not a long-lived phenomenon. Management expects that, over time, a more rational reflection of the Company’s fair value will be reflected in its stock price.
After considering the applicable guidance and factors noted above, management concluded that as of the end of the third quarter and through the November 10, 2008 filing of the Company’s third quarter Form 10-Q, no events or change in circumstances had occurred that would require the Company to perform interim period testing for impairment of goodwill, other intangible assets, and long-lived assets.
Summary of Material Relevant Significant Assumptions and Estimates in Prior Analyses
For purposes of estimating the fair value of the reporting units in prior analyses, the Income and Market Approaches to value were utilized. Specifically, the Income Approach incorporated the use of the Discounted Cash Flow Method, whereas the Market Approach incorporated the use of the Guideline Company Method. In the valuation of the gaming licenses, the Greenfield Approach or Build-up Method was applied.
| 2 | We consider a 7.5 times Adjusted EBITDA multiple valuation estimate appropriate, as 7 — 9 times multiples are currently being utilized by Wall Street analysts for the gaming industry, and a recently announced Las Vegas Strip property acquisition was priced at approximately 7.75 times Adjusted EBITDA. | |
| 3 | Non-earning assets of the Company include, among others: approximately $100 million of invested capital at our River City casino development near St. Louis, MO; approximately 22 acres of developable land in an excellent location on the Boardwalk in Atlantic City, NJ; approximately 490 acres of land around our Boomtown Reno property in Reno, NV; and two gaming development opportunities (including gaming licenses) in the cities of Lake Charles and Baton Rouge, LA as well as local approval and the real estate (in each case) for development. |
5
As requested, the following is a summary of the material relevant significant assumptions and estimates underlying the Company’s previous impairment analyses prepared with respect to goodwill and indefinite-lived intangible assets over the past two years as compared to actual operating results that have occurred in 2006 and 2007:
Assumptions and estimates underlying our SFAS 142 impairment analysis:
| 10/1/2006 | 10/1/2007 | |||||||
| Step 1 - EBITDA multiple | 12.9x | 11.6x | ||||||
| Cost of Debt | 7.74 | % | 7.95 | % | ||||
| Expected Return on Equity | 9.95 | % | 13.45 | % | ||||
| WACC | 8.15 | % | 10.41 | % | ||||
| Discount rate | 8.15 | % | 10.41 | % | ||||
| Long-term growth rate | 4.0 | % | 3.0 | % | ||||
| Effective income tax rate | 40 | % | 40 | % | ||||
Projected & Actual Property-Level Adjusted EBITDA (in millions):
| Valuation Date | 2006 | 2007 | ||||||
| 10/1/2006 | $ | 229.3 | $ | 239.7 | ||||
| 10/1/2007 | n/a | $ | 209.4 | |||||
| Actual Results | $ | 231.7 | $ | 208.9 | ||||
The variances between projections used in our 2006 and 2007 impairment analyses indicate that our projections were fairly conservative. The future annual projections used in our analyses through the year ended 2012 have not been provided as these periods do not have actual results just yet and no comparison can yet be performed. We have not yet finalized our year end 2008 results.
* * * * * *
With respect to the preceding responses, the Company acknowledges that:
| • | the Company is responsible for the adequacy and accuracy of the disclosure in the filing; | ||
| • | Staff comments or changes to disclosure in respect to Staff comments do not foreclose the Commission from taking any action with respect to the filing; and | ||
| • | the Company may not assert Staff comments as a defense in any proceeding initiated by the Commission or any person under the federal securities laws of the United States. |
If you have any questions concerning the foregoing, please contact me or Dan Boudreaux at (702) 784-7777.
| Sincerely, | ||
| /s/ Stephen H. Capp | ||
| Stephen H. Capp, | ||
| Executive Vice President and | ||
| Chief Financial Officer of | ||
| Pinnacle Entertainment, Inc. |
6
Copy to:
Mr. Patrick Kuhn
U.S. Securities and Exchange Commission
Division of Corporation Finance
100 F Street N.E.
Washington D.C. 20549-3561
(Via Fax and FedEx)
U.S. Securities and Exchange Commission
Division of Corporation Finance
100 F Street N.E.
Washington D.C. 20549-3561
(Via Fax and FedEx)
Mr. Joe Foti
U.S. Securities and Exchange Commission
Division of Corporation Finance
100 F Street N.E.
Washington D.C. 20549-3561
(Via Fax and FedEx)
U.S. Securities and Exchange Commission
Division of Corporation Finance
100 F Street N.E.
Washington D.C. 20549-3561
(Via Fax and FedEx)
Mr. Dan Boudreaux
Chief Accounting Officer of Pinnacle Entertainment, Inc.
3800 Howard Hughes Pkwy, Suite 1800
Las Vegas, NV 89169
(Hand Deliver)
Chief Accounting Officer of Pinnacle Entertainment, Inc.
3800 Howard Hughes Pkwy, Suite 1800
Las Vegas, NV 89169
(Hand Deliver)
7
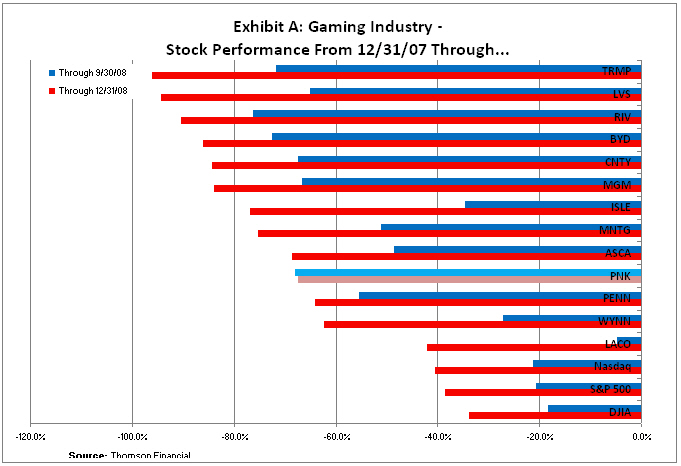
| Exhibit A: Gaming Industry — Stock Performance From 12/31/07 Through... |
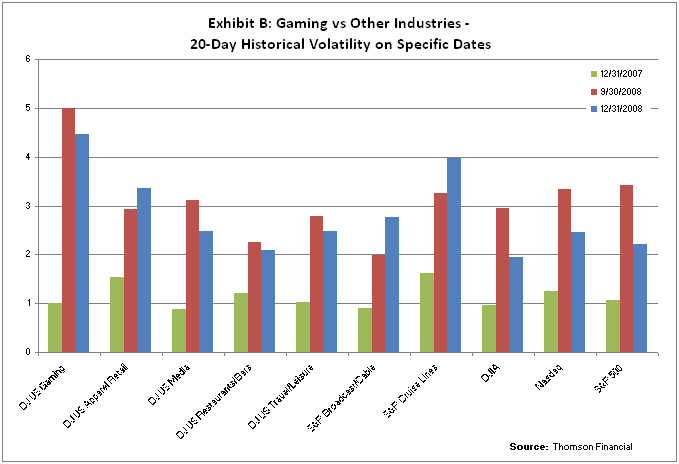
| Exhibit B: Gaming vs Other Industries — 20-Day Historical Volatility on Specific Dates |