
SAFE, RELIABLE NATURAL GAS AT OUR CORE … AND SO MUCH MORE Financial Community Update – Strategic Outlook Laurence M. Downes Chairman and CEO

Fiscal 2016 Review & Financial Community Update Our Objectives for Today Share Our Strategy Introduce Our Fiscal 2017 Guidance Review Our Fiscal 2016 Earnings Provide Business Segment Updates Looking Forward: Fiscal Years 2017-2019 Our Path To Future Growth Q&A 2
Fiscal 2016 Review & Financial Community Update Regarding Forward Looking Statements Certain statements contained in this presentation are forward-looking statements within the meaning of Section 27A of the Securities Act of 1933, as amended, Section 21E of the Securities Exchange Act of 1934, as amended, and the Private Securities Litigation Reform Act of 1995. New Jersey Resources (NJR or the Company) cautions readers that the assumptions forming the basis for forward-looking statements include many factors that are beyond NJR’s ability to control or estimate precisely, such as estimates of future market conditions and the behavior of other market participants. Words such as “anticipates,” “estimates,” “expects,” “projects,” “may,” “will,” “intends,” “plans,” “believes,” “should” and similar expressions may identify forward-looking statements and such forward-looking statements are made based upon management’s current expectations, assumptions and beliefs as of this date concerning future developments and their potential effect upon NJR. There can be no assurance that future developments will be in accordance with management’s expectations or that the effect of future developments on NJR will be those anticipated by management. Forward-looking statements in this presentation include, but are not limited to, certain statements regarding NJR’s Net Financial Earnings (NFE) guidance for fiscal 2017 and NFE growth beyond fiscal 2017, forecasted contribution of business segments to fiscal 2017 NFE and to NFE beyond fiscal 2017, forecasted dividend growth, growing energy demand, future New Jersey Natural Gas Company (NJNG) customer growth, future capital plans and expenditures and infrastructure investments, the effect of the federal Production Tax Credit (PTC) and federal Investment Tax Credit (ITC) extension on NJRCEV, the effect of Solar Renewable Energy Certificate (SRECs) prices, supply, hedges and generation on NJRCEV, the long-term outlook for NJR Clean Energy Ventures Corporation (NJCEV), diversification of NJRCEV’s strategy, NJRCEV’s future solar and wind projects, future rate case proceedings, NJR’s cash flow and financing activities forecast and the PennEast Pipeline project. The factors that could cause actual results to differ materially from NJR’s expectations, assumptions and beliefs include, but are not limited to, weather and economic conditions; changes in the rate of NJNG’s customer growth; volatility of natural gas and other commodity prices; changes in rating agency requirements and/or credit ratings; the impact of volatility in the credit markets; the ability to comply with debt covenants; the impact to the asset values and resulting higher costs and funding obligations of NJR's pension and post-employment benefit plans as a result of downturns in the financial markets, lower discount rates, revised actuarial assumptions or impacts associated with the Patient Protection and Affordable Care Act; accounting effects and other risks associated with hedging activities and use of derivatives contracts; commercial and wholesale credit risks, including the availability of creditworthy customers and counterparties and liquidity in the wholesale energy trading market; the ability to obtain governmental and regulatory approvals, land-use rights, electrical grid connection and/or financing for the construction, development and operation of NJR’s non-regulated energy investments and NJNG’s planned infrastructure projects in a timely manner; risks associated with the management of the company's joint ventures, partnerships and investment in a master limited partnership; risks associated with our investments in renewable energy projects, including the availability of regulatory and tax incentives, the availability of viable projects and NJR's eligibility for ITCs and PTCs, the future market for Solar Renewable Energy Certificates (SRECs) and operational risks related to projects in service; timing of qualifying for ITCs and PTCs due to delays or failures to complete planned solar and wind energy projects; the level and rate at which NJNG's costs and expenses are incurred and the extent to which they are allowed to be recovered from customers through the regulatory process, including through the base rate case filing; access to adequate supplies of natural gas and dependence on third-party storage and transportation facilities for natural gas supply; operating risks incidental to handling, storing, transporting and providing customers with natural gas; risks related to our employee workforce; the regulatory and pricing policies of federal and state regulatory agencies; the costs of compliance with present and future environmental laws, including potential climate change-related legislation; risks related to changes in accounting standards; the disallowance of recovery of environmental-related expenditures and other regulatory changes; environmental-related and other litigation and other uncertainties; risks related to cyber-attack or failure of information technology systems; and the impact of natural disasters, terrorist activities, and other extreme events on our operations and customers. The aforementioned factors are detailed in the “Risk Factors” section of our Annual Report on Form 10-K filed with the Securities and Exchange Commission (SEC) on November 24, 2015, which is available on the SEC’s website at sec.gov. Information included in this presentation is representative as of today only and while NJR periodically reassesses material trends and uncertainties affecting NJR's results of operations and financial condition in connection with its preparation of management's discussion and analysis of results of operations and financial condition contained in its Quarterly and Annual Reports filed with the SEC, NJR does not, by including this statement, assume any obligation to review or revise any particular forward-looking statement referenced herein in light of future events. 3

Fiscal 2016 Review & Financial Community Update This presentation includes the non-GAAP measure, Net Financial Earnings (NFE). As an indicator of the Company’s operating performance, this measure should not be considered an alternative to, or more meaningful than, GAAP measures, such as cash flow, net income, operating income or earnings per share. NFE excludes unrealized gains or losses on derivative instruments related to the Company’s unregulated subsidiaries and certain realized gains and losses on derivative instruments related to natural gas that has been placed into storage at NJR Energy Services (NJRES), net of applicable tax adjustments, as described below. Volatility associated with the change in value of these financial and physical commodity contracts is reported in the income statement in the current period. In order to manage its business, NJR views its results without the impacts of the unrealized gains and losses, and certain realized gains and losses, caused by changes in value of these financial instruments and physical commodity contracts prior to the completion of the planned transaction because it shows changes in value currently as opposed to when the planned transaction ultimately is settled. An annual estimated effective tax rate is calculated for NFE purposes and any necessary quarterly tax adjustment is applied to NJRCEV, as such adjustment is related to tax credits generated by NJRCEV. Management uses NFE as a supplemental measure to other GAAP results to provide a more complete understanding of the Company’s performance. Management believes this non-GAAP measure is more reflective of the Company’s business model, provides transparency to investors and enables period-to-period comparability of financial performance. In providing fiscal 2017 earnings guidance, management is aware that there could be differences between reported GAAP earnings and NFE due to matters such as, but not limited to, the positions of our energy-related derivatives. Management is not able to reasonably estimate the aggregate impact of these items on reported earnings and therefore is not able to provide a reconciliation to the corresponding GAAP equivalent for its operating earnings guidance without unreasonable efforts. For a full discussion of our non- GAAP financial measures, please see NJR’s most recent Form 10-K, Item 7. This information has been provided pursuant to the requirements of SEC Regulation G. Disclaimer Regarding Non-GAAP Financial Measures 4

Fiscal 2016 Review & Financial Community Update Who We Are New Jersey Resources is a diversified energy company New Jersey Natural Gas (NJNG) is a natural gas distribution company and the foundation of our business NJR Midstream (Midstream) invests in storage facilities and interstate pipeline projects that bring low-cost natural gas to customers NJR Clean Energy Ventures (NJRCEV) invests in solar and onshore wind projects to provide customers with clean, cost effective energy NJR Energy Services (NJRES) manages a portfolio of contracted storage and pipeline capacity and provides energy management services throughout North America 5

Fiscal 2016 Review & Financial Community Update New Jersey Resources – Energy Assets Across the Country 6

Fiscal 2016 Review & Financial Community Update Fiscal 2016A 55% 20% 16% 7% 2% Fiscal 2017E 55-65% 15-20% 5-15% 5-10% 1-3% Fiscal 2017 results are expected to be driven by strong performance from New Jersey Natural Gas New Jersey Natural Gas NJR Midstream NJR Energy Services NJR Home ServicesNJR Clean Energy Ventures *A reconciliation from NFE to net income is set forth in the Appendix on Slide 64. Initial Fiscal 2017 NFE Guidance: $1.65 to $1.75 Per Share* 7
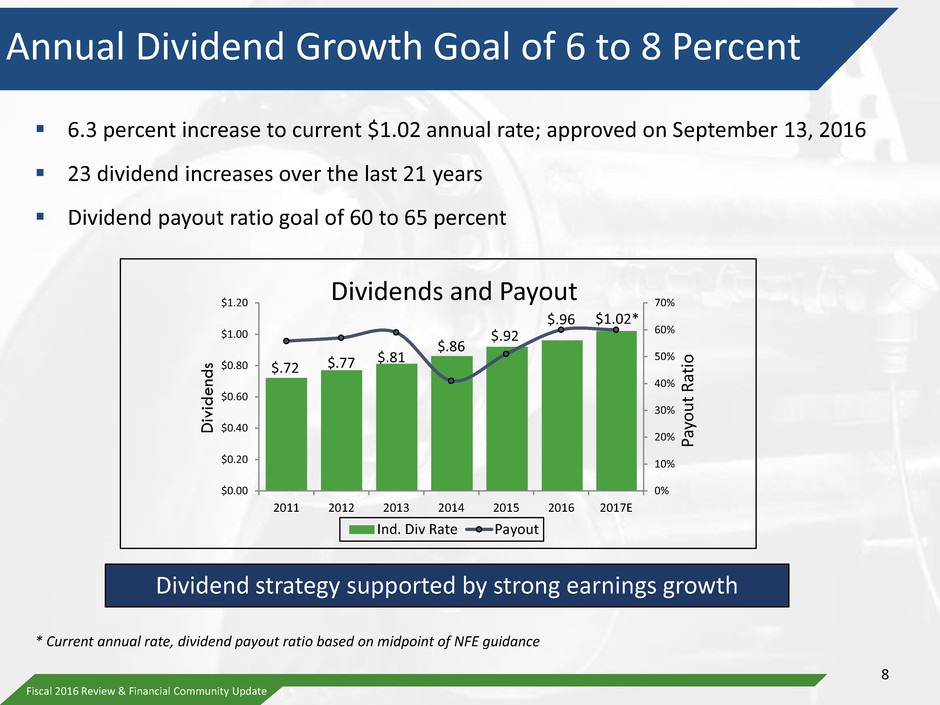
Fiscal 2016 Review & Financial Community Update Annual Dividend Growth Goal of 6 to 8 Percent 6.3 percent increase to current $1.02 annual rate; approved on September 13, 2016 23 dividend increases over the last 21 years Dividend payout ratio goal of 60 to 65 percent $.72 $.77 $.81 $.86 $.92 $.96 $1.02* 0% 10% 20% 30% 40% 50% 60% 70% $0.00 $0.20 $0.40 $0.60 $0.80 $1.00 $1.20 2011 2012 2013 2014 2015 2016 2017E Pa yout R ati o D ivi d e nd s Dividends and Payout Ind. Div Rate Payout Dividend strategy supported by strong earnings growth 8 * Current annual rate, dividend payout ratio based on midpoint of NFE guidance

Fiscal 2016 Review & Financial Community Update NJR is Positioned to Grow Strong demand for natural gas due to abundant supply and low prices Demand for clean energy generation is increasing The mix of energy sources will continue to evolve Public policy supports reliable, low cost and clean energy Customers want to save money and help the environment Sustainability and governmental policy will be key drivers in the energy sector 9

Fiscal 2016 Review & Financial Community Update 2015 U.S. Energy Consumption by Source Coal 16% Hydroelectric & Renewables 10% Natural Gas 29% Petroleum 36% Nuclear 9% Total: 98 quadrillion Btu Source: U.S. Energy Consumption by Source, 2016 U.S. Energy Information Administration Monthly Energy Review (April 2016) Preliminary Data Company Update Growing demand requires diversification of energy supply 10

Fiscal 2016 Review & Financial Community Update U.S. Shale Production Source: Energy Information Administration TC F 11

Fiscal 2016 Review & Financial Community Update Declining Natural Gas Prices Source: Energy Information Administration 0 2 4 6 8 10 12 14 16 18 Jan Feb Mar Apr May Jun Jul Aug Sep Oct Nov Dec Natural Gas Futures at Henry Hub 2016 2015 2014 Price Range 2006-2010 $ /M M B tu 12

Fiscal 2016 Review & Financial Community Update $9.12 $4.05 $2.30 $8.85 $3.52 $1.95 $7.79 $2.50 $1.48 $0 $1 $2 $3 $4 $5 $6 $7 $8 $9 $10 $ /W at t Residential Non-Residential ≤500 kW Non-Residential >500 kW Declining Solar Costs Source: Lawrence Berkeley Labs, Tracking the Sun IX, Aug 2016; IHS, U.S. Wind and Solar Energy Price Outlook Update, June 2016 13
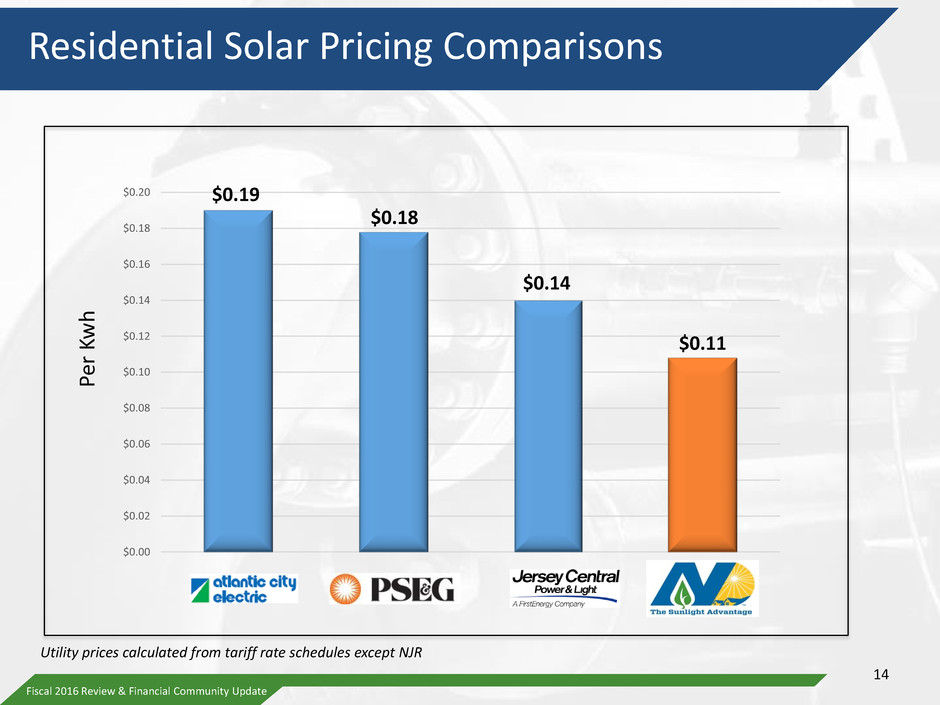
Fiscal 2016 Review & Financial Community Update $0.19 $0.18 $0.14 $0.11 $0.00 $0.02 $0.04 $0.06 $0.08 $0.10 $0.12 $0.14 $0.16 $0.18 $0.20 Residential Solar Pricing Comparisons Utility prices calculated from tariff rate schedules except NJR Per K w h 14
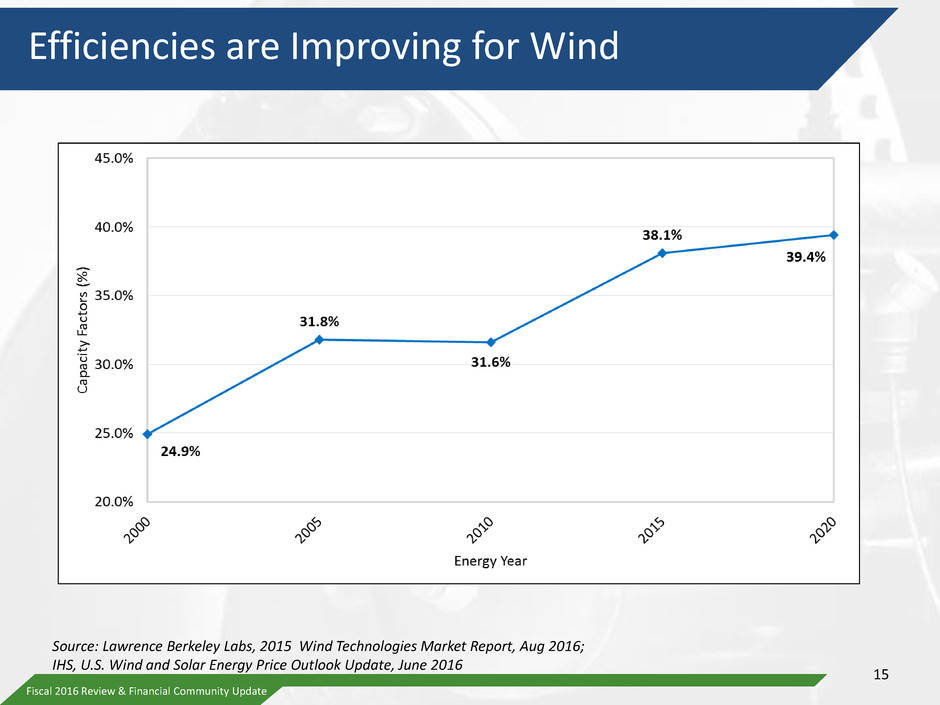
Fiscal 2016 Review & Financial Community Update Efficiencies are Improving for Wind Source: Lawrence Berkeley Labs, 2015 Wind Technologies Market Report, Aug 2016; IHS, U.S. Wind and Solar Energy Price Outlook Update, June 2016 15

Fiscal 2016 Review & Financial Community Update Natural Gas and Renewable Additions in 2015 Source: Energy Information Administration 16

Fiscal 2016 Review & Financial Community Update Our Strategy Strong natural gas fundamentals drive infrastructure and energy services opportunities Energy efficiency is the most cost-effective option for reducing overall demand and lowering customers’ bills Clean energy provides new investment opportunities Natural Gas • Regulated Distribution • Midstream Assets • Wholesale Energy Services Energy Efficiency • The SAVEGREEN Project® • Conserve to Preserve • Conservation Incentive Program Clean Energy • Wholesale, Commercial and Residential Solar • Onshore Wind 17

Fiscal 2016 Review & Financial Community Update Natural Gas: Our Core Business A growing, regulated natural gas distribution business anchors our portfolio Regulatory incentive programs benefit customers and shareowners Increasing natural gas supply and growing demand provide opportunities for investments in midstream infrastructure Wholesale demand offers new opportunities for physical and producer natural gas services for NJRES 18

Fiscal 2016 Review & Financial Community Update Energy efficiency benefits customers, shareowners and the environment Our Conservation Incentive Program enables us to encourage customers to use less while protecting utility gross margin SAVEGREEN offers customers incentives to invest in energy efficiency while contributing to utility gross margin growth We are uniquely positioned to bring products and services to the marketplace Energy Efficiency: Best Alternative to Address Growing Demand 19

Fiscal 2016 Review & Financial Community Update Clean Energy: Growing Investment Opportunities Supports state and federal energy policy goals ITC/PTC extensions support new market opportunities Diverse portfolio of 236 MW* of solar and wind assets Emerging technologies offer additional investment opportunities 20 * Based on projects qualifying for federal tax credits

Fiscal 2016 Review & Financial Community Update Solid regulated investment platform • Investments in midstream projects that are predominantly regulated • Investments in clean energy projects with contracted long-term revenue streams • Significant regulated capital programs to support safety, resiliency and reliability Diversified infrastructure opportunities Strong financial profile • Strong financial profile to support access to capital • Investment grade credit ratings; stable outlook • Below average payout ratio; strong earnings retention Total return potential • Projected average annual long-term NFE growth rate of 5-9 percent • 21 consecutive years of dividend growth; attractive dividend yield • Attractive total return potential • Approximately 70 percent of earnings are either regulated or represented by PPAs • Collaborative regulatory relationships • Accelerated recovery of significant expenditures Investment Highlights 21

SAFE, RELIABLE NATURAL GAS AT OUR CORE … AND SO MUCH MORE Fiscal Fourth Quarter 2016 Update Patrick J. Migliaccio Senior Vice President and Chief Financial Officer

Fiscal First Quarter 2016 Update 23Fiscal 2016 Review & Financial Community Update Net Financial Earnings* ($MM) Three Months Ended September 30, 12 Months Ended September 30, Company 2016 2015 2016 2015 New Jersey Natural Gas ($7.4) $(7.7) $76.1 $76.3 NJR Midstream 2.5 2.6 9.4 9.8 Subtotal $(4.9) $(5.1) $85.5 $86.1 NJR Clean Energy Ventures 6.5 1.9 28.4 20.1 NJR Energy Services (5.7) (5.4) 21.9 42.1 NJR Home Services/Other 2.0 3.2 2.3 3.2 Total ($2.1) ($5.2) $138.1 $151.5 Per basic share ($.02) ($.06) $1.61 $1.78 Fiscal Fourth Quarter and Year-End 2016 Results 23 *A reconciliation from NFE to net income is set forth in the Appendix on Slide 64.
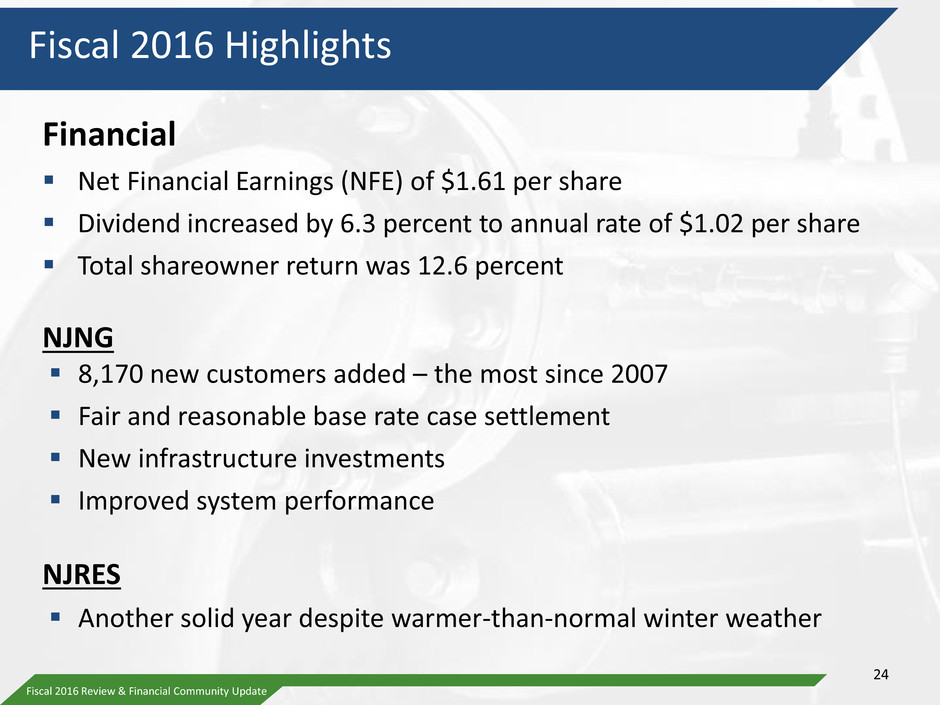
Fiscal 2016 Review & Financial Community Update Fiscal 2016 Highlights Financial Net Financial Earnings (NFE) of $1.61 per share Dividend increased by 6.3 percent to annual rate of $1.02 per share Total shareowner return was 12.6 percent NJNG 8,170 new customers added – the most since 2007 Fair and reasonable base rate case settlement New infrastructure investments Improved system performance NJRES Another solid year despite warmer-than-normal winter weather 24

Fiscal 2016 Review & Financial Community Update Fiscal 2016 Highlights NJR Midstream Existing investments performed well FERC issued draft Environmental Impact Statement on PennEast Pipeline Concentric Energy Advisors report substantiated the primary advantages of Penn East PJM Interconnection highlighted the need for natural gas transmission projects like PennEast to support grid reliability and supply options NJRCEV ITC/PTC extensions Completed five commercial solar projects totaling 21.8 MW Added 1,123 residential customers through The Sunlight Advantage® program totaling 10.4 MW Added 50.7 MW of wind capacity Total solar and wind capacity of 236 MW* 25 * Based on projects qualifying for federal tax credits

Fiscal 2016 Review & Financial Community Update NJNG’s Regulated Growth Model • Growing service area • Healthy conversion market Customer Growth • SAVEGREEN • CIP • SAFE • NJ RISE • SRL • Off-system sales • Capacity release Energy Efficiency BGSS Incentives Utility Gross Margin Infrastructure Fiscal 2016 NFE of $76.1 million vs $76.3 million last year 26
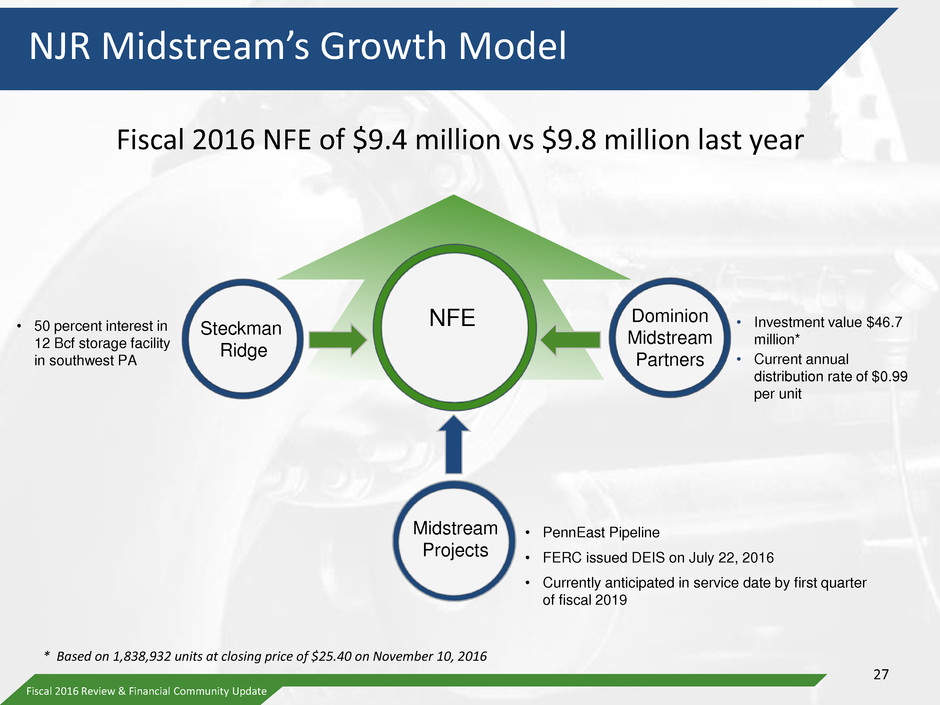
Fiscal 2016 Review & Financial Community Update NJR Midstream’s Growth Model • 50 percent interest in 12 Bcf storage facility in southwest PA • PennEast Pipeline • FERC issued DEIS on July 22, 2016 • Currently anticipated in service date by first quarter of fiscal 2019 • Investment value $46.7 million* • Current annual distribution rate of $0.99 per unit Steckman Ridge Midstream Projects NFE * Based on 1,838,932 units at closing price of $25.40 on November 10, 2016 Dominion Midstream Partners Fiscal 2016 NFE of $9.4 million vs $9.8 million last year 27

Fiscal 2016 Review & Financial Community Update NJR Clean Energy Ventures’ Growth Model • Four operating wind farms • Additional 39.9 MW-Ringer Hill under construction • Fiscal 2017 wind capital expenditures - $83.4 million • 5,085 Sunlight Advantage® customers • Fiscal 2017 residential solar capital expenditures - $35 million NFE • Fiscal 2017 commercial solar capital expenditures - $62.6 million Residential Solar (45.5 MW) Onshore Wind (86.7 MW) Commercial Solar (104.2 MW*) Fiscal 2016 NFE of $28.4 million vs $20.1 million last year 28 * Based on projects qualifying for federal tax credits

Fiscal 2016 Review & Financial Community Update NJR Energy Services’ Growth Model Pipeline Capacity (1.7 Bcf/d) NFE Storage Capacity (44 Bcf) Fiscal 2016 NFE of $21.9 million vs $42.1 million last year Producer Services Utility Asset Management Electric Generation Supply 29

SAFE, RELIABLE NATURAL GAS AT OUR CORE … AND SO MUCH MORE New Jersey Natural Gas Mariellen Dugan Senior Vice President and Chief Operating Officer
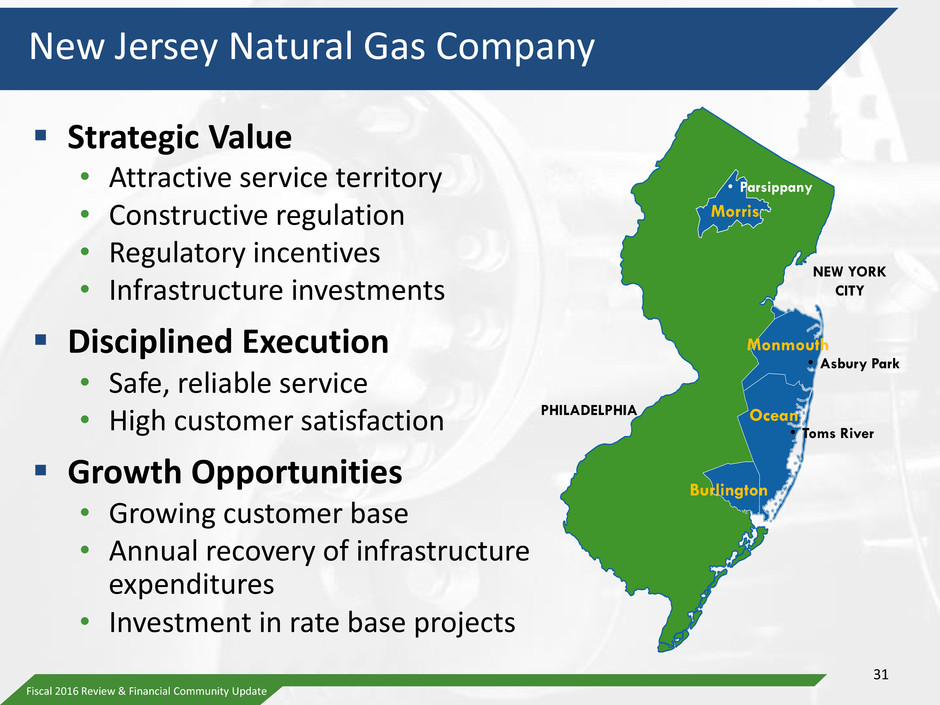
Fiscal 2016 Review & Financial Community Update New Jersey Natural Gas Company Strategic Value • Attractive service territory • Constructive regulation • Regulatory incentives • Infrastructure investments Disciplined Execution • Safe, reliable service • High customer satisfaction Growth Opportunities • Growing customer base • Annual recovery of infrastructure expenditures • Investment in rate base projects Morris • Parsippany NEW YORK CITY Monmouth • Asbury Park Ocean • Toms River Burlington PHILADELPHIA 31

Fiscal 2016 Review & Financial Community Update Targeted Marketing Based on Key Advantages Geographic Advantage • Located between two major metropolitan areas Demographic Advantage • Median household income above state and national averages • Retirees/Active Adults New Customer Growth Advantage • NJNG captures 95 percent of residential and commercial new construction • Strong penetration in growing multi-family market Conversion Markets • Natural gas provides price, comfort and environmental advantages over competing fuels 32

Fiscal 2016 Review & Financial Community Update Key Trends Support Future Customer Growth On Main, 32,100 Near Main, 28,300 Off Main, 42,200 Non Heat, 5,600 Residential Conversions4 = 108,200 4. Source: NJNG $0.00 $1.00 $2.00 $3.00 $4.00 $5.00 NJNG Fuel Oil Propane Electricity $0.97 $1.77 $3.58 $4.10 Equivalent Customer Cost2 2. Source: US Energy Information Administration. Data as of October 2016. Based on 100,000 comparable BTUs. 2017 – 2019 = 11,775 2020 - Buildout = 69,176 3. Source: A.D. Little - 1,000 2,000 3,000 4,000 5,000 NJNG Monmouth Ocean Morris 3,140 918 1,927 565 Building Permits Issued1 January-August 2016 1. Source: US Bureau of Census Residential New Construction3 = 80,951 33

Fiscal 2016 Review & Financial Community Update Customer Growth and Mix Trends FY2016: 8,170 new customers added • 4,587 new construction • 3,583 conversions • Highest number since 2007 FY2013-2016: 50/50 new construction and conversion mix FY2017-2019: 55/45 new construction and conversion mix Margin impact: Residential customers contribute 70 percent of utility gross margin 7,858 8,170 8,300 8,450 8,600 0 1,000 2,000 3,000 4,000 5,000 6,000 7,000 8,000 9,000 10,000 FY15A FY16A FY17E FY18E FY19E C u st o m er s Customer Additions New Construction Conversions 34
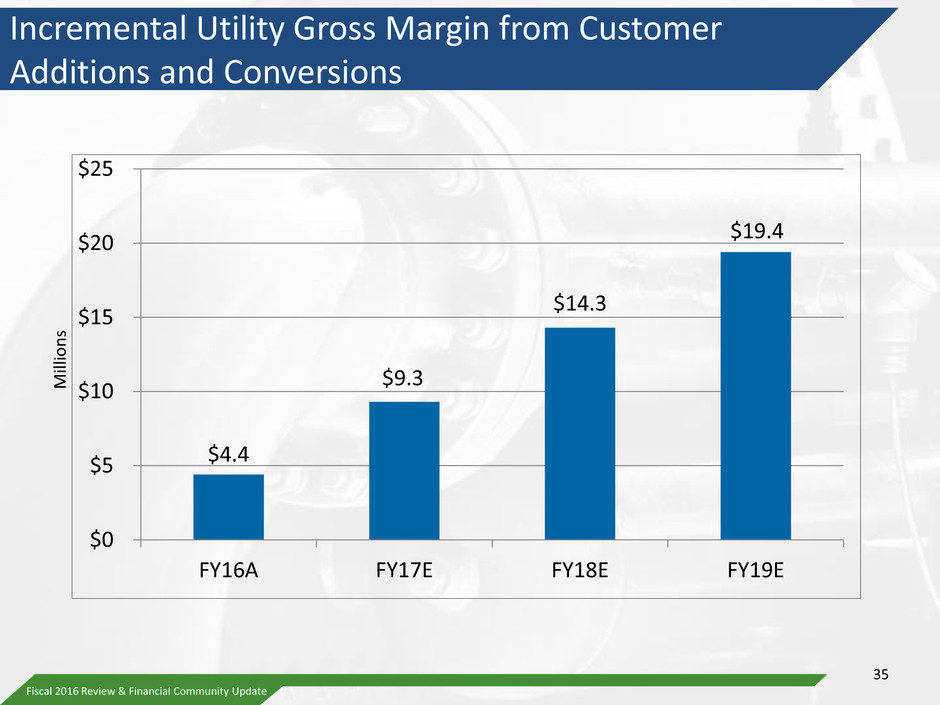
Fiscal 2016 Review & Financial Community Update Incremental Utility Gross Margin from Customer Additions and Conversions $4.4 $9.3 $14.3 $19.4 $0 $5 $10 $15 $20 $25 FY16A FY17E FY18E FY19E Milli o n s 35
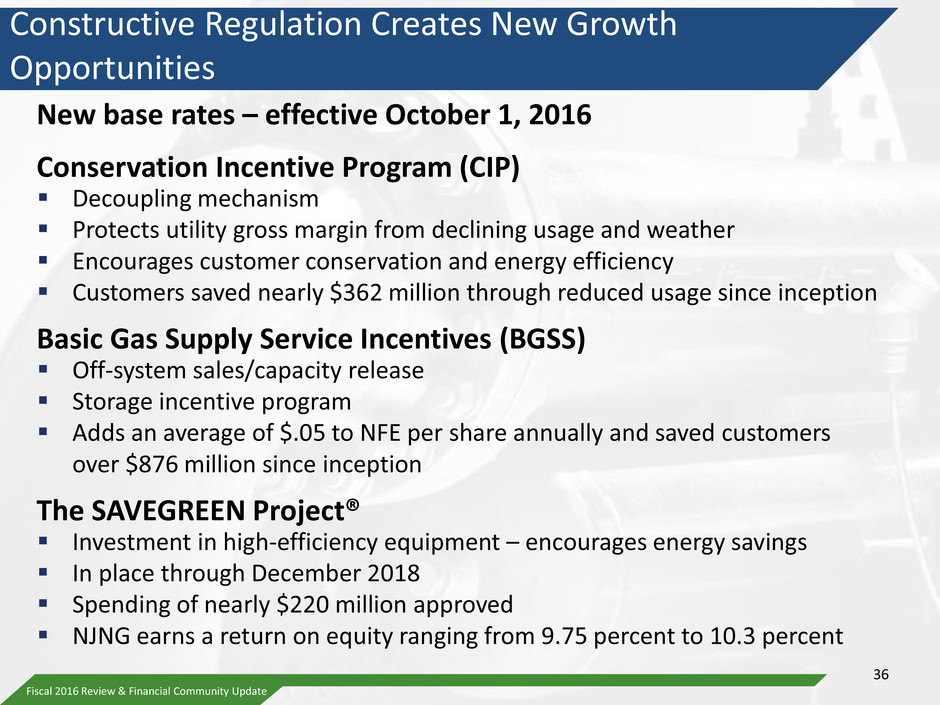
Fiscal 2016 Review & Financial Community Update Constructive Regulation Creates New Growth Opportunities New base rates – effective October 1, 2016 Conservation Incentive Program (CIP) Decoupling mechanism Protects utility gross margin from declining usage and weather Encourages customer conservation and energy efficiency Customers saved nearly $362 million through reduced usage since inception Basic Gas Supply Service Incentives (BGSS) Off-system sales/capacity release Storage incentive program Adds an average of $.05 to NFE per share annually and saved customers over $876 million since inception The SAVEGREEN Project® Investment in high-efficiency equipment – encourages energy savings In place through December 2018 Spending of nearly $220 million approved NJNG earns a return on equity ranging from 9.75 percent to 10.3 percent 36

Fiscal 2016 Review & Financial Community Update Current Infrastructure Investment Programs Safety Acceleration and Facilities Enhancement Program (SAFE) SAFE I approved in 2012 SAFE II approved as part of 2016 rate case settlement • Five-year, $157.5 million program to eliminate unprotected bare steel pipe throughout our system SAFE I completed replacement of all cast iron in December 2015 and replaced 214 miles of unprotected steel main SAFE II will complete replacement of remaining 276 miles of unprotected steel main Annual recovery of spending on completed projects New Jersey Reinvestment in System Enhancement (NJ RISE) Five-year, $102.5 million program implemented in 2014 consisting of six system hardening projects within NJNG’s coastal communities • Excess Flow Valves and Sea Bright reinforcement project in process; remaining projects in design and/or permitting phases Annual recovery of spending on completed projects 37

Fiscal 2016 Review & Financial Community Update 0 0.1 0.2 0.3 0.4 0.5 0.6 0.7 0.8 0.9 0 500 1,000 1,500 2,000 2,500 3,000 3,500 4,000 4,500 5,000 Le ak s p er Mi le Pe nd ing Le ak s Leaks per Mile and Pending Leaks Pending Leaks Leaks per Mile Infrastructure Investment Improves System Performance 38

Fiscal 2016 Review & Financial Community Update Southern Reliability Link A 30-mile pipeline to improve system integrity and reliability Will add resiliency to system through a second feed • 85 percent of NJNG supply is transported through a single interstate pipeline system • Maintains system pressures in case of a disruption • Provides supply diversification through the Transco Pipeline 39
Fiscal 2016 Review & Financial Community Update SRL: Progress to Date Approvals Received: • NJBPU Construction, operation and route designation approved in January 2016 Finding that SRL is necessary for the safety, welfare and convenience of the public in March 2016 • NJ Department of Environmental Protection (DEP) Flood Hazard Permit-by-Rule • Pinelands Commission Certificate-of-Filing issued Remaining Permits: • DEP Wetlands and Coastal Area Facility Review Act (CAFRA) permits on schedule for approval • Road opening permits Rate treatment will be requested in future rate proceeding • Will be timed to avoid regulatory lag 40
Fiscal 2016 Review & Financial Community Update Key Messages NJNG will continue to drive our long-term growth through customer additions and infrastructure investment Customer growth outlook remains strong Collaborative regulatory programs generate earnings and customer savings Infrastructure projects improve safety, reliability and resiliency SRL approved by NJBPU and is in permitting phase NFE contribution expected to be 55-65 percent in fiscal 2017 and beyond 41

SAFE, RELIABLE NATURAL GAS AT OUR CORE … AND SO MUCH MORE NJR Clean Energy Ventures, NJR Midstream, NJR Energy Services Stephen Westhoven Senior Vice President and Chief Operating Officer

Fiscal 2016 Review & Financial Community Update NJR Clean Energy Ventures (NJRCEV) Strategic Value • Meet customer needs for clean, affordable and reliable power • Leverage our brand, balance sheet and expertise • Diversify business into growth segment of electric industry Disciplined Execution • Projects must meet hurdle rates and risk management criteria • Delivered 236 MW* of installed solar and wind on time and under budget • Achieving strong operational performance Profit Opportunities • Tax savings from ITC and PTC incentives • Solar Renewable Energy Certificates (SREC) sales • Lease payments • Energy sales from wind and solar PPAs 43 * Based on projects qualifying for ITC
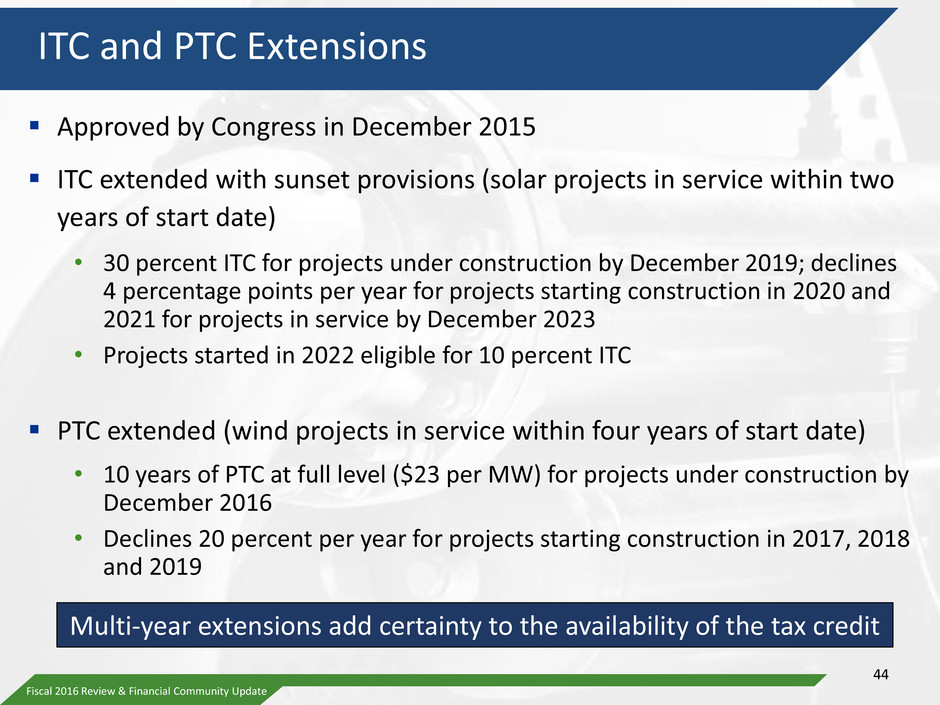
Fiscal 2016 Review & Financial Community Update ITC and PTC Extensions Approved by Congress in December 2015 ITC extended with sunset provisions (solar projects in service within two years of start date) • 30 percent ITC for projects under construction by December 2019; declines 4 percentage points per year for projects starting construction in 2020 and 2021 for projects in service by December 2023 • Projects started in 2022 eligible for 10 percent ITC PTC extended (wind projects in service within four years of start date) • 10 years of PTC at full level ($23 per MW) for projects under construction by December 2016 • Declines 20 percent per year for projects starting construction in 2017, 2018 and 2019 Multi-year extensions add certainty to the availability of the tax credit 44

Fiscal 2016 Review & Financial Community Update Benefits of the ITC/PTC Extensions for NJRCEV ITC • Grid-connected projects, previously uneconomic, now viable • Increases future pipeline of commercial, net-metered projects • Improves economics for previously-planned residential solar projects PTC • Expands markets where wind is competitive with wholesale power • Stabilizes development cycle • Increases project pipeline for future development 45
Fiscal 2016 Review & Financial Community Update SREC Market Fundamentals Supply • Number of SRECs available to satisfy Renewable Portfolio Standard (RPS) Determined based on actual solar electric generation in NJ Demand • RPS establishes requirement • Basic Generation Service (BGS) auction identifies specific Load Serving Entities (LSEs) and is a significant driver of demand • LSEs procure SRECs to establish compliance with RPS 46

Fiscal 2016 Review & Financial Community Update Contracted Load by Energy Year Sets Market Demand Annual BGS auction occurs in early February Two common buying periods • Leading up to, and during, BGS auction • Leading up to compliance Third Party Supplier (TPS) Source: New Jersey Statewide Basic Generation Service (BGS) Electricity Supply Auction 47

Fiscal 2016 Review & Financial Community Update SREC Hedging Strategy Stabilizes Revenue Pct. Hedged: 91% 63% 15% Average Price: $230 $226 $221 Current Price (EY): $210 $190 $125 Plan Price: $227 $184 $165 As of November 10, 2016. Source: InterContinental Exchange (ICE) 167 152 41 183 242 270 0 50 100 150 200 250 300 FY17E FY18E FY19E Th ousa n ds of SR EC s Hedged Expected Generated 48

Fiscal 2016 Review & Financial Community Update Proposed New Jersey Legislation 0.2% 0.3% 0.4% 0.7% 2.1% 2.5% 2.8% 3.0% 3.3% 3.6% 3.8% 4.1% 4.1% 4.1% 4.1% 4.1% 4.1% 4.1% 4.1% 0.00% 0.50% 1.00% 1.50% 2.00% 2.50% 3.00% 3.50% 4.00% 4.50% 2010 2011 2012 2013 2014 2015 2016 2017 2018 2019 2020 2021 2022 2023 2024 2025 2026 2027 2028 % o f R et ail Sal e s Energy Year Current Proposed Addition 49
Fiscal 2016 Review & Financial Community Update Conditions are favorable for the continued build out of solar and wind assets Solar Market Pipeline Executed agreements for both commercial and residential solar projects entering FY2017 Evaluating a $100 million pipeline of additional commercial solar investments for FY2018 and beyond Wind Market Pipeline Wind capital identified for FY2017 is supported by Ringer Hill Wind Farm under construction and expected to be placed in service in the first quarter of FY2017 Evaluating a $400 million pipeline of additional wind investments for FY2018 and beyond Renewable Market Fundamentals and Pipeline Market and regulatory climate support portfolio expansion 50
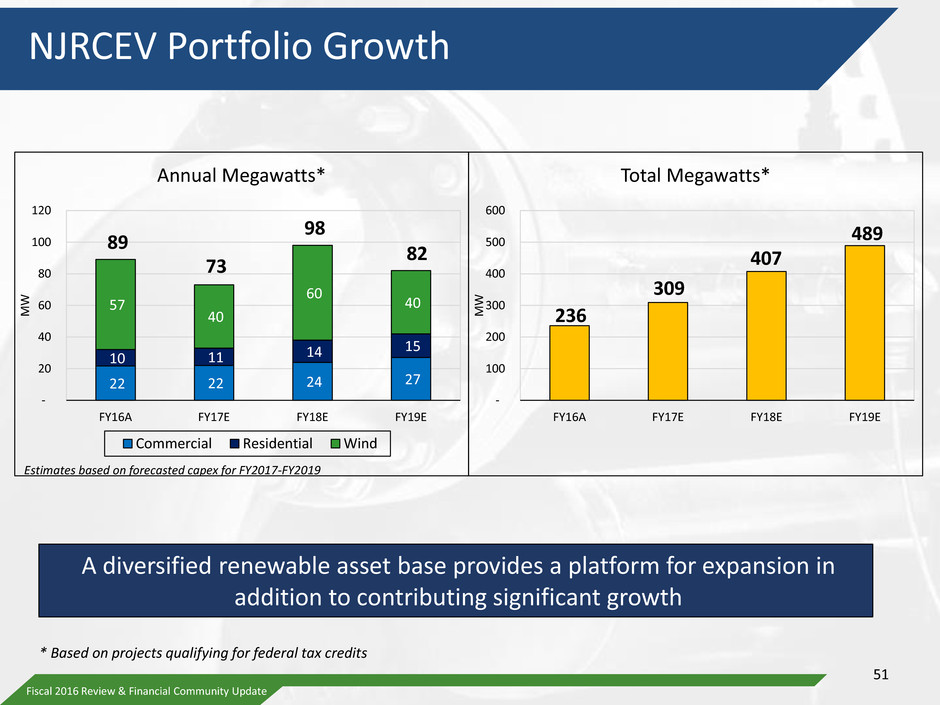
Fiscal 2016 Review & Financial Community Update NJRCEV Portfolio Growth A diversified renewable asset base provides a platform for expansion in addition to contributing significant growth 22 22 24 27 10 11 14 15 57 40 60 40 89 73 98 82 - 20 40 60 80 100 120 FY16A FY17E FY18E FY19E M W Annual Megawatts* Commercial Residential Wind Estimates based on forecasted capex for FY2017-FY2019 236 309 407 489 - 100 200 300 400 500 600 FY16A FY17E FY18E FY19E M W Total Megawatts* 51 * Based on projects qualifying for federal tax credits
Fiscal 2016 Review & Financial Community Update NJR Midstream Strategic Value • FERC-regulated infrastructure business • Storage and pipeline demand driven by lower cost supply • Proximity to attractive markets Disciplined Execution • Reliable, experienced partners Profit Opportunities • Investment capital – FERC-regulated returns such as PennEast • Generating steady storage revenues and cash flow 52

Fiscal First Quarter 2016 Update 53Fiscal 2016 Review & Financial Community Update 20 percent ownership in 120-mile transmission pipeline connecting Marcellus shale region supply to Northeast Demand pull project with capacity of up to 1.1 MMdth/day Nearly fully subscribed by 12 shippers; 72 percent LDCs in Mid-Atlantic Region Draft Environmental Impact Study (DEIS) issued by FERC on July 22, 2016; final EIS expected February 2017 PJM states PennEast “would expand capacity and supply options and improve grid reliability” PennEast Pipeline Source: Pennsylvania Jersey Maryland Power Pool (PJM) 53

Fiscal 2016 Review & Financial Community Update NJR Energy Services (NJRES) Strategic Value • Geographically diverse portfolio of contracted storage and pipeline capacity • Energy management services throughout North America Disciplined Execution • Strong customer relationships • Risk management systems and strategies • Experienced team with senior members’ tenure averaging 16 years Profit Opportunities • Leverage natural gas market volatility to augment profits • Provide physical delivery of natural gas • Arrange transportation service for producers 54
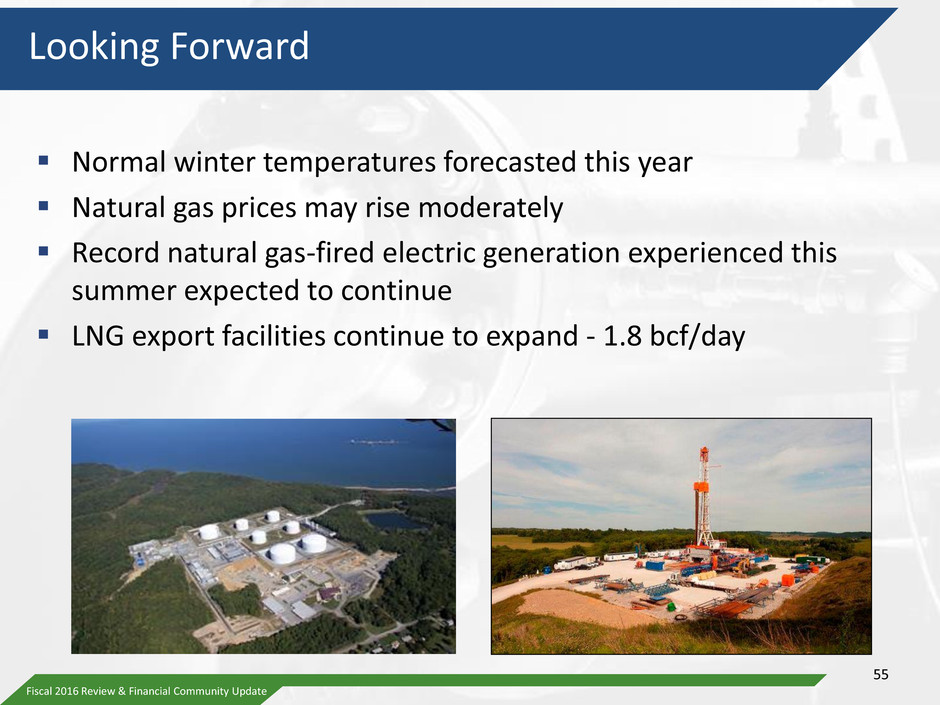
Fiscal 2016 Review & Financial Community Update Looking Forward Normal winter temperatures forecasted this year Natural gas prices may rise moderately Record natural gas-fired electric generation experienced this summer expected to continue LNG export facilities continue to expand - 1.8 bcf/day 55

Fiscal 2016 Review & Financial Community Update NJRCEV will pursue residential solar, commercial net- metered solar and onshore wind projects and will build out its inventory of state-approved, grid-connected commercial projects NJRCEV continues to invest in one of the nation’s fastest-growing energy sectors ITC and PTC extensions have allowed NJRCEV to increase its portfolio Actively hedging SREC prices locks in price and mitigates future exposure NFE contribution expected to be 15 - 25 percent in fiscal 2017 and beyond 56 Key Messages
Fiscal 2016 Review & Financial Community Update Key Messages NJR Midstream will continue to invest in and develop storage and transportation projects to provide access to lower-cost supply, increase reliability and stabilize energy prices PennEast will provide access to lower-cost natural gas and will add supply security and diversity Evaluating other Midstream investment opportunities NFE contribution expected to be 5 - 10 percent in fiscal 2017 and beyond 57
Fiscal 2016 Review & Financial Community Update Key Messages NJRES, leveraging their expertise in a constantly changing marketplace, will continue to provide physical and producer natural gas services Winter of 2016 was warmer than normal, but NFE exceeded expectations NFE not assumed to match record fiscal 2014 and 2015 performance NFE contribution expected to be 5 – 15 percent in fiscal 2017 and beyond 58
SAFE, RELIABLE NATURAL GAS AT OUR CORE … AND SO MUCH MORE Financial Update Patrick J. Migliaccio Senior Vice President and Chief Financial Officer
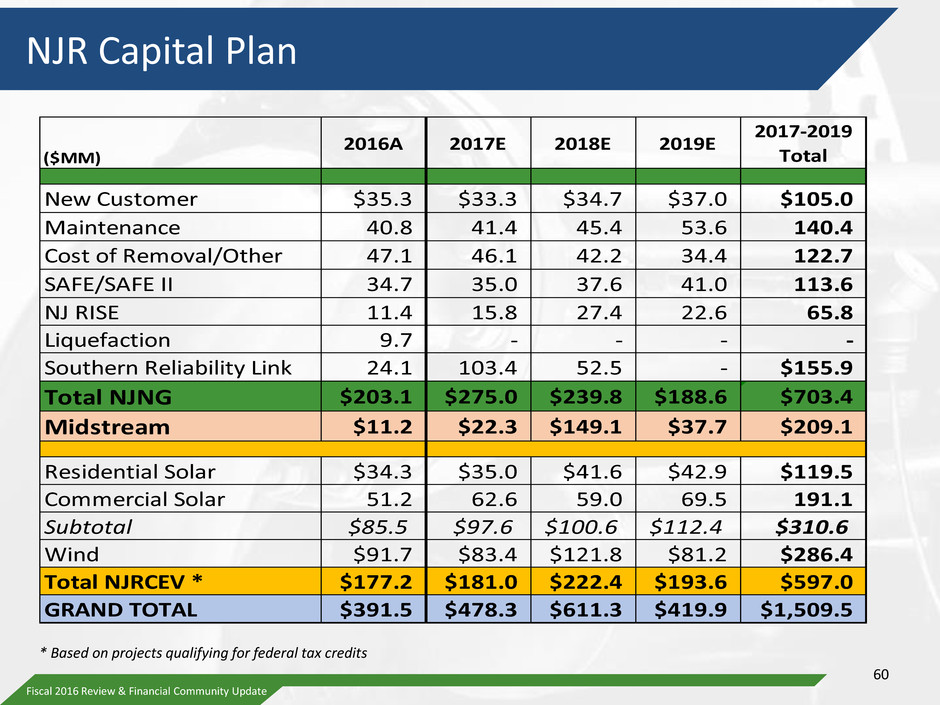
Fiscal 2016 Review & Financial Community Update NJR Capital Plan ($MM) 2016A 2017E 2018E 2019E 2017-2019 Total New Customer $35.3 $33.3 $34.7 $37.0 $105.0 Maintenance 40.8 41.4 45.4 53.6 140.4 Cost of Removal/Other 47.1 46.1 42.2 34.4 122.7 SAFE/SAFE II 34.7 35.0 37.6 41.0 113.6 NJ RISE 11.4 15.8 27.4 22.6 65.8 Liquefaction 9.7 - - - - Southern Reliability Link 24.1 103.4 52.5 - $155.9 Total NJNG $203.1 $275.0 $239.8 $188.6 $703.4 Midstream $11.2 $22.3 $149.1 $37.7 $209.1 Residential Solar $34.3 $35.0 $41.6 $42.9 $119.5 Commercial Solar 51.2 62.6 59.0 69.5 191.1 Subtotal $85.5 $97.6 $100.6 $112.4 $310.6 Wind $91.7 $83.4 $121.8 $81.2 $286.4 Total NJRCEV * $177.2 $181.0 $222.4 $193.6 $597.0 GRAND TOTAL $391.5 $478.3 $611.3 $419.9 $1,509.5 * Based on projects qualifying for federal tax credits 60
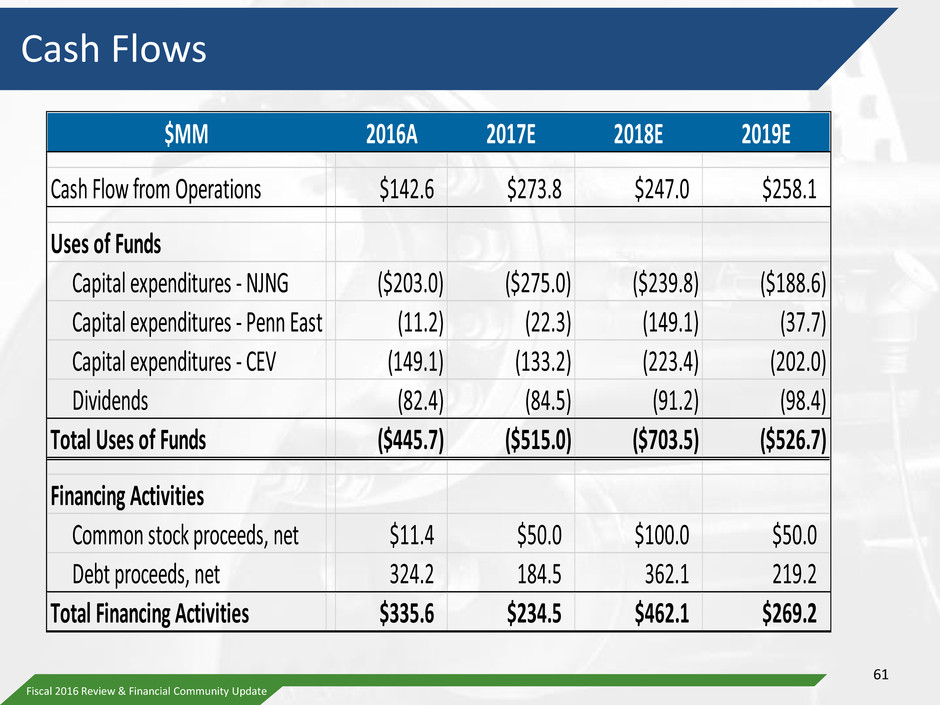
Fiscal 2016 Review & Financial Community Update Cash Flows $MM 2016A 2017E 2018E 2019E Cash Flow from Operations $142.6 $273.8 $247.0 $258.1 Uses of Funds Capital expenditures - NJNG ($203.0) ($275.0) ($239.8) ($188.6) Capital expenditures - Penn East (11.2) (22.3) (149.1) (37.7) Capital expenditures - CEV (149.1) (133.2) (223.4) (202.0) Dividends (82.4) (84.5) (91.2) (98.4) Total Uses of Funds ($445.7) ($515.0) ($703.5) ($526.7) Financing Activities Common stock proceeds, net $11.4 $50.0 $100.0 $50.0 Debt proceeds, net 324.2 184.5 362.1 219.2 Total Financing Activities $335.6 $234.5 $462.1 $269.2 61
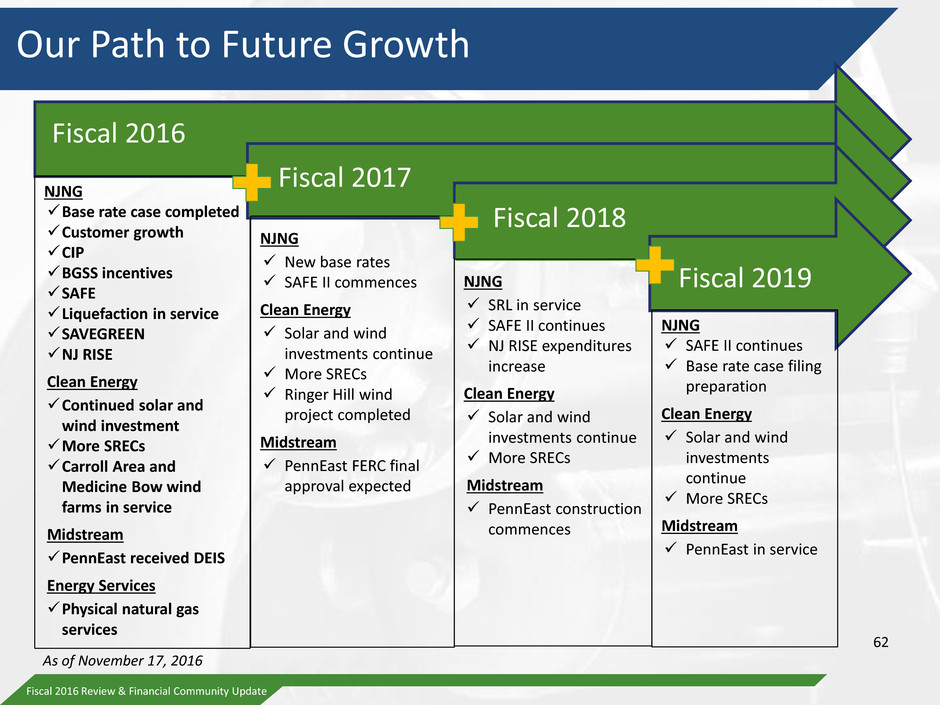
Fiscal 2016 Review & Financial Community Update Our Path to Future Growth Fiscal 2016 NJNG Base rate case completed Customer growth CIP BGSS incentives SAFE Liquefaction in service SAVEGREEN NJ RISE Clean Energy Continued solar and wind investment More SRECs Carroll Area and Medicine Bow wind farms in service Midstream PennEast received DEIS Energy Services Physical natural gas services Fiscal 2017 NJNG New base rates SAFE II commences Clean Energy Solar and wind investments continue More SRECs Ringer Hill wind project completed Midstream PennEast FERC final approval expected Fiscal 2018 NJNG SRL in service SAFE II continues NJ RISE expenditures increase Clean Energy Solar and wind investments continue More SRECs Midstream PennEast construction commences Fiscal 2019 NJNG SAFE II continues Base rate case filing preparation Clean Energy Solar and wind investments continue More SRECs Midstream PennEast in service 62 As of November 17, 2016

Fiscal 2016 Review & Financial Community Update APPENDIX 63
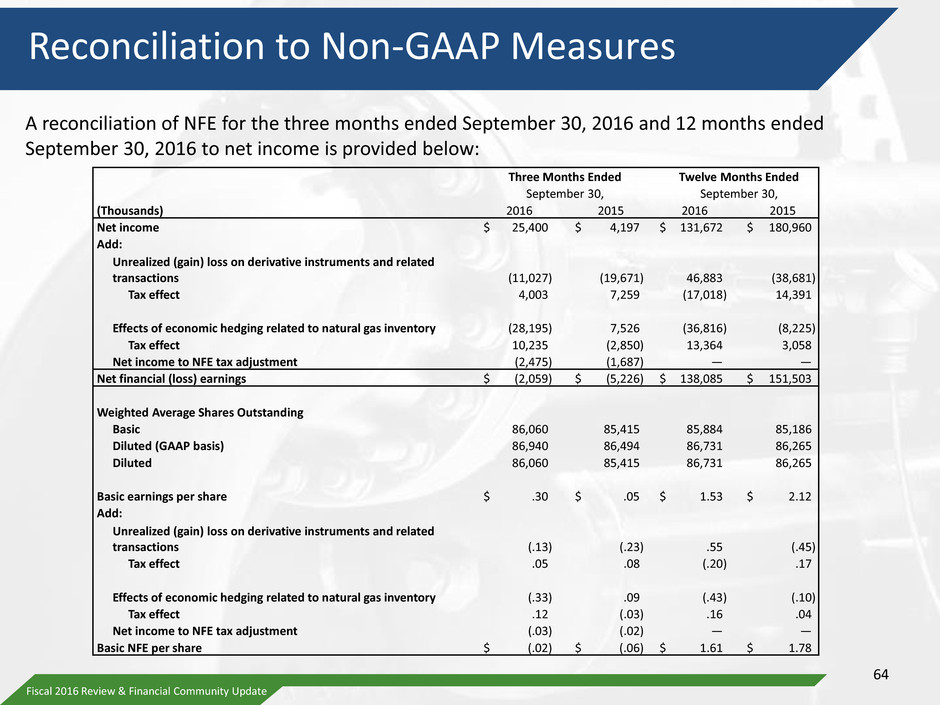
Fiscal 2016 Review & Financial Community Update Reconciliation to Non-GAAP Measures Three Months Ended Twelve Months Ended September 30, September 30, (Thousands) 2016 2015 2016 2015 Net income $ 25,400 $ 4,197 $ 131,672 $ 180,960 Add: Unrealized (gain) loss on derivative instruments and related transactions (11,027) (19,671) 46,883 (38,681) Tax effect 4,003 7,259 (17,018) 14,391 Effects of economic hedging related to natural gas inventory (28,195) 7,526 (36,816) (8,225) Tax effect 10,235 (2,850) 13,364 3,058 Net income to NFE tax adjustment (2,475) (1,687) — — Net financial (loss) earnings $ (2,059) $ (5,226) $ 138,085 $ 151,503 Weighted Average Shares Outstanding Basic 86,060 85,415 85,884 85,186 Diluted (GAAP basis) 86,940 86,494 86,731 86,265 Diluted 86,060 85,415 86,731 86,265 Basic earnings per share $ .30 $ .05 $ 1.53 $ 2.12 Add: Unrealized (gain) loss on derivative instruments and related transactions (.13) (.23) .55 (.45) Tax effect .05 .08 (.20) .17 Effects of economic hedging related to natural gas inventory (.33) .09 (.43) (.10) Tax effect .12 (.03) .16 .04 Net income to NFE tax adjustment (.03) (.02) — — Basic NFE per share $ (.02) $ (.06) $ 1.61 $ 1.78 64 A reconciliation of NFE for the three months ended September 30, 2016 and 12 months ended September 30, 2016 to net income is provided below:

Fiscal 2016 Review & Financial Community Update Mutually Beneficial Regulatory Programs * No expiration, but subject to periodic review. Benefits Program Description Customer/ Societal Shareholder Inception BGSS: Basic Gas Supply Service Incentives* Off-system sales, capacity release, and storage incentives Customer savings of about $842 million since inception Average of $.05 per share annually 1992 CIP: Conservation Incentive Program* Reconciles use per customer differences Gas cost savings of nearly $350 million through reduced usage Margin stability 2007 The SAVEGREEN Project® Encourages investment in energy efficiency equipment and measures through customer incentives Reduces energy usage emissions and lowers bills Investments included in rates 2009 SAFE: Safety Acceleration and Facility Enhancement Program Replacement of old cast iron and bare steel main Enhances pipeline safety and reliability by replacing aged infrastructure Full return deferred for future recovery and included in current rate case 2012 NJ RISE: New Jersey Reinvestment in System Enhancement System strengthening/ reliability projects driven by Superstorm Sandy Improve system resiliency for future major weather events Investments included in rates 2014 65

Fiscal 2016 Review & Financial Community Update NJ RISE – Secondary Feeds & Reinforcements 66 Location of projects and investments on the barrier islands

Fiscal 2016 Review & Financial Community Update Solar ITC Rate 2016 2017 2018 2019 2020 2021 2022 2023 2024 2025 30% 26% 22% 10% Permanent 10% ITC ITC Rate for New Projects In Service Requirement Wind PTC Rate 2016 2017 2018 2019 2020 2021 2022 2023 2024 2025 $23 $17 $9 No PTC No PTC PTC and ITC Extensions Provide Long-Term Support for Market Development Source: IHS Inc. 67
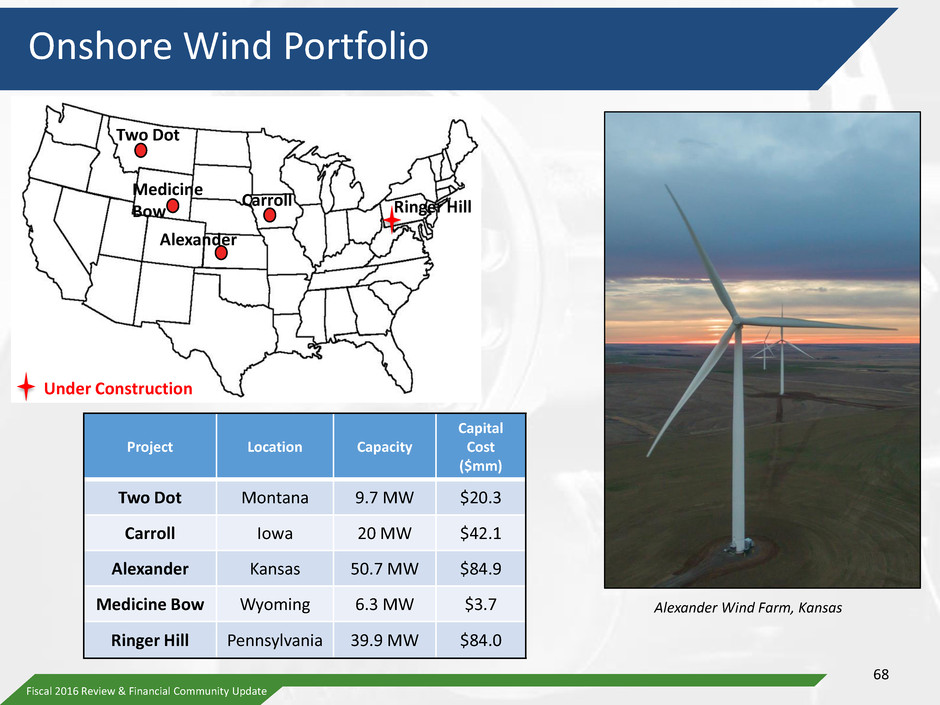
Fiscal 2016 Review & Financial Community Update Onshore Wind Portfolio 68 Two Dot Carroll Alexander Ringer Hill Under Construction Project Location Capacity Capital Cost ($mm) Two Dot Montana 9.7 MW $20.3 Carroll Iowa 20 MW $42.1 Alexander Kansas 50.7 MW $84.9 Medicine Bow Wyoming 6.3 MW $3.7 Ringer Hill Pennsylvania 39.9 MW $84.0 Alexander Wind Farm, Kansas Medicine Bow


