Third Quarter Fiscal 2017 Update August 2, 2017

2 Forward-Looking Statements Certain statements contained in this presentation are forward-looking statements within the meaning of Section 27A of the Securities Act of 1933, as amended, Section 21E of the Securities Exchange Act of 1934, as amended, and the Private Securities Litigation Reform Act of 1995. New Jersey Resources (NJR or the Company) cautions readers that the assumptions forming the basis for forward-looking statements include many factors that are beyond NJR’s ability to control or estimate precisely, such as estimates of future market conditions and the behavior of other market participants. Words such as “anticipates,” “estimates,” “expects,” “projects,” “may,” “will,” “intends,” “plans,” “believes,” “should” and similar expressions may identify forward-looking statements and such forward-looking statements are made based upon management’s current expectations, assumptions and beliefs as of this date concerning future developments and their potential effect upon NJR. There can be no assurance that future developments will be in accordance with management’s expectations or that the effect of future developments on NJR will be those anticipated by management. Forward-looking statements in this presentation include, but are not limited to, certain statements regarding NJR’s Net Financial Earnings (NFE) guidance for fiscal 2017 and NFE growth beyond fiscal 2017, forecasted contribution of business segments to fiscal 2017 NFE and to NFE beyond fiscal 2017, dividend growth, growing energy demand, future New Jersey Natural Gas Company (NJNG) customer growth and margin growth, future capital plans and expenditures and infrastructure investments, the effect of Solar Renewable Energy Certificate (SRECs) prices, supply, hedges and generation on NJR Clean Energy Ventures Corporation (NJRCEV), the long-term outlook for NJCEV, diversification of NJRCEV’s strategy, energy efficiency opportunities, the effects of a hypothetical corporate tax rate reduction, and the PennEast Pipeline project. The factors that could cause actual results to differ materially from NJR’s expectations, assumptions and beliefs include, but are not limited to, weather and economic conditions; demographic changes in NJR’s service territory and their effect on NJR’s customer growth; volatility of natural gas and other commodity prices and their impact on NJNG customer usage, NJNG’s BGSS incentive programs, NJR Energy Services Company (NJRES) operations and on our risk management efforts; changes in rating agency requirements and/or credit ratings and their effect on availability and cost of capital to our Company; the impact of volatility in the credit markets on our access to capital; the ability to comply with debt covenants; the impact to the asset values and resulting higher costs and funding obligations of our pension and postemployment benefit plans as a result of potential downturns in the financial markets, lower discount rates, revised actuarial assumptions or impacts associated with the Patient Protection and Affordable Care Act; accounting effects and other risks associated with hedging activities and use of derivatives contracts; commercial and wholesale credit risks, including the availability of creditworthy customers and counterparties, and liquidity in the wholesale energy trading market; the ability to obtain governmental and regulatory approvals and land-use rights such as those necessary for the PennEast Project, electric grid connection (in the case of clean energy projects) and/or financing for the construction, development and operation of our unregulated energy investments and NJNG’s infrastructure projects in a timely manner; risks associated with the management of our joint ventures and partnerships, and investment in a master limited partnership; risks associated with our investments in clean energy projects, including the availability of regulatory and tax incentives, the availability of viable projects, our eligibility for Investment Tax Credits (ITC) and Production Tax Credits (PTC), the future market for SRECs and electricity prices, and operational risks related to projects in service; timing of qualifying for ITCs and PTCs due to delays or failures to complete planned solar and wind energy projects and the resulting effect on our effective tax rate and earnings; the level and rate at which NJNG’s costs and expenses are incurred and the extent to which they are allowed to be recovered from customers through the regulatory process, including through future base rate case filings; access to adequate supplies of natural gas and dependence on third-party storage and transportation facilities for natural gas supply; operating risks incidental to handling, storing, transporting and providing customers with natural gas; risks related to our employee workforce; the regulatory and pricing policies of federal and state regulatory agencies; the costs of compliance with present and future environmental laws, including potential climate change-related legislation; the impact of a disallowance of recovery of environmental-related expenditures and other regulatory changes; environmental-related and other litigation and other uncertainties; risks related to cyber-attack or failure of information technology systems; and the impact of natural disasters, terrorist activities and other extreme events on our operations and customers. The aforementioned factors are detailed in the “Risk Factors” section of our Annual Report on Form 10-K filed with the Securities and Exchange Commission (SEC) on November 22, 2016, which is available on the SEC’s website at sec.gov. Information included in this presentation is representative as of today only and while NJR periodically reassesses material trends and uncertainties affecting NJR's results of operations and financial condition in connection with its preparation of management's discussion and analysis of results of operations and financial condition contained in its Quarterly and Annual Reports filed with the SEC, NJR does not, by including this statement, assume any obligation to review or revise any particular forward-looking statement referenced herein in light of future events.

3 Non-GAAP Financial Measures This presentation includes the non-GAAP measure, NFE. As an indicator of the Company’s operating performance, this measure should not be considered an alternative to, or more meaningful than, GAAP measures, such as cash flow, net income, operating income or earnings per share. NFE excludes unrealized gains or losses on derivative instruments related to the Company’s unregulated subsidiaries and certain realized gains and losses on derivative instruments related to natural gas that has been placed into storage at NJRES, net of applicable tax adjustments, as described below. Volatility associated with the change in value of these financial and physical commodity contracts is reported in the income statement in the current period. In order to manage its business, NJR views its results without the impacts of the unrealized gains and losses, and certain realized gains and losses, caused by changes in value of these financial instruments and physical commodity contracts prior to the completion of the planned transaction because it shows changes in value currently as opposed to when the planned transaction ultimately is settled. An annual estimated effective tax rate is calculated for NFE purposes and any necessary quarterly tax adjustment is applied to NJRCEV, as such adjustment is related to tax credits generated by NJRCEV. Management uses NFE as a supplemental measure to other GAAP results to provide a more complete understanding of the Company’s performance. Management believes this non-GAAP measure is more reflective of the Company’s business model, provides transparency to investors and enables period-to-period comparability of financial performance. In providing fiscal 2017 earnings guidance, management is aware that there could be differences between reported GAAP earnings and NFE due to matters such as, but not limited to, the positions of our energy-related derivatives. Management is not able to reasonably estimate the aggregate impact of these items on reported earnings and therefore is not able to provide a reconciliation to the corresponding GAAP equivalent for its operating earnings guidance without unreasonable efforts. For a full discussion of our non- GAAP financial measures, please see NJR’s most recent Form 10-K, Item 7. This information has been provided pursuant to the requirements of SEC Regulation G.

4 Highlights Financial Performance • 3Q 2017 Net Financial Earnings (NFE)* per share of $.20, an increase of 54 percent; fiscal year-to-date NFE per share of $1.88 compared with $1.63 last year • Reaffirmed 2017 NFE guidance of $1.65-$1.75 per share Diversified infrastructure opportunities • Customer and utility gross margin growth continues at NJNG • 64 percent FYTD increase in NJRCEV residential solar customers • Three new commercial solar projects in service; two others under construction • Southern Reliability Link and PennEast Pipeline projects remain on track • Annualized dividend of $1.02 per share; up 6.3 percent fiscal year- over-year • 21 consecutive years of dividend growth; attractive dividend yield Total return potential Key Project Milestones Customer Growth Attractive Dividend * A reconciliation from NFE to net income is set forth in the Appendix on Slide 17.

5 60-75 percent of 2017 NFE Expected from Regulated Businesses Projected Diversified Sources of Fiscal 2017 NFE New Jersey Natural Gas 55-65% NJR Midstream 5-10% NJR Energy Services 5-15% NJR Home Services/ Other 1-3% NJR Clean Energy Ventures 15-25% Regulated businesses

6 Annual Dividend Growth Goal of 6 to 8 Percent • 6.3 percent increase to current $1.02 annual rate; approved on September 13, 2016 • 23 dividend increases over the last 21 years • Dividend payout ratio goal of 60 to 65 percent $.72 $.77 $.81 $.86 $.92 $.96 $1.02* 0% 10% 20% 30% 40% 50% 60% 70% $0.00 $0.20 $0.40 $0.60 $0.80 $1.00 $1.20 2011 2012 2013 2014 2015 2016 2017E Pa you t R ati o D ivi d e nd s Dividends and Payout Ind. Div Rate Payout * Current annual rate, dividend payout ratio based on midpoint of NFE guidance Dividend Strategy Supported By NFE Growth

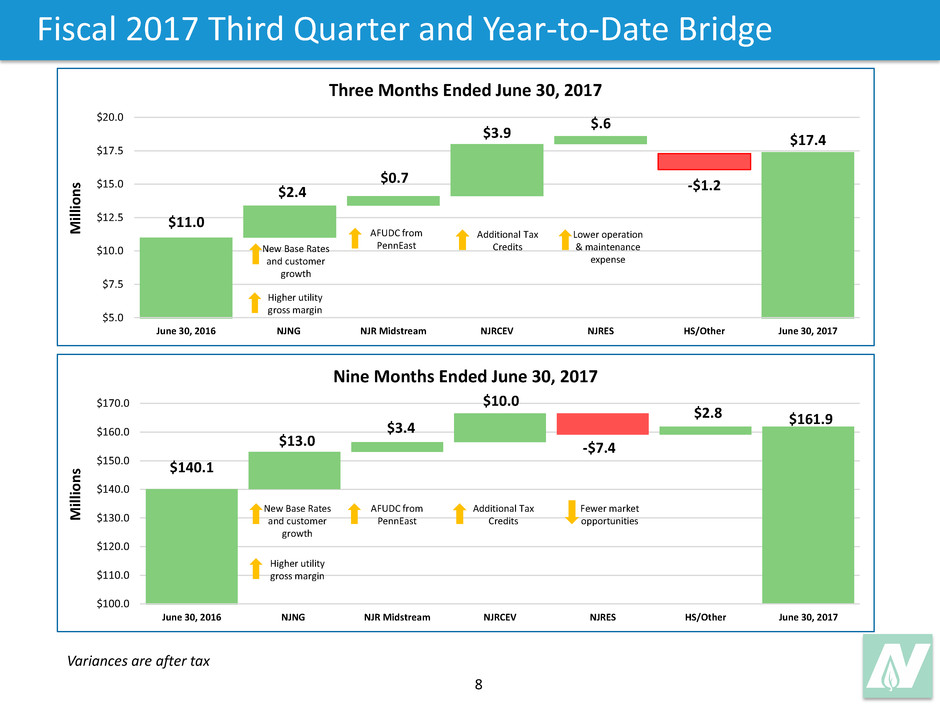
7 Fiscal 2017 Third Quarter and Year-To-Date NFE Net Financial Earnings ($MM) Company 2017 2016 Variance 2017 2016 Variance New Jersey Natural Gas $6.0 $3.6 $2.4 $96.5 $83.5 $13.0 NJR Midstream 3.0 2.3 0.7 10.3 6.9 3.4 Subtotal $9.0 $5.9 $3.1 $106.8 $90.4 $16.4 NJR Clean Energy Ventures 6.3 2.4 3.9 31.9 21.9 10.0 NJR Energy Services 0.9 0.3 0.6 20.2 27.6 (7.4) NJR H me Services/Other 1.2 2.4 (1.2) 3.0 0.2 2.8 Total $17.4 $11.0 $6.4 $161.9 $140.1 $21.8 Per basic share $.20 $.13 $.07 $1.88 $1.63 $.25 Three Months Ended June 30, Nine Months Ended June 30,

8 Fiscal 2017 Third Quarter and Year-to-Date Bridge $.6 -$1.2 $11.0 $2.4 $0.7 $3.9 $17.4 $5.0 $7.5 $10.0 $12.5 $15.0 $17.5 $20.0 June 30, 2016 NJNG NJR Midstream NJRCEV NJRES HS/Other June 30, 2017 M ill io n s Three Months Ended June 30, 2017 New Base Rates and customer growth Higher utility gross margin AFUDC from PennEast Lower operation & maintenance expense Additional Tax Credits $161.9 -$7.4 $140.1 $13.0 $3.4 $10.0 $2.8 $100.0 $110.0 $120.0 $130.0 $140.0 $150.0 $160.0 $170.0 June 30, 2016 NJNG NJR Midstream NJRCEV NJRES HS/Other June 30, 2017 M ill io n s Nine Months Ended June 30, 2017 New Base Rates and customer growth Higher utility gross margin AFUDC from PennEast Additional Tax Credits Fewer market opportunities Variances are after tax

9 NJNG Capital Investment Update - June 30, 2017 CAPITAL INVESTMENT ($MM) 3Q FYTD 2017 2017E ACTIONS STATUS NJNG 11 Customer Growth $9.0 $27.8 $34.9 Added 2,101 customers in FY3Q2017 On target to add 9,000 customers in FY2017 Maintenance 11.3 30.0 41.4 Capital spending to enhance system safety and reliability On track Cost of Removal/Other 8.4 26.8 48.6 Capital spending to take replaced/retired pipe out of service On track SAFE II 9.4 24.7 35.0 Five year, $157.5 million SAFE extension program approved by the NJBPU effective October 2016 to complete replacement of 276 miles of unprotected steel pipe Replaced 38.2 miles through FY3Q2017 NJ RISE 5.0 6.1 15.8 Work continues on storm hardening projects, including installing excess flow valves to prepare for future weather events Sea Bright reinforcement completed in April. Ship Bottom regulator re-design on track to be completed and operational by September 2017. Southern Reliability Link 1.2 3.0 6.0 Reduced FY2017 capital expenditure estimate due to timing of permitting process Expected to be in service in late FY2018 Total NJNG $44.3 $118.4 $181.7

10 Strong Customer Growth Continues • FY3Q 2017: 2,101 new customers added • 1,291 new construction • 810 conversions • 9 Months: 6,231 new customers added; up nearly 18 percent over last year • 3,994 new construction • 2,237 conversions • FY2017-2019: 60/40 percent new construction and conversion mix • Margin impact: Residential customers contribute 70 percent of utility gross margin • Return of Superstorm Sandy customers adds to growth rate in FY 2017 and beyond 5,289 6,231 7,599 7,858 8,170 9,000 0 2,000 4,000 6,000 8,000 10,000 12,000 FY14A FY15A FY16A FY17E FY3Q 16 FY3Q 17 C u st o m e rs Customer Additions New Construction Conversions 26,000-28,000 New Customers Expected from Fiscal 2017-2019; A Growth Rate of 1.7 Percent

11 NJRCEV Assets Placed Into Service* CAPITAL INVESTMENT ($MM) 3Q FYTD 2017 2017E ACTIONS STATUS NJRCEV 11 Commercial Solar $51.8 $52.7 $63.9 2.5 MW project for Brick Board of Education (BOE) and 20 MW Pemberton projects completed and in service Two other projects under construction Residential Solar 8.4 27.8 38.5 328 new customers added in FY3Q2017, for total of 1,008 in first nine months Approximately 6,100 Sunlight Advantage® customers Wind - 89.0 89.0 Ringer Hill wind farm completed Five wind farms in operation Total NJRCEV* $60.2 $169.5 $191.4 * Based on projects qualifying for federal tax credits. As of June 30, 2017.

12 SREC Pricing and Hedging Strategy Pct. Hedged: 98% 89% 75% Average Price: $229 $225 $190 Current Price (EY): $248 $190 $175 As of June 30, 2017. Source: InterContinental Exchange (ICE) 179 195 169 - 20 40 60 80 100 120 140 160 180 200 220 240 260 EY17 EY18 EY19 Th o u sa n d s o f SR EC s Energy Year - Operational & Under Construction Facilities Hedged Unhedged Operational 182 224219 NJRCEV mitigates price risk through an active hedging program to stabilize revenue

13 NJR Capital Plan ($MM) 3Q F2017A FYTD 2017A 2017E 2018E 2019E 2017-2019 Total New Customer $9.0 $27.8 $34.9 $34.7 $37.0 $106.6 Maintenance 11.3 30.0 41.4 45.4 53.6 140.4 Cost of Removal/Other 8.4 26.8 48.6 42.2 34.4 125.2 SAFE II 9.4 24.7 35.0 37.6 41.0 113.6 NJ RISE 5.0 6.1 15.8 27.4 22.6 65.8 Southern Reliability Link 1.2 3.0 6.0 149.9 - $155.9 Total NJNG $44.3 $118.4 $181.7 $337.2 $188.6 $707.5 Midstream $13.6 $24.1 $38.0 $138.8 $37.7 $214.5 Residential Solar $8.4 $27.8 $38.5 $41.6 $42.9 $123.0 Commercial Solar 51.8 52.7 63.9 59.0 69.5 192.4 Subtotal $60.2 $80.5 $102.4 $100.6 $112.4 $315.4 Wind - $89.0 $89.0 $121.8 $81.2 $292.0 Total NJRCEV * $60.2 $169.5 $191.4 $222.4 $193.6 $607.4 GRAND TOTAL $118.1 $312.0 $411.1 $698.4 $419.9 $1,529.4 * Based on projects qualifying for federal tax credits As of June 30, 2017 Regulated Sources to Generate 60 -75 Percent of Fiscal 2017 NFE

14 NJR Sources and Uses of Capital $0.0 $100.0 $200.0 $300.0 $400.0 $500.0 $600.0 $700.0 $800.0 $900.0 Sources Uses Sources Uses Sources Uses M ill io n s Cash Flows LT Debt Equity CFFO Capex Dividends Capital Plan Supports Infrastructure Investments, While Maintaining Strong Balance Sheet 2017E 2018E 2019E

15 Creating Long-Term Value • Growing customer base generates incremental utility gross margin of approximately $5 million annually • Projected annual rate base growth of approximately 6 percent • Collaborative regulatory relations Diversified infrastructure opportunities • Continued investment in infrastructure projects totaling nearly $450 million over the next three years • Invest in regulated Midstream projects • Public policy supports investments in clean energy projects • Capital allocation strategy supports long-term growth • Efficient financial profile supports access to capital and maintains investment grade credit ratings • Solid earnings performance supports strong dividend growth Strong financial profile and access to capital Diversified infrastructure opportunities Solid utility investment platform

16 APPENDIX

17 Reconciliation to Non-GAAP Measures A reconciliation of NFE for the three and nine months ended June 30, 2017 and 2016 to net income is provided below:

18 Key Trends Support Future Customer Growth On Main, 32,100 Near Main, 28,300 Off Main, 42,200 Non Heat, 5,600 Residential Conversions4 = 108,200 4. Source: NJNG $0.00 $1.00 $2.00 $3.00 $4.00 $5.00 NJNG Fuel Oil Propane Electricity $0.97 $1.91 $4.10 $4.10 Equivalent Customer Cost2 2. Source: US Energy Information Administration. As of March 2017. Based on 100,000 comparable BTUs. 2017 – 2019 = 11,775 2020 - Buildout = 69,176 3. Source: A.D. Little - 2,000 4,000 6,000 8,000 NJNG Monmouth Ocean Morris 5,419 1,952 2,624 843 Building Permits Issued1 2016 1. Source: US Bureau of Census Residential New Construction3 = 80,951

19 NJR Projected Cash Flows $MM 2017E 2018E 2019E Cash Flow from Operations $228.5 $276.1 $258.1 Uses of Funds Capital expenditures - NJNG ($181.7) ($337.2) ($188.6) Capital expenditures - PennEast (38.0) (138.8) (37.7) Capital expenditures - NJRCEV (132.3) (223.4) (202.0) Dividends (86.5) (91.2) (98.4) Total Uses of Funds ($438.5) ($790.6) ($526.7) Financing Activities Common stock proceeds, net $16.0 $100.0 $50.0 Debt proceeds, net 194.0 414.5 219.2 Total Financing Activities $210.0 $514.5 $269.2 As of June 30, 2017.

20 NJRCEV – Commercial Solar Portfolio Net In-Service Capital Cost Total Metered Wholesale Facility Location Date ($MM) MW MW MW FY2011 Fieldcrest Edison Township Feb-11 $2.3 0.5 0.5 Blair Road II Woodbridge Township Mar-11 6.9 1.3 0.3 1.0 Herrod Solar Facility South Brunswick Township Jul-11 4.7 1.0 1.0 South River Road Cranbury Jul-11 4.4 0.9 0.3 0.6 $18.3 3.6 2.1 1.6 FY2012 Brunswick* Edison Nov-11 $3.1 0.6 0.7 160 Raritan* Edison Township Nov-11 3.6 0.7 0.7 The Vineland Vineland Nov-11 22.3 4.7 4.7 McGraw-Hill Windsor Township Dec-11 61.8 14.1 14.1 Manalapan Village Manalapan Township Dec-11 18.1 3.6 3.6 $108.9 23.8 14.1 9.7 FY2013 Reeves Station Road East Medford Oct-12 $19.7 6.7 6.7 Wakefern 5000 Riverside* Woodbridge Township Dec-12 6.6 2.4 2.4 Medford Wastewater Treatment Plant Medford Jul-13 4.5 1.5 1.5 Abescon Community Schools Complex Abescon Sep-13 2.6 0.9 0.9 $33.4 11.5 4.8 6.7 FY2014 Woolrich Township Municipal Complex Woolrich Township Dec-13 $1.0 0.3 0.3 Reeves Station South Medford Dec-13 4.8 1.4 1.4 West Pemberton Pemberton Township Jun-14 22.4 9.2 9.2 Jacobstown North Hanover Township Jul-14 15.4 6.1 6.1 $43.6 17.0 0.3 16.7 FY2015 Rock Solid Howell Township Dec-14 $25.8 9.9 9.9 North Run North Hanover Township Jan-15 15.8 6.3 6.3 Franklin Township Board of Education Pittstown Apr-15 1.6 0.4 0.4 Harmony Phillipsburg Jun-15 10.1 3.9 3.9 Hanover North Hanover Township Sep-15 15.1 6.0 6.0 $68.4 26.5 0.4 26.1 FY2016 East Amwell East Amwell Township May-16 $7.3 2.3 2.2 Junction Road Raritan May-16 12.4 5.4 5.4 Sharon Station Upper Freehold May-16 8.0 3.3 3.3 Bernards Landfll Bernardsville Sep-16 9.9 3.7 3.7 Cedar Branch Buena Vista Township Sep-16 16.8 7.2 7.2 $54.4 21.8 0.0 21.7 FY2017 Pemberton Township (Phase 1) Burlington County May-17 $22.3 10.0 10.0 Pemberton Township (Phase 2) Burlington County May-17 22.3 10.0 10.0 Brick Township Schools Brick Township Jun-17 6.6 2.5 2.5 Westfield Township Board of Education* Union County Aug-17 4.4 1.6 Stonybrook Sewage Authority* Princeton Aug-17 8.4 3.0 $51.1 22.5 2.5 20.0 Total Commercial Solar $378.1 126.7 24.2 102.4 * Project not included in totals until it is in service.

21 NJRCEV: Onshore Wind Farm Portfolio Capital In-Service Cost Total Capacity Hedge Wind Farm Location Date ($MM) MW Factor Percentage FY2014 Two Dot Two Dot, Montana Jun-14 $20.7 9.7 42.8 100.0 $20.7 9.7 FY2015 Carroll Area Carroll, Iowa Jan-15 $42.0 20.0 49.7 100.0 $42.0 20.0 FY2016 Alexander Rush County, Kansas Dec-15 $84.5 50.7 49.2 100.0 Medicine Bow Carbon County, Wyoming Sep-16 3.9 6.3 32.5 100.0 $88.4 57.0 FY2017 Ringer Hill Somerset County, PA Dec-16 $88.9 39.9 35.0 67.0 $88.9 39.9 Total Onshore Wind $240.0 126.6

22 Effects of Hypothetical Corporate Tax Rate Reduction on NJR Income Statement EPS Impact NJNG net income* Flat Non-regulated net income Annual Increase Revaluation of net deferred tax liabilities, non-regulated One-Time Increase Balance Sheet Balance Sheet Impact Equity (Impact of one-time revaluation of non-regulated deferred tax liabilities + earnings increase) Increase Net deferred tax liabilities Decrease Other Impact Tax Appetite Decrease * Assumes similar treatment as in 1986 corporate tax reduction

Third Quarter Fiscal 2017 Update August 2, 2017


