Exhibit 99.2
Third Quarter 2022 Financial Results August 4, 2022
Forward-Looking Statements and Non-GAAP Measures 1 Forward-Looking Statements This presentation contains forward-looking statements within the meaning of Section 27A of the Securities Act of 1933, as amended, Section 21E of the Securities Exchange Act of 1934, as amended, and the Private Securities Litigation Reform Act of 1995. NJR cautions readers that the assumptions forming the basis for forward-looking statements include many factors that are beyond NJR’s ability to control or estimate precisely, such as estimates of future market conditions and the behavior of other market participants. Words such as “anticipates,” “estimates,” “expects,” “projects,” “may,” “will,” “intends,” “plans,” “believes,” “should” and similar expressions may identify forward-looking statements and such forward-looking statements are made based upon management’s current expectations, assumptions and beliefs as of this date concerning future developments and their potential effect upon NJR. There can be no assurance that future developments will be in accordance with management’s expectations, assumptions and beliefs or that the effect of future developments on NJR will be those anticipated by management. Forward-looking statements in this earnings release include, but are not limited to, certain statements regarding NJR’s NFEPS guidance for fiscal 2022, long term annual growth projections, projections of dividend and financing activities, forecasted contribution of business segments to NJR’s NFE for fiscal 2022, customer growth at NJNG, future NJR and NJNG capital expenditures, potential CEV capital projects, CEV revenue projections, infrastructure programs and investments future decarbonization opportunities, Asset Management Agreements, the ability to complete the Adelphia Gateway Pipeline project, and other legal and regulatory expectations. Additional information and factors that could cause actual results to differ materially from NJR’s expectations are contained in NJR’s filings with the SEC, including NJR’s Annual Reports on Form 10-K and subsequent Quarterly Reports on Form 10-Q, recent Current Reports on Form 8-K, and other SEC filings, which are available at the SEC’s web site, http://www.sec.gov. Information included in this presentation is representative as of today only and while NJR periodically reassesses material trends and uncertainties affecting NJR's results of operations and financial condition in connection with its preparation of management's discussion and analysis of results of operations and financial condition contained in its Quarterly and Annual Reports filed with the SEC, NJR does not, by including this statement, assume any obligation to review or revise any particular forward-looking statement referenced herein in light of future events. Non-GAAP Measures This presentation includes the non-GAAP financial measures NFE/net financial loss, NFE per basic share, financial margin and utility gross margin. A reconciliation of these non-GAAP financial measures to the most directly comparable financial measures calculated and reported in accordance with GAAP can be found below. As an indicator of NJR’s operating performance, these measures should not be considered an alternative to, or more meaningful than, net income or operating revenues as determined in accordance with GAAP. This information has been provided pursuant to the requirements of SEC Regulation G. NFE and financial margin exclude unrealized gains or losses on derivative instruments related to NJR’s unregulated subsidiaries and certain realized gains and losses on derivative instruments related to natural gas that has been placed into storage at Energy Services and certain transactions related to NJR's investments in the PennEast Project, net of applicable tax adjustments as described below. Financial margin also differs from gross margin as defined on a GAAP basis as it excludes certain operations and maintenance expense and depreciation and amortization as well as the effects of derivatives as discussed above. Volatility associated with the change in value of these financial instruments and physical commodity reported on the income statement in the current period. In order to manage its business, NJR views its results without the impacts of the unrealized gains and losses, and certain realized gains and losses, caused by changes in value of these financial instruments and physical commodity contracts prior to the completion of the planned transaction because it shows changes in value currently instead of when the planned transaction ultimately is settled. An annual estimated effective tax rate is calculated for NFE purposes and any necessary quarterly tax adjustment is applied to NJR Energy Services Company. NJNG’s utility gross margin is defined as operating revenues less natural gas purchases, sales tax, and regulatory rider expense. This measure differs from gross margin as presented on a GAAP basis as it excludes certain operations and maintenance expense and depreciation and amortization. Utility gross margin may also not be comparable to the definition of gross margin used by others in the natural gas distribution business and other industries. Management believes that utility gross margin provides a meaningful basis for evaluating utility operations since natural gas costs, sales tax and regulatory rider expenses are included in operating revenues and passed through to customers and, therefore, have no effect on utility gross margin. Management uses NFE/net financial loss, utility gross margin and financial margin, as supplemental measures to other GAAP results to provide a more complete understanding of the Company’s performance. Management believes these non- GAAP measures are more reflective of the Company’s business model, provide transparency to investors and enable period-to-period comparability of financial performance. In providing NFE guidance, management is aware that there could be differences between reported GAAP earnings and NFE/net financial loss due to matters such as, but not limited to, the positions of our energy-related derivatives. Management is not able to reasonably estimate the aggregate impact or significance of these items on reported earnings and therefore is not able to provide a reconciliation to the corresponding GAAP equivalent for its operating earnings guidance without unreasonable efforts. NFE/net financial loss, utility gross margin and financial margin are discussed more fully in Item 7 of our Report on Form 10-K, NJR’s Form 10-Q filed on August 4, 2022 and, we have provided presentations of the most directly comparable GAAP financial measure and a reconciliation of our non-GAAP financial measure, NFE/net financial loss, to the most directly comparable GAAP financial measure, in the appendix to this presentation. This information has been provided pursuant to the requirements of SEC Regulation G.
1 Third-Quarter FY 2022 Highlights Steve Westhoven | President & CEO 2 Financial Highlights Roberto Bel | SVP and CFO 3 Q&A Session 2 Agenda
3 Third Quarter 2022 Highlights Quarterly Review * A reconciliation from NFE to net income can be found in the Appendix on slide 17. Q3 Fiscal 2022 Financial Results and Updated Guidance NJR reported EPS of $0.14 and net financial loss per share of $(0.04)* for Q3 Fiscal 2022 Increases FY 2022 NFEPS guidance range to $2.40 - $2.50 from $2.30 - $2.40 New Jersey Natural Gas Added 1,695 customers during the quarter Clean Energy Ventures Over 675MW pipeline of projects under construction, contract or exclusivity through fiscal 2027 Storage and Transportation Adelphia Gateway on track to be completed by end of calendar year Energy Services Asset Management Agreement drives $7.5 million of NFE improvement from the prior year
4 Utility Non-Utility Increasing Fiscal 2022 NFEPS Guidance by $0.10 $1.45 $1.74 $2.16 $2.40 - $2.50 FY2019A FY2020A FY2021A FY 2022E * NFEPS long-term annual growth projections are based on the original $2.20 - $2.30 guidance range for fiscal 2022, which excludes the effects of Energy Services’ over-performance 7-9% LONG-TERM ANNUAL GROWTH* New Jersey Natural Gas 59% - 61% Energy Services 15% - 20% CEV 16% - 18% S&T 6% - 8% Home Services 0%-1% Driven by a Combination of Strong Performance at New Jersey Natural Gas, Greater than Anticipated Financial Margin at Energy Services, and Increased Wholesale Electricity Revenue at Clean Energy Ventures Net Financial Earnings per Share Fiscal 2022 NFEPS Guidance by Segment
5 New Customer $35 SAVEGREEN $36 IIP $24 Cost of Removal/Other $34** IT $29 New Jersey Natural Gas Solid Performance Due to Higher Base Rates and Incremental Off-systems Sales ~$231M Total change in PP&E (cash spent, capex accrued and AFUDC). Includes SAVEGREEN investments, which for GAAP purposes are included as part of cash flows from operations ** Facilities and RNG & P2G included in “Other” (detailed on Slide 12) Fiscal YTD Capital Expenditures* ~41% of capital expenditures earning a near real-time return Maintenance $73 540 530 520 510 500 2017 2018 2019 2020 2021 Through Q3 FY2022 NJNG Customers (in thousands) 570 560 550 568.6 Added 5,274 new customers YTD in fiscal 2022 Regulatory Updates Submitted annual Basic Gas Supply Service (BGSS) filing to the New Jersey Board of Public Utilities (BPU) seeking to adjust its periodic BGSS rates for residential and small commercial customers primarily to reflect a significant rise in wholesale market prices for natural gas
6 380 67 0 200 400 600 800 1000 In Service FY2022 - FY2024E In Service Under Construction Under Contract or Exclusivity FY2025E-FY2026E FY2027E - CEV: Robust and Diversified Pipeline in Solar Taking Advantage of a Considerable Decarbonization Opportunity MWs 1200 Total 1.1 GW* Recent Developments New Jersey market awaiting finalization of Solar Successor Program (Straw Proposal being evaluated), TREC final project approvals, and the dual use incentive structure to develop solar on farmlands On June 14, 2022, PJM filed new tariff modifications with FERC to reform the interconnection study process and address the backlog of projects in the queue. In NJ 364MW * Total of installed capacity of 372MW plus a pipeline of 680MW including projects under construction, contract, or exclusivity Break down of ~608MW Pipeline Under Contract or Exclusivity By Location Outside NJ 244MW 608MW
CEV: New Project – Holland Township, NJ This solar project was built on an existing Superfund site that required environmental cleanup, including the removal of fuel tanks, hazardous materials and more than 10,000 cubic yards of contaminated soil. 7 ~8MW In Service in July 2022 Located in Hunterdon County (central NJ near the Pennsylvania border)
Project Updates Construction completed at Marcus Hook (lower Chichester Township, PA), and Quakertown, PA compressor stations Nearly fully contracted Expect completion by end of the calendar year Project Overview North zone: operational at acquisition – 600,000 Dth/d South zone: oil conversion and expansion; adding compression, laterals and interconnects – 250,000 Dth/d S&T: Adelphia Gateway Near Completion Conversion and Expansion Project Martin’s Creek Booster Compression Texas Eastern Sherry Lane Lateral UGI Easton Road Interconnect In-service Construction Complete Since 5/5/2022 Construction Ongoing Quakertown Compressor Station TETCO Quakertown Interconnect South Mainline (oil to natural gas conversion) Tilghman Lateral and PECO Interconnect Parkway Lateral & Columbia Interconnect Marcus Hook Compressor Station Transco Meter Station North Mainline 8
Financial Review 9 Roberto Bel SVP & Chief Financial Officer
NJR Review of Fiscal 3Q22 NFE Changes * A reconciliation of these non-GAAP measures can be found in the Appendix ($ in Millions) Fiscal 3Q21 – Consolidated NFE ($ in millions) $ (14.1) NJNG $ 1.1 Utility Gross Margin* $ 10.7 O&M $ 0.1 Depreciation & Amortization (D&A) $ (4.1) Interest expense, AFUDC, Income Tax $ (5.6) Clean Energy Ventures $ (0.2) Revenue $ 0.4 O&M $ (0.2) D&A, Interest Expense and Other $ (0.4) Storage & Transportation $ 1.1 Operating Income $ 2.1 Equity in Earnings of Affiliates $ (2.1) Other $ 1.1 Energy Services $ 7.5 Financial Margin* $ 11.2 Interest Expense, Income Tax and Other $ (3.7) Home Services and Other $ 1.0 Revenues $ 0.9 Other $ 0.1 Fiscal 3Q22 – Consolidated NFE ($ in millions) $ (3.6) 10
11 114 380 399 283 353 46 21 3 EY 2026 EY 2025 EY 2024 EY 2023 Thousands Hedged Unhedged NJR CEV – SREC Hedging Strategy Stabilizes Revenue Based on Energy Year, as of July 11, 2022 Percent Hedged Average Price Current Price (EY) 99% $203 $227 Percent Hedged Average Price Current Price (EY) 95% $197 $215 Percent Hedged Average Price Current Price (EY) 89% $190 $196 Percent Hedged Average Price Current Price (EY) 29% $173 $180 Note: Energy Years run from June 1 of the prior year to May 31 of the respective year; for example, Energy Year 2023 begins on June 1, 2022, and ends on May 31, 2023
12 1Q FY2022A 2Q FY2022A 3Q FY2022A YTD FY2022A FY2021A FY2022E FY2023E Near Real Time Return? New Jersey Natural Gas New Customer $12 $11 $12 $35 $65 $52 - $56 $54 - $58 Yes Maintenance & Integrity $27 $16 $30 $73 $252 $125 - $140 $114 - $118 Cost of Removal / Other $9 $18 $4 $31 $66 $34 - $38 $36 - $40 Facilities $1 $2 $— $3 $63 $8 - $10 $26 - $30 IT $4 $9 $16 $29 $9 $42 - $52 $60 - $64 IIP $6 $4 $13 $23 $9 $24 - $28 $32 - $36 Yes RNG & P2G $1 $— $— $1 $5 $1 - $1 $35 - $39 SAVEGREEN $13 $11 $12 $36 $31 $48 - $52 $48 - $52 Yes $73 $71 $87 $231 $499 $334 - $377 $405 - $437 Clean Energy Ventures Sunlight Advantage $2 $4 $4 $10 $11 $14 - $17 $14 - $18 Commercial Solar $30 $32 $28 $90 $78 $125 - $140 $110 - $250 $32 $36 $32 $100 $89 $139 - $157 $124 - $268 Storage and Transportation Adelphia Gateway $51 $38 $22 $111 $113 $115 - $130 $5 - $10 Leaf River $6 $4 $3 $13 $11 $7 - $11 $3 - $7 $57 $42 $25 $125 $124 $122 - $141 $8 - $17 Total $162 $149 $144 $455 $712 $595 - $675 $537 - $722 NJR Capital Plan1 ($ in Millions) 1Total change in PP&E (cash spent, capex accrued and AFUDC). For GAAP purposes, SAVEGREEN investments are included as part of cash flows from operations
13 NJR Projected Cash Flows ($ in Millions) 1- Excludes accrual for AFUDC and SAVEGREEN investments (for GAAP purposes, SAVEGREEN investments are included in Cash Flow from Operations) 2- Dividend growth for fiscal 2023 are based upon the midpoint of forecasted 7-9% growth rate FY2021A FY2022E FY2023E Cash Flow from Operations $391 $225 - $245 $410 - $430 Uses of Funds Capital Expenditures1 $625 $534 - $610 $481 - $658 Dividends2 $117 $127 - $132 $135 - $140 Total Uses of Funds $742 $661 - $742 $616 - $798 Financing Activities Common Stock Proceeds – DRIP $15 $14 - $16 - - Debt Proceeds/Other $336 $422 - $481 $206 - $368 Total Financing Activities $351 $436 - $497 $206 - $368
Attractive Total Shareholder Return 10% - 12% 14 1Based on dividend per share of $1.45 and closing share price of $45.71 on August 2, 2022 Growing Dividend Annualized dividend yield of 3.2%1 Expect future dividend growth to be 7% to 9% (in line with long-term NFEPS expectations) The Clean Energy Future Starts at NJR Net Zero by 2050 goal for New Jersey operations First utility on the East Coast to blend green hydrogen into its fuel stream Largest solar pipeline in Company history Solid Long Term Growth Outlook Expect 7% - 9% NFEPS Growth Diversified energy infrastructure company with complementary businesses that provide a strong profile for growth Value Proposition for Stakeholders
Appendix 15 Slide 16 Third Quarter Fiscal 2022 NFE by Business Unit 17 Reconciliation of NFE and NFEPS to Net Income 18 Other Reconciliation of Non-GAAP Measures 19 Review of Fiscal YTD NFE Changes 20 Energy Services: AMAs De-Risks Business and Drives Value 21 NJR CEV – SREC Hedging by Fiscal Year 22 Shareholder and Contact Information
Third Quarter Fiscal 2022 NFE by Business Unit 16 ($ in 000s) Three Months Ended June 30, Nine Months Ended June 30, 2022 2021 Change 2022 2021 Change New Jersey Natural Gas $2,648 $1,581 $1,067 $156,511 $131,589 $24,922 Clean Energy Ventures $(5,098) $(4,926) $(172) $(18,410) $(24,072) $5,662 Storage and Transportation $3,526 $2,387 $1,139 $11,113 $10,606 $507 Energy Services $(5,003) $(12,527) $7,524 $42,504 $85,501 $(42,997) Home Services and Other $376 $(663) $1,039 $707 $(2,511) $3,218 Total $(3,551) $(14,148) $10,597 $192,425 $201,113 $(8,688) NFEPS $(0.04) $(0.15) $0.11 $2.00 $2.09 $(0.09)
Reconciliation of NFE and NFEPS to Net Income ($ in 000s) (Unaudited) Three Months Ended June 30, Nine Months Ended June 30, 2022 2021 2022 2021 NEW JERSEY RESOURCES NFE is a measure of earnings based on the A reconciliation of net income, the closest GAAP financial measure, to net financial earnings is as follows: elimination of timing differences to effectively match the earnings effects of the economic Net income (loss) $ 13,053 $ (111,831) $ 220,400 $ 119,023 hedges with the physical sale of natural gas, Solar Add: Renewable Energy Certificates (SRECs) and Unrealized (gain) loss on derivative instruments and related transactions (17,891) 21,862 (58,060) 13,627 foreign currency contracts. Consequently, to Tax effect 4,253 (5,198) 13,809 (3,240) reconcile net income and NFE, current-period Effects of economic hedging related to natural gas inventory unrealized gains and losses on the derivatives are 428 2,486 25,160 (12,255) excluded from NFE as a reconciling item. Tax effect (102) (591) (5,979) 2,912 Realized derivative gains and losses are also (Gain on) impairment of equity method investment (4,021) 92,000 (4,021) 92,000 included in current-period net income. However, Tax effect 1,003 (11,934) 1,003 (11,934) NFE includes only realized gains and losses NFE tax adjustment (274) (942) 113 980 related to natural gas sold out of inventory, Net financial (loss) earnings $ (3,551) $ (14,148) $ 192,425 $ 201,113 effectively matching the full earnings effects of the derivatives with realized margins on physical Weighted Average Shares Outstanding natural gas flows. NFE also excludes certain transactions associated with equity method Basic 96,154 96,348 96,055 96,237 investments, including impairment charges, which Diluted 96,620 96,348 96,527 96,629 are non-cash charges, and return of capital in excess of the carrying value of our investment. A reconciliation of basic earnings per share, the closest GAAP financial measure, to basic net financial earnings per share is as These are not indicative of the Company's follows: performance for its ongoing operations. Included Basic earnings (loss) per share in the tax effects are current and deferred income $ 0.14 $ (1.16) $ 2.29 $ 1.24 tax expense corresponding with the components Add: of NFE. Unrealized (gain) loss on derivative instruments and related transactions $ (0.19) $ 0.22 $ (0.60) $ 0.14 Tax effect $ 0.04 $ (0.05) $ 0.14 $ (0.03) NFE eliminates the impact of volatility to GAAP Effects of economic hedging related to natural gas inventory $ — $ 0.03 $ 0.26 $ (0.13) earnings associated with unrealized gains and Tax effect $ — $ (0.01) $ (0.06) $ 0.03 losses on derivative instruments in the current Impairment of equity method investment $ (0.04) $ 0.95 $ (0.04) $ 0.95 period Tax effect $ 0.01 $ (0.12) $ 0.01 $ (0.12) NFE tax adjustment $ — $ (0.01) $ — $ 0.01 Basic NFE per share $ (0.04) $ (0.15) $ 2.00 $ 2.09 17
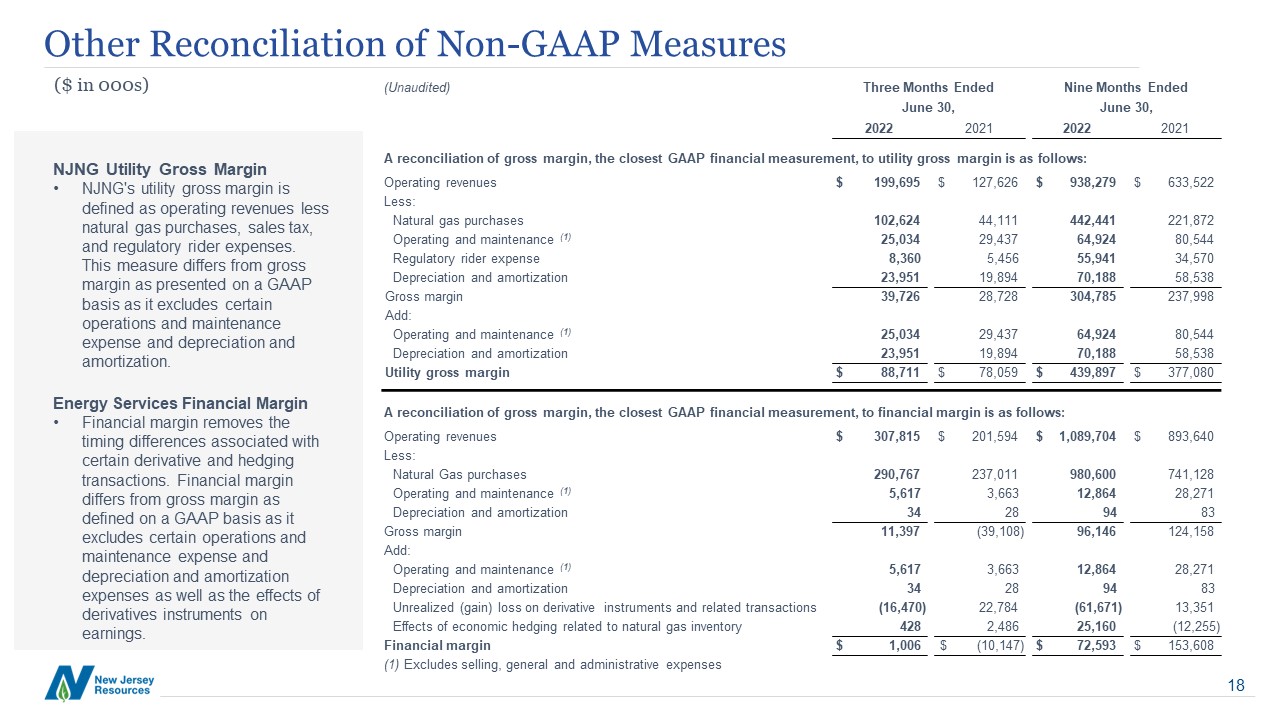
Other Reconciliation of Non-GAAP Measures ($ in 000s) (Unaudited) Three Months Ended Nine Months Ended June 30, June 30, 2022 2021 2022 2021 NJNG Utility Gross Margin A reconciliation of gross margin, the closest GAAP financial measurement, to utility gross margin is as follows: NJNG's utility gross margin is Operating revenues $ 199,695 $ 127,626 $ 938,279 $ 633,522 defined as operating revenues less Less: natural gas purchases, sales tax, Natural gas purchases 102,624 44,111 442,441 221,872 and regulatory rider expenses. Operating and maintenance (1) 25,034 29,437 64,924 80,544 This measure differs from gross Regulatory rider expense 8,360 5,456 55,941 34,570 margin as presented on a GAAP Depreciation and amortization 23,951 19,894 70,188 58,538 basis as it excludes certain Gross margin 39,726 28,728 304,785 237,998 operations and maintenance Add: expense and depreciation and Operating and maintenance (1) 25,034 29,437 64,924 80,544 amortization. Depreciation and amortization 23,951 19,894 70,188 58,538 Utility gross margin $ 88,711 $ 78,059 $ 439,897 $ 377,080 Energy Services Financial Margin Financial margin removes the A reconciliation of gross margin, the closest GAAP financial measurement, to financial margin is as follows: timing differences associated with Operating revenues $ 307,815 $ 201,594 $ 1,089,704 $ 893,640 certain derivative and hedging Less: transactions. Financial margin Natural Gas purchases 290,767 237,011 980,600 741,128 differs from gross margin as Operating and maintenance (1) 5,617 3,663 12,864 28,271 defined on a GAAP basis as it Depreciation and amortization 34 28 94 83 excludes certain operations and Gross margin 11,397 (39,108) 96,146 124,158 maintenance expense and Add: depreciation and amortization Operating and maintenance (1) 5,617 3,663 12,864 28,271 expenses as well as the effects of Depreciation and amortization 34 28 94 83 derivatives instruments on Unrealized (gain) loss on derivative instruments and related transactions (16,470) 22,784 (61,671) 13,351 earnings. Effects of economic hedging related to natural gas inventory 428 2,486 25,160 (12,255) Financial margin $ 1,006 $ (10,147) $ 72,593 $ 153,608 (1) Excludes selling, general and administrative expenses 18
Review of Fiscal 2022 YTD NFE Changes * A reconciliation of these non-GAAP measures can be found in the Appendix ($ in Millions) Fiscal 2021 YTD – Consolidated NFE ($ in millions) $ 201.1 NJNG $ 24.9 Utility Gross Margin* $ 62.8 O&M $ 7.3 Depreciation & Amortization (D&A) $ (11.7) Interest expense, AFUDC, Income Tax $ (33.5) Clean Energy Ventures $ 5.7 Revenue $ 9.6 O&M $ (0.9) D&A, Interest Expense and Other $ (3.0) Storage & Transportation $ 0.5 Operating Income $ (0.8) Equity in Earnings of Affiliates $ (6.4) Other $ 7.7 Energy Services $ (43.0) Financial Margin* $ (81.0) Interest Expense, Income Tax and Other $ 38.0 Home Services and Other $ 3.2 Revenues $ 2.7 Other $ 0.5 Fiscal 2022 YTD – Consolidated NFE ($ in millions) $ 192.4 19
Energy Services: AMAs De-Risks Business and Drives Value AMAs feature initial and permanent capacity releases with cash payments throughout, with ASC 606 revenue recognition standard requiring that revenue be allocated to both the initial and permanent releases. As a result, disproportionate value is allocated to the permanent release periods in FY 2024 and FY 2032. Revenue Recognition * Cash Fiscal Years 2022 – 2024 $239 $261 Fiscal Years 2025 – 2031 $138 $240 Fiscal Year 2032 $124 $0 $262 $240 Total $501 $501 ($ in Millions) Overview 10-Year Asset Management Agreements (AMAs) with Investment Grade Utility Entered into AMAs to release certain natural gas transportation contracts of Energy Services for aggregate cash proceeds of approximately $500 million payable over 10 years (~$260 million through FY2024; $240 million after FY2024) Counterparty will provide certain asset management services and Energy Services may deliver natural gas to the investment grade utility First payment of $86.8 million received by Energy Services on October 29, 2021 De- Risking De-risks Energy Services business by securing 10 years of contracted cash payments with minimal counterparty credit risk. The counterparty is rated BBB+/Stable by S&P. There is NO price or volumetric risk involved in the transaction, and no other potential variability in the cash flow except in case of default If the counterparty defaults for any reason before capacity has been permanently released, assets revert back to Energy Services Financial Impacts Cash proceeds provide flexibility to reinvest in core businesses, reduce future debt issuances and support shareholder distributions Strengthen balance sheet and credit metrics Revenue Recognition* Revenue recognition for FY2022 is expected to be $53.1 million, of which $22.1 million was recognized in fiscal Q1 2022, $10.3M recognized in fiscal Q2 2022, and $10.3M recognized in fiscal Q3 2022 NJR received this year’s cash payment of $86.8 million in fiscal Q1 2022 20
114 263 365 395 465 145 135 36 7 FY 2026 FY 2025 FY 2024 FY 2023 FY 2022 Thousands Hedged Unhedged 21 NJR CEV – SREC Hedging by Fiscal Year As of July 11, 2022 Percent Hedged Average Price Current Price (FY) 100% $203 $235 Percent Hedged Average Price Current Price (FY) 98% $201 $223 Percent Hedged Average Price Current Price (FY) 91% $193 $208 Percent Hedged Average Price Current Price (FY) 66% $190 $191 Percent Hedged Average Price Current Price (EY) 44% $173 $174
Shareholder and Contact Information 1415 Wyckoff Road Wall, NJ 07719 (732) 938-1000 www.njresources.com Corporate Headquarters Contact Information The Transfer Agent and Registrar for the company’s common stock is Broadridge Corporate Issuer Solutions, Inc. (Broadridge). Shareowners with questions about account activity should contact Broadridge investor relations representatives between 9 a.m. and 6 p.m. ET, Monday through Friday, by calling toll-free 800-817-3955. General written inquiries and address changes may be sent to: Broadridge Corporate Issuer Solutions P.O. Box 1342, Brentwood, NY 11717 or For certified and overnight delivery: Broadridge Corporate Issuer Solutions, ATTN: IWS 1155 Long Island Avenue, Edgewood, NY 11717 Shareowners can view their account information online at shareholder.broadridge.com/NJR. Stock Transfer Agent and Registrar Adam Prior – Director, Investor Relations 732-938-1145 aprior@njresources.com Dennis Puma – Director, Investor Relations 732-938-1229 dpuma@njresources.com Last Four Dividends Paid (Quarterly Frequency) Ex-Dividend Date Record Date Payable Date Amount per share 6/14/2022 6/15/2022 7/1/2022 $0.3625 3/15/2022 3/16/2022 4/1/2022 $0.3625 12/14/2021 12/15/2021 1/3/2022 $0.3625 9/17/2021 9/20/2021 10/1/2021 $0.3625 Online Information Website: www.njresources.com Investor Relations: LINK Follow us: 22