Free signup for more
- Track your favorite companies
- Receive email alerts for new filings
- Personalized dashboard of news and more
- Access all data and search results
Filing tables
Filing exhibits
Related financial report
NJR similar filings
- 9 Aug 24 Entry into a Material Definitive Agreement
- 6 Aug 24 New Jersey Resources Reports Fiscal 2024 Third-quarter Results
- 15 Jul 24 Amendments to Articles of Incorporation or Bylaws
- 1 Jul 24 Entry into a Material Definitive Agreement
- 7 May 24 New Jersey Resources Reports Fiscal 2024 Second-quarter Results
Filing view
External links
Exhibit 99.2
Fiscal 2024 Third Quarter and Year-to-Date Financial Results August 2024 Investor Presentation
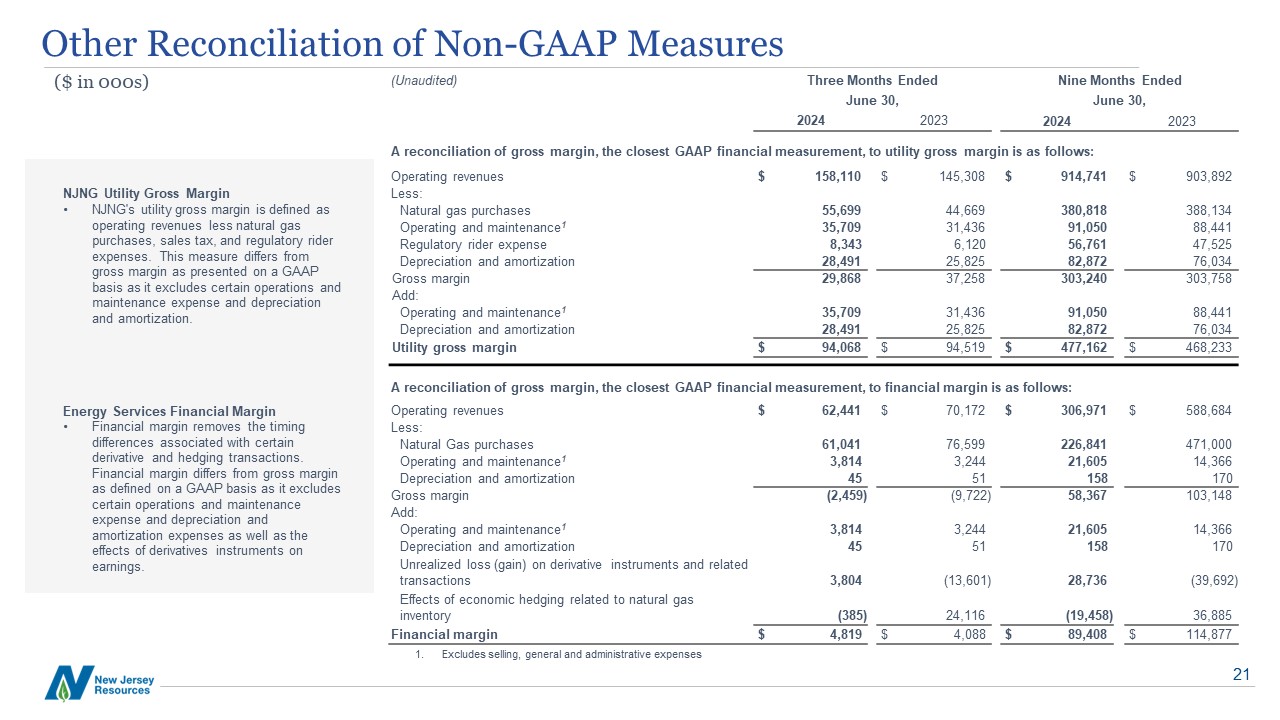
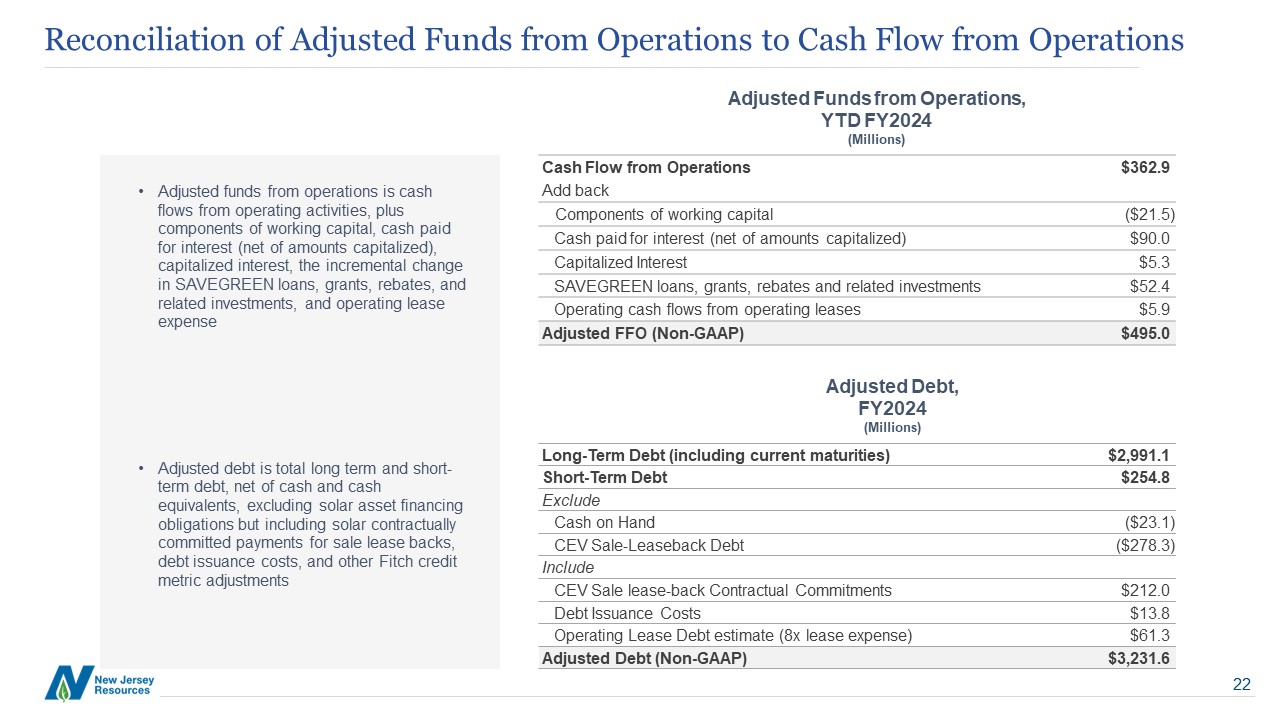
Forward-Looking Statements and Non-GAAP Measures Forward-Looking Statements This presentation contains forward-looking statements within the meaning of Section 27A of the Securities Act of 1933, as amended, Section 21E of the Securities Exchange Act of 1934, as amended, and the Private Securities Litigation Reform Act of 1995. NJR cautions readers that the assumptions forming the basis for forward-looking statements include many factors that are beyond NJR’s ability to control or estimate precisely, such as estimates of future market conditions and the behavior of other market participants. Words such as “anticipates,” “estimates,” “expects,” “projects,” “may,” “will,” “intends,” “plans,” “believes,” “should” and similar expressions may identify forward-looking statements and such forward-looking statements are made based upon management’s current expectations, assumptions and beliefs as of this date concerning future developments and their potential effect upon NJR. There can be no assurance that future developments will be in accordance with management’s expectations, assumptions and beliefs or that the effect of future developments on NJR will be those anticipated by management. Forward-looking statements in this earnings presentation include, but are not limited to, certain statements regarding NJR’s NFEPS guidance for fiscal 2024, including NFEPS guidance by Segment and EPS, long term growth targets and guidance range, long term annual growth projections and targets, Capital Plan expectations, projections of dividend and financing activities, customer growth at NJNG, future NJR and NJNG capital expenditures, potential CEV capital projects, project pipeline (under construction, contract or exclusivity) through Fiscal 2028, total expected shareholder return projections, dividend growth, CEV revenue and service projections, our debt repayment schedule, contributions from Leaf River, Steckman Ridge and Adelphia Gateway, SREC Hedging strategies and Asset Management Agreements, the outcome and timing of Base Rate Cases with the BPU, emissions reduction strategies and clean energy goals, environmental social and governance efforts, rising interest rates, and other legal and regulatory expectations. Additional information and factors that could cause actual results to differ materially from NJR’s expectations are contained in NJR’s filings with the SEC, including NJR’s Annual Reports on Form 10-K and subsequent Quarterly Reports on Form 10-Q, recent Current Reports on Form 8-K, and other SEC filings, which are available at the SEC’s web site, http://www.sec.gov. Information included in this presentation is representative as of today only and while NJR periodically reassesses material trends and uncertainties affecting NJR's results of operations and financial condition in connection with its preparation of management's discussion and analysis of results of operations and financial condition contained in its Quarterly and Annual Reports filed with the SEC, NJR does not, by including this statement, assume any obligation to review or revise any particular forward-looking statement referenced herein in light of future events. Non-GAAP Measures Non-GAAP Measures This presentation includes the non-GAAP financial measures NFE/net financial loss, NFE per basic share, financial margin, utility gross margin, adjusted funds from operations and adjusted debt. A reconciliation of these non-GAAP financial measures to the most directly comparable financial measures calculated and reported in accordance with GAAP can be found below. As an indicator of NJR’s operating performance, these measures should not be considered an alternative to, or more meaningful than, net income or operating revenues as determined in accordance with GAAP. This information has been provided pursuant to the requirements of SEC Regulation G. NFE and financial margin exclude unrealized gains or losses on derivative instruments related to NJR’s unregulated subsidiaries and certain realized gains and losses on derivative instruments related to natural gas that has been placed into storage at Energy Services, net of applicable tax adjustments as described below. Financial margin also differs from gross margin as defined on a GAAP basis as it excludes certain operations and maintenance expense and depreciation and amortization as well as the effects of derivatives as discussed above. Volatility associated with the change in value of these financial instruments and physical commodity reported on the income statement in the current period. In order to manage its business, NJR views its results without the impacts of the unrealized gains and losses, and certain realized gains and losses, caused by changes in value of these financial instruments and physical commodity contracts prior to the completion of the planned transaction because it shows changes in value currently instead of when the planned transaction ultimately is settled. An annual estimated effective tax rate is calculated for NFE purposes and any necessary quarterly tax adjustment is applied to NJR Energy Services Company. NJNG’s utility gross margin is defined as operating revenues less natural gas purchases, sales tax, and regulatory rider expense. This measure differs from gross margin as presented on a GAAP basis as it excludes certain operations and maintenance expense and depreciation and amortization. Utility gross margin may also not be comparable to the definition of gross margin used by others in the natural gas distribution business and other industries. Management believes that utility gross margin provides a meaningful basis for evaluating utility operations since natural gas costs, sales tax and regulatory rider expenses are included in operating revenues and passed through to customers and, therefore, have no effect on utility gross margin. Adjusted funds from operations is cash flows from operating activities, plus components of working capital, cash paid for interest (net of amounts capitalized), capitalized interest, the incremental change in SAVEGREEN loans, grants, rebates, and related investments, and operating lease expense. Adjusted debt is total long-term and short-term debt, net of cash and cash equivalents, excluding solar asset financing obligations but including solar contractually committed payments for sale lease-backs, debt issuance costs, and other Fitch credit metric adjustments. Management uses NFE/net financial loss, utility gross margin, financial margin, adjusted funds from operations and adjusted debt, as supplemental measures to other GAAP results to provide a more complete understanding of the Company’s performance. Management believes these non-GAAP measures are more reflective of the Company’s business model, provide transparency to investors and enable period-to-period comparability of financial performance. In providing NFE guidance, management is aware that there could be differences between reported GAAP earnings and NFE/net financial loss due to matters such as, but not limited to, the positions of our energy-related derivatives. Management is not able to reasonably estimate the aggregate impact or significance of these items on reported earnings and therefore is not able to provide a reconciliation to the corresponding GAAP equivalent for its operating earnings guidance without unreasonable efforts. In addition, in making forecasts relating to S&T’s Adjusted EBITDA and adjusted funds from operations and adjusted debt, management is aware that there could be differences between reported GAAP earnings, cash flows from operations and total long-term and short-term debt due to matters such as, but not limited to, the unpredictability and variability of future earnings, working capital and cash positions. Management is not able to reasonably estimate the aggregate impact or significance of these items on reported GAAP measures and therefore is not able to provide a reconciliation to the corresponding GAAP equivalent for such forecasts without unreasonable efforts. NFE/net financial loss, utility gross margin and financial margin are discussed more fully in Item 7 of our Report on Form 10-K and, we have provided presentations of the most directly comparable GAAP financial measure and a reconciliation of our non-GAAP financial measures, NFE/net financial loss, utility gross margin, financial margin, adjusted funds from operations and adjusted debt, to the most directly comparable GAAP financial measures, in the appendix to this presentation. This information has been provided pursuant to the requirements of SEC Regulation G.
Contents Fiscal 2024 Third Quarter and Year-to-Date Conference Call 4 Agenda 5 Fiscal 2024 Third Quarter and Year-to-Date Highlights 6 Re-affirming Fiscal 2024 NFEPS Guidance of $2.85 to $3.00 7 NFEPS Guidance by Segment 8 New Jersey Natural Gas 9 NJNG Rate Case Update 10 Clean Energy Ventures (CEV): Pipeline of Investment Opportunities 11 Storage and Transportation (S&T): Organic Growth Initiatives 12 Financial Review 13 Review of Fiscal 2024 Third Quarter and Year-to-Date NFE Changes 14 Capital Plan 15 Projected Cash Flows 16 Investment Grade Profile 17 Debt Repayment Schedule 18 Growth Strategy and Key Highlights Appendix: Financial Statements and Additional Information – 19 20 Reconciliation of NFE and NFEPS to Net Income 21 Other Reconciliation of Non-GAAP Measures 22 Reconciliation of Adjusted Funds from Operations to Cash Flow from Operations 23 Fiscal 2024 Third Quarter and Year-to-Date NFE and NFEPS by Business Unit 24 CEV: SREC Hedging Strategy Stabilizes Revenue 25 Capital Plan Table 26 NJR: Business Portfolio 27 NJNG: Supportive Regulatory Construct 28 CEV: Overview 29 Energy Services (ES): Overview 30 Dividend Growth: Committed to Building Shareholder Value 31 Environmental, Social and Governance Efforts 32 Shareholder and Contact Information
1 FY 2024 Q3 and YTD Highlights Steve Westhoven | President and CEO 2 Financial Highlights Roberto Bel | SVP and CFO 3 Q&A Session FY 2024 Third Quarter Conference Call Agenda 4
Fiscal 2024 Third Quarter and Year-to-Date Highlights Executing on our Strategic Plan to Drive Continued, Organic Growth NJNG CEV S&T Energy Services $(0.09) Q3 FY 2024 NFEPS1 On January 31st, NJNG filed a base rate case, which continues to progress as expected In June, SAVEGREEN reached a milestone - serving its 100,000th customer since its inception in 2009 Higher utility gross margin YTD 2024 Increased capacity by ~8MW in fiscal 2024 YTD Project pipeline of ~873MW NFEPS contribution in line with expectations Completed open season at Leaf River for additional working capacity to be added over the next year Derived significant value from pipeline capacity during brief periods of strong demand in an otherwise warmer than historical winter period A reconciliation from NFE to net income can be found in the Appendix. $2.05 YTD FY 2024 NFEPS1 Third Quarter NFEPS YTD NFEPS
Re-Affirming Fiscal 2024 NFEPS Guidance of $2.85 to $3.00 Net Financial Earnings per Share NFEPS long-term annual growth projections are based on the midpoint of the $2.20 - $2.30 initial guidance range for fiscal 2022, provided on February 1, 2021. Initial fiscal 2023 NFEPS guidance was $2.42 - $2.52; initial fiscal 2024 NFEPS guidance was $2.70 - $2.85 Guidance Raised by $0.15 in February 2024; Represents 18.4% Increase from Midpoint of FY 2023 Initial Guidance Range Guidance Range $2.85 - $3.00 7-9% LONG-TERM ANNUAL GROWTH1 $2.50 $2.70 Outperformance Above Long-Term Growth Rate and Initial Guidance Range1 $2.20 - $2.301 $2.42 - $2.521 Strong energy prices(NJNG, CEV, ES) Winter Storm Elliot January 2024 weather event Initial Guidance Range1 Represents the midpoint of NJR's Long-Term Growth Rate $2.70 - $2.851
NFEPS Guidance by Segment Energy Services to Represent a Larger Portion of NFEPS Guidance in 2024; Long-term NJNG Remains the Largest Contributor to NFEPS Fiscal 2024 NFEPS Guidance by Segment New Jersey Natural Gas 43% - 46% Energy Services 40% - 43% Home Services 0% - 1% S&T 3% - 5% CEV 11% - 14% Long-term Expected NFEPS Composition New Jersey Natural Gas 60% - 70% Energy Services 6% - 10% Home Services 0% - 1% S&T 5% - 10% CEV 20% - 25% Energy Services will represent a higher than normal % of NFEPS due to contributions from the AMAs for fiscal year 2024 as well as outperformance in January 2024 NJNG and CEV projected to make up the predominate portion of NJR’s total business mix
New Jersey Natural Gas (NJNG) Strong Trend of Favorable Customer Growth Total change in PP&E (cash spent, capex accrued and AFUDC). Includes SAVEGREEN investments, which for GAAP purposes are included as part of cash flows from operations. Facilities included in “Other”. The sum of actual amounts may not equal due to rounding. ~43% of capital expenditures earning a near real-time return NJNG Customer Growth (in thousands) Fiscal 2024 YTD Capital Expenditures1,2,3 ~$345M Monmouth Mall Redevelopment to Construct over 1,000 Multi-family Residential Units
NJNG: Rate Case Update Continued Progress Link: White Paper with Additional Details on Rate Case Filing Requested an increase to base rates of $219.6 million Proposed rate base of $3.4 billion As illustrated in the timeline, a rate case by statute in New Jersey is a nine-month process from the filing date to completion; however, 10-12 months is not uncommon. Administrative Law Judge (ALJ) and New Jersey Board of Public Utilities (BPU). Expected Base Rate Case Procedural Schedule January March May June - September August ALJ & BPU Staff2, Company, Rate Counsel Agree on Procedural Schedule Filed Base Rate Case with the BPU2 Filing of 9+3 Update Expected Filing of 12+0 Update Settlement Discussions
Clean Energy Ventures (CEV): Pipeline of Investment Opportunities CEV owns and operates solar projects with approximately 477MW of capacity Total ~1.3 GW MWs Pipeline of ~873MW including projects under construction, contract, or exclusivity ~477MW of projects in-service ~50% of pipeline located in NJ ~50% located outside of NJ New In-Service in Fiscal 2024 ~8MW
Storage and Transportation (S&T): Organic Growth Initiatives Leaf River (storage), Steckman Ridge (storage), and Adelphia Gateway (transportation) 32.2 mmdth high deliverability salt cavern storage facility in southeastern Mississippi Acquired October 2019 100% owner & operator Serving Gulf Coast/Southeast the fastest growing natural gas market in North America with a growing reliance on regional supply imports 12.6 mmdth reservoir storage facility in southern PA Placed in service April 2009 50% ownership interest Serving the Northeast Region with a high dependence on storage and increasingly constrained pipeline capacity 0.9 mmdth/d interstate pipeline from NE PA to greater Philadelphia area Acquired January 2020 / Placed in-service September 2022 100% owner & operator Serving the Northeast region, where the current pipeline grid is constrained Maximizing capabilities at existing assets as pipeline and storage constraints continue to highlight the benefit of storage and transportation assets Leaf River Energy Center Capacity Recovery Project S&T to expand leaching plant facilities Salt cavern leaching is a process used to regain capacity lost to salt buildup over time Completed open season for additional working capacity as part of this expansion
12 12 Financial Review Roberto Bel SVP and Chief Financial Officer
Review of Fiscal 2024 Third Quarter and Year-to-Date Results ($ in Millions) A reconciliation of these non-GAAP measures can be found in the Appendix. The sum of actual amounts may not equal to total due to rounding. Fiscal 3Q23 – Consolidated NFE ($ in millions) $ 9.7 NJNG $ (7.0) Utility Gross Margin1 $ (0.5) O&M $ (6.2) Depreciation & Amortization (D&A) $ (2.7) Interest expense, AFUDC, Income Tax $ 2.4 Clean Energy Ventures $ (14.0) Revenue $ 1.5 D&A and Interest Expense $ 0.5 Other (including ITC recognition) $ (16.0) Storage & Transportation $ 1.8 Revenue $ 2.3 D&A and Interest Expense $ 0.5 O&M, AFUDC & Other $ (1.0) Energy Services $ (0.6) Financial Margin1 $ 0.7 Interest Expense, Income Tax and Other $ (1.3) Home Services and Other $ 1.3 Fiscal 3Q24 – Consolidated NFE ($ in millions)2 $ (8.9) YTD Fiscal 2023 – Consolidated NFE ($ in millions) $ 232.3 NJNG $ (3.9) Utility Gross Margin1 $ 8.9 O&M $ (12.3) Depreciation & Amortization (D&A) $ (6.8) Interest expense, AFUDC, Income Tax $ 6.3 Clean Energy Ventures $ 3.9 Revenue $ 18.9 D&A and Interest Expense $ (2.7) Other (including ITC recognition) $ (12.3) Storage & Transportation $ (1.3) Revenue $ 1.5 D&A and Interest Expense $ 1.1 O&M, AFUDC & Other $ (3.9) Energy Services $ (28.8) Financial Margin1 $ (25.5) Interest Expense, Income Tax and Other $ (3.3) Home Services and Other $ (0.1) YTD Fiscal 2024 – Consolidated NFE ($ in millions)2 $ 202.1
Capital Plan1,2 Includes SAVEGREEN Investments. Total change in PP&E (cash spent, capex accrued and AFUDC). For GAAP purposes, SAVEGREEN investments are included as part of cash flows from operations. The sum of actual amounts may not equal due to rounding. $622 $596 $639 - $723 $578 - $742 ($ in Millions) Capital plan supports long-term NFEPS growth targets of 7-9% $455 - $490 $410 - $462 $140 - $175 $44 - $58 $8 - $16 $160 - $264 Actuals Estimates
FY2023A YTD FY2024A FY2024E FY2025E Cash Flow from Operations $479 $363 $420 - $450 $450 - $490 Uses of Funds Capital Expenditures2 $539 $393 $490 - $580 $495 - $675 Dividends3 $151 $123 $161 - $165 $174 - $178 Total Uses of Funds $690 $516 $651 - $745 $669 - $853 Financing Activities Common Stock Proceeds – DRIP $58 $58 $64 - $66 $17 - $19 Debt Proceeds /Other $153 $95 $167 - $229 $202 - $344 Total Financing Activities $211 $153 $231 - $295 $219 - $363 Projected Cash Flows1 ($ in Millions) The sum of actual amounts may not equal due to rounding. Excludes accrual for AFUDC and SAVEGREEN investments (for GAAP purposes, SAVEGREEN investments are included in Cash Flow from Operations). Dividend growth for fiscal 2023 and fiscal 2024 are based upon the midpoint of forecasted 7-9% growth rate. Actuals Estimates
Investment Grade Profile 1. Internal estimates based on Fitch Ratings methodology. Ratio represents inverse of FFO-adjusted leverage ratio. A reconciliation from adjusted funds from operations to cash flows from operating activities and adjusted debt to long-term and short-term debt can be found in the Appendix. Adjusted funds from operations is cash flows from operating activities, plus components of working capital, cash paid for interest (net of amounts capitalized), capitalized interest, the incremental change in SAVEGREEN loans, grants, rebates, and related investments, and operating lease expense. Adjusted debt is total long-term and short-term debt, net of cash and cash equivalents, excluding solar asset financing obligations but including solar contractually committed payments for sale lease-backs, debt issuance costs, and other Fitch credit metric adjustments. NJR Adjusted FFO / Adjusted Debt1 NJNG (Secured Rating) NJR (Unsecured Rating) NAIC NAIC-1.E NAIC-2.A Moody's A1 (Stable) Fitch A+ (Stable) Current Credit Ratings Strong Credit Ratings Supported by Stable Cash Flows 19.0% 17% - 18% Strong Cash Flows with No Block Equity Needs Actuals Estimates
Debt Repayment Schedule No significant maturity towers in any particular year Term debt only (excludes short-term debt of $254.8 million, capital leases of $33.8 million and solar financing obligations of $278.3 million). Term Debt1 Maturity Schedule as of June 30, 2024 / $ in Millions, unless otherwise noted No Debt Maturities Remaining in FY2024 Percent of NJR Holding Company Term Debt Maturing in the Next Three Years: <18% $1.4B NJR Unsecured Senior Notes FY Maturity Principal 3.48% 2025 $100,000 3.54% 2026 $100,000 4.38% 2027 $110,000 3.96% 2028 $100,000 3.29% 2029 $150,000 3.50% 2030 $130,000 3.13% 2031 $120,000 3.60% 2032 $130,000 3.25% 2033 $80,000 6.14% 2033 $50,000 3.64% 2034 $50,000 Total NJR LT Debt $1,120,000 NJNG First Mortgage Bonds FY Maturity Principal 2.82% 2025 $50,000 3.15% 2028 $50,000 5.56% 2033 $50,000 4.37% 2037 $50,000 3.38% 2038 $10,500 2.75% 2039 $9,545 3.00% 2041 $46,500 3.50% 2042 $10,300 3.00% 2043 $41,000 4.61% 2044 $55,000 3.66% 2045 $100,000 3.63% 2046 $125,000 4.01% 2048 $125,000 3.76% 2049 $100,000 3.13% 2050 $50,000 3.13% 2050 $50,000 2.87% 2050 $25,000 2.97% 2052 $50,000 4.71% 2052 $50,000 5.47% 2053 $125,000 5.85% 2054 $50,000 5.82% 2054 $125,000 2.45% 2059 $15,000 3.86% 2059 $85,000 3.33% 2060 $25,000 2.97% 2060 $50,000 3.07% 2062 $50,000 Total NJNG LT Debt $1,572,845 Substantial liquidity at both NJNG and NJR - $900M of credit facilities available through FY2027
Growth Strategy and Key Highlights 7% - 9% Long-term expected NFEPS and Dividend Growth Highest in peer group1 Maximize the value of existing assets through organic growth opportunities Prudent capital allocation with a defined capital plan of between $1.2 - $1.5 Billion in the next 2 years Use diversified strategy to deliver outsized returns for shareholders 11 - 13% Expected Shareholder Return2 Peer group includes: ATO, AVA, BKH, CMS, CNP, CPK, MDU, NFG, NI, NWE, NWN, OGS, SWX, UGI, UTL. Expected shareholder return includes projected NFEPS long-term growth rate of 7 – 9% in addition to an annualized dividend yield of 3.6%, based on dividend per share of $1.68 and closing share price of $46.80 on August 2, 2024.
Appendix: Financial Statements and Additional Information 19 Fiscal 2024 Third Quarter and Year-to-Date Conference Call 20 Reconciliation of NFE and NFEPS to Net Income 21 Other Reconciliation of Non-GAAP Measures 22 Reconciliation of Adjusted Funds from Operations to Cash Flow from Operations 23 Fiscal 2024 Third Quarter and Year-to-Date NFE and NFEPS by Business Unit 24 CEV: SREC Hedging Strategy Stabilizes Revenue 25 Capital Plan Table 26 NJR: Business Portfolio 27 NJNG: Supportive Regulatory Construct 28 CEV: Overview 29 Energy Services (ES): Overview 30 Dividend Growth: Committed to Building Shareholder Value 31 Environmental, Social and Governance Efforts 32 Shareholder and Contact Information
Reconciliation of NFE and NFEPS to Net Income ($ in 000s) NFE is a measure of earnings based on the elimination of timing differences to effectively match the earnings effects of the economic hedges with the physical sale of natural gas, Solar Renewable Energy Certificates (SRECs) and foreign currency contracts. Consequently, to reconcile net income and NFE, current-period unrealized gains and losses on the derivatives are excluded from NFE as a reconciling item. Realized derivative gains and losses are also included in current-period net income. However, NFE includes only realized gains and losses related to natural gas sold out of inventory, effectively matching the full earnings effects of the derivatives with realized margins on physical natural gas flows. NFE also excludes certain transactions associated with equity method investments, including impairment charges, which are non-cash charges, and return of capital in excess of the carrying value of our investment. These are not indicative of the Company's performance for its ongoing operations. Included in the tax effects are current and deferred income tax expense corresponding with the components of NFE. NFE eliminates the impact of volatility to GAAP earnings associated with unrealized gains and losses on derivative instruments in the current period (Unaudited) Three Months Ended June 30, Nine Months Ended June 30, 2024 2023 2024 2023 NEW JERSEY RESOURCES A reconciliation of net income, the closest GAAP financial measure, to net financial earnings is as follows: Net (loss) income $ (11,574) $ 1,532 $ 198,649 $ 227,700 Add: Unrealized loss (gain) on derivative instruments and related transactions 3,803 (12,970) 23,860 (30,502) Tax effect (903) 3,083 (5,670) 7,250 Effects of economic hedging related to natural gas inventory (385) 24,116 (19,458) 36,885 Tax effect 91 (5,731) 4,624 (8,766) Gain on equity method investment — (100) — (300) Tax effect — 24 — 74 NFE tax adjustment 69 (284) 116 (77) Net financial (loss) earnings $ (8,899) $ 9,670 $ 202,121 $ 232,264 Weighted Average Shares Outstanding Basic 98,983 97,168 98,409 96,849 Diluted 98,983 97,886 99,213 97,538 A reconciliation of basic earnings per share, the closest GAAP financial measure, to basic net financial earnings per share is as follows: Basic (loss) earnings per share $ (0.12) $ 0.02 $ 2.02 $ 2.35 Add: Unrealized loss (gain) on derivative instruments and related transactions 0.04 (0.14) 0.24 (0.31) Tax effect (0.01) 0.03 (0.06) 0.07 Effects of economic hedging related to natural gas inventory — 0.25 (0.20) 0.38 Tax effect — (0.06) 0.05 (0.09) Basic net financial (loss) earnings per share $ (0.09) $ 0.10 $ 2.05 $ 2.40
Other Reconciliation of Non-GAAP Measures NJNG Utility Gross Margin NJNG's utility gross margin is defined as operating revenues less natural gas purchases, sales tax, and regulatory rider expenses. This measure differs from gross margin as presented on a GAAP basis as it excludes certain operations and maintenance expense and depreciation and amortization. Energy Services Financial Margin Financial margin removes the timing differences associated with certain derivative and hedging transactions. Financial margin differs from gross margin as defined on a GAAP basis as it excludes certain operations and maintenance expense and depreciation and amortization expenses as well as the effects of derivatives instruments on earnings. (Unaudited) Three Months Ended Nine Months Ended June 30, June 30, 2024 2023 2024 2023 A reconciliation of gross margin, the closest GAAP financial measurement, to utility gross margin is as follows: Operating revenues $ 158,110 $ 145,308 $ 914,741 $ 903,892 Less: Natural gas purchases 55,699 44,669 380,818 388,134 Operating and maintenance1 35,709 31,436 91,050 88,441 Regulatory rider expense 8,343 6,120 56,761 47,525 Depreciation and amortization 28,491 25,825 82,872 76,034 Gross margin 29,868 37,258 303,240 303,758 Add: Operating and maintenance1 35,709 31,436 91,050 88,441 Depreciation and amortization 28,491 25,825 82,872 76,034 Utility gross margin $ 94,068 $ 94,519 $ 477,162 $ 468,233 A reconciliation of gross margin, the closest GAAP financial measurement, to financial margin is as follows: Operating revenues $ 62,441 $ 70,172 $ 306,971 $ 588,684 Less: Natural Gas purchases 61,041 76,599 226,841 471,000 Operating and maintenance1 3,814 3,244 21,605 14,366 Depreciation and amortization 45 51 158 170 Gross margin (2,459) (9,722) 58,367 103,148 Add: Operating and maintenance1 3,814 3,244 21,605 14,366 Depreciation and amortization 45 51 158 170 Unrealized loss (gain) on derivative instruments and related transactions 3,804 (13,601) 28,736 (39,692) Effects of economic hedging related to natural gas inventory (385) 24,116 (19,458) 36,885 Financial margin $ 4,819 $ 4,088 $ 89,408 $ 114,877 Excludes selling, general and administrative expenses ($ in 000s)
Reconciliation of Adjusted Funds from Operations to Cash Flow from Operations Adjusted funds from operations is cash flows from operating activities, plus components of working capital, cash paid for interest (net of amounts capitalized), capitalized interest, the incremental change in SAVEGREEN loans, grants, rebates, and related investments, and operating lease expense Adjusted debt is total long term and short-term debt, net of cash and cash equivalents, excluding solar asset financing obligations but including solar contractually committed payments for sale lease backs, debt issuance costs, and other Fitch credit metric adjustments Cash Flow from Operations $362.9 Add back Components of working capital ($21.5) Cash paid for interest (net of amounts capitalized) $90.0 Capitalized Interest $5.3 SAVEGREEN loans, grants, rebates and related investments $52.4 Operating cash flows from operating leases $5.9 Adjusted FFO (Non-GAAP) $495.0 Long-Term Debt (including current maturities) $2,991.1 Short-Term Debt $254.8 Exclude Cash on Hand ($23.1) CEV Sale-Leaseback Debt ($278.3) Include CEV Sale lease-back Contractual Commitments $212.0 Debt Issuance Costs $13.8 Operating Lease Debt estimate (8x lease expense) $61.3 Adjusted Debt (Non-GAAP) $3,231.6 Adjusted Debt, FY2024 (Millions) Adjusted Funds from Operations, YTD FY2024 (Millions)
Fiscal 2024 Q3 and Year-to-Date NFE and NFEPS by Business Unit1 ($ in 000s) (Thousands) Three Months Ended June 30, Nine Months Ended June 30, 2024 2023 Change 2024 2023 Change New Jersey Natural Gas $(6,139) $891 $(7,030) $152,400 $156,252 $(3,852) Clean Energy Ventures $(6,714) $7,267 $(13,981) $(1,808) $(5,694) $3,886 Storage and Transportation $4,140 $2,358 $1,782 $9,761 $11,051 $(1,290) Energy Services $(2,244) $(1,604) $(640) $43,231 $72,054 $(28,823) Home Services and Other $2,058 $758 $1,300 $(1,463) $(1,399) $(64) Total $(8,899) $9,670 $(18,569) $202,121 $232,264 $(30,143) (Thousands) Three Months Ended June 30, Nine Months Ended June 30, 2024 2023 Change 2024 2023 Change New Jersey Natural Gas $(0.07) $0.01 $(0.08) $1.55 $1.61 $(0.06) Clean Energy Ventures $(0.07) $0.07 $(0.14) $(0.02) $(0.06) $0.04 Storage and Transportation $0.04 $0.03 $0.01 $0.10 $0.12 $(0.02) Energy Services $(0.02) $(0.02) $— $0.44 $0.74 $(0.30) Home Services and Other $0.03 $0.01 $0.02 $(0.02) $(0.01) $(0.01) Total $(0.09) $0.10 $(0.19) $2.05 $2.40 $(0.35) Net Financial Earnings (NFE) Net Financial Earnings per Share (NFEPS) The sum of actual amounts may not equal due to rounding
CEV: SREC Hedging Strategy Stabilizes Revenue Based on Energy Year1, as of June 30, 2024 Energy Years run from June 1 of the prior year to May 31 of the respective year; for example, Energy Year 2025 began on June 1, 2024 and ends on May 31, 2025. Based on Fiscal Year, as of June 30, 2024 75% hedged through Fiscal Year 2025 80% hedged through Fiscal Year 2026 88% hedged through Energy Year 2026 Percent Hedged Average Price Current Price (EY) 88% $190 $203 88% $179 $192 51% $165 $181 39% $154 $165 Percent Hedged Average Price Current Price (FY) 75% $190 $199 80% $178 $188 62% $165 $176 30% $150 $160
Capital Plan Table1,2 ($ in Millions) Total change in PP&E (cash spent, capex accrued and AFUDC). For GAAP purposes, SAVEGREEN investments are included as part of cash flows from operations. The sum of actual amounts may not equal due to rounding. FY2023A YTD FY2024A FY2024E FY2025E Near Real Time Return? New Jersey Natural Gas New Customer $77 $73 $97 - $103 $85 - $90 Yes IIP $43 $23 $28 - $32 $26 - $30 Yes SAVEGREEN $60 $52 $58 - $62 $48 - $52 Yes IT $61 $49 $60 - $65 $20 - $25 System Integrity $126 $113 $153 - $157 $150 - $165 Cost of Removal $42 $30 $36 - $40 $36 - $40 Other $45 $5 $23 - $31 $45 - $60 $454 $345 $455 - $490 $410 - $462 Clean Energy Ventures $110 $70 $140 - $175 $160 - $264 Storage and Transportation Adelphia Gateway $19 $5 $8 - $12 $4 - $8 Leaf River $12 $28 $36 - $46 $4 - $8 $31 $32 $44 - $58 $8 - $16 Total $596 $447 $639 - $723 $578 - $742 Actuals Estimates
NJR: Business Portfolio Natural Gas and Renewable Fuel Distribution; Solar Investments, Wholesale Energy Markets; Storage & Transportation Infrastructure; Retail Operations Operates and maintains Natural Gas transportation and distribution infrastructure serving approximately 582,000 customers in New Jersey New Jersey Natural Gas (NJNG) Clean Energy Ventures (CEV) Storage and Transportation (S&T) Energy Services (ES) New Jersey Resources Home Services (NJRHS) CEV develops, invests in, owns and operates energy projects that generate clean power, provide low carbon energy solutions and help our customers save energy and money in a sustainable way Invests in, owns and operates midstream assets including natural gas pipeline and storage facilities. Our companies provide transportation and storage services to a broad range of customers in the natural gas market Provides unregulated, wholesale natural gas to consumers across the Gulf Coast, Eastern Seaboard, Southwest, Mid-continent and Canada. In addition to energy supply, NJRES provides a full-range of customized energy management services NJR Home Services offers customers home comfort solutions, including equipment sales and installations; solar lease and purchase plans; and a service contract product line, including heating, cooling, water heating, electric and standby generator contracts Demonstrated leadership as a premier energy infrastructure and environmentally-forward thinking company Recognized as a Top 20 Ruud® National Pro Partner™ for 6 Consecutive Years
Launched in 2009, SAVEGREEN™ provides energy efficiency solutions that meet the unique needs and budgets of residential and commercial customers — including low- and moderate income, multifamily, hospitals and municipalities. On December 1, 2023, NJNG filed with the Board of Public Utilities a proposed next generation of SAVEGREEN™ energy-efficiency offerings, its largest filing to date. The proposal will strengthen NJNG’s existing energy-efficiency offerings and provide comprehensive solutions to help participating customers save energy and reduce carbon emissions, while supporting New Jersey’s ambitious climate goals. NJNG: Supportive Regulatory Construct 27 Stable Rate Case Results Rate case results are stable Current ROE of 9.60% with a common equity ratio of 54% Full recovery of plant investments to date Rate cases are settled (generally not litigated) Resolution of cases have been timely Last completed case filed in March 2021 and rates effective on December 1, 2021 Decoupled Rates for majority of customers Volume risk due to weather or energy conservation mitigated through the Conservation Incentive Program (CIP). This decoupling mechanism allows NJNG to earn a fix margin per customer1. NJNG’s natural gas commodity price is a pass-through cost the Basic Gas Supply Service (BGSS) program Minimization of Regulatory Lag Investments in customer growth and Infrastructure Investment Program (IIP) earn real-time recovery or accelerated recovery through annual mechanisms Through the SAVEGREEN program, energy efficiency investments also have an annual cost recovery mechanism that accelerate recovery of investments and returns Margin Sharing Incentives Like other utilities, NJNG contracts for supply and transportation to meet customer needs NJNG’s BPU-approved “BGSS Incentive Programs” allow temporary release of capacity or supply when not needed NJNG shares margin generated with customers (85% for customers/15% for NJNG) BGSS Incentive margin is not counted in NJNG’s ROE calculation for overearning For residential and small commercial customers, which make the vast majority of NJNG’s customers.
CEV: Overview Largest Solar Owner-Operator in New Jersey CEV owns and operates solar projects in New Jersey, Rhode Island, New York, Connecticut, Indiana, and Michigan with approximately 477MW of installed capacity Over $1.2 billion invested in the solar marketplace to date A total of ~70 commercial projects in service ~10,000 residential solar customers in all of NJ’s 21 counties
Energy Services (ES): Overview Managing a Diversified Portfolio of Physical Natural Gas Transportation and Storage Assets to Serve Customers Across North America; Fee-based Revenue through Asset Management Agreements Asset Management Agreements De-risked Energy Services business by securing 10 years of contracted cash payments with minimal counterparty credit risk Long Option Strategy Proven track record of success over 28 years, leveraging natural gas market volatility to drive value Minimal long-term capital commitments and significant cash generation during outperformance years has significantly reduced NJR equity needs NJR expects to recognize the majority of the fiscal 2024 AMA revenues in the fiscal fourth quarter
Dividend Growth: Committed to Building Shareholder Value Strong Track Record of Dividend Growth $1.68 FY 2024 Dividend (up 7.7%) 7.4% DPS CAGR Dividend History Dividends per Share Record Date Payable Date Amount Per Share 6/12/2024 7/01/2024 $0.42 3/13/2024 4/01/2024 $0.42 12/13/2023 1/02/2024 $0.42 9/20/2023 10/02/2023 $0.42* 6/14/2023 7/03/2023 $0.39 3/15/2023 4/03/2023 $0.39 12/14/2022 1/03/2023 $0.39 9/26/2022 10/03/2022 $0.39 6/15/2022 7/01/2022 $0.3625 3/16/2022 4/01/2022 $0.3625 12/15/2021 1/03/2022 $0.3625 9/20/2021 10/01/2021 $0.3625 6/16/2021 7/01/2021 $0.3325 3/17/2021 4/01/2021 0.3325 12/16/2020 1/04/2021 $0.3325 9/22/2020 10/01/2020 $0.3325 Highlighted Rows Reflect Changes in Quarterly Cash Dividends * 7.7% increase in the quarterly dividend rate to $1.68 per share from $1.56 per share
Environmental, Social and Governance Efforts Focus on Definable Accomplishments Social Established $20 million endowment fund for NJR’s charities to support continued community giving long into the future Robust structure and initiatives to promote DEI at NJR including Executive DEI Council to ensure accountability Employee-led Business Resource Groups (BRGs) bring together employees with common background to promote engagement and inclusiveness – 25% of NJR workforce belongs to one or more BRGs Achieved NJ operational emissions reductions over 55% since 2006 with goal of 60% by 2030 and net zero by 2050 One of the largest owner-operators of solar assets in New Jersey, we have invested over $1 billion over the last decade building clean, emissions-free power for homes and businesses Plans to invest up to $2 million over the next five years through its Coastal Climate Initiative, which has expanded to a multi-faceted environmental stewardship program; over $1.1 million of this funding is committed Environmental Our board of directors (Board) has a broad range of skills and industry knowledge, as well as a diversity of perspectives that align with our company’s long-term strategy The Board is responsible for oversight of NJR’s overall strategy, including all Environmental Social and Governance (ESG) issues NJR includes sustainability considerations in the performance metrics of our Commitment to Stakeholders. Actual results of these goals and metrics directly impact the compensation of corporate officers year-to-year and ensure accountability Governance Fiscal 2024 ESG Reports January 2024 15th Consecutive Year of our Sustainability Report February 2024 Diversity, Equity and Inclusion Report Giving Back In June 2024, NJR announced a five-year, $500,000 funding commitment to Monmouth Conservation Foundation (MCF) through the company’s Coastal Climate Initiative (CCI). NJR’s gift will help bring to life MCF’s vision to restore and improve the Scudder Preserve, an important natural habitat in Middletown, Monmouth County, New Jersey, benefitting the local community for generations to come.
The Transfer Agent and Registrar for the company’s common stock is Broadridge Corporate Issuer Solutions, Inc. (Broadridge). Shareowners with questions about account activity should contact Broadridge investor relations representatives between 9 a.m. and 6 p.m. ET, Monday through Friday, by calling toll-free 800-817-3955. General written inquiries and address changes may be sent to: Broadridge Corporate Issuer Solutions P.O. Box 1342, Brentwood, NY 11717 or For certified and overnight delivery: Broadridge Corporate Issuer Solutions, ATTN: IWS 1155 Long Island Avenue, Edgewood, NY 11717 Shareowners can view their account information online at shareholder.broadridge.com/NJR. Website: www.njresources.com Investor Relations: New Jersey Resources Investor Relations Contact Information Adam Prior – Director, Investor Relations 732-938-1145 aprior@njresources.com 1415 Wyckoff Road Wall, NJ 07719 (732) 938-1000 www.njresources.com Corporate Headquarters Online Information Shareholder and Online Information Stock Transfer Agent and Registrar