Exhibit 99.2
Exhibit 99.2
Fiscal 2013 Second Quarter Update
May 2, 2013

Regarding Forward-Looking Statements
Certain statements contained in this presentation are forward-looking statements within the meaning of the Private Securities Litigation Reform Act of 1995. Forward-looking statements can also be identified by the use of forward-looking terminology such as “may,” “will,” “intend,” “expect,” “believe,” or “continue” or comparable terminology and are made based upon management’s current expectations and beliefs as of this date concerning future developments and their potential effect upon New Jersey Resources (NJR or the Company). There can be no assurance that future developments will be in accordance with management’s expectations or that the effect of future developments on the Company will be those anticipated by management. NJR cautions persons reading or hearing this presentation that the assumptions that form the basis for forward-looking statements regarding NJR’s net financial earnings (NFE) for the remainder of fiscal 2013, forecasted contribution of business segments to fiscal 2013 NFE, long-term financial goals of NJR, expected contribution by new customers of New Jersey Natural Gas Company (NJNG) to utility gross margin, expected number of new customers of NJNG, the completion of NJRCEV’s planned solar projects in fiscal 2013, Solar Renewable Energy Certificate (SREC) prices, NJR’s effective tax rate, estimated capital expenditures in fiscal 2013, by NJNG and NJRCEV, expected dividend payout ratio, and the potential impact of post-tropical cyclone Sandy, (commonly referred to as “Superstorm” Sandy).
The factors that could cause actual results to differ materially from NJR’s expectations include, but are not limited to, weather and economic conditions; demographic changes in the NJNG service territory and their effect on NJNG’s customer growth; volatility of natural gas and other commodity prices andtheir impact on NJNG customer usage, NJNG’s Basic Gas Supply Service incentive programs, NJRES’ operations and on the Company’s risk management efforts; changes in rating agency requirements and/or credit ratings and their effect on availability and cost of capital to the Company; the impact of volatility in the credit markets; the ability to comply with debt covenants; the impact to the asset values and resulting higher costs and funding obligations of NJR’s pension and postemployment benefit plans as a result of downturns in the financial markets, a lower discount rate, and impacts associated with the Patient Protection and Affordable Care Act; accounting effects and other risks associated with hedging activities and use of derivatives contracts; commercial and wholesale credit risks, including the availability of creditworthy customers and counterparties and liquidity in the wholesale energy trading market; the ability to obtain governmental approvals and/or financing for the construction, development and operation of certain non-regulated energy investments; risks associated with the management of the Company’s joint ventures and partnerships; risks associated with our investments in renewable energy projects and our investment in an on-shore wind developer, including the availability of regulatory and tax incentives, logistical risks and potential delays related to construction, permitting, regulatory approvals and electric grid interconnection, the availability of viable projects and NJR’s eligibility for federal investment tax credits (ITC), the future market for SRECs and operational risks related to projects in service; timing of qualifying for ITCs due to delays or failures to complete planned solarenergy projects and the resulting effect on our effective tax rate and earnings; the level and rate at which NJNG’s costs and expenses (including those relatedto restoration efforts resulting from Superstorm Sandy) are incurred and the extent to which they are allowed to be recovered from customers through the regulatory process; access to adequate supplies of natural gas and dependence on third-party storage and transportation facilities for natural gas supply; operating risks incidental to handling, storing, transporting and providing customers with natural gas; risks related to our employee workforce, including a work stoppage; the regulatory and pricing policies of federal and state regulatory agencies; the possible expiration of the NJNG Conservation Incentive Program (CIP), the costs of compliance with the proposed regulatory framework for over-the-counter derivatives; the costs of compliance with present and future environmental laws, including potential climate change-related legislation; risks related to changes in accounting standards; the disallowance of recovery of environmental-related expenditures and other regulatory changes; environmental-related and other litigation and other uncertainties; risks related to cyber-attack of failure of information technology systems; and the impact of natural disasters, terrorist activities, and other extreme events on our operations and customers, including any impacts to utility gross margin, and restoration costs resulting from Superstorm Sandy. The aforementioned factors are detailed in the “Risk Factors” sections of our Annual Report on Form 10-K filed on November 28, 2012, as filed with the Securities and Exchange Commission (SEC) and our Quarterly Report on Form 10-Q, to be filed with the SEC on May 3, 2013, each of which is, or will be, available on the SEC’s website at sec.gov. NJR disclaims any obligation to update and revise statements contained in these materials based on new information or otherwise.
2
Disclaimer Regarding Non-GAAP Financial Measures
This presentation includes the non-GAAP measures net financial earnings (losses), financial margin and utility gross margin. As an indicator of the Company’s operating performance, these measures should not be considered an alternative to, or more meaningful than, GAAP measures such as cash flow, net income, operating income or earnings per share. Net financial earnings (losses) and financial margin exclude unrealized gains or losses on derivative instruments related to the Company’s unregulated subsidiaries and certain realized gains and losses on derivative instruments related to natural gas that has been placed into storage at NJRES. Volatility associated with the change in value of these financial and physical commodity contracts is reported in the income statement in the current period. In order to manage its business, NJR views its results without the impacts of the unrealized gains and losses, and certain realized gains and losses, caused by changes in value of these financial instruments and physical commodity contracts prior to the completion of the planned transaction because it shows changes in value currently as opposed to when the planned transaction ultimately is settled. NJNG’s utility gross margin represents the results of revenues less natural gas costs, sales and other taxes and regulatory rider expenses, which are key components of the Company’s operations that move inrelation to each other.
Management uses net financial earnings (NFE), financial margin and utility gross margin as supplemental measures to other GAAP results to provide a more complete understanding of the Company’s performance. Management believes these non-GAAP measures are more reflective of the Company’s business model, provide transparency to investors and enable period-to-period comparability of financial performance. For a full discussion of our non-GAAP financial measures, please see Item 7 of our Annual Report on Form 10-K for the fiscal year ended September 30, 2012, filed on November 28, 2012.
3
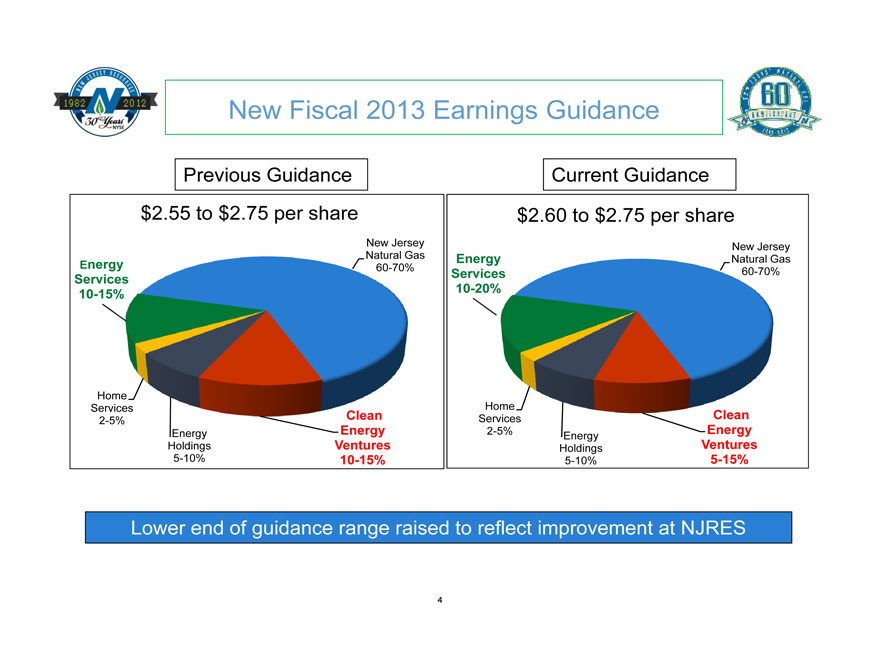
New Fiscal 2013 Earnings Guidance
Previous Guidance
$2.55 to $2.75 per share
Energy Services
10-15%
Home Services
2-5%
Energy Holdings
5-10%
Clean Energy Ventures
10-15%
New Jersey Natural Gas
60-70%
Current Guidance
$2.60 to $2.75 per share
Energy Services
10-20%
Home Services
2-5%
Energy Holdings
5-10%
Clean Energy Ventures 5-15%
New Jersey Natural Gas
60-70%
Lower end of guidance range raised to reflect improvement at NJRES
4
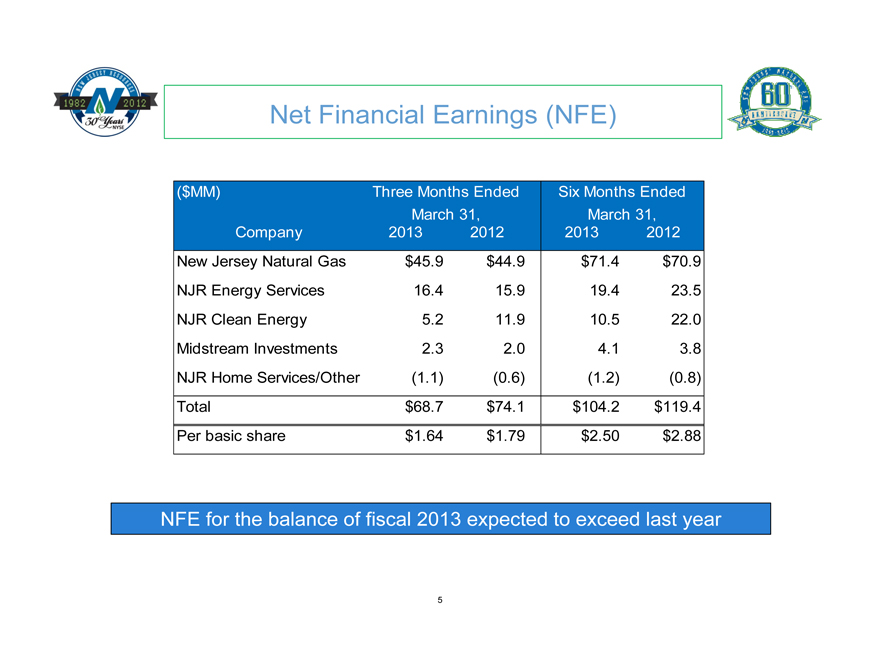
Net Financial Earnings (NFE)
($MM) Three Months Ended Six Months Ended
March 31, March 31,
Company 2013 2012 2013 2012
New Jersey Natural Gas $45.9 $44.9 $71.4 $70.9
NJR Energy Services 16.4 15.9 19.4 23.5
NJR Clean Energy 5.2 11.9 10.5 22.0
Midstream Investments 2.3 2.0 4.1 3.8
NJR Home Services/Other (1.1) (0.6) (1.2) (0.8)
Total $68.7 $74.1 $104.2 $119.4
Per basic share $1.64 $1.79 $2.50 $2.88
NFE for the balance of fiscal 2013 expected to exceed last year
5
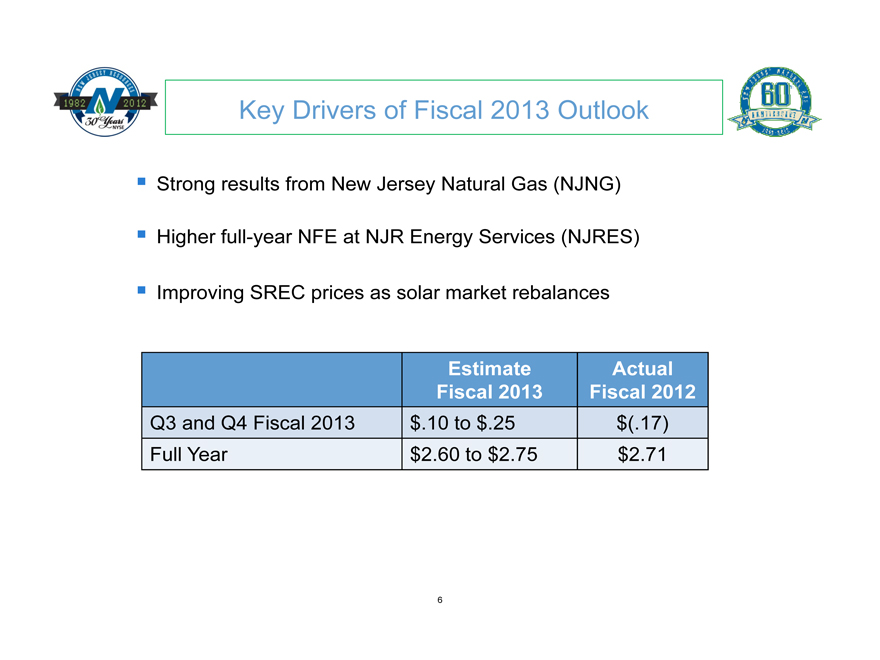
Key Drivers of Fiscal 2013 Outlook
Strong results from New Jersey Natural Gas (NJNG)
Higher full-year NFE at NJR Energy Services (NJRES)
Improving SREC prices as solar market rebalances
Estimate Actual
Fiscal 2013 Fiscal 2012
Q3 and Q4 Fiscal 2013 $.10 to $.25 $(.17)
Full Year $2.60 to $2.75 $2.71
6
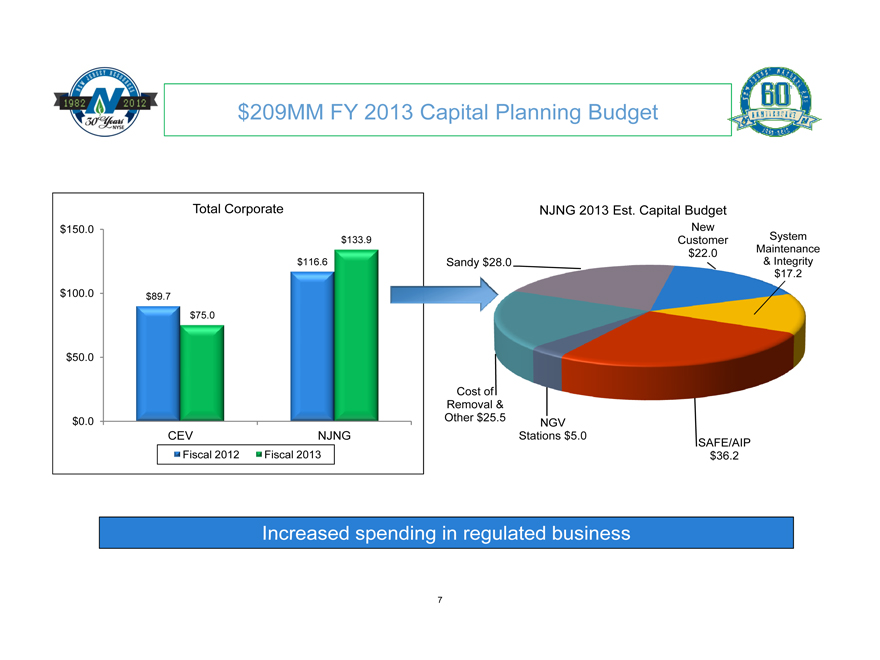
$209MM FY 2013 Capital Planning Budget
Total Corporate
$89.7 $75.0
$150.0 $100.0 $50.0 $0.0
$116.6
$133.9
CEV NJNG
Fiscal 2012
Fiscal 2013
NJNG 2013 Est. Capital Budget
Sandy $28.0
Cost of Removal & Other $25.5
NGV Stations $5.0
SAFE/AIP $36.2
System Maintenance
& Integrity $17.2
New Customer $22.0
Increased spending in regulated business
7
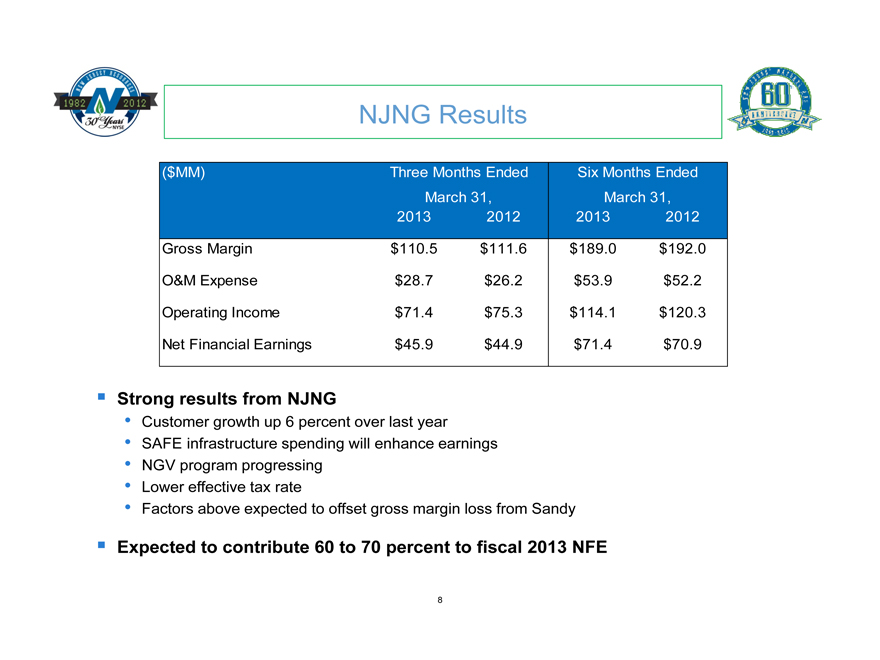
NJNG Results
($MM) Three Months Ended Six Months Ended March 31, March 31, 2013 2012 2013 2012
Gross Margin $110.5 $111.6 $189.0 $192.0 O&M Expense $28.7 $26.2 $53.9 $52.2 Operating Income $71.4 $75.3 $114.1 $120.3 Net Financial Earnings $45.9 $44.9 $71.4 $70.9
Strong results from NJNG
• Customer growth up 6 percent over last year
• SAFE infrastructure spending will enhance earnings
• NGV program progressing
• Lower effective tax rate
• Factors above expected to offset gross margin loss from Sandy
Expected to contribute 60 to 70 percent to fiscal 2013 NFE
8
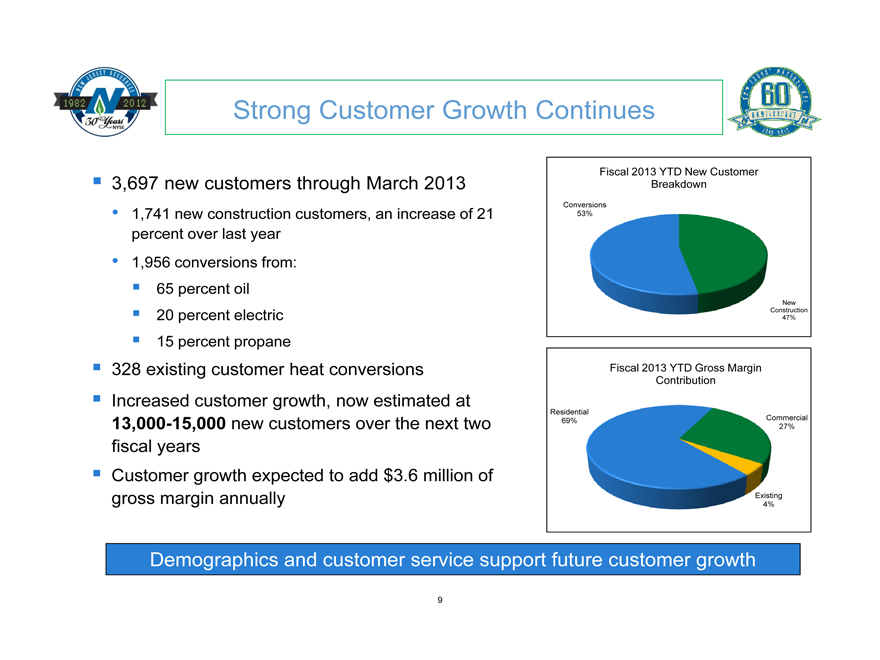
Strong Customer Growth Continues
3,697 new customers through March 2013
• 1,741 new construction customers, an increase of 21 percent over last year
• 1,956 conversions from:
65 percent oil
20 percent electric
15 percent propane
328 existing customer heat conversions
Increased customer growth, now estimated at 13,000-15,000 new customers over the next two fiscal years
Customer growth expected to add $3.6 million of gross margin annually
Fiscal 2013 YTD New Customer Breakdown
Conversions 53%
New Construction 47%
Fiscal 2013 YTD Gross Margin Contribution
Residential 69%
Commercial 27%
Existing 4%
Demographics and customer service support future customer growth
9
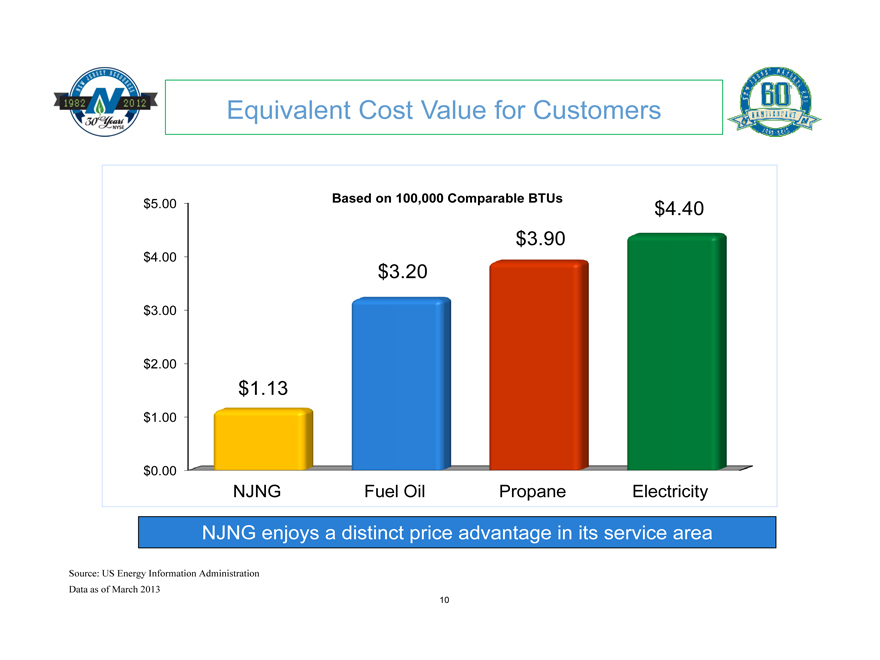
Equivalent Cost Value for Customers
$5.00 $4.00 $3.00 $2.00 $1.00 $0.00
Based on 100,000 Comparable BTUs
$1.13
$3.20
$3.90
$4.40
NJNG Fuel Oil Propane Electricity
NJNG enjoys a distinct price advantage in its service area
Source: US Energy Information Administration Data as of March 2013
10

Future Potential Customer Growth
New Construction
2013-2017 15,900
2018-Build Out 71,600
Conversions
Off Main 49,800
Non Heat
7,246
On Main 37,749
Near Main
29,192
With our new construction and conversion outlook, we see a total potential of over 204,000 new customers
Sources: Arthur D. Little, Harte Hanks and NJNG
11
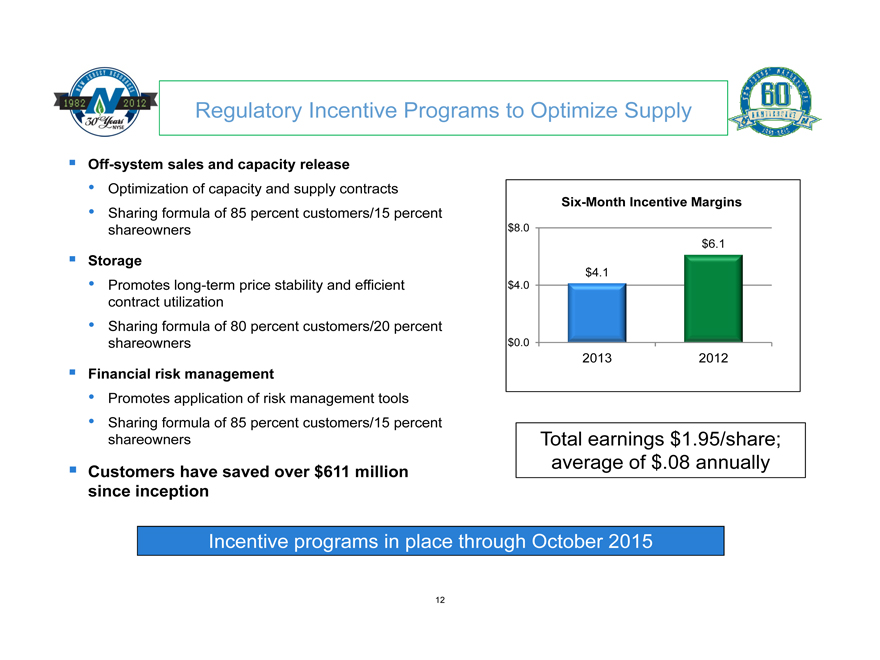
Regulatory Incentive Programs to Optimize Supply
Off-system sales and capacity release
• Optimization of capacity and supply contracts
• Sharing formula of 85 percent customers/15 percent shareowners
Storage
• Promotes long-term price stability and efficient contract utilization
• Sharing formula of 80 percent customers/20 percent shareowners
Financial risk management
• Promotes application of risk management tools
• Sharing formula of 85 percent customers/15 percent shareowners
Customers have saved over $611 million since inception
Six-Month Incentive Margins
$8.0 $4.0 $0.0
$4.1
$6.1
2013 2012
Total earnings $1.95/share; average of $.08 annually
Incentive programs in place through October 2015
12
Regulatory Collaboration Adds Value
Safety Acceleration and Facility Enhancement (SAFE) Program
Approved in October 2012; four-year, $130 million program
Conservation Incentive Program
In place through September 30, 2013; petition filed for extension on March 1, 2013
NGV Program
Three agreements signed
Total investment of $6 to $8 million on Compressed Natural Gas infrastructure
NJNG earns a return of 7.1 percent/10.3 percent ROE
The SAVEGREEN Project®
Filing submitted to the NJ BPU; decision expected in June
Constructive regulatory environment and support of public policy objectives create growth opportunities for NJNG
13
Superstorm Sandy Update
Impact lower than original post-storm estimates
Total storm-related capital expenditures currently estimated at $30 to $40 million over the next three years; majority in fiscal 2013
Capital will be treated as rate base additions
Total incremental O&M costs are currently estimated at $15 to $17 million
No direct impact expected on fiscal 2013 earnings
NJNG will file its deferred costs with the New Jersey Board of Public Utilities by July 1, 2013, seeking recovery in next base case
14
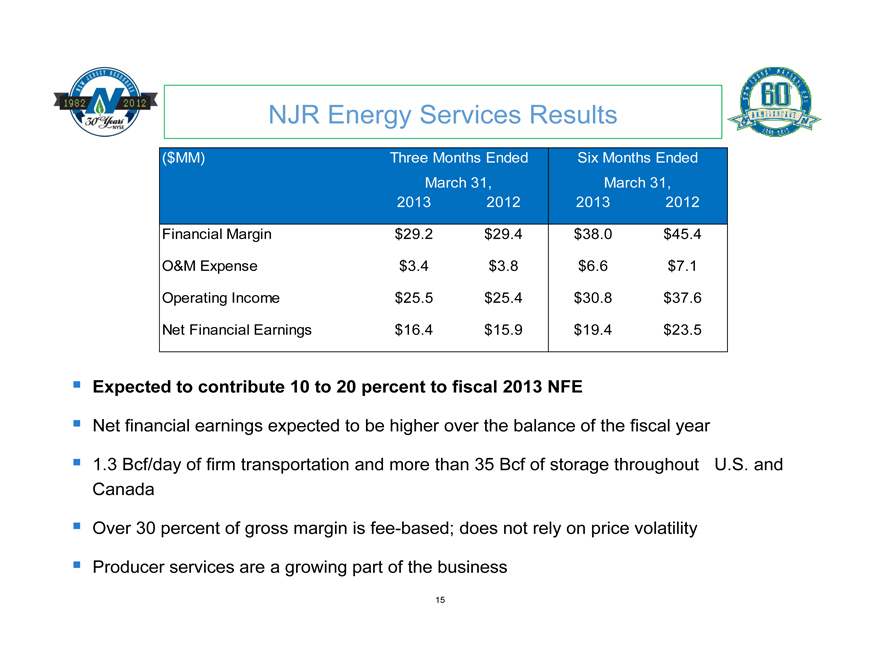
NJR Energy Services Results
($MM) Three Months Ended Six Months Ended March 31, March 31, 2013 2012 2013 2012
Financial Margin $29.2 $29.4 $38.0 $45.4 O&M Expense $3.4 $3.8 $6.6 $7.1 Operating Income $25.5 $25.4 $30.8 $37.6 Net Financial Earnings $16.4 $15.9 $19.4 $23.5
Expected to contribute 10 to 20 percent to fiscal 2013 NFE
Net financial earnings expected to be higher over the balance of the fiscal year
1.3 Bcf/day of firm transportation and more than 35 Bcf of storage throughout U.S. and Canada
Over 30 percent of gross margin is fee-based; does not rely on price volatility
Producer services are a growing part of the business
15
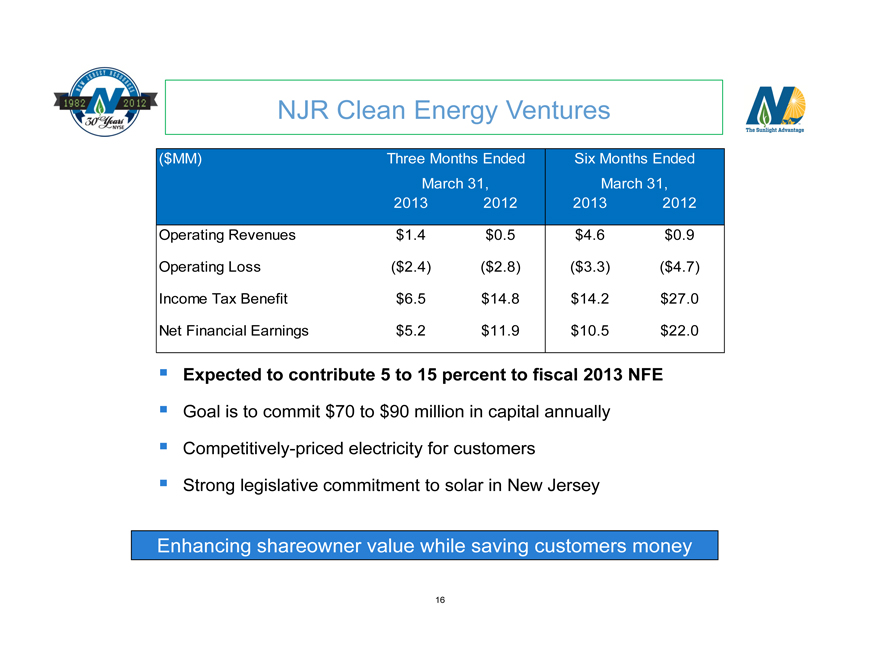
NJR Clean Energy Ventures
($MM) Three Months Ended Six Months Ended March 31, March 31, 2013 2012 2013 2012
Operating Revenues $1.4 $0.5 $4.6 $0.9 Operating Loss ($2.4) ($2.8) ($3.3) ($4.7) Income Tax Benefit $6.5 $14.8 $14.2 $27.0 Net Financial Earnings $5.2 $11.9 $10.5 $22.0
Expected to contribute 5 to 15 percent to fiscal 2013 NFE
Goal is to commit $70 to $90 million in capital annually Competitively-priced electricity for customers Strong legislative commitment to solar in New Jersey
Enhancing shareowner value while saving customers money
16
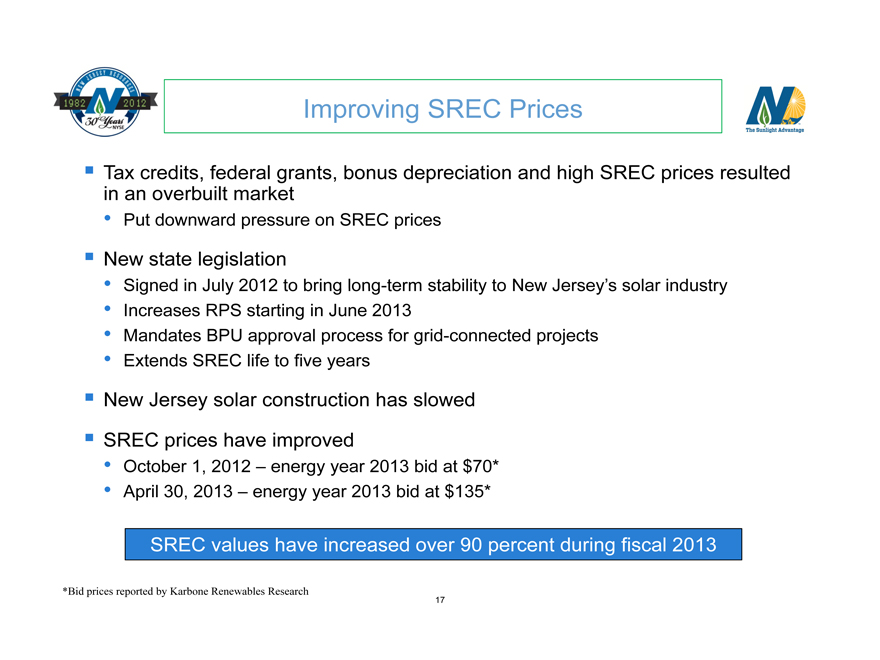
Improving SREC Prices
Tax credits, federal grants, bonus depreciation and high SREC prices resulted in an overbuilt market
Put downward pressure on SREC prices
New state legislation
Signed in July 2012 to bring long-term stability to New Jersey’s solar industry
Increases RPS starting in June 2013
Mandates BPU approval process for grid-connected projects
Extends SREC life to five years
New Jersey solar construction has slowed
SREC prices have improved
October 1, 2012 – energy year 2013 bid at $70*
April 30, 2013 – energy year 2013 bid at $135*
SREC values have increased over 90 percent during fiscal 2013
*Bid prices reported by Karbone Renewables Research
17
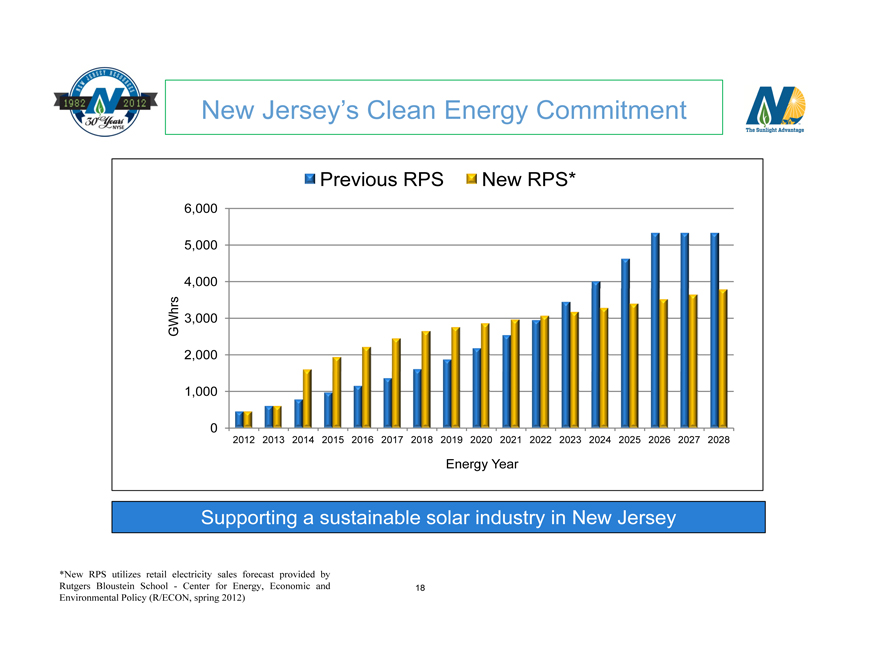
New Jersey’s Clean Energy Commitment
Previous RPS
New RPS*
6,000
5,000
4,000 GWhrs 3,000 2,000
1,000
0
2012 2013 2014 2015 2016 2017 2018 2019 2020 2021 2022 2023 2024 2025 2026 2027 2028
Energy Year
Supporting a sustainable solar industry in New Jersey
*New RPS utilizes retail electricity sales forecast provided by Rutgers Bloustein School—Center for Energy, Economic and Environmental Policy (R/ECON, spring 2012)
18
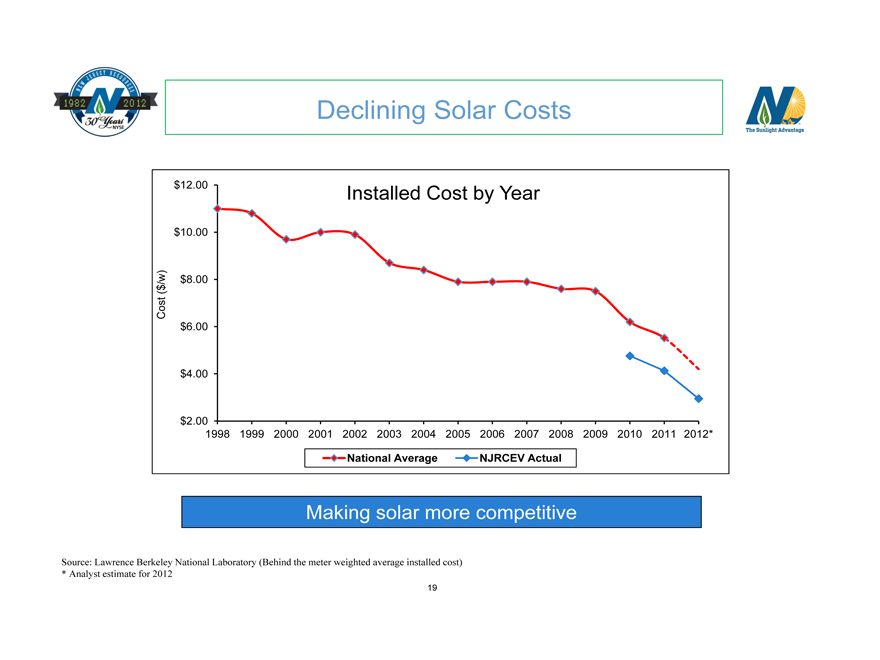
Declining Solar Costs
Installed Cost by Year
$12.00
$10.00
/w) $8.00 ( $ Cost $6.00
$4.00
$2.00
1998 1999 2000 2001 2002 2003 2004 2005 2006 2007 2008 2009 2010 2011 2012*
National Average
NJRCEV Actual
Making solar more competitive
Source: Lawrence Berkeley National Laboratory (Behind the meter weighted average installed cost)
* Analyst estimate for 2012
19
Strong Solar Project Pipeline
Total commercial and residential programs through March 31, 2013:
47 MW of installed capacity
Approximately 55,000 SRECs generated annually
Residential Program
FY 2013 results to date:
294 homes added
Average size: 8.3 kilowatts
$8.1 million of capital deployed
700 leases backlog
Over 1,400 customers added since 2010
Commercial Program
Fiscal 2013 commercial projects:
• Medford and Wakefern in place
$26.3 million of invested capital
9.1 total installed MW
• Medford Township Wastewater
Ground-mounted system
$4.7 million; 1.5 MW project
Expected completion Q3, fiscal 2013
Approximately $140 million in commercial project pipeline
20
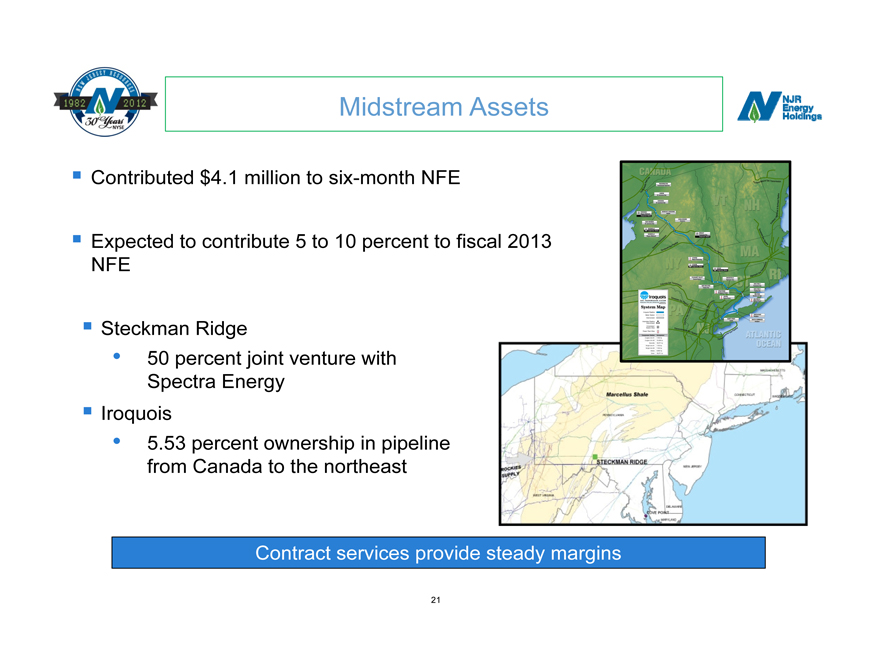
Midstream Assets
Contributed $4.1 million to six-month NFE
Expected to contribute 5 to 10 percent to fiscal 2013 NFE
Steckman Ridge
50 percent joint venture with Spectra Energy Iroquois
5.53 percent ownership in pipeline from Canada to the northeast
Contract services provide steady margins
21
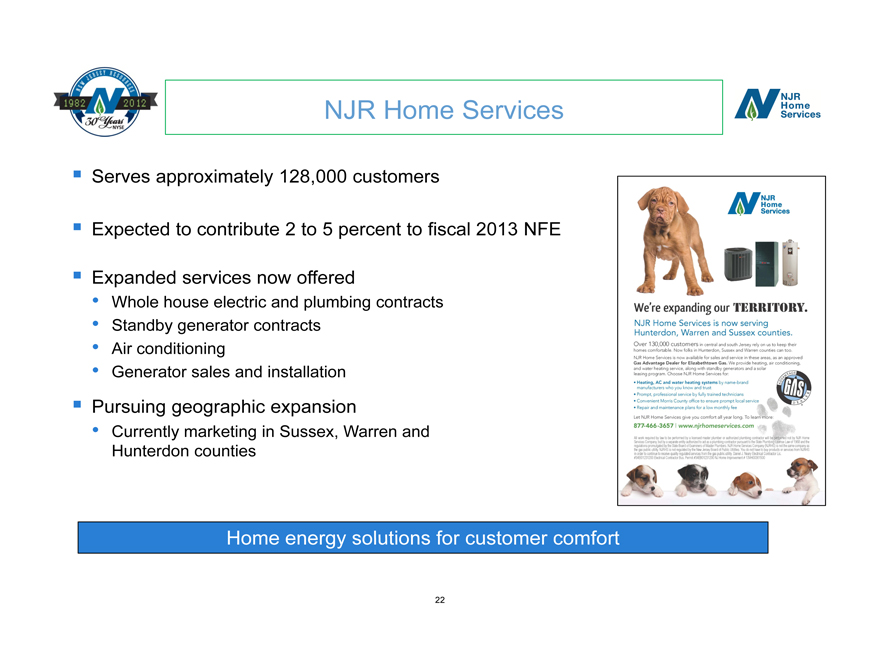
NJR Home Services
Serves approximately 128,000 customers
Expected to contribute 2 to 5 percent to fiscal 2013 NFE
Expanded services now offered
Whole house electric and plumbing contracts
Standby generator contracts
Air conditioning
Generator sales and installation
Pursuing geographic expansion
Currently marketing in Sussex, Warren and Hunterdon counties
Home energy solutions for customer comfort
22
Financial Goals
Long-term NFE growth of 4 to 6 percent
Earnings from New Jersey Natural Gas of 60 to 70 percent Annual dividend growth of 5 percent Maintain a payout ratio at or lower than peer average
Maintain a strong financial profile with a minimum equity ratio of 50 percent
23
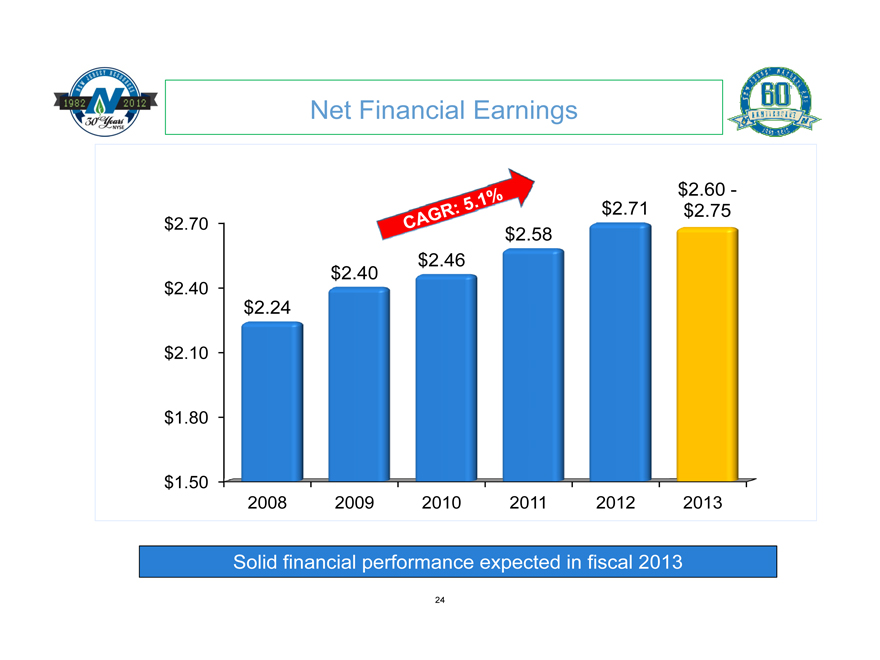
Net Financial Earnings
$2.70 $2.40 $2.10 $1.80 $1.50
2008 2009 2010 2011 2012 2013
Solid financial performance expected in fiscal 2013
$2.24
$2.40
$2.46
$2.58
$2.71
$2.60 -$2.75
24
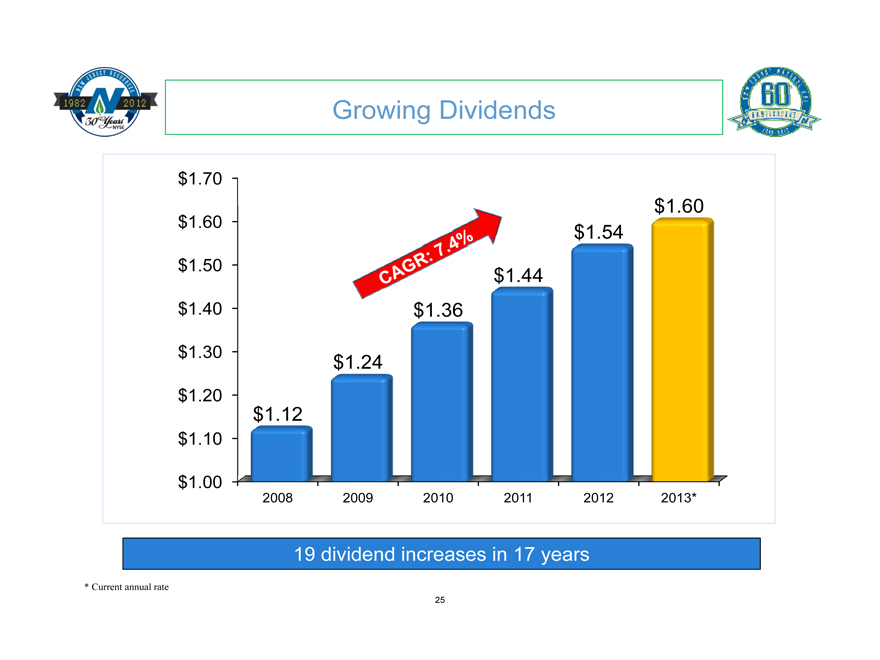
Growing Dividends
$1.70 $1.60 $1.50 $1.40 $1.30 $1.20 $1.10 $1.00
2008 2009 2010 2011 2012 2013*
$1.12
$1.24
$1.36
$1.44
$1.54
$1.60
19 dividend increases in 17 years
* Current annual rate
25
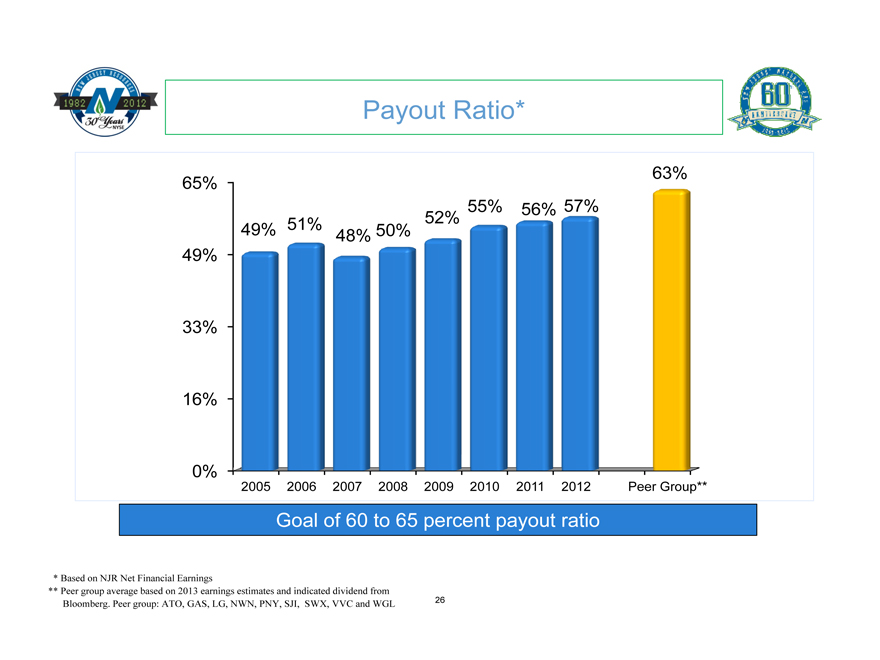
Payout Ratio*
65% 49% 33% 16% 0%
63% 55% 56% 57% 51% 52% 49% 48% 50%
2005 2006 2007 2008 2009 2010 2011 2012 Peer Group**
Goal of 60 to 65 percent payout ratio
* Based on NJR Net Financial Earnings
** Peer group average based on 2013 earnings estimates and indicated dividend from Bloomberg. Peer group: ATO, GAS, LG, NWN, PNY, SJI, SWX, VVC and WGL
26
Fundamental Growth Drivers
Solid earnings performance expected in fiscal 2013
Earnings over the remainder of the fiscal year expected to exceed last year
Core utility continues to provide majority of earnings
Strong customer growth of 1.3 to 1.4 percent
Infrastructure investment opportunities
Regulatory incentives
CEV spending consistent with tax appetite
Goal is to spend $70 to $90 million annually
SREC market improving
Ongoing earnings contributions expected from wholesale and retail energy services
Fundamentals deliver consistent performance and sustainable long-term growth
27

Fiscal 2013 Second Quarter Update
May 2, 2013