Exhibit 99.2
Fiscal 2013 Third Quarter Update
August 7, 2013

Regarding Forward-Looking Statements
Certain statements contained in this presentation are forward-looking statements within the meaning of the Private Securities Litigation Reform Act of 1995. Forward-looking statements can also be identified by the use of forward-looking terminology such as “may,” “will,” “intend,” “expect,” “believe,” or “continue” or comparable terminology andare made basedupon management’s current expectations and beliefs as of this date concerning future developments and their potential effect upon New Jersey Resources(NJRorthe Company).There canbenoassurance that future developments will be in accordance with management’s expectations or that the effect of future developments on the Company will be those anticipated by management. NJR cautions persons reading or hearing this presentation that the assumptions that form the basis for forward-looking statements regarding NJR’s net financial earnings (NFE) for the remainder of fiscal 2013, forecasted contribution of business segments to fiscal 2013 long-term NFE, long-term financial goals of NJR, expected contribution by new customers of New Jersey Natural Gas Company (NJNG) to utility gross margin, expected number of new and customers of NJNG, sources of gross margin at NJNG, the approval and completion of NJR Clean Energy Venture’s planned solar projects in fiscal 2013, Solar Renewable Energy Certificate (SREC) prices, NJR’s effective tax rate, estimated capital expenditures in fiscal 2013 and beyond, by NJNG and NJRCEV, planned natural gas vehicle (NGV) stations, the diversification of NJRCEV’s strategy, expected dividend payout ratio, and the impact of post-tropical cyclone Sandy, (commonly referred to as “Superstorm” Sandy).
The factors that could cause actual results to differ materially from NJR’s expectations include, but are not limited to, weather and economic conditions; demographic changes in the NJNG service territory and their effect on NJNG’s customer growth; volatility of natural gas and other commodity prices and their impactonNJNGcustomer usage, NJNG’s Basic Gas Supply Service incentive programs, NJRES’ operations and on the Company’s risk management efforts; changes in rating agency requirements and/or credit ratings and their effect on availability and cost of capital to the Company; the impact of volatility in the credit markets; the ability tocomplywith debt covenants; the impact to the asset values and resulting higher costs and funding obligations of NJR’s pension and postemployment benefit plans as a result of downturns in the financial markets, a lower discount rate, and impacts associated with the Patient Protection and Affordable Care Act; accounting effects and other risks associated with hedging activities and use of derivatives contracts; commercial and wholesale credit risks, including the availability of creditworthy customers and counterparties and liquidity in the wholesale energy trading market; the ability to obtain governmental approvals and/or financing for the construction, development and operation of certain non-regulated energy investments; risks associated with the management of the Company’s joint ventures and partnerships; risks associated with our investments in renewable energy projects and our investment in an on-shore wind developer, including the availability of regulatory and tax incentives, logistical risks and potential delays related to construction, permitting, regulatory approvals and electric grid interconnection, the availability of viable projects and NJR’s eligibility for federal investment tax credits (ITC), the future market for SRECs and operational risks related to projects in service; timing of qualifying for ITCs due to delays or failures to complete planned solar energy projects and the resulting effect on our effective tax rate and earnings; the level and rate at which NJNG’s costs and expenses (including those related to restoration efforts resulting from Superstorm Sandy) are incurred and the extent to which they are allowed to be recovered from customers through the regulatory process; access to adequate supplies of natural gas and dependence on third-party storage and transportation facilities for natural gas supply; operating risks incidental to handling, storing, transporting and providing customers with natural gas; risks related to our employee workforce, including a work stoppage; the regulatory and pricing policies of federal and state regulatory agencies; the possible expiration of the NJNG Conservation Incentive Program (CIP), the costs of compliance with the proposed regulatory framework for over-the-counter derivatives; the costs of compliance with present and future environmental laws, including potential climate change-related legislation; risks related to changes in accounting standards; the disallowance of recovery of environmental-related expenditures and other regulatory changes; environmental-related and other litigation and other uncertainties; risks related to cyber-attack of failure of information technology systems; and the impact of natural disasters, terrorist activities, and other extreme events on our operations and customers, including any impacts to utility gross margin, and restoration costs resulting from Superstorm Sandy. The aforementioned factors are detailed in the “Risk Factors” sections of our Annual Report on Form 10-K filed on November 28, 2012, as filed with the Securities and Exchange Commission (SEC) and our Quarterly Report on Form 10-Q, filed with the SEC on May 3, 2013, each of which is available on the SEC’s website at sec.gov. NJR disclaims any obligation to update and revise statements contained in these materials based on new information or otherwise
Disclaimer Regarding Non-GAAP Financial Measures
This presentation includes the non-GAAP measures net financial earnings (losses), financial margin and utility gross margin. As an indicator of the Company’s operating performance, these measures should not be considered an alternative to, or more meaningful than, GAAP measures, such as cash flow, net income, operating income or earnings per share. Net financial earnings (losses) and financial margin exclude unrealized gains or losses on derivative instruments related to the Company’s unregulated subsidiaries and certain realized gains and losses on derivative instruments related to natural gas that has been placed into storage at NJRES. Volatility associated with the change in value of these financial and physical commodity contracts is reported in the income statement in the current period. In order to manage its business, NJR views its results without the impacts of the unrealized gains and losses, and certain realized gains and losses, caused by changes in value of these financial instruments and physical commodity contracts prior to the completion of the planned transaction because it shows changes in value currently as opposed to when the planned transaction ultimately is settled. NJNG’s utility gross margin represents the results of revenues less natural gas costs, sales and other taxes and regulatory rider expenses, which are key components of the Company’s operations that move in relation to each other.
Management uses net financial earnings (NFE), financial margin and utility gross margin as supplemental measures to other GAAP results to provide a more complete understanding of the Company’s performance. Management believes these non-GAAP measures are more reflective of the Company’s business model, provide transparency to investors and enable period-to-period comparability of financial performance. For a full discussion of our non-GAAP financial measures, please see Item 7 of our Annual Report on Form 10-K for the fiscal year ended September 30, 2012, filed on November 28, 2012. This information has been provided pursuant to the requirements of SEC Regulation G.
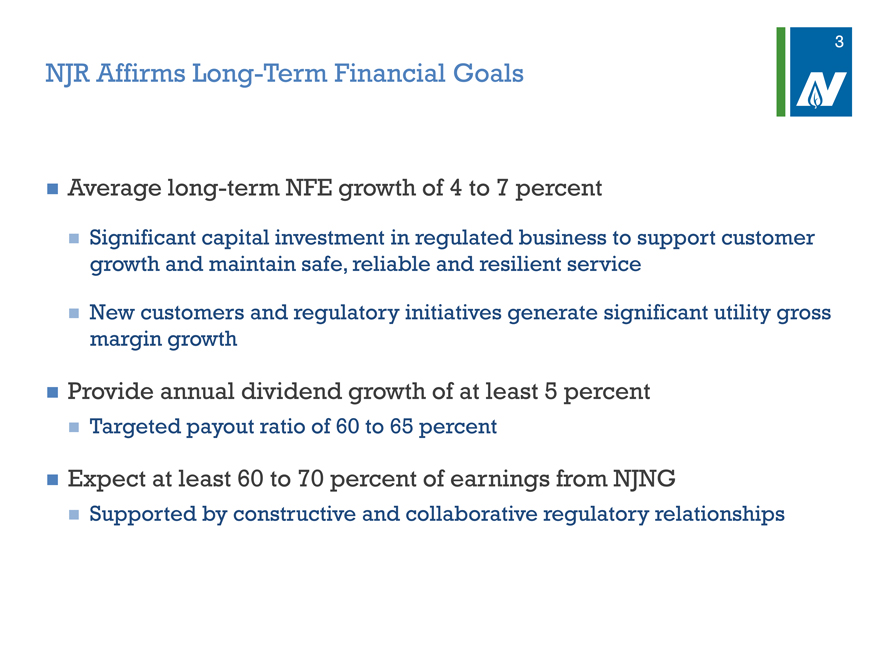
NJR Affirms Long-Term Financial Goals
Average long-term NFE growth of 4 to 7 percent
Significant capital investment in regulated business to support customer growth and maintain safe, reliable and resilient service
New customers and regulatory initiatives generate significant utility gross margin growth
Provide annual dividend growth of at least 5 percent
Targeted payout ratio of 60 to 65 percent
Expect at least 60 to 70 percent of earnings from NJNG
Supported by constructive and collaborative regulatory relationships

NJR Has Provided 4 – 7 Percent Average Long-Term NFE Growth
Net Financial Earnings Per Share
$3.60
$3.16 –
$3.40 $3.54
$3.20
$3.00
$2.65 –
$2.80 $2.71 $2.75
$2.58
$2.60 $2.46
$2.40
$2.40
$2.24
$2.20 $2.11
$2.00 $1.88
$1.80
$1.80 $1.73
$ 1.61
$1.60
$1.40
2003 2004 2005 2006 2007 2008 2009 2010 2011 2012 2013E 2017E*
* | | Assumes a range of 4-7 percent average annual growth from 2014 to 2017 |
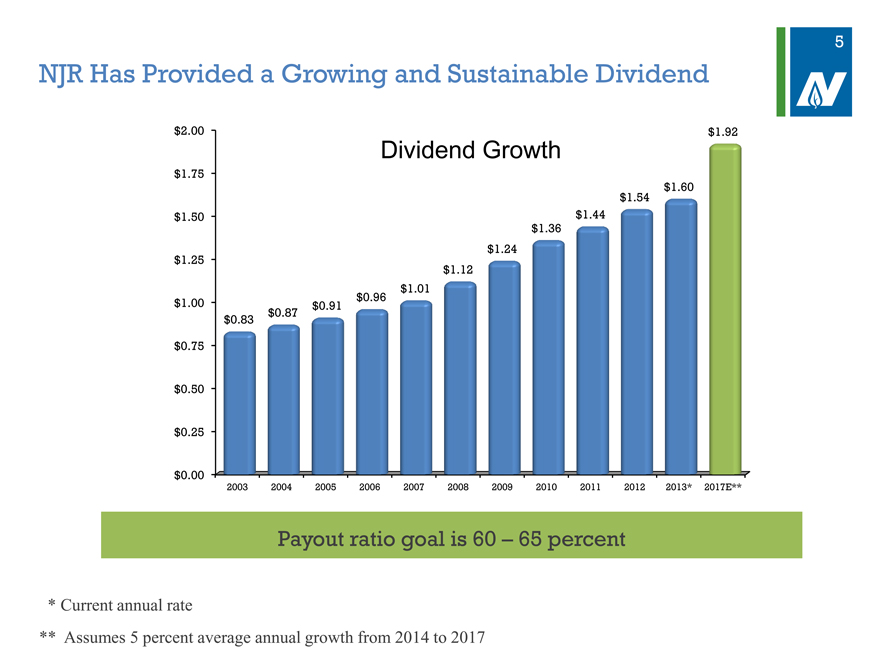
NJR Has Provided a Growing and Sustainable Dividend
$ 2.00 $1.92
Dividend Growth
$ 1.75
$1.60
$1.54
$ 1.50 $1.44
$1.36
.
$ 1.25
$1.12
$1.01
$ 1.00 $0.91 $0.96
$ 0.83 $0.87
$ 0.75
$ 0.50
$ 0.25
$ 0.00
2003 2004 2005 2006 2007 2008 2009 2010 2011 2012 2013* 2017E**
Payout ratio goal is 60 – 65 percent
** Assumes 5 percent average annual growth from 2014 to 2017
Third-Quarter Highlights
Strong third quarter results
Increased midpoint of guidance
Superstorm Sandy recovery remains on track
Solar fundamentals improving
Increased Share Repurchase Program
Foundation for long-term growth in place
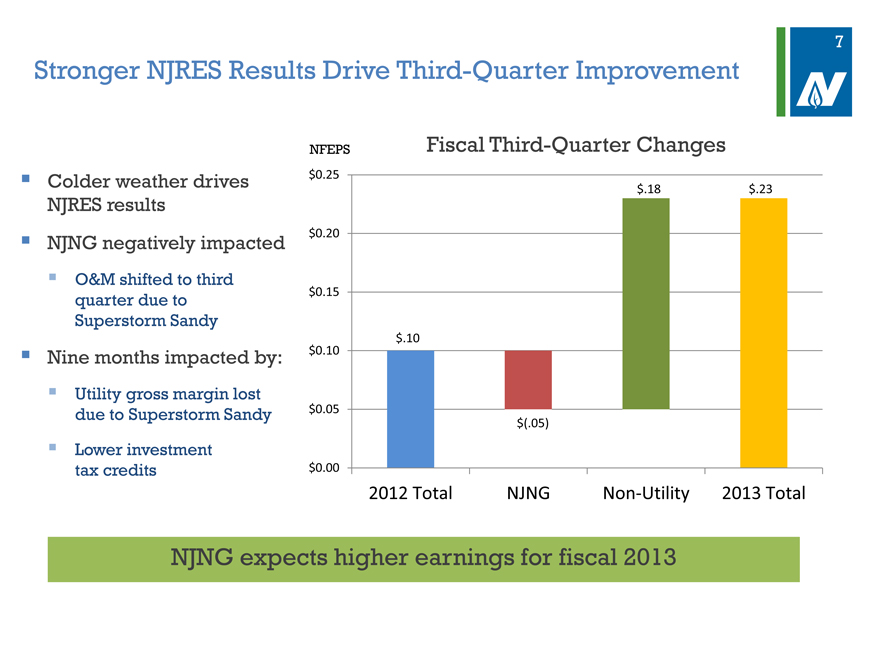
Stronger NJRES Results Drive Third-Quarter Improvement
Colder weather drives NJRES results
NJNG negatively impacted
O&M shifted to third quarter due to Superstorm Sandy
Nine months impacted by:
Utility gross margin lost due to Superstorm Sandy
Lower investment tax credits
NFEPS Fiscal Third-Quarter Changes
$ 0.25
$ .18 $ .23
$ 0.20
$ 0.15
$ .10
$ 0.10
$ 0.05
$ (.05)
$ 0.00
2012 Total NJNG Non-Utility 2013 Total
NJNG expects higher earnings for fiscal 2013
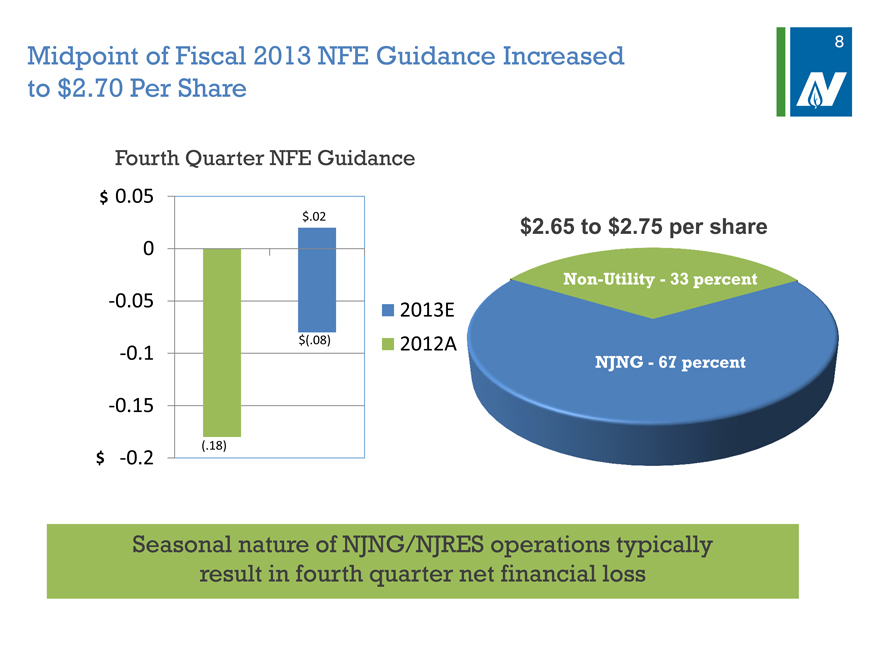
Midpoint of Fiscal 2013 NFE Guidance Increased to $2.70 Per Share
Fourth Quarter NFE Guidance
$ 0.05
$.02 $2.65 to $2.75 per share
0
Non-Utility—33 percent
-0.05 2013E
$(.08) 2012A
-0.1 NJNG—67 percent
-0.15
(.18)
$ -0.2
Seasonal nature of NJNG/NJRES operations typically result in fourth quarter net financial loss
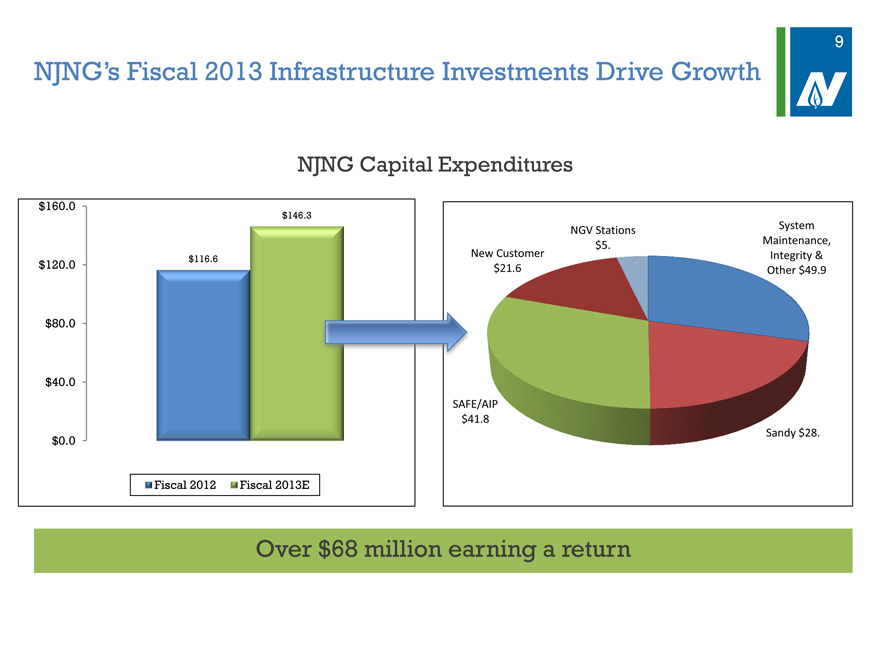
NJNG’s Fiscal 2013 Infrastructure Investments Drive Growth
NJNG Capital Expenditures
$160.0
$146.3
NGV Stations System
$5. Maintenance,
$116.6 New Customer Integrity &
$120.0 $21.6 Other $ 49.9
$80.0
$40.0
SAFE/AIP
$41.8
$0.0 Sandy $ 28.
Fiscal 2012 Fiscal 2013E
Over $68 million earning a return
9
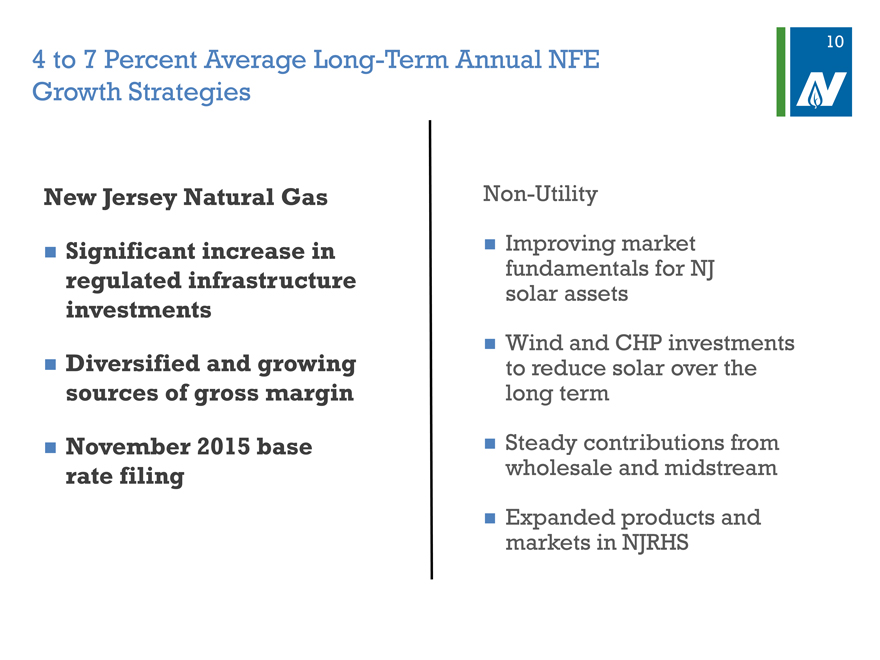
4 | | to 7 Percent Average Long-Term Annual NFE Growth Strategies |
New Jersey Natural Gas Non-Utility
Significant increase in Improving market
regulated infrastructure fundamentals for NJ
investments solar assets
Wind and CHP investments
Diversified and growing to reduce solar over the
sources of gross margin long term
November 2015 base Steady contributions from
rate filing wholesale and midstream
Expanded products and
markets in NJRHS
10
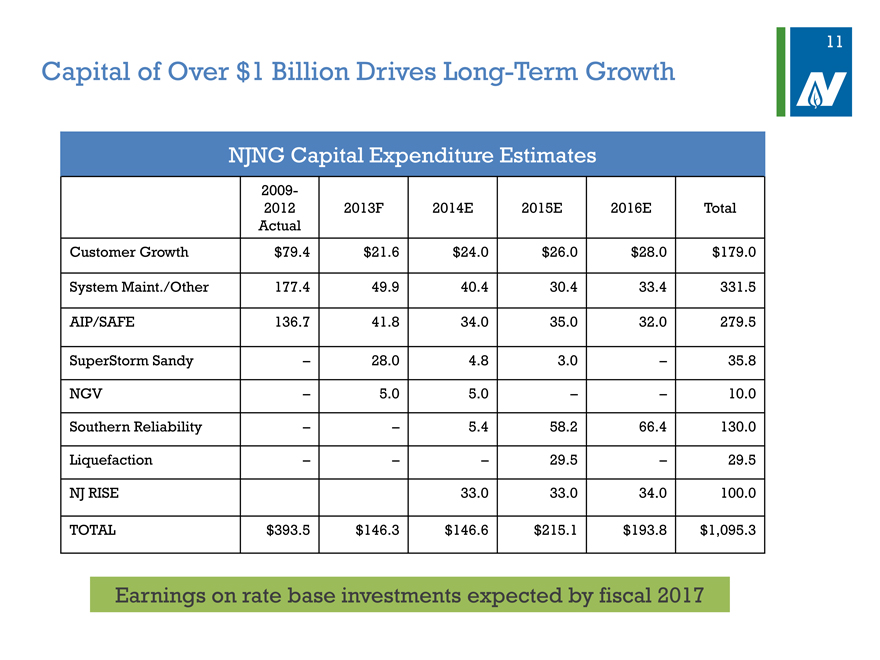
Capital of Over $1 Billion Drives Long-Term Growth
NJNG Capital Expenditure Estimates
2009-
2012 2013F 2014E 2015E 2016E Total
Actual
Customer Growth $79.4 $21.6 $24.0 $26.0 $28.0 $179.0
System Maint./Other 177.4 49.9 40.4 30.4 33.4 331.5
AIP/SAFE 136.7 41.8 34.0 35.0 32.0 279.5
SuperStorm Sandy – 28.0 4.8 3.0 – 35.8
NGV – 5.0 5.0 – – 10.0
Southern Reliability – – 5.4 58.2 66.4 130.0
Liquefaction – – – 29.5 – 29.5
NJ RISE 33.0 33.0 34.0 100.0
TOTAL $393.5 $146.3 $146.6 $215.1 $193.8 $1,095.3
Earnings on rate base investments expected by fiscal 2017
11
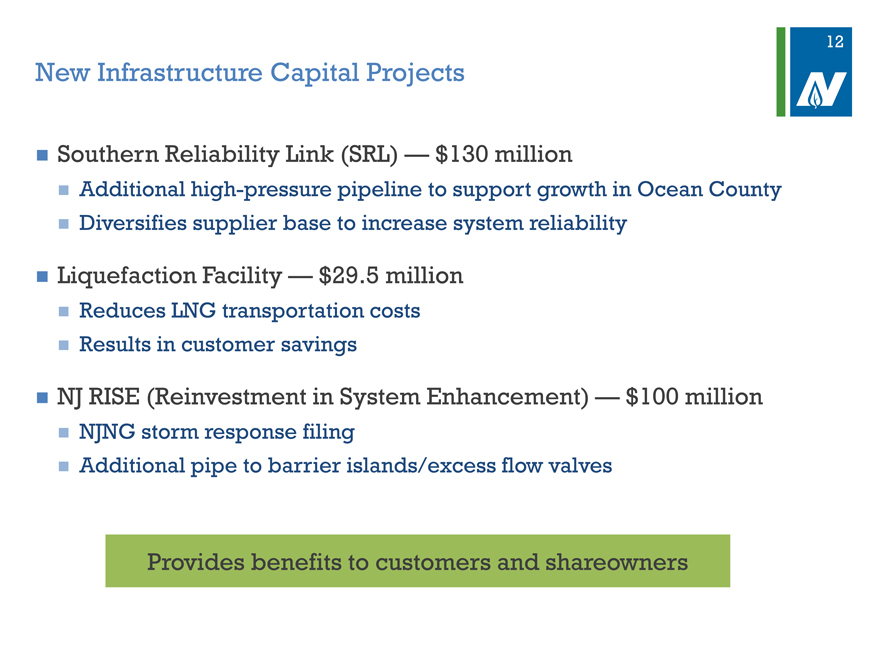
New Infrastructure Capital Projects
Southern Reliability Link (SRL) — $130 million
Additional high-pressure pipeline to support growth in Ocean County
Diversifies supplier base to increase system reliability
Liquefaction Facility — $29.5 million
Reduces LNG transportation costs
Results in customer savings
NJ RISE (Reinvestment in System Enhancement) — $100 million
NJNG storm response filing
Additional pipe to barrier islands/excess flow valves
Provides benefits to customers and shareowners
12
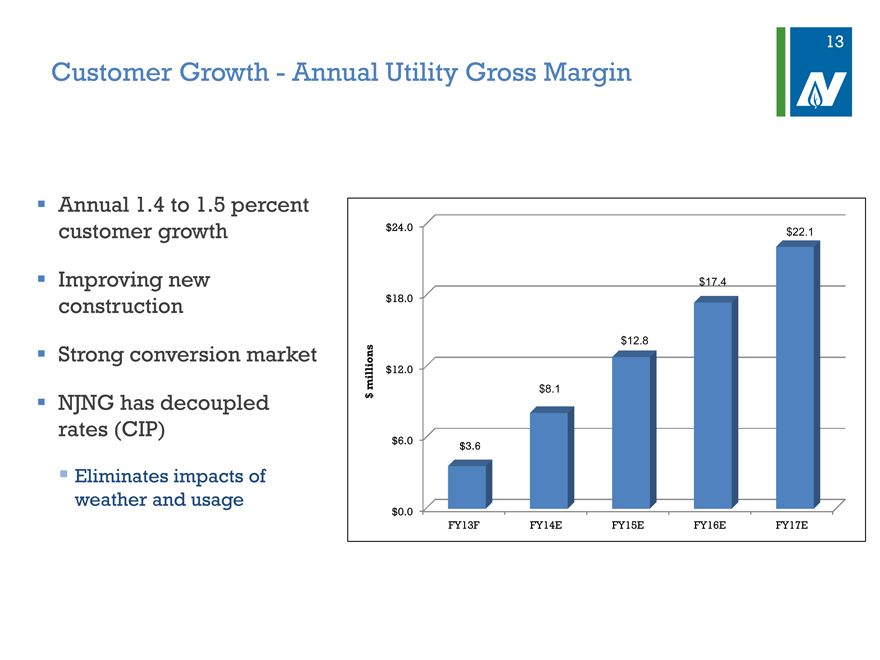
Customer Growth—Annual Utility Gross Margin
Annual 1.4 to 1.5 percent customer growth
Improving new construction
Strong conversion market
NJNG has decoupled rates (CIP)
Eliminates impacts of weather and usage
$24.0 $22.1
$17.4
$18.0
$12.8
millions $12.0
$8.1
$
$6.0 $3.6
$0.0
FY13F FY14E FY15E FY16E FY17E
13
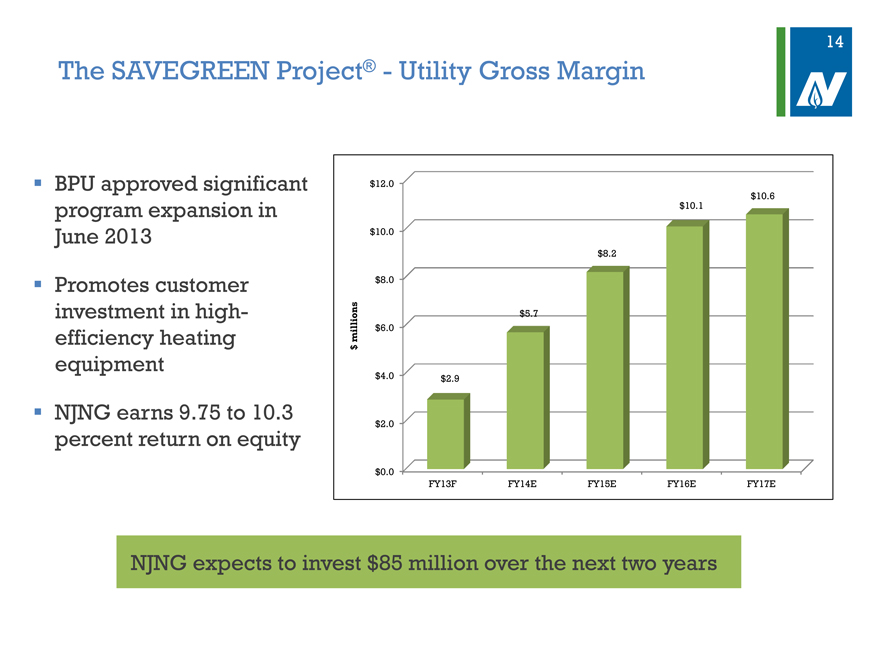
The SAVEGREEN Project®—Utility Gross Margin
BPU approved significant program expansion in June 2013
Promotes customer investment in high-efficiency heating equipment
NJNG earns 9.75 to 10.3 percent return on equity
$12.0
$10.6
$10.1
$10.0
$8.2
$8.0
llions $5.7
$6.0
mi
$
$4.0 $2.9
$2.0
$0.0
FY13F FY14E FY15E FY16E FY17E
14
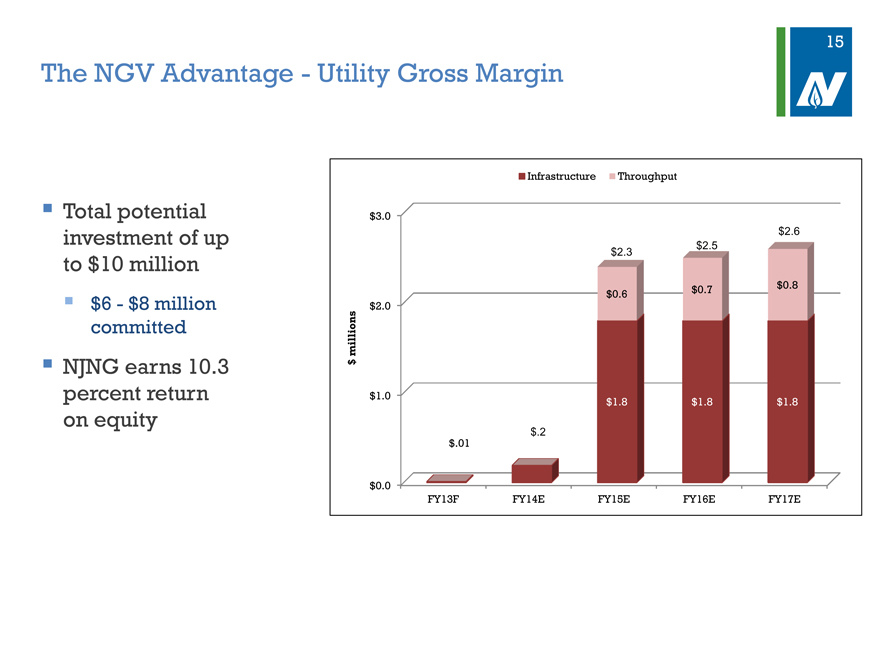
The NGV Advantage—Utility Gross Margin
Total potential investment of up to $10 million
$6—$8 million committed
NJNG earns 10.3 percent return on equity
Infrastructure Throughput
$ 3.0
$2.6
$2.3 $2.5
$0.7 $0.8
$0.6
$ 2.0
ons
milli
$
$ 1.0 $1.8 $1.8 $1.8
$.2
$ .01
$ 0.0
FY13F FY14E FY15E FY16E FY17E
15
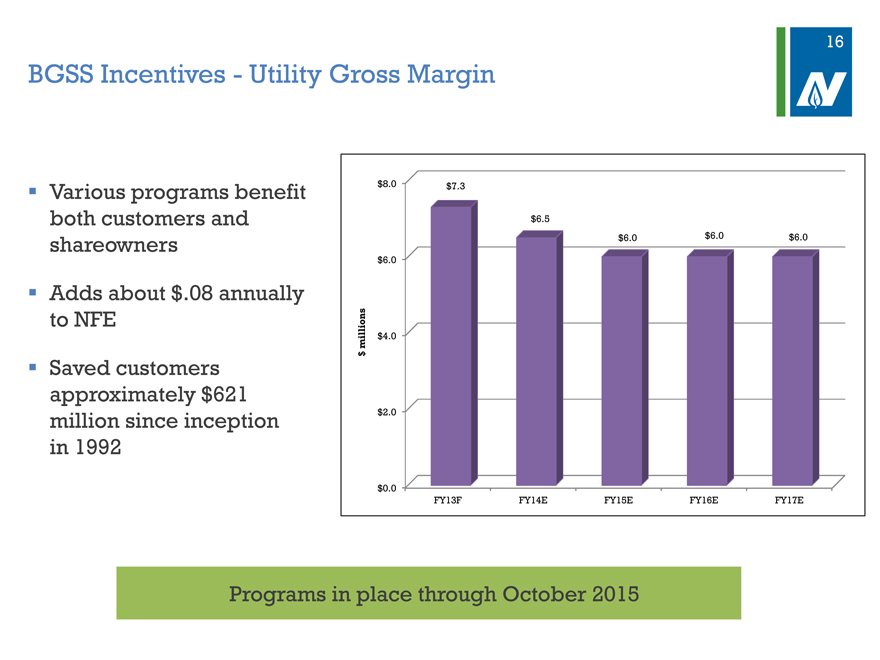
BGSS Incentives—Utility Gross Margin
Various programs benefit both customers and shareowners
Adds about $.08 annually to NFE
Saved customers approximately $621 million since inception in 1992
$ 8.0 $7.3
$6.5
$6.0 $6.0 $6.0
$ 6.0
ions
mill $ 4.0
$
$ 2.0
$ 0.0
FY13F FY14E FY15E FY16E FY17E
Programs in place through October 2015
16
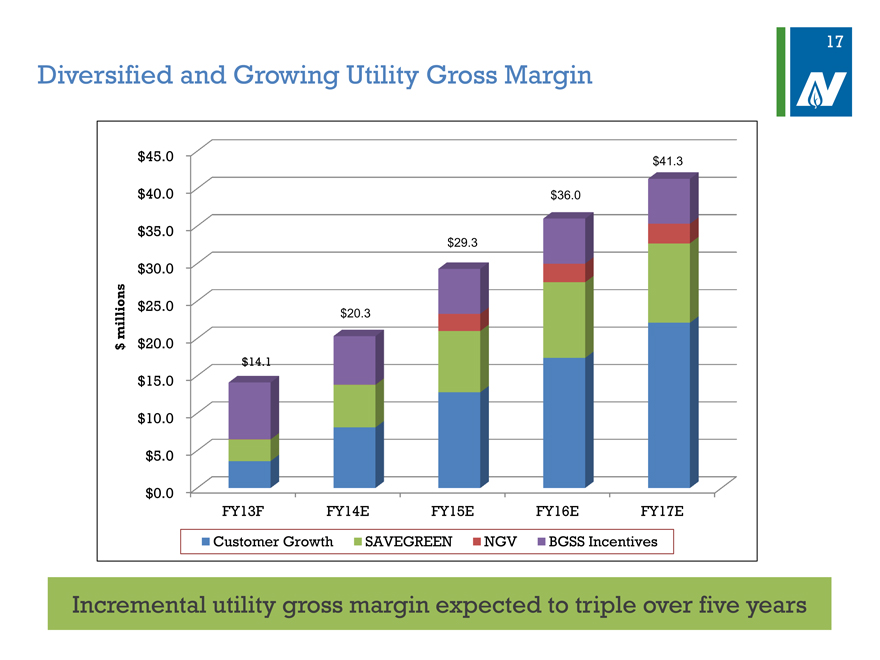
Diversified and Growing Utility Gross Margin
$45.0 $41.3
$40.0 $36.0
$35.0
$29.3
$30.0
illions $25.0 $20.3
$ m $20.0
$14.1
$15.0
$10.0
$5.0
$0.0
FY13F FY14E FY15E FY16E FY17E
Customer Growth SAVEGREEN NGV BGSS Incentives
Incremental utility gross margin expected to triple over five years
17
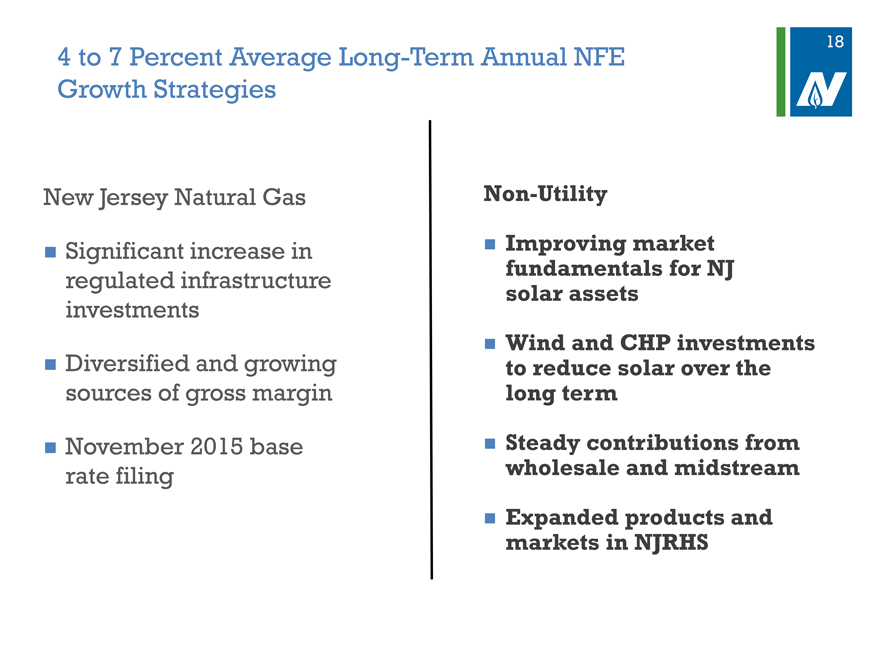
4 | | to 7 Percent Average Long-Term Annual NFE Growth Strategies |
New Jersey Natural Gas Non-Utility
Significant increase in Improving market
regulated infrastructure fundamentals for NJ
investments solar assets
Wind and CHP investments
Diversified and growing to reduce solar over the
sources of gross margin long term
November 2015 base Steady contributions from
rate filing wholesale and midstream
Expanded products and
markets in NJRHS
18
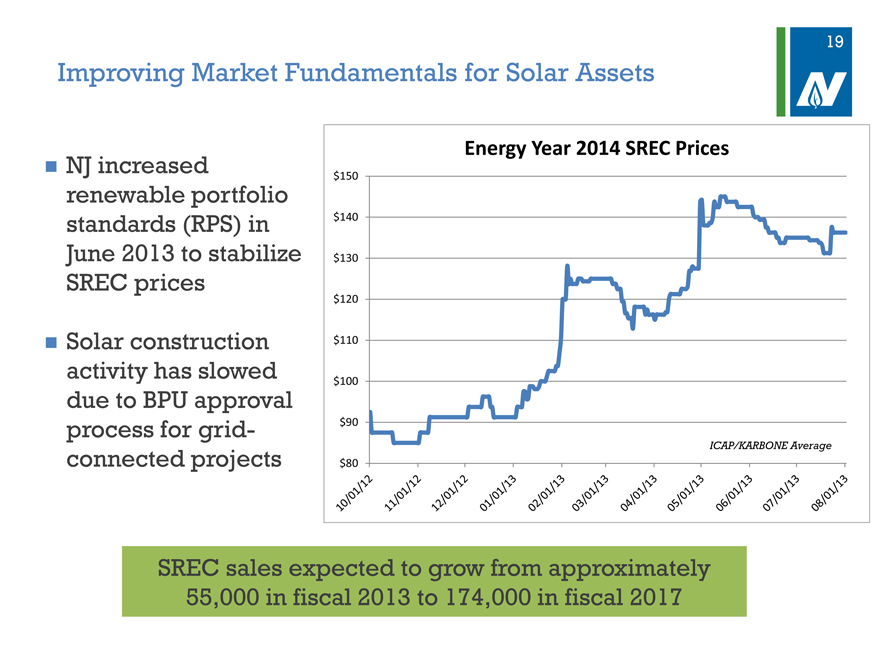
Improving Market Fundamentals for Solar Assets
NJ increased renewable portfolio standards (RPS) in June 2013 to stabilize SREC prices
Solar construction activity has slowed due to BPU approval process for grid-connected projects
Energy Year 2014 SREC Prices
$150
$140
$130
$120
$110
$100
$90
ICAP/KARBONE Average
$80
SREC sales expected to grow from approximately 55,000 in fiscal 2013 to 174,000 in fiscal 2017
19
Reallocating Capital into Wind Energy
Strategic Considerations
29 states and the District of Columbia have mandatory renewable portfolio standards
Wind is typically the most economic solution for meeting RPS standards in most states
NJR’s Wind Energy Progress
Strategic partnership with OwnEnergy, specializing in small to mid-sized projects
OwnEnergy current pipeline of projects totaling 1,300 MW
Will focus on long-term power purchase agreements and project financing
20
Reallocating Capital into Combined Heat and Power (CHP)
Strategic Considerations
Federal and state incentives strongly support project economics
Superstorm Sandy drives need for enhanced reliability and resiliency
CHP Portfolio Standard under discussion
NJR’s CHP Progress
Targeting key markets—hospitals, food processing, etc.
Project pipeline of approximately 6 MW
Long-term goal to maintain NJRCEV at 10 to15 percent of NFE and reduce new solar capital
21
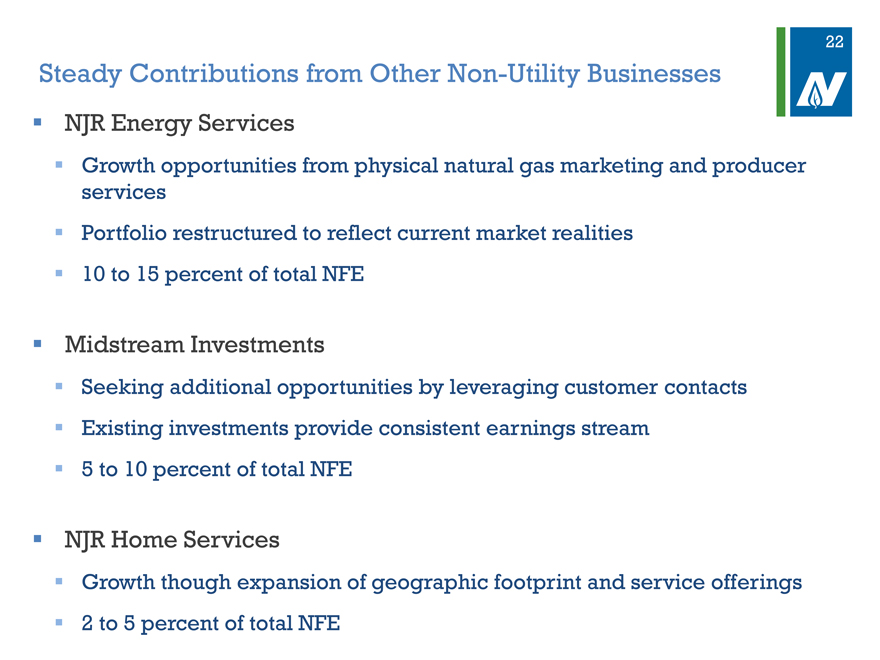
Steady Contributions from Other Non-Utility Businesses
NJR Energy Services
Growth opportunities from physical natural gas marketing and producer services
Portfolio restructured to reflect current market realities
10 to 15 percent of total NFE
Midstream Investments
Seeking additional opportunities by leveraging customer contacts
Existing investments provide consistent earnings stream
5 to 10 percent of total NFE
NJR Home Services
Growth though expansion of geographic footprint and service offerings
2 to 5 percent of total NFE
22
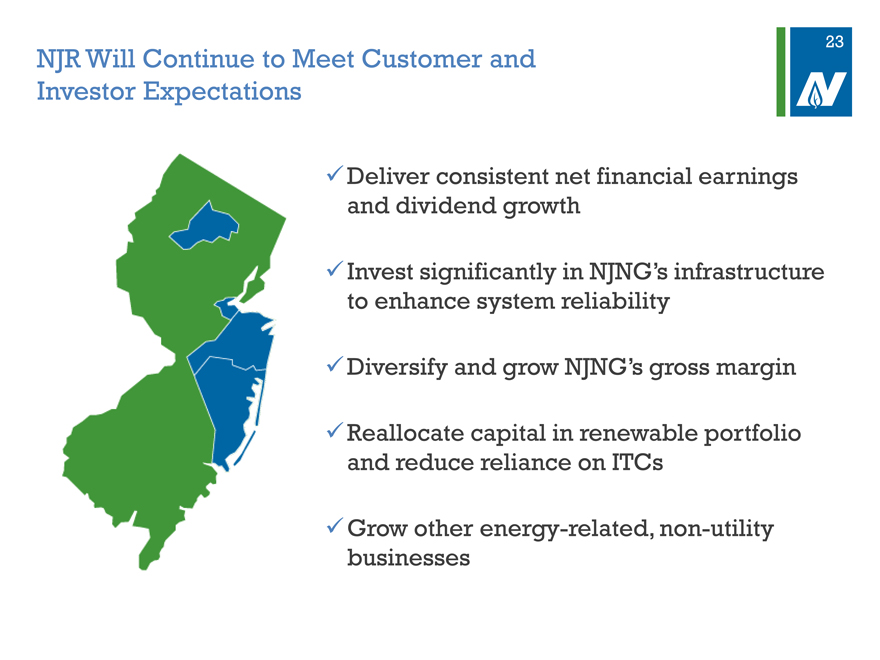
NJR Will Continue to Meet Customer and Investor Expectations
Deliver consistent net financial earnings and dividend growth
Invest significantly in NJNG’s infrastructure to enhance system reliability
Diversify and grow NJNG’s gross margin
Reallocate capital in renewable portfolio and reduce reliance on ITCs
Grow other energy-related, non-utility businesses
23