UNITED STATES
SECURITIES AND EXCHANGE COMMISSION
Washington, D.C. 20549
FORM N-CSR
CERTIFIED SHAREHOLDER REPORT OF
REGISTERED MANAGEMENT INVESTMENT COMPANIES
Investment Company Act file number 811-3327
MFS SERIES TRUST XIII
|
| (Exact name of registrant as specified in charter) |
500 Boylston Street, Boston, Massachusetts 02116
(Address of principal executive offices) (Zip code)
Susan S. Newton
Massachusetts Financial Services Company
500 Boylston Street
Boston, Massachusetts 02116
|
| (Name and address of agents for service) |
Registrant’s telephone number, including area code: (617) 954-5000
Date of fiscal year end: February 28
Date of reporting period: August 31, 2008
| ITEM 1. | REPORTS TO STOCKHOLDERS. |

MFS® Diversified Income Fund
The report is prepared for the general information of shareholders. It is authorized for distribution to prospective investors only when preceded or accompanied by a current prospectus.
NOT FDIC INSURED Ÿ MAY LOSE VALUE Ÿ
NO BANK OR CREDIT UNION GUARANTEE Ÿ NOT A DEPOSIT Ÿ
NOT INSURED BY ANY FEDERAL GOVERNMENT AGENCY OR
NCUA/NCUSIF
8/31/08
DIF-SEM

LETTER FROM THE CEO
Dear Shareholders:
The global economy is not a very welcoming place these days. Headlines tell the story of slowing growth, accelerating inflation, and credit collapse. We have watched the rampant selling that has typified equity and credit markets since the strains in the financial system first became apparent last year.
The volatility in commodity and currency markets has further complicated investment choices. There are so many parts moving in so many directions; it has become very easy to get overwhelmed.
At MFS® we remind investors to keep their eye on the long term and not become panicked by the uncertainty of the day to day.
Remember that what goes down could very easily come back up. And that is where we as money managers like to turn our focus.
Investment opportunities abound in oversold markets. When markets experience excessive selloffs, assets become undervalued. At MFS, we have a team of global sector analysts located in Boston, London, Mexico City, Singapore, Sydney, and Tokyo working together to do the kind of bottom-up research that will root out these investment opportunities.
In times like these, we encourage our investors to check in with their advisors to ensure they have an investment plan in place that will pay heed to the present, but that is firmly tailored to the future.
Respectfully,

Robert J. Manning
Chief Executive Officer and Chief Investment Officer
MFS Investment Management®
October 15, 2008
The opinions expressed in this letter are subject to change, may not be relied upon for investment advice, and no forecasts can be guaranteed.
1
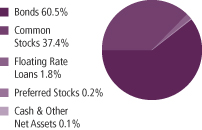
PORTFOLIO COMPOSITION
Portfolio structure (i)
| | |
| Top ten holdings (i) | | |
| Fannie Mae, 5.5%, 30 Years | | 3.8% |
| U.S. Treasury Bonds, 6.75%, 2026 | | 1.5% |
| Fannie Mae, 6.0%, 30 Years | | 1.5% |
| Simon Property Group, Inc., REIT | | 1.3% |
| Exxon Mobil Corp. | | 1.2% |
| Federative Republic of Brazil 6%, 2017 | | 1.2% |
| Fannie Mae, 4.5%, 15 Years | | 0.9% |
Alexandria Real Estate Equities,
Inc., REIT | | 0.9% |
| SL Green Realty Corp., REIT | | 0.9% |
| Financing Corp., 10.35%, 2018 | | 0.9% |
| | |
| Credit quality of loans and bonds (r) |
| AAA | | 36.6% |
| AA | | 0.3% |
| A | | 2.6% |
| BBB | | 8.3% |
| BB | | 17.4% |
| B | | 24.2% |
| CCC | | 9.6% |
| D (o) | | 0.0% |
| Not Rated | | 1.0% |
| |
| Portfolio facts | | |
| Average Duration (d)(i) | | 5.1 |
| Average Life (i)(m) | | 8.2 yrs. |
| Average Maturity (i)(m) | | 12.3 yrs. |
| Average Credit Quality of Rated Securities (long-term) (a) | | BBB |
| Average Credit Quality of Rated Securities (short-term) (a) | | A-1 |
| (a) | The average credit quality of rated securities is based upon a market weighted average of portfolio holdings that are rated by public rating agencies. |
| (d) | Duration is a measure of how much a bond’s price is likely to fluctuate with general changes in interest rates, e.g., if rates rise 1.00%, a bond with a 5-year duration is likely to lose about 5.00% of its value. |
| (i) | For purposes of this presentation, the loan and bond components include accrued interest amounts and may be positively or negatively impacted by the equivalent exposure from any derivative holdings, if applicable. |
| (m) | The average maturity shown is calculated using the final stated maturity on the portfolio’s holdings without taking into account any holdings which have been pre-refunded or pre-paid to an earlier date or which have a mandatory put date prior to the stated maturity. The average life shown takes into account these earlier dates. |
| (r) | Each security is assigned a rating from Moody’s Investors Service. If not rated by Moody’s, the rating will be that assigned by Standard & Poor’s. Likewise, if not assigned a rating by Standard & Poor’s, it will be based on the rating assigned by Fitch, Inc. For those portfolios that hold a security which is not rated by any of the three agencies, the security is considered Not Rated. Holdings in U.S. Treasuries and government agency mortgage-backed securities, if any, are included in the “AAA”-rating category. Percentages are based on the total market value of investments as of 8/31/08. |
Percentages are based on net assets as of 8/31/08, unless otherwise noted.
The portfolio is actively managed and current holdings may be different.
2
EXPENSE TABLE
Fund expenses borne by the shareholders during the period,
March 1, 2008 through August 31, 2008
As a shareholder of the fund, you incur two types of costs: (1) transaction costs, including sales charges (loads) on certain purchase or redemption payments, and (2) ongoing costs, including management fees; distribution and service (12b-1) fees; and other fund expenses. This example is intended to help you understand your ongoing costs (in dollars) of investing in the fund and to compare these costs with the ongoing costs of investing in other mutual funds.
The example is based on an investment of $1,000 invested at the beginning of the period and held for the entire period March 1, 2008 through August 31, 2008.
Actual Expenses
The first line for each share class in the following table provides information about actual account values and actual expenses. You may use the information in this line, together with the amount you invested, to estimate the expenses that you paid over the period. Simply divide your account value by $1,000 (for example, an $8,600 account value divided by $1,000 = 8.6), then multiply the result by the number in the first line under the heading entitled “Expenses Paid During Period” to estimate the expenses you paid on your account during this period.
Hypothetical Example for Comparison Purposes
The second line for each share class in the following table provides information about hypothetical account values and hypothetical expenses based on the fund’s actual expense ratio and an assumed rate of return of 5% per year before expenses, which is not the fund’s actual return. The hypothetical account values and expenses may not be used to estimate the actual ending account balance or expenses you paid for the period. You may use this information to compare the ongoing costs of investing in the fund and other funds. To do so, compare this 5% hypothetical example with the 5% hypothetical examples that appear in the shareholder reports of the other funds.
Please note that the expenses shown in the table are meant to highlight your ongoing costs only and do not reflect any transactional costs, such as sales charges (loads). Therefore, the second line for each share class in the table is useful in comparing ongoing costs only, and will not help you determine the relative total costs of owning different funds. In addition, if these transactional costs were included, your costs would have been higher.
3
Expense Table – continued
| | | | | | | | | | |
Share
Class | | | | Annualized
Expense
Ratio | | Beginning
Account Value
3/1/08 | | Ending
Account Value
8/31/08 | | Expenses
Paid During
Period (p)
3/1/08-8/31/08 |
| A | | Actual | | 0.95% | | $1,000.00 | | $1,003.95 | | $4.80 |
| | Hypothetical (h) | | 0.95% | | $1,000.00 | | $1,020.42 | | $4.84 |
| C | | Actual | | 1.65% | | $1,000.00 | | $1,001.45 | | $8.32 |
| | Hypothetical (h) | | 1.65% | | $1,000.00 | | $1,016.89 | | $8.39 |
| I | | Actual | | 0.65% | | $1,000.00 | | $1,006.47 | | $3.29 |
| | Hypothetical (h) | | 0.65% | | $1,000.00 | | $1,021.93 | | $3.31 |
| R1 | | Actual (i) | | 1.65% | | $1,000.00 | | $1,006.80 | | $2.81 |
| | Hypothetical (h) | | 1.65% | | $1,000.00 | | $1,016.89 | | $8.39 |
| R2 | | Actual (i) | | 1.15% | | $1,000.00 | | $1,007.63 | | $1.96 |
| | Hypothetical (h) | | 1.15% | | $1,000.00 | | $1,019.41 | | $5.85 |
| R3 | | Actual (i) | | 0.90% | | $1,000.00 | | $1,008.04 | | $1.53 |
| | Hypothetical (h) | | 0.90% | | $1,000.00 | | $1,020.67 | | $4.58 |
| R4 | | Actual (i) | | 0.65% | | $1,000.00 | | $1,008.45 | | $1.11 |
| | Hypothetical (h) | | 0.65% | | $1,000.00 | | $1,021.93 | | $3.31 |
| (h) | 5% class return per year before expenses. |
| (i) | For the period of the class inception, 07/01/08 through the stated period end. |
| (p) | Expenses paid is equal to each class’ annualized expense ratio, as shown above, multiplied by the average account value over the period, multiplied by the number of days in the period, divided by the number of days in the year. Expenses paid do not include any applicable sales charges (loads). If these transaction costs had been included, your costs would have been higher. |
4
PORTFOLIO OF INVESTMENTS
8/31/08 (unaudited)
The Portfolio of Investments is a complete list of all securities owned by your fund. It is categorized by broad-based asset classes.
| | | | | | |
| Bonds - 58.1% | | | | | | |
| Issuer | | Shares/Par | | Value ($) |
| | | | | | |
| Aerospace - 0.2% | | | | | | |
| Hawker Beechcraft Acquisition Co. LLC, 9.75%, 2017 (l) | | $ | 270,000 | | $ | 264,600 |
| Vought Aircraft Industries, Inc., 8%, 2011 | | | 305,000 | | | 281,363 |
| | | | | | |
| | | | | | $ | 545,963 |
| Agency - Other - 1.7% | | | | | | |
| Financing Corp., 9.4%, 2018 | | $ | 965,000 | | $ | 1,313,743 |
| Financing Corp., 10.35%, 2018 | | | 1,415,000 | | | 2,050,413 |
| Financing Corp., STRIPS, 0%, 2017 | | | 860,000 | | | 576,190 |
| | | | | | |
| | | | | | $ | 3,940,346 |
| Airlines - 0.1% | | | | | | |
| Continental Airlines, Inc., 7.339%, 2014 | | $ | 390,000 | | $ | 291,525 |
| | |
| Asset Backed & Securitized - 0.7% | | | | | | |
| Banc of America Commercial Mortgage, Inc., 5.39%, 2045 | | $ | 70,467 | | $ | 60,032 |
| Banc of America Commercial Mortgage, Inc., FRN, 5.772%, 2017 | | | 500,000 | | | 421,506 |
| Banc of America Commercial Mortgage, Inc., FRN, 6.003%, 2017 | | | 145,867 | | | 124,491 |
| Citigroup Commercial Mortgage Trust, FRN, 5.889%, 2017 | | | 198,555 | | | 97,572 |
| Credit Suisse Mortgage Capital Certificate, 5.343%, 2039 | | | 48,162 | | | 40,656 |
| JPMorgan Chase Commercial Mortgage Securities Corp., 5.44%, 2045 | | | 237,347 | | | 202,720 |
JPMorgan Chase Commercial Mortgage Securities Corp.,
FRN, 5.466%, 2047 | | | 189,579 | | | 158,440 |
Merrill Lynch/Countrywide Commercial Mortgage Trust,
FRN, 5.204%, 2049 | | | 256,753 | | | 215,424 |
Merrill Lynch/Countrywide Commercial Mortgage Trust,
FRN, 5.902%, 2050 | | | 66,000 | | | 56,203 |
| Wachovia Bank Commercial Mortgage Trust, FRN, 5.944%, 2047 | | | 116,771 | | | 67,575 |
| Wachovia Bank Commercial Mortgage Trust, FRN, 6.1%, 2051 | | | 256,150 | | | 219,768 |
| | | | | | |
| | | | | | $ | 1,664,387 |
| Automotive - 1.1% | | | | | | |
| Accuride Corp., 8.5%, 2015 (l) | | $ | 100,000 | | $ | 64,500 |
| Allison Transmission, Inc., 11%, 2015 (l)(n) | | | 655,000 | | | 602,600 |
| FCE Bank PLC, 7.125%, 2012 | | | EUR 350,000 | | | 426,120 |
| Ford Motor Credit Co. LLC, 9.75%, 2010 | | $ | 185,000 | | | 161,174 |
| Ford Motor Credit Co. LLC, 12%, 2015 | | | 755,000 | | | 638,649 |
| Ford Motor Credit Co. LLC, 8%, 2016 (l) | | | 650,000 | | | 468,346 |
| General Motors Corp., 8.375%, 2033 (l) | | | 400,000 | | | 198,000 |
| | | | | | |
| | | | | | $ | 2,559,389 |
5
Portfolio of Investments (unaudited) – continued
| | | | | | |
| Issuer | | Shares/Par | | Value ($) |
| | | | | | |
| Bonds - continued | | | | | | |
| Broadcasting - 1.6% | | | | | | |
| Allbritton Communications Co., 7.75%, 2012 | | $ | 445,000 | | $ | 398,275 |
| Bonten Media Acquisition Co., 9%, 2015 (n)(p) | | | 285,000 | | | 208,050 |
| CanWest MediaWorks LP, 9.25%, 2015 (n) | | | 120,000 | | | 93,600 |
| DIRECTV Holdings LLC, 7.625%, 2016 (n) | | | 340,000 | | | 339,150 |
| Grupo Televisa S.A., 8.5%, 2032 | | | 84,000 | | | 98,560 |
| Lamar Media Corp., 6.625%, 2015 | | | 390,000 | | | 346,125 |
| Lamar Media Corp., “C”, 6.625%, 2015 | | | 140,000 | | | 124,075 |
| LBI Media, Inc., 8.5%, 2017 (n) | | | 185,000 | | | 134,356 |
| LIN TV Corp., 6.5%, 2013 | | | 650,000 | | | 533,000 |
| Local TV Finance LLC, 9.25%, 2015 (n)(p) | | | 445,000 | | | 329,300 |
| Newport Television LLC, 13%, 2017 (n)(p) | | | 495,000 | | | 373,725 |
| Nexstar Broadcasting Group, Inc., 7%, 2014 | | | 325,000 | | | 266,500 |
| Univision Communications, Inc., 9.75%, 2015 (l)(n)(p) | | | 625,000 | | | 446,875 |
| Young Broadcasting, Inc., 8.75%, 2014 | | | 110,000 | | | 36,025 |
| | | | | | |
| | | | | | $ | 3,727,616 |
| Brokerage & Asset Managers - 0.2% | | | | | | |
| Nuveen Investments, Inc., 10.5%, 2015 (n) | | $ | 450,000 | | $ | 390,375 |
| | |
| Building - 0.4% | | | | | | |
| Associated Materials, Inc., 9.75%, 2012 | | $ | 90,000 | | $ | 89,775 |
| Associated Materials, Inc., 0% to 2009, 11.25% to 2014 (l) | | | 295,000 | | | 197,650 |
| Building Materials Corp. of America, 7.75%, 2014 | | | 175,000 | | | 144,375 |
| Nortek Holdings, Inc., 10%, 2013 (n) | | | 145,000 | | | 135,575 |
| Nortek Holdings, Inc., 8.5%, 2014 | | | 170,000 | | | 103,700 |
| Ply Gem Industries, Inc., 9%, 2012 (l) | | | 325,000 | | | 178,750 |
| Ply Gem Industries, Inc., 11.75%, 2013 (n) | | | 110,000 | | | 100,100 |
| | | | | | |
| | | | | | $ | 949,925 |
| Business Services - 0.4% | | | | | | |
| First Data Corp., 9.875%, 2015 (n) | | $ | 490,000 | | $ | 422,625 |
| SunGard Data Systems, Inc., 10.25%, 2015 | | | 452,000 | | | 455,390 |
| | | | | | |
| | | | | | $ | 878,015 |
| Cable TV - 1.3% | | | | | | |
| CCH I Holdings LLC, 11%, 2015 (l) | | $ | 360,000 | | $ | 276,300 |
| CCH II Holdings LLC, 10.25%, 2010 | | | 405,000 | | | 388,800 |
| CCO Holdings LLC, 8.75%, 2013 | | | 1,185,000 | | | 1,116,862 |
| CSC Holdings, Inc., 6.75%, 2012 | | | 315,000 | | | 307,125 |
| CSC Holdings, Inc., 8.5%, 2015 (n) | | | 295,000 | | | 296,475 |
| Mediacom LLC, 9.5%, 2013 | | | 270,000 | | | 261,225 |
| NTL Cable PLC, 9.125%, 2016 | | | 300,000 | | | 285,750 |
| | | | | | |
| | | | | | $ | 2,932,537 |
6
Portfolio of Investments (unaudited) – continued
| | | | | | |
| Issuer | | Shares/Par | | Value ($) |
| | | | | | |
| Bonds - continued | | | | | | |
| Chemicals - 1.0% | | | | | | |
| Braskem S.A., 7.25%, 2018 (l)(z) | | $ | 195,000 | | $ | 194,025 |
| Innophos, Inc., 8.875%, 2014 | | | 615,000 | | | 630,375 |
| Koppers Holdings, Inc., 9.875%, 2013 | | | 190,000 | | | 199,500 |
| Momentive Performance Materials, Inc., 9.75%, 2014 | | | 100,000 | | | 90,250 |
| Momentive Performance Materials, Inc., 11.5%, 2016 (l) | | | 440,000 | | | 343,200 |
| Nalco Co., 7.75%, 2011 | | | 145,000 | | | 146,813 |
| Nalco Co., 8.875%, 2013 | | | 610,000 | | | 634,400 |
| | | | | | |
| | | | | | $ | 2,238,563 |
| Consumer Goods & Services - 0.5% | | | | | | |
| Corrections Corp. of America, 6.25%, 2013 | | $ | 145,000 | | $ | 142,100 |
| Jarden Corp., 7.5%, 2017 | | | 100,000 | | | 89,000 |
| KAR Holdings, Inc., 10%, 2015 | | | 300,000 | | | 252,750 |
| Service Corp. International, 7.375%, 2014 | | | 120,000 | | | 117,000 |
| Service Corp. International, 7%, 2017 | | | 540,000 | | | 503,550 |
| Ticketmaster, 10.75%, 2016 (z) | | | 135,000 | | | 138,375 |
| | | | | | |
| | | | | | $ | 1,242,775 |
| Containers - 0.5% | | | | | | |
| Crown Americas LLC, 7.625%, 2013 | | $ | 190,000 | | $ | 193,325 |
| Greif, Inc., 6.75%, 2017 | | | 570,000 | | | 552,900 |
| Owens-Brockway Glass Container, Inc., 8.25%, 2013 | | | 450,000 | | | 463,500 |
| | | | | | |
| | | | | | $ | 1,209,725 |
| Defense Electronics - 0.2% | | | | | | |
| L-3 Communications Corp., 5.875%, 2015 | | $ | 450,000 | | $ | 424,125 |
| | |
| Electronics - 0.2% | | | | | | |
| Flextronics International Ltd., 6.25%, 2014 | | $ | 250,000 | | $ | 230,625 |
| Spansion LLC, 11.25%, 2016 (l)(n) | | | 435,000 | | | 271,875 |
| | | | | | |
| | | | | | $ | 502,500 |
| Emerging Market Quasi-Sovereign - 3.8% | | | | | | |
Banco Nacional de Desenvolvimento Economico e Social,
6.369%, 2018 (n) | | $ | 565,000 | | $ | 569,237 |
| Corporación Nacional del Cobre de Chile, 4.75%, 2014 | | | 1,348,000 | | | 1,321,059 |
| Corporación Nacional del Cobre de Chile, 5.625%, 2035 | | | 1,645,000 | | | 1,466,948 |
| Gazprom International S.A., 7.201%, 2020 | | | 1,247,763 | | | 1,240,402 |
| NAK Naftogaz Ukrainy, 8.125%, 2009 | | | 500,000 | | | 437,550 |
| National Power Corp., 6.875%, 2016 (n) | | | 100,000 | | | 96,750 |
| National Power Corp., 6.875%, 2016 | | | 300,000 | | | 290,250 |
| National Power Corp., FRN, 7.061%, 2011 | | | 381,000 | | | 398,681 |
| Pemex Project Funding Master Trust, 5.75%, 2018 (n) | | | 711,000 | | | 698,525 |
| Pemex Project Funding Master Trust, 5.75%, 2018 | | | 485,000 | | | 476,490 |
| Pemex Project Funding Master Trust, 6.625%, 2035 | | | 1,882,000 | | | 1,857,831 |
| | | | | | |
| | | | | | $ | 8,853,723 |
7
Portfolio of Investments (unaudited) – continued
| | | | | | |
| Issuer | | Shares/Par | | Value ($) |
| | | | | | |
| Bonds - continued | | | | | | |
| Emerging Market Sovereign - 7.9% | | | | | | |
| Banque Centrale de Tunisie, 7.375%, 2012 | | $ | 200,000 | | $ | 212,000 |
| Federative Republic of Brazil, 6%, 2017 | | | 2,698,000 | | | 2,762,752 |
| Federative Republic of Brazil, 8%, 2018 | | | 1,033,000 | | | 1,152,828 |
| Gabonese Republic, 8.2%, 2017 | | | 525,000 | | | 535,500 |
| Republic of Argentina, FRN, 3.127%, 2012 | | | 442,450 | | | 351,018 |
| Republic of Colombia, 7.375%, 2017 | | | 729,000 | | | 801,900 |
| Republic of Colombia, 7.375%, 2037 | | | 675,000 | | | 739,800 |
| Republic of Croatia, FRN, 3.938%, 2010 | | | 454,545 | | | 451,136 |
| Republic of El Salvador, 7.65%, 2035 | | | 200,000 | | | 206,000 |
| Republic of Indonesia, 6.875%, 2018 (n) | | | 305,000 | | | 304,619 |
| Republic of Indonesia, 8.5%, 2035 | | | 1,265,000 | | | 1,358,328 |
| Republic of Indonesia, 7.75%, 2038 (n) | | | 509,000 | | | 503,910 |
| Republic of Panama, 7.25%, 2015 | | | 573,000 | | | 621,705 |
| Republic of Panama, 9.375%, 2029 | | | 887,000 | | | 1,173,058 |
| Republic of Peru, 8.375%, 2016 | | | 202,000 | | | 236,986 |
| Republic of Peru, 6.55%, 2037 | | | 802,000 | | | 822,050 |
| Republic of Philippines, 9.375%, 2017 | | | 460,000 | | | 549,700 |
| Republic of Philippines, 7.75%, 2031 | | | 575,000 | | | 629,625 |
| Republic of Turkey, 7.25%, 2015 | | | 657,000 | | | 683,280 |
| Republic of Turkey, 7.375%, 2025 | | | 297,000 | | | 299,599 |
| Republic of Turkey, 8%, 2034 | | | 85,000 | | | 89,888 |
| Republic of Turkey, 6.875%, 2036 | | | 575,000 | | | 535,469 |
| Republic of Uruguay, 8%, 2022 | | | 1,351,000 | | | 1,438,815 |
| Republic of Uruguay, 7.625%, 2036 | | | 700,000 | | | 708,750 |
| Russian Federation, 7.5%, 2030 | | | 683,658 | | | 763,229 |
| United Mexican States, 6.05%, 2040 | | | 466,000 | | | 452,486 |
| | | | | | |
| | | | | | $ | 18,384,431 |
| Energy - Independent - 1.5% | | | | | | |
| Chaparral Energy, Inc., 8.875%, 2017 | | $ | 175,000 | | $ | 151,812 |
| Chesapeake Energy Corp., 6.375%, 2015 | | | 370,000 | | | 344,100 |
| Chesapeake Energy Corp., 6.875%, 2016 | | | 515,000 | | | 494,400 |
| Forest Oil Corp., 7.25%, 2019 | | | 210,000 | | | 193,200 |
| Forest Oil Corp., 7.25%, 2019 (n) | | | 45,000 | | | 41,400 |
| Hilcorp Energy I LP, 9%, 2016 (n) | | | 340,000 | | | 331,500 |
| Mariner Energy, Inc., 8%, 2017 | | | 195,000 | | | 178,425 |
| OPTI Canada, Inc., 8.25%, 2014 | | | 395,000 | | | 394,506 |
| Plains Exploration & Production Co., 7%, 2017 | | | 520,000 | | | 468,000 |
| Quicksilver Resources, Inc., 7.125%, 2016 | | | 490,000 | | | 426,300 |
| SandRidge Energy, Inc., 8.625%, 2015 (n)(p) | | | 115,000 | | | 111,263 |
| SandRidge Energy, Inc., 8%, 2018 (n) | | | 320,000 | | | 300,000 |
| | | | | | |
| | | | | | $ | 3,434,906 |
8
Portfolio of Investments (unaudited) – continued
| | | | | | |
| Issuer | | Shares/Par | | Value ($) |
| | | | | | |
| Bonds - continued | | | | | | |
| Energy - Integrated - 0.3% | | | | | | |
| Petroleum Co. of Trinidad & Tobago Ltd., 6%, 2022 (n) | | $ | 746,000 | | $ | 719,219 |
| | |
| Entertainment - 0.1% | | | | | | |
| AMC Entertainment, Inc., 11%, 2016 | | $ | 200,000 | | $ | 203,000 |
| Marquee Holdings, Inc., 9.505%, 2014 | | | 120,000 | | | 95,400 |
| | | | | | |
| | | | | | $ | 298,400 |
| Financial Institutions - 0.3% | | | | | | |
| General Motors Acceptance Corp., 6.875%, 2011 | | $ | 710,000 | | $ | 440,583 |
| General Motors Acceptance Corp., 8%, 2031 | | | 295,000 | | | 159,108 |
| | | | | | |
| | | | | | $ | 599,691 |
| Food & Beverages - 0.4% | | | | | | �� |
| ARAMARK Corp., 8.5%, 2015 | | $ | 285,000 | | $ | 287,137 |
| Dean Foods Co., 7%, 2016 | | | 450,000 | | | 416,250 |
| Del Monte Corp., 6.75%, 2015 | | | 300,000 | | | 282,000 |
| | | | | | |
| | | | | | $ | 985,387 |
| Forest & Paper Products - 0.8% | | | | | | |
| Buckeye Technologies, Inc., 8%, 2010 | | $ | 384,000 | | $ | 381,120 |
| Georgia-Pacific Corp., 7.125%, 2017 (n) | | | 165,000 | | | 153,037 |
| Georgia-Pacific Corp., 8%, 2024 | | | 90,000 | | | 82,350 |
| Graphic Packaging International Corp., 9.5%, 2013 | | | 405,000 | | | 380,700 |
| Millar Western Forest Products Ltd., 7.75%, 2013 | | | 585,000 | | | 356,850 |
| NewPage Holding Corp., 10%, 2012 | | | 415,000 | | | 402,550 |
| Smurfit-Stone Container Corp., 8%, 2017 | | | 220,000 | | | 176,000 |
| | | | | | |
| | | | | | $ | 1,932,607 |
| Gaming & Lodging - 1.7% | | | | | | |
| Firekeepers Development Authority, 13.875%, 2015 (z) | | $ | 145,000 | | $ | 133,762 |
| Fontainebleau Las Vegas Holdings LLC, 10.25%, 2015 (n) | | | 720,000 | | | 340,200 |
| Harrah’s Operating Co., Inc., 5.5%, 2010 | | | 600,000 | | | 504,000 |
| Harrah’s Operating Co., Inc., 10.75%, 2016 (n) | | | 500,000 | | | 336,250 |
| Harrah’s Operating Co., Inc., 10.75%, 2018 (l)(n)(p) | | | 325,000 | | | 195,000 |
| Host Hotels & Resorts, Inc., 7.125%, 2013 | | | 185,000 | | | 174,362 |
| Host Hotels & Resorts, Inc., 6.75%, 2016 | | | 150,000 | | | 129,000 |
| MGM Mirage, 8.375%, 2011 | | | 325,000 | | | 294,938 |
| MGM Mirage, 6.75%, 2013 | | | 750,000 | | | 652,500 |
| Pinnacle Entertainment, Inc., 7.5%, 2015 | | | 520,000 | | | 403,000 |
| Station Casinos, Inc., 6%, 2012 (l) | | | 95,000 | | | 66,263 |
| Station Casinos, Inc., 6.5%, 2014 (l) | | | 440,000 | | | 198,000 |
| Station Casinos, Inc., 6.875%, 2016 (l) | | | 475,000 | | | 206,625 |
| Trump Entertainment Resorts Holdings, Inc., 8.5%, 2015 (l) | | | 800,000 | | | 366,000 |
| | | | | | |
| | | | | | $ | 3,999,900 |
9
Portfolio of Investments (unaudited) – continued
| | | | | | |
| Issuer | | Shares/Par | | Value ($) |
| | | | | | |
| Bonds - continued | | | | | | |
| Industrial - 0.3% | | | | | | |
| Blount, Inc., 8.875%, 2012 | | $ | 280,000 | | $ | 285,600 |
| JohnsonDiversey Holdings, Inc., 9.625%, 2012 | | EUR | 75,000 | | | 105,613 |
| JohnsonDiversey Holdings, Inc., 10.67%, 2013 | | $ | 240,000 | | | 241,200 |
| | | | | | |
| | | | | | $ | 632,413 |
| Insurance - Property & Casualty - 0.1% | | | | | | |
| USI Holdings Corp., 9.75%, 2015 (n) | | $ | 205,000 | | $ | 163,488 |
| | |
| Major Banks - 0.3% | | | | | | |
| Bank of America Corp., 8% to 2018, FRN to 2059 | | $ | 310,000 | | $ | 276,267 |
| JPMorgan Chase & Co., 7.9% to 2018, FRN to 2049 | | | 435,000 | | | 395,198 |
| | | | | | |
| | | | | | $ | 671,465 |
| Medical & Health Technology & Services - 2.9% | | | | | | |
| Biomet, Inc., 10%, 2017 | | $ | 470,000 | | $ | 507,600 |
| Biomet, Inc., 11.625%, 2017 | | | 210,000 | | | 220,762 |
| Community Health Systems, Inc., 8.875%, 2015 | | | 1,115,000 | | | 1,126,150 |
| Cooper Cos., Inc., 7.125%, 2015 | | | 230,000 | | | 220,800 |
| DaVita, Inc., 7.25%, 2015 | | | 720,000 | | | 708,300 |
| HCA, Inc., 8.75%, 2010 | | | 1,140,000 | | | 1,151,400 |
| HCA, Inc., 6.375%, 2015 | | | 395,000 | | | 325,875 |
| HCA, Inc., 9.25%, 2016 | | | 1,275,000 | | | 1,311,656 |
| Psychiatric Solutions, Inc., 7.75%, 2015 | | | 190,000 | | | 184,300 |
| U.S. Oncology, Inc., 10.75%, 2014 | | | 450,000 | | | 451,125 |
| Universal Hospital Services, Inc., 8.5%, 2015 (p) | | | 205,000 | | | 203,975 |
| Universal Hospital Services, Inc., FRN, 6.303%, 2015 | | | 65,000 | | | 60,450 |
| VWR Funding, Inc., 10.25%, 2015 (p) | | | 355,000 | | | 323,050 |
| | | | | | |
| | | | | | $ | 6,795,443 |
| Metals & Mining - 1.1% | | | | | | |
| FMG Finance Ltd., 10.625%, 2016 (n) | | $ | 790,000 | | $ | 884,800 |
| Freeport-McMoRan Copper & Gold, Inc., 8.375%, 2017 | | | 670,000 | | | 710,200 |
| Freeport-McMoRan Copper & Gold, Inc., FRN, 5.883%, 2015 | | | 280,000 | | | 280,739 |
| Peabody Energy Corp., 7.375%, 2016 | | | 105,000 | | | 108,150 |
| Peabody Energy Corp., “B”, 6.875%, 2013 | | | 540,000 | | | 546,750 |
| | | | | | |
| | | | | | $ | 2,530,639 |
| Mortgage Backed - 15.0% | | | | | | |
| Fannie Mae, 4.35%, 2013 | | $ | 184,619 | | $ | 179,389 |
| Fannie Mae, 4.374%, 2013 | | | 131,943 | | | 128,674 |
| Fannie Mae, 4.518%, 2013 | | | 122,779 | | | 120,625 |
| Fannie Mae, 5.369%, 2013 | | | 96,983 | | | 98,615 |
| Fannie Mae, 4.56%, 2014-2015 | | | 207,766 | | | 201,945 |
10
Portfolio of Investments (unaudited) – continued
| | | | | | |
| Issuer | | Shares/Par | | Value ($) |
| | | | | | |
| Bonds - continued | | | | | | |
| Mortgage Backed - continued | | | | | | |
| Fannie Mae, 4.76%, 2014 | | $ | 84,176 | | $ | 83,191 |
| Fannie Mae, 4.88%, 2014 | | | 103,672 | | | 102,261 |
| Fannie Mae, 4.935%, 2014 | | | 168,018 | | | 166,767 |
| Fannie Mae, 5.033%, 2014 | | | 316,222 | | | 313,303 |
| Fannie Mae, 4.6%, 2015 | | | 28,686 | | | 27,729 |
| Fannie Mae, 4.69%, 2015 | | | 200,399 | | | 195,377 |
| Fannie Mae, 4.7%, 2015 | | | 61,853 | | | 60,295 |
| Fannie Mae, 4.78%, 2015 | | | 85,101 | | | 83,085 |
| Fannie Mae, 4.79%, 2015 | | | 128,042 | | | 125,125 |
| Fannie Mae, 4.85%, 2015 | | | 184,505 | | | 181,344 |
| Fannie Mae, 4.856%, 2015 | | | 155,038 | | | 150,683 |
| Fannie Mae, 4.925%, 2015 | | | 152,241 | | | 150,308 |
| Fannie Mae, 4.97%, 2015 | | | 191,488 | | | 187,227 |
| Fannie Mae, 5.022%, 2015 | | | 167,969 | | | 165,440 |
| Fannie Mae, 5.034%, 2015 | | | 66,516 | | | 65,792 |
| Fannie Mae, 5.09%, 2016 | | | 67,739 | | | 67,051 |
| Fannie Mae, 5.259%, 2016 | | | 75,000 | | | 73,951 |
| Fannie Mae, 5.423%, 2016 | | | 33,940 | | | 34,293 |
| Fannie Mae, 5.574%, 2016 | | | 111,587 | | | 112,001 |
| Fannie Mae, 5.93%, 2016 | | | 121,012 | | | 125,462 |
| Fannie Mae, 6.039%, 2016 | | | 67,937 | | | 70,235 |
| Fannie Mae, 4.996%, 2017 | | | 280,086 | | | 276,263 |
| Fannie Mae, 5.218%, 2017 | | | 70,000 | | | 68,829 |
| Fannie Mae, 5.228%, 2017 | | | 110,000 | | | 108,215 |
| Fannie Mae, 5.32%, 2017 | | | 115,642 | | | 115,426 |
| Fannie Mae, 5.456%, 2017 | | | 115,000 | | | 114,560 |
| Fannie Mae, 5.476%, 2017 | | | 167,371 | | | 166,873 |
| Fannie Mae, 5.5%, 2017-2038 | | | 10,388,722 | | | 10,319,831 |
| Fannie Mae, 5.559%, 2017 | | | 108,335 | | | 108,526 |
| Fannie Mae, 5.631%, 2017 | | | 112,195 | | | 112,844 |
| Fannie Mae, 5.724%, 2017 | | | 190,000 | | | 192,097 |
| Fannie Mae, 6%, 2017-2037 | | | 3,973,004 | | | 4,029,188 |
| Fannie Mae, 6.5%, 2017-2037 | | | 341,584 | | | 352,318 |
| Fannie Mae, 4.5%, 2018-2020 | | | 2,232,859 | | | 2,196,867 |
| Fannie Mae, 5.19%, 2020 | | | 98,891 | | | 95,908 |
| Fannie Mae, 5.35%, 2023 | | | 97,192 | | | 96,831 |
| Fannie Mae, 5%, 2025-2028 | | | 1,724,096 | | | 1,740,081 |
| Freddie Mac, 4.5%, 2015-2021 | | | 97,472 | | | 98,048 |
| Freddie Mac, 6%, 2017-2038 | | | 613,725 | | | 620,051 |
| Freddie Mac, 5%, 2018-2027 | | | 3,441,936 | | | 3,461,975 |
| Freddie Mac, 5.5%, 2022-2035 | | | 3,106,787 | | | 3,115,198 |
| Freddie Mac, 4%, 2024 | | | 173,226 | | | 173,084 |
11
Portfolio of Investments (unaudited) – continued
| | | | | | |
| Issuer | | Shares/Par | | Value ($) |
| | | | | | |
| Bonds - continued | | | | | | |
| Mortgage Backed - continued | | | | | | |
| Freddie Mac, 6.5%, 2037 | | $ | 1,298,983 | | $ | 1,335,698 |
| Ginnie Mae, 5.5%, 2033-2038 | | | 2,261,637 | | | 2,261,539 |
| Ginnie Mae, 5.612%, 2058 | | | 344,398 | | | 346,066 |
| Ginnie Mae, 6.36%, 2058 | | | 295,139 | | | 305,664 |
| | | | | | |
| | | | | | $ | 35,082,148 |
| Municipals - 0.8% | | | | | | |
| California Educational Facilities Authority Rev. (Stanford University), “T-1”, 5%, 2039 | | $ | 585,000 | | $ | 610,371 |
| Illinois Regional Transportation Authority, “A”, N, 5.75%, 2034 | | | 295,000 | | | 333,382 |
| Massachusetts Bay Transportation Authority, Sales Tax Rev., “A-1”, 5.25%, 2028 | | | 270,000 | | | 296,733 |
| Massachusetts Water Resources Authority Rev., “B”, N, 5.25%, 2035 | | | 345,000 | | | 370,485 |
| Minnesota Public Facilities Authority, Water Pollution Control Rev., “B”, 5%, 2018 | | | 310,000 | | | 343,055 |
| | | | | | |
| | | | | | $ | 1,954,026 |
| Natural Gas - Distribution - 0.4% | | | | | | |
| AmeriGas Partners LP, 7.125%, 2016 | | $ | 285,000 | | $ | 265,050 |
| Inergy LP, 6.875%, 2014 | | | 820,000 | | | 738,000 |
| | | | | | |
| | | | | | $ | 1,003,050 |
| Natural Gas - Pipeline - 0.5% | | | | | | |
| Atlas Pipeline Partners LP, 8.75%, 2018 (n) | | $ | 190,000 | | $ | 185,250 |
Deutsche Bank (El Paso Performance-Linked Trust, CLN),
7.75%, 2011 (n) | | | 280,000 | | | 283,079 |
| El Paso Corp., 7.25%, 2018 | | | 190,000 | | | 186,675 |
| Intergas Finance B.V., 6.875%, 2011 | | | 300,000 | | | 289,500 |
| Williams Partners LP, 7.25%, 2017 | | | 295,000 | | | 295,738 |
| | | | | | |
| | | | | | $ | 1,240,242 |
| Network & Telecom - 1.0% | | | | | | |
| Cincinnati Bell, Inc., 8.375%, 2014 | | $ | 395,000 | | $ | 373,769 |
| Citizens Communications Co., 9.25%, 2011 | | | 275,000 | | | 284,625 |
| Nordic Telephone Co. Holdings, 8.875%, 2016 (n) | | | 195,000 | | | 187,688 |
| Qwest Capital Funding, Inc., 7.25%, 2011 | | | 985,000 | | | 946,831 |
| Qwest Corp., 7.875%, 2011 | | | 115,000 | | | 114,138 |
| Windstream Corp., 8.625%, 2016 | | | 385,000 | | | 381,150 |
| | | | | | |
| | | | | | $ | 2,288,201 |
| Oil Services - 0.7% | | | | | | |
| KazMunaiGaz Finance B.V., 8.375%, 2013 (z) | | $ | 1,285,000 | | $ | 1,304,275 |
| KazMunaiGaz Finance B.V., 9.125%, 2018 (z) | | | 406,000 | | | 414,628 |
| | | | | | |
| | | | | | $ | 1,718,903 |
12
Portfolio of Investments (unaudited) – continued
| | | | | | |
| Issuer | | Shares/Par | | Value ($) |
| | | | | | |
| Bonds - continued | | | | | | |
| Other Banks & Diversified Financials - 0.0% | | | | | | |
| RSHB Capital S.A., 7.125%, 2014 (z) | | $ | 100,000 | | $ | 97,430 |
| | |
| Precious Metals & Minerals - 0.2% | | | | | | |
| Alrosa Finance S.A., 8.875%, 2014 | | $ | 482,000 | | $ | 491,004 |
| | |
| Printing & Publishing - 0.8% | | | | | | |
| American Media Operations, Inc., 10.25%, 2009 (z) | | $ | 14,726 | | $ | 11,044 |
| American Media Operations, Inc., “B”, 10.25%, 2009 (l) | | | 405,000 | | | 303,750 |
| Dex Media West LLC, 9.875%, 2013 | | | 443,000 | | | 341,110 |
| Dex Media, Inc., 0% to 2008, 9% to 2013 | | | 250,000 | | | 145,000 |
| Idearc, Inc., 8%, 2016 | | | 591,000 | | | 267,428 |
| Nielsen Finance LLC, 10%, 2014 | | | 575,000 | | | 582,188 |
| Nielsen Finance LLC, 0% to 2011, 12.5% to 2016 | | | 25,000 | | | 17,125 |
| Quebecor World, Inc., 6.125%, 2013 (d) | | | 120,000 | | | 42,900 |
| R.H. Donnelley Corp., 8.875%, 2016 | | | 255,000 | | | 133,875 |
| | | | | | |
| | | | | | $ | 1,844,420 |
| Retailers - 0.1% | | | | | | |
| Couche-Tard, Inc., 7.5%, 2013 | | $ | 40,000 | | $ | 37,300 |
| Sally Beauty Holdings, Inc., 10.5%, 2016 (l) | | | 140,000 | | | 140,700 |
| | | | | | |
| | | | | | $ | 178,000 |
| Specialty Stores - 0.1% | | | | | | |
| Payless ShoeSource, Inc., 8.25%, 2013 | | $ | 170,000 | | $ | 154,700 |
| | |
| Telecommunications - Wireless - 0.7% | | | | | | |
| Alltel Corp., 7%, 2012 | | $ | 278,000 | | $ | 285,645 |
| MetroPCS Wireless, Inc., 9.25%, 2014 | | | 285,000 | | | 282,506 |
| Vimpel-Communications, 8.375%, 2013 (z) | | | 366,000 | | | 353,737 |
| Wind Acquisition Finance S.A., 10.75%, 2015 (n) | | | 750,000 | | | 768,750 |
| | | | | | |
| | | | | | $ | 1,690,638 |
| Transportation - Services - 0.1% | | | | | | |
| Hertz Corp., 8.875%, 2014 | | $ | 180,000 | | $ | 168,525 |
| | |
| U.S. Government Agencies - 0.6% | | | | | | |
| Small Business Administration, 6.34%, 2021 | | $ | 413,637 | | $ | 423,941 |
| Small Business Administration, 6.07%, 2022 | | | 359,616 | | | 370,988 |
| Small Business Administration, 5.16%, 2028 | | | 489,046 | | | 469,631 |
| | | | | | |
| | | | | | $ | 1,264,560 |
13
Portfolio of Investments (unaudited) – continued
| | | | | | |
| Issuer | | Shares/Par | | Value ($) |
| | | | | | |
| Bonds - continued | | | | | | |
| U.S. Treasury Obligations - 3.5% | | | | | | |
| U.S. Treasury Bonds, 9.25%, 2016 | | $ | 47,000 | | $ | 64,577 |
| U.S. Treasury Bonds, 4.75%, 2017 (l) | | | 513,000 | | | 552,597 |
| U.S. Treasury Bonds, 6.75%, 2026 (l) | | | 2,686,000 | | | 3,452,770 |
| U.S. Treasury Bonds, 4.375%, 2038 | | | 130,000 | | | 129,076 |
| U.S. Treasury Notes, 4.75%, 2010 | | | 55,000 | | | 57,037 |
| U.S. Treasury Notes, 5.125%, 2011 (f)(l) | | | 531,000 | | | 567,714 |
| U.S. Treasury Notes, 4.125%, 2012 (l) | | | 294,000 | | | 307,666 |
| U.S. Treasury Notes, 4%, 2014 (l) | | | 18,000 | | | 18,792 |
| U.S. Treasury Notes, 4.75%, 2014 (l) | | | 1,044,000 | | | 1,132,414 |
| U.S. Treasury Notes, 4.25%, 2017 (l) | | | 1,785,000 | | | 1,855,284 |
| | | | | | |
| | | | | | $ | 8,137,927 |
| Utilities - Electric Power - 2.0% | | | | | | |
| Centrais Eletricas Brasileiras S.A., 7.75%, 2015 | | $ | 418,000 | | $ | 438,900 |
| Dynegy Holdings, Inc., 7.5%, 2015 | | | 180,000 | | | 169,200 |
| Edison Mission Energy, 7%, 2017 | | | 445,000 | | | 426,087 |
| Enersis S.A., 7.375%, 2014 | | | 450,000 | | | 478,567 |
| Mirant Americas Generation LLC, 8.3%, 2011 | | | 600,000 | | | 612,000 |
| Mirant North America LLC, 7.375%, 2013 | | | 135,000 | | | 133,988 |
| NRG Energy, Inc., 7.375%, 2016 | | | 1,325,000 | | | 1,308,438 |
| Reliant Energy, Inc., 7.875%, 2017 | | | 415,000 | | | 400,475 |
| Texas Competitive Electric Holdings LLC, 10.25%, 2015 (n) | | | 715,000 | | | 713,213 |
| | | | | | |
| | | | | | $ | 4,680,868 |
| Total Bonds (Identified Cost, $139,724,319) | | | | | $ | 135,494,120 |
| | |
| Floating Rate Loans - 1.7% (g)(r) | | | | | | |
| Aerospace - 0.1% | | | | | | |
| Hawker Beechcraft Acquisition Co., Letter of Credit, 3.83%, 2014 | | $ | 11,609 | | $ | 10,809 |
| Hawker Beechcraft Acquisition Co., Term Loan B, 4.8%, 2014 | | | 298,331 | | | 277,774 |
| | | | | | |
| | | | | | $ | 288,583 |
| Automotive - 0.4% | | | | | | |
| Federal Mogul Corp., Term Loan B, 4.41%, 2015 | | $ | 228,446 | | $ | 175,904 |
| Ford Motor Co., Term Loan B, 5.47%, 2013 | | | 877,413 | | | 679,682 |
| Mark IV Industries, Inc., Second Lien Term Loan, 11.39%, 2011 | | | 300,597 | | | 120,239 |
| | | | | | |
| | | | | | $ | 975,825 |
| Broadcasting - 0.1% | | | | | | |
| Young Broadcasting, Inc., Term Loan, 5.31%, 2012 | | $ | 158,028 | | $ | 129,583 |
| Young Broadcasting, Inc., Term Loan B-1, 5.31%, 2012 | | | 146,253 | | | 119,928 |
| | | | | | |
| | | | | | $ | 249,511 |
14
Portfolio of Investments (unaudited) – continued
| | | | | | |
| Issuer | | Shares/Par | | Value ($) |
| | | | | | |
| Floating Rate Loans (g)(r) - continued | | | | | | |
| Business Services - 0.2% | | | | | | |
| First Data Corp., Term Loan B-1, 5.25%, 2014 | | $ | 592,152 | | $ | 542,642 |
| | |
| Forest & Paper Products - 0.1% | | | | | | |
| Abitibi-Consolidated, Inc., Term Loan, 11.5%, 2009 | | $ | 148,613 | | $ | 147,870 |
| | |
| Gaming & Lodging - 0.1% | | | | | | |
Green Valley Ranch Gaming LLC, Second Lien Term Loan,
5.72%, 2014 (o) | | $ | 302,859 | | $ | 152,187 |
| | |
| Medical & Health Technology & Services - 0.2% | | | | | | |
| Community Health Systems, Inc., Delayed Draw Term Loan B, 2014 (q) | | $ | 5,230 | | $ | 4,943 |
| Community Health Systems, Inc., Term Loan, 4.98%, 2014 | | | 102,256 | | | 96,644 |
| HCA, Inc., Term Loan B, 5.05%, 2013 | | | 431,275 | | | 403,871 |
| | | | | | |
| | | | | | $ | 505,458 |
| Printing & Publishing - 0.1% | | | | | | |
| Idearc, Inc., Term Loan B, 4.79%, 2014 | | $ | 24,561 | | $ | 17,193 |
| Tribune Co., Term Loan B, 2014 (o) | | | 347,066 | | | 229,064 |
| | | | | | |
| | | | | | $ | 246,257 |
| Retailers - 0.0% | | | | | | |
| Burlington Coat Factory, Term Loan B, 2013 (o) | | $ | 106,405 | | $ | 82,397 |
| | |
| Specialty Stores - 0.0% | | | | | | |
| Michaels Stores, Inc., Term Loan B, 4.75%, 2013 | | $ | 82,924 | | $ | 63,929 |
| | |
| Telecommunications - Wireless - 0.2% | | | | | | |
| Alltel Corp., Term Loan B-2, 5.56%, 2015 | | $ | 332,496 | | $ | 328,589 |
| | |
| Utilities - Electric Power - 0.2% | | | | | | |
| Calpine Corp., Term Loan, 5.69%, 2009 | | $ | 215,276 | | $ | 199,938 |
| TXU Corp. Term Loan B-3, 6.27%, 2014 | | | 278,833 | | | 259,315 |
| | | | | | |
| | | | | | $ | 459,253 |
| Total Floating Rate Loans (Identified Cost, $4,584,081) | | | | | $ | 4,042,501 |
| | |
| Common Stocks - 37.4% | | | | | | |
| Aerospace - 0.3% | | | | | | |
| Northrop Grumman Corp. | | | 9,476 | | $ | 652,423 |
| | |
| Airlines - 0.1% | | | | | | |
| Southwest Airlines Co. | | | 13,210 | | $ | 201,188 |
15
Portfolio of Investments (unaudited) – continued
| | | | | |
| Issuer | | Shares/Par | | Value ($) |
| | | | | |
| Common Stocks - continued | | | | | |
| Biotechnology - 0.2% | | | | | |
| Amgen, Inc. (a) | | 6,787 | | $ | 426,563 |
| | |
| Broadcasting - 0.2% | | | | | |
| Walt Disney Co. | | 15,089 | | $ | 488,129 |
| | |
| Brokerage & Asset Managers - 0.5% | | | | | |
| Goldman Sachs Group, Inc. | | 3,170 | | $ | 519,785 |
| Merrill Lynch & Co., Inc. | | 4,840 | | | 137,214 |
| Morgan Stanley | | 15,510 | | | 633,273 |
| | | | | |
| | | | | $ | 1,290,272 |
| Cable TV - 0.4% | | | | | |
| Comcast Corp., “A” | | 27,540 | | $ | 583,297 |
| Dish Network Corp., “A” (a) | | 8,340 | | | 235,271 |
| Time Warner Cable, Inc., “A” (a) | | 6,300 | | | 168,525 |
| | | | | |
| | | | | $ | 987,093 |
| Chemicals - 0.4% | | | | | |
| Dow Chemical Co. | | 13,794 | | $ | 470,789 |
| PPG Industries, Inc. | | 8,090 | | | 508,537 |
| | | | | |
| | | | | $ | 979,326 |
| Computer Software - 0.1% | | | | | |
| Oracle Corp. (a) | | 9,790 | | $ | 214,695 |
| | |
| Construction - 0.2% | | | | | |
| NVR, Inc. (a)(l) | | 600 | | $ | 358,638 |
| | |
| Consumer Goods & Services - 0.5% | | | | | |
| Kimberly-Clark Corp. | | 2,143 | | $ | 132,180 |
| Priceline.com, Inc. (a)(l) | | 1,820 | | | 169,224 |
| Procter & Gamble Co. | | 12,640 | | | 881,893 |
| | | | | |
| | | | | $ | 1,183,297 |
| Electrical Equipment - 0.8% | | | | | |
| General Electric Co. | | 54,972 | | $ | 1,544,713 |
| WESCO International, Inc. (a) | | 5,950 | | | 228,718 |
| | | | | |
| | | | | $ | 1,773,431 |
| Electronics - 0.5% | | | | | |
| Intel Corp. | | 39,567 | | $ | 904,897 |
| National Semiconductor Corp. | | 11,220 | | | 240,445 |
| | | | | |
| | | | | $ | 1,145,342 |
16
Portfolio of Investments (unaudited) – continued
| | | | | |
| Issuer | | Shares/Par | | Value ($) |
| | | | | |
| Common Stocks - continued | | | | | |
| Energy - Independent - 0.1% | | | | | |
| Apache Corp. | | 2,830 | | $ | 323,695 |
| | |
| Energy - Integrated - 2.7% | | | | | |
| Chevron Corp. | | 22,955 | | $ | 1,981,476 |
| ConocoPhillips | | 5,720 | | | 471,957 |
| Exxon Mobil Corp. | | 34,850 | | | 2,788,348 |
| Hess Corp. | | 4,440 | | | 464,912 |
| Marathon Oil Corp. | | 12,880 | | | 580,502 |
| | | | | |
| | | | | $ | 6,287,195 |
| Engineering - Construction - 0.1% | | | | | |
| Foster Wheeler Ltd. (a) | | 3,880 | | $ | 192,797 |
| | |
| Food & Beverages - 0.3% | | | | | |
| General Mills, Inc. | | 4,447 | | $ | 294,302 |
| Pepsi Bottling Group, Inc. | | 9,490 | | | 280,714 |
| SYSCO Corp. | | 3,860 | | | 122,864 |
| | | | | |
| | | | | $ | 697,880 |
| Food & Drug Stores - 0.2% | | | | | |
| CVS Caremark Corp. | | 15,580 | | $ | 570,228 |
| | |
| Forest & Paper Products - 0.7% | | | | | |
| International Paper Co. | | 4,930 | | $ | 133,357 |
| Weyerhaeuser Co. | | 28,034 | | | 1,555,607 |
| | | | | |
| | | | | $ | 1,688,964 |
| Gaming & Lodging - 0.2% | | | | | |
| Royal Caribbean Cruises Ltd. | | 13,441 | | $ | 365,326 |
| | |
| General Merchandise - 0.3% | | | | | |
| Macy’s, Inc. | | 7,995 | | $ | 166,456 |
| Wal-Mart Stores, Inc. | | 9,720 | | | 574,160 |
| | | | | |
| | | | | $ | 740,616 |
| Health Maintenance Organizations - 0.3% | | | | | |
| WellPoint, Inc. (a) | | 11,690 | | $ | 617,115 |
| | |
| Insurance - 2.0% | | | | | |
| ACE Ltd. | | 3,147 | | $ | 165,564 |
| American International Group, Inc. | | 9,260 | | | 198,997 |
| Endurance Specialty Holdings Ltd. (l) | | 6,910 | | | 225,404 |
| Genworth Financial, Inc., “A” | | 29,410 | | | 472,030 |
17
Portfolio of Investments (unaudited) – continued
| | | | | |
| Issuer | | Shares/Par | | Value ($) |
| | | | | |
| Common Stocks - continued | | | | | |
| Insurance - continued | | | | | |
| Hartford Financial Services Group, Inc. | | 9,680 | | $ | 610,614 |
| IPC Holdings Ltd. | | 13,330 | | | 422,161 |
| MetLife, Inc. | | 12,402 | | | 672,188 |
| Prudential Financial, Inc. | | 11,120 | | | 819,655 |
| Travelers Cos., Inc. | | 22,120 | | | 976,819 |
| | | | | |
| | | | | $ | 4,563,432 |
| Machinery & Tools - 0.9% | | | | | |
| Eaton Corp. | | 11,790 | | $ | 862,792 |
| Ingersoll-Rand Co. Ltd., “A” | | 6,830 | | | 252,232 |
| Timken Co. | | 26,886 | | | 868,956 |
| Trinity Industries, Inc. | | 5,330 | | | 191,773 |
| | | | | |
| | | | | $ | 2,175,753 |
| Major Banks - 2.6% | | | | | |
| Bank of America Corp. | | 63,061 | | $ | 1,963,720 |
| Bank of New York Mellon Corp. | | 3,880 | | | 134,287 |
| Comerica, Inc. | | 7,750 | | | 217,697 |
| JPMorgan Chase & Co. | | 40,080 | | | 1,542,679 |
| PNC Financial Services Group, Inc. | | 8,260 | | | 594,307 |
| Regions Financial Corp. (l) | | 18,019 | | | 167,036 |
| SunTrust Banks, Inc. | | 8,790 | | | 368,213 |
| UnionBanCal Corp. | | 3,760 | | | 277,037 |
| Wells Fargo & Co. | | 25,910 | | | 784,296 |
| | | | | |
| | | | | $ | 6,049,272 |
| Medical & Health Technology & Services - 0.2% | | | | | |
| Omnicare, Inc. (l) | | 17,080 | | $ | 550,830 |
| | |
| Metals & Mining - 0.4% | | | | | |
| Allegheny Technologies, Inc. | | 3,252 | | $ | 159,348 |
| Freeport-McMoRan Copper & Gold, Inc. | | 1,940 | | | 173,281 |
| Nucor Corp. | | 5,501 | | | 288,803 |
| United States Steel Corp. | | 1,840 | | | 244,849 |
| | | | | |
| | | | | $ | 866,281 |
| Natural Gas - Distribution - 0.1% | | | | | |
| Questar Corp. | | 2,710 | | $ | 140,622 |
| | |
| Natural Gas - Pipeline - 0.5% | | | | | |
| El Paso Corp. | | 29,200 | | $ | 489,392 |
| Williams Cos., Inc. | | 24,759 | | | 764,806 |
| | | | | |
| | | | | $ | 1,254,198 |
18
Portfolio of Investments (unaudited) – continued
| | | | | |
| Issuer | | Shares/Par | | Value ($) |
| | | | | |
| Common Stocks - continued | | | | | |
| Other Banks & Diversified Financials - 0.6% | | | | | |
| Allied Capital Corp. (l) | | 17,870 | | $ | 263,582 |
| American Capital Ltd. (l) | | 10,110 | | | 219,791 |
| Capital One Financial Corp. | | 6,250 | | | 275,875 |
| Citigroup, Inc. | | 17,053 | | | 323,836 |
| New York Community Bancorp, Inc. | | 11,680 | | | 192,603 |
| TCF Financial Corp. | | 12,020 | | | 189,315 |
| | | | | |
| | | | | $ | 1,465,002 |
| Personal Computers & Peripherals - 0.2% | | | | | |
| NetApp, Inc. (a) | | 9,130 | | $ | 232,632 |
| Western Digital Corp. (a) | | 5,170 | | | 140,934 |
| | | | | |
| | | | | $ | 373,566 |
| Pharmaceuticals - 1.8% | | | | | |
| Bristol-Myers Squibb Co. | | 22,646 | | $ | 483,266 |
| Eli Lilly & Co. | | 2,622 | | | 122,316 |
| Johnson & Johnson | | 18,380 | | | 1,294,503 |
| Merck & Co., Inc. | | 21,653 | | | 772,363 |
| Pfizer, Inc. | | 57,430 | | | 1,097,487 |
| Wyeth | | 10,530 | | | 455,738 |
| | | | | |
| | | | | $ | 4,225,673 |
| Railroad & Shipping - 0.1% | | | | | |
| Frontline Ltd. (l) | | 4,020 | | $ | 242,848 |
| | |
| Real Estate - 15.2% | | | | | |
| Alexandria Real Estate Equities, Inc., REIT | | 19,697 | | $ | 2,121,564 |
| AvalonBay Communities, Inc., REIT | | 12,373 | | | 1,237,300 |
| BRE Properties, Inc., REIT | | 29,419 | | | 1,418,878 |
| British Land Co. PLC | | 39,530 | | | 551,281 |
| Brixton PLC | | 112,095 | | | 487,563 |
| Douglas Emmett, Inc., REIT | | 11,992 | | | 283,851 |
| EastGroup Properties, Inc., REIT | | 30,231 | | | 1,344,070 |
| Equity Residential, REIT | | 27,991 | | | 1,181,220 |
| General Growth Properties, Inc., REIT | | 46,713 | | | 1,211,268 |
| Hammerson PLC | | 22,149 | | | 384,142 |
| HCP, Inc., REIT | | 9,178 | | | 332,427 |
| Highwoods Properties, Inc., REIT | | 48,844 | | | 1,771,572 |
| IMMOEAST AG (a) | | 61,511 | | | 396,098 |
| IVG Immobilien AG | | 33,170 | | | 611,599 |
| Kimco Realty Corp., REIT | | 47,700 | | | 1,771,578 |
| Lexington Corporate Properties Trust, REIT | | 87,177 | | | 1,299,809 |
| Macerich Co., REIT | | 27,133 | | | 1,680,347 |
19
Portfolio of Investments (unaudited) – continued
| | | | | |
| Issuer | | Shares/Par | | Value ($) |
| | | | | |
| Common Stocks - continued | | | | | |
| Real Estate - continued | | | | | |
| Medical Properties Trust, Inc., REIT | | 169,053 | | $ | 1,866,345 |
| Pennsylvania Real Estate Investment Trust, REIT | | 43,606 | | | 865,579 |
| Plum Creek Timber Co., Inc., REIT | | 40,267 | | | 1,998,049 |
| ProLogis, REIT | | 36,965 | | | 1,591,713 |
| Public Storage, Inc., REIT | | 16,073 | | | 1,419,567 |
| Regency Centers Corp., REIT | | 19,326 | | | 1,197,632 |
| Simon Property Group, Inc., REIT | | 33,182 | | | 3,148,308 |
| SL Green Realty Corp., REIT | | 24,128 | | | 2,075,008 |
| Ventas, Inc., REIT | | 19,859 | | | 901,996 |
| Vornado Realty Trust, REIT | | 20,421 | | | 2,031,073 |
| Wereldhave N.V. | | 3,278 | | | 366,635 |
| | | | | |
| | | | | $ | 35,546,472 |
| Restaurants - 0.3% | | | | | |
| Darden Restaurants, Inc. | | 22,582 | | $ | 661,427 |
| | |
| Specialty Stores - 0.2% | | | | | |
| Advance Auto Parts, Inc. | | 5,160 | | $ | 222,086 |
| Ross Stores, Inc. | | 7,680 | | | 308,813 |
| | | | | |
| | | | | $ | 530,899 |
| Telecommunications - Wireless - 0.1% | | | | | |
| Sprint Nextel Corp. | | 17,840 | | $ | 155,565 |
| | |
| Telephone Services - 1.4% | | | | | |
| AT&T, Inc. | | 31,610 | | $ | 1,011,204 |
| Embarq Corp. | | 18,729 | | | 883,260 |
| Qwest Communications International, Inc. (l) | | 83,890 | | | 317,104 |
| Verizon Communications, Inc. | | 25,530 | | | 896,614 |
| Virgin Media, Inc. | | 24,630 | | | 280,782 |
| | | | | |
| | | | | $ | 3,388,964 |
| Tobacco - 0.4% | | | | | |
| Altria Group, Inc. | | 19,700 | | $ | 414,291 |
| Philip Morris International, Inc. | | 10,150 | | | 545,055 |
| | | | | |
| | | | | $ | 959,346 |
| Utilities - Electric Power - 1.3% | | | | | |
| American Electric Power Co., Inc. | | 12,741 | | $ | 497,409 |
| Duke Energy Corp. | | 19,580 | | | 341,475 |
| Edison International | | 15,860 | | | 728,291 |
| FirstEnergy Corp. | | 9,740 | | | 707,514 |
| FPL Group, Inc. | | 3,370 | | | 202,402 |
20
Portfolio of Investments (unaudited) – continued
| | | | | | | |
| Issuer | | Shares/Par | | Value ($) | |
| | | | | | | |
| Common Stocks - continued | | | | | | | |
| Utilities - Electric Power - continued | | | | | | | |
| NRG Energy, Inc. (a) | | | 3,540 | | $ | 133,246 | |
| Public Service Enterprise Group, Inc. | | | 8,050 | | | 328,199 | |
| | | | | | | |
| | | | | | $ | 2,938,536 | |
| Total Common Stocks (Identified Cost, $94,814,367) | | | | | $ | 87,272,899 | |
| | |
| Preferred Stocks - 0.2% | | | | | | | |
| Brokerage & Asset Managers - 0.2% | | | | | | | |
| Merrill Lynch Co., Inc., 8.625% (Identified Cost $511,875) (l) | | | 20,475 | | $ | 445,127 | |
| | |
| Money Market Funds (v) - 1.8% | | | | | | | |
MFS Institutional Money Market Portfolio, 2.64%,
at Cost and Net Asset Value | | $ | 4,043,456 | | $ | 4,043,456 | |
| | |
| Collateral for Securities Loaned - 4.5% | | | | | | | |
Citigroup Global Markets, Inc., Repurchase Agreement, 2.1%,
dated 8/29/08, due 9/02/08, total to be received $10,547,991 (secured by U.S. Treasury and Federal Agency obligations and
Mortgage Backed securities in a jointly traded account),
at Cost and Net Asset Value | | | 10,545,531 | | $ | 10,545,531 | |
| Total Investments (Identified Cost, $254,223,629) | | | | | $ | 241,843,634 | |
| | |
| Other Assets, Less Liabilities - (3.7)% | | | | | | (8,616,637 | ) |
| Net Assets - 100.0% | | | | | $ | 233,226,997 | |
| (a) | Non-income producing security. |
| (d) | Non-income producing security - in default. |
| (f) | All or a portion of the security has been segregated as collateral for open futures contracts. |
| (g) | The rate shown represents a weighted average coupon rate on settled positions at period end, unless otherwise indicated. |
| (l) | All or a portion of this security is on loan. |
| (n) | Securities exempt from registration under Rule 144A of the Securities Act of 1933. These securities may be sold in the ordinary course of business in transactions exempt from registration, normally to qualified institutional buyers. At period end, the aggregate value of these securities was $12,031,859, representing 5.2% of net assets. |
| (o) | All or a portion of this position has not settled. Upon settlement date, interest rates for unsettled amounts will be determined. The rate shown represents the weighted average coupon rate for settled amounts. |
| (p) | Payment-in-kind security. |
| (q) | All or a portion of this position represents an unfunded loan commitment. The rate shown represents a weighted average coupon rate on the full position, including the unfunded loan commitment which has no current coupon rate. |
| (r) | Remaining maturities of floating rate loans may be less than stated maturities shown as a result of contractual or optional prepayments by the borrower. Such prepayments cannot be predicted with certainty. These loans may be subject to restrictions on resale. Floating rate loans generally have rates of interest which are determined periodically by reference to a base lending rate plus a premium. |
21
Portfolio of Investments (unaudited) – continued
| (v) | Underlying fund that is available only to investment companies managed by MFS. The rate quoted is the annualized seven-day yield of the fund at period end. |
| (z) | Restricted securities are not registered under the Securities Act of 1933 and are subject to legal restrictions on resale. These securities generally may be resold in transactions exempt from registration or to the public if the securities are subsequently registered. Disposal of these securities may involve time-consuming negotiations and prompt sale at an acceptable price may be difficult. The fund holds the following restricted securities: |
| | | | | | |
| Restricted Securities | | Acquisition
Date | | Cost | | Current
Market
Value |
| American Media Operations, Inc., 10.25%, 2009 | | 1/18/08 | | $14,199 | | $11,044 |
| Braskem S.A., 7.25%, 2018 | | 5/29/08 | | 193,326 | | 194,025 |
| Firekeepers Development Authority, 13.875%, 2015 | | 4/22/08 | | 139,357 | | 133,762 |
| KazMunaiGaz Finance B.V., 8.375%, 2013 | | 6/24/08-7/29/08 | | 1,295,020 | | 1,304,275 |
| KazMunaiGaz Finance B.V., 9.125%, 2018 | | 6/24/08 | | 402,769 | | 414,628 |
| RSHB Capital S.A., 7.125%, 2014 | | 5/21/08 | | 100,000 | | 97,430 |
| Ticketmaster, 10.75%, 2016 | | 7/16/08-7/17/08 | | 136,402 | | 138,375 |
| Vimpel-Communications, 8.375%, 2013 | | 4/24/08 | | 366,000 | | 353,737 |
| Total Restricted Securities | | | | | | $2,647,276 |
| % of Net Assets | | | | | | 1.1% |
The following abbreviations are used in this report and are defined:
| FRN | | Floating Rate Note. Interest rate resets periodically and may not be the rate reported at period end. |
| REIT | | Real Estate Investment Trust |
| STRIPS | | Separate Trading of Registered Interest and Principal of Securities |
Abbreviations indicate amounts shown in currencies other than the U.S. dollar. All amounts are stated in U.S. dollars unless otherwise indicated. A list of abbreviations is shown below:
Derivative Contracts at 8/31/08
Forward Foreign Currency Exchange Contracts at 8/31/08
| | | | | | | | | | | | | | |
| | | Type | | Currency | | Contracts to
Deliver/Receive | | Settlement
Date Range | | In Exchange
for | | Contracts
at Value | | Net
Unrealized
Appreciation
(Depreciation) |
| Appreciation | | | | | | | | | | | | | | |
| | SELL | | EUR | | 359,643 | | 10/22/08 | | $526,878 | | $526,183 | | $695 |
| | | | | | | | | | | | | | |
22
Portfolio of Investments (unaudited) – continued
Futures contracts outstanding at 8/31/08
| | | | | | | | | |
| Description | | Contracts | | Value | | Expiration Date | | Unrealized
Appreciation/
(Depreciation) | |
| U.S. Treasury Bond (Short) | | 20 | | $2,346,250 | | Dec-08 | | $2,274 | |
| U.S. Treasury Note 2 yr (Long) | | 35 | | 7,429,844 | | Dec-08 | | (4,498 | ) |
| U.S. Treasury Note 5 yr (Long) | | 15 | | 1,679,063 | | Dec-08 | | (2,396 | ) |
| U.S. Treasury Note 10 yr (Short) | | 25 | | 2,887,500 | | Dec-08 | | (1,845 | ) |
| | | | | | | | | |
| | | | | | | | $(6,465 | ) |
| | | | | | | | | |
At August 31, 2008, the fund had sufficient cash and/or other liquid securities to cover any commitments under these derivative contracts.
See Notes to Financial Statements
23
Financial Statements
STATEMENT OF ASSETS AND LIABILITIES
At 8/31/08 (unaudited)
This statement represents your fund’s balance sheet, which details the assets and liabilities comprising the total value of the fund.
| | | | | |
| Assets | | | | | |
Investments - | | | | | |
Non-affiliated issuers, at value (identified cost, $250,180,173) | | $237,800,178 | | | |
Underlying funds, at cost and value | | 4,043,456 | | | |
Total investments, at value, including $13,122,853 of securities on loan (identified cost, $254,223,629) | | | | | $241,843,634 |
Cash | | $113,915 | | | |
Receivable for forward foreign currency exchange contracts | | 695 | | | |
Receivable for daily variation margin on open futures contracts | | 20,156 | | | |
Receivable for investments sold | | 116,316 | | | |
Receivable for fund shares sold | | 432,818 | | | |
Interest and dividends receivable | | 2,397,832 | | | |
Receivable from investment adviser | | 55,707 | | | |
Other assets | | 1,255 | | | |
Total assets | | | | | $244,982,328 |
| Liabilities | | | | | |
Distributions payable | | $218,242 | | | |
Payable for investments purchased | | 461,124 | | | |
Payable for fund shares reacquired | | 452,254 | | | |
Collateral for securities loaned, at value (c) | | 10,545,531 | | | |
Payable to affiliates | | | | | |
Management fee | | 16,549 | | | |
Shareholder servicing costs | | 36,276 | | | |
Distribution and service fees | | 13,523 | | | |
Administrative services fee | | 454 | | | |
Payable for independent trustees’ compensation | | 100 | | | |
Accrued expenses and other liabilities | | 11,278 | | | |
Total liabilities | | | | | $11,755,331 |
Net assets | | | | | $233,226,997 |
| Net assets consist of | | | | | |
Paid-in capital | | $256,496,192 | | | |
Unrealized appreciation (depreciation) on investments and
translation of assets and liabilities in foreign currencies | | (12,387,600 | ) | | |
Accumulated distributions in excess of net realized gain on investments and foreign currency transactions | | (11,455,977 | ) | | |
Undistributed net investment income | | 574,382 | | | |
Net assets | | | | | $233,226,997 |
Shares of beneficial interest outstanding | | | | | 23,697,390 |
24
Statement of Assets and Liabilities (unaudited) – continued
| | | | |
Class A shares | | | | |
Net assets | | $153,843,757 | | |
Shares outstanding | | 15,627,253 | | |
Net asset value per share | | | | $9.84 |
Offering price per share (100/95.25 × net asset value per share) | | | | $10.33 |
Class C shares | | | | |
Net assets | | $77,548,429 | | |
Shares outstanding | | 7,883,772 | | |
Net asset value and offering price per share | | | | $9.84 |
Class I shares | | | | |
Net assets | | $1,431,634 | | |
Shares outstanding | | 145,379 | | |
Net asset value, offering price, and redemption price per share | | | | $9.85 |
Class R1 shares | | | | |
Net assets | | $100,699 | | |
Shares outstanding | | 10,242 | | |
Net asset value, offering price, and redemption price per share | | | | $9.83 |
Class R2 shares | | | | |
Net assets | | $100,784 | | |
Shares outstanding | | 10,251 | | |
Net asset value, offering price, and redemption price per share | | | | $9.83 |
Class R3 shares | | | | |
Net assets | | $100,826 | | |
Shares outstanding | | 10,244 | | |
Net asset value, offering price, and redemption price per share | | | | $9.84 |
Class R4 shares | | | | |
Net assets | | $100,868 | | |
Shares outstanding | | 10,249 | | |
Net asset value, offering price, and redemption price per share | | | | $9.84 |
(c) Non-cash collateral is not included.
On sales of $50,000 or more, the offering price of Class A shares is reduced. A contingent deferred sales charge may be imposed on redemptions of Class A and Class C shares.
See Notes to Financial Statements
25
Financial Statements
STATEMENT OF OPERATIONS
Six months ended 8/31/08 (unaudited)
This statement describes how much your fund earned in investment income and accrued in expenses. It also describes any gains and/or losses generated by fund operations.
| | | | | | |
| Net investment income | | | | | | |
Income | | | | | | |
Interest | | $5,461,170 | | | | |
Dividends | | 1,648,668 | | | | |
Dividends from underlying funds | | 109,418 | | | | |
Total investment income | | | | | $7,219,256 | |
Expenses | | | | | | |
Management fee | | $795,257 | | | | |
Distribution and service fees | | 650,324 | | | | |
Shareholder servicing costs | | 117,183 | | | | |
Administrative services fee | | 20,884 | | | | |
Independent trustees’ compensation | | 5,848 | | | | |
Custodian fee | | 32,841 | | | | |
Shareholder communications | | 24,707 | | | | |
Auditing fees | | 26,006 | | | | |
Legal fees | | 2,535 | | | | |
Miscellaneous | | 49,888 | | | | |
Total expenses | | | | | $1,725,473 | |
Fees paid indirectly | | (325 | ) | | | |
Reduction of expenses by investment adviser | | (274,877 | ) | | | |
Net expenses | | | | | $1,450,271 | |
Net investment income | | | | | $5,768,985 | |
Realized and unrealized gain (loss) on investments
and foreign currency transactions | | | | | | |
Realized gain (loss) (identified cost basis) | | | | | | |
Investment transactions | | $(5,604,825 | ) | | | |
Futures contracts | | (99,840 | ) | | | |
Foreign currency transactions | | 12,158 | | | | |
Net realized gain (loss) on investments
and foreign currency transactions | | | | | $(5,692,507 | ) |
Change in unrealized appreciation (depreciation) | | | | | | |
Investments | | $848,582 | | | | |
Futures contracts | | 33,397 | | | | |
Translation of assets and liabilities in foreign currencies | | 5,465 | | | | |
Net unrealized gain (loss) on investments
and foreign currency translation | | | | | $887,444 | |
Net realized and unrealized gain (loss) on investments
and foreign currency | | | | | $(4,805,063 | ) |
Change in net assets from operations | | | | | $963,922 | |
See Notes to Financial Statements
26
Financial Statements
STATEMENTS OF CHANGES IN NET ASSETS
These statements describe the increases and/or decreases in net assets resulting from operations, any distributions, and any shareholder transactions.
| | | | | | |
| | | Six months ended
8/31/08 | | | Year ended
2/29/08 | |
| Change in net assets | | (unaudited) | | | | |
| From operations | | | | | | |
Net investment income | | $5,768,985 | | | $11,606,470 | |
Net realized gain (loss) on investments and
foreign currency transactions | | (5,692,507 | ) | | (2,619,736 | ) |
Net unrealized gain (loss) on investments and
foreign currency translation | | 887,444 | | | (19,650,593 | ) |
Change in net assets from operations | | $963,922 | | | $(10,663,859 | ) |
| Distributions declared to shareholders | | | | | | |
From net investment income | | | | | | |
Class A | | $(3,671,604 | ) | | $(8,674,678 | ) |
Class C | | (1,571,647 | ) | | (3,283,944 | ) |
Class I | | (36,179 | ) | | (102,874 | ) |
Class R1 | | (678 | ) | | — | |
Class R2 | | (761 | ) | | — | |
Class R3 | | (802 | ) | | — | |
Class R4 | | (844 | ) | | — | |
From net realized gain on investments | | | | | | |
Class A | | (201,107 | ) | | (1,838,588 | ) |
Class C | | (101,612 | ) | | (830,763 | ) |
Class I | | (1,840 | ) | | (19,205 | ) |
Total distributions declared to shareholders | | $(5,587,074 | ) | | $(14,750,052 | ) |
Change in net assets from fund share transactions | | $(12,688,661 | ) | | $52,730,434 | |
Total change in net assets | | $(17,311,813 | ) | | $27,316,523 | |
| Net assets | | | | | | |
At beginning of period | | 250,538,810 | | | 223,222,287 | |
At end of period (including undistributed net investment income of $574,382 and $87,912, respectively) | | $233,226,997 | | | $250,538,810 | |
See Notes to Financial Statements
27
Financial Statements
FINANCIAL HIGHLIGHTS
The financial highlights table is intended to help you understand the fund’s financial performance for the semiannual period and the past 5 fiscal years (or life of a particular share class, if shorter). Certain information reflects financial results for a single fund share. The total returns in the table represent the rate by which an investor would have earned (or lost) on an investment in the fund share class (assuming reinvestment of all distributions) held for the entire period.
| | | | | | | | | |
| Class A | | Six months
ended
8/31/08
(unaudited) | | | Year ended 2/29/08 | | | Period ended
2/28/07 (c) | |
| | | | | | | | |
Net asset value, beginning of period | | $10.04 | | | $10.95 | | | $10.00 | |
| Income (loss) from investment operations | | | | | | | | | |
Net investment income (d) | | $0.25 | | | $0.47 | | | $0.37 | |
Net realized and unrealized gain (loss)
on investments and foreign currency | | (0.21 | ) | | (0.80 | ) | | 0.93 | |
Total from investment operations | | $0.04 | | | $(0.33 | ) | | $1.30 | |
| Less distributions declared to shareholders | | | | | | | | | |
From net investment income | | $(0.23 | ) | | $(0.48 | ) | | $(0.35 | ) |
From net realized gain on investments | | (0.01 | ) | | (0.10 | ) | | (0.00 | )(w) |
Total distributions declared to shareholders | | $(0.24 | ) | | $(0.58 | ) | | $(0.35 | ) |
Net asset value, end of period | | $9.84 | | | $10.04 | | | $10.95 | |
Total return (%) (r)(s)(t) | | 0.39 | (n) | | (3.18 | ) | | 13.20 | (n) |
Ratios (%) (to average net assets) and Supplemental data: | | | | | | | | | |
Expenses before expense reductions (f) | | 1.18 | (a) | | 1.18 | | | 1.36 | (a) |
Expenses after expense reductions (f) | | 0.95 | (a) | | 0.95 | | | 0.95 | (a) |
Net investment income | | 4.93 | (a) | | 4.35 | | | 4.45 | (a) |
Portfolio turnover | | 44 | | | 89 | | | 46 | |
Net assets at end of period (000 Omitted) | | $153,844 | | | $166,546 | | | $156,447 | |
See Notes to Financial Statements
28
Financial Highlights – continued
| | | | | | | | | |
| | | Six months
ended
8/31/08 (unaudited) | | | Year ended 2/29/08 | | | Period ended
2/28/07 (c) | |
| Class C | | | |
| | | | | | | | |
Net asset value, beginning of period | | $10.03 | | | $10.94 | | | $10.00 | |
| Income (loss) from investment operations | | | | | | | | | |
Net investment income (d) | | $0.22 | | | $0.39 | | | $0.30 | |
Net realized and unrealized gain (loss)
on investments and foreign currency | | (0.20 | ) | | (0.80 | ) | | 0.93 | |
Total from investment operations | | $0.02 | | | $(0.41 | ) | | $1.23 | |
| Less distributions declared to shareholders | | | | | | | | | |
From net investment income | | $(0.20 | ) | | $(0.40 | ) | | $(0.29 | ) |
From net realized gain on investments | | (0.01 | ) | | (0.10 | ) | | (0.00 | )(w) |
Total distributions declared to shareholders | | $(0.21 | ) | | $(0.50 | ) | | $(0.29 | ) |
Net asset value, end of period | | $9.84 | | | $10.03 | | | $10.94 | |
Total return (%) (r)(s)(t) | | 0.15 | (n) | | (3.87 | ) | | 12.51 | (n) |
Ratios (%) (to average net assets)
and Supplemental data: | | | | | | | | | |
Expenses before expense reductions (f) | | 1.87 | (a) | | 1.89 | | | 2.01 | (a) |
Expenses after expense reductions (f) | | 1.65 | (a) | | 1.65 | | | 1.65 | (a) |
Net investment income | | 4.24 | (a) | | 3.64 | | | 3.67 | (a) |
Portfolio turnover | | 44 | | | 89 | | | 46 | |
Net assets at end of period (000 Omitted) | | $77,548 | | | $82,486 | | | $64,316 | |
See Notes to Financial Statements
29
Financial Highlights – continued
| | | | | | | | | |
| | | Six months
ended
8/31/08 (unaudited) | | | Year ended 2/29/08 | | | Period ended
2/28/07 (c) | |
| Class I | | | |
| | | | | | | | |
Net asset value, beginning of period | | $10.04 | | | $10.95 | | | $10.00 | |
| Income (loss) from investment operations | | | | | | | | | |
Net investment income (d) | | $0.27 | | | $0.51 | | | $0.41 | |
Net realized and unrealized gain (loss)
on investments and foreign currency | | (0.20 | ) | | (0.81 | ) | | 0.91 | |
Total from investment operations | | $0.07 | | | $(0.30 | ) | | $1.32 | |
| Less distributions declared to shareholders | | | | | | | | | |
From net investment income | | $(0.25 | ) | | $(0.51 | ) | | $(0.37 | ) |
From net realized gain on investments | | (0.01 | ) | | (0.10 | ) | | (0.00 | )(w) |
Total distributions declared to shareholders | | $(0.26 | ) | | $(0.61 | ) | | $(0.37 | ) |
Net asset value, end of period | | $9.85 | | | $10.04 | | | $10.95 | |
Total return (%) (r)(s) | | 0.65 | (n) | | (2.89 | ) | | 13.45 | (n) |
Ratios (%) (to average net assets) and Supplemental data: | | | | | | | | | |
Expenses before expense reductions (f) | | 0.88 | (a) | | 0.88 | | | 1.29 | (a) |
Expenses after expense reductions (f) | | 0.65 | (a) | | 0.65 | | | 0.65 | (a) |
Net investment income | | 5.23 | (a) | | 4.67 | | | 4.84 | (a) |
Portfolio turnover | | 44 | | | 89 | | | 46 | |
Net assets at end of period (000 Omitted) | | $1,432 | | | $1,507 | | | $2,459 | |
See Notes to Financial Statements
30
Financial Highlights – continued
| | | |
Class R1 | | Period ended
8/31/08 (i) | |
Net asset value, beginning of period | | $9.83 | |
| Income (loss) from investment operations | | | |
Net investment income (d) | | $0.07 | |
Net realized and unrealized gain (loss)
on investments and foreign currency | | (0.00 | )(w) |
Total from investment operations | | $0.07 | |
| Less distributions declared to shareholders | | | |
From net investment income | | $(0.07 | ) |
Net asset value, end of period | | $9.83 | |
Total return (%) (r)(s) | | 0.68 | (n) |
Ratios (%) (to average net assets) and Supplemental data: | | | |
Expenses before expense reductions (f) | | 1.91 | (a) |
Expenses after expense reductions (f) | | 1.65 | (a) |
Net investment income | | 4.00 | (a) |
Portfolio turnover | | 44 | |
Net assets at end of period (000 Omitted) | | $101 | |
See Notes to Financial Statements
31
Financial Highlights – continued
| | | |
Class R2 | | Period ended
8/31/08 (i) | |
Net asset value, beginning of period | | $9.83 | |
| Income (loss) from investment operations | | | |
Net investment income (d) | | $0.07 | |
Net realized and unrealized gain (loss)
on investments and foreign currency | | (0.00 | )(w) |
Total from investment operations | | $0.07 | |
| Less distributions declared to shareholders | | | |
From net investment income | | $(0.07 | ) |
Net asset value, end of period | | $9.83 | |
Total return (%) (r)(s) | | 0.76 | (n) |
Ratios (%) (to average net assets) and Supplemental data: | | | |
Expenses before expense reductions (f) | | 1.42 | (a) |
Expenses after expense reductions (f) | | 1.15 | (a) |
Net investment income | | 4.49 | (a) |
Portfolio turnover | | 44 | |
Net assets at end of period (000 Omitted) | | $101 | |
See Notes to Financial Statements
32
Financial Highlights – continued
| | | |
Class R3 | | Period ended
8/31/08 (i) | |
Net asset value, beginning of period | | $9.84 | |
| Income (loss) from investment operations | | | |
Net investment income (d) | | $0.08 | |
Net realized and unrealized gain (loss)
on investments and foreign currency | | (0.00 | )(w) |
Total from investment operations | | $0.08 | |
| Less distributions declared to shareholders | | | |
From net investment income | | $(0.08 | ) |
Net asset value, end of period | | $9.84 | |
Total return (%) (r)(s) | | 0.80 | (n) |
Ratios (%) (to average net assets) and Supplemental data: | | | |
Expenses before expense reductions (f) | | 1.17 | (a) |
Expenses after expense reductions (f) | | 0.90 | (a) |
Net investment income | | 4.74 | (a) |
Portfolio turnover | | 44 | |
Net assets at end of period (000 Omitted) | | $101 | |
See Notes to Financial Statements
33
Financial Highlights – continued
| | | |
Class R4 | | Period ended
8/31/08 (i) | |
Net asset value, beginning of period | | $9.84 | |
| Income (loss) from investment operations | | | |
Net investment income (d) | | $0.08 | |
Net realized and unrealized gain (loss)
on investments and foreign currency | | (0.00 | )(w) |
Total from investment operations | | $0.08 | |
| Less distributions declared to shareholders | | | |
From net investment income | | $(0.08 | ) |
Net asset value, end of period | | $9.84 | |
Total return (%) (r)(s) | | 0.85 | (n) |
Ratios (%) (to average net assets) and Supplemental data: | | | |
Expenses before expense reductions (f) | | 0.83 | (a) |
Expenses after expense reductions (f) | | 0.65 | (a) |
Net investment income | | 4.99 | (a) |
Portfolio turnover | | 44 | |
Net assets at end of period (000 Omitted) | | $101 | |
| (c) | For the period from the commencement of the fund’s investment operations, May 26, 2006, through the stated period end. |
| (d) | Per share data is based on average shares outstanding. |
| (f) | Ratios do not reflect reductions from fees paid indirectly, if applicable. |
| (i) | For the period from the class’ inception, July 1, 2008 (Class R1, R2, R3, and R4) through the stated period end. |
| (r) | Certain expenses have been reduced without which performance would have been lower. |
| (s) | From time to time the fund may receive proceeds from litigation settlements, without which performance would be lower. |
| (t) | Total returns do not include any applicable sales charges. |
| (w) | Per share amount was less than $0.01. |
See Notes to Financial Statements
34
NOTES TO FINANCIAL STATEMENTS
(unaudited)
| (1) | | Business and Organization |
MFS Diversified Income Fund (the fund) is a series of MFS Series Trust XIII (the trust). The trust is organized as a Massachusetts business trust and is registered under the Investment Company Act of 1940, as amended, as an open-end management investment company.
| (2) | | Significant Accounting Policies |
General – The preparation of financial statements in conformity with U.S. generally accepted accounting principles requires management to make estimates and assumptions that affect the reported amounts of assets and liabilities, and disclosure of contingent assets and liabilities at the date of the financial statements and the reported amounts of revenues and expenses during the reporting period. Actual results could differ from those estimates. The fund may invest a significant portion of its assets in mortgage-backed securities. The value of mortgage-backed securities may depend, in part, on the issuer’s or borrower’s credit quality or ability to pay principal and interest when due and may fall if an issuer or borrower defaults on its obligation to pay principal or interest or if the instrument’s credit rating is downgraded by a credit rating agency. U.S. Government securities not supported as to the payment of principal or interest by the U.S. Treasury, such as those issued by Fannie Mae, Freddie Mac, and the Federal Home Loan Banks, are subject to greater credit risk than are U.S. Government securities supported by the U.S. Treasury, such as those issued by Ginnie Mae. The fund can invest in foreign securities, including securities of emerging market issuers. Investments in foreign securities are vulnerable to the effects of changes in the relative values of the local currency and the U.S. dollar and to the effects of changes in each country’s legal, political, and economic environment. The markets of emerging markets countries are generally more volatile than the markets of developed countries with more mature economies. All of the risks of investing in foreign securities previously described are heightened when investing in emerging markets countries.
Investment Valuations – Equity securities, including restricted equity securities, are generally valued at the last sale or official closing price as reported by a third party pricing service on the market or exchange on which they are primarily traded. For securities for which there were no sales reported that day, equity securities are generally valued at the last quoted daily bid quotation as reported by a third party pricing service on the market or exchange on which they are primarily traded. For securities held short for which there were no sales reported for the day, the position is generally valued at the last quoted daily ask quotation
35
Notes to Financial Statements (unaudited) – continued
as reported by a third party pricing service on the market or exchange on which such securities are primarily traded. Debt instruments and floating rate loans (other than short-term instruments), including restricted debt instruments, are generally valued at an evaluated or composite bid as reported by a third party pricing service. Short-term instruments with a maturity at issuance of 60 days or less may be valued at amortized cost, which approximates market value. Futures contracts are generally valued at last posted settlement price as reported by a third party pricing service on the market on which they are primarily traded. Futures contracts for which there were no trades that day for a particular position are generally valued at the closing bid quotation as reported by a third party pricing service on the market on which such futures contracts are primarily traded. Forward foreign currency contracts are generally valued at the mean of bid and asked prices for the time period interpolated from rates reported by a third party pricing service for proximate time periods. Open-end investment companies are generally valued at net asset value per share. Securities and other assets generally valued on the basis of information from a third party pricing service may also be valued at a broker-dealer bid quotation. Values obtained from pricing services can utilize both dealer-supplied valuations and electronic data processing techniques, which take into account factors such as institutional-size trading in similar groups of securities, yield, quality, coupon rate, maturity, type of issue, trading characteristics, and other market data. The values of foreign securities and other assets and liabilities expressed in foreign currencies are converted to U.S. dollars using the mean of bid and asked prices for rates reported by a third party pricing service.
The Board of Trustees has delegated primary responsibility for determining or causing to be determined the value of the fund’s investments (including any fair valuation) to the adviser pursuant to valuation policies and procedures approved by the Board. If the adviser determines that reliable market quotations are not readily available, investments are valued at fair value as determined in good faith by the adviser in accordance with such procedures under the oversight of the Board of Trustees. Under the fund’s valuation policies and procedures, market quotations are not considered to be readily available for most types of debt instruments and floating rate loans and many types of derivatives. These investments are generally valued at fair value based on information from third party pricing services. In addition, investments may be valued at fair value if the adviser determines that an investment’s value has been materially affected by events occurring after the close of the exchange or market on which the investment is principally traded (such as foreign exchange or market) and prior to the determination of the fund’s net asset value, or after the halting of trading of a specific security where trading does not resume prior to the close of the exchange or market on which the security is principally traded. Events that occur on a frequent basis after foreign
36
Notes to Financial Statements (unaudited) – continued
markets close (such as developments in foreign markets and significant movements in the U.S. markets) and prior to the determination of the fund’s net asset value may be deemed to have a material affect on the value of securities traded in foreign markets. Accordingly, the fund’s foreign equity securities may often be valued at fair value. The adviser may rely on third party pricing services or other information (such as the correlation with price movements of similar securities in the same or other markets; the type, cost and investment characteristics of the security; the business and financial condition of the issuer; and trading and other market data) to assist in determining whether to fair value and at what value to fair value an investment. The value of an investment for purposes of calculating the fund’s net asset value can differ depending on the source and method used to determine value. When fair valuation is used, the value of investments used to determine the fund’s net asset value may differ from quoted or published prices for the same investments.
The fund adopted FASB Statement No. 157, Fair Value Measurements (the “Statement”) in this reporting period. This Statement provides a single definition of fair value, a hierarchy for measuring fair value and expanded disclosures about fair value measurements.
Various inputs are used in determining the value of the fund’s assets or liabilities carried at market value. These inputs are categorized into three broad levels. Level 1 includes quoted prices in active markets for identical assets or liabilities. Level 2 includes other significant observable market-based inputs (including quoted prices for similar securities, interest rates, prepayment speed, and credit risk). Level 3 includes unobservable inputs, which may include the adviser’s own assumptions in determining the fair value of investments. Other financial instruments are derivative instruments not reflected in total investments, such as futures, forwards, swap contracts and written options, which are valued at the unrealized appreciation/depreciation on the instrument. The following is a summary of the levels used as of August 31, 2008 in valuing the fund’s assets or liabilities carried at market value:
| | | | | | | | | | |
| | | Level 1 | | | Level 2 | | Level 3 | | Total | |
| Investments in Securities | | $91,761,482 | | | $150,082,152 | | $— | | $241,843,634 | |
| Other Financial Instruments | | $(6,465 | ) | | $695 | | $— | | $(5,770 | ) |
Repurchase Agreements – The fund may enter into repurchase agreements with approved counterparties. Each repurchase agreement is recorded at cost. The fund requires that the securities collateral in a repurchase transaction be transferred to a custodian. The fund monitors, on a daily basis, the value of the collateral to ensure that its value, including accrued interest, is greater than amounts owed to the fund under each such repurchase agreement.
37
Notes to Financial Statements (unaudited) – continued
Foreign Currency Translation – Purchases and sales of foreign investments, income, and expenses are converted into U.S. dollars based upon currency exchange rates prevailing on the respective dates of such transactions or on the reporting date for foreign denominated receivables and payables. Gains and losses attributable to foreign currency exchange rates on sales of securities are recorded for financial statement purposes as net realized gains and losses on investments. Gains and losses attributable to foreign exchange rate movements on receivables, payables, income and expenses are recorded for financial statement purposes as foreign currency transaction gains and losses. That portion of both realized and unrealized gains and losses on investments that results from fluctuations in foreign currency exchange rates is not separately disclosed.
Derivative Risk – The fund may invest in derivatives for hedging or non-hedging purposes. While hedging can reduce or eliminate losses, it can also reduce or eliminate gains. When the fund uses derivatives as an investment to gain market exposure, or for hedging purposes, gains and losses from derivative instruments may be substantially greater than the derivative’s original cost. Cash that has been segregated on behalf of certain derivative contracts will be reported separately on the Statement of Assets and Liabilities as restricted cash. On some over-the-counter derivatives, the fund attempts to reduce its exposure to counterparty credit risk by entering into an ISDA Master Agreement on a bilateral basis with each of the counterparties with whom it undertakes a significant volume of transactions. The ISDA Master Agreement gives the fund the right, upon an event of default by the applicable counterparty, to close out all transactions traded under such agreement and to net amounts owed under each transaction to one net amount payable by one party to the other. This right to close out and net payments across all transactions traded under the ISDA Master Agreement could result in a reduction of the fund’s credit risk to such counterparty equal to any amounts payable by the fund under the applicable transactions, if any. However, absent an event of default by the counterparty, the ISDA Master Agreement does not result in an offset of reported balance sheet assets and liabilities across transactions between the fund and the applicable counterparty. Derivative instruments include purchased options, futures contracts, and forward foreign currency exchange contracts.
In March 2008, FASB Statement No. 161, Disclosures about Derivative Instruments and Hedging Activities (the “Standard”) was issued, and is effective for financial statements issued for fiscal years and interim periods beginning after November 15, 2008. This Standard provides enhanced disclosures about the fund’s use of and accounting for derivative instruments and the effect of derivative instruments on the fund’s results of operations and financial position. Management is evaluating the application of the Standard to the fund, and has not at this time determined the impact, if any, resulting from the adoption of this Standard on the fund’s financial statements.
38
Notes to Financial Statements (unaudited) – continued
Purchased Options – The fund may purchase call or put options for a premium. Purchasing call options may be a hedge against an anticipated increase in the dollar cost of securities to be acquired or to increase the fund’s exposure to the underlying instrument. Purchasing put options may hedge against a decline in the value of portfolio securities. The premium paid is included as an investment in the Statement of Assets and Liabilities and is subsequently adjusted to the current value of the option. Premiums paid for purchased options which have expired are treated as realized losses on investments in the Statement of Operations. Premiums paid for purchased options which are exercised or closed are added to the amount paid or offset against the proceeds on the underlying security or financial instrument to determine the realized gain or loss. The risk of loss associated with purchased options is limited to the premium paid.
Futures Contracts – The fund may enter into futures contracts for the delayed delivery of securities or currency, or contracts based on financial indices at a fixed price on a future date. In entering such contracts, the fund is required to deposit with the broker either in cash or securities an amount equal to a certain percentage of the contract amount. Subsequent payments are made or received by the fund each day, depending on the daily fluctuations in the value of the contract, and are recorded for financial statement purposes as unrealized gains or losses by the fund. Upon entering into such contracts, the fund bears the risk of interest or exchange rates or securities prices moving unexpectedly, in which case, the fund may not achieve the anticipated benefits of the futures contracts and may realize a loss.
Forward Foreign Currency Exchange Contracts – The fund may enter into forward foreign currency exchange contracts for the purchase or sale of a specific foreign currency at a fixed price on a future date. Risks may arise upon entering into these contracts from the potential inability of counterparties to meet the terms of their contracts and from unanticipated movements in the value of the contract. The fund may enter into forward foreign currency exchange contracts for hedging purposes as well as for non-hedging purposes. For hedging purposes, the fund may enter into contracts to deliver or receive foreign currency it will receive from or require for its normal investment activities. The fund may also use contracts in a manner intended to protect foreign currency denominated securities from declines in value due to unfavorable exchange rate movements. For non-hedging purposes, the fund may enter into contracts with the intent of changing the relative exposure of the fund’s portfolio of securities to different currencies to take advantage of anticipated changes. The forward foreign currency exchange contracts are adjusted by the daily exchange rate of the underlying currency and any gains or losses are recorded as unrealized until the contract settlement date. On
39
Notes to Financial Statements (unaudited) – continued
contract settlement date, the gains or losses are recorded as realized gains or losses on foreign currency transactions.
Hybrid Instruments – The fund may invest in indexed or hybrid securities on which any combination of interest payments, the principal or stated amount payable at maturity is determined by reference to prices of other securities, currencies, indexes, economic factors or other measures, including interest rates, currency exchange rates, or securities indices. The risks of investing in hybrid instruments reflect a combination of the risks of investing in securities, swaps, options, futures and currencies. Hybrid instruments are potentially more volatile and carry greater market risks than traditional debt instruments. Depending on the structure of the particular hybrid instrument, changes in a benchmark, underlying assets or economic indicator may be magnified by the terms of the hybrid instrument and have an even more dramatic and substantial effect upon the value of the hybrid instrument. Also, the prices of the hybrid instrument and the benchmark, underlying asset or economic indicator may not move in the same direction or at the same time.
Security Loans – JPMorgan Chase and Co. (“Chase”), as lending agent, may loan the securities of the fund to certain qualified institutions (the “Borrowers”) approved by the fund. The loans are collateralized by cash and/or U.S. Treasury and federal agency obligations in an amount typically at least equal to the market value of the securities loaned. Security lending activity through Chase is further collateralized by an irrevocable standby letter of credit. Chase provides the fund with indemnification against Borrower default. The fund bears the risk of loss with respect to the investment of cash collateral. On loans collateralized by cash, the cash collateral is invested in short-term securities. A portion of the income generated upon investment of the collateral is remitted to the Borrowers, and the remainder is allocated between the fund and the lending agent. On loans collateralized by U.S. Treasury and/or federal agency obligations, a fee is received from the Borrower, and is allocated between the fund and the lending agent. Net income from securities lending is included in interest income on the Statement of Operations. The dividend and interest income earned on the securities loaned is accounted for in the same manner as other dividend and interest income.
At August 31, 2008, the value of securities loaned was $13,122,853. These loans were collateralized by cash of $10,545,531 and U.S. Treasury obligations of $2,877,938.
Loans and Other Direct Debt Instruments – The fund may invest in loans and loan participations or other receivables. These investments may include standby financing commitments, including revolving credit facilities, which obligate the fund to supply additional cash to the borrower on demand. At August 31, 2008, the portfolio had unfunded loan commitments of $5,230,
40
Notes to Financial Statements (unaudited) – continued
which could be extended at the option of the borrower and which are covered by sufficient cash and/or liquid securities held by the fund. The market value and obligation of the fund on these unfunded loan commitments is included in Investments, at value and Payable for investments purchased, respectively, on the Statement of Assets and Liabilities. Loan participations involve a risk of insolvency of the lending bank or other financial intermediary.
Indemnifications – Under the fund’s organizational documents, its officers and trustees may be indemnified against certain liabilities and expenses arising out of the performance of their duties to the fund. Additionally, in the normal course of business, the fund enters into agreements with service providers that may contain indemnification clauses. The fund’s maximum exposure under these agreements is unknown as this would involve future claims that may be made against the fund that have not yet occurred.
Investment Transactions and Income – Investment transactions are recorded on the trade date. Interest income is recorded on the accrual basis. All premium and discount is amortized or accreted for financial statement purposes in accordance with U.S. generally accepted accounting principles. The fund earns certain fees in connection with its floating rate loan purchasing activities. These fees are in addition to interest payments earned and may include amendment fees, commitment fees, facility fees, consent fees, and prepayment fees. Commitment fees are recorded on an accrual basis as income in the accompanying financial statements. Dividends received in cash are recorded on the ex-dividend date. Certain dividends from foreign securities will be recorded when the fund is informed of the dividend if such information is obtained subsequent to the ex-dividend date. Dividend and interest payments received in additional securities are recorded on the ex-dividend or ex-interest date in an amount equal to the value of the security on such date.
The fund may receive proceeds from litigation settlements. Any proceeds received from litigation involving portfolio holdings are reflected in the Statement of Operations in realized gain/loss if the security has been disposed of by the fund or in unrealized gain/loss if the security is still held by the fund. Any other proceeds from litigation not related to portfolio holdings are reflected as other income in the Statement of Operations.
Fees Paid Indirectly – The fund’s custody fee may be reduced according to an arrangement that measures the value of cash deposited with the custodian by the fund. This amount, for the six months ended August 31, 2008, is shown as a reduction of total expenses on the Statement of Operations.
Tax Matters and Distributions – The fund intends to qualify as a regulated investment company, as defined under Subchapter M of the Internal Revenue Code, and to distribute all of its taxable income, including realized capital gains. As a result, no provision for federal income tax is required. The fund
41
Notes to Financial Statements (unaudited) – continued
adopted the provisions of FASB Interpretation No. 48, Accounting for Uncertainty in Income Taxes (“the Interpretation”). The Interpretation prescribes a minimum threshold for financial statement recognition of the benefit of a tax position taken or expected to be taken in a tax return. There was no impact resulting from the adoption of this Interpretation on the fund’s financial statements. Each of the fund’s federal tax returns for the prior three fiscal years remains subject to examination by the Internal Revenue Service. It is the fund’s policy to record interest and penalty charges on underpaid taxes associated with its tax positions as interest expense and miscellaneous expense, respectively. No such charges were recorded in the current financial statements. Foreign taxes, if any, have been accrued by the fund in the accompanying financial statements.
Distributions to shareholders are recorded on the ex-dividend date. Income and capital gain distributions are determined in accordance with income tax regulations, which may differ from U.S. generally accepted accounting principles. Certain capital accounts in the financial statements are periodically adjusted for permanent differences in order to reflect their tax character. These adjustments have no impact on net assets or net asset value per share. Temporary differences which arise from recognizing certain items of income, expense, gain or loss in different periods for financial statement and tax purposes will reverse at some time in the future. Distributions in excess of net investment income or net realized gains are temporary overdistributions for financial statement purposes resulting from differences in the recognition or classification of income or distributions for financial statement and tax purposes.
Book/tax differences primarily relate to amortization and accretion of debt securities, wash sale loss deferrals, straddle loss deferrals, and treating a portion of the proceeds from redemptions as a distribution for tax purposes.
The tax character of distributions made during the current period will be determined at fiscal year end. The tax character of distributions declared to shareholders is as follows:
| | |
| | | 2/29/08 |
Ordinary income (including any
short-term capital gains) | | $13,913,734 |
| Long-term capital gain | | 836,318 |
| Total distributions | | $14,750,052 |
42
Notes to Financial Statements (unaudited) – continued
The federal tax cost and the tax basis components of distributable earnings were as follows:
| | | |
| As of 8/31/08 | | | |
| Cost of investments | | $254,544,110 | |
| Gross appreciation | | 4,151,736 | |
| Gross depreciation | | (16,852,212 | ) |
| Net unrealized appreciation (depreciation) | | $(12,700,476 | ) |
| |
| As of 2/29/08 | | | |
| Undistributed ordinary income | | $1,000,752 | |
| Undistributed long-term capital gain | | 303,519 | |
| Post-October capital loss deferral | | (3,736,283 | ) |
| Other temporary differences | | (1,104,010 | ) |
| Net unrealized appreciation (depreciation) | | (15,110,021 | ) |
The aggregate cost above includes prior fiscal year end tax adjustments.
Multiple Classes of Shares of Beneficial Interest – The fund offers multiple classes of shares, which differ in their respective distribution fees. The fund’s income, realized and unrealized gain (loss), and common expenses are allocated to shareholders based on the daily net assets of each class, without distinction between share classes. Dividends are declared separately for each class. Differences in per share dividend rates are generally due to differences in separate class expenses.
| (3) | | Transactions with Affiliates |
Investment Adviser – The fund has an investment advisory agreement with Massachusetts Financial Services Company (MFS) to provide overall investment management and related administrative services and facilities to the fund.
The management fee is computed daily and paid monthly at an annual rate of 0.65% of the fund’s average daily net assets. The adviser and the fund have engaged a sub-adviser for the real estate related component of the fund, Sun Capital Advisers LLC, referred to as Sun Capital or the sub-adviser. MFS pays a sub-advisory fee in an amount equal to 0.30% annually of the average daily net asset value of the fund’s assets managed by the sub-adviser.
The investment adviser has agreed in writing to pay a portion of the fund’s operating expenses, exclusive of certain fees and expenses, such that total annual fund operating expenses do not exceed the following rates annually of the fund’s average daily net assets with respect to each class:
| | | | | | | | | | | | |
| Class A | | Class C | | Class I | | Class R1 | | Class R2 | | Class R3 | | Class R4 |
| 0.95% | | 1.65% | | 0.65% | | 1.65% | | 1.15% | | 0.90% | | 0.65% |
43
Notes to Financial Statements (unaudited) – continued
This written agreement will continue through June 30, 2009, unless changed or rescinded by the fund’s Board of Trustees. For the six months ended August 31, 2008, this reduction amounted to $274,157 and is reflected as a reduction of total expenses in the Statement of Operations.
Distributor – MFS Fund Distributors, Inc. (MFD), a wholly-owned subsidiary of MFS, as distributor, received $25,478 for the six months ended August 31, 2008, as its portion of the initial sales charge on sales of Class A shares of the fund.
The Board of Trustees has adopted a distribution plan for certain class shares pursuant to Rule 12b-1 of the Investment Company Act of 1940.
The fund’s distribution plan provides that the fund will pay MFD for services provided by MFD and financial intermediaries in connection with the distribution and servicing of certain share classes. One component of the plan is a distribution fee paid to MFD and another component of the plan is a service fee paid to MFD. MFD may subsequently pay all, or a portion, of the distribution and/or service fees to financial intermediaries.
Distribution Plan Fee Table:
| | | | | | | | | | |
| | | Distribution
Fee Rate | | Service
Fee Rate | | Total
Distribution
Plan (d) | | Annual
Effective
Rate (e) | | Distribution
and Service
Fee |
| Class A | | 0.10% | | 0.25% | | 0.35% | | 0.30% | | $242,270 |
| Class C | | 0.75% | | 0.25% | | 1.00% | | 1.00% | | 407,759 |
| Class R1 (i) | | 0.75% | | 0.25% | | 1.00% | | 1.00% | | 169 |
| Class R2 (i) | | 0.25% | | 0.25% | | 0.50% | | 0.50% | | 84 |
| Class R3 (i) | | — | | 0.25% | | 0.25% | | 0.25% | | 42 |
| Total Distribution and Service Fees | | | | | | $650,324 |
| (d) | In accordance with the distribution plan for certain classes, the fund pays distribution and/or service fees up to these annual percentage rates of each class’ average daily net assets. |
| (e) | The annual effective rates represent actual fees incurred under the distribution plan for the six months ended August 31, 2008 based on each class’ average daily net assets. 0.05% of the Class A distribution fee is currently being paid by the fund. Payment of the remaining 0.05% of the Class A distribution fee is not yet in effect and will be implemented on such date as the fund’s Board of Trustees may determine. |
| (i) | For the period from the class’ inception, July 1, 2008 (Classes R1, R2, and R3) through the stated period end. |
Certain Class A shares purchased prior to September 1, 2008 are subject to a contingent deferred sales charge (CDSC) in the event of a shareholder redemption within 12 months of purchase. Certain Class A shares purchased on or subsequent to September 1, 2008 are subject to a CDSC in the event of a shareholder redemption within 24 months of purchase. Class C shares are subject to a CDSC in the event of a shareholder redemption within 12 months of purchase. All contingent deferred sales charges are paid to MFD and during the six months ended August 31, 2008, were as follows:
| | |
| | | Amount |
| Class A | | $842 |
| Class C | | $10,062 |
44
Notes to Financial Statements (unaudited) – continued
Shareholder Servicing Agent – MFS Service Center, Inc. (MFSC), a wholly-owned subsidiary of MFS, receives a fee from the fund for its services as shareholder servicing agent calculated as a percentage of the average daily net assets of the fund as determined periodically under the supervision of the fund’s Board of Trustees. For the six months ended August 31, 2008, the fee was $33,625, which equated to 0.0274% annually of the fund’s average daily net assets. MFSC also receives payment from the fund for out-of-pocket expenses, sub-accounting and other shareholder servicing costs which may be paid to affiliated and unaffiliated service providers. For the six months ended August 31, 2008, these out-of-pocket expenses, sub-accounting and other shareholder servicing costs amounted to $83,558.
Administrator – MFS provides certain financial, legal, shareholder communications, compliance, and other administrative services to the fund. Under an administrative services agreement, the fund partially reimburses MFS the costs incurred to provide these services. The fund is charged a fixed amount plus a fee based on average daily net assets. The fund’s annual fixed amount is $17,500.
The administrative services fee incurred for the six months ended August 31, 2008 was equivalent to an annual effective rate of 0.0170% of the fund’s average daily net assets.
Trustees’ and Officers’ Compensation – The fund pays compensation to independent trustees in the form of a retainer, attendance fees, and additional compensation to Board and Committee chairpersons. The fund does not pay compensation directly to trustees or officers of the fund who are also officers of the investment adviser, all of whom receive remuneration for their services to the fund from MFS. Certain officers and trustees of the fund are officers or directors of MFS, MFD, and MFSC.
Other – This fund and certain other MFS funds (the funds) have entered into services agreements (the Agreements) which provide for payment of fees by the funds to Tarantino LLC and Griffin Compliance LLC in return for the provision of services of an Independent Chief Compliance Officer (ICCO) and Assistant ICCO, respectively, for the funds. The ICCO and Assistant ICCO are officers of the funds and the sole members of Tarantino LLC and Griffin Compliance LLC, respectively. The funds can terminate the Agreements with Tarantino LLC and Griffin Compliance LLC at any time under the terms of the Agreements. For the six months ended August 31, 2008, the fee paid by the fund to Tarantino LLC and Griffin Compliance LLC was $762 and is included in miscellaneous expense on the Statement of Operations. MFS has agreed to reimburse the fund for a portion of the payments made by the fund to Tarantino LLC in the amount of $720, which is shown as a reduction of total expenses in the Statement of Operations. Additionally, MFS has agreed to bear
45
Notes to Financial Statements (unaudited) – continued
all expenses associated with office space, other administrative support, and supplies provided to the ICCO and Assistant ICCO.
The fund may invest in a money market fund managed by MFS which seeks preservation of capital and current income. Income earned on this investment is included in dividends from underlying funds on the Statement of Operations. This money market fund does not pay a management fee to MFS.
Purchases and sales of investments, other than purchased option transactions and short-term obligations, were as follows:
| | | | |
| | | Purchases | | Sales |
| U.S. government securities | | $21,325,257 | | $35,792,872 |
| Investments (non-U.S. government securities) | | $80,314,347 | | $74,315,063 |
| (5) | | Shares of Beneficial Interest |
The fund’s Declaration of Trust permits the Trustees to issue an unlimited number of full and fractional shares of beneficial interest. Transactions in fund shares were as follows:
| | | | | | | | | | | | |
| | | Six months ended
8/31/08 (i) | | | Year ended
2/29/08 | |
| | | Shares | | | Amount | | | Shares | | | Amount | |
| Shares sold | | | | | | | | | | | | |
Class A | | 1,356,712 | | | $13,615,171 | | | 9,371,028 | | | $101,513,992 | |
Class C | | 592,504 | | | 5,961,816 | | | 4,263,522 | | | 46,159,401 | |
Class I | | 18,176 | | | 184,084 | | | 257,125 | | | 2,769,345 | |
Class R1 | | 10,208 | | | 100,340 | | | — | | | — | |
Class R2 | | 10,212 | | | 100,381 | | | — | | | — | |
Class R3 | | 10,203 | | | 100,402 | | | — | | | — | |
Class R4 | | 10,206 | | | 100,422 | | | — | | | — | |
| | 2,008,221 | | | $20,162,616 | | | 13,891,675 | | | $150,442,738 | |
Shares issued to shareholders in
reinvestment of distributions | | | | | | | | | | | | |
Class A | | 310,590 | | | $3,136,102 | | | 779,055 | | | $8,313,792 | |
Class C | | 103,102 | | | 1,040,527 | | | 235,015 | | | 2,501,528 | |
Class I | | 3,791 | | | 38,273 | | | 11,564 | | | 123,853 | |
Class R1 | | 34 | | | 338 | | | — | | | — | |
Class R2 | | 39 | | | 380 | | | — | | | — | |
Class R3 | | 41 | | | 400 | | | — | | | — | |
Class R4 | | 43 | | | 421 | | | — | | | — | |
| | 417,640 | | | $4,216,441 | | | 1,025,634 | | | $10,939,173 | |
| Shares reacquired | | | | | | | | | | | | |
Class A | | (2,629,073 | ) | | $(26,436,765 | ) | | (7,849,246 | ) | | $(82,409,994 | ) |
Class C | | (1,034,801 | ) | | (10,362,532 | ) | | (2,154,925 | ) | | (22,570,029 | ) |
Class I | | (26,649 | ) | | (268,421 | ) | | (343,161 | ) | | (3,671,454 | ) |
| | (3,690,523 | ) | | $(37,067,718 | ) | | (10,347,332 | ) | | $(108,651,477 | ) |
46
Notes to Financial Statements (unaudited) – continued
| | | | | | | | | | | | |
| | | Six months ended
8/31/08 (i) | | | Year ended
2/29/08 | |
| | | Shares | | | Amount | | | Shares | | | Amount | |
| Net change | | | | | | | | | | | | |
Class A | | (961,771 | ) | | $(9,685,492 | ) | | 2,300,837 | | | $27,417,790 | |
Class C | | (339,195 | ) | | (3,360,189 | ) | | 2,343,612 | | | 26,090,900 | |
Class I | | (4,682 | ) | | (46,064 | ) | | (74,472 | ) | | (778,256 | ) |
Class R1 | | 10,242 | | | 100,678 | | | — | | | — | |
Class R2 | | 10,251 | | | 100,761 | | | — | | | — | |
Class R3 | | 10,244 | | | 100,802 | | | — | | | — | |
Class R4 | | 10,249 | | | 100,843 | | | — | | | ��� | |
| | (1,264,662 | ) | | $(12,688,661 | ) | | 4,569,977 | | | $52,730,434 | |
| (i) | For the period from the class’ inception, July 1, 2008 (Classes R1, R2, R3, and R4), through the stated period end. |
The fund and other funds managed by MFS participate in a $1 billion unsecured committed line of credit provided by a syndication of banks under a credit agreement. In addition, the fund and other funds managed by MFS have established uncommitted borrowing arrangements with certain banks. Borrowings may be made for temporary financing needs. Interest is charged to each fund, based on its borrowings, generally at a rate equal to the Federal Reserve funds rate plus 0.30%. In addition, a commitment fee, based on the average daily, unused portion of the committed line of credit, is allocated among the participating funds at the end of each calendar quarter. For the six months ended August 31, 2008, the fund’s commitment fee and interest expense were $604 and $0, respectively, and are included in miscellaneous expense on the Statement of Operations.
| (7) | | Transactions in Underlying Funds-Affiliated Issuers |
An affiliated issuer may be considered one in which the fund owns 5% or more of the outstanding voting securities, or a company which is under common control. For the purposes of this report, the fund assumes the following to be affiliated issuers:
| | | | | | | | | |
| Underlying Funds | | Beginning Shares/Par Amount | | Acquisitions Shares/Par Amount | | Dispositions Shares/Par Amount | | | Ending Shares/Par Amount |
MFS Institutional Money
Market Portfolio | | 6,652,415 | | 52,960,533 | | (55,569,492 | ) | | 4,043,456 |
| | | | |
| Underlying Funds | | Realized Gain (Loss) | | Capital Gain Distributions | | Dividend Income | | | Ending Value |
MFS Institutional Money
Market Portfolio | | $— | | $— | | $109,418 | | | $4,043,456 |
47
BOARD REVIEW OF INVESTMENT
ADVISORY AGREEMENT
The Investment Company Act of 1940 requires that both the full Board of Trustees and a majority of the non-interested (“independent”) Trustees, voting separately, annually approve the continuation of the Fund’s investment advisory agreement with MFS and investment sub-advisory agreement among MFS Series Trust XIII, on behalf of the Fund, MFS and Sun Capital Advisers LLC (“Sun Capital”) (together, the “Agreements”). The Trustees consider matters bearing on the Fund and its advisory arrangements at their meetings throughout the year, including a review of performance data at each regular meeting. In addition, the independent Trustees met several times over the course of three months beginning in May and ending in July, 2008 (“contract review meetings”) for the specific purpose of considering whether to approve the continuation of the investment advisory agreements for the Fund and the other investment companies that the Board oversees (the “MFS Funds”). The independent Trustees were assisted in their evaluation of the Agreements by independent legal counsel, from whom they received separate legal advice and with whom they met separately from MFS and Sun Capital during various contract review meetings. The independent Trustees were also assisted in this process by the MFS Funds’ Independent Chief Compliance Officer, a full-time senior officer appointed by and reporting to the independent Trustees.
In connection with their deliberations regarding the continuation of the Agreements, the Trustees, including the independent Trustees, considered such information and factors as they believed, in light of the legal advice furnished to them and their own business judgment, to be relevant. The investment advisory agreements for the Fund were considered separately, although the Trustees also took into account the common interests of all MFS Funds in their review. As described below, the Trustees considered the nature, quality, and extent of the various investment advisory, administrative, and shareholder services performed by MFS and Sun Capital, as applicable, under the Agreements and other arrangements with the Fund.
In connection with their contract review meetings, the Trustees received and relied upon materials that included, among other items: (i) information provided by Lipper Inc., an independent third party, on the Fund’s investment performance of the Fund for the one-year period ended December 31, 2007 and the investment performance of a group of funds with substantially similar investment classifications/objections (the “Lipper performance universe”), (ii) information provided by Lipper Inc. on the Fund’s advisory fees and other expenses and the advisory fees and other expenses of comparable funds identified by Lipper Inc. (the “Lipper expense group”), (iii) information provided by MFS on the advisory fees of comparable portfolios of other clients
48
Board Review of Investment Advisory Agreement – continued
of MFS, including institutional separate accounts and other clients, (iv) information as to whether and to what extent applicable expense waivers, reimbursements or fee “breakpoints” are observed for the Fund, (v) information regarding MFS’ financial results and financial condition, including MFS’ and certain of its affiliates’ estimated profitability from services performed for the Fund and the MFS Funds as a whole, (vi) MFS’ views regarding the outlook for the mutual fund industry and the strategic business plans of MFS, (vii) descriptions of various functions performed by MFS for the Funds, such as compliance monitoring and portfolio trading practices, (viii) information regarding the overall organization of MFS, including information about MFS’ senior management and other personnel providing investment advisory, administrative and other services to the Fund and the other MFS Funds, and (ix) information regarding the overall organization of Sun Capital, including information about Sun Capital personnel providing investment advisory services to the Fund. The comparative fee and expense information prepared and provided by Lipper Inc. was not independently verified and the independent Trustees did not independently verify any information provided to them by MFS or Sun Capital.
The Trustees’ conclusion as to the continuation of the Agreements was based on a comprehensive consideration of all information provided to the Trustees and not the result of any single factor. Some of the factors that figured particularly in the Trustees’ deliberations are described below, although individual Trustees may have evaluated the information presented differently from one another, giving different weights to various factors.
Based on information provided by Lipper Inc., the Trustees reviewed the Fund’s total return investment performance as well as the performance of peer groups of funds for the one-year period ended December 31, 2007. The total return performance of the Fund’s Class A shares was in the 5th quintile relative to the other funds in the universe for the one-year period (the 1st quintile being the best performers and the 5th quintile being the worst performers). The Fund commenced operations on May 26, 2006; therefore, no performance data for the three- or five-year period was available. Because of the passage of time, this performance may differ from performance results for more recent periods, including those shown elsewhere in this report.
The Trustees expressed concern to MFS about the substandard investment performance of the Fund. In the course of their deliberations, the Trustees took into account information provided by MFS in connection with the contract review meetings, as well as during investment review meetings conducted with portfolio management personnel during the course of the year regarding the Fund’s performance. In addition, the Trustees requested that they receive a separate update on the Fund’s performance at each of their regular meetings.
49
Board Review of Investment Advisory Agreement – continued
After reviewing these and related factors, the Trustees concluded, within the context of their overall conclusions regarding the investment advisory agreement, that MFS’ responses and efforts and plans to improve investment performance were sufficient to support approval of the continuance of the investment advisory agreement for an additional one year period, but that they would continue to closely monitor the performance of the Fund.
In assessing the reasonableness of the Fund’s advisory fee, the Trustees considered, among other information, the Fund’s advisory fee, sub-advisory fee, and the total expense ratio of the Fund’s Class A shares as a percentage of average daily net assets and the advisory fee and total expense ratios of peer groups of funds based on information provided by Lipper Inc. and MFS and/or Sun Capital. The Trustees noted that MFS (and not the Fund) pays Sun Capital its sub-advisory fee from its advisory fees. The Trustees considered that MFS currently observes an expense limitation for the Fund. The Trustees also considered that, according to the Lipper data (which takes into account the expense limitation), the Fund’s effective advisory fee and total expense ratio were each lower than the Lipper expense group median.
The Trustees also considered the advisory fees charged by MFS to institutional accounts. In comparing these fees, the Trustees considered information provided by MFS as to the generally broader scope of services provided by MFS to the Fund in comparison to institutional accounts, the higher demands placed on MFS’ investment personnel and trading infrastructure as a result of the daily cash in-flows and out-flows of the Fund, and the impact on MFS and expenses associated with the more extensive regulatory regime to which the Fund is subject in comparison to institutional accounts.
The Trustees also considered whether the Fund is likely to benefit from any economies of scale in the management of the Fund in the event of growth in assets of the Fund. They noted that the Fund’s advisory fee rate and sub-advisory fee rate schedules are not currently subject to any breakpoints. Taking into account the expense limitation noted above, the Trustees determined not to recommend any advisory fee or sub-advisory fee breakpoints for the Fund at this time.
The Trustees also considered information prepared by MFS and Sun Capital relating to MFS’ and Sun Capital’s costs and profits with respect to the Fund, and with respect to the MFS Funds considered as a group, and other investment companies and accounts advised by MFS, as well as MFS’ methodologies used to determine and allocate its costs to the MFS Funds, the Fund and other accounts and products for purposes of estimating profitability.
After reviewing these and other factors described herein, the Trustees concluded, within the context of their overall conclusions regarding the Agreements, that the advisory fee charged to the Fund and the sub-advisory fee
50
Board Review of Investment Advisory Agreement – continued
paid by MFS to Sun Capital represent reasonable compensation in light of the services being provided by MFS and Sun Capital to the Fund.
In addition, the Trustees considered MFS’ and Sun Capital’s resources and related efforts to continue to retain, attract and motivate capable personnel to serve the Fund. The Trustees also considered current and developing conditions in the financial services industry, including the entry into the industry of large and well-capitalized companies which are spending, and appear to be prepared to continue to spend, substantial sums to engage personnel and to provide services to competing investment companies. In this regard, the Trustees also considered the financial resources of MFS, Sun Capital and their ultimate parent, Sun Life Financial Inc. The Trustees also considered the advantages and possible disadvantages to the Fund of having an adviser and sub-adviser that also serve other investment companies as well as other accounts.
The Trustees also considered the nature, quality, cost, and extent of administrative, transfer agency, and distribution services provided to the Fund by MFS and its affiliates under agreements and plans other than the investment advisory agreements, including any 12b-1 fees the Fund pays to MFS Fund Distributors, Inc. (“MFD”), an affiliate of MFS and Sun Capital. The Trustees also considered the nature, extent and quality of certain other services MFS performs or arranges for on the Fund’s behalf, which may include securities lending programs, directed expense payment programs, class action recovery programs, and MFS’ and Sun Capital’s interaction with third-party service providers, principally custodians and sub-custodians. The Trustees concluded that the various non-advisory services provided by MFS and its affiliates on behalf of the Fund were satisfactory.
The Trustees also considered benefits to MFS and Sun Capital from the use of the Fund’s portfolio brokerage commissions, if applicable, to pay for investment research (excluding third-party research, for which MFS pays directly) and various other factors. The Trustees noted that Sun Capital may obtain third-party research with soft dollar commissions. Additionally, the Trustees considered so-called “fall-out benefits” to MFS and Sun Capital such as reputational value derived from serving as an investment manager to the Fund.
Based on their evaluation of factors that they deemed to be material, including those factors described above, the Board of Trustees, including a majority of the independent Trustees, concluded that the Fund’s investment advisory agreement with MFS and MFS’ investment sub-advisory agreement with Sun Capital should be continued for an additional one-year period, commencing August 1, 2008.
Note: MFD has agreed to the Trustees’ recommendation to eliminate the distribution fee component of the 12b-1 fee paid by the Fund’s Class A shares, effective March 1, 2009.
51
Board Review of Investment Advisory Agreement – continued
A discussion regarding the Board’s most recent review and renewal of the fund’s Investment Advisory Agreement with MFS will be available on or about November 1, 2008 by clicking on the fund’s name under “Mutual Funds” in the “Products and Performance” section of the MFS Web site (mfs.com).
52
PROXY VOTING POLICIES AND INFORMATION
A general description of the MFS funds’ proxy voting policies and procedures is available without charge, upon request, by calling 1-800-225-2606, by visiting the Proxy Voting section of mfs.com or by visiting the SEC’s Web site at http://www.sec.gov.
Information regarding how the fund voted proxies relating to portfolio securities during the most recent twelve-month period ended June 30 is available without charge by visiting the Proxy Voting section of mfs.com or by visiting the SEC’s Web site at http://www.sec.gov.
QUARTERLY PORTFOLIO DISCLOSURE
The fund will file a complete schedule of portfolio holdings with the Securities and Exchange Commission (the Commission) for the first and third quarters of each fiscal year on Form N-Q. The fund’s Form N-Q may be reviewed and copied at the:
Public Reference Room
Securities and Exchange Commission
100 F Street, NE, Room 1580
Washington, D.C. 20549
Information on the operation of the Public Reference Room may be obtained by calling the Commission at 1-800-SEC-0330. The fund’s Form N-Q is available on the EDGAR database on the Commission’s Internet Web site at http://www.sec.gov, and copies of this information may be obtained, upon payment of a duplicating fee, by electronic request at the following e-mail address: publicinfo@sec.gov or by writing the Public Reference Section at the above address.
A shareholder can also obtain the quarterly portfolio holdings report at mfs.com.
53
CONTACT US
| | |
Web site | | Mailing address |
mfs.com | | MFS Service Center, Inc. |
| | P.O. Box 55824 |
MFS TALK | | Boston, MA 02205-5824 |
1-800-637-8255 | | |
24 hours a day | | Overnight mail |
| | MFS Service Center, Inc. |
Account service and literature | | c/o Boston Financial Data Services |
| | 30 Dan Road |
Shareholders | | Canton, MA 02021-2809 |
1-800-225-2606 | | |
8 a.m. to 8 p.m. ET | | |
| |
Investment professionals | | |
1-800-343-2829 | | |
8 a.m. to 7 p.m. ET | | |
| |
Retirement plan services | | |
1-800-637-1255 | | |
8 a.m. to 8 p.m. ET | | |

Save paper with eDelivery. MFS® will send you prospectuses, reports, and proxies directly via e-mail so you will get information faster with less mailbox clutter. To sign up: 1. go to mfs.com. 2. log in via MFS® Access. 3. select eDelivery. If you own your MFS fund shares through a financial institution or a retirement plan, MFS® TALK, MFS Access, and eDelivery may not be available to you.


MFS® Government Securities Fund
Note to Shareholders: At the close of business on April 18, 2008, Class R shares and Class R2 shares converted into Class R3 shares. Following this conversion, Class R3, Class R4, and Class R5 shares were renamed Class R2, Class R3, and Class R4 shares, respectively.
The report is prepared for the general information of shareholders. It is authorized for distribution to prospective investors only when preceded or accompanied by a current prospectus.
NOT FDIC INSURED Ÿ MAY LOSE VALUE Ÿ
NO BANK OR CREDIT UNION GUARANTEE Ÿ NOT A DEPOSIT Ÿ
NOT INSURED BY ANY FEDERAL GOVERNMENT AGENCY OR
NCUA/NCUSIF
8/31/08
MFG-SEM

LETTER FROM THE CEO
Dear Shareholders:
The global economy is not a very welcoming place these days. Headlines tell the story of slowing growth, accelerating inflation, and credit collapse. We have watched the rampant selling that has typified equity and credit markets since the strains in the financial system first became apparent last year.
The volatility in commodity and currency markets has further complicated investment choices. There are so many parts moving in so many directions; it has become very easy to get overwhelmed.
At MFS® we remind investors to keep their eye on the long term and not become panicked by the uncertainty of the day to day.
Remember that what goes down could very easily come back up. And that is where we as money managers like to turn our focus.
Investment opportunities abound in oversold markets. When markets experience excessive selloffs, assets become undervalued. At MFS, we have a team of global sector analysts located in Boston, London, Mexico City, Singapore, Sydney, and Tokyo working together to do the kind of bottom-up research that will root out these investment opportunities.
In times like these, we encourage our investors to check in with their advisors to ensure they have an investment plan in place that will pay heed to the present, but that is firmly tailored to the future.
Respectfully,

Robert J. Manning
Chief Executive Officer and Chief Investment Officer
MFS Investment Management®
October 15, 2008
The opinions expressed in this letter are subject to change, may not be relied upon for investment advice, and no forecasts can be guaranteed.
1
PORTFOLIO COMPOSITION
Portfolio structure (i)

| | |
| Fixed income sectors (i) | | |
| Mortgage-Backed Securities | | 57.4% |
| U.S. Treasury Securities | | 24.4% |
| U.S. Government Agencies | | 12.8% |
| Municipal Bonds | | 3.1% |
| | |
| Credit quality of bonds (r) | | |
| AAA | | 99.4% |
| AA | | 0.6% |
| |
| Portfolio facts | | |
| Average Duration (d)(i) | | 4.9 |
| Average Life (i)(m) | | 6.9 yrs. |
| Average Maturity (i)(m) | | 15.2 yrs. |
| Average Credit Quality of Rated Securities (long-term) (a) | | AAA |
| Average Credit Quality of Rated Securities (short-term) (a) | | A-1 |
| (a) | The average credit quality of rated securities is based upon a market weighted average of portfolio holdings that are rated by public rating agencies. |
| (d) | Duration is a measure of how much a bond’s price is likely to fluctuate with general changes in interest rates, e.g., if rates rise 1.00%, a bond with a 5-year duration is likely to lose about 5.00% of its value. |
| (i) | For purposes of this presentation, the bond component includes accrued interest amounts and may be positively or negatively impacted by the equivalent exposure from any derivative holdings, if applicable. |
| (m) | The average maturity shown is calculated using the final stated maturity on the portfolio’s holdings without taking into account any holdings which have been pre-refunded or pre-paid to an earlier date or which have a mandatory put date prior to the stated maturity. The average life shown takes into account these earlier dates. |
| (r) | Each security is assigned a rating from Moody’s Investors Service. If not rated by Moody’s, the rating will be that assigned by Standard & Poor’s. Likewise, if not assigned a rating by Standard & Poor’s, it will be based on the rating assigned by Fitch, Inc. For those portfolios that hold a security which is not rated by any of the three agencies, the security is considered Not Rated. Holdings in U.S. Treasuries and government agency mortgage-backed securities, if any, are included in the “AAA”-rating category. Percentages are based on the total market value of investments as of 8/31/08. |
Percentages are based on net assets as of 8/31/08, unless otherwise noted.
The portfolio is actively managed and current holdings may be different.
2
EXPENSE TABLE
Fund expenses borne by the shareholders during the period,
March 1, 2008 through August 31, 2008
As a shareholder of the fund, you incur two types of costs: (1) transaction costs, including sales charges (loads) on certain purchase or redemption payments, and (2) ongoing costs, including management fees; distribution and service (12b-1) fees; and other fund expenses. This example is intended to help you understand your ongoing costs (in dollars) of investing in the fund and to compare these costs with the ongoing costs of investing in other mutual funds.
The example is based on an investment of $1,000 invested at the beginning of the period and held for the entire period March 1, 2008 through August 31, 2008.
The actual expenses include the payment of a portion of the transfer-agent-related expenses of MFS funds that invest in the fund. For further information, please see the Notes to the Financial Statements.
Actual Expenses
The first line for each share class in the following table provides information about actual account values and actual expenses. You may use the information in this line, together with the amount you invested, to estimate the expenses that you paid over the period. Simply divide your account value by $1,000 (for example, an $8,600 account value divided by $1,000 = 8.6), then multiply the result by the number in the first line under the heading entitled “Expenses Paid During Period” to estimate the expenses you paid on your account during this period.
Hypothetical Example for Comparison Purposes
The second line for each share class in the following table provides information about hypothetical account values and hypothetical expenses based on the fund’s actual expense ratio and an assumed rate of return of 5% per year before expenses, which is not the fund’s actual return. The hypothetical account values and expenses may not be used to estimate the actual ending account balance or expenses you paid for the period. You may use this information to compare the ongoing costs of investing in the fund and other funds. To do so, compare this 5% hypothetical example with the 5% hypothetical examples that appear in the shareholder reports of the other funds.
Please note that the expenses shown in the table are meant to highlight your ongoing costs only and do not reflect any transactional costs, such as sales charges (loads). Therefore, the second line for each share class in the table is useful in comparing ongoing costs only, and will not help you determine the relative total costs of owning different funds. In addition, if these transactional costs were included, your costs would have been higher.
3
Expense Table – continued
| | | | | | | | | | |
Share Class | | | | Annualized
Expense
Ratio | | Beginning
Account Value
3/1/08 | | Ending
Account Value
8/31/08 | | Expenses
Paid During
Period (p)
3/1/08-8/31/08 |
| A | | Actual | | 0.79% | | $1,000.00 | | $1,006.74 | | $4.00 |
| | Hypothetical (h) | | 0.79% | | $1,000.00 | | $1,021.22 | | $4.02 |
| B | | Actual | | 1.54% | | $1,000.00 | | $1,001.93 | | $7.77 |
| | Hypothetical (h) | | 1.54% | | $1,000.00 | | $1,017.44 | | $7.83 |
| C | | Actual | | 1.54% | | $1,000.00 | | $1,002.00 | | $7.77 |
| | Hypothetical (h) | | 1.54% | | $1,000.00 | | $1,017.44 | | $7.83 |
| I | | Actual | | 0.54% | | $1,000.00 | | $1,007.99 | | $2.73 |
| | Hypothetical (h) | | 0.54% | | $1,000.00 | | $1,022.48 | | $2.75 |
| R1 | | Actual | | 1.54% | | $1,000.00 | | $1,002.97 | | $7.77 |
| | Hypothetical (h) | | 1.54% | | $1,000.00 | | $1,017.44 | | $7.83 |
| R2 (formerly R3) | | Actual | | 1.04% | | $1,000.00 | | $1,005.47 | | $5.26 |
| | Hypothetical (h) | | 1.04% | | $1,000.00 | | $1,019.96 | | $5.30 |
| R3 (formerly R4) | | Actual | | 0.79% | | $1,000.00 | | $1,006.74 | | $4.00 |
| | Hypothetical (h) | | 0.79% | | $1,000.00 | | $1,021.22 | | $4.02 |
| R4 (formerly R5) | | Actual | | 0.54% | | $1,000.00 | | $1,007.99 | | $2.73 |
| | Hypothetical (h) | | 0.54% | | $1,000.00 | | $1,022.48 | | $2.75 |
| (h) | 5% class return per year before expenses. |
| (p) | Expenses paid is equal to each class’ annualized expense ratio, as shown above, multiplied by the average account value over the period, multiplied by the number of days in the period, divided by the number of days in the year. Expenses paid do not include any applicable sales charges (loads). If these transaction costs had been included, your costs would have been higher. |
4
PORTFOLIO OF INVESTMENTS
8/31/08 (unaudited)
The Portfolio of Investments is a complete list of all securities owned by your fund. It is categorized by broad-based asset classes.
| | | | | | |
| Bonds - 99.2% | | | | | | |
| Issuer | | Shares/Par | | Value ($) |
| | | | | | |
| Agency - Other - 6.8% | | | | | | |
| Financing Corp., 10.7%, 2017 | | $ | 14,360,000 | | $ | 20,790,185 |
| Financing Corp., 9.4%, 2018 | | | 11,750,000 | | | 15,996,356 |
| Financing Corp., 9.8%, 2018 | | | 14,975,000 | | | 20,911,120 |
| Financing Corp., 10.35%, 2018 | | | 15,165,000 | | | 21,974,919 |
| Financing Corp., STRIPS, 0%, 2017 | | | 18,780,000 | | | 12,582,375 |
| | | | | | |
| | | | | | $ | 92,254,955 |
| Mortgage Backed - 57.3% | | | | | | |
| Fannie Mae, 4.35%, 2013 | | $ | 900,015 | | $ | 874,522 |
| Fannie Mae, 4.374%, 2013 | | | 2,506,919 | | | 2,444,816 |
| Fannie Mae, 4.5%, 2015 - 2019 | | | 43,580,328 | | | 42,876,146 |
| Fannie Mae, 4.518%, 2014 | | | 2,741,214 | | | 2,678,008 |
| Fannie Mae, 4.543%, 2013 | | | 1,433,276 | | | 1,408,585 |
| Fannie Mae, 4.56%, 2015 | | | 2,321,371 | | | 2,246,610 |
| Fannie Mae, 4.6%, 2014 | | | 1,796,511 | | | 1,755,006 |
| Fannie Mae, 4.62%, 2015 | | | 3,317,533 | | | 3,224,767 |
| Fannie Mae, 4.665%, 2015 | | | 1,567,422 | | | 1,525,243 |
| Fannie Mae, 4.666%, 2014 | | | 5,858,206 | | | 5,730,211 |
| Fannie Mae, 4.69%, 2015 | | | 1,277,425 | | | 1,245,410 |
| Fannie Mae, 4.7%, 2015 | | | 1,798,483 | | | 1,753,185 |
| Fannie Mae, 4.73%, 2012 | | | 2,743,721 | | | 2,722,694 |
| Fannie Mae, 4.74%, 2015 | | | 1,774,668 | | | 1,732,830 |
| Fannie Mae, 4.77%, 2014 | | | 1,547,325 | | | 1,520,479 |
| Fannie Mae, 4.78%, 2015 | | | 1,934,379 | | | 1,888,540 |
| Fannie Mae, 4.786%, 2012 | | | 775,421 | | | 772,474 |
| Fannie Mae, 4.79%, 2012 - 2015 | | | 13,252,858 | | | 13,274,825 |
| Fannie Mae, 4.81%, 2015 | | | 1,665,942 | | | 1,628,877 |
| Fannie Mae, 4.815%, 2015 | | | 1,968,000 | | | 1,926,890 |
| Fannie Mae, 4.82%, 2014 - 2015 | | | 6,524,243 | | | 6,401,484 |
| Fannie Mae, 4.839%, 2014 | | | 8,796,200 | | | 8,687,941 |
| Fannie Mae, 4.845%, 2013 | | | 3,719,199 | | | 3,693,235 |
| Fannie Mae, 4.85%, 2015 | | | 1,428,963 | | | 1,404,485 |
| Fannie Mae, 4.87%, 2015 | | | 1,363,423 | | | 1,339,634 |
| Fannie Mae, 4.872%, 2014 | | | 5,617,119 | | | 5,565,260 |
| Fannie Mae, 4.88%, 2020 | | | 1,254,450 | | | 1,226,947 |
| Fannie Mae, 4.89%, 2015 | | | 1,262,212 | | | 1,242,662 |
| Fannie Mae, 4.92%, 2014 | | | 1,176,370 | | | 1,178,290 |
| Fannie Mae, 4.925%, 2015 | | | 5,305,282 | | | 5,237,936 |
5
Portfolio of Investments (unaudited) – continued
| | | | | | |
| Issuer | | Shares/Par | | Value ($) |
| | | | | | |
| Bonds - continued | | | | | | |
| Mortgage Backed - continued | | | | | | |
| Fannie Mae, 4.935%, 2014 | | $ | 780,352 | | $ | 774,541 |
| Fannie Mae, 4.996%, 2017 | | | 4,450,066 | | | 4,389,329 |
| Fannie Mae, 5%, 2013 - 2027 | | | 44,830,474 | | | 45,074,142 |
| Fannie Mae, 5.05%, 2017 | | | 1,897,000 | | | 1,865,265 |
| Fannie Mae, 5.06%, 2013 - 2017 | | | 2,874,976 | | | 2,852,193 |
| Fannie Mae, 5.09%, 2016 | | | 600,000 | | | 591,608 |
| Fannie Mae, 5.1%, 2014 - 2015 | | | 3,244,313 | | | 3,221,198 |
| Fannie Mae, 5.19%, 2020 | | | 1,528,574 | | | 1,482,470 |
| Fannie Mae, 5.27%, 2016 | | | 650,000 | | | 647,773 |
| Fannie Mae, 5.3%, 2017 | | | 787,629 | | | 785,283 |
| Fannie Mae, 5.369%, 2013 | | | 1,939,663 | | | 1,972,297 |
| Fannie Mae, 5.37%, 2018 | | | 1,880,000 | | | 1,855,157 |
| Fannie Mae, 5.38%, 2017 | | | 2,078,055 | | | 2,081,718 |
| Fannie Mae, 5.423%, 2016 | | | 2,941,166 | | | 2,971,753 |
| Fannie Mae, 5.471%, 2015 | | | 2,383,005 | | | 2,415,376 |
| Fannie Mae, 5.5%, 2017 - 2038 | | | 201,476,146 | | | 200,649,495 |
| Fannie Mae, 6%, 2017 - 2037 | | | 76,658,198 | | | 77,772,991 |
| Fannie Mae, 6.5%, 2016 - 2036 | | | 22,516,192 | | | 23,302,839 |
| Fannie Mae, 7.5%, 2024 - 2031 | | | 559,784 | | | 603,667 |
| Freddie Mac, 3.75%, 2024 | | | 1,803,684 | | | 1,798,646 |
| Freddie Mac, 4%, 2024 | | | 1,699,388 | | | 1,697,994 |
| Freddie Mac, 4.375%, 2015 | | | 5,422,730 | | | 5,405,887 |
| Freddie Mac, 4.5%, 2010 - 2026 | | | 14,130,096 | | | 14,191,859 |
| Freddie Mac, 5%, 2016 - 2028 | | | 62,195,055 | | | 62,622,497 |
| Freddie Mac, 5.5%, 2022 - 2035 | | | 74,195,693 | | | 74,193,895 |
| Freddie Mac, 6%, 2017 - 2038 | | | 36,702,865 | | | 37,145,813 |
| Freddie Mac, 6.5%, 2016 - 2037 | | | 11,270,233 | | | 11,595,979 |
| Ginnie Mae, 5.5%, 2033 - 2038 | | | 49,477,807 | | | 49,477,647 |
| Ginnie Mae, 5.612%, 2058 | | | 7,708,429 | | | 7,745,767 |
| Ginnie Mae, 6.36%, 2058 | | | 6,991,661 | | | 7,241,012 |
| | | | | | |
| | | | | | $ | 777,634,083 |
| Municipals - 3.1% | | | | | | |
California Educational Facilities Authority Rev.
(Stanford University), “T-1”, 5%, 2039 | | $ | 12,420,000 | | $ | 12,958,655 |
Illinois Regional Transportation Authority, “A”,
5.75%, 2034 | | | 7,665,000 | | | 8,662,293 |
| Massachusetts Bay Transportation Authority, Sales Tax Rev., “A-1”, 5.25%, 2028 | | | 7,075,000 | | | 7,775,496 |
Massachusetts Water Resources Authority Rev., “B”,
5.25%, 2035 | | | 8,950,000 | | | 9,611,137 |
| Minnesota Public Facilities Authority, Water Pollution Control Rev., “B”, 5%, 2018 | | | 2,325,000 | | | 2,572,915 |
| | | | | | |
| | | | | | $ | 41,580,496 |
6
Portfolio of Investments (unaudited) – continued
| | | | | | |
| Issuer | | Shares/Par | | Value ($) |
| | | | | | |
| Bonds - continued | | | | | | |
| U.S. Government Agencies - 5.8% | | | | | | |
| Aid-Egypt, 4.45%, 2015 | | $ | 7,118,000 | | $ | 7,277,514 |
| Empresa Energetica Cornito Ltd., 6.07%, 2010 | | | 3,890,000 | | | 4,017,125 |
| Farmer Mac, 5.5%, 2011 (n) | | | 11,110,000 | | | 11,697,952 |
| Small Business Administration, 4.77%, 2024 | | | 4,596,922 | | | 4,426,944 |
| Small Business Administration, 4.86%, 2024 - 2025 | | | 7,634,386 | | | 7,347,251 |
| Small Business Administration, 4.88%, 2024 | | | 2,720,462 | | | 2,612,619 |
| Small Business Administration, 4.89%, 2023 | | | 5,503,633 | | | 5,276,610 |
| Small Business Administration, 4.98%, 2023 | | | 2,236,773 | | | 2,182,327 |
| Small Business Administration, 4.99%, 2024 | | | 4,135,937 | | | 3,994,227 |
| Small Business Administration, 5.11%, 2025 | | | 4,140,968 | | | 4,009,719 |
| Small Business Administration, 5.52%, 2024 | | | 3,396,588 | | | 3,390,393 |
| Small Business Administration, 6.07%, 2022 | | | 2,609,782 | | | 2,692,312 |
| Small Business Administration, 6.34%, 2021 | | | 2,688,638 | | | 2,755,618 |
| Small Business Administration, 6.35%, 2021 | | | 2,353,610 | | | 2,412,552 |
| Small Business Administration, 6.44%, 2021 | | | 2,272,152 | | | 2,332,852 |
| Small Business Administration, 6.625%, 2021 | | | 2,533,295 | | | 2,634,405 |
| Small Business Administration, 8.625%, 2011 | | | 59,104 | | | 60,411 |
| Small Business Administration, 8.8%, 2011 | | | 68,610 | | | 69,652 |
| Small Business Administration, 9.05%, 2009 | | | 10,349 | | | 10,445 |
| Small Business Administration, 9.1%, 2009 | | | 7,999 | | | 8,138 |
| Small Business Administration, 9.25%, 2010 | | | 24,364 | | | 24,890 |
| Small Business Administration, 9.3%, 2010 | | | 64,334 | | | 65,512 |
| Small Business Administration, 9.5%, 2010 | | | 49,980 | | | 50,740 |
| Small Business Administration, 9.65%, 2010 | | | 39,301 | | | 40,022 |
| Small Business Administration, 9.7%, 2010 | | | 29,743 | | | 30,166 |
| Small Business Administration, 9.9%, 2008 | | | 3,360 | | | 3,361 |
| Small Business Administration, 10.05%, 2009 | | | 1,645 | | | 1,665 |
U.S. Department of Housing & Urban Development,
6.36%, 2016 | | | 7,000,000 | | | 7,360,836 |
U.S. Department of Housing & Urban Development,
6.59%, 2016 | | | 1,970,000 | | | 1,996,867 |
| | | | | | |
| | | | | | $ | 78,783,125 |
| U.S. Treasury Obligations - 26.2% | | | | | | |
| U.S. Treasury Bonds, 7.5%, 2016 | | $ | 3,421,000 | | $ | 4,325,160 |
| U.S. Treasury Bonds, 4.75%, 2017 | | | 11,911,000 | | | 12,830,386 |
| U.S. Treasury Bonds, 6.25%, 2023 | | | 8,165,000 | | | 9,845,202 |
| U.S. Treasury Bonds, 6.875%, 2025 | | | 1,307,000 | | | 1,691,339 |
| U.S. Treasury Bonds, 6%, 2026 | | | 5,933,000 | | | 7,057,025 |
| U.S. Treasury Bonds, 6.75%, 2026 (f) | | | 49,895,000 | | | 64,138,476 |
| U.S. Treasury Bonds, 5.25%, 2029 | | | 14,086,000 | | | 15,521,011 |
| U.S. Treasury Bonds, 6.25%, 2030 | | | 3,166,000 | | | 3,949,091 |
| U.S. Treasury Bonds, 4.375%, 2038 | | | 529,000 | | | 525,239 |
7
Portfolio of Investments (unaudited) – continued
| | | | | | |
| Issuer | | Shares/Par | | Value ($) |
| | | | | | |
| Bonds - continued | | | | | | |
| U.S. Treasury Obligations - continued | | | | | | |
| U.S. Treasury Notes, 4.875%, 2009 | | $ | 19,849,000 | | $ | 20,346,773 |
| U.S. Treasury Notes, 6%, 2009 | | | 1,866,000 | | | 1,932,040 |
| U.S. Treasury Notes, 4.75%, 2010 | | | 17,802,000 | | | 18,461,226 |
| U.S. Treasury Notes, 2.625%, 2010 | | | 20,428,000 | | | 20,552,488 |
| U.S. Treasury Notes, 5.125%, 2011 | | | 50,902,000 | | | 54,421,415 |
| U.S. Treasury Notes, 4.125%, 2012 | | | 15,630,000 | | | 16,356,545 |
| U.S. Treasury Notes, 3.375%, 2012 | | | 41,349,000 | | | 42,072,608 |
| U.S. Treasury Notes, 4.25%, 2013 | | | 2,114,000 | | | 2,230,600 |
| U.S. Treasury Notes, 4%, 2014 | | | 14,781,000 | | | 15,431,128 |
| U.S. Treasury Notes, 4.75%, 2014 | | | 6,223,000 | | | 6,750,013 |
| U.S. Treasury Notes, 4.25%, 2017 | | | 35,316,000 | | | 36,706,568 |
| | | | | | |
| | | | | | $ | 355,144,333 |
| Total Bonds (Identified Cost, $1,334,724,261) | | | | | $ | 1,345,396,992 |
| | |
| Money Market Funds (v) - 0.3% | | | | | | |
MFS Institutional Money Market Portfolio, 2.68%,
at Cost and Net Asset Value | | | 3,989,129 | | $ | 3,989,129 |
| Total Investments (Identified Cost, $1,338,713,390) | | | | | $ | 1,349,386,121 |
| | |
| Other Assets, Less Liabilities - 0.5% | | | | | | 7,067,981 |
| Net Assets - 100.0% | | | | | $ | 1,356,454,102 |
| (f) | All or a portion of the security has been segregated as collateral for open futures contracts. |
| (n) | Securities exempt from registration under Rule 144A of the Securities Act of 1933. These securities may be sold in the ordinary course of business in transactions exempt from registration, normally to qualified institutional buyers. At period end, the aggregate value of these securities was $11,697,952 representing 0.9% of net assets. |
| (v) | Underlying fund that is available only to investment companies managed by MFS. The rate quoted is the annualized seven-day yield of the fund at period end. |
Futures contracts outstanding at 8/31/08
| | | | | | | | |
| Description | | Contracts | | Value | | Expiration
Date | | Unrealized
Appreciation/
(Depreciation) |
| U.S. Treasury Bond 30 yr (Short) | | 221 | | $25,926,063 | | Dec-08 | | $25,125 |
At August 31, 2008, the fund had sufficient cash and/or other liquid securities to cover any commitments under these derivative contracts.
The following abbreviations are used in this report and are defined:
| STRIPS | | Separate Trading of Registered Interest and Principal of Securities |
See Notes to Financial Statements
8
Financial Statements
STATEMENT OF ASSETS AND LIABILITIES
At 8/31/08 (unaudited)
This statement represents your fund’s balance sheet, which details the assets and liabilities comprising the total value of the fund.
| | | | | |
| Assets | | | | | |
Investments - | | | | | |
Non-affiliated issuers, at value
(identified cost, $1,334,724,261) | | $1,345,396,992 | | | |
Underlying funds, at cost and value | | 3,989,129 | | | |
Total investments, at value (identified cost, $1,338,713,390) | | | | | $1,349,386,121 |
Cash | | $321,581 | | | |
Receivable for daily variation margin on open futures contracts | | 134,672 | | | |
Receivable for fund shares sold | | 1,438,067 | | | |
Interest and dividends receivable | | 8,689,402 | | | |
Other assets | | 3,770 | | | |
Total assets | | | | | $1,359,973,613 |
| Liabilities | | | | | |
Distributions payable | | $814,585 | | | |
Payable for fund shares reacquired | | 2,153,738 | | | |
Payable to affiliates | | | | | |
Management fee | | 44,433 | | | |
Shareholder servicing costs | | 259,166 | | | |
Distribution and service fees | | 36,258 | | | |
Administrative services fee | | 2,062 | | | |
Payable for independent trustees’ compensation | | 125,314 | | | |
Accrued expenses and other liabilities | | 83,955 | | | |
Total liabilities | | | | | $3,519,511 |
Net assets | | | | | $1,356,454,102 |
| Net assets consist of | | | | | |
Paid-in capital | | $1,400,266,356 | | | |
Unrealized appreciation (depreciation) on investments | | 10,697,856 | | | |
Accumulated net realized gain (loss) on investments | | (52,937,569 | ) | | |
Accumulated distributions in excess of net investment income | | (1,572,541 | ) | | |
Net assets | | | | | $1,356,454,102 |
Shares of beneficial interest outstanding | | | | | 140,899,740 |
9
Statement of Assets and Liabilities (unaudited) – continued
| | | | |
Class A shares | | | | |
Net assets | | $741,790,801 | | |
Shares outstanding | | 77,044,981 | | |
Net asset value per share | | | | $9.63 |
Offering price per share (100/95.25 × net asset value per share) | | | | $10.11 |
Class B shares | | | | |
Net assets | | $83,920,877 | | |
Shares outstanding | | 8,728,862 | | |
Net asset value and offering price per share | | | | $9.61 |
Class C shares | | | | |
Net assets | | $41,484,815 | | |
Shares outstanding | | 4,297,890 | | |
Net asset value and offering price per share | | | | $9.65 |
Class I shares | | | | |
Net assets | | $439,363,870 | | |
Shares outstanding | | 45,643,158 | | |
Net asset value, offering price, and redemption price per share | | | | $9.63 |
Class R1 shares | | | | |
Net assets | | $4,565,573 | | |
Shares outstanding | | 474,651 | | |
Net asset value, offering price, and redemption price per share | | | | $9.62 |
Class R2 shares (formerly Class R3 shares) | | | | |
Net assets | | $23,669,293 | | |
Shares outstanding | | 2,460,698 | | |
Net asset value, offering price, and redemption price per share | | | | $9.62 |
Class R3 shares (formerly Class R4 shares) | | | | |
Net assets | | $18,109,292 | | |
Shares outstanding | | 1,880,914 | | |
Net asset value, offering price, and redemption price per share | | | | $9.63 |
Class R4 shares (formerly Class R5 shares) | | | | |
Net assets | | $3,549,581 | | |
Shares outstanding | | 368,586 | | |
Net asset value, offering price, and redemption price per share | | | | $9.63 |
On sales of $50,000 or more, the offering price of Class A shares is reduced. A contingent deferred sales charge may be imposed on redemptions of Class A, Class B, and Class C shares.
See Notes to Financial Statements
10
Financial Statements
STATEMENT OF OPERATIONS
Six months ended 8/31/08 (unaudited)
This statement describes how much your fund earned in investment income and accrued in expenses. It also describes any gains and/or losses generated by fund operations.
| | | | | | |
| Net investment income | | | | | | |
Income | | | | | | |
Interest | | $32,118,984 | | | | |
Dividends from underlying funds | | 311,755 | | | | |
Total investment income | | | | | $32,430,739 | |
Expenses | | | | | | |
Management fee | | $2,729,626 | | | | |
Distribution and service fees | | 1,664,582 | | | | |
Shareholder servicing costs | | 1,256,775 | | | | |
Administrative services fee | | 90,514 | | | | |
Independent trustees’ compensation | | 16,907 | | | | |
Custodian fee | | 88,078 | | | | |
Shareholder communications | | 48,302 | | | | |
Auditing fees | | 25,732 | | | | |
Legal fees | | 11,650 | | | | |
Miscellaneous | | 120,471 | | | | |
Total expenses | | | | | $6,052,637 | |
Reduction of expenses by investment adviser | | (686,402 | ) | | | |
Net expenses | | | | | $5,366,235 | |
Net investment income | | | | | $27,064,504 | |
| Realized and unrealized gain (loss) on investments | | | | | | |
Realized gain (loss) (identified cost basis) | | | | | | |
Investment transactions in non-affiliated issuers | | $3,977,048 | | | | |
Futures contracts | | 235,599 | | | | |
Net realized gain (loss) on investments | | | | | $4,212,647 | |
Change in unrealized appreciation (depreciation) | | | | | | |
Investments | | $(22,841,424 | ) | | | |
Futures contracts | | 25,125 | | | | |
Net unrealized gain (loss) on investments | | | | | $(22,816,299 | ) |
Net realized and unrealized gain (loss) on investments | | | | | $(18,603,652 | ) |
Change in net assets from operations | | | | | $8,460,852 | |
See Notes to Financial Statements
11
Financial Statements
STATEMENTS OF CHANGES IN NET ASSETS
These statements describe the increases and/or decreases in net assets resulting from operations, any distributions, and any shareholder transactions.
| | | | | | |
| | | Six months ended
8/31/08 | | | Year ended
2/29/08 | |
| Change in net assets | | (Unaudited) | | | | |
| From operations | | | | | | |
Net investment income | | $27,064,504 | | | $58,023,488 | |
Net realized gain (loss) on investments | | 4,212,647 | | | 6,971,845 | |
Net unrealized gain (loss) on investments | | (22,816,299 | ) | | 37,633,795 | |
Change in net assets from operations | | $8,460,852 | | | $102,629,128 | |
| Distributions declared to shareholders | | | | | | |
From net investment income | | | | | | |
Class A | | $(16,456,638 | ) | | $(33,087,659 | ) |
Class B | | (1,647,831 | ) | | (4,002,420 | ) |
Class C | | (686,875 | ) | | (1,069,855 | ) |
Class I | | (10,402,757 | ) | | (22,038,804 | ) |
Class R (b) | | (27,242 | ) | | (280,019 | ) |
Class R1 | | (78,760 | ) | | (74,800 | ) |
Former Class R2 (b) | | (7,080 | ) | | (50,680 | ) |
Class R2 (formerly Class R3) | | (424,702 | ) | | (305,879 | ) |
Class R3 (formerly Class R4) | | (383,502 | ) | | (519,702 | ) |
Class R4 (formerly Class R5) | | (86,662 | ) | | (94,802 | ) |
Class 529A | | — | | | (883 | ) |
Class 529B | | — | | | (695 | ) |
Class 529C | | — | | | (447 | ) |
Total distributions declared to shareholders | | $(30,202,049 | ) | | $(61,526,645 | ) |
Change in net assets from fund share transactions | | $16,307,488 | | | $(19,517,789 | ) |
Total change in net assets | | $(5,433,709 | ) | | $21,584,694 | |
| Net assets | | | | | | |
| At beginning of period | | 1,361,887,811 | | | 1,340,303,117 | |
At end of period (including accumulated distributions in excess of net investment income of $1,572,541 and undistributed net investment income of $1,565,004) | | $1,356,454,102 | | | $1,361,887,811 | |
| (b) | At the close of business on April 18, 2008, Class R and Class R2 shares converted into Class R3 shares. Following the conversion, Class R3 shares were renamed Class R2 shares. |
See Notes to Financial Statements
12
Financial Statements
FINANCIAL HIGHLIGHTS
The financial highlights table is intended to help you understand the fund’s financial performance for the semiannual period and the past 5 fiscal years (or life of a particular share class, if shorter). Certain information reflects financial results for a single fund share. The total returns in the table represent the rate by which an investor would have earned (or lost) on an investment in the fund share class (assuming reinvestment of all distributions) held for the entire period.
| | | | | | | | | | | | | | | | | | |
| | | Six months
ended
8/31/08
(unaudited) | | | Years ended 2/29, 2/28 | |
| Class A | | | 2008 | | | 2007 | | | 2006 | | | 2005 | | | 2004 | |
| | | | | | | | | | | | | | | | | |
Net asset value, beginning of period | | $9.78 | | | $9.48 | | | $9.47 | | | $9.65 | | | $9.84 | | | $10.03 | |
Income (loss) from
investment operations | | | | | | | | | | | | | | | | | | |
Net investment income (d) | | $0.19 | | | $0.41 | | | $0.40 | | | $0.39 | | | $0.36 | | | $0.29 | |
Net realized and unrealized gain
(loss) on investments | | (0.13 | ) | | 0.33 | | | 0.04 | | | (0.17 | ) | | (0.19 | ) | | (0.08 | ) |
Total from investment operations | | $0.06 | | | $0.74 | | | $0.44 | | | $0.22 | | | $0.17 | | | $0.21 | |
Less distributions declared
to shareholders | | | | | | | | | | | | | | | | | | |
From net investment income | | $(0.21 | ) | | $(0.44 | ) | | $(0.43 | ) | | $(0.40 | ) | | $(0.36 | ) | | $(0.40 | ) |
Net asset value, end of period | | $9.63 | | | $9.78 | | | $9.48 | | | $9.47 | | | $9.65 | | | $9.84 | |
Total return (%) (r)(s)(t) | | 0.67 | (n) | | 8.02 | | | 4.75 | | | 2.28 | | | 1.81 | | | 2.19 | |
Ratios (%) (to average net assets)
and Supplemental data: | | | | | | | | | | | | | | | | | | |
Expenses before expense reductions (f) | | 0.89 | (a) | | 0.84 | | | 0.88 | | | 0.90 | | | 0.93 | | | 1.00 | |
Expenses after expense reductions (f) | | 0.79 | (a) | | 0.73 | | | 0.78 | | | 0.80 | | | 0.83 | | | 0.95 | |
Net investment income | | 3.95 | (a) | | 4.35 | | | 4.29 | | | 4.03 | | | 3.75 | | | 2.94 | |
Portfolio turnover | | 25 | | | 55 | | | 14 | | | 73 | | | 126 | | | 143 | |
Net assets at end of period
(000 Omitted) | | $741,791 | | | $740,620 | | | $731,126 | | | $826,001 | | | $932,879 | | | $803,974 | |
See Notes to Financial Statements
13
Financial Highlights – continued
| | | | | | | | | | | | | | | | | | |
| | | Six months
ended
8/31/08 (unaudited) | | | Years ended 2/29, 2/28 | |
| Class B | | | 2008 | | | 2007 | | | 2006 | | | 2005 | | | 2004 | |
| | | | | | | | | | | | | | | | | |
Net asset value, beginning of period | | $9.77 | | | $9.47 | | | $9.46 | | | $9.64 | | | $9.83 | | | $10.02 | |
Income (loss) from
investment operations | | | | | | | | | | | | | | | | | | |
Net investment income (d) | | $0.16 | | | $0.34 | | | $0.33 | | | $0.31 | | | $0.29 | | | $0.24 | |
Net realized and unrealized gain
(loss) on investments | | (0.14 | ) | | 0.33 | | | 0.04 | | | (0.16 | ) | | (0.18 | ) | | (0.09 | ) |
Total from investment operations | | $0.02 | | | $0.67 | | | $0.37 | | | $0.15 | | | $0.11 | | | $0.15 | |
Less distributions declared
to shareholders | | | | | | | | | | | | | | | | | | |
From net investment income | | $(0.18 | ) | | $(0.37 | ) | | $(0.36 | ) | | $(0.33 | ) | | $(0.30 | ) | | $(0.34 | ) |
Net asset value, end of period | | $9.61 | | | $9.77 | | | $9.47 | | | $9.46 | | | $9.64 | | | $9.83 | |
Total return (%) (r)(s)(t) | | 0.19 | (n) | | 7.22 | | | 3.97 | | | 1.52 | | | 1.12 | | | 1.53 | |
Ratios (%) (to average net assets)
and Supplemental data: | | | | | | | | | | | | | | | | | | |
Expenses before expense reductions (f) | | 1.64 | (a) | | 1.59 | | | 1.64 | | | 1.65 | | | 1.62 | | | 1.64 | |
Expenses after expense reductions (f) | | 1.54 | (a) | | 1.49 | | | 1.54 | | | 1.55 | | | 1.52 | | | 1.59 | |
Net investment income | | 3.21 | (a) | | 3.61 | | | 3.55 | | | 3.27 | | | 3.03 | | | 2.42 | |
Portfolio turnover | | 25 | | | 55 | | | 14 | | | 73 | | | 126 | | | 143 | |
Net assets at end of period
(000 Omitted) | | $83,921 | | | $94,206 | | | $124,277 | | | $175,207 | | | $233,734 | | | $255,512 | |
See Notes to Financial Statements
14
Financial Highlights – continued
| | | | | | | | | | | | | | | | | | |
| | | Six months
ended
8/31/08
(unaudited) | | | Years ended 2/29, 2/28 | |
| Class C | | | 2008 | | | 2007 | | | 2006 | | | 2005 | | | 2004 | |
| | | | | | | | | | | | | | | | | |
Net asset value, beginning of period | | $9.81 | | | $9.51 | | | $9.50 | | | $9.68 | | | $9.87 | | | $10.06 | |
Income (loss) from
investment operations | | | | | | | | | | | | | | | | | | |
Net investment income (d) | | $0.15 | | | $0.34 | | | $0.33 | | | $0.32 | | | $0.29 | | | $0.25 | |
Net realized and unrealized gain
(loss) on investments | | (0.13 | ) | | 0.33 | | | 0.04 | | | (0.17 | ) | | (0.18 | ) | | (0.10 | ) |
Total from investment operations | | $0.02 | | | $0.67 | | | $0.37 | | | $0.15 | | | $0.11 | | | $0.15 | |
Less distributions declared
to shareholders | | | | | | | | | | | | | | | | | | |
From net investment income | | $(0.18 | ) | | $(0.37 | ) | | $(0.36 | ) | | $(0.33 | ) | | $(0.30 | ) | | $(0.34 | ) |
Net asset value, end of period | | $9.65 | | | $9.81 | | | $9.51 | | | $9.50 | | | $9.68 | | | $9.87 | |
Total return (%) (r)(s)(t) | | 0.20 | (n) | | 7.21 | | | 3.97 | | | 1.52 | | | 1.13 | | | 1.54 | |
Ratios (%) (to average net assets)
and Supplemental data: | | | | | | | | | | | | | | | | | | |
Expenses before expense reductions (f) | | 1.64 | (a) | | 1.59 | | | 1.64 | | | 1.65 | | | 1.62 | | | 1.64 | |
Expenses after expense reductions (f) | | 1.54 | (a) | | 1.49 | | | 1.54 | | | 1.55 | | | 1.52 | | | 1.59 | |
Net investment income | | 3.18 | (a) | | 3.59 | | | 3.55 | | | 3.27 | | | 2.95 | | | 2.47 | |
Portfolio turnover | | 25 | | | 55 | | | 14 | | | 73 | | | 126 | | | 143 | |
Net assets at end of period
(000 Omitted) | | $41,485 | | | $35,316 | | | $27,529 | | | $35,768 | | | $44,692 | | | $63,609 | |
See Notes to Financial Statements
15
Financial Highlights – continued
| | | | | | | | | | | | | | | | | | |
| | | Six months
ended
8/31/08
(unaudited) | | | Years ended 2/29, 2/28 | |
| Class I | | | 2008 | | | 2007 | | | 2006 | | | 2005 | | | 2004 | |
| | | | | | | | | | | | | | | | | |
Net asset value, beginning
of period | | $9.78 | | | $9.48 | | | $9.47 | | | $9.65 | | | $9.84 | | | $10.03 | |
Income (loss) from
investment operations | | | | | | | | | | | | | | | | | | |
Net investment income (d) | | $0.20 | | | $0.44 | | | $0.42 | | | $0.41 | | | $0.39 | | | $0.25 | |
Net realized and
unrealized gain (loss)
on investments | | (0.12 | ) | | 0.32 | | | 0.04 | | | (0.17 | ) | | (0.19 | ) | | (0.00 | )(g)(w) |
Total from
investment operations | | $0.08 | | | $0.76 | | | $0.46 | | | $0.24 | | | $0.20 | | | $0.25 | |
Less distributions
declared to shareholders | | | | | | | | | | | | | | | | | | |
From net
investment income | | $(0.23 | ) | | $(0.46 | ) | | $(0.45 | ) | | $(0.42 | ) | | $(0.39 | ) | | $(0.44 | ) |
Net asset value, end
of period | | $9.63 | | | $9.78 | | | $9.48 | | | $9.47 | | | $9.65 | | | $9.84 | |
Total return (%) (r)(s) | | 0.80 | (n) | | 8.28 | | | 5.01 | | | 2.54 | | | 2.14 | | | 2.55 | |
Ratios (%) (to average
net assets) and
Supplemental data: | | | | | | | | | | | | | | | | | | |
Expenses before expense
reductions (f) | | 0.64 | (a) | | 0.59 | | | 0.63 | | | 0.65 | | | 0.60 | | | 0.67 | |
Expenses after expense
reductions (f) | | 0.54 | (a) | | 0.48 | | | 0.53 | | | 0.55 | | | 0.50 | | | 0.62 | |
Net investment income | | 4.20 | (a) | | 4.61 | | | 4.54 | | | 4.34 | | | 4.09 | | | 2.57 | |
Portfolio turnover | | 25 | | | 55 | | | 14 | | | 73 | | | 126 | | | 143 | |
Net assets at end of
period (000 Omitted) | | $439,364 | | | $449,109 | | | $432,536 | | | $359,623 | | | $279,080 | | | $168,124 | |
See Notes to Financial Statements
16
Financial Highlights – continued
| | | | | | | | | | | | |
| | | Six months
ended
8/31/08
(unaudited) | | | Years ended 2/29, 2/28 | |
| Class R1 | | | 2008 | | | 2007 | | | 2006 (i) | |
| | | | | | | | | | | |
Net asset value, beginning of period | | $9.77 | | | $9.48 | | | $9.46 | | | $9.57 | |
| Income (loss) from investment operations | | | | | | | | | | | | |
Net investment income (d) | | $0.16 | | | $0.33 | | | $0.32 | | | $0.29 | |
Net realized and unrealized gain
(loss) on investments | | (0.13 | ) | | 0.32 | | | 0.05 | | | (0.12 | )(g) |
Total from investment operations | | $0.03 | | | $0.65 | | | $0.37 | | | $0.17 | |
| Less distributions declared to shareholders | | | | | | | | | | | | |
From net investment income | | $(0.18 | ) | | $(0.36 | ) | | $(0.35 | ) | | $(0.28 | ) |
Net asset value, end of period | | $9.62 | | | $9.77 | | | $9.48 | | | $9.46 | |
Total return (%) (r)(s) | | 0.30 | (n) | | 7.00 | | | 3.98 | | | 1.82 | (n) |
Ratios (%) (to average net assets)
and Supplemental data: | | | | | | | | | | | | |
Expenses before expense reductions (f) | | 1.64 | (a) | | 1.68 | | | 1.82 | | | 1.85 | (a) |
Expenses after expense reductions (f) | | 1.54 | (a) | | 1.58 | | | 1.62 | | | 1.68 | (a) |
Net investment income | | 3.20 | (a) | | 3.45 | | | 3.45 | | | 3.25 | (a) |
Portfolio turnover | | 25 | | | 55 | | | 14 | | | 73 | |
Net assets at end of period (000 Omitted) | | $4,566 | | | $3,832 | | | $586 | | | $192 | |
See Notes to Financial Statements
17
Financial Highlights – continued
| | | | | | | | | | | | | | | | | | |
| | | Six months
ended
8/31/08
(unaudited) | | | Years ended 2/29, 2/28 | |
| Class R2 (formerly Class R3) | | | 2008 | | | 2007 | | | 2006 | | | 2005 | | | 2004 (i) | |
| | | | | | | | | | | | | | | | | |
Net asset value, beginning of period | | $9.77 | | | $9.48 | | | $9.47 | | | $9.65 | | | $9.84 | | | $9.69 | |
Income (loss) from
investment operations | | | | | | | | | | | | | | | | | | |
Net investment income (d) | | $0.18 | | | $0.37 | | | $0.37 | | | $0.35 | | | $0.38 | | | $0.02 | |
Net realized and unrealized gain
(loss) on investments | | (0.13 | ) | | 0.32 | | | 0.03 | | | (0.18 | ) | | (0.25 | ) | | 0.23 | (g) |
Total from investment operations | | $0.05 | | | $0.69 | | | $0.40 | | | $0.17 | | | $0.13 | | | $0.25 | |
Less distributions declared
to shareholders | | | | | | | | | | | | | | | | | | |
From net investment income | | $(0.20 | ) | | $(0.40 | ) | | $(0.39 | ) | | $(0.35 | ) | | $(0.32 | ) | | $(0.10 | ) |
Net asset value, end of period | | $9.62 | | | $9.77 | | | $9.48 | | | $9.47 | | | $9.65 | | | $9.84 | |
Total return (%) (r)(s) | | 0.55 | (n) | | 7.51 | | | 4.34 | | | 1.82 | | | 1.38 | | | 2.58 | (n) |
Ratios (%) (to average net assets)
and Supplemental data: | | | | | | | | | | | | | | | | | | |
Expenses before expense reductions (f) | | 1.14 | (a) | | 1.19 | | | 1.37 | | | 1.40 | | | 1.36 | | | 1.42 | (a) |
Expenses after expense reductions (f) | | 1.04 | (a) | | 1.09 | | | 1.17 | | | 1.24 | | | 1.26 | | | 1.37 | (a) |
Net investment income | | 3.70 | (a) | | 3.95 | | | 3.89 | | | 3.64 | | | 3.99 | | | 0.72 | (a) |
Portfolio turnover | | 25 | | | 55 | | | 14 | | | 73 | | | 126 | | | 143 | |
Net assets at end of period
(000 Omitted) | | $23,669 | | | $13,863 | | | $3,928 | | | $1,392 | | | $422 | | | $41 | |
See Notes to Financial Statements
18
Financial Highlights – continued
| | | | | | | | | | | | |
| | | Six months
ended
8/31/08 (unaudited) | | | Years ended 2/29, 2/28 | |
| Class R3 (formerly Class R4) | | | 2008 | | | 2007 | | | 2006 (i) | |
| | | | | | | | | | | |
Net asset value, beginning of period | | $9.78 | | | $9.48 | | | $9.48 | | | $9.58 | |
| Income (loss) from investment operations | | | | | | | | | | | | |
Net investment income (d) | | $0.19 | | | $0.40 | | | $0.39 | | | $0.36 | |
Net realized and unrealized gain
(loss) on investments | | (0.13 | ) | | 0.33 | | | 0.02 | | | (0.11 | )(g) |
Total from investment operations | | $0.06 | | | $0.73 | | | $0.41 | | | $0.25 | |
| Less distributions declared to shareholders | | | | | | | | | | | | |
From net investment income | | $(0.21 | ) | | $(0.43 | ) | | $(0.41 | ) | | $(0.35 | ) |
Net asset value, end of period | | $9.63 | | | $9.78 | | | $9.48 | | | $9.48 | |
Total return (%) (r)(s) | | 0.67 | (n) | | 7.88 | | | 4.49 | | | 2.64 | (n) |
Ratios (%) (to average net assets)
and Supplemental data: | | | | | | | | | | | | |
Expenses before expense reductions (f) | | 0.89 | (a) | | 0.95 | | | 1.02 | | | 1.05 | (a) |
Expenses after expense reductions (f) | | 0.79 | (a) | | 0.85 | | | 0.92 | | | 0.95 | (a) |
Net investment income | | 3.94 | (a) | | 4.21 | | | 4.15 | | | 4.02 | (a) |
Portfolio turnover | | 25 | | | 55 | | | 14 | | | 73 | |
Net assets at end of period (000 Omitted) | | $18,109 | | | $15,317 | | | $8,108 | | | $1,305 | |
See Notes to Financial Statements
19
Financial Highlights – continued
| | | | | | | | | | | | |
| | | Six months
ended
8/31/08 (unaudited) | | | Years ended 2/29, 2/28 | |
| Class R4 (formerly Class R5) | | | 2008 | | | 2007 | | | 2006 (i) | |
| | | | | | | | | | | |
Net asset value, beginning of period | | $9.78 | | | $9.51 | | | $9.47 | | | $9.58 | |
| Income (loss) from investment operations | | | | | | | | | | | | |
Net investment income (d) | | $0.21 | | | $0.43 | | | $0.42 | | | $0.37 | |
Net realized and unrealized gain
(loss) on investments | | (0.13 | ) | | 0.29 | | | 0.06 | | | (0.10 | )(g) |
Total from investment operations | | $0.08 | | | $0.72 | | | $0.48 | | | $0.27 | |
| Less distributions declared to shareholders | | | | | | | | | | | | |
From net investment income | | $(0.23 | ) | | $(0.45 | ) | | $(0.44 | ) | | $(0.38 | ) |
Net asset value, end of period | | $9.63 | | | $9.78 | | | $9.51 | | | $9.47 | |
Total return (%) (r)(s) | | 0.80 | (n) | | 7.85 | | | 5.24 | | | 2.81 | (n) |
Ratios (%) (to average net assets)
and Supplemental data: | | | | | | | | | | | | |
Expenses before expense reductions (f) | | 0.64 | (a) | | 0.65 | | | 0.73 | | | 0.75 | (a) |
Expenses after expense reductions (f) | | 0.54 | (a) | | 0.55 | | | 0.63 | | | 0.65 | (a) |
Net investment income | | 4.20 | (a) | | 4.47 | | | 4.44 | | | 4.20 | (a) |
Portfolio turnover | | 25 | | | 55 | | | 14 | | | 73 | |
Net assets at end of period (000 Omitted) | | $3,550 | | | $3,772 | | | $54 | | | $51 | |
Any redemption fees charged by the fund during the 2004 and 2005 fiscal years resulted in a per share impact of less than $0.01.
| (d) | Per share data are based on average shares outstanding. |
| (f) | Ratios do not reflect reductions from fees paid indirectly, if applicable. |
| (g) | The per share amount is not in accordance with the net realized and unrealized gain/loss for the period because of the timing of sales of fund shares and the per share amount of realized and unrealized gains and losses at such time. |
| (i) | For the period from the class’ inception, October 31, 2003 (Class R2), April 1, 2005 (Classes R1, R3, and R4) through the stated period end. |
| (r) | Certain expenses have been reduced without which performance would have been lower. |
| (s) | From time to time the fund may receive proceeds from litigation settlements, without which performance would be lower. |
| (t) | Total returns do not include any applicable sales charges. |
| (w) | Per share amount was less than $0.01. |
See Notes to Financial Statements
20
NOTES TO FINANCIAL STATEMENTS
(unaudited)
| (1) | | Business and Organization |
MFS Government Securities Fund (the fund) is a series of MFS Series Trust XIII (the trust). The trust is organized as a Massachusetts business trust and is registered under the Investment Company Act of 1940, as amended, as an open-end management investment company.
| (2) | | Significant Accounting Policies |
General – The preparation of financial statements in conformity with U.S. generally accepted accounting principles requires management to make estimates and assumptions that affect the reported amounts of assets and liabilities, and disclosure of contingent assets and liabilities at the date of the financial statements and the reported amounts of revenues and expenses during the reporting period. Actual results could differ from those estimates.
The fund may invest a significant portion of its assets in mortgage-backed securities. The value of mortgage-backed securities may depend, in part, on the issuer’s or borrower’s credit quality or ability to pay principal and interest when due and may fall if an issuer or borrower defaults on its obligation to pay principal or interest or if the instrument’s credit rating is downgraded by a credit rating agency. U.S. Government securities not supported as to the payment of principal or interest by the U.S. Treasury, such as those issued by Fannie Mae, Freddie Mac, and the Federal Home Loan Banks, are subject to greater credit risk than are U.S. Government securities supported by the U.S. Treasury, such as those issued by Ginnie Mae.
Investment Valuations – Debt instruments and floating rate loans (other than short-term instruments), including restricted debt instruments, are generally valued at an evaluated or composite bid as reported by a third party pricing service. Short-term instruments with a maturity at issuance of 60 days or less may be valued at amortized cost, which approximates market value. Futures contracts are generally valued at last posted settlement price as reported by a third party pricing service on the market on which they are primarily traded. Futures contracts for which there were no trades that day for a particular position are generally valued at the closing bid quotation as reported by a third party pricing service on the market on which such futures contracts are primarily traded. Open-end investment companies are generally valued at net asset value per share. Securities and other assets generally valued on the basis of information from a third party pricing service may also be valued at a broker-dealer bid quotation. Values obtained from pricing services can utilize both dealer-supplied valuations and electronic data processing techniques, which take into account factors such as institutional-size trading in similar
21
Notes to Financial Statements (unaudited) – continued
groups of securities, yield, quality, coupon rate, maturity, type of issue, trading characteristics, and other market data.
The Board of Trustees has delegated primary responsibility for determining or causing to be determined the value of the fund’s investments (including any fair valuation) to the adviser pursuant to valuation policies and procedures approved by the Board. If the adviser determines that reliable market quotations are not readily available, investments are valued at fair value as determined in good faith by the adviser in accordance with such procedures under the oversight of the Board of Trustees. Under the fund’s valuation policies and procedures, market quotations are not considered to be readily available for most types of debt instruments and floating rate loans and many types of derivatives. These investments are generally valued at fair value based on information from third party pricing services. In addition, investments may be valued at fair value if the adviser determines that an investment’s value has been materially affected by events occurring after the close of the exchange or market on which the investment is principally traded (such as foreign exchange or market) and prior to the determination of the fund’s net asset value, or after the halting of trading of a specific security where trading does not resume prior to the close of the exchange or market on which the security is principally traded. The adviser may rely on third party pricing services or other information (such as the correlation with price movements of similar securities in the same or other markets; the type, cost and investment characteristics of the security; the business and financial condition of the issuer; and trading and other market data) to assist in determining whether to fair value and at what value to fair value an investment. The value of an investment for purposes of calculating the fund’s net asset value can differ depending on the source and method used to determine value. When fair valuation is used, the value of investments used to determine the fund’s net asset value may differ from quoted or published prices for the same investments.
The fund adopted FASB Statement No. 157, Fair Value Measurements (the “Statement”) in this reporting period. This Statement provides a single definition of fair value, a hierarchy for measuring fair value and expanded disclosures about fair value measurements.
Various inputs are used in determining the value of the fund’s assets or liabilities carried at market value. These inputs are categorized into three broad levels. Level 1 includes quoted prices in active markets for identical assets or liabilities. Level 2 includes other significant observable market-based inputs (including quoted prices for similar securities, interest rates, prepayment speed, and credit risk). Level 3 includes unobservable inputs, which may include the adviser’s own assumptions in determining the fair value of investments. Other financial instruments are derivative instruments not reflected in total investments, such as futures, forwards, swap contracts and written options, which are valued at the
22
Notes to Financial Statements (unaudited) – continued
unrealized appreciation/depreciation on the instrument. The following is a summary of the levels used as of August 31, 2008 in valuing the fund’s assets or liabilities carried at market value:
| | | | | | | | |
| | | Level 1 | | Level 2 | | Level 3 | | Total |
| Investments in Securities | | $3,989,129 | | $1,345,396,992 | | $— | | $1,349,386,121 |
| Other Financial Instruments | | $25,125 | | $— | | $— | | $25,125 |
Derivative Risk – The fund may invest in derivatives for hedging or non-hedging purposes. While hedging can reduce or eliminate losses, it can also reduce or eliminate gains. When the fund uses derivatives as an investment to gain market exposure, or for hedging purposes, gains and losses from derivative instruments may be substantially greater than the derivative’s original cost. Cash that has been segregated on behalf of certain derivative contracts will be reported separately on the Statement of Assets and Liabilities as restricted cash. On some over-the-counter derivatives, the fund attempts to reduce its exposure to counterparty credit risk by entering into an ISDA Master Agreement on a bilateral basis with each of the counterparties with whom it undertakes a significant volume of transactions. The ISDA Master Agreement gives the fund the right, upon an event of default by the applicable counterparty, to close out all transactions traded under such agreement and to net amounts owed under each transaction to one net amount payable by one party to the other. This right to close out and net payments across all transactions traded under the ISDA Master Agreement could result in a reduction of the fund’s credit risk to such counterparty equal to any amounts payable by the fund under the applicable transactions, if any. However, absent an event of default by the counterparty, the ISDA Master Agreement does not result in an offset of reported balance sheet assets and liabilities across transactions between the fund and the applicable counterparty. Derivative instruments include purchased options and futures contracts.
In March 2008, FASB Statement No. 161, Disclosures about Derivative Instruments and Hedging Activities (the “Standard”) was issued, and is effective for financial statements issued for fiscal years and interim periods beginning after November 15, 2008. This Standard provides enhanced disclosures about the fund’s use of and accounting for derivative instruments and the effect of derivative instruments on the fund’s results of operations and financial position. Management is evaluating the application of the Standard to the fund, and has not at this time determined the impact, if any, resulting from the adoption of this Standard on the fund’s financial statements.
Purchased Options – The fund may purchase call or put options for a premium. Purchasing call options may be a hedge against an anticipated increase in the dollar cost of securities to be acquired or to increase the fund’s exposure to the underlying instrument. Purchasing put options may hedge
23
Notes to Financial Statements (unaudited) – continued
against a decline in the value of portfolio securities. The premium paid is included as an investment in the Statement of Assets and Liabilities and is subsequently adjusted to the current value of the option. Premiums paid for purchased options which have expired are treated as realized losses on investments in the Statement of Operations. Premiums paid for purchased options which are exercised or closed are added to the amount paid or offset against the proceeds on the underlying security or financial instrument to determine the realized gain or loss. The risk of loss associated with purchased options is limited to the premium paid.
Futures Contracts – The fund may enter into futures contracts for the delayed delivery of securities or currency, or contracts based on financial indices at a fixed price on a future date. In entering such contracts, the fund is required to deposit with the broker either in cash or securities an amount equal to a certain percentage of the contract amount. Subsequent payments are made or received by the fund each day, depending on the daily fluctuations in the value of the contract, and are recorded for financial statement purposes as unrealized gains or losses by the fund. Upon entering into such contracts, the fund bears the risk of interest or exchange rates or securities prices moving unexpectedly, in which case, the fund may not achieve the anticipated benefits of the futures contracts and may realize a loss.
Indemnifications – Under the fund’s organizational documents, its officers and trustees may be indemnified against certain liabilities and expenses arising out of the performance of their duties to the fund. Additionally, in the normal course of business, the fund enters into agreements with service providers that may contain indemnification clauses. The fund’s maximum exposure under these agreements is unknown as this would involve future claims that may be made against the fund that have not yet occurred.
Investment Transactions and Income – Investment transactions are recorded on the trade date. Some securities may be purchased on a “when-issued” or “forward delivery” basis, which means that the securities will be delivered to the fund at a future date, usually beyond customary settlement time. Interest income is recorded on the accrual basis. All premium and discount is amortized or accreted for financial statement purposes in accordance with U.S. generally accepted accounting principles.
The fund may receive proceeds from litigation settlements. Any proceeds received from litigation involving portfolio holdings are reflected in the Statement of Operations in realized gain/loss if the security has been disposed of by the fund or in unrealized gain/loss if the security is still held by the fund. Any other proceeds from litigation not related to portfolio holdings are reflected as other income in the Statement of Operations.
24
Notes to Financial Statements (unaudited) – continued
The fund may enter into “TBA” (to be announced) purchase commitments to purchase securities for a fixed unit price at a future date. Although the unit price has been established, the principal value has not been finalized. However, the principal amount of the commitments will not fluctuate more than 0.01%. The fund holds, and maintains until settlement date, cash or high-grade debt obligations in an amount sufficient to meet the purchase price, or the fund may enter into offsetting contracts for the forward sale of other securities it owns. Income on the securities will not be earned until settlement date. TBA purchase commitments may be considered securities in themselves, and involve a risk of loss if the value of the security to be purchased declines prior to settlement date, which is in addition to the risk of decline in the value of the fund’s other assets. Unsettled TBA purchase commitments are valued at the current market value of the underlying securities.
The fund may enter into “TBA” (to be announced) sale commitments to hedge its portfolio positions or to sell mortgage-backed securities it owns under delayed delivery arrangements. Proceeds of TBA sale commitments are not received until the contractual settlement date. During the time a TBA sale commitment is outstanding, equivalent deliverable securities, or an offsetting TBA purchase commitment deliverable on or before the sale commitment date, are held as “cover” for the transaction.
Fees Paid Indirectly – The fund’s custody fee may be reduced according to an arrangement that measures the value of cash deposited with the custodian by the fund. For the six months ended August 31, 2008, custody fees were not reduced.
Tax Matters and Distributions – The fund intends to qualify as a regulated investment company, as defined under Subchapter M of the Internal Revenue Code, and to distribute all of its taxable income, including realized capital gains. As a result, no provision for federal income tax is required. The fund adopted the provisions of FASB Interpretation No. 48, Accounting for Uncertainty in Income Taxes (“the Interpretation”). The Interpretation prescribes a minimum threshold for financial statement recognition of the benefit of a tax position taken or expected to be taken in a tax return. There was no impact resulting from the adoption of this Interpretation on the fund’s financial statements. Each of the fund’s federal tax returns for the prior three fiscal years remains subject to examination by the Internal Revenue Service. It is the fund’s policy to record interest and penalty charges on underpaid taxes associated with its tax positions as interest expense and miscellaneous expense, respectively. No such charges were recorded in the current financial statements. Foreign taxes, if any, have been accrued by the fund in the accompanying financial statements.
Distributions to shareholders are recorded on the ex-dividend date. Income and capital gain distributions are determined in accordance with income tax regulations, which may differ from U.S. generally accepted accounting
25
Notes to Financial Statements (unaudited) – continued
principles. Certain capital accounts in the financial statements are periodically adjusted for permanent differences in order to reflect their tax character. These adjustments have no impact on net assets or net asset value per share. Temporary differences which arise from recognizing certain items of income, expense, gain or loss in different periods for financial statement and tax purposes will reverse at some time in the future. Distributions in excess of net investment income or net realized gains are temporary overdistributions for financial statement purposes resulting from differences in the recognition or classification of income or distributions for financial statement and tax purposes.
Book/tax differences primarily relate to expiration of capital loss carryforwards, amortization and accretion of debt securities, and straddle loss deferrals.
The tax character of distributions made during the current period will be determined at year end. The tax character of distributions declared to shareholders is as follows:
| | |
| | | 2/29/08 |
Ordinary income (including any
short-term capital gains) | | $61,526,645 |
The federal tax cost and the tax basis components of distributable earnings were as follows:
| | | |
| As of 8/31/08 | | | |
| Cost of investments | | $1,350,197,765 | |
| Gross appreciation | | $13,010,650 | |
| Gross depreciation | | (13,822,294 | ) |
| Net unrealized appreciation (depreciation) | | $(811,644 | ) |
| |
| As of 2/29/08 | | | |
| Undistributed ordinary income | | $6,761,377 | |
| Capital loss carryfowards | | (45,584,171 | ) |
| Other temporary differences | | (5,862,365 | ) |
| Net unrealized appreciation (depreciation) | | 22,614,102 | |
The aggregate cost above includes prior fiscal year end tax adjustments.
As of February 29, 2008, the fund had capital loss carryforwards available to offset future realized gains. Such losses expire as follows:
| | | |
| 2/28/09 | | $(3,477,230 | ) |
| 2/28/11 | | (11,527,172 | ) |
| 2/29/12 | | (5,729,829 | ) |
| 2/28/13 | | (11,095,767 | ) |
| 2/28/14 | | (6,955,037 | ) |
| 2/28/15 | | (6,799,136 | ) |
| | $(45,584,171 | ) |
26
Notes to Financial Statements (unaudited) – continued
The availability of a portion of the capital loss carryforwards, which were acquired on November 19, 2004 in connection with the MFS Government Mortgage Fund merger, may be limited in a given year.
Multiple Classes of Shares of Beneficial Interest – The fund offers multiple classes of shares, which differ in their respective distribution and service fees. The fund’s income, realized and unrealized gain (loss), and common expenses are allocated to shareholders based on the daily net assets of each class, without distinction between share classes. Dividends are declared separately for each class. Differences in per share dividend rates are generally due to differences in separate class expenses. Class B shares will convert to Class A shares approximately eight years after purchase. At the close of business on April 18, 2008, Class R and Class R2 shares converted into Class R3 shares. Following this conversion, Class R3, Class R4, and Class R5 shares were renamed Class R2, Class R3, and Class R4 shares, respectively. Class 529A, Class 529B, and Class 529C shares closed on March 30, 2007.
| (3) | | Transactions with Affiliates |
Investment Adviser – The fund has an investment advisory agreement with Massachusetts Financial Services Company (MFS) to provide overall investment management and related administrative services and facilities to the fund. The management fee is computed daily and paid monthly at an annual rate of 0.40% of the fund’s average daily net assets.
As part of a settlement agreement with the New York Attorney General concerning market timing and related matters, MFS has agreed to reduce the management fee to 0.30% of the fund’s average daily net assets for the period March 1, 2004 through February 28, 2009. For the six months ended August 31, 2008, this waiver amounted to $682,401 and is reflected as a reduction of total expenses in the Statement of Operations. The management fee incurred for the six months ended August 31, 2008 was equivalent to an annual effective rate of 0.30% of the fund’s average daily net assets.
The investment adviser has agreed in writing to pay a portion of the fund’s operating expenses, exclusive of management, distribution and service, and certain other fees and expenses, such that operating expenses do not exceed 0.25% annually of the fund’s average daily net assets. This written agreement will continue through June 30, 2009 unless changed or rescinded by the funds Board of Trustees. For the six months ended August 31,2008, the funds actual operating expenses did not exceed this limit and therefore, the investment advisor did not pay any portion of the fund’s expenses.
The investment adviser has also agreed in writing to pay a portion of the fund’s operating expenses, exclusive of certain fees and expenses, such that
27
Notes to Financial Statements (unaudited) – continued
total annual fund operating expenses do not exceed the following rates annually of the fund’s average daily net assets with respect to each class:
| | | | | | | | | | | | | | |
| Class A | | Class B | | Class C | | Class I | | Class R1 | | Class R2
(formerly R3) | | Class R3
(formerly R4) | | Class R4
(formerly R5) |
| 0.80% | | 1.55% | | 1.55% | | 0.55% | | 1.55% | | 1.05% | | 0.80% | | 0.55% |
This written agreement may be rescinded only upon consent of the fund’s Board of Trustees. For the six months ended August 31, 2008, the fund’s actual operating expenses, after taking into account the management fee reduction described above, did not exceed these limits and therefore, the investment adviser did not pay any portion of the fund’s expenses.
Distributor – MFS Fund Distributors, Inc. (MFD), a wholly-owned subsidiary of MFS, as distributor, received $41,574 for the six months ended August 31, 2008, as its portion of the initial sales charge on sales of Class A shares of the fund.
The Board of Trustees has adopted a distribution plan for certain class shares pursuant to Rule 12b-1 of the Investment Company Act of 1940.
The fund’s distribution plan provides that the fund will pay MFD for services provided by MFD and financial intermediaries in connection with the distribution and servicing of certain share classes. One component of the plan is a distribution fee paid to MFD and another component of the plan is a service fee paid to MFD. MFD may subsequently pay all, or a portion, of the distribution and/or service fees to financial intermediaries.
Distribution Plan Fee Table:
| | | | | | | | | | |
| | | Distribution
Fee Rate | | Service
Fee Rate | | Total
Distribution
Plan (d) | | Annual
Effective
Rate (e) | | Distribution
andService
Fee |
| Class A | | 0.10% | | 0.25% | | 0.35% | | 0.25% | | $931,145 |
| Class B | | 0.75% | | 0.25% | | 1.00% | | 1.00% | | 448,009 |
| Class C | | 0.75% | | 0.25% | | 1.00% | | 1.00% | | 187,183 |
| Class R (b) | | 0.25% | | 0.25% | | 0.50% | | 0.50% | | 3,232 |
| Class R1 | | 0.75% | | 0.25% | | 1.00% | | 1.00% | | 21,468 |
| Former Class R2 (b) | | 0.25% | | 0.25% | | 0.50% | | 0.50% | | 840 |
| Class R2 (formerly Class R3) | | 0.25% | | 0.25% | | 0.50% | | 0.50% | | 50,996 |
| Class R3 (formerly Class R4) | | — | | 0.25% | | 0.25% | | 0.25% | | 21,709 |
| Total Distribution and Service Fees | | | | | | | | | | $1,664,582 |
| (b) | At the close of business on April 18, 2008, Class R and Class R2 shares converted into Class R3 shares. Following this conversion, Class R3 shares were renamed Class R2 shares. |
| (d) | In accordance with the distribution plan for certain classes, the fund pays distribution and/or service fees up to these annual percentage rates of each class’ average daily net assets. |
| (e) | The annual effective rates represent actual fees incurred under the distribution plan for the six months ended August 31, 2008 based on each class’ average daily net assets. Payment of the 0.10% annual Class A distribution fee is not yet in effect and will be implemented on such date as the fund’s Board of Trustees may determine. |
28
Notes to Financial Statements (unaudited) – continued
Certain Class A shares purchased prior to September 1, 2008 are subject to a contingent deferred sales charge (CDSC) in the event of a shareholder redemption within 12 months of purchase. Certain Class A shares purchased on or subsequent to September 1, 2008 are subject to a CDSC in the event of a shareholder redemption within 24 months of purchase. Class C shares are subject to a CDSC in the event of a shareholder redemption within 12 months of purchase. Class B shares are subject to a CDSC in the event of a shareholder redemption within six years of purchase. All contingent deferred sales charges are paid to MFD and during the six months ended August 31, 2008, were as follows:
| | |
| | | Amount |
| Class A | | $1,756 |
| Class B | | $51,327 |
| Class C | | $8,331 |
Shareholder Servicing Agent – MFS Service Center, Inc. (MFSC), a wholly-owned subsidiary of MFS, receives a fee from the fund for its services as shareholder servicing agent calculated as a percentage of the average daily net assets of the fund as determined periodically under the supervision of the fund’s Board of Trustees. For the six months ended August 31, 2008, the fee was $435,878, which equated to 0.0637% annually of the fund’s average daily net assets. MFSC also receives payment from the fund for out-of-pocket expenses, sub-accounting and other shareholder servicing costs which may be paid to affiliated and unaffiliated service providers. For the six months ended August 31, 2008, these out-of-pocket expenses, sub-accounting and other shareholder servicing costs amounted to $408,783.
Under a Special Servicing Agreement among MFS, each MFS fund which invests in other MFS funds (“MFS fund-of-funds”) and each underlying fund in which a MFS fund-of-funds invests (“underlying funds”), each underlying fund may pay a portion of each MFS fund-of-fund’s transfer agent-related expenses, including sub-accounting fees payable to financial intermediaries, to the extent such payments do not exceed the benefits realized or expected to be realized by the underlying fund from the investment in the underlying fund by the MFS fund-of-fund. For the six months ended August 31, 2008, these costs for the fund amounted to $412,114 and are reflected in the shareholder servicing costs on the Statement of Operations.
Administrator – MFS provides certain financial, legal, shareholder communications, compliance, and other administrative services to the fund. Under an administrative services agreement, the fund partially reimburses MFS the costs incurred to provide these services. The fund is charged a fixed amount plus a fee based on average daily net assets. The fund’s annual fixed amount is $17,500.
29
Notes to Financial Statements (unaudited) – continued
The administrative services fee incurred for the six months ended August 31, 2008 was equivalent to an annual effective rate of 0.0132% of the fund’s average daily net assets.
Trustees’ and Officers’ Compensation – The fund pays compensation to independent trustees in the form of a retainer, attendance fees, and additional compensation to Board and Committee chairpersons. The fund does not pay compensation directly to trustees or officers of the fund who are also officers of the investment adviser, all of whom receive remuneration for their services to the fund from MFS. Certain officers and trustees of the fund are officers or directors of MFS, MFD, and MFSC.
The fund has an unfunded, defined benefit plan for certain retired independent trustees which resulted in a pension expense of $3,530. The fund also has an unfunded retirement benefit deferral plan for certain independent trustees which resulted in a net decrease in expense of $3,049. Both amounts are included in independent trustees’ compensation for the six months ended August 31, 2008. The liability for deferred retirement benefits payable to certain independent trustees under both plans amounted to $125,297 at August 31, 2008, and is included in payable for independent trustees’ compensation.
Other – This fund and certain other MFS funds (the funds) have entered into services agreements (the Agreements) which provide for payment of fees by the funds to Tarantino LLC and Griffin Compliance LLC in return for the provision of services of an Independent Chief Compliance Officer (ICCO) and Assistant ICCO, respectively, for the funds. The ICCO and Assistant ICCO are officers of the funds and the sole members of Tarantino LLC and Griffin Compliance LLC, respectively. The funds can terminate the Agreements with Tarantino LLC and Griffin Compliance LLC at any time under the terms of the Agreements. For the six months ended August 31, 2008, the fee paid by the fund to Tarantino LLC and Griffin Compliance LLC was $4,242 and is included in miscellaneous expense on the Statement of Operations. MFS has agreed to reimburse the fund for a portion of the payments made by the fund to Tarantino LLC in the amount of $4,001, which is shown as a reduction of total expenses in the Statement of Operations. Additionally, MFS has agreed to bear all expenses associated with office space, other administrative support, and supplies provided to the ICCO and Assistant ICCO.
The fund may invest in a money market fund managed by MFS which seeks preservation of capital and current income. Income earned on this investment is included in dividends from underlying funds on the Statement of Operations. This money market fund does not pay a management fee to MFS.
30
Notes to Financial Statements (unaudited) – continued
Purchases and sales of investments, other than purchased option transactions and short-term obligations, were as follows:
| | | | |
| | | Purchases | | Sales |
| U.S. Government securities | | $319,044,868 | | $256,016,823 |
| Investments (non-U.S. Government securities) | | $45,684,931 | | $72,845,238 |
| (5) | | Shares of Beneficial Interest |
The fund’s Declaration of Trust permits the Trustees to issue an unlimited number of full and fractional shares of beneficial interest. Transactions in fund shares were as follows:
| | | | | | | | |
| | | Six months ended
8/31/08 | | Year ended
2/29/08 |
| | | Shares | | Amount | | Shares | | Amount |
| Shares sold | | | | | | | | |
Class A | | 9,730,183 | | $94,075,304 | | 26,720,347 | | $254,524,226 |
Class B | | 1,007,619 | | 9,746,913 | | 2,320,464 | | 22,238,537 |
Class C | | 1,288,691 | | 12,471,499 | | 1,915,432 | | 18,482,462 |
Class I | | 1,744,219 | | 16,932,900 | | 4,949,335 | | 46,692,585 |
Class R (b) | | 31,740 | | 310,073 | | 614,938 | | 5,883,559 |
Class R1 | | 183,493 | | 1,773,150 | | 410,658 | | 3,911,341 |
Former Class R2 (b) | | 10,067 | | 98,470 | | 162,540 | | 1,538,277 |
Class R2 (formerly Class R3) | | 1,445,456 | | 13,987,381 | | 1,409,413 | | 13,420,296 |
Class R3 (formerly Class R4) | | 542,191 | | 5,264,389 | | 1,245,047 | | 11,800,372 |
Class R4 (formerly Class R5) | | 84,121 | | 813,539 | | 496,376 | | 4,721,419 |
| | 16,067,780 | | $155,473,618 | | 40,244,550 | | $383,213,074 |
Shares issued to shareholders
in reinvestment of distributions | | | | | | | | |
Class A | | 1,239,129 | | $11,996,217 | | 2,494,731 | | $23,661,322 |
Class B | | 139,263 | | 1,346,738 | | 350,066 | | 3,312,628 |
Class C | | 50,431 | | 489,470 | | 84,568 | | 804,480 |
Class I | | 1,081,791 | | 10,471,581 | | 2,317,775 | | 21,983,889 |
Class R (b) | | 631 | | 6,174 | | 22,539 | | 212,377 |
Class R1 | | 7,894 | | 76,299 | | 6,776 | | 64,570 |
Former Class R2 (b) | | 846 | | 8,275 | | 5,121 | | 48,445 |
Class R2 (formerly Class R3) | | 35,315 | | 341,198 | | 28,413 | | 270,777 |
Class R3 (formerly Class R4) | | 38,570 | | 373,219 | | 50,924 | | 484,025 |
Class R4 (formerly Class R5) | | 2,522 | | 24,451 | | 3,673 | | 34,824 |
Class 529A (c) | | — | | — | | 138 | | 883 |
Class 529B (c) | | — | | — | | 107 | | 695 |
Class 529C (c) | | — | | — | | 70 | | 447 |
| | 2,596,392 | | $25,133,622 | | 5,364,901 | | $50,879,362 |
31
Notes to Financial Statements (unaudited) – continued
| | | | | | | | | | | | |
| | | Six months ended
8/31/08 | | | Year ended
2/29/08 | |
| | | Shares | | | Amount | | | Shares | | | Amount | |
| Shares reacquired | | | | | | | | | | | | |
Class A | | (9,637,456 | ) | | $(93,149,674 | ) | | (30,591,183 | ) | | $(290,386,750 | ) |
Class B | | (2,063,121 | ) | | (19,878,691 | ) | | (6,148,724 | ) | | (58,253,955 | ) |
Class C | | (642,108 | ) | | (6,218,445 | ) | | (1,293,975 | ) | | (12,309,138 | ) |
Class I | | (3,105,225 | ) | | (29,975,100 | ) | | (6,964,969 | ) | | (66,933,076 | ) |
Class R (b) | | (512,315 | ) | | (4,971,830 | ) | | (1,212,138 | ) | | (11,430,067 | ) |
Class R1 | | (108,883 | ) | | (1,052,516 | ) | | (87,112 | ) | | (827,584 | ) |
Former Class R2 (b) | | (129,745 | ) | | (1,258,860 | ) | | (179,575 | ) | | (1,691,871 | ) |
Class R2 (formerly Class R3) | | (438,542 | ) | | (4,225,327 | ) | | (433,890 | ) | | (4,132,887 | ) |
Class R3 (formerly Class R4) | | (265,747 | ) | | (2,568,950 | ) | | (584,913 | ) | | (5,573,778 | ) |
Class R4 (formerly Class R5) | | (103,632 | ) | | (1,000,359 | ) | | (120,163 | ) | | (1,140,902 | ) |
Class 529A (c) | | — | | | — | | | (39,015 | ) | | (370,085 | ) |
Class 529B (c) | | — | | | — | | | (35,700 | ) | | (338,555 | ) |
Class 529C (c) | | — | | | — | | | (23,257 | ) | | (221,577 | ) |
| | (17,006,774 | ) | | $(164,299,752 | ) | | (47,714,614 | ) | | $(453,610,225 | ) |
| Net change | | | | | | | | | | | | |
Class A | | 1,331,856 | | | $12,921,847 | | | (1,376,105 | ) | | $(12,201,202 | ) |
Class B | | (916,239 | ) | | (8,785,040 | ) | | (3,478,194 | ) | | (32,702,790 | ) |
Class C | | 697,014 | | | 6,742,524 | | | 706,025 | | | 6,977,804 | |
Class I | | (279,215 | ) | | (2,570,619 | ) | | 302,141 | | | 1,743,398 | |
Class R (b) | | (479,944 | ) | | (4,655,583 | ) | | (574,661 | ) | | (5,334,131 | ) |
Class R1 | | 82,504 | | | 796,933 | | | 330,322 | | | 3,148,327 | |
Former Class R2 (b) | | (118,832 | ) | | (1,152,115 | ) | | (11,914 | ) | | (105,149 | ) |
Class R2 (formerly Class R3) | | 1,042,229 | | | 10,103,252 | | | 1,003,936 | | | 9,558,186 | |
Class R3 (formerly Class R4) | | 315,014 | | | 3,068,658 | | | 711,058 | | | 6,710,619 | |
Class R4 (formerly Class R5) | | (16,989 | ) | | (162,369 | ) | | 379,886 | | | 3,615,341 | |
Class 529A (c) | | — | | | — | | | (38,877 | ) | | (369,202 | ) |
Class 529B (c) | | — | | | — | | | (35,593 | ) | | (337,860 | ) |
Class 529C (c) | | — | | | — | | | (23,187 | ) | | (221,130 | ) |
| | 1,657,398 | | | $16,307,488 | | | (2,105,163 | ) | | $(19,517,789 | ) |
| (b) | At the close of business on April 18, 2008, Class R and Class R2 shares converted into Class R3 shares. Following the conversion, Class R3 shares were renamed Class R2 shares. |
| (c) | Class 529A, Class 529B, and Class 529C shares closed on March 30, 2007. |
The fund is one of several mutual funds in which the MFS funds-of-funds may invest. The MFS funds-of-funds do not invest in the underlying MFS funds for the purpose of exercising management or control. At the end of the period, the MFS Moderate Allocation Fund, MFS Growth Allocation Fund and MFS Conservative Allocation Fund were the owners of record of approximately 16%, 9% and 6%, respectively, of the value of outstanding voting shares of the fund. In addition, the MFS Lifetime 2010 Fund, MFS Lifetime 2020 Fund, MFS Lifetime 2030 Fund and MFS Lifetime retirement Income Fund were each the owners of record of less than 1% of the value of outstanding voting shares of the fund.
32
Notes to Financial Statements (unaudited) – continued
The fund and other funds managed by MFS participate in a $1 billion unsecured committed line of credit provided by a syndication of banks under a credit agreement. In addition, the fund and other funds managed by MFS have established uncommitted borrowing arrangements with certain banks. Borrowings may be made for temporary financing needs. Interest is charged to each fund, based on its borrowings, generally at a rate equal to the Federal Reserve funds rate plus 0.30%. In addition, a commitment fee, based on the average daily, unused portion of the committed line of credit, is allocated among the participating funds at the end of each calendar quarter. For the six months ended August 31, 2008, the fund’s commitment fee and interest expense were $3,128 and $0, respectively, and are included in miscellaneous expense on the Statement of Operations.
The fund’s investment adviser, MFS, was the subject of an administrative proceeding concerning market timing which resulted in the Securities and Exchange Commission (the “SEC”) entering an order approving a settlement with MFS and two of its former officers (the “Settlement Order”). Under the terms of the Settlement Order, MFS transferred $175 million in disgorgement and $50 million in penalty (the “Payments”) to a Fair Fund established by the SEC, from which settlement funds will be distributed to current and former shareholders of the fund and certain other affected MFS retail funds. The Payments will be distributed to shareholders in accordance with a plan developed by an independent distribution consultant (the “IDC”) in consultation with MFS and the Board of Trustees of the MFS retail funds. The plan was approved in July 2007 by the SEC. Pursuant to the distribution plan, after the distributions to eligible shareholders have been made, residual amounts, if any, may be available for distribution to the fund and certain other affected MFS retail funds. Payments made by third parties into other settlement funds to remediate harm caused by the third party’s late or excessive trading in certain MFS funds may also become part of the residual amounts. At this time, the residual amounts, if any, cannot be reasonably estimated and the fund has not accrued an estimate for any amounts to be received.
| (8) | | Transactions in Underlying Funds-Affiliated Issuers |
An affiliated issuer may be considered one in which the fund owns 5% or more of the outstanding voting securities, or a company which is under common control. For the purposes of this report, the fund assumes the following to be affiliated issuers:
| | | | | | | | | |
| Underlying Funds | | Beginning
Shares/Par
Amount | | Acquisitions
Shares/Par
Amount | | Dispositions
Shares/Par
Amount | | | Ending
Shares/Par
Amount |
MFS Institutional Money
Market Portfolio | | 36,523,941 | | 206,124,350 | | (238,659,162 | ) | | 3,989,129 |
| | | | |
| Underlying Funds | | Realized
Gain (Loss) | | Capital Gain
Distributions | | Dividend
Income | | | Ending
Value |
MFS Institutional Money
Market Portfolio | | $— | | $— | | $311,755 | | | $3,989,129 |
33
BOARD REVIEW OF INVESTMENT
ADVISORY AGREEMENT
The Investment Company Act of 1940 requires that both the full Board of Trustees and a majority of the non-interested (“independent”) Trustees, voting separately, annually approve the continuation of the Fund’s investment advisory agreement with MFS. The Trustees consider matters bearing on the Fund and its advisory arrangements at their meetings throughout the year, including a review of performance data at each regular meeting. In addition, the independent Trustees met several times over the course of three months beginning in May and ending in July, 2008 (“contract review meetings”) for the specific purpose of considering whether to approve the continuation of the investment advisory agreement for the Fund and the other investment companies that the Board oversees (the “MFS Funds”). The independent Trustees were assisted in their evaluation of the Fund’s investment advisory agreement by independent legal counsel, from whom they received separate legal advice and with whom they met separately from MFS during various contract review meetings. The independent Trustees were also assisted in this process by the MFS Funds’ Independent Chief Compliance Officer, a full-time senior officer appointed by and reporting to the independent Trustees.
In connection with their deliberations regarding the continuation of the investment advisory agreement, the Trustees, including the independent Trustees, considered such information and factors as they believed, in light of the legal advice furnished to them and their own business judgment, to be relevant. The investment advisory agreement for the Fund was considered separately, although the Trustees also took into account the common interests of all MFS Funds in their review. As described below, the Trustees considered the nature, quality, and extent of the various investment advisory, administrative, and shareholder services performed by MFS under the existing investment advisory agreement and other arrangements with the Fund.
In connection with their contract review meetings, the Trustees received and relied upon materials that included, among other items: (i) information provided by Lipper Inc., an independent advisory group, on the investment performance of the Fund for various time periods ended December 31, 2007 and the investment performance of a group of funds with substantially similar investment classifications/objectives (the “Lipper performance universe”), (ii) information provided by Lipper Inc. on the Fund’s advisory fees and other expenses and the advisory fees and other expenses of comparable funds identified by Lipper Inc. (the “Lipper expense group”), (iii) information provided by MFS on the advisory fees of comparable portfolios of other clients of MFS, including institutional separate accounts and other clients, (iv) information as to whether and to what extent applicable expense waivers,
34
Board Review of Investment Advisory Agreement – continued
reimbursements or fee “breakpoints” are observed for the Fund, (v) information regarding MFS’ financial results and financial condition, including MFS’ and certain of its affiliates’ estimated profitability from services performed for the Fund and the MFS Funds as a whole, (vi) MFS’ views regarding the outlook for the mutual fund industry and the strategic business plans of MFS, (vii) descriptions of various functions performed by MFS for the Funds, such as compliance monitoring and portfolio trading practices, and (viii) information regarding the overall organization of MFS, including information about MFS’ senior management and other personnel providing investment advisory, administrative and other services to the Fund and the other MFS Funds. The comparative performance, fee and expense information prepared and provided by Lipper Inc. was not independently verified and the independent Trustees did not independently verify any information provided to them by MFS.
The Trustees’ conclusion as to the continuation of the investment advisory agreement was based on a comprehensive consideration of all information provided to the Trustees and not the result of any single factor. Some of the factors that figured particularly in the Trustees’ deliberations are described below, although individual Trustees may have evaluated the information presented differently from one another, giving different weights to various factors. It is also important to recognize that the fee arrangements for the Fund and other MFS Funds are the result of years of review and discussion between the independent Trustees and MFS, that certain aspects of such arrangements may receive greater scrutiny in some years than in others, and that the Trustees’ conclusions may be based, in part, on their consideration of these same arrangements during the course of the year and in prior years.
Based on information provided by Lipper Inc. and MFS, the Trustees reviewed the Fund’s total return investment performance as well as the performance of peer groups of funds over various time periods. The Trustees placed particular emphasis on the total return performance of the Fund’s Class A shares in comparison to the performance of funds in its Lipper performance universe over the three-year period ended December 31, 2007, which the Trustees believed was a long enough period to reflect differing market conditions. The total return performance of the Fund’s Class A shares was in the 1st quintile relative to the other funds in the universe for this three-year period (the 1st quintile being the best performers and the 5th quintile being the worst performers). The total return performance of the Fund’s Class A shares was in the 2nd quintile for each of the one- and five-year periods ended December 31, 2007 relative to the Lipper performance universe. Because of the passage of time, these performance results may differ from the performance results for more recent periods, including those shown elsewhere in this report.
35
Board Review of Investment Advisory Agreement – continued
In the course of their deliberations, the Trustees took into account information provided by MFS in connection with the contract review meetings, as well as during investment review meetings conducted with portfolio management personnel during the course of the year regarding the Fund’s performance. After reviewing these and related factors, the Trustees concluded, within the context of their overall conclusions regarding the investment advisory agreement, that they were satisfied with MFS’ responses and efforts relating to investment performance.
In assessing the reasonableness of the Fund’s advisory fee, the Trustees considered, among other information, the Fund’s advisory fee and the total expense ratio of the Fund’s Class A shares as a percentage of average daily net assets and the advisory fee and total expense ratios of peer groups of funds based on information provided by Lipper Inc. The Trustees considered that there is an advisory fee reduction in effect for the Fund through February 28, 2009 as part of MFS’ settlement with the New York Attorney General (the “NYAG Settlement”) concerning market timing and related matters, and that MFS currently observes an expense limitation for the Fund. The Trustees also considered that, according to the Lipper data (which takes into account the advisory fee reduction and expense limitation), the Fund’s effective advisory fee rate and total expense ratio were each lower than the Lipper expense group median.
The Trustees also considered the advisory fees charged by MFS to institutional accounts. In comparing these fees, the Trustees considered information provided by MFS as to the generally broader scope of services provided by MFS to the Fund in comparison to institutional accounts, the higher demands placed on MFS’ investment personnel and trading infrastructure as a result of the daily cash in-flows and out-flows of the Fund, and the impact on MFS and expenses associated with the more extensive regulatory regime to which the Fund is subject in comparison to institutional accounts.
The Trustees also considered whether the Fund is likely to benefit from any economies of scale in the management of the Fund in the event of growth in assets of the Fund. They noted that the Fund’s advisory fee rate schedule is not currently subject to any breakpoints. Taking into account the advisory fee reduction and the expense limitation noted above, the Trustees determined not to recommend any advisory fee breakpoints for the Fund at this time.
The Trustees also considered information prepared by MFS relating to MFS’ costs and profits with respect to the Fund, the MFS Funds considered as a group, and other investment companies and accounts advised by MFS, as well as MFS’ methodologies used to determine and allocate its costs to the MFS Funds, the Fund and other accounts and products for purposes of estimating profitability.
36
Board Review of Investment Advisory Agreement – continued
After reviewing these and other factors described herein, the Trustees concluded, within the context of their overall conclusions regarding the investment advisory agreement, that the advisory fees charged to the Fund represent reasonable compensation in light of the services being provided by MFS to the Fund.
In addition, the Trustees considered MFS’ resources and related efforts to continue to retain, attract and motivate capable personnel to serve the Fund. The Trustees also considered current and developing conditions in the financial services industry, including the entry into the industry of large and well-capitalized companies which are spending, and appear to be prepared to continue to spend, substantial sums to engage personnel and to provide services to competing investment companies. In this regard, the Trustees also considered the financial resources of MFS and its ultimate parent, Sun Life Financial Inc. The Trustees also considered the advantages and possible disadvantages to the Fund of having an adviser that also serves other investment companies as well as other accounts.
The Trustees also considered the nature, quality, cost, and extent of administrative, transfer agency, and distribution services provided to the Fund by MFS and its affiliates under agreements and plans other than the investment advisory agreement, including any 12b-1 fees the Fund pays to MFS Fund Distributors, Inc., an affiliate of MFS. The Trustees also considered the nature, extent and quality of certain other services MFS performs or arranges for on the Fund’s behalf, which may include securities lending programs, directed expense payment programs, class action recovery programs, and MFS’ interaction with third-party service providers, principally custodians and sub-custodians. The Trustees concluded that the various non-advisory services provided by MFS and its affiliates on behalf of the Funds were satisfactory.
The Trustees also considered benefits to MFS from the use of the Fund’s portfolio brokerage commissions, if applicable, to pay for investment research (excluding third-party research, for which MFS pays directly) and various other factors. Additionally, the Trustees considered so-called “fall-out benefits” to MFS such as reputational value derived from serving as investment manager to the Fund.
Based on their evaluation of factors that they deemed to be material, including those factors described above, the Board of Trustees, including a majority of the independent Trustees, concluded that the Fund’s investment advisory agreement with MFS should be continued for an additional one-year period, commencing August 1, 2008.
Note: The advisory fee reduction required by the NYAG Settlement with respect to the Fund will expire on February 28, 2009. At the time MFS entered into the NYAG Settlement, MFS also agreed with the Board that it would not
37
Board Review of Investment Advisory Agreement – continued
eliminate such advisory fee reduction without the Board’s consent. Following discussions between MFS and the Board at the contract review meetings, MFS and the Board agreed that, effective March 1, 2009, MFS will no longer be required to observe an advisory fee reduction for this Fund. In addition, effective March 1, 2009, MFS will observe an expense limitation for the Fund, which may not be modified by MFS without the consent of the Board.
A discussion regarding the Board’s most recent review and renewal of the fund’s Investment Advisory Agreement with MFS will be available on or about November 1, 2008 by clicking on the fund’s name under “Mutual Funds” in the “Products and Performance” section of the MFS Web site (mfs.com).
38
PROXY VOTING POLICIES AND INFORMATION
A general description of the MFS funds’ proxy voting policies and procedures is available without charge, upon request, by calling 1-800-225-2606, by visiting the Proxy Voting section of mfs.com or by visiting the SEC’s Web site at http://www.sec.gov.
Information regarding how the fund voted proxies relating to portfolio securities during the most recent twelve-month period ended June 30 is available without charge by visiting the Proxy Voting section of mfs.com or by visiting the SEC’s Web site at http://www.sec.gov.
QUARTERLY PORTFOLIO DISCLOSURE
The fund will file a complete schedule of portfolio holdings with the Securities and Exchange Commission (the Commission) for the first and third quarters of each fiscal year on Form N-Q. The fund’s Form N-Q may be reviewed and copied at the:
Public Reference Room
Securities and Exchange Commission
100 F Street, NE, Room 1580
Washington, D.C. 20549
Information on the operation of the Public Reference Room may be obtained by calling the Commission at 1-800-SEC-0330. The fund’s Form N-Q is available on the EDGAR database on the Commission’s Internet Web site at http://www.sec.gov, and copies of this information may be obtained, upon payment of a duplicating fee, by electronic request at the following e-mail address: publicinfo@sec.gov or by writing the Public Reference Section at the above address.
A shareholder can also obtain the quarterly portfolio holdings report at mfs.com.
39
CONTACT US
| | |
| Web site | | Mailing address |
| mfs.com | | MFS Service Center, Inc. |
| | P.O. Box 55824 |
| MFS TALK | | Boston, MA 02205-5824 |
| 1-800-637-8255 | | |
| 24 hours a day | | Overnight mail |
| | MFS Service Center, Inc. |
| Account service and literature | | c/o Boston Financial Data Services |
| | 30 Dan Road |
| Shareholders | | Canton, MA 02021-2809 |
| 1-800-225-2606 | | |
| 8 a.m. to 8 p.m. Eastern time | | |
| |
| Investment professionals | | |
| 1-800-343-2829 | | |
| 8 a.m. to 8 p.m. Eastern time | | |
| |
| Retirement plan services | | |
| 1-800-637-1255 | | |
| 8 a.m. to 8 p.m. Eastern time | | |

Save paper with eDelivery. MFS® will send you prospectuses, reports, and proxies directly via e-mail so you will get information faster with less mailbox clutter.  To sign up: 1. go to mfs.com. 2. log in via MFS® Access. 3. select eDelivery. If you own your MFS fund shares through a financial institution or a retirement plan, MFS® TALK, MFS Access, and eDelivery may not be available to you.

The Registrant has not amended any provision in its Code of Ethics (the “Code”) that relates to any element of the Code’s definition enumerated in paragraph (b) of Item 2 of this Form N-CSR.
| ITEM 3. | AUDIT COMMITTEE FINANCIAL EXPERT. |
Not applicable for semi-annual reports.
| ITEM 4. | PRINCIPAL ACCOUNTANT FEES AND SERVICES. |
Not applicable for semi-annual reports.
| ITEM 5. | AUDIT COMMITTEE OF LISTED REGISTRANTS. |
Not applicable to the Registrant.
A schedule of investments for each series of the Registrant is included as part of the report to shareholders of such series under Item 1 of this Form N-CSR.
| ITEM 7. | DISCLOSURE OF PROXY VOTING POLICIES AND PROCEDURES FOR CLOSED-END MANAGEMENT INVESTMENT COMPANIES. |
Not applicable to the Registrant.
| ITEM 8. | PORTFOLIO MANAGERS OF CLOSED-END MANAGEMENT INVESTMENT COMPANIES. |
Not applicable to the Registrant.
| ITEM 9. | PURCHASES OF EQUITY SECURITIES BY CLOSED-END MANAGEMENT INVESTMENT COMPANY AND AFFILIATED PURCHASERS. |
Not applicable to the Registrant.
| ITEM 10. | SUBMISSION OF MATTERS TO A VOTE OF SECURITY HOLDERS. |
There were no material changes to the procedures by which shareholders may send recommendations to the Board for nominees to the Registrant’s Board since the Registrant last provided disclosure as to such procedures in response to the requirements of Item 407 (c)(2)(iv) of Regulation S-K or this Item.
| ITEM 11. | CONTROLS AND PROCEDURES. |
| (a) | Based upon their evaluation of the effectiveness of the registrant’s disclosure controls and procedures (as defined in Rule 30a-3(c) under the Investment Company Act of 1940 (the “Act”)) as conducted within 90 days of the filing date of this report on Form N-CSR, the registrant’s principal financial officer and principal executive officer have concluded that those disclosure controls and procedures provide reasonable assurance that the material information required to be disclosed by the registrant on this report is recorded, processed, summarized and reported within the time periods specified in the Securities and Exchange Commission’s rules and forms. |
| (b) | There were no changes in the registrant’s internal controls over financial reporting (as defined in Rule 30a-3(d) under the Act) that occurred during the second fiscal quarter of the period covered by the report that have materially affected, or are reasonably likely to materially affect, the registrant’s internal control over financial reporting. |
| (a) | File the exhibits listed below as part of this form. Letter or number the exhibits in the sequence indicated. |
| | (1) | Any code of ethics, or amendment thereto, that is the subject of the disclosure required by Item 2, to the extent that the registrant intends to satisfy the Item 2 requirements through filing of an exhibit. |
| | (2) | A separate certification for each principal executive officer and principal financial officer of the registrant as required by Rule 30a-2 under the Act (17 CFR 270.30a-2): Attached hereto. |
| (b) | If the report is filed under Section 13(a) or 15(d) of the Exchange Act, provide the certifications required by Rule 30a-2(b) under the Act (17 CFR 270.30a-2(b)), Rule 13a-14(b) or Rule 15d-14(b) under the Exchange Act (17 CFR 240.13a-14(b) or 240.15d-14(b)) and Section 1350 of Chapter 63 of Title 18 of the United States Code (18 U.S.C. 1350) as an exhibit. A certification furnished pursuant to this paragraph will not be deemed “filed” for the purposes of Section 18 of the Exchange Act (15 U.S.C. 78r), or otherwise subject to the liability of that section. Such certification will not be deemed to be incorporated by reference into any filing under the Securities Act of 1933 or the Exchange Act, except to the extent that the registrant specifically incorporates it by reference: Attached hereto. |
Notice
A copy of the Amended and Restated Declaration of Trust, as amended, of the Registrant is on file with the Secretary of State of The Commonwealth of Massachusetts and notice is hereby given that this instrument is executed on behalf of the Registrant by an officer of the Registrant as an officer and not individually and the obligations of or arising out of this instrument are not binding upon any of the Trustees or shareholders individually, but are binding only upon the assets and property of the respective constituent series of the Registrant.
SIGNATURES
Pursuant to the requirements of the Securities Exchange Act of 1934 and the Investment Company Act of 1940, the registrant has duly caused this report to be signed on its behalf by the undersigned, thereunto duly authorized.
(Registrant) MFS SERIES TRUST XIII
| | |
| By (Signature and Title)* | | ROBERT J. MANNING |
| | Robert J. Manning, President |
Date: October 15, 2008
Pursuant to the requirements of the Securities Exchange Act of 1934 and the Investment Company Act of 1940, this report has been signed below by the following persons on behalf of the registrant and in the capacities and on the dates indicated.
| | |
| By (Signature and Title)* | | ROBERT J. MANNING |
| | Robert J. Manning, President (Principal Executive Officer) |
Date: October 15, 2008
| | |
| By (Signature and Title)* | | MARIA F. DWYER |
| | Maria F. Dwyer, Treasurer (Principal Financial Officer and Accounting Officer) |
Date: October 15, 2008
| * | Print name and title of each signing officer under his or her signature. |