UNITED STATES
SECURITIES AND EXCHANGE COMMISSION
Washington, D.C. 20549
FORM N-CSR
CERTIFIED SHAREHOLDER REPORT OF
REGISTERED MANAGEMENT INVESTMENT COMPANIES
Investment Company Act file number 811-3327
MFS SERIES TRUST XIII
(Exact name of registrant as specified in charter)
111 Huntington Avenue, Boston, Massachusetts 02199
(Address of principal executive offices) (Zip code)
Christopher R. Bohane
Massachusetts Financial Services Company
111 Huntington Avenue
Boston, Massachusetts 02199
(Name and address of agents for service)
Registrant’s telephone number, including area code: (617) 954-5000
Date of fiscal year end: February 28*
Date of reporting period: August 31, 2021
| * | This Form N-CSR pertains only to the following series of the Registrant: MFS Diversified Income Fund, MFS Government Securities Fund and MFS New Discovery Value Fund. The remaining series of the Registrant has a fiscal year end other than February 28. |
| ITEM 1. | REPORTS TO STOCKHOLDERS. |
Item 1(a):
Semiannual Report
August 31, 2021
MFS® Diversified
Income Fund
MFS® Diversified
Income Fund
| 1 |
| 2 |
| 5 |
| 7 |
| 38 |
| 40 |
| 42 |
| 43 |
| 51 |
| 70 |
| 74 |
| 75 |
| 75 |
| 75 |
| 75 |
| 75 |
The report is prepared for the general information of shareholders. It is authorized for distribution to prospective investors only when preceded or accompanied by a current prospectus.
NOT FDIC INSURED • MAY LOSE VALUE • NO BANK GUARANTEE
LETTER FROM THE CEO
Dear Shareholders:
After experiencing dramatic swings in the early days of the coronavirus pandemic, global equity markets have performed strongly over the past year. Though the speedy development of vaccines brightened the economic and market outlook, uncertainty remains as new variants of the virus appear, and questions persist over how fast vaccines can be made widely available in the developing world.
After having taken aggressive steps to cushion the economic and market fallout related to the virus, some global central banks have begun to recalibrate monetary policy. For example, the U.S. Federal Reserve has signaled it will likely taper its bond buying program before the end of 2021, which has helped push up Treasury yields, and steepened the yield curve. Having passed a $1.9 trillion stimulus package in March, the U.S. Congress could approve additional stimulus later this year, some of it focused on infrastructure. Production and transportation bottlenecks and labor shortages stemming from the pandemic have fueled a rise in inflation, though policymakers and investors think most of the price hikes will prove transitory.
Since midyear, the spread of the Delta variant of the coronavirus has slowed economic growth while markets have focused on a regulatory crackdown in China, which, when coupled with stress in that country's property development sector, has contributed to a slowdown there. Tightening global energy and raw materials supplies are a further concern for investors.
The policy measures put in place to counteract the pandemic's effects have helped build a supportive environment and are encouraging economic recovery; however, if markets disconnect from fundamentals, they can sow the seeds of instability. As such, recent dramatic increases in speculative trading in cryptocurrencies, special purpose acquisition companies (SPACs), and the like bear watching.
In the aftermath of the crisis, we could see societal changes as households, businesses, and governments adjust to a new reality, and any such alterations could affect the investment landscape. For investors, events such as the COVID-19 outbreak demonstrate the importance of having a deep understanding of company fundamentals, and we have built our global research platform to do just that.
At MFS®, we put our clients’ assets to work responsibly by carefully navigating the increasing complexity of global markets and economies. Guided by our long-term philosophy and adhering to our commitment to sustainable investing, we tune out the noise and aim to uncover what we believe are the best, most durable investment opportunities in the market. Our unique global investment platform combines collective expertise, long-term discipline, and thoughtful risk management to create sustainable value for investors.
Respectfully,
Michael W. Roberge
Chief Executive Officer
MFS Investment Management
October 15, 2021
The opinions expressed in this letter are subject to change and may not be relied upon for investment advice. No forecasts can be guaranteed.
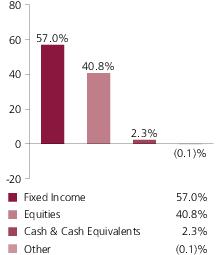
Portfolio structure (i)
Top ten holdings (i)
| Prologis, Inc., REIT | 1.7% |
| Equinix, Inc., REIT | 1.2% |
| Extra Space Storage, Inc., REIT | 1.1% |
| Roche Holding AG | 1.0% |
| Johnson & Johnson | 1.0% |
| Welltower, Inc., REIT | 1.0% |
| AvalonBay Communities, Inc., REIT | 0.9% |
| Merck & Co., Inc. | 0.9% |
| Schneider Electric SE | 0.9% |
| U.S. Treasury Ultra Bond Future - DEC 2021 | (1.4)% |
GICS equity sectors (g)(i)
| Real Estate | 17.7% |
| Health Care | 4.6% |
| Consumer Staples | 3.7% |
| Financials | 3.5% |
| Information Technology | 2.8% |
| Industrials | 2.5% |
| Communication Services | 1.5% |
| Materials | 1.3% |
| Utilities | 1.2% |
| Energy | 0.8% |
| Consumer Discretionary | 0.6% |
| ETFs | 0.4% |
| Convertible Debt | 0.2% |
| Equity Warrants (o) | 0.0% |
Fixed income sectors (i)
| High Yield Corporates | 23.5% |
| Emerging Markets Bonds | 18.0% |
| Investment Grade Corporates | 8.8% |
| Mortgage-Backed Securities | 3.1% |
| U.S. Treasury Securities | 2.7% |
| Collateralized Debt Obligations | 0.3% |
| Municipal Bonds | 0.2% |
| Commercial Mortgage-Backed Securities | 0.2% |
| U.S. Government Agencies | 0.1% |
| Non-U.S. Government Bonds | 0.1% |
| Asset-Backed Securities (o) | 0.0% |
Portfolio Composition - continued
Composition including fixed income credit quality (a)(i)
| AAA | 0.4% |
| AA | 1.2% |
| A | 3.2% |
| BBB | 10.1% |
| BB | 18.2% |
| B | 13.7% |
| CCC | 3.7% |
| CC (o) | 0.0% |
| C (o) | 0.0% |
| U.S. Government | 2.6% |
| Federal Agencies | 3.2% |
| Not Rated | 18.2% |
| Non-Fixed Income | 23.3% |
| Cash & Cash Equivalents | 2.3% |
| Other | (0.1)% |
Issuer country weightings (i)(x)
| United States | 64.3% |
| United Kingdom | 2.4% |
| Canada | 2.2% |
| Switzerland | 2.1% |
| China | 1.9% |
| Japan | 1.9% |
| Mexico | 1.3% |
| Brasil | 1.1% |
| France | 1.1% |
| Other Countries | 21.7% |
| (a) | For all securities other than those specifically described below, ratings are assigned to underlying securities utilizing ratings from Moody’s, Fitch, and Standard & Poor’s rating agencies and applying the following hierarchy: If all three agencies provide a rating, the middle rating (after dropping the highest and lowest ratings) is assigned; if two of the three agencies rate a security, the lower of the two is assigned. If none of the 3 rating agencies above assign a rating, but the security is rated by DBRS Morningstar, then the DBRS Morningstar rating is assigned. If none of the 4 rating agencies listed above rate the security, but the security is rated by the Kroll Bond Rating Agency (KBRA), then the KBRA rating is assigned. Ratings are shown in the S&P and Fitch scale (e.g., AAA). Securities rated BBB or higher are considered investment grade. All ratings are subject to change. U.S. Government includes securities issued by the U.S. Department of the Treasury. Federal Agencies includes rated and unrated U.S. Agency fixed-income securities, U.S. Agency mortgage-backed securities, and collateralized mortgage obligations of U.S. Agency mortgage-backed securities. |
Not Rated includes fixed income securities and fixed income derivatives that have not been rated by any rating agency. Non-Fixed Income includes equity securities (including convertible bonds and equity derivatives) and/or commodity-linked derivatives. The fund may or may not have held all of these instruments on this date. The fund is not rated by these agencies.
| (g) | The Global Industry Classification Standard (GICS®) was developed by and/or is the exclusive property of MSCI, Inc. and S&P Global Market Intelligence Inc. (“S&P Global Market Intelligence”). GICS is a service mark of MSCI and S&P Global Market Intelligence and has been licensed for use by MFS. MFS has applied its own internal sector/industry classification methodology for equity securities and non-equity securities that are unclassified by GICS. |
Portfolio Composition - continued
| (i) | For purposes of this presentation, the components include the value of securities, and reflect the impact of the equivalent exposure of derivative positions, if any. These amounts may be negative from time to time. Equivalent exposure is a calculated amount that translates the derivative position into a reasonable approximation of the amount of the underlying asset that the portfolio would have to hold at a given point in time to have the same price sensitivity that results from the portfolio’s ownership of the derivative contract. When dealing with derivatives, equivalent exposure is a more representative measure of the potential impact of a position on portfolio performance than value. The bond component will include any accrued interest amounts. |
| (x) | Represents the portfolio’s exposure to issuer countries as a percentage of a portfolio’s net assets. For purposes of this presentation, United States includes Cash & Cash Equivalents and Other. |
Where the fund holds convertible bonds, they are treated as part of the equity portion of the portfolio.
The fund invests a portion of its assets in the MFS High Yield Pooled Portfolio. Percentages include the indirect exposure to the underlying holdings, including investments in money market funds and Other, of the MFS High Yield Pooled Portfolio and not the direct exposure from investing in the MFS High Yield Pooled Portfolio itself.
Cash & Cash Equivalents includes any direct exposure to cash, direct and indirect exposure to investments in money market funds, cash equivalents, short-term securities, and other assets less liabilities. Please see the Statement of Assets and Liabilities for additional information related to the fund’s direct cash position and other assets and liabilities.
Other includes the direct and indirect equivalent exposure from currency derivatives and/or any offsets to derivative positions and may be negative.
Percentages are based on net assets as of August 31, 2021.
The portfolio is actively managed and current holdings may be different.
Expense Table
Fund expenses borne by the shareholders during the period,
March 1, 2021 through August 31, 2021
As a shareholder of the fund, you incur two types of costs: (1) transaction costs, including sales charges (loads) on certain purchase or redemption payments, and (2) ongoing costs, including management fees; distribution and service (12b-1) fees; and other fund expenses. This example is intended to help you understand your ongoing costs (in dollars) of investing in the fund and to compare these costs with the ongoing costs of investing in other mutual funds.
In addition to the fees and expenses which the fund bears directly, the fund indirectly bears a pro rata share of the fees and expenses of the MFS High Yield Pooled Portfolio, an underlying MFS Pooled Portfolio in which the fund invests. MFS Pooled Portfolios are mutual funds advised by MFS that do not pay management fees to MFS but do incur investment and operating costs. If these transactional and indirect costs were included, your costs would have been higher.
The example is based on an investment of $1,000 invested at the beginning of the period and held for the entire period March 1, 2021 through August 31, 2021.
Actual Expenses
The first line for each share class in the following table provides information about actual account values and actual expenses. You may use the information in this line, together with the amount you invested, to estimate the expenses that you paid over the period. Simply divide your account value by $1,000 (for example, an $8,600 account value divided by $1,000 = 8.6), then multiply the result by the number in the first line under the heading entitled “Expenses Paid During Period” to estimate the expenses you paid on your account during this period.
Hypothetical Example for Comparison Purposes
The second line for each share class in the following table provides information about hypothetical account values and hypothetical expenses based on the fund’s actual expense ratio and an assumed rate of return of 5% per year before expenses, which is not the fund’s actual return. The hypothetical account values and expenses may not be used to estimate the actual ending account balance or expenses you paid for the period. You may use this information to compare the ongoing costs of investing in the fund and other funds. To do so, compare this 5% hypothetical example with the 5% hypothetical examples that appear in the shareholder reports of the other funds.
Please note that the expenses shown in the table are meant to highlight your ongoing costs only and do not reflect any transactional costs, such as sales charges (loads). Therefore, the second line for each share class in the table is useful in comparing ongoing costs only, and will not help you determine the relative total costs of owning different funds. In addition, if these transactional costs were included, your costs would have been higher.
Expense Table - continued
Share
Class | | Annualized
Expense
Ratio | Beginning
Account Value
3/01/21 | Ending
Account Value
8/31/21 | Expenses
Paid During
Period (p)
3/01/21-8/31/21 |
| A | Actual | 0.97% | $1,000.00 | $1,076.42 | $5.08 |
| Hypothetical (h) | 0.97% | $1,000.00 | $1,020.32 | $4.94 |
| C | Actual | 1.72% | $1,000.00 | $1,071.66 | $8.98 |
| Hypothetical (h) | 1.72% | $1,000.00 | $1,016.53 | $8.74 |
| I | Actual | 0.72% | $1,000.00 | $1,077.75 | $3.77 |
| Hypothetical (h) | 0.72% | $1,000.00 | $1,021.58 | $3.67 |
| R1 | Actual | 1.72% | $1,000.00 | $1,072.47 | $8.98 |
| Hypothetical (h) | 1.72% | $1,000.00 | $1,016.53 | $8.74 |
| R2 | Actual | 1.22% | $1,000.00 | $1,075.08 | $6.38 |
| Hypothetical (h) | 1.22% | $1,000.00 | $1,019.06 | $6.21 |
| R3 | Actual | 0.97% | $1,000.00 | $1,076.36 | $5.08 |
| Hypothetical (h) | 0.97% | $1,000.00 | $1,020.32 | $4.94 |
| R4 | Actual | 0.73% | $1,000.00 | $1,077.69 | $3.82 |
| Hypothetical (h) | 0.73% | $1,000.00 | $1,021.53 | $3.72 |
| R6 | Actual | 0.64% | $1,000.00 | $1,078.22 | $3.35 |
| Hypothetical (h) | 0.64% | $1,000.00 | $1,021.98 | $3.26 |
| (h) | 5% class return per year before expenses. |
| (p) | “Expenses Paid During Period” are equal to each class’s annualized expense ratio, as shown above, multiplied by the average account value over the period, multiplied by 184/365 (to reflect the one-half year period). Expenses paid do not include any applicable sales charges (loads). If these transaction costs had been included, your costs would have been higher. In addition to the fees and expenses which the fund bears directly, the fund indirectly bears a pro rata share of the fees and expenses of the underlying funds in which the fund invests. If these indirect costs were included, your costs would have been higher. |
Portfolio of Investments
8/31/21 (unaudited)
The Portfolio of Investments is a complete list of all securities owned by your fund. It is categorized by broad-based asset classes.
| Issuer | | | Shares/Par | Value ($) |
| Common Stocks – 40.0% |
| Alcoholic Beverages – 0.1% | |
| Kirin Holdings Co. Ltd. | | 195,300 | $ 3,539,774 |
| Apparel Manufacturers – 0.1% | |
| Compagnie Financiere Richemont S.A. | | 20,433 | $ 2,253,599 |
| Automotive – 0.4% | |
| Magna International, Inc. | | 164,768 | $ 13,011,402 |
| Zhengzhou Yutong Bus Co. Ltd., “A” | | 708,775 | 1,348,857 |
| | | | | $14,360,259 |
| Biotechnology – 0.3% | |
| Biogen, Inc. (a) | | 12,442 | $ 4,216,718 |
| Gilead Sciences, Inc. | | 76,904 | 5,597,073 |
| | | | | $9,813,791 |
| Brokerage & Asset Managers – 0.1% | |
| IG Group Holdings PLC | | 177,130 | $ 2,280,632 |
| Business Services – 0.1% | |
| Amdocs Ltd. | | 69,983 | $ 5,390,790 |
| Chemicals – 0.2% | |
| Eastman Chemical Co. | | 49,978 | $ 5,655,510 |
| Computer Software – 0.5% | |
| Adobe Systems, Inc. (a) | | 4,622 | $ 3,067,621 |
| Microsoft Corp. | | 53,201 | 16,060,318 |
| | | | | $19,127,939 |
| Computer Software - Systems – 1.4% | |
| Asustek Computer, Inc. | | 152,000 | $ 1,777,040 |
| Compal Electronics | | 2,107,000 | 1,741,039 |
| Fujitsu Ltd. | | 17,000 | 3,136,845 |
| Hitachi Ltd. | | 434,200 | 24,015,880 |
| Hon Hai Precision Industry Co. Ltd. | | 2,125,000 | 8,511,195 |
| Samsung Electronics Co. Ltd. | | 185,766 | 12,288,803 |
| | | | | $51,470,802 |
| Construction – 2.6% | |
| American Homes 4 Rent, “A”, REIT | | 604,126 | $ 25,337,044 |
| AvalonBay Communities, Inc., REIT | | 145,244 | 33,345,118 |
| D.R. Horton, Inc. | | 20,852 | 1,993,868 |
| ICA Tenedora S.A. de C.V. (a) | | 560,019 | 2,307,604 |
Portfolio of Investments (unaudited) – continued
| Issuer | | | Shares/Par | Value ($) |
| Common Stocks – continued |
| Construction – continued | |
| Mid-America Apartment Communities, Inc., REIT | | 158,885 | $ 30,564,708 |
| | | | | $93,548,342 |
| Consumer Products – 1.1% | |
| Colgate-Palmolive Co. | | 201,477 | $ 15,705,132 |
| Kimberly-Clark Corp. | | 163,437 | 22,523,253 |
| | | | | $38,228,385 |
| Containers – 0.3% | |
| Graphic Packaging Holding Co. | | 452,378 | $ 9,282,797 |
| Electrical Equipment – 0.9% | |
| Schneider Electric SE | | 172,317 | $ 30,783,997 |
| Electronics – 1.2% | |
| Intel Corp. | | 244,503 | $ 13,217,832 |
| Taiwan Semiconductor Manufacturing Co. Ltd., ADR | | 174,301 | 20,743,562 |
| Texas Instruments, Inc. | | 46,457 | 8,869,106 |
| | | | | $42,830,500 |
| Energy - Independent – 0.1% | |
| China Shenhua Energy Co. Ltd. | | 2,439,000 | $ 5,400,174 |
| Energy - Integrated – 0.5% | |
| China Petroleum & Chemical Corp. | | 33,466,000 | $ 16,222,132 |
| LUKOIL PJSC, ADR | | 13,716 | 1,162,568 |
| | | | | $17,384,700 |
| Food & Beverages – 1.3% | |
| General Mills, Inc. | | 368,964 | $ 21,329,809 |
| J.M. Smucker Co. | | 174,016 | 21,520,558 |
| JBS S.A. | | 368,677 | 2,222,415 |
| | | | | $45,072,782 |
| Food & Drug Stores – 0.1% | |
| Albertsons Cos., Inc., “A” (l) | | 176,907 | $ 5,370,897 |
| Forest & Paper Products – 0.2% | |
| Rayonier, Inc., REIT | | 219,487 | $ 8,072,732 |
| General Merchandise – 0.3% | |
| BIM Birlesik Magazalar A.S. | | 607,140 | $ 5,245,357 |
| Wal-Mart de Mexico S.A.B. de C.V. | | 1,342,662 | 4,777,267 |
| | | | | $10,022,624 |
Portfolio of Investments (unaudited) – continued
| Issuer | | | Shares/Par | Value ($) |
| Common Stocks – continued |
| Insurance – 1.5% | |
| Equitable Holdings, Inc. | | 242,723 | $ 7,526,840 |
| Hartford Financial Services Group, Inc. | | 80,160 | 5,388,355 |
| Manulife Financial Corp. | | 1,118,191 | 21,776,208 |
| MetLife, Inc. | | 129,837 | 8,049,894 |
| NN Group N.V. | | 24,001 | 1,246,074 |
| Samsung Fire & Marine Insurance Co. Ltd. | | 44,310 | 8,636,906 |
| | | | | $52,624,277 |
| Leisure & Toys – 0.1% | |
| Brunswick Corp. | | 38,708 | $ 3,749,644 |
| Polaris, Inc. | | 12,508 | 1,497,958 |
| | | | | $5,247,602 |
| Machinery & Tools – 0.8% | |
| Eaton Corp. PLC | | 175,620 | $ 29,567,383 |
| Major Banks – 1.3% | |
| China Construction Bank Corp. | | 9,756,000 | $ 7,049,704 |
| DBS Group Holdings Ltd. | | 984,400 | 21,943,894 |
| Goldman Sachs Group, Inc. | | 4,497 | 1,859,554 |
| UBS Group AG | | 996,827 | 16,632,833 |
| | | | | $47,485,985 |
| Medical & Health Technology & Services – 2.0% | |
| Encompass Health Corp. | | 97,597 | $ 7,656,485 |
| HCA Healthcare, Inc. | | 26,536 | 6,713,077 |
| Medical Properties Trust, Inc., REIT | | 961,534 | 19,692,216 |
| Omega Healthcare Investors, Inc., REIT | | 72,703 | 2,437,732 |
| Welltower, Inc., REIT | | 393,292 | 34,424,849 |
| | | | | $70,924,359 |
| Metals & Mining – 0.8% | |
| ArcelorMittal S.A. | | 64,133 | $ 2,150,212 |
| Fortescue Metals Group Ltd. | | 453,035 | 6,959,773 |
| POSCO | | 5,312 | 1,543,960 |
| Rio Tinto PLC | | 212,518 | 15,725,148 |
| Vale S.A. | | 166,600 | 3,179,409 |
| | | | | $29,558,502 |
| Natural Gas - Distribution – 0.2% | |
| Italgas S.p.A. | | 610,928 | $ 4,049,677 |
| UGI Corp. | | 36,404 | 1,685,869 |
| | | | | $5,735,546 |
Portfolio of Investments (unaudited) – continued
| Issuer | | | Shares/Par | Value ($) |
| Common Stocks – continued |
| Natural Gas - Pipeline – 0.1% | |
| Enterprise Products Partners LP | | 164,290 | $ 3,657,095 |
| Network & Telecom – 2.4% | |
| CoreSite Realty Corp., REIT | | 168,663 | $ 25,024,529 |
| Equinix, Inc., REIT | | 52,564 | 44,335,106 |
| QTS Realty Trust, Inc., REIT, “A” | | 230,174 | 17,948,969 |
| | | | | $87,308,604 |
| Other Banks & Diversified Financials – 0.4% | |
| KB Financial Group, Inc. | | 48,947 | $ 2,233,211 |
| Sberbank of Russia, ADR | | 373,515 | 6,665,375 |
| SLM Corp. | | 222,516 | 4,172,175 |
| Synchrony Financial | | 47,587 | 2,367,453 |
| | | | | $15,438,214 |
| Pharmaceuticals – 3.9% | |
| Bayer AG | | 188,717 | $ 10,505,207 |
| Eli Lilly & Co. | | 51,893 | 13,403,443 |
| Johnson & Johnson | | 207,851 | 35,985,243 |
| Merck & Co., Inc. | | 404,986 | 30,896,382 |
| Novartis AG | | 124,765 | 11,552,088 |
| Organon & Co. | | 40,499 | 1,372,511 |
| Roche Holding AG | | 93,469 | 37,535,599 |
| | | | | $141,250,473 |
| Precious Metals & Minerals – 0.0% | |
| Petra Diamonds Ltd. (a) | | 36,792,338 | $ 859,927 |
| Printing & Publishing – 0.0% | |
| Transcontinental, Inc. | | 75,049 | $ 1,452,619 |
| Real Estate – 10.6% | |
| Alexandria Real Estate Equities, Inc., REIT | | 107,657 | $ 22,217,175 |
| Boston Properties, Inc., REIT | | 101,821 | 11,504,755 |
| Brixmor Property Group, Inc., REIT | | 903,615 | 21,189,772 |
| Douglas Emmett, Inc., REIT | | 343,776 | 11,348,046 |
| Empire State Realty Trust, REIT, “A” | | 366,141 | 3,760,268 |
| EPR Properties, REIT | | 57,683 | 2,927,412 |
| Equity Lifestyle Properties, Inc., REIT | | 323,759 | 27,542,178 |
| Extra Space Storage, Inc., REIT | | 213,769 | 39,955,564 |
| Host Hotels & Resorts, Inc., REIT (a) | | 893,246 | 14,792,154 |
| National Retail Properties, Inc., REIT | | 337,960 | 16,090,276 |
| National Storage Affiliates Trust, REIT | | 30,094 | 1,722,881 |
| Phillips Edison & Co., REIT | | 240,985 | 7,244,009 |
| Prologis, Inc., REIT | | 466,669 | 62,841,648 |
Portfolio of Investments (unaudited) – continued
| Issuer | | | Shares/Par | Value ($) |
| Common Stocks – continued |
| Real Estate – continued | |
| Simon Property Group, Inc., REIT | | 185,076 | $ 24,883,468 |
| STAG Industrial, Inc., REIT | | 536,976 | 22,687,236 |
| Starwood Property Trust, Inc., REIT | | 158,631 | 4,092,680 |
| STORE Capital Corp., REIT | | 541,158 | 19,519,569 |
| Sun Communities, Inc., REIT | | 139,548 | 28,117,526 |
| Urban Edge Properties, REIT | | 948,554 | 17,965,613 |
| VICI Properties, Inc., REIT | | 742,772 | 22,959,082 |
| | | | | $383,361,312 |
| Special Products & Services – 0.1% | |
| Tisco Financial Group PCL | | 1,780,400 | $ 5,192,200 |
| Telecommunications - Wireless – 1.7% | |
| American Tower Corp., REIT | | 56,937 | $ 16,635,283 |
| KDDI Corp. | | 708,100 | 21,690,651 |
| Mobile TeleSystems PJSC, ADR | | 259,402 | 2,433,191 |
| Turkcell Iletisim Hizmetleri A.S. | | 745,895 | 1,469,996 |
| Vodafone Group PLC | | 10,944,185 | 18,350,849 |
| | | | | $60,579,970 |
| Telephone Services – 0.3% | |
| Hellenic Telecommunications Organization S.A. | | 326,202 | $ 6,418,742 |
| PT Telekom Indonesia | | 11,702,600 | 2,789,752 |
| | | | | $9,208,494 |
| Tobacco – 0.9% | |
| British American Tobacco PLC | | 342,264 | $ 12,841,628 |
| Imperial Brands PLC | | 333,932 | 7,077,125 |
| Japan Tobacco, Inc. | | 674,100 | 13,066,566 |
| | | | | $32,985,319 |
| Utilities - Electric Power – 1.1% | |
| CLP Holdings Ltd. | | 684,000 | $ 6,837,845 |
| E.ON SE | | 642,733 | 8,483,062 |
| Energias do Brasil S.A. | | 486,360 | 1,734,447 |
| Energisa S.A., IEU | | 137,700 | 1,181,587 |
| ENGIE Energía Brasil S.A. | | 227,400 | 1,651,364 |
| Exelon Corp. | | 199,046 | 9,757,235 |
| Iberdrola S.A. | | 409,638 | 5,076,222 |
| Transmissora Alianca de Energia Eletrica S.A., IEU | | 548,121 | 4,018,579 |
| | | | | $38,740,341 |
| Total Common Stocks (Identified Cost, $1,021,060,461) | | $1,441,069,248 |
Portfolio of Investments (unaudited) – continued
| Issuer | | | Shares/Par | Value ($) |
| Bonds – 33.0% | | | |
| Aerospace & Defense – 0.2% |
| BAE Systems PLC, 3.4%, 4/15/2030 (n) | | $ | 1,818,000 | $ 1,992,927 |
| Boeing Co., 5.15%, 5/01/2030 | | | 1,797,000 | 2,126,145 |
| Boeing Co., 3.75%, 2/01/2050 | | | 518,000 | 536,212 |
| DAE Sukuk DIFC Ltd., 3.75%, 2/15/2026 (n) | | | 1,258,000 | 1,335,556 |
| Raytheon Technologies Corp., 1.9%, 9/01/2031 | | | 486,000 | 480,171 |
| | | | | $6,471,011 |
| Airlines – 0.0% |
| Azul Investments LLP, 7.25%, 6/15/2026 (n) | | $ | 1,050,000 | $ 1,015,885 |
| Apparel Manufacturers – 0.0% |
| Tapestry, Inc., 4.125%, 7/15/2027 | | $ | 652,000 | $ 713,692 |
| Asset-Backed & Securitized – 0.5% |
| Arbor Realty Trust, Inc., CLO, 2021-FL1, “B”, FLR, 1.595% (LIBOR - 1mo. + 1.5%), 12/15/2035 (n) | | $ | 998,500 | $ 999,431 |
| Bancorp Commercial Mortgage Trust, 2019-CRE6, “A”, FLR, 1.214% (LIBOR - 1mo. + 1.05%), 9/15/2036 (n) | | | 506,789 | 506,843 |
| BBCMS Mortgage Trust, 2021-C9, “XA”, 1.767%, 2/15/2054 (i) | | | 3,569,720 | 441,470 |
| Benchmark Mortgage Trust, 2021-B24, “XA”, 1.273%, 3/15/2054 (i) | | | 6,701,871 | 568,990 |
| Benchmark Mortgage Trust, 2021-B26, “XA”, 0.999%, 6/15/2054 (i) | | | 6,509,470 | 443,036 |
| Benchmark Mortgage Trust, 2021-B27, “XA”, 1.389%, 7/15/2054 (i) | | | 7,631,008 | 748,801 |
| Capital Automotive, 2020-1A, “A4”, REIT, 3.19%, 2/15/2050 (n) | | | 515,743 | 529,879 |
| Citigroup Commercial Mortgage Trust, 2019-XA, “C7”, 1.002%, 12/15/2072 (i)(n) | | | 9,477,286 | 578,206 |
| Commercial Mortgage Pass-Through Certificates, 2021-BN32, “XA”, 0.893%, 4/15/2054 (i) | | | 4,834,747 | 285,873 |
| CSAIL Commercial Mortgage Trust, 2015-C2, “A4”, 3.504%, 6/15/2057 | | | 58,835 | 63,617 |
| GS Mortgage Securities Trust, 2015-GC32, “A2”, 3.062%, 7/10/2048 | | | 214,184 | 218,569 |
| KREF Ltd., 2018-FT1, “A”, FLR, 1.163% (LIBOR - 1mo. + 1.1%), 2/15/2039 (n) | | | 478,500 | 478,500 |
| KREF Ltd., 2018-FT1, “AS”, FLR, 1.393% (LIBOR - 1mo. + 1.3%), 2/15/2039 (n) | | | 526,000 | 526,000 |
| LoanCore Ltd., 2021-CRE5, “AS”, FLR, 1.845% (LIBOR - 1mo. + 1.75%), 7/15/2036 (n) | | | 750,000 | 750,234 |
| Madison Park Funding Ltd., 2014-13A, “BR2”, FLR, 1.634% (LIBOR - 3mo. + 1.5%), 4/19/2030 (n) | | | 2,390,920 | 2,401,997 |
Portfolio of Investments (unaudited) – continued
| Issuer | | | Shares/Par | Value ($) |
| Bonds – continued | | | |
| Asset-Backed & Securitized – continued |
| MF1 CLO Ltd., 2021-FL5, “AS”, FLR, 1.364% (LIBOR - 1mo. + 1.2%), 7/15/2036 (n) | | $ | 985,000 | $ 985,613 |
| MF1 CLO Ltd., 2021-FL5, “B”, FLR, 1.614% (LIBOR - 1mo. + 1.45%), 7/15/2036 (n) | | | 1,241,000 | 1,242,544 |
| MF1 Multi-Family Housing Mortgage Loan Trust, 2020-FL4, “A”, FLR, 1.864% (LIBOR - 1mo. + 1.7%), 11/15/2035 (n) | | | 1,592,000 | 1,608,903 |
| Morgan Stanley Capital I Trust, 2018-H4, “XA”, 1.025%, 12/15/2051 (i) | | | 9,987,405 | 515,690 |
| Morgan Stanley Capital I Trust, 2021-L5, “XA”, 1.425%, 5/15/2054 (i) | | | 2,701,904 | 259,194 |
| Palmer Square Loan Funding Ltd., 2020-1A, “A2”, FLR, 1.481% (LIBOR - 3mo. + 1.35%), 2/20/2028 (n) | | | 1,308,942 | 1,302,533 |
| PFP III Ltd., 2021-7, “AS”, FLR, 1.245% (LIBOR - 1mo. + 1.15%), 4/14/2038 (n) | | | 1,383,931 | 1,379,603 |
| Symphony CLO Ltd., 2016-17A, “BR”, FLR, 1.326% (LIBOR - 3mo. + 1.2%), 4/15/2028 (n) | | | 2,026,203 | 2,023,287 |
| Wells Fargo Commercial Mortgage Trust, 2018-C48, “XA”, 1.113%, 1/15/2052 (i)(n) | | | 5,871,017 | 337,026 |
| | | | | $19,195,839 |
| Automotive – 0.4% |
| Aptiv PLC, 5.4%, 3/15/2049 | | $ | 1,364,000 | $ 1,898,037 |
| Hyundai Capital America, 2.375%, 2/10/2023 (n) | | | 789,000 | 807,743 |
| Hyundai Capital America, 2.375%, 10/15/2027 (n) | | | 597,000 | 610,766 |
| Hyundai Capital America, 1.8%, 1/10/2028 (n) | | | 852,000 | 847,838 |
| Hyundai Capital America, 6.375%, 4/08/2030 (n) | | | 3,373,000 | 4,386,144 |
| Lear Corp., 3.8%, 9/15/2027 | | | 2,009,000 | 2,236,599 |
| Volkswagen Group of America Finance LLC, 3.35%, 5/13/2025 (n) | | | 1,818,000 | 1,957,610 |
| | | | | $12,744,737 |
| Broadcasting – 0.6% |
| Discovery Communications LLC, 3.625%, 5/15/2030 | | $ | 1,364,000 | $ 1,494,257 |
| Discovery Communications LLC, 4%, 9/15/2055 | | | 1,082,000 | 1,158,359 |
| Prosus N.V., 3.68%, 1/21/2030 (n) | | | 4,984,000 | 5,188,422 |
| Prosus N.V., 3.061%, 7/13/2031 (n) | | | 1,227,000 | 1,200,406 |
| Prosus N.V., 4.027%, 8/03/2050 (n) | | | 1,149,000 | 1,083,284 |
| Prosus N.V., 3.832%, 2/08/2051 (n) | | | 2,834,000 | 2,566,530 |
| Walt Disney Co., 3.35%, 3/24/2025 | | | 1,455,000 | 1,578,486 |
| Walt Disney Co., 3.5%, 5/13/2040 | | | 2,155,000 | 2,423,765 |
| Walt Disney Co., 3.8%, 5/13/2060 | | | 1,364,000 | 1,631,134 |
| Weibo Corp., 3.375%, 7/08/2030 | | | 1,657,000 | 1,696,128 |
| | | | | $20,020,771 |
Portfolio of Investments (unaudited) – continued
| Issuer | | | Shares/Par | Value ($) |
| Bonds – continued | | | |
| Brokerage & Asset Managers – 0.3% |
| Banco BTG Pactual S.A. (Cayman Islands Branch), 4.5%, 1/10/2025 (n) | | $ | 1,598,000 | $ 1,654,249 |
| Banco BTG Pactual S.A. (Cayman Islands Branch), 4.5%, 1/10/2025 | | | 1,548,000 | 1,602,490 |
| Brookfield Finance, Inc., 2.34%, 1/30/2032 | | | 1,906,000 | 1,905,781 |
| Charles Schwab Corp., 1.95%, 12/01/2031 | | | 2,865,000 | 2,867,565 |
| E*TRADE Financial Corp., 3.8%, 8/24/2027 | | | 547,000 | 613,080 |
| Intercontinental Exchange, Inc., 1.85%, 9/15/2032 | | | 2,974,000 | 2,865,479 |
| Intercontinental Exchange, Inc., 3%, 9/15/2060 | | | 591,000 | 585,505 |
| | | | | $12,094,149 |
| Building – 0.1% |
| CEMEX S.A.B. de C.V., 7.375%, 6/05/2027 (n) | | $ | 841,000 | $ 946,125 |
| CEMEX S.A.B. de C.V., 3.875%, 7/11/2031 (n) | | | 1,252,000 | 1,288,008 |
| Masco Corp., 4.5%, 5/15/2047 | | | 436,000 | 532,095 |
| Vulcan Materials Co., 3.5%, 6/01/2030 | | | 1,246,000 | 1,386,554 |
| Vulcan Materials Co., 4.5%, 6/15/2047 | | | 739,000 | 911,597 |
| | | | | $5,064,379 |
| Business Services – 0.5% |
| Equinix, Inc., 2.5%, 5/15/2031 | | $ | 2,649,000 | $ 2,716,287 |
| Equinix, Inc., 3%, 7/15/2050 | | | 891,000 | 866,142 |
| Fiserv, Inc., 4.4%, 7/01/2049 | | | 682,000 | 834,445 |
| Mastercard, Inc., 3.85%, 3/26/2050 | | | 1,655,000 | 2,020,137 |
| NXP Semiconductors N.V., 3.4%, 5/01/2030 (n) | | | 2,036,000 | 2,233,058 |
| StoneCo Ltd., 3.95%, 6/16/2028 (n) | | | 1,603,000 | 1,546,655 |
| Tencent Holdings Ltd., 2.39%, 6/03/2030 (n) | | | 3,235,000 | 3,228,860 |
| Visa, Inc., 2.05%, 4/15/2030 | | | 909,000 | 938,668 |
| Visa, Inc., 2.7%, 4/15/2040 | | | 1,818,000 | 1,890,261 |
| | | | | $16,274,513 |
| Cable TV – 0.3% |
| Cable Onda S.A., 4.5%, 1/30/2030 (n) | | $ | 1,842,000 | $ 1,955,283 |
| Charter Communications Operating LLC/Charter Communications Operating Capital Corp., 6.384%, 10/23/2035 | | | 3,046,000 | 4,071,526 |
| Comcast Corp., 3.75%, 4/01/2040 | | | 909,000 | 1,043,739 |
| United Group B.V., 4.625%, 8/15/2028 (n) | | EUR | 367,000 | 434,195 |
| VTR Comunicaciones S.p.A., 5.125%, 1/15/2028 (n) | | $ | 1,273,000 | 1,330,285 |
| VTR Finance N.V., 6.375%, 7/15/2028 (n) | | | 2,925,000 | 3,104,887 |
| | | | | $11,939,915 |
Portfolio of Investments (unaudited) – continued
| Issuer | | | Shares/Par | Value ($) |
| Bonds – continued | | | |
| Chemicals – 0.3% |
| Alpek SAB de C.V., 3.25%, 2/25/2031 (n) | | $ | 466,000 | $ 477,655 |
| Consolidated Energy Finance S.A., 6.875%, 6/15/2025 (n) | | | 1,352,000 | 1,395,940 |
| Consolidated Energy Finance S.A., 6.875%, 6/15/2025 | | | 293,000 | 302,523 |
| RPM International, Inc., 4.55%, 3/01/2029 | | | 217,000 | 251,169 |
| RPM International, Inc., 4.25%, 1/15/2048 | | | 110,000 | 124,716 |
| Sasol Financing (USA) LLC, 4.375%, 9/18/2026 | | | 1,552,000 | 1,602,440 |
| Sasol Financing (USA) LLC, 5.5%, 3/18/2031 | | | 2,503,000 | 2,646,923 |
| Sherwin-Williams Co., 3.45%, 6/01/2027 | | | 1,409,000 | 1,556,546 |
| Sherwin-Williams Co., 4.5%, 6/01/2047 | | | 1,082,000 | 1,355,421 |
| Synthos S.A., 2.5%, 6/07/2028 (n) | | EUR | 1,249,000 | 1,465,321 |
| | | | | $11,178,654 |
| Computer Software – 0.1% |
| Microsoft Corp., 2.525%, 6/01/2050 | | $ | 3,182,000 | $ 3,174,333 |
| VeriSign, Inc., 4.75%, 7/15/2027 | | | 1,502,000 | 1,581,907 |
| | | | | $4,756,240 |
| Computer Software - Systems – 0.2% |
| Apple, Inc., 2.05%, 9/11/2026 | | $ | 3,416,000 | $ 3,582,556 |
| Apple, Inc., 1.7%, 8/05/2031 | | | 2,384,000 | 2,359,510 |
| Apple, Inc., 2.65%, 5/11/2050 | | | 791,000 | 784,009 |
| | | | | $6,726,075 |
| Conglomerates – 0.4% |
| Carrier Global Corp., 2.722%, 2/15/2030 | | $ | 1,409,000 | $ 1,477,760 |
| Carrier Global Corp., 3.377%, 4/05/2040 | | | 1,282,000 | 1,369,877 |
| Grupo KUO S.A.B. de C.V., 5.75%, 7/07/2027 (n) | | | 5,300,000 | 5,541,203 |
| Otis Worldwide Corp., 2.565%, 2/15/2030 | | | 2,127,000 | 2,222,245 |
| Westinghouse Air Brake Technologies Corp., 4.95%, 9/15/2028 | | | 1,927,000 | 2,243,018 |
| | | | | $12,854,103 |
| Construction – 0.1% |
| Seazen Group Ltd., 4.45%, 7/13/2025 | | $ | 1,614,000 | $ 1,583,455 |
| Sunac China Holdings Ltd., 7.5%, 2/01/2024 | | | 1,231,000 | 1,246,141 |
| | | | | $2,829,596 |
| Consumer Products – 0.1% |
| Mattel, Inc., 3.75%, 4/01/2029 (n) | | $ | 873,000 | $ 916,475 |
| Reckitt Benckiser Treasury Services PLC, 2.75%, 6/26/2024 (n) | | | 2,516,000 | 2,648,355 |
| | | | | $3,564,830 |
Portfolio of Investments (unaudited) – continued
| Issuer | | | Shares/Par | Value ($) |
| Bonds – continued | | | |
| Consumer Services – 0.2% |
| B2W Digital Lux S.à r.l., 4.375%, 12/20/2030 (n) | | $ | 1,498,000 | $ 1,498,000 |
| Booking Holdings, Inc., 3.55%, 3/15/2028 | | | 1,200,000 | 1,339,259 |
| Conservation Fund, 3.474%, 12/15/2029 | | | 1,031,000 | 1,104,980 |
| Meituan, 2.125%, 10/28/2025 (n) | | | 865,000 | 844,769 |
| Meituan, 3.05%, 10/28/2030 (n) | | | 1,511,000 | 1,431,273 |
| | | | | $6,218,281 |
| Containers – 0.1% |
| Canpack S.A./Eastern PA Land Investment Holding LLC, 3.125%, 11/01/2025 (n) | | $ | 412,000 | $ 418,180 |
| Canpack S.A./Eastern PA Land Investment Holding LLC, 2.375%, 11/01/2027 (n) | | EUR | 445,000 | 539,773 |
| San Miguel Industrias PET S.A., 3.5%, 8/02/2028 (n) | | $ | 2,000,000 | 1,970,000 |
| | | | | $2,927,953 |
| Electrical Equipment – 0.0% |
| Arrow Electronics, Inc., 3.875%, 1/12/2028 | | $ | 389,000 | $ 428,219 |
| Electronics – 0.2% |
| Broadcom Corp./Broadcom Cayman Finance Ltd., 3.5%, 1/15/2028 | | $ | 2,782,000 | $ 3,025,623 |
| Broadcom, Inc., 5%, 4/15/2030 | | | 1,591,000 | 1,884,450 |
| Broadcom, Inc., 3.469%, 4/15/2034 (n) | | | 854,000 | 904,136 |
| NXP B.V./NXP Funding LLC, 4.625%, 6/01/2023 (n) | | | 1,818,000 | 1,940,445 |
| | | | | $7,754,654 |
| Emerging Market Quasi-Sovereign – 3.3% |
| Abu Dhabi Crude Oil Pipeline, 4.6%, 11/02/2047 | | $ | 1,915,000 | $ 2,301,255 |
| Aeropuerto Internacional de Tocumen S.A. (Republic of Panama), 5.125%, 8/11/2061 (n) | | | 1,651,000 | 1,745,107 |
| Autoridad del Canal de Panama, 4.95%, 7/29/2035 (n) | | | 281,000 | 348,443 |
| Autoridad del Canal de Panama, 4.95%, 7/29/2035 | | | 1,220,000 | 1,512,812 |
| Banco de Reservas de la Republica Dominicana, 7%, 2/01/2023 | | | 1,500,000 | 1,578,765 |
| Banco Nacional de Panama, 2.5%, 8/11/2030 (n) | | | 241,000 | 231,360 |
| Biz Finance PLC (Ukraine), 9.75%, 1/22/2025 | | | 295,313 | 318,961 |
| CDBL Funding 1 (People's Republic of China), 4.25%, 12/02/2024 | | | 854,000 | 924,207 |
| China Construction Bank Corp., 4.25% to 2/27/2024, FLR (CMT - 5yr. + 1.88%) to 2/27/2029 | | | 1,764,000 | 1,890,022 |
| China Development Bank Financial Leasing Co. Ltd., 2.875%, 9/28/2030 | | | 1,618,000 | 1,654,712 |
| Comision Federal de Electricidad (United Mexican States), 3.348%, 2/09/2031 (n) | | | 1,360,000 | 1,353,214 |
Portfolio of Investments (unaudited) – continued
| Issuer | | | Shares/Par | Value ($) |
| Bonds – continued | | | |
| Emerging Market Quasi-Sovereign – continued |
| Comision Federal de Electricidad (United Mexican States), 3.875%, 7/26/2033 (n) | | $ | 1,391,000 | $ 1,394,144 |
| DAE Funding LLC (United Arab Emirates), 3.375%, 3/20/2028 (n) | | | 935,000 | 966,826 |
| Development Bank of Kazakhstan, 4.125%, 12/10/2022 | | | 1,663,000 | 1,728,855 |
| DP World Salaam (United Arab Emirates), 6% to 1/01/2026, FLR (CMT - 5yr. + 5.75%) to 1/01/2031, FLR (CMT - 5yr. + 6.75%) to 1/01/2070 | | | 2,760,000 | 3,013,506 |
| Ecopetrol S.A., 5.375%, 6/26/2026 | | | 2,155,000 | 2,376,965 |
| Ecopetrol S.A., 6.875%, 4/29/2030 | | | 1,273,000 | 1,534,309 |
| Emirates NBD Bank PJSC, 6.125% to 7/09/2026, FLR (Swap Rate - 6yr. + 5.702%) to 1/09/2170 | | | 1,170,000 | 1,285,245 |
| Empresa de Transmision Electrica S.A. (Republic of Panama), 5.125%, 5/02/2049 (n) | | | 1,694,000 | 1,943,865 |
| Empresa Nacional del Petroleo (Republic of Chile), 4.375%, 10/30/2024 (n) | | | 2,469,000 | 2,680,354 |
| Empresas Publicas de Medellin E.S.P., 4.25%, 7/18/2029 | | | 448,000 | 447,328 |
| Empresas Publicas de Medellin E.S.P., 4.375%, 2/15/2031 (n) | | | 1,193,000 | 1,178,064 |
| EQUATE Petrochemical B.V. (State of Kuwait), 4.25%, 11/03/2026 | | | 3,292,000 | 3,655,865 |
| EQUATE Petrochemical B.V. (State of Kuwait), 2.625%, 4/28/2028 (n) | | | 548,000 | 557,313 |
| Eskom Holdings SOC Ltd. (Republic of South Africa), 6.35%, 8/10/2028 (n) | | | 2,885,000 | 3,189,010 |
| Export-Import Bank of India, 3.875%, 2/01/2028 (n) | | | 2,738,000 | 2,981,223 |
| Export-Import Bank of India, 2.25%, 1/13/2031 (n) | | | 2,354,000 | 2,229,164 |
| Greenko Dutch B.V. (Republic of India), 3.85%, 3/29/2026 (n) | | | 1,193,000 | 1,218,506 |
| Huarong Finance Co. Ltd. (People's Republic of China), 3.25%, 11/13/2024 | | | 2,058,000 | 1,955,100 |
| Indian Railway Finance Corp., 2.8%, 2/10/2031 (n) | | | 2,640,000 | 2,588,205 |
| Industrial & Commercial Bank of China Ltd., 4.875%, 9/21/2025 | | | 1,689,000 | 1,891,842 |
| Ipoteka Bank (Republic of Uzbekistan), 5.5%, 11/19/2025 | | | 1,553,000 | 1,602,510 |
| Krung Thai Bank PLC (Cayman Islands Branch), 4.4% to 3/25/2026, FLR (CMT - 5yr. + 3.53%) to 9/25/2169 | | | 1,612,000 | 1,624,832 |
| MDGH - GMTN B.V. (United Arab Emirates), 2.875%, 11/07/2029 (n) | | | 2,464,000 | 2,608,711 |
| MEGlobal Canada ULC (State of Kuwait), 5.875%, 5/18/2030 (n) | | | 910,000 | 1,132,158 |
| NAK Naftogaz Ukraine via Standard Bank London Holdings PLC, 7.625%, 11/08/2026 (n) | | | 3,111,000 | 3,207,431 |
Portfolio of Investments (unaudited) – continued
| Issuer | | | Shares/Par | Value ($) |
| Bonds – continued | | | |
| Emerging Market Quasi-Sovereign – continued |
| OCP S.A. (Republic of Madagascar), 6.875%, 4/25/2044 | | $ | 2,448,000 | $ 2,979,162 |
| Office Cherifien des Phosphates S.A. (Kingdom of Morocco), 3.75%, 6/23/2031 (n) | | | 1,113,000 | 1,125,882 |
| Office Cherifien des Phosphates S.A. (Kingdom of Morocco), 5.125%, 6/23/2051 (n) | | | 1,279,000 | 1,290,191 |
| Ooredoo International Finance Ltd. (State of Qatar), 2.625%, 4/08/2031 (n) | | | 3,227,000 | 3,323,810 |
| Oryx Funding Ltd. (Sultanate of Oman), 5.8%, 2/03/2031 (n) | | | 1,210,000 | 1,279,938 |
| Petroleos Mexicanos, 6.875%, 10/16/2025 (n) | | | 1,634,000 | 1,785,112 |
| Petroleos Mexicanos, 6.49%, 1/23/2027 | | | 1,374,000 | 1,455,588 |
| Petroleos Mexicanos, 6.84%, 1/23/2030 | | | 3,174,000 | 3,304,515 |
| Petroleos Mexicanos, 6.75%, 9/21/2047 | | | 1,784,000 | 1,567,244 |
| Petroleos Mexicanos, 7.69%, 1/23/2050 | | | 5,408,000 | 5,163,396 |
| Petroleos Mexicanos, 6.95%, 1/28/2060 | | | 3,229,000 | 2,848,624 |
| PJSC State Savings Bank of Ukraine, 9.375%, 3/10/2023 | | | 1,178,800 | 1,231,846 |
| PJSC State Savings Bank of Ukraine, 9.625%, 3/20/2025 | | | 852,800 | 925,288 |
| PT Bank Negara Indonesia (Persero) Tbk, 3.75%, 3/30/2026 | | | 1,293,000 | 1,332,701 |
| PT Indonesia Asahan Aluminium (Persero), 4.75%, 5/15/2025 (n) | | | 1,905,000 | 2,076,660 |
| PT Indonesia Asahan Aluminium (Persero), 5.8%, 5/15/2050 (n) | | | 1,191,000 | 1,417,290 |
| PT Pertamina (Persero) (Republic of Indonesia), 6.45%, 5/30/2044 | | | 1,662,000 | 2,206,687 |
| PT Perusahaan Listrik Negara (Republic of Indonesia), 6.15%, 5/21/2048 (n) | | | 1,317,000 | 1,675,224 |
| PTT Treasury Center Co. Ltd. (Kingdom of Thailand), 3.7%, 7/16/2070 (n) | | | 1,999,000 | 2,068,466 |
| Qatar Petroleum, 2.25%, 7/12/2031 (n) | | | 1,397,000 | 1,408,684 |
| Qatar Petroleum, 3.125%, 7/12/2041 (n) | | | 1,292,000 | 1,329,504 |
| Qatar Petroleum, 3.3%, 7/12/2051 (n) | | | 1,053,000 | 1,087,538 |
| SA Global Sukuk Ltd. (Kingdom of Saudi Arabia), 1.602%, 6/17/2026 (n) | | | 414,000 | 414,811 |
| SA Global Sukuk Ltd. (Kingdom of Saudi Arabia), 2.694%, 6/17/2031 (n) | | | 593,000 | 606,787 |
| Saudi Arabian Oil Co., 3.5%, 11/24/2070 (n) | | | 1,098,000 | 1,073,471 |
| Southern Gas Corridor CJSC (Republic of Azerbaijan), 6.875%, 3/24/2026 (n) | | | 5,170,000 | 6,124,899 |
| State Oil Company of the Azerbaijan Republic, 4.75%, 3/13/2023 | | | 3,933,000 | 4,129,650 |
Portfolio of Investments (unaudited) – continued
| Issuer | | | Shares/Par | Value ($) |
| Bonds – continued | | | |
| Emerging Market Quasi-Sovereign – continued |
| T.C. Ziraat Bankasi A.S. (Republic of Turkey), 5.375%, 3/02/2026 (n) | | $ | 1,464,000 | $ 1,458,364 |
| | | | | $119,541,521 |
| Emerging Market Sovereign – 8.7% |
| Arab Republic of Egypt, 0%, 12/07/2021 | | EGP | 28,500,000 | $ 1,756,291 |
| Arab Republic of Egypt, 6.125%, 1/31/2022 | | $ | 7,492,000 | 7,610,673 |
| Arab Republic of Egypt, 5.577%, 2/21/2023 (n) | | | 1,218,000 | 1,272,995 |
| Arab Republic of Egypt, 7.5%, 1/31/2027 | | | 1,900,000 | 2,116,543 |
| Arab Republic of Egypt, 6.588%, 2/21/2028 | | | 1,753,000 | 1,860,722 |
| Arab Republic of Egypt, 7.6%, 3/01/2029 (n) | | | 1,396,000 | 1,532,389 |
| Arab Republic of Egypt, 7.625%, 5/29/2032 (n) | | | 1,736,000 | 1,862,568 |
| Arab Republic of Egypt, 8.875%, 5/29/2050 (n) | | | 1,710,000 | 1,840,388 |
| Arab Republic of Egypt, 7.5%, 2/16/2061 (n) | | | 1,617,000 | 1,532,496 |
| Commonwealth of Bahamas, 8.95%, 10/15/2032 | | | 1,130,000 | 1,228,875 |
| Dominican Republic, 6.875%, 1/29/2026 | | | 3,004,000 | 3,492,150 |
| Dominican Republic, 5.95%, 1/25/2027 | | | 3,057,000 | 3,462,053 |
| Dominican Republic, 6%, 7/19/2028 (n) | | | 3,561,000 | 4,077,381 |
| Dominican Republic, 4.875%, 9/23/2032 (n) | | | 3,806,000 | 3,996,338 |
| Dominican Republic, 5.3%, 1/21/2041 (n) | | | 1,002,000 | 1,022,050 |
| Dominican Republic, 5.875%, 1/30/2060 (n) | | | 2,282,000 | 2,321,958 |
| Dominican Republic, 5.875%, 1/30/2060 | | | 2,407,000 | 2,449,147 |
| Federal Republic of Nigeria, 7.625%, 11/21/2025 | | | 1,042,000 | 1,165,435 |
| Federal Republic of Nigeria, 6.5%, 11/28/2027 (n) | | | 2,571,000 | 2,713,665 |
| Federal Republic of Nigeria, 7.143%, 2/23/2030 (n) | | | 521,000 | 548,034 |
| Federal Republic of Nigeria, 7.875%, 2/16/2032 | | | 1,417,000 | 1,524,525 |
| Federal Republic of Nigeria, 7.696%, 2/23/2038 | | | 969,000 | 992,450 |
| Federative Republic of Brazil, 10%, 1/01/2023 | | BRL | 14,946,000 | 2,939,722 |
| Federative Republic of Brazil, 3.75%, 9/12/2031 | | $ | 1,249,000 | 1,230,265 |
| Federative Republic of Brazil, 4.75%, 1/14/2050 | | | 1,053,000 | 996,412 |
| Government of Jamaica, 8%, 3/15/2039 | | | 3,225,000 | 4,579,532 |
| Government of Jamaica, 7.875%, 7/28/2045 | | | 1,935,000 | 2,752,557 |
| Government of Malaysia, 4.065%, 6/15/2050 | | MYR | 12,547,000 | 2,950,431 |
| Government of Oman, 6.25%, 1/25/2031 | | $ | 1,488,000 | 1,622,039 |
| Government of Oman, 7%, 1/25/2051 | | | 336,000 | 349,994 |
| Government of Romania, 2.625%, 12/02/2040 (n) | | EUR | 602,000 | 700,825 |
| Government of Ukraine, 7.75%, 9/01/2024 (n) | | $ | 2,600,000 | 2,854,072 |
| Government of Ukraine, 7.75%, 9/01/2025 | | | 4,164,000 | 4,590,810 |
| Government of Ukraine, 7.75%, 9/01/2026 | | | 3,434,000 | 3,816,754 |
| Government of Ukraine, 6.876%, 5/21/2029 (n) | | | 2,213,000 | 2,335,777 |
| Government of Ukraine, 6.876%, 5/21/2029 | | | 598,000 | �� 631,177 |
| Government of Ukraine, 4.375%, 1/27/2030 (n) | | EUR | 1,074,000 | 1,208,270 |
| Government of Ukraine, 7.253%, 3/15/2033 (n) | | $ | 3,003,000 | 3,180,141 |
Portfolio of Investments (unaudited) – continued
| Issuer | | | Shares/Par | Value ($) |
| Bonds – continued | | | |
| Emerging Market Sovereign – continued |
| Government of Ukraine, 7.253%, 3/15/2033 | | $ | 3,089,000 | $ 3,271,214 |
| Government of Ukraine, GDP Linked Bond, 0%, 5/31/2040 | | | 6,063,000 | 6,902,726 |
| Hashemite Kingdom of Jordan, 5.85%, 7/07/2030 (n) | | | 2,432,000 | 2,565,760 |
| Islamic Republic of Pakistan, 8.875%, 4/08/2051 (n) | | | 1,504,000 | 1,552,910 |
| Kingdom of Morocco, 1.375%, 3/30/2026 (n) | | EUR | 1,001,000 | 1,194,814 |
| Kingdom of Morocco, 2.375%, 12/15/2027 (n) | | $ | 1,562,000 | 1,542,475 |
| Kingdom of Morocco, 3%, 12/15/2032 (n) | | | 1,638,000 | 1,584,627 |
| Kingdom of Morocco, 3%, 12/15/2032 | | | 1,357,000 | 1,312,784 |
| Kingdom of Morocco, 4%, 12/15/2050 (n) | | | 1,126,000 | 1,046,414 |
| Kingdom of Saudi Arabia, 2.25%, 2/02/2033 (n) | | | 1,288,000 | 1,268,922 |
| Oriental Republic of Uruguay, 8.5%, 3/15/2028 | | UYU | 82,019,000 | 2,002,722 |
| Oriental Republic of Uruguay, 4.375%, 1/23/2031 | | $ | 3,844,000 | 4,509,166 |
| Oriental Republic of Uruguay, 8.25%, 5/21/2031 | | UYU | 53,264,000 | 1,268,131 |
| Oriental Republic of Uruguay, Inflation Linked Bond, 3.875%, 7/02/2040 | | | 82,945,565 | 2,263,315 |
| Republic of Angola, 9.375%, 5/08/2048 | | $ | 2,905,000 | 3,086,249 |
| Republic of Argentina, 0.5%, 7/09/2030 | | | 1,517,982 | 592,332 |
| Republic of Argentina, 1.125%, 7/09/2035 | | | 2,781,057 | 970,617 |
| Republic of Benin, 4.875%, 1/19/2032 (n) | | EUR | 1,060,000 | 1,266,844 |
| Republic of Benin, 6.875%, 1/19/2052 (n) | | | 419,000 | 519,293 |
| Republic of Chile, 5%, 10/01/2028 (n) | | CLP | 870,000,000 | 1,156,325 |
| Republic of Chile, 2.55%, 7/27/2033 | | $ | 1,604,000 | 1,632,407 |
| Republic of Colombia, 3.875%, 4/25/2027 | | | 1,350,000 | 1,429,596 |
| Republic of Colombia, 5.75%, 11/03/2027 | | COP | 11,984,300,000 | 3,075,929 |
| Republic of Colombia, 3.25%, 4/22/2032 | | $ | 2,274,000 | 2,219,106 |
| Republic of Costa Rica, 6.125%, 2/19/2031 | | | 3,248,000 | 3,451,032 |
| Republic of Costa Rica, 7.158%, 3/12/2045 | | | 1,997,000 | 2,081,892 |
| Republic of Cote d'Ivoire, 5.25%, 3/22/2030 (n) | | EUR | 2,432,000 | 3,061,269 |
| Republic of Cote d'Ivoire, 5.875%, 10/17/2031 (n) | | | 1,678,000 | 2,161,454 |
| Republic of Cote d'Ivoire, 4.875%, 1/30/2032 (n) | | | 1,724,000 | 2,075,169 |
| Republic of Cote d'Ivoire, 6.875%, 10/17/2040 (n) | | | 2,193,000 | 2,892,876 |
| Republic of Cote d'Ivoire, 6.625%, 3/22/2048 (n) | | | 602,000 | 763,104 |
| Republic of Croatia, 2.75%, 1/27/2030 | | | 1,000,000 | 1,386,473 |
| Republic of Croatia, 1.75%, 3/04/2041 | | | 1,325,000 | 1,655,954 |
| Republic of Ecuador, 0%, 7/31/2030 (n) | | $ | 532,211 | 300,705 |
| Republic of Ecuador, 5%, 7/31/2030 | | | 1,965,000 | 1,758,695 |
| Republic of Ecuador, 1%, 7/31/2035 (n) | | | 3,587,406 | 2,569,515 |
| Republic of Ecuador, 1%, 7/31/2035 | | | 4,219,000 | 3,021,901 |
| Republic of Ecuador, 0.5%, 7/31/2040 (n) | | | 3,326,765 | 2,125,004 |
| Republic of Ecuador, 0.5%, 7/31/2040 | | | 2,198,000 | 1,403,994 |
| Republic of El Salvador, 6.375%, 1/18/2027 | | | 1,580,000 | 1,374,616 |
| Republic of Ghana, 7.75%, 4/07/2029 (n) | | | 1,182,000 | 1,193,413 |
| Republic of Ghana, 8.625%, 4/07/2034 (n) | | | 631,000 | 638,320 |
Portfolio of Investments (unaudited) – continued
| Issuer | | | Shares/Par | Value ($) |
| Bonds – continued | | | |
| Emerging Market Sovereign – continued |
| Republic of Ghana, 7.875%, 2/11/2035 | | $ | 2,325,000 | $ 2,235,116 |
| Republic of Ghana, 8.875%, 5/07/2042 (n) | | | 596,000 | 592,923 |
| Republic of Ghana, 8.75%, 3/11/2061 | | | 1,973,000 | 1,891,910 |
| Republic of Guatemala, 4.9%, 6/01/2030 | | | 4,648,000 | 5,198,834 |
| Republic of Guatemala, 5.375%, 4/24/2032 (n) | | | 880,000 | 1,015,960 |
| Republic of Guatemala, 6.125%, 6/01/2050 | | | 2,624,000 | 3,144,890 |
| Republic of Hungary, 1.75%, 6/05/2035 | | EUR | 2,896,000 | 3,688,734 |
| Republic of India, 7.27%, 4/08/2026 | | INR | 269,280,000 | 3,903,052 |
| Republic of India, 7.26%, 1/14/2029 | | | 283,120,000 | 4,092,021 |
| Republic of Indonesia, 1.1%, 3/12/2033 | | EUR | 1,082,000 | 1,261,155 |
| Republic of Indonesia, 7.125%, 6/15/2042 | | IDR | 36,592,000,000 | 2,651,103 |
| Republic of Indonesia, 4.35%, 1/11/2048 | | $ | 1,978,000 | 2,293,059 |
| Republic of Kenya, 7%, 5/22/2027 (n) | | | 1,709,000 | 1,876,824 |
| Republic of Kenya, 8%, 5/22/2032 | | | 3,895,000 | ��� 4,449,890 |
| Republic of Kenya, 8.25%, 2/28/2048 (n) | | | 1,974,000 | 2,234,173 |
| Republic of Kenya, 8.25%, 2/28/2048 | | | 1,785,000 | 2,020,263 |
| Republic of North Macedonia, 1.625%, 3/10/2028 (n) | | EUR | 1,618,000 | 1,909,002 |
| Republic of Pakistan, 6%, 4/08/2026 (n) | | $ | 1,550,000 | 1,557,363 |
| Republic of Panama, 3.362%, 6/30/2031 (n) | | | 1,539,000 | 1,565,933 |
| Republic of Panama, 2.252%, 9/29/2032 | | | 2,191,000 | 2,137,145 |
| Republic of Paraguay, 6.1%, 8/11/2044 | | | 4,048,000 | 5,110,640 |
| Republic of Paraguay, 5.6%, 3/13/2048 | | | 1,226,000 | 1,471,212 |
| Republic of Paraguay, 5.4%, 3/30/2050 (n) | | | 1,944,000 | 2,321,136 |
| Republic of Philippines, 1.2%, 4/28/2033 | | EUR | 2,353,000 | 2,839,327 |
| Republic of Philippines, 1.75%, 4/28/2041 | | | 1,891,000 | 2,268,478 |
| Republic of Romania, 1.75%, 7/13/2030 (n) | | | 1,556,000 | 1,844,173 |
| Republic of Romania, 2.124%, 7/16/2031 | | | 1,290,000 | 1,566,535 |
| Republic of Romania, 2%, 1/28/2032 (n) | | | 3,455,000 | 4,115,456 |
| Republic of Romania, 2%, 1/28/2032 | | | 1,150,000 | 1,369,833 |
| Republic of Romania, 2%, 4/14/2033 (n) | | | 2,181,000 | 2,563,375 |
| Republic of Romania, 2.75%, 4/14/2041 (n) | | | 1,029,000 | 1,199,972 |
| Republic of Rwanda, 5.5%, 8/09/2031 (n) | | $ | 793,000 | 816,219 |
| Republic of Senegal, 4.75%, 3/13/2028 (n) | | EUR | 1,883,000 | 2,358,052 |
| Republic of Senegal, 5.375%, 6/08/2037 (n) | | | 633,000 | 764,755 |
| Republic of Senegal, 6.75%, 3/13/2048 | | $ | 1,061,000 | 1,102,943 |
| Republic of Serbia, 3.125%, 5/15/2027 (n) | | EUR | 1,566,000 | 2,061,141 |
| Republic of Serbia, 1.65%, 3/03/2033 (n) | | | 1,574,000 | 1,839,916 |
| Republic of South Africa, 4.85%, 9/27/2027 | | $ | 1,734,000 | 1,858,848 |
| Republic of South Africa, 4.85%, 9/30/2029 | | | 1,946,000 | 2,058,284 |
| Republic of South Africa, 8%, 1/31/2030 | | ZAR | 37,114,000 | 2,439,732 |
| Republic of South Africa, 8.25%, 3/31/2032 | | | 63,469,000 | 4,031,912 |
| Republic of Sri Lanka, 6.125%, 6/03/2025 | | $ | 4,379,000 | 2,890,140 |
| Republic of Sri Lanka, 7.55%, 3/28/2030 | | | 2,892,000 | 1,840,035 |
Portfolio of Investments (unaudited) – continued
| Issuer | | | Shares/Par | Value ($) |
| Bonds – continued | | | |
| Emerging Market Sovereign – continued |
| Republic of Turkey, 5.6%, 11/14/2024 | | $ | 2,529,000 | $ 2,621,855 |
| Republic of Turkey, 6.375%, 10/14/2025 | | | 1,646,000 | 1,738,999 |
| Republic of Turkey, 4.75%, 1/26/2026 | | | 1,172,000 | 1,168,214 |
| Republic of Turkey, 5.875%, 6/26/2031 | | | 1,223,000 | 1,216,836 |
| Republic of Turkey, 6.625%, 2/17/2045 | | | 1,943,000 | 1,904,140 |
| Republic of Turkey, 5.75%, 5/11/2047 | | | 2,106,000 | 1,873,161 |
| Republic of Uzbekistan, 3.7%, 11/25/2030 (n) | | | 1,498,000 | 1,482,870 |
| Republic of Uzbekistan, 3.9%, 10/19/2031 (n) | | | 835,000 | 833,864 |
| Russian Federation, 4.75%, 5/27/2026 | | | 2,800,000 | 3,175,760 |
| Russian Federation, 4.25%, 6/23/2027 | | | 5,600,000 | 6,288,184 |
| State of Qatar, 3.75%, 4/16/2030 (n) | | | 1,818,000 | 2,071,131 |
| State of Qatar, 5.103%, 4/23/2048 (n) | | | 2,326,000 | 3,131,466 |
| State of Qatar, 4.817%, 3/14/2049 (n) | | | 1,236,000 | 1,614,147 |
| Sultanate of Oman, 6%, 8/01/2029 | | | 1,515,000 | 1,620,132 |
| Sultanate of Oman, 6.75%, 1/17/2048 | | | 3,925,000 | 4,008,406 |
| Sultanate of Oman, 7%, 1/25/2051 (n) | | | 3,249,000 | 3,384,321 |
| United Mexican States, 2.659%, 5/24/2031 | | | 1,818,000 | 1,806,892 |
| United Mexican States, 1.45%, 10/25/2033 | | EUR | 722,000 | 818,913 |
| United Mexican States, 4.5%, 1/31/2050 | | $ | 1,241,000 | 1,348,731 |
| | | | | $311,827,454 |
| Energy - Independent – 0.6% |
| Diamondback Energy, Inc., 3.125%, 3/24/2031 | | $ | 936,000 | $ 974,414 |
| Energean Israel Finance Ltd., 4.875%, 3/30/2026 | | | 1,724,000 | 1,764,686 |
| Energean Israel Finance Ltd., 5.375%, 3/30/2028 | | | 1,533,000 | 1,564,472 |
| Hess Corp., 5.8%, 4/01/2047 | | | 1,364,000 | 1,774,018 |
| Leviathan Bond Ltd., 6.75%, 6/30/2030 (n) | | | 2,841,000 | 3,175,045 |
| Medco Bell Pte. Ltd., 6.375%, 1/30/2027 (n) | | | 1,718,000 | 1,746,931 |
| Sierracol Energy Andina LLC, 6%, 6/15/2028 (n) | | | 2,195,000 | 2,189,513 |
| Tengizchevroil Finance Co. International Ltd., 4%, 8/15/2026 (n) | | | 2,119,000 | 2,296,886 |
| Tengizchevroil Finance Co. International Ltd., 4%, 8/15/2026 | | | 1,507,000 | 1,633,510 |
| Tengizchevroil Finance Co. International Ltd., 3.25%, 8/15/2030 (n) | | | 3,178,000 | 3,257,450 |
| | | | | $20,376,925 |
| Energy - Integrated – 0.1% |
| Cenovus Energy, Inc., 6.75%, 11/15/2039 | | $ | 801,000 | $ 1,081,636 |
| Eni S.p.A., 4.75%, 9/12/2028 (n) | | | 1,818,000 | 2,138,210 |
| | | | | $3,219,846 |
Portfolio of Investments (unaudited) – continued
| Issuer | | | Shares/Par | Value ($) |
| Bonds – continued | | | |
| Financial Institutions – 0.3% |
| AerCap Ireland Capital DAC, 3.65%, 7/21/2027 | | $ | 1,669,000 | $ 1,777,805 |
| Avolon Holdings Funding Ltd., 4.25%, 4/15/2026 (n) | | | 909,000 | 985,609 |
| Avolon Holdings Funding Ltd., 4.375%, 5/01/2026 (n) | | | 855,000 | 929,070 |
| Avolon Holdings Funding Ltd., 2.75%, 2/21/2028 (n) | | | 1,636,000 | 1,641,278 |
| Muthoot Finance Ltd., 4.4%, 9/02/2023 (n) | | | 2,255,000 | 2,311,375 |
| Shriram Transport Finance Co. Ltd., 4.4%, 3/13/2024 (n) | | | 2,049,000 | 2,069,449 |
| Times China Holdings Ltd., 6.75%, 7/08/2025 | | | 1,256,000 | 1,249,900 |
| | | | | $10,964,486 |
| Food & Beverages – 0.8% |
| Anheuser-Busch InBev Worldwide, Inc., 3.5%, 6/01/2030 | | $ | 2,791,000 | $ 3,108,646 |
| Anheuser-Busch InBev Worldwide, Inc., 5.55%, 1/23/2049 | | | 1,364,000 | 1,896,102 |
| Aragvi Finance International DAC, 8.45%, 4/29/2026 (n) | | | 1,588,000 | 1,648,122 |
| Bacardi Ltd., 5.15%, 5/15/2038 (n) | | | 1,036,000 | 1,296,504 |
| Central American Bottling Corp., 5.75%, 1/31/2027 (n) | | | 1,742,000 | 1,824,745 |
| Constellation Brands, Inc., 3.5%, 5/09/2027 | | | 2,727,000 | 3,016,421 |
| Constellation Brands, Inc., 3.15%, 8/01/2029 | | | 1,527,000 | 1,649,943 |
| Constellation Brands, Inc., 4.1%, 2/15/2048 | | | 2,446,000 | 2,823,827 |
| Corporacion Lindley S.A., 6.75%, 11/23/2021 (n) | | | 286,250 | 288,397 |
| Grupo Bimbo S.A.B. de C.V., 5.95%, 4/17/2059 | | | 1,248,000 | 1,321,632 |
| JBS Finance Luxembourg S.à r.l., 3.625%, 1/15/2032 (n) | | | 1,297,000 | 1,342,149 |
| JBS Investments II GmbH, 5.75%, 1/15/2028 (n) | | | 1,796,000 | 1,896,217 |
| JBS Investments II GmbH, 5.75%, 1/15/2028 | | | 928,000 | 979,782 |
| JBS USA Lux S.A./JBS USA Finance, Inc., 6.5%, 4/15/2029 (n) | | | 1,304,000 | 1,476,780 |
| JBS USA Lux S.A./JBS USA Food Co./JBS USA Finance, Inc., 6.5%, 4/15/2029 | | | 1,107,000 | 1,253,677 |
| PT Indofood CBP Sukses Makmur Tbk, 3.398%, 6/09/2031 | | | 759,000 | 794,852 |
| SYSCO Corp., 2.4%, 2/15/2030 | | | 218,000 | 224,549 |
| SYSCO Corp., 4.45%, 3/15/2048 | | | 391,000 | 473,756 |
| | | | | $27,316,101 |
| Forest & Paper Products – 0.1% |
| Celulosa Arauco y Constitucion, 4.2%, 1/29/2030 (n) | | $ | 1,818,000 | $ 1,983,892 |
| Gaming & Lodging – 0.1% |
| GENM Capital Labuan Ltd., 3.882%, 4/19/2031 (n) | | $ | 1,716,000 | $ 1,726,626 |
| Marriott International, Inc., 4.625%, 6/15/2030 | | | 455,000 | 522,871 |
| Marriott International, Inc., 2.85%, 4/15/2031 | | | 482,000 | 491,723 |
| Marriott International, Inc., 3.5%, 10/15/2032 | | | 1,164,000 | 1,242,533 |
| | | | | $3,983,753 |
Portfolio of Investments (unaudited) – continued
| Issuer | | | Shares/Par | Value ($) |
| Bonds – continued | | | |
| Industrial – 0.2% |
| Arabian Centres Sukuk II Ltd., 5.625%, 10/07/2026 (n) | | $ | 2,278,000 | $ 2,357,502 |
| Dar Al-Arkan Sukuk Co. Ltd., 6.875%, 2/26/2027 | | | 1,811,000 | 1,869,894 |
| GEMS Menasa Cayman Ltd./GEMS Education Delaware LLC, 7.125%, 7/31/2026 (n) | | | 1,470,000 | 1,521,450 |
| Howard University, Washington D.C., 2.638%, 10/01/2021 | | | 181,000 | 181,320 |
| Howard University, Washington D.C., 2.738%, 10/01/2022 | | | 190,000 | 193,826 |
| Howard University, Washington D.C., 2.801%, 10/01/2023 | | | 209,000 | 216,978 |
| Howard University, Washington D.C., AGM, 2.416%, 10/01/2024 | | | 230,000 | 236,305 |
| Howard University, Washington D.C., AGM, 2.516%, 10/01/2025 | | | 285,000 | 294,084 |
| Trustees of the University of Pennsylvania, 2.396%, 10/01/2050 | | | 2,127,000 | 2,089,050 |
| | | | | $8,960,409 |
| Insurance - Health – 0.1% |
| UnitedHealth Group, Inc., 2.3%, 5/15/2031 | | $ | 143,000 | $ 148,084 |
| UnitedHealth Group, Inc., 4.625%, 7/15/2035 | | | 2,782,000 | 3,537,645 |
| UnitedHealth Group, Inc., 3.25%, 5/15/2051 | | | 477,000 | 522,574 |
| | | | | $4,208,303 |
| Insurance - Property & Casualty – 0.2% |
| Aon Corp./Aon Global Holdings PLC, 2.05%, 8/23/2031 | | $ | 1,593,000 | $ 1,585,384 |
| Fairfax Financial Holdings Ltd., 4.625%, 4/29/2030 | | | 1,100,000 | 1,261,390 |
| Fairfax Financial Holdings Ltd., 3.375%, 3/03/2031 (n) | | | 536,000 | 565,579 |
| Hartford Financial Services Group, Inc., 3.6%, 8/19/2049 | | | 1,318,000 | 1,480,539 |
| Progressive Corp., 4.125%, 4/15/2047 | | | 1,427,000 | 1,784,054 |
| Willis North America, Inc., 3.875%, 9/15/2049 | | | 1,818,000 | 2,053,565 |
| | | | | $8,730,511 |
| International Market Sovereign – 0.1% |
| Government of Bermuda, 2.375%, 8/20/2030 (n) | | $ | 1,818,000 | $ 1,824,817 |
| Government of Bermuda, 3.375%, 8/20/2050 (n) | | | 1,290,000 | 1,345,857 |
| | | | | $3,170,674 |
| Internet – 0.0% |
| XP, Inc., 3.25%, 7/01/2026 (n) | | $ | 1,819,000 | $ 1,776,072 |
| Machinery & Tools – 0.1% |
| CNH Industrial Capital LLC, 3.85%, 11/15/2027 | | $ | 3,018,000 | $ 3,365,870 |
Portfolio of Investments (unaudited) – continued
| Issuer | | | Shares/Par | Value ($) |
| Bonds – continued | | | |
| Major Banks – 1.6% |
| Australia and New Zealand Banking Group Ltd., 2.57%, 11/25/2035 (n) | | $ | 982,000 | $ 966,514 |
| Bank of America Corp., 3.366% to 1/23/2025, FLR (LIBOR - 3mo. + 0.81%) to 1/23/2026 | | | 6,364,000 | 6,836,174 |
| Bank of America Corp., 3.419% to 12/20/2027, FLR (LIBOR - 3mo. + 1.04%) to 12/20/2028 | | | 3,227,000 | 3,544,151 |
| Bank of America Corp., 2.496% to 2/13/2030, FLR (LIBOR - 3mo. + 0.99%) to 2/13/2031 | | | 1,446,000 | 1,486,895 |
| Bank of America Corp., 3.311% to 4/22/2041, FLR (SOFR + 1.58%) to 4/22/2042 | | | 2,255,000 | 2,431,367 |
| Commonwealth Bank of Australia, 3.61% to 9/12/2029, FLR (CMT - 1yr. + 2.05%) to 9/12/2034 (n) | | | 1,818,000 | 1,948,262 |
| Commonwealth Bank of Australia, 3.305%, 3/11/2041 (n) | | | 1,818,000 | 1,885,406 |
| Credit Agricole S.A., 1.247% to 1/26/2026, FLR (SOFR + 0.89162%) to 1/26/2027 (n) | | | 2,273,000 | 2,250,927 |
| Credit Suisse Group AG, 3.091% to 5/14/2031, FLR (SOFR + 1.73%) to 5/14/2032 (n) | | | 2,273,000 | 2,370,917 |
| Goldman Sachs Group, Inc., 2.908%, 7/21/2042 | | | 1,896,000 | 1,915,400 |
| HSBC Holdings PLC, 2.099% to 6/04/2025, FLR (SOFR + 1.929%) to 6/04/2026 | | | 3,637,000 | 3,739,522 |
| HSBC Holdings PLC, 2.357% to 8/18/2030, FLR (SOFR + 1.947%) to 8/18/2031 | | | 4,091,000 | 4,108,895 |
| HSBC Holdings PLC, 5.25%, 3/14/2044 | | | 1,818,000 | 2,409,582 |
| JPMorgan Chase & Co., 3.782% to 2/01/2027, FLR (LIBOR - 3mo. + 1.337%) to 2/01/2028 | | | 5,000,000 | 5,558,174 |
| JPMorgan Chase & Co., 3.109% to 4/22/2040, FLR (SOFR + 2.46%) to 4/22/2041 | | | 909,000 | 957,769 |
| Kasikornbank PLC (Hong Kong Branch), 3.343% to 10/02/2026, FLR (CMT - 5yr. + 1.7%) to 10/02/2031 | | | 1,269,000 | 1,289,388 |
| Morgan Stanley, 3.125%, 7/27/2026 | | | 3,309,000 | 3,590,690 |
| Morgan Stanley, 3.622% to 4/01/2030, FLR (SOFR + 3.12%) to 4/01/2031 | | | 2,782,000 | 3,116,026 |
| Morgan Stanley, 3.217% to 4/22/2041, FLR (SOFR + 1.485%) to 4/22/2042 | | | 1,309,000 | 1,403,281 |
| Oversea-Chinese Banking Corp. Ltd., 1.832% to 9/10/2025, FLR (CMT - 1yr. + 1.58%) to 9/10/2030 (n) | | | 723,000 | 723,983 |
| Sumitomo Mitsui Financial Group, Inc., 1.71%, 1/12/2031 | | | 1,818,000 | 1,770,855 |
| UBS Group AG, 3.491%, 5/23/2023 (n) | | | 829,000 | 847,515 |
| UniCredit S.p.A., 2.569% to 9/22/2025, FLR (CMT - 1yr. + 2.3%) to 9/22/2026 (n) | | | 3,182,000 | 3,240,900 |
| | | | | $58,392,593 |
Portfolio of Investments (unaudited) – continued
| Issuer | | | Shares/Par | Value ($) |
| Bonds – continued | | | |
| Medical & Health Technology & Services – 0.5% |
| Alcon Finance Corp., 2.75%, 9/23/2026 (n) | | $ | 1,818,000 | $ 1,927,107 |
| Alcon, Inc., 2.6%, 5/27/2030 (n) | | | 1,818,000 | 1,877,045 |
| Becton, Dickinson and Co., 2.823%, 5/20/2030 | | | 3,182,000 | 3,369,091 |
| HCA, Inc., 5.125%, 6/15/2039 | | | 1,600,000 | 2,015,357 |
| Montefiore Obligated Group, AGM, 5.246%, 11/01/2048 | | | 3,192,000 | 4,186,855 |
| ProMedica Toledo Hospital, “B”, AGM, 5.325%, 11/15/2028 | | | 1,721,000 | 2,059,827 |
| Thermo Fisher Scientific, Inc., 2.8%, 10/15/2041 | | | 1,407,000 | 1,437,746 |
| | | | | $16,873,028 |
| Medical Equipment – 0.1% |
| Boston Scientific Corp., 3.75%, 3/01/2026 | | $ | 764,000 | $ 846,189 |
| Danaher Corp., 2.6%, 10/01/2050 | | | 2,027,000 | 1,979,506 |
| | | | | $2,825,695 |
| Metals & Mining – 0.2% |
| Anglo American Capital PLC, 2.875%, 3/17/2031 (n) | | $ | 2,616,000 | $ 2,693,190 |
| First Quantum Minerals Ltd., 6.875%, 10/15/2027 (n) | | | 1,802,000 | 1,950,665 |
| Glencore Funding LLC, 2.5%, 9/01/2030 (n) | | | 909,000 | 907,082 |
| Glencore Funding LLC, 2.85%, 4/27/2031 (n) | | | 918,000 | 939,466 |
| Petra Diamonds US$ Treasury PLC, 10.5%,(0% cash or 10.5% PIK) 3/08/2026 (n)(p) | | | 1,453,584 | 1,437,776 |
| | | | | $7,928,179 |
| Midstream – 0.6% |
| Cheniere Corpus Christi Holdings LLC, 3.7%, 11/15/2029 | | $ | 822,000 | $ 901,728 |
| Energy Transfer LP, 3.75%, 5/15/2030 | | | 473,000 | 513,569 |
| Energy Transfer Partners LP, 5.15%, 3/15/2045 | | | 1,364,000 | 1,583,110 |
| Enterprise Products Operating LLC, 3.7%, 1/31/2051 | | | 840,000 | 910,199 |
| Galaxy Pipeline Assets Bidco Ltd., 1.75%, 9/30/2027 (n) | | | 2,000,000 | 2,031,429 |
| Galaxy Pipeline Assets Bidco Ltd., 2.625%, 3/31/2036 (n) | | | 2,156,000 | 2,153,754 |
| Galaxy Pipeline Assets Bidco Ltd., 2.94%, 9/30/2040 (n) | | | 1,779,000 | 1,806,900 |
| Galaxy Pipeline Assets Bidco Ltd., 3.25%, 9/30/2040 (n) | | | 1,589,000 | 1,631,585 |
| MPLX LP, 4.5%, 4/15/2038 | | | 1,655,000 | 1,892,801 |
| Plains All American Pipeline LP/PAA Finance Corp., 3.55%, 12/15/2029 | | | 1,827,000 | 1,935,190 |
| Plains All American Pipeline LP/PAA Finance Corp., 4.3%, 1/31/2043 | | | 1,364,000 | 1,374,132 |
| Sabine Pass Liquefaction LLC, 4.2%, 3/15/2028 | | | 3,055,000 | 3,432,207 |
| Sabine Pass Liquefaction LLC, 4.5%, 5/15/2030 | | | 927,000 | 1,073,805 |
| | | | | $21,240,409 |
Portfolio of Investments (unaudited) – continued
| Issuer | | | Shares/Par | Value ($) |
| Bonds – continued | | | |
| Mortgage-Backed – 3.1% | |
| Fannie Mae, 4.5%, 1/01/2023 - 11/01/2042 | | $ | 2,004,367 | $ 2,231,397 |
| Fannie Mae, 5%, 7/01/2023 - 3/01/2042 | | | 4,152,576 | 4,740,143 |
| Fannie Mae, 3.5%, 5/25/2025 - 5/01/2049 | | | 4,340,824 | 4,664,291 |
| Fannie Mae, 3%, 11/01/2028 - 9/01/2046 | | | 7,362,036 | 7,799,009 |
| Fannie Mae, 2.5%, 11/01/2031 - 10/01/2046 | | | 758,506 | 791,558 |
| Fannie Mae, 3.5%, 12/25/2031 - 2/25/2036 (i) | | | 709,940 | 74,162 |
| Fannie Mae, 6.5%, 1/01/2033 - 10/01/2037 | | | 51,206 | 58,307 |
| Fannie Mae, 3%, 2/25/2033 (i) | | | 855,847 | 83,923 |
| Fannie Mae, 5.5%, 5/01/2033 - 5/01/2044 | | | 3,602,668 | 4,175,925 |
| Fannie Mae, 6%, 8/01/2034 - 6/01/2038 | | | 192,797 | 225,529 |
| Fannie Mae, 4%, 9/01/2040 - 7/01/2043 | | | 4,761,269 | 5,240,477 |
| Fannie Mae, 2%, 10/25/2040 - 5/25/2044 | | | 536,054 | 540,855 |
| Fannie Mae, UMBS, 5.5%, 5/01/2044 | | | 585,890 | 679,601 |
| Fannie Mae, UMBS, 2.5%, 2/01/2050 - 7/01/2050 | | | 3,571,907 | 3,745,363 |
| Fannie Mae, UMBS, 2%, 1/01/2051 - 2/01/2051 | | | 1,338,404 | 1,365,024 |
| Freddie Mac, 5%, 4/01/2023 - 12/01/2044 | | | 1,925,700 | 2,194,640 |
| Freddie Mac, 1.017%, 4/25/2024 (i) | | | 17,683,079 | 318,759 |
| Freddie Mac, 0.732%, 7/25/2024 (i) | | | 24,071,609 | 302,515 |
| Freddie Mac, 4.5%, 9/01/2024 - 5/01/2042 | | | 1,214,329 | 1,357,074 |
| Freddie Mac, 4%, 7/01/2025 - 4/01/2044 | | | 1,380,372 | 1,521,866 |
| Freddie Mac, 3.5%, 1/15/2027 - 10/25/2058 | | | 4,800,132 | 5,210,131 |
| Freddie Mac, 1.481%, 3/25/2027 (i) | | | 2,188,000 | 155,708 |
| Freddie Mac, 0.711%, 7/25/2027 (i) | | | 45,363,129 | 1,416,368 |
| Freddie Mac, 0.562%, 8/25/2027 (i) | | | 34,428,417 | 828,561 |
| Freddie Mac, 0.427%, 1/25/2028 (i) | | | 63,799,973 | 1,212,091 |
| Freddie Mac, 0.434%, 1/25/2028 (i) | | | 26,301,096 | 513,971 |
| Freddie Mac, 0.269%, 2/25/2028 (i) | | | 78,646,610 | 784,681 |
| Freddie Mac, 2.5%, 3/15/2028 | | | 277,614 | 282,750 |
| Freddie Mac, 0.262%, 4/25/2028 (i) | | | 50,520,625 | 470,418 |
| Freddie Mac, 3%, 6/15/2028 - 3/01/2047 | | | 6,493,128 | 6,898,904 |
| Freddie Mac, 1.218%, 7/25/2029 (i) | | | 8,111,911 | 629,354 |
| Freddie Mac, 1.268%, 8/25/2029 (i) | | | 14,242,054 | 1,158,654 |
| Freddie Mac, 1.915%, 4/25/2030 (i) | | | 3,344,437 | 477,720 |
| Freddie Mac, 1.984%, 4/25/2030 (i) | | | 8,166,315 | 1,213,296 |
| Freddie Mac, 1.765%, 5/25/2030 (i) | | | 4,373,949 | 585,205 |
| Freddie Mac, 1.906%, 5/25/2030 (i) | | | 9,928,903 | 1,429,756 |
| Freddie Mac, 5.5%, 6/01/2030 - 9/01/2041 | | | 1,178,385 | 1,369,291 |
| Freddie Mac, 1.436%, 6/25/2030 (i) | | | 3,957,955 | 431,246 |
| Freddie Mac, 1.704%, 8/25/2030 (i) | | | 3,506,241 | 460,651 |
| Freddie Mac, 1.263%, 9/25/2030 (i) | | | 2,193,674 | 215,568 |
| Freddie Mac, 0.423%, 1/25/2031 (i) | | | 12,741,258 | 347,785 |
| Freddie Mac, 0.874%, 1/25/2031 (i) | | | 4,987,462 | 343,543 |
| Freddie Mac, 6%, 8/01/2034 - 10/01/2038 | | | 228,425 | 269,510 |
Portfolio of Investments (unaudited) – continued
| Issuer | | | Shares/Par | Value ($) |
| Bonds – continued | | | |
| Mortgage-Backed – continued | |
| Freddie Mac, 5.5%, 2/15/2036 (i) | | $ | 212,228 | $ 38,909 |
| Freddie Mac, 6.5%, 5/01/2037 | | | 8,416 | 9,825 |
| Freddie Mac, 4.5%, 12/15/2040 (i) | | | 79,729 | 7,682 |
| Freddie Mac, UMBS, 2.5%, 8/01/2040 | | | 298,286 | 315,408 |
| Freddie Mac, UMBS, 3%, 2/01/2050 - 6/01/2050 | | | 1,486,116 | 1,571,941 |
| Ginnie Mae, 5.5%, 5/15/2033 - 1/20/2042 | | | 175,386 | 204,190 |
| Ginnie Mae, 4.5%, 7/20/2033 - 9/20/2041 | | | 2,796,083 | 3,109,798 |
| Ginnie Mae, 5.698%, 8/20/2034 | | | 589,913 | 673,231 |
| Ginnie Mae, 4%, 5/16/2039 - 7/20/2049 | | | 1,903,810 | 2,045,348 |
| Ginnie Mae, 3.5%, 10/20/2041 (i) | | | 343,953 | 24,768 |
| Ginnie Mae, 3.5%, 12/15/2041 - 4/20/2047 | | | 4,085,987 | 4,401,510 |
| Ginnie Mae, 2.5%, 6/20/2042 - 8/20/2051 | | | 4,647,365 | 4,824,504 |
| Ginnie Mae, 4%, 8/16/2042 (i) | | | 378,060 | 49,923 |
| Ginnie Mae, 3%, 4/20/2045 - 9/20/2047 | | | 3,330,725 | 3,518,752 |
| Ginnie Mae, 5.87%, 4/20/2058 | | | 1,763 | 2,027 |
| Ginnie Mae, 0.558%, 2/16/2059 (i) | | | 1,433,920 | 61,362 |
| Ginnie Mae, TBA, 2.5%, 2/20/2051 - 10/15/2051 | | | 125,000 | 129,390 |
| Ginnie Mae, TBA, 3.5%, 9/15/2051 | | | 1,700,000 | 1,789,117 |
| Ginnie Mae, TBA, 2%, 9/21/2051 | | | 1,425,000 | 1,454,558 |
| UMBS, TBA, 2.5%, 9/14/2051 - 10/25/2051 | | | 3,780,000 | 3,925,153 |
| UMBS, TBA, 2%, 9/25/2051 - 10/14/2051 | | | 14,100,000 | 14,266,487 |
| UMBS, TBA, 3%, 9/25/2051 | | | 1,825,000 | 1,909,050 |
| | | | | $113,148,513 |
| Municipals – 0.1% |
| Massachusetts Educational Financing Authority, Education Loan Rev., “A”, 2.562%, 7/01/2026 | | $ | 55,000 | $ 57,666 |
| Massachusetts Educational Financing Authority, Education Loan Rev., “A”, 2.682%, 7/01/2027 | | | 255,000 | 267,749 |
| Michigan Finance Authority Tobacco Settlement Asset-Backed Rev. (2006 Sold Tobacco Receipts), “A-1”, 2.326%, 6/01/2030 | | | 599,796 | 624,542 |
| Philadelphia, PA, School District, “A”, AGM, 5.995%, 9/01/2030 | | | 1,210,000 | 1,587,074 |
| State of Florida, “A”, 2.154%, 7/01/2030 | | | 936,000 | 960,283 |
| Texas Transportation Commission, Central Texas Turnpike System First Tier Refunding Rev., Taxable, “B”, 1.98%, 8/15/2042 | | | 1,355,000 | 1,373,448 |
| West Virginia Tobacco Settlement Financing Authority Asset-Backed Refunding, “A-1”, 1.497%, 6/01/2024 | | | 210,000 | 212,872 |
| West Virginia Tobacco Settlement Financing Authority Asset-Backed Refunding, “A-1”, 1.647%, 6/01/2025 | | | 175,000 | 177,287 |
| | | | | $5,260,921 |
Portfolio of Investments (unaudited) – continued
| Issuer | | | Shares/Par | Value ($) |
| Bonds – continued | | | |
| Natural Gas - Distribution – 0.2% |
| ENN Clean Energy International Investment Ltd., 3.375%, 5/12/2026 (n) | | $ | 1,893,000 | $ 1,922,683 |
| Infraestructura Energética Nova S.A.B. de C.V., 4.875%, 1/14/2048 | | | 2,466,000 | 2,576,970 |
| NiSource, Inc., 5.65%, 2/01/2045 | | | 773,000 | 1,083,786 |
| | | | | $5,583,439 |
| Network & Telecom – 0.2% |
| AT&T, Inc., 2.75%, 6/01/2031 | | $ | 3,309,000 | $ 3,467,476 |
| AT&T, Inc., 3.3%, 2/01/2052 | | | 1,682,000 | 1,674,904 |
| AT&T, Inc., 3.55%, 9/15/2055 (n) | | | 519,000 | 531,066 |
| Verizon Communications, Inc., 2.1%, 3/22/2028 | | | 236,000 | 242,257 |
| Verizon Communications, Inc., 3.15%, 3/22/2030 | | | 427,000 | 463,198 |
| Verizon Communications, Inc., 3.4%, 3/22/2041 | | | 864,000 | 925,681 |
| | | | | $7,304,582 |
| Oil Services – 0.1% |
| Guara Norte S.à r.l., 5.198%, 6/15/2034 (n) | | $ | 1,259,296 | $ 1,296,319 |
| Halliburton Co., 5%, 11/15/2045 | | | 909,000 | 1,092,287 |
| MV24 Capital B.V., 6.748%, 6/01/2034 | | | 1,163,477 | 1,266,457 |
| | | | | $3,655,063 |
| Oils – 0.2% |
| FS Luxembourg S.à r.l., 10%, 12/15/2025 (n) | | $ | 1,740,000 | $ 1,957,517 |
| MC Brazil Downstream Trading S.à r.l., 7.25%, 6/30/2031 (n) | | | 1,553,000 | 1,616,207 |
| Puma International Financing S.A., 5%, 1/24/2026 | | | 2,372,000 | 2,372,000 |
| | | | | $5,945,724 |
| Other Banks & Diversified Financials – 0.7% |
| Banco Continental S.A.E.C.A., 2.75%, 12/10/2025 (n) | | $ | 1,239,000 | $ 1,230,277 |
| Banco GNB Sudameris S.A., 7.5% to 4/16/2026, FLR (CMT - 5yr. + 6.66%) to 4/16/2031 (n) | | | 1,456,000 | 1,493,871 |
| Banco Industrial S. A., 4.875% to 1/29/2026, FLR (CMT - 5yr. + 4.442%) to 1/29/2031 (n) | | | 1,050,000 | 1,081,500 |
| Bank Leumi le-Israel B.M., 3.275% to 1/29/2026, FLR (CMT - 5yr. + 1.631%) to 1/29/2031 (n) | | | 3,963,000 | 4,057,121 |
| BBVA Bancomer S.A./Texas, 5.875%, 9/13/2034 (n) | | | 823,000 | 906,798 |
| BPCE S.A., 1.652% to 10/6/2025, FLR (SOFR + 1.52%) to 10/06/2026 (n) | | | 2,670,000 | 2,684,745 |
| Commercial Bank PSQC, 4.5% to 9/03/2026, FLR (CMT - 5yr. + 3.874%) to 9/03/2169 | | | 1,294,000 | 1,308,557 |
| Grupo Aval Ltd., 4.375%, 2/04/2030 (n) | | | 1,643,000 | 1,638,564 |
Portfolio of Investments (unaudited) – continued
| Issuer | | | Shares/Par | Value ($) |
| Bonds – continued | | | |
| Other Banks & Diversified Financials – continued |
| Mizrahi Tefahot Bank Ltd., 3.077% to 4/07/2026, FLR (CMT - 5yr. + 2.25%) to 4/07/2031 (n) | | $ | 3,279,000 | $ 3,313,495 |
| NBK Tier 1 Financing Ltd., 3.625% to 2/24/2027, FLR (Swap Rate - 6yr. + 2.875%) to 8/24/2169 | | | 1,256,000 | 1,255,030 |
| United Overseas Bank Ltd., 2% to 10/14/2026, FLR (CMT - 5yr. + 1.23%) to 10/14/2031 (n) | | | 1,677,000 | 1,692,191 |
| Uzbek Industrial and Construction Bank, 5.75%, 12/02/2024 | | | 3,783,000 | 3,967,989 |
| | | | | $24,630,138 |
| Personal Computers & Peripherals – 0.1% |
| Equifax, Inc., 3.1%, 5/15/2030 | | $ | 2,237,000 | $ 2,397,084 |
| Equifax, Inc., 2.35%, 9/15/2031 | | | 2,407,000 | 2,423,307 |
| | | | | $4,820,391 |
| Real Estate - Apartment – 0.1% |
| American Homes 4 Rent, L.P., 2.375%, 7/15/2031 | | $ | 1,118,000 | $ 1,122,855 |
| American Homes 4 Rent, L.P., 3.375%, 7/15/2051 | | | 1,114,000 | 1,147,770 |
| Mid-America Apartment Communities, REIT, 1.7%, 2/15/2031 | | | 1,282,000 | 1,234,132 |
| | | | | $3,504,757 |
| Real Estate - Office – 0.1% |
| Corporate Office Property LP, REIT, 2%, 1/15/2029 | | $ | 1,314,000 | $ 1,302,879 |
| Corporate Office Property LP, REIT, 2.75%, 4/15/2031 | | | 1,600,000 | 1,632,779 |
| | | | | $2,935,658 |
| Real Estate - Other – 0.1% |
| Lexington Realty Trust Co., 2.7%, 9/15/2030 | | $ | 1,082,000 | $ 1,111,589 |
| Lexington Realty Trust Co., 2.375%, 10/01/2031 | | | 450,000 | 446,159 |
| Sun Communities, Inc., 2.7%, 7/15/2031 | | | 1,100,000 | 1,120,100 |
| W.P. Carey, Inc., REIT, 2.4%, 2/01/2031 | | | 1,646,000 | 1,653,599 |
| | | | | $4,331,447 |
| Real Estate - Retail – 0.1% |
| Brixmor Operating Partnership LP, REIT, 4.05%, 7/01/2030 | | $ | 1,573,000 | $ 1,780,447 |
| Brixmor Operating Partnership LP, REIT, 2.5%, 8/16/2031 | | | 597,000 | 600,149 |
| National Retail Properties, Inc., REIT, 3.5%, 4/15/2051 | | | 418,000 | 444,687 |
| STORE Capital Corp., REIT, 2.75%, 11/18/2030 | | | 1,909,000 | 1,944,022 |
| VEREIT Operating Partnership LP, REIT, 3.1%, 12/15/2029 | | | 373,000 | 401,414 |
| | | | | $5,170,719 |
Portfolio of Investments (unaudited) – continued
| Issuer | | | Shares/Par | Value ($) |
| Bonds – continued | | | |
| Retailers – 0.3% |
| Alibaba Group Holding Ltd., 2.125%, 2/09/2031 | | $ | 1,975,000 | $ 1,943,083 |
| Alimentation Couche-Tard, Inc., 3.8%, 1/25/2050 (n) | | | 1,621,000 | 1,774,421 |
| Grupo Axo S.A.P.I. de C.V., 5.75%, 6/08/2026 (n) | | | 1,154,000 | 1,175,937 |
| Home Depot, Inc., 3.9%, 6/15/2047 | | | 1,773,000 | 2,132,338 |
| JD.com, Inc., 3.375%, 1/14/2030 | | | 1,160,000 | 1,237,641 |
| Kohl's Corp., 3.375%, 5/01/2031 | | | 1,718,000 | 1,802,594 |
| MercadoLibre, Inc., 2.375%, 1/14/2026 | | | 550,000 | 552,095 |
| MercadoLibre, Inc., 3.125%, 1/14/2031 | | | 507,000 | 500,526 |
| | | | | $11,118,635 |
| Specialty Stores – 0.0% |
| Nordstrom, Inc., 4.25%, 8/01/2031 | | $ | 882,000 | $ 918,002 |
| Nordstrom, Inc., 5%, 1/15/2044 | | | 478,000 | 475,266 |
| | | | | $1,393,268 |
| Supranational – 0.1% |
| Inter-American Development Bank, 4.375%, 1/24/2044 | | $ | 511,000 | $ 718,963 |
| West African Development Bank, 4.7%, 10/22/2031 (n) | | | 1,855,000 | 2,037,532 |
| | | | | $2,756,495 |
| Telecommunications - Wireless – 0.5% |
| American Tower Corp., REIT, 4%, 6/01/2025 | | $ | 2,400,000 | $ 2,636,567 |
| Cellnex Finance Co. S.A., 3.875%, 7/07/2041 (n) | | | 1,304,000 | 1,317,470 |
| Crown Castle International Corp., 4.45%, 2/15/2026 | | | 799,000 | 899,226 |
| Crown Castle International Corp., 3.7%, 6/15/2026 | | | 3,355,000 | 3,694,369 |
| Millicom International Cellular S.A., 4.5%, 4/27/2031 (n) | | | 512,000 | 533,760 |
| Rogers Communications, Inc., 3.7%, 11/15/2049 | | | 1,709,000 | 1,814,282 |
| Telefonica Celular del Paraguay S.A., 5.875%, 4/15/2027 (n) | | | 1,846,000 | 1,940,607 |
| Telefonica Celular del Paraguay S.A., 5.875%, 4/15/2027 | | | 1,203,000 | 1,264,654 |
| T-Mobile USA, Inc., 3.5%, 4/15/2025 | | | 2,182,000 | 2,355,142 |
| VEON Holdings B.V., 4%, 4/09/2025 (n) | | | 1,444,000 | 1,520,965 |
| | | | | $17,977,042 |
| Transportation - Services – 0.3% |
| Adani Ports & Special Economic Zone Ltd., 5%, 8/02/2041 (n) | | $ | 1,694,000 | $ 1,777,565 |
| Aeropuertos Dominicanos Siglo XXI S.A., 6.75%, 3/30/2029 | | | 737,000 | 764,623 |
| Cliffton Ltd., 6.25%, 10/25/2025 (n) | | | 1,732,000 | 1,714,680 |
| Delhi International Airport Ltd., 6.45%, 6/04/2029 (n) | | | 1,600,000 | 1,572,000 |
| ERAC USA Finance LLC, 3.3%, 12/01/2026 | | | 2,463,000 | 2,688,036 |
| Hacienda Investments Ltd. via DME Airport Ltd., 5.35%, 2/08/2028 (n) | | | 1,281,000 | 1,347,046 |
Portfolio of Investments (unaudited) – continued
| Issuer | | | Shares/Par | Value ($) |
| Bonds – continued | | | |
| Transportation - Services – continued |
| ICTSI Treasury B.V., 5.875%, 9/17/2025 | | $ | 1,055,000 | $ 1,234,585 |
| | | | | $11,098,535 |
| U.S. Government Agencies and Equivalents – 0.1% |
| Small Business Administration, 6.07%, 3/01/2022 | | $ | 1,368 | $ 1,379 |
| Small Business Administration, 5.16%, 2/01/2028 | | | 25,894 | 28,322 |
| Small Business Administration, 2.21%, 2/01/2033 | | | 134,864 | 141,122 |
| Small Business Administration, 2.22%, 3/01/2033 | | | 221,819 | 230,341 |
| Small Business Administration, 3.15%, 7/01/2033 | | | 262,448 | 281,955 |
| Small Business Administration, 3.16%, 8/01/2033 | | | 317,565 | 341,163 |
| Small Business Administration, 3.62%, 9/01/2033 | | | 274,559 | 298,449 |
| Tennessee Valley Authority, 0.75%, 5/15/2025 | | | 1,502,000 | 1,515,997 |
| | | | | $2,838,728 |
| U.S. Treasury Obligations – 2.6% |
| U.S. Treasury Bonds, 6.375%, 8/15/2027 | | $ | 106,000 | $ 139,676 |
| U.S. Treasury Bonds, 5.25%, 2/15/2029 | | | 2,965,000 | 3,846,508 |
| U.S. Treasury Bonds, 1.625%, 5/15/2031 | | | 2,940,000 | 3,031,416 |
| U.S. Treasury Bonds, 1.375%, 11/15/2040 | | | 4,091,000 | 3,786,732 |
| U.S. Treasury Bonds, 2.875%, 5/15/2043 | | | 6,853,400 | 8,089,957 |
| U.S. Treasury Bonds, 2.875%, 11/15/2046 (f) | | | 7,328,000 | 8,763,830 |
| U.S. Treasury Notes, 1.75%, 6/15/2022 | | | 11,589,000 | 11,741,106 |
| U.S. Treasury Notes, 0.125%, 9/30/2022 | | | 6,171,000 | 6,173,411 |
| U.S. Treasury Notes, 2.5%, 8/15/2023 | | | 7,225,000 | 7,548,149 |
| U.S. Treasury Notes, 2.75%, 2/15/2024 | | | 7,855,000 | 8,326,607 |
| U.S. Treasury Notes, 2.5%, 5/15/2024 | | | 4,680,000 | 4,952,025 |
| U.S. Treasury Notes, 2.875%, 7/31/2025 | | | 1,948,000 | 2,119,363 |
| U.S. Treasury Notes, 2.25%, 8/15/2027 | | | 8,936,000 | 9,623,304 |
| U.S. Treasury Notes, 2.375%, 5/15/2029 | | | 8,149,500 | 8,889,958 |
| U.S. Treasury Notes, 1.125%, 8/15/2040 | | | 6,301,000 | 5,593,614 |
| | | | | $92,625,656 |
| Utilities - Electric Power – 1.7% |
| Adani Green Energy (UP) Ltd./Prayatna Developers Private Ltd., 6.25%, 12/10/2024 (n) | | $ | 3,526,000 | $ 3,839,461 |
| Adani Transmission Ltd., 4.25%, 5/21/2036 (n) | | | 2,921,875 | 3,023,650 |
| AES Gener S.A., 7.125% to 7/06/2024, FLR (Swap Rate - 5yr. + 4.644%) to 7/06/2029, FLR (Swap Rate - 5yr. + 4.894%) to 7/06/2044, FLR (Swap Rate - 5yr. + 5.644%) to 3/26/2079 | | | 1,802,000 | 1,928,140 |
| AES Gener S.A., 6.35% to 4/07/2025, FLR (CMT - 5yr. + 4.917%) to 4/07/2030, FLR (CMT - 5yr. + 5.167%) to 4/07/2045, FLR (CMT - 5yr. + 5.917%) to 10/07/2079 (n) | | | 1,885,000 | 1,991,503 |
Portfolio of Investments (unaudited) – continued
| Issuer | | | Shares/Par | Value ($) |
| Bonds – continued | | | |
| Utilities - Electric Power – continued |
| AES Panama Generation Holdings SRL, 4.375%, 5/31/2030 (n) | | $ | 1,897,000 | $ 1,971,932 |
| Alabama Power Co., 3.45%, 10/01/2049 | | | 1,609,000 | 1,786,325 |
| American Electric Power Co., Inc., 2.3%, 3/01/2030 | | | 955,000 | 964,174 |
| Azure Power Energy Ltd., 3.575%, 8/19/2026 (n) | | | 1,175,000 | 1,189,688 |
| CenterPoint Energy, Inc., 2.65%, 6/01/2031 | | | 936,000 | 972,076 |
| Clean Renewable Power, 4.25%, 3/25/2027 (n) | | | 1,545,000 | 1,568,175 |
| Dominion Energy, Inc., 2.25%, 8/15/2031 | | | 1,669,000 | 1,685,264 |
| Duke Energy Corp., 3.3%, 6/15/2041 | | | 1,936,000 | 2,009,267 |
| Duke Energy Indiana LLC, 2.75%, 4/01/2050 | | | 691,000 | 676,868 |
| Enel Finance International N.V., 4.875%, 6/14/2029 (n) | | | 2,273,000 | 2,738,428 |
| Energuate Trust, 5.875%, 5/03/2027 | | | 1,613,000 | 1,681,569 |
| EnfraGen Energia Sur S.A., 5.375%, 12/30/2030 (n) | | | 1,426,000 | 1,416,018 |
| ENGIE Energía Chile S.A., 4.5%, 1/29/2025 | | | 1,156,000 | 1,262,224 |
| Evergy, Inc., 2.9%, 9/15/2029 | | | 842,000 | 899,639 |
| FirstEnergy Corp., 2.65%, 3/01/2030 | | | 2,000,000 | 2,035,000 |
| Investment Energy Resources Ltd., 6.25%, 4/26/2029 (n) | | | 1,219,000 | 1,328,710 |
| Jersey Central Power & Light Co., 2.75%, 3/01/2032 (n) | | | 2,671,000 | 2,777,578 |
| Listrindo Capital B.V., 4.95%, 9/14/2026 | | | 1,877,000 | 1,920,171 |
| MidAmerican Energy Co., 3.95%, 8/01/2047 | | | 1,818,000 | 2,183,927 |
| Pacific Gas & Electric Co., 2.5%, 2/01/2031 | | | 1,206,000 | 1,136,204 |
| Pacific Gas & Electric Co., 4.95%, 7/01/2050 | | | 471,000 | 498,537 |
| ReNew Wind Energy AP2/ReNew Power Private Ltd., 4.5%, 7/14/2028 (n) | | | 1,249,000 | 1,279,013 |
| Southern California Edison, 4.5%, 9/01/2040 | | | 454,000 | 525,924 |
| Southern California Edison, 2.95%, 2/01/2051 | | | 478,000 | 436,205 |
| Southern California Edison Co.'s First & Refunding Mortgage Bonds, 3.65%, 2/01/2050 | | | 1,836,000 | 1,870,975 |
| Star Energy Geothermal (Salak-Darajat) B.V., 4.85%, 10/14/2038 (n) | | | 1,119,000 | 1,235,096 |
| TermoCandelaria Power Ltd., 7.875%, 1/30/2029 (n) | | | 2,307,875 | 2,428,946 |
| TerraForm Global Operating LLC, 6.125%, 3/01/2026 (n) | | | 1,536,000 | 1,580,160 |
| Transelec S.A., 3.875%, 1/12/2029 (n) | | | 3,854,000 | 4,186,446 |
| Virginia Electric & Power Co., 2.875%, 7/15/2029 | | | 2,473,000 | 2,665,722 |
| | | | | $59,693,015 |
| Utilities - Water – 0.0% |
| Aegea Finance S.à r.l., 5.75%, 10/10/2024 | | $ | 1,716,000 | $ 1,767,497 |
| Total Bonds (Identified Cost, $1,146,674,954) | | $ 1,189,019,440 |
Portfolio of Investments (unaudited) – continued
| Issuer | | | Shares/Par | Value ($) |
| Convertible Preferred Stocks – 0.2% |
| Medical Equipment – 0.1% | |
| Boston Scientific Corp., 5.5% | | 14,339 | $ 1,722,974 |
| Danaher Corp., 4.75% | | 857 | 1,860,556 |
| | | | | $3,583,530 |
| Utilities - Electric Power – 0.1% | |
| CenterPoint Energy, Inc., 7% | | 83,168 | $ 3,851,510 |
| Total Convertible Preferred Stocks (Identified Cost, $6,448,138) | $ 7,435,040 |
| Preferred Stocks – 0.2% |
| Computer Software - Systems – 0.2% | | | | |
| Samsung Electronics Co. Ltd. (Identified Cost, $5,506,462) | | 109,887 | $ 6,710,078 |
| Investment Companies (h) – 26.9% |
| Bond Funds – 24.7% |
| MFS High Yield Pooled Portfolio (v) | | | 95,517,726 | $ 889,270,032 |
| Money Market Funds – 2.2% | |
| MFS Institutional Money Market Portfolio, 0.04% (v) | | | 79,460,143 | $ 79,460,143 |
| Total Investment Companies (Identified Cost, $895,814,091) | $ 968,730,175 |
| Collateral for Securities Loaned – 0.0% |
| JPMorgan U.S. Government Money Market Fund, 0.03% (j) (Identified Cost, $2,631,477) | | | 2,631,477 | $ 2,631,477 |
|
|
| Other Assets, Less Liabilities – (0.3)% | | (11,786,138) |
| Net Assets – 100.0% | $3,603,809,320 |
| (a) | Non-income producing security. | | | |
| (f) | All or a portion of the security has been segregated as collateral for open futures contracts. | | | |
| (h) | An affiliated issuer, which may be considered one in which the fund owns 5% or more of the outstanding voting securities, or a company which is under common control. At period end, the aggregate values of the fund's investments in affiliated issuers and in unaffiliated issuers were $968,730,175 and $2,646,865,283, respectively. | | | |
| (i) | Interest only security for which the fund receives interest on notional principal (Par amount). Par amount shown is the notional principal and does not reflect the cost of the security. | | | |
| (j) | The rate quoted is the annualized seven-day yield of the fund at period end. | | | |
| (l) | A portion of this security is on loan. See Note 2 for additional information. | | | |
| (n) | Securities exempt from registration under Rule 144A of the Securities Act of 1933. These securities may be sold in the ordinary course of business in transactions exempt from registration, normally to qualified institutional buyers. At period end, the aggregate value of these securities was $400,984,390, representing 11.1% of net assets. | | | |
| (p) | Payment-in-kind (PIK) security for which interest income may be received in additional securities and/or cash. | | | |
Portfolio of Investments (unaudited) – continued
| (v) | Affiliated issuer that is available only to investment companies managed by MFS. The rate quoted for the MFS Institutional Money Market Portfolio is the annualized seven-day yield of the fund at period end. | | | |
| The following abbreviations are used in this report and are defined: |
| ADR | American Depositary Receipt |
| AGM | Assured Guaranty Municipal |
| CLO | Collateralized Loan Obligation |
| CMT | Constant Maturity Treasury |
| FLR | Floating Rate. Interest rate resets periodically based on the parenthetically disclosed reference rate plus a spread (if any). The period-end rate reported may not be the current rate. All reference rates are USD unless otherwise noted. |
| IEU | International Equity Unit |
| LIBOR | London Interbank Offered Rate |
| PCL | Public Company Limited |
| REIT | Real Estate Investment Trust |
| SOFR | Secured Overnight Financing Rate |
| TBA | To Be Announced |
| UMBS | Uniform Mortgage-Backed Security |
| Abbreviations indicate amounts shown in currencies other than the U.S. dollar. All amounts are stated in U.S. dollars unless otherwise indicated. A list of abbreviations is shown below: |
| BRL | Brazilian Real |
| CLP | Chilean Peso |
| CNH | Chinese Yuan Renminbi (Offshore) |
| COP | Colombian Peso |
| EGP | Egypt Pound |
| EUR | Euro |
| HUF | Hungarian Forint |
| IDR | Indonesian Rupiah |
| INR | Indian Rupee |
| KRW | South Korean Won |
| MXN | Mexican Peso |
| MYR | Malaysian Ringgit |
| RUB | Russian Ruble |
| UYU | Uruguayan Peso |
| ZAR | South African Rand |
Derivative Contracts at 8/31/21
| Forward Foreign Currency Exchange Contracts |
Currency
Purchased | Currency
Sold | Counterparty | Settlement
Date | Unrealized
Appreciation
(Depreciation) |
| Asset Derivatives |
| CNH | 19,359,000 | USD | 2,969,404 | HSBC Bank | 10/08/2021 | $19,985 |
| COP | 11,727,389,450 | USD | 3,075,633 | Goldman Sachs International | 9/07/2021 | 35,010 |
| EUR | 1,299,833 | USD | 1,528,622 | Citibank N.A. | 10/08/2021 | 7,299 |
| HUF | 384,285,000 | USD | 1,269,676 | Merrill Lynch International | 10/08/2021 | 29,239 |
| IDR | 1,754,095,589 | USD | 119,595 | Barclays Bank PLC | 9/22/2021 | 3,176 |
| IDR | 21,132,328,000 | USD | 1,450,400 | JPMorgan Chase Bank N.A. | 9/22/2021 | 28,673 |
| INR | 92,718,024 | USD | 1,236,900 | Barclays Bank PLC | 9/30/2021 | 29,492 |
Portfolio of Investments (unaudited) – continued
| Forward Foreign Currency Exchange Contracts - continued |
Currency
Purchased | Currency
Sold | Counterparty | Settlement
Date | Unrealized
Appreciation
(Depreciation) |
| Asset Derivatives - continued |
| MXN | 32,724,842 | USD | 1,615,283 | Merrill Lynch International | 10/08/2021 | $5,915 |
| USD | 1,215,946 | CLP | 924,265,000 | Goldman Sachs International | 9/27/2021 | 22,783 |
| USD | 57,166,321 | EUR | 48,331,105 | Goldman Sachs International | 10/08/2021 | 56,837 |
| USD | 1,844,344 | EUR | 1,555,222 | JPMorgan Chase Bank N.A. | 10/08/2021 | 6,647 |
| | | | | | | $245,056 |
| Liability Derivatives |
| BRL | 5,402,829 | USD | 1,044,287 | Barclays Bank PLC | 10/04/2021 | $(4,112) |
| CLP | 519,188,000 | USD | 704,936 | Goldman Sachs International | 9/27/2021 | (34,699) |
| CLP | 1,426,361,000 | USD | 1,978,364 | Morgan Stanley Capital Services, Inc. | 9/27/2021 | (137,029) |
| EUR | 1,887,000 | USD | 2,245,398 | Deutsche Bank AG | 10/08/2021 | (15,662) |
| EUR | 1,358,159 | USD | 1,605,428 | JPMorgan Chase Bank N.A. | 10/08/2021 | (587) |
| KRW | 4,431,487,000 | USD | 3,935,461 | JPMorgan Chase Bank N.A. | 9/29/2021 | (114,749) |
| MYR | 4,793,791 | USD | 1,161,146 | Barclays Bank PLC | 9/13/2021 | (8,559) |
| RUB | 95,372,000 | USD | 1,296,910 | Goldman Sachs International | 9/27/2021 | (209) |
| ZAR | 23,543,000 | USD | 1,615,375 | State Street Bank Corp. | 10/08/2021 | (2,771) |
| USD | 1,912,263 | BRL | 10,256,000 | Citibank N.A. | 10/04/2021 | (62,268) |
| USD | 2,966,078 | CNH | 19,359,000 | Brown Brothers Harriman | 10/08/2021 | (23,310) |
| USD | 3,060,272 | COP | 11,727,389,450 | Goldman Sachs International | 12/01/2021 | (35,333) |
| USD | 3,091,353 | COP | 11,727,389,450 | JPMorgan Chase Bank N.A. | 9/07/2021 | (19,290) |
| USD | 433,148 | EUR | 367,000 | JPMorgan Chase Bank N.A. | 10/08/2021 | (510) |
| USD | 1,551,088 | IDR | 22,644,179,000 | Citibank N.A. | 9/22/2021 | (33,801) |
| USD | 2,622,800 | IDR | 37,938,031,000 | Merrill Lynch International | 9/22/2021 | (32,520) |
| USD | 6,314,344 | INR | 475,312,208 | JPMorgan Chase Bank N.A. | 9/30/2021 | (177,723) |
| USD | 6,441,259 | ZAR | 95,230,150 | Deutsche Bank AG | 10/08/2021 | (81,635) |
| | | | | | | $(784,767) |
| Futures Contracts |
| Description | Long/
Short | Currency | Contracts | Notional
Amount | Expiration
Date | Value/Unrealized
Appreciation
(Depreciation) |
| Asset Derivatives |
| Interest Rate Futures | | |
| U.S. Treasury Note 10 yr | Long | USD | 140 | $18,683,438 | December – 2021 | $3,864 |
| U.S. Treasury Note 2 yr | Long | USD | 138 | 30,405,281 | December – 2021 | 23,226 |
| U.S. Treasury Note 5 yr | Long | USD | 99 | 12,248,156 | December – 2021 | 18,563 |
| U.S. Treasury Ultra Bond | Long | USD | 21 | 4,142,906 | December – 2021 | 26,196 |
| | | | | | | $71,849 |
| Liability Derivatives |
| Interest Rate Futures | | |
| U.S. Treasury Bond | Short | USD | 72 | $11,733,750 | December – 2021 | $(26,057) |
Portfolio of Investments (unaudited) – continued
| Futures Contracts - continued |
| Description | Long/
Short | Currency | Contracts | Notional
Amount | Expiration
Date | Value/Unrealized
Appreciation
(Depreciation) |
| Liability Derivatives - continued |
| Interest Rate Futures - continued |
| U.S. Treasury Ultra Note 10 yr | Short | USD | 338 | $50,029,281 | December – 2021 | $(39,366) |
| | | | | | | $(65,423) |
At August 31, 2021, the fund had cash collateral of $320,000 and other liquid securities with an aggregate value of $828,786 to cover any collateral or margin obligations for certain derivative contracts. Restricted cash and/or deposits with brokers in the Statement of Assets and Liabilities are comprised of cash collateral.
See Notes to Financial Statements
Financial Statements
Statement of Assets and Liabilities
At 8/31/21 (unaudited)
This statement represents your fund’s balance sheet, which details the assets and liabilities comprising the total value of the fund.
| Assets | |
| Investments in unaffiliated issuers, at value, including $2,685,433 of securities on loan (identified cost, $2,182,321,492) | $2,646,865,283 |
| Investments in affiliated issuers, at value (identified cost, $895,814,091) | 968,730,175 |
| Cash | 3,759,750 |
| Restricted cash for | |
| Forward foreign currency exchange contracts | 320,000 |
| Receivables for | |
| Forward foreign currency exchange contracts | 245,056 |
| Net daily variation margin on open futures contracts | 90,682 |
| Investments sold | 3,822,510 |
| Fund shares sold | 2,486,773 |
| Interest and dividends | 17,722,538 |
| Other assets | 63,652 |
| Total assets | $3,644,106,419 |
| Liabilities | |
| Payables for | |
| Distributions | $732,029 |
| Forward foreign currency exchange contracts | 784,767 |
| Investments purchased | 6,688,026 |
| TBA purchase commitments | 23,472,385 |
| Fund shares reacquired | 4,969,240 |
| Collateral for securities loaned, at value | 2,631,477 |
| Payable to affiliates | |
| Investment adviser | 115,241 |
| Administrative services fee | 2,618 |
| Shareholder servicing costs | 559,719 |
| Distribution and service fees | 46,018 |
| Deferred country tax expense payable | 46,125 |
| Accrued expenses and other liabilities | 249,454 |
| Total liabilities | $40,297,099 |
| Net assets | $3,603,809,320 |
| Net assets consist of | |
| Paid-in capital | $3,070,286,081 |
| Total distributable earnings (loss) | 533,523,239 |
| Net assets | $3,603,809,320 |
| Shares of beneficial interest outstanding | 258,326,828 |
Statement of Assets and Liabilities (unaudited) – continued
| | Net assets | Shares
outstanding | Net asset value
per share (a) |
| Class A | $1,663,497,416 | 119,220,588 | $13.95 |
| Class C | 419,705,322 | 30,098,322 | 13.94 |
| Class I | 1,209,447,828 | 86,708,469 | 13.95 |
| Class R1 | 268,794 | 19,286 | 13.94 |
| Class R2 | 1,909,837 | 136,924 | 13.95 |
| Class R3 | 24,321,440 | 1,742,709 | 13.96 |
| Class R4 | 8,404,999 | 602,219 | 13.96 |
| Class R6 | 276,253,684 | 19,798,311 | 13.95 |
| (a) | Maximum offering price per share was equal to the net asset value per share for all share classes, except for Class A, for which the maximum offering price per share was $14.57 [100 / 95.75 x $13.95]. On sales of $100,000 or more, the maximum offering price of Class A shares is reduced. A contingent deferred sales charge may be imposed on redemptions of Class A and Class C shares. Redemption price per share was equal to the net asset value per share for Classes I, R1, R2, R3, R4, and R6. |
See Notes to Financial Statements
Financial Statements
Statement of Operations
Six months ended 8/31/21 (unaudited)
This statement describes how much your fund earned in investment income and accrued in expenses. It also describes any gains and/or losses generated by fund operations.
| Net investment income (loss) | |
| Income | |
| Dividends | $26,561,902 |
| Dividends from affiliated issuers | 24,836,085 |
| Interest | 21,794,072 |
| Other | 61,457 |
| Income on securities loaned | 7,783 |
| Foreign taxes withheld | (1,145,394) |
| Total investment income | $72,115,905 |
| Expenses | |
| Management fee | $10,711,056 |
| Distribution and service fees | 4,291,724 |
| Shareholder servicing costs | 1,597,382 |
| Administrative services fee | 237,952 |
| Independent Trustees' compensation | 25,966 |
| Custodian fee | 168,629 |
| Shareholder communications | 112,451 |
| Audit and tax fees | 44,432 |
| Legal fees | 13,822 |
| Miscellaneous | 141,570 |
| Total expenses | $17,344,984 |
| Fees paid indirectly | (479) |
| Reduction of expenses by investment adviser and distributor | (224,326) |
| Net expenses | $17,120,179 |
| Net investment income (loss) | $54,995,726 |
Statement of Operations (unaudited) – continued
| Realized and unrealized gain (loss) |
| Realized gain (loss) (identified cost basis) | |
| Unaffiliated issuers | $40,713,026 |
| Affiliated issuers | 475,688 |
| Futures contracts | (208,776) |
| Forward foreign currency exchange contracts | 412,642 |
| Foreign currency | 45,848 |
| Net realized gain (loss) | $41,438,428 |
| Change in unrealized appreciation or depreciation | |
| Unaffiliated issuers (net of $46,125 increase in deferred country tax) | $157,541,274 |
| Affiliated issuers | 8,475,180 |
| Futures contracts | (97,943) |
| Forward foreign currency exchange contracts | (1,221,801) |
| Translation of assets and liabilities in foreign currencies | (27,673) |
| Net unrealized gain (loss) | $164,669,037 |
| Net realized and unrealized gain (loss) | $206,107,465 |
| Change in net assets from operations | $261,103,191 |
See Notes to Financial Statements
Financial Statements
Statements of Changes in Net Assets
These statements describe the increases and/or decreases in net assets resulting from operations, any distributions, and any shareholder transactions.
| | Six months ended | Year ended |
| | 8/31/21
(unaudited) | 2/28/21 |
| Change in net assets | | |
| From operations | | |
| Net investment income (loss) | $54,995,726 | $106,181,817 |
| Net realized gain (loss) | 41,438,428 | (18,075,299) |
| Net unrealized gain (loss) | 164,669,037 | 63,447,015 |
| Change in net assets from operations | $261,103,191 | $151,553,533 |
| Total distributions to shareholders | $(49,513,804) | $(106,424,048) |
| Change in net assets from fund share transactions | $(97,896,692) | $(554,489,316) |
| Total change in net assets | $113,692,695 | $(509,359,831) |
| Net assets | | |
| At beginning of period | 3,490,116,625 | 3,999,476,456 |
| At end of period | $3,603,809,320 | $3,490,116,625 |
See Notes to Financial Statements
Financial Statements
Financial Highlights
The financial highlights table is intended to help you understand the fund's financial performance for the semiannual period and the past 5 fiscal years. Certain information reflects financial results for a single fund share. The total returns in the table represent the rate that an investor would have earned (or lost) on an investment in the fund share class (assuming reinvestment of all distributions) held for the entire period.
| Class A | Six months
ended | Year ended |
| | 8/31/21
(unaudited) | 2/28/21 | 2/29/20 | 2/28/19
| 2/28/18 | 2/28/17 |
| Net asset value, beginning of period | $13.14 | $12.86 | $12.35 | $12.10 | $12.28 | $11.22 |
| Income (loss) from investment operations |
| Net investment income (loss) (d) | $0.21 | $0.37 | $0.37 | $0.39 | $0.37 | $0.39 |
| Net realized and unrealized gain (loss) | 0.79 | 0.28 | 0.51 | 0.33 | (0.10) | 1.08 |
| Total from investment operations | $1.00 | $0.65 | $0.88 | $0.72 | $0.27 | $1.47 |
| Less distributions declared to shareholders |
| From net investment income | $(0.18) | $(0.34) | $(0.37) | $(0.39) | $(0.39) | $(0.41) |
| From net realized gain | (0.01) | (0.03) | (0.00)(w) | (0.08) | (0.06) | (0.00)(w) |
| Total distributions declared to shareholders | $(0.19) | $(0.37) | $(0.37) | $(0.47) | $(0.45) | $(0.41) |
| Net asset value, end of period (x) | $13.95 | $13.14 | $12.86 | $12.35 | $12.10 | $12.28 |
| Total return (%) (r)(s)(t)(x) | 7.64(n) | 5.28 | 7.20 | 6.10 | 2.19 | 13.26 |
Ratios (%) (to average net assets)
and Supplemental data: |
| Expenses before expense reductions (f)(h) | 0.99(a) | 0.99 | 0.98 | 0.99 | 0.99 | 1.02 |
| Expenses after expense reductions (f)(h) | 0.97(a) | 0.98 | 0.97 | 0.98 | 0.98 | 1.00 |
| Net investment income (loss) | 3.06(a) | 2.97 | 2.86 | 3.21 | 2.97 | 3.25 |
| Portfolio turnover | 48(n) | 111 | 57 | 36 | 44 | 46 |
| Net assets at end of period (000 omitted) | $1,663,497 | $1,577,032 | $1,540,570 | $1,315,625 | $1,343,257 | $1,321,135 |
See Notes to Financial Statements
Financial Highlights – continued
| Class C | Six months
ended | Year ended |
| | 8/31/21
(unaudited) | 2/28/21 | 2/29/20 | 2/28/19
| 2/28/18 | 2/28/17 |
| Net asset value, beginning of period | $13.14 | $12.85 | $12.35 | $12.09 | $12.28 | $11.22 |
| Income (loss) from investment operations |
| Net investment income (loss) (d) | $0.16 | $0.28 | $0.28 | $0.30 | $0.28 | $0.30 |
| Net realized and unrealized gain (loss) | 0.78 | 0.29 | 0.49 | 0.34 | (0.11) | 1.08 |
| Total from investment operations | $0.94 | $0.57 | $0.77 | $0.64 | $0.17 | $1.38 |
| Less distributions declared to shareholders |
| From net investment income | $(0.13) | $(0.25) | $(0.27) | $(0.30) | $(0.30) | $(0.32) |
| From net realized gain | (0.01) | (0.03) | (0.00)(w) | (0.08) | (0.06) | (0.00)(w) |
| Total distributions declared to shareholders | $(0.14) | $(0.28) | $(0.27) | $(0.38) | $(0.36) | $(0.32) |
| Net asset value, end of period (x) | $13.94 | $13.14 | $12.85 | $12.35 | $12.09 | $12.28 |
| Total return (%) (r)(s)(t)(x) | 7.17(n) | 4.57 | 6.32 | 5.40 | 1.34 | 12.43 |
Ratios (%) (to average net assets)
and Supplemental data: |
| Expenses before expense reductions (f)(h) | 1.74(a) | 1.74 | 1.73 | 1.75 | 1.74 | 1.77 |
| Expenses after expense reductions (f)(h) | 1.72(a) | 1.73 | 1.72 | 1.74 | 1.73 | 1.75 |
| Net investment income (loss) | 2.32(a) | 2.27 | 2.14 | 2.48 | 2.23 | 2.50 |
| Portfolio turnover | 48(n) | 111 | 57 | 36 | 44 | 46 |
| Net assets at end of period (000 omitted) | $419,705 | $456,806 | $724,758 | $756,643 | $931,292 | $1,046,946 |
See Notes to Financial Statements
Financial Highlights – continued
| Class I | Six months
ended | Year ended |
| | 8/31/21
(unaudited) | 2/28/21 | 2/29/20 | 2/28/19
| 2/28/18 | 2/28/17 |
| Net asset value, beginning of period | $13.14 | $12.86 | $12.35 | $12.09 | $12.28 | $11.22 |
| Income (loss) from investment operations |
| Net investment income (loss) (d) | $0.23 | $0.40 | $0.40 | $0.42 | $0.40 | $0.41 |
| Net realized and unrealized gain (loss) | 0.79 | 0.29 | 0.51 | 0.34 | (0.11) | 1.09 |
| Total from investment operations | $1.02 | $0.69 | $0.91 | $0.76 | $0.29 | $1.50 |
| Less distributions declared to shareholders |
| From net investment income | $(0.20) | $(0.38) | $(0.40) | $(0.42) | $(0.42) | $(0.44) |
| From net realized gain | (0.01) | (0.03) | (0.00)(w) | (0.08) | (0.06) | (0.00)(w) |
| Total distributions declared to shareholders | $(0.21) | $(0.41) | $(0.40) | $(0.50) | $(0.48) | $(0.44) |
| Net asset value, end of period (x) | $13.95 | $13.14 | $12.86 | $12.35 | $12.09 | $12.28 |
| Total return (%) (r)(s)(t)(x) | 7.77(n) | 5.54 | 7.46 | 6.45 | 2.36 | 13.54 |
Ratios (%) (to average net assets)
and Supplemental data: |
| Expenses before expense reductions (f)(h) | 0.74(a) | 0.74 | 0.73 | 0.74 | 0.74 | 0.77 |
| Expenses after expense reductions (f)(h) | 0.72(a) | 0.73 | 0.72 | 0.74 | 0.73 | 0.75 |
| Net investment income (loss) | 3.31(a) | 3.24 | 3.11 | 3.47 | 3.23 | 3.44 |
| Portfolio turnover | 48(n) | 111 | 57 | 36 | 44 | 46 |
| Net assets at end of period (000 omitted) | $1,209,448 | $1,156,030 | $1,425,004 | $1,181,300 | $1,371,333 | $1,434,280 |
See Notes to Financial Statements
Financial Highlights – continued
| Class R1 | Six months
ended | Year ended |
| | 8/31/21
(unaudited) | 2/28/21 | 2/29/20 | 2/28/19
| 2/28/18 | 2/28/17 |
| Net asset value, beginning of period | $13.13 | $12.85 | $12.34 | $12.08 | $12.26 | $11.21 |
| Income (loss) from investment operations |
| Net investment income (loss) (d) | $0.16 | $0.28 | $0.27 | $0.31 | $0.28 | $0.31 |
| Net realized and unrealized gain (loss) | 0.79 | 0.28 | 0.51 | 0.33 | (0.10) | 1.06 |
| Total from investment operations | $0.95 | $0.56 | $0.78 | $0.64 | $0.18 | $1.37 |
| Less distributions declared to shareholders |
| From net investment income | $(0.13) | $(0.25) | $(0.27) | $(0.30) | $(0.30) | $(0.32) |
| From net realized gain | (0.01) | (0.03) | (0.00)(w) | (0.08) | (0.06) | (0.00)(w) |
| Total distributions declared to shareholders | $(0.14) | $(0.28) | $(0.27) | $(0.38) | $(0.36) | $(0.32) |
| Net asset value, end of period (x) | $13.94 | $13.13 | $12.85 | $12.34 | $12.08 | $12.26 |
| Total return (%) (r)(s)(t)(x) | 7.25(n) | 4.49 | 6.40 | 5.40 | 1.42 | 12.35 |
Ratios (%) (to average net assets)
and Supplemental data: |
| Expenses before expense reductions (f)(h) | 1.74(a) | 1.74 | 1.73 | 1.75 | 1.75 | 1.77 |
| Expenses after expense reductions (f)(h) | 1.72(a) | 1.73 | 1.72 | 1.74 | 1.74 | 1.75 |
| Net investment income (loss) | 2.31(a) | 2.22 | 2.12 | 2.57 | 2.29 | 2.55 |
| Portfolio turnover | 48(n) | 111 | 57 | 36 | 44 | 46 |
| Net assets at end of period (000 omitted) | $269 | $241 | $214 | $193 | $573 | $938 |
See Notes to Financial Statements
Financial Highlights – continued
| Class R2 | Six months
ended | Year ended |
| | 8/31/21
(unaudited) | 2/28/21 | 2/29/20 | 2/28/19
| 2/28/18 | 2/28/17 |
| Net asset value, beginning of period | $13.14 | $12.86 | $12.35 | $12.09 | $12.28 | $11.22 |
| Income (loss) from investment operations |
| Net investment income (loss) (d) | $0.19 | $0.35 | $0.34 | $0.36 | $0.34 | $0.36 |
| Net realized and unrealized gain (loss) | 0.79 | 0.27 | 0.51 | 0.34 | (0.11) | 1.08 |
| Total from investment operations | $0.98 | $0.62 | $0.85 | $0.70 | $0.23 | $1.44 |
| Less distributions declared to shareholders |
| From net investment income | $(0.16) | $(0.31) | $(0.34) | $(0.36) | $(0.36) | $(0.38) |
| From net realized gain | (0.01) | (0.03) | (0.00)(w) | (0.08) | (0.06) | (0.00)(w) |
| Total distributions declared to shareholders | $(0.17) | $(0.34) | $(0.34) | $(0.44) | $(0.42) | $(0.38) |
| Net asset value, end of period (x) | $13.95 | $13.14 | $12.86 | $12.35 | $12.09 | $12.28 |
| Total return (%) (r)(s)(t)(x) | 7.51(n) | 5.01 | 6.93 | 5.92 | 1.85 | 12.98 |
Ratios (%) (to average net assets)
and Supplemental data: |
| Expenses before expense reductions (f)(h) | 1.24(a) | 1.24 | 1.23 | 1.25 | 1.24 | 1.27 |
| Expenses after expense reductions (f)(h) | 1.22(a) | 1.23 | 1.22 | 1.24 | 1.23 | 1.25 |
| Net investment income (loss) | 2.81(a) | 2.78 | 2.65 | 2.99 | 2.73 | 2.99 |
| Portfolio turnover | 48(n) | 111 | 57 | 36 | 44 | 46 |
| Net assets at end of period (000 omitted) | $1,910 | $1,830 | $3,085 | $3,486 | $4,396 | $4,223 |
See Notes to Financial Statements
Financial Highlights – continued
| Class R3 | Six months
ended | Year ended |
| | 8/31/21
(unaudited) | 2/28/21 | 2/29/20 | 2/28/19
| 2/28/18 | 2/28/17 |
| Net asset value, beginning of period | $13.15 | $12.86 | $12.36 | $12.10 | $12.28 | $11.23 |
| Income (loss) from investment operations |
| Net investment income (loss) (d) | $0.21 | $0.37 | $0.37 | $0.39 | $0.37 | $0.39 |
| Net realized and unrealized gain (loss) | 0.79 | 0.29 | 0.50 | 0.34 | (0.10) | 1.07 |
| Total from investment operations | $1.00 | $0.66 | $0.87 | $0.73 | $0.27 | $1.46 |
| Less distributions declared to shareholders |
| From net investment income | $(0.18) | $(0.34) | $(0.37) | $(0.39) | $(0.39) | $(0.41) |
| From net realized gain | (0.01) | (0.03) | (0.00)(w) | (0.08) | (0.06) | (0.00)(w) |
| Total distributions declared to shareholders | $(0.19) | $(0.37) | $(0.37) | $(0.47) | $(0.45) | $(0.41) |
| Net asset value, end of period (x) | $13.96 | $13.15 | $12.86 | $12.36 | $12.10 | $12.28 |
| Total return (%) (r)(s)(t)(x) | 7.64(n) | 5.36 | 7.11 | 6.18 | 2.19 | 13.16 |
Ratios (%) (to average net assets)
and Supplemental data: |
| Expenses before expense reductions (f)(h) | 0.99(a) | 0.99 | 0.98 | 1.00 | 0.99 | 1.02 |
| Expenses after expense reductions (f)(h) | 0.97(a) | 0.98 | 0.97 | 0.99 | 0.98 | 1.00 |
| Net investment income (loss) | 3.06(a) | 2.98 | 2.86 | 3.21 | 2.97 | 3.24 |
| Portfolio turnover | 48(n) | 111 | 57 | 36 | 44 | 46 |
| Net assets at end of period (000 omitted) | $24,321 | $22,760 | $24,385 | $19,159 | $20,013 | $19,274 |
See Notes to Financial Statements
Financial Highlights – continued
| Class R4 | Six months
ended | Year ended |
| | 8/31/21
(unaudited) | 2/28/21 | 2/29/20 | 2/28/19
| 2/28/18 | 2/28/17 |
| Net asset value, beginning of period | $13.15 | $12.86 | $12.36 | $12.10 | $12.29 | $11.23 |
| Income (loss) from investment operations |
| Net investment income (loss) (d) | $0.23 | $0.41 | $0.41 | $0.41 | $0.40 | $0.42 |
| Net realized and unrealized gain (loss) | 0.79 | 0.29 | 0.49 | 0.35 | (0.10) | 1.08 |
| Total from investment operations | $1.02 | $0.70 | $0.90 | $0.76 | $0.30 | $1.50 |
| Less distributions declared to shareholders |
| From net investment income | $(0.20) | $(0.38) | $(0.40) | $(0.42) | $(0.43) | $(0.44) |
| From net realized gain | (0.01) | (0.03) | (0.00)(w) | (0.08) | (0.06) | (0.00)(w) |
| Total distributions declared to shareholders | $(0.21) | $(0.41) | $(0.40) | $(0.50) | $(0.49) | $(0.44) |
| Net asset value, end of period (x) | $13.96 | $13.15 | $12.86 | $12.36 | $12.10 | $12.29 |
| Total return (%) (r)(s)(t)(x) | 7.77(n) | 5.62 | 7.38 | 6.45 | 2.36 | 13.53 |
Ratios (%) (to average net assets)
and Supplemental data: |
| Expenses before expense reductions (f)(h) | 0.74(a) | 0.74 | 0.73 | 0.74 | 0.74 | 0.77 |
| Expenses after expense reductions (f)(h) | 0.73(a) | 0.73 | 0.72 | 0.73 | 0.73 | 0.75 |
| Net investment income (loss) | 3.32(a) | 3.24 | 3.15 | 3.43 | 3.20 | 3.50 |
| Portfolio turnover | 48(n) | 111 | 57 | 36 | 44 | 46 |
| Net assets at end of period (000 omitted) | $8,405 | $8,626 | $9,783 | $10,063 | $7,915 | $6,179 |
See Notes to Financial Statements
Financial Highlights – continued
| Class R6 | Six months
ended | Year ended |
| | 8/31/21
(unaudited) | 2/28/21 | 2/29/20 | 2/28/19
| 2/28/18 | 2/28/17 |
| Net asset value, beginning of period | $13.14 | $12.86 | $12.35 | $12.10 | $12.28 | $11.22 |
| Income (loss) from investment operations |
| Net investment income (loss) (d) | $0.23 | $0.42 | $0.41 | $0.43 | $0.38 | $0.43 |
| Net realized and unrealized gain (loss) | 0.79 | 0.28 | 0.51 | 0.33 | (0.06)(g) | 1.08 |
| Total from investment operations | $1.02 | $0.70 | $0.92 | $0.76 | $0.32 | $1.51 |
| Less distributions declared to shareholders |
| From net investment income | $(0.20) | $(0.39) | $(0.41) | $(0.43) | $(0.44) | $(0.45) |
| From net realized gain | (0.01) | (0.03) | (0.00)(w) | (0.08) | (0.06) | (0.00)(w) |
| Total distributions declared to shareholders | $(0.21) | $(0.42) | $(0.41) | $(0.51) | $(0.50) | $(0.45) |
| Net asset value, end of period (x) | $13.95 | $13.14 | $12.86 | $12.35 | $12.10 | $12.28 |
| Total return (%) (r)(s)(t)(x) | 7.82(n) | 5.64 | 7.55 | 6.46 | 2.54 | 13.65 |
Ratios (%) (to average net assets)
and Supplemental data: |
| Expenses before expense reductions (f)(h) | 0.65(a) | 0.65 | 0.64 | 0.65 | 0.65 | 0.67 |
| Expenses after expense reductions (f)(h) | 0.64(a) | 0.64 | 0.63 | 0.64 | 0.64 | 0.65 |
| Net investment income (loss) | 3.40(a) | 3.32 | 3.19 | 3.55 | 3.08 | 3.57 |
| Portfolio turnover | 48(n) | 111 | 57 | 36 | 44 | 46 |
| Net assets at end of period (000 omitted) | $276,254 | $266,792 | $271,679 | $218,650 | $214,111 | $15,036 |
| (a) | Annualized. |
| (d) | Per share data is based on average shares outstanding. |
| (f) | Ratios do not reflect reductions from fees paid indirectly, if applicable. |
| (g) | The per share amount varies from the net realized and unrealized gain/loss for the period because of the timing of sales of fund shares and the per share amount of realized and unrealized gains and losses at such time. |
| (h) | In addition to the fees and expenses which the fund bears directly, the fund indirectly bears a pro rata share of the fees and expenses of the underlying affiliated funds in which the fund invests. Accordingly, the expense ratio for the fund reflects only those fees and expenses borne directly by the fund. Because the underlying affiliated funds have varied expense and fee levels and the fund may own different proportions of the underlying affiliated funds at different times, the amount of fees and expenses incurred indirectly by the fund will vary. |
| (n) | Not annualized. |
| (r) | Certain expenses have been reduced without which performance would have been lower. |
| (s) | From time to time the fund may receive proceeds from litigation settlements, without which performance would be lower. |
| (t) | Total returns do not include any applicable sales charges. |
| (w) | Per share amount was less than $0.01. |
| (x) | The net asset values and total returns have been calculated on net assets which include adjustments made in accordance with U.S. generally accepted accounting principles required at period end for financial reporting purposes. |
See Notes to Financial Statements
Notes to Financial Statements
(unaudited)
(1) Business and Organization
MFS Diversified Income Fund (the fund) is a diversified series of MFS Series Trust XIII (the trust). The trust is organized as a Massachusetts business trust and is registered under the Investment Company Act of 1940, as amended, as an open-end management investment company.
The fund is an investment company and accordingly follows the investment company accounting and reporting guidance of the Financial Accounting Standards Board (FASB) Accounting Standards Codification Topic 946 Financial Services - Investment Companies.
(2) Significant Accounting Policies
General — The preparation of financial statements in conformity with U.S. generally accepted accounting principles requires management to make estimates and assumptions that affect the reported amounts of assets and liabilities, and disclosure of contingent assets and liabilities at the date of the financial statements and the reported amounts of increases and decreases in net assets from operations during the reporting period. Actual results could differ from those estimates. In the preparation of these financial statements, management has evaluated subsequent events occurring after the date of the fund’s Statement of Assets and Liabilities through the date that the financial statements were issued.
The fund invests in the MFS High Yield Pooled Portfolio (“High Yield Pooled Portfolio”). MFS does not receive a management fee from the High Yield Pooled Portfolio. The High Yield Pooled Portfolio’s investment objective is to seek total return with an emphasis on high current income, but also considering capital appreciation. The accounting policies of the High Yield Pooled Portfolio are outlined in its shareholder report, which is available without charge by calling 1-800-225-2606 and on the Securities and Exchange Commission (SEC) web site at http://www.sec.gov. The accounting policies detailed in the Significant Accounting Policies note cover both the fund and the High Yield Pooled Portfolio. For purposes of this policy disclosure, “fund” refers to both the fund and the High Yield Pooled Portfolio in which the fund invests. The High Yield Pooled Portfolio’s shareholder report is not covered by this report. The fund and the High Yield Pooled Portfolio invest in high-yield securities rated below investment grade. Investments in below investment grade quality securities can involve a substantially greater risk of default or can already be in default, and their values can decline significantly. Below investment grade quality securities tend to be more sensitive to adverse news about the issuer, or the market or economy in general, than higher quality debt instruments. The fund and the High Yield Pooled Portfolio invest in foreign securities. Investments in foreign securities are vulnerable to the effects of changes in the relative values of the local currency and the U.S. dollar and to the effects of changes in each country’s market, economic, industrial, political, regulatory, geopolitical, environmental, public health, and other conditions. The fund invests a significant amount of its net assets in U.S. and foreign real estate related investments and as a result is subject to certain risks associated with the direct ownership of real estate and the real estate industry in general. These include risks related to general, regional and local economic conditions; difficulties in valuing and disposing of real estate; fluctuations in interest rates and property tax rates, shifts in zoning laws, environmental regulations and other governmental action; cash flow dependency;
Notes to Financial Statements (unaudited) - continued
increased operating expenses; lack of availability of mortgage funds; losses due to natural disasters; overbuilding; losses due to casualty or condemnation; changes in property values and rental rates; the management skill and creditworthiness of the manager; and other factors. The fund invests in emerging market issuers. Investments in emerging markets can involve additional and greater risks than the risks associated with investments in developed foreign markets. Emerging markets can have less developed markets, greater custody and operational risk, less developed legal, regulatory, accounting, and auditing systems, and greater political, social, and economic instability than developed markets.
Certain of the fund's investments, including its investments in derivatives, as well as any debt issued by the fund and other contractual arrangements of the fund may be based on reference interest rates such as the London Interbank Offered Rate (“LIBOR”). In 2017, the regulatory authority that oversees financial services firms in the United Kingdom announced plans to transition away from LIBOR by the end of 2021. In March 2021, the administrator of LIBOR announced the extension of the publication of the more commonly used U.S. dollar LIBOR settings to the end of June 2023. Although the full impacts of the transition away from LIBOR are not fully known, the transition may result in, among other things, an increase in volatility or illiquidity of the markets for instruments that currently rely on LIBOR to determine interest rates and this could have an adverse impact on the fund's performance. With respect to the fund's accounting for investments, including its investments in derivatives, as well as any debt issued by the fund and other contractual arrangements of the fund that undergo reference rate-related modifications as a result of the transition, management will rely upon the relief provided by FASB Codification Topic 848 – Reference Rate Reform (Topic 848). The guidance in Topic 848 permits the fund to disregard the GAAP accounting requirements around certain contract modifications resulting from the LIBOR transition such that for contracts considered in scope, the fund can account for those modified contracts as a continuation of the existing contracts.
Balance Sheet Offsetting — The fund's accounting policy with respect to balance sheet offsetting is that, absent an event of default by the counterparty or a termination of the agreement, the International Swaps and Derivatives Association (ISDA) Master Agreement, or similar agreement, does not result in an offset of reported amounts of financial assets and financial liabilities in the Statement of Assets and Liabilities across transactions between the fund and the applicable counterparty. The fund's right to setoff may be restricted or prohibited by the bankruptcy or insolvency laws of the particular jurisdiction to which a specific master netting agreement counterparty is subject. Balance sheet offsetting disclosures, to the extent applicable to the fund, have been included in the fund’s Significant Accounting Policies note under the captions for each of the fund’s in-scope financial instruments and transactions.
Investment Valuations — The investments of the fund and the High Yield Pooled Portfolio are valued as described below.
Equity securities, including restricted equity securities, are generally valued at the last sale or official closing price on their primary market or exchange as provided by a third-party pricing service. Equity securities, for which there were no sales reported that day, are generally valued at the last quoted daily bid quotation on their primary market or exchange as provided by a third-party pricing service. Debt instruments and floating rate loans, including restricted debt instruments, are generally valued at an evaluated or composite bid as provided by a third-party pricing service. Short-term instruments
Notes to Financial Statements (unaudited) - continued
with a maturity at issuance of 60 days or less may be valued at amortized cost, which approximates market value. Exchange-traded options are generally valued at the last sale or official closing price on their primary exchange as provided by a third-party pricing service. Exchange-traded options for which there were no sales reported that day are generally valued at the last daily bid quotation on their primary exchange as provided by a third-party pricing service. For put options, the position may be valued at the last daily ask quotation if there are no trades reported during the day. Options not traded on an exchange are generally valued at a broker/dealer bid quotation. Foreign currency options are generally valued at valuations provided by a third-party pricing service. Futures contracts are generally valued at last posted settlement price on their primary exchange as provided by a third-party pricing service. Futures contracts for which there were no trades that day for a particular position are generally valued at the closing bid quotation on their primary exchange as provided by a third-party pricing service. Forward foreign currency exchange contracts are generally valued at the mean of bid and asked prices for the time period interpolated from rates provided by a third-party pricing service for proximate time periods. Open-end investment companies are generally valued at net asset value per share. Securities and other assets generally valued on the basis of information from a third-party pricing service may also be valued at a broker/dealer bid quotation. In determining values, third-party pricing services can utilize both transaction data and market information such as yield, quality, coupon rate, maturity, type of issue, trading characteristics, and other market data. The values of foreign securities and other assets and liabilities expressed in foreign currencies are converted to U.S. dollars using the mean of bid and asked prices for rates provided by a third-party pricing service.
The Board of Trustees has delegated primary responsibility for determining or causing to be determined the value of the fund’s investments (including any fair valuation) to the adviser pursuant to valuation policies and procedures approved by the Board. If the adviser determines that reliable market quotations are not readily available, investments are valued at fair value as determined in good faith by the adviser in accordance with such procedures under the oversight of the Board of Trustees. Under the fund’s valuation policies and procedures, market quotations are not considered to be readily available for most types of debt instruments and floating rate loans and many types of derivatives. These investments are generally valued at fair value based on information from third-party pricing services. In addition, investments may be valued at fair value if the adviser determines that an investment’s value has been materially affected by events occurring after the close of the exchange or market on which the investment is principally traded (such as foreign exchange or market) and prior to the determination of the fund’s net asset value, or after the halt of trading of a specific security where trading does not resume prior to the close of the exchange or market on which the security is principally traded. Events that occur after foreign markets close (such as developments in foreign markets and significant movements in the U.S. markets) and prior to the determination of the fund’s net asset value may be deemed to have a material effect on the value of securities traded in foreign markets. Accordingly, the fund’s foreign equity securities may often be valued at fair value. The adviser generally relies on third-party pricing services or other information (such as the correlation with price movements of similar securities in the same or other markets; the type, cost and investment characteristics of the security; the business and financial condition of the issuer; and trading and other market data) to assist in determining whether to fair value and at what value to fair value an investment. The value of an investment for
Notes to Financial Statements (unaudited) - continued
purposes of calculating the fund’s net asset value can differ depending on the source and method used to determine value. When fair valuation is used, the value of an investment used to determine the fund’s net asset value may differ from quoted or published prices for the same investment. There can be no assurance that the fund could obtain the fair value assigned to an investment if it were to sell the investment at the same time at which the fund determines its net asset value per share.
Various inputs are used in determining the value of the fund's assets or liabilities. These inputs are categorized into three broad levels. In certain cases, the inputs used to measure fair value may fall into different levels of the fair value hierarchy. In such cases, an investment's level within the fair value hierarchy is based on the lowest level of input that is significant to the fair value measurement. The fund's assessment of the significance of a particular input to the fair value measurement in its entirety requires judgment, and considers factors specific to the investment. Level 1 includes unadjusted quoted prices in active markets for identical assets or liabilities. Level 2 includes other significant observable market-based inputs (including quoted prices for similar securities, interest rates, prepayment speed, and credit risk). Level 3 includes unobservable inputs, which may include the adviser's own assumptions in determining the fair value of investments. Other financial instruments are derivative instruments, such as futures contracts and forward foreign currency exchange contracts. The following is a summary of the levels used as of August 31, 2021 in valuing the fund's assets or liabilities:
Notes to Financial Statements (unaudited) - continued
| Financial Instruments | Level 1 | Level 2 | Level 3 | Total |
| Equity Securities: | | | | |
| United States | $983,722,516 | $— | $— | $983,722,516 |
| Switzerland | 67,974,119 | — | — | 67,974,119 |
| Japan | 65,449,716 | — | — | 65,449,716 |
| United Kingdom | 57,135,309 | — | — | 57,135,309 |
| Canada | 36,240,229 | — | — | 36,240,229 |
| France | 32,934,209 | — | — | 32,934,209 |
| Taiwan | 32,772,836 | — | — | 32,772,836 |
| South Korea | 31,412,958 | — | — | 31,412,958 |
| China | 30,020,867 | — | — | 30,020,867 |
| Other Countries | 110,051,803 | 7,499,804 | — | 117,551,607 |
| U.S. Treasury Bonds & U.S. Government Agencies & Equivalents | — | 95,464,384 | — | 95,464,384 |
| Non - U.S. Sovereign Debt | — | 437,296,144 | — | 437,296,144 |
| Municipal Bonds | — | 5,260,921 | — | 5,260,921 |
| U.S. Corporate Bonds | — | 244,544,796 | — | 244,544,796 |
| Residential Mortgage-Backed Securities | — | 113,148,513 | — | 113,148,513 |
| Commercial Mortgage-Backed Securities | — | 7,097,152 | — | 7,097,152 |
| Asset-Backed Securities (including CDOs) | — | 12,098,687 | — | 12,098,687 |
| Foreign Bonds | — | 274,108,843 | — | 274,108,843 |
| Mutual Funds | 971,361,652 | — | — | 971,361,652 |
| Total | $2,419,076,214 | $1,196,519,244 | $— | $3,615,595,458 |
| Other Financial Instruments | | | | |
| Futures Contracts – Assets | $71,849 | $— | $— | $71,849 |
| Futures Contracts – Liabilities | (65,423) | — | — | (65,423) |
| Forward Foreign Currency Exchange Contracts – Assets | — | 245,056 | — | 245,056 |
| Forward Foreign Currency Exchange Contracts – Liabilities | — | (784,767) | — | (784,767) |
For further information regarding security characteristics, see the Portfolio of Investments. Please refer to the High Yield Pooled Portfolio's shareholder report for further information regarding the levels used in valuing its assets or liabilities.
Notes to Financial Statements (unaudited) - continued
The following is a reconciliation of level 3 assets for which significant unobservable inputs were used to determine fair value. The table presents the activity of level 3 securities held at the beginning and the end of the period.
| | Fixed Income
Securities |
| Balance as of 2/28/21 | $0 |
| Realized gain (loss) | (193,010) |
| Change in unrealized appreciation or depreciation | 193,010 |
| Disposition of worthless securities | 0 |
| Balance as of 8/31/21 | $— |
Inflation-Adjusted Debt Securities — The fund invests in inflation-adjusted debt securities issued by foreign corporations and/or foreign governments. The principal value of these debt securities is adjusted through income according to changes in an inflation index or another general price or wage index. These debt securities typically pay a fixed rate of interest, but this fixed rate is applied to the inflation-adjusted principal amount. The principal paid at maturity of the debt security is typically equal to the inflation-adjusted principal amount, or the security’s original par value, whichever is greater. Other types of inflation-adjusted securities may use other methods to adjust for other measures of inflation.
Foreign Currency Translation — Purchases and sales of foreign investments, income, and expenses are converted into U.S. dollars based upon currency exchange rates prevailing on the respective dates of such transactions or on the reporting date for foreign denominated receivables and payables. Gains and losses attributable to foreign currency exchange rates on sales of securities are recorded for financial statement purposes as net realized gains and losses on investments. Gains and losses attributable to foreign exchange rate movements on receivables, payables, income and expenses are recorded for financial statement purposes as foreign currency transaction gains and losses. That portion of both realized and unrealized gains and losses on investments that results from fluctuations in foreign currency exchange rates is not separately disclosed.
Derivatives — The fund uses derivatives primarily to increase or decrease exposure to a particular market or segment of the market, or security, to increase or decrease interest rate or currency exposure, or as alternatives to direct investments. Derivatives are used for hedging or non-hedging purposes. While hedging can reduce or eliminate losses, it can also reduce or eliminate gains. When the fund uses derivatives as an investment to increase market exposure, or for hedging purposes, gains and losses from derivative instruments may be substantially greater than the derivative’s original cost.
The derivative instruments used by the fund during the period were purchased options, futures contracts, and forward foreign currency exchange contracts. Depending on the type of derivative, a fund may exit a derivative position by entering into an offsetting transaction with a counterparty or exchange, negotiating an agreement with the derivative counterparty, or novating the position to a third party. The fund may be unable to promptly close out a futures position in instances where the daily fluctuation
Notes to Financial Statements (unaudited) - continued
in the price for that type of future exceeds the daily limit set by the exchange. The fund's period end derivatives, as presented in the Portfolio of Investments and the associated Derivative Contract tables, generally are indicative of the volume of its derivative activity during the period.
The following table presents, by major type of derivative contract, the fair value, on a gross basis, of the asset and liability components of derivatives held by the fund at August 31, 2021 as reported in the Statement of Assets and Liabilities:
| | | Fair Value (a) |
| Risk | Derivative Contracts | Asset Derivatives | Liability Derivatives |
| Interest Rate | Futures Contracts | $71,849 | $(65,423) |
| Foreign Exchange | Forward Foreign Currency Exchange Contracts | 245,056 | (784,767) |
| Total | | $316,905 | $(850,190) |
| (a) | Values presented in this table for futures contracts correspond to the values reported in the Portfolio of Investments. Only the current day net variation margin for futures contracts is separately reported within the Statement of Assets and Liabilities. |
The following table presents, by major type of derivative contract, the realized gain (loss) on derivatives held by the fund for the six months ended August 31, 2021 as reported in the Statement of Operations:
| Risk | Futures
Contracts | Forward Foreign
Currency
Exchange
Contracts | Unaffiliated Issuers
(Purchased
Options) |
| Interest Rate | $(208,776) | $ — | $ — |
| Foreign Exchange | — | 412,642 | — |
| Equity | — | — | (6,237,000) |
| Total | $(208,776) | $412,642 | $(6,237,000) |
The following table presents, by major type of derivative contract, the change in unrealized appreciation or depreciation on derivatives held by the fund for the six months ended August 31, 2021 as reported in the Statement of Operations:
| Risk | Futures
Contracts | Forward Foreign
Currency
Exchange
Contracts | Unaffiliated Issuers
(Purchased
Options) |
| Interest Rate | $(97,943) | $ — | $ — |
| Foreign Exchange | — | (1,221,801) | — |
| Equity | — | — | 5,819,000 |
| Total | $(97,943) | $(1,221,801) | $5,819,000 |
Derivative counterparty credit risk is managed through formal evaluation of the creditworthiness of all potential counterparties. On certain, but not all, uncleared derivatives, the fund attempts to reduce its exposure to counterparty credit risk whenever possible by entering into an ISDA Master Agreement on a bilateral basis. The ISDA Master Agreement gives each party to the agreement the right to terminate all transactions traded under such agreement if there is a specified deterioration in the credit quality of the other party. Upon an event of default or a termination of the ISDA
Notes to Financial Statements (unaudited) - continued
Master Agreement, the non-defaulting party has the right to close out all transactions traded under such agreement and to net amounts owed under each agreement to one net amount payable by one party to the other. This right to close out and net payments across all transactions traded under the ISDA Master Agreement could result in a reduction of the fund's credit risk to such counterparty equal to any amounts payable by the fund under the applicable transactions, if any.
Collateral and margin requirements differ by type of derivative. For cleared derivatives (e.g., futures contracts, cleared swaps, and exchange-traded options), margin requirements are set by the clearing broker and the clearing house and collateral, in the form of cash or securities, is posted by the fund directly with the clearing broker. Collateral terms are counterparty agreement specific for uncleared derivatives (e.g., forward foreign currency exchange contracts, uncleared swap agreements, and uncleared options) and collateral, in the form of cash and securities, is held in segregated accounts with the fund's custodian in connection with these agreements. For derivatives traded under an ISDA Master Agreement, which contains a collateral support annex, the collateral requirements are netted across all transactions traded under such counterparty-specific agreement and an amount is posted from one party to the other to collateralize such obligations. Cash that has been segregated or delivered to cover the fund's collateral or margin obligations under derivative contracts, if any, will be reported separately in the Statement of Assets and Liabilities as restricted cash for uncleared derivatives and/or deposits with brokers for cleared derivatives. Securities pledged as collateral or margin for the same purpose, if any, are noted in the Portfolio of Investments. The fund may be required to make payments of interest on uncovered collateral or margin obligations with the broker. Any such payments are included in “Miscellaneous” expense in the Statement of Operations.
Purchased Options — The fund purchased put options for a premium. Purchased put options entitle the holder to sell a specified number of shares or units of a particular security, currency or index at a specified price at a specified date or within a specified period of time. Purchasing put options may hedge against an anticipated decline in the value of portfolio securities or currency or decrease the fund's exposure to an underlying instrument.
The premium paid is initially recorded as an investment in the Statement of Assets and Liabilities. That investment is subsequently marked-to-market daily with the difference between the premium paid and the market value of the purchased option being recorded as unrealized appreciation or depreciation. Premiums paid for purchased put options which have expired are treated as realized losses on investments in the Statement of Operations. Upon the exercise or closing of a purchased put option, the premium paid is offset against the proceeds on the sale of the underlying security or financial instrument in order to determine the realized gain or loss on investments.
Whether or not the option is exercised, the fund's maximum risk of loss from purchasing an option is the amount of premium paid. All option contracts involve credit risk if the counterparty to the option contract fails to perform. For uncleared options, this risk is mitigated in cases where there is an ISDA Master Agreement between the fund and the counterparty providing for netting as described above and, where applicable, by the posting of collateral by the counterparty to the fund to cover the fund’s exposure to the counterparty under such ISDA Master Agreement.
Notes to Financial Statements (unaudited) - continued
Futures Contracts — The fund entered into futures contracts which may be used to hedge against or obtain broad market exposure, interest rate exposure, currency exposure, or to manage duration. A futures contract represents a commitment for the future purchase or sale of an asset at a specified price on a specified date.
Upon entering into a futures contract, the fund is required to deposit with the broker, either in cash or securities, an initial margin in an amount equal to a specified percentage of the notional amount of the contract. Subsequent payments (variation margin) are made or received by the fund each day, depending on the daily fluctuations in the value of the contract, and are recorded for financial statement purposes as unrealized gain or loss by the fund until the contract is closed or expires at which point the gain or loss on futures contracts is realized.
The fund bears the risk of interest rates, exchange rates or securities prices moving unexpectedly, in which case, the fund may not achieve the anticipated benefits of the futures contracts and may realize a loss. While futures contracts may present less counterparty risk to the fund since the contracts are exchange traded and the exchange’s clearinghouse guarantees payments to the broker, there is still counterparty credit risk due to the insolvency of the broker. The fund’s maximum risk of loss due to counterparty credit risk is equal to the margin posted by the fund to the broker plus any gains or minus any losses on the outstanding futures contracts.
Forward Foreign Currency Exchange Contracts — The fund entered into forward foreign currency exchange contracts for the purchase or sale of a specific foreign currency at a fixed price on a future date. These contracts may be used to hedge the fund’s currency risk or for non-hedging purposes. For hedging purposes, the fund may enter into contracts to deliver or receive foreign currency that the fund will receive from or use in its normal investment activities. The fund may also use contracts to hedge against declines in the value of foreign currency denominated securities due to unfavorable exchange rate movements. For non-hedging purposes, the fund may enter into contracts with the intent of changing the relative exposure of the fund’s portfolio of securities to different currencies to take advantage of anticipated exchange rate changes.
Forward foreign currency exchange contracts are adjusted by the daily exchange rate of the underlying currency and any unrealized gains or losses are recorded as a receivable or payable for forward foreign currency exchange contracts until the contract settlement date. On contract settlement date, any gain or loss on the contract is recorded as realized gains or losses on forward foreign currency exchange contracts.
Risks may arise upon entering into these contracts from unanticipated movements in the value of the contract and from the potential inability of counterparties to meet the terms of their contracts. Generally, the fund’s maximum risk due to counterparty credit risk is the unrealized gain on the contract due to the use of Continuous Linked Settlement, a multicurrency cash settlement system for the centralized settlement of foreign transactions. This risk is mitigated in cases where there is an ISDA Master Agreement between the fund and the counterparty providing for netting as described above and, where applicable, by the posting of collateral by the counterparty to the fund to cover the fund’s exposure to the counterparty under such ISDA Master Agreement.
Notes to Financial Statements (unaudited) - continued
Security Loans — Under its Securities Lending Agency Agreement with the fund, JPMorgan Chase and Co., as lending agent, loans the securities of the fund to certain qualified institutions (the “Borrowers”) approved by the fund. Security loans can be terminated at the discretion of either the lending agent or the fund and the related securities must be returned within the earlier of the standard trade settlement period for such securities or within three business days. The loans are collateralized by cash and/or U.S. Treasury and federal agency obligations in an amount typically at least equal to the market value of the securities loaned. On loans collateralized by cash, the cash collateral is invested in a money market fund. The market value of the loaned securities is determined at the close of business of the fund and any additional required collateral is delivered to the fund on the next business day. The lending agent provides the fund with indemnification against Borrower default. In the event of Borrower default, the lending agent will, for the benefit of the fund, either purchase securities identical to those loaned or, when such purchase is commercially impracticable, pay the fund the market value of the loaned securities. In return, the lending agent assumes the fund's rights to the related collateral. If the collateral value is less than the cost to purchase identical securities, the lending agent is responsible for the shortfall, but only to the extent that such shortfall is not due to a decline in collateral value resulting from collateral reinvestment for which the fund bears the risk of loss. At period end, the fund had investment securities on loan, all of which were classified as equity securities in the fund's Portfolio of Investments, with a fair value of $2,685,433. The fair value of the fund's investment securities on loan and a related liability of $2,631,477 for cash collateral received on securities loaned are both presented gross in the Statement of Assets and Liabilities. The value of the fund's securities on loan is marked to market daily and daily market fluctuations could cause the value of loaned securities to be more or less than the value of the collateral received. The value of the fund's securities on loan net of the related collateral is $53,956 at period end. The collateral shortfall was adjusted for the following business day. The liability for cash collateral for securities loaned is carried at fair value, which is categorized as level 2 within the fair value hierarchy. A portion of the income generated upon investment of the collateral is remitted to the Borrowers, and the remainder is allocated between the fund and the lending agent. On loans collateralized by U.S. Treasury and/or federal agency obligations, a fee is received from the Borrower, and is allocated between the fund and the lending agent. Income from securities lending is separately reported in the Statement of Operations. The dividend and interest income earned on the securities loaned is accounted for in the same manner as other dividend and interest income.
Loans and Other Direct Debt Instruments — The fund invests in loans and loan participations or other receivables. These investments may include standby financing commitments, including revolving credit facilities, which contractually obligate the fund to supply additional cash to the borrower on demand. The fund generally provides this financial support in order to preserve its existing investment or to obtain a more senior secured interest in the assets of the borrower. Loan participations involve a risk of insolvency of the lending bank or other financial intermediary.
Indemnifications — Under the fund's organizational documents, its officers and Trustees may be indemnified against certain liabilities and expenses arising out of the performance of their duties to the fund. Additionally, in the normal course of business,
Notes to Financial Statements (unaudited) - continued
the fund enters into agreements with service providers that may contain indemnification clauses. The fund's maximum exposure under these agreements is unknown as this would involve future claims that may be made against the fund that have not yet occurred.
Investment Transactions and Income — Investment transactions are recorded on the trade date. Some securities may be purchased or sold on an extended settlement basis, which means that the receipt or delivery of the securities by the fund and related payments occur at a future date, usually beyond the customary settlement period.
Interest income is recorded on the accrual basis. All premium and discount is amortized or accreted for financial statement purposes in accordance with U.S. generally accepted accounting principles. Dividends received in cash are recorded on the ex-dividend date. Certain dividends from foreign securities will be recorded when the fund is informed of the dividend if such information is obtained subsequent to the ex-dividend date. Dividend and interest payments received in additional securities are recorded on the ex-dividend or ex-interest date in an amount equal to the value of the security on such date. Inflation-indexed bonds are fixed-income securities whose principal value is periodically adjusted upward or downward based on the rate of inflation. Interest is accrued based on the principal value, which is adjusted for inflation. Any increase or decrease in the principal amount of an inflation-indexed bond is generally recorded as an increase or decrease in interest income, respectively, even though the adjusted principal is not received until maturity. Distributions from REITs may be characterized as ordinary income, net capital gain, or a return of capital to the fund. The proper characterization of REIT distributions is generally not known until after the end of each calendar year. As such, estimates are used in reporting the character of income and distributions for financial statement purposes. The fund receives substantial distributions from holdings in REITs.
The fund may receive proceeds from litigation settlements. Any proceeds received from litigation involving portfolio holdings are reflected in the Statement of Operations in realized gain/loss if the security has been disposed of by the fund or in unrealized gain/loss if the security is still held by the fund. Any other proceeds from litigation not related to portfolio holdings are reflected as other income in the Statement of Operations.
The fund may purchase or sell mortgage-backed securities on a “To Be Announced” (TBA) basis. A TBA transaction is subject to extended settlement and typically does not designate the actual security to be delivered, but instead includes an approximate principal amount. The price of the TBA security and the date that it will be settled are fixed at the time the transaction is negotiated. The value of the security varies with market fluctuations and no interest accrues to the fund until settlement takes place. TBA purchase and sale commitments are held at carrying amount, which approximates fair value and are categorized as level 2 within the fair value hierarchy and included in TBA purchase commitments in the Statement of Assets and Liabilities. Losses may arise as a result of changes in the value of the TBA investment prior to settlement date or due to counterparty non-performance. At the time that it enters into a TBA transaction, the fund is required to have sufficient cash and/or liquid securities to cover its commitments.
The fund may also enter into mortgage dollar rolls, typically TBA dollar rolls, in which the fund sells TBA mortgage-backed securities to financial institutions and simultaneously agrees to repurchase similar (same issuer, type and coupon) securities at
Notes to Financial Statements (unaudited) - continued
a later date at an agreed-upon price. During the period between the sale and repurchase, the fund will not be entitled to receive interest and principal payments on the securities sold. The fund accounts for dollar roll transactions as purchases and sales and realizes gains and losses on these transactions. Dollar roll transactions involve the risk that the market value of the securities that the fund is required to purchase may decline below the agreed upon repurchase price of those securities.
To mitigate the counterparty credit risk on TBA transactions, mortgage dollar rolls, and other types of forward settling mortgage-backed and asset-backed security transactions, the fund whenever possible enters into a Master Securities Forward Transaction Agreement (“MSFTA”) on a bilateral basis with each of the counterparties with whom it undertakes a significant volume of transactions. The MSFTA gives each party to the agreement the right to terminate all transactions traded under such agreement if there is a specified deterioration in the credit quality of the other party. Upon an event of default or a termination of the MSFTA, the non-defaulting party has the right to close out all transactions traded under such agreement and to net amounts owed under each transaction to one net amount payable by one party to the other. This right to close out and net payments across all transactions traded under the MSFTA could result in a reduction of the fund's credit risk to such counterparty equal to any amounts payable by the fund under the applicable transactions, if any.
For mortgage-backed and asset-backed securities traded under a MSFTA, the collateral and margining requirements are contract specific. Collateral amounts across all transactions traded under such agreement are netted and an amount is posted from one party to the other to collateralize such obligations. Cash that has been pledged to cover the fund's collateral or margin obligations under a MSFTA, if any, will be reported separately on the Statement of Assets and Liabilities as restricted cash. Securities pledged as collateral or margin for the same purpose, if any, are noted in the Portfolio of Investments.
Fees Paid Indirectly — The fund's custody fee may be reduced by a credit earned under an arrangement that measures the value of U.S. dollars deposited with the custodian by the fund. The amount of the credit, for the six months ended August 31, 2021, is shown as a reduction of total expenses in the Statement of Operations.
Tax Matters and Distributions — The fund intends to qualify as a regulated investment company, as defined under Subchapter M of the Internal Revenue Code, and to distribute all of its taxable income, including realized capital gains. As a result, no provision for federal income tax is required. The fund’s federal tax returns, when filed, will remain subject to examination by the Internal Revenue Service for a three year period. Management has analyzed the fund’s tax positions taken on federal and state tax returns for all open tax years and does not believe that there are any uncertain tax positions that require recognition of a tax liability. Foreign taxes, if any, have been accrued by the fund in the accompanying financial statements in accordance with the applicable foreign tax law. Foreign income taxes may be withheld by certain countries in which the fund invests. Additionally, capital gains realized by the fund on securities issued in or by certain foreign countries may be subject to capital gains tax imposed by those countries.
Distributions to shareholders are recorded on the ex-dividend date. Income and capital gain distributions are determined in accordance with income tax regulations, which may differ from U.S. generally accepted accounting principles. Certain capital accounts in the financial statements are periodically adjusted for permanent differences in order
Notes to Financial Statements (unaudited) - continued
to reflect their tax character. These adjustments have no impact on net assets or net asset value per share. Temporary differences which arise from recognizing certain items of income, expense, gain or loss in different periods for financial statement and tax purposes will reverse at some time in the future.
Book/tax differences primarily relate to amortization and accretion of debt securities and wash sale loss deferrals.
The tax character of distributions made during the current period will be determined at fiscal year end. The tax character of distributions declared to shareholders for the last fiscal year is as follows:
| | Year ended
2/28/21 |
| Ordinary income (including any short-term capital gains) | $99,621,041 |
| Long-term capital gains | 6,803,007 |
| Total distributions | $106,424,048 |
The federal tax cost and the tax basis components of distributable earnings were as follows:
| As of 8/31/21 | |
| Cost of investments | $3,139,542,543 |
| Gross appreciation | 501,805,981 |
| Gross depreciation | (25,753,066) |
| Net unrealized appreciation (depreciation) | $ 476,052,915 |
| As of 2/28/21 | |
| Undistributed ordinary income | 10,954,318 |
| Undistributed long-term capital gain | 2,490,794 |
| Other temporary differences | (5,556,146) |
| Net unrealized appreciation (depreciation) | 314,044,886 |
The aggregate cost above includes prior fiscal year end tax adjustments, if applicable.
Multiple Classes of Shares of Beneficial Interest — The fund offers multiple classes of shares, which differ in their respective distribution and service fees. The fund's income and common expenses are allocated to shareholders based on the value of settled shares outstanding of each class. The fund's realized and unrealized gain (loss) are allocated to shareholders based on the daily net assets of each class. Dividends are declared separately for each class. Differences in per share dividend rates are generally due to differences in separate class expenses. Class C shares will convert to Class A
Notes to Financial Statements (unaudited) - continued
shares approximately eight years after purchase. The fund’s distributions declared to shareholders as reported in the Statements of Changes in Net Assets are presented by class as follows:
| | Six months
ended
8/31/21 | | Year
ended
2/28/21 |
| Class A | $22,506,796 | | $44,341,535 |
| Class C | 4,452,960 | | 13,078,504 |
| Class I | 17,880,524 | | 39,272,282 |
| Class R1 | 2,369 | | 5,201 |
| Class R2 | 23,981 | | 50,897 |
| Class R3 | 324,947 | | 703,020 |
| Class R4 | 125,742 | | 274,982 |
| Class R6 | 4,196,485 | | 8,697,627 |
| Total | $49,513,804 | | $106,424,048 |
(3) Transactions with Affiliates
Investment Adviser — The fund has an investment advisory agreement with MFS to provide overall investment management and related administrative services and facilities to the fund. The management fee is computed daily and paid monthly at the following annual rates based on the fund's average daily net assets:
| Up to $1 billion | 0.65% |
| In excess of $1 billion and up to $2.5 billion | 0.60% |
| In excess of $2.5 billion and up to $5 billion | 0.55% |
| In excess of $5 billion | 0.50% |
MFS has agreed in writing to reduce its management fee by a specified amount if certain MFS mutual fund assets exceed thresholds agreed to by MFS and the fund's Board of Trustees. For the six months ended August 31, 2021, this management fee reduction amounted to $224,166, which is included in the reduction of total expenses in the Statement of Operations. The management fee incurred for the six months ended August 31, 2021 was equivalent to an annual effective rate of 0.59% of the fund's average daily net assets.
The investment adviser has agreed in writing to pay a portion of the fund’s total annual operating expenses, excluding interest, taxes, extraordinary expenses, brokerage and transaction costs, and investment-related expenses (such as fees and expenses associated with investments in investment companies and other similar investment vehicles), such that total fund operating expenses do not exceed the following rates annually of each class’s average daily net assets:
| Classes |
| A | C | I | R1 | R2 | R3 | R4 | R6 |
| 1.10% | 1.85% | 0.85% | 1.85% | 1.35% | 1.10% | 0.85% | 0.79% |
This written agreement will continue until modified by the fund’s Board of Trustees, but such agreement will continue at least until June 30, 2023. For the six months ended August 31, 2021, the fund’s actual operating expenses did not exceed the limit and therefore, the investment adviser did not pay any portion of the fund’s expenses related to this agreement.
Notes to Financial Statements (unaudited) - continued
Distributor — MFS Fund Distributors, Inc. (MFD), a wholly-owned subsidiary of MFS, as distributor, received $24,364 for the six months ended August 31, 2021, as its portion of the initial sales charge on sales of Class A shares of the fund.
The Board of Trustees has adopted a distribution plan for certain share classes pursuant to Rule 12b-1 of the Investment Company Act of 1940.
The fund's distribution plan provides that the fund will pay MFD for services provided by MFD and financial intermediaries in connection with the distribution and servicing of certain share classes. One component of the plan is a distribution fee paid to MFD and another component of the plan is a service fee paid to MFD. MFD may subsequently pay all, or a portion, of the distribution and/or service fees to financial intermediaries.
Distribution Plan Fee Table:
| | Distribution
Fee Rate (d) | Service
Fee Rate (d) | Total
Distribution
Plan (d) | Annual
Effective
Rate (e) | Distribution
and Service
Fee |
| Class A | — | 0.25% | 0.25% | 0.25% | $ 2,042,196 |
| Class C | 0.75% | 0.25% | 1.00% | 1.00% | 2,214,081 |
| Class R1 | 0.75% | 0.25% | 1.00% | 1.00% | 1,182 |
| Class R2 | 0.25% | 0.25% | 0.50% | 0.50% | 4,786 |
| Class R3 | — | 0.25% | 0.25% | 0.25% | 29,479 |
| Total Distribution and Service Fees | | | | | $4,291,724 |
| (d) | In accordance with the distribution plan for certain classes, the fund pays distribution and/or service fees equal to these annual percentage rates of each class’s average daily net assets. The distribution and service fee rates disclosed by class represent the current rates in effect at the end of the reporting period. Any rate changes, if applicable, are detailed below. |
| (e) | The annual effective rates represent actual fees incurred under the distribution plan for the six months ended August 31, 2021 based on each class's average daily net assets. MFD has voluntarily agreed to rebate a portion of each class's 0.25% service fee attributable to accounts for which there is no financial intermediary specified on the account except for accounts attributable to MFS or its affiliates' seed money. For the six months ended August 31, 2021, this rebate amounted to $154 and $6 for Class A and Class C, respectively, and is included in the reduction of total expenses in the Statement of Operations. |
Certain Class A shares are subject to a contingent deferred sales charge (CDSC) in the event of a shareholder redemption within 18 months of purchase. Class C shares are subject to a CDSC in the event of a shareholder redemption within 12 months of purchase. All contingent deferred sales charges are paid to MFD and during the six months ended August 31, 2021, were as follows:
| | Amount |
| Class A | $15,754 |
| Class C | 2,732 |
Shareholder Servicing Agent — MFS Service Center, Inc. (MFSC), a wholly-owned subsidiary of MFS, receives a fee from the fund for its services as shareholder servicing agent calculated as a percentage of the average daily net assets of the fund as determined periodically under the supervision of the fund's Board of Trustees. For the six months ended August 31, 2021, the fee was $96,412, which equated to 0.0054% annually of the fund's average daily net assets. MFSC also receives reimbursement from
Notes to Financial Statements (unaudited) - continued
the fund for out-of-pocket expenses, sub-accounting and other shareholder servicing costs which may be paid to affiliated and unaffiliated service providers. Class R6 shares do not incur sub-accounting fees. For the six months ended August 31, 2021, these out-of-pocket expenses, sub-accounting and other shareholder servicing costs amounted to $1,500,970.
Administrator — MFS provides certain financial, legal, shareholder communications, compliance, and other administrative services to the fund. Under an administrative services agreement, the fund reimburses MFS the costs incurred to provide these services. The fund is charged an annual fixed amount of $17,500 plus a fee based on average daily net assets. The administrative services fee incurred for the six months ended August 31, 2021 was equivalent to an annual effective rate of 0.0133% of the fund's average daily net assets.
Trustees’ and Officers’ Compensation — The fund pays compensation to independent Trustees in the form of a retainer, attendance fees, and additional compensation to Board and Committee chairpersons. The fund does not pay compensation directly to Trustees or officers of the fund who are also officers of the investment adviser, all of whom receive remuneration from MFS for their services to the fund. Certain officers and Trustees of the fund are officers or directors of MFS, MFD, and MFSC.
Other — The fund invests in the MFS Institutional Money Market Portfolio which is managed by MFS and seeks current income consistent with preservation of capital and liquidity. This money market fund does not pay a management fee to MFS but does incur investment and operating costs.
The fund invests in the High Yield Pooled Portfolio, which is a mutual fund advised by MFS that does not pay management fees to MFS but does incur investment and operating costs. The fund invests in the High Yield Pooled Portfolio to gain exposure to high income debt instruments, rather than investing in high income debt instruments directly. Income earned on this investment is included in “Dividends from affiliated issuers” in the Statement of Operations. The High Yield Pooled Portfolio does not pay distribution and/or service fees to MFD.
The fund is permitted to engage in purchase and sale transactions with funds and accounts for which MFS serves as investment adviser or sub-adviser (“cross-trades”) pursuant to a policy adopted by the Board of Trustees. This policy has been designed to ensure that cross-trades conducted by the fund comply with Rule 17a-7 under the Investment Company Act of 1940. During the six months ended August 31, 2021, the fund engaged in sale transactions pursuant to this policy, which amounted to $389,336. The sales transactions resulted in net realized gains (losses) of $134,131.
The adviser has voluntarily undertaken to reimburse the fund from its own resources on a quarterly basis for the cost of investment research embedded in the cost of the fund’s securities trades. This agreement may be rescinded at any time. For the six months ended August 31, 2021, this reimbursement amounted to $55,636, which is included in “Other” income in the Statement of Operations.
Notes to Financial Statements (unaudited) - continued
(4) Portfolio Securities
For the six months ended August 31, 2021, purchases and sales of investments, other than short-term obligations, were as follows:
| | Purchases | Sales |
| U.S. Government securities | $793,826,770 | $1,141,894,178 |
| Non-U.S. Government securities | 870,651,586 | 623,163,727 |
(5) Shares of Beneficial Interest
The fund's Declaration of Trust permits the Trustees to issue an unlimited number of full and fractional shares of beneficial interest. Transactions in fund shares were as follows:
| | Six months ended
8/31/21 | | Year ended
2/28/21 |
| | Shares | Amount | | Shares | Amount |
| Shares sold | | | | | |
| Class A | 7,258,472 | $98,771,435 | | 26,698,817 | $334,629,453 |
| Class C | 859,885 | 11,685,729 | | 2,317,040 | 28,643,678 |
| Class I | 7,997,505 | 108,427,259 | | 21,074,382 | 260,990,032 |
| Class R1 | 5,574 | 76,529 | | 4,179 | 50,747 |
| Class R2 | 11,175 | 152,291 | | 35,647 | 449,430 |
| Class R3 | 125,957 | 1,715,097 | | 274,176 | 3,430,576 |
| Class R4 | 82,580 | 1,109,936 | | 159,223 | 2,005,362 |
| Class R6 | 1,959,977 | 26,641,350 | | 4,833,104 | 60,253,088 |
| | 18,301,125 | $248,579,626 | | 55,396,568 | $690,452,366 |
Shares issued to shareholders
in reinvestment of distributions | | | | | |
| Class A | 1,560,017 | $21,301,958 | | 3,375,341 | $42,228,518 |
| Class C | 303,669 | 4,142,549 | | 946,276 | 11,795,795 |
| Class I | 1,076,697 | 14,697,975 | | 2,541,818 | 31,726,946 |
| Class R1 | 173 | 2,351 | | 399 | 4,993 |
| Class R2 | 1,753 | 23,929 | | 3,739 | 46,640 |
| Class R3 | 23,779 | 324,903 | | 56,059 | 700,910 |
| Class R4 | 9,202 | 125,656 | | 22,000 | 274,956 |
| Class R6 | 295,063 | 4,028,681 | | 660,976 | 8,265,621 |
| | 3,270,353 | $44,648,002 | | 7,606,608 | $95,044,379 |
Notes to Financial Statements (unaudited) - continued
| | Six months ended
8/31/21 | | Year ended
2/28/21 |
| | Shares | Amount | | Shares | Amount |
| Shares reacquired | | | | | |
| Class A | (9,586,182) | $(130,152,082) | | (29,866,177) | $(368,944,745) |
| Class C | (5,841,435) | (79,309,294) | | (24,873,333) | (313,101,450) |
| Class I | (10,352,661) | (140,260,517) | | (46,458,975) | (567,582,659) |
| Class R1 | (4,790) | (65,384) | | (2,873) | (36,133) |
| Class R2 | (15,301) | (209,898) | | (140,095) | (1,765,344) |
| Class R3 | (138,350) | (1,867,491) | | (494,519) | (6,285,453) |
| Class R4 | (145,705) | (1,952,348) | | (285,574) | (3,527,252) |
| Class R6 | (2,755,466) | (37,307,306) | | (6,317,809) | (78,743,025) |
| | (28,839,890) | $(391,124,320) | | (108,439,355) | $(1,339,986,061) |
| Net change | | | | | |
| Class A | (767,693) | $(10,078,689) | | 207,981 | $7,913,226 |
| Class C | (4,677,881) | (63,481,016) | | (21,610,017) | (272,661,977) |
| Class I | (1,278,459) | (17,135,283) | | (22,842,775) | (274,865,681) |
| Class R1 | 957 | 13,496 | | 1,705 | 19,607 |
| Class R2 | (2,373) | (33,678) | | (100,709) | (1,269,274) |
| Class R3 | 11,386 | 172,509 | | (164,284) | (2,153,967) |
| Class R4 | (53,923) | (716,756) | | (104,351) | (1,246,934) |
| Class R6 | (500,426) | (6,637,275) | | (823,729) | (10,224,316) |
| | (7,268,412) | $(97,896,692) | | (45,436,179) | $(554,489,316) |
(6) Line of Credit
The fund and certain other funds managed by MFS participate in a $1.25 billion unsecured committed line of credit of which $1 billion is reserved for use by the fund and certain other MFS U.S. funds. The line of credit is provided by a syndicate of banks under a credit agreement. Borrowings may be made for temporary financing needs. Interest is charged to each fund, based on its borrowings, generally at a rate equal to the highest of one month LIBOR, the Federal Funds Effective Rate and the Overnight Bank Funding Rate, plus an agreed upon spread. A commitment fee, based on the average daily, unused portion of the committed line of credit, is allocated among the participating funds. In addition, the fund and other funds managed by MFS have established unsecured uncommitted borrowing arrangements with certain banks for temporary financing needs. Interest is charged to each fund, based on its borrowings, at rates equal to customary reference rates plus an agreed upon spread. For the six months ended August 31, 2021, the fund’s commitment fee and interest expense were $7,289 and $0, respectively, and are included in “Miscellaneous” expense in the Statement of Operations.
Notes to Financial Statements (unaudited) - continued
(7) Investments in Affiliated Issuers
An affiliated issuer may be considered one in which the fund owns 5% or more of the outstanding voting securities, or a company which is under common control. For the purposes of this report, the following were affiliated issuers:
| Affiliated Issuers | Beginning
Value | Purchases | Sales
Proceeds | Realized
Gain
(Loss) | Change in
Unrealized
Appreciation or
Depreciation | Ending
Value |
| MFS High Yield Pooled Portfolio | $1,016,507,214 | $27,512,827 | $163,700,877 | $475,688 | $8,475,180 | $889,270,032 |
| MFS Institutional Money Market Portfolio | 165,569,182 | 813,005,316 | 899,114,355 | — | — | 79,460,143 |
| | $1,182,076,396 | $840,518,143 | $1,062,815,232 | $475,688 | $8,475,180 | $968,730,175 |
| Affiliated Issuers | Dividend
Income | Capital Gain
Distributions |
| MFS High Yield Pooled Portfolio | $24,809,789 | $— |
| MFS Institutional Money Market Portfolio | 26,296 | — |
| | $24,836,085 | $— |
(8) Impacts of COVID-19
The pandemic related to the global spread of novel coronavirus disease (COVID-19), which was first detected in December 2019, has resulted in significant disruptions to global business activity and the global economy, as well as the economies of individual countries, the financial performance of individual companies and sectors, and the securities and commodities markets in general. Multiple surges in cases globally, the availability and widespread adoption of vaccines, and the emergence of variant strains of the virus continue to create uncertainty as to the future and long-term impacts resulting from the pandemic including impacts to the prices and liquidity of the fund's investments and the fund's performance.
Board Review of Investment Advisory Agreement
MFS Diversified Income Fund
The Investment Company Act of 1940 requires that both the full Board of Trustees and a majority of the non-interested (“independent”) Trustees, voting separately, annually approve the continuation of the Fund’s investment advisory agreement with MFS. The Trustees consider matters bearing on the Fund and its advisory arrangements at their meetings throughout the year, including a review of performance data at each regular meeting. In addition, the independent Trustees met several times by videoconference (in accordance with Securities and Exchange Commission relief) over the course of three months beginning in May and ending in July, 2021 (“contract review meetings”) for the specific purpose of considering whether to approve the continuation of the investment advisory agreement for the Fund and the other investment companies that the Board oversees (the “MFS Funds”). The independent Trustees were assisted in their evaluation of the Fund’s investment advisory agreement by independent legal counsel, from whom they received separate legal advice and with whom they met separately from MFS during various contract review meetings. The independent Trustees were also assisted in this process by an independent consultant who was retained by and reported to the independent Trustees.
In connection with their deliberations regarding the continuation of the investment advisory agreement, the Trustees, including the independent Trustees, considered such information and factors as they believed, in light of the legal advice furnished to them and their own business judgment, to be relevant. The investment advisory agreement for the Fund was considered separately, although the Trustees also took into account the common interests of all MFS Funds in their review. As described below, the Trustees considered the nature, quality, and extent of the various investment advisory, administrative, and shareholder services performed by MFS under the existing investment advisory agreement and other arrangements with the Fund.
In connection with their contract review meetings, the Trustees received and relied upon materials that included, among other items: (i) information provided by Broadridge Financial Solutions, Inc. (“Broadridge”), an independent third party, on the investment performance of the Fund for various time periods ended December 31, 2020 and the investment performance of a group of funds with substantially similar investment classifications/objectives (the “Broadridge performance universe”), (ii) information provided by Broadridge on the Fund’s advisory fees and other expenses and the advisory fees and other expenses of comparable funds identified by Broadridge as well as all other funds in the same investment classification/category (the “Broadridge expense group and universe”), (iii) information provided by MFS on the advisory fees of portfolios of other clients of MFS, including institutional separate accounts and other clients, (iv) information as to whether and to what extent applicable expense waivers, reimbursements or fee “breakpoints” are observed for the Fund, (v) information regarding MFS’ financial results and financial condition, including MFS’ and certain of its affiliates’ estimated profitability from services performed for the Fund and the MFS Funds as a whole, and compared to MFS’ institutional business, (vi) MFS’ views regarding the outlook for the mutual fund industry and the strategic business plans of MFS, (vii) descriptions of various functions performed by MFS for the Funds, such as compliance monitoring and portfolio trading practices, and (viii)
Board Review of Investment Advisory Agreement - continued
information regarding the overall organization of MFS, including information about MFS’ senior management and other personnel providing investment advisory, administrative and other services to the Fund and the other MFS Funds. The comparative performance, fee and expense information prepared and provided by Broadridge was not independently verified and the independent Trustees did not independently verify any information provided to them by MFS.
The Trustees’ conclusion as to the continuation of the investment advisory agreement was based on a comprehensive consideration of all information provided to the Trustees and not the result of any single factor. Some of the factors that figured particularly in the Trustees’ deliberations are described below, although individual Trustees may have evaluated the information presented differently from one another, giving different weights to various factors. It is also important to recognize that the fee arrangements for the Fund and other MFS Funds are the result of years of review and discussion between the independent Trustees and MFS, that certain aspects of such arrangements may receive greater scrutiny in some years than in others, and that the Trustees’ conclusions may be based, in part, on their consideration of these same arrangements during the course of the year and in prior years.
Based on information provided by Broadridge and MFS, the Trustees reviewed the Fund’s total return investment performance as well as the Broadridge performance universe over various time periods. The Trustees placed particular emphasis on the total return performance of the Fund’s Class I shares in comparison to the performance of funds in its Broadridge performance universe over the five-year period ended December 31, 2020, which the Trustees believed was a long enough period to reflect differing market conditions. The total return performance of the Fund’s Class I shares was in the 4th quintile relative to the other funds in the universe for this five-year period (the 1st quintile being the best performers and the 5th quintile being the worst performers). The total return performance of the Fund’s Class I shares was in the 5th quintile for the one-year period and the 4th quintile for the three-year period ended December 31, 2020 relative to the Broadridge performance universe. Because of the passage of time, these performance results may differ from the performance results for more recent periods, including those shown elsewhere in this report.
The Trustees expressed concern to MFS about the substandard investment performance of the Fund. In the course of their deliberations, the Trustees took into account information provided by MFS in connection with the contract review meetings, as well as during investment review meetings conducted with portfolio management personnel during the course of the year, as to MFS’ efforts to improve the Fund’s performance, including a recent investment strategy change to permit the Fund to invest in investment grade quality debt instruments. In addition, the Trustees requested that they receive a separate update on the Fund’s performance at each of their regular meetings. After reviewing these and related factors, the Trustees concluded, within the context of their overall conclusions regarding the investment advisory agreement, that MFS’ responses and efforts and plans to improve investment performance were sufficient to support approval of the continuance of the investment advisory agreement for an additional one-year period, but that they would continue to closely monitor the performance of the Fund.
Board Review of Investment Advisory Agreement - continued
In assessing the reasonableness of the Fund’s advisory fee, the Trustees considered, among other information, the Fund’s advisory fee and the total expense ratio of the Fund’s Class I shares as a percentage of average daily net assets and the advisory fee and total expense ratios of the Broadridge expense group based on information provided by Broadridge. The Trustees considered that MFS currently observes an expense limitation for the Fund, which may not be changed without the Trustees’ approval. The Trustees also considered that, according to the data provided by Broadridge (which takes into account any fee reductions or expense limitations that were in effect during the Fund’s last fiscal year), the Fund’s effective advisory fee rate was higher than the Broadridge expense group median and the Fund’s total expense ratio was approximately at the Broadridge expense group median.
The Trustees also considered the advisory fees charged by MFS to any institutional separate accounts advised by MFS (“separate accounts”) and unaffiliated investment companies for which MFS serves as subadviser (“subadvised funds”) that have comparable investment strategies to the Fund, if any. In comparing these fees, the Trustees considered information provided by MFS as to the generally broader scope of services provided by MFS to the Fund, as well as the more extensive regulatory burdens imposed on MFS in managing the Fund, in comparison to separate accounts and subadvised funds. The Trustees also considered the higher demands placed on MFS’ investment personnel and trading infrastructure as a result of the daily cash in-flows and out-flows of the Fund in comparison to separate accounts.
The Trustees also considered whether the Fund may benefit from any economies of scale in the management of the Fund in the event of growth in assets of the Fund and/or growth in assets of the MFS Funds as a whole. They noted that the Fund’s advisory fee rate schedule is subject to contractual breakpoints that reduce the Fund’s advisory fee rate on average daily net assets over $1 billion, $2.5 billion and $5 billion. The Trustees also noted that MFS has agreed in writing to waive a portion of the management fees of certain MFS Funds, including the Fund, if the total combined assets of certain funds within the MFS Funds’ complex increase above agreed upon thresholds (the “group fee waiver”), enabling the Fund’s shareholders to share in the benefits from any economies of scale at the complex level. The group fee waiver is reviewed and renewed annually between the Board and MFS. The Trustees concluded that the breakpoints and the group fee waiver were sufficient to allow the Fund to benefit from economies of scale as its assets and overall complex assets grow.
The Trustees also considered information prepared by MFS relating to MFS’ costs and profits with respect to the Fund, the MFS Funds considered as a group, and other investment companies and accounts advised by MFS, as well as MFS’ methodologies used to determine and allocate its costs to the MFS Funds, the Fund and other accounts and products for purposes of estimating profitability.
After reviewing these and other factors described herein, the Trustees concluded, within the context of their overall conclusions regarding the investment advisory agreement, that the advisory fees charged to the Fund represent reasonable compensation in light of the services being provided by MFS to the Fund.
In addition, the Trustees considered MFS’ resources and related efforts to continue to retain, attract and motivate capable personnel to serve the Fund. The Trustees also considered current and developing conditions in the financial services industry, including the presence of large and well-capitalized companies which are spending,
Board Review of Investment Advisory Agreement - continued
and appear to be prepared to continue to spend, substantial sums to engage personnel and to provide services to competing investment companies. In this regard, the Trustees also considered the financial resources of MFS and its ultimate parent, Sun Life Financial Inc. The Trustees also considered the advantages and possible disadvantages to the Fund of having an adviser that also serves other investment companies as well as other accounts.
The Trustees also considered the nature, quality, cost, and extent of administrative, transfer agency, and distribution services provided to the Fund by MFS and its affiliates under agreements and plans other than the investment advisory agreement, including any 12b-1 fees the Fund pays to MFS Fund Distributors, Inc., an affiliate of MFS. The Trustees also considered the nature, extent and quality of certain other services MFS performs or arranges for on the Fund’s behalf, which may include securities lending programs, directed expense payment programs, class action recovery programs, and MFS’ interaction with third-party service providers, principally custodians and sub-custodians. The Trustees concluded that the various non-advisory services provided by MFS and its affiliates on behalf of the Fund were satisfactory.
The Trustees considered so-called “fall-out benefits” to MFS such as reputational value derived from serving as investment manager to the MFS Funds. The Trustees also considered that MFS discontinued its historic practice of obtaining investment research from portfolio brokerage commissions paid by certain MFS Funds effective January 2018, and directly pays or voluntarily reimburses a Fund, if applicable, for the costs of external research acquired through the use of the Fund’s portfolio brokerage commissions.
Based on their evaluation of factors that they deemed to be material, including those factors described above, the Board of Trustees, including the independent Trustees, concluded that the Fund’s investment advisory agreement with MFS should be continued for an additional one-year period, commencing August 1, 2021.
Statement Regarding Liquidity Risk Management Program
The fund has adopted and implemented a liquidity risk management program (the “Program”) as required by Rule 22e-4 under the Investment Company Act of 1940, as amended. The fund’s Board of Trustees (the “Board”) has designated MFS as the administrator of the Program. The Program is reasonably designed to assess and manage the liquidity risk of the fund. Liquidity risk is the risk that the fund could not meet requests to redeem shares issued by the fund without significant dilution of remaining investors' interests.
MFS provided a written report to the Board for consideration at its April 2021 meeting that addressed the operation of the Program and provided an assessment of the adequacy and effectiveness of the Program during the period from January 1, 2020 to December 31, 2020 (the “Covered Period”). The report concluded that during the Covered Period the Program had operated effectively and had adequately and effectively been implemented to assess and manage the fund’s liquidity risk. MFS also reported that there were no liquidity events that impacted the fund or its ability to timely meet redemptions without dilution to existing shareholders during the Covered Period.
There can be no assurance that the Program will achieve its objectives in the future. Further information on liquidity risk, and other principal risks to which an investment in the fund may be subject, can be found in the prospectus.
Proxy Voting Policies and Information
MFS votes proxies on behalf of the fund pursuant to proxy voting policies and procedures that are available without charge, upon request, by calling 1-800-225-2606, by visiting mfs.com/proxyvoting, or by visiting the SEC’s Web site at http://www.sec.gov.
Information regarding how the fund voted proxies relating to portfolio securities during the most recent twelve-month period ended June 30 is available by August 31 of each year without charge by visiting mfs.com/proxyvoting, or by visiting the SEC’s Web site at http://www.sec.gov.
Quarterly Portfolio Disclosure
The fund files a complete schedule of portfolio holdings with the SEC for the first and third quarters of each fiscal year as an exhibit to its reports on Form N-PORT. The fund's Form N-PORT reports are available on the SEC's Web site at http://www.sec.gov. A shareholder can obtain the portfolio holdings report for the first and third quarters of the fund's fiscal year at mfs.com/openendfunds by choosing the fund's name and then scrolling to the “Resources” section and clicking on the “Prospectus and Reports” tab.
Further Information
From time to time, MFS may post important information about the fund or the MFS Funds on the MFS Web site (mfs.com). This information is available at https://www.mfs.com/announcements or at mfs.com/openendfunds by choosing the fund’s name and then scrolling to the “Resources” section and clicking on the “Announcements” tab, if any.
Information About Fund Contracts and Legal Claims
The fund has entered into contractual arrangements with an investment adviser, administrator, distributor, shareholder servicing agent, 529 program manager (if applicable), and custodian who each provide services to the fund. Unless expressly stated otherwise, shareholders are not parties to, or intended beneficiaries of these contractual arrangements, and these contractual arrangements are not intended to create any shareholder right to enforce them against the service providers or to seek any remedy under them against the service providers, either directly or on behalf of the fund.
Under the Trust’s By-Laws and Declaration of Trust, any claims asserted against or on behalf of the MFS Funds, including claims against Trustees and Officers, must be brought in state and federal courts located within the Commonwealth of Massachusetts.
Provision of Financial Reports and Summary Prospectuses
The fund produces financial reports every six months and updates its summary prospectus and prospectus annually. To avoid sending duplicate copies of materials to households, only one copy of the fund’s annual and semiannual report and summary prospectus may be mailed to shareholders having the same last name and residential address on the fund’s records. However, any shareholder may contact MFSC (please see back cover for address and telephone number) to request that copies of these reports and summary prospectuses be sent personally to that shareholder.
Save paper with eDelivery.
MFS® will send you prospectuses, reports, and proxies directly via e-mail so you will get information faster with less mailbox clutter.
To sign up:
1. Go to mfs.com.
2. Log in via MFS® Access.
3. Select eDelivery.
If you own your MFS fund shares through a financial institution or a retirement plan, MFS® TALK, MFS® Access, or eDelivery may not be available to you.
CONTACT
WEB SITE
mfs.com
MFS TALK
1-800-637-8255
24 hours a day
ACCOUNT SERVICE AND LITERATURE
Shareholders
1-800-225-2606
Financial advisors
1-800-343-2829
Retirement plan services
1-800-637-1255
MAILING ADDRESS
MFS Service Center, Inc.
P.O. Box 219341
Kansas City, MO 64121-9341
OVERNIGHT MAIL
MFS Service Center, Inc.
Suite 219341
430 W 7th Street
Kansas City, MO 64105-1407
Semiannual Report
August 31, 2021
MFS® Government
Securities Fund
MFS® Government
Securities Fund
| 1 |
| 2 |
| 4 |
| 6 |
| 15 |
| 17 |
| 18 |
| 19 |
| 25 |
| 39 |
| 43 |
| 44 |
| 44 |
| 44 |
| 44 |
| 44 |
The report is prepared for the general information of shareholders. It is authorized for distribution to prospective investors only when preceded or accompanied by a current prospectus.
NOT FDIC INSURED • MAY LOSE VALUE • NO BANK GUARANTEE
LETTER FROM THE CEO
Dear Shareholders:
After experiencing dramatic swings in the early days of the coronavirus pandemic, global equity markets have performed strongly over the past year. Though the speedy development of vaccines brightened the economic and market outlook, uncertainty remains as new variants of the virus appear, and questions persist over how fast vaccines can be made widely available in the developing world.
After having taken aggressive steps to cushion the economic and market fallout related to the virus, some global central banks have begun to recalibrate monetary policy. For example, the U.S. Federal Reserve has signaled it will likely taper its bond buying program before the end of 2021, which has helped push up Treasury yields, and steepened the yield curve. Having passed a $1.9 trillion stimulus package in March, the U.S. Congress could approve additional stimulus later this year, some of it focused on infrastructure. Production and transportation bottlenecks and labor shortages stemming from the pandemic have fueled a rise in inflation, though policymakers and investors think most of the price hikes will prove transitory.
Since midyear, the spread of the Delta variant of the coronavirus has slowed economic growth while markets have focused on a regulatory crackdown in China, which, when coupled with stress in that country's property development sector, has contributed to a slowdown there. Tightening global energy and raw materials supplies are a further concern for investors.
The policy measures put in place to counteract the pandemic's effects have helped build a supportive environment and are encouraging economic recovery; however, if markets disconnect from fundamentals, they can sow the seeds of instability. As such, recent dramatic increases in speculative trading in cryptocurrencies, special purpose acquisition companies (SPACs), and the like bear watching.
In the aftermath of the crisis, we could see societal changes as households, businesses, and governments adjust to a new reality, and any such alterations could affect the investment landscape. For investors, events such as the COVID-19 outbreak demonstrate the importance of having a deep understanding of company fundamentals, and we have built our global research platform to do just that.
At MFS®, we put our clients’ assets to work responsibly by carefully navigating the increasing complexity of global markets and economies. Guided by our long-term philosophy and adhering to our commitment to sustainable investing, we tune out the noise and aim to uncover what we believe are the best, most durable investment opportunities in the market. Our unique global investment platform combines collective expertise, long-term discipline, and thoughtful risk management to create sustainable value for investors.
Respectfully,
Michael W. Roberge
Chief Executive Officer
MFS Investment Management
October 15, 2021
The opinions expressed in this letter are subject to change and may not be relied upon for investment advice. No forecasts can be guaranteed.
Portfolio structure (i)
Fixed income sectors (i)
| Mortgage-Backed Securities | 45.0% |
| U.S. Treasury Securities | 40.1% |
| Commercial Mortgage-Backed Securities | 5.1% |
| Municipal Bonds | 2.0% |
| Collateralized Debt Obligations | 1.4% |
| Investment Grade Corporates | 1.3% |
| U.S. Government Agencies | 0.4% |
| Non-U.S. Government Bonds | 0.1% |
| Asset-Backed Securities | 0.1% |
Composition including fixed income credit quality (a)(i)
| AAA | 5.4% |
| AA | 1.7% |
| A | 2.5% |
| BBB | 0.3% |
| U.S. Government | 40.0% |
| Federal Agencies | 45.5% |
| Not Rated | 0.1% |
| Cash & Cash Equivalents | 4.6% |
| Other | (0.1)% |
Portfolio facts (i)
| Average Duration (d) | 5.2 |
| Average Effective Maturity (m) | 5.9 yrs. |
| (a) | For all securities other than those specifically described below, ratings are assigned to underlying securities utilizing ratings from Moody’s, Fitch, and Standard & Poor’s rating agencies and applying the following hierarchy: If all three agencies provide a rating, the middle rating (after dropping the highest and lowest ratings) is assigned; if two of the three agencies rate a security, the lower of the two is assigned. If none of the 3 rating agencies above assign a rating, but the security is rated by DBRS Morningstar, then the DBRS Morningstar rating is assigned. If none of the 4 rating agencies listed above rate the security, but the security is rated by the Kroll Bond Rating Agency (KBRA), then the KBRA rating is assigned. Ratings are shown in the S&P and Fitch scale (e.g., AAA). Securities rated BBB or higher are considered investment grade. All ratings are subject to change. U.S. Government includes securities issued by the U.S. Department of the Treasury. Federal Agencies includes rated and unrated U.S. Agency fixed-income securities, U.S. Agency mortgage-backed securities, and collateralized mortgage obligations of U.S. Agency mortgage-backed securities. Not Rated includes fixed income securities and fixed income derivatives that have not been rated by any rating agency. The fund may or may not have held all of these instruments on this date. The fund is not rated by these agencies. |
Portfolio Composition - continued
| (d) | Duration is a measure of how much a bond’s price is likely to fluctuate with general changes in interest rates, e.g., if rates rise 1.00%, a bond with a 5-year duration is likely to lose about 5.00% of its value due to the interest rate move. |
| (i) | For purposes of this presentation, the components include the value of securities, and reflect the impact of the equivalent exposure of derivative positions, if any. These amounts may be negative from time to time. Equivalent exposure is a calculated amount that translates the derivative position into a reasonable approximation of the amount of the underlying asset that the portfolio would have to hold at a given point in time to have the same price sensitivity that results from the portfolio’s ownership of the derivative contract. When dealing with derivatives, equivalent exposure is a more representative measure of the potential impact of a position on portfolio performance than value. The bond component will include any accrued interest amounts. |
| (m) | In determining each instrument’s effective maturity for purposes of calculating the fund’s dollar-weighted average effective maturity, MFS uses the instrument’s stated maturity or, if applicable, an earlier date on which MFS believes it is probable that a maturity-shortening device (such as a put, pre-refunding or prepayment) will cause the instrument to be repaid. Such an earlier date can be substantially shorter than the instrument’s stated maturity. |
Where the fund holds convertible bonds, they are treated as part of the equity portion of the portfolio.
Cash & Cash Equivalents includes any cash, investments in money market funds, short-term securities, and other assets less liabilities. Please see the Statement of Assets and Liabilities for additional information related to the fund’s cash position and other assets and liabilities.
Other includes equivalent exposure from currency derivatives and/or any offsets to derivative positions and may be negative.
Percentages are based on net assets as of August 31, 2021.
The portfolio is actively managed and current holdings may be different.
Expense Table
Fund expenses borne by the shareholders during the period,
March 1, 2021 through August 31, 2021
As a shareholder of the fund, you incur two types of costs: (1) transaction costs, including sales charges (loads) on certain purchase or redemption payments, and (2) ongoing costs, including management fees; distribution and service (12b-1) fees; and other fund expenses. This example is intended to help you understand your ongoing costs (in dollars) of investing in the fund and to compare these costs with the ongoing costs of investing in other mutual funds.
The example is based on an investment of $1,000 invested at the beginning of the period and held for the entire period March 1, 2021 through August 31, 2021.
The expenses include the payment of a portion of the transfer-agent-related expenses of MFS funds that invest in the fund. For further information, please see the Notes to Financial Statements.
Actual Expenses
The first line for each share class in the following table provides information about actual account values and actual expenses. You may use the information in this line, together with the amount you invested, to estimate the expenses that you paid over the period. Simply divide your account value by $1,000 (for example, an $8,600 account value divided by $1,000 = 8.6), then multiply the result by the number in the first line under the heading entitled “Expenses Paid During Period” to estimate the expenses you paid on your account during this period.
Hypothetical Example for Comparison Purposes
The second line for each share class in the following table provides information about hypothetical account values and hypothetical expenses based on the fund’s actual expense ratio and an assumed rate of return of 5% per year before expenses, which is not the fund’s actual return. The hypothetical account values and expenses may not be used to estimate the actual ending account balance or expenses you paid for the period. You may use this information to compare the ongoing costs of investing in the fund and other funds. To do so, compare this 5% hypothetical example with the 5% hypothetical examples that appear in the shareholder reports of the other funds.
Please note that the expenses shown in the table are meant to highlight your ongoing costs only and do not reflect any transactional costs, such as sales charges (loads). Therefore, the second line for each share class in the table is useful in comparing ongoing costs only, and will not help you determine the relative total costs of owning different funds. In addition, if these transactional costs were included, your costs would have been higher.
Expense Table - continued
Share
Class | | Annualized
Expense
Ratio | Beginning
Account Value
3/01/21 | Ending
Account Value
8/31/21 | Expenses
Paid During
Period (p)
3/01/21-8/31/21 |
| A | Actual | 0.79% | $1,000.00 | $1,008.41 | $4.00 |
| Hypothetical (h) | 0.79% | $1,000.00 | $1,021.22 | $4.02 |
| B | Actual | 1.54% | $1,000.00 | $1,004.62 | $7.78 |
| Hypothetical (h) | 1.54% | $1,000.00 | $1,017.44 | $7.83 |
| C | Actual | 1.54% | $1,000.00 | $1,003.63 | $7.78 |
| Hypothetical (h) | 1.54% | $1,000.00 | $1,017.44 | $7.83 |
| I | Actual | 0.54% | $1,000.00 | $1,008.70 | $2.73 |
| Hypothetical (h) | 0.54% | $1,000.00 | $1,022.48 | $2.75 |
| R1 | Actual | 1.54% | $1,000.00 | $1,004.62 | $7.78 |
| Hypothetical (h) | 1.54% | $1,000.00 | $1,017.44 | $7.83 |
| R2 | Actual | 1.04% | $1,000.00 | $1,007.15 | $5.26 |
| Hypothetical (h) | 1.04% | $1,000.00 | $1,019.96 | $5.30 |
| R3 | Actual | 0.79% | $1,000.00 | $1,007.43 | $4.00 |
| Hypothetical (h) | 0.79% | $1,000.00 | $1,021.22 | $4.02 |
| R4 | Actual | 0.54% | $1,000.00 | $1,009.68 | $2.74 |
| Hypothetical (h) | 0.54% | $1,000.00 | $1,022.48 | $2.75 |
| R6 | Actual | 0.44% | $1,000.00 | $1,010.20 | $2.23 |
| Hypothetical (h) | 0.44% | $1,000.00 | $1,022.99 | $2.24 |
| (h) | 5% class return per year before expenses. |
| (p) | “Expenses Paid During Period” are equal to each class’s annualized expense ratio, as shown above, multiplied by the average account value over the period, multiplied by 184/365 (to reflect the one-half year period). Expenses paid do not include any applicable sales charges (loads). If these transaction costs had been included, your costs would have been higher. |
Notes to Expense Table
Changes to the fund's fee arrangements will occur during the fund's current fiscal year. Had these fee changes been in effect during the six month period, the annualized expense ratios, the actual expenses paid during the period, and the hypothetical expenses paid during the period would have been approximately 0.76%, $3.85, and $3.87 for Class A, 1.51%, $7.63, and $7.68 for Class B, 1.51%, $7.63, and $7.68 for Class C, 0.51%, $2.58, and $2.60 for Class I, 1.51%, $7.63, and $7.68 for Class R1, 1.01%, $5.11, and $5.14 for Class R2, 0.76%, $3.85, and $3.87 for Class R3, 0.51%, $2.58, and $2.60 for Class R4, 0.40%, $2.03, and $2.04 for Class R6, respectively. For further information about the fund’s fee arrangements and changes to those fee arrangements, please see Note 3 in the Notes to Financial Statements.
Portfolio of Investments
8/31/21 (unaudited)
The Portfolio of Investments is a complete list of all securities owned by your fund. It is categorized by broad-based asset classes.
| Issuer | | | Shares/Par | Value ($) |
| Bonds – 95.1% | | | |
| Asset-Backed & Securitized – 6.5% |
| Allegro CLO Ltd., 2016-1A, “BR2”, FLR, 1.676% (LIBOR - 3mo. + 1.55%), 1/15/2030 (n) | | $ | 6,215,880 | $ 6,216,626 |
| Arbor Realty Trust, Inc., CLO, 2021-FL1, “B”, FLR, 1.595% (LIBOR - 1mo. + 1.5%), 12/15/2035 (n) | | | 3,901,000 | 3,904,636 |
| Bancorp Commercial Mortgage Trust, 2019-CRE6, “A”, FLR, 1.214% (LIBOR - 1mo. + 1.05%), 9/15/2036 (n) | | | 1,383,397 | 1,383,544 |
| Bank, 2021-BN35, “XA”, 1.159%, 7/15/2031 (i) | | | 13,420,652 | 1,101,331 |
| BBCMS Mortgage Trust, 2021-C10, “XA”, 1.433%, 7/15/2054 (i) | | | 21,386,971 | 2,133,053 |
| BBCMS Mortgage Trust, 2021-C9, “XA”, 1.767%, 2/15/2054 (i) | | | 13,986,927 | 1,729,776 |
| Benchmark Mortgage Trust, 2020-B18, “A5”, 1.925%, 7/15/2053 | | | 5,074,627 | 5,083,421 |
| Benchmark Mortgage Trust, 2021-B23, “XA”, 1.385%, 2/15/2054 (i) | | | 44,053,867 | 4,125,107 |
| Benchmark Mortgage Trust, 2021-B24, “XA”, 1.273%, 3/15/2054 (i) | | | 26,380,656 | 2,239,723 |
| Benchmark Mortgage Trust, 2021-B26, “XA”, 0.999%, 6/15/2054 (i) | | | 28,371,816 | 1,930,992 |
| Benchmark Mortgage Trust, 2021-B27, “XA”, 1.389%, 7/15/2054 (i) | | | 33,851,133 | 3,321,680 |
| Benchmark Mortgage Trust, 2021-B28, “XA”, 1.406%, 8/15/2054 (i) | | | 40,536,065 | 4,026,897 |
| BPCRE Holder LLC, FLR, 0.942% (LIBOR - 1mo. + 0.85%), 2/15/2037 (n) | | | 1,747,800 | 1,746,700 |
| BPCRE Holder LLC, FLR, 1.642% (LIBOR - 1mo. + 1.55%), 2/15/2037 (n) | | | 1,306,500 | 1,306,090 |
| BXMT Ltd., 2021-FL4, “AS”, FLR, 1.395% (LIBOR - 1mo. + 1.3%), 5/15/2038 (n) | | | 7,779,500 | 7,779,136 |
| Cantor Commercial Real Estate, 2019-CF3, “A4”, 3.005%, 1/15/2053 | | | 5,105,000 | 5,513,687 |
| Capital Automotive, 2020-1A, “A4”, REIT, 3.19%, 2/15/2050 (n) | | | 1,256,938 | 1,291,388 |
| Citigroup Commercial Mortgage Trust, 2019-C7, “A4”, 3.102%, 12/15/2072 | | | 1,830,317 | 1,999,017 |
| Citigroup Commercial Mortgage Trust, 2019-XA, “C7”, 1.002%, 12/15/2072 (i)(n) | | | 23,528,832 | 1,435,487 |
| Commercial Mortgage Pass-Through Certificates, 2020-BN28, “A4”, 1.844%, 3/15/2063 | | | 1,526,471 | 1,521,956 |
| Commercial Mortgage Pass-Through Certificates, 2020-BN29, “A4”, 1.997%, 11/15/2053 | | | 2,554,811 | 2,574,829 |
| Commercial Mortgage Pass-Through Certificates, 2020-BN30, “A4”, 1.925%, 12/15/2053 | | | 4,192,000 | 4,203,094 |
Portfolio of Investments (unaudited) – continued
| Issuer | | | Shares/Par | Value ($) |
| Bonds – continued | | | |
| Asset-Backed & Securitized – continued |
| Commercial Mortgage Pass-Through Certificates, 2021-BN31, “XA”, 1.443%, 2/15/2054 (i) | | $ | 33,913,025 | $ 3,456,059 |
| Commercial Mortgage Pass-Through Certificates, 2021-BN32, “XA”, 0.893%, 4/15/2054 (i) | | | 19,077,937 | 1,128,058 |
| Commercial Mortgage Trust, 2014-CR19, “A5”, 3.796%, 8/10/2047 | | | 1,000,000 | 1,082,728 |
| Commercial Mortgage Trust, 2015-DC1, “A5”, 3.35%, 2/10/2048 | | | 4,990,000 | 5,367,460 |
| Commercial Mortgage Trust, 2015-LC21, “A4”, 3.708%, 7/10/2048 | | | 3,135,000 | 3,419,366 |
| Commercial Mortgage Trust, 2015-PC1, “A5”, 3.902%, 7/10/2050 | | | 5,300,000 | 5,813,239 |
| Commercial Mortgage Trust, 2017-COR2, “A3”, 3.51%, 9/10/2050 | | | 5,351,861 | 5,939,461 |
| CSAIL Commercial Mortgage Trust, 2015-C2, “A4”, 3.504%, 6/15/2057 | | | 5,341,994 | 5,776,161 |
| GS Mortgage Securities Trust, 2015-GC30, “A4”, 3.382%, 5/10/2050 | | | 5,951,000 | 6,439,943 |
| GS Mortgage Securities Trust, 2015-GC32, “A2”, 3.062%, 7/10/2048 | | | 511,278 | 521,746 |
| GS Mortgage Securities Trust, 2020-GC45, “A5”, 2.911%, 2/13/2053 | | | 3,429,659 | 3,702,126 |
| KREF Ltd., 2018-FT1, “AS”, FLR, 1.393% (LIBOR - 1mo. + 1.3%), 2/15/2039 (n) | | | 759,000 | 759,000 |
| LoanCore Ltd., 2021-CRE5, “AS”, FLR, 1.845% (LIBOR - 1mo. + 1.75%), 7/15/2036 (n) | | | 6,508,500 | 6,510,529 |
| Madison Park Funding Ltd., 2014-13A, “BR2”, FLR, 1.634% (LIBOR - 3mo. + 1.5%), 4/19/2030 (n) | | | 5,711,934 | 5,738,397 |
| MF1 CLO Ltd., 2021-FL5, “AS”, FLR, 1.364% (LIBOR - 1mo. + 1.2%), 7/15/2036 (n) | | | 3,875,500 | 3,877,911 |
| MF1 CLO Ltd., 2021-FL5, “B”, FLR, 1.614% (LIBOR - 1mo. + 1.45%), 7/15/2036 (n) | | | 4,881,500 | 4,887,572 |
| MF1 Multi-Family Housing Mortgage Loan Trust, 2020-FL4, “A”, FLR, 1.864% (LIBOR - 1mo. + 1.7%), 11/15/2035 (n) | | | 4,790,500 | 4,841,362 |
| Morgan Stanley Bank of America Merrill Lynch Trust, 2017-C34, “A4”, 3.536%, 11/15/2052 | | | 1,650,987 | 1,834,874 |
| Morgan Stanley Capital I Trust, 2018-H4, “XA”, 1.025%, 12/15/2051 (i) | | | 24,876,038 | 1,284,449 |
| Morgan Stanley Capital I Trust, 2021-L5, “XA”, 1.425%, 5/15/2054 (i) | | | 16,833,921 | 1,614,878 |
| Morgan Stanley Capital I Trust, 2021-L6, “XA”, 1.356%, 6/15/2054 (i) | | | 20,775,860 | 1,823,688 |
Portfolio of Investments (unaudited) – continued
| Issuer | | | Shares/Par | Value ($) |
| Bonds – continued | | | |
| Asset-Backed & Securitized – continued |
| Palmer Square Loan Funding Ltd., 2020-1A, “A2”, FLR, 1.481% (LIBOR - 3mo. + 1.35%), 2/20/2028 (n) | | $ | 3,163,115 | $ 3,147,628 |
| PFP III Ltd., 2021-7, “AS”, FLR, 1.245% (LIBOR - 1mo. + 1.15%), 4/14/2038 (n) | | | 5,441,728 | 5,424,712 |
| Symphony CLO Ltd., 2016-17A, “BR”, FLR, 1.326% (LIBOR - 3mo. + 1.2%), 4/15/2028 (n) | | | 4,840,622 | 4,833,656 |
| UBS Commercial Mortgage Trust, 2017-C1, “A4”, 3.544%, 11/15/2050 | | | 3,359,567 | 3,741,462 |
| Wells Fargo Commercial Mortgage Trust, 2018-C48, “XA”, 1.113%, 1/15/2052 (i)(n) | | | 14,459,908 | 830,071 |
| Wells Fargo Commercial Mortgage Trust, 2019-C54, “A4”, 3.146%, 12/15/2052 | | | 7,948,914 | 8,723,381 |
| Wells Fargo Commercial Mortgage Trust, 2020-C58, “A4”, 2.092%, 7/15/2053 | | | 2,285,000 | 2,317,541 |
| Wells Fargo Commercial Mortgage Trust, 2021-C60, 1.684%, 8/15/2054 (i) | | | 20,992,114 | 2,486,629 |
| | | | | $173,892,257 |
| Automotive – 0.2% |
| Hyundai Capital America, 2.85%, 11/01/2022 (n) | | $ | 2,831,000 | $ 2,904,737 |
| Hyundai Capital America, 2.375%, 2/10/2023 (n) | | | 1,899,000 | 1,944,112 |
| | | | | $4,848,849 |
| Consumer Services – 0.1% |
| Conservation Fund, 3.474%, 12/15/2029 | | $ | 2,018,000 | $ 2,162,802 |
| Industrial – 0.1% |
| Howard University, Washington D.C., 2.638%, 10/01/2021 | | $ | 436,000 | $ 436,770 |
| Howard University, Washington D.C., 2.738%, 10/01/2022 | | | 458,000 | 467,223 |
| Howard University, Washington D.C., 2.801%, 10/01/2023 | | | 505,000 | 524,277 |
| Howard University, Washington D.C., AGM, 2.416%, 10/01/2024 | | | 556,000 | 571,241 |
| Howard University, Washington D.C., AGM, 2.516%, 10/01/2025 | | | 688,000 | 709,931 |
| | | | | $2,709,442 |
| Major Banks – 0.3% |
| JPMorgan Chase & Co., 1.578% to 4/22/2026, FLR (SOFR + 0.885%) to 4/22/2027 | | $ | 5,416,000 | $ 5,466,771 |
| UBS Group AG, 3.491%, 5/23/2023 (n) | | | 2,120,000 | 2,167,349 |
| | | | | $7,634,120 |
Portfolio of Investments (unaudited) – continued
| Issuer | | | Shares/Par | Value ($) |
| Bonds – continued | | | |
| Medical & Health Technology & Services – 0.7% |
| Montefiore Obligated Group, AGM, 5.246%, 11/01/2048 | | $ | 7,884,000 | $ 10,341,217 |
| ProMedica Toledo Hospital, “B”, AGM, 5.325%, 11/15/2028 | | | 4,139,000 | 4,953,878 |
| ProMedica Toledo Hospital, “B”, AGM, 5.75%, 11/15/2038 | | | 1,992,000 | 2,398,261 |
| | | | | $17,693,356 |
| Mortgage-Backed – 44.9% | |
| Fannie Mae, 2.152%, 1/25/2023 | | $ | 1,773,679 | $ 1,801,545 |
| Fannie Mae, 2.41%, 5/01/2023 | | | 1,367,831 | 1,401,011 |
| Fannie Mae, 2.55%, 5/01/2023 | | | 1,176,378 | 1,206,948 |
| Fannie Mae, 5.5%, 6/01/2023 - 5/01/2044 | | | 11,572,391 | 13,376,607 |
| Fannie Mae, 5%, 3/01/2024 - 3/01/2042 | | | 10,704,359 | 12,187,841 |
| Fannie Mae, 4.5%, 5/01/2025 - 6/01/2044 | | | 26,166,066 | 29,219,286 |
| Fannie Mae, 3.5%, 5/25/2025 - 5/01/2049 | | | 37,254,598 | 40,172,568 |
| Fannie Mae, 2.641%, 12/25/2026 | | | 4,567,009 | 4,912,231 |
| Fannie Mae, 4%, 3/25/2028 - 7/01/2047 | | | 51,332,732 | 56,237,990 |
| Fannie Mae, 3%, 11/01/2028 - 5/25/2053 | | | 32,526,801 | 34,334,715 |
| Fannie Mae, 2.5%, 11/01/2031 - 10/01/2046 | | | 5,366,130 | 5,559,708 |
| Fannie Mae, 3.5%, 12/25/2031 - 2/25/2036 (i) | | | 2,063,991 | 217,656 |
| Fannie Mae, 6.5%, 1/01/2032 - 10/01/2037 | | | 918,689 | 1,057,041 |
| Fannie Mae, 6%, 1/01/2033 - 12/01/2037 | | | 2,616,125 | 3,045,678 |
| Fannie Mae, 3%, 2/25/2033 (i) | | | 2,035,537 | 199,602 |
| Fannie Mae, 2%, 10/25/2040 - 4/25/2046 | | | 2,960,286 | 3,026,980 |
| Fannie Mae, 1.75%, 9/25/2041 - 10/25/2041 | | | 8,518,890 | 8,684,405 |
| Fannie Mae, 2.75%, 9/25/2042 | | | 2,467,683 | 2,568,805 |
| Fannie Mae, UMBS, 5.5%, 5/01/2044 | | | 1,753,029 | 2,033,423 |
| Fannie Mae, UMBS, 2.5%, 2/01/2050 - 7/01/2050 | | | 8,978,626 | 9,417,242 |
| Fannie Mae, UMBS, 2%, 1/01/2051 - 2/01/2051 | | | 4,457,547 | 4,546,206 |
| Freddie Mac, 5%, 12/01/2021 - 12/01/2044 | | | 11,340,668 | 12,912,019 |
| Freddie Mac, 5.5%, 5/01/2022 - 9/01/2041 | | | 5,033,861 | 5,811,441 |
| Freddie Mac, 4.5%, 11/01/2022 - 5/01/2042 | | | 4,506,952 | 5,017,254 |
| Freddie Mac, 3.32%, 2/25/2023 | | | 4,605,000 | 4,781,292 |
| Freddie Mac, 3.25%, 4/25/2023 | | | 9,000,000 | 9,356,611 |
| Freddie Mac, 6%, 6/01/2023 - 10/01/2038 | | | 1,624,586 | 1,891,568 |
| Freddie Mac, 3.06%, 7/25/2023 | | | 871,000 | 906,485 |
| Freddie Mac, 3.531%, 7/25/2023 | | | 240,000 | 252,560 |
| Freddie Mac, 3.458%, 8/25/2023 | | | 4,600,000 | 4,847,717 |
| Freddie Mac, 1.017%, 4/25/2024 (i) | | | 45,654,403 | 822,975 |
| Freddie Mac, 0.732%, 7/25/2024 (i) | | | 58,313,821 | 732,847 |
| Freddie Mac, 3.303%, 7/25/2024 | | | 4,700,000 | 5,037,929 |
| Freddie Mac, 3.064%, 8/25/2024 | | | 6,098,509 | 6,472,664 |
| Freddie Mac, 2.67%, 12/25/2024 | | | 10,788,000 | 11,450,868 |
| Freddie Mac, 3.062%, 12/25/2024 | | | 325,000 | 349,035 |
| Freddie Mac, 2.811%, 1/25/2025 | | | 9,000,000 | 9,606,383 |
Portfolio of Investments (unaudited) – continued
| Issuer | | | Shares/Par | Value ($) |
| Bonds – continued | | | |
| Mortgage-Backed – continued | |
| Freddie Mac, 3.329%, 5/25/2025 | | $ | 16,621,000 | $ 18,106,206 |
| Freddie Mac, 3.284%, 6/25/2025 | | | 1,125,000 | 1,224,196 |
| Freddie Mac, 4%, 7/01/2025 - 4/01/2044 | | | 3,964,807 | 4,353,049 |
| Freddie Mac, 3.01%, 7/25/2025 | | | 2,651,000 | 2,864,571 |
| Freddie Mac, 3.5%, 11/15/2025 - 10/25/2058 | | | 47,461,429 | 50,847,869 |
| Freddie Mac, 3.3%, 10/25/2026 | | | 7,808,000 | 8,669,084 |
| Freddie Mac, 1.481%, 3/25/2027 (i) | | | 5,583,000 | 397,311 |
| Freddie Mac, 3.117%, 6/25/2027 | | | 5,237,000 | 5,798,191 |
| Freddie Mac, 0.711%, 7/25/2027 (i) | | | 105,743,174 | 3,301,609 |
| Freddie Mac, 0.562%, 8/25/2027 (i) | | | 83,326,548 | 2,005,353 |
| Freddie Mac, 0.427%, 1/25/2028 (i) | | | 151,146,474 | 2,871,526 |
| Freddie Mac, 0.434%, 1/25/2028 (i) | | | 62,212,027 | 1,215,735 |
| Freddie Mac, 0.269%, 2/25/2028 (i) | | | 176,673,473 | 1,762,724 |
| Freddie Mac, 2.5%, 3/15/2028 | | | 664,700 | 676,999 |
| Freddie Mac, 0.262%, 4/25/2028 (i) | | | 113,603,475 | 1,057,807 |
| Freddie Mac, 3%, 6/15/2028 - 2/25/2059 | | | 33,091,825 | 35,183,297 |
| Freddie Mac, 1.218%, 7/25/2029 (i) | | | 19,381,215 | 1,503,672 |
| Freddie Mac, 1.268%, 8/25/2029 (i) | | | 33,888,326 | 2,756,964 |
| Freddie Mac, 1.915%, 4/25/2030 (i) | | | 14,430,646 | 2,061,278 |
| Freddie Mac, 1.984%, 4/25/2030 (i) | | | 20,077,463 | 2,982,975 |
| Freddie Mac, 1.765%, 5/25/2030 (i) | | | 12,033,779 | 1,610,039 |
| Freddie Mac, 1.906%, 5/25/2030 (i) | | | 26,880,424 | 3,870,765 |
| Freddie Mac, 1.436%, 6/25/2030 (i) | | | 11,124,134 | 1,212,050 |
| Freddie Mac, 1.704%, 8/25/2030 (i) | | | 10,235,210 | 1,344,706 |
| Freddie Mac, 1.263%, 9/25/2030 (i) | | | 6,568,138 | 645,438 |
| Freddie Mac, 1.172%, 11/25/2030 (i) | | | 13,158,725 | 1,213,650 |
| Freddie Mac, 0.423%, 1/25/2031 (i) | | | 50,236,349 | 1,371,251 |
| Freddie Mac, 0.874%, 1/25/2031 (i) | | | 19,512,958 | 1,344,080 |
| Freddie Mac, 1.027%, 1/25/2031 (i) | | | 14,681,587 | 1,190,954 |
| Freddie Mac, 0.625%, 3/25/2031 (i) | | | 40,555,216 | 1,807,104 |
| Freddie Mac, 0.837%, 3/25/2031 (i) | | | 17,260,719 | 1,144,555 |
| Freddie Mac, 1.333%, 5/25/2031 (i) | | | 7,120,528 | 776,007 |
| Freddie Mac, 5.5%, 2/15/2036 (i) | | | 504,758 | 92,541 |
| Freddie Mac, 2%, 8/15/2036 | | | 4,502,048 | 4,559,240 |
| Freddie Mac, 6.5%, 5/01/2037 | | | 183,405 | 214,102 |
| Freddie Mac, 4.5%, 12/15/2040 (i) | | | 189,733 | 18,282 |
| Freddie Mac, 1.75%, 8/15/2041 | | | 1,882,760 | 1,931,874 |
| Freddie Mac, UMBS, 2.5%, 8/01/2040 | | | 823,025 | 870,266 |
| Freddie Mac, UMBS, 3%, 2/01/2050 - 7/01/2050 | | | 3,934,751 | 4,165,046 |
| Ginnie Mae, 5.5%, 3/15/2033 - 1/20/2042 | | | 2,265,348 | 2,616,713 |
| Ginnie Mae, 4.5%, 7/20/2033 - 7/20/2049 | | | 6,601,180 | 7,370,630 |
| Ginnie Mae, 5.698%, 8/20/2034 | | | 1,764,195 | 2,013,365 |
| Ginnie Mae, 4%, 5/16/2039 - 7/20/2049 | | | 6,522,063 | 7,007,301 |
Portfolio of Investments (unaudited) – continued
| Issuer | | | Shares/Par | Value ($) |
| Bonds – continued | | | |
| Mortgage-Backed – continued | |
| Ginnie Mae, 3.5%, 10/20/2041 (i) | | $ | 818,219 | $ 58,919 |
| Ginnie Mae, 3.5%, 12/15/2041 - 7/20/2043 | | | 10,323,375 | 11,194,802 |
| Ginnie Mae, 2.5%, 6/20/2042 - 8/20/2051 | | | 29,785,325 | 30,913,930 |
| Ginnie Mae, 4%, 8/16/2042 (i) | | | 899,355 | 118,761 |
| Ginnie Mae, 3%, 2/20/2043 - 8/20/2051 | | | 30,489,939 | 32,077,077 |
| Ginnie Mae, 2.25%, 9/20/2043 | | | 1,969,321 | 1,999,702 |
| Ginnie Mae, 5.87%, 4/20/2058 | | | 41,763 | 48,024 |
| Ginnie Mae, 0.558%, 2/16/2059 (i) | | | 3,615,401 | 154,715 |
| Ginnie Mae, TBA, 3.5%, 9/15/2051 | | | 56,717,230 | 59,690,453 |
| Ginnie Mae, TBA, 2%, 9/21/2051 | | | 16,350,000 | 16,689,135 |
| Ginnie Mae, TBA, 3%, 9/21/2051 | | | 14,650,000 | 15,315,545 |
| Ginnie Mae, TBA, 4%, 9/21/2051 | | | 20,525,000 | 21,730,844 |
| Ginnie Mae, TBA, 2.5%, 10/15/2051 | | | 20,925,000 | 21,659,827 |
| UMBS, TBA, 1.5%, 9/25/2036 - 10/19/2036 | | | 19,625,000 | 19,926,048 |
| UMBS, TBA, 2%, 9/25/2036 - 10/14/2051 | | | 226,700,000 | 230,420,678 |
| UMBS, TBA, 2.5%, 9/25/2036 - 10/25/2051 | | | 132,540,000 | 137,779,133 |
| UMBS, TBA, 3%, 9/25/2036 - 9/25/2051 | | | 82,985,603 | 86,822,127 |
| | | | | $ 1,200,087,231 |
| Municipals – 1.9% |
| California Earthquake Authority Rev., “B”, 1.327%, 7/01/2022 | | $ | 1,910,000 | $ 1,925,983 |
| California Earthquake Authority Rev., “B”, 1.477%, 7/01/2023 | | | 1,355,000 | 1,380,716 |
| Chicago, IL, Transit Authority Sales Tax Receipts Refunding Rev., Taxable, “B”, 1.838%, 12/01/2023 | | | 492,000 | 504,847 |
| Chicago, IL, Transit Authority Sales Tax Receipts Refunding Rev., Taxable, “B”, 2.064%, 12/01/2024 | | | 985,000 | 1,021,156 |
| Chicago, IL, Transit Authority Sales Tax Receipts Refunding Rev., Taxable, “B”, 2.214%, 12/01/2025 | | | 738,000 | 769,901 |
| Chicago, IL, Transit Authority Sales Tax Receipts Refunding Rev., Taxable, “B”, 2.481%, 12/01/2026 | | | 1,723,000 | 1,819,727 |
| Florida State Board of Administration Finance Corp. Rev., “A”, 1.705%, 7/01/2027 | | | 4,545,000 | 4,656,943 |
| Massachusetts Educational Financing Authority, Education Loan Rev., “A”, 2.562%, 7/01/2026 | | | �� 445,000 | 466,573 |
| Massachusetts Educational Financing Authority, Education Loan Rev., “A”, 2.682%, 7/01/2027 | | | 2,165,000 | 2,273,239 |
| Michigan Finance Authority Tobacco Settlement Asset-Backed Rev. (2006 Sold Tobacco Receipts), “A-1”, 2.326%, 6/01/2030 | | | 1,780,286 | 1,853,737 |
| New Jersey Economic Development Authority State Pension Funding Rev., Capital Appreciation, “B”, AGM, 0%, 2/15/2023 | | | 14,792,000 | 14,689,805 |
| New York Transportation Development Corp., Special Facilities Taxable Rev. (Terminal 4 John F. Kennedy International Airport Project), “B”, 1.36%, 12/01/2021 | | | 810,000 | 811,811 |
Portfolio of Investments (unaudited) – continued
| Issuer | | | Shares/Par | Value ($) |
| Bonds – continued | | | |
| Municipals – continued |
| New York Transportation Development Corp., Special Facilities Taxable Rev. (Terminal 4 John F. Kennedy International Airport Project), “B”, 1.61%, 12/01/2022 | | $ | 770,000 | $ 779,616 |
| Philadelphia, PA, School District, “A”, AGM, 5.995%, 9/01/2030 | | | 3,280,000 | 4,302,151 |
| Port Authority of NY & NJ, “AAA”, 1.086%, 7/01/2023 | | | 4,045,000 | 4,103,369 |
| Port Oakland, CA, Senior Lien Refunding Taxable Rev., “R”, 1.081%, 5/01/2024 | | | 1,150,000 | 1,162,060 |
| Port Oakland, CA, Senior Lien Refunding Taxable Rev., “R”, 1.517%, 5/01/2026 | | | 1,680,000 | 1,711,084 |
| Rhode Island Student Loan Authority, Education Loan Rev., “1”, 2.195%, 12/01/2039 | | | 770,000 | 794,545 |
| Texas Transportation Commission, Central Texas Turnpike System First Tier Refunding Rev., Taxable, “B”, 1.98%, 8/15/2042 | | | 3,260,000 | 3,304,385 |
| West Virginia Tobacco Settlement Financing Authority Asset-Backed Refunding, “A-1”, 1.497%, 6/01/2024 | | | 1,900,000 | 1,925,979 |
| West Virginia Tobacco Settlement Financing Authority Asset-Backed Refunding, “A-1”, 1.647%, 6/01/2025 | | | 1,550,000 | 1,570,260 |
| | | | | $51,827,887 |
| Supranational – 0.2% |
| Inter-American Development Bank, 4.375%, 1/24/2044 | | $ | 2,796,000 | $ 3,933,897 |
| U.S. Government Agencies and Equivalents – 0.4% |
| Small Business Administration, 6.07%, 3/01/2022 | | $ | 9,928 | $ 10,011 |
| Small Business Administration, 4.98%, 11/01/2023 | | | 45,117 | 46,773 |
| Small Business Administration, 4.89%, 12/01/2023 | | | 129,068 | 133,205 |
| Small Business Administration, 4.77%, 4/01/2024 | | | 150,575 | 155,989 |
| Small Business Administration, 5.52%, 6/01/2024 | | | 78,484 | 82,060 |
| Small Business Administration, 4.99%, 9/01/2024 | | | 121,724 | 126,518 |
| Small Business Administration, 4.86%, 10/01/2024 | | | 85,453 | 88,971 |
| Small Business Administration, 4.86%, 1/01/2025 | | | 164,010 | 171,949 |
| Small Business Administration, 5.11%, 4/01/2025 | | | 128,036 | 134,563 |
| Small Business Administration, 2.21%, 2/01/2033 | | | 1,073,237 | 1,123,044 |
| Small Business Administration, 2.22%, 3/01/2033 | | | 1,691,544 | 1,756,530 |
| Small Business Administration, 3.15%, 7/01/2033 | | | 1,643,460 | 1,765,617 |
| Small Business Administration, 3.16%, 8/01/2033 | | | 635,131 | 682,325 |
| Small Business Administration, 3.62%, 9/01/2033 | | | 686,397 | 746,123 |
| Tennessee Valley Authority, 0.75%, 5/15/2025 | | | 3,827,000 | 3,862,663 |
| | | | | $10,886,341 |
| U.S. Treasury Obligations – 39.8% |
| U.S. Treasury Bonds, 6.25%, 8/15/2023 | | $ | 1,445,000 | $ 1,615,183 |
| U.S. Treasury Bonds, 6%, 2/15/2026 | | | 5,933,000 | 7,320,766 |
| U.S. Treasury Bonds, 6.75%, 8/15/2026 | | | 981,000 | 1,266,601 |
Portfolio of Investments (unaudited) – continued
| Issuer | | | Shares/Par | Value ($) |
| Bonds – continued | | | |
| U.S. Treasury Obligations – continued |
| U.S. Treasury Bonds, 6.375%, 8/15/2027 | | $ | 2,309,000 | $ 3,042,558 |
| U.S. Treasury Bonds, 1.625%, 5/15/2031 | | | 41,833,000 | 43,133,745 |
| U.S. Treasury Bonds, 4.375%, 2/15/2038 | | | 2,078,000 | 2,920,321 |
| U.S. Treasury Bonds, 4.5%, 8/15/2039 | | | 11,926,300 | 17,192,041 |
| U.S. Treasury Bonds, 3.125%, 2/15/2043 | | | 9,748,800 | 11,946,088 |
| U.S. Treasury Bonds, 2.875%, 5/15/2043 | | | 27,528,200 | 32,495,105 |
| U.S. Treasury Bonds, 2.5%, 2/15/2045 | | | 97,983,000 | 109,155,359 |
| U.S. Treasury Bonds, 2.875%, 11/15/2046 | | | 26,245,000 | 31,387,380 |
| U.S. Treasury Notes, 1.5%, 9/15/2022 | | | 35,000,000 | 35,511,328 |
| U.S. Treasury Notes, 0.125%, 9/30/2022 | | | 49,534,000 | 49,553,349 |
| U.S. Treasury Notes, 0.125%, 2/28/2023 | | | 51,824,200 | 51,803,956 |
| U.S. Treasury Notes, 2.5%, 3/31/2023 | | | 131,000,000 | 135,851,094 |
| U.S. Treasury Notes, 0.125%, 5/31/2023 | | | 33,455,000 | 33,426,249 |
| U.S. Treasury Notes, 0.125%, 6/30/2023 | | | 18,346,500 | 18,332,883 |
| U.S. Treasury Notes, 2.5%, 8/15/2023 (f) | | | 136,673,000 | 142,785,913 |
| U.S. Treasury Notes, 0.125%, 12/15/2023 | | | 51,749,000 | 51,579,199 |
| U.S. Treasury Notes, 2.875%, 7/31/2025 | | | 30,757,000 | 33,462,655 |
| U.S. Treasury Notes, 0.25%, 9/30/2025 | | | 19,700,000 | 19,391,418 |
| U.S. Treasury Notes, 2.625%, 12/31/2025 | | | 20,900,000 | 22,637,313 |
| U.S. Treasury Notes, 2%, 11/15/2026 | | | 51,959,000 | 55,115,103 |
| U.S. Treasury Notes, 2.75%, 2/15/2028 | | | 54,157,000 | 60,093,115 |
| U.S. Treasury Notes, 1%, 7/31/2028 | | | 32,248,000 | 32,086,760 |
| U.S. Treasury Notes, 2.375%, 5/15/2029 | | | 19,515,500 | 21,288,666 |
| U.S. Treasury Notes, 1.625%, 8/15/2029 | | | 29,405,000 | 30,446,810 |
| U.S. Treasury Notes, 1.75%, 11/15/2029 | | | 8,564,000 | 8,949,380 |
| | | | | $ 1,063,790,338 |
| Total Bonds (Identified Cost, $2,448,835,895) | | $ 2,539,466,520 |
| Investment Companies (h) – 27.8% |
| Money Market Funds – 27.8% | |
| MFS Institutional Money Market Portfolio, 0.04% (v) (Identified Cost, $742,448,403) | | | 742,449,918 | $ 742,449,918 |
|
|
| Other Assets, Less Liabilities – (22.9)% | | (610,645,540) |
| Net Assets – 100.0% | $ 2,671,270,898 |
| (f) | All or a portion of the security has been segregated as collateral for open futures contracts. | | | |
| (h) | An affiliated issuer, which may be considered one in which the fund owns 5% or more of the outstanding voting securities, or a company which is under common control. At period end, the aggregate values of the fund's investments in affiliated issuers and in unaffiliated issuers were $742,449,918 and $2,539,466,520, respectively. | | | |
| (i) | Interest only security for which the fund receives interest on notional principal (Par amount). Par amount shown is the notional principal and does not reflect the cost of the security. | | | |
Portfolio of Investments (unaudited) – continued
| (n) | Securities exempt from registration under Rule 144A of the Securities Act of 1933. These securities may be sold in the ordinary course of business in transactions exempt from registration, normally to qualified institutional buyers. At period end, the aggregate value of these securities was $72,930,643, representing 2.7% of net assets. | | | |
| (v) | Affiliated issuer that is available only to investment companies managed by MFS. The rate quoted for the MFS Institutional Money Market Portfolio is the annualized seven-day yield of the fund at period end. | | | |
| The following abbreviations are used in this report and are defined: |
| AGM | Assured Guaranty Municipal |
| CLO | Collateralized Loan Obligation |
| FLR | Floating Rate. Interest rate resets periodically based on the parenthetically disclosed reference rate plus a spread (if any). The period-end rate reported may not be the current rate. All reference rates are USD unless otherwise noted. |
| LIBOR | London Interbank Offered Rate |
| REIT | Real Estate Investment Trust |
| SOFR | Secured Overnight Financing Rate |
| TBA | To Be Announced |
| UMBS | Uniform Mortgage-Backed Security |
Derivative Contracts at 8/31/21
| Futures Contracts |
| Description | Long/
Short | Currency | Contracts | Notional
Amount | Expiration
Date | Value/Unrealized
Appreciation
(Depreciation) |
| Asset Derivatives |
| Interest Rate Futures | | |
| U.S. Treasury Note 10 yr | Long | USD | 670 | $89,413,594 | December – 2021 | $18,492 |
| U.S. Treasury Ultra Bond | Long | USD | 447 | 88,184,719 | December – 2021 | 555,922 |
| | | | | | | $574,414 |
| Liability Derivatives |
| Interest Rate Futures | | |
| U.S. Treasury Bond | Short | USD | 141 | $22,978,594 | December – 2021 | $(51,028) |
| U.S. Treasury Note 2 yr | Short | USD | 482 | 106,198,156 | December – 2021 | (88,320) |
| U.S. Treasury Note 5 yr | Short | USD | 174 | 21,527,063 | December – 2021 | (34,602) |
| U.S. Treasury Ultra Note 10 yr | Short | USD | 160 | 23,682,500 | December – 2021 | (17,531) |
| | | | | | | $(191,481) |
At August 31, 2021, the fund had liquid securities with an aggregate value of $3,037,030 to cover any collateral or margin obligations for certain derivative contracts.
See Notes to Financial Statements
Financial Statements
Statement of Assets and Liabilities
At 8/31/21 (unaudited)
This statement represents your fund’s balance sheet, which details the assets and liabilities comprising the total value of the fund.
| Assets | |
| Investments in unaffiliated issuers, at value (identified cost, $2,448,835,895) | $2,539,466,520 |
| Investments in affiliated issuers, at value (identified cost, $742,448,403) | 742,449,918 |
| Receivables for | |
| Investments sold | 898,245 |
| TBA sale commitments | 5,716,242 |
| Fund shares sold | 5,179,348 |
| Interest | 7,556,500 |
| Other assets | 15,526 |
| Total assets | $3,301,282,299 |
| Liabilities | |
| Payable to custodian | $110,131 |
| Payables for | |
| Distributions | 219,565 |
| Net daily variation margin on open futures contracts | 378,218 |
| Investments purchased | 12,033,503 |
| TBA purchase commitments | 615,068,745 |
| Fund shares reacquired | 1,578,481 |
| Payable to affiliates | |
| Investment adviser | 51,576 |
| Administrative services fee | 1,962 |
| Shareholder servicing costs | 443,371 |
| Distribution and service fees | 13,734 |
| Payable for independent Trustees' compensation | 5,534 |
| Accrued expenses and other liabilities | 106,581 |
| Total liabilities | $630,011,401 |
| Net assets | $2,671,270,898 |
| Net assets consist of | |
| Paid-in capital | $2,666,521,515 |
| Total distributable earnings (loss) | 4,749,383 |
| Net assets | $2,671,270,898 |
| Shares of beneficial interest outstanding | 262,638,328 |
Statement of Assets and Liabilities (unaudited) – continued
| | Net assets | Shares
outstanding | Net asset value
per share (a) |
| Class A | $780,095,293 | 76,636,927 | $10.18 |
| Class B | 3,430,183 | 337,405 | 10.17 |
| Class C | 13,219,190 | 1,296,860 | 10.19 |
| Class I | 152,196,869 | 14,974,921 | 10.16 |
| Class R1 | 2,156,877 | 212,143 | 10.17 |
| Class R2 | 57,032,733 | 5,609,244 | 10.17 |
| Class R3 | 42,835,697 | 4,210,172 | 10.17 |
| Class R4 | 69,141,931 | 6,793,566 | 10.18 |
| Class R6 | 1,551,162,125 | 152,567,090 | 10.17 |
| (a) | Maximum offering price per share was equal to the net asset value per share for all share classes, except for Class A, for which the maximum offering price per share was $10.63 [100 / 95.75 x $10.18]. On sales of $100,000 or more, the maximum offering price of Class A shares is reduced. A contingent deferred sales charge may be imposed on redemptions of Class A, Class B, and Class C shares. Redemption price per share was equal to the net asset value per share for Classes I, R1, R2, R3, R4, and R6. |
See Notes to Financial Statements
Financial Statements
Statement of Operations
Six months ended 8/31/21 (unaudited)
This statement describes how much your fund earned in investment income and accrued in expenses. It also describes any gains and/or losses generated by fund operations.
| Net investment income (loss) | |
| Income | |
| Interest | $20,304,930 |
| Dividends from affiliated issuers | 134,261 |
| Total investment income | $20,439,191 |
| Expenses | |
| Management fee | $4,846,298 |
| Distribution and service fees | 1,317,739 |
| Shareholder servicing costs | 1,213,391 |
| Administrative services fee | 177,389 |
| Independent Trustees' compensation | 20,271 |
| Custodian fee | 73,828 |
| Shareholder communications | 32,229 |
| Audit and tax fees | 33,199 |
| Legal fees | 9,366 |
| Miscellaneous | 133,530 |
| Total expenses | $7,857,240 |
| Fees paid indirectly | (69) |
| Reduction of expenses by investment adviser and distributor | (166,512) |
| Net expenses | $7,690,659 |
| Net investment income (loss) | $12,748,532 |
| Realized and unrealized gain (loss) |
| Realized gain (loss) (identified cost basis) | |
| Unaffiliated issuers | $(737,209) |
| Futures contracts | 4,603,796 |
| Net realized gain (loss) | $3,866,587 |
| Change in unrealized appreciation or depreciation | |
| Unaffiliated issuers | $6,594,270 |
| Futures contracts | 697,074 |
| Net unrealized gain (loss) | $7,291,344 |
| Net realized and unrealized gain (loss) | $11,157,931 |
| Change in net assets from operations | $23,906,463 |
See Notes to Financial Statements
Financial Statements
Statements of Changes in Net Assets
These statements describe the increases and/or decreases in net assets resulting from operations, any distributions, and any shareholder transactions.
| | Six months ended | Year ended |
| | 8/31/21
(unaudited) | 2/28/21 |
| Change in net assets | | |
| From operations | | |
| Net investment income (loss) | $12,748,532 | $37,460,682 |
| Net realized gain (loss) | 3,866,587 | 11,832,530 |
| Net unrealized gain (loss) | 7,291,344 | (43,921,875) |
| Change in net assets from operations | $23,906,463 | $5,371,337 |
| Total distributions to shareholders | $(16,953,804) | $(44,976,163) |
| Change in net assets from fund share transactions | $67,795,492 | $382,371,044 |
| Total change in net assets | $74,748,151 | $342,766,218 |
| Net assets | | |
| At beginning of period | 2,596,522,747 | 2,253,756,529 |
| At end of period | $2,671,270,898 | $2,596,522,747 |
See Notes to Financial Statements
Financial Statements
Financial Highlights
The financial highlights table is intended to help you understand the fund's financial performance for the semiannual period and the past 5 fiscal years. Certain information reflects financial results for a single fund share. The total returns in the table represent the rate that an investor would have earned (or lost) on an investment in the fund share class (assuming reinvestment of all distributions) held for the entire period.
| Class A | Six months
ended | Year ended |
| | 8/31/21
(unaudited) | 2/28/21 | 2/29/20 | 2/28/19
| 2/28/18 | 2/28/17 |
| Net asset value, beginning of period | $10.15 | $10.28 | $9.59 | $9.55 | $9.84 | $10.17 |
| Income (loss) from investment operations |
| Net investment income (loss) (d) | $0.04 | $0.14 | $0.20 | $0.20 | $0.20 | $0.19(c) |
| Net realized and unrealized gain (loss) | 0.05 | (0.10) | 0.70 | 0.06 | (0.26) | (0.29) |
| Total from investment operations | $0.09 | $0.04 | $0.90 | $0.26 | $(0.06) | $(0.10) |
| Less distributions declared to shareholders |
| From net investment income | $(0.06) | $(0.17) | $(0.21) | $(0.22) | $(0.23) | $(0.23) |
| Net asset value, end of period (x) | $10.18 | $10.15 | $10.28 | $9.59 | $9.55 | $9.84 |
| Total return (%) (r)(s)(t)(x) | 0.84(n) | 0.40 | 9.48 | 2.75 | (0.61) | (0.97)(c) |
Ratios (%) (to average net assets)
and Supplemental data: |
| Expenses before expense reductions (f) | 0.80(a) | 0.81 | 0.85 | 0.86 | 0.87 | 0.88(c) |
| Expenses after expense reductions (f) | 0.79(a) | 0.80 | 0.84 | 0.84 | 0.85 | 0.86(c) |
| Net investment income (loss) | 0.76(a) | 1.35 | 1.98 | 2.12 | 2.06 | 1.93(c) |
| Portfolio turnover | 211(n) | 307 | 113 | 56 | 20 | 48 |
| Net assets at end of period (000 omitted) | $780,095 | $805,484 | $702,063 | $596,678 | $625,457 | $685,256 |
See Notes to Financial Statements
Financial Highlights – continued
| Class B | Six months
ended | Year ended |
| | 8/31/21
(unaudited) | 2/28/21 | 2/29/20 | 2/28/19
| 2/28/18 | 2/28/17 |
| Net asset value, beginning of period | $10.14 | $10.27 | $9.58 | $9.54 | $9.82 | $10.16 |
| Income (loss) from investment operations |
| Net investment income (loss) (d) | $0.00(w) | $0.07 | $0.12 | $0.13 | $0.13 | $0.12(c) |
| Net realized and unrealized gain (loss) | 0.05 | (0.10) | 0.71 | 0.06 | (0.25) | (0.30) |
| Total from investment operations | $0.05 | $(0.03) | $0.83 | $0.19 | $(0.12) | $(0.18) |
| Less distributions declared to shareholders |
| From net investment income | $(0.02) | $(0.10) | $(0.14) | $(0.15) | $(0.16) | $(0.16) |
| Net asset value, end of period (x) | $10.17 | $10.14 | $10.27 | $9.58 | $9.54 | $9.82 |
| Total return (%) (r)(s)(t)(x) | 0.46(n) | (0.35) | 8.68 | 1.99 | (1.26) | (1.82)(c) |
Ratios (%) (to average net assets)
and Supplemental data: |
| Expenses before expense reductions (f) | 1.55(a) | 1.56 | 1.60 | 1.61 | 1.62 | 1.63(c) |
| Expenses after expense reductions (f) | 1.54(a) | 1.55 | 1.59 | 1.60 | 1.61 | 1.62(c) |
| Net investment income (loss) | 0.02(a) | 0.66 | 1.23 | 1.37 | 1.31 | 1.18(c) |
| Portfolio turnover | 211(n) | 307 | 113 | 56 | 20 | 48 |
| Net assets at end of period (000 omitted) | $3,430 | $4,468 | $7,711 | $8,811 | $12,968 | $18,013 |
| Class C | Six months
ended | Year ended |
| | 8/31/21
(unaudited) | 2/28/21 | 2/29/20 | 2/28/19
| 2/28/18 | 2/28/17 |
| Net asset value, beginning of period | $10.17 | $10.29 | $9.60 | $9.57 | $9.85 | $10.19 |
| Income (loss) from investment operations |
| Net investment income (loss) (d) | $0.00(w) | $0.07 | $0.12 | $0.13 | $0.13 | $0.12(c) |
| Net realized and unrealized gain (loss) | 0.04 | (0.09) | 0.71 | 0.05 | (0.25) | (0.30) |
| Total from investment operations | $0.04 | $(0.02) | $0.83 | $0.18 | $(0.12) | $(0.18) |
| Less distributions declared to shareholders |
| From net investment income | $(0.02) | $(0.10) | $(0.14) | $(0.15) | $(0.16) | $(0.16) |
| Net asset value, end of period (x) | $10.19 | $10.17 | $10.29 | $9.60 | $9.57 | $9.85 |
| Total return (%) (r)(s)(t)(x) | 0.36(n) | (0.25) | 8.66 | 1.88 | (1.25) | (1.81)(c) |
Ratios (%) (to average net assets)
and Supplemental data: |
| Expenses before expense reductions (f) | 1.55(a) | 1.56 | 1.60 | 1.61 | 1.62 | 1.63(c) |
| Expenses after expense reductions (f) | 1.54(a) | 1.55 | 1.59 | 1.60 | 1.61 | 1.62(c) |
| Net investment income (loss) | 0.02(a) | 0.63 | 1.23 | 1.37 | 1.30 | 1.17(c) |
| Portfolio turnover | 211(n) | 307 | 113 | 56 | 20 | 48 |
| Net assets at end of period (000 omitted) | $13,219 | $19,052 | $20,084 | $19,919 | $29,766 | $41,824 |
See Notes to Financial Statements
Financial Highlights – continued
| Class I | Six months
ended | Year ended |
| | 8/31/21
(unaudited) | 2/28/21 | 2/29/20 | 2/28/19
| 2/28/18 | 2/28/17 |
| Net asset value, beginning of period | $10.14 | $10.27 | $9.58 | $9.55 | $9.83 | $10.16 |
| Income (loss) from investment operations |
| Net investment income (loss) (d) | $0.05 | $0.17 | $0.22 | $0.22 | $0.22 | $0.22(c) |
| Net realized and unrealized gain (loss) | 0.04 | (0.10) | 0.70 | 0.05 | (0.24) | (0.29) |
| Total from investment operations | $0.09 | $0.07 | $0.92 | $0.27 | $(0.02) | $(0.07) |
| Less distributions declared to shareholders |
| From net investment income | $(0.07) | $(0.20) | $(0.23) | $(0.24) | $(0.26) | $(0.26) |
| Net asset value, end of period (x) | $10.16 | $10.14 | $10.27 | $9.58 | $9.55 | $9.83 |
| Total return (%) (r)(s)(t)(x) | 0.87(n) | 0.65 | 9.76 | 2.90 | (0.26) | (0.73)(c) |
Ratios (%) (to average net assets)
and Supplemental data: |
| Expenses before expense reductions (f) | 0.55(a) | 0.56 | 0.60 | 0.61 | 0.62 | 0.63(c) |
| Expenses after expense reductions (f) | 0.54(a) | 0.55 | 0.59 | 0.60 | 0.61 | 0.62(c) |
| Net investment income (loss) | 1.01(a) | 1.60 | 2.20 | 2.36 | 2.29 | 2.17(c) |
| Portfolio turnover | 211(n) | 307 | 113 | 56 | 20 | 48 |
| Net assets at end of period (000 omitted) | $152,197 | $162,286 | $96,407 | $43,627 | $39,572 | $43,439 |
| Class R1 | Six months
ended | Year ended |
| | 8/31/21
(unaudited) | 2/28/21 | 2/29/20 | 2/28/19
| 2/28/18 | 2/28/17 |
| Net asset value, beginning of period | $10.14 | $10.27 | $9.58 | $9.54 | $9.83 | $10.16 |
| Income (loss) from investment operations |
| Net investment income (loss) (d) | $0.00(w) | $0.06 | $0.12 | $0.13 | $0.13 | $0.12(c) |
| Net realized and unrealized gain (loss) | 0.05 | (0.09) | 0.71 | 0.06 | (0.26) | (0.29) |
| Total from investment operations | $0.05 | $(0.03) | $0.83 | $0.19 | $(0.13) | $(0.17) |
| Less distributions declared to shareholders |
| From net investment income | $(0.02) | $(0.10) | $(0.14) | $(0.15) | $(0.16) | $(0.16) |
| Net asset value, end of period (x) | $10.17 | $10.14 | $10.27 | $9.58 | $9.54 | $9.83 |
| Total return (%) (r)(s)(t)(x) | 0.46(n) | (0.35) | 8.68 | 1.99 | (1.36) | (1.72)(c) |
Ratios (%) (to average net assets)
and Supplemental data: |
| Expenses before expense reductions (f) | 1.55(a) | 1.56 | 1.60 | 1.61 | 1.62 | 1.63(c) |
| Expenses after expense reductions (f) | 1.54(a) | 1.55 | 1.59 | 1.60 | 1.61 | 1.62(c) |
| Net investment income (loss) | 0.01(a) | 0.61 | 1.23 | 1.37 | 1.31 | 1.18(c) |
| Portfolio turnover | 211(n) | 307 | 113 | 56 | 20 | 48 |
| Net assets at end of period (000 omitted) | $2,157 | $2,274 | $2,158 | $2,125 | $2,237 | $3,265 |
See Notes to Financial Statements
Financial Highlights – continued
| Class R2 | Six months
ended | Year ended |
| | 8/31/21
(unaudited) | 2/28/21 | 2/29/20 | 2/28/19
| 2/28/18 | 2/28/17 |
| Net asset value, beginning of period | $10.14 | $10.27 | $9.58 | $9.54 | $9.83 | $10.16 |
| Income (loss) from investment operations |
| Net investment income (loss) (d) | $0.03 | $0.12 | $0.17 | $0.18 | $0.18 | $0.17(c) |
| Net realized and unrealized gain (loss) | 0.04 | (0.10) | 0.71 | 0.06 | (0.26) | (0.29) |
| Total from investment operations | $0.07 | $0.02 | $0.88 | $0.24 | $(0.08) | $(0.12) |
| Less distributions declared to shareholders |
| From net investment income | $(0.04) | $(0.15) | $(0.19) | $(0.20) | $(0.21) | $(0.21) |
| Net asset value, end of period (x) | $10.17 | $10.14 | $10.27 | $9.58 | $9.54 | $9.83 |
| Total return (%) (r)(s)(t)(x) | 0.71(n) | 0.15 | 9.22 | 2.50 | (0.86) | (1.22)(c) |
Ratios (%) (to average net assets)
and Supplemental data: |
| Expenses before expense reductions (f) | 1.05(a) | 1.06 | 1.10 | 1.11 | 1.12 | 1.13(c) |
| Expenses after expense reductions (f) | 1.04(a) | 1.05 | 1.09 | 1.10 | 1.11 | 1.12(c) |
| Net investment income (loss) | 0.51(a) | 1.12 | 1.73 | 1.87 | 1.80 | 1.68(c) |
| Portfolio turnover | 211(n) | 307 | 113 | 56 | 20 | 48 |
| Net assets at end of period (000 omitted) | $57,033 | $63,945 | $78,519 | $86,431 | $98,060 | $111,123 |
| Class R3 | Six months
ended | Year ended |
| | 8/31/21
(unaudited) | 2/28/21 | 2/29/20 | 2/28/19
| 2/28/18 | 2/28/17 |
| Net asset value, beginning of period | $10.15 | $10.27 | $9.58 | $9.55 | $9.83 | $10.17 |
| Income (loss) from investment operations |
| Net investment income (loss) (d) | $0.04 | $0.14 | $0.20 | $0.20 | $0.20 | $0.19(c) |
| Net realized and unrealized gain (loss) | 0.03 | (0.09) | 0.70 | 0.05 | (0.25) | (0.30) |
| Total from investment operations | $0.07 | $0.05 | $0.90 | $0.25 | $(0.05) | $(0.11) |
| Less distributions declared to shareholders |
| From net investment income | $(0.05) | $(0.17) | $(0.21) | $(0.22) | $(0.23) | $(0.23) |
| Net asset value, end of period (x) | $10.17 | $10.15 | $10.27 | $9.58 | $9.55 | $9.83 |
| Total return (%) (r)(s)(t)(x) | 0.74(n) | 0.50 | 9.49 | 2.65 | (0.51) | (1.07)(c) |
Ratios (%) (to average net assets)
and Supplemental data: |
| Expenses before expense reductions (f) | 0.80(a) | 0.81 | 0.85 | 0.86 | 0.87 | 0.88(c) |
| Expenses after expense reductions (f) | 0.79(a) | 0.80 | 0.84 | 0.85 | 0.86 | 0.87(c) |
| Net investment income (loss) | 0.76(a) | 1.36 | 1.99 | 2.12 | 2.05 | 1.93(c) |
| Portfolio turnover | 211(n) | 307 | 113 | 56 | 20 | 48 |
| Net assets at end of period (000 omitted) | $42,836 | $49,242 | $52,773 | $66,977 | $79,274 | $88,434 |
See Notes to Financial Statements
Financial Highlights – continued
| Class R4 | Six months
ended | Year ended |
| | 8/31/21
(unaudited) | 2/28/21 | 2/29/20 | 2/28/19
| 2/28/18 | 2/28/17 |
| Net asset value, beginning of period | $10.15 | $10.28 | $9.59 | $9.55 | $9.84 | $10.17 |
| Income (loss) from investment operations |
| Net investment income (loss) (d) | $0.05 | $0.17 | $0.22 | $0.22 | $0.23 | $0.22(c) |
| Net realized and unrealized gain (loss) | 0.05 | (0.10) | 0.71 | 0.06 | (0.26) | (0.29) |
| Total from investment operations | $0.10 | $0.07 | $0.93 | $0.28 | $(0.03) | $(0.07) |
| Less distributions declared to shareholders |
| From net investment income | $(0.07) | $(0.20) | $(0.24) | $(0.24) | $(0.26) | $(0.26) |
| Net asset value, end of period (x) | $10.18 | $10.15 | $10.28 | $9.59 | $9.55 | $9.84 |
| Total return (%) (r)(s)(t)(x) | 0.97(n) | 0.65 | 9.75 | 3.01 | (0.36) | (0.72)(c) |
Ratios (%) (to average net assets)
and Supplemental data: |
| Expenses before expense reductions (f) | 0.55(a) | 0.56 | 0.60 | 0.61 | 0.62 | 0.63(c) |
| Expenses after expense reductions (f) | 0.54(a) | 0.55 | 0.59 | 0.60 | 0.61 | 0.62(c) |
| Net investment income (loss) | 1.01(a) | 1.61 | 2.22 | 2.36 | 2.30 | 2.18(c) |
| Portfolio turnover | 211(n) | 307 | 113 | 56 | 20 | 48 |
| Net assets at end of period (000 omitted) | $69,142 | $67,258 | $73,230 | $58,677 | $64,691 | $64,371 |
| Class R6 | Six months
ended | Year ended |
| | 8/31/21
(unaudited) | 2/28/21 | 2/29/20 | 2/28/19
| 2/28/18 | 2/28/17 |
| Net asset value, beginning of period | $10.14 | $10.27 | $9.58 | $9.54 | $9.83 | $10.16 |
| Income (loss) from investment operations |
| Net investment income (loss) (d) | $0.06 | $0.18 | $0.23 | $0.24 | $0.24 | $0.23(c) |
| Net realized and unrealized gain (loss) | 0.04 | (0.10) | 0.71 | 0.05 | (0.26) | (0.29) |
| Total from investment operations | $0.10 | $0.08 | $0.94 | $0.29 | $(0.02) | $(0.06) |
| Less distributions declared to shareholders |
| From net investment income | $(0.07) | $(0.21) | $(0.25) | $(0.25) | $(0.27) | $(0.27) |
| Net asset value, end of period (x) | $10.17 | $10.14 | $10.27 | $9.58 | $9.54 | $9.83 |
| Total return (%) (r)(s)(t)(x) | 1.02(n) | 0.75 | 9.87 | 3.13 | (0.25) | (0.61)(c) |
Ratios (%) (to average net assets)
and Supplemental data: |
| Expenses before expense reductions (f) | 0.45(a) | 0.46 | 0.50 | 0.50 | 0.50 | 0.51(c) |
| Expenses after expense reductions (f) | 0.44(a) | 0.45 | 0.49 | 0.49 | 0.50 | 0.50(c) |
| Net investment income (loss) | 1.11(a) | 1.69 | 2.33 | 2.48 | 2.42 | 2.30(c) |
| Portfolio turnover | 211(n) | 307 | 113 | 56 | 20 | 48 |
| Net assets at end of period (000 omitted) | $1,551,162 | $1,422,514 | $1,220,812 | $1,025,911 | $1,066,416 | $1,038,818 |
See Notes to Financial Statements
Financial Highlights – continued
| (a) | Annualized. |
| (c) | Amount reflects a one-time reimbursement of expenses by the custodian (or former custodian) without which net investment income and performance would be lower and expenses would be higher. |
| (d) | Per share data is based on average shares outstanding. |
| (f) | Ratios do not reflect reductions from fees paid indirectly, if applicable. |
| (n) | Not annualized. |
| (r) | Certain expenses have been reduced without which performance would have been lower. |
| (s) | From time to time the fund may receive proceeds from litigation settlements, without which performance would be lower. |
| (t) | Total returns do not include any applicable sales charges. |
| (w) | Per share amount was less than $0.01. |
| (x) | The net asset values and total returns have been calculated on net assets which include adjustments made in accordance with U.S. generally accepted accounting principles required at period end for financial reporting purposes. |
See Notes to Financial Statements
Notes to Financial Statements
(unaudited)
(1) Business and Organization
MFS Government Securities Fund (the fund) is a diversified series of MFS Series Trust XIII (the trust). The trust is organized as a Massachusetts business trust and is registered under the Investment Company Act of 1940, as amended, as an open-end management investment company.
The fund is an investment company and accordingly follows the investment company accounting and reporting guidance of the Financial Accounting Standards Board (FASB) Accounting Standards Codification Topic 946 Financial Services - Investment Companies.
(2) Significant Accounting Policies
General — The preparation of financial statements in conformity with U.S. generally accepted accounting principles requires management to make estimates and assumptions that affect the reported amounts of assets and liabilities, and disclosure of contingent assets and liabilities at the date of the financial statements and the reported amounts of increases and decreases in net assets from operations during the reporting period. Actual results could differ from those estimates. In the preparation of these financial statements, management has evaluated subsequent events occurring after the date of the fund’s Statement of Assets and Liabilities through the date that the financial statements were issued.
Certain of the fund's investments, including its investments in derivatives, as well as any debt issued by the fund and other contractual arrangements of the fund may be based on reference interest rates such as the London Interbank Offered Rate (“LIBOR”). In 2017, the regulatory authority that oversees financial services firms in the United Kingdom announced plans to transition away from LIBOR by the end of 2021. In March 2021, the administrator of LIBOR announced the extension of the publication of the more commonly used U.S. dollar LIBOR settings to the end of June 2023. Although the full impacts of the transition away from LIBOR are not fully known, the transition may result in, among other things, an increase in volatility or illiquidity of the markets for instruments that currently rely on LIBOR to determine interest rates and this could have an adverse impact on the fund's performance. With respect to the fund's accounting for investments, including its investments in derivatives, as well as any debt issued by the fund and other contractual arrangements of the fund that undergo reference rate-related modifications as a result of the transition, management will rely upon the relief provided by FASB Codification Topic 848 – Reference Rate Reform (Topic 848). The guidance in Topic 848 permits the fund to disregard the GAAP accounting requirements around certain contract modifications resulting from the LIBOR transition such that for contracts considered in scope, the fund can account for those modified contracts as a continuation of the existing contracts.
Balance Sheet Offsetting — The fund's accounting policy with respect to balance sheet offsetting is that, absent an event of default by the counterparty or a termination of the agreement, the International Swaps and Derivatives Association (ISDA) Master Agreement, or similar agreement, does not result in an offset of reported amounts of financial assets and financial liabilities in the Statement of Assets and Liabilities across transactions between the fund and the applicable counterparty. The fund's right to setoff may be restricted or prohibited by the bankruptcy or insolvency laws of the particular jurisdiction to which a specific master netting agreement counterparty is
Notes to Financial Statements (unaudited) - continued
subject. Balance sheet offsetting disclosures, to the extent applicable to the fund, have been included in the fund’s Significant Accounting Policies note under the captions for each of the fund’s in-scope financial instruments and transactions.
Investment Valuations — Debt instruments and floating rate loans, including restricted debt instruments, are generally valued at an evaluated or composite bid as provided by a third-party pricing service. Short-term instruments with a maturity at issuance of 60 days or less may be valued at amortized cost, which approximates market value. Futures contracts are generally valued at last posted settlement price on their primary exchange as provided by a third-party pricing service. Futures contracts for which there were no trades that day for a particular position are generally valued at the closing bid quotation on their primary exchange as provided by a third-party pricing service. Open-end investment companies are generally valued at net asset value per share. Securities and other assets generally valued on the basis of information from a third-party pricing service may also be valued at a broker/dealer bid quotation. In determining values, third-party pricing services can utilize both transaction data and market information such as yield, quality, coupon rate, maturity, type of issue, trading characteristics, and other market data. The values of foreign securities and other assets and liabilities expressed in foreign currencies are converted to U.S. dollars using the mean of bid and asked prices for rates provided by a third-party pricing service.
The Board of Trustees has delegated primary responsibility for determining or causing to be determined the value of the fund’s investments (including any fair valuation) to the adviser pursuant to valuation policies and procedures approved by the Board. If the adviser determines that reliable market quotations are not readily available, investments are valued at fair value as determined in good faith by the adviser in accordance with such procedures under the oversight of the Board of Trustees. Under the fund’s valuation policies and procedures, market quotations are not considered to be readily available for most types of debt instruments and floating rate loans and many types of derivatives. These investments are generally valued at fair value based on information from third-party pricing services. In addition, investments may be valued at fair value if the adviser determines that an investment’s value has been materially affected by events occurring after the close of the exchange or market on which the investment is principally traded (such as foreign exchange or market) and prior to the determination of the fund’s net asset value, or after the halt of trading of a specific security where trading does not resume prior to the close of the exchange or market on which the security is principally traded. The adviser generally relies on third-party pricing services or other information (such as the correlation with price movements of similar securities in the same or other markets; the type, cost and investment characteristics of the security; the business and financial condition of the issuer; and trading and other market data) to assist in determining whether to fair value and at what value to fair value an investment. The value of an investment for purposes of calculating the fund’s net asset value can differ depending on the source and method used to determine value. When fair valuation is used, the value of an investment used to determine the fund’s net asset value may differ from quoted or published prices for the same investment. There can be no assurance that the fund could obtain the fair value assigned to an investment if it were to sell the investment at the same time at which the fund determines its net asset value per share.
Various inputs are used in determining the value of the fund's assets or liabilities. These inputs are categorized into three broad levels. In certain cases, the inputs used to measure fair value may fall into different levels of the fair value hierarchy. In such cases,
Notes to Financial Statements (unaudited) - continued
an investment's level within the fair value hierarchy is based on the lowest level of input that is significant to the fair value measurement. The fund's assessment of the significance of a particular input to the fair value measurement in its entirety requires judgment, and considers factors specific to the investment. Level 1 includes unadjusted quoted prices in active markets for identical assets or liabilities. Level 2 includes other significant observable market-based inputs (including quoted prices for similar securities, interest rates, prepayment speed, and credit risk). Level 3 includes unobservable inputs, which may include the adviser's own assumptions in determining the fair value of investments. Other financial instruments are derivative instruments, such as futures contracts. The following is a summary of the levels used as of August 31, 2021 in valuing the fund's assets or liabilities:
| Financial Instruments | Level 1 | Level 2 | Level 3 | Total |
| U.S. Treasury Bonds & U.S. Government Agencies & Equivalents | $— | $1,074,676,679 | $— | $1,074,676,679 |
| Non - U.S. Sovereign Debt | — | 3,933,897 | — | 3,933,897 |
| Municipal Bonds | — | 51,827,887 | — | 51,827,887 |
| U.S. Corporate Bonds | — | 32,881,220 | — | 32,881,220 |
| Residential Mortgage-Backed Securities | — | 1,200,087,231 | — | 1,200,087,231 |
| Commercial Mortgage-Backed Securities | — | 134,394,081 | — | 134,394,081 |
| Asset-Backed Securities (including CDOs) | — | 39,498,176 | — | 39,498,176 |
| Foreign Bonds | — | 2,167,349 | — | 2,167,349 |
| Mutual Funds | 742,449,918 | — | — | 742,449,918 |
| Total | $742,449,918 | $2,539,466,520 | $— | $3,281,916,438 |
| Other Financial Instruments | | | | |
| Futures Contracts – Assets | $574,414 | $— | $— | $574,414 |
| Futures Contracts – Liabilities | (191,481) | — | — | (191,481) |
For further information regarding security characteristics, see the Portfolio of Investments.
Inflation-Adjusted Debt Securities — The fund invests in inflation-adjusted debt securities issued by the U.S. Treasury. The principal value of these debt securities is adjusted through income according to changes in the Consumer Price Index. These debt securities typically pay a fixed rate of interest, but this fixed rate is applied to the inflation-adjusted principal amount. The principal paid at maturity of the debt security is typically equal to the inflation-adjusted principal amount, or the security’s original par value, whichever is greater. Other types of inflation-adjusted securities may use other methods to adjust for other measures of inflation.
Foreign Currency Translation — Purchases and sales of foreign investments, income, and expenses are converted into U.S. dollars based upon currency exchange rates prevailing on the respective dates of such transactions or on the reporting date for foreign denominated receivables and payables. Gains and losses attributable to foreign currency exchange rates on sales of securities are recorded for financial statement purposes as net realized gains and losses on investments. Gains and losses attributable
Notes to Financial Statements (unaudited) - continued
to foreign exchange rate movements on receivables, payables, income and expenses are recorded for financial statement purposes as foreign currency transaction gains and losses. That portion of both realized and unrealized gains and losses on investments that results from fluctuations in foreign currency exchange rates is not separately disclosed.
Derivatives — The fund uses derivatives primarily to increase or decrease exposure to a particular market or segment of the market, or security, to increase or decrease interest rate or currency exposure, or as alternatives to direct investments. Derivatives are used for hedging or non-hedging purposes. While hedging can reduce or eliminate losses, it can also reduce or eliminate gains. When the fund uses derivatives as an investment to increase market exposure, or for hedging purposes, gains and losses from derivative instruments may be substantially greater than the derivative’s original cost.
The derivative instruments used by the fund during the period were futures contracts. Depending on the type of derivative, a fund may exit a derivative position by entering into an offsetting transaction with a counterparty or exchange, negotiating an agreement with the derivative counterparty, or novating the position to a third party. The fund's period end derivatives, as presented in the Portfolio of Investments and the associated Derivative Contract tables, generally are indicative of the volume of its derivative activity during the period.
The following table presents, by major type of derivative contract, the fair value, on a gross basis, of the asset and liability components of derivatives held by the fund at August 31, 2021 as reported in the Statement of Assets and Liabilities:
| | | Fair Value (a) |
| Risk | Derivative Contracts | Asset Derivatives | Liability Derivatives |
| Interest Rate | Futures Contracts | $574,414 | $(191,481) |
| (a) | Values presented in this table for futures contracts correspond to the values reported in the Portfolio of Investments. Only the current day net variation margin for futures contracts is separately reported within the Statement of Assets and Liabilities. |
The following table presents, by major type of derivative contract, the realized gain (loss) on derivatives held by the fund for the six months ended August 31, 2021 as reported in the Statement of Operations:
| Risk | Futures
Contracts |
| Interest Rate | $4,603,796 |
The following table presents, by major type of derivative contract, the change in unrealized appreciation or depreciation on derivatives held by the fund for the six months ended August 31, 2021 as reported in the Statement of Operations:
| Risk | Futures
Contracts |
| Interest Rate | $697,074 |
Derivative counterparty credit risk is managed through formal evaluation of the creditworthiness of all potential counterparties. On certain, but not all, uncleared derivatives, the fund attempts to reduce its exposure to counterparty credit risk whenever possible by entering into an ISDA Master Agreement on a bilateral basis. The
Notes to Financial Statements (unaudited) - continued
ISDA Master Agreement gives each party to the agreement the right to terminate all transactions traded under such agreement if there is a specified deterioration in the credit quality of the other party. Upon an event of default or a termination of the ISDA Master Agreement, the non-defaulting party has the right to close out all transactions traded under such agreement and to net amounts owed under each agreement to one net amount payable by one party to the other. This right to close out and net payments across all transactions traded under the ISDA Master Agreement could result in a reduction of the fund's credit risk to such counterparty equal to any amounts payable by the fund under the applicable transactions, if any.
Collateral and margin requirements differ by type of derivative. For cleared derivatives (e.g., futures contracts, cleared swaps, and exchange-traded options), margin requirements are set by the clearing broker and the clearing house and collateral, in the form of cash or securities, is posted by the fund directly with the clearing broker. Collateral terms are counterparty agreement specific for uncleared derivatives (e.g., forward foreign currency exchange contracts, uncleared swap agreements, and uncleared options) and collateral, in the form of cash and securities, is held in segregated accounts with the fund's custodian in connection with these agreements. For derivatives traded under an ISDA Master Agreement, which contains a collateral support annex, the collateral requirements are netted across all transactions traded under such counterparty-specific agreement and an amount is posted from one party to the other to collateralize such obligations. Cash that has been segregated or delivered to cover the fund's collateral or margin obligations under derivative contracts, if any, will be reported separately in the Statement of Assets and Liabilities as restricted cash for uncleared derivatives and/or deposits with brokers for cleared derivatives. Securities pledged as collateral or margin for the same purpose, if any, are noted in the Portfolio of Investments. The fund may be required to make payments of interest on uncovered collateral or margin obligations with the broker. Any such payments are included in “Miscellaneous” expense in the Statement of Operations.
Futures Contracts — The fund entered into futures contracts which may be used to hedge against or obtain broad market exposure, interest rate exposure, or to manage duration. A futures contract represents a commitment for the future purchase or sale of an asset at a specified price on a specified date.
Upon entering into a futures contract, the fund is required to deposit with the broker, either in cash or securities, an initial margin in an amount equal to a specified percentage of the notional amount of the contract. Subsequent payments (variation margin) are made or received by the fund each day, depending on the daily fluctuations in the value of the contract, and are recorded for financial statement purposes as unrealized gain or loss by the fund until the contract is closed or expires at which point the gain or loss on futures contracts is realized.
The fund bears the risk of interest rates or securities prices moving unexpectedly, in which case, the fund may not achieve the anticipated benefits of the futures contracts and may realize a loss. While futures contracts may present less counterparty risk to the fund since the contracts are exchange traded and the exchange’s clearinghouse guarantees payments to the broker, there is still counterparty credit risk due to the insolvency of the broker. The fund's maximum risk of loss due to counterparty credit risk is equal to the margin posted by the fund to the broker plus any gains or minus any losses on the outstanding futures contracts.
Notes to Financial Statements (unaudited) - continued
Indemnifications — Under the fund's organizational documents, its officers and Trustees may be indemnified against certain liabilities and expenses arising out of the performance of their duties to the fund. Additionally, in the normal course of business, the fund enters into agreements with service providers that may contain indemnification clauses. The fund's maximum exposure under these agreements is unknown as this would involve future claims that may be made against the fund that have not yet occurred.
Investment Transactions and Income — Investment transactions are recorded on the trade date. Some securities may be purchased or sold on an extended settlement basis, which means that the receipt or delivery of the securities by the fund and related payments occur at a future date, usually beyond the customary settlement period.
Interest income is recorded on the accrual basis. All premium and discount is amortized or accreted for financial statement purposes in accordance with U.S. generally accepted accounting principles. Interest payments received in additional securities are recorded on the ex-interest date in an amount equal to the value of the security on such date.
The fund may receive proceeds from litigation settlements. Any proceeds received from litigation involving portfolio holdings are reflected in the Statement of Operations in realized gain/loss if the security has been disposed of by the fund or in unrealized gain/loss if the security is still held by the fund. Any other proceeds from litigation not related to portfolio holdings are reflected as other income in the Statement of Operations.
The fund invests a significant portion of its assets in asset-backed and/or mortgage-backed securities. For these securities, the value of the debt instrument also depends on the credit quality and adequacy of the underlying assets or collateral as well as whether there is a security interest in the underlying assets or collateral. Enforcing rights, if any, against the underlying assets or collateral may be difficult. U.S. Government securities not supported as to the payment of principal or interest by the U.S. Treasury, such as those issued by Fannie Mae, Freddie Mac, and the Federal Home Loan Banks, are subject to greater credit risk than are U.S. Government securities supported by the U.S. Treasury, such as those issued by Ginnie Mae.
The fund may purchase or sell mortgage-backed securities on a “To Be Announced” (TBA) basis. A TBA transaction is subject to extended settlement and typically does not designate the actual security to be delivered, but instead includes an approximate principal amount. The price of the TBA security and the date that it will be settled are fixed at the time the transaction is negotiated. The value of the security varies with market fluctuations and no interest accrues to the fund until settlement takes place. TBA purchase and sale commitments are held at carrying amount, which approximates fair value and are categorized as level 2 within the fair value hierarchy and included in TBA purchase and TBA sale commitments in the Statement of Assets and Liabilities. Losses may arise as a result of changes in the value of the TBA investment prior to settlement date or due to counterparty non-performance. At the time that it enters into a TBA transaction, the fund is required to have sufficient cash and/or liquid securities to cover its commitments.
The fund may also enter into mortgage dollar rolls, typically TBA dollar rolls, in which the fund sells TBA mortgage-backed securities to financial institutions and simultaneously agrees to repurchase similar (same issuer, type and coupon) securities at a later date at an agreed-upon price. During the period between the sale and repurchase, the fund will not be entitled to receive interest and principal payments on
Notes to Financial Statements (unaudited) - continued
the securities sold. The fund accounts for dollar roll transactions as purchases and sales and realizes gains and losses on these transactions. Dollar roll transactions involve the risk that the market value of the securities that the fund is required to purchase may decline below the agreed upon repurchase price of those securities.
To mitigate the counterparty credit risk on TBA transactions, mortgage dollar rolls, and other types of forward settling mortgage-backed and asset-backed security transactions, the fund whenever possible enters into a Master Securities Forward Transaction Agreement (“MSFTA”) on a bilateral basis with each of the counterparties with whom it undertakes a significant volume of transactions. The MSFTA gives each party to the agreement the right to terminate all transactions traded under such agreement if there is a specified deterioration in the credit quality of the other party. Upon an event of default or a termination of the MSFTA, the non-defaulting party has the right to close out all transactions traded under such agreement and to net amounts owed under each transaction to one net amount payable by one party to the other. This right to close out and net payments across all transactions traded under the MSFTA could result in a reduction of the fund's credit risk to such counterparty equal to any amounts payable by the fund under the applicable transactions, if any.
For mortgage-backed and asset-backed securities traded under a MSFTA, the collateral and margining requirements are contract specific. Collateral amounts across all transactions traded under such agreement are netted and an amount is posted from one party to the other to collateralize such obligations. Cash that has been pledged to cover the fund's collateral or margin obligations under a MSFTA, if any, will be reported separately on the Statement of Assets and Liabilities as restricted cash. Securities pledged as collateral or margin for the same purpose, if any, are noted in the Portfolio of Investments.
Fees Paid Indirectly — The fund's custody fee may be reduced by a credit earned under an arrangement that measures the value of U.S. dollars deposited with the custodian by the fund. The amount of the credit, for the six months ended August 31, 2021, is shown as a reduction of total expenses in the Statement of Operations.
Tax Matters and Distributions — The fund intends to qualify as a regulated investment company, as defined under Subchapter M of the Internal Revenue Code, and to distribute all of its taxable income, including realized capital gains. As a result, no provision for federal income tax is required. The fund’s federal tax returns, when filed, will remain subject to examination by the Internal Revenue Service for a three year period. Management has analyzed the fund’s tax positions taken on federal and state tax returns for all open tax years and does not believe that there are any uncertain tax positions that require recognition of a tax liability. Foreign taxes, if any, have been accrued by the fund in the accompanying financial statements in accordance with the applicable foreign tax law. Foreign income taxes may be withheld by certain countries in which the fund invests. Additionally, capital gains realized by the fund on securities issued in or by certain foreign countries may be subject to capital gains tax imposed by those countries.
Distributions to shareholders are recorded on the ex-dividend date. Income and capital gain distributions are determined in accordance with income tax regulations, which may differ from U.S. generally accepted accounting principles. Certain capital accounts in the financial statements are periodically adjusted for permanent differences in order to reflect their tax character. These adjustments have no impact on net assets or net
Notes to Financial Statements (unaudited) - continued
asset value per share. Temporary differences which arise from recognizing certain items of income, expense, gain or loss in different periods for financial statement and tax purposes will reverse at some time in the future.
Book/tax differences primarily relate to amortization and accretion of debt securities and straddle loss deferrals.
The tax character of distributions made during the current period will be determined at fiscal year end. The tax character of distributions declared to shareholders for the last fiscal year is as follows:
| | Year ended
2/28/21 |
| Ordinary income (including any short-term capital gains) | $44,976,163 |
The federal tax cost and the tax basis components of distributable earnings were as follows:
| As of 8/31/21 | |
| Cost of investments | $3,206,802,287 |
| Gross appreciation | 78,909,031 |
| Gross depreciation | (3,794,880) |
| Net unrealized appreciation (depreciation) | $ 75,114,151 |
| As of 2/28/21 | |
| Undistributed ordinary income | 7,415,651 |
| Capital loss carryforwards | (73,886,735) |
| Other temporary differences | (3,017,965) |
| Net unrealized appreciation (depreciation) | 67,285,773 |
The aggregate cost above includes prior fiscal year end tax adjustments, if applicable.
As of February 28, 2021, the fund had capital loss carryforwards available to offset future realized gains. These net capital losses may be carried forward indefinitely and their character is retained as short-term and/or long-term losses. Such losses are characterized as follows:
Multiple Classes of Shares of Beneficial Interest — The fund offers multiple classes of shares, which differ in their respective distribution and service fees. The fund's income and common expenses are allocated to shareholders based on the value of settled shares outstanding of each class. The fund's realized and unrealized gain (loss) are allocated to shareholders based on the daily net assets of each class. Dividends are declared separately for each class. Differences in per share dividend rates are generally due to differences in separate class expenses. Class B and Class C shares will convert to
Notes to Financial Statements (unaudited) - continued
Class A shares approximately eight years after purchase. The fund’s distributions declared to shareholders as reported in the Statements of Changes in Net Assets are presented by class as follows:
| | Six months ended
8/31/21 | Year ended
2/28/21 |
| Class A | $4,284,600 | $13,069,927 |
| Class B | 6,614 | 60,676 |
| Class C | 26,931 | 222,594 |
| Class I | 1,055,943 | 3,382,613 |
| Class R1 | 3,677 | 22,693 |
| Class R2 | 255,992 | 1,057,985 |
| Class R3 | 250,866 | 864,178 |
| Class R4 | 454,948 | 1,407,096 |
| Class R6 | 10,614,233 | 24,888,401 |
| Total | $16,953,804 | $44,976,163 |
(3) Transactions with Affiliates
Investment Adviser — The fund has an investment advisory agreement with MFS to provide overall investment management and related administrative services and facilities to the fund. The management fee is computed daily and paid monthly at the following annual rates based on the fund's average daily net assets:
| Up to $1 billion | 0.40% |
| In excess of $1 billion and up to $2.5 billion | 0.35% |
| In excess of $2.5 billion and up to $5 billion | 0.30% |
| In excess of $5 billion | 0.29% |
MFS has agreed in writing to reduce its management fee by a specified amount if certain MFS mutual fund assets exceed thresholds agreed to by MFS and the fund's Board of Trustees. For the six months ended August 31, 2021, this management fee reduction amounted to $165,753, which is included in the reduction of total expenses in the Statement of Operations. The management fee incurred for the six months ended August 31, 2021 was equivalent to an annual effective rate of 0.35% of the fund's average daily net assets.
The investment adviser has agreed in writing to pay a portion of the fund’s total annual operating expenses, excluding interest, taxes, extraordinary expenses, brokerage and transaction costs, and investment-related expenses, such that total fund operating expenses do not exceed the following rates annually of each class’s average daily net assets:
| Classes |
| A | B | C | I | R1 | R2 | R3 | R4 | R6 |
| 0.80% | 1.55% | 1.55% | 0.55% | 1.55% | 1.05% | 0.80% | 0.55% | 0.44% |
This written agreement will continue until modified by the fund’s Board of Trustees, but such agreement will continue at least until June 30, 2023. For the six months ended August 31, 2021, the fund’s actual operating expenses did not exceed the limit and therefore, the investment adviser did not pay any portion of the fund’s expenses related to this agreement.
Notes to Financial Statements (unaudited) - continued
Distributor — MFS Fund Distributors, Inc. (MFD), a wholly-owned subsidiary of MFS, as distributor, received $8,765 for the six months ended August 31, 2021, as its portion of the initial sales charge on sales of Class A shares of the fund.
The Board of Trustees has adopted a distribution plan for certain share classes pursuant to Rule 12b-1 of the Investment Company Act of 1940.
The fund's distribution plan provides that the fund will pay MFD for services provided by MFD and financial intermediaries in connection with the distribution and servicing of certain share classes. One component of the plan is a distribution fee paid to MFD and another component of the plan is a service fee paid to MFD. MFD may subsequently pay all, or a portion, of the distribution and/or service fees to financial intermediaries.
Distribution Plan Fee Table:
| | Distribution
Fee Rate (d) | Service
Fee Rate (d) | Total
Distribution
Plan (d) | Annual
Effective
Rate (e) | Distribution
and Service
Fee |
| Class A | — | 0.25% | 0.25% | 0.25% | $ 994,371 |
| Class B | 0.75% | 0.25% | 1.00% | 1.00% | 19,817 |
| Class C | 0.75% | 0.25% | 1.00% | 1.00% | 80,011 |
| Class R1 | 0.75% | 0.25% | 1.00% | 1.00% | 11,141 |
| Class R2 | 0.25% | 0.25% | 0.50% | 0.50% | 154,334 |
| Class R3 | — | 0.25% | 0.25% | 0.25% | 58,065 |
| Total Distribution and Service Fees | | | | | $1,317,739 |
| (d) | In accordance with the distribution plan for certain classes, the fund pays distribution and/or service fees equal to these annual percentage rates of each class’s average daily net assets. The distribution and service fee rates disclosed by class represent the current rates in effect at the end of the reporting period. Any rate changes, if applicable, are detailed below. |
| (e) | The annual effective rates represent actual fees incurred under the distribution plan for the six months ended August 31, 2021 based on each class's average daily net assets. MFD has voluntarily agreed to rebate a portion of each class's 0.25% service fee attributable to accounts for which there is no financial intermediary specified on the account except for accounts attributable to MFS or its affiliates' seed money. For the six months ended August 31, 2021, this rebate amounted to $712, $1, and $46 for Class A, Class C, and Class R3, respectively, and is included in the reduction of total expenses in the Statement of Operations. |
Certain Class A shares are subject to a contingent deferred sales charge (CDSC) in the event of a shareholder redemption within 18 months of purchase. Class B shares are subject to a CDSC in the event of a shareholder redemption within six years of purchase. Class C shares are subject to a CDSC in the event of a shareholder redemption within 12 months of purchase. All contingent deferred sales charges are paid to MFD and during the six months ended August 31, 2021, were as follows:
| | Amount |
| Class A | $32,320 |
| Class B | 2,891 |
| Class C | 1,372 |
Notes to Financial Statements (unaudited) - continued
Shareholder Servicing Agent — MFS Service Center, Inc. (MFSC), a wholly-owned subsidiary of MFS, receives a fee from the fund for its services as shareholder servicing agent calculated as a percentage of the average daily net assets of the fund as determined periodically under the supervision of the fund's Board of Trustees. For the six months ended August 31, 2021, the fee was $116,839, which equated to 0.0088% annually of the fund's average daily net assets. MFSC also receives reimbursement from the fund for out-of-pocket expenses, sub-accounting and other shareholder servicing costs which may be paid to affiliated and unaffiliated service providers. Class R6 shares do not incur sub-accounting fees. For the six months ended August 31, 2021, these out-of-pocket expenses, sub-accounting and other shareholder servicing costs amounted to $641,137.
Under a Special Servicing Agreement among MFS, certain MFS funds which invest in other MFS funds (“MFS fund-of-funds”) and certain underlying funds in which a MFS fund-of-funds invests (“underlying funds”), each underlying fund may pay a portion of each MFS fund-of-funds' transfer agent-related expenses, including sub-accounting fees payable to financial intermediaries, to the extent such payments do not exceed the benefits realized or expected to be realized by the underlying fund from the investment in the underlying fund by the MFS fund-of-funds. For the six months ended August 31, 2021, these costs for the fund amounted to $455,415 and are included in “Shareholder servicing costs” in the Statement of Operations. Effective September 30, 2021, the fund will no longer participate in this Special Servicing Agreement.
Administrator — MFS provides certain financial, legal, shareholder communications, compliance, and other administrative services to the fund. Under an administrative services agreement, the fund reimburses MFS the costs incurred to provide these services. The fund is charged an annual fixed amount of $17,500 plus a fee based on average daily net assets. The administrative services fee incurred for the six months ended August 31, 2021 was equivalent to an annual effective rate of 0.0134% of the fund's average daily net assets.
Trustees’ and Officers’ Compensation — The fund pays compensation to independent Trustees in the form of a retainer, attendance fees, and additional compensation to Board and Committee chairpersons. The fund does not pay compensation directly to Trustees or officers of the fund who are also officers of the investment adviser, all of whom receive remuneration from MFS for their services to the fund. Certain officers and Trustees of the fund are officers or directors of MFS, MFD, and MFSC.
Prior to December 31, 2001, the fund had an unfunded defined benefit plan (“DB plan”) for independent Trustees. As of December 31, 2001, the Board took action to terminate the DB plan with respect to then-current and any future independent Trustees, such that the DB plan covers only certain of those former independent Trustees who retired on or before December 31, 2001. The DB plan resulted in a pension expense of $839 and is included in “Independent Trustees’ compensation” in the Statement of Operations for the six months ended August 31, 2021. The liability for deferred retirement benefits payable to those former independent Trustees under the DB plan amounted to $5,534 at August 31, 2021, and is included in “Payable for independent Trustees’ compensation” in the Statement of Assets and Liabilities.
Notes to Financial Statements (unaudited) - continued
Other — The fund invests in the MFS Institutional Money Market Portfolio which is managed by MFS and seeks current income consistent with preservation of capital and liquidity. This money market fund does not pay a management fee to MFS but does incur investment and operating costs.
(4) Portfolio Securities
For the six months ended August 31, 2021, purchases and sales of investments, other than short-term obligations, were as follows:
| | Purchases | Sales |
| U.S. Government securities | $5,292,152,748 | $5,131,081,275 |
| Non-U.S. Government securities | 50,745,278 | 58,559,391 |
(5) Shares of Beneficial Interest
The fund's Declaration of Trust permits the Trustees to issue an unlimited number of full and fractional shares of beneficial interest. Transactions in fund shares were as follows:
| | Six months ended
8/31/21 | | Year ended
2/28/21 |
| | Shares | Amount | | Shares | Amount |
| Shares sold | | | | | |
| Class A | 7,919,199 | $80,218,730 | | 37,432,324 | $388,976,524 |
| Class B | 5,860 | 59,274 | | 172,933 | 1,792,195 |
| Class C | 150,588 | 1,525,430 | | 1,838,016 | 19,087,959 |
| Class I | 2,010,799 | 20,337,191 | | 20,764,180 | 215,062,429 |
| Class R1 | 14,224 | 143,870 | | 157,633 | 1,631,410 |
| Class R2 | 409,824 | 4,136,913 | | 2,829,544 | 29,391,810 |
| Class R3 | 527,940 | 5,345,988 | | 1,848,618 | 19,205,838 |
| Class R4 | 927,610 | 9,387,137 | | 4,005,926 | 41,619,980 |
| Class R6 | 16,059,594 | 162,591,347 | | 49,026,064 | 509,164,154 |
| | 28,025,638 | $283,745,880 | | 118,075,238 | $1,225,932,299 |
Shares issued to shareholders
in reinvestment of distributions | | | | | |
| Class A | 334,391 | $3,387,305 | | 1,005,414 | $10,466,299 |
| Class B | 636 | 6,424 | | 5,698 | 59,331 |
| Class C | 2,587 | 26,211 | | 20,289 | 211,820 |
| Class I | 94,640 | 957,030 | | 290,751 | 3,022,529 |
| Class R1 | 363 | 3,674 | | 2,180 | 22,685 |
| Class R2 | 24,988 | 252,759 | | 99,515 | 1,035,320 |
| Class R3 | 24,787 | 250,860 | | 83,031 | 864,142 |
| Class R4 | 17,143 | 173,617 | | 63,588 | 662,276 |
| Class R6 | 1,030,922 | 10,431,793 | | 2,344,033 | 24,359,227 |
| | 1,530,457 | $15,489,673 | | 3,914,499 | $40,703,629 |
Notes to Financial Statements (unaudited) - continued
| | Six months ended
8/31/21 | | Year ended
2/28/21 |
| | Shares | Amount | | Shares | Amount |
| Shares reacquired | | | | | |
| Class A | (10,946,316) | $(110,929,451) | | (27,409,355) | $(284,825,248) |
| Class B | (109,679) | (1,109,151) | | (489,221) | (5,076,599) |
| Class C | (730,056) | (7,399,435) | | (1,935,540) | (20,133,491) |
| Class I | (3,138,245) | (31,777,142) | | (14,438,216) | (149,772,348) |
| Class R1 | (26,690) | (269,375) | | (145,752) | (1,509,695) |
| Class R2 | (1,130,509) | (11,446,951) | | (4,272,384) | (44,167,230) |
| Class R3 | (1,194,628) | (12,111,646) | | (2,216,138) | (22,928,241) |
| Class R4 | (776,266) | (7,865,120) | | (4,570,079) | (47,313,619) |
| Class R6 | (4,788,121) | (48,531,790) | | (30,003,593) | (308,538,413) |
| | (22,840,510) | $(231,440,061) | | (85,480,278) | $(884,264,884) |
| Net change | | | | | |
| Class A | (2,692,726) | $(27,323,416) | | 11,028,383 | $114,617,575 |
| Class B | (103,183) | (1,043,453) | | (310,590) | (3,225,073) |
| Class C | (576,881) | (5,847,794) | | (77,235) | (833,712) |
| Class I | (1,032,806) | (10,482,921) | | 6,616,715 | 68,312,610 |
| Class R1 | (12,103) | (121,831) | | 14,061 | 144,400 |
| Class R2 | (695,697) | (7,057,279) | | (1,343,325) | (13,740,100) |
| Class R3 | (641,901) | (6,514,798) | | (284,489) | (2,858,261) |
| Class R4 | 168,487 | 1,695,634 | | (500,565) | (5,031,363) |
| Class R6 | 12,302,395 | 124,491,350 | | 21,366,504 | 224,984,968 |
| | 6,715,585 | $67,795,492 | | 36,509,459 | $382,371,044 |
Effective June 1, 2019, purchases of the fund’s Class B shares are closed to new and existing investors subject to certain exceptions. Please see the fund’s prospectus for details.
The fund is one of several mutual funds in which certain MFS funds may invest. The MFS funds do not invest in the underlying funds for the purpose of exercising management or control. At the end of the period, the MFS Moderate Allocation Fund, the MFS Conservative Allocation Fund, the MFS Lifetime 2030 Fund, the MFS Lifetime Income Fund, the MFS Lifetime 2025 Fund, and the MFS Lifetime 2020 Fund were the owners of record of approximately 28%, 16%, 3%, 3%, 2%, and 1%, respectively, of the value of outstanding voting shares of the fund. In addition, the MFS Lifetime 2035 Fund was the owner of record of less than 1% of the value of outstanding voting shares of the fund.
(6) Line of Credit
The fund and certain other funds managed by MFS participate in a $1.25 billion unsecured committed line of credit of which $1 billion is reserved for use by the fund and certain other MFS U.S. funds. The line of credit is provided by a syndicate of banks under a credit agreement. Borrowings may be made for temporary financing needs. Interest is charged to each fund, based on its borrowings, generally at a rate equal to
Notes to Financial Statements (unaudited) - continued
the highest of one month LIBOR, the Federal Funds Effective Rate and the Overnight Bank Funding Rate, plus an agreed upon spread. A commitment fee, based on the average daily, unused portion of the committed line of credit, is allocated among the participating funds. In addition, the fund and other funds managed by MFS have established unsecured uncommitted borrowing arrangements with certain banks for temporary financing needs. Interest is charged to each fund, based on its borrowings, at rates equal to customary reference rates plus an agreed upon spread. For the six months ended August 31, 2021, the fund’s commitment fee and interest expense were $5,356 and $0, respectively, and are included in “Miscellaneous” expense in the Statement of Operations.
(7) Investments in Affiliated Issuers
An affiliated issuer may be considered one in which the fund owns 5% or more of the outstanding voting securities, or a company which is under common control. For the purposes of this report, the following were affiliated issuers:
| Affiliated Issuers | Beginning
Value | Purchases | Sales
Proceeds | Realized
Gain
(Loss) | Change in
Unrealized
Appreciation or
Depreciation | Ending
Value |
| MFS Institutional Money Market Portfolio | $688,575,859 | $517,676,046 | $463,801,987 | $— | $— | $742,449,918 |
| Affiliated Issuers | Dividend
Income | Capital Gain
Distributions |
| MFS Institutional Money Market Portfolio | $134,261 | $— |
(8) Impacts of COVID-19
The pandemic related to the global spread of novel coronavirus disease (COVID-19), which was first detected in December 2019, has resulted in significant disruptions to global business activity and the global economy, as well as the economies of individual countries, the financial performance of individual companies and sectors, and the securities and commodities markets in general. Multiple surges in cases globally, the availability and widespread adoption of vaccines, and the emergence of variant strains of the virus continue to create uncertainty as to the future and long-term impacts resulting from the pandemic including impacts to the prices and liquidity of the fund's investments and the fund's performance.
Board Review of Investment Advisory Agreement
MFS Government Securities Fund
The Investment Company Act of 1940 requires that both the full Board of Trustees and a majority of the non-interested (“independent”) Trustees, voting separately, annually approve the continuation of the Fund’s investment advisory agreement with MFS. The Trustees consider matters bearing on the Fund and its advisory arrangements at their meetings throughout the year, including a review of performance data at each regular meeting. In addition, the independent Trustees met several times by videoconference (in accordance with Securities and Exchange Commission relief) over the course of three months beginning in May and ending in July, 2021 (“contract review meetings”) for the specific purpose of considering whether to approve the continuation of the investment advisory agreement for the Fund and the other investment companies that the Board oversees (the “MFS Funds”). The independent Trustees were assisted in their evaluation of the Fund’s investment advisory agreement by independent legal counsel, from whom they received separate legal advice and with whom they met separately from MFS during various contract review meetings. The independent Trustees were also assisted in this process by an independent consultant who was retained by and reported to the independent Trustees.
In connection with their deliberations regarding the continuation of the investment advisory agreement, the Trustees, including the independent Trustees, considered such information and factors as they believed, in light of the legal advice furnished to them and their own business judgment, to be relevant. The investment advisory agreement for the Fund was considered separately, although the Trustees also took into account the common interests of all MFS Funds in their review. As described below, the Trustees considered the nature, quality, and extent of the various investment advisory, administrative, and shareholder services performed by MFS under the existing investment advisory agreement and other arrangements with the Fund.
In connection with their contract review meetings, the Trustees received and relied upon materials that included, among other items: (i) information provided by Broadridge Financial Solutions, Inc. (“Broadridge”), an independent third party, on the investment performance of the Fund for various time periods ended December 31, 2020 and the investment performance of a group of funds with substantially similar investment classifications/objectives (the “Broadridge performance universe”), (ii) information provided by Broadridge on the Fund’s advisory fees and other expenses and the advisory fees and other expenses of comparable funds identified by Broadridge as well as all other funds in the same investment classification/category (the “Broadridge expense group and universe”), (iii) information provided by MFS on the advisory fees of portfolios of other clients of MFS, including institutional separate accounts and other clients, (iv) information as to whether and to what extent applicable expense waivers, reimbursements or fee “breakpoints” are observed for the Fund, (v) information regarding MFS’ financial results and financial condition, including MFS’ and certain of its affiliates’ estimated profitability from services performed for the Fund and the MFS Funds as a whole, and compared to MFS’ institutional business, (vi) MFS’ views regarding the outlook for the mutual fund industry and the strategic business plans of MFS, (vii) descriptions of various functions performed by MFS for the Funds, such as compliance monitoring and portfolio trading practices, and (viii)
Board Review of Investment Advisory Agreement - continued
information regarding the overall organization of MFS, including information about MFS’ senior management and other personnel providing investment advisory, administrative and other services to the Fund and the other MFS Funds. The comparative performance, fee and expense information prepared and provided by Broadridge was not independently verified and the independent Trustees did not independently verify any information provided to them by MFS.
The Trustees’ conclusion as to the continuation of the investment advisory agreement was based on a comprehensive consideration of all information provided to the Trustees and not the result of any single factor. Some of the factors that figured particularly in the Trustees’ deliberations are described below, although individual Trustees may have evaluated the information presented differently from one another, giving different weights to various factors. It is also important to recognize that the fee arrangements for the Fund and other MFS Funds are the result of years of review and discussion between the independent Trustees and MFS, that certain aspects of such arrangements may receive greater scrutiny in some years than in others, and that the Trustees’ conclusions may be based, in part, on their consideration of these same arrangements during the course of the year and in prior years.
Based on information provided by Broadridge and MFS, the Trustees reviewed the Fund’s total return investment performance as well as the Broadridge performance universe over various time periods. The Trustees placed particular emphasis on the total return performance of the Fund’s Class I shares in comparison to the performance of funds in its Broadridge performance universe over the five-year period ended December 31, 2020, which the Trustees believed was a long enough period to reflect differing market conditions. The total return performance of the Fund’s Class I shares was in the 2nd quintile relative to the other funds in the universe for this five-year period (the 1st quintile being the best performers and the 5th quintile being the worst performers). The total return performance of the Fund’s Class I shares was in the 2nd quintile for each of the one- and three-year periods ended December 31, 2020 relative to the Broadridge performance universe. Because of the passage of time, these performance results may differ from the performance results for more recent periods, including those shown elsewhere in this report.
In the course of their deliberations, the Trustees took into account information provided by MFS in connection with the contract review meetings, as well as during investment review meetings conducted with portfolio management personnel during the course of the year regarding the Fund’s performance. After reviewing these and related factors, the Trustees concluded, within the context of their overall conclusions regarding the investment advisory agreement, that they were satisfied with MFS’ responses and efforts relating to investment performance.
In assessing the reasonableness of the Fund’s advisory fee, the Trustees considered, among other information, the Fund’s advisory fee and the total expense ratio of the Fund’s Class I shares as a percentage of average daily net assets and the advisory fee and total expense ratios of the Broadridge expense group based on information provided by Broadridge. The Trustees considered that MFS currently observes an expense limitation for the Fund, which may not be changed without the Trustees’ approval. The Trustees also considered that, according to the data provided by Broadridge (which takes into account any fee reductions or expense limitations that
Board Review of Investment Advisory Agreement - continued
were in effect during the Fund’s last fiscal year), the Fund’s effective advisory fee rate was approximately at the Broadridge expense group median and the Fund’s total expense ratio was higher than the Broadridge expense group median.
The Trustees also considered the advisory fees charged by MFS to any institutional separate accounts advised by MFS (“separate accounts”) and unaffiliated investment companies for which MFS serves as subadviser (“subadvised funds”) that have comparable investment strategies to the Fund, if any. In comparing these fees, the Trustees considered information provided by MFS as to the generally broader scope of services provided by MFS to the Fund, as well as the more extensive regulatory burdens imposed on MFS in managing the Fund, in comparison to separate accounts and subadvised funds. The Trustees also considered the higher demands placed on MFS’ investment personnel and trading infrastructure as a result of the daily cash in-flows and out-flows of the Fund in comparison to separate accounts.
The Trustees also considered whether the Fund may benefit from any economies of scale in the management of the Fund in the event of growth in assets of the Fund and/or growth in assets of the MFS Funds as a whole. They noted that the Fund’s advisory fee rate schedule is subject to contractual breakpoints that reduce the Fund’s advisory fee rate on average daily net assets over $1 billion, $2.5 billion, and $5 billion. The Trustees also noted that MFS has agreed in writing to waive a portion of the management fees of certain MFS Funds, including the Fund, if the total combined assets of certain funds within the MFS Funds’ complex increase above agreed upon thresholds (the “group fee waiver”), enabling the Fund’s shareholders to share in the benefits from any economies of scale at the complex level. The group fee waiver is reviewed and renewed annually between the Board and MFS. The Trustees concluded that the breakpoints and the group fee waiver were sufficient to allow the Fund to benefit from economies of scale as its assets and overall complex assets grow.
The Trustees also considered information prepared by MFS relating to MFS’ costs and profits with respect to the Fund, the MFS Funds considered as a group, and other investment companies and accounts advised by MFS, as well as MFS’ methodologies used to determine and allocate its costs to the MFS Funds, the Fund and other accounts and products for purposes of estimating profitability.
After reviewing these and other factors described herein, the Trustees concluded, within the context of their overall conclusions regarding the investment advisory agreement, that the advisory fees charged to the Fund represent reasonable compensation in light of the services being provided by MFS to the Fund.
In addition, the Trustees considered MFS’ resources and related efforts to continue to retain, attract and motivate capable personnel to serve the Fund. The Trustees also considered current and developing conditions in the financial services industry, including the presence of large and well-capitalized companies which are spending, and appear to be prepared to continue to spend, substantial sums to engage personnel and to provide services to competing investment companies. In this regard, the Trustees also considered the financial resources of MFS and its ultimate parent, Sun Life Financial Inc. The Trustees also considered the advantages and possible disadvantages to the Fund of having an adviser that also serves other investment companies as well as other accounts.
Board Review of Investment Advisory Agreement - continued
The Trustees also considered the nature, quality, cost, and extent of administrative, transfer agency, and distribution services provided to the Fund by MFS and its affiliates under agreements and plans other than the investment advisory agreement, including any 12b-1 fees the Fund pays to MFS Fund Distributors, Inc., an affiliate of MFS. The Trustees also considered the nature, extent and quality of certain other services MFS performs or arranges for on the Fund’s behalf, which may include securities lending programs, directed expense payment programs, class action recovery programs, and MFS’ interaction with third-party service providers, principally custodians and sub-custodians. The Trustees concluded that the various non-advisory services provided by MFS and its affiliates on behalf of the Fund were satisfactory.
The Trustees considered so-called “fall-out benefits” to MFS such as reputational value derived from serving as investment manager to the MFS Funds. The Trustees also considered that MFS discontinued its historic practice of obtaining investment research from portfolio brokerage commissions paid by certain MFS Funds effective January 2018, and directly pays or voluntarily reimburses a Fund, if applicable, for the costs of external research acquired through the use of the Fund’s portfolio brokerage commissions.
Based on their evaluation of factors that they deemed to be material, including those factors described above, the Board of Trustees, including the independent Trustees, concluded that the Fund’s investment advisory agreement with MFS should be continued for an additional one-year period, commencing August 1, 2021.
Statement Regarding Liquidity Risk Management Program
The fund has adopted and implemented a liquidity risk management program (the “Program”) as required by Rule 22e-4 under the Investment Company Act of 1940, as amended. The fund’s Board of Trustees (the “Board”) has designated MFS as the administrator of the Program. The Program is reasonably designed to assess and manage the liquidity risk of the fund. Liquidity risk is the risk that the fund could not meet requests to redeem shares issued by the fund without significant dilution of remaining investors' interests.
MFS provided a written report to the Board for consideration at its April 2021 meeting that addressed the operation of the Program and provided an assessment of the adequacy and effectiveness of the Program during the period from January 1, 2020 to December 31, 2020 (the “Covered Period”). The report concluded that during the Covered Period the Program had operated effectively and had adequately and effectively been implemented to assess and manage the fund’s liquidity risk. MFS also reported that there were no liquidity events that impacted the fund or its ability to timely meet redemptions without dilution to existing shareholders during the Covered Period.
There can be no assurance that the Program will achieve its objectives in the future. Further information on liquidity risk, and other principal risks to which an investment in the fund may be subject, can be found in the prospectus.
Proxy Voting Policies and Information
MFS votes proxies on behalf of the fund pursuant to proxy voting policies and procedures that are available without charge, upon request, by calling 1-800-225-2606, by visiting mfs.com/proxyvoting, or by visiting the SEC’s Web site at http://www.sec.gov.
Information regarding how the fund voted proxies relating to portfolio securities during the most recent twelve-month period ended June 30 is available by August 31 of each year without charge by visiting mfs.com/proxyvoting, or by visiting the SEC’s Web site at http://www.sec.gov.
Quarterly Portfolio Disclosure
The fund files a complete schedule of portfolio holdings with the SEC for the first and third quarters of each fiscal year as an exhibit to its reports on Form N-PORT. The fund's Form N-PORT reports are available on the SEC's Web site at http://www.sec.gov. A shareholder can obtain the portfolio holdings report for the first and third quarters of the fund's fiscal year at mfs.com/openendfunds by choosing the fund's name and then scrolling to the “Resources” section and clicking on the “Prospectus and Reports” tab.
Further Information
From time to time, MFS may post important information about the fund or the MFS Funds on the MFS Web site (mfs.com). This information is available at https://www.mfs.com/announcements or at mfs.com/openendfunds by choosing the fund’s name and then scrolling to the “Resources” section and clicking on the “Announcements” tab, if any.
Information About Fund Contracts and Legal Claims
The fund has entered into contractual arrangements with an investment adviser, administrator, distributor, shareholder servicing agent, 529 program manager (if applicable), and custodian who each provide services to the fund. Unless expressly stated otherwise, shareholders are not parties to, or intended beneficiaries of these contractual arrangements, and these contractual arrangements are not intended to create any shareholder right to enforce them against the service providers or to seek any remedy under them against the service providers, either directly or on behalf of the fund.
Under the Trust’s By-Laws and Declaration of Trust, any claims asserted against or on behalf of the MFS Funds, including claims against Trustees and Officers, must be brought in state and federal courts located within the Commonwealth of Massachusetts.
Provision of Financial Reports and Summary Prospectuses
The fund produces financial reports every six months and updates its summary prospectus and prospectus annually. To avoid sending duplicate copies of materials to households, only one copy of the fund’s annual and semiannual report and summary prospectus may be mailed to shareholders having the same last name and residential address on the fund’s records. However, any shareholder may contact MFSC (please see back cover for address and telephone number) to request that copies of these reports and summary prospectuses be sent personally to that shareholder.
Save paper with eDelivery.
MFS® will send you prospectuses, reports, and proxies directly via e-mail so you will get information faster with less mailbox clutter.
To sign up:
1. Go to mfs.com.
2. Log in via MFS® Access.
3. Select eDelivery.
If you own your MFS fund shares through a financial institution or a retirement plan, MFS® TALK, MFS® Access, or eDelivery may not be available to you.
CONTACT
WEB SITE
mfs.com
MFS TALK
1-800-637-8255
24 hours a day
ACCOUNT SERVICE AND LITERATURE
Shareholders
1-800-225-2606
Financial advisors
1-800-343-2829
Retirement plan services
1-800-637-1255
MAILING ADDRESS
MFS Service Center, Inc.
P.O. Box 219341
Kansas City, MO 64121-9341
OVERNIGHT MAIL
MFS Service Center, Inc.
Suite 219341
430 W 7th Street
Kansas City, MO 64105-1407
Semiannual Report
August 31, 2021
MFS® New Discovery
Value Fund
MFS® New Discovery
Value Fund
| 1 |
| 2 |
| 3 |
| 5 |
| 11 |
| 13 |
| 14 |
| 15 |
| 24 |
| 35 |
| 39 |
| 40 |
| 40 |
| 40 |
| 40 |
| 40 |
The report is prepared for the general information of shareholders. It is authorized for distribution to prospective investors only when preceded or accompanied by a current prospectus.
NOT FDIC INSURED • MAY LOSE VALUE • NO BANK GUARANTEE
LETTER FROM THE CEO
Dear Shareholders:
After experiencing dramatic swings in the early days of the coronavirus pandemic, global equity markets have performed strongly over the past year. Though the speedy development of vaccines brightened the economic and market outlook, uncertainty remains as new variants of the virus appear, and questions persist over how fast vaccines can be made widely available in the developing world.
After having taken aggressive steps to cushion the economic and market fallout related to the virus, some global central banks have begun to recalibrate monetary policy. For example, the U.S. Federal Reserve has signaled it will likely taper its bond buying program before the end of 2021, which has helped push up Treasury yields, and steepened the yield curve. Having passed a $1.9 trillion stimulus package in March, the U.S. Congress could approve additional stimulus later this year, some of it focused on infrastructure. Production and transportation bottlenecks and labor shortages stemming from the pandemic have fueled a rise in inflation, though policymakers and investors think most of the price hikes will prove transitory.
Since midyear, the spread of the Delta variant of the coronavirus has slowed economic growth while markets have focused on a regulatory crackdown in China, which, when coupled with stress in that country's property development sector, has contributed to a slowdown there. Tightening global energy and raw materials supplies are a further concern for investors.
The policy measures put in place to counteract the pandemic's effects have helped build a supportive environment and are encouraging economic recovery; however, if markets disconnect from fundamentals, they can sow the seeds of instability. As such, recent dramatic increases in speculative trading in cryptocurrencies, special purpose acquisition companies (SPACs), and the like bear watching.
In the aftermath of the crisis, we could see societal changes as households, businesses, and governments adjust to a new reality, and any such alterations could affect the investment landscape. For investors, events such as the COVID-19 outbreak demonstrate the importance of having a deep understanding of company fundamentals, and we have built our global research platform to do just that.
At MFS®, we put our clients’ assets to work responsibly by carefully navigating the increasing complexity of global markets and economies. Guided by our long-term philosophy and adhering to our commitment to sustainable investing, we tune out the noise and aim to uncover what we believe are the best, most durable investment opportunities in the market. Our unique global investment platform combines collective expertise, long-term discipline, and thoughtful risk management to create sustainable value for investors.
Respectfully,
Michael W. Roberge
Chief Executive Officer
MFS Investment Management
October 15, 2021
The opinions expressed in this letter are subject to change and may not be relied upon for investment advice. No forecasts can be guaranteed.
Portfolio structure
Top ten holdings
| Berry Global Group, Inc. | 1.7% |
| Graphic Packaging Holding Co. | 1.7% |
| Skechers USA, Inc., “A” | 1.7% |
| Umpqua Holdings Corp. | 1.6% |
| LKQ Corp. | 1.5% |
| Cathay General Bancorp, Inc. | 1.5% |
| Element Solutions, Inc. | 1.5% |
| International Game Technology PLC | 1.5% |
| UMB Financial Corp. | 1.5% |
| Encore Capital Group, Inc. | 1.5% |
GICS equity sectors (g)
| Financials | 24.1% |
| Industrials | 15.1% |
| Consumer Discretionary | 13.1% |
| Materials | 11.2% |
| Real Estate | 8.8% |
| Information Technology | 7.5% |
| Health Care | 6.0% |
| Energy | 5.1% |
| Utilities | 5.0% |
| Consumer Staples | 2.6% |
| Communication Services | 0.5% |
| (g) | The Global Industry Classification Standard (GICS®) was developed by and/or is the exclusive property of MSCI, Inc. and S&P Global Market Intelligence Inc. (“S&P Global Market Intelligence”). GICS is a service mark of MSCI and S&P Global Market Intelligence and has been licensed for use by MFS. MFS has applied its own internal sector/industry classification methodology for equity securities and non-equity securities that are unclassified by GICS. |
Cash & Cash Equivalents includes any cash, investments in money market funds, short-term securities, and other assets less liabilities. Please see the Statement of Assets and Liabilities for additional information related to the fund’s cash position and other assets and liabilities.
Percentages are based on net assets as of August 31, 2021.
The portfolio is actively managed and current holdings may be different.
Expense Table
Fund expenses borne by the shareholders during the period,
March 1, 2021 through August 31, 2021
As a shareholder of the fund, you incur two types of costs: (1) transaction costs, including sales charges (loads) on certain purchase or redemption payments, and (2) ongoing costs, including management fees; distribution and service (12b-1) fees; and other fund expenses. This example is intended to help you understand your ongoing costs (in dollars) of investing in the fund and to compare these costs with the ongoing costs of investing in other mutual funds.
The example is based on an investment of $1,000 invested at the beginning of the period and held for the entire period March 1, 2021 through August 31, 2021.
Actual Expenses
The first line for each share class in the following table provides information about actual account values and actual expenses. You may use the information in this line, together with the amount you invested, to estimate the expenses that you paid over the period. Simply divide your account value by $1,000 (for example, an $8,600 account value divided by $1,000 = 8.6), then multiply the result by the number in the first line under the heading entitled “Expenses Paid During Period” to estimate the expenses you paid on your account during this period.
Hypothetical Example for Comparison Purposes
The second line for each share class in the following table provides information about hypothetical account values and hypothetical expenses based on the fund’s actual expense ratio and an assumed rate of return of 5% per year before expenses, which is not the fund’s actual return. The hypothetical account values and expenses may not be used to estimate the actual ending account balance or expenses you paid for the period. You may use this information to compare the ongoing costs of investing in the fund and other funds. To do so, compare this 5% hypothetical example with the 5% hypothetical examples that appear in the shareholder reports of the other funds.
Please note that the expenses shown in the table are meant to highlight your ongoing costs only and do not reflect any transactional costs, such as sales charges (loads). Therefore, the second line for each share class in the table is useful in comparing ongoing costs only, and will not help you determine the relative total costs of owning different funds. In addition, if these transactional costs were included, your costs would have been higher.
Expense Table - continued
Share
Class | | Annualized
Expense
Ratio | Beginning
Account Value
3/01/21 | Ending
Account Value
8/31/21 | Expenses
Paid During
Period (p)
3/01/21-8/31/21 |
| A | Actual | 1.18% | $1,000.00 | $1,139.97 | $6.36 |
| Hypothetical (h) | 1.18% | $1,000.00 | $1,019.26 | $6.01 |
| B | Actual | 1.93% | $1,000.00 | $1,135.23 | $10.39 |
| Hypothetical (h) | 1.93% | $1,000.00 | $1,015.48 | $9.80 |
| C | Actual | 1.93% | $1,000.00 | $1,135.32 | $10.39 |
| Hypothetical (h) | 1.93% | $1,000.00 | $1,015.48 | $9.80 |
| I | Actual | 0.93% | $1,000.00 | $1,140.80 | $5.02 |
| Hypothetical (h) | 0.93% | $1,000.00 | $1,020.52 | $4.74 |
| R1 | Actual | 1.93% | $1,000.00 | $1,134.67 | $10.38 |
| Hypothetical (h) | 1.93% | $1,000.00 | $1,015.48 | $9.80 |
| R2 | Actual | 1.43% | $1,000.00 | $1,137.97 | $7.71 |
| Hypothetical (h) | 1.43% | $1,000.00 | $1,018.00 | $7.27 |
| R3 | Actual | 1.18% | $1,000.00 | $1,139.66 | $6.36 |
| Hypothetical (h) | 1.18% | $1,000.00 | $1,019.26 | $6.01 |
| R4 | Actual | 0.93% | $1,000.00 | $1,140.52 | $5.02 |
| Hypothetical (h) | 0.93% | $1,000.00 | $1,020.52 | $4.74 |
| R6 | Actual | 0.83% | $1,000.00 | $1,141.56 | $4.48 |
| Hypothetical (h) | 0.83% | $1,000.00 | $1,021.02 | $4.23 |
| (h) | 5% class return per year before expenses. |
| (p) | “Expenses Paid During Period” are equal to each class’s annualized expense ratio, as shown above, multiplied by the average account value over the period, multiplied by 184/365 (to reflect the one-half year period). Expenses paid do not include any applicable sales charges (loads). If these transaction costs had been included, your costs would have been higher. |
Portfolio of Investments
8/31/21 (unaudited)
The Portfolio of Investments is a complete list of all securities owned by your fund. It is categorized by broad-based asset classes.
| Issuer | | | Shares/Par | Value ($) |
| Common Stocks – 99.0% |
| Aerospace & Defense – 3.2% | |
| CACI International, Inc., “A” (a) | | 182,545 | $ 47,012,639 |
| KBR, Inc. | | 1,404,814 | 54,703,457 |
| PAE, Inc. (a)(h) | | 4,731,143 | 31,651,347 |
| | | | | $133,367,443 |
| Apparel Manufacturers – 2.6% | |
| PVH Corp. (a) | | 379,491 | $ 39,766,862 |
| Skechers USA, Inc., “A” (a) | | 1,378,163 | 69,500,760 |
| | | | | $109,267,622 |
| Automotive – 3.5% | |
| LKQ Corp. (a) | | 1,215,627 | $ 64,051,387 |
| Methode Electronics, Inc. | | 1,016,792 | 47,352,003 |
| Stoneridge, Inc. (a) | | 608,451 | 14,176,908 |
| Visteon Corp. (a) | | 187,772 | 19,843,745 |
| | | | | $145,424,043 |
| Business Services – 1.1% | |
| Paya, Inc. (a) | | 2,997,493 | $ 28,925,807 |
| WNS (Holdings) Ltd., ADR (a) | | 216,821 | 17,983,134 |
| | | | | $46,908,941 |
| Chemicals – 1.5% | |
| Element Solutions, Inc. | | 2,764,561 | $ 62,838,471 |
| Computer Software – 0.9% | |
| 8x8, Inc. (a) | | 749,579 | $ 18,102,333 |
| ACI Worldwide, Inc. (a) | | 648,473 | 20,900,285 |
| | | | | $39,002,618 |
| Computer Software - Systems – 2.1% | |
| Softchoice Corp. | | 1,835,176 | $ 48,728,567 |
| Verint Systems, Inc. (a) | | 880,949 | 39,325,563 |
| | | | | $88,054,130 |
| Construction – 1.7% | |
| Armstrong World Industries, Inc. | | 183,360 | $ 19,056,605 |
| GMS, Inc. (a) | | 346,316 | 17,111,474 |
| Toll Brothers, Inc. | | 542,359 | 34,743,517 |
| | | | | $70,911,596 |
Portfolio of Investments (unaudited) – continued
| Issuer | | | Shares/Par | Value ($) |
| Common Stocks – continued |
| Consumer Products – 2.6% | |
| Energizer Holdings, Inc. | | 614,080 | $ 24,157,907 |
| Newell Brands, Inc. | | 1,157,525 | 29,412,710 |
| Prestige Consumer Healthcare, Inc. (a) | | 946,197 | 54,302,246 |
| | | | | $107,872,863 |
| Consumer Services – 1.7% | |
| BrightView Holdings, Inc. (a) | | 1,082,367 | $ 16,592,686 |
| Grand Canyon Education, Inc. (a) | | 481,112 | 42,886,324 |
| Regis Corp. (a)(h) | | 1,889,155 | 10,239,220 |
| | | | | $69,718,230 |
| Containers – 6.1% | |
| Ardagh Metal Packaging S.A. (a)(l) | | 2,192,940 | $ 23,486,387 |
| Berry Global, Inc. (a) | | 1,059,225 | 71,148,143 |
| Graphic Packaging Holding Co. | | 3,423,037 | 70,240,719 |
| Owens Corning | | 237,843 | 22,725,899 |
| Pactiv Evergreen, Inc. | | 2,442,414 | 33,583,193 |
| Silgan Holdings, Inc. | | 787,779 | 33,425,463 |
| | | | | $254,609,804 |
| Electrical Equipment – 2.8% | |
| nVent Electric PLC | | 1,273,441 | $ 43,755,433 |
| TriMas Corp. (a) | | 1,294,902 | 41,579,303 |
| WESCO International, Inc. (a) | | 282,385 | 33,044,693 |
| | | | | $118,379,429 |
| Electronics – 2.3% | |
| Cohu, Inc. (a) | | 765,254 | $ 27,304,263 |
| nLIGHT, Inc. (a) | | 462,616 | 12,772,828 |
| Plexus Corp. (a) | | 595,332 | 54,669,337 |
| | | | | $94,746,428 |
| Energy - Independent – 2.4% | |
| Devon Energy Corp. | | 952,006 | $ 28,131,777 |
| Magnolia Oil & Gas Corp., “A” | | 2,407,664 | 37,752,172 |
| Viper Energy Partners LP | | 1,868,293 | 34,600,786 |
| | | | | $100,484,735 |
| Engineering - Construction – 1.5% | |
| APi Group, Inc. (a) | | 1,793,407 | $ 41,589,108 |
| Quanta Services, Inc. | | 225,466 | 23,020,079 |
| | | | | $64,609,187 |
Portfolio of Investments (unaudited) – continued
| Issuer | | | Shares/Par | Value ($) |
| Common Stocks – continued |
| Food & Beverages – 2.0% | |
| Hostess Brands, Inc. (a) | | 2,482,405 | $ 39,619,184 |
| Nomad Foods Ltd. (a) | | 1,646,903 | 43,461,770 |
| | | | | $83,080,954 |
| Furniture & Appliances – 0.6% | |
| IMAX Corp. (a) | | 1,481,392 | $ 23,272,668 |
| Gaming & Lodging – 2.2% | |
| International Game Technology PLC (a) | | 2,900,586 | $ 62,333,593 |
| Wyndham Hotels & Resorts, Inc. | | 408,822 | 29,721,360 |
| | | | | $92,054,953 |
| Insurance – 4.2% | |
| CNO Financial Group, Inc. | | 1,969,458 | $ 48,172,943 |
| Everest Re Group Ltd. | | 133,647 | 35,403,090 |
| Hanover Insurance Group, Inc. | | 282,016 | 39,851,681 |
| Selective Insurance Group, Inc. | | 442,065 | 36,943,372 |
| SiriusPoint Ltd. (a) | | 1,711,526 | 16,790,070 |
| | | | | $177,161,156 |
| Leisure & Toys – 1.1% | |
| Brunswick Corp. | | 272,666 | $ 26,413,155 |
| Funko, Inc., “A” (a) | | 919,939 | 18,343,584 |
| | | | | $44,756,739 |
| Machinery & Tools – 1.4% | |
| Enerpac Tool Group Corp. | | 557,985 | $ 14,038,903 |
| Regal Beloit Corp. | | 120,484 | 18,002,719 |
| Rexnord Corp. | | 447,082 | 27,164,702 |
| | | | | $59,206,324 |
| Medical & Health Technology & Services – 3.3% | |
| ICON PLC (a) | | 124,847 | $ 31,932,117 |
| Premier, Inc., “A” | | 1,288,747 | 47,915,613 |
| Syneos Health, Inc. (a) | | 639,107 | 59,296,348 |
| | | | | $139,144,078 |
| Medical Equipment – 0.8% | |
| Agiliti Health, Inc. (a) | | 1,657,969 | $ 35,364,479 |
| Metals & Mining – 1.4% | |
| Arconic Corp. (a) | | 1,079,407 | $ 37,228,747 |
| Kaiser Aluminum Corp. | | 182,427 | 23,033,233 |
| | | | | $60,261,980 |
Portfolio of Investments (unaudited) – continued
| Issuer | | | Shares/Par | Value ($) |
| Common Stocks – continued |
| Natural Gas - Distribution – 2.2% | |
| New Jersey Resources Corp. | | 1,084,360 | $ 40,490,003 |
| South Jersey Industries, Inc. | | 2,075,898 | 51,503,029 |
| | | | | $91,993,032 |
| Natural Gas - Pipeline – 1.1% | |
| Plains GP Holdings LP | | 4,557,644 | $ 44,482,605 |
| Oil Services – 1.6% | |
| ChampionX Corp. (a) | | 2,169,559 | $ 50,615,811 |
| Frank's International N.V. (a) | | 5,977,271 | 17,214,541 |
| | | | | $67,830,352 |
| Other Banks & Diversified Financials – 21.1% | |
| Air Lease Corp. | | 570,019 | $ 22,652,555 |
| Bank of Hawaii Corp. | | 516,721 | 43,306,387 |
| Brookline Bancorp, Inc. | | 2,503,525 | 37,477,769 |
| Cathay General Bancorp, Inc. | | 1,581,771 | 62,922,850 |
| East West Bancorp, Inc. | | 584,161 | 42,842,368 |
| Element Fleet Management Corp. | | 3,910,702 | 43,116,447 |
| Encore Capital Group, Inc. (a) | | 1,238,033 | 60,923,604 |
| First Hawaiian, Inc. | | 1,823,767 | 50,901,337 |
| Hanmi Financial Corp. | | 1,450,163 | 27,959,143 |
| Lakeland Financial Corp. | | 432,093 | 28,695,296 |
| Prosperity Bancshares, Inc. | | 774,123 | 54,095,715 |
| Sandy Spring Bancorp, Inc. | | 519,881 | 22,651,215 |
| Signature Bank | | 108,013 | 28,011,011 |
| SLM Corp. | | 3,164,541 | 59,335,144 |
| Textainer Group Holdings Ltd. (a) | | 1,741,588 | 57,855,553 |
| Triton International Ltd. of Bermuda | | 467,605 | 25,587,346 |
| UMB Financial Corp. | | 679,956 | 62,270,371 |
| Umpqua Holdings Corp. | | 3,490,468 | 67,959,412 |
| Wintrust Financial Corp. | | 571,564 | 42,775,850 |
| Zions Bancorp NA | | 772,486 | 44,726,939 |
| | | | | $886,066,312 |
| Pharmaceuticals – 0.5% | |
| Organon & Co. | | 631,201 | $ 21,391,402 |
| Pollution Control – 0.5% | |
| U.S. Ecology, Inc. (a) | | 565,482 | $ 20,272,530 |
| Real Estate – 10.1% | |
| Brixmor Property Group, Inc., REIT | | 1,172,881 | $ 27,504,059 |
| Broadstone Net Lease, Inc. | | 1,683,791 | 46,135,873 |
| Douglas Emmett, Inc., REIT | | 513,846 | 16,962,057 |
Portfolio of Investments (unaudited) – continued
| Issuer | | | Shares/Par | Value ($) |
| Common Stocks – continued |
| Real Estate – continued | |
| Empire State Realty Trust, REIT, “A” | | 3,041,749 | $ 31,238,762 |
| Industrial Logistics Properties Trust, REIT | | 1,903,900 | 52,223,977 |
| Lexington Realty Trust, REIT | | 3,304,496 | 44,709,831 |
| Life Storage, Inc., REIT | | 310,665 | 38,659,153 |
| National Storage Affiliates Trust, REIT | | 550,470 | 31,514,408 |
| Office Properties Income Trust, REIT | | 618,193 | 16,400,660 |
| Phillips Edison & Co., REIT (h) | | 1,098,212 | 33,012,253 |
| STAG Industrial, Inc., REIT | | 773,603 | 32,684,727 |
| Two Harbors Investment Corp., REIT | | 7,796,444 | 51,456,530 |
| | | | | $422,502,290 |
| Specialty Chemicals – 3.5% | |
| Avient Corp. | | 1,122,553 | $ 58,473,786 |
| Axalta Coating Systems Ltd. (a) | | 644,917 | 19,695,765 |
| Diversey Holdings Ltd. (a) | | 2,056,192 | 35,921,674 |
| Univar Solutions, Inc. (a) | | 1,322,272 | 31,218,842 |
| | | | | $145,310,067 |
| Specialty Stores – 2.0% | |
| Urban Outfitters, Inc. (a) | | 1,309,546 | $ 43,241,209 |
| Zumiez, Inc. (a) | | 1,058,373 | 42,536,011 |
| | | | | $85,777,220 |
| Trucking – 0.6% | |
| Schneider National, Inc. | | 1,122,828 | $ 25,308,543 |
| Utilities - Electric Power – 2.8% | |
| Black Hills Corp. | | 847,400 | $ 59,597,642 |
| Portland General Electric Co. | | 1,119,556 | 57,489,201 |
| | | | | $117,086,843 |
| Total Common Stocks (Identified Cost, $3,024,206,009) | | $4,148,520,067 |
| Investment Companies (h) – 1.0% |
| Money Market Funds – 1.0% | |
| MFS Institutional Money Market Portfolio, 0.04% (v) (Identified Cost, $41,221,211) | | | 41,221,211 | $ 41,221,211 |
| Collateral for Securities Loaned – 0.2% |
| State Street Navigator Securities Lending Government Money Market Portfolio, 0.03% (j) (Identified Cost, $6,976,811) | | | 6,976,811 | $ 6,976,811 |
|
|
| Other Assets, Less Liabilities – (0.2)% | | (7,990,878) |
| Net Assets – 100.0% | $4,188,727,211 |
Portfolio of Investments (unaudited) – continued
| (a) | Non-income producing security. | | | |
| (h) | An affiliated issuer, which may be considered one in which the fund owns 5% or more of the outstanding voting securities, or a company which is under common control. At period end, the aggregate values of the fund's investments in affiliated issuers and in unaffiliated issuers were $116,124,031 and $4,080,594,058, respectively. | | | |
| (j) | The rate quoted is the annualized seven-day yield of the fund at period end. | | | |
| (l) | A portion of this security is on loan. See Note 2 for additional information. | | | |
| (v) | Affiliated issuer that is available only to investment companies managed by MFS. The rate quoted for the MFS Institutional Money Market Portfolio is the annualized seven-day yield of the fund at period end. | | | |
| The following abbreviations are used in this report and are defined: |
| ADR | American Depositary Receipt |
| REIT | Real Estate Investment Trust |
See Notes to Financial Statements
Financial Statements
Statement of Assets and Liabilities
At 8/31/21 (unaudited)
This statement represents your fund’s balance sheet, which details the assets and liabilities comprising the total value of the fund.
| Assets | |
| Investments in unaffiliated issuers, at value, including $7,064,969 of securities on loan (identified cost, $2,932,208,597) | $4,080,594,058 |
| Investments in affiliated issuers, at value (identified cost, $140,195,434) | 116,124,031 |
| Receivables for | |
| Investments sold | 4,485,703 |
| Fund shares sold | 4,755,660 |
| Interest and dividends | 3,957,277 |
| Other assets | 72,441 |
| Total assets | $4,209,989,170 |
| Liabilities | |
| Payables for | |
| Investments purchased | $4,074,113 |
| Fund shares reacquired | 9,203,086 |
| Collateral for securities loaned, at value (c) | 6,976,811 |
| Payable to affiliates | |
| Investment adviser | 202,755 |
| Administrative services fee | 3,058 |
| Shareholder servicing costs | 550,440 |
| Distribution and service fees | 9,231 |
| Accrued expenses and other liabilities | 242,465 |
| Total liabilities | $21,261,959 |
| Net assets | $4,188,727,211 |
| Net assets consist of | |
| Paid-in capital | $2,823,876,816 |
| Total distributable earnings (loss) | 1,364,850,395 |
| Net assets | $4,188,727,211 |
| Shares of beneficial interest outstanding | 197,610,555 |
| (c) | Non-cash collateral is not included. |
Statement of Assets and Liabilities (unaudited) – continued
| | Net assets | Shares
outstanding | Net asset value
per share (a) |
| Class A | $363,952,794 | 17,326,050 | $21.01 |
| Class B | 6,456,976 | 325,763 | 19.82 |
| Class C | 40,626,800 | 2,060,623 | 19.72 |
| Class I | 1,679,540,817 | 79,207,106 | 21.20 |
| Class R1 | 2,445,812 | 123,372 | 19.82 |
| Class R2 | 5,099,443 | 245,037 | 20.81 |
| Class R3 | 100,711,366 | 4,783,794 | 21.05 |
| Class R4 | 100,948,598 | 4,754,055 | 21.23 |
| Class R6 | 1,888,944,605 | 88,784,755 | 21.28 |
| (a) | Maximum offering price per share was equal to the net asset value per share for all share classes, except for Class A, for which the maximum offering price per share was $22.29 [100 / 94.25 x $21.01]. On sales of $50,000 or more, the maximum offering price of Class A shares is reduced. A contingent deferred sales charge may be imposed on redemptions of Class A, Class B, and Class C shares. Redemption price per share was equal to the net asset value per share for Classes I, R1, R2, R3, R4, and R6. |
See Notes to Financial Statements
Financial Statements
Statement of Operations
Six months ended 8/31/21 (unaudited)
This statement describes how much your fund earned in investment income and accrued in expenses. It also describes any gains and/or losses generated by fund operations.
| Net investment income (loss) | |
| Income | |
| Dividends | $31,411,429 |
| Other | 111,714 |
| Income on securities loaned | 64,410 |
| Dividends from affiliated issuers | 6,009 |
| Foreign taxes withheld | (57,101) |
| Total investment income | $31,536,461 |
| Expenses | |
| Management fee | $16,558,844 |
| Distribution and service fees | 845,183 |
| Shareholder servicing costs | 1,236,662 |
| Administrative services fee | 272,323 |
| Independent Trustees' compensation | 27,879 |
| Custodian fee | 65,201 |
| Shareholder communications | 116,099 |
| Audit and tax fees | 29,455 |
| Legal fees | 10,718 |
| Miscellaneous | 120,982 |
| Total expenses | $19,283,346 |
| Reduction of expenses by investment adviser and distributor | (257,684) |
| Net expenses | $19,025,662 |
| Net investment income (loss) | $12,510,799 |
| Realized and unrealized gain (loss) |
| Realized gain (loss) (identified cost basis) | |
| Unaffiliated issuers | $289,559,401 |
| Foreign currency | 74,885 |
| Net realized gain (loss) | $289,634,286 |
| Change in unrealized appreciation or depreciation | |
| Unaffiliated issuers | $238,306,070 |
| Affiliated issuers | (16,692,183) |
| Net unrealized gain (loss) | $221,613,887 |
| Net realized and unrealized gain (loss) | $511,248,173 |
| Change in net assets from operations | $523,758,972 |
See Notes to Financial Statements
Financial Statements
Statements of Changes in Net Assets
These statements describe the increases and/or decreases in net assets resulting from operations, any distributions, and any shareholder transactions.
| | Six months ended | Year ended |
| | 8/31/21
(unaudited) | 2/28/21 |
| Change in net assets | | |
| From operations | | |
| Net investment income (loss) | $12,510,799 | $23,018,760 |
| Net realized gain (loss) | 289,634,286 | (33,509,403) |
| Net unrealized gain (loss) | 221,613,887 | 992,232,798 |
| Change in net assets from operations | $523,758,972 | $981,742,155 |
| Total distributions to shareholders | $(23,583,414) | $(67,363,256) |
| Change in net assets from fund share transactions | $(42,632,090) | $(147,791,280) |
| Total change in net assets | $457,543,468 | $766,587,619 |
| Net assets | | |
| At beginning of period | 3,731,183,743 | 2,964,596,124 |
| At end of period | $4,188,727,211 | $3,731,183,743 |
See Notes to Financial Statements
Financial Statements
Financial Highlights
The financial highlights table is intended to help you understand the fund's financial performance for the semiannual period and the past 5 fiscal years. Certain information reflects financial results for a single fund share. The total returns in the table represent the rate that an investor would have earned (or lost) on an investment in the fund share class (assuming reinvestment of all distributions) held for the entire period.
| Class A | Six months
ended | Year ended |
| | 8/31/21
(unaudited) | 2/28/21 | 2/29/20 | 2/28/19
| 2/28/18 | 2/28/17 |
| Net asset value, beginning of period | $18.53 | $14.12 | $15.16 | $14.92 | $14.99 | $11.40 |
| Income (loss) from investment operations |
| Net investment income (loss) (d) | $0.04 | $0.07 | $0.10 | $0.05 | $0.02 | $0.03(c) |
| Net realized and unrealized gain (loss) | 2.55 | 4.66 | (0.38) | 1.21 | 0.72 | 4.18 |
| Total from investment operations | $2.59 | $4.73 | $(0.28) | $1.26 | $0.74 | $4.21 |
| Less distributions declared to shareholders |
| From net investment income | $(0.11) | $— | $(0.10) | $(0.04) | $(0.00)(w) | $(0.06) |
| From net realized gain | (0.00)(w) | (0.32) | (0.66) | (0.98) | (0.81) | (0.56) |
| Total distributions declared to shareholders | $(0.11) | $(0.32) | $(0.76) | $(1.02) | $(0.81) | $(0.62) |
| Net asset value, end of period (x) | $21.01 | $18.53 | $14.12 | $15.16 | $14.92 | $14.99 |
| Total return (%) (r)(s)(t)(x) | 14.00(n) | 34.47 | (2.41) | 8.90 | 4.98 | 37.22(c) |
Ratios (%) (to average net assets)
and Supplemental data: |
| Expenses before expense reductions (f) | 1.19(a) | 1.23 | 1.23 | 1.29 | 1.33 | 1.43(c) |
| Expenses after expense reductions (f) | 1.18(a) | 1.22 | 1.22 | 1.28 | 1.32 | 1.39(c) |
| Net investment income (loss) | 0.35(a) | 0.53 | 0.64 | 0.31 | 0.12 | 0.22(c) |
| Portfolio turnover | 21(n) | 48 | 44 | 57 | 60 | 60 |
| Net assets at end of period (000 omitted) | $363,953 | $333,743 | $331,255 | $318,067 | $250,525 | $189,746 |
See Notes to Financial Statements
Financial Highlights – continued
| Class B | Six months
ended | Year ended |
| | 8/31/21
(unaudited) | 2/28/21 | 2/29/20 | 2/28/19
| 2/28/18 | 2/28/17 |
| Net asset value, beginning of period | $17.54 | $13.48 | $14.52 | $14.40 | $14.60 | $11.16 |
| Income (loss) from investment operations |
| Net investment income (loss) (d) | $(0.04) | $(0.03) | $(0.02) | $(0.07) | $(0.09) | $(0.07)(c) |
| Net realized and unrealized gain (loss) | 2.41 | 4.41 | (0.36) | 1.17 | 0.70 | 4.08 |
| Total from investment operations | $2.37 | $4.38 | $(0.38) | $1.10 | $0.61 | $4.01 |
| Less distributions declared to shareholders |
| From net investment income | $(0.09) | $— | $— | $— | $— | $(0.01) |
| From net realized gain | (0.00)(w) | (0.32) | (0.66) | (0.98) | (0.81) | (0.56) |
| Total distributions declared to shareholders | $(0.09) | $(0.32) | $(0.66) | $(0.98) | $(0.81) | $(0.57) |
| Net asset value, end of period (x) | $19.82 | $17.54 | $13.48 | $14.52 | $14.40 | $14.60 |
| Total return (%) (r)(s)(t)(x) | 13.52(n) | 33.50 | (3.11) | 8.05 | 4.21 | 36.17(c) |
Ratios (%) (to average net assets)
and Supplemental data: |
| Expenses before expense reductions (f) | 1.94(a) | 1.98 | 1.98 | 2.04 | 2.08 | 2.18(c) |
| Expenses after expense reductions (f) | 1.93(a) | 1.97 | 1.97 | 2.03 | 2.07 | 2.14(c) |
| Net investment income (loss) | (0.40)(a) | (0.21) | (0.12) | (0.48) | (0.63) | (0.54)(c) |
| Portfolio turnover | 21(n) | 48 | 44 | 57 | 60 | 60 |
| Net assets at end of period (000 omitted) | $6,457 | $6,032 | $6,207 | $7,198 | $6,329 | $5,872 |
See Notes to Financial Statements
Financial Highlights – continued
| Class C | Six months
ended | Year ended |
| | 8/31/21
(unaudited) | 2/28/21 | 2/29/20 | 2/28/19
| 2/28/18 | 2/28/17 |
| Net asset value, beginning of period | $17.45 | $13.41 | $14.45 | $14.33 | $14.54 | $11.11 |
| Income (loss) from investment operations |
| Net investment income (loss) (d) | $(0.04) | $(0.03) | $(0.02) | $(0.08) | $(0.09) | $(0.06)(c) |
| Net realized and unrealized gain (loss) | 2.40 | 4.39 | (0.36) | 1.18 | 0.69 | 4.05 |
| Total from investment operations | $2.36 | $4.36 | $(0.38) | $1.10 | $0.60 | $3.99 |
| Less distributions declared to shareholders |
| From net investment income | $(0.09) | $— | $— | $— | $— | $— |
| From net realized gain | (0.00)(w) | (0.32) | (0.66) | (0.98) | (0.81) | (0.56) |
| Total distributions declared to shareholders | $(0.09) | $(0.32) | $(0.66) | $(0.98) | $(0.81) | $(0.56) |
| Net asset value, end of period (x) | $19.72 | $17.45 | $13.41 | $14.45 | $14.33 | $14.54 |
| Total return (%) (r)(s)(t)(x) | 13.53(n) | 33.52 | (3.12) | 8.09 | 4.15 | 36.17(c) |
Ratios (%) (to average net assets)
and Supplemental data: |
| Expenses before expense reductions (f) | 1.94(a) | 1.98 | 1.98 | 2.04 | 2.08 | 2.18(c) |
| Expenses after expense reductions (f) | 1.93(a) | 1.97 | 1.97 | 2.03 | 2.07 | 2.14(c) |
| Net investment income (loss) | (0.41)(a) | (0.21) | (0.11) | (0.56) | (0.64) | (0.46)(c) |
| Portfolio turnover | 21(n) | 48 | 44 | 57 | 60 | 60 |
| Net assets at end of period (000 omitted) | $40,627 | $39,061 | $38,477 | $41,046 | $52,616 | $63,140 |
See Notes to Financial Statements
Financial Highlights – continued
| Class I | Six months
ended | Year ended |
| | 8/31/21
(unaudited) | 2/28/21 | 2/29/20 | 2/28/19
| 2/28/18 | 2/28/17 |
| Net asset value, beginning of period | $18.69 | $14.21 | $15.25 | $15.00 | $15.06 | $11.44 |
| Income (loss) from investment operations |
| Net investment income (loss) (d) | $0.06 | $0.11 | $0.14 | $0.12 | $0.06 | $0.06(c) |
| Net realized and unrealized gain (loss) | 2.57 | 4.70 | (0.39) | 1.19 | 0.73 | 4.20 |
| Total from investment operations | $2.63 | $4.81 | $(0.25) | $1.31 | $0.79 | $4.26 |
| Less distributions declared to shareholders |
| From net investment income | $(0.12) | $(0.01) | $(0.13) | $(0.08) | $(0.04) | $(0.08) |
| From net realized gain | (0.00)(w) | (0.32) | (0.66) | (0.98) | (0.81) | (0.56) |
| Total distributions declared to shareholders | $(0.12) | $(0.33) | $(0.79) | $(1.06) | $(0.85) | $(0.64) |
| Net asset value, end of period (x) | $21.20 | $18.69 | $14.21 | $15.25 | $15.00 | $15.06 |
| Total return (%) (r)(s)(t)(x) | 14.08(n) | 34.82 | (2.17) | 9.19 | 5.26 | 37.54(c) |
Ratios (%) (to average net assets)
and Supplemental data: |
| Expenses before expense reductions (f) | 0.94(a) | 0.98 | 0.98 | 1.04 | 1.08 | 1.18(c) |
| Expenses after expense reductions (f) | 0.93(a) | 0.97 | 0.97 | 1.03 | 1.07 | 1.14(c) |
| Net investment income (loss) | 0.60(a) | 0.78 | 0.89 | 0.77 | 0.37 | 0.42(c) |
| Portfolio turnover | 21(n) | 48 | 44 | 57 | 60 | 60 |
| Net assets at end of period (000 omitted) | $1,679,541 | $1,430,510 | $1,119,891 | $917,167 | $351,939 | $242,154 |
See Notes to Financial Statements
Financial Highlights – continued
| Class R1 | Six months
ended | Year ended |
| | 8/31/21
(unaudited) | 2/28/21 | 2/29/20 | 2/28/19
| 2/28/18 | 2/28/17 |
| Net asset value, beginning of period | $17.55 | $13.49 | $14.53 | $14.41 | $14.61 | $11.16 |
| Income (loss) from investment operations |
| Net investment income (loss) (d) | $(0.04) | $(0.03) | $(0.02) | $(0.06) | $(0.09) | $(0.06)(c) |
| Net realized and unrealized gain (loss) | 2.40 | 4.41 | (0.36) | 1.16 | 0.70 | 4.07 |
| Total from investment operations | $2.36 | $4.38 | $(0.38) | $1.10 | $0.61 | $4.01 |
| Less distributions declared to shareholders |
| From net investment income | $(0.09) | $— | $(0.00)(w) | $— | $— | $— |
| From net realized gain | (0.00)(w) | (0.32) | (0.66) | (0.98) | (0.81) | (0.56) |
| Total distributions declared to shareholders | $(0.09) | $(0.32) | $(0.66) | $(0.98) | $(0.81) | $(0.56) |
| Net asset value, end of period (x) | $19.82 | $17.55 | $13.49 | $14.53 | $14.41 | $14.61 |
| Total return (%) (r)(s)(t)(x) | 13.47(n) | 33.47 | (3.08) | 8.04 | 4.20 | 36.19(c) |
Ratios (%) (to average net assets)
and Supplemental data: |
| Expenses before expense reductions (f) | 1.94(a) | 1.98 | 1.98 | 2.04 | 2.08 | 2.18(c) |
| Expenses after expense reductions (f) | 1.93(a) | 1.96 | 1.97 | 2.03 | 2.07 | 2.14(c) |
| Net investment income (loss) | (0.40)(a) | (0.22) | (0.11) | (0.42) | (0.64) | (0.45)(c) |
| Portfolio turnover | 21(n) | 48 | 44 | 57 | 60 | 60 |
| Net assets at end of period (000 omitted) | $2,446 | $2,320 | $1,453 | $1,581 | $1,228 | $210 |
See Notes to Financial Statements
Financial Highlights – continued
| Class R2 | Six months
ended | Year ended |
| | 8/31/21
(unaudited) | 2/28/21 | 2/29/20 | 2/28/19
| 2/28/18 | 2/28/17 |
| Net asset value, beginning of period | $18.38 | $14.04 | $15.09 | $14.87 | $14.97 | $11.40 |
| Income (loss) from investment operations |
| Net investment income (loss) (d) | $0.02 | $0.04 | $0.06 | $0.02 | $(0.02) | $(0.00)(c)(w) |
| Net realized and unrealized gain (loss) | 2.51 | 4.62 | (0.38) | 1.19 | 0.73 | 4.17 |
| Total from investment operations | $2.53 | $4.66 | $(0.32) | $1.21 | $0.71 | $4.17 |
| Less distributions declared to shareholders |
| From net investment income | $(0.10) | $— | $(0.07) | $(0.01) | $— | $(0.04) |
| From net realized gain | (0.00)(w) | (0.32) | (0.66) | (0.98) | (0.81) | (0.56) |
| Total distributions declared to shareholders | $(0.10) | $(0.32) | $(0.73) | $(0.99) | $(0.81) | $(0.60) |
| Net asset value, end of period (x) | $20.81 | $18.38 | $14.04 | $15.09 | $14.87 | $14.97 |
| Total return (%) (r)(s)(t)(x) | 13.80(n) | 34.16 | (2.64) | 8.59 | 4.78 | 36.81(c) |
Ratios (%) (to average net assets)
and Supplemental data: |
| Expenses before expense reductions (f) | 1.44(a) | 1.48 | 1.47 | 1.54 | 1.58 | 1.68(c) |
| Expenses after expense reductions (f) | 1.43(a) | 1.47 | 1.47 | 1.53 | 1.57 | 1.64(c) |
| Net investment income (loss) | 0.15(a) | 0.29 | 0.40 | 0.16 | (0.13) | (0.02)(c) |
| Portfolio turnover | 21(n) | 48 | 44 | 57 | 60 | 60 |
| Net assets at end of period (000 omitted) | $5,099 | $4,779 | $5,054 | $3,719 | $2,349 | $1,216 |
See Notes to Financial Statements
Financial Highlights – continued
| Class R3 | Six months
ended | Year ended |
| | 8/31/21
(unaudited) | 2/28/21 | 2/29/20 | 2/28/19
| 2/28/18 | 2/28/17 |
| Net asset value, beginning of period | $18.57 | $14.15 | $15.20 | $14.96 | $15.03 | $11.43 |
| Income (loss) from investment operations |
| Net investment income (loss) (d) | $0.04 | $0.07 | $0.10 | $0.06 | $0.02 | $0.01(c) |
| Net realized and unrealized gain (loss) | 2.55 | 4.67 | (0.38) | 1.20 | 0.73 | 4.20 |
| Total from investment operations | $2.59 | $4.74 | $(0.28) | $1.26 | $0.75 | $4.21 |
| Less distributions declared to shareholders |
| From net investment income | $(0.11) | $(0.00)(w) | $(0.11) | $(0.04) | $(0.01) | $(0.05) |
| From net realized gain | (0.00)(w) | (0.32) | (0.66) | (0.98) | (0.81) | (0.56) |
| Total distributions declared to shareholders | $(0.11) | $(0.32) | $(0.77) | $(1.02) | $(0.82) | $(0.61) |
| Net asset value, end of period (x) | $21.05 | $18.57 | $14.15 | $15.20 | $14.96 | $15.03 |
| Total return (%) (r)(s)(t)(x) | 13.97(n) | 34.47 | (2.41) | 8.88 | 5.04 | 37.11(c) |
Ratios (%) (to average net assets)
and Supplemental data: |
| Expenses before expense reductions (f) | 1.19(a) | 1.23 | 1.22 | 1.29 | 1.33 | 1.46(c) |
| Expenses after expense reductions (f) | 1.18(a) | 1.22 | 1.21 | 1.28 | 1.32 | 1.39(c) |
| Net investment income (loss) | 0.37(a) | 0.53 | 0.64 | 0.40 | 0.11 | 0.08(c) |
| Portfolio turnover | 21(n) | 48 | 44 | 57 | 60 | 60 |
| Net assets at end of period (000 omitted) | $100,711 | $88,963 | $76,069 | $45,355 | $26,095 | $14,208 |
See Notes to Financial Statements
Financial Highlights – continued
| Class R4 | Six months
ended | Year ended |
| | 8/31/21
(unaudited) | 2/28/21 | 2/29/20 | 2/28/19
| 2/28/18 | 2/28/17 |
| Net asset value, beginning of period | $18.72 | $14.23 | $15.27 | $15.02 | $15.08 | $11.46 |
| Income (loss) from investment operations |
| Net investment income (loss) (d) | $0.05 | $0.11 | $0.14 | $0.10 | $0.06 | $0.06(c) |
| Net realized and unrealized gain (loss) | 2.58 | 4.71 | (0.38) | 1.21 | 0.73 | 4.20 |
| Total from investment operations | $2.63 | $4.82 | $(0.24) | $1.31 | $0.79 | $4.26 |
| Less distributions declared to shareholders |
| From net investment income | $(0.12) | $(0.01) | $(0.14) | $(0.08) | $(0.04) | $(0.08) |
| From net realized gain | (0.00)(w) | (0.32) | (0.66) | (0.98) | (0.81) | (0.56) |
| Total distributions declared to shareholders | $(0.12) | $(0.33) | $(0.80) | $(1.06) | $(0.85) | $(0.64) |
| Net asset value, end of period (x) | $21.23 | $18.72 | $14.23 | $15.27 | $15.02 | $15.08 |
| Total return (%) (r)(s)(t)(x) | 14.05(n) | 34.84 | (2.16) | 9.19 | 5.28 | 37.46(c) |
Ratios (%) (to average net assets)
and Supplemental data: |
| Expenses before expense reductions (f) | 0.94(a) | 0.98 | 0.98 | 1.03 | 1.08 | 1.20(c) |
| Expenses after expense reductions (f) | 0.93(a) | 0.97 | 0.97 | 1.03 | 1.07 | 1.14(c) |
| Net investment income (loss) | 0.53(a) | 0.78 | 0.89 | 0.66 | 0.36 | 0.45(c) |
| Portfolio turnover | 21(n) | 48 | 44 | 57 | 60 | 60 |
| Net assets at end of period (000 omitted) | $100,949 | $104,206 | $82,613 | $71,765 | $5,469 | $2,440 |
See Notes to Financial Statements
Financial Highlights – continued
| Class R6 | Six months
ended | Year ended |
| | 8/31/21
(unaudited) | 2/28/21 | 2/29/20 | 2/28/19
| 2/28/18 | 2/28/17 |
| Net asset value, beginning of period | $18.75 | $14.24 | $15.27 | $15.02 | $15.08 | $11.45 |
| Income (loss) from investment operations |
| Net investment income (loss) (d) | $0.07 | $0.13 | $0.16 | $0.12 | $0.07 | $0.10(c) |
| Net realized and unrealized gain (loss) | 2.58 | 4.71 | (0.38) | 1.20 | 0.73 | 4.18 |
| Total from investment operations | $2.65 | $4.84 | $(0.22) | $1.32 | $0.80 | $4.28 |
| Less distributions declared to shareholders |
| From net investment income | $(0.12) | $(0.01) | $(0.15) | $(0.09) | $(0.05) | $(0.09) |
| From net realized gain | (0.00)(w) | (0.32) | (0.66) | (0.98) | (0.81) | (0.56) |
| Total distributions declared to shareholders | $(0.12) | $(0.33) | $(0.81) | $(1.07) | $(0.86) | $(0.65) |
| Net asset value, end of period (x) | $21.28 | $18.75 | $14.24 | $15.27 | $15.02 | $15.08 |
| Total return (%) (r)(s)(t)(x) | 14.16(n) | 34.98 | (2.02) | 9.28 | 5.36 | 37.68(c) |
Ratios (%) (to average net assets)
and Supplemental data: |
| Expenses before expense reductions (f) | 0.84(a) | 0.87 | 0.87 | 0.92 | 0.97 | 1.07(c) |
| Expenses after expense reductions (f) | 0.83(a) | 0.86 | 0.86 | 0.92 | 0.96 | 1.02(c) |
| Net investment income (loss) | 0.71(a) | 0.89 | 0.99 | 0.78 | 0.47 | 0.73(c) |
| Portfolio turnover | 21(n) | 48 | 44 | 57 | 60 | 60 |
| Net assets at end of period (000 omitted) | $1,888,945 | $1,721,570 | $1,303,575 | $938,134 | $599,845 | $346,955 |
| (a) | Annualized. |
| (c) | Amount reflects a one-time reimbursement of expenses by the custodian (or former custodian) without which net investment income and performance would be lower and expenses would be higher. |
| (d) | Per share data is based on average shares outstanding. |
| (f) | Ratios do not reflect reductions from fees paid indirectly, if applicable. |
| (n) | Not annualized. |
| (r) | Certain expenses have been reduced without which performance would have been lower. |
| (s) | From time to time the fund may receive proceeds from litigation settlements, without which performance would be lower. |
| (t) | Total returns do not include any applicable sales charges. |
| (w) | Per share amount was less than $0.01. |
| (x) | The net asset values and total returns have been calculated on net assets which include adjustments made in accordance with U.S. generally accepted accounting principles required at period end for financial reporting purposes. |
See Notes to Financial Statements
Notes to Financial Statements
(unaudited)
(1) Business and Organization
MFS New Discovery Value Fund (the fund) is a diversified series of MFS Series Trust XIII (the trust). The trust is organized as a Massachusetts business trust and is registered under the Investment Company Act of 1940, as amended, as an open-end management investment company.
The fund is an investment company and accordingly follows the investment company accounting and reporting guidance of the Financial Accounting Standards Board (FASB) Accounting Standards Codification Topic 946 Financial Services - Investment Companies.
(2) Significant Accounting Policies
General — The preparation of financial statements in conformity with U.S. generally accepted accounting principles requires management to make estimates and assumptions that affect the reported amounts of assets and liabilities, and disclosure of contingent assets and liabilities at the date of the financial statements and the reported amounts of increases and decreases in net assets from operations during the reporting period. Actual results could differ from those estimates. In the preparation of these financial statements, management has evaluated subsequent events occurring after the date of the fund’s Statement of Assets and Liabilities through the date that the financial statements were issued. The fund will generally focus on securities of small size companies which may be more volatile than those of larger companies.
Certain of the fund's investments, including its investments in derivatives, as well as any debt issued by the fund and other contractual arrangements of the fund may be based on reference interest rates such as the London Interbank Offered Rate (“LIBOR”). In 2017, the regulatory authority that oversees financial services firms in the United Kingdom announced plans to transition away from LIBOR by the end of 2021. In March 2021, the administrator of LIBOR announced the extension of the publication of the more commonly used U.S. dollar LIBOR settings to the end of June 2023. Although the full impacts of the transition away from LIBOR are not fully known, the transition may result in, among other things, an increase in volatility or illiquidity of the markets for instruments that currently rely on LIBOR to determine interest rates and this could have an adverse impact on the fund's performance. With respect to the fund's accounting for investments, including its investments in derivatives, as well as any debt issued by the fund and other contractual arrangements of the fund that undergo reference rate-related modifications as a result of the transition, management will rely upon the relief provided by FASB Codification Topic 848 – Reference Rate Reform (Topic 848). The guidance in Topic 848 permits the fund to disregard the GAAP accounting requirements around certain contract modifications resulting from the LIBOR transition such that for contracts considered in scope, the fund can account for those modified contracts as a continuation of the existing contracts.
Balance Sheet Offsetting — The fund's accounting policy with respect to balance sheet offsetting is that, absent an event of default by the counterparty or a termination of the agreement, the International Swaps and Derivatives Association (ISDA) Master Agreement, or similar agreement, does not result in an offset of reported amounts of financial assets and financial liabilities in the Statement of Assets and Liabilities across transactions between the fund and the applicable counterparty. The fund's right to setoff may be restricted or prohibited by the bankruptcy or insolvency laws of the
Notes to Financial Statements (unaudited) - continued
particular jurisdiction to which a specific master netting agreement counterparty is subject. Balance sheet offsetting disclosures, to the extent applicable to the fund, have been included in the fund’s Significant Accounting Policies note under the captions for each of the fund’s in-scope financial instruments and transactions.
Investment Valuations — Equity securities, including restricted equity securities, are generally valued at the last sale or official closing price on their primary market or exchange as provided by a third-party pricing service. Equity securities, for which there were no sales reported that day, are generally valued at the last quoted daily bid quotation on their primary market or exchange as provided by a third-party pricing service. Short-term instruments with a maturity at issuance of 60 days or less may be valued at amortized cost, which approximates market value. Open-end investment companies are generally valued at net asset value per share. Securities and other assets generally valued on the basis of information from a third-party pricing service may also be valued at a broker/dealer bid quotation. In determining values, third-party pricing services can utilize both transaction data and market information such as yield, quality, coupon rate, maturity, type of issue, trading characteristics, and other market data. The values of foreign securities and other assets and liabilities expressed in foreign currencies are converted to U.S. dollars using the mean of bid and asked prices for rates provided by a third-party pricing service.
The Board of Trustees has delegated primary responsibility for determining or causing to be determined the value of the fund’s investments (including any fair valuation) to the adviser pursuant to valuation policies and procedures approved by the Board. If the adviser determines that reliable market quotations are not readily available, investments are valued at fair value as determined in good faith by the adviser in accordance with such procedures under the oversight of the Board of Trustees. Under the fund’s valuation policies and procedures, market quotations are not considered to be readily available for most types of debt instruments and floating rate loans and many types of derivatives. These investments are generally valued at fair value based on information from third-party pricing services. In addition, investments may be valued at fair value if the adviser determines that an investment’s value has been materially affected by events occurring after the close of the exchange or market on which the investment is principally traded (such as foreign exchange or market) and prior to the determination of the fund’s net asset value, or after the halt of trading of a specific security where trading does not resume prior to the close of the exchange or market on which the security is principally traded. Events that occur after foreign markets close (such as developments in foreign markets and significant movements in the U.S. markets) and prior to the determination of the fund’s net asset value may be deemed to have a material effect on the value of securities traded in foreign markets. Accordingly, the fund’s foreign equity securities may often be valued at fair value. The adviser generally relies on third-party pricing services or other information (such as the correlation with price movements of similar securities in the same or other markets; the type, cost and investment characteristics of the security; the business and financial condition of the issuer; and trading and other market data) to assist in determining whether to fair value and at what value to fair value an investment. The value of an investment for purposes of calculating the fund’s net asset value can differ depending on the source and method used to determine value. When fair valuation is used, the value of an investment used to determine the fund’s net asset value may differ from quoted or
Notes to Financial Statements (unaudited) - continued
published prices for the same investment. There can be no assurance that the fund could obtain the fair value assigned to an investment if it were to sell the investment at the same time at which the fund determines its net asset value per share.
Various inputs are used in determining the value of the fund's assets or liabilities. These inputs are categorized into three broad levels. In certain cases, the inputs used to measure fair value may fall into different levels of the fair value hierarchy. In such cases, an investment's level within the fair value hierarchy is based on the lowest level of input that is significant to the fair value measurement. The fund's assessment of the significance of a particular input to the fair value measurement in its entirety requires judgment, and considers factors specific to the investment. Level 1 includes unadjusted quoted prices in active markets for identical assets or liabilities. Level 2 includes other significant observable market-based inputs (including quoted prices for similar securities, interest rates, prepayment speed, and credit risk). Level 3 includes unobservable inputs, which may include the adviser's own assumptions in determining the fair value of investments. The following is a summary of the levels used as of August 31, 2021 in valuing the fund's assets or liabilities:
| Financial Instruments | Level 1 | Level 2 | Level 3 | Total |
| Equity Securities | $4,148,520,067 | $— | $— | $4,148,520,067 |
| Mutual Funds | 48,198,022 | — | — | 48,198,022 |
| Total | $4,196,718,089 | $— | $— | $4,196,718,089 |
For further information regarding security characteristics, see the Portfolio of Investments.
Foreign Currency Translation — Purchases and sales of foreign investments, income, and expenses are converted into U.S. dollars based upon currency exchange rates prevailing on the respective dates of such transactions or on the reporting date for foreign denominated receivables and payables. Gains and losses attributable to foreign currency exchange rates on sales of securities are recorded for financial statement purposes as net realized gains and losses on investments. Gains and losses attributable to foreign exchange rate movements on receivables, payables, income and expenses are recorded for financial statement purposes as foreign currency transaction gains and losses. That portion of both realized and unrealized gains and losses on investments that results from fluctuations in foreign currency exchange rates is not separately disclosed.
Security Loans — Under its Securities Lending Agency Agreement with the fund, State Street Bank and Trust Company, as lending agent, loans the securities of the fund to certain qualified institutions (the “Borrowers”) approved by the fund. Security loans can be terminated at the discretion of either the lending agent or the fund and the related securities must be returned within the earlier of the standard trade settlement period for such securities or within three business days. The loans are collateralized by cash and/or U.S. Treasury and federal agency obligations in an amount typically at least equal to the market value of the securities loaned. On loans collateralized by cash, the cash collateral is invested in a money market fund. The market value of the loaned securities is determined at the close of business of the fund and any additional required collateral is delivered to the fund on the next business day. The lending agent provides the fund with indemnification against Borrower default. In the event of Borrower default, the lending agent will, for the benefit of the fund, either purchase securities identical to those loaned or, when such purchase is commercially impracticable, pay the
Notes to Financial Statements (unaudited) - continued
fund the market value of the loaned securities. In return, the lending agent assumes the fund's rights to the related collateral. If the collateral value is less than the cost to purchase identical securities, the lending agent is responsible for the shortfall, but only to the extent that such shortfall is not due to a decline in collateral value resulting from collateral reinvestment for which the fund bears the risk of loss. At period end, the fund had investment securities on loan, all of which were classified as equity securities in the fund's Portfolio of Investments, with a fair value of $7,064,969. The fair value of the fund's investment securities on loan and a related liability of $6,976,811 for cash collateral received on securities loaned are both presented gross in the Statement of Assets and Liabilities. Additionally, these loans were collateralized by U.S. Treasury Obligations of $440,781 held by the lending agent. The collateral on securities loaned exceeded the value of securities on loan at period end. The liability for cash collateral for securities loaned is carried at fair value, which is categorized as level 2 within the fair value hierarchy. A portion of the income generated upon investment of the collateral is remitted to the Borrowers, and the remainder is allocated between the fund and the lending agent. On loans collateralized by U.S. Treasury and/or federal agency obligations, a fee is received from the Borrower, and is allocated between the fund and the lending agent. Income from securities lending is separately reported in the Statement of Operations. The dividend and interest income earned on the securities loaned is accounted for in the same manner as other dividend and interest income.
Indemnifications — Under the fund's organizational documents, its officers and Trustees may be indemnified against certain liabilities and expenses arising out of the performance of their duties to the fund. Additionally, in the normal course of business, the fund enters into agreements with service providers that may contain indemnification clauses. The fund's maximum exposure under these agreements is unknown as this would involve future claims that may be made against the fund that have not yet occurred.
Investment Transactions and Income — Investment transactions are recorded on the trade date. Dividends received in cash are recorded on the ex-dividend date. Certain dividends from foreign securities will be recorded when the fund is informed of the dividend if such information is obtained subsequent to the ex-dividend date. Dividend payments received in additional securities are recorded on the ex-dividend date in an amount equal to the value of the security on such date.
The fund may receive proceeds from litigation settlements. Any proceeds received from litigation involving portfolio holdings are reflected in the Statement of Operations in realized gain/loss if the security has been disposed of by the fund or in unrealized gain/loss if the security is still held by the fund. Any other proceeds from litigation not related to portfolio holdings are reflected as other income in the Statement of Operations.
Tax Matters and Distributions — The fund intends to qualify as a regulated investment company, as defined under Subchapter M of the Internal Revenue Code, and to distribute all of its taxable income, including realized capital gains. As a result, no provision for federal income tax is required. The fund’s federal tax returns, when filed, will remain subject to examination by the Internal Revenue Service for a three year period. Management has analyzed the fund’s tax positions taken on federal and state tax returns for all open tax years and does not believe that there are any uncertain tax positions that require recognition of a tax liability. Foreign taxes, if any, have been accrued by the fund in the accompanying financial statements in accordance with the
Notes to Financial Statements (unaudited) - continued
applicable foreign tax law. Foreign income taxes may be withheld by certain countries in which the fund invests. Additionally, capital gains realized by the fund on securities issued in or by certain foreign countries may be subject to capital gains tax imposed by those countries.
Distributions to shareholders are recorded on the ex-dividend date. Income and capital gain distributions are determined in accordance with income tax regulations, which may differ from U.S. generally accepted accounting principles. Certain capital accounts in the financial statements are periodically adjusted for permanent differences in order to reflect their tax character. These adjustments have no impact on net assets or net asset value per share. Temporary differences which arise from recognizing certain items of income, expense, gain or loss in different periods for financial statement and tax purposes will reverse at some time in the future.
Book/tax differences primarily relate to wash sale loss deferrals.
The tax character of distributions made during the current period will be determined at fiscal year end. The tax character of distributions declared to shareholders for the last fiscal year is as follows:
| | Year ended
2/28/21 |
| Ordinary income (including any short-term capital gains) | $34,305,697 |
| Long-term capital gains | 33,057,559 |
| Total distributions | $67,363,256 |
The federal tax cost and the tax basis components of distributable earnings were as follows:
| As of 8/31/21 | |
| Cost of investments | $3,134,011,438 |
| Gross appreciation | 1,132,195,986 |
| Gross depreciation | (69,489,335) |
| Net unrealized appreciation (depreciation) | $1,062,706,651 |
| As of 2/28/21 | |
| Undistributed ordinary income | 23,582,073 |
| Net unrealized appreciation (depreciation) | 841,092,764 |
The aggregate cost above includes prior fiscal year end tax adjustments, if applicable.
Multiple Classes of Shares of Beneficial Interest — The fund offers multiple classes of shares, which differ in their respective distribution and service fees. The fund's income, realized and unrealized gain (loss), and common expenses are allocated to shareholders based on the daily net assets of each class. Dividends are declared separately for each class. Differences in per share dividend rates are generally due to differences in separate class expenses. Class B and Class C shares will convert to
Notes to Financial Statements (unaudited) - continued
Class A shares approximately eight years after purchase. The fund’s distributions declared to shareholders as reported in the Statements of Changes in Net Assets are presented by class as follows:
| | Six months
ended
8/31/21 | | Year
ended
2/28/21 |
| Class A | $1,949,830 | | $6,297,483 |
| Class B | 30,113 | | 130,336 |
| Class C | 187,123 | | 807,766 |
| Class I | 9,388,103 | | 24,173,641 |
| Class R1 | 11,252 | | 35,695 |
| Class R2 | 25,641 | | 98,960 |
| Class R3 | 532,537 | | 1,755,065 |
| Class R4 | 524,491 | | 1,948,117 |
| Class R6 | 10,934,324 | | 32,116,193 |
| Total | $23,583,414 | | $67,363,256 |
(3) Transactions with Affiliates
Investment Adviser — The fund has an investment advisory agreement with MFS to provide overall investment management and related administrative services and facilities to the fund. The management fee is computed daily and paid monthly at the following annual rates based on the fund's average daily net assets:
| Up to $1 billion | 0.90% |
| In excess of $1 billion and up to $2.5 billion | 0.80% |
| In excess of $2.5 billion and up to $5 billion | 0.75% |
| In excess of $5 billion | 0.70% |
MFS has agreed in writing to reduce its management fee by a specified amount if certain MFS mutual fund assets exceed thresholds agreed to by MFS and the fund's Board of Trustees. For the six months ended August 31, 2021, this management fee reduction amounted to $257,474, which is included in the reduction of total expenses in the Statement of Operations. The management fee incurred for the six months ended August 31, 2021 was equivalent to an annual effective rate of 0.79% of the fund's average daily net assets.
The investment adviser has agreed in writing to pay a portion of the fund’s total annual operating expenses, excluding interest, taxes, extraordinary expenses, brokerage and transaction costs, and investment-related expenses, such that total fund operating expenses do not exceed the following rates annually of each class’s average daily net assets:
| Classes |
| A | B | C | I | R1 | R2 | R3 | R4 | R6 |
| 1.39% | 2.14% | 2.14% | 1.14% | 2.14% | 1.64% | 1.39% | 1.14% | 1.10% |
This written agreement will continue until modified by the fund’s Board of Trustees, but such agreement will continue at least until June 30, 2023. For the six months ended August 31, 2021, the fund’s actual operating expenses did not exceed the limit and therefore, the investment adviser did not pay any portion of the fund’s expenses related to this agreement.
Notes to Financial Statements (unaudited) - continued
Distributor — MFS Fund Distributors, Inc. (MFD), a wholly-owned subsidiary of MFS, as distributor, received $10,833 for the six months ended August 31, 2021, as its portion of the initial sales charge on sales of Class A shares of the fund.
The Board of Trustees has adopted a distribution plan for certain share classes pursuant to Rule 12b-1 of the Investment Company Act of 1940.
The fund's distribution plan provides that the fund will pay MFD for services provided by MFD and financial intermediaries in connection with the distribution and servicing of certain share classes. One component of the plan is a distribution fee paid to MFD and another component of the plan is a service fee paid to MFD. MFD may subsequently pay all, or a portion, of the distribution and/or service fees to financial intermediaries.
Distribution Plan Fee Table:
| | Distribution
Fee Rate (d) | Service
Fee Rate (d) | Total
Distribution
Plan (d) | Annual
Effective
Rate (e) | Distribution
and Service
Fee |
| Class A | — | 0.25% | 0.25% | 0.25% | $ 455,534 |
| Class B | 0.75% | 0.25% | 1.00% | 1.00% | 32,934 |
| Class C | 0.75% | 0.25% | 1.00% | 1.00% | 208,074 |
| Class R1 | 0.75% | 0.25% | 1.00% | 1.00% | 12,221 |
| Class R2 | 0.25% | 0.25% | 0.50% | 0.50% | 13,202 |
| Class R3 | — | 0.25% | 0.25% | 0.25% | 123,218 |
| Total Distribution and Service Fees | | | | | $845,183 |
| (d) | In accordance with the distribution plan for certain classes, the fund pays distribution and/or service fees equal to these annual percentage rates of each class’s average daily net assets. The distribution and service fee rates disclosed by class represent the current rates in effect at the end of the reporting period. Any rate changes, if applicable, are detailed below. |
| (e) | The annual effective rates represent actual fees incurred under the distribution plan for the six months ended August 31, 2021 based on each class's average daily net assets. MFD has voluntarily agreed to rebate a portion of each class's 0.25% service fee attributable to accounts for which there is no financial intermediary specified on the account except for accounts attributable to MFS or its affiliates' seed money. For the six months ended August 31, 2021, this rebate amounted to $210 for Class A and is included in the reduction of total expenses in the Statement of Operations. |
Certain Class A shares are subject to a contingent deferred sales charge (CDSC) in the event of a shareholder redemption within 18 months of purchase. Class B shares are subject to a CDSC in the event of a shareholder redemption within six years of purchase. Class C shares are subject to a CDSC in the event of a shareholder redemption within 12 months of purchase. All contingent deferred sales charges are paid to MFD and during the six months ended August 31, 2021, were as follows:
| | Amount |
| Class A | $460 |
| Class B | 1,982 |
| Class C | 345 |
Shareholder Servicing Agent — MFS Service Center, Inc. (MFSC), a wholly-owned subsidiary of MFS, receives a fee from the fund for its services as shareholder servicing agent calculated as a percentage of the average daily net assets of the fund as
Notes to Financial Statements (unaudited) - continued
determined periodically under the supervision of the fund's Board of Trustees. For the six months ended August 31, 2021, the fee was $58,151, which equated to 0.0028% annually of the fund's average daily net assets. MFSC also receives reimbursement from the fund for out-of-pocket expenses, sub-accounting and other shareholder servicing costs which may be paid to affiliated and unaffiliated service providers. Class R6 shares do not incur sub-accounting fees. For the six months ended August 31, 2021, these out-of-pocket expenses, sub-accounting and other shareholder servicing costs amounted to $1,178,511.
Administrator — MFS provides certain financial, legal, shareholder communications, compliance, and other administrative services to the fund. Under an administrative services agreement, the fund reimburses MFS the costs incurred to provide these services. The fund is charged an annual fixed amount of $17,500 plus a fee based on average daily net assets. The administrative services fee incurred for the six months ended August 31, 2021 was equivalent to an annual effective rate of 0.0132% of the fund's average daily net assets.
Trustees’ and Officers’ Compensation — The fund pays compensation to independent Trustees in the form of a retainer, attendance fees, and additional compensation to Board and Committee chairpersons. The fund does not pay compensation directly to Trustees or officers of the fund who are also officers of the investment adviser, all of whom receive remuneration from MFS for their services to the fund. Certain officers and Trustees of the fund are officers or directors of MFS, MFD, and MFSC.
Other — The fund invests in the MFS Institutional Money Market Portfolio which is managed by MFS and seeks current income consistent with preservation of capital and liquidity. This money market fund does not pay a management fee to MFS but does incur investment and operating costs.
The fund is permitted to engage in purchase and sale transactions with funds and accounts for which MFS serves as investment adviser or sub-adviser (“cross-trades”) pursuant to a policy adopted by the Board of Trustees. This policy has been designed to ensure that cross-trades conducted by the fund comply with Rule 17a-7 under the Investment Company Act of 1940. During the six months ended August 31, 2021, the fund engaged in purchase transactions pursuant to this policy, which amounted to $1,135,099.
The adviser has voluntarily undertaken to reimburse the fund from its own resources on a quarterly basis for the cost of investment research embedded in the cost of the fund’s securities trades. This agreement may be rescinded at any time. For the six months ended August 31, 2021, this reimbursement amounted to $111,377, which is included in “Other” income in the Statement of Operations.
(4) Portfolio Securities
For the six months ended August 31, 2021, purchases and sales of investments, other than short-term obligations, aggregated $858,656,802 and $879,082,444, respectively.
Notes to Financial Statements (unaudited) - continued
(5) Shares of Beneficial Interest
The fund's Declaration of Trust permits the Trustees to issue an unlimited number of full and fractional shares of beneficial interest. Transactions in fund shares were as follows:
| | Six months ended
8/31/21 | | Year ended
2/28/21 |
| | Shares | Amount | | Shares | Amount |
| Shares sold | | | | | |
| Class A | 657,280 | $13,346,786 | | 2,019,337 | $26,327,639 |
| Class B | 1,264 | 24,717 | | 976 | 13,070 |
| Class C | 41,142 | 788,559 | | 169,412 | 2,108,802 |
| Class I | 10,905,691 | 224,113,340 | | 31,316,292 | 433,769,956 |
| Class R1 | 13,795 | 264,921 | | 32,645 | 482,002 |
| Class R2 | 67,796 | 1,358,774 | | 71,753 | 972,777 |
| Class R3 | 990,068 | 20,365,673 | | 1,577,907 | 21,718,615 |
| Class R4 | 960,022 | 19,858,509 | | 1,417,123 | 19,335,999 |
| Class R6 | 10,080,740 | 208,271,151 | | 31,239,089 | 414,302,831 |
| | 23,717,798 | $488,392,430 | | 67,844,534 | $919,031,691 |
Shares issued to shareholders
in reinvestment of distributions | | | | | |
| Class A | 93,872 | $1,946,914 | | 486,139 | $6,285,772 |
| Class B | 1,529 | 29,941 | | 10,527 | 129,382 |
| Class C | 9,601 | 186,940 | | 66,035 | 806,943 |
| Class I | 437,149 | 9,149,535 | | 1,807,969 | 23,539,760 |
| Class R1 | 575 | 11,252 | | 2,904 | 35,695 |
| Class R2 | 1,248 | 25,641 | | 7,707 | 98,960 |
| Class R3 | 25,627 | 532,537 | | 135,422 | 1,755,065 |
| Class R4 | 25,023 | 524,491 | | 149,395 | 1,948,117 |
| Class R6 | 459,685 | 9,653,392 | | 2,195,048 | 28,645,381 |
| | 1,054,309 | $22,060,643 | | 4,861,146 | $63,245,075 |
| Shares reacquired | | | | | |
| Class A | (1,432,444) | $(29,213,839) | | (7,951,911) | $(102,359,961) |
| Class B | (20,932) | (407,773) | | (127,934) | (1,696,929) |
| Class C | (228,883) | (4,409,704) | | (864,947) | (10,878,824) |
| Class I | (8,669,013) | (178,656,884) | | (35,383,231) | (472,821,255) |
| Class R1 | (23,206) | (444,227) | | (11,060) | (151,491) |
| Class R2 | (84,045) | (1,713,305) | | (179,347) | (2,429,696) |
| Class R3 | (1,021,403) | (20,759,006) | | (2,298,084) | (34,272,909) |
| Class R4 | (1,798,434) | (37,324,406) | | (1,803,699) | (25,628,339) |
| Class R6 | (13,590,560) | (280,156,019) | | (33,135,986) | (479,828,642) |
| | (26,868,920) | $(553,085,163) | | (81,756,199) | $(1,130,068,046) |
Notes to Financial Statements (unaudited) - continued
| | Six months ended
8/31/21 | | Year ended
2/28/21 |
| | Shares | Amount | | Shares | Amount |
| Net change | | | | | |
| Class A | (681,292) | $(13,920,139) | | (5,446,435) | $(69,746,550) |
| Class B | (18,139) | (353,115) | | (116,431) | (1,554,477) |
| Class C | (178,140) | (3,434,205) | | (629,500) | (7,963,079) |
| Class I | 2,673,827 | 54,605,991 | | (2,258,970) | (15,511,539) |
| Class R1 | (8,836) | (168,054) | | 24,489 | 366,206 |
| Class R2 | (15,001) | (328,890) | | (99,887) | (1,357,959) |
| Class R3 | (5,708) | 139,204 | | (584,755) | (10,799,229) |
| Class R4 | (813,389) | (16,941,406) | | (237,181) | (4,344,223) |
| Class R6 | (3,050,135) | (62,231,476) | | 298,151 | (36,880,430) |
| | (2,096,813) | $(42,632,090) | | (9,050,519) | $(147,791,280) |
Effective June 1, 2019, purchases of the fund’s Class B shares are closed to new and existing investors subject to certain exceptions. Effective at the close of business on August 14, 2019, the fund is closed to new investors subject to certain exceptions. Please see the fund’s prospectus for details.
The fund is one of several mutual funds in which certain MFS funds may invest. The MFS funds do not invest in the underlying funds for the purpose of exercising management or control. At the end of the period, the MFS Growth Allocation Fund, the MFS Moderate Allocation Fund, the MFS Aggressive Growth Allocation Fund, and the MFS Conservative Allocation Fund were the owners of record of approximately 3%, 3%, 2%, and 1%, respectively, of the value of outstanding voting shares of the fund.
In addition, the MFS Lifetime 2020 Fund, the MFS Lifetime 2025 Fund, the MFS Lifetime 2030 Fund, the MFS Lifetime 2035 Fund, the MFS Lifetime 2040 Fund, the MFS Lifetime 2045 Fund, the MFS Lifetime 2050 Fund, the MFS Lifetime 2055 Fund, the MFS Lifetime 2060 Fund, and the MFS Lifetime Income Fund were each the owners of record of less than 1% of the value of outstanding voting shares of the fund.
(6) Line of Credit
The fund and certain other funds managed by MFS participate in a $1.25 billion unsecured committed line of credit of which $1 billion is reserved for use by the fund and certain other MFS U.S. funds. The line of credit is provided by a syndicate of banks under a credit agreement. Borrowings may be made for temporary financing needs. Interest is charged to each fund, based on its borrowings, generally at a rate equal to the highest of one month LIBOR, the Federal Funds Effective Rate and the Overnight Bank Funding Rate, plus an agreed upon spread. A commitment fee, based on the average daily, unused portion of the committed line of credit, is allocated among the participating funds. In addition, the fund and other funds managed by MFS have established unsecured uncommitted borrowing arrangements with certain banks for temporary financing needs. Interest is charged to each fund, based on its borrowings,
Notes to Financial Statements (unaudited) - continued
at rates equal to customary reference rates plus an agreed upon spread. For the six months ended August 31, 2021, the fund’s commitment fee and interest expense were $7,067 and $0, respectively, and are included in “Miscellaneous” expense in the Statement of Operations.
(7) Investments in Affiliated Issuers
An affiliated issuer may be considered one in which the fund owns 5% or more of the outstanding voting securities, or a company which is under common control. For the purposes of this report, the following were affiliated issuers:
| Affiliated Issuers | Beginning
Value | Purchases | Sales
Proceeds | Realized
Gain
(Loss) | Change in
Unrealized
Appreciation or
Depreciation | Ending
Value |
| MFS Institutional Money Market Portfolio | $51,206,243 | $420,846,435 | $430,831,467 | $— | $— | $41,221,211 |
| PAE, Inc. | 37,682,140 | 1,030,366 | — | — | (7,061,159) | 31,651,347 |
| Phillips Edison & Co., REIT | — | 30,760,741 | — | — | 2,251,512 | 33,012,253 |
| Regis Corp. | 21,725,186 | 396,570 | — | — | (11,882,536) | 10,239,220 |
| | $110,613,569 | $453,034,112 | $430,831,467 | $— | $(16,692,183) | $116,124,031 |
| Affiliated Issuers | Dividend
Income | Capital Gain
Distributions |
| MFS Institutional Money Market Portfolio | $6,009 | $— |
| PAE, Inc. | — | — |
| Phillips Edison & Co., REIT | — | — |
| Regis Corp. | — | — |
| | $6,009 | $— |
(8) Impacts of COVID-19
The pandemic related to the global spread of novel coronavirus disease (COVID-19), which was first detected in December 2019, has resulted in significant disruptions to global business activity and the global economy, as well as the economies of individual countries, the financial performance of individual companies and sectors, and the securities and commodities markets in general. Multiple surges in cases globally, the availability and widespread adoption of vaccines, and the emergence of variant strains of the virus continue to create uncertainty as to the future and long-term impacts resulting from the pandemic including impacts to the prices and liquidity of the fund's investments and the fund's performance.
Board Review of Investment Advisory Agreement
MFS New Discovery Value Fund
The Investment Company Act of 1940 requires that both the full Board of Trustees and a majority of the non-interested (“independent”) Trustees, voting separately, annually approve the continuation of the Fund’s investment advisory agreement with MFS. The Trustees consider matters bearing on the Fund and its advisory arrangements at their meetings throughout the year, including a review of performance data at each regular meeting. In addition, the independent Trustees met several times by videoconference (in accordance with Securities and Exchange Commission relief) over the course of three months beginning in May and ending in July, 2021 (“contract review meetings”) for the specific purpose of considering whether to approve the continuation of the investment advisory agreement for the Fund and the other investment companies that the Board oversees (the “MFS Funds”). The independent Trustees were assisted in their evaluation of the Fund’s investment advisory agreement by independent legal counsel, from whom they received separate legal advice and with whom they met separately from MFS during various contract review meetings. The independent Trustees were also assisted in this process by an independent consultant who was retained by and reported to the independent Trustees.
In connection with their deliberations regarding the continuation of the investment advisory agreement, the Trustees, including the independent Trustees, considered such information and factors as they believed, in light of the legal advice furnished to them and their own business judgment, to be relevant. The investment advisory agreement for the Fund was considered separately, although the Trustees also took into account the common interests of all MFS Funds in their review. As described below, the Trustees considered the nature, quality, and extent of the various investment advisory, administrative, and shareholder services performed by MFS under the existing investment advisory agreement and other arrangements with the Fund.
In connection with their contract review meetings, the Trustees received and relied upon materials that included, among other items: (i) information provided by Broadridge Financial Solutions, Inc. (“Broadridge”), an independent third party, on the investment performance of the Fund for the various time periods ended December 31, 2020 and the investment performance of a group of funds with substantially similar investment classifications/objectives (the “Broadridge performance universe”), (ii) information provided by Broadridge on the Fund’s advisory fees and other expenses and the advisory fees and other expenses of comparable funds identified by Broadridge as well as all other funds in the same investment classification/category (the “Broadridge expense group and universe”), (iii) information provided by MFS on the advisory fees of portfolios of other clients of MFS, including institutional separate accounts and other clients, (iv) information as to whether and to what extent applicable expense waivers, reimbursements or fee “breakpoints” are observed for the Fund, (v) information regarding MFS’ financial results and financial condition, including MFS’ and certain of its affiliates’ estimated profitability from services performed for the Fund and the MFS Funds as a whole, and compared to MFS’ institutional business, (vi) MFS’ views regarding the outlook for the mutual fund industry and the strategic business plans of MFS, (vii) descriptions of various functions performed by MFS for the Funds, such as compliance monitoring and portfolio trading practices, and (viii)
Board Review of Investment Advisory Agreement - continued
information regarding the overall organization of MFS, including information about MFS’ senior management and other personnel providing investment advisory, administrative and other services to the Fund and the other MFS Funds. The comparative performance, fee and expense information prepared and provided by Broadridge was not independently verified and the independent Trustees did not independently verify any information provided to them by MFS.
The Trustees’ conclusion as to the continuation of the investment advisory agreement was based on a comprehensive consideration of all information provided to the Trustees and not the result of any single factor. Some of the factors that figured particularly in the Trustees’ deliberations are described below, although individual Trustees may have evaluated the information presented differently from one another, giving different weights to various factors. It is also important to recognize that the fee arrangements for the Fund and other MFS Funds are the result of years of review and discussion between the independent Trustees and MFS, that certain aspects of such arrangements may receive greater scrutiny in some years than in others, and that the Trustees’ conclusions may be based, in part, on their consideration of these same arrangements during the course of the year and in prior years.
Based on information provided by Broadridge and MFS, the Trustees reviewed the Fund’s total return investment performance as well as the Broadridge performance universe over various time periods. The Trustees placed particular emphasis on the total return performance of the Fund’s Class I shares in comparison to the performance of funds in its Broadridge performance universe over the five-year period ended December 31, 2020, which the Trustees believed was a long enough period to reflect differing market conditions. The total return performance of the Fund’s Class I shares was in the 1st quintile relative to the other funds in the universe for this five-year period (the 1st quintile being the best performers and the 5th quintile being the worst performers). The total return performance of the Fund’s Class I shares was in the 3rd quintile for the one-year period and the 1st quintile for the three-year period ended December 31, 2020 relative to the Broadridge performance universe. Because of the passage of time, these performance results may differ from the performance results for more recent periods, including those shown elsewhere in this report.
In the course of their deliberations, the Trustees took into account information provided by MFS in connection with the contract review meetings, as well as during investment review meetings conducted with portfolio management personnel during the course of the year regarding the Fund’s performance. After reviewing these and related factors, the Trustees concluded, within the context of their overall conclusions regarding the investment advisory agreement, that they were satisfied with MFS’ responses and efforts relating to investment performance.
In assessing the reasonableness of the Fund’s advisory fee, the Trustees considered, among other information, the Fund’s advisory fee and the total expense ratio of the Fund’s Class I shares as a percentage of average daily net assets and the advisory fee and total expense ratios of the Broadridge expense group based on information provided by Broadridge. The Trustees considered that MFS currently observes an expense limitation for the Fund, which may not be changed without the Trustees’ approval. The Trustees also considered that, according to the data provided by
Board Review of Investment Advisory Agreement - continued
Broadridge (which takes into account any fee reductions or expense limitations that were in effect during the Fund’s last fiscal year), the Fund’s effective advisory fee rate and total expense ratio were each approximately at the Broadridge expense group median.
The Trustees also considered the advisory fees charged by MFS to any institutional separate accounts advised by MFS (“separate accounts”) and unaffiliated investment companies for which MFS serves as subadviser (“subadvised funds”) that have comparable investment strategies to the Fund, if any. In comparing these fees, the Trustees considered information provided by MFS as to the generally broader scope of services provided by MFS to the Fund, as well as the more extensive regulatory burdens imposed on MFS in managing the Fund, in comparison to separate accounts and subadvised funds. The Trustees also considered the higher demands placed on MFS’ investment personnel and trading infrastructure as a result of the daily cash in-flows and out-flows of the Fund in comparison to separate accounts.
The Trustees also considered whether the Fund may benefit from any economies of scale in the management of the Fund in the event of growth in assets of the Fund and/or growth in assets of the MFS Funds as a whole. They noted that the Fund’s advisory fee rate schedule is subject to contractual breakpoints that reduce the Fund’s advisory fee rate on average daily net assets over $1 billion, $2.5 billion, and $5 billion. The Trustees also noted that MFS has agreed in writing to waive a portion of the management fees of certain MFS Funds, including the Fund, if the total combined assets of certain funds within the MFS Funds’ complex increase above agreed upon thresholds (the “group fee waiver”), enabling the Fund’s shareholders to share in the benefits from any economies of scale at the complex level. The group fee waiver is reviewed and renewed annually between the Board and MFS. The Trustees concluded that the breakpoints and the group fee waiver were sufficient to allow the Fund to benefit from economies of scale as its assets and overall complex assets grow.
The Trustees also considered information prepared by MFS relating to MFS’ costs and profits with respect to the Fund, the MFS Funds considered as a group, and other investment companies and accounts advised by MFS, as well as MFS’ methodologies used to determine and allocate its costs to the MFS Funds, the Fund and other accounts and products for purposes of estimating profitability.
After reviewing these and other factors described herein, the Trustees concluded, within the context of their overall conclusions regarding the investment advisory agreement, that the advisory fees charged to the Fund represent reasonable compensation in light of the services being provided by MFS to the Fund.
In addition, the Trustees considered MFS’ resources and related efforts to continue to retain, attract and motivate capable personnel to serve the Fund. The Trustees also considered current and developing conditions in the financial services industry, including the presence of large and well-capitalized companies which are spending, and appear to be prepared to continue to spend, substantial sums to engage personnel and to provide services to competing investment companies. In this regard, the Trustees also considered the financial resources of MFS and its ultimate parent, Sun Life Financial Inc. The Trustees also considered the advantages and possible disadvantages to the Fund of having an adviser that also serves other investment companies as well as other accounts.
Board Review of Investment Advisory Agreement - continued
The Trustees also considered the nature, quality, cost, and extent of administrative, transfer agency, and distribution services provided to the Fund by MFS and its affiliates under agreements and plans other than the investment advisory agreement, including any 12b-1 fees the Fund pays to MFS Fund Distributors, Inc., an affiliate of MFS. The Trustees also considered the nature, extent and quality of certain other services MFS performs or arranges for on the Fund’s behalf, which may include securities lending programs, directed expense payment programs, class action recovery programs, and MFS’ interaction with third-party service providers, principally custodians and sub-custodians. The Trustees concluded that the various non-advisory services provided by MFS and its affiliates on behalf of the Fund were satisfactory.
The Trustees considered so-called “fall-out benefits” to MFS such as reputational value derived from serving as investment manager to the MFS Funds. The Trustees also considered that MFS discontinued its historic practice of obtaining investment research from portfolio brokerage commissions paid by certain MFS Funds effective January 2018, and directly pays or voluntarily reimburses a Fund, if applicable, for the costs of external research acquired through the use of the Fund’s portfolio brokerage commissions.
Based on their evaluation of factors that they deemed to be material, including those factors described above, the Board of Trustees, including the independent Trustees, concluded that the Fund’s investment advisory agreement with MFS should be continued for an additional one-year period, commencing August 1, 2021.
Statement Regarding Liquidity Risk Management Program
The fund has adopted and implemented a liquidity risk management program (the “Program”) as required by Rule 22e-4 under the Investment Company Act of 1940, as amended. The fund’s Board of Trustees (the “Board”) has designated MFS as the administrator of the Program. The Program is reasonably designed to assess and manage the liquidity risk of the fund. Liquidity risk is the risk that the fund could not meet requests to redeem shares issued by the fund without significant dilution of remaining investors' interests.
MFS provided a written report to the Board for consideration at its April 2021 meeting that addressed the operation of the Program and provided an assessment of the adequacy and effectiveness of the Program during the period from January 1, 2020 to December 31, 2020 (the “Covered Period”). The report concluded that during the Covered Period the Program had operated effectively and had adequately and effectively been implemented to assess and manage the fund’s liquidity risk. MFS also reported that there were no liquidity events that impacted the fund or its ability to timely meet redemptions without dilution to existing shareholders during the Covered Period.
There can be no assurance that the Program will achieve its objectives in the future. Further information on liquidity risk, and other principal risks to which an investment in the fund may be subject, can be found in the prospectus.
Proxy Voting Policies and Information
MFS votes proxies on behalf of the fund pursuant to proxy voting policies and procedures that are available without charge, upon request, by calling 1-800-225-2606, by visiting mfs.com/proxyvoting, or by visiting the SEC’s Web site at http://www.sec.gov.
Information regarding how the fund voted proxies relating to portfolio securities during the most recent twelve-month period ended June 30 is available by August 31 of each year without charge by visiting mfs.com/proxyvoting, or by visiting the SEC’s Web site at http://www.sec.gov.
Quarterly Portfolio Disclosure
The fund files a complete schedule of portfolio holdings with the SEC for the first and third quarters of each fiscal year as an exhibit to its reports on Form N-PORT. The fund's Form N-PORT reports are available on the SEC's Web site at http://www.sec.gov. A shareholder can obtain the portfolio holdings report for the first and third quarters of the fund's fiscal year at mfs.com/openendfunds by choosing the fund's name and then scrolling to the “Resources” section and clicking on the “Prospectus and Reports” tab.
Further Information
From time to time, MFS may post important information about the fund or the MFS Funds on the MFS Web site (mfs.com). This information is available at https://www.mfs.com/announcements or at mfs.com/openendfunds by choosing the fund’s name and then scrolling to the “Resources” section and clicking on the “Announcements” tab, if any.
Information About Fund Contracts and Legal Claims
The fund has entered into contractual arrangements with an investment adviser, administrator, distributor, shareholder servicing agent, 529 program manager (if applicable), and custodian who each provide services to the fund. Unless expressly stated otherwise, shareholders are not parties to, or intended beneficiaries of these contractual arrangements, and these contractual arrangements are not intended to create any shareholder right to enforce them against the service providers or to seek any remedy under them against the service providers, either directly or on behalf of the fund.
Under the Trust’s By-Laws and Declaration of Trust, any claims asserted against or on behalf of the MFS Funds, including claims against Trustees and Officers, must be brought in state and federal courts located within the Commonwealth of Massachusetts.
Provision of Financial Reports and Summary Prospectuses
The fund produces financial reports every six months and updates its summary prospectus and prospectus annually. To avoid sending duplicate copies of materials to households, only one copy of the fund’s annual and semiannual report and summary prospectus may be mailed to shareholders having the same last name and residential address on the fund’s records. However, any shareholder may contact MFSC (please see back cover for address and telephone number) to request that copies of these reports and summary prospectuses be sent personally to that shareholder.
Save paper with eDelivery.
MFS® will send you prospectuses, reports, and proxies directly via e-mail so you will get information faster with less mailbox clutter.
To sign up:
1. Go to mfs.com.
2. Log in via MFS® Access.
3. Select eDelivery.
If you own your MFS fund shares through a financial institution or a retirement plan, MFS® TALK, MFS® Access, or eDelivery may not be available to you.
CONTACT
WEB SITE
mfs.com
MFS TALK
1-800-637-8255
24 hours a day
ACCOUNT SERVICE AND LITERATURE
Shareholders
1-800-225-2606
Financial advisors
1-800-343-2829
Retirement plan services
1-800-637-1255
MAILING ADDRESS
MFS Service Center, Inc.
P.O. Box 219341
Kansas City, MO 64121-9341
OVERNIGHT MAIL
MFS Service Center, Inc.
Suite 219341
430 W 7th Street
Kansas City, MO 64105-1407
Item 1(b):
Not applicable
During the period covered by this report, the Registrant has not amended any provision in its Code of Ethics (the “Code”) that relates to an element of the Code’s definition enumerated in paragraph (b) of Item 2 of this Form N-CSR. During the period covered by this report, the Registrant did not grant a waiver, including an implicit waiver, from any provision of the Code.
| ITEM 3. | AUDIT COMMITTEE FINANCIAL EXPERT. |
Not applicable for semi-annual reports.
| ITEM 4. | PRINCIPAL ACCOUNTANT FEES AND SERVICES. |
Not applicable for semi-annual reports.
| ITEM 5. | AUDIT COMMITTEE OF LISTED REGISTRANTS. |
Not applicable to the Registrant.
A schedule of investments for each series of the Registrant is included as part of the report to shareholders of such series under Item 1(a) of this Form N-CSR.
| ITEM 7. | DISCLOSURE OF PROXY VOTING POLICIES AND PROCEDURES FOR CLOSED-END MANAGEMENT INVESTMENT COMPANIES. |
Not applicable to the Registrant.
| ITEM 8. | PORTFOLIO MANAGERS OF CLOSED-END MANAGEMENT INVESTMENT COMPANIES. |
Not applicable to the Registrant.
| ITEM 9. | PURCHASES OF EQUITY SECURITIES BY CLOSED-END MANAGEMENT INVESTMENT COMPANY AND AFFILIATED PURCHASERS. |
Not applicable to the Registrant.
| ITEM 10. | SUBMISSION OF MATTERS TO A VOTE OF SECURITY HOLDERS. |
There were no material changes to the procedures by which shareholders may send recommendations to the Board for nominees to the Registrant’s Board since the Registrant last provided disclosure as to such procedures in response to the requirements of Item 407 (c)(2)(iv) of Regulation S-K or this Item.
| ITEM 11. | CONTROLS AND PROCEDURES. |
| (a) | Based upon their evaluation of the effectiveness of the registrant’s disclosure controls and procedures (as defined in Rule 30a-3(c) under the Investment Company Act of 1940 (the “Act”)) as conducted within 90 days of the filing date of this report on Form N-CSR, the registrant’s principal financial officer and principal executive officer have concluded that those disclosure controls and procedures provide reasonable assurance that the material information required to be disclosed by the registrant on this report is recorded, processed, summarized and reported within the time periods specified in the Securities and Exchange Commission’s rules and forms. |
| (b) | There were no changes in the registrant’s internal controls over financial reporting (as defined in Rule 30a-3(d) under the Act) that occurred during the period covered by the report that have materially affected, or are reasonably likely to materially affect, the registrant’s internal control over financial reporting. |
| ITEM 12. | DISCLOSURE OF SECURITIES LENDING ACTIVITIES FOR CLOSED-END MANAGEMENT INVESTMENT COMPANIES. |
Not applicable to the Registrant.
| (a) (1) | Any code of ethics, or amendment thereto, that is the subject of the disclosure required by Item 2, to the extent that the registrant intends to satisfy the Item 2 requirements through filing of an exhibit. Not applicable. |
| | (2) | A separate certification for each principal executive officer and principal financial officer of the registrant as required by Rule 30a-2(a) under the Act (17 CFR 270.30a-2): Attached hereto as EX-99.302CERT. |
| | (3) | Any written solicitation to purchase securities under Rule 23c-1 under the Act (17 CFR 270.23c-1) sent or given during the period covered by the report by or on behalf of the registrant to 10 or more persons. Not applicable. |
| | (4) | Change in the registrant’s independent public accountant. Not applicable. |
| (b) | If the report is filed under Section 13(a) or 15(d) of the Exchange Act, provide the certifications required by Rule 30a-2(b) under the Act (17 CFR 270.30a-2(b)), Rule 13a-14(b) or Rule 15d-14(b) under the Exchange Act (17 CFR 240.13a-14(b) or 240.15d-14(b)) and Section 1350 of Chapter 63 of Title 18 of the United States Code (18 U.S.C. 1350) as an exhibit. A certification furnished pursuant to this paragraph will not be deemed “filed” for the purposes of Section 18 of the Exchange Act (15 U.S.C. 78r), or otherwise subject to the liability of that section. Such certification will not be deemed to be incorporated by reference into any filing under the Securities Act of 1933 or the Exchange Act, except to the extent that the registrant specifically incorporates it by reference. Attached hereto as EX-99.906CERT. |
Notice
A copy of the Amended and Restated Declaration of Trust, as amended, of the Registrant is on file with the Secretary of State of The Commonwealth of Massachusetts and notice is hereby given that this instrument is executed on behalf of the Registrant by an officer of the Registrant as an officer and not individually and the obligations of or arising out of this instrument are not binding upon any of the Trustees or shareholders individually, but are binding only upon the assets and property of the respective constituent series of the Registrant.
SIGNATURES
Pursuant to the requirements of the Securities Exchange Act of 1934 and the Investment Company Act of 1940, the registrant has duly caused this report to be signed on its behalf by the undersigned, thereunto duly authorized.
(Registrant) MFS SERIES TRUST XIII
| | |
| By (Signature and Title)* | | /S/ DAVID L. DILORENZO |
| | David L. DiLorenzo, President |
Date: October 15, 2021
Pursuant to the requirements of the Securities Exchange Act of 1934 and the Investment Company Act of 1940, this report has been signed below by the following persons on behalf of the registrant and in the capacities and on the dates indicated.
| | |
| By (Signature and Title)* | | /S/ DAVID L. DILORENZO |
| | David L. DiLorenzo, President (Principal Executive Officer) |
Date: October 15, 2021
| | |
| By (Signature and Title)* | | /S/ JAMES O. YOST |
| | James O. Yost, Treasurer (Principal Financial Officer and Accounting Officer) |
Date: October 15, 2021
| * | Print name and title of each signing officer under his or her signature. |