UNITED STATES
SECURITIES AND EXCHANGE COMMISSION
Washington, D.C. 20549
FORM N-CSR
CERTIFIED SHAREHOLDER REPORT OF REGISTERED
MANAGEMENT INVESTMENT COMPANIES
Investment Company Act file number 811-03327
MFS SERIES TRUST XIII
(Exact name of registrant as specified in charter)
111 Huntington Avenue, Boston, Massachusetts 02199 (Address of principal executive offices) (Zip code)
Christopher R. Bohane
Massachusetts Financial Services Company
111Huntington Avenue Boston, Massachusetts 02199
(Name and address of agents for service)
Registrant's telephone number, including area code: (617) 954-5000
Date of fiscal year end: February 28*
Date of reporting period: February 28, 2023
*This Form N-CSR pertains to the following series of the Registrant: MFS Diversified Income Fund, MFS Government Securities Fund and MFS New Discovery Value Fund. The remaining series of the Registrant has a fiscal year end other than February 28.
ITEM 1. REPORTS TO STOCKHOLDERS.
Item 1(a):
Annual Report
February 28, 2023
MFS® Diversified
Income Fund
MFS® Diversified
Income Fund
| 1 |
| 2 |
| 5 |
| 7 |
| 11 |
| 13 |
| 47 |
| 49 |
| 51 |
| 52 |
| 60 |
| 81 |
| 83 |
| 87 |
| 87 |
| 87 |
| 87 |
| 87 |
| 89 |
The report is prepared for the general information of shareholders. It is authorized for distribution to prospective investors only when preceded or accompanied by a current prospectus.
NOT FDIC INSURED • MAY LOSE VALUE • NO BANK GUARANTEE
LETTER FROM THE CHAIR AND CEO
Dear Shareholders:
Markets — which rallied in late 2022 and early 2023 on signs of peaking inflation, hopes that monetary policy tightening cycles may be nearing an end and a rapid reopening of China’s economy — have hit turbulence after the sudden collapse of two US regional banks and the government-led merger of Switzerland’s two largest lenders. At the same time, US inflation data suggest that price pressures will prove more persistent than expected, making the US Federal Reserve’s job of trying to corral four-decade-high inflation without tipping the economy into recession that much more difficult. On a positive note, markets have largely adjusted to the challenges posed by Russia’s invasion of Ukraine, thanks in part to mild European winter weather that has alleviated concerns over potential near-term shortages of natural gas. Resilient labor markets in much of the developed world have further contributed to a brighter-than-expected economic backdrop. However, after the recent banking turmoil, investors are increasingly mindful that the lagged effects of ongoing monetary policy tightening have yet to fully work their way through the global economy.
One result of the banking crisis has been a rally in global government bond markets as investors sense that the global monetary tightening campaign is nearing its end, and the resulting lower yields have eased some of the pressure on interest rate–sensitive parts of the economy. Over the near term, amid tighter financial conditions, we feel companies will face a challenging earnings backdrop as they are forced to absorb higher input and labor costs while pricing power dwindles. As for fixed income, the rise in interest rates in recent months has made bonds more attractive than they have been in years, which may provide balance for investors’ portfolios.
During times of market transition, it is important to have a deep understanding of company fundamentals, and we have built our unique global research platform to do just that.
At MFS®, we put our clients’ assets to work responsibly by carefully navigating increasingly complex global capital markets. Our investment team is guided by a commitment to long-term fundamental investing. Our global investment platform — combining collective expertise, long-term discipline, and thoughtful risk management — seeks to uncover what we believe are the best, most durable investment ideas in markets around the world, enabling us to potentially create value for investors.
Respectfully,
Michael W. Roberge
Chair and Chief Executive Officer
MFS Investment Management
April 14, 2023
The opinions expressed in this letter are subject to change and may not be relied upon for investment advice. No forecasts can be guaranteed.
Portfolio structure (i)
Top ten holdings (i)
| U.S. Treasury Note 10 yr Future - JUN 2023 | 1.7% |
| U.S. Treasury Note 2 yr Future - JUN 2023 | 1.5% |
| U.S. Treasury Note 5 yr Future - JUN 2023 | 1.4% |
| Prologis, Inc., REIT | 1.3% |
| Equinix, Inc., REIT | 1.1% |
| Simon Property Group, Inc., REIT | 1.1% |
| U.S. Treasury Ultra Bond Future - JUN 2023 | 1.0% |
| UMBS, TBA, 2.5%, 30 year (h) | 0.9% |
| Markit CDX North America Investment Grade Series 39 Index Credit Default Swap-Option - APR 2023 | (1.2)% |
| U.S. Treasury Ultra Note 10 yr Future - JUN 2023 | (2.0)% |
GICS equity sectors (g)(i)
| Real Estate | 11.4% |
| Health Care | 3.8% |
| Financials | 3.1% |
| Consumer Staples | 3.0% |
| Information Technology | 1.7% |
| Communication Services | 1.5% |
| Materials | 1.4% |
| Energy | 1.4% |
| Industrials | 1.1% |
| Utilities | 0.7% |
| Consumer Discretionary | 0.6% |
| Convertible Debt | 0.1% |
| Equity Warrants (o) | 0.0% |
| Index Options | (0.2)% |
| Equity Options | (0.6)% |
Fixed income sectors (i)
| High Yield Corporates | 21.5% |
| Emerging Markets Bonds | 14.0% |
| Investment Grade Corporates | 13.8% |
| U.S. Treasury Securities | 9.5% |
| Mortgage-Backed Securities | 7.2% |
| Commercial Mortgage-Backed Securities | 0.4% |
| Collateralized Debt Obligations | 0.4% |
| Non-U.S. Government Bonds | 0.2% |
| Municipal Bonds | 0.2% |
| Asset-Backed Securities | 0.2% |
| U.S. Government Agencies (o) | 0.0% |
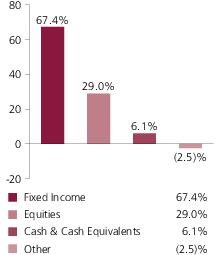
Portfolio Composition - continued
Composition including fixed income credit quality (a)(i)
| AAA | 0.9% |
| AA | 2.0% |
| A | 6.5% |
| BBB | 11.7% |
| BB | 15.1% |
| B | 11.2% |
| CCC | 3.6% |
| CC | 0.1% |
| C (o) | 0.0% |
| D | 0.1% |
| U.S. Government | 5.3% |
| Federal Agency | 7.2% |
| Not Rated | 3.7% |
| Non-Fixed Income | 29.0% |
| Cash & Cash Equivalents | 6.1% |
| Other | (2.5)% |
Issuer country weightings (i)(x)
| United States | 70.2% |
| Canada | 2.7% |
| United Kingdom | 2.4% |
| France | 1.4% |
| Mexico | 1.4% |
| Japan | 1.3% |
| Switzerland | 1.2% |
| China | 1.0% |
| India | 0.9% |
| Other Countries | 17.5% |
| (a) | For all securities other than those specifically described below, ratings are assigned to underlying securities utilizing ratings from Moody’s, Fitch, and Standard & Poor’s rating agencies and applying the following hierarchy: If all three agencies provide a rating, the middle rating (after dropping the highest and lowest ratings) is assigned; if two of the three agencies rate a security, the lower of the two is assigned. If none of the 3 rating agencies above assign a rating, but the security is rated by DBRS Morningstar, then the DBRS Morningstar rating is assigned. If none of the 4 rating agencies listed above rate the security, but the security is rated by the Kroll Bond Rating Agency (KBRA), then the KBRA rating is assigned. Ratings are shown in the S&P and Fitch scale (e.g., AAA). Securities rated BBB or higher are considered investment grade. All ratings are subject to change. U.S. Government includes securities issued by the U.S. Department of the Treasury. Federal Agencies includes rated and unrated U.S. Agency fixed-income securities, U.S. Agency mortgage-backed securities, and collateralized mortgage obligations of U.S. Agency mortgage-backed securities. |
Not Rated includes fixed income securities and fixed income derivatives that have not been rated by any rating agency. Non-Fixed Income includes equity securities (including convertible bonds and equity derivatives), ETFs, and/or commodity-linked derivatives. The fund may or may not have held all of these instruments on this date. The fund is not rated by these agencies.
| (g) | The Global Industry Classification Standard (GICS®) was developed by and/or is the exclusive property of MSCI, Inc. and S&P Global Market Intelligence Inc. (“S&P Global Market Intelligence”). GICS is a service mark of MSCI and S&P Global Market Intelligence and has been licensed for use by MFS. MFS has applied its own internal sector/industry classification methodology for equity securities and non-equity securities that are unclassified by GICS. |
| (h) | UMBS may include both Fannie Mae and Freddie Mac securities. |
Portfolio Composition - continued
| (i) | For purposes of this presentation, the components include the value of securities, and reflect the impact of the equivalent exposure of derivative positions, if any. These amounts may be negative from time to time. Equivalent exposure is a calculated amount that translates the derivative position into a reasonable approximation of the amount of the underlying asset that the portfolio would have to hold at a given point in time to have the same price sensitivity that results from the portfolio’s ownership of the derivative contract. When dealing with derivatives, equivalent exposure is a more representative measure of the potential impact of a position on portfolio performance than value. The bond component will include any accrued interest amounts. |
| (x) | Represents the portfolio’s exposure to issuer countries as a percentage of a portfolio’s net assets. For purposes of this presentation, United States includes Cash & Cash Equivalents and Other. |
Where the fund holds convertible bonds, they are treated as part of the equity portion of the portfolio.
The fund invests a portion of its assets in the MFS High Yield Pooled Portfolio. Percentages include the indirect exposure to the underlying holdings, including investments in money market funds and Other, of the MFS High Yield Pooled Portfolio and not the direct exposure from investing in the MFS High Yield Pooled Portfolio itself.
Cash & Cash Equivalents includes any direct exposure to cash, direct and indirect exposure to investments in money market funds, cash equivalents, short-term securities, and other assets less liabilities. Please see the Statement of Assets and Liabilities for additional information related to the fund’s direct cash position and other assets and liabilities.
Other includes the direct and indirect equivalent exposure from currency derivatives and/or any offsets to derivative positions and may be negative.
Percentages are based on net assets as of February 28, 2023.
The portfolio is actively managed and current holdings may be different.
Management Review
Summary of Results
The MFS Diversified Income Fund (fund) includes investments in lower quality debt instruments, U.S. government securities, emerging market debt instruments, dividend-paying equity securities, and real estate-related instruments.
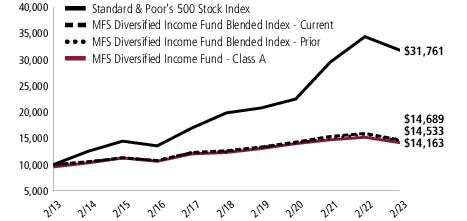
For the twelve months ended February 28, 2023, Class A shares of the fund provided a total return of -6.96%, at net asset value. This compares with a return of -7.69% for the fund’s benchmark, the Standard & Poor’s 500 Stock Index. The fund’s other benchmark, the MFS Diversified Income Fund Blended Index - Current (Blended Index) generated a return of -7.89% over the reporting period. The Blended Index reflects the blended returns of various equity and fixed income market indices, with percentage allocations to each index designed to resemble the allocations of the fund. The market indices and related percentage allocations used to compile the Blended Index are set forth in the Performance Summary.
Market Environment
During the reporting period, central banks around the world had to combat the strongest inflationary pressures in four decades, fueled by the global fiscal response to the pandemic, disrupted supply chains and the dislocations to energy markets stemming from the war in Ukraine. Interest rates have risen substantially, but the effects of a tighter monetary policy may not have been fully experienced yet, given that monetary policy works with long and variable lags. Late in the period, China abruptly ended its Zero-COVID policy, helping unleash a substantial amount of pent-up demand in the world’s second-largest economy and sending ripple effects throughout the global economy. A shift in consumption patterns in the parts of the world that reopened earlier favored services over goods, straining already tight labor markets in many developed economies, while reducing demand for manufactured goods, primarily from Asia. The combination of these factors contributed to market volatility.
Policymakers will find themselves in the difficult position of trying to restrain inflation without tipping economies into recession. Despite the challenging macroeconomic and geopolitical environment, policymakers remained focused on controlling inflation, although investors appeared to have expected varying degrees of action from the central banks. The Fed has been among the most aggressive developed market central banks, tightening policy at the fastest rate in decades, although it slowed its hiking pace at the end of the period, as did the European Central Bank. After remaining on the monetary sidelines for much of the period, the Bank of Japan widened its Yield Curve Control band toward the end of the period, capping the yield on its 10-year bond at 0.5%, up from 0.25%, an action investors appeared to have interpreted as a first step toward monetary policy normalization.
Against an environment of still-tight labor markets, tighter global financial conditions and volatile materials prices, investor anxiety appeared to have increased over the potential that corporate profit margins may be past peak for this cycle. That said, tentative signs that supply chain bottlenecks (most notably semiconductors) may be moderating, the lifting of COVID restrictions in China, low levels of unemployment across developed markets and hopes that inflation levels may have peaked were supportive factors for the macroeconomic backdrop.
Management Review - continued
Factors Affecting Performance
During the reporting period, favorable security selection within the global high dividend equity, emerging markets debt and high yield bond segments of the fund was a primary contributor to performance relative to the Blended Index. Conversely, the fund’s allocation to a Standard and Poor’s 500 index option, and its overweight position in U.S. government debt, detracted from the fund’s relative returns.
Respectfully,
Portfolio Manager(s)
Robert Almeida, Neeraj Arora, David Cole, Rick Gable, Alexander Mackey, John Mitchell, Matt Ryan, Jonathan Sage, Geoffrey Schechter, and Michael Skatrud
Note to Shareholders: Effective January 20, 2023, Henry Peabody is no longer a Portfolio Manager of the fund and John Mitchell was added as a Portfolio Manager of the fund. Effective April 30, 2024, Matt Ryan will no longer be a Portfolio Manager of the fund.
The views expressed in this report are those of the portfolio manager(s) only through the end of the period of the report as stated on the cover and do not necessarily reflect the views of MFS or any other person in the MFS organization. These views are subject to change at any time based on market or other conditions, and MFS disclaims any responsibility to update such views. These views may not be relied upon as investment advice or an indication of trading intent on behalf of any MFS portfolio. References to specific securities are not recommendations of such securities, and may not be representative of any MFS portfolio’s current or future investments.
Performance Summary THROUGH 2/28/23
The following chart illustrates a representative class of the fund’s historical performance in comparison to its benchmark(s). Performance results include the deduction of the maximum applicable sales charge and reflect the percentage change in net asset value, including reinvestment of dividends and capital gains distributions. The performance of other share classes will be greater than or less than that of the class depicted below. Benchmarks are unmanaged and may not be invested in directly. Benchmark returns do not reflect sales charges, commissions or expenses. (See Notes to Performance Summary.)
Performance data shown represents past performance and is no guarantee of future results. Investment return and principal value fluctuate so your shares, when sold, may be worth more or less than the original cost; current performance may be lower or higher than quoted. The performance shown does not reflect the deduction of taxes, if any, that a shareholder would pay on fund distributions or the redemption of fund shares.
Growth of a Hypothetical $10,000 Investment
Performance Summary - continued
Total Returns through 2/28/23
Average annual without sales charge
| Share Class | Class Inception Date | 1-yr | 5-yr | 10-yr |
| A | 5/26/06 | (6.96)% | 2.83% | 3.99% |
| C | 5/26/06 | (7.74)% | 2.06% | 3.21% |
| I | 5/26/06 | (6.73)% | 3.10% | 4.25% |
| R1 | 7/01/08 | (7.67)% | 2.08% | 3.22% |
| R2 | 7/01/08 | (7.20)% | 2.59% | 3.73% |
| R3 | 7/01/08 | (7.04)% | 2.83% | 3.98% |
| R4 | 7/01/08 | (6.80)% | 3.09% | 4.25% |
| R6 | 7/02/12 | (6.64)% | 3.18% | 4.35% |
Comparative benchmark(s)
| Standard & Poor’s 500 Stock Index (f) | (7.69)% | 9.82% | 12.25% |
| MFS Diversified Income Fund Blended Index - Current (f)(w) | (7.89)% | 3.03% | 3.92% |
| MFS Diversified Income Fund Blended Index - Prior (f)(w) | (7.89)% | 3.03% | 3.81% |
| Bloomberg U.S. Corporate High-Yield 2% Issuer Capped Index (f) | (5.45)% | 2.85% | 4.09% |
| Bloomberg U.S. Credit Index (f) | (10.15)% | 1.05% | 1.91% |
| Bloomberg U.S. Government/Mortgage Index (f) | (9.61)% | 0.22% | 0.73% |
| JPMorgan Emerging Markets Bond Index Global (f) | (8.20)% | (0.40)% | 1.59% |
| JPMorgan Emerging Markets Bond Index Global Diversified (f) | (8.64)% | (0.73)% | 1.85% |
| MSCI All Country World High Dividend Yield Index (net div) (f) | (5.71)% | 4.37% | 5.74% |
| MSCI US REIT Index (net div) (f) | (12.77)% | 6.13% | 5.23% |
Average annual with sales charge
| | | | |
A
With Initial Sales Charge (4.25%) | (10.92)% | 1.94% | 3.54% |
C
With CDSC (1% for 12 months) (v) | (8.63)% | 2.06% | 3.21% |
CDSC – Contingent Deferred Sales Charge.
Class I, R1, R2, R3, R4, and R6 shares do not have a sales charge.
| (f) | Source: FactSet Research Systems Inc. |
| (v) | Assuming redemption at the end of the applicable period. |
Performance Summary - continued
| (w) | The MFS Diversified Income Fund Blended Index (a custom index) was comprised of the following at the beginning and at the end of the reporting period (change effective as of July 21, 2022): |
| | 2/28/23 | 2/28/22 |
| Bloomberg U.S. Corporate High-Yield 2% Issuer Capped Index | 25% | 25% |
| Bloomberg U.S. Government/Mortgage Index | 10% | 10% |
| Bloomberg U.S. Credit Index | 15% | 15% |
| JPMorgan Emerging Markets Bond Index Global | N/A | 15% |
| JPMorgan Emerging Markets Bond Index Global Diversified | 15% | N/A |
| MSCI US REIT Index (net div) | 15% | 15% |
| MSCI All Country World High Dividend Yield Index (net div) | 20% | 20% |
Benchmark Definition(s)
Bloomberg U.S. Corporate High-Yield 2% Issuer Capped Index(a) – a component of the Bloomberg U.S. Corporate High-Yield Bond Index, which measures performance of non-investment grade, fixed rate debt. The index limits the maximum exposure to any one issuer to 2%.
Bloomberg U.S. Credit Index(a) – a market capitalization-weighted index that measures the performance of publicly issued, SEC-registered, U.S. corporate and specified foreign debentures and secured notes that meet specified maturity, liquidity, and quality requirements.
Bloomberg U.S. Government/Mortgage Index(a) – measures the performance of debt issued by the U.S. Government, and its agencies, as well as mortgage-backed pass-through securities of Ginnie Mae (GNMA), Fannie Mae (FNMA), and Freddie Mac (FHLMC).
JPMorgan Emerging Markets Bond Index Global – measures the performance of U.S. dollar-denominated debt instruments issued by emerging market sovereign and quasi-sovereign entities: Brady bonds, loans, Eurobonds.
JPMorgan Emerging Markets Bond Index Global Diversified – tracks the total returns of USD-denominated debt instruments issued by emerging markets, sovereign and quasi-sovereign entities: Brady bonds, loans, and Eurobonds. The index, which is a uniquely-weighted version of the EMBI Global Index, limits the weights of those index countries with larger debt stocks by only including specified portions of these countries' eligible current face amounts of debt outstanding.
MSCI All Country World High Dividend Yield Index(e) (net div) – is designed to reflect the performance of developed and emerging markets equities with higher-than-average dividend income and quality characteristics.
MSCI US REIT Index(e) (net div) – a market capitalization-weighted index that is designed to measure equity market performance for real estate investment trusts (REITs) that generate a majority of their revenue and income from real estate rental and leasing operations.
Standard & Poor's 500 Stock Index(g) – a market capitalization-weighted index of 500 widely held equity securities, designed to measure broad U.S. equity performance.
Performance Summary - continued
It is not possible to invest directly in an index.
| (a) | Source: Bloomberg Index Services Limited. BLOOMBERG® is a trademark and service mark of Bloomberg Finance L.P. and its affiliates (collectively “Bloomberg”). Bloomberg or Bloomberg's licensors own all proprietary rights in the Bloomberg Indices. Bloomberg neither approves or endorses this material, or guarantees the accuracy or completeness of any information herein, or makes any warranty, express or implied, as to the results to be obtained therefrom and, to the maximum extent allowed by law, neither shall have any liability or responsibility for injury or damages arising in connection therewith. |
| (e) | Morgan Stanley Capital International (“MSCI”) makes no express or implied warranties or representations and shall have no liability whatsoever with respect to any MSCI data contained herein. The MSCI data may not be further redistributed or used as a basis for other indices or any securities or financial products. This report is not approved, reviewed, or produced by MSCI. |
| (g) | “Standard & Poor's®” and “S&P®” are registered trademarks of Standard & Poor's Financial Services LLC (“S&P”) and Dow Jones is a registered trademark of Dow Jones Trademark Holdings LLC (“Dow Jones”) and have been licensed for use by S&P Dow Jones Indices LLC and sublicensed for certain purposes by MFS. The S&P 500® is a product of S&P Dow Jones Indices LLC, and has been licensed for use by MFS. MFS's product(s) is not sponsored, endorsed, sold, or promoted by S&P Dow Jones Indices LLC, Dow Jones, S&P, or their respective affiliates, and neither S&P Dow Jones Indices LLC, Dow Jones, S&P, nor their respective affiliates make any representation regarding the advisability of investing in such product(s). |
Notes to Performance Summary
Average annual total return represents the average annual change in value for each share class for the periods presented.
Performance results reflect any applicable expense subsidies and waivers in effect during the periods shown. Without such subsidies and waivers the fund's performance results would be less favorable. Please see the prospectus and financial statements for complete details.
Performance results do not include adjustments made for financial reporting purposes in accordance with U.S. generally accepted accounting principles and may differ from amounts reported in the financial highlights.
From time to time the fund may receive proceeds from litigation settlements, without which performance would be lower.
Expense Table
Fund expenses borne by the shareholders during the period,
September 1, 2022 through February 28, 2023
As a shareholder of the fund, you incur two types of costs: (1) transaction costs, including sales charges (loads) on certain purchase or redemption payments, and (2) ongoing costs, including management fees; distribution and service (12b-1) fees; and other fund expenses. This example is intended to help you understand your ongoing costs (in dollars) of investing in the fund and to compare these costs with the ongoing costs of investing in other mutual funds.
In addition to the fees and expenses which the fund bears directly, the fund indirectly bears a pro rata share of the fees and expenses of the MFS High Yield Pooled Portfolio, an underlying MFS Pooled Portfolio in which the fund invests. MFS Pooled Portfolios are mutual funds advised by MFS that do not pay management fees to MFS but do incur investment and operating costs. If these transactional and indirect costs were included, your costs would have been higher.
The example is based on an investment of $1,000 invested at the beginning of the period and held for the entire period September 1, 2022 through February 28, 2023.
Actual Expenses
The first line for each share class in the following table provides information about actual account values and actual expenses. You may use the information in this line, together with the amount you invested, to estimate the expenses that you paid over the period. Simply divide your account value by $1,000 (for example, an $8,600 account value divided by $1,000 = 8.6), then multiply the result by the number in the first line under the heading entitled “Expenses Paid During Period” to estimate the expenses you paid on your account during this period.
Hypothetical Example for Comparison Purposes
The second line for each share class in the following table provides information about hypothetical account values and hypothetical expenses based on the fund’s actual expense ratio and an assumed rate of return of 5% per year before expenses, which is not the fund’s actual return. The hypothetical account values and expenses may not be used to estimate the actual ending account balance or expenses you paid for the period. You may use this information to compare the ongoing costs of investing in the fund and other funds. To do so, compare this 5% hypothetical example with the 5% hypothetical examples that appear in the shareholder reports of the other funds.
Please note that the expenses shown in the table are meant to highlight your ongoing costs only and do not reflect any transactional costs, such as sales charges (loads). Therefore, the second line for each share class in the table is useful in comparing ongoing costs only, and will not help you determine the relative total costs of owning different funds. In addition, if these transactional costs were included, your costs would have been higher.
Expense Table - continued
Share
Class | | Annualized
Expense
Ratio | Beginning
Account Value
9/01/22 | Ending
Account Value
2/28/23 | Expenses
Paid During
Period (p)
9/01/22-2/28/23 |
| A | Actual | 0.89% | $1,000.00 | $1,014.15 | $4.44 |
| Hypothetical (h) | 0.89% | $1,000.00 | $1,020.38 | $4.46 |
| C | Actual | 1.64% | $1,000.00 | $1,009.46 | $8.17 |
| Hypothetical (h) | 1.64% | $1,000.00 | $1,016.66 | $8.20 |
| I | Actual | 0.64% | $1,000.00 | $1,015.41 | $3.20 |
| Hypothetical (h) | 0.64% | $1,000.00 | $1,021.62 | $3.21 |
| R1 | Actual | 1.64% | $1,000.00 | $1,010.34 | $8.17 |
| Hypothetical (h) | 1.64% | $1,000.00 | $1,016.66 | $8.20 |
| R2 | Actual | 1.14% | $1,000.00 | $1,012.88 | $5.69 |
| Hypothetical (h) | 1.14% | $1,000.00 | $1,019.14 | $5.71 |
| R3 | Actual | 0.89% | $1,000.00 | $1,014.15 | $4.44 |
| Hypothetical (h) | 0.89% | $1,000.00 | $1,020.38 | $4.46 |
| R4 | Actual | 0.64% | $1,000.00 | $1,014.53 | $3.20 |
| Hypothetical (h) | 0.64% | $1,000.00 | $1,021.62 | $3.21 |
| R6 | Actual | 0.55% | $1,000.00 | $1,015.85 | $2.75 |
| Hypothetical (h) | 0.55% | $1,000.00 | $1,022.07 | $2.76 |
| (h) | 5% class return per year before expenses. |
| (p) | “Expenses Paid During Period” are equal to each class’s annualized expense ratio, as shown above, multiplied by the average account value over the period, multiplied by 181/365 (to reflect the one-half year period). Expenses paid do not include any applicable sales charges (loads). If these transaction costs had been included, your costs would have been higher. In addition to the fees and expenses which the fund bears directly, the fund indirectly bears a pro rata share of the fees and expenses of the underlying funds in which the fund invests. If these indirect costs were included, your costs would have been higher. |
Portfolio of Investments
2/28/23
The Portfolio of Investments is a complete list of all securities owned by your fund. It is categorized by broad-based asset classes.
| Issuer | | | Shares/Par | Value ($) |
| Bonds – 41.3% |
| Aerospace & Defense – 0.3% |
| Boeing Co., 2.196%, 2/04/2026 | | $ | 920,000 | $835,682 |
| Boeing Co., 5.15%, 5/01/2030 | | | 731,000 | 707,364 |
| Boeing Co., 5.805%, 5/01/2050 | | | 2,462,000 | 2,341,919 |
| General Dynamics Corp., 3.625%, 4/01/2030 | | | 1,362,000 | 1,269,048 |
| Raytheon Technologies Corp., 1.9%, 9/01/2031 | | | 1,540,000 | 1,203,899 |
| Raytheon Technologies Corp., 2.375%, 3/15/2032 | | | 1,796,000 | 1,447,579 |
| Raytheon Technologies Corp., 3.03%, 3/15/2052 | | | 1,272,000 | 877,775 |
| | | | | $8,683,266 |
| Apparel Manufacturers – 0.1% |
| Tapestry, Inc., 4.125%, 7/15/2027 | | $ | 667,000 | $629,268 |
| Tapestry, Inc., 3.05%, 3/15/2032 | | | 785,000 | 623,739 |
| | | | | $1,253,007 |
| Asset-Backed & Securitized – 1.0% |
| 3650R Commercial Mortgage Trust, 2021-PF1, “XA”, 1.027%, 11/15/2054 (i) | | $ | 6,505,896 | $359,555 |
| ACREC 2021-FL1 Ltd., “A”, FLR, 5.751% (LIBOR - 1mo. + 1.15%), 10/16/2036 (n) | | | 1,091,500 | 1,067,489 |
| ACREC 2023-FL2 LLC, “A”, FLR, 6.63% (SOFR - 1mo. + 2.23%), 2/19/2038 (n) | | | 888,988 | 886,792 |
| Arbor Realty Trust, Inc., CLO, 2021-FL1, “B”, FLR, 6.073% (LIBOR - 1mo. + 1.5%), 12/15/2035 (n) | | | 998,500 | 927,862 |
| Arbor Realty Trust, Inc., CLO, 2021-FL4, “AS”, FLR, 6.288% (LIBOR - 1mo. + 1.7%), 11/15/2036 (n) | | | 484,000 | 475,562 |
| AREIT 2022-CRE6 Trust, “AS”, FLR, 6.076% (SOFR - 30 day + 1.65%), 1/16/2037 (n) | | | 946,500 | 910,553 |
| BBCMS Mortgage Trust, 2021-C9, “XA”, 1.62%, 2/15/2054 (i) | | | 3,531,156 | 315,816 |
| BBCMS Mortgage Trust, 2022-C18, “XA”, 0.46%, 12/15/2055 (i) | | | 4,291,275 | 166,958 |
| BDS 2021-FL7 Ltd., “B”, FLR, 6.091% (LIBOR - 1mo. + 1.5%), 6/16/2036 (n) | | | 431,500 | 407,177 |
| Benchmark 2021-B24 Mortgage Trust, “XA”, 1.151%, 3/15/2054 (i) | | | 6,687,288 | 414,331 |
| Benchmark 2021-B26 Mortgage Trust, “XA”, 0.885%, 6/15/2054 (i) | | | 6,504,681 | 318,884 |
| Benchmark 2021-B27 Mortgage Trust, “XA”, 1.266%, 7/15/2054 (i) | | | 7,589,849 | 544,509 |
Portfolio of Investments – continued
| Issuer | | | Shares/Par | Value ($) |
| Bonds – continued |
| Asset-Backed & Securitized – continued |
| Benchmark 2022-B36 Mortgage Trust, “XA”, 0.639%, 7/15/2055 (i) | | $ | 6,962,076 | $338,382 |
| Capital Automotive, 2020-1A, “A4”, REIT, 3.19%, 2/15/2050 (n) | | | 512,405 | 477,564 |
| Citigroup Commercial Mortgage Trust, 2019-XA, “C7”, 0.867%, 12/15/2072 (i)(n) | | | 9,399,939 | 408,433 |
| Commercial Mortgage Pass-Through Certificates, 2021-BN32, “XA”, 0.778%, 4/15/2054 (i) | | | 4,821,109 | 206,438 |
| Commercial Mortgage Pass-Through Certificates, 2022-BN43, “XA”, 0.895%, 8/15/2055 (i) | | | 7,983,644 | 498,151 |
| CPS Auto Trust, 2019-D, “E”, 3.86%, 10/15/2025 (n) | | | 1,008,000 | 981,325 |
| DT Auto Owner Trust, 2023-1A, “A”, 5.48%, 4/15/2027 (n) | | | 645,840 | 644,563 |
| Flagship Credit Auto Trust, 2019-3, “D”, 2.86%, 12/15/2025 (n) | | | 500,000 | 484,876 |
| KREF 2018-FT1 Ltd., “A”, FLR, 5.671% (LIBOR - 1mo. + 1.1%), 2/15/2039 (n) | | | 478,500 | 462,414 |
| KREF 2018-FT1 Ltd., “AS”, FLR, 5.901% (LIBOR - 1mo. + 1.3%), 2/15/2039 (n) | | | 526,000 | 501,988 |
| LAD Auto Receivables Trust, 2022-1A, “A”, 5.21%, 6/15/2027 (n) | | | 371,735 | 368,848 |
| LAD Auto Receivables Trust, 2023-1A, “A2”, 5.68%, 10/15/2026 (n) | | | 332,000 | 331,861 |
| LoanCore 2021-CRE5 Ltd., “AS”, FLR, 6.338% (LIBOR - 1mo. + 1.75%), 7/15/2036 (n) | | | 750,000 | 725,258 |
| MF1 2020-FL4 Ltd., “A”, FLR, 6.376% (LIBOR - 1mo. + 1.7%), 11/15/2035 (n) | | | 1,047,125 | 1,047,154 |
| MF1 2021-FL5 Ltd., “AS”, FLR, 5.876% (LIBOR - 1mo. + 1.2%), 7/15/2036 (n) | | | 985,000 | 954,167 |
| MF1 2021-FL5 Ltd., “B”, FLR, 6.126% (LIBOR - 1mo. + 1.45%), 7/15/2036 (n) | | | 1,241,000 | 1,200,066 |
| MF1 2022-FL8 Ltd., “A”, FLR, 5.784% (SOFR - 1mo. + 1.35%), 2/19/2037 (n) | | | 1,430,921 | 1,411,586 |
| Morgan Stanley Capital I Trust, 2018-H4, “XA”, 0.831%, 12/15/2051 (i) | | | 9,705,960 | 345,520 |
| Morgan Stanley Capital I Trust, 2021-L5, “XA”, 1.295%, 5/15/2054 (i) | | | 2,693,080 | 183,312 |
| Palmer Square Loan Funding 2020-1A Ltd., “A2”, FLR, 6.025% (LIBOR - 3mo. + 1.35%), 2/20/2028 (n) | | | 1,308,942 | 1,295,184 |
| PFP III 2021-7 Ltd., “AS”, FLR, 5.738% (LIBOR - 1mo. + 1.15%), 4/14/2038 (n) | | | 1,383,931 | 1,320,626 |
| PFP III 2021-8 Ltd., “A”, FLR, 5.59% (LIBOR - 1mo. + 1%), 8/09/2037 (n) | | | 692,161 | 672,126 |
Portfolio of Investments – continued
| Issuer | | | Shares/Par | Value ($) |
| Bonds – continued |
| Asset-Backed & Securitized – continued |
| PFP III 2021-8 Ltd., “AS”, FLR, 5.84% (LIBOR - 1mo. + 1.25%), 8/09/2037 (n) | | $ | 1,010,000 | $954,310 |
| ReadyCap Commercial Mortgage Trust, 2021-FL5, “A”, FLR, 5.617% (LIBOR - 1mo. + 1%), 4/25/2038 (n) | | | 535,207 | 519,619 |
| ReadyCap Commercial Mortgage Trust, 2021-FL7, “A”, FLR, 5.817% (LIBOR - 1mo. + 1.2%), 11/25/2036 (n) | | | 353,699 | 343,319 |
| ReadyCap Commercial Mortgage Trust, 2021-FL7, “AS”, FLR, 6.117% (LIBOR - 1mo. + 1.5%), 11/25/2036 (n) | | | 109,000 | 106,275 |
| Santander Drive Auto Receivables Trust, 2022-5, “A2”, 3.98%, 1/15/2025 | | | 406,862 | 405,597 |
| Santander Drive Auto Receivables Trust, 2022-6, “A2”, 4.37%, 5/15/2025 | | | 157,593 | 157,098 |
| Wells Fargo Commercial Mortgage Trust, 2018-C48, “XA”, 1.058%, 1/15/2052 (i)(n) | | | 5,197,209 | 211,775 |
| Westlake Automobile Receivable Trust, 2023-1A, “A2B”, FLR, 5.251% (SOFR - 1mo. + 0.85%), 6/15/2026 (n) | | | 187,000 | 187,007 |
| Westlake Automobile Receivables Trust, 2022-3A, “A2”, 5.24%, 7/15/2025 (n) | | | 850,000 | 847,870 |
| | | | | $25,388,200 |
| Automotive – 0.1% |
| Hyundai Capital America, 1.8%, 1/10/2028 (n) | | $ | 852,000 | $714,248 |
| Hyundai Capital America, 6.375%, 4/08/2030 (n) | | | 851,000 | 878,095 |
| | | | | $1,592,343 |
| Broadcasting – 0.5% |
| Activision Blizzard, Inc., 2.5%, 9/15/2050 | | $ | 1,594,000 | $993,936 |
| Discovery Communications LLC, 3.625%, 5/15/2030 | | | 2,384,000 | 2,040,124 |
| Discovery Communications LLC, 4%, 9/15/2055 | | | 1,082,000 | 699,650 |
| Prosus N.V., 4.193%, 1/19/2032 (n) | | | 881,000 | 724,220 |
| Prosus N.V., 4.027%, 8/03/2050 (n) | | | 1,149,000 | 726,729 |
| Prosus N.V., 3.832%, 2/08/2051 (n) | | | 1,016,000 | 615,376 |
| Walt Disney Co., 3.35%, 3/24/2025 | | | 2,391,000 | 2,310,170 |
| Walt Disney Co., 3.5%, 5/13/2040 | | | 2,155,000 | 1,741,483 |
| Walt Disney Co., 3.8%, 5/13/2060 | | | 1,364,000 | 1,067,397 |
| Warnermedia Holdings, Inc., 4.279%, 3/15/2032 (n) | | | 2,105,000 | 1,817,270 |
| Warnermedia Holdings, Inc., 5.391%, 3/15/2062 (n) | | | 882,000 | 687,969 |
| | | | | $13,424,324 |
Portfolio of Investments – continued
| Issuer | | | Shares/Par | Value ($) |
| Bonds – continued |
| Brokerage & Asset Managers – 0.2% |
| Brookfield Finance, Inc., 2.34%, 1/30/2032 | | $ | 1,462,000 | $1,144,653 |
| Intercontinental Exchange, Inc., 1.85%, 9/15/2032 | | | 2,958,000 | 2,213,578 |
| Intercontinental Exchange, Inc., 5.2%, 6/15/2062 | | | 1,145,000 | 1,119,629 |
| | | | | $4,477,860 |
| Building – 0.2% |
| Fortune Brands Home & Security, Inc., 4%, 3/25/2032 | | $ | 3,331,000 | $2,894,618 |
| GCC S.A.B de C.V., 3.614%, 4/20/2032 (n) | | | 1,646,000 | 1,371,233 |
| Vulcan Materials Co., 3.5%, 6/01/2030 | | | 360,000 | 319,440 |
| Vulcan Materials Co., 4.5%, 6/15/2047 | | | 325,000 | 277,929 |
| | | | | $4,863,220 |
| Business Services – 0.5% |
| Equifax, Inc., 3.1%, 5/15/2030 | | $ | 1,801,000 | $1,533,585 |
| Equifax, Inc., 2.35%, 9/15/2031 | | | 1,098,000 | 865,393 |
| Equinix, Inc., 2.5%, 5/15/2031 | | | 2,649,000 | 2,121,156 |
| Fiserv, Inc., 4.4%, 7/01/2049 | | | 1,953,000 | 1,578,996 |
| Mastercard, Inc., 3.85%, 3/26/2050 | | | 1,013,000 | 853,204 |
| Visa, Inc., 2.05%, 4/15/2030 | | | 3,932,000 | 3,323,089 |
| Visa, Inc., 2.7%, 4/15/2040 | | | 1,818,000 | 1,361,998 |
| Visa, Inc., 2%, 8/15/2050 | | | 1,791,000 | 1,062,111 |
| | | | | $12,699,532 |
| Cable TV – 0.3% |
| Cable Onda S.A., 4.5%, 1/30/2030 (n) | | $ | 1,326,000 | $1,080,690 |
| Charter Communications Operating LLC/Charter Communications Operating Capital Corp., 6.384%, 10/23/2035 | | | 1,092,000 | 1,048,185 |
| Comcast Corp., 1.5%, 2/15/2031 | | | 3,070,000 | 2,370,470 |
| Comcast Corp., 3.75%, 4/01/2040 | | | 1,245,000 | 1,019,659 |
| Liberty Costa Rica Senior Secured Finance, 10.875%, 1/15/2031 (n) | | | 1,588,000 | 1,498,858 |
| United Group B.V., 4.625%, 8/15/2028 (n) | | EUR | 367,000 | 307,629 |
| VTR Comunicaciones S.p.A., 5.125%, 1/15/2028 (n) | | $ | 1,273,000 | 899,807 |
| | | | | $8,225,298 |
| Chemicals – 0.1% |
| RPM International, Inc., 4.55%, 3/01/2029 | | $ | 1,380,000 | $1,276,925 |
| RPM International, Inc., 4.25%, 1/15/2048 | | | 110,000 | 82,941 |
| Sasol Financing (USA) LLC, 5.5%, 3/18/2031 | | | 1,455,000 | 1,213,106 |
| | | | | $2,572,972 |
Portfolio of Investments – continued
| Issuer | | | Shares/Par | Value ($) |
| Bonds – continued |
| Computer Software – 0.3% |
| Cisco Systems, Inc., 5.5%, 1/15/2040 | | $ | 745,000 | $783,064 |
| Microsoft Corp., 2.525%, 6/01/2050 | | | 7,093,000 | 4,736,702 |
| Oracle Corp., 5.55%, 2/06/2053 | | | 1,130,000 | 1,035,455 |
| VeriSign, Inc., 4.75%, 7/15/2027 | | | 2,180,000 | 2,113,624 |
| | | | | $8,668,845 |
| Computer Software - Systems – 0.3% |
| Apple, Inc., 2.05%, 9/11/2026 | | $ | 3,416,000 | $3,110,510 |
| Apple, Inc., 1.7%, 8/05/2031 | | | 3,997,000 | 3,180,714 |
| Apple, Inc., 2.65%, 5/11/2050 | | | 2,850,000 | 1,913,801 |
| | | | | $8,205,025 |
| Conglomerates – 0.3% |
| Grupo KUO S.A.B. de C.V., 5.75%, 7/07/2027 (n) | | $ | 1,187,000 | $1,087,407 |
| Otis Worldwide Corp., 2.565%, 2/15/2030 | | | 101,000 | 85,102 |
| Regal Rexnord Corp., 6.05%, 4/15/2028 (n) | | | 1,114,000 | 1,089,279 |
| Regal Rexnord Corp., 6.3%, 2/15/2030 (n) | | | 955,000 | 934,356 |
| Regal Rexnord Corp., 6.4%, 4/15/2033 (n) | | | 1,392,000 | 1,369,688 |
| Westinghouse Air Brake Technologies Corp., 4.95%, 9/15/2028 | | | 3,268,000 | 3,153,675 |
| | | | | $7,719,507 |
| Construction – 0.1% |
| Seazen Group Ltd., 4.45%, 7/13/2025 | | $ | 1,614,000 | $1,226,640 |
| Consumer Products – 0.1% |
| Hasbro, Inc., 3.9%, 11/19/2029 | | $ | 1,181,000 | $1,041,142 |
| Mattel, Inc., 3.75%, 4/01/2029 (n) | | | 1,163,000 | 1,005,995 |
| | | | | $2,047,137 |
| Consumer Services – 0.2% |
| Booking Holdings, Inc., 3.55%, 3/15/2028 | | $ | 1,755,000 | $1,645,157 |
| Booking Holdings, Inc., 4.625%, 4/13/2030 | | | 876,000 | 851,151 |
| Conservation Fund, 3.474%, 12/15/2029 | | | 1,031,000 | 878,418 |
| Meituan, 3.05%, 10/28/2030 (n) | | | 1,511,000 | 1,161,536 |
| Meituan, 3.05%, 10/28/2030 | | | 1,024,000 | 787,169 |
| | | | | $5,323,431 |
| Containers – 0.1% |
| San Miguel Industrias PET S.A., 3.5%, 8/02/2028 (n) | | $ | 2,000,000 | $1,660,000 |
| Electrical Equipment – 0.1% |
| Arrow Electronics, Inc., 3.875%, 1/12/2028 | | $ | 3,044,000 | $2,788,269 |
Portfolio of Investments – continued
| Issuer | | | Shares/Par | Value ($) |
| Bonds – continued |
| Electronics – 0.3% |
| Broadcom, Inc., 3.187%, 11/15/2036 (n) | | $ | 1,648,000 | $1,193,366 |
| Lam Research Corp., 1.9%, 6/15/2030 | | | 988,000 | 804,529 |
| Lam Research Corp., 4.875%, 3/15/2049 | | | 795,000 | 751,124 |
| NXP B.V./NXP Funding LLC/NXP USA, Inc., 3.125%, 2/15/2042 | | | 767,000 | 517,119 |
| Qualcomm, Inc., 3.25%, 5/20/2027 | | | 876,000 | 823,937 |
| SK Hynix, Inc., 6.375%, 1/17/2028 (n) | | | 1,259,000 | 1,239,663 |
| TSMC Arizona Corp., 3.875%, 4/22/2027 | | | 834,000 | 800,824 |
| TSMC Arizona Corp., 3.125%, 10/25/2041 | | | 1,658,000 | 1,294,314 |
| | | | | $7,424,876 |
| Emerging Market Quasi-Sovereign – 3.0% |
| Abu Dhabi Crude Oil Pipeline, 4.6%, 11/02/2047 | | $ | 870,000 | $792,788 |
| Aeropuerto Internacional de Tocumen S.A. (Republic of Panama), 5.125%, 8/11/2061 (n) | | | 530,000 | 415,300 |
| Autoridad del Canal de Panama, 4.95%, 7/29/2035 (n) | | | 281,000 | 263,649 |
| Autoridad del Canal de Panama, 4.95%, 7/29/2035 | | | 1,220,000 | 1,144,667 |
| Bulgarian Energy Holding EAD, 2.45%, 7/22/2028 | | EUR | 1,694,000 | 1,469,051 |
| China Development Bank Financial Leasing Co. Ltd., 2.875% to 9/28/2025, FLR (CMT - 1yr. + 2.75%) to 9/28/2030 | | $ | 753,000 | 700,742 |
| Comision Federal de Electricidad (United Mexican States), 4.688%, 5/15/2029 (n) | | | 932,000 | 834,140 |
| Comision Federal de Electricidad (United Mexican States), 3.875%, 7/26/2033 (n) | | | 1,391,000 | 1,053,781 |
| DP World Salaam (United Arab Emirates), 6% to 1/01/2026, FLR (CMT - 5yr. + 5.75%) to 1/01/2031, FLR (CMT - 5yr. + 6.75%) to 1/01/2070 | | | 1,464,000 | 1,454,929 |
| Dua Capital Ltd. (Federation of Malaysia), 2.78%, 5/11/2031 | | | 1,263,000 | 1,036,620 |
| Empresa de Transmision Electrica S.A. (Republic of Panama), 5.125%, 5/02/2049 (n) | | | 1,694,000 | 1,372,140 |
| Empresa Nacional del Petroleo, 5.25%, 11/06/2029 | | | 624,000 | 591,864 |
| Empresa Nacional del Petroleo (Republic of Chile), 3.45%, 9/16/2031 (n) | | | 1,391,000 | 1,142,435 |
| Empresa Nacional del Petroleo (Republic of Chile), 4.5%, 9/14/2047 | | | 895,000 | 686,037 |
| Eskom Holdings SOC Ltd. (Republic of South Africa), 7.125%, 2/11/2025 | | | 1,686,000 | 1,652,280 |
| Eskom Holdings SOC Ltd. (Republic of South Africa), 6.35%, 8/10/2028 (n) | | | 1,294,000 | 1,209,890 |
| Eskom Holdings SOC Ltd. (Republic of South Africa), 8.45%, 8/10/2028 | | | 845,000 | 827,221 |
| Export-Import Bank of India, 5.5%, 1/18/2033 (n) | | | 2,154,000 | 2,107,770 |
Portfolio of Investments – continued
| Issuer | | | Shares/Par | Value ($) |
| Bonds – continued |
| Emerging Market Quasi-Sovereign – continued |
| Export-Import Bank of Korea, 4.5%, 9/15/2032 | | $ | 631,000 | $614,401 |
| Export-Import Bank of Korea, 5.125%, 1/11/2033 | | | 437,000 | 446,599 |
| Huarong Finance 2017 Co. Ltd. (People's Republic of China), 4.25%, 11/07/2027 | | | 1,496,000 | 1,248,748 |
| Huarong Finance 2017 Co. Ltd. (People's Republic of China), 4.95%, 11/07/2047 | | | 1,673,000 | 1,111,995 |
| Indian Railway Finance Corp., 2.8%, 2/10/2031 (n) | | | 2,640,000 | 2,130,401 |
| Ipoteka Bank (Republic of Uzbekistan), 5.5%, 11/19/2025 | | | 1,553,000 | 1,465,721 |
| KazMunayGas National Co., JSC (Republic of Kazakhstan), 3.5%, 4/14/2033 | | | 1,039,000 | 775,894 |
| KazMunayGas National Co., JSC (Republic of Kazakhstan), 5.75%, 4/19/2047 | | | 1,109,000 | 884,161 |
| KazMunayGas National Co., JSC (Republic of Kazakhstan), 6.375%, 10/24/2048 | | | 3,964,000 | 3,324,274 |
| Korea Hydro & Nuclear Power Co. Ltd., 4.25%, 7/27/2027 (n) | | | 2,119,000 | 2,040,364 |
| MEGlobal Canada ULC (State of Kuwait), 5.875%, 5/18/2030 (n) | | | 591,000 | 602,541 |
| NAK Naftogaz Ukraine via Kondor Finance PLC, 7.625%, 11/08/2026 (a)(z) | | | 3,111,000 | 591,090 |
| National Central Cooling Co. PJSC, 2.5%, 10/21/2027 | | | 957,000 | 845,111 |
| NBK SPC Ltd. (State of Kuwait), 1.625% to 9/15/2026, FLR (SOFR - 1 day + 1.05%) to 9/15/2027 (n) | | | 1,664,000 | 1,468,480 |
| NPC Ukrenergo (Government of Ukraine), 6.875%, 11/09/2028 (a)(n) | | | 905,000 | 151,757 |
| OCP S.A. (Republic of Madagascar), 6.875%, 4/25/2044 | | | 1,263,000 | 1,149,330 |
| Office Cherifien des Phosphates S.A. (Kingdom of Morocco), 5.125%, 6/23/2051 (n) | | | 2,245,000 | 1,619,206 |
| Oryx Funding Ltd. (Sultanate of Oman), 5.8%, 2/03/2031 (n) | | | 1,210,000 | 1,178,237 |
| Pertamina PT, 5.625%, 5/20/2043 | | | 957,000 | 887,716 |
| Petroleos Mexicanos, 6.84%, 1/23/2030 | | | 1,186,000 | 991,874 |
| Petroleos Mexicanos, 10%, 2/07/2033 (n) | | | 2,302,000 | 2,217,747 |
| Petroleos Mexicanos, 6.75%, 9/21/2047 | | | 3,572,000 | 2,322,563 |
| Petroleos Mexicanos, 7.69%, 1/23/2050 | | | 6,564,000 | 4,631,500 |
| Petroleos Mexicanos, 6.95%, 1/28/2060 | | | 3,229,000 | 2,074,901 |
| PETRONAS Capital Ltd. (Federation of Malaysia), 3.404%, 4/28/2061 | | | 1,343,000 | 940,145 |
| Power Finance Corp. Ltd. (Republic of India), 3.95%, 4/23/2030 (n) | | | 1,228,000 | 1,054,668 |
| PT Bank Negara Indonesia (Persero) Tbk, 3.75%, 3/30/2026 | | | 1,838,000 | 1,692,029 |
| PT Freeport Indonesia, 5.315%, 4/14/2032 (n) | | | 1,564,000 | 1,438,428 |
| PT Freeport Indonesia, 6.2%, 4/14/2052 (n) | | | 1,473,000 | 1,296,186 |
Portfolio of Investments – continued
| Issuer | | | Shares/Par | Value ($) |
| Bonds – continued |
| Emerging Market Quasi-Sovereign – continued |
| PT Indonesia Asahan Aluminium (Persero), 5.8%, 5/15/2050 (n) | | $ | 1,883,000 | $1,646,698 |
| Qatar Petroleum, 2.25%, 7/12/2031 (n) | | | 1,397,000 | 1,147,286 |
| Qatar Petroleum, 3.125%, 7/12/2041 (n) | | | 1,997,000 | 1,517,520 |
| Qatar Petroleum, 3.3%, 7/12/2051 (n) | | | 1,053,000 | 767,374 |
| QNB Finance Ltd. (State of Qatar), 2.75%, 2/12/2027 | | | 1,129,000 | 1,033,035 |
| SA Global Sukuk Ltd. (Kingdom of Saudi Arabia), 2.694%, 6/17/2031 (n) | | | 593,000 | 505,918 |
| Saudi Arabian Oil Co., 3.5%, 11/24/2070 (n) | | | 3,601,000 | 2,364,056 |
| Southern Gas Corridor CJSC (Republic of Azerbaijan), 6.875%, 3/24/2026 (n) | | | 3,049,000 | 3,111,200 |
| State Oil Company of the Azerbaijan Republic, 6.95%, 3/18/2030 | | | 3,263,000 | 3,348,491 |
| State Savings Bank of Ukraine PJSC, 9.375%, 3/10/2023 | | | 294,700 | 212,368 |
| State Savings Bank of Ukraine PJSC, 9.625%, 3/20/2025 | | | 533,000 | 306,901 |
| Sweihan PV Power Co. PJSC, 3.625%, 1/31/2049 (n) | | | 997,920 | 816,965 |
| T.C. Ziraat Bankasi A.S. (Republic of Turkey), 9.5%, 8/01/2026 (n) | | | 752,000 | 739,127 |
| Uzbekneftegaz JSC (Republic of Uzbekistan), 4.75%, 11/16/2028 (n) | | | 1,236,000 | 1,027,116 |
| | | | | $78,495,426 |
| Emerging Market Sovereign – 6.0% |
| Arab Republic of Egypt, 7.6%, 3/01/2029 (n) | | $ | 1,396,000 | $1,093,975 |
| Arab Republic of Egypt, 7.903%, 2/21/2048 (n) | | | 1,492,000 | 898,008 |
| Arab Republic of Egypt, 7.903%, 2/21/2048 | | | 2,991,000 | 1,800,229 |
| Arab Republic of Egypt, 8.875%, 5/29/2050 (n) | | | 2,842,000 | 1,825,212 |
| Arab Republic of Egypt, 7.5%, 2/16/2061 (n) | | | 1,617,000 | 942,116 |
| Dominican Republic, 6%, 7/19/2028 (n) | | | 1,663,000 | 1,603,290 |
| Dominican Republic, 5.5%, 2/22/2029 (n) | | | 1,714,000 | 1,588,168 |
| Dominican Republic, 7.05%, 2/03/2031 (n) | | | 764,000 | 762,709 |
| Dominican Republic, 4.875%, 9/23/2032 (n) | | | 1,192,000 | 996,308 |
| Dominican Republic, 6%, 2/22/2033 (n) | | | 2,048,000 | 1,853,376 |
| Dominican Republic, 5.3%, 1/21/2041 (n) | | | 1,002,000 | 783,722 |
| Dominican Republic, 5.875%, 1/30/2060 (n) | | | 2,282,000 | 1,710,345 |
| Dominican Republic, 5.875%, 1/30/2060 | | | 2,407,000 | 1,804,031 |
| Emirate of Sharjah, 6.5%, 11/23/2032 (n) | | | 518,000 | 521,885 |
| Federal Republic of Nigeria, 6.125%, 9/28/2028 (n) | | | 1,457,000 | 1,154,498 |
| Federal Republic of Nigeria, 7.375%, 9/28/2033 (n) | | | 1,839,000 | 1,336,390 |
| Federal Republic of Nigeria, 7.696%, 2/23/2038 | | | 969,000 | 675,219 |
| Federative Republic of Brazil, 4.75%, 1/14/2050 | | | 1,053,000 | 753,131 |
| Government of Ukraine, 7.75%, 9/01/2028 (a) | | | 1,262,000 | 235,679 |
| Government of Ukraine, 4.375%, 1/27/2030 (a)(n) | | EUR | 1,074,000 | 187,435 |
Portfolio of Investments – continued
| Issuer | | | Shares/Par | Value ($) |
| Bonds – continued |
| Emerging Market Sovereign – continued |
| Government of Ukraine, 6.876%, 5/21/2031 (a) | | $ | 598,000 | $100,763 |
| Government of Ukraine, 7.253%, (7.253% cash or 7.253% PIK) 3/15/2035 (a)(p) | | | 3,089,000 | 524,744 |
| Government of Ukraine, GDP Linked Bond, 0%, 5/31/2040 (a) | | | 2,068,000 | 559,394 |
| Hashemite Kingdom of Jordan, 7.75%, 1/15/2028 (n) | | | 817,000 | 837,588 |
| Hashemite Kingdom of Jordan, 5.85%, 7/07/2030 (n) | | | 2,432,000 | 2,191,718 |
| Hashemite Kingdom of Jordan, 7.375%, 10/10/2047 | | | 3,663,000 | 3,199,557 |
| Islamic Republic of Pakistan, 6%, 4/08/2026 (n) | | | 1,550,000 | 689,750 |
| Islamic Republic of Pakistan, 8.875%, 4/08/2051 (n) | | | 1,504,000 | 609,625 |
| Kingdom of Saudi Arabia, 4.875%, 7/18/2033 (n) | | | 603,000 | 593,020 |
| Kingdom of Saudi Arabia, 4.5%, 10/26/2046 | | | 2,723,000 | 2,344,590 |
| Kingdom of Saudi Arabia, 4.625%, 10/04/2047 | | | 3,863,000 | 3,375,296 |
| Kingdom of Saudi Arabia, 5.25%, 1/16/2050 | | | 1,032,000 | 983,969 |
| Kingdom of Saudi Arabia, 3.25%, 11/17/2051 (n) | | | 2,103,000 | 1,445,981 |
| Kingdom of Saudi Arabia, 5%, 1/18/2053 (n) | | | 872,000 | 795,700 |
| Oriental Republic of Uruguay, 8.25%, 5/21/2031 | | UYU | 89,988,000 | 2,090,421 |
| Oriental Republic of Uruguay, 5.75%, 10/28/2034 | | $ | 1,729,000 | 1,858,583 |
| Oriental Republic of Uruguay, 4.975%, 4/20/2055 | | | 1,300,000 | 1,239,051 |
| Republic of Angola, 8.75%, 4/14/2032 (n) | | | 1,899,000 | 1,704,637 |
| Republic of Angola, 9.375%, 5/08/2048 | | | 2,905,000 | 2,470,122 |
| Republic of Angola, 9.125%, 11/26/2049 | | | 3,425,000 | 2,877,000 |
| Republic of Argentina, 3.875%, 1/09/2038 | | | 8,097,000 | 2,832,275 |
| Republic of Argentina, 3.5%, 7/09/2041 | | | 11,085,000 | 3,480,928 |
| Republic of Cameroon, 5.95%, 7/07/2032 | | EUR | 1,136,000 | 900,019 |
| Republic of Chile, 2.55%, 1/27/2032 | | $ | 997,000 | 817,342 |
| Republic of Chile, 4%, 1/31/2052 | | | 1,103,000 | 855,283 |
| Republic of Colombia, 8%, 4/20/2033 | | | 1,186,000 | 1,170,995 |
| Republic of Colombia, 5.2%, 5/15/2049 | | | 613,000 | 405,102 |
| Republic of Costa Rica, 7.158%, 3/12/2045 | | | 958,000 | 928,413 |
| Republic of Cote d'Ivoire, 4.875%, 1/30/2032 (n) | | EUR | 1,724,000 | 1,392,442 |
| Republic of Cote d'Ivoire, 6.875%, 10/17/2040 (n) | | | 2,193,000 | 1,711,488 |
| Republic of Cote d'Ivoire, 6.625%, 3/22/2048 (n) | | | 602,000 | 442,276 |
| Republic of Ecuador, 2.5%, 7/31/2035 (n) | | $ | 1,794,406 | 632,451 |
| Republic of Ecuador, 2.5%, 7/31/2035 | | | 1,175,000 | 414,137 |
| Republic of Ecuador, 1.5%, 7/31/2040 (n) | | | 1,683,765 | 525,919 |
| Republic of Ecuador, 1.5%, 7/31/2040 | | | 3,713,000 | 1,159,745 |
| Republic of Gabon, 7%, 11/24/2031 (n) | | | 1,694,000 | 1,376,375 |
| Republic of Ghana, 7.75%, 4/07/2029 (a)(n) | | | 982,000 | 365,795 |
| Republic of Ghana, 7.875%, 2/11/2035 (a) | | | 2,325,000 | 854,159 |
| Republic of Guatemala, 3.7%, 10/07/2033 (n) | | | 1,018,000 | 837,345 |
| Republic of Guatemala, 4.65%, 10/07/2041 (n) | | | 808,000 | 654,927 |
| Republic of Guatemala, 6.125%, 6/01/2050 | | | 1,673,000 | 1,582,682 |
Portfolio of Investments – continued
| Issuer | | | Shares/Par | Value ($) |
| Bonds – continued |
| Emerging Market Sovereign – continued |
| Republic of Hungary, 6.125%, 5/22/2028 (n) | | $ | 951,000 | $965,417 |
| Republic of Hungary, 6.25%, 9/22/2032 (n) | | | 1,389,000 | 1,409,835 |
| Republic of Hungary, 5.5%, 6/16/2034 (n) | | | 2,223,000 | 2,134,151 |
| Republic of Hungary, 6.75%, 9/25/2052 (n) | | | 1,056,000 | 1,081,635 |
| Republic of Indonesia, 4.65%, 9/20/2032 | | | 1,032,000 | 1,004,410 |
| Republic of Indonesia, 1.1%, 3/12/2033 | | EUR | 1,082,000 | 835,298 |
| Republic of Indonesia, 5.125%, 1/15/2045 | | $ | 816,000 | 795,681 |
| Republic of Indonesia, 4.35%, 1/11/2048 | | | 2,767,000 | 2,422,608 |
| Republic of Indonesia, 5.45%, 9/20/2052 | | | 644,000 | 638,365 |
| Republic of Indonesia, 5.65%, 1/11/2053 | | | 833,000 | 847,001 |
| Republic of Kazakhstan, 6.5%, 7/21/2045 | | | 1,362,000 | 1,442,086 |
| Republic of Kenya, 8%, 5/22/2032 | | | 2,864,000 | 2,441,045 |
| Republic of Kenya, 8.25%, 2/28/2048 | | | 728,000 | 561,623 |
| Republic of Panama, 3.362%, 6/30/2031 (n) | | | 1,539,000 | 1,269,675 |
| Republic of Panama, 6.4%, 2/14/2035 | | | 1,081,000 | 1,113,639 |
| Republic of Paraguay, 3.849%, 6/28/2033 (n) | | | 612,000 | 515,764 |
| Republic of Paraguay, 6.1%, 8/11/2044 | | | 1,400,000 | 1,319,996 |
| Republic of Paraguay, 5.6%, 3/13/2048 | | | 2,372,000 | 2,039,176 |
| Republic of Paraguay, 5.4%, 3/30/2050 (n) | | | 1,944,000 | 1,627,807 |
| Republic of Peru, 2.783%, 1/23/2031 | | | 708,000 | 582,620 |
| Republic of Peru, 1.862%, 12/01/2032 | | | 545,000 | 394,647 |
| Republic of Philippines, 5.609%, 4/13/2033 | | | 701,000 | 722,360 |
| Republic of Philippines, 5%, 7/17/2033 | | | 1,231,000 | 1,220,497 |
| Republic of Philippines, 5.5%, 1/17/2048 | | | 840,000 | 848,886 |
| Republic of Poland, 5.75%, 11/16/2032 | | | 1,038,000 | 1,086,869 |
| Republic of Romania, 6.625%, 2/17/2028 (n) | | | 1,032,000 | 1,053,672 |
| Republic of Romania, 1.75%, 7/13/2030 (n) | | EUR | 1,556,000 | 1,188,912 |
| Republic of Romania, 2%, 1/28/2032 (n) | | | 1,241,000 | 913,705 |
| Republic of Romania, 2%, 1/28/2032 | | | 1,150,000 | 846,705 |
| Republic of Romania, 7.125%, 1/17/2033 (n) | | $ | 1,186,000 | 1,240,912 |
| Republic of Romania, 2.625%, 12/02/2040 (n) | | EUR | 602,000 | 359,291 |
| Republic of Romania, 2.75%, 4/14/2041 (n) | | | 611,000 | 369,076 |
| Republic of Senegal, 6.75%, 3/13/2048 | | $ | 1,061,000 | 743,782 |
| Republic of Serbia, 6.25%, 5/26/2028 (n) | | | 1,236,000 | 1,233,034 |
| Republic of Serbia, 6.5%, 9/26/2033 (n) | | | 719,000 | 698,509 |
| Republic of Serbia, 2.05%, 9/23/2036 (n) | | EUR | 954,000 | 587,769 |
| Republic of South Africa, 5.75%, 9/30/2049 | | $ | 3,173,000 | 2,308,358 |
| Republic of South Africa, 7.3%, 4/20/2052 | | | 2,881,000 | 2,481,261 |
| Republic of Sri Lanka, 6.125%, 6/03/2025 (a) | | | 4,379,000 | 1,654,991 |
| Republic of Sri Lanka, 7.55%, 3/28/2030 (a) | | | 2,892,000 | 1,042,856 |
| Republic of Turkey, 9.875%, 1/15/2028 | | | 994,000 | 1,007,558 |
| Republic of Turkey, 9.375%, 1/19/2033 | | | 1,048,000 | 1,011,404 |
| Republic of Turkey, 5.75%, 5/11/2047 | | | 1,220,000 | 816,348 |
Portfolio of Investments – continued
| Issuer | | | Shares/Par | Value ($) |
| Bonds – continued |
| Emerging Market Sovereign – continued |
| Republic of Zambia, 8.97%, 7/30/2027 (a)(d) | | $ | 1,909,000 | $857,905 |
| Socialist Republic of Vietnam, 4.8%, 11/19/2024 | | | 1,088,000 | 1,067,924 |
| State of Qatar, 5.103%, 4/23/2048 (n) | | | 1,215,000 | 1,197,409 |
| State of Qatar, 4.817%, 3/14/2049 (n) | | | 1,236,000 | 1,174,200 |
| State of Qatar, 4.817%, 3/14/2049 | | | 619,000 | 588,050 |
| State of Qatar, 4.4%, 4/16/2050 (n) | | | 652,000 | 583,670 |
| Sultanate of Oman, 6.5%, 3/08/2047 | | | 2,434,000 | 2,262,306 |
| Sultanate of Oman, 6.75%, 1/17/2048 | | | 4,130,000 | 3,949,147 |
| Sultanate of Oman, 7%, 1/25/2051 (n) | | | 3,249,000 | 3,202,422 |
| Sultanate of Oman, 7%, 1/25/2051 | | | 3,459,000 | 3,409,412 |
| United Arab Emirates, 4.951%, 7/07/2052 (n) | | | 2,155,000 | 2,088,540 |
| United Mexican States, 5.75%, 3/05/2026 | | MXN | 17,400,000 | 837,918 |
| United Mexican States, 7.5%, 6/03/2027 | | | 16,400,000 | 826,727 |
| United Mexican States, 5.4%, 2/09/2028 | | $ | 634,000 | 636,196 |
| United Mexican States, 7.75%, 5/29/2031 | | MXN | 24,900,000 | 1,244,775 |
| United Mexican States, 4.875%, 5/19/2033 | | $ | 1,282,000 | 1,189,892 |
| United Mexican States, 3.5%, 2/12/2034 | | | 1,435,000 | 1,168,741 |
| United Mexican States, 4.28%, 8/14/2041 | | | 972,000 | 774,250 |
| United Mexican States, 4.5%, 1/31/2050 | | | 2,754,000 | 2,157,740 |
| United Mexican States, 4.4%, 2/12/2052 | | | 1,036,000 | 784,434 |
| | | | | $155,238,225 |
| Energy - Independent – 0.8% |
| Energean PLC, 6.5%, 4/30/2027 (n) | | $ | 1,565,000 | $1,439,293 |
| EQT Corp., 3.625%, 5/15/2031 (n) | | | 2,977,000 | 2,498,447 |
| Hess Corp., 5.8%, 4/01/2047 | | | 2,385,000 | 2,254,567 |
| Leviathan Bond Ltd., 6.75%, 6/30/2030 (n) | | | 2,841,000 | 2,649,165 |
| Medco Bell Pte. Ltd., 6.375%, 1/30/2027 (n) | | | 1,146,000 | 1,050,077 |
| Medco Laurel Tree Pte. Ltd., 6.95%, 11/12/2028 (n) | | | 1,636,000 | 1,487,436 |
| Pioneer Natural Resources Co., 1.9%, 8/15/2030 | | | 2,149,000 | 1,674,789 |
| Sierracol Energy Andina LLC, 6%, 6/15/2028 (n) | | | 1,240,000 | 970,662 |
| Tengizchevroil Finance Co. International Ltd., 4%, 8/15/2026 (n) | | | 2,119,000 | 1,866,415 |
| Tengizchevroil Finance Co. International Ltd., 3.25%, 8/15/2030 (n) | | | 4,736,000 | 3,572,128 |
| | | | | $19,462,979 |
| Energy - Integrated – 0.2% |
| BP Capital Markets America, Inc., 1.749%, 8/10/2030 | | $ | 1,672,000 | $1,338,774 |
| BP Capital Markets America, Inc., 4.812%, 2/13/2033 | | | 1,140,000 | 1,119,777 |
| BP Capital Markets America, Inc., 3.001%, 3/17/2052 | | | 1,301,000 | 873,520 |
| Eni S.p.A., 4.75%, 9/12/2028 (n) | | | 1,818,000 | 1,771,782 |
Portfolio of Investments – continued
| Issuer | | | Shares/Par | Value ($) |
| Bonds – continued |
| Energy - Integrated – continued |
| Eni S.p.A., 4.25%, 5/09/2029 (n) | | $ | 976,000 | $899,808 |
| | | | | $6,003,661 |
| Financial Institutions – 0.5% |
| AerCap Ireland Capital DAC/AerCap Global Aviation Trust, 3.65%, 7/21/2027 | | $ | 1,425,000 | $1,290,612 |
| AerCap Ireland Capital DAC/AerCap Global Aviation Trust, 3.3%, 1/30/2032 | | | 2,323,000 | 1,858,953 |
| Air Lease Corp., 2.875%, 1/15/2032 | | | 1,362,000 | 1,069,241 |
| Avolon Holdings Funding Ltd., 4.25%, 4/15/2026 (n) | | | 909,000 | 843,548 |
| Avolon Holdings Funding Ltd., 4.375%, 5/01/2026 (n) | | | 855,000 | 795,394 |
| Avolon Holdings Funding Ltd., 2.75%, 2/21/2028 (n) | | | 1,636,000 | 1,366,006 |
| Muthoot Finance Ltd., 4.4%, 9/02/2023 (n) | | | 2,255,000 | 2,215,537 |
| Shriram Transport Finance Co. Ltd., 4.4%, 3/13/2024 (n) | | | 2,049,000 | 1,982,407 |
| Sunac China Holdings Ltd., 7.5%, 2/01/2024 (a)(d) | | | 1,792,000 | 469,585 |
| Times China Holdings Ltd., 6.75%, 7/08/2025 (a) | | | 1,256,000 | 200,105 |
| | | | | $12,091,388 |
| Food & Beverages – 0.9% |
| Agrosuper S.A., 4.6%, 1/20/2032 (n) | | $ | 610,000 | $519,964 |
| Anheuser-Busch InBev Worldwide, Inc., 5.55%, 1/23/2049 | | | 2,533,000 | 2,548,606 |
| Aragvi Finance International DAC, 8.45%, 4/29/2026 (n) | | | 1,588,000 | 1,124,368 |
| Bacardi Ltd., 5.15%, 5/15/2038 (n) | | | 1,036,000 | 963,184 |
| Central America Bottling Co., 5.25%, 4/27/2029 (n) | | | 2,121,000 | 1,952,635 |
| Compania Cervecerias Unidas S.A., 3.35%, 1/19/2032 (n) | | | 1,439,000 | 1,192,211 |
| Constellation Brands, Inc., 2.25%, 8/01/2031 | | | 1,839,000 | 1,447,942 |
| Constellation Brands, Inc., 4.1%, 2/15/2048 | | | 3,081,000 | 2,430,107 |
| Grupo Bimbo S.A.B. de C.V., 5.95% to 7/17/2023, FLR (CMT - 5yr. + 3.28%) to 7/17/2028, FLR (CMT - 5yr. + 3.53%) to 7/17/2043, FLR (CMT - 5yr. + 4.28%) to 7/17/2171 | | | 1,248,000 | 1,244,980 |
| JBS USA Lux S.A./JBS USA Food Co./JBS USA Finance, Inc., 3%, 2/02/2029 (n) | | | 1,065,000 | 885,711 |
| JBS USA Lux S.A./JBS USA Food Co./JBS USA Finance, Inc., 3.625%, 1/15/2032 (n) | | | 1,557,000 | 1,247,188 |
| JBS USA Lux S.A./JBS USA Food Co./JBS USA Finance, Inc., 5.75%, 4/01/2033 (n) | | | 894,000 | 833,852 |
| Kraft Heinz Foods Co., 4.875%, 10/01/2049 | | | 816,000 | 719,340 |
| Kraft Heinz Foods Co., 5.5%, 6/01/2050 | | | 1,419,000 | 1,360,715 |
| PT Indofood CBP Sukses Makmur Tbk, 3.398%, 6/09/2031 | | | 1,243,000 | 1,018,098 |
| PT Indofood CBP Sukses Makmur Tbk, 4.805%, 4/27/2052 | | | 1,637,000 | 1,198,406 |
| SYSCO Corp., 2.45%, 12/14/2031 | | | 2,369,000 | 1,905,948 |
| SYSCO Corp., 4.45%, 3/15/2048 | | | 1,219,000 | 1,006,493 |
| | | | | $23,599,748 |
Portfolio of Investments – continued
| Issuer | | | Shares/Par | Value ($) |
| Bonds – continued |
| Gaming & Lodging – 0.2% |
| GENM Capital Labuan Ltd., 3.882%, 4/19/2031 (n) | | $ | 803,000 | $623,495 |
| Marriott International, Inc., 2.85%, 4/15/2031 | | | 2,566,000 | 2,116,473 |
| Marriott International, Inc., 3.5%, 10/15/2032 | | | 2,052,000 | 1,737,015 |
| VICI Properties LP / VICI Note Co., Inc., 4.25%, 12/01/2026 (n) | | | 264,000 | 244,821 |
| VICI Properties LP, REIT, 4.75%, 2/15/2028 | | | 1,316,000 | 1,241,422 |
| | | | | $5,963,226 |
| Industrial – 0.1% |
| Dar Al-Arkan Sukuk Co. Ltd., 6.875%, 2/26/2027 | | $ | 798,000 | $788,663 |
| GEMS Menasa Cayman Ltd./GEMS Education Delaware LLC, 7.125%, 7/31/2026 (n) | | | 627,000 | 612,690 |
| Howard University, Washington D.C., AGM, 2.416%, 10/01/2024 | | | 230,000 | 219,499 |
| Howard University, Washington D.C., AGM, 2.516%, 10/01/2025 | | | 285,000 | 264,306 |
| Trustees of the University of Pennsylvania, 2.396%, 10/01/2050 | | | 2,127,000 | 1,383,510 |
| | | | | $3,268,668 |
| Insurance – 0.3% |
| AIA Group Ltd., 5.625%, 10/25/2027 (n) | | $ | 896,000 | $917,112 |
| Corebridge Financial, Inc., 3.9%, 4/05/2032 (n) | | | 2,080,000 | 1,820,024 |
| Corebridge Financial, Inc., 4.35%, 4/05/2042 (n) | | | 2,580,000 | 2,126,578 |
| Equitable Holdings, Inc., 5.594%, 1/11/2033 | | | 2,538,000 | 2,516,259 |
| | | | | $7,379,973 |
| Insurance - Health – 0.3% |
| Humana, Inc., 2.15%, 2/03/2032 | | $ | 1,951,000 | $1,506,239 |
| Humana, Inc., 4.95%, 10/01/2044 | | | 2,242,000 | 2,010,009 |
| Humana, Inc., 5.5%, 3/15/2053 | | | 269,000 | 259,753 |
| UnitedHealth Group, Inc., 5.3%, 2/15/2030 | | | 1,215,000 | 1,232,891 |
| UnitedHealth Group, Inc., 2.3%, 5/15/2031 | | | 1,986,000 | 1,637,016 |
| UnitedHealth Group, Inc., 4.625%, 7/15/2035 | | | 444,000 | 425,358 |
| UnitedHealth Group, Inc., 5.875%, 2/15/2053 | | | 971,000 | 1,047,429 |
| | | | | $8,118,695 |
| Insurance - Property & Casualty – 0.2% |
| Aon Corp./Aon Global Holdings PLC, 2.05%, 8/23/2031 | | $ | 3,843,000 | $3,019,508 |
| Aon Corp./Aon Global Holdings PLC, 2.6%, 12/02/2031 | | | 187,000 | 152,400 |
| Fairfax Financial Holdings Ltd., 5.625%, 8/16/2032 (n) | | | 3,206,000 | 3,047,695 |
| | | | | $6,219,603 |
Portfolio of Investments – continued
| Issuer | | | Shares/Par | Value ($) |
| Bonds – continued |
| International Market Quasi-Sovereign – 0.0% |
| Ontario Teachers' Cadillac Fairview Properties, 2.5%, 10/15/2031 (n) | | $ | 1,158,000 | $888,929 |
| International Market Sovereign – 0.2% |
| Government of Bermuda, 5%, 7/15/2032 (n) | | $ | 3,115,000 | $3,028,667 |
| Government of Bermuda, 3.375%, 8/20/2050 (n) | | | 2,322,000 | 1,602,191 |
| | | | | $4,630,858 |
| Machinery & Tools – 0.2% |
| Ashtead Capital, Inc., 5.55%, 5/30/2033 (n) | | $ | 1,339,000 | $1,283,074 |
| CNH Industrial N.V., 3.85%, 11/15/2027 | | | 3,018,000 | 2,860,605 |
| | | | | $4,143,679 |
| Major Banks – 3.6% |
| Australia and New Zealand Banking Group Ltd., 2.57% to 11/25/2030, FLR (CMT - 5yr. + 1.7%) to 11/25/2035 (n) | | $ | 2,249,000 | $1,715,041 |
| Banco Mercantil del Norte S.A., 6.625% to 1/24/2032, FLR (CMT - 10yr. + 5.034%) to 1/24/2171 | | | 1,055,000 | 906,772 |
| Bank of America Corp., 3.366% to 1/23/2025, FLR (LIBOR - 3mo. + 0.81%) to 1/23/2026 | | | 3,238,000 | 3,099,491 |
| Bank of America Corp., 3.419% to 12/20/2027, FLR (LIBOR - 3mo. + 1.04%) to 12/20/2028 | | | 3,227,000 | 2,937,163 |
| Bank of America Corp., 2.496% to 2/13/2030, FLR (LIBOR - 3mo. + 0.99%) to 2/13/2031 | | | 505,000 | 416,436 |
| Bank of America Corp., 2.687% to 4/22/2031, FLR (SOFR - 1 day + 1.32%) to 4/22/2032 | | | 4,771,000 | 3,869,445 |
| Bank of New York Mellon Corp., 5.802% to 10/25/2027, FLR (SOFR - 1 day + 1.802%) to 10/25/2028 | | | 1,707,000 | 1,748,649 |
| Bank of New York Mellon Corp., 5.834% to 10/25/2032, FLR (SOFR - 1 day + 2.074%) to 10/25/2033 | | | 1,281,000 | 1,333,935 |
| Barclays PLC, 2.894% to 11/24/2031, FLR (CMT - 1yr. + 1.3%) to 11/24/2032 | | | 3,578,000 | 2,778,066 |
| Commonwealth Bank of Australia, 3.61% to 9/12/2029, FLR (CMT - 1yr. + 2.05%) to 9/12/2034 (n) | | | 1,818,000 | 1,535,315 |
| Commonwealth Bank of Australia, 3.305%, 3/11/2041 (n) | | | 2,351,000 | 1,657,523 |
| Credit Agricole S.A., 1.247% to 1/26/2026, FLR (SOFR - 1 day + 0.89162%) to 1/26/2027 (n) | | | 3,272,000 | 2,887,827 |
| Goldman Sachs Group, Inc., 2.64% to 2/24/2027, FLR (SOFR - 1 day + 1.114%) to 2/24/2028 | | | 3,267,000 | 2,919,375 |
| Goldman Sachs Group, Inc., 3.102% to 2/24/2032, FLR (SOFR - 1 day + 1.41%) to 2/24/2033 | | | 1,036,000 | 853,937 |
| HSBC Holdings PLC, 2.099% to 6/04/2025, FLR (SOFR - 1 day + 1.929%) to 6/04/2026 | | | 3,837,000 | 3,530,951 |
Portfolio of Investments – continued
| Issuer | | | Shares/Par | Value ($) |
| Bonds – continued |
| Major Banks – continued |
| HSBC Holdings PLC, 2.357% to 8/18/2030, FLR (SOFR - 1 day + 1.947%) to 8/18/2031 | | $ | 3,604,000 | $2,845,831 |
| JPMorgan Chase & Co., 3.782% to 2/01/2027, FLR (LIBOR - 3mo. + 1.337%) to 2/01/2028 | | | 2,435,000 | 2,287,690 |
| JPMorgan Chase & Co., 2.545% to 11/08/2031, FLR (SOFR - 1 day + 1.18%) to 11/08/2032 | | | 5,987,000 | 4,786,830 |
| JPMorgan Chase & Co., 3.109% to 4/22/2040, FLR (SOFR - 1 day + 2.46%) to 4/22/2041 | | | 2,419,000 | 1,779,586 |
| Kasikornbank PLC (Hong Kong Branch), 3.343% to 10/02/2026, FLR (CMT - 5yr. + 1.7%) to 10/02/2031 | | | 940,000 | 826,739 |
| Mitsubishi UFJ Financial Group, Inc., 1.64% to 10/13/2026, FLR (CMT - 1yr. + 0.67%) to 10/13/2027 | | | 2,438,000 | 2,115,291 |
| Mitsubishi UFJ Financial Group, Inc., 2.494% to 10/13/2031, FLR (CMT - 1yr. + 0.97%) to 10/13/2032 | | | 6,270,000 | 4,937,090 |
| Morgan Stanley, 3.125%, 7/27/2026 | | | 4,414,000 | 4,107,628 |
| Morgan Stanley, 3.622% to 4/01/2030, FLR (SOFR - 1 day + 3.12%) to 4/01/2031 | | | 4,129,000 | 3,656,110 |
| Morgan Stanley, 3.217% to 4/22/2041, FLR (SOFR - 1 day + 1.485%) to 4/22/2042 | | | 2,137,000 | 1,588,425 |
| National Australia Bank Ltd., 3.347% to 1/12/2032, FLR (CMT - 5yr. + 1.7%) to 1/12/2037 (n) | | | 2,091,000 | 1,669,974 |
| NatWest Group PLC, 5.847% to 3/02/2026, FLR (CMT - 1yr. + 1.35%) to 3/02/2027 | | | 956,000 | 956,486 |
| NatWest Group PLC, 6.016% to 3/02/2033, FLR (CMT - 1yr. + 2.1%) to 3/02/2034 | | | 250,000 | 250,322 |
| Nordea Bank Abp, 1.5%, 9/30/2026 (n) | | | 3,606,000 | 3,136,359 |
| Oversea-Chinese Banking Corp. Ltd., 1.832% to 9/10/2025, FLR (CMT - 1yr. + 1.58%) to 9/10/2030 (n) | | | 723,000 | 654,995 |
| Oversea-Chinese Banking Corp. Ltd., 4.602%, 6/15/2032 | | | 671,000 | 649,349 |
| Royal Bank of Canada, 2.3%, 11/03/2031 | | | 4,776,000 | 3,832,405 |
| Royal Bank of Canada, 5%, 2/01/2033 | | | 2,507,000 | 2,448,903 |
| Sumitomo Mitsui Financial Group, Inc., 1.71%, 1/12/2031 | | | 2,461,000 | 1,877,830 |
| Toronto-Dominion Bank, 4.108%, 6/08/2027 | | | 1,725,000 | 1,653,468 |
| Toronto-Dominion Bank, 4.693%, 9/15/2027 | | | 1,665,000 | 1,628,641 |
| Toronto-Dominion Bank, 2%, 9/10/2031 | | | 1,949,000 | 1,531,657 |
| Toronto-Dominion Bank, 4.456%, 6/08/2032 | | | 379,000 | 356,729 |
| UBS Group AG, 3.179% to 2/11/2042, FLR (CMT - 1yr. + 1.1%) to 2/11/2043 (n) | | | 3,775,000 | 2,733,210 |
| UniCredit S.p.A., 2.569% to 9/22/2025, FLR (CMT - 1yr. + 2.3%) to 9/22/2026 (n) | | | 1,750,000 | 1,578,587 |
| UniCredit S.p.A., 1.982% to 6/03/2026, FLR (CMT - 1yr. + 1.2%) to 6/03/2027 (n) | | | 282,000 | 245,932 |
Portfolio of Investments – continued
| Issuer | | | Shares/Par | Value ($) |
| Bonds – continued |
| Major Banks – continued |
| Wells Fargo & Co., 3.908% to 4/25/2025, FLR (SOFR - 1 day + 1.32%) to 4/25/2026 | | $ | 1,496,000 | $1,442,978 |
| Wells Fargo & Co., 4.54% to 8/15/2025, FLR (SOFR - 1 day + 1.56%) to 8/15/2026 | | | 2,350,000 | 2,293,079 |
| Wells Fargo & Co., 3.35% to 3/02/2032, FLR (SOFR - 1 day + 1.5%) to 3/02/2033 | | | 2,462,000 | 2,081,630 |
| | | | | $92,143,680 |
| Medical & Health Technology & Services – 0.5% |
| Alcon Finance Corp., 2.6%, 5/27/2030 (n) | | $ | 1,260,000 | $1,059,024 |
| Alcon Finance Corp., 5.375%, 12/06/2032 (n) | | | 507,000 | 509,019 |
| Alcon, Inc., 2.75%, 9/23/2026 (n) | | | 1,818,000 | 1,666,340 |
| Becton, Dickinson and Co., 2.823%, 5/20/2030 | | | 1,871,000 | 1,600,510 |
| Becton, Dickinson and Co., 4.298%, 8/22/2032 | | | 3,123,000 | 2,901,589 |
| CVS Health Corp., 5%, 2/20/2026 | | | 1,211,000 | 1,204,332 |
| CVS Health Corp., 5.625%, 2/21/2053 | | | 1,126,000 | 1,089,702 |
| ProMedica Toledo Hospital, “B”, AGM, 5.325%, 11/15/2028 | | | 1,721,000 | 1,688,447 |
| Thermo Fisher Scientific, Inc., 2%, 10/15/2031 | | | 1,930,000 | 1,540,850 |
| Thermo Fisher Scientific, Inc., 2.8%, 10/15/2041 | | | 1,197,000 | 863,816 |
| | | | | $14,123,629 |
| Medical Equipment – 0.1% |
| Danaher Corp., 2.6%, 10/01/2050 | | $ | 4,299,000 | $2,745,216 |
| Metals & Mining – 0.4% |
| Anglo American Capital PLC, 4.5%, 3/15/2028 (n) | | $ | 1,778,000 | $1,682,091 |
| Anglo American Capital PLC, 2.875%, 3/17/2031 (n) | | | 3,799,000 | 3,109,704 |
| Antofagasta PLC, 5.625%, 5/13/2032 (n) | | | 1,059,000 | 1,025,029 |
| Ero Copper Corp., 6.5%, 2/15/2030 (n) | | | 613,000 | 515,143 |
| Glencore Funding LLC, 2.85%, 4/27/2031 (n) | | | 1,809,000 | 1,480,061 |
| Petra Diamonds US$ Treasury PLC, 10.5% (10.5% PIK/9.75% Cash to 6/30/2023), 9.75% Cash to 3/08/2026 (n)(p) | | | 1,694,753 | 1,624,232 |
| Prumo Participacoes e Investimentos S.A., 7.5%, 12/31/2031 | | | 770,268 | 734,209 |
| | | | | $10,170,469 |
| Midstream – 0.9% |
| Cheniere Corpus Christi Holdings LLC, 3.7%, 11/15/2029 | | $ | 822,000 | $740,262 |
| Enbridge, Inc., 3.4%, 8/01/2051 | | | 1,735,000 | 1,195,186 |
| Energy Transfer LP, 4%, 10/01/2027 | | | 893,000 | 832,490 |
| Energy Transfer LP, 3.75%, 5/15/2030 | | | 1,147,000 | 1,017,538 |
| Energy Transfer Partners LP, 5.15%, 3/15/2045 | | | 1,963,000 | 1,647,343 |
| Galaxy Pipeline Assets Bidco Ltd., 1.75%, 9/30/2027 (n) | | | 2,330,411 | 2,147,403 |
Portfolio of Investments – continued
| Issuer | | | Shares/Par | Value ($) |
| Bonds – continued |
| Midstream – continued |
| Galaxy Pipeline Assets Bidco Ltd., 2.625%, 3/31/2036 (n) | | $ | 1,010,000 | $798,220 |
| Galaxy Pipeline Assets Bidco Ltd., 2.94%, 9/30/2040 (n) | | | 1,719,457 | 1,353,468 |
| Galaxy Pipeline Assets Bidco Ltd., 3.25%, 9/30/2040 (n) | | | 1,589,000 | 1,208,773 |
| Peru LNG, 5.375%, 3/22/2030 | | | 1,254,000 | 1,006,623 |
| Plains All American Pipeline LP/PAA Finance Corp., 3.55%, 12/15/2029 | | | 1,827,000 | 1,584,144 |
| Plains All American Pipeline LP/PAA Finance Corp., 4.3%, 1/31/2043 | | | 1,810,000 | 1,326,470 |
| Sabine Pass Liquefaction LLC, 4.2%, 3/15/2028 | | | 3,055,000 | 2,867,798 |
| Sabine Pass Liquefaction LLC, 4.5%, 5/15/2030 | | | 1,798,000 | 1,684,264 |
| Targa Resources Corp., 4.2%, 2/01/2033 | | | 2,118,000 | 1,844,009 |
| Targa Resources Corp., 4.95%, 4/15/2052 | | | 2,512,000 | 2,009,307 |
| | | | | $23,263,298 |
| Mortgage-Backed – 7.1% | |
| Fannie Mae, 5%, 7/01/2023 - 3/01/2042 | | $ | 2,688,380 | $2,707,302 |
| Fannie Mae, 4.5%, 5/01/2025 - 11/01/2042 | | | 1,382,675 | 1,372,585 |
| Fannie Mae, 3%, 11/01/2028 - 9/01/2046 | | | 6,726,605 | 6,264,851 |
| Fannie Mae, 2.5%, 11/01/2031 - 10/01/2046 | | | 575,436 | 505,783 |
| Fannie Mae, 3.5%, 12/25/2031 - 2/25/2036 (i) | | | 479,955 | 45,446 |
| Fannie Mae, 6.5%, 1/01/2033 - 10/01/2037 | | | 39,157 | 40,296 |
| Fannie Mae, 3%, 2/25/2033 (i) | | | 640,190 | 57,838 |
| Fannie Mae, 5.5%, 5/01/2033 - 5/01/2044 | | | 2,557,707 | 2,614,097 |
| Fannie Mae, 6%, 8/01/2034 - 6/01/2038 | | | 134,529 | 137,917 |
| Fannie Mae, 3.5%, 4/25/2040 - 12/01/2047 | | | 2,301,414 | 2,157,065 |
| Fannie Mae, 4%, 9/01/2040 - 7/01/2043 | | | 3,659,598 | 3,516,727 |
| Fannie Mae, 2%, 10/25/2040 - 5/25/2044 | | | 123,281 | 119,067 |
| Fannie Mae, UMBS, 2.5%, 11/01/2036 - 6/01/2052 | | | 31,165,658 | 26,691,249 |
| Fannie Mae, UMBS, 2%, 5/01/2037 - 9/01/2052 | | | 17,277,854 | 14,444,237 |
| Fannie Mae, UMBS, 1.5%, 2/01/2042 - 7/01/2051 | | | 1,541,566 | 1,194,822 |
| Fannie Mae, UMBS, 5.5%, 5/01/2044 - 11/01/2052 | | | 1,423,037 | 1,433,267 |
| Fannie Mae, UMBS, 3.5%, 5/01/2049 - 7/01/2052 | | | 792,168 | 732,177 |
| Fannie Mae, UMBS, 3%, 7/01/2050 - 11/01/2052 | | | 5,831,501 | 5,144,854 |
| Fannie Mae, UMBS, 4%, 5/01/2052 - 9/01/2052 | | | 1,996,619 | 1,879,750 |
| Fannie Mae, UMBS, 4.5%, 7/01/2052 - 9/01/2052 | | | 459,989 | 444,723 |
| Fannie Mae, UMBS, 5%, 8/01/2052 | | | 423,225 | 416,308 |
| Fannie Mae, UMBS, 6%, 2/01/2053 | | | 299,699 | 314,107 |
| Freddie Mac, 5%, 4/01/2023 - 12/01/2044 | | | 1,426,203 | 1,438,898 |
| Freddie Mac, 0.903%, 4/25/2024 (i) | | | 13,982,360 | 112,329 |
| Freddie Mac, 0.597%, 7/25/2024 (i) | | | 20,256,383 | 121,145 |
| Freddie Mac, 4.5%, 9/01/2024 - 5/01/2042 | | | 1,865,875 | 1,832,720 |
| Freddie Mac, 4%, 7/01/2025 - 4/01/2044 | | | 1,266,027 | 1,217,064 |
| Freddie Mac, 3.5%, 1/15/2027 - 10/25/2058 | | | 3,935,719 | 3,663,205 |
Portfolio of Investments – continued
| Issuer | | | Shares/Par | Value ($) |
| Bonds – continued |
| Mortgage-Backed – continued | |
| Freddie Mac, 1.368%, 3/25/2027 (i) | | $ | 2,188,000 | $106,406 |
| Freddie Mac, 0.573%, 7/25/2027 (i) | | | 44,591,502 | 933,095 |
| Freddie Mac, 0.424%, 8/25/2027 (i) | | | 33,679,164 | 546,034 |
| Freddie Mac, 0.293%, 1/25/2028 (i) | | | 60,603,603 | 807,543 |
| Freddie Mac, 0.304%, 1/25/2028 (i) | | | 26,067,922 | 357,668 |
| Freddie Mac, 0.135%, 2/25/2028 (i) | | | 77,912,390 | 547,896 |
| Freddie Mac, 2.5%, 3/15/2028 | | | 86,463 | 85,759 |
| Freddie Mac, 0.12%, 4/25/2028 (i) | | | 50,265,580 | 335,352 |
| Freddie Mac, 3%, 6/15/2028 - 10/01/2046 | | | 3,718,881 | 3,384,991 |
| Freddie Mac, 3.78%, 10/25/2028 | | | 1,350,000 | 1,292,351 |
| Freddie Mac, 4.06%, 10/25/2028 | | | 2,474,000 | 2,401,917 |
| Freddie Mac, 1.091%, 7/25/2029 (i) | | | 8,086,674 | 451,680 |
| Freddie Mac, 1.143%, 8/25/2029 (i) | | | 14,171,676 | 831,904 |
| Freddie Mac, 1.8%, 4/25/2030 (i) | | | 3,344,437 | 351,004 |
| Freddie Mac, 1.868%, 4/25/2030 (i) | | | 8,166,315 | 866,537 |
| Freddie Mac, 1.665%, 5/25/2030 (i) | | | 4,373,949 | 426,661 |
| Freddie Mac, 1.797%, 5/25/2030 (i) | | | 9,928,903 | 1,042,029 |
| Freddie Mac, 5.5%, 6/01/2030 - 9/01/2041 | | | 851,043 | 874,213 |
| Freddie Mac, 1.341%, 6/25/2030 (i) | | | 3,957,955 | 317,538 |
| Freddie Mac, 1.6%, 8/25/2030 (i) | | | 3,506,241 | 336,626 |
| Freddie Mac, 1.17%, 9/25/2030 (i) | | | 2,193,674 | 156,925 |
| Freddie Mac, 0.329%, 1/25/2031 (i) | | | 12,719,871 | 251,684 |
| Freddie Mac, 0.781%, 1/25/2031 (i) | | | 4,987,462 | 253,154 |
| Freddie Mac, 6%, 8/01/2034 - 10/01/2038 | | | 167,574 | 173,223 |
| Freddie Mac, 5.5%, 2/15/2036 (i) | | | 155,832 | 25,044 |
| Freddie Mac, 6.5%, 5/01/2037 | | | 6,010 | 6,314 |
| Freddie Mac, 4.5%, 12/15/2040 (i) | | | 47,559 | 4,123 |
| Freddie Mac, 2.92%, 6/25/2054 | | | 1,900,000 | 1,676,795 |
| Freddie Mac, 2.58%, 6/25/2055 | | | 752,286 | 645,125 |
| Freddie Mac, 3.25%, 11/25/2061 | | | 1,473,025 | 1,333,143 |
| Freddie Mac, UMBS, 2%, 4/01/2037 - 6/01/2052 | | | 17,040,010 | 14,148,267 |
| Freddie Mac, UMBS, 2.5%, 4/01/2037 - 3/01/2052 | | | 9,198,610 | 7,828,321 |
| Freddie Mac, UMBS, 3%, 3/01/2047 - 7/01/2052 | | | 6,588,553 | 5,832,811 |
| Freddie Mac, UMBS, 1.5%, 6/01/2051 - 11/01/2051 | | | 64,555 | 49,951 |
| Freddie Mac, UMBS, 3.5%, 5/01/2052 - 9/01/2052 | | | 6,883,233 | 6,271,444 |
| Freddie Mac, UMBS, 4%, 5/01/2052 - 6/01/2052 | | | 1,454,761 | 1,372,913 |
| Freddie Mac, UMBS, 6%, 10/01/2052 | | | 93,436 | 94,628 |
| Freddie Mac, UMBS, 5.5%, 12/01/2052 | | | 597,413 | 596,792 |
| Freddie Mac, UMBS, 4.5%, 1/01/2053 | | | 322,326 | 310,721 |
| Ginnie Mae, 5.5%, 5/15/2033 - 1/20/2042 | | | 134,580 | 139,051 |
| Ginnie Mae, 4.5%, 7/20/2033 - 12/20/2052 | | | 11,161,794 | 10,875,772 |
| Ginnie Mae, 5.679%, 8/20/2034 | | | 405,013 | 411,897 |
| Ginnie Mae, 4%, 5/16/2039 - 10/20/2052 | | | 4,791,017 | 4,551,193 |
Portfolio of Investments – continued
| Issuer | | | Shares/Par | Value ($) |
| Bonds – continued |
| Mortgage-Backed – continued | |
| Ginnie Mae, 3.5%, 10/20/2041 (i) | | $ | 195,425 | $9,515 |
| Ginnie Mae, 3.5%, 12/15/2041 - 11/20/2052 | | | 6,155,826 | 5,723,871 |
| Ginnie Mae, 2.5%, 6/20/2042 - 7/20/2052 | | | 9,803,117 | 8,483,956 |
| Ginnie Mae, 4%, 8/16/2042 (i) | | | 285,110 | 41,846 |
| Ginnie Mae, 3%, 4/20/2045 - 10/20/2052 | | | 7,908,708 | 7,106,230 |
| Ginnie Mae, 5%, 5/20/2049 - 11/20/2052 | | | 3,988 | 3,989 |
| Ginnie Mae, 2%, 1/20/2052 - 3/20/2052 | | | 2,201,127 | 1,845,453 |
| Ginnie Mae, 0.586%, 2/16/2059 (i) | | | 1,027,371 | 35,053 |
| Ginnie Mae, TBA, 5%, 3/15/2053 - 4/20/2053 | | | 825,000 | 815,036 |
| Ginnie Mae, TBA, 5.5%, 3/15/2053 - 4/20/2053 | | | 2,200,000 | 2,206,965 |
| Ginnie Mae, TBA, 6%, 3/15/2053 | | | 450,000 | 456,467 |
| UMBS, TBA, 6%, 3/13/2053 | | | 1,525,000 | 1,542,625 |
| UMBS, TBA, 2%, 3/25/2053 | | | 1,550,000 | 1,262,251 |
| UMBS, TBA, 2.5%, 3/25/2053 | | | 750,000 | 635,244 |
| UMBS, TBA, 5.5%, 3/25/2053 | | | 600,000 | 598,969 |
| | | | | $184,693,794 |
| Municipals – 0.2% |
| Golden State, CA, Tobacco Securitization Corp., Tobacco Settlement Rev., Taxable, “B”, 2.746%, 6/01/2034 | | $ | 855,000 | $694,245 |
| Golden State, CA, Tobacco Securitization Corp., Tobacco Settlement Rev., Taxable, “B”, 3%, 6/01/2046 | | | 730,000 | 670,070 |
| Golden State, CA, Tobacco Securitization Corp., Tobacco Settlement Rev., Taxable, “B-1”, 1.85%, 6/01/2031 | | | 155,000 | 153,690 |
| Massachusetts Educational Financing Authority, Education Loan Rev., Taxable, “A”, 2.682%, 7/01/2027 | | | 255,000 | 229,507 |
| Michigan Finance Authority Tobacco Settlement Asset-Backed Rev., Taxable (2006 Sold Tobacco Receipts), “A-1”, 2.326%, 6/01/2030 | | | 390,762 | 370,920 |
| Philadelphia, PA, School District, Taxable, “A”, AGM, 5.995%, 9/01/2030 | | | 1,210,000 | 1,272,712 |
| State of Florida, Taxable, “A”, 2.154%, 7/01/2030 | | | 936,000 | 766,291 |
| West Virginia Tobacco Settlement Financing Authority Asset-Backed Refunding, Taxable, “A-1”, 1.497%, 6/01/2024 | | | 210,000 | 199,526 |
| West Virginia Tobacco Settlement Financing Authority Asset-Backed Refunding, Taxable, “A-1”, 1.647%, 6/01/2025 | | | 175,000 | 160,340 |
| | | | | $4,517,301 |
| Natural Gas - Distribution – 0.0% |
| NiSource, Inc., 5.65%, 2/01/2045 | | $ | 295,000 | $289,406 |
Portfolio of Investments – continued
| Issuer | | | Shares/Par | Value ($) |
| Bonds – continued |
| Natural Gas - Pipeline – 0.1% |
| APA Infrastructure Ltd., 5%, 3/23/2035 (n) | | $ | 1,605,000 | $1,478,138 |
| Network & Telecom – 0.1% |
| AT&T, Inc., 2.75%, 6/01/2031 | | $ | 775,000 | $640,235 |
| AT&T, Inc., 3.55%, 9/15/2055 | | | 633,000 | 428,796 |
| Total Play Telecomunicaciones S.A. de C.V., 6.375%, 9/20/2028 (n) | | | 1,574,000 | 1,223,628 |
| | | | | $2,292,659 |
| Oil Services – 0.0% |
| Acu Petroleo Luxembourg S.à r.l., 7.5%, 1/13/2032 (n) | | $ | 625,150 | $563,573 |
| MV24 Capital B.V., 6.748%, 6/01/2034 | | | 424,824 | 381,332 |
| | | | | $944,905 |
| Oils – 0.0% |
| Puma International Financing S.A., 5%, 1/24/2026 | | $ | 1,210,000 | $1,101,099 |
| Other Banks & Diversified Financials – 0.6% |
| American Express Co., 4.989% to 5/26/2032, FLR (SOFR - 1 day + 2.255%) to 5/26/2033 | | $ | 2,417,000 | $2,316,494 |
| Banco Continental S.A.E.C.A., 2.75%, 12/10/2025 (n) | | | 1,239,000 | 1,096,515 |
| Banco GNB Sudameris S.A., 7.5% to 4/16/2026, FLR (CMT - 5yr. + 6.66%) to 4/16/2031 (n) | | | 1,456,000 | 1,214,807 |
| Banco Industrial S.A., 4.875% to 1/29/2026, FLR (CMT - 5yr. + 4.442%) to 1/29/2031 (n) | | | 1,050,000 | 980,497 |
| Bangkok Bank Public Co. Ltd., 3.466% to 9/23/2031, FLR (CMT - 5yr. + 2.15%) to 9/23/2036 (n) | | | 2,084,000 | 1,684,584 |
| Bangkok Bank Public Co. Ltd. (Hong Kong), 3.733% to 9/25/2029, FLR (CMT - 5yr. + 1.9%) to 9/25/2034 | | | 1,004,000 | 848,378 |
| BSF Finance, 5.5%, 11/23/2027 | | | 800,000 | 811,000 |
| Mizrahi Tefahot Bank Ltd., 3.077% to 4/07/2026, FLR (CMT - 5yr. + 2.25%) to 4/07/2031 (n) | | | 1,218,000 | 1,059,355 |
| United Overseas Bank Ltd., 2% to 10/14/2026, FLR (CMT - 5yr. + 1.23%) to 10/14/2031 (n) | | | 1,677,000 | 1,469,503 |
| United Overseas Bank Ltd., 3.863% to 10/07/2027, FLR (CMT - 5yr. + 1.45%) to 10/07/2032 (n) | | | 934,000 | 873,473 |
| Uzbek Industrial and Construction Bank, 5.75%, 12/02/2024 | | | 3,783,000 | 3,593,850 |
| | | | | $15,948,456 |
| Pharmaceuticals – 0.1% |
| Amgen, Inc., 5.15%, 3/02/2028 | | $ | 638,000 | $635,476 |
| Amgen, Inc., 5.25%, 3/02/2030 | | | 979,000 | 974,225 |
| AstraZeneca PLC, 1.375%, 8/06/2030 | | | 913,000 | 720,820 |
| Merck & Co., Inc., 2.75%, 12/10/2051 | | | 826,000 | 552,346 |
Portfolio of Investments – continued
| Issuer | | | Shares/Par | Value ($) |
| Bonds – continued |
| Pharmaceuticals – continued |
| Pfizer, Inc., 2.55%, 5/28/2040 | | $ | 826,000 | $596,939 |
| | | | | $3,479,806 |
| Pollution Control – 0.1% |
| Waste Connections, Inc., 4.2%, 1/15/2033 | | $ | 1,344,000 | $1,242,021 |
| Waste Management, Inc., 4.625%, 2/15/2033 | | | 1,806,000 | 1,737,961 |
| | | | | $2,979,982 |
| Railroad & Shipping – 0.0% |
| Canadian Pacific Railway Co., 3%, 12/02/2041 | | $ | 323,000 | $244,682 |
| Canadian Pacific Railway Co., 3.1%, 12/02/2051 | | | 480,000 | 327,579 |
| | | | | $572,261 |
| Real Estate - Apartment – 0.0% |
| American Homes 4 Rent LP, REIT, 2.375%, 7/15/2031 | | $ | 1,118,000 | $878,963 |
| Real Estate - Office – 0.1% |
| Corporate Office Property LP, REIT, 2%, 1/15/2029 | | $ | 2,124,000 | $1,635,021 |
| Corporate Office Property LP, REIT, 2.75%, 4/15/2031 | | | 1,544,000 | 1,162,509 |
| | | | | $2,797,530 |
| Real Estate - Other – 0.1% |
| EPR Properties, REIT, 3.6%, 11/15/2031 | | $ | 741,000 | $557,635 |
| Lexington Realty Trust Co., 2.7%, 9/15/2030 | | | 1,082,000 | 865,690 |
| Lexington Realty Trust Co., 2.375%, 10/01/2031 | | | 474,000 | 359,429 |
| W.P. Carey, Inc., REIT, 2.45%, 2/01/2032 | | | 386,000 | 305,014 |
| | | | | $2,087,768 |
| Real Estate - Retail – 0.1% |
| STORE Capital Corp., REIT, 2.75%, 11/18/2030 | | $ | 2,605,000 | $1,967,488 |
| Retailers – 0.3% |
| Alimentation Couche-Tard, Inc., 3.8%, 1/25/2050 (n) | | $ | 936,000 | $670,227 |
| Amazon.com, Inc., 3.6%, 4/13/2032 | | | 3,809,000 | 3,487,006 |
| AutoZone, Inc., 4.75%, 8/01/2032 | | | 2,321,000 | 2,214,823 |
| Grupo Axo S.A.P.I. de C.V., 5.75%, 6/08/2026 (n) | | | 1,154,000 | 1,011,654 |
| Home Depot, Inc., 3.9%, 6/15/2047 | | | 1,785,000 | 1,479,090 |
| | | | | $8,862,800 |
| Specialty Chemicals – 0.1% |
| Braskem Idesa S.A.P.I., 6.99%, 2/20/2032 | | $ | 903,000 | $628,669 |
| International Flavors & Fragrances, Inc., 1.23%, 10/01/2025 (n) | | | 414,000 | 366,675 |
| International Flavors & Fragrances, Inc., 1.832%, 10/15/2027 (n) | | | 417,000 | 349,119 |
Portfolio of Investments – continued
| Issuer | | | Shares/Par | Value ($) |
| Bonds – continued |
| Specialty Chemicals – continued |
| International Flavors & Fragrances, Inc., 2.3%, 11/01/2030 (n) | | $ | 1,606,000 | $1,240,003 |
| International Flavors & Fragrances, Inc., 3.268%, 11/15/2040 (n) | | | 1,208,000 | 828,369 |
| | | | | $3,412,835 |
| Specialty Stores – 0.1% |
| DICK'S Sporting Goods, 3.15%, 1/15/2032 | | $ | 910,000 | $718,750 |
| DICK'S Sporting Goods, 4.1%, 1/15/2052 | | | 2,272,000 | 1,508,409 |
| | | | | $2,227,159 |
| Telecommunications - Wireless – 0.6% |
| Crown Castle, Inc., REIT, 4.45%, 2/15/2026 | | $ | 1,267,000 | $1,231,919 |
| Crown Castle, Inc., REIT, 3.7%, 6/15/2026 | | | 2,254,000 | 2,133,712 |
| Millicom International Cellular S.A., 4.5%, 4/27/2031 (n) | | | 737,000 | 595,127 |
| Rogers Communications, Inc., 3.8%, 3/15/2032 (n) | | | 764,000 | 667,338 |
| Rogers Communications, Inc., 4.5%, 3/15/2042 (n) | | | 2,401,000 | 1,968,345 |
| Rogers Communications, Inc., 3.7%, 11/15/2049 | | | 1,709,000 | 1,204,802 |
| Sitios Latinoamerica, S.A.B. de C.V., 5.375%, 4/04/2032 | | | 879,000 | 777,475 |
| Telefonica Celular del Paraguay S.A., 5.875%, 4/15/2027 | | | 1,203,000 | 1,087,109 |
| T-Mobile USA, Inc., 3.5%, 4/15/2025 | | | 2,182,000 | 2,090,054 |
| VEON Holdings B.V., 4%, 4/09/2025 (n) | | | 1,444,000 | 1,198,520 |
| Vodafone Group PLC, 5.625%, 2/10/2053 | | | 1,305,000 | 1,253,872 |
| | | | | $14,208,273 |
| Tobacco – 0.1% |
| Philip Morris International, Inc., 5.625%, 11/17/2029 | | $ | 605,000 | $613,031 |
| Philip Morris International, Inc., 5.125%, 2/15/2030 | | | 1,467,000 | 1,435,999 |
| | | | | $2,049,030 |
| Transportation – 0.0% |
| Hidrovias International Finance S.à r.l., 4.95%, 2/08/2031 | | $ | 1,410,000 | $994,871 |
| Transportation - Services – 0.3% |
| Adani Ports & Special Economic Zone Ltd., 5%, 8/02/2041 (n) | | $ | 1,694,000 | $1,079,925 |
| Cliffton Ltd., 6.25%, 10/25/2025 (n) | | | 2,561,000 | 2,439,737 |
| ERAC USA Finance LLC, 3.3%, 12/01/2026 | | | 2,463,000 | 2,271,472 |
| GMR Hyderabad International Airport Ltd., 4.25%, 10/27/2027 | | | 420,000 | 364,560 |
| ICTSI Treasury B.V., 3.5%, 11/16/2031 | | | 1,309,000 | 1,088,628 |
| Royal Capital B.V., 5% to 5/05/2026, FLR (CMT - 5yr. + 7.396%) to 7/31/2070 | | | 914,000 | 880,200 |
| | | | | $8,124,522 |
Portfolio of Investments – continued
| Issuer | | | Shares/Par | Value ($) |
| Bonds – continued |
| U.S. Government Agencies and Equivalents – 0.0% |
| Small Business Administration, 5.16%, 2/01/2028 | | $ | 14,560 | $14,027 |
| Small Business Administration, 2.21%, 2/01/2033 | | | 87,239 | 78,241 |
| Small Business Administration, 2.22%, 3/01/2033 | | | 143,424 | 129,188 |
| Small Business Administration, 3.15%, 7/01/2033 | | | 178,087 | 166,774 |
| Small Business Administration, 3.16%, 8/01/2033 | | | 213,829 | 200,988 |
| Small Business Administration, 3.62%, 9/01/2033 | | | 158,712 | 151,432 |
| | | | | $740,650 |
| U.S. Treasury Obligations – 5.3% |
| U.S. Treasury Bonds, 6.375%, 8/15/2027 | | $ | 106,000 | $114,894 |
| U.S. Treasury Bonds, 5.25%, 2/15/2029 | | | 2,965,000 | 3,132,592 |
| U.S. Treasury Bonds, 1.125%, 8/15/2040 | | | 4,402,000 | 2,772,400 |
| U.S. Treasury Bonds, 1.375%, 11/15/2040 | | | 5,929,000 | 3,895,770 |
| U.S. Treasury Bonds, 2.375%, 2/15/2042 | | | 6,879,000 | 5,294,949 |
| U.S. Treasury Bonds, 2.875%, 5/15/2043 | | | 6,853,400 | 5,669,582 |
| U.S. Treasury Bonds, 2.5%, 2/15/2046 | | | 3,581,000 | 2,721,420 |
| U.S. Treasury Bonds, 2.875%, 11/15/2046 (f) | | | 7,328,000 | 5,970,889 |
| U.S. Treasury Bonds, 2.875%, 5/15/2052 | | | 2,359,000 | 1,931,708 |
| U.S. Treasury Notes, 0.125%, 7/15/2023 | | | 2,180,000 | 2,140,147 |
| U.S. Treasury Notes, 2.5%, 8/15/2023 | | | 7,225,000 | 7,142,025 |
| U.S. Treasury Notes, 0.375%, 10/31/2023 | | | 11,653,300 | 11,295,507 |
| U.S. Treasury Notes, 0.875%, 1/31/2024 | | | 7,753,600 | 7,458,903 |
| U.S. Treasury Notes, 2.75%, 2/15/2024 | | | 7,855,000 | 7,678,876 |
| U.S. Treasury Notes, 2.5%, 5/15/2024 | | | 4,680,000 | 4,536,127 |
| U.S. Treasury Notes, 3%, 6/30/2024 | | | 12,564,000 | 12,224,379 |
| U.S. Treasury Notes, 4.25%, 12/31/2024 | | | 2,160,000 | 2,135,784 |
| U.S. Treasury Notes, 2.625%, 4/15/2025 | | | 6,492,000 | 6,212,540 |
| U.S. Treasury Notes, 0.875%, 9/30/2026 | | | 5,600,000 | 4,953,813 |
| U.S. Treasury Notes, 2.25%, 8/15/2027 | | | 8,936,000 | 8,214,837 |
| U.S. Treasury Notes, 2.375%, 5/15/2029 | | | 8,149,500 | 7,374,661 |
| U.S. Treasury Notes, 1.625%, 5/15/2031 | | | 4,940,000 | 4,153,074 |
| U.S. Treasury Notes, 1.875%, 2/15/2032 | | | 7,500,000 | 6,353,613 |
| U.S. Treasury Notes, 2.75%, 8/15/2032 | | | 12,028,000 | 10,930,445 |
| U.S. Treasury Notes, 3.25%, 5/15/2042 | | | 1,714,000 | 1,514,948 |
| | | | | $135,823,883 |
| Utilities - Electric Power – 2.3% |
| Adani Green Energy (UP) Ltd./Prayatna Developers Private Ltd., 6.25%, 12/10/2024 (n) | | $ | 1,238,000 | $1,166,815 |
| Adani Transmission Ltd., 4.25%, 5/21/2036 (n) | | | 2,640,625 | 1,840,783 |
| AES Gener S.A., 7.125% to 7/06/2024, FLR (Swap Rate - 5yr. + 4.644%) to 7/06/2029, FLR (Swap Rate - 5yr. + 4.894%) to 7/06/2044, FLR (Swap Rate - 5yr. + 5.644%) to 3/26/2079 | | | 1,018,000 | 969,677 |
Portfolio of Investments – continued
| Issuer | | | Shares/Par | Value ($) |
| Bonds – continued |
| Utilities - Electric Power – continued |
| AES Gener S.A., 6.35% to 4/07/2025, FLR (CMT - 5yr. + 4.917%) to 4/07/2030, FLR (CMT - 5yr. + 5.167%) to 4/07/2045, FLR (CMT - 5yr. + 5.917%) to 10/07/2079 (n) | | $ | 1,885,000 | $1,755,725 |
| AES Panama Generation Holdings SRL, 4.375%, 5/31/2030 (n) | | | 675,000 | 589,950 |
| Alabama Power Co., 3.45%, 10/01/2049 | | | 2,366,000 | 1,727,881 |
| Alfa Desarrollo S.p.A., 4.55%, 9/27/2051 (n) | | | 1,027,242 | 752,968 |
| American Electric Power Co., Inc., 2.3%, 3/01/2030 | | | 1,879,000 | 1,527,598 |
| American Electric Power Co., Inc., 5.625%, 3/01/2033 | | | 300,000 | 299,835 |
| American Transmission Systems, Inc., 2.65%, 1/15/2032 (n) | | | 305,000 | 249,934 |
| Azure Power Energy Ltd., 3.575%, 8/19/2026 (n) | | | 1,054,327 | 801,289 |
| CenterPoint Energy, Inc., 2.65%, 6/01/2031 | | | 936,000 | 767,469 |
| Clean Renewable Power (Mauritius) Pte. Ltd., 4.25%, 3/25/2027 (n) | | | 1,475,475 | 1,266,954 |
| Duke Energy Carolinas LLC, 2.85%, 3/15/2032 | | | 3,193,000 | 2,675,715 |
| Duke Energy Corp., 3.3%, 6/15/2041 | | | 2,356,000 | 1,708,924 |
| Electricidad Firme de Mexico, 4.9%, 11/20/2026 (n) | | | 967,000 | 867,999 |
| Empresa Generadora de Electricidad Haina S.A., 5.625%, 11/08/2028 (n) | | | 1,095,000 | 947,284 |
| Enel Finance International N.V., 4.625%, 6/15/2027 (n) | | | 1,080,000 | 1,036,749 |
| Enel Finance International N.V., 2.25%, 7/12/2031 (n) | | | 662,000 | 498,907 |
| Enel Finance International N.V., 7.75%, 10/14/2052 (n) | | | 1,023,000 | 1,155,791 |
| Energuate Trust, 5.875%, 5/03/2027 | | | 1,613,000 | 1,501,573 |
| EnfraGen Energia Sur S.A., 5.375%, 12/30/2030 (n) | | | 1,426,000 | 911,656 |
| Evergy, Inc., 2.9%, 9/15/2029 | | | 2,162,000 | 1,850,433 |
| FirstEnergy Corp., 2.65%, 3/01/2030 | | | 1,863,000 | 1,544,911 |
| Florida Power & Light Co., 2.85%, 4/01/2025 | | | 3,623,000 | 3,468,478 |
| Florida Power & Light Co., 3.95%, 3/01/2048 | | | 1,629,000 | 1,332,091 |
| Georgia Power Co., 4.7%, 5/15/2032 | | | 2,379,000 | 2,262,190 |
| Georgia Power Co., 5.125%, 5/15/2052 | | | 1,101,000 | 1,027,876 |
| Greenko Dutch B.V. (Republic of India), 3.85%, 3/29/2026 (n) | | | 1,139,315 | 1,003,053 |
| Greenko Wind Projects (Mauritius) Ltd., 5.5%, 4/06/2025 (n) | | | 1,322,000 | 1,242,474 |
| Investment Energy Resources Ltd., 6.25%, 4/26/2029 (n) | | | 1,219,000 | 1,090,315 |
| Jersey Central Power & Light Co., 2.75%, 3/01/2032 (n) | | | 3,045,000 | 2,486,295 |
| Mercury Chile Holdco LLC, 6.5%, 1/24/2027 (n) | | | 1,039,000 | 992,245 |
| NextEra Energy Capital Holdings, Inc., 6.051%, 3/01/2025 | | | 848,000 | 853,164 |
| NextEra Energy Capital Holdings, Inc., 2.44%, 1/15/2032 | | | 1,197,000 | 947,988 |
| NextEra Energy Capital Holdings, Inc., 3.8% to 3/15/2027, FLR (CMT - 5yr. + 2.547%) to 3/15/2082 | | | 1,583,000 | 1,352,777 |
| Pacific Gas & Electric Co., 3.25%, 2/16/2024 | | | 654,000 | 639,477 |
| Pacific Gas & Electric Co., 2.5%, 2/01/2031 | | | 1,645,000 | 1,282,004 |
Portfolio of Investments – continued
| Issuer | | | Shares/Par | Value ($) |
| Bonds – continued |
| Utilities - Electric Power – continued |
| ReNew Wind Energy AP2/ReNew Power Private Ltd., 4.5%, 7/14/2028 (n) | | $ | 1,249,000 | $1,033,391 |
| Southern California Edison Co., 4.5%, 9/01/2040 | | | 454,000 | 389,327 |
| Southern California Edison Co., 3.65%, 2/01/2050 | | | 1,318,000 | 968,221 |
| Star Energy Geothermal (Salak-Darajat) B.V., 4.85%, 10/14/2038 (n) | | | 1,119,000 | 959,878 |
| TermoCandelaria Power Ltd., 7.875%, 1/30/2029 (n) | | | 1,043,150 | 933,619 |
| Transelec S.A., 3.875%, 1/12/2029 (n) | | | 1,886,000 | 1,712,317 |
| Virginia Electric & Power Co., 2.875%, 7/15/2029 | | | 2,899,000 | 2,538,314 |
| Xcel Energy, Inc., 4.6%, 6/01/2032 | | | 1,907,000 | 1,808,292 |
| | | | | $58,740,606 |
| Utilities - Water – 0.1% |
| Aegea Finance S.à r.l., 6.75%, 5/20/2029 (n) | | $ | 1,634,000 | $1,536,503 |
| Total Bonds (Identified Cost, $1,200,189,488) | | $1,068,945,790 |
| Common Stocks – 29.4% |
| Aerospace & Defense – 0.5% | |
| General Dynamics Corp. | | 59,124 | $13,474,951 |
| Alcoholic Beverages – 0.1% | |
| Kirin Holdings Co. Ltd. | | 260,400 | $3,899,641 |
| Apparel Manufacturers – 0.1% | |
| Compagnie Financiere Richemont S.A. | | 17,548 | $2,641,006 |
| Automotive – 0.3% | |
| Magna International, Inc. | | 86,224 | $4,805,669 |
| Stellantis N.V. | | 169,566 | 2,968,959 |
| | | | | $7,774,628 |
| Biotechnology – 0.2% | |
| Biogen, Inc. (a) | | 4,642 | $1,252,690 |
| Gilead Sciences, Inc. | | 42,406 | 3,414,955 |
| | | | | $4,667,645 |
| Broadcasting – 0.3% | |
| Omnicom Group, Inc. | | 93,596 | $8,476,990 |
| Business Services – 0.1% | |
| Amdocs Ltd. | | 40,946 | $3,751,063 |
| Cable TV – 0.3% | |
| Comcast Corp., “A” | | 219,149 | $8,145,768 |
Portfolio of Investments – continued
| Issuer | | | Shares/Par | Value ($) |
| Common Stocks – continued |
| Chemicals – 0.0% | |
| Nutrien Ltd. | | 15,734 | $1,225,972 |
| Computer Software – 0.3% | |
| Microsoft Corp. | | 27,448 | $6,846,080 |
| Computer Software - Systems – 0.7% | |
| Hitachi Ltd. | | 67,700 | $3,425,897 |
| Hon Hai Precision Industry Co. Ltd. | | 1,464,000 | 4,852,853 |
| Lenovo Group Ltd. | | 2,860,000 | 2,565,088 |
| Samsung Electronics Co. Ltd. | | 77,564 | 3,552,147 |
| Seagate Technology Holdings PLC | | 41,706 | 2,692,539 |
| | | | | $17,088,524 |
| Construction – 1.7% | |
| American Homes 4 Rent, “A”, REIT | | 302,750 | $9,391,305 |
| Anhui Conch Cement Co. Ltd. | | 660,500 | 2,423,421 |
| AvalonBay Communities, Inc., REIT | | 90,803 | 15,665,333 |
| Essex Property Trust, Inc., REIT | | 69,111 | 15,761,455 |
| ICA Tenedora S.A. de C.V. (a)(u) | | 560,019 | 520,336 |
| | | | | $43,761,850 |
| Consumer Products – 0.8% | |
| Colgate-Palmolive Co. | | 111,832 | $8,197,286 |
| Kimberly-Clark Corp. | | 91,168 | 11,400,558 |
| | | | | $19,597,844 |
| Electronics – 0.7% | |
| Novatek Microelectronics Corp. | | 179,000 | $2,376,418 |
| Texas Instruments, Inc. | | 95,117 | 16,307,810 |
| | | | | $18,684,228 |
| Energy - Independent – 0.2% | |
| Coterra Energy, Inc. | | 116,003 | $2,896,595 |
| Valero Energy Corp. | | 20,850 | 2,746,571 |
| | | | | $5,643,166 |
| Energy - Integrated – 1.1% | |
| China Petroleum & Chemical Corp. | | 15,606,000 | $7,972,592 |
| Eni S.p.A. | | 416,711 | 5,891,134 |
| Exxon Mobil Corp. | | 50,479 | 5,548,147 |
| LUKOIL PJSC (a)(u) | | 17,902 | 0 |
| Suncor Energy, Inc. | | 47,375 | 1,592,245 |
| TotalEnergies SE | | 114,567 | 7,097,367 |
| | | | | $28,101,485 |
Portfolio of Investments – continued
| Issuer | | | Shares/Par | Value ($) |
| Common Stocks – continued |
| Food & Beverages – 1.1% | |
| Archer Daniels Midland Co. | | 56,003 | $4,457,839 |
| Coca-Cola FEMSA S.A.B. de C.V. | | 26,888 | 1,936,205 |
| General Mills, Inc. | | 179,421 | 14,265,763 |
| J.M. Smucker Co. | | 45,682 | 6,755,911 |
| | | | | $27,415,718 |
| Food & Drug Stores – 0.5% | |
| Albertsons Cos., Inc., “A” | | 125,226 | $2,489,493 |
| BIM Birlesik Magazalar A.S. | | 661,520 | 4,774,433 |
| Tesco PLC | | 1,827,240 | 5,604,634 |
| | | | | $12,868,560 |
| Forest & Paper Products – 0.9% | |
| Rayonier, Inc., REIT | | 304,489 | $10,224,740 |
| Weyerhaeuser Co., REIT | | 397,163 | 12,411,344 |
| | | | | $22,636,084 |
| Health Maintenance Organizations – 0.1% | |
| Cigna Group | | 6,890 | $2,012,569 |
| Insurance – 1.4% | |
| Equitable Holdings, Inc. | | 239,352 | $7,520,440 |
| Hartford Financial Services Group, Inc. | | 41,226 | 3,227,171 |
| Manulife Financial Corp. (l) | | 600,687 | 11,877,270 |
| MetLife, Inc. | | 84,553 | 6,064,987 |
| Samsung Fire & Marine Insurance Co. Ltd. | | 26,456 | 4,288,541 |
| Zurich Insurance Group AG | | 9,604 | 4,551,920 |
| | | | | $37,530,329 |
| Leisure & Toys – 0.1% | |
| Nintendo Co. Ltd. | | 44,700 | $1,682,221 |
| Machinery & Tools – 0.4% | |
| GEA Group AG | | 40,003 | $1,760,991 |
| Timken Co. | | 15,134 | 1,293,200 |
| Volvo Group | | 357,879 | 7,172,623 |
| | | | | $10,226,814 |
| Major Banks – 1.3% | |
| BNP Paribas | | 165,326 | $11,567,340 |
| DBS Group Holdings Ltd. | | 571,400 | 14,479,393 |
| Erste Group Bank AG | | 48,581 | 1,910,462 |
| Regions Financial Corp. | | 196,077 | 4,572,516 |
| State Street Corp. | | 24,984 | 2,215,581 |
| | | | | $34,745,292 |
Portfolio of Investments – continued
| Issuer | | | Shares/Par | Value ($) |
| Common Stocks – continued |
| Medical & Health Technology & Services – 0.7% | |
| Encompass Health Corp. | | 204,861 | $11,578,744 |
| McKesson Corp. | | 21,598 | 7,555,196 |
| | | | | $19,133,940 |
| Metals & Mining – 1.0% | |
| Fortescue Metals Group Ltd. | | 48,174 | $693,708 |
| Glencore PLC | | 367,142 | 2,187,549 |
| Rio Tinto PLC | | 226,719 | 15,577,135 |
| United States Steel Corp. | | 76,274 | 2,336,273 |
| Vale S.A. | | 354,600 | 5,778,772 |
| | | | | $26,573,437 |
| Natural Gas - Pipeline – 0.0% | |
| Plains GP Holdings LP | | 91,467 | $1,272,306 |
| Network & Telecom – 1.1% | |
| Equinix, Inc., REIT | | 42,056 | $28,945,883 |
| Other Banks & Diversified Financials – 0.3% | |
| China Construction Bank Corp. | | 3,939,000 | $2,408,745 |
| KB Financial Group, Inc. | | 31,508 | 1,221,508 |
| Sberbank of Russia PJSC (a)(u) | | 1,738,404 | 0 |
| SLM Corp. | | 201,920 | 2,903,609 |
| | | | | $6,533,862 |
| Pharmaceuticals – 2.8% | |
| Bayer AG | | 105,643 | $6,289,766 |
| Johnson & Johnson | | 84,313 | 12,921,810 |
| Merck & Co., Inc. | | 212,528 | 22,578,975 |
| Novartis AG | | 31,122 | 2,619,687 |
| Organon & Co. | | 269,146 | 6,591,386 |
| Pfizer, Inc. | | 96,932 | 3,932,531 |
| Roche Holding AG | | 50,514 | 14,577,380 |
| Sanofi | | 34,365 | 3,230,961 |
| | | | | $72,742,496 |
| Printing & Publishing – 0.1% | |
| Lamar Advertising Co., REIT | | 15,252 | $1,594,749 |
| Railroad & Shipping – 0.1% | |
| A.P. Moller-Maersk A/S | | 439 | $1,023,723 |
| Orient Overseas International Ltd. | | 44,000 | 706,296 |
| | | | | $1,730,019 |
Portfolio of Investments – continued
| Issuer | | | Shares/Par | Value ($) |
| Common Stocks – continued |
| Real Estate – 7.1% | |
| Alexandria Real Estate Equities, Inc., REIT | | 87,600 | $13,120,728 |
| Brixmor Property Group, Inc., REIT | | 631,050 | 14,286,972 |
| Douglas Emmett, Inc., REIT | | 159,516 | 2,253,961 |
| Equity Lifestyle Properties, Inc., REIT | | 237,766 | 16,289,349 |
| Extra Space Storage, Inc., REIT | | 115,599 | 19,033,375 |
| Farmland Partners, Inc., REIT | | 184,951 | 1,982,675 |
| National Retail Properties, Inc., REIT | | 350,070 | 15,865,172 |
| Phillips Edison & Co., REIT | | 365,990 | 12,476,599 |
| Prologis, Inc., REIT | | 262,579 | 32,402,249 |
| Simon Property Group, Inc., REIT | | 224,646 | 27,427,030 |
| Sun Communities, Inc., REIT | | 108,533 | 15,535,414 |
| Urban Edge Properties, REIT | | 755,035 | 11,627,539 |
| W.P. Carey, Inc., REIT | | 30,750 | 2,495,670 |
| | | | | $184,796,733 |
| Restaurants – 0.2% | |
| Darden Restaurants, Inc. | | 11,451 | $1,637,378 |
| Sodexo | | 21,185 | 1,966,023 |
| Texas Roadhouse, Inc. | | 19,218 | 1,951,396 |
| | | | | $5,554,797 |
| Specialty Chemicals – 0.1% | |
| Chemours Co. | | 43,331 | $1,481,054 |
| Telecommunications - Wireless – 1.2% | |
| American Tower Corp., REIT | | 23,521 | $4,657,393 |
| KDDI Corp. | | 415,800 | 12,172,735 |
| PT Telekom Indonesia | | 6,853,600 | 1,743,736 |
| SBA Communications Corp., REIT | | 44,640 | 11,577,384 |
| | | | | $30,151,248 |
| Telephone Services – 0.2% | |
| France Telecom | | 265,033 | $3,025,272 |
| Hellenic Telecommunications Organization S.A. | | 228,432 | 3,508,214 |
| | | | | $6,533,486 |
| Tobacco – 0.6% | |
| British American Tobacco PLC | | 208,033 | $7,866,059 |
| Japan Tobacco, Inc. | | 205,900 | 4,188,168 |
| Philip Morris International, Inc. | | 25,454 | 2,476,674 |
| | | | | $14,530,901 |
Portfolio of Investments – continued
| Issuer | | | Shares/Par | Value ($) |
| Common Stocks – continued |
| Utilities - Electric Power – 0.7% | |
| American Electric Power Co., Inc. | | 31,434 | $2,765,249 |
| E.ON SE | | 450,170 | 4,925,718 |
| Edison International | | 85,703 | 5,674,396 |
| Iberdrola S.A. | | 243,901 | 2,802,889 |
| Vistra Corp. | | 50,557 | 1,111,748 |
| | | | | $17,280,000 |
| Total Common Stocks (Identified Cost, $622,646,359) | | $761,753,339 |
| Preferred Stocks – 0.2% |
| Computer Software - Systems – 0.0% | | | | |
| Samsung Electronics Co. Ltd. | | 37,246 | $1,503,069 |
| Metals & Mining – 0.2% | | | | |
| Gerdau S.A. | | 822,800 | $4,499,473 |
| Total Preferred Stocks (Identified Cost, $5,616,244) | | $6,002,542 |
| Convertible Preferred Stocks – 0.1% |
| Medical Equipment – 0.1% | |
| Boston Scientific Corp., 5.5% (Identified Cost, $3,372,789) | | 30,481 | $3,467,823 |
| Investment Companies (h) – 28.7% |
| Mutual Funds – 22.8% |
| MFS High Yield Pooled Portfolio (v) | | | 74,857,752 | $591,376,239 |
| Money Market Funds – 5.9% | |
| MFS Institutional Money Market Portfolio, 4.55% (v) | | | 151,917,676 | $151,917,677 |
| Total Investment Companies (Identified Cost, $776,373,089) | $743,293,916 |
Portfolio of Investments – continued
| Underlying/Expiration Date/Exercise Price | Put/Call | Counterparty | Notional
Amount | Par Amount/
Number of
Contracts | Value ($) |
| Purchased Options – 0.0% | |
| Market Index Securities – 0.0% | |
| Markit CDX North America Investment Grade Series 39 Index Credit Default Swap-Fund pays 1%, Fund receives notional amount upon a defined credit event of an Index constituent – April 2023 @ 0.875% | Put | Merrill Lynch International | $ 97,062,086 | $ 95,900,000 | $126,135 |
| S&P 500 Index – June 2023 @ $3,000 | Put | Goldman Sachs International | 119,090,700 | 300 | 324,000 |
Total Purchased Options
(Premiums Paid, $4,148,987) | | $450,135 |
| Issuer | | | Shares/Par | |
| Collateral for Securities Loaned – 0.3% |
| JPMorgan U.S. Government Money Market Fund - Class IM Shares, 4.41% (j) (Identified Cost, $6,187,066) | | | 6,187,066 | $6,187,066 |
| Written Options (see table below) – (0.0)% | |
| (Premiums Received, $95,900) | $(36,598) |
|
|
| Other Assets, Less Liabilities – (0.0)% | | (723,689) |
| Net Assets – 100.0% | $2,589,340,324 |
| (a) | Non-income producing security. |
| (d) | In default. |
| (f) | All or a portion of the security has been segregated as collateral for open futures contracts. |
| (h) | An affiliated issuer, which may be considered one in which the fund owns 5% or more of the outstanding voting securities, or a company which is under common control. At period end, the aggregate values of the fund's investments in affiliated issuers and in unaffiliated issuers were $743,293,916 and $1,846,806,695, respectively. |
| (i) | Interest only security for which the fund receives interest on notional principal (Par amount). Par amount shown is the notional principal and does not reflect the cost of the security. |
| (j) | The rate quoted is the annualized seven-day yield of the fund at period end. |
| (l) | A portion of this security is on loan. See Note 2 for additional information. |
| (n) | Securities exempt from registration under Rule 144A of the Securities Act of 1933. These securities may be sold in the ordinary course of business in transactions exempt from registration, normally to qualified institutional buyers. At period end, the aggregate value of these securities was $276,605,092, representing 10.7% of net assets. |
| (p) | Payment-in-kind (PIK) security for which interest income may be received in additional securities and/or cash. |
Portfolio of Investments – continued
| (u) | The security was valued using significant unobservable inputs and is considered level 3 under the fair value hierarchy. For further information about the fund’s level 3 holdings, please see Note 2 in the Notes to Financial Statements. |
| (v) | Affiliated issuer that is available only to investment companies managed by MFS. The rate quoted for the MFS Institutional Money Market Portfolio is the annualized seven-day yield of the fund at period end. |
| (z) | Restricted securities are not registered under the Securities Act of 1933 and are subject to legal restrictions on resale. These securities generally may be resold in transactions exempt from registration or to the public if the securities are subsequently registered. Disposal of these securities may involve time-consuming negotiations and prompt sale at an acceptable price may be difficult. The fund holds the following restricted securities: |
| Restricted Securities | Acquisition
Date | Cost | Value |
| NAK Naftogaz Ukraine via Kondor Finance PLC, 7.625%, 11/08/2026 | 11/04/2019-6/03/2020 | $3,064,674 | $591,090 |
| % of Net assets | | | 0.0% |
| The following abbreviations are used in this report and are defined: |
| AGM | Assured Guaranty Municipal |
| CLO | Collateralized Loan Obligation |
| CMT | Constant Maturity Treasury |
| FLR | Floating Rate. Interest rate resets periodically based on the parenthetically disclosed reference rate plus a spread (if any). The period-end rate reported may not be the current rate. All reference rates are USD unless otherwise noted. |
| LIBOR | London Interbank Offered Rate |
| REIT | Real Estate Investment Trust |
| SOFR | Secured Overnight Financing Rate |
| TBA | To Be Announced |
| UMBS | Uniform Mortgage-Backed Security |
| Abbreviations indicate amounts shown in currencies other than the U.S. dollar. All amounts are stated in U.S. dollars unless otherwise indicated. A list of abbreviations is shown below: |
| BRL | Brazilian Real |
| CLP | Chilean Peso |
| CNH | Chinese Yuan Renminbi (Offshore) |
| EUR | Euro |
| JPY | Japanese Yen |
| MXN | Mexican Peso |
| MYR | Malaysian Ringgit |
| PHP | Philippine Peso |
| THB | Thai Baht |
| UYU | Uruguayan Peso |
Portfolio of Investments – continued
Derivative Contracts at 2/28/23
| Written Options |
| Underlying | Put/
Call | Counterparty | Par Amount/
Number of
Contracts | Notional
Amount | Exercise
Price | Expiration
Date | Value |
| Liability Derivatives |
| Market Index Securities | | | |
| Markit CDX North America Investment Grade Series 39 Index Credit Default Swap-Fund pays 1%, Fund receives notional amount upon a defined credit event of an Index constituent | Put | Merrill Lynch International | $(95,900,000) | $(97,062,086) | 1.10% | April – 2023 | $(36,598) |
| Forward Foreign Currency Exchange Contracts |
Currency
Purchased | Currency
Sold | Counterparty | Settlement
Date | Unrealized
Appreciation
(Depreciation) |
| Asset Derivatives |
| CLP | 978,429,400 | USD | 1,099,606 | Barclays Bank PLC | 3/06/2023 | $82,054 |
| CLP | 1,832,463,439 | USD | 1,956,670 | Morgan Stanley Capital Services, Inc. | 3/06/2023 | 256,416 |
| MXN | 14,163,204 | USD | 747,268 | UBS AG | 4/21/2023 | 19,326 |
| USD | 660,370 | BRL | 3,403,285 | Goldman Sachs International | 4/04/2023 | 14,613 |
| USD | 1,106,226 | CLP | 914,295,839 | Goldman Sachs International | 3/06/2023 | 2,021 |
| USD | 11,591,641 | EUR | 10,676,032 | JPMorgan Chase Bank N.A. | 4/21/2023 | 265,491 |
| USD | 57,503 | EUR | 52,538 | State Street Bank Corp. | 4/21/2023 | 1,766 |
| USD | 866,103 | THB | 28,259,534 | JPMorgan Chase Bank N.A. | 3/07/2023 | 63,507 |
| | | | | | | $705,194 |
| Liability Derivatives |
| BRL | 3,458,000 | USD | 660,971 | Banco Santander S.A. | 4/04/2023 | $(4,831) |
| CLP | 914,295,839 | USD | 1,093,067 | Goldman Sachs International | 6/02/2023 | (1,939) |
| CNH | 7,168,626 | USD | 1,064,716 | BNP Paribas S.A. | 4/21/2023 | (29,744) |
| EUR | 523 | USD | 555 | Brown Brothers Harriman | 4/21/2023 | (1) |
| EUR | 52,538 | USD | 57,043 | JPMorgan Chase Bank N.A. | 4/21/2023 | (1,306) |
| EUR | 259,310 | USD | 283,216 | UBS AG | 4/21/2023 | (8,116) |
| JPY | 215,547,497 | USD | 1,708,741 | Merrill Lynch International | 4/21/2023 | (114,127) |
| MYR | 10,700,080 | USD | 2,453,697 | Barclays Bank PLC | 6/20/2023 | (50,811) |
| PHP | 55,695,229 | USD | 1,007,876 | Barclays Bank PLC | 5/16/2023 | (4,810) |
| THB | 96,513,744 | USD | 2,933,344 | JPMorgan Chase Bank N.A. | 3/07/2023 | (192,268) |
| USD | 1,989,110 | CLP | 1,896,597,000 | Barclays Bank PLC | 3/06/2023 | (301,430) |
Portfolio of Investments – continued
| Forward Foreign Currency Exchange Contracts - continued |
Currency
Purchased | Currency
Sold | Counterparty | Settlement
Date | Unrealized
Appreciation
(Depreciation) |
| Liability Derivatives - continued |
| USD | 1,626,577 | MXN | 30,920,092 | HSBC Bank | 4/21/2023 | $(46,995) |
| | | | | | | $(756,378) |
| Futures Contracts |
| Description | Long/
Short | Currency | Contracts | Notional
Amount | Expiration
Date | Value/Unrealized
Appreciation
(Depreciation) |
| Liability Derivatives |
| Interest Rate Futures | | |
| U.S. Treasury Bond | Long | USD | 125 | $15,652,344 | June – 2023 | $(2,986) |
| U.S. Treasury Note 10 yr | Long | USD | 527 | 58,842,844 | June – 2023 | (68,363) |
| U.S. Treasury Note 2 yr | Long | USD | 193 | 39,319,226 | June – 2023 | (119,224) |
| U.S. Treasury Note 5 yr | Long | USD | 329 | 35,220,992 | June – 2023 | (99,283) |
| U.S. Treasury Ultra Bond | Long | USD | 178 | 24,041,125 | June – 2023 | (110,722) |
| U.S. Treasury Ultra Note 10 yr | Short | USD | 448 | 52,500,000 | June – 2023 | (40,456) |
| | | | | | | $(441,034) |
At February 28, 2023, the fund had cash collateral of $110,000 and other liquid securities with an aggregate value of $2,711,654 to cover any collateral or margin obligations for certain derivative contracts. Restricted cash and/or deposits with brokers in the Statement of Assets and Liabilities are comprised of cash collateral.
See Notes to Financial Statements
Financial Statements
Statement of Assets and Liabilities
At 2/28/23
This statement represents your fund’s balance sheet, which details the assets and liabilities comprising the total value of the fund.
| Assets | |
| Investments in unaffiliated issuers, at value, including $5,951,891 of securities on loan (identified cost, $1,842,160,933) | $1,846,806,695 |
| Investments in affiliated issuers, at value (identified cost, $776,373,089) | 743,293,916 |
| Cash | 687,833 |
| Restricted cash for | |
| Forward foreign currency exchange contracts | 110,000 |
| Receivables for | |
| Forward foreign currency exchange contracts | 705,194 |
| Investments sold | 14,815,418 |
| TBA sale commitments | 6,561,165 |
| Fund shares sold | 1,178,454 |
| Interest and dividends | 12,820,886 |
| Other assets | 8,372 |
| Total assets | $2,626,987,933 |
| Liabilities | |
| Payable to custodian | $22,522 |
| Payables for | |
| Distributions | 675,847 |
| Forward foreign currency exchange contracts | 756,378 |
| Net daily variation margin on open futures contracts | 54,492 |
| Investments purchased | 11,916,129 |
| TBA purchase commitments | 10,876,354 |
| Fund shares reacquired | 5,537,079 |
| Collateral for securities loaned, at value | 6,187,066 |
| Written options (premiums received, $95,900) | 36,598 |
| Payable to affiliates | |
| Investment adviser | 25,956 |
| Administrative services fee | 2,177 |
| Shareholder servicing costs | 590,495 |
| Distribution and service fees | 30,268 |
| Payable for independent Trustees' compensation | 37 |
| Deferred country tax expense payable | 694,756 |
| Accrued expenses and other liabilities | 241,455 |
| Total liabilities | $37,647,609 |
| Net assets | $2,589,340,324 |
Statement of Assets and Liabilities – continued
| Net assets consist of | |
| Paid-in capital | $2,698,272,108 |
| Total distributable earnings (loss) | (108,931,784) |
| Net assets | $2,589,340,324 |
| Shares of beneficial interest outstanding | 225,649,412 |
| | Net assets | Shares
outstanding | Net asset value
per share (a) |
| Class A | $1,300,450,630 | 113,308,323 | $11.48 |
| Class C | 220,774,656 | 19,246,657 | 11.47 |
| Class I | 816,791,119 | 71,196,089 | 11.47 |
| Class R1 | 180,262 | 15,724 | 11.46 |
| Class R2 | 1,289,328 | 112,375 | 11.47 |
| Class R3 | 21,712,125 | 1,891,412 | 11.48 |
| Class R4 | 4,145,993 | 361,118 | 11.48 |
| Class R6 | 223,996,211 | 19,517,714 | 11.48 |
| (a) | Maximum offering price per share was equal to the net asset value per share for all share classes, except for Class A, for which the maximum offering price per share was $11.99 [100 / 95.75 x $11.48]. On sales of $100,000 or more, the maximum offering price of Class A shares is reduced. A contingent deferred sales charge may be imposed on redemptions of Class A and Class C shares. Redemption price per share was equal to the net asset value per share for Classes I, R1, R2, R3, R4, and R6. |
See Notes to Financial Statements
Financial Statements
Statement of Operations
Year ended 2/28/23
This statement describes how much your fund earned in investment income and accrued in expenses. It also describes any gains and/or losses generated by fund operations.
| Net investment income (loss) | |
| Income | |
| Interest | $47,693,623 |
| Dividends from affiliated issuers | 42,157,633 |
| Dividends | 37,504,213 |
| Other | 566,972 |
| Income on securities loaned | 20,824 |
| Foreign taxes withheld | (1,349,300) |
| Total investment income | $126,593,965 |
| Expenses | |
| Management fee | $16,604,077 |
| Distribution and service fees | 6,328,367 |
| Shareholder servicing costs | 2,638,839 |
| Administrative services fee | 463,188 |
| Independent Trustees' compensation | 46,664 |
| Custodian fee | 315,003 |
| Shareholder communications | 159,305 |
| Audit and tax fees | 89,014 |
| Legal fees | 14,030 |
| Miscellaneous | 265,089 |
| Total expenses | $26,923,576 |
| Fees paid indirectly | (24,178) |
| Reduction of expenses by investment adviser and distributor | (1,056,890) |
| Net expenses | $25,842,508 |
| Net investment income (loss) | $100,751,457 |
Statement of Operations – continued
| Realized and unrealized gain (loss) |
| Realized gain (loss) (identified cost basis) | |
| Unaffiliated issuers (net of $687,364 country tax) | $(15,036,764) |
| Affiliated issuers | (21,050,773) |
| Futures contracts | (7,454,280) |
| Forward foreign currency exchange contracts | 3,499,957 |
| Foreign currency | (311,889) |
| Net realized gain (loss) | $(40,353,749) |
| Change in unrealized appreciation or depreciation | |
| Unaffiliated issuers (net of $22,347 decrease in deferred country tax) | $(241,324,526) |
| Affiliated issuers | (55,811,816) |
| Written options | 59,302 |
| Futures contracts | (204,599) |
| Forward foreign currency exchange contracts | (360,044) |
| Translation of assets and liabilities in foreign currencies | (166,371) |
| Net unrealized gain (loss) | $(297,808,054) |
| Net realized and unrealized gain (loss) | $(338,161,803) |
| Change in net assets from operations | $(237,410,346) |
See Notes to Financial Statements
Financial Statements
Statements of Changes in Net Assets
These statements describe the increases and/or decreases in net assets resulting from operations, any distributions, and any shareholder transactions.
| | Year ended |
| | 2/28/23 | 2/28/22 |
| Change in net assets | | |
| From operations | | |
| Net investment income (loss) | $100,751,457 | $99,044,479 |
| Net realized gain (loss) | (40,353,749) | 120,461,861 |
| Net unrealized gain (loss) | (297,808,054) | (103,477,005) |
| Change in net assets from operations | $(237,410,346) | $116,029,335 |
| Total distributions to shareholders | $(131,363,838) | $(174,809,430) |
| Change in net assets from fund share transactions | $(396,673,104) | $(76,548,918) |
| Total change in net assets | $(765,447,288) | $(135,329,013) |
| Net assets | | |
| At beginning of period | 3,354,787,612 | 3,490,116,625 |
| At end of period | $2,589,340,324 | $3,354,787,612 |
See Notes to Financial Statements
Financial Statements
Financial Highlights
The financial highlights table is intended to help you understand the fund's financial performance for the past 5 years. Certain information reflects financial results for a single fund share. The total returns in the table represent the rate that an investor would have earned (or lost) on an investment in the fund share class (assuming reinvestment of all distributions) held for the entire period.
| Class A | Year ended |
| | 2/28/23 | 2/28/22 | 2/28/21 | 2/29/20 | 2/28/19
|
| Net asset value, beginning of period | $12.91 | $13.14 | $12.86 | $12.35 | $12.10 |
| Income (loss) from investment operations |
| Net investment income (loss) (d) | $0.41 | $0.38 | $0.37 | $0.37 | $0.39 |
| Net realized and unrealized gain (loss) | (1.31) | 0.07 | 0.28 | 0.51 | 0.33 |
| Total from investment operations | $(0.90) | $0.45 | $0.65 | $0.88 | $0.72 |
| Less distributions declared to shareholders |
| From net investment income | $(0.38) | $(0.41) | $(0.34) | $(0.37) | $(0.39) |
| From net realized gain | (0.15) | (0.27) | (0.03) | (0.00)(w) | (0.08) |
| Total distributions declared to shareholders | $(0.53) | $(0.68) | $(0.37) | $(0.37) | $(0.47) |
| Net asset value, end of period (x) | $11.48 | $12.91 | $13.14 | $12.86 | $12.35 |
| Total return (%) (r)(s)(t)(x) | (6.96) | 3.22 | 5.28 | 7.20 | 6.10 |
Ratios (%) (to average net assets)
and Supplemental data: |
| Expenses before expense reductions (f)(h) | 0.97 | 0.99 | 0.99 | 0.98 | 0.99 |
| Expenses after expense reductions (f)(h) | 0.93 | 0.98 | 0.98 | 0.97 | 0.98 |
| Net investment income (loss) | 3.46 | 2.78 | 2.97 | 2.86 | 3.21 |
| Portfolio turnover | 62 | 72 | 111 | 57 | 36 |
| Net assets at end of period (000 omitted) | $1,300,451 | $1,563,027 | $1,577,032 | $1,540,570 | $1,315,625 |
See Notes to Financial Statements
Financial Highlights – continued
| Class C | Year ended |
| | 2/28/23 | 2/28/22 | 2/28/21 | 2/29/20 | 2/28/19
|
| Net asset value, beginning of period | $12.91 | $13.14 | $12.85 | $12.35 | $12.09 |
| Income (loss) from investment operations |
| Net investment income (loss) (d) | $0.32 | $0.28 | $0.28 | $0.28 | $0.30 |
| Net realized and unrealized gain (loss) | (1.32) | 0.06 | 0.29 | 0.49 | 0.34 |
| Total from investment operations | $(1.00) | $0.34 | $0.57 | $0.77 | $0.64 |
| Less distributions declared to shareholders |
| From net investment income | $(0.29) | $(0.30) | $(0.25) | $(0.27) | $(0.30) |
| From net realized gain | (0.15) | (0.27) | (0.03) | (0.00)(w) | (0.08) |
| Total distributions declared to shareholders | $(0.44) | $(0.57) | $(0.28) | $(0.27) | $(0.38) |
| Net asset value, end of period (x) | $11.47 | $12.91 | $13.14 | $12.85 | $12.35 |
| Total return (%) (r)(s)(t)(x) | (7.74) | 2.44 | 4.57 | 6.32 | 5.40 |
Ratios (%) (to average net assets)
and Supplemental data: |
| Expenses before expense reductions (f)(h) | 1.72 | 1.74 | 1.74 | 1.73 | 1.75 |
| Expenses after expense reductions (f)(h) | 1.69 | 1.73 | 1.73 | 1.72 | 1.74 |
| Net investment income (loss) | 2.71 | 2.05 | 2.27 | 2.14 | 2.48 |
| Portfolio turnover | 62 | 72 | 111 | 57 | 36 |
| Net assets at end of period (000 omitted) | $220,775 | $355,639 | $456,806 | $724,758 | $756,643 |
See Notes to Financial Statements
Financial Highlights – continued
| Class I | Year ended |
| | 2/28/23 | 2/28/22 | 2/28/21 | 2/29/20 | 2/28/19
|
| Net asset value, beginning of period | $12.91 | $13.14 | $12.86 | $12.35 | $12.09 |
| Income (loss) from investment operations |
| Net investment income (loss) (d) | $0.44 | $0.41 | $0.40 | $0.40 | $0.42 |
| Net realized and unrealized gain (loss) | (1.32) | 0.07 | 0.29 | 0.51 | 0.34 |
| Total from investment operations | $(0.88) | $0.48 | $0.69 | $0.91 | $0.76 |
| Less distributions declared to shareholders |
| From net investment income | $(0.41) | $(0.44) | $(0.38) | $(0.40) | $(0.42) |
| From net realized gain | (0.15) | (0.27) | (0.03) | (0.00)(w) | (0.08) |
| Total distributions declared to shareholders | $(0.56) | $(0.71) | $(0.41) | $(0.40) | $(0.50) |
| Net asset value, end of period (x) | $11.47 | $12.91 | $13.14 | $12.86 | $12.35 |
| Total return (%) (r)(s)(t)(x) | (6.81) | 3.47 | 5.54 | 7.46 | 6.45 |
Ratios (%) (to average net assets)
and Supplemental data: |
| Expenses before expense reductions (f)(h) | 0.72 | 0.74 | 0.74 | 0.73 | 0.74 |
| Expenses after expense reductions (f)(h) | 0.69 | 0.73 | 0.73 | 0.72 | 0.74 |
| Net investment income (loss) | 3.70 | 3.03 | 3.24 | 3.11 | 3.47 |
| Portfolio turnover | 62 | 72 | 111 | 57 | 36 |
| Net assets at end of period (000 omitted) | $816,791 | $1,145,617 | $1,156,030 | $1,425,004 | $1,181,300 |
See Notes to Financial Statements
Financial Highlights – continued
| Class R1 | Year ended |
| | 2/28/23 | 2/28/22 | 2/28/21 | 2/29/20 | 2/28/19
|
| Net asset value, beginning of period | $12.90 | $13.13 | $12.85 | $12.34 | $12.08 |
| Income (loss) from investment operations |
| Net investment income (loss) (d) | $0.32 | $0.28 | $0.28 | $0.27 | $0.31 |
| Net realized and unrealized gain (loss) | (1.32) | 0.06 | 0.28 | 0.51 | 0.33 |
| Total from investment operations | $(1.00) | $0.34 | $0.56 | $0.78 | $0.64 |
| Less distributions declared to shareholders |
| From net investment income | $(0.29) | $(0.30) | $(0.25) | $(0.27) | $(0.30) |
| From net realized gain | (0.15) | (0.27) | (0.03) | (0.00)(w) | (0.08) |
| Total distributions declared to shareholders | $(0.44) | $(0.57) | $(0.28) | $(0.27) | $(0.38) |
| Net asset value, end of period (x) | $11.46 | $12.90 | $13.13 | $12.85 | $12.34 |
| Total return (%) (r)(s)(t)(x) | (7.75) | 2.44 | 4.49 | 6.40 | 5.40 |
Ratios (%) (to average net assets)
and Supplemental data: |
| Expenses before expense reductions (f)(h) | 1.72 | 1.74 | 1.74 | 1.73 | 1.75 |
| Expenses after expense reductions (f)(h) | 1.69 | 1.73 | 1.73 | 1.72 | 1.74 |
| Net investment income (loss) | 2.70 | 2.03 | 2.22 | 2.12 | 2.57 |
| Portfolio turnover | 62 | 72 | 111 | 57 | 36 |
| Net assets at end of period (000 omitted) | $180 | $225 | $241 | $214 | $193 |
See Notes to Financial Statements
Financial Highlights – continued
| Class R2 | Year ended |
| | 2/28/23 | 2/28/22 | 2/28/21 | 2/29/20 | 2/28/19
|
| Net asset value, beginning of period | $12.91 | $13.14 | $12.86 | $12.35 | $12.09 |
| Income (loss) from investment operations |
| Net investment income (loss) (d) | $0.38 | $0.34 | $0.35 | $0.34 | $0.36 |
| Net realized and unrealized gain (loss) | (1.32) | 0.07 | 0.27 | 0.51 | 0.34 |
| Total from investment operations | $(0.94) | $0.41 | $0.62 | $0.85 | $0.70 |
| Less distributions declared to shareholders |
| From net investment income | $(0.35) | $(0.37) | $(0.31) | $(0.34) | $(0.36) |
| From net realized gain | (0.15) | (0.27) | (0.03) | (0.00)(w) | (0.08) |
| Total distributions declared to shareholders | $(0.50) | $(0.64) | $(0.34) | $(0.34) | $(0.44) |
| Net asset value, end of period (x) | $11.47 | $12.91 | $13.14 | $12.86 | $12.35 |
| Total return (%) (r)(s)(t)(x) | (7.28) | 2.96 | 5.01 | 6.93 | 5.92 |
Ratios (%) (to average net assets)
and Supplemental data: |
| Expenses before expense reductions (f)(h) | 1.22 | 1.24 | 1.24 | 1.23 | 1.25 |
| Expenses after expense reductions (f)(h) | 1.18 | 1.23 | 1.23 | 1.22 | 1.24 |
| Net investment income (loss) | 3.21 | 2.53 | 2.78 | 2.65 | 2.99 |
| Portfolio turnover | 62 | 72 | 111 | 57 | 36 |
| Net assets at end of period (000 omitted) | $1,289 | $1,647 | $1,830 | $3,085 | $3,486 |
See Notes to Financial Statements
Financial Highlights – continued
| Class R3 | Year ended |
| | 2/28/23 | 2/28/22 | 2/28/21 | 2/29/20 | 2/28/19
|
| Net asset value, beginning of period | $12.92 | $13.15 | $12.86 | $12.36 | $12.10 |
| Income (loss) from investment operations |
| Net investment income (loss) (d) | $0.41 | $0.38 | $0.37 | $0.37 | $0.39 |
| Net realized and unrealized gain (loss) | (1.32) | 0.07 | 0.29 | 0.50 | 0.34 |
| Total from investment operations | $(0.91) | $0.45 | $0.66 | $0.87 | $0.73 |
| Less distributions declared to shareholders |
| From net investment income | $(0.38) | $(0.41) | $(0.34) | $(0.37) | $(0.39) |
| From net realized gain | (0.15) | (0.27) | (0.03) | (0.00)(w) | (0.08) |
| Total distributions declared to shareholders | $(0.53) | $(0.68) | $(0.37) | $(0.37) | $(0.47) |
| Net asset value, end of period (x) | $11.48 | $12.92 | $13.15 | $12.86 | $12.36 |
| Total return (%) (r)(s)(t)(x) | (7.04) | 3.21 | 5.36 | 7.11 | 6.18 |
Ratios (%) (to average net assets)
and Supplemental data: |
| Expenses before expense reductions (f)(h) | 0.97 | 0.99 | 0.99 | 0.98 | 1.00 |
| Expenses after expense reductions (f)(h) | 0.93 | 0.98 | 0.98 | 0.97 | 0.99 |
| Net investment income (loss) | 3.45 | 2.78 | 2.98 | 2.86 | 3.21 |
| Portfolio turnover | 62 | 72 | 111 | 57 | 36 |
| Net assets at end of period (000 omitted) | $21,712 | $22,253 | $22,760 | $24,385 | $19,159 |
See Notes to Financial Statements
Financial Highlights – continued
| Class R4 | Year ended |
| | 2/28/23 | 2/28/22 | 2/28/21 | 2/29/20 | 2/28/19
|
| Net asset value, beginning of period | $12.92 | $13.15 | $12.86 | $12.36 | $12.10 |
| Income (loss) from investment operations |
| Net investment income (loss) (d) | $0.44 | $0.42 | $0.41 | $0.41 | $0.41 |
| Net realized and unrealized gain (loss) | (1.32) | 0.06 | 0.29 | 0.49 | 0.35 |
| Total from investment operations | $(0.88) | $0.48 | $0.70 | $0.90 | $0.76 |
| Less distributions declared to shareholders |
| From net investment income | $(0.41) | $(0.44) | $(0.38) | $(0.40) | $(0.42) |
| From net realized gain | (0.15) | (0.27) | (0.03) | (0.00)(w) | (0.08) |
| Total distributions declared to shareholders | $(0.56) | $(0.71) | $(0.41) | $(0.40) | $(0.50) |
| Net asset value, end of period (x) | $11.48 | $12.92 | $13.15 | $12.86 | $12.36 |
| Total return (%) (r)(s)(t)(x) | (6.80) | 3.47 | 5.62 | 7.38 | 6.45 |
Ratios (%) (to average net assets)
and Supplemental data: |
| Expenses before expense reductions (f)(h) | 0.72 | 0.74 | 0.74 | 0.73 | 0.74 |
| Expenses after expense reductions (f)(h) | 0.69 | 0.73 | 0.73 | 0.72 | 0.73 |
| Net investment income (loss) | 3.71 | 3.05 | 3.24 | 3.15 | 3.43 |
| Portfolio turnover | 62 | 72 | 111 | 57 | 36 |
| Net assets at end of period (000 omitted) | $4,146 | $5,995 | $8,626 | $9,783 | $10,063 |
See Notes to Financial Statements
Financial Highlights – continued
| Class R6 | Year ended |
| | 2/28/23 | 2/28/22 | 2/28/21 | 2/29/20 | 2/28/19
|
| Net asset value, beginning of period | $12.91 | $13.14 | $12.86 | $12.35 | $12.10 |
| Income (loss) from investment operations |
| Net investment income (loss) (d) | $0.45 | $0.42 | $0.42 | $0.41 | $0.43 |
| Net realized and unrealized gain (loss) | (1.31) | 0.07 | 0.28 | 0.51 | 0.33 |
| Total from investment operations | $(0.86) | $0.49 | $0.70 | $0.92 | $0.76 |
| Less distributions declared to shareholders |
| From net investment income | $(0.42) | $(0.45) | $(0.39) | $(0.41) | $(0.43) |
| From net realized gain | (0.15) | (0.27) | (0.03) | (0.00)(w) | (0.08) |
| Total distributions declared to shareholders | $(0.57) | $(0.72) | $(0.42) | $(0.41) | $(0.51) |
| Net asset value, end of period (x) | $11.48 | $12.91 | $13.14 | $12.86 | $12.35 |
| Total return (%) (r)(s)(t)(x) | (6.64) | 3.57 | 5.64 | 7.55 | 6.46 |
Ratios (%) (to average net assets)
and Supplemental data: |
| Expenses before expense reductions (f)(h) | 0.63 | 0.65 | 0.65 | 0.64 | 0.65 |
| Expenses after expense reductions (f)(h) | 0.59 | 0.64 | 0.64 | 0.63 | 0.64 |
| Net investment income (loss) | 3.79 | 3.12 | 3.32 | 3.19 | 3.55 |
| Portfolio turnover | 62 | 72 | 111 | 57 | 36 |
| Net assets at end of period (000 omitted) | $223,996 | $260,384 | $266,792 | $271,679 | $218,650 |
| (d) | Per share data is based on average shares outstanding. |
| (f) | Ratios do not reflect reductions from fees paid indirectly, if applicable. See Note 2 in the Notes to Financial Statements for additional information. |
| (h) | In addition to the fees and expenses which the fund bears directly, the fund indirectly bears a pro rata share of the fees and expenses of the underlying affiliated funds in which the fund invests. Accordingly, the expense ratio for the fund reflects only those fees and expenses borne directly by the fund. Because the underlying affiliated funds have varied expense and fee levels and the fund may own different proportions of the underlying affiliated funds at different times, the amount of fees and expenses incurred indirectly by the fund will vary. |
| (r) | Certain expenses have been reduced without which performance would have been lower. |
| (s) | From time to time the fund may receive proceeds from litigation settlements, without which performance would be lower. |
| (t) | Total returns do not include any applicable sales charges. |
| (w) | Per share amount was less than $0.01. |
| (x) | The net asset values and total returns have been calculated on net assets which include adjustments made in accordance with U.S. generally accepted accounting principles required at period end for financial reporting purposes. |
See Notes to Financial Statements
Notes to Financial Statements
(1) Business and Organization
MFS Diversified Income Fund (the fund) is a diversified series of MFS Series Trust XIII (the trust). The trust is organized as a Massachusetts business trust and is registered under the Investment Company Act of 1940, as amended, as an open-end management investment company.
The fund is an investment company and accordingly follows the investment company accounting and reporting guidance of the Financial Accounting Standards Board (FASB) Accounting Standards Codification Topic 946 Financial Services - Investment Companies.
(2) Significant Accounting Policies
General — The preparation of financial statements in conformity with U.S. generally accepted accounting principles requires management to make estimates and assumptions that affect the reported amounts of assets and liabilities, and disclosure of contingent assets and liabilities at the date of the financial statements and the reported amounts of increases and decreases in net assets from operations during the reporting period. Actual results could differ from those estimates. In the preparation of these financial statements, management has evaluated subsequent events occurring after the date of the fund’s Statement of Assets and Liabilities through the date that the financial statements were issued.
The fund invests in the MFS High Yield Pooled Portfolio (“High Yield Pooled Portfolio”). MFS does not receive a management fee from the High Yield Pooled Portfolio. The High Yield Pooled Portfolio’s investment objective is to seek total return with an emphasis on high current income, but also considering capital appreciation. The accounting policies of the High Yield Pooled Portfolio are outlined in its shareholder report, which is available without charge by calling 1-800-225-2606 and on the Securities and Exchange Commission (SEC) web site at http://www.sec.gov. The accounting policies detailed in the Significant Accounting Policies note cover both the fund and the High Yield Pooled Portfolio. For purposes of this policy disclosure, “fund” refers to both the fund and the High Yield Pooled Portfolio in which the fund invests. The High Yield Pooled Portfolio’s shareholder report is not covered by this report. The fund and the High Yield Pooled Portfolio invest in high-yield securities rated below investment grade. Investments in below investment grade quality securities can involve a substantially greater risk of default or can already be in default, and their values can decline significantly. Below investment grade quality securities tend to be more sensitive to adverse news about the issuer, or the market or economy in general, than higher quality debt instruments. The fund and the High Yield Pooled Portfolio invest in foreign securities. Investments in foreign securities are vulnerable to the effects of changes in the relative values of the local currency and the U.S. dollar and to the effects of changes in each country’s market, economic, industrial, political, regulatory, geopolitical, environmental, public health, and other conditions. The fund invests a significant amount of its net assets in U.S. and foreign real estate related investments and as a result is subject to certain risks associated with the direct ownership of real estate and the real estate industry in general. These include risks related to general, regional and local economic conditions; difficulties in valuing and disposing of real estate; fluctuations in interest rates and property tax rates, shifts in zoning laws, environmental regulations and other governmental action; cash flow dependency; increased operating expenses; lack of availability of mortgage funds; losses due to
Notes to Financial Statements - continued
natural disasters; overbuilding; losses due to casualty or condemnation; changes in property values and rental rates; the management skill and creditworthiness of the manager; and other factors. The fund invests in emerging market issuers. Investments in emerging markets can involve additional and greater risks than the risks associated with investments in developed foreign markets. Emerging markets can have less developed markets, greater custody and operational risk, less developed legal, regulatory, accounting, and auditing systems, greater government involvement in the economy, greater risk of new or inconsistent government treatment of or restrictions on issuers and instruments, and greater political, social, and economic instability than developed markets.
Balance Sheet Offsetting — The fund's accounting policy with respect to balance sheet offsetting is that, absent an event of default by the counterparty or a termination of the agreement, the International Swaps and Derivatives Association (ISDA) Master Agreement, or similar agreement, does not result in an offset of reported amounts of financial assets and financial liabilities in the Statement of Assets and Liabilities across transactions between the fund and the applicable counterparty. The fund's right to setoff may be restricted or prohibited by the bankruptcy or insolvency laws of the particular jurisdiction to which a specific master netting agreement counterparty is subject. Balance sheet offsetting disclosures, to the extent applicable to the fund, have been included in the fund’s Significant Accounting Policies note under the captions for each of the fund’s in-scope financial instruments and transactions.
Investment Valuations — The investments of the fund and the High Yield Pooled Portfolio are valued as described below.
Subject to its oversight, the fund's Board of Trustees has delegated primary responsibility for determining or causing to be determined the value of the fund’s investments to MFS as the fund's adviser, pursuant to the fund’s valuation policy and procedures which have been adopted by the adviser and approved by the Board. Effective September 8, 2022, and in accordance with Rule 2a-5 under the Investment Company Act of 1940, the Board of Trustees designated the adviser as the “valuation designee” of the fund. If the adviser, as valuation designee, determines that reliable market quotations are not readily available for an investment, the investment is valued at fair value as determined in good faith by the adviser in accordance with the adviser’s fair valuation policy and procedures.
Under the fund's valuation policy and procedures, equity securities, including restricted equity securities, are generally valued at the last sale or official closing price on their primary market or exchange as provided by a third-party pricing service. Equity securities, for which there were no sales reported that day, are generally valued at the last quoted daily bid quotation on their primary market or exchange as provided by a third-party pricing service. Debt instruments and floating rate loans, including restricted debt instruments, are generally valued at an evaluated or composite bid as provided by a third-party pricing service. Short-term instruments with a maturity at issuance of 60 days or less may be valued at amortized cost, which approximates market value.
Exchange-traded options are generally valued at the last sale or official closing price on their primary exchange as provided by a third-party pricing service. Exchange-traded options for which there were no sales reported that day are generally valued at the last daily bid quotation on their primary exchange as provided by a third-party pricing service. For put options, the position may be valued at the last daily ask quotation if there are no trades reported during the day. Options not traded on an exchange are
Notes to Financial Statements - continued
generally valued at a broker/dealer bid quotation. Foreign currency options are generally valued at valuations provided by a third-party pricing service. Futures contracts are generally valued at last posted settlement price on their primary exchange as provided by a third-party pricing service. Futures contracts for which there were no trades that day for a particular position are generally valued at the closing bid quotation on their primary exchange as provided by a third-party pricing service.
Forward foreign currency exchange contracts are generally valued at the mean of bid and asked prices for the time period interpolated from rates provided by a third-party pricing service for proximate time periods. Open-end investment companies are generally valued at net asset value per share. The values of foreign securities and other assets and liabilities expressed in foreign currencies are converted to U.S. dollars using the mean of bid and asked prices for rates provided by a third-party pricing service.
Under the fund’s valuation policy and procedures, market quotations are not considered to be readily available for debt instruments, floating rate loans, and many types of derivatives. These investments are generally valued at fair value based on information from third-party pricing services or otherwise determined by the adviser in accordance with the adviser’s fair valuation policy and procedures. Securities and other assets generally valued on the basis of information from a third-party pricing service may also be valued at a broker/dealer bid quotation. In determining values, third-party pricing services can utilize both transaction data and market information such as yield, quality, coupon rate, maturity, type of issue, trading characteristics, spreads and other market data. An investment may also be valued at fair value if the adviser determines that the investment’s value has been materially affected by events occurring after the close of the exchange or market on which the investment is principally traded (such as foreign exchange or market) and prior to the determination of the fund’s net asset value, or after the halt of trading of a specific security where trading does not resume prior to the close of the exchange or market on which the security is principally traded. Events that occur after foreign markets close (such as developments in foreign markets and significant movements in the U.S. markets) and prior to the determination of the fund’s net asset value may be deemed to have a material effect on the value of securities traded in foreign markets. Accordingly, the fund’s foreign equity securities may often be valued at fair value. The adviser generally relies on third-party pricing services or other information (such as the correlation with price movements of similar securities in the same or other markets; the type, cost and investment characteristics of the security; the business and financial condition of the issuer; and trading and other market data) to assist in determining whether to fair value and at what value to fair value an investment. The value of an investment for purposes of calculating the fund’s net asset value can differ depending on the source and method used to determine value. When fair valuation is used, the value of an investment used to determine the fund’s net asset value may differ from quoted or published prices for the same investment. There can be no assurance that the fund could obtain the fair value assigned to an investment if it were to sell the investment at the same time at which the fund determines its net asset value per share.
Various inputs are used in determining the value of the fund's assets or liabilities. These inputs are categorized into three broad levels. In certain cases, the inputs used to measure fair value may fall into different levels of the fair value hierarchy. In such cases, an investment's level within the fair value hierarchy is based on the lowest level of input that is significant to the fair value measurement. The fund's assessment of the significance of a particular input to the fair value measurement in its entirety requires
Notes to Financial Statements - continued
judgment, and considers factors specific to the investment. Level 1 includes unadjusted quoted prices in active markets for identical assets or liabilities. Level 2 includes other significant observable market-based inputs (including quoted prices for similar securities, interest rates, prepayment speed, and credit risk). Level 3 includes significant unobservable inputs, which may include the adviser's own assumptions in determining the fair value of investments. Other financial instruments are derivative instruments, such as futures contracts, forward foreign currency exchange contracts, and written options. The following is a summary of the levels used as of February 28, 2023 in valuing the fund's assets and liabilities:
| Financial Instruments | Level 1 | Level 2 | Level 3 | Total |
| Equity Securities: | | | | |
| United States | $537,614,340 | $— | $— | $537,614,340 |
| United Kingdom | 31,235,377 | — | — | 31,235,377 |
| France | 26,886,963 | — | — | 26,886,963 |
| Japan | 25,368,662 | — | — | 25,368,662 |
| Switzerland | 24,389,993 | — | — | 24,389,993 |
| Canada | 19,501,156 | — | — | 19,501,156 |
| China | 16,076,142 | — | — | 16,076,142 |
| Singapore | 14,479,393 | — | — | 14,479,393 |
| Germany | 12,976,475 | — | — | 12,976,475 |
| Other Countries | 60,122,449 | 2,376,418 | 520,336 | 63,019,203 |
| U.S. Treasury Bonds & U.S. Government Agencies & Equivalents | — | 136,564,533 | — | 136,564,533 |
| Non - U.S. Sovereign Debt | — | 239,253,438 | — | 239,253,438 |
| Municipal Bonds | — | 4,517,301 | — | 4,517,301 |
| U.S. Corporate Bonds | — | 274,465,382 | — | 274,465,382 |
| Residential Mortgage-Backed Securities | — | 184,693,794 | — | 184,693,794 |
| Commercial Mortgage-Backed Securities | — | 10,849,218 | — | 10,849,218 |
| Asset-Backed Securities (including CDOs) | — | 14,538,982 | — | 14,538,982 |
| Foreign Bonds | — | 204,189,277 | — | 204,189,277 |
| Mutual Funds | 749,480,982 | — | — | 749,480,982 |
| Total | $1,518,131,932 | $1,071,448,343 | $520,336 | $2,590,100,611 |
| Other Financial Instruments | | | | |
| Futures Contracts – Liabilities | $(441,034) | $— | $— | $(441,034) |
| Forward Foreign Currency Exchange Contracts – Assets | — | 705,194 | — | 705,194 |
| Forward Foreign Currency Exchange Contracts – Liabilities | — | (756,378) | — | (756,378) |
| Written Options - Liabilities | — | (36,598) | — | (36,598) |
Notes to Financial Statements - continued
For further information regarding security characteristics, see the Portfolio of Investments. Please refer to the High Yield Pooled Portfolio's shareholder report for further information regarding the levels used in valuing its assets and liabilities.
The following is a reconciliation of level 3 assets for which significant unobservable inputs were used to determine fair value. The table presents the activity of level 3 securities held at the beginning and the end of the period.
| | Equity
Securities | Fixed Income
Securities | Total |
| Balance as of 2/28/22 | $464,837 | $7,687,618 | $8,152,455 |
| Accrued discounts/premiums | — | (30,769) | (30,769) |
| Realized gain (loss) | — | (5,881,891) | (5,881,891) |
| Change in unrealized appreciation or depreciation | 55,499 | 6,013,389 | 6,068,888 |
| Sales | — | (3,719,696) | (3,719,696) |
| Transfers out of level 3 | — | (4,068,651) | (4,068,651) |
| Balance as of 2/28/23 | $520,336 | $— | $520,336 |
The net change in unrealized appreciation or depreciation from investments held as level 3 at February 28, 2023 is $55,499. At February 28, 2023, the fund held three level 3 securities.
Inflation-Adjusted Debt Securities — The fund invests in inflation-adjusted debt securities issued by foreign corporations and/or foreign governments. The principal value of these debt securities is adjusted through income according to changes in an inflation index or another general price or wage index. These debt securities typically pay a fixed rate of interest, but this fixed rate is applied to the inflation-adjusted principal amount. The principal paid at maturity of the debt security is typically equal to the inflation-adjusted principal amount, or the security’s original par value, whichever is greater. Other types of inflation-adjusted securities may use other methods to adjust for other measures of inflation.
Foreign Currency Translation — Purchases and sales of foreign investments, income, and expenses are converted into U.S. dollars based upon currency exchange rates prevailing on the respective dates of such transactions or on the reporting date for foreign denominated receivables and payables. Gains and losses attributable to foreign currency exchange rates on sales of securities are recorded for financial statement purposes as net realized gains and losses on investments. Gains and losses attributable to foreign exchange rate movements on receivables, payables, income and expenses are recorded for financial statement purposes as foreign currency transaction gains and losses. That portion of both realized and unrealized gains and losses on investments that results from fluctuations in foreign currency exchange rates is not separately disclosed.
Derivatives — The fund uses derivatives primarily to increase or decrease exposure to a particular market or segment of the market, or security, to increase or decrease interest rate or currency exposure, or as alternatives to direct investments. Derivatives are used for hedging or non-hedging purposes. While hedging can reduce or eliminate losses, it can also reduce or eliminate gains. When the fund uses derivatives as an investment to increase market exposure, or for hedging purposes, gains and losses from derivative instruments may be substantially greater than the derivative’s original cost.
Notes to Financial Statements - continued
The derivative instruments used by the fund during the period were written options, purchased options, futures contracts, and forward foreign currency exchange contracts. Depending on the type of derivative, a fund may exit a derivative position by entering into an offsetting transaction with a counterparty or exchange, negotiating an agreement with the derivative counterparty, or novating the position to a third party. The fund may be unable to promptly close out a futures position in instances where the daily fluctuation in the price for that type of future exceeds the daily limit set by the exchange. The fund's period end derivatives, as presented in the Portfolio of Investments and the associated Derivative Contract tables, generally are indicative of the volume of its derivative activity during the period.
The following table presents, by major type of derivative contract, the fair value, on a gross basis, of the asset and liability components of derivatives held by the fund at February 28, 2023 as reported in the Statement of Assets and Liabilities:
| | | Fair Value (a) |
| Risk | Derivative Contracts | Asset Derivatives | Liability Derivatives |
| Credit | Written Option Contracts | $— | $(36,598) |
| Equity | Purchased Option Contracts | 324,000 | — |
| Credit | Purchased Option Contracts | 126,135 | — |
| Interest Rate | Futures Contracts | — | (441,034) |
| Foreign Exchange | Forward Foreign Currency Exchange Contracts | 705,194 | (756,378) |
| Total | | $1,155,329 | $(1,234,010) |
| (a) | The value of purchased options outstanding is included in investments in unaffiliated issuers, at value, within the Statement of Assets and Liabilities. Values presented in this table for futures contracts correspond to the values reported in the Portfolio of Investments. Only the current day net variation margin for futures contracts is reported separately within the Statement of Assets and Liabilities. |
The following table presents, by major type of derivative contract, the realized gain (loss) on derivatives held by the fund for the year ended February 28, 2023 as reported in the Statement of Operations:
| Risk | Futures
Contracts | Forward Foreign
Currency
Exchange
Contracts |
| Interest Rate | $(7,454,280) | $— |
| Foreign Exchange | — | 3,499,957 |
| Total | $(7,454,280) | $3,499,957 |
Notes to Financial Statements - continued
The following table presents, by major type of derivative contract, the change in unrealized appreciation or depreciation on derivatives held by the fund for the year ended February 28, 2023 as reported in the Statement of Operations:
| Risk | Futures
Contracts | Forward Foreign
Currency
Exchange
Contracts | Unaffiliated Issuers
(Purchased
Options) | Written
Options |
| Interest Rate | $(204,599) | $— | $— | $— |
| Foreign Exchange | — | (360,044) | — | — |
| Equity | — | — | (3,590,991) | — |
| Credit | — | — | (107,861) | 59,302 |
| Total | $(204,599) | $(360,044) | $(3,698,852) | $59,302 |
Derivative counterparty credit risk is managed through formal evaluation of the creditworthiness of all potential counterparties. On certain, but not all, uncleared derivatives, the fund attempts to reduce its exposure to counterparty credit risk whenever possible by entering into an ISDA Master Agreement on a bilateral basis. The ISDA Master Agreement gives each party to the agreement the right to terminate all transactions traded under such agreement if there is a specified deterioration in the credit quality of the other party. Upon an event of default or a termination of the ISDA Master Agreement, the non-defaulting party has the right to close out all transactions traded under such agreement and to net amounts owed under each agreement to one net amount payable by one party to the other. This right to close out and net payments across all transactions traded under the ISDA Master Agreement could result in a reduction of the fund's credit risk to such counterparty equal to any amounts payable by the fund under the applicable transactions, if any.
Collateral and margin requirements differ by type of derivative. For cleared derivatives (e.g., futures contracts, cleared swaps, and exchange-traded options), margin requirements are set by the clearing broker and the clearing house and collateral, in the form of cash or securities, is posted by the fund directly with the clearing broker. Collateral terms are counterparty agreement specific for uncleared derivatives (e.g., forward foreign currency exchange contracts, uncleared swap agreements, and uncleared options) and collateral, in the form of cash and securities, is held in segregated accounts with the fund's custodian in connection with these agreements. For derivatives traded under an ISDA Master Agreement, which contains a credit support annex, the collateral requirements are netted across all transactions traded under such counterparty-specific agreement and an amount is posted from one party to the other to collateralize such obligations. Cash that has been segregated or delivered to cover the fund's collateral or margin obligations under derivative contracts, if any, will be reported separately in the Statement of Assets and Liabilities as restricted cash for uncleared derivatives and/or deposits with brokers for cleared derivatives. Securities pledged as collateral or margin for the same purpose, if any, are noted in the Portfolio of Investments. The fund may be required to make payments of interest on uncovered collateral or margin obligations with the broker. Any such payments are included in “Miscellaneous” expense in the Statement of Operations.
Written Options — In exchange for a premium, the fund wrote put options on securities for which it anticipated the price would increase. At the time the option was written, the fund believed the premium received exceeded the potential loss that could result from adverse price changes in the options’ underlying securities. In a written
Notes to Financial Statements - continued
option, the fund as the option writer grants the buyer the right to purchase from, or sell to, the fund a specified number of shares or units of a particular security, currency or index at a specified price within a specified period of time.
The premium received is initially recorded as a liability in the Statement of Assets and Liabilities. The option is subsequently marked-to-market daily with the difference between the premium received and the market value of the written option being recorded as unrealized appreciation or depreciation. When a written option expires, the fund realizes a gain equal to the amount of the premium received. The difference between the premium received and the amount paid on effecting a closing transaction is considered a realized gain or loss. When a written put option is exercised, the premium reduces the cost basis of the security purchased by the fund.
At the initiation of the written option contract, for exchange traded options, the fund is required to deposit securities or cash as collateral with the custodian for the benefit of the broker or directly with the clearing broker, based on the type of option. For uncleared options, the fund may post collateral subject to the terms of an ISDA Master Agreement as generally described above if the market value of the options contract moves against it. The fund, as writer of an option, may have no control over whether the underlying securities may be sold (call) or purchased (put) and, as a result, bears the market risk of an unfavorable change in the price of the securities underlying the written option. Losses from writing options can exceed the premium received and can exceed the potential loss from an ordinary buy and sell transaction. Although the fund’s market risk may be significant, the maximum counterparty credit risk to the fund is equal to the market value of any collateral posted to the broker. For uncleared options, this risk is mitigated in cases where there is an ISDA Master Agreement between the fund and the counterparty providing for netting as described above.
Purchased Options — The fund purchased put options for a premium. Purchased put options entitle the holder to sell a specified number of shares or units of a particular security, currency or index at a specified price at a specified date or within a specified period of time. Purchasing put options may hedge against an anticipated decline in the value of portfolio securities or currency or decrease the fund's exposure to an underlying instrument.
The premium paid is initially recorded as an investment in the Statement of Assets and Liabilities. That investment is subsequently marked-to-market daily with the difference between the premium paid and the market value of the purchased option being recorded as unrealized appreciation or depreciation. Premiums paid for purchased put options which have expired are treated as realized losses on investments in the Statement of Operations. Upon the exercise or closing of a purchased put option, the premium paid is offset against the proceeds on the sale of the underlying security or financial instrument in order to determine the realized gain or loss on investments.
Whether or not the option is exercised, the fund's maximum risk of loss from purchasing an option is the amount of premium paid. All option contracts involve credit risk if the counterparty to the option contract fails to perform. For uncleared options, this risk is mitigated in cases where there is an ISDA Master Agreement between the fund and the counterparty providing for netting as described above and, where applicable, by the posting of collateral by the counterparty to the fund to cover the fund’s exposure to the counterparty under such ISDA Master Agreement.
Notes to Financial Statements - continued
Futures Contracts — The fund entered into futures contracts which may be used to hedge against or obtain broad market exposure, interest rate exposure, currency exposure, or to manage duration. A futures contract represents a commitment for the future purchase or sale of an asset at a specified price on a specified date.
Upon entering into a futures contract, the fund is required to deposit with the broker, either in cash or securities, an initial margin in an amount equal to a specified percentage of the notional amount of the contract. Subsequent payments (variation margin) are made or received by the fund each day, depending on the daily fluctuations in the value of the contract, and are recorded for financial statement purposes as unrealized gain or loss by the fund until the contract is closed or expires at which point the gain or loss on futures contracts is realized.
The fund bears the risk of interest rates, exchange rates or securities prices moving unexpectedly, in which case, the fund may not achieve the anticipated benefits of the futures contracts and may realize a loss. While futures contracts may present less counterparty risk to the fund since the contracts are exchange traded and the exchange’s clearinghouse guarantees payments to the broker, there is still counterparty credit risk due to the insolvency of the broker. The fund’s maximum risk of loss due to counterparty credit risk is equal to the margin posted by the fund to the broker plus any gains or minus any losses on the outstanding futures contracts.
Forward Foreign Currency Exchange Contracts — The fund entered into forward foreign currency exchange contracts for the purchase or sale of a specific foreign currency at a fixed price on a future date. These contracts may be used to hedge the fund’s currency risk or for non-hedging purposes. For hedging purposes, the fund may enter into contracts to deliver or receive foreign currency that the fund will receive from or use in its normal investment activities. The fund may also use contracts to hedge against declines in the value of foreign currency denominated securities due to unfavorable exchange rate movements. For non-hedging purposes, the fund may enter into contracts with the intent of changing the relative exposure of the fund’s portfolio of securities to different currencies to take advantage of anticipated exchange rate changes.
Forward foreign currency exchange contracts are adjusted by the daily exchange rate of the underlying currency and any unrealized gains or losses are recorded as a receivable or payable for forward foreign currency exchange contracts until the contract settlement date. On contract settlement date, any gain or loss on the contract is recorded as realized gains or losses on forward foreign currency exchange contracts.
Risks may arise upon entering into these contracts from unanticipated movements in the value of the contract and from the potential inability of counterparties to meet the terms of their contracts. Generally, the fund’s maximum risk due to counterparty credit risk is the unrealized gain on the contract due to the use of Continuous Linked Settlement, a multicurrency cash settlement system for the centralized settlement of foreign transactions. This risk is mitigated in cases where there is an ISDA Master Agreement between the fund and the counterparty providing for netting as described above and, where applicable, by the posting of collateral by the counterparty to the fund to cover the fund’s exposure to the counterparty under such ISDA Master Agreement.
Notes to Financial Statements - continued
Security Loans — Under its Securities Lending Agency Agreement with the fund, JPMorgan Chase and Co., as lending agent, loans the securities of the fund to certain qualified institutions (the “Borrowers”) approved by the fund. Security loans can be terminated at the discretion of either the lending agent or the fund and the related securities must be returned within the earlier of the standard trade settlement period for such securities or within three business days. The loans are collateralized by cash and/or U.S. Treasury and federal agency obligations in an amount typically at least equal to the market value of the securities loaned. On loans collateralized by cash, the cash collateral is invested in a money market fund. The market value of the loaned securities is determined at the close of business of the fund and any additional required collateral is delivered to the fund on the next business day. The lending agent provides the fund with indemnification against Borrower default. In the event of Borrower default, the lending agent will, for the benefit of the fund, either purchase securities identical to those loaned or, when such purchase is commercially impracticable, pay the fund the market value of the loaned securities. In return, the lending agent assumes the fund's rights to the related collateral. If the collateral value is less than the cost to purchase identical securities, the lending agent is responsible for the shortfall, but only to the extent that such shortfall is not due to a decline in collateral value resulting from collateral reinvestment for which the fund bears the risk of loss. At period end, the fund had investment securities on loan, all of which were classified as equity securities in the fund's Portfolio of Investments, with a fair value of $5,951,891. The fair value of the fund's investment securities on loan and a related liability of $6,187,066 for cash collateral received on securities loaned are both presented gross in the Statement of Assets and Liabilities. The collateral on securities loaned exceeded the value of securities on loan at period end. The liability for cash collateral for securities loaned is carried at fair value, which is categorized as level 2 within the fair value hierarchy. A portion of the income generated upon investment of the collateral is remitted to the Borrowers, and the remainder is allocated between the fund and the lending agent. On loans collateralized by U.S. Treasury and/or federal agency obligations, a fee is received from the Borrower, and is allocated between the fund and the lending agent. Income from securities lending is separately reported in the Statement of Operations. The dividend and interest income earned on the securities loaned is accounted for in the same manner as other dividend and interest income.
Indemnifications — Under the fund's organizational documents, its officers and Trustees may be indemnified against certain liabilities and expenses arising out of the performance of their duties to the fund. Additionally, in the normal course of business, the fund enters into agreements with service providers that may contain indemnification clauses. The fund's maximum exposure under these agreements is unknown as this would involve future claims that may be made against the fund that have not yet occurred.
Investment Transactions and Income — Investment transactions are recorded on the trade date. Some securities may be purchased or sold on an extended settlement basis, which means that the receipt or delivery of the securities by the fund and related payments occur at a future date, usually beyond the customary settlement period.
Interest income is recorded on the accrual basis. All premium and discount is amortized or accreted for financial statement purposes in accordance with U.S. generally accepted accounting principles. Dividends received in cash are recorded on the ex-dividend date. Certain dividends from foreign securities will be recorded when the fund is informed of the dividend if such information is obtained subsequent to the ex-dividend date.
Notes to Financial Statements - continued
Dividend and interest payments received in additional securities are recorded on the ex-dividend or ex-interest date in an amount equal to the value of the security on such date. In determining the net gain or loss on securities sold, the cost of securities is determined on the identified cost basis. Inflation-indexed bonds are fixed-income securities whose principal value is periodically adjusted upward or downward based on the rate of inflation. Interest is accrued based on the principal amount, which is adjusted for inflation. Any increase or decrease in the principal amount of an inflation-indexed bond is generally recorded as an increase or decrease in interest income, respectively, even though the adjusted principal is not received until maturity.
Distributions from REITs may be characterized as ordinary income, net capital gain, or a return of capital to the fund. The proper characterization of REIT distributions is generally not known until after the end of each calendar year. As such, estimates are used in reporting the character of income and distributions for financial statement purposes. The fund receives substantial distributions from holdings in REITs. Debt obligations may be placed on non-accrual status or set to accrue at a rate of interest less than the contractual coupon when the collection of all or a portion of interest has become doubtful. Interest income for those debt obligations may be further reduced by the write-off of the related interest receivables when deemed uncollectible.
The fund may receive proceeds from litigation settlements. Any proceeds received from litigation involving portfolio holdings are reflected in the Statement of Operations in realized gain/loss if the security has been disposed of by the fund or in unrealized gain/loss if the security is still held by the fund. Any other proceeds from litigation not related to portfolio holdings are reflected as other income in the Statement of Operations.
The fund invests a significant portion of its assets in asset-backed and/or mortgage-backed securities. For these securities, the value of the debt instrument also depends on the credit quality and adequacy of the underlying assets or collateral as well as whether there is a security interest in the underlying assets or collateral. Enforcing rights, if any, against the underlying assets or collateral may be difficult. U.S. Government securities not supported as to the payment of principal or interest by the U.S. Treasury, such as those issued by Fannie Mae, Freddie Mac, and the Federal Home Loan Banks, are subject to greater credit risk than are U.S. Government securities supported by the U.S. Treasury, such as those issued by Ginnie Mae.
The fund may purchase or sell mortgage-backed securities on a “To Be Announced” (TBA) basis. A TBA transaction is subject to extended settlement and typically does not designate the actual security to be delivered, but instead includes an approximate principal amount. The price of the TBA security and the date that it will be settled are fixed at the time the transaction is negotiated. The value of the security varies with market fluctuations and no interest accrues to the fund until settlement takes place. TBA purchase and sale commitments are held at carrying amount, which approximates fair value and are categorized as level 2 within the fair value hierarchy and included in TBA purchase and TBA sale commitments in the Statement of Assets and Liabilities. Losses may arise as a result of changes in the value of the TBA investment prior to settlement date or due to counterparty non-performance.
The fund may also enter into mortgage dollar rolls, typically TBA dollar rolls, in which the fund sells TBA mortgage-backed securities to financial institutions and simultaneously agrees to repurchase similar (same issuer, type and coupon) securities at a later date at an agreed-upon price. During the period between the sale and
Notes to Financial Statements - continued
repurchase, the fund will not be entitled to receive interest and principal payments on the securities sold. The fund accounts for dollar roll transactions as purchases and sales and realizes gains and losses on these transactions. Dollar roll transactions involve the risk that the market value of the securities that the fund is required to purchase may decline below the agreed upon repurchase price of those securities.
To mitigate the counterparty credit risk on TBA transactions, mortgage dollar rolls, and other types of forward settling mortgage-backed and asset-backed security transactions, the fund whenever possible enters into a Master Securities Forward Transaction Agreement (“MSFTA”) on a bilateral basis with each of the counterparties with whom it undertakes a significant volume of transactions. The MSFTA gives each party to the agreement the right to terminate all transactions traded under such agreement if there is a specified deterioration in the credit quality of the other party. Upon an event of default or a termination of the MSFTA, the non-defaulting party has the right to close out all transactions traded under such agreement and to net amounts owed under each transaction to one net amount payable by one party to the other. This right to close out and net payments across all transactions traded under the MSFTA could result in a reduction of the fund's credit risk to such counterparty equal to any amounts payable by the fund under the applicable transactions, if any.
For mortgage-backed and asset-backed securities traded under a MSFTA, the collateral and margining requirements are contract specific. Collateral amounts across all transactions traded under such agreement are netted and an amount is posted from one party to the other to collateralize such obligations. Cash that has been pledged to cover the fund's collateral or margin obligations under a MSFTA, if any, will be reported separately on the Statement of Assets and Liabilities as restricted cash. Securities pledged as collateral or margin for the same purpose, if any, are noted in the Portfolio of Investments.
Fees Paid Indirectly — The fund's custody fee may be reduced by a credit earned under an arrangement that measures the value of U.S. dollars deposited with the custodian by the fund. The amount of the credit, for the year ended February 28, 2023, is shown as a reduction of total expenses in the Statement of Operations.
Tax Matters and Distributions — The fund intends to qualify as a regulated investment company, as defined under Subchapter M of the Internal Revenue Code, and to distribute all of its taxable income, including realized capital gains. As a result, no provision for federal income tax is required. The fund’s federal tax returns, when filed, will remain subject to examination by the Internal Revenue Service for a three year period. Management has analyzed the fund’s tax positions taken on federal and state tax returns for all open tax years and does not believe that there are any uncertain tax positions that require recognition of a tax liability. Foreign taxes, if any, have been accrued by the fund in the accompanying financial statements in accordance with the applicable foreign tax law. Foreign income taxes may be withheld by certain countries in which the fund invests. Additionally, capital gains realized by the fund on securities issued in or by certain foreign countries may be subject to capital gains tax imposed by those countries.
Distributions to shareholders are recorded on the ex-dividend date. Income and capital gain distributions are determined in accordance with income tax regulations, which may differ from U.S. generally accepted accounting principles. Certain capital accounts in the financial statements are periodically adjusted for permanent differences in order to reflect their tax character. These adjustments have no impact on net assets or net
Notes to Financial Statements - continued
asset value per share. Temporary differences which arise from recognizing certain items of income, expense, gain or loss in different periods for financial statement and tax purposes will reverse at some time in the future.
Book/tax differences primarily relate to defaulted bonds, amortization and accretion of debt securities, wash sale loss deferrals, and derivative transactions.
The tax character of distributions declared to shareholders for the last two fiscal years is as follows:
| | Year ended
2/28/23 | Year ended
2/28/22 |
| Ordinary income (including any short-term capital gains) | $95,051,016 | $112,252,493 |
| Long-term capital gains | 36,312,822 | 62,556,937 |
| Total distributions | $131,363,838 | $174,809,430 |
The federal tax cost and the tax basis components of distributable earnings were as follows:
| As of 2/28/23 | |
| Cost of investments | $2,659,167,616 |
| Gross appreciation | 172,767,557 |
| Gross depreciation | (242,363,378) |
| Net unrealized appreciation (depreciation) | $(69,595,821) |
| Undistributed ordinary income | 16,377,528 |
| Capital loss carryforwards | (47,228,379) |
| Other temporary differences | (8,485,112) |
| Total distributable earnings (loss) | $(108,931,784) |
As of February 28, 2023, the fund had capital loss carryforwards available to offset future realized gains. These net capital losses may be carried forward indefinitely and their character is retained as short-term and/or long-term losses. Such losses are characterized as follows:
Multiple Classes of Shares of Beneficial Interest — The fund offers multiple classes of shares, which differ in their respective distribution and service fees. The fund's income and common expenses are allocated to shareholders based on the value of settled shares outstanding of each class. The fund's realized and unrealized gain (loss) are allocated to shareholders based on the daily net assets of each class. Dividends are declared separately for each class. Differences in per share dividend rates are generally due to differences in separate class expenses. Class C shares will convert to Class A
Notes to Financial Statements - continued
shares approximately eight years after purchase. The fund’s distributions declared to shareholders as reported in the Statements of Changes in Net Assets are presented by class as follows:
| | Year
ended
2/28/23 | | Year
ended
2/28/22 |
| Class A | $62,915,628 | | $80,153,863 |
| Class C | 10,456,513 | | 16,876,828 |
| Class I | 45,334,899 | | 61,796,880 |
| Class R1 | 7,733 | | 11,007 |
| Class R2 | 54,720 | | 89,714 |
| Class R3 | 959,124 | | 1,143,825 |
| Class R4 | 226,361 | | 406,553 |
| Class R6 | 11,408,860 | | 14,330,760 |
| Total | $131,363,838 | | $174,809,430 |
(3) Transactions with Affiliates
Investment Adviser — The fund has an investment advisory agreement with MFS to provide overall investment management and related administrative services and facilities to the fund. For the period form March 1, 2022 through July 31, 2022, the management fee was computed daily and paid monthly at the following annual rates based on the fund's average daily net assets:
| Up to $1 billion | 0.65% |
| In excess of $1 billion and up to $2.5 billion | 0.60% |
| In excess of $2.5 billion and up to $5 billion | 0.55% |
| In excess of $5 billion | 0.50% |
Effective August 1, 2022, the management fee is computed daily and paid monthly at the following annual rates based on the fund's average daily net assets:
| Up to $5 billion | 0.55% |
| In excess of $5 billion | 0.50% |
MFS has agreed in writing to reduce its management fee by a specified amount if certain MFS mutual fund assets exceed thresholds agreed to by MFS and the fund's Board of Trustees. MFS has also agreed in writing to waive at least 0.01% of its management fee as part of this agreement. The agreement to waive at least 0.01% of the management fee will continue until modified by the fund's Board of Trustees, but such agreement will continue at least until June 30, 2023. For the year ended February 28, 2023, this management fee reduction amounted to $398,041, which is included in the reduction of total expenses in the Statement of Operations. The management fee incurred for the year ended February 28, 2023 was equivalent to an annual effective rate of 0.56% of the fund’s average daily net assets.
For the period from March 1, 2022 through July 31, 2022, the investment adviser had agreed in writing to pay a portion of the fund’s total annual operating expenses, excluding interest, taxes, extraordinary expenses, brokerage and transaction costs, certain tax reclaim recovery expenses (including contingency fees and closing agreement expenses), and investment-related expenses (such as fees and expenses
Notes to Financial Statements - continued
associated with investments in investment companies and other similar investment vehicles), such that total fund operating expenses did not exceed the following rates annually of each class’s average daily net assets:
| | | | Classes | | | | |
| A | C | I | R1 | R2 | R3 | R4 | R6 |
| 1.10% | 1.85% | 0.85% | 1.85% | 1.35% | 1.10% | 0.85% | 0.79% |
This written agreement terminated on July 31, 2022. For the period from March 1, 2022 through July 31, 2022, the fund’s actual operating expenses did not exceed the limit and therefore, the investment adviser did not pay any portion of the fund’s expenses related to this agreement.
Effective August 1, 2022, the investment adviser has agreed in writing to pay a portion of the fund’s total annual operating expenses, excluding interest, taxes, extraordinary expenses, brokerage and transaction costs, certain tax reclaim recovery expenses (including contingency fees and closing agreement expenses), and investment-related expenses, such that total fund operating expenses do not exceed the following rates annually of each class’s average daily net assets:
| | | | Classes | | | | |
| A | C | I | R1 | R2 | R3 | R4 | R6 |
| 0.89% | 1.64% | 0.64% | 1.64% | 1.14% | 0.89% | 0.64% | 0.55% |
This written agreement will continue until modified by the fund’s Board of Trustees, but such agreement will continue at least until June 30, 2024. For the period from August 1, 2022 through February 28, 2023, this reduction amounted to $658,676 which is included in the reduction of total expenses in the Statement of Operations.
Distributor — MFS Fund Distributors, Inc. (MFD), a wholly-owned subsidiary of MFS, as distributor, received $25,703 for the year ended February 28, 2023, as its portion of the initial sales charge on sales of Class A shares of the fund.
The Board of Trustees has adopted a distribution plan for certain share classes pursuant to Rule 12b-1 of the Investment Company Act of 1940.
The fund's distribution plan provides that the fund will pay MFD for services provided by MFD and financial intermediaries in connection with the distribution and servicing of certain share classes. One component of the plan is a distribution fee paid to MFD and another component of the plan is a service fee paid to MFD. MFD may subsequently pay all, or a portion, of the distribution and/or service fees to financial intermediaries.
Notes to Financial Statements - continued
Distribution Plan Fee Table:
| | Distribution
Fee Rate (d) | Service
Fee Rate (d) | Total
Distribution
Plan (d) | Annual
Effective
Rate (e) | Distribution
and Service
Fee |
| Class A | — | 0.25% | 0.25% | 0.25% | $ 3,480,198 |
| Class C | 0.75% | 0.25% | 1.00% | 1.00% | 2,786,627 |
| Class R1 | 0.75% | 0.25% | 1.00% | 1.00% | 2,006 |
| Class R2 | 0.25% | 0.25% | 0.50% | 0.50% | 6,567 |
| Class R3 | — | 0.25% | 0.25% | 0.25% | 52,969 |
| Total Distribution and Service Fees | | | | | $6,328,367 |
| (d) | In accordance with the distribution plan for certain classes, the fund pays distribution and/or service fees equal to these annual percentage rates of each class’s average daily net assets. The distribution and service fee rates disclosed by class represent the current rates in effect at the end of the reporting period. Any rate changes, if applicable, are detailed below. |
| (e) | The annual effective rates represent actual fees incurred under the distribution plan for the year ended February 28, 2023 based on each class's average daily net assets. MFD has voluntarily agreed to rebate a portion of each class's 0.25% service fee attributable to accounts for which there is no financial intermediary specified on the account except for accounts attributable to MFS or its affiliates' seed money. For the year ended February 28, 2023, this rebate amounted to $173 for Class A shares, respectively, and is included in the reduction of total expenses in the Statement of Operations. |
Certain Class A shares are subject to a contingent deferred sales charge (CDSC) in the event of a shareholder redemption within 18 months of purchase. Class C shares are subject to a CDSC in the event of a shareholder redemption within 12 months of purchase. All contingent deferred sales charges are paid to MFD and during the year ended February 28, 2023, were as follows:
| | Amount |
| Class A | $73,643 |
| Class C | 8,698 |
Shareholder Servicing Agent — MFS Service Center, Inc. (MFSC), a wholly-owned subsidiary of MFS, receives a fee from the fund for its services as shareholder servicing agent calculated as a percentage of the average daily net assets of the fund as determined periodically under the supervision of the fund's Board of Trustees. For the year ended February 28, 2023, the fee was $170,668, which equated to 0.0059% annually of the fund's average daily net assets. MFSC also receives reimbursement from the fund for out-of-pocket expenses, sub-accounting and other shareholder servicing costs which may be paid to affiliated and unaffiliated service providers. Class R6 shares do not incur sub-accounting fees. For the year ended February 28, 2023, these out-of-pocket expenses, sub-accounting and other shareholder servicing costs amounted to $2,468,171.
Administrator — MFS provides certain financial, legal, shareholder communications, compliance, and other administrative services to the fund. Under an administrative services agreement, the fund reimburses MFS the costs incurred to provide these services. The fund is charged an annual fixed amount of $17,500 plus a fee based on average daily net assets. The administrative services fee incurred for the year ended February 28, 2023 was equivalent to an annual effective rate of 0.0161% of the fund's average daily net assets.
Notes to Financial Statements - continued
Trustees’ and Officers’ Compensation — The fund pays compensation to independent Trustees in the form of a retainer, attendance fees, and additional compensation to Board and Committee chairpersons. The fund does not pay compensation directly to Trustees or officers of the fund who are also officers of the investment adviser, all of whom receive remuneration from MFS for their services to the fund. Certain officers and Trustees of the fund are officers or directors of MFS, MFD, and MFSC.
Other — The fund invests in the MFS Institutional Money Market Portfolio which is managed by MFS and seeks current income consistent with preservation of capital and liquidity. This money market fund does not pay a management fee to MFS but does incur investment and operating costs.
The fund invests in the MFS High Yield Pooled Portfolio, which is a mutual fund advised by MFS that does not pay management fees to MFS and does not pay distribution and/or service fees to MFD, but does incur investment and operating costs. The fund invests in MFS High Yield Pooled Portfolio to gain exposure to high income debt instruments, rather than investing in high income debt instruments directly. Income earned on this investment is included in “Dividends from affiliated issuers” in the Statement of Operations.
On August 3, 2022, MFS redeemed 21 shares of Class R2 for an aggregate amount of $249.
On August 3, 2022, MFS redeemed 20 shares of Class R6 for an aggregate amount of $237.
The adviser has voluntarily undertaken to reimburse the fund from its own resources on a quarterly basis for the cost of investment research embedded in the cost of the fund’s securities trades. This agreement may be rescinded at any time. For the year ended February 28, 2023, this reimbursement amounted to $69,977, which is included in “Other” income in the Statement of Operations.
(4) Portfolio Securities
For the year ended February 28, 2023, purchases and sales of investments, other than purchased options with an expiration date of less than one year from the time of purchase and short-term obligations, were as follows:
| | Purchases | Sales |
| U.S. Government securities | $839,599,018 | $711,130,754 |
| Non-U.S. Government securities | 874,202,811 | 1,543,339,083 |
Notes to Financial Statements - continued
(5) Shares of Beneficial Interest
The fund's Declaration of Trust permits the Trustees to issue an unlimited number of full and fractional shares of beneficial interest. Transactions in fund shares were as follows:
| | Year ended
2/28/23 | | Year ended
2/28/22 |
| | Shares | Amount | | Shares | Amount |
| Shares sold | | | | | |
| Class A | 14,774,136 | $174,356,080 | | 14,607,047 | $198,557,562 |
| Class C | 944,302 | 11,158,682 | | 1,711,416 | 23,298,433 |
| Class I | 10,662,576 | 126,908,598 | | 16,504,267 | 224,664,063 |
| Class R1 | 1,874 | 22,246 | | 6,820 | 93,515 |
| Class R2 | 10,736 | 127,045 | | 20,842 | 284,007 |
| Class R3 | 286,020 | 3,366,042 | | 226,162 | 3,076,702 |
| Class R4 | 33,848 | 398,607 | | 120,292 | 1,623,061 |
| Class R6 | 3,524,722 | 41,388,166 | | 3,701,055 | 50,342,326 |
| | 30,238,214 | $357,725,466 | | 36,897,901 | $501,939,669 |
Shares issued to shareholders
in reinvestment of distributions | | | | | |
| Class A | 5,070,118 | $59,553,596 | | 5,582,553 | $75,785,017 |
| Class C | 837,455 | 9,851,187 | | 1,161,810 | 15,773,452 |
| Class I | 3,225,812 | 37,924,405 | | 3,782,563 | 51,329,884 |
| Class R1 | 653 | 7,678 | | 809 | 10,977 |
| Class R2 | 4,647 | 54,626 | | 6,579 | 89,333 |
| Class R3 | 81,598 | 957,903 | | 84,146 | 1,142,993 |
| Class R4 | 19,182 | 225,843 | | 29,898 | 406,227 |
| Class R6 | 939,612 | 11,034,589 | | 1,018,378 | 13,826,069 |
| | 10,179,077 | $119,609,827 | | 11,666,736 | $158,363,952 |
| Shares reacquired | | | | | |
| Class A | (27,576,832) | $(322,612,726) | | (19,136,980) | $(259,994,737) |
| Class C | (10,091,221) | (118,516,947) | | (10,093,308) | (136,833,130) |
| Class I | (31,441,612) | (368,467,110) | | (19,524,445) | (264,711,290) |
| Class R1 | (4,267) | (48,165) | | (8,494) | (115,225) |
| Class R2 | (30,572) | (377,408) | | (39,154) | (529,170) |
| Class R3 | (199,120) | (2,335,392) | | (318,717) | (4,323,050) |
| Class R4 | (156,023) | (1,831,518) | | (342,221) | (4,608,637) |
| Class R6 | (5,110,900) | (59,819,131) | | (4,853,890) | (65,737,300) |
| | (74,610,547) | $(874,008,397) | | (54,317,209) | $(736,852,539) |
Notes to Financial Statements - continued
| | Year ended
2/28/23 | | Year ended
2/28/22 |
| | Shares | Amount | | Shares | Amount |
| Net change | | | | | |
| Class A | (7,732,578) | $(88,703,050) | | 1,052,620 | $14,347,842 |
| Class C | (8,309,464) | (97,507,078) | | (7,220,082) | (97,761,245) |
| Class I | (17,553,224) | (203,634,107) | | 762,385 | 11,282,657 |
| Class R1 | (1,740) | (18,241) | | (865) | (10,733) |
| Class R2 | (15,189) | (195,737) | | (11,733) | (155,830) |
| Class R3 | 168,498 | 1,988,553 | | (8,409) | (103,355) |
| Class R4 | (102,993) | (1,207,068) | | (192,031) | (2,579,349) |
| Class R6 | (646,566) | (7,396,376) | | (134,457) | (1,568,905) |
| | (34,193,256) | $(396,673,104) | | (5,752,572) | $(76,548,918) |
(6) Line of Credit
The fund and certain other funds managed by MFS participate in a $1.45 billion unsecured committed line of credit of which $1.2 billion is reserved for use by the fund and certain other MFS U.S. funds. The line of credit is provided by a syndicate of banks under a credit agreement. Borrowings may be made for temporary financing needs. Interest is charged to each fund, based on its borrowings, generally at a rate equal to the highest of 1) Daily Simple SOFR (Secured Overnight Financing Rate) plus 0.10%, 2) the Federal Funds Effective Rate, or 3) the Overnight Bank Funding Rate, each plus an agreed upon spread. A commitment fee, based on the average daily unused portion of the committed line of credit, is allocated among the participating funds. The line of credit expires on March 14, 2024 unless extended or renewed. In addition, the fund and other funds managed by MFS have established unsecured uncommitted borrowing arrangements with certain banks for temporary financing needs. Interest is charged to each fund, based on its borrowings, at rates equal to customary reference rates plus an agreed upon spread. For the year ended February 28, 2023, the fund’s commitment fee and interest expense were $14,074 and $0, respectively, and are included in “Miscellaneous” expense in the Statement of Operations.
Notes to Financial Statements - continued
(7) Investments in Affiliated Issuers
An affiliated issuer may be considered one in which the fund owns 5% or more of the outstanding voting securities, or a company which is under common control. For the purposes of this report, the following were affiliated issuers:
| Affiliated Issuers | Beginning
Value | Purchases | Sales
Proceeds | Realized
Gain
(Loss) | Change in
Unrealized
Appreciation or
Depreciation | Ending
Value |
| MFS High Yield Pooled Portfolio | $809,235,637 | $59,220,377 | $200,214,510 | $(21,043,061) | $(55,822,204) | $591,376,239 |
| MFS Institutional Money Market Portfolio | 106,862,112 | 1,280,610,750 | 1,235,557,861 | (7,712) | 10,388 | 151,917,677 |
| | $916,097,749 | $1,339,831,127 | $1,435,772,371 | $(21,050,773) | $(55,811,816) | $743,293,916 |
| Affiliated Issuers | Dividend
Income | Capital Gain
Distributions |
| MFS High Yield Pooled Portfolio | $38,492,773 | $— |
| MFS Institutional Money Market Portfolio | 3,664,860 | — |
| | $42,157,633 | $— |
(8) LIBOR Transition
Certain of the fund's investments, including investments in certain debt instruments and derivatives (if any), as well as borrowings by the fund and certain other contractual arrangements of the fund, may be based on the London Interbank Offered Rate (“LIBOR”). In 2017, the regulatory authority that oversees financial services firms in the United Kingdom announced plans to transition away from LIBOR by the end of 2021. In March 2021, the administrator of LIBOR announced the extension of the publication of the more commonly used U.S. dollar LIBOR settings to the end of June 2023. Although the full impacts of the transition away from LIBOR are not fully known, the transition may result in, among other things, an increase in volatility or illiquidity of the markets for instruments that currently rely on LIBOR to determine interest rates and this could have an adverse impact on the fund's performance. With respect to the fund's accounting for investments, including investments in certain debt instruments and derivatives, as well as borrowings by the fund and any other contractual arrangements of the fund that undergo reference rate-related modifications as a result of the transition, management will rely upon the relief provided by FASB Codification Topic 848 – Reference Rate Reform (Topic 848). The guidance in Topic 848 permits the fund to account for those modified contracts as a continuation of the existing contracts. The situation remains fluid, and management believes, based on best available information, that the impact of the transition will not be material to the fund.
(9) Russia and Ukraine Conflict
The fund invests in securities and/or derivative instruments that are economically tied to Russia and/or Ukraine. Escalation of the conflict between Russia and Ukraine in late February 2022 caused market volatility and disruption in the tradability of Russian securities, including closure of the local securities market, temporary restriction on
Notes to Financial Statements - continued
securities sales by non-residents, and disruptions to clearance and payment systems. To the extent that the fund is unable to sell securities, whether due to market constraints or to the sanctions imposed on Russia by the United States and other countries, those securities are considered illiquid and the value of those securities reflects their illiquid classification. Management continues to monitor these events and to evaluate the related impacts on fund performance.
(10) Subsequent Event
On March 30, 2023, the fund announced that effective after the close of business on September 29, 2023, purchases of Class R1 and Class R2 shares will be closed to new eligible investors.
Report of Independent Registered Public Accounting Firm
To the Shareholders of MFS Diversified Income Fund and the Board of Trustees of MFS Series Trust XIII
Opinion on the Financial Statements
We have audited the accompanying statement of assets and liabilities of MFS Diversified Income Fund (the “Fund”) (one of the funds constituting MFS Series Trust XIII (the “Trust”)), including the portfolio of investments, as of February 28, 2023, and the related statement of operations for the year then ended, the statements of changes in net assets for each of the two years in the period then ended, the financial highlights for each of the five years in the period then ended and the related notes (collectively referred to as the “financial statements”). In our opinion, the financial statements present fairly, in all material respects, the financial position of the Fund (one of the funds constituting MFS Series Trust XIII) at February 28, 2023, the results of its operations for the year then ended, the changes in its net assets for each of the two years in the period then ended and its financial highlights for each of the five years in the period then ended, in conformity with U.S. generally accepted accounting principles.
Basis for Opinion
These financial statements are the responsibility of the Trust’s management. Our responsibility is to express an opinion on the Fund’s financial statements based on our audits. We are a public accounting firm registered with the Public Company Accounting Oversight Board (United States) (“PCAOB”) and are required to be independent with respect to the Trust in accordance with the U.S. federal securities laws and the applicable rules and regulations of the Securities and Exchange Commission and the PCAOB.
We conducted our audits in accordance with the standards of the PCAOB. Those standards require that we plan and perform the audit to obtain reasonable assurance about whether the financial statements are free of material misstatement, whether due to error or fraud. The Trust is not required to have, nor were we engaged to perform, an audit of the Trust’s internal control over financial reporting. As part of our audits, we are required to obtain an understanding of internal control over financial reporting, but not for the purpose of expressing an opinion on the effectiveness of the Trust’s internal control over financial reporting. Accordingly, we express no such opinion.
Report of Independent Registered Public Accounting Firm – continued
Our audits included performing procedures to assess the risks of material misstatement of the financial statements, whether due to error or fraud, and performing procedures that respond to those risks. Such procedures included examining, on a test basis, evidence regarding the amounts and disclosures in the financial statements. Our procedures included confirmation of securities owned as of February 28, 2023, by correspondence with the custodian, brokers and others; when replies were not received from brokers and others, we performed other auditing procedures. Our audits also included evaluating the accounting principles used and significant estimates made by management, as well as evaluating the overall presentation of the financial statements. We believe that our audits provide a reasonable basis for our opinion.
We have served as the auditor of one or more MFS investment companies since 1993.
Boston, Massachusetts
April 14, 2023
Trustees and Officers — Identification and Background
The Trustees and Officers of the Trust, as of April 1, 2023, are listed below, together with their principal occupations during the past five years. (Their titles may have varied during that period.) The address of each Trustee and Officer is 111 Huntington Avenue, Boston, Massachusetts 02199-7618.
| Name, Age | | Position(s) Held with Fund | | Trustee/Officer Since(h) | | Number of MFS Funds overseen by the Trustee | | Principal Occupations During
the Past Five Years | | Other Directorships During
the Past Five Years (j) |
| INTERESTED TRUSTEE | | | | | | | | | | |
Michael W. Roberge (k)
(age 56) | | Trustee | | January 2021 | | 136 | | Massachusetts Financial Services Company, Chairman (since January 2021); Chief Executive Officer (since January 2017); Director; Chairman of the Board (since January 2022); President (until December 2018); Chief Investment Officer (until December 2018) | | N/A |
| INDEPENDENT TRUSTEES | | | | | | | | | | |
John P. Kavanaugh
(age 68) | | Trustee and Chair of Trustees | | January 2009 | | 136 | | Private investor | | N/A |
Steven E. Buller
(age 71) | | Trustee | | February 2014 | | 136 | | Private investor | | N/A |
John A. Caroselli
(age 68) | | Trustee | | March 2017 | | 136 | | Private investor; JC Global Advisors, LLC (management consulting), President (since 2015) | | N/A |
Maureen R. Goldfarb
(age 67) | | Trustee | | January 2009 | | 136 | | Private investor | | N/A |
Peter D. Jones
(age 67) | | Trustee | | January 2019 | | 136 | | Private investor | | N/A |
James W. Kilman, Jr.
(age 61) | | Trustee | | January 2019 | | 136 | | Burford Capital Limited (finance and investment management), Senior Advisor (since May 3, 2021), Chief Financial Officer (2019 - May 2, 2021); KielStrand Capital LLC (family office), Chief Executive Officer (since 2016) | | Alpha-En Corporation, Director (2016-2019) |
Trustees and Officers - continued
| Name, Age | | Position(s) Held with Fund | | Trustee/Officer Since(h) | | Number of MFS Funds overseen by the Trustee | | Principal Occupations During
the Past Five Years | | Other Directorships During
the Past Five Years (j) |
Clarence Otis, Jr.
(age 66) | | Trustee | | March 2017 | | 136 | | Private investor | | VF Corporation, Director; Verizon Communications, Inc., Director; The Travelers Companies, Director |
Maryanne L. Roepke
(age 67) | | Trustee | | May 2014 | | 136 | | Private investor | | N/A |
Laurie J. Thomsen
(age 65) | | Trustee | | March 2005 | | 136 | | Private investor | | The Travelers Companies, Director; Dycom Industries, Inc., Director |
| Name, Age | | Position(s) Held with
Fund | | Trustee/Officer Since(h) | | Number of MFS Funds for which the Person is an Officer | | Principal Occupations During
the Past Five Years |
| OFFICERS | | | | | | | | |
Christopher R. Bohane (k)
(age 49) | | Assistant Secretary and Assistant Clerk | | July 2005 | | 136 | | Massachusetts Financial Services Company, Senior Vice President and Senior Managing Counsel |
Kino Clark (k)
(age 54) | | Assistant Treasurer | | January 2012 | | 136 | | Massachusetts Financial Services Company, Vice President |
John W. Clark, Jr. (k)
(age 56) | | Assistant Treasurer | | April 2017 | | 136 | | Massachusetts Financial Services Company, Vice President |
David L. DiLorenzo (k)
(age 54) | | President | | July 2005 | | 136 | | Massachusetts Financial Services Company, Senior Vice President |
Heidi W. Hardin (k)
(age 55) | | Secretary and Clerk | | April 2017 | | 136 | | Massachusetts Financial Services Company, Executive Vice President and General Counsel |
Brian E. Langenfeld (k)
(age 50) | | Assistant Secretary and Assistant Clerk | | June 2006 | | 136 | | Massachusetts Financial Services Company, Vice President and Managing Counsel |
Trustees and Officers - continued
| Name, Age | | Position(s) Held with
Fund | | Trustee/Officer Since(h) | | Number of MFS Funds for which the Person is an Officer | | Principal Occupations During
the Past Five Years |
Rosa E. Licea-Mailloux (k)
(age 46) | | Chief Compliance Officer | | March 2022 | | 136 | | Massachusetts Financial Services Company, Vice President (since 2018); Director of Corporate Compliance (2018-2021), Senior Director Compliance (2021-2022), Senior Managing Director of North American Compliance & Chief Compliance Officer (since March 2022); Natixis Investment Managers (investment management), Funds Chief Compliance Officer, Deputy General Counsel & Senior Vice President (until 2018) |
Amanda S. Mooradian (k)
(age 44) | | Assistant Secretary and Assistant Clerk | | September 2018 | | 136 | | Massachusetts Financial Services Company, Assistant Vice President and Senior Counsel |
Susan A. Pereira (k)
(age 52) | | Assistant Secretary and Assistant Clerk | | July 2005 | | 136 | | Massachusetts Financial Services Company, Vice President and Managing Counsel |
Kasey L. Phillips (k)
(age 52) | | Assistant Treasurer | | September 2012 | | 136 | | Massachusetts Financial Services Company, Vice President |
Matthew A. Stowe (k)
(age 48) | | Assistant Secretary and Assistant Clerk | | October 2014 | | 136 | | Massachusetts Financial Services Company, Vice President and Senior Managing Counsel |
William B. Wilson (k)
(age 40) | | Assistant Secretary and Assistant Clerk | | October 2022 | | 136 | | Massachusetts Financial Services Company, Assistant Vice President and Senior Counsel |
James O. Yost (k)
(age 62) | | Treasurer | | September 1990 | | 136 | | Massachusetts Financial Services Company, Senior Vice President |
| (h) | Date first appointed to serve as Trustee/Officer of an MFS Fund. Each Trustee has served continuously since appointment unless indicated otherwise. From January 2012 through December 2016, Messrs. DiLorenzo and Yost served as Treasurer and Deputy Treasurer of the Funds, respectively. |
| (j) | Directorships or trusteeships of companies required to report to the Securities and Exchange Commission (i.e., “public companies”). |
| (k) | “Interested person” of the Trust within the meaning of the Investment Company Act of 1940 (referred to as the 1940 Act), which is the principal federal law governing investment companies like the fund, as a result of a position with MFS. The address of MFS is 111 Huntington Avenue, Boston, Massachusetts 02199-7618. |
Trustees and Officers - continued
Each Trustee (other than Messrs. Jones, Kilman and Roberge) has been elected by shareholders and each Trustee and Officer holds office until his or her successor is chosen and qualified or until his or her earlier death, resignation, retirement or removal. Mr. Roberge became a Trustee of the Funds on January 1, 2021 and Messrs. Jones and Kilman became Trustees of the Funds on January 1, 2019. The Trust does not hold annual meetings for the purpose of electing Trustees, and Trustees are not elected for fixed terms. Under the terms of the Board's retirement policy, an Independent Trustee shall retire at the end of the calendar year in which he or she reaches the earlier of 75 years of age or 15 years of service on the Board (or, in the case of any Independent Trustee who joined the Board prior to 2015, 20 years of service on the Board).
Messrs. Buller, Kilman and Otis and Ms. Roepke are members of the Trust’s Audit Committee.
Each of the Interested Trustees and certain Officers hold comparable officer positions with certain affiliates of MFS.
The Statement of Additional Information for a Fund includes further information about the Trustees and is available without charge upon request by calling 1-800-225-2606.
| Investment Adviser | Custodian |
Massachusetts Financial Services Company
111 Huntington Avenue
Boston, MA 02199-7618 | JPMorgan Chase Bank, NA
4 Metrotech Center
New York, NY 11245 |
| Distributor | Independent Registered Public Accounting Firm |
MFS Fund Distributors, Inc.
111 Huntington Avenue
Boston, MA 02199-7618 | Ernst & Young LLP
200 Clarendon Street
Boston, MA 02116 |
| Portfolio Manager(s) | |
Robert Almeida
Neeraj Arora
David Cole
Rick Gable
Alexander Mackey
John Mitchell
Matt Ryan
Jonathan Sage
Geoffrey Schechter
Michael Skatrud | |
Proxy Voting Policies and Information
MFS votes proxies on behalf of the fund pursuant to proxy voting policies and procedures that are available without charge, upon request, by calling 1-800-225-2606, by visiting mfs.com/proxyvoting, or by visiting the SEC’s Web site at http://www.sec.gov.
Information regarding how the fund voted proxies relating to portfolio securities during the most recent twelve-month period ended June 30 is available by August 31 of each year without charge by visiting mfs.com/proxyvoting, or by visiting the SEC’s Web site at http://www.sec.gov.
Quarterly Portfolio Disclosure
The fund files a complete schedule of portfolio holdings with the SEC for the first and third quarters of each fiscal year as an exhibit to its reports on Form N-PORT. The fund's Form N-PORT reports are available on the SEC's Web site at http://www.sec.gov. A shareholder can obtain the portfolio holdings report for the first and third quarters of the fund's fiscal year at mfs.com/openendfunds by choosing the fund's name and then scrolling to the “Resources” section and clicking on the “Prospectus and Reports” tab.
Further Information
From time to time, MFS may post important information about the fund or the MFS Funds on the MFS Web site (mfs.com). This information is available at https://www.mfs.com/announcements or at mfs.com/openendfunds by choosing the fund’s name and then scrolling to the “Resources” section and clicking on the “Announcements” tab, if any.
Information About Fund Contracts and Legal Claims
The fund has entered into contractual arrangements with an investment adviser, administrator, distributor, shareholder servicing agent, and custodian who each provide services to the fund. Unless expressly stated otherwise, shareholders are not parties to, or intended beneficiaries of these contractual arrangements, and these contractual arrangements are not intended to create any shareholder right to enforce them against the service providers or to seek any remedy under them against the service providers, either directly or on behalf of the fund.
Under the Trust’s By-Laws and Declaration of Trust, any claims asserted against or on behalf of the MFS Funds, including claims against Trustees and Officers, must be brought in state and federal courts located within the Commonwealth of Massachusetts.
Federal Tax Information (unaudited)
The fund will notify shareholders of amounts for use in preparing 2023 income tax forms in January 2024. The following information is provided pursuant to provisions of the Internal Revenue Code.
The fund designates the maximum amount allowable as qualified dividend income eligible to be taxed at the same rate as long-term capital gain.
The fund designates $39,945,000 as capital gain dividends paid during the fiscal year.
For corporate shareholders, 7.92% of the ordinary income dividends paid during the fiscal year qualify for the corporate dividends received deduction.
Federal Tax Information (unaudited) - continued
The fund designates the maximum amount allowable as Section 199A dividends as defined in Proposed Treasury Regulation §1.199A-3(d).
The fund intends to pass through the maximum amount allowable as Section 163(j) Interest Dividends as defined in Treasury Regulation §1.163(j)-1(b).
| FACTS | WHAT DOES MFS DO WITH YOUR PERSONAL INFORMATION? |
| Why? | Financial companies choose how they share your personal information. Federal law gives consumers the right to limit some but not all sharing. Federal law also requires us to tell you how we collect, share, and protect your personal information. Please read this notice carefully to understand what we do. |
| What? | The types of personal information we collect and share depend on the product or service you have with us. This information can include: |
| • Social Security number and account balances |
| • Account transactions and transaction history |
| • Checking account information and wire transfer instructions |
| When you are no longer our customer, we continue to share your information as described in this notice. |
| How? | All financial companies need to share customers' personal information to run their everyday business. In the section below, we list the reasons financial companies can share their customers' personal information; the reasons MFS chooses to share; and whether you can limit this sharing. |
Reasons we can share your
personal information | Does MFS share? | Can you limit
this sharing? |
For our everyday business purposes –
such as to process your transactions, maintain your
account(s), respond to court orders and legal
investigations, or report to credit bureaus | Yes | No |
For our marketing purposes –
to offer our products and services to you | No | We don't share |
For joint marketing with other
financial companies | No | We don't share |
For our affiliates' everyday business purposes –
information about your transactions and experiences | No | We don't share |
For our affiliates' everyday business purposes –
information about your creditworthiness | No | We don't share |
| For nonaffiliates to market to you | No | We don't share |
| Questions? | Call 800-225-2606 or go to mfs.com. |
| Who we are |
| Who is providing this notice? | MFS Funds, MFS Investment Management, MFS Institutional Advisors, Inc., and MFS Heritage Trust Company. |
| What we do |
How does MFS
protect my personal
information? | To protect your personal information from unauthorized access and use, we use security measures that comply with federal law. These measures include procedural, electronic, and physical safeguards for the protection of the personal information we collect about you. |
How does MFS
collect my personal
information? | We collect your personal information, for example, when you |
| • open an account or provide account information |
| • direct us to buy securities or direct us to sell your securities |
| • make a wire transfer |
| We also collect your personal information from others, such as credit bureaus, affiliates, or other companies. |
| Why can't I limit all sharing? | Federal law gives you the right to limit only |
| • sharing for affiliates' everyday business purposes – information about your creditworthiness |
| • affiliates from using your information to market to you |
| • sharing for nonaffiliates to market to you |
| State laws and individual companies may give you additional rights to limit sharing. |
| Definitions |
| Affiliates | Companies related by common ownership or control. They can be financial and nonfinancial companies. |
| • MFS does not share personal information with affiliates, except for everyday business purposes as described on page one of this notice. |
| Nonaffiliates | Companies not related by common ownership or control. They can be financial and nonfinancial companies. |
| • MFS does not share with nonaffiliates so they can market to you. |
| Joint marketing | A formal agreement between nonaffiliated financial companies that together market financial products or services to you. |
| • MFS doesn't jointly market. |
| Other important information |
| If you own an MFS product or receive an MFS service in the name of a third party such as a bank or broker-dealer, their privacy policy may apply to you instead of ours. |
Save paper with eDelivery.
MFS® will send you prospectuses, reports, and proxies directly via e-mail so you will get information faster with less mailbox clutter.
To sign up:
1. Go to mfs.com.
2. Log in via MFS® Access.
3. Select eDelivery.
If you own your MFS fund shares through a financial institution or a retirement plan, MFS® TALK, MFS® Access, or eDelivery may not be available to you.
CONTACT
WEB SITE
mfs.com
MFS TALK
1-800-637-8255
24 hours a day
ACCOUNT SERVICE AND LITERATURE
Shareholders
1-800-225-2606
Financial advisors
1-800-343-2829
Retirement plan services
1-800-637-1255
MAILING ADDRESS
MFS Service Center, Inc.
P.O. Box 219341
Kansas City, MO 64121-9341
OVERNIGHT MAIL
MFS Service Center, Inc.
Suite 219341
430 W 7th Street
Kansas City, MO 64105-1407
Annual Report
February 28, 2023
MFS® Government
Securities Fund
MFS® Government
Securities Fund
| 1 |
| 2 |
| 4 |
| 6 |
| 9 |
| 11 |
| 19 |
| 21 |
| 22 |
| 23 |
| 29 |
| 43 |
| 45 |
| 49 |
| 49 |
| 49 |
| 49 |
| 49 |
| 50 |
The report is prepared for the general information of shareholders. It is authorized for distribution to prospective investors only when preceded or accompanied by a current prospectus.
NOT FDIC INSURED • MAY LOSE VALUE • NO BANK GUARANTEE
LETTER FROM THE CHAIR AND CEO
Dear Shareholders:
Markets — which rallied in late 2022 and early 2023 on signs of peaking inflation, hopes that monetary policy tightening cycles may be nearing an end and a rapid reopening of China’s economy — have hit turbulence after the sudden collapse of two US regional banks and the government-led merger of Switzerland’s two largest lenders. At the same time, US inflation data suggest that price pressures will prove more persistent than expected, making the US Federal Reserve’s job of trying to corral four-decade-high inflation without tipping the economy into recession that much more difficult. On a positive note, markets have largely adjusted to the challenges posed by Russia’s invasion of Ukraine, thanks in part to mild European winter weather that has alleviated concerns over potential near-term shortages of natural gas. Resilient labor markets in much of the developed world have further contributed to a brighter-than-expected economic backdrop. However, after the recent banking turmoil, investors are increasingly mindful that the lagged effects of ongoing monetary policy tightening have yet to fully work their way through the global economy.
One result of the banking crisis has been a rally in global government bond markets as investors sense that the global monetary tightening campaign is nearing its end, and the resulting lower yields have eased some of the pressure on interest rate–sensitive parts of the economy. Over the near term, amid tighter financial conditions, we feel companies will face a challenging earnings backdrop as they are forced to absorb higher input and labor costs while pricing power dwindles. As for fixed income, the rise in interest rates in recent months has made bonds more attractive than they have been in years, which may provide balance for investors’ portfolios.
During times of market transition, it is important to have a deep understanding of company fundamentals, and we have built our unique global research platform to do just that.
At MFS®, we put our clients’ assets to work responsibly by carefully navigating increasingly complex global capital markets. Our investment team is guided by a commitment to long-term fundamental investing. Our global investment platform — combining collective expertise, long-term discipline, and thoughtful risk management — seeks to uncover what we believe are the best, most durable investment ideas in markets around the world, enabling us to potentially create value for investors.
Respectfully,
Michael W. Roberge
Chair and Chief Executive Officer
MFS Investment Management
April 14, 2023
The opinions expressed in this letter are subject to change and may not be relied upon for investment advice. No forecasts can be guaranteed.
Portfolio structure at value (v)
Portfolio structure reflecting equivalent exposure of derivative positions (i)
Fixed income sectors (i)
| U.S. Treasury Securities | 61.4% |
| Mortgage-Backed Securities | 48.3% |
| Commercial Mortgage-Backed Securities | 4.0% |
| Collateralized Debt Obligations | 1.5% |
| Municipal Bonds | 0.9% |
| Asset-Backed Securities | 0.8% |
| Investment Grade Corporates | 0.5% |
| U.S. Government Agencies | 0.2% |
Composition including fixed income credit quality (a)(i)
| AAA | 4.9% |
| AA | 1.6% |
| A | 0.9% |
| BBB | 0.3% |
| U.S. Government | 36.4% |
| Federal Agencies | 48.5% |
| Not Rated | 25.0% |
| Cash & Cash Equivalents | 7.4% |
| Other (q) | (25.0%) |
Portfolio facts
| Average Duration (d) | 6.2 |
| Average Effective Maturity (m) | 6.8 yrs. |
Portfolio Composition - continued
| (a) | For all securities other than those specifically described below, ratings are assigned to underlying securities utilizing ratings from Moody’s, Fitch, and Standard & Poor’s rating agencies and applying the following hierarchy: If all three agencies provide a rating, the middle rating (after dropping the highest and lowest ratings) is assigned; if two of the three agencies rate a security, the lower of the two is assigned. If none of the 3 rating agencies above assign a rating, but the security is rated by DBRS Morningstar, then the DBRS Morningstar rating is assigned. If none of the 4 rating agencies listed above rate the security, but the security is rated by the Kroll Bond Rating Agency (KBRA), then the KBRA rating is assigned. Ratings are shown in the S&P and Fitch scale (e.g., AAA). Securities rated BBB or higher are considered investment grade. All ratings are subject to change. U.S. Government includes securities issued by the U.S. Department of the Treasury. Federal Agencies includes rated and unrated U.S. Agency fixed-income securities, U.S. Agency mortgage-backed securities, and collateralized mortgage obligations of U.S. Agency mortgage-backed securities. |
Not Rated includes fixed income securities and fixed income derivatives that have not been rated by any rating agency. The fund may or may not have held all of these instruments on this date. The fund is not rated by these agencies.
| (d) | Duration is a measure of how much a bond’s price is likely to fluctuate with general changes in interest rates, e.g., if rates rise 1.00%, a bond with a 5-year duration is likely to lose about 5.00% of its value due to the interest rate move. The Average Duration calculation reflects the impact of the equivalent exposure of derivative positions, if any. |
| (i) | For purposes of this presentation, the components include the value of securities, and reflect the impact of the equivalent exposure of derivative positions, if any. These amounts may be negative from time to time. Equivalent exposure is a calculated amount that translates the derivative position into a reasonable approximation of the amount of the underlying asset that the portfolio would have to hold at a given point in time to have the same price sensitivity that results from the portfolio’s ownership of the derivative contract. When dealing with derivatives, equivalent exposure is a more representative measure of the potential impact of a position on portfolio performance than value. The bond component will include any accrued interest amounts. |
| (m) | In determining each instrument’s effective maturity for purposes of calculating the fund’s dollar-weighted average effective maturity, MFS uses the instrument’s stated maturity or, if applicable, an earlier date on which MFS believes it is probable that a maturity-shortening device (such as a put, pre-refunding or prepayment) will cause the instrument to be repaid. Such an earlier date can be substantially shorter than the instrument’s stated maturity. |
| (q) | For purposes of this presentation, Other includes equivalent exposure from currency derivatives and/or any offsets to derivative positions and may be negative. |
| (v) | For purposes of this presentation, market value of fixed income and/or equity derivatives, if any, is included in Cash & Cash Equivalents. |
Where the fund holds convertible bonds, they are treated as part of the equity portion of the portfolio.
Cash & Cash Equivalents includes any cash, investments in money market funds, short-term securities, and other assets less liabilities. Please see the Statement of Assets and Liabilities for additional information related to the fund’s cash position and other assets and liabilities.
Percentages are based on net assets as of February 28, 2023.
The portfolio is actively managed and current holdings may be different.
Management Review
Summary of Results
For the twelve months ended February 28, 2023, Class A shares of the MFS Government Securities Fund (fund) provided a total return of -9.83%, at net asset value. This compares with a return of -9.61% for the fund’s benchmark, the Bloomberg U.S. Government/Mortgage Index.
Market Environment
During the reporting period, central banks around the world had to combat the strongest inflationary pressures in four decades, fueled by the global fiscal response to the pandemic, disrupted supply chains and the dislocations to energy markets stemming from the war in Ukraine. Interest rates have risen substantially, but the effects of a tighter monetary policy may not have been fully experienced yet, given that monetary policy works with long and variable lags. Late in the period, China abruptly ended its Zero-COVID policy, helping unleash a substantial amount of pent-up demand in the world’s second-largest economy and sending ripple effects throughout the global economy. A shift in consumption patterns in the parts of the world that reopened earlier favored services over goods, straining already tight labor markets in many developed economies, while reducing demand for manufactured goods, primarily from Asia. The combination of these factors contributed to market volatility.
Policymakers will find themselves in the difficult position of trying to restrain inflation without tipping economies into recession. Despite the challenging macroeconomic and geopolitical environment, policymakers remained focused on controlling inflation, although investors appeared to have expected varying degrees of action from the central banks. The Fed has been among the most aggressive developed market central banks, tightening policy at the fastest rate in decades, although it slowed its hiking pace at the end of the period, as did the European Central Bank. After remaining on the monetary sidelines for much of the period, the Bank of Japan widened its Yield Curve Control band toward the end of the period, capping the yield on its 10-year bond at 0.5%, up from 0.25%, an action investors appeared to have interpreted as a first step toward monetary policy normalization.
Against an environment of still-tight labor markets, tighter global financial conditions and volatile materials prices, investor anxiety appeared to have increased over the potential that corporate profit margins may be past peak for this cycle. That said, tentative signs that supply chain bottlenecks (most notably semiconductors) may be moderating, the lifting of COVID restrictions in China, low levels of unemployment across developed markets and hopes that inflation levels may have peaked were supportive factors for the macroeconomic backdrop.
Factors Affecting Performance
Relative to the Bloomberg U.S. Government/Mortgage Index, bond selection in the treasury sector held back performance. The fund’s cash and/or cash equivalents position during the period also detracted from relative results.
On the positive side, the fund's shorter duration(d) stance supported relative performance as interest rates rose over the reporting period. The fund’s exposure to both the government-related local authorities and commercial mortgage-backed
Management Review - continued
securities (CMBS) sectors, for which the benchmark has no exposure, also strengthened relative returns. Additionally, an underweight exposure to the mortgage-backed securities (MBS) agency fixed rate sector further aided relative results.
Respectfully,
Portfolio Manager(s)
Geoffrey Schechter and Jake Stone
| (d) | Duration is a measure of how much a bond’s price is likely to fluctuate with general changes in interest rates, e.g., if rates rise 1.00%, a bond with a 5-year duration is likely to lose about 5.00% of its value. |
The views expressed in this report are those of the portfolio manager(s) only through the end of the period of the report as stated on the cover and do not necessarily reflect the views of MFS or any other person in the MFS organization. These views are subject to change at any time based on market or other conditions, and MFS disclaims any responsibility to update such views. These views may not be relied upon as investment advice or an indication of trading intent on behalf of any MFS portfolio. References to specific securities are not recommendations of such securities, and may not be representative of any MFS portfolio’s current or future investments.
Performance Summary THROUGH 2/28/23
The following chart illustrates a representative class of the fund’s historical performance in comparison to its benchmark(s). Performance results include the deduction of the maximum applicable sales charge and reflect the percentage change in net asset value, including reinvestment of dividends and capital gains distributions. The performance of other share classes will be greater than or less than that of the class depicted below. Benchmarks are unmanaged and may not be invested in directly. Benchmark returns do not reflect sales charges, commissions or expenses. (See Notes to Performance Summary.)
Performance data shown represents past performance and is no guarantee of future results. Investment return and principal value fluctuate so your shares, when sold, may be worth more or less than the original cost; current performance may be lower or higher than quoted. The performance shown does not reflect the deduction of taxes, if any, that a shareholder would pay on fund distributions or the redemption of fund shares.
Growth of a Hypothetical $10,000 Investment
Performance Summary - continued
Total Returns through 2/28/23
Average annual without sales charge
| Share Class | Class Inception Date | 1-yr | 5-yr | 10-yr |
| A | 7/25/84 | (9.83)% | (0.13)% | 0.20% |
| B | 8/30/93 | (10.52)% | (0.87)% | (0.54)% |
| C | 4/01/96 | (10.58)% | (0.89)% | (0.56)% |
| I | 1/02/97 | (9.71)% | 0.08% | 0.43% |
| R1 | 4/01/05 | (10.52)% | (0.87)% | (0.55)% |
| R2 | 10/31/03 | (10.07)% | (0.38)% | (0.05)% |
| R3 | 4/01/05 | (9.93)% | (0.15)% | 0.20% |
| R4 | 4/01/05 | (9.60)% | 0.12% | 0.45% |
| R6 | 7/02/12 | (9.52)% | 0.23% | 0.56% |
Comparative benchmark(s)
| Bloomberg U.S. Government/Mortgage Index (f) | (9.61)% | 0.22% | 0.73% |
Average annual with sales charge
| | | | |
A
With Initial Sales Charge (4.25%) | (13.66)% | (0.99)% | (0.24)% |
B
With CDSC (Declining over six years from 4% to 0%) (v) | (14.06)% | (1.25)% | (0.54)% |
C
With CDSC (1% for 12 months) (v) | (11.47)% | (0.89)% | (0.56)% |
CDSC – Contingent Deferred Sales Charge.
Class I, R1, R2, R3, R4, and R6 shares do not have a sales charge.
| (f) | Source: FactSet Research Systems Inc. |
| (v) | Assuming redemption at the end of the applicable period. |
Benchmark Definition(s)
Bloomberg U.S. Government/Mortgage Index(a) – measures the performance of debt issued by the U.S. Government, and its agencies, as well as mortgage-backed pass-through securities of Ginnie Mae (GNMA), Fannie Mae (FNMA), and Freddie Mac (FHLMC).
It is not possible to invest directly in an index.
| (a) | Source: Bloomberg Index Services Limited. BLOOMBERG® is a trademark and service mark of Bloomberg Finance L.P. and its affiliates (collectively “Bloomberg”). Bloomberg or Bloomberg's licensors own all proprietary rights in the Bloomberg Indices. Bloomberg neither approves or endorses this material, or guarantees the accuracy or completeness of any information herein, or makes any warranty, express or implied, as to the results to be obtained therefrom and, to the maximum extent allowed by law, neither shall have any liability or responsibility for injury or damages arising in connection therewith. |
Notes to Performance Summary
Average annual total return represents the average annual change in value for each share class for the periods presented.
Performance Summary - continued
Performance results reflect any applicable expense subsidies and waivers in effect during the periods shown. Without such subsidies and waivers the fund's performance results would be less favorable. Please see the prospectus and financial statements for complete details.
Performance results do not include adjustments made for financial reporting purposes in accordance with U.S. generally accepted accounting principles and may differ from amounts reported in the financial highlights.
From time to time the fund may receive proceeds from litigation settlements, without which performance would be lower.
Expense Table
Fund expenses borne by the shareholders during the period,
September 1, 2022 through February 28, 2023
As a shareholder of the fund, you incur two types of costs: (1) transaction costs, including sales charges (loads) on certain purchase or redemption payments, and (2) ongoing costs, including management fees; distribution and service (12b-1) fees; and other fund expenses. This example is intended to help you understand your ongoing costs (in dollars) of investing in the fund and to compare these costs with the ongoing costs of investing in other mutual funds.
The example is based on an investment of $1,000 invested at the beginning of the period and held for the entire period September 1, 2022 through February 28, 2023.
Actual Expenses
The first line for each share class in the following table provides information about actual account values and actual expenses. You may use the information in this line, together with the amount you invested, to estimate the expenses that you paid over the period. Simply divide your account value by $1,000 (for example, an $8,600 account value divided by $1,000 = 8.6), then multiply the result by the number in the first line under the heading entitled “Expenses Paid During Period” to estimate the expenses you paid on your account during this period.
Hypothetical Example for Comparison Purposes
The second line for each share class in the following table provides information about hypothetical account values and hypothetical expenses based on the fund’s actual expense ratio and an assumed rate of return of 5% per year before expenses, which is not the fund’s actual return. The hypothetical account values and expenses may not be used to estimate the actual ending account balance or expenses you paid for the period. You may use this information to compare the ongoing costs of investing in the fund and other funds. To do so, compare this 5% hypothetical example with the 5% hypothetical examples that appear in the shareholder reports of the other funds.
Please note that the expenses shown in the table are meant to highlight your ongoing costs only and do not reflect any transactional costs, such as sales charges (loads). Therefore, the second line for each share class in the table is useful in comparing ongoing costs only, and will not help you determine the relative total costs of owning different funds. In addition, if these transactional costs were included, your costs would have been higher.
Expense Table - continued
Share
Class | | Annualized
Expense
Ratio | Beginning
Account Value
9/01/22 | Ending
Account Value
2/28/23 | Expenses
Paid During
Period (p)
9/01/22-2/28/23 |
| A | Actual | 0.76% | $1,000.00 | $972.21 | $3.72 |
| Hypothetical (h) | 0.76% | $1,000.00 | $1,021.03 | $3.81 |
| B | Actual | 1.51% | $1,000.00 | $968.49 | $7.37 |
| Hypothetical (h) | 1.51% | $1,000.00 | $1,017.31 | $7.55 |
| C | Actual | 1.51% | $1,000.00 | $968.58 | $7.37 |
| Hypothetical (h) | 1.51% | $1,000.00 | $1,017.31 | $7.55 |
| I | Actual | 0.51% | $1,000.00 | $973.35 | $2.50 |
| Hypothetical (h) | 0.51% | $1,000.00 | $1,022.27 | $2.56 |
| R1 | Actual | 1.51% | $1,000.00 | $968.49 | $7.37 |
| Hypothetical (h) | 1.51% | $1,000.00 | $1,017.31 | $7.55 |
| R2 | Actual | 1.01% | $1,000.00 | $970.94 | $4.94 |
| Hypothetical (h) | 1.01% | $1,000.00 | $1,019.79 | $5.06 |
| R3 | Actual | 0.76% | $1,000.00 | $972.17 | $3.72 |
| Hypothetical (h) | 0.76% | $1,000.00 | $1,021.03 | $3.81 |
| R4 | Actual | 0.51% | $1,000.00 | $973.44 | $2.50 |
| Hypothetical (h) | 0.51% | $1,000.00 | $1,022.27 | $2.56 |
| R6 | Actual | 0.41% | $1,000.00 | $973.86 | $2.01 |
| Hypothetical (h) | 0.41% | $1,000.00 | $1,022.76 | $2.06 |
| (h) | 5% class return per year before expenses. |
| (p) | “Expenses Paid During Period” are equal to each class’s annualized expense ratio, as shown above, multiplied by the average account value over the period, multiplied by 181/365 (to reflect the one-half year period). Expenses paid do not include any applicable sales charges (loads). If these transaction costs had been included, your costs would have been higher. |
Portfolio of Investments
2/28/23
The Portfolio of Investments is a complete list of all securities owned by your fund. It is categorized by broad-based asset classes.
| Issuer | | | Shares/Par | Value ($) |
| Bonds – 92.2% |
| Asset-Backed & Securitized – 6.3% |
| 3650R Commercial Mortgage Trust, 2021-PF1, “XA”, 1.027%, 11/15/2054 (i) | | $ | 21,942,651 | $1,212,682 |
| ACREC 2021-FL1 Ltd., “AS”, FLR, 6.101% (LIBOR - 1mo. + 1.5%), 10/16/2036 (n) | | | 7,778,000 | 7,500,990 |
| ACREC 2023-FL2 LLC, “A”, FLR, 6.63% (SOFR - 1mo. + 2.23%), 2/19/2038 (n) | | | 4,824,645 | 4,812,728 |
| Arbor Realty Trust, Inc., CLO, 2021-FL1, “B”, FLR, 6.073% (LIBOR - 1mo. + 1.5%), 12/15/2035 (n) | | | 3,901,000 | 3,625,028 |
| Arbor Realty Trust, Inc., CLO, 2021-FL3, “AS”, FLR, 5.988% (LIBOR - 1mo. + 1.4%), 8/15/2034 (n) | | | 6,638,000 | 6,455,455 |
| AREIT 2022-CRE6 Trust, “AS”, FLR, 6.076% (SOFR - 30 day + 1.65%), 1/16/2037 (n) | | | 7,155,500 | 6,883,741 |
| BBCMS Mortgage Trust, 2021-C10, “XA”, 1.297%, 7/15/2054 (i) | | | 21,198,614 | 1,543,952 |
| BBCMS Mortgage Trust, 2021-C9, “XA”, 1.62%, 2/15/2054 (i) | | | 13,835,823 | 1,237,433 |
| BBCMS Mortgage Trust, 2022-C18, “AS”, 6.148%, 12/15/2055 | | | 2,688,397 | 2,823,310 |
| BBCMS Mortgage Trust, 2022-C18, “XA”, 0.46%, 12/15/2055 (i) | | | 23,093,876 | 898,500 |
| Benchmark 2021-B23 Mortgage Trust, “XA”, 1.271%, 2/15/2054 (i) | | | 43,809,183 | 2,997,026 |
| Benchmark 2021-B24 Mortgage Trust, “XA”, 1.151%, 3/15/2054 (i) | | | 26,323,250 | 1,630,936 |
| Benchmark 2021-B26 Mortgage Trust, “XA”, 0.885%, 6/15/2054 (i) | | | 38,154,652 | 1,870,486 |
| Benchmark 2021-B27 Mortgage Trust, “XA”, 1.266%, 7/15/2054 (i) | | | 33,668,550 | 2,415,442 |
| Benchmark 2021-B28 Mortgage Trust, “XA”, 1.282%, 8/15/2054 (i) | | | 40,215,692 | 2,914,130 |
| Benchmark 2021-B29 Mortgage Trust, “XA”, 1.042%, 9/15/2054 (i) | | | 45,401,030 | 2,539,902 |
| BSPDF 2021-FL1 Issuer Ltd., “A”, FLR, 5.787% (LIBOR - 1mo. + 1.2%), 10/15/2036 (n) | | | 3,712,000 | 3,645,611 |
| BSPDF 2021-FL1 Issuer Ltd., “AS”, FLR, 6.068% (LIBOR - 1mo. + 1.48%), 10/15/2036 (n) | | | 4,700,500 | 4,572,092 |
| BXMT 2021-FL4 Ltd., “AS”, FLR, 5.887% (LIBOR - 1mo. + 1.3%), 5/15/2038 (n) | | | 7,779,500 | 7,475,157 |
| Capital Automotive, 2020-1A, “A4”, REIT, 3.19%, 2/15/2050 (n) | | | 1,248,803 | 1,163,889 |
| Citigroup Commercial Mortgage Trust, 2019-XA, “C7”, 0.867%, 12/15/2072 (i)(n) | | | 23,336,805 | 1,013,998 |
| Commercial Mortgage Pass-Through Certificates, 2021-BN31, “XA”, 1.324%, 2/15/2054 (i) | | | 33,566,823 | 2,492,092 |
Portfolio of Investments – continued
| Issuer | | | Shares/Par | Value ($) |
| Bonds – continued |
| Asset-Backed & Securitized – continued |
| Commercial Mortgage Pass-Through Certificates, 2021-BN32, “XA”, 0.778%, 4/15/2054 (i) | | $ | 19,024,121 | $814,607 |
| Commercial Mortgage Pass-Through Certificates, 2021-BN35, “XA”, 1.046%, 6/15/2064 (i) | | | 13,329,077 | 784,464 |
| CPS Auto Trust, 2019-D, “E”, 3.86%, 10/15/2025 (n) | | | 5,505,000 | 5,359,321 |
| DT Auto Owner Trust, 2023-1A, “A”, 5.48%, 4/15/2027 (n) | | | 3,485,833 | 3,478,939 |
| Flagship Credit Auto Trust, 2019-3, “D”, 2.86%, 12/15/2025 (n) | | | 2,270,000 | 2,201,337 |
| KREF 2018-FT1 Ltd., “AS”, FLR, 5.901% (LIBOR - 1mo. + 1.3%), 2/15/2039 (n) | | | 759,000 | 724,351 |
| LAD Auto Receivables Trust, 2022-1A, “A”, 5.21%, 6/15/2027 (n) | | | 1,165,598 | 1,156,545 |
| LAD Auto Receivables Trust, 2023-1A, “A2”, 5.68%, 10/15/2026 (n) | | | 1,353,000 | 1,352,433 |
| LoanCore 2021-CRE5 Ltd., “AS”, FLR, 6.338% (LIBOR - 1mo. + 1.75%), 7/15/2036 (n) | | | 6,508,500 | 6,293,786 |
| LoanCore 2021-CRE6 Ltd., “AS”, FLR, 6.238% (LIBOR - 1mo. + 1.65%), 11/15/2038 (n) | | | 10,000,000 | 9,448,620 |
| MF1 2021-FL5 Ltd., “AS”, FLR, 5.876% (LIBOR - 1mo. + 1.2%), 7/15/2036 (n) | | | 3,875,500 | 3,754,189 |
| MF1 2021-FL5 Ltd., “B”, FLR, 6.126% (LIBOR - 1mo. + 1.45%), 7/15/2036 (n) | | | 4,881,500 | 4,720,485 |
| Morgan Stanley Capital I Trust, 2018-H4, “XA”, 0.831%, 12/15/2051 (i) | | | 24,175,030 | 860,602 |
| Morgan Stanley Capital I Trust, 2021-L5, “XA”, 1.295%, 5/15/2054 (i) | | | 16,778,949 | 1,142,104 |
| Morgan Stanley Capital I Trust, 2021-L6, “XA”, 1.228%, 6/15/2054 (i) | | | 20,581,911 | 1,283,937 |
| Morgan Stanley Capital I Trust, 2021-L7, “XA”, 1.099%, 10/15/2054 (i) | | | 80,723,073 | 4,737,532 |
| PFP III 2021-7 Ltd., “AS”, FLR, 5.738% (LIBOR - 1mo. + 1.15%), 4/14/2038 (n) | | | 5,441,728 | 5,192,807 |
| ReadyCap Commercial Mortgage Trust, 2021-FL7, “A”, FLR, 5.817% (LIBOR - 1mo. + 1.2%), 11/25/2036 (n) | | | 4,033,142 | 3,914,777 |
| ReadyCap Commercial Mortgage Trust, 2021-FL7, “AS”, FLR, 6.117% (LIBOR - 1mo. + 1.5%), 11/25/2036 (n) | | | 1,261,500 | 1,229,962 |
| Santander Drive Auto Receivables Trust, 2022-5, “A2”, 3.98%, 1/15/2025 | | | 910,165 | 907,335 |
| Santander Drive Auto Receivables Trust, 2022-6, “A2”, 4.37%, 5/15/2025 | | | 841,371 | 838,730 |
| Wells Fargo Commercial Mortgage Trust, 2018-C48, “XA”, 1.058%, 1/15/2052 (i)(n) | | | 12,800,367 | 521,587 |
| Wells Fargo Commercial Mortgage Trust, 2021-C60, “XA”, 1.545%, 8/15/2054 (i) | | | 20,674,178 | 1,796,944 |
Portfolio of Investments – continued
| Issuer | | | Shares/Par | Value ($) |
| Bonds – continued |
| Asset-Backed & Securitized – continued |
| Westlake Automobile Receivable Trust, 2023-1A, “A2B”, FLR, 5.251% (SOFR - 1mo. + 0.85%), 6/15/2026 (n) | | $ | 1,011,000 | $1,011,040 |
| | | | | $135,251,014 |
| Consumer Services – 0.1% |
| Conservation Fund, 3.474%, 12/15/2029 | | $ | 2,018,000 | $1,719,349 |
| Industrial – 0.1% |
| Howard University, Washington D.C., 2.801%, 10/01/2023 | | $ | 505,000 | $495,391 |
| Howard University, Washington D.C., AGM, 2.416%, 10/01/2024 | | | 556,000 | 530,614 |
| Howard University, Washington D.C., AGM, 2.516%, 10/01/2025 | | | 688,000 | 638,043 |
| | | | | $1,664,048 |
| Medical & Health Technology & Services – 0.3% |
| ProMedica Toledo Hospital, “B”, AGM, 5.325%, 11/15/2028 | | $ | 4,139,000 | $4,060,711 |
| ProMedica Toledo Hospital, “B”, AGM, 5.75%, 11/15/2038 | | | 1,992,000 | 1,932,248 |
| | | | | $5,992,959 |
| Mortgage-Backed – 48.1% | |
| Fannie Mae, 2.41%, 5/01/2023 | | $ | 1,309,884 | $1,299,882 |
| Fannie Mae, 5.5%, 6/01/2023 - 5/01/2044 | | | 8,187,154 | 8,358,962 |
| Fannie Mae, 5%, 3/01/2024 - 3/01/2042 | | | 7,440,903 | 7,490,123 |
| Fannie Mae, 4.5%, 5/01/2025 - 6/01/2044 | | | 18,177,039 | 18,019,209 |
| Fannie Mae, 4%, 3/25/2028 - 7/01/2047 | | | 38,710,536 | 37,160,841 |
| Fannie Mae, 3%, 11/01/2028 - 5/25/2053 | | | 28,606,938 | 26,690,752 |
| Fannie Mae, 2.5%, 11/01/2031 - 10/01/2046 | | | 3,453,246 | 3,116,533 |
| Fannie Mae, 3.5%, 12/25/2031 - 2/25/2036 (i) | | | 1,398,124 | 133,548 |
| Fannie Mae, 6.5%, 1/01/2032 - 10/01/2037 | | | 658,307 | 681,920 |
| Fannie Mae, 6%, 1/01/2033 - 12/01/2037 | | | 1,764,060 | 1,808,202 |
| Fannie Mae, 3%, 2/25/2033 (i) | | | 1,522,621 | 137,560 |
| Fannie Mae, 3.5%, 4/01/2038 - 12/01/2047 | | | 25,123,000 | 23,466,389 |
| Fannie Mae, 2%, 10/25/2040 - 4/25/2046 | | | 1,488,831 | 1,352,645 |
| Fannie Mae, 1.75%, 9/25/2041 - 10/25/2041 | | | 4,647,673 | 4,262,027 |
| Fannie Mae, 2.75%, 9/25/2042 | | | 1,524,032 | 1,412,462 |
| Fannie Mae, UMBS, 2.5%, 5/01/2036 - 1/01/2053 | | | 185,249,741 | 158,221,250 |
| Fannie Mae, UMBS, 2%, 10/01/2036 - 3/01/2052 | | | 138,319,894 | 114,559,581 |
| Fannie Mae, UMBS, 5.5%, 10/01/2038 - 12/01/2052 | | | 3,832,573 | 3,864,565 |
| Fannie Mae, UMBS, 1.5%, 2/01/2042 | | | 526,081 | 425,257 |
| Fannie Mae, UMBS, 3.5%, 5/01/2049 - 9/01/2052 | | | 10,900,982 | 9,943,933 |
| Fannie Mae, UMBS, 3%, 6/01/2051 - 11/01/2052 | | | 24,469,489 | 21,654,405 |
| Fannie Mae, UMBS, 4%, 5/01/2052 - 9/01/2052 | | | 6,033,927 | 5,697,166 |
| Fannie Mae, UMBS, 4.5%, 9/01/2052 | | | 2,371,578 | 2,293,257 |
| Fannie Mae, UMBS, 6%, 2/01/2053 | | | 1,748,241 | 1,832,293 |
| Freddie Mac, 5%, 4/01/2023 - 12/01/2044 | | | 8,230,280 | 8,286,532 |
Portfolio of Investments – continued
| Issuer | | | Shares/Par | Value ($) |
| Bonds – continued |
| Mortgage-Backed – continued | |
| Freddie Mac, 3.25%, 4/25/2023 - 11/25/2061 | | $ | 15,253,767 | $13,821,366 |
| Freddie Mac, 6%, 6/01/2023 - 10/01/2038 | | | 1,057,674 | 1,090,540 |
| Freddie Mac, 3.06%, 7/25/2023 | | | 869,032 | 862,865 |
| Freddie Mac, 3.531%, 7/25/2023 | | | 228,881 | 227,232 |
| Freddie Mac, 3.458%, 8/25/2023 | | | 4,509,040 | 4,473,502 |
| Freddie Mac, 0.903%, 4/25/2024 (i) | | | 36,099,839 | 290,012 |
| Freddie Mac, 0.597%, 7/25/2024 (i) | | | 49,071,381 | 293,476 |
| Freddie Mac, 3.303%, 7/25/2024 | | | 4,700,000 | 4,588,488 |
| Freddie Mac, 3.064%, 8/25/2024 | | | 5,927,185 | 5,759,335 |
| Freddie Mac, 4.5%, 9/01/2024 - 5/01/2042 | | | 6,680,960 | 6,564,951 |
| Freddie Mac, 2.67%, 12/25/2024 | | | 10,948,000 | 10,496,242 |
| Freddie Mac, 3.062%, 12/25/2024 | | | 325,000 | 313,470 |
| Freddie Mac, 2.811%, 1/25/2025 | | | 7,434,950 | 7,137,808 |
| Freddie Mac, 3.329%, 5/25/2025 | | | 16,621,000 | 16,026,743 |
| Freddie Mac, 3.284%, 6/25/2025 | | | 1,125,000 | 1,084,363 |
| Freddie Mac, 4%, 7/01/2025 - 4/01/2044 | | | 4,429,421 | 4,263,413 |
| Freddie Mac, 3.5%, 11/15/2025 - 10/25/2058 | | | 33,421,807 | 31,406,500 |
| Freddie Mac, 1.368%, 3/25/2027 (i) | | | 5,583,000 | 271,510 |
| Freddie Mac, 0.573%, 7/25/2027 (i) | | | 103,944,483 | 2,175,080 |
| Freddie Mac, 0.424%, 8/25/2027 (i) | | | 81,513,145 | 1,321,556 |
| Freddie Mac, 0.293%, 1/25/2028 (i) | | | 143,574,055 | 1,913,124 |
| Freddie Mac, 0.304%, 1/25/2028 (i) | | | 61,660,482 | 846,019 |
| Freddie Mac, 0.135%, 2/25/2028 (i) | | | 175,024,107 | 1,230,805 |
| Freddie Mac, 2.5%, 3/15/2028 | | | 207,020 | 205,336 |
| Freddie Mac, 0.12%, 4/25/2028 (i) | | | 113,029,965 | 754,091 |
| Freddie Mac, 3%, 6/15/2028 - 2/25/2059 | | | 24,774,913 | 22,495,794 |
| Freddie Mac, 3.69%, 1/25/2029 | | | 5,643,236 | 5,393,839 |
| Freddie Mac, 1.091%, 7/25/2029 (i) | | | 19,320,919 | 1,079,168 |
| Freddie Mac, 1.143%, 8/25/2029 (i) | | | 33,720,863 | 1,979,479 |
| Freddie Mac, 1.8%, 4/25/2030 (i) | | | 14,430,646 | 1,514,518 |
| Freddie Mac, 1.868%, 4/25/2030 (i) | | | 20,077,463 | 2,130,442 |
| Freddie Mac, 1.665%, 5/25/2030 (i) | | | 12,033,779 | 1,173,847 |
| Freddie Mac, 1.797%, 5/25/2030 (i) | | | 26,880,424 | 2,821,076 |
| Freddie Mac, 5.5%, 6/01/2030 - 9/01/2041 | | | 3,678,746 | 3,768,304 |
| Freddie Mac, 1.341%, 6/25/2030 (i) | | | 11,124,134 | 892,466 |
| Freddie Mac, 1.6%, 8/25/2030 (i) | | | 10,235,210 | 982,658 |
| Freddie Mac, 1.17%, 9/25/2030 (i) | | | 6,568,138 | 469,854 |
| Freddie Mac, 1.08%, 11/25/2030 (i) | | | 13,158,725 | 882,982 |
| Freddie Mac, 0.329%, 1/25/2031 (i) | | | 50,152,023 | 992,343 |
| Freddie Mac, 0.781%, 1/25/2031 (i) | | | 19,512,958 | 990,439 |
| Freddie Mac, 0.936%, 1/25/2031 (i) | | | 14,681,587 | 873,230 |
| Freddie Mac, 0.516%, 3/25/2031 (i) | | | 40,293,212 | 1,287,251 |
| Freddie Mac, 0.732%, 3/25/2031 (i) | | | 17,260,719 | 828,858 |
Portfolio of Investments – continued
| Issuer | | | Shares/Par | Value ($) |
| Bonds – continued |
| Mortgage-Backed – continued | |
| Freddie Mac, 1.217%, 5/25/2031 (i) | | $ | 7,120,528 | $564,108 |
| Freddie Mac, 0.937%, 7/25/2031 (i) | | | 11,674,001 | 736,346 |
| Freddie Mac, 0.508%, 8/25/2031 (i) | | | 14,900,584 | 514,593 |
| Freddie Mac, 0.536%, 9/25/2031 (i) | | | 50,149,699 | 1,870,985 |
| Freddie Mac, 0.855%, 9/25/2031 (i) | | | 14,983,637 | 865,221 |
| Freddie Mac, 2.154%, 10/25/2031 | | | 1,500,000 | 1,249,431 |
| Freddie Mac, 0.349%, 11/25/2031 (i) | | | 73,361,326 | 1,849,212 |
| Freddie Mac, 0.498%, 12/25/2031 (i) | | | 73,957,916 | 2,571,250 |
| Freddie Mac, 0.567%, 12/25/2031 (i) | | | 12,187,459 | 477,679 |
| Freddie Mac, 2.59%, 1/25/2032 | | | 1,000,000 | 861,315 |
| Freddie Mac, 2.4%, 3/25/2032 | | | 1,000,000 | 846,849 |
| Freddie Mac, 5.5%, 2/15/2036 (i) | | | 370,628 | 59,564 |
| Freddie Mac, 2%, 8/15/2036 | | | 732,709 | 724,482 |
| Freddie Mac, 6.5%, 5/01/2037 | | | 130,967 | 137,585 |
| Freddie Mac, 4.5%, 12/15/2040 (i) | | | 113,178 | 9,811 |
| Freddie Mac, 1.75%, 8/15/2041 | | | 1,232,522 | 1,125,907 |
| Freddie Mac, 2.58%, 6/25/2055 | | | 1,880,714 | 1,612,812 |
| Freddie Mac, UMBS, 2.5%, 3/01/2037 - 1/01/2053 | | | 41,989,729 | 36,000,557 |
| Freddie Mac, UMBS, 2%, 4/01/2037 - 5/01/2052 | | | 60,270,150 | 51,062,644 |
| Freddie Mac, UMBS, 3.5%, 12/01/2046 - 11/01/2052 | | | 7,975,923 | 7,308,585 |
| Freddie Mac, UMBS, 3%, 2/01/2050 - 10/01/2052 | | | 41,289,986 | 36,400,854 |
| Freddie Mac, UMBS, 1.5%, 7/01/2051 - 10/01/2051 | | | 8,365,656 | 6,474,706 |
| Freddie Mac, UMBS, 4%, 5/01/2052 - 9/01/2052 | | | 6,372,709 | 6,027,584 |
| Ginnie Mae, 5.5%, 3/15/2033 - 1/20/2053 | | | 10,922,278 | 11,003,462 |
| Ginnie Mae, 4.5%, 7/20/2033 - 12/20/2052 | | | 53,159,408 | 51,655,862 |
| Ginnie Mae, 5.679%, 8/20/2034 | | | 1,211,231 | 1,231,820 |
| Ginnie Mae, 4%, 5/16/2039 - 10/20/2052 | | | 17,941,064 | 17,024,823 |
| Ginnie Mae, 3.5%, 10/20/2041 (i) | | | 464,891 | 22,636 |
| Ginnie Mae, 3.5%, 12/15/2041 - 11/20/2052 | | | 35,513,392 | 32,835,994 |
| Ginnie Mae, 2.5%, 6/20/2042 - 6/20/2052 | | | 45,599,548 | 39,473,588 |
| Ginnie Mae, 4%, 8/16/2042 (i) | | | 678,240 | 99,547 |
| Ginnie Mae, 3%, 2/20/2043 - 10/20/2052 | | | 46,315,504 | 41,574,818 |
| Ginnie Mae, 2.25%, 9/20/2043 | | | 810,321 | 769,681 |
| Ginnie Mae, 2%, 1/20/2052 - 3/20/2052 | | | 21,589,601 | 18,102,399 |
| Ginnie Mae, 0.586%, 2/16/2059 (i) | | | 2,590,353 | 88,382 |
| Ginnie Mae, TBA, 5%, 3/15/2053 - 4/20/2053 | | | 3,325,000 | 3,284,840 |
| Ginnie Mae, TBA, 6%, 3/15/2053 | | | 13,375,000 | 13,567,200 |
| Ginnie Mae, TBA, 5.5%, 4/20/2053 | | | 3,700,000 | 3,708,816 |
| UMBS, TBA, 6%, 3/13/2053 | | | 450,000 | 455,201 |
| | | | | $1,024,394,818 |
Portfolio of Investments – continued
| Issuer | | | Shares/Par | Value ($) |
| Bonds – continued |
| Municipals – 0.8% |
| California Earthquake Authority Rev., Taxable, “B”, 1.477%, 7/01/2023 | | $ | 1,355,000 | $1,338,085 |
| Chicago, IL, Transit Authority Sales Tax Receipts Refunding Rev., Taxable, “B”, 2.064%, 12/01/2024 | | | 985,000 | 934,652 |
| Chicago, IL, Transit Authority Sales Tax Receipts Refunding Rev., Taxable, “B”, 2.214%, 12/01/2025 | | | 738,000 | 684,505 |
| Golden State, CA, Tobacco Securitization Corp., Tobacco Settlement Rev., Taxable, “B”, 3%, 6/01/2046 | | | 4,150,000 | 3,809,303 |
| Massachusetts Educational Financing Authority, Education Loan Rev., Taxable, “A”, 2.682%, 7/01/2027 | | | 2,165,000 | 1,948,556 |
| Michigan Finance Authority Tobacco Settlement Asset-Backed Rev., Taxable (2006 Sold Tobacco Receipts), “A-1”, 2.326%, 6/01/2030 | | | 1,159,841 | 1,100,949 |
| Philadelphia, PA, School District, Taxable, “A”, AGM, 5.995%, 9/01/2030 | | | 3,280,000 | 3,449,996 |
| Port of Oakland, CA, Senior Lien Refunding Rev., Taxable, “R”, 1.517%, 5/01/2026 | | | 1,680,000 | 1,507,942 |
| West Virginia Tobacco Settlement Financing Authority Asset-Backed Refunding, Taxable, “A-1”, 1.497%, 6/01/2024 | | | 1,900,000 | 1,805,231 |
| West Virginia Tobacco Settlement Financing Authority Asset-Backed Refunding, Taxable, “A-1”, 1.647%, 6/01/2025 | | | 1,550,000 | 1,420,151 |
| | | | | $17,999,370 |
| U.S. Government Agencies and Equivalents – 0.2% |
| Small Business Administration, 4.98%, 11/01/2023 | | $ | 13,765 | $13,666 |
| Small Business Administration, 4.89%, 12/01/2023 | | | 43,040 | 42,514 |
| Small Business Administration, 4.77%, 4/01/2024 | | | 61,360 | 60,540 |
| Small Business Administration, 5.52%, 6/01/2024 | | | 25,275 | 25,226 |
| Small Business Administration, 4.99%, 9/01/2024 | | | 41,475 | 40,804 |
| Small Business Administration, 4.86%, 10/01/2024 | | | 39,009 | 38,580 |
| Small Business Administration, 4.86%, 1/01/2025 | | | 67,602 | 66,594 |
| Small Business Administration, 5.11%, 4/01/2025 | | | 56,327 | 55,175 |
| Small Business Administration, 2.21%, 2/01/2033 | | | 694,246 | 622,637 |
| Small Business Administration, 2.22%, 3/01/2033 | | | 1,093,717 | 985,162 |
| Small Business Administration, 3.15%, 7/01/2033 | | | 1,115,186 | 1,044,344 |
| Small Business Administration, 3.16%, 8/01/2033 | | | 427,658 | 401,976 |
| Small Business Administration, 3.62%, 9/01/2033 | | | 396,780 | 378,580 |
| | | | | $3,775,798 |
| U.S. Treasury Obligations – 36.3% |
| U.S. Treasury Bonds, 6.25%, 8/15/2023 | | $ | 1,445,000 | $1,453,128 |
| U.S. Treasury Bonds, 6%, 2/15/2026 | | | 5,933,000 | 6,177,504 |
| U.S. Treasury Bonds, 6.75%, 8/15/2026 | | | 981,000 | 1,053,770 |
| U.S. Treasury Bonds, 6.375%, 8/15/2027 | | | 2,309,000 | 2,502,740 |
Portfolio of Investments – continued
| Issuer | | | Shares/Par | Value ($) |
| Bonds – continued |
| U.S. Treasury Obligations – continued |
| U.S. Treasury Bonds, 4.375%, 2/15/2038 | | $ | 2,078,000 | $2,176,543 |
| U.S. Treasury Bonds, 4.5%, 8/15/2039 | | | 11,926,300 | 12,649,798 |
| U.S. Treasury Bonds, 3.125%, 2/15/2043 | | | 9,748,800 | 8,400,343 |
| U.S. Treasury Bonds, 2.875%, 5/15/2043 | | | 27,528,200 | 22,773,133 |
| U.S. Treasury Bonds, 2.5%, 2/15/2045 | | | 97,983,000 | 74,853,653 |
| U.S. Treasury Bonds, 2.875%, 11/15/2046 | | | 26,245,000 | 21,384,549 |
| U.S. Treasury Notes, 2.5%, 3/31/2023 | | | 131,000,000 | 130,760,877 |
| U.S. Treasury Notes, 0.125%, 5/31/2023 | | | 33,455,000 | 33,059,078 |
| U.S. Treasury Notes, 0.125%, 6/30/2023 | | | 18,346,500 | 18,055,536 |
| U.S. Treasury Notes, 0.125%, 7/15/2023 | | | 11,546,000 | 11,334,925 |
| U.S. Treasury Notes, 2.5%, 8/15/2023 (f) | | | 136,673,000 | 135,103,395 |
| U.S. Treasury Notes, 0.375%, 10/31/2023 | | | 8,133,200 | 7,883,485 |
| U.S. Treasury Notes, 4.375%, 10/31/2024 | | | 5,227,000 | 5,177,997 |
| U.S. Treasury Notes, 2.625%, 12/31/2025 | | | 20,900,000 | 19,872,961 |
| U.S. Treasury Notes, 0.75%, 5/31/2026 | | | 38,599,000 | 34,318,431 |
| U.S. Treasury Notes, 2%, 11/15/2026 | | | 51,959,000 | 47,790,102 |
| U.S. Treasury Notes, 2.75%, 2/15/2028 | | | 54,157,000 | 50,670,643 |
| U.S. Treasury Notes, 1%, 7/31/2028 | | | 32,248,000 | 27,350,335 |
| U.S. Treasury Notes, 2.375%, 5/15/2029 | | | 19,515,500 | 17,660,003 |
| U.S. Treasury Notes, 1.625%, 8/15/2029 | | | 29,405,000 | 25,416,947 |
| U.S. Treasury Notes, 1.75%, 11/15/2029 | | | 8,564,000 | 7,451,349 |
| U.S. Treasury Notes, 1.625%, 5/15/2031 | | | 41,833,000 | 35,169,134 |
| U.S. Treasury Notes, 1.375%, 11/15/2031 | | | 11,425,300 | 9,300,462 |
| U.S. Treasury Notes, 3.25%, 5/15/2042 | | | 3,075,000 | 2,717,892 |
| | | | | $772,518,713 |
| Total Bonds (Identified Cost, $2,130,332,223) | | $1,963,316,069 |
| Investment Companies (h) – 8.4% |
| Money Market Funds – 8.4% | |
| MFS Institutional Money Market Portfolio, 4.55% (v) (Identified Cost, $179,828,867) | | | 179,832,235 | $179,832,235 |
|
|
| Other Assets, Less Liabilities – (0.6)% | | (13,096,501) |
| Net Assets – 100.0% | $2,130,051,803 |
| (f) | All or a portion of the security has been segregated as collateral for open futures contracts. | | | |
| (h) | An affiliated issuer, which may be considered one in which the fund owns 5% or more of the outstanding voting securities, or a company which is under common control. At period end, the aggregate values of the fund's investments in affiliated issuers and in unaffiliated issuers were $179,832,235 and $1,963,316,069, respectively. | | | |
| (i) | Interest only security for which the fund receives interest on notional principal (Par amount). Par amount shown is the notional principal and does not reflect the cost of the security. | | | |
Portfolio of Investments – continued
| (n) | Securities exempt from registration under Rule 144A of the Securities Act of 1933. These securities may be sold in the ordinary course of business in transactions exempt from registration, normally to qualified institutional buyers. At period end, the aggregate value of these securities was $97,508,868, representing 4.6% of net assets. | | | |
| (v) | Affiliated issuer that is available only to investment companies managed by MFS. The rate quoted for the MFS Institutional Money Market Portfolio is the annualized seven-day yield of the fund at period end. | | | |
| The following abbreviations are used in this report and are defined: |
| AGM | Assured Guaranty Municipal |
| CLO | Collateralized Loan Obligation |
| FLR | Floating Rate. Interest rate resets periodically based on the parenthetically disclosed reference rate plus a spread (if any). The period-end rate reported may not be the current rate. All reference rates are USD unless otherwise noted. |
| LIBOR | London Interbank Offered Rate |
| REIT | Real Estate Investment Trust |
| SOFR | Secured Overnight Financing Rate |
| TBA | To Be Announced |
| UMBS | Uniform Mortgage-Backed Security |
Derivative Contracts at 2/28/23
| Futures Contracts |
| Description | Long/
Short | Currency | Contracts | Notional
Amount | Expiration
Date | Value/Unrealized
Appreciation
(Depreciation) |
| Asset Derivatives |
| Interest Rate Futures | | |
| U.S. Treasury Ultra Note 10 yr | Long | USD | 333 | $39,023,437 | June – 2023 | $93,483 |
| Liability Derivatives |
| Interest Rate Futures | | |
| U.S. Treasury Bond | Long | USD | 359 | $44,953,531 | June – 2023 | $(25,052) |
| U.S. Treasury Note 10 yr | Long | USD | 1,580 | 176,416,875 | June – 2023 | (195,794) |
| U.S. Treasury Note 2 yr | Long | USD | 202 | 41,152,766 | June – 2023 | (124,089) |
| U.S. Treasury Note 5 yr | Long | USD | 1,799 | 192,591,384 | June – 2023 | (443,189) |
| U.S. Treasury Ultra Bond | Long | USD | 285 | 38,492,812 | June – 2023 | (177,222) |
| | | | | | | $(965,346) |
At February 28, 2023, the fund had liquid securities with an aggregate value of $9,936,603 to cover any collateral or margin obligations for certain derivative contracts.
See Notes to Financial Statements
Financial Statements
Statement of Assets and Liabilities
At 2/28/23
This statement represents your fund’s balance sheet, which details the assets and liabilities comprising the total value of the fund.
| Assets | |
| Investments in unaffiliated issuers, at value (identified cost, $2,130,332,223) | $1,963,316,069 |
| Investments in affiliated issuers, at value (identified cost, $179,828,867) | 179,832,235 |
| Receivables for | |
| Net daily variation margin on open futures contracts | 16,827 |
| Investments sold | 8,579,604 |
| TBA sale commitments | 12,592,320 |
| Fund shares sold | 2,044,820 |
| Interest | 7,687,558 |
| Other assets | 6,589 |
| Total assets | $2,174,076,022 |
| Liabilities | |
| Payable to custodian | $33,399 |
| Payables for | |
| Distributions | 193,069 |
| Investments purchased | 7,131,533 |
| TBA purchase commitments | 33,829,783 |
| Fund shares reacquired | 2,399,689 |
| Payable to affiliates | |
| Investment adviser | 41,913 |
| Administrative services fee | 1,794 |
| Shareholder servicing costs | 244,774 |
| Distribution and service fees | 8,280 |
| Payable for independent Trustees' compensation | 4,008 |
| Accrued expenses and other liabilities | 135,977 |
| Total liabilities | $44,024,219 |
| Net assets | $2,130,051,803 |
| Net assets consist of | |
| Paid-in capital | $2,509,941,941 |
| Total distributable earnings (loss) | (379,890,138) |
| Net assets | $2,130,051,803 |
| Shares of beneficial interest outstanding | 245,395,701 |
Statement of Assets and Liabilities – continued
| | Net assets | Shares
outstanding | Net asset value
per share (a) |
| Class A | $468,594,901 | 53,931,815 | $8.69 |
| Class B | 1,528,677 | 176,145 | 8.68 |
| Class C | 5,145,908 | 591,376 | 8.70 |
| Class I | 233,539,998 | 26,926,376 | 8.67 |
| Class R1 | 1,587,242 | 182,876 | 8.68 |
| Class R2 | 40,294,727 | 4,642,605 | 8.68 |
| Class R3 | 27,808,376 | 3,202,024 | 8.68 |
| Class R4 | 42,785,185 | 4,925,399 | 8.69 |
| Class R6 | 1,308,766,789 | 150,817,085 | 8.68 |
| (a) | Maximum offering price per share was equal to the net asset value per share for all share classes, except for Class A, for which the maximum offering price per share was $9.08 [100 / 95.75 x $8.69]. On sales of $100,000 or more, the maximum offering price of Class A shares is reduced. A contingent deferred sales charge may be imposed on redemptions of Class A, Class B, and Class C shares. Redemption price per share was equal to the net asset value per share for Classes I, R1, R2, R3, R4, and R6. |
See Notes to Financial Statements
Financial Statements
Statement of Operations
Year ended 2/28/23
This statement describes how much your fund earned in investment income and accrued in expenses. It also describes any gains and/or losses generated by fund operations.
| Net investment income (loss) | |
| Income | |
| Interest | $50,309,403 |
| Dividends from affiliated issuers | 3,714,566 |
| Other | 273 |
| Total investment income | $54,024,242 |
| Expenses | |
| Management fee | $8,406,577 |
| Distribution and service fees | 1,681,722 |
| Shareholder servicing costs | 1,195,142 |
| Administrative services fee | 364,456 |
| Independent Trustees' compensation | 39,023 |
| Custodian fee | 142,043 |
| Shareholder communications | 58,077 |
| Audit and tax fees | 74,114 |
| Legal fees | 11,639 |
| Miscellaneous | 229,675 |
| Total expenses | $12,202,468 |
| Fees paid indirectly | (33,334) |
| Reduction of expenses by investment adviser and distributor | (312,331) |
| Net expenses | $11,856,803 |
| Net investment income (loss) | $42,167,439 |
| Realized and unrealized gain (loss) |
| Realized gain (loss) (identified cost basis) | |
| Unaffiliated issuers | $(50,288,051) |
| Affiliated issuers | (18,693) |
| Futures contracts | (47,715,958) |
| Foreign currency | (11) |
| Net realized gain (loss) | $(98,022,713) |
| Change in unrealized appreciation or depreciation | |
| Unaffiliated issuers | $(184,217,592) |
| Affiliated issuers | 1,853 |
| Futures contracts | (2,806,758) |
| Net unrealized gain (loss) | $(187,022,497) |
| Net realized and unrealized gain (loss) | $(285,045,210) |
| Change in net assets from operations | $(242,877,771) |
See Notes to Financial Statements
Financial Statements
Statements of Changes in Net Assets
These statements describe the increases and/or decreases in net assets resulting from operations, any distributions, and any shareholder transactions.
| | Year ended |
| | 2/28/23 | 2/28/22 |
| Change in net assets | | |
| From operations | | |
| Net investment income (loss) | $42,167,439 | $24,907,648 |
| Net realized gain (loss) | (98,022,713) | (19,495,848) |
| Net unrealized gain (loss) | (187,022,497) | (64,585,881) |
| Change in net assets from operations | $(242,877,771) | $(59,174,081) |
| Total distributions to shareholders | $(44,759,748) | $(30,875,262) |
| Change in net assets from fund share transactions | $(163,743,589) | $74,959,507 |
| Total change in net assets | $(451,381,108) | $(15,089,836) |
| Net assets | | |
| At beginning of period | 2,581,432,911 | 2,596,522,747 |
| At end of period | $2,130,051,803 | $2,581,432,911 |
See Notes to Financial Statements
Financial Statements
Financial Highlights
The financial highlights table is intended to help you understand the fund's financial performance for the past 5 years. Certain information reflects financial results for a single fund share. The total returns in the table represent the rate that an investor would have earned (or lost) on an investment in the fund share class (assuming reinvestment of all distributions) held for the entire period.
| Class A | Year ended |
| | 2/28/23 | 2/28/22 | 2/28/21 | 2/29/20 | 2/28/19
|
| Net asset value, beginning of period | $9.81 | $10.15 | $10.28 | $9.59 | $9.55 |
| Income (loss) from investment operations |
| Net investment income (loss) (d) | $0.15 | $0.07 | $0.14 | $0.20 | $0.20 |
| Net realized and unrealized gain (loss) | (1.11) | (0.31) | (0.10) | 0.70 | 0.06 |
| Total from investment operations | $(0.96) | $(0.24) | $0.04 | $0.90 | $0.26 |
| Less distributions declared to shareholders |
| From net investment income | $(0.16) | $(0.10) | $(0.17) | $(0.21) | $(0.22) |
| Net asset value, end of period (x) | $8.69 | $9.81 | $10.15 | $10.28 | $9.59 |
| Total return (%) (r)(s)(t)(x) | (9.83) | (2.43) | 0.40 | 9.48 | 2.75 |
Ratios (%) (to average net assets)
and Supplemental data: |
| Expenses before expense reductions (f) | 0.78 | 0.79 | 0.81 | 0.85 | 0.86 |
| Expenses after expense reductions (f) | 0.76 | 0.78 | 0.80 | 0.84 | 0.84 |
| Net investment income (loss) | 1.63 | 0.73 | 1.35 | 1.98 | 2.12 |
| Portfolio turnover | 198 | 398 | 307 | 113 | 56 |
| Net assets at end of period (000 omitted) | $468,595 | $589,493 | $805,484 | $702,063 | $596,678 |
See Notes to Financial Statements
Financial Highlights – continued
| Class B | Year ended |
| | 2/28/23 | 2/28/22 | 2/28/21 | 2/29/20 | 2/28/19
|
| Net asset value, beginning of period | $9.80 | $10.14 | $10.27 | $9.58 | $9.54 |
| Income (loss) from investment operations |
| Net investment income (loss) (d) | $0.08 | $(0.00)(w) | $0.07 | $0.12 | $0.13 |
| Net realized and unrealized gain (loss) | (1.11) | (0.32) | (0.10) | 0.71 | 0.06 |
| Total from investment operations | $(1.03) | $(0.32) | $(0.03) | $0.83 | $0.19 |
| Less distributions declared to shareholders |
| From net investment income | $(0.09) | $(0.02) | $(0.10) | $(0.14) | $(0.15) |
| Net asset value, end of period (x) | $8.68 | $9.80 | $10.14 | $10.27 | $9.58 |
| Total return (%) (r)(s)(t)(x) | (10.52) | (3.16) | (0.35) | 8.68 | 1.99 |
Ratios (%) (to average net assets)
and Supplemental data: |
| Expenses before expense reductions (f) | 1.53 | 1.54 | 1.56 | 1.60 | 1.61 |
| Expenses after expense reductions (f) | 1.51 | 1.53 | 1.55 | 1.59 | 1.60 |
| Net investment income (loss) | 0.83 | (0.02) | 0.66 | 1.23 | 1.37 |
| Portfolio turnover | 198 | 398 | 307 | 113 | 56 |
| Net assets at end of period (000 omitted) | $1,529 | $2,757 | $4,468 | $7,711 | $8,811 |
| Class C | Year ended |
| | 2/28/23 | 2/28/22 | 2/28/21 | 2/29/20 | 2/28/19
|
| Net asset value, beginning of period | $9.83 | $10.17 | $10.29 | $9.60 | $9.57 |
| Income (loss) from investment operations |
| Net investment income (loss) (d) | $0.07 | $(0.00)(w) | $0.07 | $0.12 | $0.13 |
| Net realized and unrealized gain (loss) | (1.11) | (0.32) | (0.09) | 0.71 | 0.05 |
| Total from investment operations | $(1.04) | $(0.32) | $(0.02) | $0.83 | $0.18 |
| Less distributions declared to shareholders |
| From net investment income | $(0.09) | $(0.02) | $(0.10) | $(0.14) | $(0.15) |
| Net asset value, end of period (x) | $8.70 | $9.83 | $10.17 | $10.29 | $9.60 |
| Total return (%) (r)(s)(t)(x) | (10.58) | (3.15) | (0.25) | 8.66 | 1.88 |
Ratios (%) (to average net assets)
and Supplemental data: |
| Expenses before expense reductions (f) | 1.53 | 1.54 | 1.56 | 1.60 | 1.61 |
| Expenses after expense reductions (f) | 1.51 | 1.53 | 1.55 | 1.59 | 1.60 |
| Net investment income (loss) | 0.83 | (0.01) | 0.63 | 1.23 | 1.37 |
| Portfolio turnover | 198 | 398 | 307 | 113 | 56 |
| Net assets at end of period (000 omitted) | $5,146 | $10,187 | $19,052 | $20,084 | $19,919 |
See Notes to Financial Statements
Financial Highlights – continued
| Class I | Year ended |
| | 2/28/23 | 2/28/22 | 2/28/21 | 2/29/20 | 2/28/19
|
| Net asset value, beginning of period | $9.80 | $10.14 | $10.27 | $9.58 | $9.55 |
| Income (loss) from investment operations |
| Net investment income (loss) (d) | $0.17 | $0.10 | $0.17 | $0.22 | $0.22 |
| Net realized and unrealized gain (loss) | (1.12) | (0.32) | (0.10) | 0.70 | 0.05 |
| Total from investment operations | $(0.95) | $(0.22) | $0.07 | $0.92 | $0.27 |
| Less distributions declared to shareholders |
| From net investment income | $(0.18) | $(0.12) | $(0.20) | $(0.23) | $(0.24) |
| Net asset value, end of period (x) | $8.67 | $9.80 | $10.14 | $10.27 | $9.58 |
| Total return (%) (r)(s)(t)(x) | (9.71) | (2.18) | 0.65 | 9.76 | 2.90 |
Ratios (%) (to average net assets)
and Supplemental data: |
| Expenses before expense reductions (f) | 0.53 | 0.53 | 0.56 | 0.60 | 0.61 |
| Expenses after expense reductions (f) | 0.51 | 0.52 | 0.55 | 0.59 | 0.60 |
| Net investment income (loss) | 1.88 | 0.97 | 1.60 | 2.20 | 2.36 |
| Portfolio turnover | 198 | 398 | 307 | 113 | 56 |
| Net assets at end of period (000 omitted) | $233,540 | $274,851 | $162,286 | $96,407 | $43,627 |
| Class R1 | Year ended |
| | 2/28/23 | 2/28/22 | 2/28/21 | 2/29/20 | 2/28/19
|
| Net asset value, beginning of period | $9.80 | $10.14 | $10.27 | $9.58 | $9.54 |
| Income (loss) from investment operations |
| Net investment income (loss) (d) | $0.08 | $(0.00)(w) | $0.06 | $0.12 | $0.13 |
| Net realized and unrealized gain (loss) | (1.11) | (0.32) | (0.09) | 0.71 | 0.06 |
| Total from investment operations | $(1.03) | $(0.32) | $(0.03) | $0.83 | $0.19 |
| Less distributions declared to shareholders |
| From net investment income | $(0.09) | $(0.02) | $(0.10) | $(0.14) | $(0.15) |
| Net asset value, end of period (x) | $8.68 | $9.80 | $10.14 | $10.27 | $9.58 |
| Total return (%) (r)(s)(t)(x) | (10.52) | (3.16) | (0.35) | 8.68 | 1.99 |
Ratios (%) (to average net assets)
and Supplemental data: |
| Expenses before expense reductions (f) | 1.53 | 1.54 | 1.56 | 1.60 | 1.61 |
| Expenses after expense reductions (f) | 1.51 | 1.53 | 1.55 | 1.59 | 1.60 |
| Net investment income (loss) | 0.89 | (0.02) | 0.61 | 1.23 | 1.37 |
| Portfolio turnover | 198 | 398 | 307 | 113 | 56 |
| Net assets at end of period (000 omitted) | $1,587 | $1,960 | $2,274 | $2,158 | $2,125 |
See Notes to Financial Statements
Financial Highlights – continued
| Class R2 | Year ended |
| | 2/28/23 | 2/28/22 | 2/28/21 | 2/29/20 | 2/28/19
|
| Net asset value, beginning of period | $9.80 | $10.14 | $10.27 | $9.58 | $9.54 |
| Income (loss) from investment operations |
| Net investment income (loss) (d) | $0.13 | $0.05 | $0.12 | $0.17 | $0.18 |
| Net realized and unrealized gain (loss) | (1.11) | (0.32) | (0.10) | 0.71 | 0.06 |
| Total from investment operations | $(0.98) | $(0.27) | $0.02 | $0.88 | $0.24 |
| Less distributions declared to shareholders |
| From net investment income | $(0.14) | $(0.07) | $(0.15) | $(0.19) | $(0.20) |
| Net asset value, end of period (x) | $8.68 | $9.80 | $10.14 | $10.27 | $9.58 |
| Total return (%) (r)(s)(t)(x) | (10.07) | (2.67) | 0.15 | 9.22 | 2.50 |
Ratios (%) (to average net assets)
and Supplemental data: |
| Expenses before expense reductions (f) | 1.03 | 1.04 | 1.06 | 1.10 | 1.11 |
| Expenses after expense reductions (f) | 1.01 | 1.03 | 1.05 | 1.09 | 1.10 |
| Net investment income (loss) | 1.39 | 0.48 | 1.12 | 1.73 | 1.87 |
| Portfolio turnover | 198 | 398 | 307 | 113 | 56 |
| Net assets at end of period (000 omitted) | $40,295 | $49,375 | $63,945 | $78,519 | $86,431 |
| Class R3 | Year ended |
| | 2/28/23 | 2/28/22 | 2/28/21 | 2/29/20 | 2/28/19
|
| Net asset value, beginning of period | $9.81 | $10.15 | $10.27 | $9.58 | $9.55 |
| Income (loss) from investment operations |
| Net investment income (loss) (d) | $0.15 | $0.07 | $0.14 | $0.20 | $0.20 |
| Net realized and unrealized gain (loss) | (1.12) | (0.31) | (0.09) | 0.70 | 0.05 |
| Total from investment operations | $(0.97) | $(0.24) | $0.05 | $0.90 | $0.25 |
| Less distributions declared to shareholders |
| From net investment income | $(0.16) | $(0.10) | $(0.17) | $(0.21) | $(0.22) |
| Net asset value, end of period (x) | $8.68 | $9.81 | $10.15 | $10.27 | $9.58 |
| Total return (%) (r)(s)(t)(x) | (9.93) | (2.43) | 0.50 | 9.49 | 2.65 |
Ratios (%) (to average net assets)
and Supplemental data: |
| Expenses before expense reductions (f) | 0.78 | 0.79 | 0.81 | 0.85 | 0.86 |
| Expenses after expense reductions (f) | 0.76 | 0.78 | 0.80 | 0.84 | 0.85 |
| Net investment income (loss) | 1.62 | 0.73 | 1.36 | 1.99 | 2.12 |
| Portfolio turnover | 198 | 398 | 307 | 113 | 56 |
| Net assets at end of period (000 omitted) | $27,808 | $38,286 | $49,242 | $52,773 | $66,977 |
See Notes to Financial Statements
Financial Highlights – continued
| Class R4 | Year ended |
| | 2/28/23 | 2/28/22 | 2/28/21 | 2/29/20 | 2/28/19
|
| Net asset value, beginning of period | $9.81 | $10.15 | $10.28 | $9.59 | $9.55 |
| Income (loss) from investment operations |
| Net investment income (loss) (d) | $0.17 | $0.10 | $0.17 | $0.22 | $0.22 |
| Net realized and unrealized gain (loss) | (1.11) | (0.32) | (0.10) | 0.71 | 0.06 |
| Total from investment operations | $(0.94) | $(0.22) | $0.07 | $0.93 | $0.28 |
| Less distributions declared to shareholders |
| From net investment income | $(0.18) | $(0.12) | $(0.20) | $(0.24) | $(0.24) |
| Net asset value, end of period (x) | $8.69 | $9.81 | $10.15 | $10.28 | $9.59 |
| Total return (%) (r)(s)(t)(x) | (9.60) | (2.18) | 0.65 | 9.75 | 3.01 |
Ratios (%) (to average net assets)
and Supplemental data: |
| Expenses before expense reductions (f) | 0.53 | 0.54 | 0.56 | 0.60 | 0.61 |
| Expenses after expense reductions (f) | 0.51 | 0.53 | 0.55 | 0.59 | 0.60 |
| Net investment income (loss) | 1.87 | 0.98 | 1.61 | 2.22 | 2.36 |
| Portfolio turnover | 198 | 398 | 307 | 113 | 56 |
| Net assets at end of period (000 omitted) | $42,785 | $53,252 | $67,258 | $73,230 | $58,677 |
| Class R6 | Year ended |
| | 2/28/23 | 2/28/22 | 2/28/21 | 2/29/20 | 2/28/19
|
| Net asset value, beginning of period | $9.80 | $10.14 | $10.27 | $9.58 | $9.54 |
| Income (loss) from investment operations |
| Net investment income (loss) (d) | $0.18 | $0.11 | $0.18 | $0.23 | $0.24 |
| Net realized and unrealized gain (loss) | (1.11) | (0.32) | (0.10) | 0.71 | 0.05 |
| Total from investment operations | $(0.93) | $(0.21) | $0.08 | $0.94 | $0.29 |
| Less distributions declared to shareholders |
| From net investment income | $(0.19) | $(0.13) | $(0.21) | $(0.25) | $(0.25) |
| Net asset value, end of period (x) | $8.68 | $9.80 | $10.14 | $10.27 | $9.58 |
| Total return (%) (r)(s)(t)(x) | (9.52) | (2.08) | 0.75 | 9.87 | 3.13 |
Ratios (%) (to average net assets)
and Supplemental data: |
| Expenses before expense reductions (f) | 0.43 | 0.44 | 0.46 | 0.50 | 0.50 |
| Expenses after expense reductions (f) | 0.41 | 0.42 | 0.45 | 0.49 | 0.49 |
| Net investment income (loss) | 1.98 | 1.08 | 1.69 | 2.33 | 2.48 |
| Portfolio turnover | 198 | 398 | 307 | 113 | 56 |
| Net assets at end of period (000 omitted) | $1,308,767 | $1,561,273 | $1,422,514 | $1,220,812 | $1,025,911 |
See Notes to Financial Statements
Financial Highlights – continued
| (d) | Per share data is based on average shares outstanding. |
| (f) | Ratios do not reflect reductions from fees paid indirectly, if applicable. See Note 2 in the Notes to Financial Statements for additional information. |
| (r) | Certain expenses have been reduced without which performance would have been lower. |
| (s) | From time to time the fund may receive proceeds from litigation settlements, without which performance would be lower. |
| (t) | Total returns do not include any applicable sales charges. |
| (w) | Per share amount was less than $0.01. |
| (x) | The net asset values and total returns have been calculated on net assets which include adjustments made in accordance with U.S. generally accepted accounting principles required at period end for financial reporting purposes. |
See Notes to Financial Statements
Notes to Financial Statements
(1) Business and Organization
MFS Government Securities Fund (the fund) is a diversified series of MFS Series Trust XIII (the trust). The trust is organized as a Massachusetts business trust and is registered under the Investment Company Act of 1940, as amended, as an open-end management investment company.
The fund is an investment company and accordingly follows the investment company accounting and reporting guidance of the Financial Accounting Standards Board (FASB) Accounting Standards Codification Topic 946 Financial Services - Investment Companies.
(2) Significant Accounting Policies
General — The preparation of financial statements in conformity with U.S. generally accepted accounting principles requires management to make estimates and assumptions that affect the reported amounts of assets and liabilities, and disclosure of contingent assets and liabilities at the date of the financial statements and the reported amounts of increases and decreases in net assets from operations during the reporting period. Actual results could differ from those estimates. In the preparation of these financial statements, management has evaluated subsequent events occurring after the date of the fund’s Statement of Assets and Liabilities through the date that the financial statements were issued.
Balance Sheet Offsetting — The fund's accounting policy with respect to balance sheet offsetting is that, absent an event of default by the counterparty or a termination of the agreement, the International Swaps and Derivatives Association (ISDA) Master Agreement, or similar agreement, does not result in an offset of reported amounts of financial assets and financial liabilities in the Statement of Assets and Liabilities across transactions between the fund and the applicable counterparty. The fund's right to setoff may be restricted or prohibited by the bankruptcy or insolvency laws of the particular jurisdiction to which a specific master netting agreement counterparty is subject. Balance sheet offsetting disclosures, to the extent applicable to the fund, have been included in the fund’s Significant Accounting Policies note under the captions for each of the fund’s in-scope financial instruments and transactions.
Investment Valuations — Subject to its oversight, the fund's Board of Trustees has delegated primary responsibility for determining or causing to be determined the value of the fund’s investments to MFS as the fund's adviser, pursuant to the fund’s valuation policy and procedures which have been adopted by the adviser and approved by the Board. Effective September 8, 2022, and in accordance with Rule 2a-5 under the Investment Company Act of 1940, the Board of Trustees designated the adviser as the “valuation designee” of the fund. If the adviser, as valuation designee, determines that reliable market quotations are not readily available for an investment, the investment is valued at fair value as determined in good faith by the adviser in accordance with the adviser’s fair valuation policy and procedures.
Under the fund's valuation policy and procedures, debt instruments and floating rate loans, including restricted debt instruments, are generally valued at an evaluated or composite bid as provided by a third-party pricing service. Short-term instruments with a maturity at issuance of 60 days or less may be valued at amortized cost, which approximates market value. Futures contracts are generally valued at last posted settlement price on their primary exchange as provided by a third-party pricing service.
Notes to Financial Statements - continued
Futures contracts for which there were no trades that day for a particular position are generally valued at the closing bid quotation on their primary exchange as provided by a third-party pricing service. Open-end investment companies are generally valued at net asset value per share. The values of foreign securities and other assets and liabilities expressed in foreign currencies are converted to U.S. dollars using the mean of bid and asked prices for rates provided by a third-party pricing service.
Under the fund’s valuation policy and procedures, market quotations are not considered to be readily available for debt instruments, floating rate loans, and many types of derivatives. These investments are generally valued at fair value based on information from third-party pricing services or otherwise determined by the adviser in accordance with the adviser’s fair valuation policy and procedures. Securities and other assets generally valued on the basis of information from a third-party pricing service may also be valued at a broker/dealer bid quotation. In determining values, third-party pricing services can utilize both transaction data and market information such as yield, quality, coupon rate, maturity, type of issue, trading characteristics, spreads and other market data. An investment may also be valued at fair value if the adviser determines that the investment’s value has been materially affected by events occurring after the close of the exchange or market on which the investment is principally traded (such as foreign exchange or market) and prior to the determination of the fund’s net asset value, or after the halt of trading of a specific security where trading does not resume prior to the close of the exchange or market on which the security is principally traded. The adviser generally relies on third-party pricing services or other information (such as the correlation with price movements of similar securities in the same or other markets; the type, cost and investment characteristics of the security; the business and financial condition of the issuer; and trading and other market data) to assist in determining whether to fair value and at what value to fair value an investment. The value of an investment for purposes of calculating the fund’s net asset value can differ depending on the source and method used to determine value. When fair valuation is used, the value of an investment used to determine the fund’s net asset value may differ from quoted or published prices for the same investment. There can be no assurance that the fund could obtain the fair value assigned to an investment if it were to sell the investment at the same time at which the fund determines its net asset value per share.
Various inputs are used in determining the value of the fund's assets or liabilities. These inputs are categorized into three broad levels. In certain cases, the inputs used to measure fair value may fall into different levels of the fair value hierarchy. In such cases, an investment's level within the fair value hierarchy is based on the lowest level of input that is significant to the fair value measurement. The fund's assessment of the significance of a particular input to the fair value measurement in its entirety requires judgment, and considers factors specific to the investment. Level 1 includes unadjusted quoted prices in active markets for identical assets or liabilities. Level 2 includes other significant observable market-based inputs (including quoted prices for similar securities, interest rates, prepayment speed, and credit risk). Level 3 includes significant unobservable inputs, which may include the adviser's own assumptions in determining the fair value of investments. Other financial instruments are derivative instruments, such as futures contracts. The following is a summary of the levels used as of February 28, 2023 in valuing the fund's assets and liabilities:
Notes to Financial Statements - continued
| Financial Instruments | Level 1 | Level 2 | Level 3 | Total |
| U.S. Treasury Bonds & U.S. Government Agencies & Equivalents | $— | $776,294,511 | $— | $776,294,511 |
| Municipal Bonds | — | 17,999,370 | — | 17,999,370 |
| U.S. Corporate Bonds | — | 9,376,356 | — | 9,376,356 |
| Residential Mortgage-Backed Securities | — | 1,024,394,818 | — | 1,024,394,818 |
| Commercial Mortgage-Backed Securities | — | 85,139,495 | — | 85,139,495 |
| Asset-Backed Securities (including CDOs) | — | 50,111,519 | — | 50,111,519 |
| Mutual Funds | 179,832,235 | — | — | 179,832,235 |
| Total | $179,832,235 | $1,963,316,069 | $— | $2,143,148,304 |
| Other Financial Instruments | | | | |
| Futures Contracts – Assets | $93,483 | $— | $— | $93,483 |
| Futures Contracts – Liabilities | (965,346) | — | — | (965,346) |
For further information regarding security characteristics, see the Portfolio of Investments.
Foreign Currency Translation — Purchases and sales of foreign investments, income, and expenses are converted into U.S. dollars based upon currency exchange rates prevailing on the respective dates of such transactions or on the reporting date for foreign denominated receivables and payables. Gains and losses attributable to foreign currency exchange rates on sales of securities are recorded for financial statement purposes as net realized gains and losses on investments. Gains and losses attributable to foreign exchange rate movements on receivables, payables, income and expenses are recorded for financial statement purposes as foreign currency transaction gains and losses. That portion of both realized and unrealized gains and losses on investments that results from fluctuations in foreign currency exchange rates is not separately disclosed.
Derivatives — The fund uses derivatives primarily to increase or decrease exposure to a particular market or segment of the market, or security, to increase or decrease interest rate or currency exposure, or as alternatives to direct investments. Derivatives are used for hedging or non-hedging purposes. While hedging can reduce or eliminate losses, it can also reduce or eliminate gains. When the fund uses derivatives as an investment to increase market exposure, or for hedging purposes, gains and losses from derivative instruments may be substantially greater than the derivative’s original cost.
The derivative instruments used by the fund during the period were futures contracts. Depending on the type of derivative, a fund may exit a derivative position by entering into an offsetting transaction with a counterparty or exchange, negotiating an agreement with the derivative counterparty, or novating the position to a third party. The fund's period end derivatives, as presented in the Portfolio of Investments and the associated Derivative Contract tables, generally are indicative of the volume of its derivative activity during the period.
Notes to Financial Statements - continued
The following table presents, by major type of derivative contract, the fair value, on a gross basis, of the asset and liability components of derivatives held by the fund at February 28, 2023 as reported in the Statement of Assets and Liabilities:
| | | Fair Value (a) |
| Risk | Derivative Contracts | Asset Derivatives | Liability Derivatives |
| Interest Rate | Futures Contracts | $93,483 | $(965,346) |
| (a) | Values presented in this table for futures contracts correspond to the values reported in the Portfolio of Investments. Only the current day net variation margin for futures contracts is reported separately within the Statement of Assets and Liabilities. |
The following table presents, by major type of derivative contract, the realized gain (loss) on derivatives held by the fund for the year ended February 28, 2023 as reported in the Statement of Operations:
| Risk | Futures
Contracts |
| Interest Rate | $(47,715,958) |
The following table presents, by major type of derivative contract, the change in unrealized appreciation or depreciation on derivatives held by the fund for the year ended February 28, 2023 as reported in the Statement of Operations:
| Risk | Futures
Contracts |
| Interest Rate | $(2,806,758) |
Derivative counterparty credit risk is managed through formal evaluation of the creditworthiness of all potential counterparties. On certain, but not all, uncleared derivatives, the fund attempts to reduce its exposure to counterparty credit risk whenever possible by entering into an ISDA Master Agreement on a bilateral basis. The ISDA Master Agreement gives each party to the agreement the right to terminate all transactions traded under such agreement if there is a specified deterioration in the credit quality of the other party. Upon an event of default or a termination of the ISDA Master Agreement, the non-defaulting party has the right to close out all transactions traded under such agreement and to net amounts owed under each agreement to one net amount payable by one party to the other. This right to close out and net payments across all transactions traded under the ISDA Master Agreement could result in a reduction of the fund's credit risk to such counterparty equal to any amounts payable by the fund under the applicable transactions, if any.
Collateral and margin requirements differ by type of derivative. For cleared derivatives (e.g., futures contracts, cleared swaps, and exchange-traded options), margin requirements are set by the clearing broker and the clearing house and collateral, in the form of cash or securities, is posted by the fund directly with the clearing broker. Collateral terms are counterparty agreement specific for uncleared derivatives (e.g., forward foreign currency exchange contracts, uncleared swap agreements, and uncleared options) and collateral, in the form of cash and securities, is held in segregated accounts with the fund's custodian in connection with these agreements. For derivatives traded under an ISDA Master Agreement, which contains a credit support annex, the collateral requirements are netted across all transactions traded under such counterparty-specific agreement and an amount is posted from one party
Notes to Financial Statements - continued
to the other to collateralize such obligations. Cash that has been segregated or delivered to cover the fund's collateral or margin obligations under derivative contracts, if any, will be reported separately in the Statement of Assets and Liabilities as restricted cash for uncleared derivatives and/or deposits with brokers for cleared derivatives. Securities pledged as collateral or margin for the same purpose, if any, are noted in the Portfolio of Investments. The fund may be required to make payments of interest on uncovered collateral or margin obligations with the broker. Any such payments are included in “Miscellaneous” expense in the Statement of Operations.
Futures Contracts — The fund entered into futures contracts which may be used to hedge against or obtain broad market exposure, interest rate exposure, or to manage duration. A futures contract represents a commitment for the future purchase or sale of an asset at a specified price on a specified date.
Upon entering into a futures contract, the fund is required to deposit with the broker, either in cash or securities, an initial margin in an amount equal to a specified percentage of the notional amount of the contract. Subsequent payments (variation margin) are made or received by the fund each day, depending on the daily fluctuations in the value of the contract, and are recorded for financial statement purposes as unrealized gain or loss by the fund until the contract is closed or expires at which point the gain or loss on futures contracts is realized.
The fund bears the risk of interest rates or securities prices moving unexpectedly, in which case, the fund may not achieve the anticipated benefits of the futures contracts and may realize a loss. While futures contracts may present less counterparty risk to the fund since the contracts are exchange traded and the exchange’s clearinghouse guarantees payments to the broker, there is still counterparty credit risk due to the insolvency of the broker. The fund's maximum risk of loss due to counterparty credit risk is equal to the margin posted by the fund to the broker plus any gains or minus any losses on the outstanding futures contracts.
Indemnifications — Under the fund's organizational documents, its officers and Trustees may be indemnified against certain liabilities and expenses arising out of the performance of their duties to the fund. Additionally, in the normal course of business, the fund enters into agreements with service providers that may contain indemnification clauses. The fund's maximum exposure under these agreements is unknown as this would involve future claims that may be made against the fund that have not yet occurred.
Investment Transactions and Income — Investment transactions are recorded on the trade date. Some securities may be purchased or sold on an extended settlement basis, which means that the receipt or delivery of the securities by the fund and related payments occur at a future date, usually beyond the customary settlement period.
Interest income is recorded on the accrual basis. All premium and discount is amortized or accreted for financial statement purposes in accordance with U.S. generally accepted accounting principles. Interest payments received in additional securities are recorded on the ex-interest date in an amount equal to the value of the security on such date. In determining the net gain or loss on securities sold, the cost of securities is determined on the identified cost basis.
Notes to Financial Statements - continued
The fund may receive proceeds from litigation settlements. Any proceeds received from litigation involving portfolio holdings are reflected in the Statement of Operations in realized gain/loss if the security has been disposed of by the fund or in unrealized gain/loss if the security is still held by the fund. Any other proceeds from litigation not related to portfolio holdings are reflected as other income in the Statement of Operations.
The fund invests a significant portion of its assets in asset-backed and/or mortgage-backed securities. For these securities, the value of the debt instrument also depends on the credit quality and adequacy of the underlying assets or collateral as well as whether there is a security interest in the underlying assets or collateral. Enforcing rights, if any, against the underlying assets or collateral may be difficult. U.S. Government securities not supported as to the payment of principal or interest by the U.S. Treasury, such as those issued by Fannie Mae, Freddie Mac, and the Federal Home Loan Banks, are subject to greater credit risk than are U.S. Government securities supported by the U.S. Treasury, such as those issued by Ginnie Mae.
The fund may purchase or sell mortgage-backed securities on a “To Be Announced” (TBA) basis. A TBA transaction is subject to extended settlement and typically does not designate the actual security to be delivered, but instead includes an approximate principal amount. The price of the TBA security and the date that it will be settled are fixed at the time the transaction is negotiated. The value of the security varies with market fluctuations and no interest accrues to the fund until settlement takes place. TBA purchase and sale commitments are held at carrying amount, which approximates fair value and are categorized as level 2 within the fair value hierarchy and included in TBA purchase and TBA sale commitments in the Statement of Assets and Liabilities. Losses may arise as a result of changes in the value of the TBA investment prior to settlement date or due to counterparty non-performance.
The fund may also enter into mortgage dollar rolls, typically TBA dollar rolls, in which the fund sells TBA mortgage-backed securities to financial institutions and simultaneously agrees to repurchase similar (same issuer, type and coupon) securities at a later date at an agreed-upon price. During the period between the sale and repurchase, the fund will not be entitled to receive interest and principal payments on the securities sold. The fund accounts for dollar roll transactions as purchases and sales and realizes gains and losses on these transactions. Dollar roll transactions involve the risk that the market value of the securities that the fund is required to purchase may decline below the agreed upon repurchase price of those securities.
To mitigate the counterparty credit risk on TBA transactions, mortgage dollar rolls, and other types of forward settling mortgage-backed and asset-backed security transactions, the fund whenever possible enters into a Master Securities Forward Transaction Agreement (“MSFTA”) on a bilateral basis with each of the counterparties with whom it undertakes a significant volume of transactions. The MSFTA gives each party to the agreement the right to terminate all transactions traded under such agreement if there is a specified deterioration in the credit quality of the other party. Upon an event of default or a termination of the MSFTA, the non-defaulting party has the right to close out all transactions traded under such agreement and to net amounts owed under each transaction to one net amount payable by one party to the other. This right to close out and net payments across all transactions traded under the MSFTA could result in a reduction of the fund's credit risk to such counterparty equal to any amounts payable by the fund under the applicable transactions, if any.
Notes to Financial Statements - continued
For mortgage-backed and asset-backed securities traded under a MSFTA, the collateral and margining requirements are contract specific. Collateral amounts across all transactions traded under such agreement are netted and an amount is posted from one party to the other to collateralize such obligations. Cash that has been pledged to cover the fund's collateral or margin obligations under a MSFTA, if any, will be reported separately on the Statement of Assets and Liabilities as restricted cash. Securities pledged as collateral or margin for the same purpose, if any, are noted in the Portfolio of Investments.
Fees Paid Indirectly — The fund's custody fee may be reduced by a credit earned under an arrangement that measures the value of U.S. dollars deposited with the custodian by the fund. The amount of the credit, for the year ended February 28, 2023, is shown as a reduction of total expenses in the Statement of Operations.
Tax Matters and Distributions — The fund intends to qualify as a regulated investment company, as defined under Subchapter M of the Internal Revenue Code, and to distribute all of its taxable income, including realized capital gains. As a result, no provision for federal income tax is required. The fund’s federal tax returns, when filed, will remain subject to examination by the Internal Revenue Service for a three year period. Management has analyzed the fund’s tax positions taken on federal and state tax returns for all open tax years and does not believe that there are any uncertain tax positions that require recognition of a tax liability. Foreign taxes, if any, have been accrued by the fund in the accompanying financial statements in accordance with the applicable foreign tax law. Foreign income taxes may be withheld by certain countries in which the fund invests. Additionally, capital gains realized by the fund on securities issued in or by certain foreign countries may be subject to capital gains tax imposed by those countries.
Distributions to shareholders are recorded on the ex-dividend date. Income and capital gain distributions are determined in accordance with income tax regulations, which may differ from U.S. generally accepted accounting principles. Certain capital accounts in the financial statements are periodically adjusted for permanent differences in order to reflect their tax character. These adjustments have no impact on net assets or net asset value per share. Temporary differences which arise from recognizing certain items of income, expense, gain or loss in different periods for financial statement and tax purposes will reverse at some time in the future.
Book/tax differences primarily relate to amortization and accretion of debt securities.
The tax character of distributions declared to shareholders for the last two fiscal years is as follows:
| | Year ended
2/28/23 | Year ended
2/28/22 |
| Ordinary income (including any short-term capital gains) | $44,759,748 | $30,875,262 |
Notes to Financial Statements - continued
The federal tax cost and the tax basis components of distributable earnings were as follows:
| As of 2/28/23 | |
| Cost of investments | $2,326,333,813 |
| Gross appreciation | 1,689,821 |
| Gross depreciation | (185,747,193) |
| Net unrealized appreciation (depreciation) | $(184,057,372) |
| Undistributed ordinary income | 14,088,188 |
| Capital loss carryforwards | (204,998,297) |
| Other temporary differences | (4,922,657) |
| Total distributable earnings (loss) | $(379,890,138) |
As of February 28, 2023, the fund had capital loss carryforwards available to offset future realized gains. These net capital losses may be carried forward indefinitely and their character is retained as short-term and/or long-term losses. Such losses are characterized as follows:
| Short-Term | $(83,581,935) |
| Long-Term | (121,416,362) |
| Total | $(204,998,297) |
Multiple Classes of Shares of Beneficial Interest — The fund offers multiple classes of shares, which differ in their respective distribution and service fees. The fund's income and common expenses are allocated to shareholders based on the value of settled shares outstanding of each class. The fund's realized and unrealized gain (loss) are allocated to shareholders based on the daily net assets of each class. Dividends are declared separately for each class. Differences in per share dividend rates are generally due to differences in separate class expenses. Class B and Class C shares will convert to Class A shares approximately eight years after purchase. The fund’s distributions declared to shareholders as reported in the Statements of Changes in Net Assets are presented by class as follows:
| | Year ended
2/28/23 | Year ended
2/28/22 |
| Class A | $8,867,727 | $6,866,841 |
| Class B | 18,682 | 7,613 |
| Class C | 67,107 | 30,740 |
| Class I | 4,959,100 | 2,502,609 |
| Class R1 | 17,491 | 4,340 |
| Class R2 | 647,768 | 407,067 |
| Class R3 | 562,865 | 416,860 |
| Class R4 | 868,517 | 772,308 |
| Class R6 | 28,750,491 | 19,866,884 |
| Total | $44,759,748 | $30,875,262 |
Notes to Financial Statements - continued
(3) Transactions with Affiliates
Investment Adviser — The fund has an investment advisory agreement with MFS to provide overall investment management and related administrative services and facilities to the fund. The management fee is computed daily and paid monthly at the following annual rates based on the fund's average daily net assets:
| Up to $1 billion | 0.40% |
| In excess of $1 billion and up to $2.5 billion | 0.35% |
| In excess of $2.5 billion and up to $5 billion | 0.30% |
| In excess of $5 billion | 0.29% |
MFS has agreed in writing to reduce its management fee by a specified amount if certain MFS mutual fund assets exceed thresholds agreed to by MFS and the fund's Board of Trustees. MFS has also agreed in writing to waive at least 0.01% of its management fee as part of this agreement. The agreement to waive at least 0.01% of the management fee will continue until modified by the fund's Board of Trustees, but such agreement will continue at least until June 30, 2023. For the year ended February 28, 2023, this management fee reduction amounted to $311,446, which is included in the reduction of total expenses in the Statement of Operations. The management fee incurred for the year ended February 28, 2023 was equivalent to an annual effective rate of 0.36% of the fund's average daily net assets.
The investment adviser has agreed in writing to pay a portion of the fund’s total annual operating expenses, excluding interest, taxes, extraordinary expenses, brokerage and transaction costs, certain tax reclaim recovery expenses (including contingency fees and closing agreement expenses), and investment-related expenses, such that total fund operating expenses do not exceed the following rates annually of each class’s average daily net assets:
| | | | | Classes | | | | |
| A | B | C | I | R1 | R2 | R3 | R4 | R6 |
| 0.80% | 1.55% | 1.55% | 0.55% | 1.55% | 1.05% | 0.80% | 0.55% | 0.44% |
This written agreement will continue until modified by the fund’s Board of Trustees, but such agreement will continue at least until June 30, 2024. For the year ended February 28, 2023, the fund’s actual operating expenses did not exceed the limit and therefore, the investment adviser did not pay any portion of the fund’s expenses related to this agreement.
Distributor — MFS Fund Distributors, Inc. (MFD), a wholly-owned subsidiary of MFS, as distributor, received $9,380 for the year ended February 28, 2023, as its portion of the initial sales charge on sales of Class A shares of the fund.
The Board of Trustees has adopted a distribution plan for certain share classes pursuant to Rule 12b-1 of the Investment Company Act of 1940.
The fund's distribution plan provides that the fund will pay MFD for services provided by MFD and financial intermediaries in connection with the distribution and servicing of certain share classes. One component of the plan is a distribution fee paid to MFD and another component of the plan is a service fee paid to MFD. MFD may subsequently pay all, or a portion, of the distribution and/or service fees to financial intermediaries.
Notes to Financial Statements - continued
Distribution Plan Fee Table:
| | Distribution
Fee Rate (d) | Service
Fee Rate (d) | Total
Distribution
Plan (d) | Annual
Effective
Rate (e) | Distribution
and Service
Fee |
| Class A | — | 0.25% | 0.25% | 0.25% | $ 1,274,319 |
| Class B | 0.75% | 0.25% | 1.00% | 1.00% | 19,960 |
| Class C | 0.75% | 0.25% | 1.00% | 1.00% | 72,864 |
| Class R1 | 0.75% | 0.25% | 1.00% | 1.00% | 17,559 |
| Class R2 | 0.25% | 0.25% | 0.50% | 0.50% | 215,815 |
| Class R3 | — | 0.25% | 0.25% | 0.25% | 81,205 |
| Total Distribution and Service Fees | | | | | $1,681,722 |
| (d) | In accordance with the distribution plan for certain classes, the fund pays distribution and/or service fees equal to these annual percentage rates of each class’s average daily net assets. The distribution and service fee rates disclosed by class represent the current rates in effect at the end of the reporting period. Any rate changes, if applicable, are detailed below. |
| (e) | The annual effective rates represent actual fees incurred under the distribution plan for the year ended February 28, 2023 based on each class's average daily net assets. MFD has voluntarily agreed to rebate a portion of each class's 0.25% service fee attributable to accounts for which there is no financial intermediary specified on the account except for accounts attributable to MFS or its affiliates' seed money. For the year ended February 28, 2023, this rebate amounted to $885 for Class A shares and is included in the reduction of total expenses in the Statement of Operations. |
Certain Class A shares are subject to a contingent deferred sales charge (CDSC) in the event of a shareholder redemption within 18 months of purchase. Class B shares are subject to a CDSC in the event of a shareholder redemption within six years of purchase. Class C shares are subject to a CDSC in the event of a shareholder redemption within 12 months of purchase. All contingent deferred sales charges are paid to MFD and during the year ended February 28, 2023, were as follows:
| | Amount |
| Class A | $82,580 |
| Class B | 1,956 |
| Class C | 374 |
Shareholder Servicing Agent — MFS Service Center, Inc. (MFSC), a wholly-owned subsidiary of MFS, receives a fee from the fund for its services as shareholder servicing agent calculated as a percentage of the average daily net assets of the fund as determined periodically under the supervision of the fund's Board of Trustees. For the year ended February 28, 2023, the fee was $220,339, which equated to 0.0098% annually of the fund's average daily net assets. MFSC also receives reimbursement from the fund for out-of-pocket expenses, sub-accounting and other shareholder servicing costs which may be paid to affiliated and unaffiliated service providers. Class R6 shares do not incur sub-accounting fees. For the year ended February 28, 2023, these out-of-pocket expenses, sub-accounting and other shareholder servicing costs amounted to $974,803.
Administrator — MFS provides certain financial, legal, shareholder communications, compliance, and other administrative services to the fund. Under an administrative services agreement, the fund reimburses MFS the costs incurred to provide these
Notes to Financial Statements - continued
services. The fund is charged an annual fixed amount of $17,500 plus a fee based on average daily net assets. The administrative services fee incurred for the year ended February 28, 2023 was equivalent to an annual effective rate of 0.0161% of the fund's average daily net assets.
Trustees’ and Officers’ Compensation — The fund pays compensation to independent Trustees in the form of a retainer, attendance fees, and additional compensation to Board and Committee chairpersons. The fund does not pay compensation directly to Trustees or officers of the fund who are also officers of the investment adviser, all of whom receive remuneration from MFS for their services to the fund. Certain officers and Trustees of the fund are officers or directors of MFS, MFD, and MFSC.
Prior to December 31, 2001, the fund had an unfunded defined benefit plan (“DB plan”) for independent Trustees. As of December 31, 2001, the Board took action to terminate the DB plan with respect to then-current and any future independent Trustees, such that the DB plan covers only certain of those former independent Trustees who retired on or before December 31, 2001. The DB plan resulted in a pension expense of $1,832 and is included in “Independent Trustees’ compensation” in the Statement of Operations for the year ended February 28, 2023. The liability for deferred retirement benefits payable to those former independent Trustees under the DB plan amounted to $3,959 at February 28, 2023, and is included in “Payable for independent Trustees’ compensation” in the Statement of Assets and Liabilities.
Other — The fund invests in the MFS Institutional Money Market Portfolio which is managed by MFS and seeks current income consistent with preservation of capital and liquidity. This money market fund does not pay a management fee to MFS but does incur investment and operating costs.
On August 3, 2022, MFS redeemed 11 shares of Class R6 for an aggregate amount of $102.
(4) Portfolio Securities
For the year ended February 28, 2023, purchases and sales of investments, other than short-term obligations, were as follows:
| | Purchases | Sales |
| U.S. Government securities | $4,312,904,188 | $4,534,496,533 |
| Non-U.S. Government securities | 25,837,252 | 71,926,553 |
Notes to Financial Statements - continued
(5) Shares of Beneficial Interest
The fund's Declaration of Trust permits the Trustees to issue an unlimited number of full and fractional shares of beneficial interest. Transactions in fund shares were as follows:
| | Year ended
2/28/23 | | Year ended
2/28/22 |
| | Shares | Amount | | Shares | Amount |
| Shares sold | | | | | |
| Class A | 8,608,163 | $77,542,261 | | 12,865,232 | $129,822,253 |
| Class B | 6,271 | 60,226 | | 21,933 | 216,332 |
| Class C | 107,209 | 979,565 | | 205,708 | 2,075,649 |
| Class I | 6,457,198 | 58,069,206 | | 18,031,612 | 182,635,307 |
| Class R1 | 17,127 | 154,253 | | 21,801 | 219,632 |
| Class R2 | 1,359,314 | 12,281,140 | | 797,169 | 8,008,502 |
| Class R3 | 1,036,197 | 9,344,478 | | 887,626 | 8,929,415 |
| Class R4 | 1,141,117 | 10,200,677 | | 1,720,152 | 17,301,502 |
| Class R6 | 12,743,386 | 114,469,579 | | 27,045,019 | 273,000,607 |
| | 31,475,982 | $283,101,385 | | 61,596,252 | $622,209,199 |
Shares issued to shareholders
in reinvestment of distributions | | | | | |
| Class A | 942,599 | $8,394,304 | | 573,886 | $5,784,485 |
| Class B | 2,103 | 18,602 | | 730 | 7,374 |
| Class C | 7,370 | 65,405 | | 2,956 | 29,928 |
| Class I | 535,799 | 4,765,741 | | 232,686 | 2,336,109 |
| Class R1 | 1,979 | 17,475 | | 430 | 4,337 |
| Class R2 | 72,622 | 644,607 | | 39,925 | 402,161 |
| Class R3 | 63,239 | 562,856 | | 41,361 | 416,755 |
| Class R4 | 31,462 | 280,532 | | 28,135 | 283,710 |
| Class R6 | 3,169,327 | 28,224,056 | | 1,940,314 | 19,521,118 |
| | 4,826,500 | $42,973,578 | | 2,860,423 | $28,785,977 |
| Shares reacquired | | | | | |
| Class A | (15,693,409) | $(141,722,518) | | (32,694,309) | $(330,894,993) |
| Class B | (113,486) | (1,032,921) | | (181,994) | (1,831,424) |
| Class C | (559,768) | (5,073,505) | | (1,045,840) | (10,566,047) |
| Class I | (8,124,551) | (72,935,528) | | (6,214,095) | (62,539,024) |
| Class R1 | (36,152) | (324,927) | | (46,555) | (467,553) |
| Class R2 | (1,826,618) | (16,564,007) | | (2,104,748) | (21,209,554) |
| Class R3 | (1,800,829) | (16,274,771) | | (1,877,643) | (18,929,424) |
| Class R4 | (1,675,006) | (15,234,061) | | (2,945,540) | (29,635,565) |
| Class R6 | (24,396,879) | (220,656,314) | | (9,948,777) | (99,962,085) |
| | (54,226,698) | $(489,818,552) | | (57,059,501) | $(576,035,669) |
Notes to Financial Statements - continued
| | Year ended
2/28/23 | | Year ended
2/28/22 |
| | Shares | Amount | | Shares | Amount |
| Net change | | | | | |
| Class A | (6,142,647) | $(55,785,953) | | (19,255,191) | $(195,288,255) |
| Class B | (105,112) | (954,093) | | (159,331) | (1,607,718) |
| Class C | (445,189) | (4,028,535) | | (837,176) | (8,460,470) |
| Class I | (1,131,554) | (10,100,581) | | 12,050,203 | 122,432,392 |
| Class R1 | (17,046) | (153,199) | | (24,324) | (243,584) |
| Class R2 | (394,682) | (3,638,260) | | (1,267,654) | (12,798,891) |
| Class R3 | (701,393) | (6,367,437) | | (948,656) | (9,583,254) |
| Class R4 | (502,427) | (4,752,852) | | (1,197,253) | (12,050,353) |
| Class R6 | (8,484,166) | (77,962,679) | | 19,036,556 | 192,559,640 |
| | (17,924,216) | $(163,743,589) | | 7,397,174 | $74,959,507 |
The fund is one of several mutual funds in which certain MFS funds may invest. The MFS funds do not invest in the underlying funds for the purpose of exercising management or control. At the end of the period, the MFS Moderate Allocation Fund, the MFS Conservative Allocation Fund, the MFS Lifetime 2030 Fund, the MFS Lifetime Income Fund, and the MFS Lifetime 2025 Fund were the owners of record of approximately 29%, 18%, 3%, 3%, and 2%, respectively, of the value of outstanding voting shares of the fund. In addition, the MFS Lifetime 2035 Fund was the owner of record of less than 1% of the value of outstanding voting shares of the fund.
Effective June 1, 2019, purchases of the fund’s Class B shares were closed to new and existing investors subject to certain exceptions.
(6) Line of Credit
The fund and certain other funds managed by MFS participate in a $1.45 billion unsecured committed line of credit of which $1.2 billion is reserved for use by the fund and certain other MFS U.S. funds. The line of credit is provided by a syndicate of banks under a credit agreement. Borrowings may be made for temporary financing needs. Interest is charged to each fund, based on its borrowings, generally at a rate equal to the highest of 1) Daily Simple SOFR (Secured Overnight Financing Rate) plus 0.10%, 2) the Federal Funds Effective Rate, or 3) the Overnight Bank Funding Rate, each plus an agreed upon spread. A commitment fee, based on the average daily unused portion of the committed line of credit, is allocated among the participating funds. The line of credit expires on March 14, 2024 unless extended or renewed. In addition, the fund and other funds managed by MFS have established unsecured uncommitted borrowing arrangements with certain banks for temporary financing needs. Interest is charged to each fund, based on its borrowings, at rates equal to customary reference rates plus an agreed upon spread. For the year ended February 28, 2023, the fund’s commitment fee and interest expense were $10,947 and $0, respectively, and are included in “Miscellaneous” expense in the Statement of Operations.
Notes to Financial Statements - continued
(7) Investments in Affiliated Issuers
An affiliated issuer may be considered one in which the fund owns 5% or more of the outstanding voting securities, or a company which is under common control. For the purposes of this report, the following were affiliated issuers:
| Affiliated Issuers | Beginning
Value | Purchases | Sales
Proceeds | Realized
Gain
(Loss) | Change in
Unrealized
Appreciation or
Depreciation | Ending
Value |
| MFS Institutional Money Market Portfolio | $677,447,936 | $1,322,516,628 | $1,820,115,489 | $(18,693) | $1,853 | $179,832,235 |
| Affiliated Issuers | Dividend
Income | Capital Gain
Distributions |
| MFS Institutional Money Market Portfolio | $3,714,566 | $— |
(8) LIBOR Transition
Certain of the fund's investments, including investments in certain debt instruments and derivatives (if any), as well as borrowings by the fund and certain other contractual arrangements of the fund, may be based on the London Interbank Offered Rate (“LIBOR”). In 2017, the regulatory authority that oversees financial services firms in the United Kingdom announced plans to transition away from LIBOR by the end of 2021. In March 2021, the administrator of LIBOR announced the extension of the publication of the more commonly used U.S. dollar LIBOR settings to the end of June 2023. Although the full impacts of the transition away from LIBOR are not fully known, the transition may result in, among other things, an increase in volatility or illiquidity of the markets for instruments that currently rely on LIBOR to determine interest rates and this could have an adverse impact on the fund's performance. With respect to the fund's accounting for investments, including investments in certain debt instruments and derivatives, as well as borrowings by the fund and any other contractual arrangements of the fund that undergo reference rate-related modifications as a result of the transition, management will rely upon the relief provided by FASB Codification Topic 848 – Reference Rate Reform (Topic 848). The guidance in Topic 848 permits the fund to account for those modified contracts as a continuation of the existing contracts. The situation remains fluid, and management believes, based on best available information, that the impact of the transition will not be material to the fund.
(9) Subsequent Event
On March 30, 2023, the fund announced that effective after the close of business on September 29, 2023, purchases of Class R1 and Class R2 shares will be closed to new eligible investors.
Report of Independent Registered Public Accounting Firm
To the Board of Trustees of MFS Series Trust XIII and the Shareholders of MFS Government Securities Fund:
Opinion on the Financial Statements and Financial Highlights
We have audited the accompanying statement of assets and liabilities of MFS Government Securities Fund (the “Fund”), including the portfolio of investments, as of February 28, 2023, the related statement of operations for the year then ended, the statements of changes in net assets for each of the two years in the period then ended, the financial highlights for each of the five years in the period then ended, and the related notes. In our opinion, the financial statements and financial highlights present fairly, in all material respects, the financial position of the Fund as of February 28, 2023, and the results of its operations for the year then ended, the changes in its net assets for each of the two years in the period then ended, and the financial highlights for each of the five years in the period then ended, in conformity with accounting principles generally accepted in the United States of America.
Basis for Opinion
These financial statements and financial highlights are the responsibility of the Fund’s management. Our responsibility is to express an opinion on the Fund's financial statements and financial highlights based on our audits. We are a public accounting firm registered with the Public Company Accounting Oversight Board (United States) (PCAOB) and are required to be independent with respect to the Fund in accordance with the U.S. federal securities laws and the applicable rules and regulations of the Securities and Exchange Commission and the PCAOB.
We conducted our audits in accordance with the standards of the PCAOB. Those standards require that we plan and perform the audit to obtain reasonable assurance about whether the financial statements and financial highlights are free of material misstatement, whether due to error or fraud. The Fund is not required to have, nor were we engaged to perform, an audit of its internal control over financial reporting. As part of our audits we are required to obtain an understanding of internal control over financial reporting but not for the purpose of expressing an opinion on the effectiveness of the Fund's internal control over financial reporting. Accordingly, we express no such opinion.
Our audits included performing procedures to assess the risks of material misstatement of the financial statements and financial highlights, whether due to error or fraud, and performing procedures that respond to those risks. Such procedures included examining, on a test basis, evidence regarding the amounts and disclosures in the financial statements and financial highlights. Our audits also included evaluating the accounting principles used and significant estimates made by management, as well as evaluating the overall presentation of the financial statements and financial highlights.
Report of Independent Registered Public Accounting Firm – continued
Our procedures included confirmation of securities owned as of February 28, 2023, by correspondence with the custodian and brokers; when replies were not received from brokers, we performed other auditing procedures. We believe that our audits provide a reasonable basis for our opinion.
DELOITTE & TOUCHE LLP
Boston, Massachusetts
April 14, 2023
We have served as the auditor of one or more of the MFS investment companies since 1924.
Trustees and Officers — Identification and Background
The Trustees and Officers of the Trust, as of April 1, 2023, are listed below, together with their principal occupations during the past five years. (Their titles may have varied during that period.) The address of each Trustee and Officer is 111 Huntington Avenue, Boston, Massachusetts 02199-7618.
| Name, Age | | Position(s) Held with Fund | | Trustee/Officer Since(h) | | Number of MFS Funds overseen by the Trustee | | Principal Occupations During
the Past Five Years | | Other Directorships During
the Past Five Years (j) |
| INTERESTED TRUSTEE | | | | | | | | | | |
Michael W. Roberge (k)
(age 56) | | Trustee | | January 2021 | | 136 | | Massachusetts Financial Services Company, Chairman (since January 2021); Chief Executive Officer (since January 2017); Director; Chairman of the Board (since January 2022); President (until December 2018); Chief Investment Officer (until December 2018) | | N/A |
| INDEPENDENT TRUSTEES | | | | | | | | | | |
John P. Kavanaugh
(age 68) | | Trustee and Chair of Trustees | | January 2009 | | 136 | | Private investor | | N/A |
Steven E. Buller
(age 71) | | Trustee | | February 2014 | | 136 | | Private investor | | N/A |
John A. Caroselli
(age 68) | | Trustee | | March 2017 | | 136 | | Private investor; JC Global Advisors, LLC (management consulting), President (since 2015) | | N/A |
Maureen R. Goldfarb
(age 67) | | Trustee | | January 2009 | | 136 | | Private investor | | N/A |
Peter D. Jones
(age 67) | | Trustee | | January 2019 | | 136 | | Private investor | | N/A |
James W. Kilman, Jr.
(age 61) | | Trustee | | January 2019 | | 136 | | Burford Capital Limited (finance and investment management), Senior Advisor (since May 3, 2021), Chief Financial Officer (2019 - May 2, 2021); KielStrand Capital LLC (family office), Chief Executive Officer (since 2016) | | Alpha-En Corporation, Director (2016-2019) |
Trustees and Officers - continued
| Name, Age | | Position(s) Held with Fund | | Trustee/Officer Since(h) | | Number of MFS Funds overseen by the Trustee | | Principal Occupations During
the Past Five Years | | Other Directorships During
the Past Five Years (j) |
Clarence Otis, Jr.
(age 66) | | Trustee | | March 2017 | | 136 | | Private investor | | VF Corporation, Director; Verizon Communications, Inc., Director; The Travelers Companies, Director |
Maryanne L. Roepke
(age 67) | | Trustee | | May 2014 | | 136 | | Private investor | | N/A |
Laurie J. Thomsen
(age 65) | | Trustee | | March 2005 | | 136 | | Private investor | | The Travelers Companies, Director; Dycom Industries, Inc., Director |
| Name, Age | | Position(s) Held with
Fund | | Trustee/Officer Since(h) | | Number of MFS Funds for which the Person is an Officer | | Principal Occupations During
the Past Five Years |
| OFFICERS | | | | | | | | |
Christopher R. Bohane (k)
(age 49) | | Assistant Secretary and Assistant Clerk | | July 2005 | | 136 | | Massachusetts Financial Services Company, Senior Vice President and Senior Managing Counsel |
Kino Clark (k)
(age 54) | | Assistant Treasurer | | January 2012 | | 136 | | Massachusetts Financial Services Company, Vice President |
John W. Clark, Jr. (k)
(age 56) | | Assistant Treasurer | | April 2017 | | 136 | | Massachusetts Financial Services Company, Vice President |
David L. DiLorenzo (k)
(age 54) | | President | | July 2005 | | 136 | | Massachusetts Financial Services Company, Senior Vice President |
Heidi W. Hardin (k)
(age 55) | | Secretary and Clerk | | April 2017 | | 136 | | Massachusetts Financial Services Company, Executive Vice President and General Counsel |
Brian E. Langenfeld (k)
(age 50) | | Assistant Secretary and Assistant Clerk | | June 2006 | | 136 | | Massachusetts Financial Services Company, Vice President and Managing Counsel |
Trustees and Officers - continued
| Name, Age | | Position(s) Held with
Fund | | Trustee/Officer Since(h) | | Number of MFS Funds for which the Person is an Officer | | Principal Occupations During
the Past Five Years |
Rosa E. Licea-Mailloux (k)
(age 46) | | Chief Compliance Officer | | March 2022 | | 136 | | Massachusetts Financial Services Company, Vice President (since 2018); Director of Corporate Compliance (2018-2021), Senior Director Compliance (2021-2022), Senior Managing Director of North American Compliance & Chief Compliance Officer (since March 2022); Natixis Investment Managers (investment management), Funds Chief Compliance Officer, Deputy General Counsel & Senior Vice President (until 2018) |
Amanda S. Mooradian (k)
(age 44) | | Assistant Secretary and Assistant Clerk | | September 2018 | | 136 | | Massachusetts Financial Services Company, Assistant Vice President and Senior Counsel |
Susan A. Pereira (k)
(age 52) | | Assistant Secretary and Assistant Clerk | | July 2005 | | 136 | | Massachusetts Financial Services Company, Vice President and Managing Counsel |
Kasey L. Phillips (k)
(age 52) | | Assistant Treasurer | | September 2012 | | 136 | | Massachusetts Financial Services Company, Vice President |
Matthew A. Stowe (k)
(age 48) | | Assistant Secretary and Assistant Clerk | | October 2014 | | 136 | | Massachusetts Financial Services Company, Vice President and Senior Managing Counsel |
William B. Wilson (k)
(age 40) | | Assistant Secretary and Assistant Clerk | | October 2022 | | 136 | | Massachusetts Financial Services Company, Assistant Vice President and Senior Counsel |
James O. Yost (k)
(age 62) | | Treasurer | | September 1990 | | 136 | | Massachusetts Financial Services Company, Senior Vice President |
| (h) | Date first appointed to serve as Trustee/Officer of an MFS Fund. Each Trustee has served continuously since appointment unless indicated otherwise. From January 2012 through December 2016, Messrs. DiLorenzo and Yost served as Treasurer and Deputy Treasurer of the Funds, respectively. |
| (j) | Directorships or trusteeships of companies required to report to the Securities and Exchange Commission (i.e., “public companies”). |
| (k) | “Interested person” of the Trust within the meaning of the Investment Company Act of 1940 (referred to as the 1940 Act), which is the principal federal law governing investment companies like the fund, as a result of a position with MFS. The address of MFS is 111 Huntington Avenue, Boston, Massachusetts 02199-7618. |
Trustees and Officers - continued
Each Trustee (other than Messrs. Jones, Kilman and Roberge) has been elected by shareholders and each Trustee and Officer holds office until his or her successor is chosen and qualified or until his or her earlier death, resignation, retirement or removal. Mr. Roberge became a Trustee of the Funds on January 1, 2021 and Messrs. Jones and Kilman became Trustees of the Funds on January 1, 2019. The Trust does not hold annual meetings for the purpose of electing Trustees, and Trustees are not elected for fixed terms. Under the terms of the Board's retirement policy, an Independent Trustee shall retire at the end of the calendar year in which he or she reaches the earlier of 75 years of age or 15 years of service on the Board (or, in the case of any Independent Trustee who joined the Board prior to 2015, 20 years of service on the Board).
Messrs. Buller, Kilman and Otis and Ms. Roepke are members of the Trust’s Audit Committee.
Each of the Interested Trustees and certain Officers hold comparable officer positions with certain affiliates of MFS.
The Statement of Additional Information for a Fund includes further information about the Trustees and is available without charge upon request by calling 1-800-225-2606.
| Investment Adviser | Custodian |
Massachusetts Financial Services Company
111 Huntington Avenue
Boston, MA 02199-7618 | JPMorgan Chase Bank, NA
4 Metrotech Center
New York, NY 11245 |
| Distributor | Independent Registered Public Accounting Firm |
MFS Fund Distributors, Inc.
111 Huntington Avenue
Boston, MA 02199-7618 | Deloitte & Touche LLP
200 Berkeley Street
Boston, MA 02116 |
| Portfolio Manager(s) | |
Geoffrey Schechter
Jake Stone | |
Proxy Voting Policies and Information
MFS votes proxies on behalf of the fund pursuant to proxy voting policies and procedures that are available without charge, upon request, by calling 1-800-225-2606, by visiting mfs.com/proxyvoting, or by visiting the SEC’s Web site at http://www.sec.gov.
Information regarding how the fund voted proxies relating to portfolio securities during the most recent twelve-month period ended June 30 is available by August 31 of each year without charge by visiting mfs.com/proxyvoting, or by visiting the SEC’s Web site at http://www.sec.gov.
Quarterly Portfolio Disclosure
The fund files a complete schedule of portfolio holdings with the SEC for the first and third quarters of each fiscal year as an exhibit to its reports on Form N-PORT. The fund's Form N-PORT reports are available on the SEC's Web site at http://www.sec.gov. A shareholder can obtain the portfolio holdings report for the first and third quarters of the fund's fiscal year at mfs.com/openendfunds by choosing the fund's name and then scrolling to the “Resources” section and clicking on the “Prospectus and Reports” tab.
Further Information
From time to time, MFS may post important information about the fund or the MFS Funds on the MFS Web site (mfs.com). This information is available at https://www.mfs.com/announcements or at mfs.com/openendfunds by choosing the fund’s name and then scrolling to the “Resources” section and clicking on the “Announcements” tab, if any.
Information About Fund Contracts and Legal Claims
The fund has entered into contractual arrangements with an investment adviser, administrator, distributor, shareholder servicing agent, and custodian who each provide services to the fund. Unless expressly stated otherwise, shareholders are not parties to, or intended beneficiaries of these contractual arrangements, and these contractual arrangements are not intended to create any shareholder right to enforce them against the service providers or to seek any remedy under them against the service providers, either directly or on behalf of the fund.
Under the Trust’s By-Laws and Declaration of Trust, any claims asserted against or on behalf of the MFS Funds, including claims against Trustees and Officers, must be brought in state and federal courts located within the Commonwealth of Massachusetts.
Federal Tax Information (unaudited)
The fund will notify shareholders of amounts for use in preparing 2023 income tax forms in January 2024. The following information is provided pursuant to provisions of the Internal Revenue Code.
The fund intends to pass through the maximum amount allowable as Section 163(j) Interest Dividends as defined in Treasury Regulation §1.163(j)-1(b).
| FACTS | WHAT DOES MFS DO WITH YOUR PERSONAL INFORMATION? |
| Why? | Financial companies choose how they share your personal information. Federal law gives consumers the right to limit some but not all sharing. Federal law also requires us to tell you how we collect, share, and protect your personal information. Please read this notice carefully to understand what we do. |
| What? | The types of personal information we collect and share depend on the product or service you have with us. This information can include: |
| • Social Security number and account balances |
| • Account transactions and transaction history |
| • Checking account information and wire transfer instructions |
| When you are no longer our customer, we continue to share your information as described in this notice. |
| How? | All financial companies need to share customers' personal information to run their everyday business. In the section below, we list the reasons financial companies can share their customers' personal information; the reasons MFS chooses to share; and whether you can limit this sharing. |
Reasons we can share your
personal information | Does MFS share? | Can you limit
this sharing? |
For our everyday business purposes –
such as to process your transactions, maintain your
account(s), respond to court orders and legal
investigations, or report to credit bureaus | Yes | No |
For our marketing purposes –
to offer our products and services to you | No | We don't share |
For joint marketing with other
financial companies | No | We don't share |
For our affiliates' everyday business purposes –
information about your transactions and experiences | No | We don't share |
For our affiliates' everyday business purposes –
information about your creditworthiness | No | We don't share |
| For nonaffiliates to market to you | No | We don't share |
| Questions? | Call 800-225-2606 or go to mfs.com. |
| Who we are |
| Who is providing this notice? | MFS Funds, MFS Investment Management, MFS Institutional Advisors, Inc., and MFS Heritage Trust Company. |
| What we do |
How does MFS
protect my personal
information? | To protect your personal information from unauthorized access and use, we use security measures that comply with federal law. These measures include procedural, electronic, and physical safeguards for the protection of the personal information we collect about you. |
How does MFS
collect my personal
information? | We collect your personal information, for example, when you |
| • open an account or provide account information |
| • direct us to buy securities or direct us to sell your securities |
| • make a wire transfer |
| We also collect your personal information from others, such as credit bureaus, affiliates, or other companies. |
| Why can't I limit all sharing? | Federal law gives you the right to limit only |
| • sharing for affiliates' everyday business purposes – information about your creditworthiness |
| • affiliates from using your information to market to you |
| • sharing for nonaffiliates to market to you |
| State laws and individual companies may give you additional rights to limit sharing. |
| Definitions |
| Affiliates | Companies related by common ownership or control. They can be financial and nonfinancial companies. |
| • MFS does not share personal information with affiliates, except for everyday business purposes as described on page one of this notice. |
| Nonaffiliates | Companies not related by common ownership or control. They can be financial and nonfinancial companies. |
| • MFS does not share with nonaffiliates so they can market to you. |
| Joint marketing | A formal agreement between nonaffiliated financial companies that together market financial products or services to you. |
| • MFS doesn't jointly market. |
| Other important information |
| If you own an MFS product or receive an MFS service in the name of a third party such as a bank or broker-dealer, their privacy policy may apply to you instead of ours. |
Save paper with eDelivery.
MFS® will send you prospectuses, reports, and proxies directly via e-mail so you will get information faster with less mailbox clutter.
To sign up:
1. Go to mfs.com.
2. Log in via MFS® Access.
3. Select eDelivery.
If you own your MFS fund shares through a financial institution or a retirement plan, MFS® TALK, MFS® Access, or eDelivery may not be available to you.
CONTACT
WEB SITE
mfs.com
MFS TALK
1-800-637-8255
24 hours a day
ACCOUNT SERVICE AND LITERATURE
Shareholders
1-800-225-2606
Financial advisors
1-800-343-2829
Retirement plan services
1-800-637-1255
MAILING ADDRESS
MFS Service Center, Inc.
P.O. Box 219341
Kansas City, MO 64121-9341
OVERNIGHT MAIL
MFS Service Center, Inc.
Suite 219341
430 W 7th Street
Kansas City, MO 64105-1407
Annual Report
February 28, 2023
MFS® New Discovery
Value Fund
MFS® New Discovery
Value Fund
| 1 |
| 2 |
| 3 |
| 6 |
| 9 |
| 11 |
| 17 |
| 19 |
| 20 |
| 21 |
| 30 |
| 42 |
| 44 |
| 48 |
| 48 |
| 48 |
| 48 |
| 48 |
| 50 |
The report is prepared for the general information of shareholders. It is authorized for distribution to prospective investors only when preceded or accompanied by a current prospectus.
NOT FDIC INSURED • MAY LOSE VALUE • NO BANK GUARANTEE
LETTER FROM THE CHAIR AND CEO
Dear Shareholders:
Markets — which rallied in late 2022 and early 2023 on signs of peaking inflation, hopes that monetary policy tightening cycles may be nearing an end and a rapid reopening of China’s economy — have hit turbulence after the sudden collapse of two US regional banks and the government-led merger of Switzerland’s two largest lenders. At the same time, US inflation data suggest that price pressures will prove more persistent than expected, making the US Federal Reserve’s job of trying to corral four-decade-high inflation without tipping the economy into recession that much more difficult. On a positive note, markets have largely adjusted to the challenges posed by Russia’s invasion of Ukraine, thanks in part to mild European winter weather that has alleviated concerns over potential near-term shortages of natural gas. Resilient labor markets in much of the developed world have further contributed to a brighter-than-expected economic backdrop. However, after the recent banking turmoil, investors are increasingly mindful that the lagged effects of ongoing monetary policy tightening have yet to fully work their way through the global economy.
One result of the banking crisis has been a rally in global government bond markets as investors sense that the global monetary tightening campaign is nearing its end, and the resulting lower yields have eased some of the pressure on interest rate–sensitive parts of the economy. Over the near term, amid tighter financial conditions, we feel companies will face a challenging earnings backdrop as they are forced to absorb higher input and labor costs while pricing power dwindles. As for fixed income, the rise in interest rates in recent months has made bonds more attractive than they have been in years, which may provide balance for investors’ portfolios.
During times of market transition, it is important to have a deep understanding of company fundamentals, and we have built our unique global research platform to do just that.
At MFS®, we put our clients’ assets to work responsibly by carefully navigating increasingly complex global capital markets. Our investment team is guided by a commitment to long-term fundamental investing. Our global investment platform — combining collective expertise, long-term discipline, and thoughtful risk management — seeks to uncover what we believe are the best, most durable investment ideas in markets around the world, enabling us to potentially create value for investors.
Respectfully,
Michael W. Roberge
Chair and Chief Executive Officer
MFS Investment Management
April 14, 2023
The opinions expressed in this letter are subject to change and may not be relied upon for investment advice. No forecasts can be guaranteed.
Portfolio structure
Top ten holdings
| International Game Technology PLC | 1.7% |
| Berry Global, Inc. | 1.5% |
| Umpqua Holdings Corp. | 1.5% |
| Cathay General Bancorp, Inc. | 1.5% |
| KBR, Inc. | 1.4% |
| Prosperity Bancshares, Inc. | 1.4% |
| Nomad Foods Ltd. | 1.4% |
| Selective Insurance Group, Inc. | 1.4% |
| Phillips Edison & Co., REIT | 1.3% |
| Avient Corp. | 1.3% |
GICS equity sectors (g)
| Financials | 22.0% |
| Consumer Discretionary | 15.2% |
| Industrials | 15.1% |
| Materials | 12.3% |
| Health Care | 7.2% |
| Energy | 7.0% |
| Information Technology | 6.8% |
| Real Estate | 6.4% |
| Utilities | 4.4% |
| Consumer Staples | 2.1% |
| (g) | The Global Industry Classification Standard (GICS®) was developed by and/or is the exclusive property of MSCI, Inc. and S&P Global Market Intelligence Inc. (“S&P Global Market Intelligence”). GICS is a service mark of MSCI and S&P Global Market Intelligence and has been licensed for use by MFS. MFS has applied its own internal sector/industry classification methodology for equity securities and non-equity securities that are unclassified by GICS. |
Cash & Cash Equivalents includes any cash, investments in money market funds, short-term securities, and other assets less liabilities. Please see the Statement of Assets and Liabilities for additional information related to the fund’s cash position and other assets and liabilities.
Percentages are based on net assets as of February 28, 2023.
The portfolio is actively managed and current holdings may be different.
Management Review
Summary of Results
For the twelve months ended February 28, 2023, Class A shares of the MFS New Discovery Value Fund (fund) provided a total return of -2.88%, at net asset value. This compares with a return of -4.40% for the fund’s benchmark, the Russell 2000® Value Index.
Market Environment
During the reporting period, central banks around the world had to combat the strongest inflationary pressures in four decades, fueled by the global fiscal response to the pandemic, disrupted supply chains and the dislocations to energy markets stemming from the war in Ukraine. Interest rates have risen substantially, but the effects of a tighter monetary policy may not have been fully experienced yet, given that monetary policy works with long and variable lags. Late in the period, China abruptly ended its Zero-COVID policy, helping unleash a substantial amount of pent-up demand in the world’s second-largest economy and sending ripple effects throughout the global economy. A shift in consumption patterns in the parts of the world that reopened earlier favored services over goods, straining already tight labor markets in many developed economies, while reducing demand for manufactured goods, primarily from Asia. The combination of these factors contributed to market volatility.
Policymakers will find themselves in the difficult position of trying to restrain inflation without tipping economies into recession. Despite the challenging macroeconomic and geopolitical environment, policymakers remained focused on controlling inflation, although investors appeared to have expected varying degrees of action from the central banks. The Fed has been among the most aggressive developed market central banks, tightening policy at the fastest rate in decades, although it slowed its hiking pace at the end of the period, as did the European Central Bank. After remaining on the monetary sidelines for much of the period, the Bank of Japan widened its Yield Curve Control band toward the end of the period, capping the yield on its 10-year bond at 0.5%, up from 0.25%, an action investors appeared to have interpreted as a first step toward monetary policy normalization.
Against an environment of still-tight labor markets, tighter global financial conditions and volatile materials prices, investor anxiety appeared to have increased over the potential that corporate profit margins may be past peak for this cycle. That said, tentative signs that supply chain bottlenecks (most notably semiconductors) may be moderating, the lifting of COVID restrictions in China, low levels of unemployment across developed markets and hopes that inflation levels may have peaked were supportive factors for the macroeconomic backdrop.
Contributors to Performance
Relative to the Russell 2000® Value Index, favorable stock selection within both the industrials and consumer discretionary sectors contributed to the fund's performance. Within the industrials sector, the fund’s holdings of strong-performing bearings and power transmission products manufacturer Timken Co(b) and electrical connection and protection solution provider nVent Electric(b) benefited relative returns. Within the
Management Review - continued
consumer discretionary sector, holdings of specialty value retailer Five Below(b)(h) strengthened relative performance as the company reported stronger-than-expected sales and margins amid higher in-store customer traffic.
The fund’s underweight position in the communication services sector also supported relative performance. There were no individual stocks within this sector, either in the fund or in the benchmark, that were among the fund's largest relative contributors for the reporting period.
Elsewhere, the fund’s holdings of integrated payment and frictionless commerce solutions provider Paya(b)(h), financial services firm Element Fleet Management(b) (Canada), consumer goods packaging manufacturer Silgan Holdings(b), oil transportation and storage company Plains GP Holdings(b) and reinsurer Everest Re Group(b) were among the fund’s top relative contributors. The timing of the fund’s ownership in shares of oilfield technology solutions provider ChampionX, and overweight position in energy services provider Expro Group Holdings, further benefited relative performance. The stock price of ChampionX climbed as the company delivered earnings results above market expectations, driven by higher-than-expected revenues in its chemical technologies segment, and announced an increase in its share buyback program.
Detractors from Performance
Stock selection within both the energy and consumer staples sectors detracted from the fund’s relative performance. Within the energy sector, there were no individual stocks, either in the fund or in the benchmark, that were among the fund's largest relative detractors for the reporting period. Within the consumer staples sector, the fund’s holdings of poor-performing frozen food manufacturer Nomad Foods(b) weighed on relative returns. The stock price of Nomad Foods declined as the company reported weaker sales volumes and depressed margins due to cost increases.
Stocks in other sectors that held back relative performance included the fund’s holdings of clinical development company Syneos Health(b), cleaning and hygiene products provider Diversey Holdings(b), drug and diagnostic company Maravai Lifesciences Holdings(b), education loan administrator SLM Corp(b), beverage can manufacturer Ardagh Metal Packaging(b), commercial products maker Newell Brands(b) and banking and financial services company Zions Bancorp(b). The stock price of Maravai Lifesciences fell as the company lowered its guidance for 2023, notably trimming its COVID CleanCap outlook given the slower uptake of bivalent boosters. The fund’s overweight positions in youth apparel retailer Zumiez and real estate investment trust Industrial Logistics Properties Trust(h) further detracted from relative returns.
Management Review - continued
Respectfully,
Portfolio Manager(s)
Richard Offen and Kevin Schmitz
Note to Shareholders: Effective December 31, 2023, Kevin Schmitz will no longer be a Portfolio Manager of the fund.
| (b) | Security is not a benchmark constituent. |
| (h) | Security was not held in the portfolio at period end. |
The views expressed in this report are those of the portfolio manager(s) only through the end of the period of the report as stated on the cover and do not necessarily reflect the views of MFS or any other person in the MFS organization. These views are subject to change at any time based on market or other conditions, and MFS disclaims any responsibility to update such views. These views may not be relied upon as investment advice or an indication of trading intent on behalf of any MFS portfolio. References to specific securities are not recommendations of such securities, and may not be representative of any MFS portfolio’s current or future investments.
Performance Summary THROUGH 2/28/23
The following chart illustrates a representative class of the fund’s historical performance in comparison to its benchmark(s). Performance results include the deduction of the maximum applicable sales charge and reflect the percentage change in net asset value, including reinvestment of dividends and capital gains distributions. The performance of other share classes will be greater than or less than that of the class depicted below. Benchmarks are unmanaged and may not be invested in directly. Benchmark returns do not reflect sales charges, commissions or expenses. (See Notes to Performance Summary.)
Performance data shown represents past performance and is no guarantee of future results. Investment return and principal value fluctuate so your shares, when sold, may be worth more or less than the original cost; current performance may be lower or higher than quoted. The performance shown does not reflect the deduction of taxes, if any, that a shareholder would pay on fund distributions or the redemption of fund shares.
Growth of a Hypothetical $10,000 Investment
Performance Summary - continued
Total Returns through 2/28/23
Average annual without sales charge
| Share Class | Class Inception Date | 1-yr | 5-yr | 10-yr |
| A | 5/26/11 | (2.88)% | 10.43% | 11.07% |
| B | 5/26/11 | (3.61)% | 9.61% | 10.24% |
| C | 5/26/11 | (3.65)% | 9.61% | 10.23% |
| I | 5/26/11 | (2.70)% | 10.70% | 11.34% |
| R1 | 5/26/11 | (3.60)% | 9.60% | 10.24% |
| R2 | 5/26/11 | (3.13)% | 10.15% | 10.80% |
| R3 | 5/26/11 | (2.92)% | 10.42% | 11.07% |
| R4 | 5/26/11 | (2.66)% | 10.71% | 11.35% |
| R6 | 7/02/12 | (2.59)% | 10.83% | 11.46% |
Comparative benchmark(s)
| Russell 2000® Value Index (f) | (4.40)% | 6.38% | 8.46% |
Average annual with sales charge
| | | | |
A
With Initial Sales Charge (5.75%) | (8.47)% | 9.13% | 10.41% |
B
With CDSC (Declining over six years from 4% to 0%) (v) | (7.20)% | 9.33% | 10.24% |
C
With CDSC (1% for 12 months) (v) | (4.55)% | 9.61% | 10.23% |
CDSC – Contingent Deferred Sales Charge.
Class I, R1, R2, R3, R4, and R6 shares do not have a sales charge.
| (f) | Source: FactSet Research Systems Inc. |
| (v) | Assuming redemption at the end of the applicable period. |
Benchmark Definition(s)
Russell 2000® Value Index(h) - a market-capitalization-weighted, value-oriented index that measures the performance of small-capitalization stocks that have relatively low price-to-book ratios and lower forecasted growth values.
It is not possible to invest directly in an index.
| (h) | Frank Russell Company (“Russell”) is the source and owner of the trademarks, service marks, and copyrights related to the Russell Indexes. Russell® is a trademark of Frank Russell Company. Neither Russell nor its licensors accept any liability for any errors or omissions in the Russell Indexes and/or Russell ratings or underlying data and no party may rely on any Russell Indexes and/or Russell ratings and/or underlying data contained in this document. No further distribution of Russell Data is permitted without Russell's express written consent. Russell does not promote, sponsor, or endorse the content of this document. |
Notes to Performance Summary
Average annual total return represents the average annual change in value for each share class for the periods presented.
Performance Summary - continued
Performance results reflect any applicable expense subsidies and waivers in effect during the periods shown. Without such subsidies and waivers the fund's performance results would be less favorable. Please see the prospectus and financial statements for complete details.
Performance results do not include adjustments made for financial reporting purposes in accordance with U.S. generally accepted accounting principles and may differ from amounts reported in the financial highlights.
From time to time the fund may receive proceeds from litigation settlements, without which performance would be lower.
Expense Table
Fund expenses borne by the shareholders during the period,
September 1, 2022 through February 28, 2023
As a shareholder of the fund, you incur two types of costs: (1) transaction costs, including sales charges (loads) on certain purchase or redemption payments, and (2) ongoing costs, including management fees; distribution and service (12b-1) fees; and other fund expenses. This example is intended to help you understand your ongoing costs (in dollars) of investing in the fund and to compare these costs with the ongoing costs of investing in other mutual funds.
The example is based on an investment of $1,000 invested at the beginning of the period and held for the entire period September 1, 2022 through February 28, 2023.
Actual Expenses
The first line for each share class in the following table provides information about actual account values and actual expenses. You may use the information in this line, together with the amount you invested, to estimate the expenses that you paid over the period. Simply divide your account value by $1,000 (for example, an $8,600 account value divided by $1,000 = 8.6), then multiply the result by the number in the first line under the heading entitled “Expenses Paid During Period” to estimate the expenses you paid on your account during this period.
Hypothetical Example for Comparison Purposes
The second line for each share class in the following table provides information about hypothetical account values and hypothetical expenses based on the fund’s actual expense ratio and an assumed rate of return of 5% per year before expenses, which is not the fund’s actual return. The hypothetical account values and expenses may not be used to estimate the actual ending account balance or expenses you paid for the period. You may use this information to compare the ongoing costs of investing in the fund and other funds. To do so, compare this 5% hypothetical example with the 5% hypothetical examples that appear in the shareholder reports of the other funds.
Please note that the expenses shown in the table are meant to highlight your ongoing costs only and do not reflect any transactional costs, such as sales charges (loads). Therefore, the second line for each share class in the table is useful in comparing ongoing costs only, and will not help you determine the relative total costs of owning different funds. In addition, if these transactional costs were included, your costs would have been higher.
Expense Table - continued
Share
Class | | Annualized
Expense
Ratio | Beginning
Account Value
9/01/22 | Ending
Account Value
2/28/23 | Expenses
Paid During
Period (p)
9/01/22-2/28/23 |
| A | Actual | 1.18% | $1,000.00 | $1,091.14 | $6.12 |
| Hypothetical (h) | 1.18% | $1,000.00 | $1,018.94 | $5.91 |
| B | Actual | 1.93% | $1,000.00 | $1,087.12 | $9.99 |
| Hypothetical (h) | 1.93% | $1,000.00 | $1,015.22 | $9.64 |
| C | Actual | 1.93% | $1,000.00 | $1,086.74 | $9.99 |
| Hypothetical (h) | 1.93% | $1,000.00 | $1,015.22 | $9.64 |
| I | Actual | 0.93% | $1,000.00 | $1,091.99 | $4.82 |
| Hypothetical (h) | 0.93% | $1,000.00 | $1,020.18 | $4.66 |
| R1 | Actual | 1.91% | $1,000.00 | $1,087.26 | $9.88 |
| Hypothetical (h) | 1.91% | $1,000.00 | $1,015.32 | $9.54 |
| R2 | Actual | 1.43% | $1,000.00 | $1,089.99 | $7.41 |
| Hypothetical (h) | 1.43% | $1,000.00 | $1,017.70 | $7.15 |
| R3 | Actual | 1.18% | $1,000.00 | $1,090.97 | $6.12 |
| Hypothetical (h) | 1.18% | $1,000.00 | $1,018.94 | $5.91 |
| R4 | Actual | 0.93% | $1,000.00 | $1,092.31 | $4.82 |
| Hypothetical (h) | 0.93% | $1,000.00 | $1,020.18 | $4.66 |
| R6 | Actual | 0.84% | $1,000.00 | $1,092.61 | $4.36 |
| Hypothetical (h) | 0.84% | $1,000.00 | $1,020.63 | $4.21 |
| (h) | 5% class return per year before expenses. |
| (p) | “Expenses Paid During Period” are equal to each class’s annualized expense ratio, as shown above, multiplied by the average account value over the period, multiplied by 181/365 (to reflect the one-half year period). Expenses paid do not include any applicable sales charges (loads). If these transaction costs had been included, your costs would have been higher. |
Notes to Expense Table
Each class with a Rule 12b-1 service fee is subject to a rebate of a portion of such fee. Such rebates are included in the expense ratios above and are outside of the expense limitation arrangement. For Class R1 shares, this rebate reduced the expense ratio above by 0.02%. See Note 3 in the Notes to Financial Statements for additional information.
Portfolio of Investments
2/28/23
The Portfolio of Investments is a complete list of all securities owned by your fund. It is categorized by broad-based asset classes.
| Issuer | | | Shares/Par | Value ($) |
| Common Stocks – 98.5% |
| Aerospace & Defense – 2.2% | |
| CACI International, Inc., “A” (a) | | 108,114 | $31,677,402 |
| KBR, Inc. | | 984,553 | 54,258,716 |
| | | | | $85,936,118 |
| Apparel Manufacturers – 3.6% | |
| Canada Goose Holdings, Inc. (a)(l) | | 1,739,929 | $32,728,064 |
| PVH Corp. | | 479,792 | 38,498,510 |
| Skechers USA, Inc., “A” (a) | | 1,118,776 | 49,796,720 |
| Under Amour, Inc., “C” (a) | | 1,972,955 | 17,362,004 |
| | | | | $138,385,298 |
| Automotive – 3.1% | |
| LKQ Corp. | | 824,706 | $47,247,407 |
| Methode Electronics, Inc. | | 887,788 | 43,261,909 |
| Visteon Corp. (a) | | 175,238 | 29,271,755 |
| | | | | $119,781,071 |
| Business Services – 2.3% | |
| HireRight Holdings Corp. (a) | | 1,457,176 | $16,058,079 |
| TaskUs, Inc., “A” (a) | | 1,064,321 | 18,311,643 |
| Thoughtworks Holding, Inc. (a) | | 2,228,415 | 16,401,134 |
| TriNet Group, Inc. (a) | | 177,888 | 14,741,579 |
| WNS (Holdings) Ltd., ADR (a) | | 254,491 | 22,120,358 |
| | | | | $87,632,793 |
| Chemicals – 2.4% | |
| Avient Corp. | | 1,191,577 | $51,988,505 |
| Element Solutions, Inc. | | 2,045,521 | 42,015,001 |
| | | | | $94,003,506 |
| Computer Software – 1.9% | |
| ACI Worldwide, Inc. (a) | | 1,474,043 | $38,104,011 |
| Dun & Bradstreet Holdings, Inc. | | 1,600,663 | 19,223,963 |
| Everbridge, Inc. (a) | | 478,803 | 15,647,282 |
| | | | | $72,975,256 |
| Computer Software - Systems – 1.2% | |
| Softchoice Corp. (l) | | 1,818,140 | $22,198,763 |
| Verint Systems, Inc. (a) | | 672,835 | 25,150,572 |
| | | | | $47,349,335 |
Portfolio of Investments – continued
| Issuer | | | Shares/Par | Value ($) |
| Common Stocks – continued |
| Construction – 1.0% | |
| Toll Brothers, Inc. | | 634,686 | $38,043,079 |
| Consumer Products – 1.9% | |
| Newell Brands, Inc. | | 2,063,854 | $30,318,015 |
| Prestige Consumer Healthcare, Inc. (a) | | 719,870 | 43,372,168 |
| | | | | $73,690,183 |
| Consumer Services – 1.6% | |
| Bright Horizons Family Solutions, Inc. (a) | | 394,861 | $31,130,841 |
| Grand Canyon Education, Inc. (a) | | 274,451 | 31,092,554 |
| | | | | $62,223,395 |
| Containers – 3.3% | |
| Ardagh Metal Packaging S.A. | | 4,955,329 | $23,884,686 |
| Graphic Packaging Holding Co. | | 1,836,217 | 43,701,965 |
| Pactiv Evergreen, Inc. | | 1,203,480 | 13,009,619 |
| Silgan Holdings, Inc. | | 872,649 | 46,599,456 |
| | | | | $127,195,726 |
| Electrical Equipment – 4.5% | |
| Berry Global, Inc. | | 957,615 | $59,467,892 |
| nVent Electric PLC | | 962,541 | 44,122,879 |
| TriMas Corp. | | 1,337,927 | 40,124,431 |
| Vertiv Holdings Co. | | 1,913,060 | 31,087,225 |
| | | | | $174,802,427 |
| Electronics – 1.6% | |
| Cohu, Inc. (a) | | 809,604 | $30,117,269 |
| Plexus Corp. (a) | | 324,368 | 31,103,647 |
| | | | | $61,220,916 |
| Energy - Independent – 2.8% | |
| CNX Resources Corp. (a) | | 2,523,424 | $38,734,558 |
| Magnolia Oil & Gas Corp., “A” | | 1,346,320 | 29,417,092 |
| Viper Energy Partners LP | | 1,355,995 | 38,822,137 |
| | | | | $106,973,787 |
| Food & Beverages – 2.1% | |
| Hostess Brands, Inc. (a) | | 1,198,974 | $29,614,658 |
| Nomad Foods Ltd. (a) | | 2,947,637 | 52,821,655 |
| | | | | $82,436,313 |
| Gaming & Lodging – 1.7% | |
| International Game Technology PLC | | 2,489,225 | $66,113,816 |
Portfolio of Investments – continued
| Issuer | | | Shares/Par | Value ($) |
| Common Stocks – continued |
| Insurance – 4.1% | |
| CNO Financial Group, Inc. | | 1,522,283 | $39,000,890 |
| Everest Re Group Ltd. | | 84,484 | 32,439,322 |
| Hanover Insurance Group, Inc. | | 248,962 | 34,725,220 |
| Selective Insurance Group, Inc. | | 518,868 | 52,680,668 |
| | | | | $158,846,100 |
| Leisure & Toys – 1.7% | |
| Brunswick Corp. | | 345,669 | $30,218,384 |
| Funko, Inc., “A” (a) | | 1,571,841 | 16,991,601 |
| Hayward Holdings, Inc. (a) | | 1,444,126 | 17,777,191 |
| | | | | $64,987,176 |
| Machinery & Tools – 4.7% | |
| ESAB Corp. | | 690,245 | $40,482,869 |
| Flowserve Corp. | | 1,183,841 | 41,067,444 |
| ITT, Inc. | | 236,957 | 21,537,022 |
| Regal Rexnord Corp. | | 230,705 | 36,368,336 |
| Timken Co. | | 509,666 | 43,550,960 |
| | | | | $183,006,631 |
| Medical & Health Technology & Services – 2.5% | |
| ICON PLC (a) | | 146,539 | $33,063,595 |
| Premier, Inc., “A” | | 1,095,116 | 35,251,784 |
| Syneos Health, Inc. (a) | | 672,034 | 27,029,207 |
| | | | | $95,344,586 |
| Medical Equipment – 3.0% | |
| Agiliti Health, Inc. (a) | | 1,071,608 | $20,424,849 |
| Envista Holdings Corp. (a) | | 982,462 | 37,981,981 |
| Maravai Lifesciences Holdings, Inc., “A” (a) | | 1,111,983 | 16,401,749 |
| Quidel Corp. (a) | | 344,133 | 29,918,923 |
| Sotera Health Co. (a) | | 769,352 | 12,840,485 |
| | | | | $117,567,987 |
| Metals & Mining – 1.4% | |
| Arconic Corp. (a) | | 1,340,455 | $35,441,630 |
| Kaiser Aluminum Corp. | | 214,121 | 16,984,078 |
| | | | | $52,425,708 |
| Natural Gas - Distribution – 2.0% | |
| New Jersey Resources Corp. | | 740,171 | $37,770,926 |
| ONE Gas, Inc. | | 506,309 | 40,585,730 |
| | | | | $78,356,656 |
Portfolio of Investments – continued
| Issuer | | | Shares/Par | Value ($) |
| Common Stocks – continued |
| Natural Gas - Pipeline – 1.2% | |
| Plains GP Holdings LP | | 3,269,088 | $45,473,014 |
| Oil Services – 3.0% | |
| ChampionX Corp. | | 1,471,729 | $44,990,756 |
| Expro Group Holdings N.V. (a) | | 1,929,752 | 43,863,263 |
| Helmerich & Payne | | 630,705 | 26,540,066 |
| | | | | $115,394,085 |
| Other Banks & Diversified Financials – 19.1% | |
| Air Lease Corp. | | 1,185,113 | $51,291,691 |
| Bank of Hawaii Corp. | | 441,076 | 33,018,949 |
| Brookline Bancorp, Inc. | | 2,707,253 | 35,085,999 |
| Cathay General Bancorp, Inc. | | 1,325,961 | 56,910,246 |
| East West Bancorp, Inc. | | 617,271 | 47,042,223 |
| Element Fleet Management Corp. | | 1,845,145 | 26,355,351 |
| First Hawaiian, Inc. | | 1,349,170 | 36,899,799 |
| First Interstate BancSystem, Inc. | | 1,113,363 | 39,568,921 |
| Hanmi Financial Corp. | | 1,165,439 | 27,527,669 |
| Pacific Premier Bancorp, Inc. | | 998,563 | 32,373,412 |
| Prosperity Bancshares, Inc. | | 728,183 | 53,514,169 |
| Sandy Spring Bancorp, Inc. | | 630,786 | 20,784,399 |
| Signature Bank | | 133,506 | 15,359,865 |
| SLM Corp. | | 3,059,737 | 43,999,018 |
| Texas Capital Bancshares, Inc. (a) | | 498,208 | 32,996,316 |
| Textainer Group Holdings Ltd. | | 647,670 | 21,321,296 |
| UMB Financial Corp. | | 555,921 | 50,399,798 |
| Umpqua Holdings Corp. | | 3,250,874 | 57,410,435 |
| Wintrust Financial Corp. | | 223,408 | 20,582,579 |
| Zions Bancorp NA | | 653,495 | 33,079,917 |
| | | | | $735,522,052 |
| Pharmaceuticals – 0.6% | |
| Organon & Co. | | 870,908 | $21,328,537 |
| Real Estate – 7.1% | |
| Brixmor Property Group, Inc., REIT | | 1,157,078 | $26,196,246 |
| Broadstone Net Lease, Inc., REIT | | 2,538,558 | 45,059,405 |
| Cushman & Wakefield PLC (a) | | 1,443,517 | 18,679,110 |
| Douglas Emmett, Inc., REIT | | 603,121 | 8,522,100 |
| Empire State Realty Trust, REIT, “A” | | 3,918,780 | 28,567,906 |
| LXP Industrial Trust, REIT | | 3,055,700 | 31,870,951 |
| National Storage Affiliates Trust, REIT | | 795,822 | 33,663,271 |
| Phillips Edison & Co., REIT | | 1,526,003 | 52,021,442 |
Portfolio of Investments – continued
| Issuer | | | Shares/Par | Value ($) |
| Common Stocks – continued |
| Real Estate – continued | |
| Two Harbors Investment Corp., REIT | | 1,651,855 | $27,371,237 |
| | | | | $271,951,668 |
| Restaurants – 0.9% | |
| Jack in the Box, Inc. | | 419,445 | $32,884,488 |
| Specialty Chemicals – 2.6% | |
| Axalta Coating Systems Ltd. (a) | | 1,328,945 | $39,602,561 |
| Diversey Holdings Ltd. (a) | | 6,441,115 | 38,066,990 |
| Quaker Chemical Corp. | | 122,662 | 24,014,766 |
| | | | | $101,684,317 |
| Specialty Stores – 2.5% | |
| Monro Muffler Brake, Inc. | | 539,290 | $27,201,787 |
| Urban Outfitters, Inc. (a) | | 1,501,087 | 40,454,295 |
| Zumiez, Inc. (a)(h) | | 1,156,726 | 26,905,447 |
| | | | | $94,561,529 |
| Trucking – 2.5% | |
| RXO, Inc. (a) | | 1,461,785 | $30,068,917 |
| Schneider National, Inc. | | 1,217,295 | 34,157,298 |
| XPO Logistics, Inc. (a) | | 988,817 | 32,986,935 |
| | | | | $97,213,150 |
| Utilities - Electric Power – 2.4% | |
| Black Hills Corp. | | 727,477 | $44,674,363 |
| Portland General Electric Co. | | 964,118 | 46,084,840 |
| | | | | $90,759,203 |
| Total Common Stocks (Identified Cost, $3,093,616,384) | | $3,796,069,906 |
| Investment Companies (h) – 1.0% |
| Money Market Funds – 1.0% | |
| MFS Institutional Money Market Portfolio, 4.55% (v) (Identified Cost, $38,401,851) | | | 38,401,851 | $38,401,851 |
| Collateral for Securities Loaned – 0.2% |
| State Street Navigator Securities Lending Government Money Market Portfolio, 4.59% (j) (Identified Cost, $9,026,775) | | | 9,026,775 | $9,026,775 |
|
|
| Other Assets, Less Liabilities – 0.3% | | 10,002,194 |
| Net Assets – 100.0% | $3,853,500,726 |
| (a) | Non-income producing security. | | | |
Portfolio of Investments – continued
| (h) | An affiliated issuer, which may be considered one in which the fund owns 5% or more of the outstanding voting securities, or a company which is under common control. At period end, the aggregate values of the fund's investments in affiliated issuers and in unaffiliated issuers were $65,307,298 and $3,778,191,234, respectively. | | | |
| (j) | The rate quoted is the annualized seven-day yield of the fund at period end. | | | |
| (l) | A portion of this security is on loan. See Note 2 for additional information. | | | |
| (v) | Affiliated issuer that is available only to investment companies managed by MFS. The rate quoted for the MFS Institutional Money Market Portfolio is the annualized seven-day yield of the fund at period end. | | | |
| The following abbreviations are used in this report and are defined: |
| ADR | American Depositary Receipt |
| REIT | Real Estate Investment Trust |
See Notes to Financial Statements
Financial Statements
Statement of Assets and Liabilities
At 2/28/23
This statement represents your fund’s balance sheet, which details the assets and liabilities comprising the total value of the fund.
| Assets | |
| Investments in unaffiliated issuers, at value, including $8,925,725 of securities on loan (identified cost, $3,080,152,190) | $3,778,191,234 |
| Investments in affiliated issuers, at value (identified cost, $60,892,820) | 65,307,298 |
| Cash | 310,989 |
| Receivables for | |
| Investments sold | 23,971,775 |
| Fund shares sold | 2,329,888 |
| Interest and dividends | 3,979,267 |
| Other assets | 11,174 |
| Total assets | $3,874,101,625 |
| Liabilities | |
| Payables for | |
| Investments purchased | $1,622,157 |
| Fund shares reacquired | 8,946,057 |
| Collateral for securities loaned, at value | 9,026,775 |
| Payable to affiliates | |
| Investment adviser | 168,098 |
| Administrative services fee | 3,216 |
| Shareholder servicing costs | 563,136 |
| Distribution and service fees | 7,600 |
| Payable for independent Trustees' compensation | 63 |
| Accrued expenses and other liabilities | 263,797 |
| Total liabilities | $20,600,899 |
| Net assets | $3,853,500,726 |
| Net assets consist of | |
| Paid-in capital | $3,150,820,893 |
| Total distributable earnings (loss) | 702,679,833 |
| Net assets | $3,853,500,726 |
| Shares of beneficial interest outstanding | 211,740,220 |
Statement of Assets and Liabilities – continued
| | Net assets | Shares
outstanding | Net asset value
per share (a) |
| Class A | $306,254,013 | 16,989,851 | $18.03 |
| Class B | 4,022,899 | 239,101 | 16.83 |
| Class C | 29,474,081 | 1,764,741 | 16.70 |
| Class I | 1,604,805,682 | 88,158,539 | 18.20 |
| Class R1 | 2,196,011 | 130,739 | 16.80 |
| Class R2 | 5,676,915 | 318,299 | 17.84 |
| Class R3 | 99,011,686 | 5,479,532 | 18.07 |
| Class R4 | 73,846,123 | 4,049,165 | 18.24 |
| Class R6 | 1,728,213,316 | 94,610,253 | 18.27 |
| (a) | Maximum offering price per share was equal to the net asset value per share for all share classes, except for Class A, for which the maximum offering price per share was $19.13 [100 / 94.25 x $18.03]. On sales of $50,000 or more, the maximum offering price of Class A shares is reduced. A contingent deferred sales charge may be imposed on redemptions of Class A, Class B, and Class C shares. Redemption price per share was equal to the net asset value per share for Classes I, R1, R2, R3, R4, and R6. |
See Notes to Financial Statements
Financial Statements
Statement of Operations
Year ended 2/28/23
This statement describes how much your fund earned in investment income and accrued in expenses. It also describes any gains and/or losses generated by fund operations.
| Net investment income (loss) | |
| Income | |
| Dividends | $69,543,912 |
| Dividends from affiliated issuers | 987,529 |
| Other | 257,931 |
| Income on securities loaned | 55,316 |
| Foreign taxes withheld | (475,637) |
| Total investment income | $70,369,051 |
| Expenses | |
| Management fee | $30,986,258 |
| Distribution and service fees | 1,413,236 |
| Shareholder servicing costs | 2,219,479 |
| Administrative services fee | 610,977 |
| Independent Trustees' compensation | 60,190 |
| Custodian fee | 129,834 |
| Shareholder communications | 300,952 |
| Audit and tax fees | 65,316 |
| Legal fees | 18,969 |
| Miscellaneous | 245,037 |
| Total expenses | $36,050,248 |
| Reduction of expenses by investment adviser and distributor | (528,196) |
| Net expenses | $35,522,052 |
| Net investment income (loss) | $34,846,999 |
| Realized and unrealized gain (loss) |
| Realized gain (loss) (identified cost basis) | |
| Unaffiliated issuers | $179,583,837 |
| Affiliated issuers | (441,407) |
| Foreign currency | 6,749 |
| Net realized gain (loss) | $179,149,179 |
| Change in unrealized appreciation or depreciation | |
| Unaffiliated issuers | $(326,825,833) |
| Affiliated issuers | (21,284,202) |
| Net unrealized gain (loss) | $(348,110,035) |
| Net realized and unrealized gain (loss) | $(168,960,856) |
| Change in net assets from operations | $(134,113,857) |
See Notes to Financial Statements
Financial Statements
Statements of Changes in Net Assets
These statements describe the increases and/or decreases in net assets resulting from operations, any distributions, and any shareholder transactions.
| | Year ended |
| | 2/28/23 | 2/28/22 |
| Change in net assets | | |
| From operations | | |
| Net investment income (loss) | $34,846,999 | $20,645,545 |
| Net realized gain (loss) | 179,149,179 | 515,912,927 |
| Net unrealized gain (loss) | (348,110,035) | 147,863,386 |
| Change in net assets from operations | $(134,113,857) | $684,421,858 |
| Total distributions to shareholders | $(293,062,186) | $(372,836,514) |
| Change in net assets from fund share transactions | $(11,547,898) | $249,455,580 |
| Total change in net assets | $(438,723,941) | $561,040,924 |
| Net assets | | |
| At beginning of period | 4,292,224,667 | 3,731,183,743 |
| At end of period | $3,853,500,726 | $4,292,224,667 |
See Notes to Financial Statements
Financial Statements
Financial Highlights
The financial highlights table is intended to help you understand the fund's financial performance for the past 5 years. Certain information reflects financial results for a single fund share. The total returns in the table represent the rate that an investor would have earned (or lost) on an investment in the fund share class (assuming reinvestment of all distributions) held for the entire period.
| Class A | Year ended |
| | 2/28/23 | 2/28/22 | 2/28/21 | 2/29/20 | 2/28/19
|
| Net asset value, beginning of period | $20.03 | $18.53 | $14.12 | $15.16 | $14.92 |
| Income (loss) from investment operations |
| Net investment income (loss) (d) | $0.12 | $0.05 | $0.07 | $0.10 | $0.05 |
| Net realized and unrealized gain (loss) | (0.77) | 3.32 | 4.66 | (0.38) | 1.21 |
| Total from investment operations | $(0.65) | $3.37 | $4.73 | $(0.28) | $1.26 |
| Less distributions declared to shareholders |
| From net investment income | $(0.23) | $(0.15) | $— | $(0.10) | $(0.04) |
| From net realized gain | (1.12) | (1.72) | (0.32) | (0.66) | (0.98) |
| Total distributions declared to shareholders | $(1.35) | $(1.87) | $(0.32) | $(0.76) | $(1.02) |
| Net asset value, end of period (x) | $18.03 | $20.03 | $18.53 | $14.12 | $15.16 |
| Total return (%) (r)(s)(t)(x) | (2.88) | 18.34 | 34.47 | (2.41) | 8.90 |
Ratios (%) (to average net assets)
and Supplemental data: |
| Expenses before expense reductions | 1.20 | 1.19 | 1.23 | 1.23 | 1.29 |
| Expenses after expense reductions | 1.18 | 1.18 | 1.22 | 1.22 | 1.28 |
| Net investment income (loss) | 0.65 | 0.25 | 0.53 | 0.64 | 0.31 |
| Portfolio turnover | 30 | 44 | 48 | 44 | 57 |
| Net assets at end of period (000 omitted) | $306,254 | $361,165 | $333,743 | $331,255 | $318,067 |
See Notes to Financial Statements
Financial Highlights – continued
| Class B | Year ended |
| | 2/28/23 | 2/28/22 | 2/28/21 | 2/29/20 | 2/28/19
|
| Net asset value, beginning of period | $18.77 | $17.54 | $13.48 | $14.52 | $14.40 |
| Income (loss) from investment operations |
| Net investment income (loss) (d) | $(0.01) | $(0.09) | $(0.03) | $(0.02) | $(0.07) |
| Net realized and unrealized gain (loss) | (0.73) | 3.13 | 4.41 | (0.36) | 1.17 |
| Total from investment operations | $(0.74) | $3.04 | $4.38 | $(0.38) | $1.10 |
| Less distributions declared to shareholders |
| From net investment income | $(0.08) | $(0.09) | $— | $— | $— |
| From net realized gain | (1.12) | (1.72) | (0.32) | (0.66) | (0.98) |
| Total distributions declared to shareholders | $(1.20) | $(1.81) | $(0.32) | $(0.66) | $(0.98) |
| Net asset value, end of period (x) | $16.83 | $18.77 | $17.54 | $13.48 | $14.52 |
| Total return (%) (r)(s)(t)(x) | (3.61) | 17.45 | 33.50 | (3.11) | 8.05 |
Ratios (%) (to average net assets)
and Supplemental data: |
| Expenses before expense reductions | 1.95 | 1.94 | 1.98 | 1.98 | 2.04 |
| Expenses after expense reductions | 1.93 | 1.93 | 1.97 | 1.97 | 2.03 |
| Net investment income (loss) | (0.09) | (0.49) | (0.21) | (0.12) | (0.48) |
| Portfolio turnover | 30 | 44 | 48 | 44 | 57 |
| Net assets at end of period (000 omitted) | $4,023 | $6,016 | $6,032 | $6,207 | $7,198 |
See Notes to Financial Statements
Financial Highlights – continued
| Class C | Year ended |
| | 2/28/23 | 2/28/22 | 2/28/21 | 2/29/20 | 2/28/19
|
| Net asset value, beginning of period | $18.66 | $17.45 | $13.41 | $14.45 | $14.33 |
| Income (loss) from investment operations |
| Net investment income (loss) (d) | $(0.02) | $(0.09) | $(0.03) | $(0.02) | $(0.08) |
| Net realized and unrealized gain (loss) | (0.72) | 3.11 | 4.39 | (0.36) | 1.18 |
| Total from investment operations | $(0.74) | $3.02 | $4.36 | $(0.38) | $1.10 |
| Less distributions declared to shareholders |
| From net investment income | $(0.10) | $(0.09) | $— | $— | $— |
| From net realized gain | (1.12) | (1.72) | (0.32) | (0.66) | (0.98) |
| Total distributions declared to shareholders | $(1.22) | $(1.81) | $(0.32) | $(0.66) | $(0.98) |
| Net asset value, end of period (x) | $16.70 | $18.66 | $17.45 | $13.41 | $14.45 |
| Total return (%) (r)(s)(t)(x) | (3.65) | 17.42 | 33.52 | (3.12) | 8.09 |
Ratios (%) (to average net assets)
and Supplemental data: |
| Expenses before expense reductions | 1.95 | 1.94 | 1.98 | 1.98 | 2.04 |
| Expenses after expense reductions | 1.93 | 1.93 | 1.97 | 1.97 | 2.03 |
| Net investment income (loss) | (0.09) | (0.48) | (0.21) | (0.11) | (0.56) |
| Portfolio turnover | 30 | 44 | 48 | 44 | 57 |
| Net assets at end of period (000 omitted) | $29,474 | $37,588 | $39,061 | $38,477 | $41,046 |
See Notes to Financial Statements
Financial Highlights – continued
| Class I | Year ended |
| | 2/28/23 | 2/28/22 | 2/28/21 | 2/29/20 | 2/28/19
|
| Net asset value, beginning of period | $20.22 | $18.69 | $14.21 | $15.25 | $15.00 |
| Income (loss) from investment operations |
| Net investment income (loss) (d) | $0.16 | $0.10 | $0.11 | $0.14 | $0.12 |
| Net realized and unrealized gain (loss) | (0.78) | 3.35 | 4.70 | (0.39) | 1.19 |
| Total from investment operations | $(0.62) | $3.45 | $4.81 | $(0.25) | $1.31 |
| Less distributions declared to shareholders |
| From net investment income | $(0.28) | $(0.20) | $(0.01) | $(0.13) | $(0.08) |
| From net realized gain | (1.12) | (1.72) | (0.32) | (0.66) | (0.98) |
| Total distributions declared to shareholders | $(1.40) | $(1.92) | $(0.33) | $(0.79) | $(1.06) |
| Net asset value, end of period (x) | $18.20 | $20.22 | $18.69 | $14.21 | $15.25 |
| Total return (%) (r)(s)(t)(x) | (2.70) | 18.64 | 34.82 | (2.17) | 9.19 |
Ratios (%) (to average net assets)
and Supplemental data: |
| Expenses before expense reductions | 0.95 | 0.94 | 0.98 | 0.98 | 1.04 |
| Expenses after expense reductions | 0.93 | 0.93 | 0.97 | 0.97 | 1.03 |
| Net investment income (loss) | 0.91 | 0.46 | 0.78 | 0.89 | 0.77 |
| Portfolio turnover | 30 | 44 | 48 | 44 | 57 |
| Net assets at end of period (000 omitted) | $1,604,806 | $1,795,671 | $1,430,510 | $1,119,891 | $917,167 |
See Notes to Financial Statements
Financial Highlights – continued
| Class R1 | Year ended |
| | 2/28/23 | 2/28/22 | 2/28/21 | 2/29/20 | 2/28/19
|
| Net asset value, beginning of period | $18.78 | $17.55 | $13.49 | $14.53 | $14.41 |
| Income (loss) from investment operations |
| Net investment income (loss) (d) | $(0.01) | $(0.10) | $(0.03) | $(0.02) | $(0.06) |
| Net realized and unrealized gain (loss) | (0.74) | 3.14 | 4.41 | (0.36) | 1.16 |
| Total from investment operations | $(0.75) | $3.04 | $4.38 | $(0.38) | $1.10 |
| Less distributions declared to shareholders |
| From net investment income | $(0.11) | $(0.09) | $— | $(0.00)(w) | $— |
| From net realized gain | (1.12) | (1.72) | (0.32) | (0.66) | (0.98) |
| Total distributions declared to shareholders | $(1.23) | $(1.81) | $(0.32) | $(0.66) | $(0.98) |
| Net asset value, end of period (x) | $16.80 | $18.78 | $17.55 | $13.49 | $14.53 |
| Total return (%) (r)(s)(t)(x) | (3.65) | 17.45 | 33.47 | (3.08) | 8.04 |
Ratios (%) (to average net assets)
and Supplemental data: |
| Expenses before expense reductions | 1.95 | 1.94 | 1.98 | 1.98 | 2.04 |
| Expenses after expense reductions | 1.92 | 1.93 | 1.96 | 1.97 | 2.03 |
| Net investment income (loss) | (0.09) | (0.51) | (0.22) | (0.11) | (0.42) |
| Portfolio turnover | 30 | 44 | 48 | 44 | 57 |
| Net assets at end of period (000 omitted) | $2,196 | $2,224 | $2,320 | $1,453 | $1,581 |
See Notes to Financial Statements
Financial Highlights – continued
| Class R2 | Year ended |
| | 2/28/23 | 2/28/22 | 2/28/21 | 2/29/20 | 2/28/19
|
| Net asset value, beginning of period | $19.84 | $18.38 | $14.04 | $15.09 | $14.87 |
| Income (loss) from investment operations |
| Net investment income (loss) (d) | $0.07 | $0.01 | $0.04 | $0.06 | $0.02 |
| Net realized and unrealized gain (loss) | (0.76) | 3.28 | 4.62 | (0.38) | 1.19 |
| Total from investment operations | $(0.69) | $3.29 | $4.66 | $(0.32) | $1.21 |
| Less distributions declared to shareholders |
| From net investment income | $(0.19) | $(0.11) | $— | $(0.07) | $(0.01) |
| From net realized gain | (1.12) | (1.72) | (0.32) | (0.66) | (0.98) |
| Total distributions declared to shareholders | $(1.31) | $(1.83) | $(0.32) | $(0.73) | $(0.99) |
| Net asset value, end of period (x) | $17.84 | $19.84 | $18.38 | $14.04 | $15.09 |
| Total return (%) (r)(s)(t)(x) | (3.13) | 18.02 | 34.16 | (2.64) | 8.59 |
Ratios (%) (to average net assets)
and Supplemental data: |
| Expenses before expense reductions | 1.45 | 1.44 | 1.48 | 1.47 | 1.54 |
| Expenses after expense reductions | 1.43 | 1.43 | 1.47 | 1.47 | 1.53 |
| Net investment income (loss) | 0.40 | 0.05 | 0.29 | 0.40 | 0.16 |
| Portfolio turnover | 30 | 44 | 48 | 44 | 57 |
| Net assets at end of period (000 omitted) | $5,677 | $6,251 | $4,779 | $5,054 | $3,719 |
See Notes to Financial Statements
Financial Highlights – continued
| Class R3 | Year ended |
| | 2/28/23 | 2/28/22 | 2/28/21 | 2/29/20 | 2/28/19
|
| Net asset value, beginning of period | $20.08 | $18.57 | $14.15 | $15.20 | $14.96 |
| Income (loss) from investment operations |
| Net investment income (loss) (d) | $0.12 | $0.05 | $0.07 | $0.10 | $0.06 |
| Net realized and unrealized gain (loss) | (0.78) | 3.33 | 4.67 | (0.38) | 1.20 |
| Total from investment operations | $(0.66) | $3.38 | $4.74 | $(0.28) | $1.26 |
| Less distributions declared to shareholders |
| From net investment income | $(0.23) | $(0.15) | $(0.00)(w) | $(0.11) | $(0.04) |
| From net realized gain | (1.12) | (1.72) | (0.32) | (0.66) | (0.98) |
| Total distributions declared to shareholders | $(1.35) | $(1.87) | $(0.32) | $(0.77) | $(1.02) |
| Net asset value, end of period (x) | $18.07 | $20.08 | $18.57 | $14.15 | $15.20 |
| Total return (%) (r)(s)(t)(x) | (2.92) | 18.36 | 34.47 | (2.41) | 8.88 |
Ratios (%) (to average net assets)
and Supplemental data: |
| Expenses before expense reductions | 1.20 | 1.19 | 1.23 | 1.22 | 1.29 |
| Expenses after expense reductions | 1.18 | 1.18 | 1.22 | 1.21 | 1.28 |
| Net investment income (loss) | 0.65 | 0.24 | 0.53 | 0.64 | 0.40 |
| Portfolio turnover | 30 | 44 | 48 | 44 | 57 |
| Net assets at end of period (000 omitted) | $99,012 | $104,164 | $88,963 | $76,069 | $45,355 |
See Notes to Financial Statements
Financial Highlights – continued
| Class R4 | Year ended |
| | 2/28/23 | 2/28/22 | 2/28/21 | 2/29/20 | 2/28/19
|
| Net asset value, beginning of period | $20.25 | $18.72 | $14.23 | $15.27 | $15.02 |
| Income (loss) from investment operations |
| Net investment income (loss) (d) | $0.17 | $0.09 | $0.11 | $0.14 | $0.10 |
| Net realized and unrealized gain (loss) | (0.78) | 3.36 | 4.71 | (0.38) | 1.21 |
| Total from investment operations | $(0.61) | $3.45 | $4.82 | $(0.24) | $1.31 |
| Less distributions declared to shareholders |
| From net investment income | $(0.28) | $(0.20) | $(0.01) | $(0.14) | $(0.08) |
| From net realized gain | (1.12) | (1.72) | (0.32) | (0.66) | (0.98) |
| Total distributions declared to shareholders | $(1.40) | $(1.92) | $(0.33) | $(0.80) | $(1.06) |
| Net asset value, end of period (x) | $18.24 | $20.25 | $18.72 | $14.23 | $15.27 |
| Total return (%) (r)(s)(t)(x) | (2.66) | 18.60 | 34.84 | (2.16) | 9.19 |
Ratios (%) (to average net assets)
and Supplemental data: |
| Expenses before expense reductions | 0.95 | 0.94 | 0.98 | 0.98 | 1.03 |
| Expenses after expense reductions | 0.93 | 0.93 | 0.97 | 0.97 | 1.03 |
| Net investment income (loss) | 0.91 | 0.45 | 0.78 | 0.89 | 0.66 |
| Portfolio turnover | 30 | 44 | 48 | 44 | 57 |
| Net assets at end of period (000 omitted) | $73,846 | $103,464 | $104,206 | $82,613 | $71,765 |
See Notes to Financial Statements
Financial Highlights – continued
| Class R6 | Year ended |
| | 2/28/23 | 2/28/22 | 2/28/21 | 2/29/20 | 2/28/19
|
| Net asset value, beginning of period | $20.29 | $18.75 | $14.24 | $15.27 | $15.02 |
| Income (loss) from investment operations |
| Net investment income (loss) (d) | $0.18 | $0.13 | $0.13 | $0.16 | $0.12 |
| Net realized and unrealized gain (loss) | (0.78) | 3.35 | 4.71 | (0.38) | 1.20 |
| Total from investment operations | $(0.60) | $3.48 | $4.84 | $(0.22) | $1.32 |
| Less distributions declared to shareholders |
| From net investment income | $(0.30) | $(0.22) | $(0.01) | $(0.15) | $(0.09) |
| From net realized gain | (1.12) | (1.72) | (0.32) | (0.66) | (0.98) |
| Total distributions declared to shareholders | $(1.42) | $(1.94) | $(0.33) | $(0.81) | $(1.07) |
| Net asset value, end of period (x) | $18.27 | $20.29 | $18.75 | $14.24 | $15.27 |
| Total return (%) (r)(s)(t)(x) | (2.59) | 18.75 | 34.98 | (2.02) | 9.28 |
Ratios (%) (to average net assets)
and Supplemental data: |
| Expenses before expense reductions | 0.85 | 0.84 | 0.87 | 0.87 | 0.92 |
| Expenses after expense reductions | 0.84 | 0.83 | 0.86 | 0.86 | 0.92 |
| Net investment income (loss) | 1.00 | 0.62 | 0.89 | 0.99 | 0.78 |
| Portfolio turnover | 30 | 44 | 48 | 44 | 57 |
| Net assets at end of period (000 omitted) | $1,728,213 | $1,875,681 | $1,721,570 | $1,303,575 | $938,134 |
| (d) | Per share data is based on average shares outstanding. |
| (r) | Certain expenses have been reduced without which performance would have been lower. |
| (s) | From time to time the fund may receive proceeds from litigation settlements, without which performance would be lower. |
| (t) | Total returns do not include any applicable sales charges. |
| (w) | Per share amount was less than $0.01. |
| (x) | The net asset values and total returns have been calculated on net assets which include adjustments made in accordance with U.S. generally accepted accounting principles required at period end for financial reporting purposes. |
See Notes to Financial Statements
Notes to Financial Statements
(1) Business and Organization
MFS New Discovery Value Fund (the fund) is a diversified series of MFS Series Trust XIII (the trust). The trust is organized as a Massachusetts business trust and is registered under the Investment Company Act of 1940, as amended, as an open-end management investment company.
The fund is an investment company and accordingly follows the investment company accounting and reporting guidance of the Financial Accounting Standards Board (FASB) Accounting Standards Codification Topic 946 Financial Services - Investment Companies.
(2) Significant Accounting Policies
General — The preparation of financial statements in conformity with U.S. generally accepted accounting principles requires management to make estimates and assumptions that affect the reported amounts of assets and liabilities, and disclosure of contingent assets and liabilities at the date of the financial statements and the reported amounts of increases and decreases in net assets from operations during the reporting period. Actual results could differ from those estimates. In the preparation of these financial statements, management has evaluated subsequent events occurring after the date of the fund’s Statement of Assets and Liabilities through the date that the financial statements were issued. The fund will generally focus on securities of small size companies which may be more volatile than those of larger companies.
Balance Sheet Offsetting — The fund's accounting policy with respect to balance sheet offsetting is that, absent an event of default by the counterparty or a termination of the agreement, the International Swaps and Derivatives Association (ISDA) Master Agreement, or similar agreement, does not result in an offset of reported amounts of financial assets and financial liabilities in the Statement of Assets and Liabilities across transactions between the fund and the applicable counterparty. The fund's right to setoff may be restricted or prohibited by the bankruptcy or insolvency laws of the particular jurisdiction to which a specific master netting agreement counterparty is subject. Balance sheet offsetting disclosures, to the extent applicable to the fund, have been included in the fund’s Significant Accounting Policies note under the captions for each of the fund’s in-scope financial instruments and transactions.
Investment Valuations — Subject to its oversight, the fund's Board of Trustees has delegated primary responsibility for determining or causing to be determined the value of the fund’s investments to MFS as the fund's adviser, pursuant to the fund’s valuation policy and procedures which have been adopted by the adviser and approved by the Board. Effective September 8, 2022, and in accordance with Rule 2a-5 under the Investment Company Act of 1940, the Board of Trustees designated the adviser as the “valuation designee” of the fund. If the adviser, as valuation designee, determines that reliable market quotations are not readily available for an investment, the investment is valued at fair value as determined in good faith by the adviser in accordance with the adviser’s fair valuation policy and procedures.
Under the fund's valuation policy and procedures, equity securities, including restricted equity securities, are generally valued at the last sale or official closing price on their primary market or exchange as provided by a third-party pricing service. Equity securities, for which there were no sales reported that day, are generally valued at the last quoted daily bid quotation on their primary market or exchange as provided by a
Notes to Financial Statements - continued
third-party pricing service. Short-term instruments with a maturity at issuance of 60 days or less may be valued at amortized cost, which approximates market value.
Open-end investment companies are generally valued at net asset value per share. The values of foreign securities and other assets and liabilities expressed in foreign currencies are converted to U.S. dollars using the mean of bid and asked prices for rates provided by a third-party pricing service.
Under the fund’s valuation policy and procedures, market quotations are not considered to be readily available for debt instruments, floating rate loans, and many types of derivatives. These investments are generally valued at fair value based on information from third-party pricing services or otherwise determined by the adviser in accordance with the adviser’s fair valuation policy and procedures. Securities and other assets generally valued on the basis of information from a third-party pricing service may also be valued at a broker/dealer bid quotation. In determining values, third-party pricing services can utilize both transaction data and market information such as yield, quality, coupon rate, maturity, type of issue, trading characteristics, spreads and other market data. An investment may also be valued at fair value if the adviser determines that the investment’s value has been materially affected by events occurring after the close of the exchange or market on which the investment is principally traded (such as foreign exchange or market) and prior to the determination of the fund’s net asset value, or after the halt of trading of a specific security where trading does not resume prior to the close of the exchange or market on which the security is principally traded. Events that occur after foreign markets close (such as developments in foreign markets and significant movements in the U.S. markets) and prior to the determination of the fund’s net asset value may be deemed to have a material effect on the value of securities traded in foreign markets. Accordingly, the fund’s foreign equity securities may often be valued at fair value. The adviser generally relies on third-party pricing services or other information (such as the correlation with price movements of similar securities in the same or other markets; the type, cost and investment characteristics of the security; the business and financial condition of the issuer; and trading and other market data) to assist in determining whether to fair value and at what value to fair value an investment. The value of an investment for purposes of calculating the fund’s net asset value can differ depending on the source and method used to determine value. When fair valuation is used, the value of an investment used to determine the fund’s net asset value may differ from quoted or published prices for the same investment. There can be no assurance that the fund could obtain the fair value assigned to an investment if it were to sell the investment at the same time at which the fund determines its net asset value per share.
Various inputs are used in determining the value of the fund's assets or liabilities. These inputs are categorized into three broad levels. In certain cases, the inputs used to measure fair value may fall into different levels of the fair value hierarchy. In such cases, an investment's level within the fair value hierarchy is based on the lowest level of input that is significant to the fair value measurement. The fund's assessment of the significance of a particular input to the fair value measurement in its entirety requires judgment, and considers factors specific to the investment. Level 1 includes unadjusted quoted prices in active markets for identical assets or liabilities. Level 2 includes other significant observable market-based inputs (including quoted prices for similar securities, interest rates, prepayment speed, and credit risk). Level 3 includes significant
Notes to Financial Statements - continued
unobservable inputs, which may include the adviser's own assumptions in determining the fair value of investments. The following is a summary of the levels used as of February 28, 2023 in valuing the fund's assets and liabilities:
| Financial Instruments | Level 1 | Level 2 | Level 3 | Total |
| Equity Securities | $3,796,069,906 | $— | $— | $3,796,069,906 |
| Mutual Funds | 47,428,626 | — | — | 47,428,626 |
| Total | $3,843,498,532 | $— | $— | $3,843,498,532 |
For further information regarding security characteristics, see the Portfolio of Investments.
Foreign Currency Translation — Purchases and sales of foreign investments, income, and expenses are converted into U.S. dollars based upon currency exchange rates prevailing on the respective dates of such transactions or on the reporting date for foreign denominated receivables and payables. Gains and losses attributable to foreign currency exchange rates on sales of securities are recorded for financial statement purposes as net realized gains and losses on investments. Gains and losses attributable to foreign exchange rate movements on receivables, payables, income and expenses are recorded for financial statement purposes as foreign currency transaction gains and losses. That portion of both realized and unrealized gains and losses on investments that results from fluctuations in foreign currency exchange rates is not separately disclosed.
Security Loans — Under its Securities Lending Agency Agreement with the fund, State Street Bank and Trust Company, as lending agent, loans the securities of the fund to certain qualified institutions (the “Borrowers”) approved by the fund. Security loans can be terminated at the discretion of either the lending agent or the fund and the related securities must be returned within the earlier of the standard trade settlement period for such securities or within three business days. The loans are collateralized by cash and/or U.S. Treasury and federal agency obligations in an amount typically at least equal to the market value of the securities loaned. On loans collateralized by cash, the cash collateral is invested in a money market fund. The market value of the loaned securities is determined at the close of business of the fund and any additional required collateral is delivered to the fund on the next business day. The lending agent provides the fund with indemnification against Borrower default. In the event of Borrower default, the lending agent will, for the benefit of the fund, either purchase securities identical to those loaned or, when such purchase is commercially impracticable, pay the fund the market value of the loaned securities. In return, the lending agent assumes the fund's rights to the related collateral. If the collateral value is less than the cost to purchase identical securities, the lending agent is responsible for the shortfall, but only to the extent that such shortfall is not due to a decline in collateral value resulting from collateral reinvestment for which the fund bears the risk of loss. At period end, the fund had investment securities on loan, all of which were classified as equity securities in the fund's Portfolio of Investments, with a fair value of $8,925,725. The fair value of the fund's investment securities on loan and a related liability of $9,026,775 for cash collateral received on securities loaned are both presented gross in the Statement of Assets and Liabilities. The collateral on securities loaned exceeded the value of securities on loan at period end. The liability for cash collateral for securities loaned is carried at fair value, which is categorized as level 2 within the fair value hierarchy. A portion of the income generated upon investment of the collateral is remitted to the
Notes to Financial Statements - continued
Borrowers, and the remainder is allocated between the fund and the lending agent. On loans collateralized by U.S. Treasury and/or federal agency obligations, a fee is received from the Borrower, and is allocated between the fund and the lending agent. Income from securities lending is separately reported in the Statement of Operations. The dividend and interest income earned on the securities loaned is accounted for in the same manner as other dividend and interest income.
Indemnifications — Under the fund's organizational documents, its officers and Trustees may be indemnified against certain liabilities and expenses arising out of the performance of their duties to the fund. Additionally, in the normal course of business, the fund enters into agreements with service providers that may contain indemnification clauses. The fund's maximum exposure under these agreements is unknown as this would involve future claims that may be made against the fund that have not yet occurred.
Investment Transactions and Income — Investment transactions are recorded on the trade date. Dividends received in cash are recorded on the ex-dividend date. Certain dividends from foreign securities will be recorded when the fund is informed of the dividend if such information is obtained subsequent to the ex-dividend date. Dividend payments received in additional securities are recorded on the ex-dividend date in an amount equal to the value of the security on such date. In determining the net gain or loss on securities sold, the cost of securities is determined on the identified cost basis.
The fund may receive proceeds from litigation settlements. Any proceeds received from litigation involving portfolio holdings are reflected in the Statement of Operations in realized gain/loss if the security has been disposed of by the fund or in unrealized gain/loss if the security is still held by the fund. Any other proceeds from litigation not related to portfolio holdings are reflected as other income in the Statement of Operations.
Tax Matters and Distributions — The fund intends to qualify as a regulated investment company, as defined under Subchapter M of the Internal Revenue Code, and to distribute all of its taxable income, including realized capital gains. As a result, no provision for federal income tax is required. The fund’s federal tax returns, when filed, will remain subject to examination by the Internal Revenue Service for a three year period. Management has analyzed the fund’s tax positions taken on federal and state tax returns for all open tax years and does not believe that there are any uncertain tax positions that require recognition of a tax liability. Foreign taxes, if any, have been accrued by the fund in the accompanying financial statements in accordance with the applicable foreign tax law. Foreign income taxes may be withheld by certain countries in which the fund invests. Additionally, capital gains realized by the fund on securities issued in or by certain foreign countries may be subject to capital gains tax imposed by those countries.
Distributions to shareholders are recorded on the ex-dividend date. Income and capital gain distributions are determined in accordance with income tax regulations, which may differ from U.S. generally accepted accounting principles. Certain capital accounts in the financial statements are periodically adjusted for permanent differences in order to reflect their tax character. These adjustments have no impact on net assets or net asset value per share. Temporary differences which arise from recognizing certain items of income, expense, gain or loss in different periods for financial statement and tax purposes will reverse at some time in the future.
Notes to Financial Statements - continued
Book/tax differences primarily relate to passive foreign investment companies, wash sale loss deferrals, and treating a portion of the proceeds from redemptions as a distribution for tax purposes.
The tax character of distributions declared to shareholders for the last two fiscal years is as follows:
| | Year ended
2/28/23 | Year ended
2/28/22 |
| Ordinary income (including any short-term capital gains) | $98,166,756 | $165,834,643 |
| Long-term capital gains | 194,895,430 | 207,001,871 |
| Total distributions | $293,062,186 | $372,836,514 |
The federal tax cost and the tax basis components of distributable earnings were as follows:
| As of 2/28/23 | |
| Cost of investments | $3,198,411,997 |
| Gross appreciation | 869,608,219 |
| Gross depreciation | (224,521,684) |
| Net unrealized appreciation (depreciation) | $645,086,535 |
| Undistributed ordinary income | 50,558,747 |
| Undistributed long-term capital gain | 7,034,551 |
| Total distributable earnings (loss) | $702,679,833 |
Multiple Classes of Shares of Beneficial Interest — The fund offers multiple classes of shares, which differ in their respective distribution and service fees. The fund's income, realized and unrealized gain (loss), and common expenses are allocated to shareholders based on the daily net assets of each class. Dividends are declared separately for each class. Differences in per share dividend rates are generally due to differences in separate class expenses. Class B and Class C shares will convert to Class A shares approximately eight years after purchase. The fund’s distributions declared to shareholders as reported in the Statements of Changes in Net Assets are presented by class as follows:
| | Year
ended
2/28/23 | | Year
ended
2/28/22 |
| Class A | $22,849,984 | | $31,886,235 |
| Class B | 319,016 | | 572,192 |
| Class C | 2,234,690 | | 3,520,445 |
| Class I | 123,507,919 | | 151,035,934 |
| Class R1 | 154,412 | | 226,208 |
| Class R2 | 430,752 | | 501,000 |
| Class R3 | 6,677,151 | | 8,905,282 |
| Class R4 | 5,586,823 | | 8,957,807 |
| Class R6 | 131,301,439 | | 167,231,411 |
| Total | $293,062,186 | | $372,836,514 |
Notes to Financial Statements - continued
(3) Transactions with Affiliates
Investment Adviser — The fund has an investment advisory agreement with MFS to provide overall investment management and related administrative services and facilities to the fund. The management fee is computed daily and paid monthly at the following annual rates based on the fund's average daily net assets:
| Up to $1 billion | 0.90% |
| In excess of $1 billion and up to $2.5 billion | 0.80% |
| In excess of $2.5 billion and up to $5 billion | 0.75% |
| In excess of $5 billion | 0.70% |
MFS has agreed in writing to reduce its management fee by a specified amount if certain MFS mutual fund assets exceed thresholds agreed to by MFS and the fund's Board of Trustees. MFS has also agreed in writing to waive at least 0.01% of its management fee as part of this agreement. The agreement to waive at least 0.01% of the management fee will continue until modified by the fund's Board of Trustees, but such agreement will continue at least until June 30, 2023. For the year ended February 28, 2023, this management fee reduction amounted to $527,852, which is included in the reduction of total expenses in the Statement of Operations. The management fee incurred for the year ended February 28, 2023 was equivalent to an annual effective rate of 0.79% of the fund's average daily net assets.
For the period from March 1, 2022 through July 31, 2022, the investment adviser had agreed in writing to pay a portion of the fund’s total annual operating expenses, excluding interest, taxes, extraordinary expenses, brokerage and transaction costs, certain tax reclaim recovery expenses (including contingency fees and closing agreement expenses), and investment-related expenses, such that total fund operating expenses did not exceed the following rates annually of each class’s average daily net assets:
| Classes |
| A | B | C | I | R1 | R2 | R3 | R4 | R6 |
| 1.39% | 2.14% | 2.14% | 1.14% | 2.14% | 1.64% | 1.39% | 1.14% | 1.10% |
This written agreement terminated on July 31, 2022. For the period from March 1, 2022 through July 31, 2022, the fund’s actual operating expenses did not exceed the limit and therefore, the investment adviser did not pay any portion of the fund’s expenses related to this agreement.
Effective August 1, 2022, the investment adviser has agreed in writing to pay a portion of the fund’s total annual operating expenses, excluding interest, taxes, extraordinary expenses, brokerage and transaction costs, certain tax reclaim recovery expenses (including contingency fees and closing agreement expenses), and investment-related expenses, such that total fund operating expenses do not exceed the following rates annually of each class’s average daily net assets:
| Classes |
| A | B | C | I | R1 | R2 | R3 | R4 | R6 |
| 1.39% | 2.14% | 2.14% | 1.14% | 2.14% | 1.64% | 1.39% | 1.14% | 1.07% |
Notes to Financial Statements - continued
This written agreement will continue until modified by the fund’s Board of Trustees, but such agreement will continue at least until June 30, 2024. For the period from August 1, 2022 through February 28, 2023, the fund’s actual operating expenses did not exceed the limit and therefore, the investment adviser did not pay any portion of the fund’s expenses related to this agreement.
Distributor — MFS Fund Distributors, Inc. (MFD), a wholly-owned subsidiary of MFS, as distributor, received $10,103 for the year ended February 28, 2023, as its portion of the initial sales charge on sales of Class A shares of the fund.
The Board of Trustees has adopted a distribution plan for certain share classes pursuant to Rule 12b-1 of the Investment Company Act of 1940.
The fund's distribution plan provides that the fund will pay MFD for services provided by MFD and financial intermediaries in connection with the distribution and servicing of certain share classes. One component of the plan is a distribution fee paid to MFD and another component of the plan is a service fee paid to MFD. MFD may subsequently pay all, or a portion, of the distribution and/or service fees to financial intermediaries.
Distribution Plan Fee Table:
| | Distribution
Fee Rate (d) | Service
Fee Rate (d) | Total
Distribution
Plan (d) | Annual
Effective
Rate (e) | Distribution
and Service
Fee |
| Class A | — | 0.25% | 0.25% | 0.25% | $ 772,903 |
| Class B | 0.75% | 0.25% | 1.00% | 1.00% | 46,262 |
| Class C | 0.75% | 0.25% | 1.00% | 1.00% | 313,098 |
| Class R1 | 0.75% | 0.25% | 1.00% | 0.99% | 20,748 |
| Class R2 | 0.25% | 0.25% | 0.50% | 0.50% | 29,230 |
| Class R3 | — | 0.25% | 0.25% | 0.25% | 230,995 |
| Total Distribution and Service Fees | | | | | $1,413,236 |
| (d) | In accordance with the distribution plan for certain classes, the fund pays distribution and/or service fees equal to these annual percentage rates of each class’s average daily net assets. The distribution and service fee rates disclosed by class represent the current rates in effect at the end of the reporting period. Any rate changes, if applicable, are detailed below. |
| (e) | The annual effective rates represent actual fees incurred under the distribution plan for the year ended February 28, 2023 based on each class's average daily net assets. MFD has voluntarily agreed to rebate a portion of each class's 0.25% service fee attributable to accounts for which there is no financial intermediary specified on the account except for accounts attributable to MFS or its affiliates' seed money. For the year ended February 28, 2023, this rebate amounted to $150 and $194 for Class A and Class R1 shares, respectively, and is included in the reduction of total expenses in the Statement of Operations. |
Certain Class A shares are subject to a contingent deferred sales charge (CDSC) in the event of a shareholder redemption within 18 months of purchase. Class B shares are subject to a CDSC in the event of a shareholder redemption within six years of
Notes to Financial Statements - continued
purchase. Class C shares are subject to a CDSC in the event of a shareholder redemption within 12 months of purchase. All contingent deferred sales charges are paid to MFD and during the year ended February 28, 2023, were as follows:
| | Amount |
| Class A | $81 |
| Class B | 6,552 |
| Class C | 357 |
Shareholder Servicing Agent — MFS Service Center, Inc. (MFSC), a wholly-owned subsidiary of MFS, receives a fee from the fund for its services as shareholder servicing agent calculated as a percentage of the average daily net assets of the fund as determined periodically under the supervision of the fund's Board of Trustees. For the year ended February 28, 2023, the fee was $101,006, which equated to 0.0026% annually of the fund's average daily net assets. MFSC also receives reimbursement from the fund for out-of-pocket expenses, sub-accounting and other shareholder servicing costs which may be paid to affiliated and unaffiliated service providers. Class R6 shares do not incur sub-accounting fees. For the year ended February 28, 2023, these out-of-pocket expenses, sub-accounting and other shareholder servicing costs amounted to $2,118,473.
Administrator — MFS provides certain financial, legal, shareholder communications, compliance, and other administrative services to the fund. Under an administrative services agreement, the fund reimburses MFS the costs incurred to provide these services. The fund is charged an annual fixed amount of $17,500 plus a fee based on average daily net assets. The administrative services fee incurred for the year ended February 28, 2023 was equivalent to an annual effective rate of 0.0159% of the fund's average daily net assets.
Trustees’ and Officers’ Compensation — The fund pays compensation to independent Trustees in the form of a retainer, attendance fees, and additional compensation to Board and Committee chairpersons. The fund does not pay compensation directly to Trustees or officers of the fund who are also officers of the investment adviser, all of whom receive remuneration from MFS for their services to the fund. Certain officers and Trustees of the fund are officers or directors of MFS, MFD, and MFSC.
Other — The fund invests in the MFS Institutional Money Market Portfolio which is managed by MFS and seeks current income consistent with preservation of capital and liquidity. This money market fund does not pay a management fee to MFS but does incur investment and operating costs.
On August 3, 2022, MFS redeemed 213 shares of Class R1 for an aggregate amount of $3,559.
The fund is permitted to engage in purchase and sale transactions with funds and accounts for which MFS serves as investment adviser or sub-adviser (“cross-trades”) pursuant to a policy adopted by the Board of Trustees. This policy has been designed to ensure that cross-trades conducted by the fund comply with Rule 17a-7 under the Investment Company Act of 1940. During the year ended February 28, 2023, the fund engaged in purchase and sale transactions pursuant to this policy, which amounted to $2,068,609 and $8,937,293, respectively. The sales transactions resulted in net realized gains (losses) of $(766,761).
Notes to Financial Statements - continued
The adviser has voluntarily undertaken to reimburse the fund from its own resources on a quarterly basis for the cost of investment research embedded in the cost of the fund’s securities trades. This agreement may be rescinded at any time. For the year ended February 28, 2023, this reimbursement amounted to $256,974, which is included in “Other” income in the Statement of Operations.
(4) Portfolio Securities
For the year ended February 28, 2023, purchases and sales of investments, other than short-term obligations, aggregated $1,151,244,199 and $1,440,160,885, respectively.
(5) Shares of Beneficial Interest
The fund's Declaration of Trust permits the Trustees to issue an unlimited number of full and fractional shares of beneficial interest. Transactions in fund shares were as follows:
| | Year ended
2/28/23 | | Year ended
2/28/22 |
| | Shares | Amount | | Shares | Amount |
| Shares sold | | | | | |
| Class A | 767,039 | $13,764,757 | | 1,098,623 | $22,440,858 |
| Class B | 1,248 | 20,802 | | 4,693 | 88,671 |
| Class C | 45,215 | 751,541 | | 73,653 | 1,430,370 |
| Class I | 24,332,154 | 441,640,960 | | 23,172,755 | 478,577,848 |
| Class R1 | 36,941 | 631,900 | | 44,355 | 850,624 |
| Class R2 | 49,007 | 873,667 | | 150,541 | 3,094,638 |
| Class R3 | 1,480,378 | 26,135,987 | | 1,796,008 | 37,157,318 |
| Class R4 | 800,576 | 14,616,720 | | 1,451,743 | 30,146,067 |
| Class R6 | 14,443,299 | 261,969,209 | | 19,041,746 | 396,650,999 |
| | 41,955,857 | $760,405,543 | | 46,834,117 | $970,437,393 |
Shares issued to shareholders
in reinvestment of distributions | | | | | |
| Class A | 1,304,261 | $22,828,836 | | 1,604,212 | $31,851,630 |
| Class B | 19,303 | 316,664 | | 30,529 | 568,762 |
| Class C | 137,333 | 2,234,690 | | 190,074 | 3,520,261 |
| Class I | 6,899,575 | 121,870,477 | | 7,437,596 | 148,948,456 |
| Class R1 | 9,451 | 154,412 | | 12,144 | 226,208 |
| Class R2 | 24,869 | 430,752 | | 25,476 | 501,000 |
| Class R3 | 380,813 | 6,677,151 | | 447,641 | 8,905,282 |
| Class R4 | 315,554 | 5,586,823 | | 446,689 | 8,957,807 |
| Class R6 | 6,603,399 | 116,928,077 | | 7,443,689 | 149,542,988 |
| | 15,694,558 | $277,027,882 | | 17,638,050 | $353,022,394 |
Notes to Financial Statements - continued
| | Year ended
2/28/23 | | Year ended
2/28/22 |
| | Shares | Amount | | Shares | Amount |
| Shares reacquired | | | | | |
| Class A | (3,108,143) | $(55,867,073) | | (2,683,483) | $(54,860,923) |
| Class B | (101,934) | (1,698,892) | | (58,640) | (1,130,466) |
| Class C | (431,880) | (7,154,573) | | (488,417) | (9,439,974) |
| Class I | (31,874,555) | (574,677,907) | | (18,342,265) | (381,438,542) |
| Class R1 | (34,092) | (576,567) | | (70,268) | (1,327,926) |
| Class R2 | (70,612) | (1,235,919) | | (121,020) | (2,477,181) |
| Class R3 | (1,568,721) | (28,035,177) | | (1,846,089) | (37,845,051) |
| Class R4 | (2,175,652) | (38,958,705) | | (2,357,189) | (49,091,085) |
| Class R6 | (18,888,251) | (340,776,510) | | (25,868,519) | (536,393,059) |
| | (58,253,840) | $(1,048,981,323) | | (51,835,890) | $(1,074,004,207) |
| Net change | | | | | |
| Class A | (1,036,843) | $(19,273,480) | | 19,352 | $(568,435) |
| Class B | (81,383) | (1,361,426) | | (23,418) | (473,033) |
| Class C | (249,332) | (4,168,342) | | (224,690) | (4,489,343) |
| Class I | (642,826) | (11,166,470) | | 12,268,086 | 246,087,762 |
| Class R1 | 12,300 | 209,745 | | (13,769) | (251,094) |
| Class R2 | 3,264 | 68,500 | | 54,997 | 1,118,457 |
| Class R3 | 292,470 | 4,777,961 | | 397,560 | 8,217,549 |
| Class R4 | (1,059,522) | (18,755,162) | | (458,757) | (9,987,211) |
| Class R6 | 2,158,447 | 38,120,776 | | 616,916 | 9,800,928 |
| | (603,425) | $(11,547,898) | | 12,636,277 | $249,455,580 |
The fund is one of several mutual funds in which certain MFS funds may invest. The MFS funds do not invest in the underlying funds for the purpose of exercising management or control. At the end of the period, the MFS Growth Allocation Fund, the MFS Moderate Allocation Fund, the MFS Aggressive Growth Allocation Fund, and the MFS Conservative Allocation Fund were the owners of record of approximately 3%, 3%, 2%, and 1%, respectively, of the value of outstanding voting shares of the fund.
In addition, the MFS Lifetime 2025 Fund, the MFS Lifetime 2030 Fund, the MFS Lifetime 2035 Fund, the MFS Lifetime 2040 Fund, the MFS Lifetime 2045 Fund, the MFS Lifetime 2050 Fund, the MFS Lifetime 2055 Fund, the MFS Lifetime 2060 Fund, the MFS Lifetime 2065 Fund, and the MFS Lifetime Income Fund were each the owners of record of less than 1% of the value of outstanding voting shares of the fund.
Effective June 1, 2019, purchases of the fund’s Class B shares were closed to new and existing investors subject to certain exceptions. Effective at the close of business on August 14, 2019, the fund was closed to new investors subject to certain exceptions.
Notes to Financial Statements - continued
(6) Line of Credit
The fund and certain other funds managed by MFS participate in a $1.45 billion unsecured committed line of credit of which $1.2 billion is reserved for use by the fund and certain other MFS U.S. funds. The line of credit is provided by a syndicate of banks under a credit agreement. Borrowings may be made for temporary financing needs. Interest is charged to each fund, based on its borrowings, generally at a rate equal to the highest of 1) Daily Simple SOFR (Secured Overnight Financing Rate) plus 0.10%, 2) the Federal Funds Effective Rate, or 3) the Overnight Bank Funding Rate, each plus an agreed upon spread. A commitment fee, based on the average daily unused portion of the committed line of credit, is allocated among the participating funds. The line of credit expires on March 14, 2024 unless extended or renewed. In addition, the fund and other funds managed by MFS have established unsecured uncommitted borrowing arrangements with certain banks for temporary financing needs. Interest is charged to each fund, based on its borrowings, at rates equal to customary reference rates plus an agreed upon spread. For the year ended February 28, 2023, the fund’s commitment fee and interest expense were $18,659 and $0, respectively, and are included in “Miscellaneous” expense in the Statement of Operations.
(7) Investments in Affiliated Issuers
An affiliated issuer may be considered one in which the fund owns 5% or more of the outstanding voting securities, or a company which is under common control. For the purposes of this report, the following were affiliated issuers:
| Affiliated Issuers | Beginning
Value | Purchases | Sales
Proceeds | Realized
Gain
(Loss) | Change in
Unrealized
Appreciation or
Depreciation | Ending
Value |
| MFS Institutional Money Market Portfolio | $17,782,312 | $708,180,116 | $687,559,101 | $(1,476) | $— | $38,401,851 |
| Zumiez, Inc. | 44,592,594 | 4,748,367 | 711,381 | (439,931) | (21,284,202) | 26,905,447 |
| | $62,374,906 | $712,928,483 | $688,270,482 | $(441,407) | $(21,284,202) | $65,307,298 |
| Affiliated Issuers | Dividend
Income | Capital Gain
Distributions |
| MFS Institutional Money Market Portfolio | $987,529 | $— |
| Zumiez, Inc. | — | — |
| | $987,529 | $— |
(8) LIBOR Transition
Certain of the fund's investments, including investments in certain debt instruments and derivatives (if any), as well as borrowings by the fund and certain other contractual arrangements of the fund, may be based on the London Interbank Offered Rate (“LIBOR”). In 2017, the regulatory authority that oversees financial services firms in the United Kingdom announced plans to transition away from LIBOR by the end of 2021. In March 2021, the administrator of LIBOR announced the extension of the publication of the more commonly used U.S. dollar LIBOR settings to the end of June 2023. Although the full impacts of the transition away from LIBOR are not fully known, the transition may result in, among other things, an increase in volatility or illiquidity of the
Notes to Financial Statements - continued
markets for instruments that currently rely on LIBOR to determine interest rates and this could have an adverse impact on the fund's performance. With respect to the fund's accounting for investments, including investments in certain debt instruments and derivatives, as well as borrowings by the fund and any other contractual arrangements of the fund that undergo reference rate-related modifications as a result of the transition, management will rely upon the relief provided by FASB Codification Topic 848 – Reference Rate Reform (Topic 848). The guidance in Topic 848 permits the fund to account for those modified contracts as a continuation of the existing contracts. The situation remains fluid, and management believes, based on best available information, that the impact of the transition will not be material to the fund.
(9) Subsequent Event
On March 30, 2023, the fund announced that effective after the close of business on September 29, 2023, purchases of Class R1 and Class R2 shares will be closed to new eligible investors.
Report of Independent Registered Public Accounting Firm
To the Shareholders of MFS New Discovery Value Fund and the Board of Trustees of MFS Series Trust XIII
Opinion on the Financial Statements
We have audited the accompanying statement of assets and liabilities of MFS New Discovery Value Fund (the “Fund”) (one of the funds constituting MFS Series Trust XIII (the “Trust”)), including the portfolio of investments, as of February 28, 2023, and the related statement of operations for the year then ended, the statements of changes in net assets for each of the two years in the period then ended, the financial highlights for each of the five years in the period then ended and the related notes (collectively referred to as the “financial statements”). In our opinion, the financial statements present fairly, in all material respects, the financial position of the Fund (one of the funds constituting MFS Series Trust XIII) at February 28, 2023, the results of its operations for the year then ended, the changes in its net assets for each of the two years in the period then ended and its financial highlights for each of the five years in the period then ended, in conformity with U.S. generally accepted accounting principles.
Basis for Opinion
These financial statements are the responsibility of the Trust’s management. Our responsibility is to express an opinion on the Fund’s financial statements based on our audits. We are a public accounting firm registered with the Public Company Accounting Oversight Board (United States) (“PCAOB”) and are required to be independent with respect to the Trust in accordance with the U.S. federal securities laws and the applicable rules and regulations of the Securities and Exchange Commission and the PCAOB.
We conducted our audits in accordance with the standards of the PCAOB. Those standards require that we plan and perform the audit to obtain reasonable assurance about whether the financial statements are free of material misstatement, whether due to error or fraud. The Trust is not required to have, nor were we engaged to perform, an audit of the Trust’s internal control over financial reporting. As part of our audits, we are required to obtain an understanding of internal control over financial reporting, but not for the purpose of expressing an opinion on the effectiveness of the Trust’s internal control over financial reporting. Accordingly, we express no such opinion.
Report of Independent Registered Public Accounting Firm – continued
Our audits included performing procedures to assess the risks of material misstatement of the financial statements, whether due to error or fraud, and performing procedures that respond to those risks. Such procedures included examining, on a test basis, evidence regarding the amounts and disclosures in the financial statements. Our procedures included confirmation of securities owned as of February 28, 2023, by correspondence with the custodian, brokers and others; when replies were not received from brokers and others, we performed other auditing procedures. Our audits also included evaluating the accounting principles used and significant estimates made by management, as well as evaluating the overall presentation of the financial statements. We believe that our audits provide a reasonable basis for our opinion.
We have served as the auditor of one or more MFS investment companies since 1993.
Boston, Massachusetts
April 14, 2023
Trustees and Officers — Identification and Background
The Trustees and Officers of the Trust, as of April 1, 2023, are listed below, together with their principal occupations during the past five years. (Their titles may have varied during that period.) The address of each Trustee and Officer is 111 Huntington Avenue, Boston, Massachusetts 02199-7618.
| Name, Age | | Position(s) Held with Fund | | Trustee/Officer Since(h) | | Number of MFS Funds overseen by the Trustee | | Principal Occupations During
the Past Five Years | | Other Directorships During
the Past Five Years (j) |
| INTERESTED TRUSTEE | | | | | | | | | | |
Michael W. Roberge (k)
(age 56) | | Trustee | | January 2021 | | 136 | | Massachusetts Financial Services Company, Chairman (since January 2021); Chief Executive Officer (since January 2017); Director; Chairman of the Board (since January 2022); President (until December 2018); Chief Investment Officer (until December 2018) | | N/A |
| INDEPENDENT TRUSTEES | | | | | | | | | | |
John P. Kavanaugh
(age 68) | | Trustee and Chair of Trustees | | January 2009 | | 136 | | Private investor | | N/A |
Steven E. Buller
(age 71) | | Trustee | | February 2014 | | 136 | | Private investor | | N/A |
John A. Caroselli
(age 68) | | Trustee | | March 2017 | | 136 | | Private investor; JC Global Advisors, LLC (management consulting), President (since 2015) | | N/A |
Maureen R. Goldfarb
(age 67) | | Trustee | | January 2009 | | 136 | | Private investor | | N/A |
Peter D. Jones
(age 67) | | Trustee | | January 2019 | | 136 | | Private investor | | N/A |
James W. Kilman, Jr.
(age 61) | | Trustee | | January 2019 | | 136 | | Burford Capital Limited (finance and investment management), Senior Advisor (since May 3, 2021), Chief Financial Officer (2019 - May 2, 2021); KielStrand Capital LLC (family office), Chief Executive Officer (since 2016) | | Alpha-En Corporation, Director (2016-2019) |
Trustees and Officers - continued
| Name, Age | | Position(s) Held with Fund | | Trustee/Officer Since(h) | | Number of MFS Funds overseen by the Trustee | | Principal Occupations During
the Past Five Years | | Other Directorships During
the Past Five Years (j) |
Clarence Otis, Jr.
(age 66) | | Trustee | | March 2017 | | 136 | | Private investor | | VF Corporation, Director; Verizon Communications, Inc., Director; The Travelers Companies, Director |
Maryanne L. Roepke
(age 67) | | Trustee | | May 2014 | | 136 | | Private investor | | N/A |
Laurie J. Thomsen
(age 65) | | Trustee | | March 2005 | | 136 | | Private investor | | The Travelers Companies, Director; Dycom Industries, Inc., Director |
| Name, Age | | Position(s) Held with
Fund | | Trustee/Officer Since(h) | | Number of MFS Funds for which the Person is an Officer | | Principal Occupations During
the Past Five Years |
| OFFICERS | | | | | | | | |
Christopher R. Bohane (k)
(age 49) | | Assistant Secretary and Assistant Clerk | | July 2005 | | 136 | | Massachusetts Financial Services Company, Senior Vice President and Senior Managing Counsel |
Kino Clark (k)
(age 54) | | Assistant Treasurer | | January 2012 | | 136 | | Massachusetts Financial Services Company, Vice President |
John W. Clark, Jr. (k)
(age 56) | | Assistant Treasurer | | April 2017 | | 136 | | Massachusetts Financial Services Company, Vice President |
David L. DiLorenzo (k)
(age 54) | | President | | July 2005 | | 136 | | Massachusetts Financial Services Company, Senior Vice President |
Heidi W. Hardin (k)
(age 55) | | Secretary and Clerk | | April 2017 | | 136 | | Massachusetts Financial Services Company, Executive Vice President and General Counsel |
Brian E. Langenfeld (k)
(age 50) | | Assistant Secretary and Assistant Clerk | | June 2006 | | 136 | | Massachusetts Financial Services Company, Vice President and Managing Counsel |
Trustees and Officers - continued
| Name, Age | | Position(s) Held with
Fund | | Trustee/Officer Since(h) | | Number of MFS Funds for which the Person is an Officer | | Principal Occupations During
the Past Five Years |
Rosa E. Licea-Mailloux (k)
(age 46) | | Chief Compliance Officer | | March 2022 | | 136 | | Massachusetts Financial Services Company, Vice President (since 2018); Director of Corporate Compliance (2018-2021), Senior Director Compliance (2021-2022), Senior Managing Director of North American Compliance & Chief Compliance Officer (since March 2022); Natixis Investment Managers (investment management), Funds Chief Compliance Officer, Deputy General Counsel & Senior Vice President (until 2018) |
Amanda S. Mooradian (k)
(age 44) | | Assistant Secretary and Assistant Clerk | | September 2018 | | 136 | | Massachusetts Financial Services Company, Assistant Vice President and Senior Counsel |
Susan A. Pereira (k)
(age 52) | | Assistant Secretary and Assistant Clerk | | July 2005 | | 136 | | Massachusetts Financial Services Company, Vice President and Managing Counsel |
Kasey L. Phillips (k)
(age 52) | | Assistant Treasurer | | September 2012 | | 136 | | Massachusetts Financial Services Company, Vice President |
Matthew A. Stowe (k)
(age 48) | | Assistant Secretary and Assistant Clerk | | October 2014 | | 136 | | Massachusetts Financial Services Company, Vice President and Senior Managing Counsel |
William B. Wilson (k)
(age 40) | | Assistant Secretary and Assistant Clerk | | October 2022 | | 136 | | Massachusetts Financial Services Company, Assistant Vice President and Senior Counsel |
James O. Yost (k)
(age 62) | | Treasurer | | September 1990 | | 136 | | Massachusetts Financial Services Company, Senior Vice President |
| (h) | Date first appointed to serve as Trustee/Officer of an MFS Fund. Each Trustee has served continuously since appointment unless indicated otherwise. From January 2012 through December 2016, Messrs. DiLorenzo and Yost served as Treasurer and Deputy Treasurer of the Funds, respectively. |
| (j) | Directorships or trusteeships of companies required to report to the Securities and Exchange Commission (i.e., “public companies”). |
| (k) | “Interested person” of the Trust within the meaning of the Investment Company Act of 1940 (referred to as the 1940 Act), which is the principal federal law governing investment companies like the fund, as a result of a position with MFS. The address of MFS is 111 Huntington Avenue, Boston, Massachusetts 02199-7618. |
Trustees and Officers - continued
Each Trustee (other than Messrs. Jones, Kilman and Roberge) has been elected by shareholders and each Trustee and Officer holds office until his or her successor is chosen and qualified or until his or her earlier death, resignation, retirement or removal. Mr. Roberge became a Trustee of the Funds on January 1, 2021 and Messrs. Jones and Kilman became Trustees of the Funds on January 1, 2019. The Trust does not hold annual meetings for the purpose of electing Trustees, and Trustees are not elected for fixed terms. Under the terms of the Board's retirement policy, an Independent Trustee shall retire at the end of the calendar year in which he or she reaches the earlier of 75 years of age or 15 years of service on the Board (or, in the case of any Independent Trustee who joined the Board prior to 2015, 20 years of service on the Board).
Messrs. Buller, Kilman and Otis and Ms. Roepke are members of the Trust’s Audit Committee.
Each of the Interested Trustees and certain Officers hold comparable officer positions with certain affiliates of MFS.
The Statement of Additional Information for a Fund includes further information about the Trustees and is available without charge upon request by calling 1-800-225-2606.
| Investment Adviser | Custodian |
Massachusetts Financial Services Company
111 Huntington Avenue
Boston, MA 02199-7618 | State Street Bank and Trust Company
1 Lincoln Street
Boston, MA 02111-2900 |
| Distributor | Independent Registered Public Accounting Firm |
MFS Fund Distributors, Inc.
111 Huntington Avenue
Boston, MA 02199-7618 | Ernst & Young LLP
200 Clarendon Street
Boston, MA 02116 |
| Portfolio Manager(s) | |
Richard Offen
Kevin Schmitz | |
Proxy Voting Policies and Information
MFS votes proxies on behalf of the fund pursuant to proxy voting policies and procedures that are available without charge, upon request, by calling 1-800-225-2606, by visiting mfs.com/proxyvoting, or by visiting the SEC’s Web site at http://www.sec.gov.
Information regarding how the fund voted proxies relating to portfolio securities during the most recent twelve-month period ended June 30 is available by August 31 of each year without charge by visiting mfs.com/proxyvoting, or by visiting the SEC’s Web site at http://www.sec.gov.
Quarterly Portfolio Disclosure
The fund files a complete schedule of portfolio holdings with the SEC for the first and third quarters of each fiscal year as an exhibit to its reports on Form N-PORT. The fund's Form N-PORT reports are available on the SEC's Web site at http://www.sec.gov. A shareholder can obtain the portfolio holdings report for the first and third quarters of the fund's fiscal year at mfs.com/openendfunds by choosing the fund's name and then scrolling to the “Resources” section and clicking on the “Prospectus and Reports” tab.
Further Information
From time to time, MFS may post important information about the fund or the MFS Funds on the MFS Web site (mfs.com). This information is available at https://www.mfs.com/announcements or at mfs.com/openendfunds by choosing the fund’s name and then scrolling to the “Resources” section and clicking on the “Announcements” tab, if any.
Information About Fund Contracts and Legal Claims
The fund has entered into contractual arrangements with an investment adviser, administrator, distributor, shareholder servicing agent, and custodian who each provide services to the fund. Unless expressly stated otherwise, shareholders are not parties to, or intended beneficiaries of these contractual arrangements, and these contractual arrangements are not intended to create any shareholder right to enforce them against the service providers or to seek any remedy under them against the service providers, either directly or on behalf of the fund.
Under the Trust’s By-Laws and Declaration of Trust, any claims asserted against or on behalf of the MFS Funds, including claims against Trustees and Officers, must be brought in state and federal courts located within the Commonwealth of Massachusetts.
Federal Tax Information (unaudited)
The fund will notify shareholders of amounts for use in preparing 2023 income tax forms in January 2024. The following information is provided pursuant to provisions of the Internal Revenue Code.
The fund designates the maximum amount allowable as qualified dividend income eligible to be taxed at the same rate as long-term capital gain.
The fund designates $230,904,000 as capital gain dividends paid during the fiscal year.
For corporate shareholders, 35.83% of the ordinary income dividends paid during the fiscal year qualify for the corporate dividends received deduction.
Federal Tax Information (unaudited) - continued
The fund designates the maximum amount allowable as Section 199A dividends as defined in Proposed Treasury Regulation §1.199A-3(d).
| FACTS | WHAT DOES MFS DO WITH YOUR PERSONAL INFORMATION? |
| Why? | Financial companies choose how they share your personal information. Federal law gives consumers the right to limit some but not all sharing. Federal law also requires us to tell you how we collect, share, and protect your personal information. Please read this notice carefully to understand what we do. |
| What? | The types of personal information we collect and share depend on the product or service you have with us. This information can include: |
| • Social Security number and account balances |
| • Account transactions and transaction history |
| • Checking account information and wire transfer instructions |
| When you are no longer our customer, we continue to share your information as described in this notice. |
| How? | All financial companies need to share customers' personal information to run their everyday business. In the section below, we list the reasons financial companies can share their customers' personal information; the reasons MFS chooses to share; and whether you can limit this sharing. |
Reasons we can share your
personal information | Does MFS share? | Can you limit
this sharing? |
For our everyday business purposes –
such as to process your transactions, maintain your
account(s), respond to court orders and legal
investigations, or report to credit bureaus | Yes | No |
For our marketing purposes –
to offer our products and services to you | No | We don't share |
For joint marketing with other
financial companies | No | We don't share |
For our affiliates' everyday business purposes –
information about your transactions and experiences | No | We don't share |
For our affiliates' everyday business purposes –
information about your creditworthiness | No | We don't share |
| For nonaffiliates to market to you | No | We don't share |
| Questions? | Call 800-225-2606 or go to mfs.com. |
| Who we are |
| Who is providing this notice? | MFS Funds, MFS Investment Management, MFS Institutional Advisors, Inc., and MFS Heritage Trust Company. |
| What we do |
How does MFS
protect my personal
information? | To protect your personal information from unauthorized access and use, we use security measures that comply with federal law. These measures include procedural, electronic, and physical safeguards for the protection of the personal information we collect about you. |
How does MFS
collect my personal
information? | We collect your personal information, for example, when you |
| • open an account or provide account information |
| • direct us to buy securities or direct us to sell your securities |
| • make a wire transfer |
| We also collect your personal information from others, such as credit bureaus, affiliates, or other companies. |
| Why can't I limit all sharing? | Federal law gives you the right to limit only |
| • sharing for affiliates' everyday business purposes – information about your creditworthiness |
| • affiliates from using your information to market to you |
| • sharing for nonaffiliates to market to you |
| State laws and individual companies may give you additional rights to limit sharing. |
| Definitions |
| Affiliates | Companies related by common ownership or control. They can be financial and nonfinancial companies. |
| • MFS does not share personal information with affiliates, except for everyday business purposes as described on page one of this notice. |
| Nonaffiliates | Companies not related by common ownership or control. They can be financial and nonfinancial companies. |
| • MFS does not share with nonaffiliates so they can market to you. |
| Joint marketing | A formal agreement between nonaffiliated financial companies that together market financial products or services to you. |
| • MFS doesn't jointly market. |
| Other important information |
| If you own an MFS product or receive an MFS service in the name of a third party such as a bank or broker-dealer, their privacy policy may apply to you instead of ours. |
Save paper with eDelivery.
MFS® will send you prospectuses, reports, and proxies directly via e-mail so you will get information faster with less mailbox clutter.
To sign up:
1. Go to mfs.com.
2. Log in via MFS® Access.
3. Select eDelivery.
If you own your MFS fund shares through a financial institution or a retirement plan, MFS® TALK, MFS® Access, or eDelivery may not be available to you.
CONTACT
WEB SITE
mfs.com
MFS TALK
1-800-637-8255
24 hours a day
ACCOUNT SERVICE AND LITERATURE
Shareholders
1-800-225-2606
Financial advisors
1-800-343-2829
Retirement plan services
1-800-637-1255
MAILING ADDRESS
MFS Service Center, Inc.
P.O. Box 219341
Kansas City, MO 64121-9341
OVERNIGHT MAIL
MFS Service Center, Inc.
Suite 219341
430 W 7th Street
Kansas City, MO 64105-1407
Item 1(b):
Not applicable.
ITEM 2. CODE OF ETHICS.
The Registrant has adopted a Code of Ethics (the "Code") pursuant to Section 406 of the Sarbanes-Oxley Act and as defined in Form N-CSR that applies to the Registrant's principal executive officer and principal financial and accounting officer. During the period covered by this report, the Registrant has not amended any provision in the Code that relates to an element of the Code's definition enumerated in paragraph
(b)of Item 2 of this Form N-CSR. During the period covered by this report, the Registrant did not grant a waiver, including an implicit waiver, from any provision of the Code.
A copy of the Code is attached hereto as EX-99.COE.
ITEM 3. AUDIT COMMITTEE FINANCIAL EXPERT.
Messrs. Steven E. Buller, James Kilman, and Clarence Otis, Jr. and Ms. Maryanne L. Roepke, members of the Audit Committee, have been determined by the Board of Trustees in their reasonable business judgment to meet the definition of "audit committee financial expert" as such term is defined in Form N-CSR. In addition, Messrs. Buller, Kilman, and Otis and Ms. Roepke are "independent" members of the Audit Committee (as such term has been defined by the Securities and Exchange Commission in regulations implementing Section 407 of the Sarbanes-Oxley Act of 2002). The Securities and Exchange Commission has stated that the designation of a person as an audit committee financial expert pursuant to this Item 3 on the Form N-CSR does not impose on such a person any duties, obligations or liability that are greater than the duties, obligations or liability imposed on such person as a member of the Audit Committee and the Board of Trustees in the absence of such designation or identification.
ITEM 4. PRINCIPAL ACCOUNTANT FEES AND SERVICES.
Items 4(a) through 4(d) and 4(g):
The Board of Trustees has appointed Deloitte & Touche LLP ("Deloitte") to serve as independent accountants to certain series of the Registrant and Ernst & Young LLP ("E&Y") to serve in the same capacity to certain other series of the Registrant (each a "Fund" and collectively the "Funds"). The tables below set forth the audit fees billed to each Fund as well as fees for non-audit services provided to each Fund and/or to each Fund's investment adviser, Massachusetts Financial Services Company ("MFS"), and to various entities either controlling, controlled by, or under common control with MFS that provide ongoing services to the Funds ("MFS Related Entities").
For the fiscal years ended February 28, 2023 and 2022, respectively, audit fees billed to each Fund by Deloitte and E&Y were as follows:
Fees billed by Deloitte: | | Audit Fees |
| 2023 | | 2022 |
| | | |
MFS Government Securities Fund | 64,436 | | 59,613 |
| | |
Fees billed by E&Y: | | Audit Fees |
| 2023 | | 2022 |
MFS Diversified Income Fund | 68,993 | | 63,826 |
MFS New Discovery Value Fund | 54,371 | | 50,312 |
Total | 123,364 | | 114,138 |
For the fiscal years ended February 28, 2023 and 2022, respectively, fees billed by Deloitte and E&Y for audit-related, tax and other services provided to each Fund and for audit-related, tax and other services provided to MFS and MFS Related Entities were as follows:
Fees billed by Deloitte: | Audit-Related Fees1 | | | Tax Fees2 | All Other Fees3 |
| | 2023 | 2022 | | 2023 | 20225 | 2023 | | 2022 |
To MFS Government | 0 | 0 | | 0 | 862 | | 0 | | 0 |
Securities Fund | | | | | | | | | | | | |
| | | | | | | | | | | |
Fees billed by Deloitte: | Audit-Related Fees1 | | | Tax Fees2 | All Other Fees3 |
| | 2023 | | 2022 | | 2023 | 2022 | | 2023 | | 2022 |
To MFS and MFS Related | | | | | | | | | | | | |
Entities of MFS Government Securi | 0 | | 0 | | 0 | 0 | | 3,790 | | 5,390 |
* | | | | | | | | | | | | | |
| | | | | | | | | | | | | |
| | | | | | | | | |
Fees billed by Deloitte: | | | | | | Aggregate fees for non-audit services | |
| | | | | | 2023 | | | 20225 | |
To MFS Government Securities Fund, MFS and MFS | | 3,790 | | | 6,252 | |
Related Entities# | | | | | | | | | | | | |
| | | | | | | |
Fees billed by E&Y: | | Audit-Related Fees1 | | | Tax Fees2 | All Other Fees4 |
| | 2023 | 2022 | | 2023 | 20225 | 2023 | | 2022 |
To MFS Diversified Income | | 0 | 0 | | 632 | 2,844 | 0 | | 1,680 |
Fund | | | | | | | | | | | | | |
To MFS New Discovery | | 0 | 0 | | 632 | 2,857 | 0 | | 1,740 |
Value Fund | | | | | | | | | | | | | |
Total fees billed by E&Y | | 0 | 0 | | 1,264 | 5,701 | 0 | | 3,420 |
To above Funds | | | | | | | | | | | | | |
| | | | | | | |
Fees billed by E&Y: | | Audit-Related Fees1 | | | Tax Fees2 | All Other Fees4 |
| | 2023 | 2022 | | 2023 | 2022 | | 2023 | | 2022 |
To MFS and MFS Related | | | | | | | | | | | | | |
Entities of MFS Diversified | | 0 | 1,795,090 | | 0 | 0 | | 3,165 | | 111,720 |
Income Fund* | | | | | | | | | | | | | |
To MFS and MFS Related | | | | | | | | | | | | | |
Entities of MFS New | | 0 | 1,795,090 | | 0 | 0 | | 3,165 | | 111,720 |
Discovery Value Fund* | | | | | | | | | | | | | |
| | | | | | |
Fees billed by E&Y: | | | | | Aggregate fees for non-audit services | |
| | | | | | 2023 | | | 20225 | |
To MFS Diversified Income Fund, MFS and | | | | 143,797 | | | 2,165,964 | |
MFS Related Entities# | | | | | | | | | | | | |
To MFS New Discovery Value Fund, MFS | | | | 143,797 | | | 2,166,037 | |
and MFS Related Entities# | | | | | | | | | | | | |
*This amount reflects the fees billed to MFS and MFS Related Entities for non-audit services relating directly to the operations and financial reporting of the Funds (portions of which services also related to the operations and financial reporting of other funds within the MFS Funds complex).
# This amount reflects the aggregate fees billed by Deloitte or E&Y, as the case may be, for non-audit services rendered to the Funds and for non- audit services rendered to MFS and the MFS Related Entities.
1 The fees included under "Audit-Related Fees" are fees related to assurance and related services that are reasonably related to the performance of the audit or review of financial statements, but not reported under ''Audit Fees,'' including accounting consultations, agreed-upon procedure reports, attestation reports, comfort letters and internal control reviews.
2 The fees included under "Tax Fees" are fees associated with tax compliance, tax advice and tax planning, including services relating to the filing or amendment of federal, state or local income tax returns, regulated investment company qualification reviews and tax distribution and analysis.
3 The fees included under "All Other Fees" are fees for products and services provided by Deloitte other than those reported under "Audit Fees," "Audit-Related Fees" and "Tax Fees".
4 The fees included under "All Other Fees" are fees for products and services provided by E&Y other than those reported under "Audit Fees," "Audit-Related Fees" and "Tax Fees," including fees for services related to reviews of internal controls and review of Rule 38a-1 compliance program.
5 Certain fees reported in 2022 have been restated in this filing from those reported in the Registrant's filing for the reporting period ended February 28, 2022.
Item 4(e)(1):
Set forth below are the policies and procedures established by the Audit Committee of the Board of Trustees relating to the pre-approval of audit and non-audit related services:
To the extent required by applicable law, pre-approval by the Audit Committee of the Board is needed for all audit and permissible non-audit services rendered to the Funds and all permissible non-audit services rendered to MFS or MFS Related Entities if the services relate directly to the operations and financial reporting of the Registrant. Pre-approval is currently on an engagement-by-engagement basis. In the event pre-approval of such services is necessary between regular meetings of the Audit Committee and it is not practical to wait to seek pre-approval at the next regular meeting of the Audit Committee, pre-approval of such services may be referred to the Chair of the Audit Committee for approval; provided that the Chair may not pre-approve any individual engagement for such services exceeding $50,000 or multiple engagements for such services in the aggregate exceeding $100,000 in each period between regular meetings of the Audit Committee. Any engagement pre-approved by the Chair between regular meetings of the Audit Committee shall be presented for ratification by the entire Audit Committee at its next regularly scheduled meeting.
Item 4(e)(2):
None, or 0%, of the services relating to the Audit-Related Fees, Tax Fees and All Other Fees paid by the Fund and MFS and MFS Related Entities relating directly to the operations and financial reporting of the Registrant disclosed above were approved by the audit committee pursuant to paragraphs (c)(7)(i)(C) of Rule 2-01 of Regulation S-X (which permits audit committee approval after the start of the engagement with respect to services other than audit, review or attest services, if certain conditions are satisfied).
Item 4(f):
Not applicable.
Item 4(h):
The Registrant's Audit Committee has considered whether the provision by a Registrant's independent registered public accounting firm of non-audit services to MFS and MFS Related Entities that were not pre-approved by the Committee (because such services did not relate directly to the operations and financial reporting of the Registrant) was compatible with maintaining the independence of the independent registered public accounting firm as the Registrant's principal auditors.
ITEM 5. AUDIT COMMITTEE OF LISTED REGISTRANTS.
Not applicable to the Registrant.
ITEM 6. INVESTMENTS
A schedule of investments for each series covered by this Form N-CSR is included as part of the report to shareholders of such series under Item 1(a) of this Form N-CSR.
ITEM 7. DISCLOSURE OF PROXY VOTING POLICIES AND PROCEDURES FOR CLOSED-END MANAGEMENT INVESTMENT COMPANIES.
Not applicable to the Registrant.
ITEM 8. PORTFOLIO MANAGERS OF CLOSED-END MANAGEMENT INVESTMENT COMPANIES.
Not applicable to the Registrant.
ITEM 9. PURCHASES OF EQUITY SECURITIES BY CLOSED-END MANAGEMENT INVESTMENT COMPANY AND AFFILIATED PURCHASERS.
Not applicable to the Registrant.
ITEM 10. SUBMISSION OF MATTERS TO A VOTE OF SECURITY HOLDERS.
There were no material changes to the procedures by which shareholders may send recommendations to the Board for nominees to the Registrant's Board since the Registrant last provided disclosure as to such procedures in response to the requirements of Item 407 (c)(2)(iv) of Regulation S-K or this Item.
ITEM 11. CONTROLS AND PROCEDURES.
(a)Based upon their evaluation of the effectiveness of the registrant's disclosure controls and procedures (as defined in Rule 30a-3(c) under the Investment Company Act of 1940 (the "Act")) as conducted within 90 days of the filing date of this report on Form N-CSR, the Registrant's principal financial officer and principal executive officer have concluded that those disclosure controls and procedures provide reasonable assurance that the material information required to be disclosed by the Registrant on this report is recorded, processed, summarized and reported within the time periods specified in the Securities and Exchange Commission's rules and forms.
(b)There were no changes in the Registrant's internal controls over financial reporting (as defined in Rule 30a-3(d) under the Act) that occurred during the period covered by the report that have materially affected, or are reasonably likely to materially affect, the Registrant's internal control over financial reporting.
ITEM 12. DISCLOSURE OF SECURITIES LENDING ACTIVITIES FOR CLOSED-END MANAGEMENT INVESTMENT COMPANIES.
Not applicable to the Registrant.
ITEM 13. EXHIBITS.
(a)(1) Any code of ethics, or amendment thereto, that is the subject of the disclosure required by Item 2, to the extent that the registrant intends to satisfy the Item 2 requirements through filing of an exhibit: Attached hereto as EX-99.COE.
(2)A separate certification for each principal executive officer and principal financial officer of the registrant as required by Rule 30a-2(a) under the Act (17 CFR 270.30a-2): Attached hereto as EX-99.302CERT.
(3)Any written solicitation to purchase securities under Rule 23c-1 under the Act (17 CFR 270.23c-1) sent or given during the period covered by the report by or on behalf of the registrant to 10 or more persons. Not applicable.
(4)Change in the registrant's independent public accountant. Not applicable.
(b)If the report is filed under Section 13(a) or 15(d) of the Exchange Act, provide the certifications required by Rule 30a-2(b) under the Act (17 CFR 270.30a-2(b)), Rule 13a-14(b) or Rule 15d-14(b) under the Exchange Act (17 CFR 240.13a-14(b) or 240.15d-14(b)) and Section 1350 of Chapter 63 of Title 18 of the United States Code (18 U.S.C. 1350) as an exhibit. A certification furnished pursuant to this paragraph will not be deemed "filed" for the purposes of Section 18 of the Exchange Act (15 U.S.C. 78r), or otherwise subject to the liability of that section. Such certification will not be deemed to be incorporated by reference into any filing under the Securities Act of 1933 or the Exchange Act, except to the extent that the registrant specifically incorporates it by reference. Attached hereto as EX-99.906CERT.
Notice
A copy of the Amended and Restated Declaration of Trust, as amended, of the Registrant is on file with the Secretary of State of The Commonwealth of Massachusetts and notice is hereby given that this instrument is executed on behalf of the Registrant by an officer of the Registrant as an officer and not individually and the obligations of or arising out of this instrument are not binding upon any of the Trustees or shareholders individually, but are binding only upon the assets and property of the respective constituent series of the Registrant.
SIGNATURES
Pursuant to the requirements of the Securities Exchange Act of 1934 and the Investment Company Act of 1940, the registrant has duly caused this report to be signed on its behalf by the undersigned, thereunto duly authorized.
(Registrant) MFS SERIES TRUST XIII
By (Signature and Title)*
/S/ DAVID L. DILORENZO
David L. DiLorenzo, President
Date: April 14, 2023
Pursuant to the requirements of the Securities Exchange Act of 1934 and the Investment Company Act of 1940, this report has been signed below by the following persons on behalf of the registrant and in the capacities and on the dates indicated.
By (Signature and Title)*
/S/ DAVID L. DILORENZO
David L. DiLorenzo, President (Principal Executive Officer)
Date: April 14, 2023
By (Signature and Title)*
/S/ JAMES O. YOST
James O. Yost, Treasurer (Principal Financial Officer and Accounting Officer) Date: April 14, 2023
* Print name and title of each signing officer under his or her signature.