UNITED STATES
SECURITIES AND EXCHANGE COMMISSION
Washington, D.C. 20549
Washington, D.C. 20549
FORM N-CSR
CERTIFIED SHAREHOLDER REPORT OF REGISTERED
MANAGEMENT INVESTMENT COMPANIES
MANAGEMENT INVESTMENT COMPANIES
Investment Company Act file number: 811-03364
EMPOWER FUNDS, INC.
(Exact name of registrant as specified in charter)
8515 E. Orchard Road, Greenwood Village, Colorado 80111
(Address of principal executive offices)
(Address of principal executive offices)
Jonathan D. Kreider
President & Chief Executive Officer
Empower Funds, Inc.
Empower Funds, Inc.
8515 E. Orchard Road
Greenwood Village, Colorado 80111
(Name and address of agent for service)
Registrant's telephone number, including area code: (866) 831-7129
Date of fiscal year end: December 31
Date of reporting period: December 31, 2023
Item 1. REPORTS TO STOCKHOLDERS
EMPOWER FUNDS, INC.
Empower International Funds (Institutional Class and Investor Class)
Annual Report
December 31, 2023
This report and the financial statements attached are submitted for general information and are not authorized for distribution to prospective investors unless preceded or accompanied by an effective prospectus. Nothing herein is to be considered an offer of the sale of shares of the Funds. Such offering is made only by the prospectus of the Funds, which includes details as to offering price and other information.
Empower Emerging Markets Equity Fund
Management Discussion
The Fund’s sub-advisers are Goldman Sachs Asset Management, L.P. (“Goldman Sachs”) and Lazard Asset Management LLC (“Lazard”). Goldman Sachs replaced UBS Asset Management (Americas) Inc. as a sub-adviser effective June 1, 2023.
Fund Performance
For the twelve-month period ended December 31, 2023, the Fund (Investor Class shares) returned 9.67%, relative to a 9.83% return for the MSCI Emerging Markets Index, the Fund’s benchmark index.
Goldman Sachs Commentary
Overall, emerging market equities had a bumpy ride in 2023, driven by persistently high rates, the U.S. dollar at near multi-decade highs, volatile geopolitical events, and macroeconomic shocks. While the asset class faced an austere environment, it broadly outperformed expectations over the year.
China, which makes up roughly 30% of the benchmark index, significantly underperformed after a short rebound in the first quarter, as optimism around Covid-19 reopening consumption drove markets, but quickly faded in the second quarter as manufacturing and consumption data disappointed. For the remainder of the year, China’s economic data consistently fell short of expectations. On the other hand, India, which makes up approximately 15% of the benchmark index, had a markedly better year. Continued strong economic growth translated to both strong realized corporate earnings growth and positive forecasts. Eastern Europe also had a particularly strong 2023. Generally, Latin America inflation was well controlled in 2023, economic growth surprised to the upside and equity markets performed roughly in line with global markets.
At the country level, holdings in Mexico and South Africa contributed to performance, while stock selection in China and Taiwan detracted from returns for the Goldman Sachs sub-advised portion of the Fund. At the sector level, holdings in real estate and healthcare contributed the most, while stock selection in financials and energy detracted from returns.
Lazard Commentary
Central bank monetary policies remained a primary driver of 2023’s returns, as hopes of a pause in rate hikes in the beginning of the year were rebuffed by the Federal Reserve. The possibility that key central banks would adopt a “higher for longer” interest rate policy posture raised fears of a global recession and weak demand. The Federal Reserve’s tone softened in November, however, supported by favorable inflation news that triggered a resurgence in equity buying over the last two months of the year.
Oil prices continued to ease despite tensions in the Middle East as inventories rose. Gold prices, by contrast, continued to appreciate, finishing 13.5% higher for the year. The U.S. dollar recorded its first decline since 2020, boosting the market in the fourth quarter; its strength had served as a headwind for most of the year.
Worries about China’s struggling post-pandemic economic recovery resulted in the country’s stock market tumbling 11.2% in 2023. Latin America was the best performing region in 2023, with the equity market in Mexico, which advanced over 41%, taking the lead. Equity markets in emerging Europe were mixed, with Greece and Hungary both rallying by approximately 50%. Turkey gave back some of last
year’s extraordinary gains, as the country’s central bank raised rates to fight inflation. Equity markets in the Middle East lagged largely due to weaker oil prices in the year. South Africa’s stock market also trailed, as the country’s economy struggles with 30% unemployment and high real interest rates.
For the Lazard sub-advised portion of the Fund, stock selection accounted for excess return, supplemented by sector positioning. Operating cash detracted. Overweight exposure to the information technology sector and underweight exposure to the materials sector were the largest contributors from allocation. Overweight exposures to the communication services and consumer discretionary sectors detracted modestly. Stock selection was strongest in the information technology and energy sectors and underperformed in the financials and materials sectors. Stock selection was favorable in China and Taiwan. Stock selection in Korea and Poland detracted.
The views and opinions in this report were current as of December 31, 2023 and are subject to change at any time. They are not guarantees of performance or investment results and should not be taken as investment advice. Fund holdings are subject to change at any time. Fund returns are net of fees unless otherwise noted.
Growth of $10,000 (unaudited)
This graph compares the value of a hypothetical $10,000 investment in the Fund over the past 10 fiscal year periods or since inception (for funds lacking 10-year records) with the performance of the Fund’s benchmark index. Results include the reinvestment of all dividends and capital gains distributions. Past performance is no guarantee of future results. The graph does not reflect the deduction of taxes that a shareholder would pay on Fund distributions or the redemption of Fund shares. Performance does not include any fees or expenses of variable insurance contracts, individual retirement accounts (“IRA(s)”), qualified retirement plans or college savings programs. If such fees and expenses were included, returns would be lower.
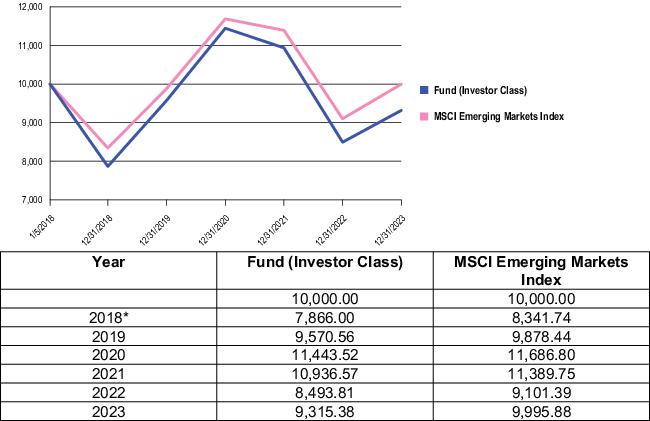
*For the period from January 5, 2018 (inception) through December 31, 2018.
Note: Performance for the Institutional Class shares may vary due to their differing fee structure. See returns table below.
Average Annual Total Returns for the Periods Ended December 31, 2023 (unaudited)
| One Year | Five Year | Since Inception(a) | |
| Institutional Class | 10.12% | 3.80% | -0.82% |
| Investor Class | 9.67% | 3.44% | -1.18% |
| (a) Institutional Class and Investor Class inception date was January 05, 2018. |
Results include the reinvestment of all dividends and capital gains distributions. Past performance is no guarantee of future results. The table does not reflect the deduction of taxes that a shareholder would pay on Fund distributions or the redemption of Fund shares. Performance does not include any fees or expenses of variable insurance contracts, IRAs, qualified retirement plans or college savings programs. If such fees and expenses were included, returns would be lower.
Empower International Growth Fund
Management Discussion
The Fund’s sub-advisers are Franklin Templeton Institutional, LLC (“Franklin”) and J.P. Morgan Investment Management Inc. (“JPMorgan”)
Fund Performance
For the twelve-month period ended December 31, 2023, the Fund (Investor Class shares) returned 16.54%, relative to a 17.58% return for the MSCI EAFE Growth Index, the Fund’s benchmark index.
Franklin Commentary
2023 began and ended on an upswing, but there was substantial turbulence along the way due to a series of bank crises in March followed by indications that major central banks would keep interest rates higher for longer in an effort to tame inflation. Financial markets hit low points in the fourth quarter as sovereign bond prices plunged - driving yields significantly higher - and some bellwether companies announced disappointing earnings and/or guidance. Amid these challenges, the potential of artificial intelligence (“AI”) thrilled investors, high interest rates did not trigger widespread recession, and inflation continued to moderate. Near year-end, markets surged as indications seemed to point to a soft economic landing in many regions, less inflationary pressure and a global economy that could continue to provide a backdrop for decent corporate earnings. Due largely to the excitement over AI, the equity market’s rally was heavily concentrated in information technology (“IT”), which gained 37.5% and was the MSCI EAFE Index’s top-performing sector. International value stocks outperformed their growth counterparts modestly, with both categories notching double-digit percentage returns as measured by MSCI style indexes.
During the year, the Franklin sub-advised portion of the Fund underperformed the benchmark index as stock selection in the communication services, industrials and materials sectors held back relative returns. Conversely, stock selection in the consumer discretionary, healthcare and IT sectors aided relative performance. In terms of sector allocations, an overweight allocation in healthcare and an underweight in financials curbed relative results, while an overweight in IT and underweight exposure to consumer staples lifted relative returns. On a regional level, stock selection in Europe - and, to a much lesser extent, Asia - hindered relative returns, while off-benchmark exposure to Canada and Brazil helped relative performance.
JPMorgan Commentary
Global equities rallied in 2023 in what came as a surprise to many market participants. Sentiment oscillated over the year, driven by recession worries at the start, to resilient growth over the summer, to higher for longer rates in the autumn, and ending the year focused on future rate cuts. A series of softer inflation prints in the U.S. and Europe led to growing excitement that central banks may cut interest rates sooner than previously expected, with the market now forecasting over 150 basis points of interest rate cuts by the Federal Reserve (the “Fed”) in 2024.
Market returns were not evenly distributed this year and were largely driven by a handful of U.S. technology stocks dubbed the “Magnificent Seven”, namely, Alphabet, Apple, Amazon, Meta Platforms, Microsoft, NVIDIA and Tesla. These stocks contributed around 80% of the S&P 500® Index returns over the year, the largest contribution of the largest seven stocks to total index performance in recent history.
More broadly, growth stocks made a stellar comeback in 2023, driven by AI frenzy amongst investors. The catalyst was the launch of generative AI chatbot, ChatGPT, that spurred the imagination of investors and will result in higher demand for advanced AI chips, helping the chip leader NVIDIA’s stock price to more than triple in 2023. As a result, the U.S. markets, with their growth-tilt, performed very strongly, thanks to a combination of better-than-expected consumer spending, resilient corporate profits, and enthusiasm around the advancements in AI.
International performance varied across regions in 2023, with emerging market equities trailing their developed market counterparts. China faced difficulties with consumption and its property market reflected in its negative equity performance this year, while Japanese stocks witnessed strong gains fueled by structural improvements in corporate governance and balance sheet management. In Europe, governments have effectively managed energy supply problems, but cautious consumers and softer manufacturing activity continued to weaken the macro backdrop. On a positive note, Europe and the UK witnessed a downtrend in inflation.
At the sector level, stock selection in industrials and an underweight exposure to consumer staples contributed to performance for the JPMorgan sub-advised portion of the Fund. On the downside, stock selection in IT and communication services detracted from performance. At the regional level, stock selection in Japan and the UK contributed to relative returns, while stock selection in continental Europe and an overweight exposure to emerging markets detracted from performance.
The views and opinions in this report were current as of December 31, 2023 and are subject to change at any time. They are not guarantees of performance or investment results and should not be taken as investment advice. Fund holdings are subject to change at any time. Fund returns are net of fees unless otherwise noted.
Growth of $10,000 (unaudited)
This graph compares the value of a hypothetical $10,000 investment in the Fund over the past 10 fiscal year periods or since inception (for funds lacking 10-year records) with the performance of the Fund’s benchmark index. Results include the reinvestment of all dividends and capital gains distributions. Past performance is no guarantee of future results. The graph does not reflect the deduction of taxes that a shareholder would pay on Fund distributions or the redemption of Fund shares. Performance does not include any fees or expenses of variable insurance contracts, individual retirement accounts (“IRA(s)”), qualified retirement plans or college savings programs. If such fees and expenses were included, returns would be lower.
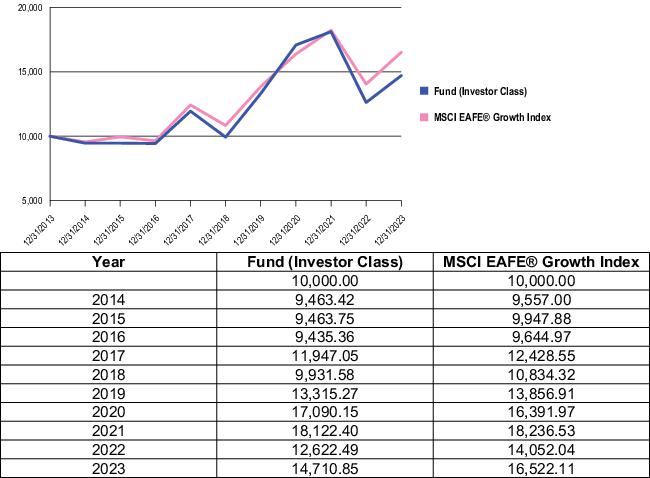
Note: Performance for the Institutional Class shares may vary due to their differing fee structure. See returns table below.
Average Annual Total Returns for the Periods Ended December 31, 2023 (unaudited)
| One Year | Five Year | Ten Year / Since Inception(a) | |
| Institutional Class | 16.93% | 8.58% | 4.38% |
| Investor Class | 16.54% | 8.17% | 3.94% |
| (a) Institutional Class inception date was May 1, 2015. |
Results include the reinvestment of all dividends and capital gains distributions. Past performance is no guarantee of future results. The table does not reflect the deduction of taxes that a shareholder would pay on Fund distributions or the redemption of Fund shares. Performance does not include any fees or expenses of variable insurance contracts, IRAs, qualified retirement plans or college savings programs. If such fees and expenses were included, returns would be lower.
Empower International Index Fund
Management Discussion
The Fund’s sub-adviser is Irish Life Investment Managers Limited (“ILIM”)
Fund Performance
For the twelve-month period ended December 31, 2023, the Fund (Investor Class shares) returned 17.52%, relative to an 18.24% return for the MSCI EAFE Index, the Fund’s benchmark index.
ILIM Commentary
Global equities rallied over the past twelve months, buoyed by hopes for a soft landing whereby while growth slows, a recession is avoided and inflation continues to fall, enabling central banks to begin cutting interest rates in 2024. The development and implementation of artificial intelligence was also supportive as it led investors to believe the technology had the potential to boost productivity and company profit margins significantly in the medium term.
There were several key factors that affected the performance of the Fund throughout the year. European ex-UK equities rose by 22.7% over the period, aided by a reversal of some severe headwinds following the outbreak of the war in Ukraine, including the collapse in natural gas prices, which eased inflation and growth pressures in the Eurozone. UK equities underperformed and energy and financials acted as headwinds, with the former hampering the fall in oil prices. Brent crude was down by 10.3% over the period, ending 2023 at $77 a barrel. Meanwhile, Japanese equities outperformed, rising by 20.8%. The market was supported by a weaker yen, relatively loose monetary policy, cheap valuations, and an improved corporate governance backdrop.
The views and opinions in this report were current as of December 31, 2023 and are subject to change at any time. They are not guarantees of performance or investment results and should not be taken as investment advice. Fund holdings are subject to change at any time. Fund returns are net of fees unless otherwise noted.
Growth of $10,000 (unaudited)
This graph compares the value of a hypothetical $10,000 investment in the Fund over the past 10 fiscal year periods or since inception (for funds lacking 10-year records) with the performance of the Fund’s benchmark index. Results include the reinvestment of all dividends and capital gains distributions. Past performance is no guarantee of future results. The graph does not reflect the deduction of taxes that a shareholder would pay on Fund distributions or the redemption of Fund shares. Performance does not include any fees or expenses of variable insurance contracts, individual retirement accounts (“IRA(s)”), qualified retirement plans or college savings programs. If such fees and expenses were included, returns would be lower.
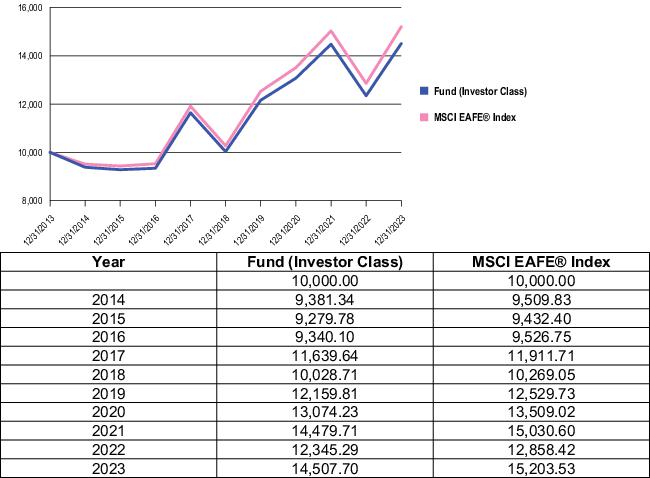
Note: Performance for the Institutional Class shares may vary due to their differing fee structure. See returns table below.
Average Annual Total Returns for the Periods Ended December 31, 2023 (unaudited)
| One Year | Five Year | Ten Year / Since Inception(a) | |
| Institutional Class | 17.96% | 8.08% | 4.46% |
| Investor Class | 17.52% | 7.66% | 3.79% |
| (a) Institutional Class inception date was May 1, 2015. |
Results include the reinvestment of all dividends and capital gains distributions. Past performance is no guarantee of future results. The table does not reflect the deduction of taxes that a shareholder would pay on Fund distributions or the redemption of Fund shares. Performance does not include any fees or expenses of variable insurance contracts, IRAs, qualified retirement plans or college savings programs. If such fees and expenses were included, returns would be lower.
Empower International Value Fund
Management Discussion
The Fund’s sub-advisers are LSV Asset Management (“LSV”) and Massachusetts Financial Services Company (“MFS”)
Fund Performance
For the twelve-month period ended December 31, 2023, the Fund (Investor Class shares) returned 18.03%, relative to an 18.95% return for the MSCI EAFE Value Index, the Fund’s benchmark index.
LSV Commentary
Value stocks modestly outperformed growth stocks in 2023 so LSV’s style was slightly in favor during the year. Relative to the benchmark index, the LSV sub-advised portion of the Fund had a deeper value style bias that was a positive contributor, while the smaller cap bias was a negative contributor for the year since smaller cap stocks lagged the overall market during 2023. The portfolio is essentially country neutral relative to the benchmark index; however, a slight overweight in Switzerland and underweight in the UK were helpful. Sector selection was also helpful due to overweight positions in industrials and consumer discretionary, two of the best performing sectors for the year. Stock selection was best in the UK, France, and Denmark while selection in Germany and the Netherlands lagged.
MFS Commentary
During the reporting period, central banks around the world had to combat the strongest inflationary pressures in four decades, fueled by the global fiscal response to the pandemic, disrupted supply chains and the dislocations to energy markets stemming from the war in Ukraine. Interest rates rose substantially, but the effects of a tighter monetary policy may not have been fully experienced yet, given that monetary policy works with long and variable lags. Strains resulting from the abrupt tightening of monetary policy began to affect some parts of the economy, most acutely among small and regional U.S. banks, which suffered from deposit flight as depositors sought higher yields on their savings. Additionally, activity in the U.S. housing sector has slowed as a result of higher mortgage rates. China’s abandonment of its zero-Covid policy ushered in a brief uptick in economic activity in early 2023, although its momentum soon stalled as the focus turned to the country’s highly indebted property development sector. In developed markets, consumer demand for services remained stronger than the demand for goods.
For the MFS sub-advised portion of the Fund, stock selection and, to a lesser extent, an underweight position in the financials sector detracted from performance relative to the benchmark index. An overweight position in the consumer staples sector also dampened relative results. An underweight position and stock selection in the consumer discretionary sector further weakened relative performance. The cash and/or cash equivalents position during the period was also a detractor from relative performance. In a period when equity markets rose, as measured by the benchmark index, holding cash hurt performance. Stock selection in the information technology sector contributed to relative performance and security selection and an underweight position in the real estate sector also supported relative returns. An overweight position in the industrials sector bolstered relative returns. During the reporting period, relative currency exposure was a contributor to relative performance.
The views and opinions in this report were current as of December 31, 2023 and are subject to change at any time. They are not guarantees of performance or investment results and should not be taken as investment advice. Fund holdings are subject to change at any time. Fund returns are net of fees unless otherwise noted.
Growth of $10,000 (unaudited)
This graph compares the value of a hypothetical $10,000 investment in the Fund over the past 10 fiscal year periods or since inception (for funds lacking 10-year records) with the performance of the Fund’s benchmark index. Results include the reinvestment of all dividends and capital gains distributions. Past performance is no guarantee of future results. The graph does not reflect the deduction of taxes that a shareholder would pay on Fund distributions or the redemption of Fund shares. Performance does not include any fees or expenses of variable insurance contracts, individual retirement accounts (“IRA(s)”), qualified retirement plans or college savings programs. If such fees and expenses were included, returns would be lower.

Note: Performance for the Institutional Class shares may vary due to their differing fee structure. See returns table below.
Average Annual Total Returns for the Periods Ended December 31, 2023 (unaudited)
| One Year | Five Year | Ten Year / Since Inception(a) | |
| Institutional Class | 18.44% | 8.64% | 6.02% |
| Investor Class | 18.03% | 8.25% | 5.89% |
| (a) Institutional Class inception date was May 1, 2015. |
Results include the reinvestment of all dividends and capital gains distributions. Past performance is no guarantee of future results. The table does not reflect the deduction of taxes that a shareholder would pay on Fund distributions or the redemption of Fund shares. Performance does not include any fees or expenses of variable insurance contracts, IRAs, qualified retirement plans or college savings programs. If such fees and expenses were included, returns would be lower.
Summary of Investments by Sector as of December 31, 2023 (unaudited)
Empower Emerging Markets Equity Fund
| Sector | Percentage of Fund Investments |
| Financial | 22.82% |
| Technology | 21.12 |
| Communications | 15.23 |
| Consumer, Non-cyclical | 11.18 |
| Consumer, Cyclical | 10.70 |
| Industrial | 7.40 |
| Energy | 4.28 |
| Basic Materials | 3.54 |
| Exchange Traded Funds | 1.68 |
| Utilities | 1.32 |
| Short Term Investments | 0.73 |
| Total | 100.00% |
Empower International Growth Fund
| Sector | Percentage of Fund Investments |
| Consumer, Non-cyclical | 28.12% |
| Industrial | 17.28 |
| Technology | 16.10 |
| Consumer, Cyclical | 14.56 |
| Financial | 10.21 |
| Basic Materials | 5.31 |
| Communications | 5.02 |
| Utilities | 0.58 |
| Short Term Investments | 2.82 |
| Total | 100.00% |
Empower International Index Fund
| Sector | Percentage of Fund Investments |
| Consumer, Non-cyclical | 23.62% |
| Financial | 20.19 |
| Industrial | 13.87 |
| Consumer, Cyclical | 13.47 |
| Technology | 6.57 |
| Basic Materials | 6.39 |
| Energy | 4.41 |
| Communications | 4.21 |
| Utilities | 3.24 |
| Diversified | 0.06 |
| Short Term Investments | 3.97 |
| Total | 100.00% |
Empower International Value Fund
| Sector | Percentage of Fund Investments |
| Financial | 20.56% |
| Consumer, Non-cyclical | 19.75 |
| Industrial | 17.47 |
| Consumer, Cyclical | 12.60 |
| Technology | 8.92 |
| Basic Materials | 7.38 |
| Energy | 6.71 |
| Communications | 2.70 |
| Utilities | 1.01 |
| Short Term Investments | 2.90 |
| Total | 100.00% |
Shareholder Expense Example (unaudited)
As a shareholder of a Fund, you incur two types of costs: (1) transaction costs, and (2) ongoing costs, including management fees and other Fund expenses. This Example is intended to help you understand your ongoing costs (in dollars) of investing in a Fund and to compare these costs with the ongoing costs of investing in other mutual funds.
Each Fund Example is based on an investment of $1,000 invested at the beginning of the period and held for the entire period (July 1, 2023 to December 31, 2023).
Actual Expenses
The first row of each Fund's table below provides information about actual account values and actual expenses. You may use the information in this row, together with the amount you invested, to estimate the expenses that you paid over the period. Simply divide your account value by $1,000 (for example, an $8,600 account value divided by $1,000 = 8.6), then multiply the result by the number in the first row under the heading entitled “Expenses Paid During Period” to estimate the expenses you paid on your account during this period.
Hypothetical Example for Comparison Purposes
The second row of each Fund's table below provides information about hypothetical account values and hypothetical expenses based on such Fund’s actual expense ratio and an assumed rate of return of 5% per year before expenses, which is not the Fund’s actual return. The hypothetical account values and expenses may not be used to estimate the actual ending account balance or expenses you paid for the period. You may use this information to compare the ongoing costs of investing in each Fund and other funds. To do so, compare this 5% hypothetical example with the 5% hypothetical examples that appear in the shareholder reports of the other funds.
Please note that the expenses shown in each Fund's table are meant to highlight your ongoing costs only and do not reflect any transactional costs. Therefore, the second row of each Fund's table is useful in comparing ongoing costs only, and will not help you determine the relative total costs of owning different funds. In addition, if these transactional costs were included, your costs would have been higher.
| Empower Emerging Markets Equity Fund | Beginning Account Value | Ending Account Value | Expenses Paid During Period* | ||
| (07/01/23) | (12/31/23) | (07/01/23 – 12/31/23) | |||
| Institutional Class | |||||
| Actual | $1,000.00 | $1,037.78 | $4.62 | ||
| Hypothetical (5% return before expenses) | $1,000.00 | $1,020.67 | $4.58 | ||
| Investor Class | |||||
| Actual | $1,000.00 | $1,035.50 | $6.41 | ||
| Hypothetical (5% return before expenses) | $1,000.00 | $1,018.90 | $6.36 |
| * Expenses are equal to the Fund's annualized expense ratio of 0.90% for the Institutional Class shares and 1.25% for the Investor Class shares, multiplied by the average account value over the period, multiplied by 184/365 days to reflect the one-half year period. Performance does not include any fees or expenses of variable insurance contracts, IRAs, qualified retirement plans or college savings programs, if applicable. If such fees or expenses were included, returns would be lower. |
| Empower International Growth Fund | Beginning Account Value | Ending Account Value | Expenses Paid During Period* | ||
| (07/01/23) | (12/31/23) | (07/01/23 – 12/31/23) | |||
| Institutional Class | |||||
| Actual | $1,000.00 | $1,026.60 | $4.34 | ||
| Hypothetical (5% return before expenses) | $1,000.00 | $1,020.92 | $4.33 | ||
| Investor Class | |||||
| Actual | $1,000.00 | $1,024.10 | $6.12 | ||
| Hypothetical (5% return before expenses) | $1,000.00 | $1,019.16 | $6.11 |
| * Expenses are equal to the Fund's annualized expense ratio of 0.85% for the Institutional Class shares and 1.20% for the Investor Class shares, multiplied by the average account value over the period, multiplied by 184/365 days to reflect the one-half year period. Performance does not include any fees or expenses of variable insurance contracts, IRAs, qualified retirement plans or college savings programs, if applicable. If such fees or expenses were included, returns would be lower. |
| Empower International Index Fund | Beginning Account Value | Ending Account Value | Expenses Paid During Period* | ||
| (07/01/23) | (12/31/23) | (07/01/23 – 12/31/23) | |||
| Institutional Class | |||||
| Actual | $1,000.00 | $1,053.90 | $1.35 | ||
| Hypothetical (5% return before expenses) | $1,000.00 | $1,023.90 | $1.33 | ||
| Investor Class | |||||
| Actual | $1,000.00 | $1,052.40 | $3.21 | ||
| Hypothetical (5% return before expenses) | $1,000.00 | $1,022.10 | $3.16 |
| * Expenses are equal to the Fund's annualized expense ratio of 0.26% for the Institutional Class shares and 0.62% for the Investor Class shares, multiplied by the average account value over the period, multiplied by 184/365 days to reflect the one-half year period. Performance does not include any fees or expenses of variable insurance contracts, IRAs, qualified retirement plans or college savings programs, if applicable. If such fees or expenses were included, returns would be lower. |
| Empower International Value Fund | Beginning Account Value | Ending Account Value | Expenses Paid During Period* | ||
| (07/01/23) | (12/31/23) | (07/01/23 – 12/31/23) | |||
| Institutional Class | |||||
| Actual | $1,000.00 | $1,063.70 | $3.69 | ||
| Hypothetical (5% return before expenses) | $1,000.00 | $1,021.60 | $3.62 | ||
| Investor Class | |||||
| Actual | $1,000.00 | $1,061.30 | $5.56 | ||
| Hypothetical (5% return before expenses) | $1,000.00 | $1,019.80 | $5.45 |
| * Expenses are equal to the Fund's annualized expense ratio of 0.71% for the Institutional Class shares and 1.07% for the Investor Class shares, multiplied by the average account value over the period, multiplied by 184/365 days to reflect the one-half year period. Performance does not include any fees or expenses of variable insurance contracts, IRAs, qualified retirement plans or college savings programs, if applicable. If such fees or expenses were included, returns would be lower. |
EMPOWER FUNDS, INC.
EMPOWER EMERGING MARKETS EQUITY FUND
Schedule of Investments
As of December 31, 2023
| Shares | Fair Value | |
| COMMON STOCK | ||
| Basic Materials — 3.54% | ||
| 86,551 | African Rainbow Minerals Ltd(a) | $ 946,300 |
| 2,787,300 | Baoshan Iron & Steel Co Ltd Class A | 2,331,199 |
| 1,475 | Ecopro Co Ltd | 734,958 |
| 120,033 | Gold Fields Ltd Sponsored ADR | 1,735,677 |
| 165,348 | Jindal Stainless Ltd | 1,136,085 |
| 31,786 | KGHM Polska Miedz SA | 991,525 |
| 4,128 | LG Chem Ltd(b) | 1,587,726 |
| 599,600 | Meihua Holdings Group Co Ltd Class A | 807,398 |
| 316,000 | Metalurgica Gerdau SA | 706,472 |
| 35,669 | Navin Fluorine International Ltd | 1,650,722 |
| 7,256 | POSCO Holdings Inc | 2,789,866 |
| 748,414 | Sappi Ltd | 1,808,386 |
| 523,300 | Satellite Chemical Co Ltd Class A(b) | 1,088,895 |
| 29,794 | Saudi Basic Industries Corp | 661,380 |
| 14,865 | Sociedad Quimica y Minera de Chile SA Sponsored ADR(a) | 895,170 |
| 190,275 | Sunresin New Materials Co Ltd Class A | 1,423,340 |
| 20,842 | Supreme Industries Ltd | 1,137,337 |
| 231,400 | Tianqi Lithium Corp Class H(a) | 1,278,521 |
| 185,000 | Vale SA | 2,940,135 |
| 530,555 | Vedanta Ltd | 1,647,189 |
| 1,392,800 | Yunnan Aluminium Co Ltd Class A | 2,400,003 |
| 30,698,284 | ||
| Communications — 15.22% | ||
| 239,000 | Accton Technology Corp | 4,062,234 |
| 2,563,100 | Alibaba Group Holding Ltd | 24,689,171 |
| 20,980 | Baidu Inc Sponsored ADR(b) | 2,498,508 |
| 57,181 | Cartrade Tech Ltd(b) | 490,123 |
| 1,197,100 | China United Network Communications Ltd Class A | 739,018 |
| 199,181 | Etihad Etisalat Co | 2,623,878 |
| 24,252 | Info Edge India Ltd | 1,496,882 |
| 247,309 | JD.com Inc Class A | 3,571,906 |
| 88,403 | Kanzhun Ltd ADR | 1,468,374 |
| 50,941 | KT Corp(b) | 1,358,270 |
| 364,100 | Kuaishou Technology(b)(c) | 2,477,418 |
| 517,810 | Meituan Class B(b) | 5,436,373 |
| 2,606 | MercadoLibre Inc(b) | 4,095,433 |
| 4,868,500 | My EG Services Bhd | 863,003 |
| 6,699 | Naspers Ltd Class N | 1,146,668 |
| 14,577 | NAVER Corp(b) | 2,522,119 |
| 3,899 | NCSoft Corp | 725,181 |
| 337,407 | Ooredoo QPSC | 1,010,090 |
| 580,630 | Orange Polska SA(a) | 1,201,747 |
| 52,108 | PDD Holdings Inc ADR(b) | 7,623,921 |
| 72,816 | Route Mobile Ltd | 1,397,970 |
| 329,526 | Saudi Telecom Co | 3,556,965 |
| 70,065 | Tata Communications Ltd | 1,489,881 |
| 38,544 | TeamLease Services Ltd(b) | 1,480,060 |
| Shares | Fair Value | |
| Communications — (continued) | ||
| 197,200 | Telefonica Brasil SA | $ 2,169,460 |
| 3,193,400 | Telkom Indonesia Persero Tbk PT | 819,258 |
| 951,400 | Tencent Holdings Ltd | 35,919,986 |
| 116,037 | Tencent Music Entertainment Group ADR(b) | 1,045,493 |
| 460,900 | TIM SA | 1,701,239 |
| 30,077 | Trip.com Group Ltd ADR(b) | 1,083,073 |
| 405,012 | Turkcell Iletisim Hizmetleri AS | 771,026 |
| 115,949 | Vipshop Holdings Ltd ADR(b) | 2,059,254 |
| 1,750,400 | Xiaomi Corp Class B(b)(c) | 3,505,080 |
| 3,348,942 | Zomato Ltd(b) | 4,970,764 |
| 132,069,826 | ||
| Consumer, Cyclical — 10.69% | ||
| 490,800 | Alsea SAB de CV(b) | 1,858,456 |
| 854,334 | Americana Restaurants International PLC | 728,083 |
| 248,600 | ANTA Sports Products Ltd | 2,416,221 |
| 3,018,000 | Astra International Tbk PT | 1,106,770 |
| 7,066 | BGF retail Co Ltd | 717,642 |
| 294,000 | BYD Co Ltd Class H | 8,109,883 |
| 41,699 | Ceat Ltd | 1,215,439 |
| 281,000 | China Motor Corp | 1,033,171 |
| 148,807 | Clicks Group Ltd | 2,649,607 |
| 135,720 | Contemporary Amperex Technology Co Ltd Class A | 3,124,351 |
| 12,534 | Craftsman Automation Ltd | 814,339 |
| 370,574 | Crompton Greaves Consumer Electricals Ltd | 1,383,839 |
| 1,697,000 | Eva Airways Corp | 1,736,633 |
| 127,080 | Feng TAY Enterprise Co Ltd | 723,916 |
| 344,000 | Fuyao Glass Industry Group Co Ltd Class H | 1,675,094 |
| 882,000 | Haidilao International Holding Ltd(c) | 1,645,355 |
| 457,400 | Haier Smart Home Co Ltd Class H | 1,291,987 |
| 538,500 | Hangzhou Robam Appliances Co Ltd Class A | 1,654,829 |
| 58,910 | Jinan Acetate Chemical Co Ltd | 1,528,609 |
| 344,620 | Jollibee Foods Corp | 1,563,959 |
| 84,525 | JUMBO SA | 2,343,977 |
| 20,283 | JYP Entertainment Corp | 1,588,464 |
| 164,960 | Kia Corp | 12,756,906 |
| 57,065 | KPIT Technologies Ltd | 1,036,988 |
| 53,620 | LG Electronics Inc(b) | 4,216,568 |
| 79,708 | Li Auto Inc ADR(b) | 2,983,470 |
| 314,000 | Lite-On Technology Corp | 1,192,315 |
| 24,265,400 | Map Aktif Adiperkasa PT | 1,292,311 |
| 67,070 | MINISO Group Holding Ltd ADR | 1,368,228 |
| 141,000 | Nien Made Enterprise Co Ltd | 1,620,171 |
| 40,640,000 | Nusantara Sejahtera Raya Tbk PT(b)(c) | 712,661 |
| 676,200 | Samsonite International SA(b)(c) | 2,230,934 |
| 8,182 | Samsung SDI Co Ltd(b) | 2,978,992 |
| 668,000 | Sendas Distribuidora S/A | 1,860,598 |
See Notes to Financial Statements.
Annual Report - December 31, 2023
EMPOWER FUNDS, INC.
EMPOWER EMERGING MARKETS EQUITY FUND
Schedule of Investments
As of December 31, 2023
| Shares | Fair Value | |
| Consumer, Cyclical — (continued) | ||
| 232,100 | Shenzhou International Group Holdings Ltd | $ 2,381,081 |
| 250,876 | Sona Blw Precision Forgings Ltd(c) | 1,941,642 |
| 328,900 | Suofeiya Home Collection Co Ltd Class A | 740,320 |
| 256,188 | Tata Motors Ltd | 2,400,126 |
| 547,000 | Tong Yang Industry Co Ltd | 1,354,026 |
| 101,796 | Turk Hava Yollari AO(b) | 788,682 |
| 400,800 | Wal-Mart de Mexico SAB de CV | 1,685,007 |
| 1,562,000 | Weichai Power Co Ltd Class H | 2,609,550 |
| 109,170 | Wowprime Corp | 886,863 |
| 37,639 | Yum China Holdings Inc | 1,597,023 |
| 77,300 | Zhongji Innolight Co Ltd Class A | 1,227,131 |
| 92,772,217 | ||
| Consumer, Non-Cyclical — 11.18% | ||
| 82,584 | Adani Ports & Special Economic Zone Ltd | 1,015,249 |
| 49,692 | Almarai Co JSC | 744,717 |
| 31,701 | Apollo Hospitals Enterprise Ltd | 2,171,654 |
| 645,900 | Arca Continental SAB de CV | 7,062,641 |
| 1,290,500 | Bangkok Dusit Medical Services PCL NVDR | 1,048,024 |
| 30,395 | Britannia Industries Ltd | 1,949,358 |
| 342,800 | Bumrungrad Hospital PCL | 2,239,637 |
| 479,000 | China Mengniu Dairy Co Ltd | 1,290,384 |
| 120,000 | China Resources Beer Holdings Co Ltd | 526,553 |
| 87,287 | Chongqing Brewery Co Ltd Class A | 817,648 |
| 337,711 | Cipla Ltd | 5,055,859 |
| 3,447 | CJ CheilJedang Corp | 865,146 |
| 55,677 | Coca-Cola Femsa SAB de CV Sponsored ADR | 5,269,270 |
| 3,492,000 | CSPC Pharmaceutical Group Ltd | 3,250,074 |
| 20,547 | Dino Polska SA(a)(b)(c) | 2,405,754 |
| 113,718 | Dr Reddy's Laboratories Ltd | 7,925,916 |
| 345,300 | Fleury SA | 1,282,364 |
| 401,360 | Hualan Biological Engineering Inc Class A | 1,252,142 |
| 45,482 | Humansoft Holding Co KSC | 503,152 |
| 612,320 | International Container Terminal Services Inc | 2,729,295 |
| 1,545,800 | Kimberly-Clark de Mexico SAB de CV Class A(a) | 3,463,735 |
| 32,500 | Kweichow Moutai Co Ltd Class A | 7,911,220 |
| 12,057,200 | Monde Nissin Corp(c) | 1,824,638 |
| 26,759 | Nahdi Medical Co | 977,040 |
| 109,539 | National Marine Dredging Co(b) | 888,779 |
| 29,253 | National Medical Care Co | 1,359,371 |
| 5,213 | Nestle India Ltd | 1,664,356 |
| 28,823 | New Oriental Education & Technology Group Inc Sponsored ADR(a)(b) | 2,112,150 |
| Shares | Fair Value | |
| Consumer, Non-Cyclical — (continued) | ||
| 142,000 | Nongfu Spring Co Ltd Class H(c) | $ 821,685 |
| 29,954 | Orion Corp | 2,688,076 |
| 49,507 | Richter Gedeon Nyrt | 1,248,687 |
| 3,087 | Samsung Biologics Co Ltd(b)(c) | 1,816,021 |
| 10,848 | Sarantis SA | 100,356 |
| 76,250 | Shenzhen Mindray Bio-Medical Electronics Co Ltd Class A | 3,126,619 |
| 5,445,100 | Sumber Alfaria Trijaya Tbk PT(b) | 1,036,190 |
| 501,620 | Sun Pharmaceutical Industries Ltd | 7,588,439 |
| 336,088 | Tata Consumer Products Ltd | 4,387,195 |
| 51,493 | Torrent Pharmaceuticals Ltd | 1,425,881 |
| 194,100 | WuXi AppTec Co Ltd Class H(a)(c) | 1,977,506 |
| 715,000 | Yihai International Holding Ltd | 1,136,222 |
| 96,959,003 | ||
| Energy — 4.28% | ||
| 366,700 | Huaibei Mining Holdings Co Ltd Class A | 860,199 |
| 1,738,000 | Kunlun Energy Co Ltd | 1,568,485 |
| 117,590 | MOL Hungarian Oil & Gas PLC | 957,903 |
| 276,699 | ORLEN SA | 4,607,043 |
| 4,648,000 | PetroChina Co Ltd Class H(b) | 3,071,353 |
| 433,941 | Petroleo Brasileiro SA Sponsored ADR | 6,930,038 |
| 196,600 | PRIO SA | 1,863,766 |
| 1,333,400 | PTT Exploration & Production PCL | 5,696,673 |
| 107,861 | Reliance Industries Ltd(b) | 3,347,784 |
| 691,860 | Saudi Arabian Oil Co(c) | 6,091,242 |
| 174,500 | Sungrow Power Supply Co Ltd Class A | 2,154,514 |
| 37,149,000 | ||
| Financial — 22.81% | ||
| 78,081 | Absa Group Ltd | 696,847 |
| 982,750 | Abu Dhabi Commercial Bank PJSC | 2,456,373 |
| 318,972 | Abu Dhabi Islamic Bank PJSC | 878,905 |
| 748,651 | Akbank TAS | 925,900 |
| 136,224 | Alinma Bank | 1,406,683 |
| 27,126 | Angel One Ltd | 1,136,390 |
| 414,612 | Axis Bank Ltd | 5,487,130 |
| 25,477 | Bajaj Finance Ltd | 2,241,756 |
| 357,600 | Banco do Brasil SA(b) | 4,077,624 |
| 35,773 | Bancolombia SA Sponsored ADR | 1,100,735 |
| 323,900 | Bangkok Bank PCL | 1,485,105 |
| 4,182,400 | Bank BTPN Syariah Tbk PT | 459,044 |
| 9,242,300 | Bank Central Asia Tbk PT | 5,644,294 |
| 16,381,600 | Bank Mandiri Persero Tbk PT | 6,435,336 |
| 712,172 | Bank of Baroda | 1,976,006 |
| 7,677,000 | Bank of China Ltd Class H | 2,917,120 |
| 1,364,000 | Bank of Communications Co Ltd Class H(b) | 851,444 |
See Notes to Financial Statements.
Annual Report - December 31, 2023
EMPOWER FUNDS, INC.
EMPOWER EMERGING MARKETS EQUITY FUND
Schedule of Investments
As of December 31, 2023
| Shares | Fair Value | |
| Financial — (continued) | ||
| 13,349,500 | Bank Rakyat Indonesia Persero Tbk PT(b) | $ 4,961,602 |
| 115,100 | BB Seguridade Participacoes SA | 797,331 |
| 1,140,380 | BDO Unibank Inc | 2,686,642 |
| 17,424,500 | BFI Finance Indonesia Tbk PT | 1,363,682 |
| 679,600 | Caixa Seguridade Participacoes S/A | 1,804,768 |
| 78,748 | Can Fin Homes Ltd | 735,317 |
| 383,040 | Chailease Holding Co Ltd | 2,406,926 |
| 6,137,000 | China CITIC Bank Corp Ltd Class H | 2,894,376 |
| 10,248,000 | China Construction Bank Corp Class H | 6,096,029 |
| 931,200 | China International Capital Corp Ltd Class H(c) | 1,368,184 |
| 1,561,000 | China Merchants Bank Co Ltd Class H | 5,429,983 |
| 390,200 | China Pacific Insurance Group Co Ltd Class H | 789,337 |
| 202,600 | China Resources Mixc Lifestyle Services Ltd(a)(c) | 722,607 |
| 3,349,000 | CIMB Group Holdings Bhd(b) | 4,263,894 |
| 79,277 | Co for Cooperative Insurance | 2,756,726 |
| 555,303 | Commercial International Bank Egypt SAE GDR | 699,682 |
| 67,787 | Computer Age Management Services Ltd | 2,158,149 |
| 10,762 | Credicorp Ltd | 1,613,547 |
| 31,843 | DB Insurance Co Ltd | 2,062,254 |
| 1,012,720 | Emaar Properties PJSC | 2,183,951 |
| 287,687 | Emirates NBD Bank PJSC | 1,355,111 |
| 612,307 | Eurobank Ergasias Services & Holdings SA Class A(b) | 1,087,900 |
| 1,005,700 | Fibra Uno Administracion SA de CV REIT(a) | 1,806,363 |
| 371,163 | FirstRand Ltd | 1,489,101 |
| 114,351 | Five-Star Business Finance Ltd(b) | 1,009,516 |
| 107,541 | Godrej Properties Ltd(b) | 2,599,486 |
| 133,944 | HDFC Bank Ltd | 2,742,640 |
| 39,300 | Hyundai Marine & Fire Insurance Co Ltd | 942,921 |
| 966,821 | ICICI Bank Ltd | 11,553,316 |
| 1,512,156 | IDFC First Bank Ltd(b) | 1,613,678 |
| 391,721 | Indiabulls Housing Finance Ltd | 1,019,053 |
| 1,838,000 | Industrial & Commercial Bank of China Ltd Class H | 895,737 |
| 124,455 | Industrial Bank of Korea | 1,143,929 |
| 370,600 | Itau Unibanco Holding SA | 2,591,667 |
| 625,917 | Jio Financial Services Ltd(b) | 1,749,920 |
| 163,310 | JSE Ltd | 825,277 |
| 320,631 | Karnataka Bank Ltd | 901,171 |
| 519,535 | Karur Vysya Bank Ltd | 1,053,806 |
| 140,192 | KB Financial Group Inc | 5,849,064 |
| 204,948 | KE Holdings Inc ADR | 3,322,207 |
| 4,706,100 | Krung Thai Bank PCL NVDR | 2,534,072 |
| 195,292 | LIC Housing Finance Ltd | 1,257,007 |
| 633,794 | Manappuram Finance Ltd | 1,308,754 |
| 67,768 | Meritz Financial Group Inc | 3,100,485 |
| Shares | Fair Value | |
| Financial — (continued) | ||
| 988,580 | Metropolitan Bank & Trust Co | $ 915,686 |
| 736,311 | National Bank of Greece SA(b) | 5,115,690 |
| 123,926 | NEPI Rockcastle NV | 856,185 |
| 131,158 | Nova Ljubljanska Banka dd GDR | 2,446,978 |
| 195,920 | NU Holdings Ltd Class A(b) | 1,632,014 |
| 426,600 | Odontoprev SA | 1,020,482 |
| 2,503,758 | Old Mutual Ltd | 1,787,568 |
| 32,208,300 | Pakuwon Jati Tbk PT | 949,389 |
| 6,491,000 | People's Insurance Co Group of China Ltd Class H | 1,996,546 |
| 3,022,000 | PICC Property & Casualty Co Ltd Class H | 3,596,232 |
| 1,303,500 | Ping An Insurance Group Co of China Ltd Class H | 5,901,335 |
| 292,642 | Piraeus Financial Holdings SA(b) | 1,034,118 |
| 81,664 | Piramal Enterprises Ltd | 913,532 |
| 467,331 | Prologis Property Mexico SA de CV REIT(a) | 2,215,426 |
| 33,802 | Reinet Investments SCA | 861,491 |
| 150,525 | Remgro Ltd | 1,337,013 |
| 5,173 | Samsung Fire & Marine Insurance Co Ltd | 1,053,928 |
| 144,948 | Saudi National Bank | 1,494,879 |
| 135,283 | SBI Life Insurance Co Ltd(c) | 2,328,189 |
| 53,173 | Shriram Transport Finance Co Ltd(b) | 1,311,658 |
| 68,519 | Standard Bank Group Ltd | 779,489 |
| 907,346 | State Bank of India | 6,994,423 |
| 20,997,000 | TMBThanachart Bank PCL | 1,026,288 |
| 530,568 | Turkiye Garanti Bankasi AS | 1,050,558 |
| 2,087,600 | Turkiye Is Bankasi AS Class C | 1,649,490 |
| 1,255,402 | Union Bank of India Ltd | 1,794,885 |
| 414,168 | Woori Financial Group Inc | 4,168,611 |
| 197,955,943 | ||
| Industrial — 7.40% | ||
| 22,628 | Amber Enterprises India Ltd(b) | 851,847 |
| 391,300 | Beijing New Building Materials PLC Class A | 1,289,261 |
| 33,958 | BEML Ltd | 1,153,531 |
| 213,000 | BYD Electronic International Co Ltd | 998,702 |
| 2,601,400 | Cemex SAB de CV(b) | 2,023,703 |
| 11,564,000 | China Tower Corp Ltd Class H(c) | 1,215,465 |
| 114,000 | Chroma ATE Inc | 789,281 |
| 11,234 | Danaos Corp | 831,990 |
| 1,180,000 | Delta Electronics Inc | 12,034,149 |
| 334,100 | Delta Electronics Thailand PCL | 858,812 |
| 50,243 | Doosan Bobcat Inc | 1,957,132 |
| 134,699 | GCC SAB de CV | 1,593,844 |
| 22,837 | Hanwha Aerospace Co Ltd | 2,203,097 |
| 130,697 | Hindustan Aeronautics Ltd | 4,402,513 |
| 68,333 | HMM Co Ltd | 1,036,698 |
| 78,120 | Hyundai Rotem Co Ltd(b) | 1,607,859 |
| 52,000 | Jentech Precision Industrial Co Ltd | 1,301,230 |
See Notes to Financial Statements.
Annual Report - December 31, 2023
EMPOWER FUNDS, INC.
EMPOWER EMERGING MARKETS EQUITY FUND
Schedule of Investments
As of December 31, 2023
| Shares | Fair Value | |
| Industrial — (continued) | ||
| 159,400 | Klabin SA | $ 729,140 |
| 44,795 | Larsen & Toubro Ltd | 1,896,973 |
| 54,000 | Lotes Co Ltd | 1,877,766 |
| 300,000 | Micro-Star International Co Ltd | 1,990,610 |
| 873,700 | Nanofilm Technologies International Ltd | 604,355 |
| 86,424 | Riyadh Cables Group Co | 2,125,648 |
| 292,300 | Rumo SA | 1,380,988 |
| 9,916 | Samsung C&T Corp | 994,658 |
| 1,375,900 | Semen Indonesia Persero Tbk PT | 571,832 |
| 119,600 | SF Holding Co Ltd Class A | 682,075 |
| 151,000 | Silergy Corp | 2,450,868 |
| 179,900 | Sunny Optical Technology Group Co Ltd | 1,635,451 |
| 450,000 | Sunonwealth Electric Machine Industry Co Ltd | 1,573,187 |
| 1,424,200 | Tian Di Science & Technology Co Ltd | 1,092,495 |
| 482,000 | Unimicron Technology Corp | 2,753,905 |
| 22,000 | Voltronic Power Technology Corp | 1,223,482 |
| 280,780 | ZBOM Home Collection Co Ltd Class A | 664,293 |
| 495,387 | Zhejiang Sanhua Intelligent Controls Co Ltd Class A | 2,053,309 |
| 81,579 | ZTO Express Cayman Inc ADR | 1,736,001 |
| 64,186,150 | ||
| Technology — 21.12% | ||
| 70,893 | Advantech Co Ltd | 857,905 |
| 15,177 | Arabian Internet & Communications Services Co | 1,400,318 |
| 97,000 | Asia Vital Components Co Ltd | 1,059,688 |
| 21,000 | ASMedia Technology Inc | 1,237,968 |
| 121,920 | Birlasoft Ltd | 1,055,150 |
| 46,594 | Coforge Ltd | 3,509,452 |
| 27,314 | Dongjin Semichem Co Ltd(b) | 815,853 |
| 207,000 | Elan Microelectronics Corp | 1,094,492 |
| 9,004 | Elm Co | 1,955,982 |
| 8,231 | Eo Technics Co Ltd | 970,688 |
| 16,000 | Global Unichip Corp | 904,388 |
| 227,351 | HCL Technologies Ltd | 4,001,096 |
| 182,926 | Infosys Ltd | 3,386,049 |
| 127,742 | Infosys Ltd Sponsored ADR | 2,347,898 |
| 183,000 | International Games System Co Ltd | 4,311,631 |
| 255,000 | ITE Technology Inc | 1,248,004 |
| 545,000 | King Yuan Electronics Co Ltd | 1,504,284 |
| 527,200 | Kingnet Network Co Ltd Class A | 830,324 |
| 442,000 | MediaTek Inc | 14,594,797 |
| 359,600 | NetEase Inc | 6,487,757 |
| 65,602 | Netweb Technologies India Ltd(b) | 934,862 |
| 159,000 | Novatek Microelectronics Corp | 2,674,262 |
| 155,000 | Quanta Computer Inc | 1,128,466 |
| 114,000 | Realtek Semiconductor Corp | 1,748,182 |
| Shares | Fair Value | |
| Technology — (continued) | ||
| 751,515 | Samsung Electronics Co Ltd | $ 45,614,598 |
| 19,609 | SK Hynix Inc(b) | 2,140,087 |
| 127,034 | Sonata Software Ltd | 1,133,218 |
| 3,275,000 | Taiwan Semiconductor Manufacturing Co Ltd | 62,786,831 |
| 65,882 | Tata Consultancy Services Ltd | 3,000,523 |
| 39,872 | TDCX Inc ADR(b) | 193,379 |
| 263,100 | TOTVS SA | 1,824,736 |
| 2,955,000 | United Microelectronics Corp | 5,034,811 |
| 94,535 | Will Semiconductor Co Ltd Shanghai Class A | 1,422,294 |
| 183,209,973 | ||
| Utilities — 1.31% | ||
| 259,000 | Beijing Enterprises Holdings Ltd(b) | 900,699 |
| 2,449,000 | China Longyuan Power Group Corp Ltd Class H | 1,859,733 |
| 446,000 | China Resources Power Holdings Co Ltd | 893,719 |
| 427,798 | China Yangtze Power Co Ltd Class A | 1,407,985 |
| 568,300 | Cia De Sanena Do Parana | 3,414,994 |
| 16,663,638 | Enel Chile SA | 1,079,347 |
| 88,000 | Energisa S/A | 975,181 |
| 365,491 | ENN Natural Gas Co Ltd Class A | 866,727 |
| 11,398,385 | ||
| TOTAL COMMON STOCK — 97.55% (Cost $802,682,261) | $846,398,781 | |
| EXCHANGE TRADED FUNDS | ||
| 454,450 | iShares ESG Aware MSCI EM ETF | 14,569,667 |
| TOTAL EXCHANGE TRADED FUNDS — 1.68% (Cost $14,030,351) | $ 14,569,667 | |
| Principal Amount | ||
| SHORT TERM INVESTMENTS | ||
| Repurchase Agreements — 0.73% | ||
| $ 1,589,876 | Undivided interest of 1.32% in a repurchase agreement (principal amount/value $120,466,826 with a maturity value of $120,538,303) with RBC Capital Markets Corp, 5.34%, dated 12/31/23 to be repurchased at $1,589,876 on 1/2/24 collateralized by U.S. Treasury securities and various U.S. Government Agency securities, 0.00% - 7.50%, 1/15/24 - 12/1/53, with a value of $122,876,165.(d) | 1,589,876 |
See Notes to Financial Statements.
Annual Report - December 31, 2023
EMPOWER FUNDS, INC.
EMPOWER EMERGING MARKETS EQUITY FUND
Schedule of Investments
As of December 31, 2023
| Principal Amount | Fair Value | |
| Repurchase Agreements — (continued) | ||
| $ 1,589,876 | Undivided interest of 1.34% in a repurchase agreement (principal amount/value $118,664,201 with a maturity value of $118,734,608) with Citigroup Global Markets Inc, 5.34%, dated 12/31/23 to be repurchased at $1,589,876 on 1/2/24 collateralized by Government National Mortgage Association securities, 2.00% - 7.50%, 7/20/37 - 12/20/53, with a value of $121,037,485.(d) | $ 1,589,876 |
| 1,589,875 | Undivided interest of 1.70% in a repurchase agreement (principal amount/value $93,637,100 with a maturity value of $93,692,762) with Bank of America Securities Inc, 5.35%, dated 12/31/23 to be repurchased at $1,589,875 on 1/2/24 collateralized by various U.S. Government Agency securities, 0.00% - 7.00%, 11/1/28 - 12/20/63, with a value of $95,509,842.(d) | 1,589,875 |
| 2 | Undivided interest of 19.99% in a repurchase agreement (principal amount/value $10 with a maturity value of $10) with Mizuho Securities (USA) LLC, 5.33%, dated 12/31/23 to be repurchased at $2 on 1/2/24 collateralized by U.S. Treasury securities, 0.38% - 4.75%, 12/31/23 - 2/15/33, with a value of $10.(d) | 2 |
| Principal Amount | Fair Value | |
| Repurchase Agreements — (continued) | ||
| $ 1,589,876 | Undivided interest of 7.75% in a repurchase agreement (principal amount/value $20,566,451 with a maturity value of $20,578,654) with HSBC Securities (USA) Inc, 5.34%, dated 12/31/23 to be repurchased at $1,589,876 on 1/2/24 collateralized by various U.S. Government Agency securities, 2.00% - 7.00%, 12/1/29 - 12/1/53, with a value of $20,977,780.(d) | $ 1,589,876 |
| TOTAL SHORT TERM INVESTMENTS — 0.73% (Cost $6,359,505) | $ 6,359,505 | |
| TOTAL INVESTMENTS — 99.96% (Cost $823,072,117) | $867,327,953 | |
| OTHER ASSETS & LIABILITIES, NET — 0.04% | $ 377,409 | |
| TOTAL NET ASSETS — 100.00% | $867,705,362 | |
| (a) | All or a portion of the security is on loan at December 31, 2023. |
| (b) | Non-income producing security. |
| (c) | Represents securities sold under Rule 144A, which are exempt from registration under the Securities Act of 1933, as amended. |
| (d) | Collateral received for securities on loan. |
| ADR | American Depositary Receipt |
| ETF | Exchange Traded Fund |
| GDR | Global Depositary Receipt |
| NVDR | Non-Voting Depository Receipt |
| REIT | Real Estate Investment Trust |
See Notes to Financial Statements.
Annual Report - December 31, 2023
EMPOWER FUNDS, INC.
EMPOWER EMERGING MARKETS EQUITY FUND
Schedule of Investments
As of December 31, 2023
Summary of Investments by Country as of December 31, 2023.
| Country | Fair Value | Percentage of Fund Investments | |
| China | $221,431,733 | 25.53% | |
| India | 143,779,973 | 16.58 | |
| Taiwan | 138,745,574 | 16.00 | |
| South Korea | 113,007,797 | 13.03 | |
| Brazil | 39,702,995 | 4.58 | |
| Saudi Arabia | 27,154,829 | 3.13 | |
| Mexico | 26,978,446 | 3.11 | |
| Indonesia | 25,352,370 | 2.92 | |
| United States | 23,160,106 | 2.67 | |
| South Africa | 15,201,932 | 1.75 | |
| Thailand | 14,888,611 | 1.72 | |
| Greece | 10,514,031 | 1.21 | |
| Philippines | 9,720,220 | 1.12 | |
| Poland | 9,206,068 | 1.06 | |
| United Arab Emirates | 8,491,202 | 0.98 | |
| Ireland | 7,623,921 | 0.88 | |
| Turkey | 5,185,656 | 0.60 | |
| Malaysia | 5,126,898 | 0.59 | |
| Uruguay | 4,095,433 | 0.47 | |
| Hong Kong | 3,889,457 | 0.45 | |
| Slovenia | 2,446,978 | 0.28 | |
| Hungary | 2,206,589 | 0.25 | |
| Chile | 1,974,517 | 0.23 | |
| Peru | 1,613,547 | 0.18 | |
| Colombia | 1,100,735 | 0.13 | |
| Qatar | 1,010,090 | 0.12 | |
| Luxembourg | 861,491 | 0.10 | |
| Netherlands | 856,185 | 0.10 | |
| Singapore | 797,735 | 0.09 | |
| Egypt | 699,682 | 0.08 | |
| Kuwait | 503,152 | 0.06 | |
| Total | $867,327,953 | 100.00% |
See Notes to Financial Statements.
Annual Report - December 31, 2023
EMPOWER FUNDS, INC.
EMPOWER INTERNATIONAL GROWTH FUND
Schedule of Investments
As of December 31, 2023
| Shares | Fair Value | |
| COMMON STOCK | ||
| Basic Materials — 5.41% | ||
| 43,109 | Air Liquide SA | $ 8,393,108 |
| 45,000 | DSM-Firmenich AG | 4,576,195 |
| 12,660 | Linde PLC | 5,199,589 |
| 187,700 | Shin-Etsu Chemical Co Ltd | 7,850,208 |
| 26,019,100 | ||
| Communications — 5.11% | ||
| 14,359 | Delivery Hero SE(a)(b) | 395,201 |
| 3,998 | MercadoLibre Inc(b) | 6,283,017 |
| 32,000 | Nice Ltd Sponsored ADR(b) | 6,384,320 |
| 60,000 | Shopify Inc Class A(b) | 4,674,000 |
| 88,500 | Tencent Holdings Ltd | 3,341,306 |
| 24,545 | Wolters Kluwer NV | 3,491,998 |
| 24,569,842 | ||
| Consumer, Cyclical — 14.85% | ||
| 42,642 | Cie Financiere Richemont SA | 5,889,889 |
| 90,000 | CTS Eventim AG & Co KGaA | 6,224,862 |
| 19,664 | Evolution AB(a) | 2,342,188 |
| 17,961 | Ferguson PLC | 3,438,885 |
| 3,665 | Ferrari NV | 1,237,326 |
| 117,835 | Industria de Diseno Textil SA | 5,141,608 |
| 78,481 | InterContinental Hotels Group PLC | 7,075,090 |
| 11,424 | LVMH Moet Hennessy Louis Vuitton SE | 9,282,405 |
| 8,170 | Next PLC | 844,364 |
| 90,000 | Puma SE | 5,006,648 |
| 500,000 | RS Group PLC | 5,217,850 |
| 12,362 | Ryanair Holdings PLC Sponsored ADR(b) | 1,648,596 |
| 22,200 | Shimano Inc(c) | 3,419,781 |
| 84,600 | Sony Group Corp | 8,005,945 |
| 113,594 | Volvo AB Class B | 2,955,716 |
| 58,196 | Yum China Holdings Inc | 2,469,256 |
| 48,137 | Zalando SE(a)(b) | 1,139,617 |
| 71,340,026 | ||
| Consumer, Non-Cyclical — 28.67% | ||
| 521 | Adyen NV(a)(b) | 672,579 |
| 90,000 | Alcon Inc | 7,041,242 |
| 102,000 | Amadeus IT Group SA | 7,325,784 |
| 7,847 | Argenx SE(b) | 2,984,747 |
| 250,000 | Asahi Intecc Co Ltd | 5,069,720 |
| 62,098 | AstraZeneca PLC | 8,374,803 |
| 10,218 | Beiersdorf AG | 1,530,191 |
| 23,000 | Cochlear Ltd | 4,679,252 |
| 32,000 | CSL Ltd | 6,238,368 |
| 250,000 | Daiichi Sankyo Co Ltd | 6,844,182 |
| 39,165 | Diageo PLC | 1,421,250 |
| 350,000 | Evotec SE(b)(c) | 8,208,514 |
| 150,000 | Experian PLC | 6,117,383 |
| 28,212 | Genmab A/S(b) | 8,995,482 |
| 5,737 | L'Oreal SA | 2,859,893 |
| 121,700 | Nestle SA | 14,107,450 |
| 125,222 | Novo Nordisk A/S Class B | 12,976,904 |
| Shares | Fair Value | |
| Consumer, Non-Cyclical — (continued) | ||
| 202,159 | Oxford Nanopore Technologies PLC(b) | $ 535,978 |
| 156,700 | Recruit Holdings Co Ltd | 6,551,805 |
| 195,308 | RELX PLC | 7,746,114 |
| 28,171 | Sanofi SA | 2,799,424 |
| 13,181 | Straumann Holding AG | 2,130,088 |
| 15,000,000 | Sumber Alfaria Trijaya Tbk PT(b) | 2,854,465 |
| 15,000 | Tecan Group AG | 6,136,610 |
| 109,000 | Terumo Corp | 3,564,410 |
| 137,766,638 | ||
| Financial — 10.41% | ||
| 205,429 | 3i Group PLC | 6,320,387 |
| 150,307 | Allfunds Group PLC | 1,068,771 |
| 181,000 | DBS Group Holdings Ltd | 4,577,279 |
| 14,547 | Deutsche Boerse AG | 2,995,728 |
| 146,604 | Goodman Group REIT | 2,524,059 |
| 46,355 | HDFC Bank Ltd ADR | 3,110,884 |
| 300,000 | Intermediate Capital Group PLC | 6,407,123 |
| 40,253 | KBC Group NV | 2,612,387 |
| 46,817 | London Stock Exchange Group PLC | 5,533,110 |
| 56,000 | Macquarie Group Ltd | 7,010,176 |
| 257,387 | QBE Insurance Group Ltd | 2,607,996 |
| 100,100 | Rakuten Bank Ltd(b) | 1,497,099 |
| 150,500 | Tokio Marine Holdings Inc | 3,747,600 |
| 50,012,599 | ||
| Industrial — 17.62% | ||
| 38,325 | Airbus SE | 5,920,755 |
| 428,416 | Atlas Copco AB Class A | 7,382,085 |
| 29,600 | Daikin Industries Ltd | 4,801,712 |
| 55,793 | Deutsche Post AG | 2,761,528 |
| 50,000 | DSV A/S | 8,785,339 |
| 49,000 | Hoya Corp | 6,102,423 |
| 1,800 | Interroll Holding AG | 5,720,068 |
| 16,100 | Keyence Corp | 7,073,640 |
| 39,000 | MTU Aero Engines AG | 8,402,366 |
| 44,383 | Safran SA | 7,825,169 |
| 6,154 | Schneider Electric SE | 1,238,835 |
| 250,000 | SIG Group AG | 5,757,755 |
| 22,500 | Sika AG | 7,336,714 |
| 44,146 | Vinci SA | 5,555,554 |
| 84,663,943 | ||
| Technology — 16.42% | ||
| 40,700 | Advantest Corp | 1,371,409 |
| 28,121 | ASML Holding NV | 21,228,144 |
| 25,000 | CyberArk Software Ltd(b) | 5,476,250 |
| 52,516 | Dassault Systemes SE | 2,570,512 |
| 30,000 | Disco Corp | 7,409,005 |
| 133,726 | Infineon Technologies AG | 5,584,736 |
| 395,000 | Keywords Studios PLC | 8,362,905 |
| 75,000 | Kinaxis Inc(b) | 8,417,230 |
| 29,000 | Monday.com Ltd(b) | 5,446,490 |
| 68,200 | Otsuka Corp(c) | 2,806,769 |
See Notes to Financial Statements.
Annual Report - December 31, 2023
EMPOWER FUNDS, INC.
EMPOWER INTERNATIONAL GROWTH FUND
Schedule of Investments
As of December 31, 2023
| Shares | Fair Value | |
| Technology — (continued) | ||
| 94,941 | Sage Group PLC | $ 1,416,750 |
| 25,026 | Samsung Electronics Co Ltd | 1,519,000 |
| 17,210 | SAP SE | 2,648,985 |
| 44,579 | Taiwan Semiconductor Manufacturing Co Ltd Sponsored ADR | 4,636,216 |
| 78,894,401 | ||
| Utilities — 0.59% | ||
| 120,787 | SSE PLC | 2,850,526 |
| TOTAL COMMON STOCK — 99.08% (Cost $409,735,294) | $476,117,075 | |
| Principal Amount | ||
| SHORT TERM INVESTMENTS | ||
| Repurchase Agreements — 2.87% | ||
| $3,448,550 | Undivided interest of 2.87% in a repurchase agreement (principal amount/value $120,466,826 with a maturity value of $120,538,303) with RBC Capital Markets Corp, 5.34%, dated 12/31/23 to be repurchased at $3,448,550 on 1/2/24 collateralized by U.S. Treasury securities and various U.S. Government Agency securities, 0.00% - 7.50%, 1/15/24 - 12/1/53, with a value of $122,876,165.(d) | 3,448,550 |
| 3,448,550 | Undivided interest of 2.91% in a repurchase agreement (principal amount/value $118,664,201 with a maturity value of $118,734,608) with Citigroup Global Markets Inc, 5.34%, dated 12/31/23 to be repurchased at $3,448,550 on 1/2/24 collateralized by Government National Mortgage Association securities, 2.00% - 7.50%, 7/20/37 - 12/20/53, with a value of $121,037,485.(d) | 3,448,550 |
| Principal Amount | Fair Value | |
| Repurchase Agreements — (continued) | ||
| $ 3,448,550 | Undivided interest of 3.69% in a repurchase agreement (principal amount/value $93,637,100 with a maturity value of $93,692,762) with Bank of America Securities Inc, 5.35%, dated 12/31/23 to be repurchased at $3,448,550 on 1/2/24 collateralized by various U.S. Government Agency securities, 0.00% - 7.00%, 11/1/28 - 12/20/63, with a value of $95,509,842.(d) | $ 3,448,550 |
| 3,448,550 | Undivided interest of 4.12% in a repurchase agreement (principal amount/value $83,874,265 with a maturity value of $83,924,030) with Bank of Montreal, 5.34%, dated 12/31/23 to be repurchased at $3,448,550 on 1/2/24 collateralized by various U.S. Government Agency securities, 4.50% - 6.50%, 12/1/38 - 12/1/53, with a value of $85,551,750.(d) | 3,448,550 |
| TOTAL SHORT TERM INVESTMENTS — 2.87% (Cost $13,794,200) | $ 13,794,200 | |
| TOTAL INVESTMENTS — 101.95% (Cost $423,529,494) | $489,911,275 | |
| OTHER ASSETS & LIABILITIES, NET — (1.95)% | $ (9,354,434) | |
| TOTAL NET ASSETS — 100.00% | $480,556,841 | |
| (a) | Represents securities sold under Rule 144A, which are exempt from registration under the Securities Act of 1933, as amended. |
| (b) | Non-income producing security. |
| (c) | All or a portion of the security is on loan at December 31, 2023. |
| (d) | Collateral received for securities on loan. |
| ADR | American Depositary Receipt |
| REIT | Real Estate Investment Trust |
See Notes to Financial Statements.
Annual Report - December 31, 2023
EMPOWER FUNDS, INC.
EMPOWER INTERNATIONAL GROWTH FUND
Schedule of Investments
As of December 31, 2023
Summary of Investments by Country as of December 31, 2023.
| Country | Fair Value | Percentage of Fund Investments | |
| Japan | $ 76,115,708 | 15.54% | |
| Switzerland | 58,696,012 | 11.98 | |
| United Kingdom | 58,251,001 | 11.89 | |
| France | 46,445,655 | 9.48 | |
| Germany | 44,898,376 | 9.16 | |
| Denmark | 30,757,725 | 6.28 | |
| Netherlands | 28,377,467 | 5.79 | |
| Australia | 23,059,851 | 4.71 | |
| United States | 18,993,789 | 3.88 | |
| Israel | 17,307,060 | 3.53 | |
| Ireland | 16,128,884 | 3.29 | |
| Canada | 13,091,229 | 2.67 | |
| Sweden | 12,679,989 | 2.59 | |
| Spain | 12,467,392 | 2.55 | |
| Uruguay | 6,283,017 | 1.28 | |
| China | 5,810,563 | 1.19 | |
| Taiwan | 4,636,216 | 0.95 | |
| Singapore | 4,577,279 | 0.93 | |
| India | 3,110,884 | 0.64 | |
| Indonesia | 2,854,465 | 0.58 | |
| Belgium | 2,612,388 | 0.53 | |
| South Korea | 1,518,999 | 0.31 | |
| Italy | 1,237,326 | 0.25 | |
| Total | $489,911,275 | 100.00% |
See Notes to Financial Statements.
Annual Report - December 31, 2023
EMPOWER FUNDS, INC.
EMPOWER INTERNATIONAL INDEX FUND
Schedule of Investments
As of December 31, 2023
| Shares | Fair Value | |
| COMMON STOCK | ||
| Basic Materials — 6.47% | ||
| 56,152 | Air Liquide SA | $ 10,932,515 |
| 18,545 | Akzo Nobel NV | 1,535,649 |
| 136,235 | Anglo American PLC | 3,409,163 |
| 41,392 | Antofagasta PLC | 884,778 |
| 55,512 | ArcelorMittal SA | 1,575,429 |
| 6,437 | Arkema SA | 733,288 |
| 135,700 | Asahi Kasei Corp | 1,001,512 |
| 95,832 | BASF SE | 5,160,262 |
| 543,124 | BHP Group Ltd | 18,555,611 |
| 49,087 | BlueScope Steel Ltd | 782,568 |
| 30,044 | Boliden AB | 940,363 |
| 15,736 | Brenntag SE | 1,446,253 |
| 11,099 | Chr Hansen Holding A/S | 930,842 |
| 22,949 | Clariant AG | 339,065 |
| 21,063 | Covestro AG(a)(b) | 1,227,378 |
| 15,588 | Croda International PLC | 1,002,284 |
| 19,957 | DSM-Firmenich AG | 2,029,492 |
| 755 | EMS-Chemie Holding AG | 612,175 |
| 20,255 | Endeavour Mining PLC | 452,972 |
| 23,014 | Evonik Industries AG | 470,151 |
| 181,559 | Fortescue Ltd | 3,579,859 |
| 990 | Givaudan SA | 4,105,245 |
| 1,129,203 | Glencore PLC | 6,786,964 |
| 9,885 | Holmen AB Class B | 417,511 |
| 84,701 | ICL Group Ltd | 425,847 |
| 75,176 | IGO Ltd | 463,319 |
| 62,700 | JFE Holdings Inc | 970,045 |
| 18,727 | Mineral Resources Ltd | 892,034 |
| 134,800 | Mitsubishi Chemical Group Corp | 824,048 |
| 18,000 | Mitsui Chemicals Inc | 532,296 |
| 51,363 | Mondi PLC | 1,004,574 |
| 109,400 | Nippon Paint Holdings Co Ltd | 882,457 |
| 18,800 | Nippon Sanso Holdings Corp | 502,009 |
| 91,674 | Nippon Steel Corp | 2,094,181 |
| 13,200 | Nissan Chemical Corp | 513,990 |
| 15,400 | Nitto Denko Corp | 1,149,228 |
| 139,264 | Norsk Hydro ASA | 936,078 |
| 120,731 | Northern Star Resources Ltd | 1,120,154 |
| 22,797 | Novozymes A/S Class B | 1,253,228 |
| 10,581 | OCI NV | 306,651 |
| 96,900 | Oji Holdings Corp | 372,475 |
| 283,234 | Pilbara Minerals Ltd(c) | 760,234 |
| 39,799 | Rio Tinto Ltd | 3,685,298 |
| 120,707 | Rio Tinto PLC | 8,976,774 |
| 195,300 | Shin-Etsu Chemical Co Ltd | 8,168,065 |
| 29,166 | Smurfit Kappa Group PLC | 1,156,153 |
| 495,632 | South32 Ltd | 1,120,941 |
| 152,900 | Sumitomo Chemical Co Ltd | 371,659 |
| 25,900 | Sumitomo Metal Mining Co Ltd | 769,175 |
| 7,845 | Syensqo SA(b) | 816,336 |
| 14,393 | Symrise AG | 1,581,724 |
| 148,300 | Toray Industries Inc | 768,197 |
| 27,500 | Tosoh Corp | 350,571 |
| 21,983 | Umicore SA | 604,685 |
| 57,817 | UPM-Kymmene OYJ | 2,180,894 |
| Shares | Fair Value | |
| Basic Materials — (continued) | ||
| 12,021 | voestalpine AG | $ 378,491 |
| 2,040 | Wacker Chemie AG | 257,202 |
| 17,379 | Yara International ASA | ��� 617,417 |
| 115,717,759 | ||
| Communications — 4.25% | ||
| 39,586 | Adevinta ASA(b) | 437,339 |
| 96,422 | Auto Trader Group PLC(a) | 885,548 |
| 77,442 | Bollore SE(b) | 484,617 |
| 703,845 | BT Group PLC | 1,108,518 |
| 37,873 | CAR Group Ltd | 802,577 |
| 18,996 | Delivery Hero SE(a)(b) | 522,825 |
| 21,800 | Dentsu Group Inc(c) | 558,154 |
| 347,493 | Deutsche Telekom AG | 8,354,862 |
| 14,975 | Elisa OYJ | 692,179 |
| 199,363 | Grab Holdings Ltd Class A(b) | 671,853 |
| 2,200 | Hikari Tsushin Inc | 363,592 |
| 388,900 | HKT Trust & HKT Ltd | 464,319 |
| 151,095 | Informa PLC | 1,502,466 |
| 160,500 | KDDI Corp | 5,090,820 |
| 352,938 | Koninklijke KPN NV | 1,215,914 |
| 285,100 | LY Corp | 1,008,195 |
| 46,400 | M3 Inc(b) | 765,707 |
| 25,900 | MonotaRO Co Ltd(c) | 281,825 |
| 6,890 | Nice Ltd(b) | 1,370,275 |
| 3,203,600 | Nippon Telegraph & Telephone Corp | 3,911,866 |
| 573,652 | Nokia OYJ | 1,953,816 |
| 199,631 | Orange SA | 2,275,320 |
| 68,678 | Pearson PLC | 843,391 |
| 158,011 | Prosus NV | 4,707,152 |
| 24,864 | Publicis Groupe SA | 2,310,156 |
| 160,400 | Rakuten Group Inc(b)(c) | 715,114 |
| 8,167 | Scout24 SE(a) | 577,498 |
| 39,300 | Sea Ltd ADR(b) | 1,591,650 |
| 38,485 | SEEK Ltd | 700,158 |
| 892,400 | Singapore Telecommunications Ltd | 1,670,578 |
| 308,000 | SoftBank Corp | 3,838,213 |
| 110,300 | SoftBank Group Corp | 4,868,473 |
| 193,660 | Spark New Zealand Ltd | 634,148 |
| 2,797 | Swisscom AG | 1,683,429 |
| 56,245 | Tele2 AB Class B | 483,464 |
| 1,098,559 | Telecom Italia SpA(b)(c) | 356,792 |
| 314,835 | Telefonaktiebolaget LM Ericsson Class B | 1,981,314 |
| 530,061 | Telefonica SA | 2,072,470 |
| 66,729 | Telenor ASA | 765,815 |
| 256,309 | Telia Co AB | 653,955 |
| 456,670 | Telstra Group Ltd | 1,234,050 |
| 14,200 | Trend Micro Inc(b)(c) | 757,854 |
| 71,282 | Vivendi SE | 763,071 |
| 2,466,057 | Vodafone Group PLC | 2,153,390 |
| 5,891 | Wix.com Ltd(b) | 724,711 |
| 26,857 | Wolters Kluwer NV | 3,820,924 |
| 117,163 | WPP PLC | 1,118,829 |
| 15,400 | ZOZO Inc | 347,565 |
| 76,096,751 | ||
See Notes to Financial Statements.
Annual Report - December 31, 2023
EMPOWER FUNDS, INC.
EMPOWER INTERNATIONAL INDEX FUND
Schedule of Investments
As of December 31, 2023
| Shares | Fair Value | |
| Consumer, Cyclical — 13.33% | ||
| 19,465 | Accor SA | $ 745,042 |
| 17,407 | adidas AG | 3,537,214 |
| 15,800 | Aisin Corp | 550,808 |
| 16,200 | ANA Holdings Inc(b) | 350,982 |
| 63,266 | Aristocrat Leisure Ltd | 1,757,752 |
| 38,023 | Associated British Foods PLC | 1,145,491 |
| 10,126 | Avolta AG(b) | 398,671 |
| 64,800 | Bandai Namco Holdings Inc | 1,295,886 |
| 102,592 | Barratt Developments PLC | 734,657 |
| 34,187 | Bayerische Motoren Werke AG | 3,804,036 |
| 11,313 | Berkeley Group Holdings PLC | 675,398 |
| 60,900 | Bridgestone Corp(c) | 2,515,254 |
| 36,574 | Bunzl PLC | 1,485,736 |
| 41,468 | Burberry Group PLC | 747,691 |
| 55,961 | Cie Financiere Richemont SA | 7,729,564 |
| 72,734 | Cie Generale des Etablissements Michelin SCA | 2,613,076 |
| 54,700 | City Developments Ltd | 275,414 |
| 185,860 | Compass Group PLC | 5,083,373 |
| 12,079 | Continental AG | 1,025,885 |
| 57,498 | Daimler Truck Holding AG | 2,159,854 |
| 63,800 | Daiwa House Industry Co Ltd | 1,928,699 |
| 185,900 | Denso Corp | 2,790,795 |
| 65,140 | Deutsche Lufthansa AG(b) | 579,110 |
| 2,258 | D'ieteren Group | 441,692 |
| 67,043 | Entain PLC | 845,313 |
| 19,664 | Evolution AB(a) | 2,342,188 |
| 18,800 | Fast Retailing Co Ltd | 4,648,844 |
| 13,514 | Ferrari NV | 4,562,409 |
| 18,932 | Flutter Entertainment PLC(b) | 3,341,331 |
| 236,000 | Galaxy Entertainment Group Ltd | 1,321,805 |
| 623,020 | Genting Singapore Ltd | 471,911 |
| 70,519 | H & M Hennes & Mauritz AB Class B(c) | 1,236,906 |
| 3,396 | Hermes International SCA | 7,218,235 |
| 495,300 | Honda Motor Co Ltd | 5,109,128 |
| 11,800 | Hoshizaki Corp | 431,058 |
| 16,156 | Iida Group Holdings Co Ltd | 241,313 |
| 6,276 | IMCD NV | 1,093,048 |
| 116,949 | Industria de Diseno Textil SA | 5,102,948 |
| 18,231 | InterContinental Hotels Group PLC | 1,643,531 |
| 62,000 | Isuzu Motors Ltd | 794,820 |
| 127,500 | ITOCHU Corp(c) | 5,194,331 |
| 15,800 | Japan Airlines Co Ltd | 310,392 |
| 10,200 | Jardine Cycle & Carriage Ltd | 229,882 |
| 283,518 | JD Sports Fashion PLC | 598,138 |
| 7,982 | Kering SA | 3,535,209 |
| 199,946 | Kingfisher PLC | 619,254 |
| 21,600 | Koito Manufacturing Co Ltd | 335,637 |
| 10,754 | La Francaise des Jeux SAEM(a) | 390,636 |
| 240,232 | Lottery Corp Ltd | 792,668 |
| Shares | Fair Value | |
| Consumer, Cyclical — (continued) | ||
| 29,625 | LVMH Moet Hennessy Louis Vuitton SE | $ 24,071,362 |
| 156,400 | Marubeni Corp | 2,462,447 |
| 36,900 | MatsukiyoCocokara & Co | 652,168 |
| 61,000 | Mazda Motor Corp | 652,034 |
| 9,700 | McDonald's Holdings Co Japan Ltd(c) | 420,176 |
| 86,024 | Mercedes-Benz Group AG | 5,935,459 |
| 369,900 | Mitsubishi Corp | 5,892,236 |
| 140,800 | Mitsui & Co Ltd | 5,274,925 |
| 22,568 | Moncler SpA | 1,389,494 |
| 13,287 | Next PLC | 1,373,202 |
| 111,400 | Nintendo Co Ltd | 5,796,576 |
| 248,800 | Nissan Motor Co Ltd | 972,789 |
| 8,700 | Nitori Holdings Co Ltd | 1,168,206 |
| 8,200 | Open House Group Co Ltd | 242,549 |
| 116,900 | Oriental Land Co Ltd | 4,344,974 |
| 40,000 | Pan Pacific International Holdings Corp | 952,179 |
| 236,800 | Panasonic Holdings Corp | 2,331,907 |
| 9,286 | Pandora A/S | 1,283,837 |
| 34,432 | Persimmon PLC | 608,406 |
| 11,350 | Puma SE | 631,394 |
| 94,481 | Qantas Airways Ltd(b) | 346,085 |
| 570 | Rational AG | 439,843 |
| 24,998 | Reece Ltd | 381,295 |
| 20,344 | Renault SA | 832,066 |
| 254,800 | Sands China Ltd(b) | 745,791 |
| 2,611 | SEB SA | 326,964 |
| 41,400 | Sekisui Chemical Co Ltd | 595,455 |
| 63,600 | Sekisui House Ltd | 1,409,772 |
| 29,200 | Sharp Corp(b)(c) | 207,831 |
| 8,200 | Shimano Inc(c) | 1,263,162 |
| 159,600 | Singapore Airlines Ltd(c) | 792,467 |
| 9,807 | Sodexo SA | 1,079,635 |
| 135,200 | Sony Group Corp | 12,794,371 |
| 237,194 | Stellantis NV | 5,563,474 |
| 65,300 | Subaru Corp | 1,191,034 |
| 112,100 | Sumitomo Corp | 2,439,482 |
| 77,300 | Sumitomo Electric Industries Ltd | 980,828 |
| 39,500 | Suzuki Motor Corp | 1,683,354 |
| 9,038 | Swatch Group AG | 1,169,521 |
| 383,364 | Taylor Wimpey PLC | 717,381 |
| 12,300 | Toho Co Ltd | 415,251 |
| 15,800 | Toyota Industries Corp | 1,284,387 |
| 1,137,675 | Toyota Motor Corp | 20,846,439 |
| 23,000 | Toyota Tsusho Corp | 1,349,691 |
| 87,842 | Universal Music Group NV | 2,507,632 |
| 21,400 | USS Co Ltd | 429,631 |
| 3,322 | Volkswagen AG | 434,699 |
| 20,793 | Volvo AB Class A | 551,679 |
| 161,786 | Volvo AB Class B | 4,209,673 |
| 61,940 | Volvo Car AB Class B(b) | 200,883 |
| 121,635 | Wesfarmers Ltd | 4,730,252 |
| 21,765 | Whitbread PLC | 1,013,042 |
| 14,700 | Yamaha Corp | 338,609 |
| 95,100 | Yamaha Motor Co Ltd(c) | 846,234 |
| 24,355 | Zalando SE(a)(b) | 576,591 |
See Notes to Financial Statements.
Annual Report - December 31, 2023
EMPOWER FUNDS, INC.
EMPOWER INTERNATIONAL INDEX FUND
Schedule of Investments
As of December 31, 2023
| Shares | Fair Value | |
| Consumer, Cyclical — (continued) | ||
| 10,100 | Zensho Holdings Co Ltd | $ 528,477 |
| 238,462,316 | ||
| Consumer, Non-Cyclical — 23.80% | ||
| 17,155 | Adecco Group AG | 842,542 |
| 2,309 | Adyen NV(a)(b) | 2,980,777 |
| 70,500 | Aeon Co Ltd | 1,573,171 |
| 48,000 | Ajinomoto Co Inc | 1,847,704 |
| 53,571 | Alcon Inc | 4,191,182 |
| 48,417 | Amadeus IT Group SA | 3,477,377 |
| 13,070 | Amplifon SpA(c) | 452,883 |
| 93,124 | Anheuser-Busch InBev SA(c) | 6,010,965 |
| 6,354 | Argenx SE(b) | 2,416,857 |
| 51,500 | Asahi Group Holdings Ltd(c) | 1,917,674 |
| 23,500 | Asahi Intecc Co Ltd | 476,554 |
| 46,981 | Ashtead Group PLC | 3,264,317 |
| 194,900 | Astellas Pharma Inc | 2,317,999 |
| 166,343 | AstraZeneca PLC | 22,433,732 |
| 3,549 | Bachem Holding AG(c) | 274,839 |
| 375 | Barry Callebaut AG | 633,067 |
| 105,327 | Bayer AG | 3,908,037 |
| 10,907 | Beiersdorf AG | 1,633,372 |
| 4,567 | BioMerieux | 508,121 |
| 150,159 | Brambles Ltd | 1,391,806 |
| 227,777 | British American Tobacco PLC | 6,663,110 |
| 175,200 | Budweiser Brewing Co APAC Ltd(a) | 328,448 |
| 31,258 | Bureau Veritas SA | 790,818 |
| 4,412 | Carl Zeiss Meditec AG | 480,264 |
| 10,670 | Carlsberg AS Class B | 1,338,916 |
| 65,363 | Carrefour SA | 1,197,098 |
| 113 | Chocoladefabriken Lindt & Spruengli AG | 2,668,190 |
| 72,100 | Chugai Pharmaceutical Co Ltd | 2,723,820 |
| 290,424 | CK Hutchison Holdings Ltd | 1,560,333 |
| 22,048 | Coca-Cola Europacific Partners PLC | 1,466,106 |
| 23,195 | Coca-Cola HBC AG | 680,778 |
| 7,179 | Cochlear Ltd | 1,460,537 |
| 145,306 | Coles Group Ltd | 1,596,194 |
| 14,706 | Coloplast A/S Class B | 1,680,398 |
| 51,717 | CSL Ltd | 10,082,177 |
| 23,600 | Dai Nippon Printing Co Ltd | 696,932 |
| 198,400 | Daiichi Sankyo Co Ltd | 5,431,543 |
| 69,032 | Danone SA | 4,478,688 |
| 55,857 | Davide Campari-Milano NV | 630,776 |
| 10,738 | Demant A/S(b) | 470,970 |
| 240,908 | Diageo PLC | 8,742,258 |
| 2,487 | DiaSorin SpA | 256,319 |
| 16,079 | EBOS Group Ltd(c) | 360,608 |
| 26,932 | Edenred SE | 1,611,735 |
| 27,300 | Eisai Co Ltd | 1,359,299 |
| 154,161 | Endeavour Group Ltd | 547,472 |
| 31,610 | EssilorLuxottica SA | 6,347,236 |
| 64,509 | Essity AB Class B | 1,598,674 |
| 14,832 | Eurofins Scientific SE | 967,525 |
| Shares | Fair Value | |
| Consumer, Non-Cyclical — (continued) | ||
| 98,639 | Experian PLC | $ 4,022,750 |
| 62,538 | Fisher & Paykel Healthcare Corp Ltd | 932,658 |
| 21,559 | Fresenius Medical Care AG | 901,343 |
| 45,037 | Fresenius SE & Co KGaA | 1,395,944 |
| 40,100 | FUJIFILM Holdings Corp | 2,403,184 |
| 7,081 | Genmab A/S(b) | 2,257,798 |
| 23,751 | Getinge AB Class B | 528,875 |
| 30,587 | Grifols SA(b) | 523,262 |
| 439,034 | GSK PLC | 8,107,481 |
| 598,716 | Haleon PLC | 2,450,922 |
| 14,108 | Heineken Holding NV | 1,194,580 |
| 30,877 | Heineken NV | 3,137,080 |
| 16,418 | HelloFresh SE(b) | 258,854 |
| 11,074 | Henkel AG & Co KGaA | 794,543 |
| 18,185 | Hikma Pharmaceuticals PLC | 414,267 |
| 26,011 | IDP Education Ltd | 354,820 |
| 92,564 | Imperial Brands PLC | 2,130,952 |
| 17,681 | Intertek Group PLC | 956,963 |
| 4,107 | Ipsen SA | 489,920 |
| 180,360 | J Sainsbury PLC | 695,134 |
| 128,800 | Japan Tobacco Inc(c) | 3,326,288 |
| 12,842 | JDE Peet's NV | 345,349 |
| 30,536 | Jeronimo Martins SGPS SA | 777,156 |
| 50,100 | Kao Corp(c) | 2,059,392 |
| 17,226 | Kerry Group PLC Class A | 1,495,202 |
| 29,371 | Kesko OYJ Class B | 582,241 |
| 14,300 | Kikkoman Corp | 873,828 |
| 85,000 | Kirin Holdings Co Ltd(c) | 1,244,411 |
| 16,500 | Kobe Bussan Co Ltd | 487,422 |
| 104,131 | Koninklijke Ahold Delhaize NV | 2,995,994 |
| 85,207 | Koninklijke Philips NV(b) | 1,994,029 |
| 3,700 | Kose Corp | 276,558 |
| 28,400 | Kyowa Kirin Co Ltd(c) | 476,522 |
| 25,355 | Lifco AB Class B(b) | 622,488 |
| 7,984 | Lonza Group AG | 3,365,946 |
| 25,858 | L'Oreal SA | 12,890,206 |
| 43 | Lotus Bakeries NV | 390,676 |
| 295,267 | Medibank Pvt Ltd | 716,840 |
| 24,700 | MEIJI Holdings Co Ltd | 586,715 |
| 13,857 | Merck KGaA | 2,206,231 |
| 51,894 | Mowi ASA | 929,305 |
| 286,474 | Nestle SA | 33,208,032 |
| 63,457 | Nexi SpA(a)(b) | 519,903 |
| 19,800 | Nissin Foods Holdings Co Ltd | 691,413 |
| 7,190 | NMC Health PLC(b)(d) | 458 |
| 220,070 | Novartis AG | 22,229,378 |
| 351,103 | Novo Nordisk A/S Class B | 36,385,220 |
| 65,093 | Ocado Group PLC(b) | 628,628 |
| 128,600 | Olympus Corp | 1,856,248 |
| 40,700 | Ono Pharmaceutical Co Ltd | 724,033 |
| 11,913 | Orion OYJ Class B | 516,205 |
| 81,566 | Orkla ASA | 633,420 |
| 44,700 | Otsuka Holdings Co Ltd | 1,671,646 |
| 21,925 | Pernod Ricard SA | 3,874,618 |
| 23,935 | QIAGEN NV(b) | 1,040,603 |
| 19,680 | Ramsay Health Care Ltd | 705,965 |
See Notes to Financial Statements.
Annual Report - December 31, 2023
EMPOWER FUNDS, INC.
EMPOWER INTERNATIONAL INDEX FUND
Schedule of Investments
As of December 31, 2023
| Shares | Fair Value | |
| Consumer, Non-Cyclical — (continued) | ||
| 11,874 | Randstad NV | $ 745,212 |
| 76,925 | Reckitt Benckiser Group PLC | 5,306,123 |
| 11,307 | Recordati Industria Chimica e Farmaceutica SpA | 609,704 |
| 154,500 | Recruit Holdings Co Ltd | 6,459,821 |
| 203,025 | RELX PLC | 8,052,178 |
| 2,408 | Remy Cointreau SA | 307,152 |
| 268,754 | Rentokil Initial PLC | 1,514,423 |
| 78,911 | Roche Holding AG | 23,009,052 |
| 7,978 | Salmar ASA | 446,807 |
| 44,511 | Sandoz Group AG(b) | 1,432,100 |
| 121,807 | Sanofi SA | 12,104,273 |
| 2,947 | Sartorius Stedim Biotech | 781,491 |
| 22,700 | Secom Co Ltd | 1,633,044 |
| 53,632 | Securitas AB Class B(c) | 525,808 |
| 80,700 | Seven & i Holdings Co Ltd | 3,191,650 |
| 16,297 | SGS SA | 1,406,933 |
| 28,400 | Shionogi & Co Ltd | 1,366,835 |
| 43,100 | Shiseido Co Ltd | 1,299,137 |
| 30,502 | Siemens Healthineers AG(a) | 1,770,901 |
| 94,966 | Smith & Nephew PLC | 1,303,948 |
| 46,947 | Sonic Healthcare Ltd | 1,025,826 |
| 5,615 | Sonova Holding AG | 1,836,374 |
| 12,039 | Straumann Holding AG | 1,945,537 |
| 14,900 | Suntory Beverage & Food Ltd | 489,910 |
| 20,089 | Swedish Orphan Biovitrum AB(b) | 531,800 |
| 17,600 | Sysmex Corp | 978,393 |
| 169,552 | Takeda Pharmaceutical Co Ltd | 4,862,421 |
| 71,500 | Terumo Corp | 2,338,122 |
| 768,543 | Tesco PLC | 2,846,258 |
| 122,047 | Teva Pharmaceutical Industries Ltd Sponsored ADR(b) | 1,274,171 |
| 26,400 | TOPPAN Holdings Inc | 735,230 |
| 330,275 | Transurban Group | 3,086,214 |
| 75,768 | Treasury Wine Estates Ltd | 557,463 |
| 13,867 | UCB SA | 1,208,807 |
| 43,700 | Unicharm Corp | 1,580,513 |
| 269,640 | Unilever PLC | 13,051,816 |
| 914,645 | WH Group Ltd(a) | 590,677 |
| 207,700 | Wilmar International Ltd | 561,076 |
| 64,538 | Wise PLC Class A(b) | 717,594 |
| 130,661 | Woolworths Group Ltd | 3,314,861 |
| 25,215 | Worldline SA(a)(b) | 438,488 |
| 27,400 | Yakult Honsha Co Ltd | 615,065 |
| 425,903,305 | ||
| Diversified — 0.06% | ||
| 16,979 | Jardine Matheson Holdings Ltd | 721,607 |
| 46,000 | Swire Pacific Ltd Class A | 389,604 |
| 1,111,211 | ||
| Energy — 4.47% | ||
| 33,392 | Aker BP ASA | 969,958 |
| Shares | Fair Value | |
| Energy — (continued) | ||
| 25,550 | Ampol Ltd | $ 629,683 |
| 133,582 | APA Group | 777,386 |
| 1,835,314 | BP PLC | 10,878,694 |
| 7,111 | Corp ACCIONA Energias Renovables SA | 220,697 |
| 10,367 | DCC PLC | 762,549 |
| 307,450 | ENEOS Holdings Inc | 1,219,419 |
| 253,357 | Eni SpA | 4,297,280 |
| 96,590 | Equinor ASA | 3,061,128 |
| 52,573 | Galp Energia SGPS SA | 773,541 |
| 103,780 | Idemitsu Kosan Co Ltd | 563,573 |
| 104,700 | Inpex Corp(c) | 1,401,069 |
| 45,564 | Neste OYJ | 1,619,789 |
| 15,750 | OMV AG | 690,994 |
| 136,951 | Repsol SA | 2,031,507 |
| 349,190 | Santos Ltd | 1,815,614 |
| 4,784,391 | Seatrium Ltd(b)(c) | 427,207 |
| 711,701 | Shell PLC | 23,292,328 |
| 245,814 | TotalEnergies SE | 16,715,077 |
| 108,645 | Vestas Wind Systems A/S(b) | 3,437,715 |
| 203,571 | Woodside Energy Group Ltd | 4,298,729 |
| 79,883,937 | ||
| Financial — 20.42% | ||
| 104,354 | 3i Group PLC | 3,210,636 |
| 50,953 | ABN AMRO Bank NV(a) | 766,255 |
| 206,574 | abrdn PLC | 469,527 |
| 27,803 | Admiral Group PLC | 950,188 |
| 178,637 | Aegon Ltd | 1,038,603 |
| 21,514 | AerCap Holdings NV(b) | 1,598,920 |
| 17,613 | Ageas SA | 765,645 |
| 1,238,400 | AIA Group Ltd | 10,777,650 |
| 173,001 | AIB Group PLC | 740,920 |
| 43,240 | Allianz SE | 11,555,490 |
| 6,942 | Amundi SA(a) | 473,510 |
| 322,208 | ANZ Group Holdings Ltd | 5,692,776 |
| 16,987 | ASR Nederland NV(b) | 802,463 |
| 108,941 | Assicurazioni Generali SpA | 2,301,649 |
| 21,399 | ASX Ltd | 919,365 |
| 295,356 | Aviva PLC | 1,633,955 |
| 196,755 | AXA SA | 6,425,308 |
| 4,568 | Azrieli Group Ltd | 295,461 |
| 4,900 | Baloise Holding AG | 768,263 |
| 639,566 | Banco Bilbao Vizcaya Argentaria SA | 5,829,167 |
| 134,022 | Banco BPM SpA | 710,174 |
| 1,735,121 | Banco Santander SA | 7,257,445 |
| 137,859 | Bank Hapoalim BM | 1,238,467 |
| 166,285 | Bank Leumi Le-Israel BM | 1,338,233 |
| 115,242 | Bank of Ireland Group PLC | 1,046,217 |
| 3,538 | Banque Cantonale Vaudoise | 456,292 |
| 1,610,311 | Barclays PLC | 3,152,684 |
| 112,484 | BNP Paribas SA | 7,811,515 |
| 407,500 | BOC Hong Kong Holdings Ltd | 1,106,985 |
| 442,296 | CaixaBank SA | 1,821,520 |
| 391,740 | CapitaLand Ascendas REIT | 898,093 |
See Notes to Financial Statements.
Annual Report - December 31, 2023
EMPOWER FUNDS, INC.
EMPOWER INTERNATIONAL INDEX FUND
Schedule of Investments
As of December 31, 2023
| Shares | Fair Value | |
| Financial — (continued) | ||
| 583,804 | CapitaLand Integrated Commercial Trust REIT(b) | $ 910,030 |
| 281,257 | Capitaland Investment Ltd | 672,451 |
| 56,500 | Chiba Bank Ltd(b) | 407,061 |
| 217,924 | CK Asset Holdings Ltd | 1,093,781 |
| 115,340 | Commerzbank AG | 1,370,905 |
| 179,708 | Commonwealth Bank of Australia | 13,696,802 |
| 60,759 | Computershare Ltd | 1,011,963 |
| 114,000 | Concordia Financial Group Ltd | 519,632 |
| 5,758 | Covivio SA REIT | 309,833 |
| 114,490 | Credit Agricole SA | 1,627,661 |
| 101,100 | Dai-ichi Life Holdings Inc | 2,144,627 |
| 6,600 | Daito Trust Construction Co Ltd | 763,927 |
| 226 | Daiwa House Investment Corp REIT | 403,003 |
| 141,300 | Daiwa Securities Group Inc | 948,431 |
| 74,382 | Danske Bank A/S | 1,988,327 |
| 194,276 | DBS Group Holdings Ltd | 4,913,013 |
| 207,800 | Deutsche Bank AG | 2,836,692 |
| 20,371 | Deutsche Boerse AG | 4,195,089 |
| 107,834 | Dexus REIT | 563,556 |
| 100,369 | DNB Bank ASA | 2,133,970 |
| 38,070 | EQT AB | 1,077,900 |
| 37,267 | Erste Group Bank AG | 1,509,494 |
| 235,000 | ESR Group Ltd(a)(c) | 324,994 |
| 4,407 | Eurazeo SE | 350,418 |
| 9,245 | Euronext NV(a) | 803,450 |
| 10,032 | EXOR NV | 1,004,178 |
| 66,859 | Fastighets AB Balder Class B(b)(c) | 474,156 |
| 66,665 | FinecoBank Banca Fineco SpA(c) | 1,002,917 |
| 5,800 | Futu Holdings Ltd ADR(b) | 316,854 |
| 4,929 | Gecina SA REIT | 600,051 |
| 20,580 | Gjensidige Forsikring ASA | 379,779 |
| 502 | GLP J-REIT | 499,710 |
| 181,774 | Goodman Group REIT | 3,129,576 |
| 195,052 | GPT Group REIT | 615,577 |
| 10,124 | Groupe Bruxelles Lambert NV | 797,293 |
| 186,000 | Hang Lung Properties Ltd | 258,598 |
| 83,700 | Hang Seng Bank Ltd | 977,235 |
| 6,510 | Hannover Rueck SE | 1,556,563 |
| 40,385 | Hargreaves Lansdown PLC | 377,333 |
| 3,984 | Helvetia Holding AG | 549,341 |
| 157,830 | Henderson Land Development Co Ltd | 486,028 |
| 129,212 | Hong Kong Exchanges & Clearing Ltd | 4,432,005 |
| 116,300 | Hongkong Land Holdings Ltd | 404,498 |
| 2,096,775 | HSBC Holdings PLC | 16,960,149 |
| 39,700 | Hulic Co Ltd(b)(c) | 414,711 |
| 13,516 | Industrivarden AB Class A | 441,889 |
| 16,841 | Industrivarden AB Class C(b)(c) | 549,520 |
| 388,052 | ING Groep NV | 5,818,652 |
| Shares | Fair Value | |
| Financial — (continued) | ||
| 264,896 | Insurance Australia Group Ltd(b) | $ 1,023,921 |
| 1,666,102 | Intesa Sanpaolo SpA | 4,875,662 |
| 185,566 | Investor AB Class B | 4,303,223 |
| 129,186 | Israel Discount Bank Ltd Class A | 646,825 |
| 53,900 | Japan Exchange Group Inc | 1,137,586 |
| 754 | Japan Metropolitan Fund Invest REIT | 544,238 |
| 156,100 | Japan Post Bank Co Ltd | 1,588,619 |
| 223,600 | Japan Post Holdings Co Ltd | 1,996,181 |
| 20,600 | Japan Post Insurance Co Ltd | 365,663 |
| 140 | Japan Real Estate Investment Corp REIT | 579,174 |
| 22,285 | Julius Baer Group Ltd | 1,250,146 |
| 26,860 | KBC Group NV | 1,743,193 |
| 440 | KDX Realty Investment Corp REIT(b) | 501,175 |
| 23,426 | Klepierre SA REIT | 639,544 |
| 8,633 | L E Lundbergforetagen AB Class B | 470,126 |
| 76,773 | Land Securities Group PLC REIT | 688,797 |
| 7,779 | LEG Immobilien SE(b) | 680,735 |
| 641,481 | Legal & General Group PLC | 2,049,156 |
| 273,344 | Link REIT | 1,534,842 |
| 6,904,614 | Lloyds Banking Group PLC | 4,187,460 |
| 44,568 | London Stock Exchange Group PLC | 5,267,310 |
| 244,408 | M&G PLC | 691,391 |
| 39,364 | Macquarie Group Ltd | 4,927,653 |
| 372,638 | Mapletree Logistics Trust REIT | 490,651 |
| 243,500 | Mapletree Pan Asia Commercial Trust REIT | 289,289 |
| 58,486 | Mediobanca Banca di Credito Finanziario SpA | 724,744 |
| 422,742 | Mirvac Group REIT | 601,404 |
| 121,300 | Mitsubishi Estate Co Ltd | 1,662,789 |
| 86,500 | Mitsubishi HC Capital Inc | 579,533 |
| 1,224,300 | Mitsubishi UFJ Financial Group Inc | 10,507,110 |
| 96,600 | Mitsui Fudosan Co Ltd | 2,361,841 |
| 16,408 | Mizrahi Tefahot Bank Ltd(b) | 635,186 |
| 258,710 | Mizuho Financial Group Inc | 4,413,028 |
| 46,200 | MS&AD Insurance Group Holdings Inc | 1,816,530 |
| 14,631 | Muenchener Rueckversicherungs-Gesellschaft AG in Muenchen | 6,069,128 |
| 336,598 | National Australia Bank Ltd | 7,035,194 |
| 627,363 | NatWest Group PLC | 1,746,661 |
| 156,108 | New World Development Co Ltd | 242,049 |
| 163 | Nippon Building Fund Inc REIT(c) | 705,608 |
| 246 | Nippon Prologis Inc REIT | 473,005 |
| 29,368 | NN Group NV | 1,160,646 |
| 325,200 | Nomura Holdings Inc | 1,464,562 |
See Notes to Financial Statements.
Annual Report - December 31, 2023
EMPOWER FUNDS, INC.
EMPOWER INTERNATIONAL INDEX FUND
Schedule of Investments
As of December 31, 2023
| Shares | Fair Value | |
| Financial — (continued) | ||
| 11,400 | Nomura Real Estate Holdings Inc | $ 299,141 |
| 511 | Nomura Real Estate Master Fund Inc REIT | 597,633 |
| 345,375 | Nordea Bank Abp | 4,287,623 |
| 125,700 | ORIX Corp | 2,360,795 |
| 362,985 | Oversea-Chinese Banking Corp Ltd | 3,571,559 |
| 2,442 | Partners Group Holding AG | 3,531,013 |
| 81,981 | Phoenix Group Holdings PLC | 558,011 |
| 295,177 | Prudential PLC | 3,329,637 |
| 160,545 | QBE Insurance Group Ltd | 1,626,736 |
| 5,683 | REA Group Ltd(c) | 700,767 |
| 227,100 | Resona Holdings Inc | 1,151,246 |
| 21,778 | Sagax AB Class B | 599,430 |
| 49,304 | Sampo OYJ Class A | 2,160,118 |
| 26,240 | SBI Holdings Inc | 588,913 |
| 584,177 | Scentre Group REIT | 1,189,623 |
| 88,748 | Schroders PLC | 485,140 |
| 128,027 | Segro PLC REIT | 1,443,466 |
| 51,200 | Shizuoka Financial Group Inc | 432,946 |
| 89,600 | Singapore Exchange Ltd | 666,569 |
| 419,178 | Sino Land Co Ltd | 455,848 |
| 170,130 | Skandinaviska Enskilda Banken AB Class A | 2,347,914 |
| 78,058 | Societe Generale SA | 2,076,755 |
| 1,613 | Sofina SA | 402,162 |
| 31,850 | Sompo Holdings Inc | 1,558,369 |
| 57,578 | St James's Place PLC | 500,799 |
| 241,691 | Standard Chartered PLC | 2,050,406 |
| 258,454 | Stockland REIT(b) | 783,796 |
| 136,100 | Sumitomo Mitsui Financial Group Inc | 6,622,605 |
| 70,772 | Sumitomo Mitsui Trust Holdings Inc | 1,355,417 |
| 30,400 | Sumitomo Realty & Development Co Ltd | 900,874 |
| 156,000 | Sun Hung Kai Properties Ltd | 1,688,134 |
| 137,490 | Suncorp Group Ltd | 1,301,943 |
| 158,059 | Svenska Handelsbanken AB Class A(c) | 1,717,697 |
| 90,734 | Swedbank AB Class A | 1,834,429 |
| 134,400 | Swire Properties Ltd | 272,060 |
| 3,164 | Swiss Life Holding AG | 2,198,833 |
| 8,220 | Swiss Prime Site AG | 878,252 |
| 32,335 | Swiss Re AG | 3,638,674 |
| 54,600 | T&D Holdings Inc | 866,800 |
| 6,820 | Talanx AG | 487,392 |
| 193,200 | Tokio Marine Holdings Inc | 4,810,873 |
| 36,649 | Tryg A/S | 797,564 |
| 352,599 | UBS Group AG | 10,952,284 |
| 12,405 | Unibail-Rodamco-Westfield REIT(b) | 917,515 |
| 174,366 | UniCredit SpA | 4,747,922 |
| 135,506 | United Overseas Bank Ltd | 2,924,654 |
| 50,906 | UOL Group Ltd(b) | 241,829 |
| 419,229 | Vicinity Ltd REIT | 582,356 |
| 78,240 | Vonovia SE | 2,458,429 |
| Shares | Fair Value | |
| Financial — (continued) | ||
| 17,971 | Warehouses De Pauw CVA REIT | $ 565,693 |
| 25,461 | Washington H Soul Pattinson & Co Ltd(b) | 568,791 |
| 376,220 | Westpac Banking Corp | 5,869,963 |
| 106,000 | Wharf Holdings Ltd | 341,473 |
| 193,300 | Wharf Real Estate Investment Co Ltd | 653,447 |
| 15,720 | Zurich Insurance Group AG | 8,218,843 |
| 365,319,738 | ||
| Industrial — 13.97% | ||
| 171,500 | ABB Ltd | 7,614,285 |
| 2,536 | Acciona SA | 373,411 |
| 23,114 | ACS Actividades de Construccion y Servicios SA | 1,026,586 |
| 8,217 | Aena SME SA(a) | 1,491,474 |
| 3,266 | Aeroports de Paris SA(b) | 423,779 |
| 22,400 | AGC Inc(c) | 830,243 |
| 63,555 | Airbus SE | 9,818,489 |
| 31,564 | Alfa Laval AB | 1,263,635 |
| 30,670 | Alstom SA(c) | 413,592 |
| 319 | AP Moller - Maersk A/S Class A | 566,637 |
| 510 | AP Moller - Maersk A/S Class B | 918,012 |
| 107,458 | Assa Abloy AB Class B | 3,096,852 |
| 287,977 | Atlas Copco AB Class A | 4,962,164 |
| 166,071 | Atlas Copco AB Class B | 2,463,852 |
| 134,189 | Auckland International Airport Ltd(c) | 746,484 |
| 188,256 | Aurizon Holdings Ltd | 487,382 |
| 11,900 | Azbil Corp | 392,487 |
| 326,819 | BAE Systems PLC | 4,624,031 |
| 41,528 | Beijer Ref AB(c) | 557,262 |
| 20,403 | Bouygues SA | 769,788 |
| 24,000 | Brother Industries Ltd | 382,200 |
| 60,594 | Cellnex Telecom SA(a) | 2,385,763 |
| 77,000 | Central Japan Railway Co | 1,954,282 |
| 49,592 | Cie de Saint-Gobain SA | 3,657,269 |
| 65,000 | CK Infrastructure Holdings Ltd | 359,722 |
| 76,122 | CRH PLC | 5,236,718 |
| 32,600 | Daifuku Co Ltd(c) | 657,346 |
| 28,300 | Daikin Industries Ltd | 4,590,826 |
| 2,222 | Dassault Aviation SA | 440,244 |
| 106,273 | Deutsche Post AG | 5,260,085 |
| 19,958 | DSV A/S | 3,506,756 |
| 32,600 | East Japan Railway Co | 1,876,546 |
| 8,071 | Eiffage SA | 866,425 |
| 2,807 | Elbit Systems Ltd | 595,339 |
| 71,031 | Epiroc AB Class A | 1,429,776 |
| 41,853 | Epiroc AB Class B | 734,009 |
| 102,700 | FANUC Corp | 3,014,156 |
| 55,537 | Ferrovial SE(c) | 2,027,124 |
| 13,700 | Fuji Electric Co Ltd | 587,209 |
| 16,545 | GEA Group AG(b) | 687,843 |
| 3,585 | Geberit AG | 2,301,279 |
See Notes to Financial Statements.
Annual Report - December 31, 2023
EMPOWER FUNDS, INC.
EMPOWER INTERNATIONAL INDEX FUND
Schedule of Investments
As of December 31, 2023
| Shares | Fair Value | |
| Industrial — (continued) | ||
| 37,749 | Getlink SE | $ 691,367 |
| 42,089 | Halma PLC | 1,223,239 |
| 24,300 | Hankyu Hanshin Holdings Inc(b) | 772,251 |
| 15,527 | Heidelberg Materials AG | 1,387,927 |
| 220,466 | Hexagon AB Class B | 2,648,085 |
| 3,479 | Hirose Electric Co Ltd | 392,913 |
| 11,600 | Hitachi Construction Machinery Co Ltd | 305,356 |
| 100,600 | Hitachi Ltd | 7,236,132 |
| 55,878 | Holcim AG | 4,388,738 |
| 38,000 | Hoya Corp | 4,732,491 |
| 39,571 | Husqvarna AB Class B | 326,403 |
| 12,100 | Ibiden Co Ltd | 667,505 |
| 29,078 | Indutrade AB | 757,847 |
| 36,913 | Infrastrutture Wireless Italiane SpA(a) | 467,351 |
| 15,374 | Investment AB Latour Class B | 401,051 |
| 48,270 | James Hardie Industries PLC(b) | 1,861,093 |
| 19,600 | JSR Corp | 557,704 |
| 45,100 | Kajima Corp | 752,006 |
| 14,900 | Kawasaki Kisen Kaisha Ltd | 637,667 |
| 14,000 | Keisei Electric Railway Co Ltd | 660,670 |
| 155,700 | Keppel Ltd | 833,120 |
| 20,860 | Keyence Corp | 9,164,977 |
| 16,770 | Kingspan Group PLC | 1,449,349 |
| 19,500 | Kintetsu Group Holdings Co Ltd | 617,838 |
| 7,848 | Knorr-Bremse AG | 506,865 |
| 99,000 | Komatsu Ltd | 2,576,311 |
| 36,563 | Kone OYJ Class B | 1,828,919 |
| 9,205 | Kongsberg Gruppen ASA | 421,414 |
| 108,500 | Kubota Corp(c) | 1,628,368 |
| 5,808 | Kuehne + Nagel International AG | 2,004,323 |
| 137,600 | Kyocera Corp | 2,003,465 |
| 28,606 | Legrand SA | 2,978,917 |
| 43,276 | Leonardo SpA | 715,053 |
| 24,100 | Makita Corp | 662,880 |
| 143,376 | Melrose Industries PLC | 1,036,010 |
| 69,536 | Metso OYJ | 705,920 |
| 39,100 | MINEBEA MITSUMI Inc | 800,300 |
| 30,600 | MISUMI Group Inc | 516,643 |
| 206,400 | Mitsubishi Electric Corp | 2,919,339 |
| 34,500 | Mitsubishi Heavy Industries Ltd | 2,008,733 |
| 37,600 | Mitsui OSK Lines Ltd(c) | 1,202,082 |
| 162,702 | MTR Corp Ltd | 631,503 |
| 5,853 | MTU Aero Engines AG | 1,261,001 |
| 184,800 | Murata Manufacturing Co Ltd | 3,905,191 |
| 165,397 | Nibe Industrier AB Class B(c) | 1,161,486 |
| 44,900 | Nidec Corp | 1,809,791 |
| 7,600 | Nippon Express Holdings Inc | 431,224 |
| 52,300 | Nippon Yusen KK(c) | 1,615,208 |
| 69,600 | Obayashi Corp | 601,234 |
| Shares | Fair Value | |
| Industrial — (continued) | ||
| 33,500 | Odakyu Electric Railway Co Ltd | $ 510,131 |
| 18,400 | Omron Corp | 856,206 |
| 49,609 | Orica Ltd | 539,262 |
| 56,701 | Poste Italiane SpA(a) | 644,504 |
| 28,605 | Prysmian SpA | 1,303,958 |
| 4,709 | Rheinmetall AG | 1,493,392 |
| 991 | ROCKWOOL A/S Class B | 289,939 |
| 902,370 | Rolls-Royce Holdings PLC(b) | 3,440,821 |
| 8,315 | Saab AB Class B | 501,092 |
| 36,645 | Safran SA | 6,460,882 |
| 115,166 | Sandvik AB | 2,502,022 |
| 6,963 | Schindler Holding AG | 1,710,419 |
| 58,343 | Schneider Electric SE | 11,744,781 |
| 34,800 | SG Holdings Co Ltd | 498,889 |
| 24,700 | Shimadzu Corp | 688,711 |
| 57,400 | Shimizu Corp | 380,753 |
| 81,480 | Siemens AG | 15,286,375 |
| 54,868 | Siemens Energy AG(b) | 725,148 |
| 31,992 | SIG Group AG | 736,808 |
| 16,344 | Sika AG | 5,329,389 |
| 172,200 | Singapore Technologies Engineering Ltd | 507,078 |
| 139,000 | SITC International Holdings Co Ltd | 239,918 |
| 37,392 | Skanska AB Class B | 677,453 |
| 36,069 | SKF AB Class B | 722,843 |
| 6,200 | SMC Corp | 3,316,604 |
| 36,709 | Smiths Group PLC | 823,715 |
| 8,054 | Spirax-Sarco Engineering PLC | 1,077,076 |
| 61,988 | Stora Enso OYJ Class R | 858,877 |
| 65,390 | Svenska Cellulosa AB SCA Class B | 982,319 |
| 18,700 | Taisei Corp | 638,565 |
| 41,800 | TDK Corp | 1,982,339 |
| 148,500 | Techtronic Industries Co Ltd | 1,769,391 |
| 50,045 | Tenaris SA | 870,440 |
| 11,347 | Thales SA | 1,680,178 |
| 20,100 | Tobu Railway Co Ltd | 539,270 |
| 53,200 | Tokyu Corp | 648,672 |
| 13,800 | TOTO Ltd | 362,522 |
| 2,937 | VAT Group AG(a) | 1,475,132 |
| 54,657 | Vinci SA | 6,878,310 |
| 51,283 | Wartsila OYJ Abp | 745,315 |
| 23,600 | West Japan Railway Co | 983,374 |
| 168,000 | Xinyi Glass Holdings Ltd | 188,695 |
| 28,600 | Yamato Holdings Co Ltd | 527,770 |
| 27,200 | Yaskawa Electric Corp | 1,132,115 |
| 24,900 | Yokogawa Electric Corp | 473,299 |
| 250,001,374 | ||
| Technology — 6.64% | ||
| 82,200 | Advantest Corp | 2,769,775 |
| 5,055 | ASM International NV | 2,630,994 |
| 43,251 | ASML Holding NV | 32,649,566 |
| 14,700 | BayCurrent Consulting Inc | 514,588 |
See Notes to Financial Statements.
Annual Report - December 31, 2023
EMPOWER FUNDS, INC.
EMPOWER INTERNATIONAL INDEX FUND
Schedule of Investments
As of December 31, 2023
| Shares | Fair Value | |
| Technology — (continued) | ||
| 8,137 | BE Semiconductor Industries NV | $ 1,228,489 |
| 8,671 | Bechtle AG | 434,308 |
| 107,300 | Canon Inc(c) | 2,752,645 |
| 18,600 | Capcom Co Ltd | 600,236 |
| 16,891 | Capgemini SE | 3,530,070 |
| 9,976 | Check Point Software Technologies Ltd(b) | 1,524,233 |
| 4,435 | CyberArk Software Ltd(b) | 971,487 |
| 71,830 | Dassault Systemes SE | 3,515,879 |
| 10,000 | Disco Corp | 2,469,668 |
| 18,900 | Fujitsu Ltd | 2,844,331 |
| 9,408 | Global-e Online Ltd(b) | 372,839 |
| 15,100 | Hamamatsu Photonics KK | 619,519 |
| 140,010 | Infineon Technologies AG | 5,847,171 |
| 12,940 | Koei Tecmo Holdings Co Ltd | 147,413 |
| 10,800 | Konami Group Corp | 564,173 |
| 8,300 | Lasertec Corp(b) | 2,178,971 |
| 17,765 | Logitech International SA | 1,689,245 |
| 3,047 | Monday.com Ltd(b) | 572,257 |
| 26,100 | NEC Corp | 1,542,149 |
| 6,062 | Nemetschek SE | 523,360 |
| 35,800 | Nexon Co Ltd(c) | 651,170 |
| 42,469 | Nomura Research Institute Ltd | 1,233,416 |
| 66,200 | NTT Data Group Corp | 935,780 |
| 7,500 | Obic Co Ltd | 1,290,413 |
| 4,000 | Oracle Corp Japan | 307,917 |
| 12,100 | Otsuka Corp | 497,975 |
| 159,200 | Renesas Electronics Corp(b) | 2,846,650 |
| 58,900 | Ricoh Co Ltd | 451,087 |
| 37,400 | Rohm Co Ltd | 713,994 |
| 109,899 | Sage Group PLC | 1,639,960 |
| 111,952 | SAP SE | 17,231,796 |
| 16,200 | SCSK Corp | 320,734 |
| 31,400 | Seiko Epson Corp | 468,831 |
| 8,900 | Square Enix Holdings Co Ltd | 319,065 |
| 73,274 | STMicroelectronics NV | 3,675,342 |
| 38,400 | SUMCO Corp(c) | 574,432 |
| 6,506 | Teleperformance SE | 952,524 |
| 6,952 | Temenos AG | 647,845 |
| 23,400 | TIS Inc(b) | 514,315 |
| 50,500 | Tokyo Electron Ltd | 8,975,864 |
| 17,416 | WiseTech Global Ltd | 892,649 |
| 15,797 | Xero Ltd(b) | 1,205,129 |
| 118,840,254 | ||
| Utilities — 3.28% | ||
| 2,192 | BKW AG | 389,885 |
| 596,674 | Centrica PLC | 1,069,278 |
| 68,000 | Chubu Electric Power Co Inc | 877,972 |
| 177,500 | CLP Holdings Ltd | 1,466,526 |
| 241,553 | E.ON SE | 3,245,273 |
| 339,280 | EDP - Energias de Portugal SA | 1,707,593 |
| 33,639 | EDP Renovaveis SA | 688,633 |
| 3,053 | Elia Group SA | 382,158 |
| 26,952 | Enagas SA(c) | 454,661 |
| Shares | Fair Value | |
| Utilities — (continued) | ||
| 33,176 | Endesa SA | $ 676,826 |
| 871,986 | Enel SpA(b) | 6,487,400 |
| 195,818 | Engie SA | 3,449,582 |
| 47,091 | Fortum OYJ(b) | 680,188 |
| 1,175,229 | Hong Kong & China Gas Co Ltd(c) | 901,147 |
| 652,725 | Iberdrola SA(b) | 8,561,625 |
| 80,300 | Kansai Electric Power Co Inc | 1,065,749 |
| 78,004 | Mercury NZ Ltd | 325,448 |
| 133,408 | Meridian Energy Ltd(c) | 467,156 |
| 402,302 | National Grid PLC | 5,416,969 |
| 14,158 | Naturgy Energy Group SA | 422,293 |
| 185,844 | Origin Energy Ltd | 1,072,448 |
| 19,856 | Orsted AS(a) | 1,100,749 |
| 40,400 | Osaka Gas Co Ltd | 843,329 |
| 148,500 | Power Assets Holdings Ltd | 860,959 |
| 42,501 | Redeia Corp SA | 700,357 |
| 67,785 | RWE AG | 3,085,086 |
| 99,300 | Sembcorp Industries Ltd | 399,136 |
| 28,606 | Severn Trent PLC | 940,329 |
| 217,140 | Snam SpA | 1,117,166 |
| 116,898 | SSE PLC | 2,758,747 |
| 154,617 | Terna - Rete Elettrica Nazionale | 1,289,914 |
| 163,600 | Tokyo Electric Power Co Holdings Inc(b) | 856,139 |
| 42,000 | Tokyo Gas Co Ltd | 963,424 |
| 74,109 | United Utilities Group PLC | 1,000,611 |
| 72,862 | Veolia Environnement SA | 2,302,920 |
| 7,347 | Verbund AG | 680,856 |
| 58,708,532 | ||
| TOTAL COMMON STOCK — 96.69% (Cost $1,517,831,055) | $1,730,045,177 | |
| PREFERRED STOCK | ||
| Consumer, Cyclical — 0.29% | ||
| 6,068 | Bayerische Motoren Werke AG | 603,782 |
| 12,366 | Dr Ing hc F Porsche AG | 1,089,160 |
| 16,904 | Porsche Automobil Holding SE | 863,823 |
| 22,107 | Volkswagen AG | 2,724,822 |
| 5,281,587 | ||
| Consumer, Non-Cyclical — 0.08% | ||
| 18,440 | Henkel AG & Co KGaA | 1,483,348 |
| Industrial — 0.06% | ||
| 2,750 | Sartorius AG | 1,009,855 |
| TOTAL PREFERRED STOCK — 0.43% (Cost $8,854,634) | $ 7,774,790 | |
See Notes to Financial Statements.
Annual Report - December 31, 2023
EMPOWER FUNDS, INC.
EMPOWER INTERNATIONAL INDEX FUND
Schedule of Investments
As of December 31, 2023
| Shares | Fair Value | |
| RIGHTS | ||
| Industrial — 0.00%(e) | ||
| 13,981 | ACS Actividades de Construccion y Servicios SA(b)(d) | $ 19,290 |
| TOTAL RIGHTS — 0.00%(e) (Cost $20,503) | $ 19,290 | |
| Principal Amount | ||
| SHORT TERM INVESTMENTS | ||
| U.S. Treasury Bonds and Notes — 1.38% | ||
| $24,812,400 | U.S. Treasury Bills(f) 5.30%, 02/22/2024 | 24,616,805 |
| Repurchase Agreements — 2.64% | ||
| 1 | Undivided interest of 0.00% in a repurchase agreement (principal amount/value $7,826,153 with a maturity value of $7,830,805) with TD Securities (USA) LLC, 5.35%, dated 12/31/23 to be repurchased at $1 on 1/2/24 collateralized by various U.S. Government Agency securities, 2.50% - 7.00%, 7/1/37 - 1/1/54, with a value of $7,982,676.(g) | 1 |
| 11,823,833 | Undivided interest of 12.66% in a repurchase agreement (principal amount/value $93,637,100 with a maturity value of $93,692,762) with Bank of America Securities Inc, 5.35%, dated 12/31/23 to be repurchased at $11,823,833 on 1/2/24 collateralized by various U.S. Government Agency securities, 0.00% - 7.00%, 11/1/28 - 12/20/63, with a value of $95,509,842.(g) | 11,823,833 |
| 11,823,833 | Undivided interest of 14.14% in a repurchase agreement (principal amount/value $83,874,265 with a maturity value of $83,924,030) with Bank of Montreal, 5.34%, dated 12/31/23 to be repurchased at $11,823,833 on 1/2/24 collateralized by various U.S. Government Agency securities, 4.50% - 6.50%, 12/1/38 - 12/1/53, with a value of $85,551,750.(g) | 11,823,833 |
| Principal Amount | Fair Value | |
| Repurchase Agreements — (continued) | ||
| $11,823,833 | Undivided interest of 9.84% in a repurchase agreement (principal amount/value $120,466,826 with a maturity value of $120,538,303) with RBC Capital Markets Corp, 5.34%, dated 12/31/23 to be repurchased at $11,823,833 on 1/2/24 collateralized by U.S. Treasury securities and various U.S. Government Agency securities, 0.00% - 7.50%, 1/15/24 - 12/1/53, with a value of $122,876,165.(g) | $ 11,823,833 |
| 11,823,833 | Undivided interest of 9.99% in a repurchase agreement (principal amount/value $118,664,201 with a maturity value of $118,734,608) with Citigroup Global Markets Inc, 5.34%, dated 12/31/23 to be repurchased at $11,823,833 on 1/2/24 collateralized by Government National Mortgage Association securities, 2.00% - 7.50%, 7/20/37 - 12/20/53, with a value of $121,037,485.(g) | 11,823,833 |
| 47,295,333 | ||
| TOTAL SHORT TERM INVESTMENTS — 4.02% (Cost $71,912,138) | $ 71,912,138 | |
| TOTAL INVESTMENTS — 101.14% (Cost $1,598,618,330) | $1,809,751,395 | |
| OTHER ASSETS & LIABILITIES, NET — (1.14)% | $ (20,447,506) | |
| TOTAL NET ASSETS — 100.00% | $1,789,303,889 | |
See Notes to Financial Statements.
Annual Report - December 31, 2023
EMPOWER FUNDS, INC.
EMPOWER INTERNATIONAL INDEX FUND
Schedule of Investments
As of December 31, 2023
| (a) | Represents securities sold under Rule 144A, which are exempt from registration under the Securities Act of 1933, as amended. |
| (b) | Non-income producing security. |
| (c) | All or a portion of the security is on loan at December 31, 2023. |
| (d) | Security is fair valued using significant unobservable inputs. |
| (e) | Represents less than 0.005% of net assets. |
| (f) | Zero coupon bond; the interest rate shown is the effective yield on date of purchase. |
| (g) | Collateral received for securities on loan. |
| ADR | American Depositary Receipt |
| REIT | Real Estate Investment Trust |
| At December 31, 2023 the Fund held the following outstanding exchange traded futures contracts: | |||||
| Description | Number of Contracts | Notional Amount (000) | Expiration Date | Fair Value and Net Unrealized Appreciation | |
| Long | |||||
| MSCI EAFE Index Futures | 463 | USD | 52,143 | Mar 2024 | $1,727,921 |
| Net Appreciation | $1,727,921 | ||||
| At December 31, 2023 the Fund held the following over-the-counter (OTC) forward foreign currency contracts: | ||||||
| Counterparty | Currency Purchased | Quantity of Currency Purchased | Currency Sold | Quantity of Currency Sold | Settlement Date | Net Unrealized Appreciation/ (Depreciation) |
| CGM | USD | 57,717 | AUD | 84,220 | 02/13/2024 | $240 |
| CGM | USD | 15,887 | AUD | 23,176 | 02/23/2024 | 66 |
| CGM | USD | 54,122 | AUD | 78,939 | 02/29/2024 | 226 |
| CGM | USD | 20,638 | AUD | 30,089 | 03/14/2024 | 86 |
| CGM | USD | 15,665 | EUR | 14,099 | 01/02/2024 | 98 |
| CGM | USD | 121,158 | EUR | 110,972 | 02/02/2024 | (1,531) |
| CGM | USD | 8,823 | GBP | 7,063 | 01/02/2024 | (180) |
| CGM | USD | 16,943 | GBP | 13,370 | 01/10/2024 | (101) |
| CGM | USD | 172,178 | GBP | 138,047 | 01/11/2024 | (3,800) |
| CGM | USD | 56,845 | GBP | 45,066 | 01/12/2024 | (604) |
| CGM | USD | 9,502 | GBP | 7,588 | 01/26/2024 | (172) |
| CGM | USD | 182,166 | GBP | 143,766 | 02/01/2024 | (1,128) |
| CGM | USD | 25,254 | GBP | 19,797 | 02/02/2024 | 14 |
| CGM | USD | 5,289 | GBP | 4,173 | 02/06/2024 | (32) |
| CGM | USD | 7,202 | JPY | 1,054,699 | 02/15/2024 | (333) |
| CGM | USD | 5,274 | JPY | 742,900 | 03/06/2024 | (51) |
| CGM | USD | 8,286 | JPY | 1,166,965 | 03/08/2024 | (80) |
| CGM | USD | 4,245 | JPY | 597,550 | 03/11/2024 | (41) |
| CGM | USD | 11,246 | JPY | 1,582,530 | 03/13/2024 | (109) |
| CGM | USD | 19,032 | JPY | 2,677,330 | 03/15/2024 | (185) |
| CGM | USD | 21,124 | JPY | 2,967,137 | 03/25/2024 | (207) |
| CGM | USD | 128,957 | JPY | 18,107,975 | 03/27/2024 | (1,269) |
| CGM | USD | 225,020 | JPY | 31,592,205 | 03/28/2024 | (2,216) |
| MEL | USD | 3,095,628 | CHF | 2,789,000 | 01/11/2024 | (225,174) |
| MEL | USD | 1,449,381 | EUR | 1,371,000 | 01/11/2024 | (64,980) |
| MEL | USD | 19,332 | GBP | 15,425 | 01/03/2024 | (330) |
| Net Depreciation | $(301,793) | |||||
| Counterparty Abbreviations | ||
| CGM | Citigroup Global Markets | |
| MEL | Mellon Capital | |
See Notes to Financial Statements.
Annual Report - December 31, 2023
EMPOWER FUNDS, INC.
EMPOWER INTERNATIONAL INDEX FUND
Schedule of Investments
As of December 31, 2023
| Currency Abbreviations | ||
| AUD | Australian Dollar | |
| CHF | Swiss Franc | |
| EUR | Euro Dollar | |
| GBP | British Pound | |
| JPY | Japanese Yen | |
| USD | U.S. Dollar | |
Summary of Investments by Country as of December 31, 2023.
| Country | Fair Value | Percentage of Fund Investments | |
| Japan | $ 388,856,836 | 21.49% | |
| United Kingdom | 235,725,341 | 13.03 | |
| France | 206,328,560 | 11.40 | |
| Switzerland | 183,307,366 | 10.13 | |
| Germany | 148,032,573 | 8.18 | |
| Australia | 129,260,552 | 7.14 | |
| Netherlands | 85,504,224 | 4.72 | |
| United States | 71,912,138 | 3.97 | |
| Denmark | 58,206,910 | 3.22 | |
| Sweden | 55,830,017 | 3.08 | |
| Spain | 47,164,438 | 2.61 | |
| Hong Kong | 40,490,770 | 2.24 | |
| Italy | 39,463,971 | 2.18 | |
| Singapore | 24,009,512 | 1.33 | |
| Ireland | 22,711,204 | 1.25 | |
| Finland | 18,812,084 | 1.04 | |
| Belgium | 14,129,303 | 0.78 | |
| Israel | 11,985,330 | 0.66 | |
| Norway | 11,732,430 | 0.65 | |
| New Zealand | 4,311,024 | 0.24 | |
| Luxembourg | 3,413,393 | 0.19 | |
| Austria | 3,259,835 | 0.18 | |
| Portugal | 3,258,290 | 0.18 | |
| Chile | 884,778 | 0.05 | |
| Macau | 745,791 | 0.04 | |
| Jordan | 414,267 | 0.02 | |
| United Arab Emirates | 458 | 0.00 | |
| Total | $1,809,751,395 | 100.00% |
See Notes to Financial Statements.
Annual Report - December 31, 2023
EMPOWER FUNDS, INC.
EMPOWER INTERNATIONAL VALUE FUND
Schedule of Investments
As of December 31, 2023
| Shares | Fair Value | |
| COMMON STOCK | ||
| Basic Materials — 7.46% | ||
| 79,090 | Agnico Eagle Mines Ltd | $ 4,336,350 |
| 79,300 | Anglo American PLC | 1,984,414 |
| 26,300 | Arkema SA | 2,996,035 |
| 334,500 | BlueScope Steel Ltd | 5,332,753 |
| 63,000 | Boliden AB | 1,971,870 |
| 39,518 | Croda International PLC | 2,540,944 |
| 130,400 | Fortescue Ltd | 2,571,140 |
| 142,697 | Franco-Nevada Corp | 15,805,923 |
| 1,245 | Givaudan SA | 5,162,656 |
| 1,364,679 | Glencore PLC | 8,202,270 |
| 242,600 | ICL Group Ltd | 1,219,709 |
| 75,800 | Kaneka Corp | 1,921,389 |
| 710,000 | Kingboard Holdings Ltd | 1,698,023 |
| 347,200 | Mitsubishi Chemical Group Corp | 2,122,475 |
| 114,700 | Mitsubishi Gas Chemical Co Inc | 1,831,225 |
| 120,900 | Mitsui Chemicals Inc | 3,575,256 |
| 47,700 | Nippon Soda Co Ltd(a) | 1,833,451 |
| 31,700 | Nitto Denko Corp | 2,365,619 |
| 66,270 | Novozymes A/S Class B | 3,643,087 |
| 311,900 | Outokumpu OYJ(b) | 1,547,666 |
| 64,200 | Rio Tinto Ltd | 5,944,776 |
| 40,711 | Symrise AG | 4,473,951 |
| 158,900 | Tokuyama Corp | 2,688,604 |
| 120,465 | Wheaton Precious Metals Corp | 5,943,019 |
| 58,600 | Yara International ASA | 2,081,861 |
| 93,794,466 | ||
| Communications — 2.73% | ||
| 1,430,200 | Airtel Africa PLC(c) | 2,370,581 |
| 2,511,000 | BT Group PLC | 3,954,692 |
| 100,500 | M3 Inc(a) | 1,658,481 |
| 9,812 | Nice Ltd Sponsored ADR(a) | 1,957,592 |
| 1,829,100 | Nippon Telegraph & Telephone Corp | 2,233,486 |
| 615,100 | Nokia OYJ | 2,094,985 |
| 192,200 | Orange SA | 2,190,624 |
| 224,800 | ProSiebenSat.1 Media SE(b) | 1,371,358 |
| 262,200 | Telefonaktiebolaget LM Ericsson Class B | 1,650,072 |
| 536,700 | Telefonica SA(b) | 2,098,425 |
| 302,800 | Television Francaise 1 SA(b) | 2,385,055 |
| 69,200 | United Internet AG | 1,760,099 |
| 60,541 | Wolters Kluwer NV | 8,613,120 |
| 34,338,570 | ||
| Consumer, Cyclical — 12.25% | ||
| 21,813 | adidas AG | 4,432,541 |
| 121,685 | Associated British Foods PLC | 3,665,913 |
| 308,300 | Barratt Developments PLC | 2,207,722 |
| 68,500 | Bayerische Motoren Werke AG | 7,622,093 |
| 23,379 | Bellway PLC | 763,040 |
| 214,000 | Betsson AB Class B | 2,305,268 |
| Shares | Fair Value | |
| Consumer, Cyclical — (continued) | ||
| 23,037 | Cie Financiere Richemont SA | $ 3,181,965 |
| 90,400 | Cie Generale des Etablissements Michelin SCA | 3,247,753 |
| 360,400 | Citizen Watch Co Ltd(a) | 2,143,396 |
| 52,100 | Daimler Truck Holding AG | 1,957,084 |
| 81,200 | Daiwa House Industry Co Ltd | 2,454,708 |
| 109,400 | Daiwabo Holdings Co Ltd(a) | 2,389,289 |
| 218,800 | EDION Corp(b) | 2,437,803 |
| 1,112,900 | Harvey Norman Holdings Ltd(b) | 3,186,325 |
| 394,500 | Honda Motor Co Ltd | 4,069,354 |
| 440,100 | International Consolidated Airlines Group SA(a) | 751,825 |
| 198,100 | Isuzu Motors Ltd | 2,539,578 |
| 59,100 | ITOCHU Corp(b) | 2,407,725 |
| 152,400 | Jardine Cycle & Carriage Ltd | 3,434,710 |
| 100,400 | JB Hi-Fi Ltd | 3,628,349 |
| 38,900 | Kaufman & Broad SA(a) | 1,295,475 |
| 204,200 | Kindred Group PLC | 1,889,665 |
| 1,038,600 | Kingfisher PLC | 3,216,656 |
| 80,000 | Kohnan Shoji Co Ltd(a) | 2,224,700 |
| 226,400 | K's Holdings Corp | 2,119,507 |
| 3,466 | LVMH Moet Hennessy Louis Vuitton SE | 2,816,248 |
| 136,600 | Marubeni Corp | 2,150,705 |
| 93,100 | Mercedes-Benz Group AG | 6,423,687 |
| 135,600 | Mitsubishi Corp | 2,160,008 |
| 71,700 | Mitsui & Co Ltd | 2,686,166 |
| 190,100 | Okamura Corp | 2,931,694 |
| 38,000 | Pandora A/S | 5,253,695 |
| 415,400 | Pets at Home Group PLC | 1,683,775 |
| 603,400 | Pirelli & C SpA(c) | 3,292,298 |
| 453,600 | Qantas Airways Ltd(a) | 1,661,543 |
| 366,400 | Redrow PLC | 2,867,511 |
| 170,200 | Rexel SA | 4,671,339 |
| 44,571 | Ryanair Holdings PLC Sponsored ADR(a) | 5,943,989 |
| 166,012 | Stellantis NV | 3,893,874 |
| 158,100 | Subaru Corp | 2,883,651 |
| 119,900 | Sumitomo Corp | 2,609,223 |
| 143,100 | Sumitomo Forestry Co Ltd(b) | 4,251,653 |
| 202,900 | Super Retail Group Ltd(a) | 2,180,432 |
| 14,500 | Swatch Group AG | 3,945,307 |
| 112,500 | Tokmanni Group Corp | 1,817,611 |
| 153,500 | Toyota Boshoku Corp | 2,427,191 |
| 312,100 | Volvo AB Class B | 8,120,844 |
| 303,600 | Yamaha Motor Co Ltd(b) | 2,701,543 |
| 108,600 | Yokohama Rubber Co Ltd(b) | 2,481,869 |
| 627,500 | Yue Yuen Industrial Holdings Ltd | 695,466 |
| 80,798 | Zalando SE(a)(c) | 1,912,849 |
| 154,036,615 | ||
| Consumer, Non-Cyclical — 19.97% | ||
| 53,300 | Adecco Group AG | 2,617,751 |
| 62,814 | Agilent Technologies Inc | 8,733,030 |
| 116,051 | Amadeus IT Group SA | 8,334,946 |
See Notes to Financial Statements.
Annual Report - December 31, 2023
EMPOWER FUNDS, INC.
EMPOWER INTERNATIONAL VALUE FUND
Schedule of Investments
As of December 31, 2023
| Shares | Fair Value | |
| Consumer, Non-Cyclical — (continued) | ||
| 52,700 | Arcs Co Ltd(a) | $ 1,038,527 |
| 213,898 | Bayer AG | 7,936,439 |
| 38,176 | Beiersdorf AG | 5,717,027 |
| 100,000 | British American Tobacco PLC | 2,925,278 |
| 78,784 | Bruker Corp | 5,789,048 |
| 127,700 | Carrefour SA | 2,338,776 |
| 188 | Chocoladefabriken Lindt & Spruengli AG | 2,256,682 |
| 357,000 | CK Hutchison Holdings Ltd | 1,918,019 |
| 152,200 | Coca-Cola HBC AG | 4,467,098 |
| 304,122 | Diageo PLC | 11,036,217 |
| 318,400 | Elders Ltd(b) | 1,635,004 |
| 40,709 | EssilorLuxottica SA | 8,174,300 |
| 195,929 | Experian PLC | 7,990,485 |
| 81,600 | Ezaki Glico Co Ltd(b) | 2,415,173 |
| 42,800 | Fresenius SE & Co KGaA | 1,326,607 |
| 505,000 | GSK PLC | 9,325,651 |
| 2,650,914 | Haleon PLC | 10,851,863 |
| 206,700 | Imperial Brands PLC | 4,758,522 |
| 100,249 | Intertek Group PLC | 5,425,858 |
| 33,800 | Ipsen SA | 4,031,971 |
| 57,160 | Itoham Yonekyu Holdings Inc | 1,562,187 |
| 841,400 | J Sainsbury PLC | 3,242,877 |
| 146,600 | Koninklijke Ahold Delhaize NV | 4,217,886 |
| 13,800 | Kose Corp(b) | 1,031,485 |
| 179,200 | Lion Corp(b) | 1,661,883 |
| 10,583 | L'Oreal SA | 5,275,623 |
| 58,700 | Megmilk Snow Brand Co Ltd | 879,964 |
| 716,900 | Metcash Ltd | 1,705,601 |
| 101,500 | Mowi ASA | 1,817,638 |
| 16,510 | Nestle SA | 1,913,837 |
| 175,400 | Novartis AG | 17,717,240 |
| 240,376 | Ocado Group PLC(a)(b) | 2,321,403 |
| 246,300 | Olympus Corp | 3,555,163 |
| 96,800 | Ono Pharmaceutical Co Ltd | 1,722,025 |
| 64,867 | Pernod Ricard SA | 11,463,390 |
| 38,900 | Randstad NV | 2,441,362 |
| 50,324 | Roche Holding AG | 14,628,863 |
| 318,900 | Rohto Pharmaceutical Co Ltd | 6,412,856 |
| 43,880 | Sandoz Group AG(a) | 1,411,798 |
| 77,700 | Sanofi SA | 7,721,248 |
| 64,500 | Santen Pharmaceutical Co Ltd | 641,722 |
| 124,000 | Scandinavian Tobacco Group A/S(c) | 2,153,983 |
| 225,300 | Securitas AB Class B(b) | 2,208,840 |
| 64,931 | SGS SA | 5,605,546 |
| 37,200 | Shionogi & Co Ltd | 1,790,361 |
| 27,900 | Societe BIC SA(b) | 1,937,552 |
| 1,981,700 | Sonae SGPS SA(a) | 1,980,042 |
| 92,100 | Suedzucker AG | 1,442,902 |
| 1,283,400 | Tesco PLC | 4,753,003 |
| 151,100 | Toyo Suisan Kaisha Ltd | 7,796,204 |
| 1,986,000 | United Laboratories International Holdings Ltd | 1,784,045 |
| Shares | Fair Value | |
| Consumer, Non-Cyclical — (continued) | ||
| 8,218,751 | WH Group Ltd(c) | $ 5,307,665 |
| 251,150,466 | ||
| Energy — 6.78% | ||
| 226,280 | Aker BP ASA | 6,572,893 |
| 2,224,300 | Beach Energy Ltd | 2,428,455 |
| 510,100 | BP PLC | 3,023,582 |
| 173,600 | Eni SpA | 2,944,492 |
| 251,930 | Galp Energia SGPS SA | 3,706,809 |
| 692,100 | New Hope Corp Ltd | 2,435,594 |
| 45,500 | OMV AG | 1,996,203 |
| 285,256 | Petroleo Brasileiro SA Sponsored ADR | 4,358,712 |
| 357,500 | Repsol SA | 5,303,119 |
| 375,800 | Shell PLC | 12,299,065 |
| 427,832 | TotalEnergies SE | 29,092,098 |
| 525,319 | Woodside Energy Group Ltd | 11,092,956 |
| 85,253,978 | ||
| Financial — 20.78% | ||
| 214,600 | 3i Group PLC | 6,602,549 |
| 220,600 | ABN AMRO Bank NV(c) | 3,317,484 |
| 457,600 | Aegon Ltd | 2,660,503 |
| 2,926,397 | AIB Group PLC | 12,533,033 |
| 10,500 | Allianz SE | 2,806,028 |
| 134,826 | ANZ Group Holdings Ltd | 2,382,108 |
| 59,400 | ASR Nederland NV(a) | 2,806,046 |
| 438,200 | Aviva PLC | 2,424,190 |
| 140,600 | AXA SA | 4,591,488 |
| 12,400 | Baloise Holding AG | 1,944,176 |
| 447,900 | Banco Bilbao Vizcaya Argentaria SA | 4,082,269 |
| 773,300 | Banco Santander SA | 3,234,463 |
| 235,700 | Bank Leumi Le-Israel BM | 1,896,873 |
| 1,113,254 | Bank of Ireland Group PLC | 10,106,606 |
| 1,130,100 | Barclays PLC | 2,212,522 |
| 41,400 | BAWAG Group AG(c) | 2,190,930 |
| 64,700 | BNP Paribas SA | 4,493,128 |
| 2,549,686 | CaixaBank SA | 10,500,448 |
| 640,100 | Chiba Bank Ltd(a) | 4,611,673 |
| 236,100 | Credit Agricole SA | 3,356,545 |
| 123,100 | Danske Bank A/S | 3,290,623 |
| 85,700 | DBS Group Holdings Ltd | 2,167,253 |
| 97,300 | Deutsche Bank AG | 1,328,249 |
| 65,986 | Deutsche Boerse AG | 13,588,786 |
| 113,800 | DNB Bank ASA | 2,419,530 |
| 100,800 | Eurocommercial Properties NV REIT(a) | 2,471,846 |
| 69,896 | Euronext NV(c) | 6,074,413 |
| 82,000 | Fukuoka Financial Group Inc | 1,928,751 |
| 600,500 | Gunma Bank Ltd | 2,931,891 |
| 196,600 | Hachijuni Bank Ltd | 1,092,961 |
| 1,117,900 | Helia Group Ltd | 3,315,921 |
| 3,030 | Helvetia Holding AG | 417,797 |
| 225,096 | Hiscox Ltd | 3,021,250 |
| 219,900 | ING Groep NV | 3,297,294 |
| 486,800 | Japan Post Holdings Co Ltd | 4,345,890 |
See Notes to Financial Statements.
Annual Report - December 31, 2023
EMPOWER FUNDS, INC.
EMPOWER INTERNATIONAL VALUE FUND
Schedule of Investments
As of December 31, 2023
| Shares | Fair Value | |
| Financial — (continued) | ||
| 114,229 | Julius Baer Group Ltd | $ 6,408,027 |
| 38,172 | Jyske Bank A/S | 2,737,197 |
| 19,002 | LEG Immobilien SE(a) | 1,662,853 |
| 5,601,600 | Lloyds Banking Group PLC | 3,397,217 |
| 821,280 | Mebuki Financial Group Inc | 2,491,979 |
| 243,300 | Mediobanca Banca di Credito Finanziario SpA | 3,014,912 |
| 547,700 | Mitsubishi HC Capital Inc | 3,669,483 |
| 386,700 | Mitsubishi UFJ Financial Group Inc | 3,318,712 |
| 166,600 | Mizuho Financial Group Inc | 2,841,832 |
| 5,221,423 | NatWest Group PLC | 14,537,130 |
| 34,900 | NN Group NV | 1,379,275 |
| 473,800 | Nomura Holdings Inc | 2,133,793 |
| 269,700 | Nordea Bank Abp | 3,348,164 |
| 293,400 | North Pacific Bank Ltd | 736,514 |
| 238,400 | ORIX Corp | 4,477,435 |
| 2,085,500 | Resona Holdings Inc | 10,572,100 |
| 90,600 | Societe Generale SA | 2,410,438 |
| 676,600 | Stockland REIT(a) | 2,051,879 |
| 54,800 | Sumitomo Mitsui Financial Group Inc | 2,666,560 |
| 128,900 | Swedbank AB Class A | 2,606,056 |
| 8,300 | Swiss Life Holding AG | 5,768,113 |
| 119,317 | Sydbank AS(a) | 5,189,515 |
| 63,478 | TAG Immobilien AG(a) | 922,897 |
| 588,298 | UBS Group AG | 18,273,468 |
| 802,300 | UnipolSai Assicurazioni SpA | 2,004,822 |
| 139,800 | United Overseas Bank Ltd | 3,017,333 |
| 136,856 | Vonovia SE | 4,300,240 |
| 20,640 | Willis Towers Watson PLC | 4,978,368 |
| 261,361,829 | ||
| Industrial — 17.66% | ||
| 82,100 | AGC Inc(b) | 3,042,988 |
| 250,800 | Alps Alpine Co Ltd | 2,180,075 |
| 217,000 | Amada Co Ltd | 2,255,733 |
| 176,500 | BAE Systems PLC | 2,497,228 |
| 57,900 | Bekaert SA | 2,975,906 |
| 104,400 | Bouygues SA | 3,938,925 |
| 248,400 | bpost SA | 1,278,965 |
| 115,700 | Brother Industries Ltd | 1,842,523 |
| 6,400 | Bucher Industries AG | 2,690,310 |
| 38,300 | Cargotec OYJ Class B | 2,234,149 |
| 85,700 | Cia de Distribucion Integral Logista Holdings SA | 2,317,736 |
| 95,930 | Cie de Saint-Gobain SA | 7,074,565 |
| 149,648 | CRH PLC | 10,349,656 |
| 15,647 | D/S Norden A/S | 744,167 |
| 97,500 | Deutsche Post AG | 4,825,857 |
| 25,700 | Dfds A/S | 848,673 |
| 256,057 | Epiroc AB Class A | 5,154,145 |
| 618,323 | Firstgroup PLC | 1,378,494 |
| 295,400 | Fujikura Ltd | 2,263,971 |
| 131,575 | GEA Group AG(a) | 5,470,112 |
| 329,800 | Hazama Ando Corp | 2,604,898 |
| 51,000 | Heidelberg Materials AG | 4,558,788 |
| 56,879 | Hirose Electric Co Ltd | 6,423,825 |
| Shares | Fair Value | |
| Industrial — (continued) | ||
| 96,800 | Holcim AG | $ 7,602,810 |
| 111,300 | Hosiden Corp | 1,354,313 |
| 436,042 | IMI PLC | 9,337,716 |
| 101,400 | Kamigumi Co Ltd | 2,416,429 |
| 100,400 | Kinden Corp | 1,703,243 |
| 62,947 | Knorr-Bremse AG | 4,065,449 |
| 111,100 | Komatsu Ltd | 2,891,193 |
| 152,106 | Legrand SA | 15,839,723 |
| 150,800 | Leonardo SpA | 2,491,680 |
| 226,800 | Metsa Board OYJ Class B(a)(b) | 1,804,745 |
| 631,800 | Mitsubishi Electric Corp | 8,936,233 |
| 35,400 | Nichiha Corp(a) | 742,528 |
| 227,900 | QinetiQ Group PLC | 896,619 |
| 266,700 | Rengo Co Ltd | 1,775,310 |
| 32,200 | Sankyu Inc(a) | 1,180,255 |
| 20,697 | Schindler Holding AG | 5,181,595 |
| 105,990 | Schneider Electric SE | 21,336,395 |
| 140,200 | Seino Holdings Co Ltd | 2,123,398 |
| 300,400 | Shimadzu Corp | 8,376,064 |
| 92,300 | Signify NV(c) | 3,095,388 |
| 16,484 | Sika AG | 5,375,040 |
| 148,300 | SKF AB Class B | 2,972,015 |
| 15,500 | SMC Corp | 8,291,509 |
| 33,794 | Spirax-Sarco Engineering PLC | 4,519,334 |
| 121,400 | Sumitomo Heavy Industries Ltd(b) | 3,051,405 |
| 225,450 | Svenska Cellulosa AB SCA Class B | 3,386,815 |
| 75,000 | Taisei Corp | 2,561,091 |
| 27,600 | Takeuchi Manufacturing Co Ltd(a) | 835,610 |
| 34,200 | Tsubakimoto Chain Co(a) | 979,008 |
| 44,500 | Verallia SA(c) | 1,714,440 |
| 109,600 | Wienerberger AG | 3,651,735 |
| 138,600 | Yokogawa Electric Corp | 2,634,505 |
| 222,075,282 | ||
| Technology — 9.02% | ||
| 47,203 | Analog Devices Inc | 9,372,628 |
| 12,615 | ANSYS Inc(a) | 4,577,731 |
| 5,788 | ASML Holding NV | 4,369,279 |
| 63,082 | Cadence Design Systems Inc(a) | 17,181,644 |
| 34,799 | Capgemini SE | 7,272,684 |
| 65,200 | Computacenter PLC(a) | 2,315,425 |
| 92,136 | Dassault Systemes SE | 4,509,801 |
| 20,300 | Disco Corp | 5,013,427 |
| 55,900 | DTS Corp(a) | 1,394,253 |
| 147,100 | Indra Sistemas SA | 2,278,329 |
| 63,400 | Infineon Technologies AG | 2,647,744 |
| 164,471 | Nomura Research Institute Ltd | 4,776,687 |
| 2,174,000 | PAX Global Technology Ltd | 1,684,111 |
| 275,016 | Samsung Electronics Co Ltd | 16,692,607 |
| 65,097 | SAP SE | 10,019,814 |
| 158,300 | Seiko Epson Corp | 2,363,566 |
See Notes to Financial Statements.
Annual Report - December 31, 2023
EMPOWER FUNDS, INC.
EMPOWER INTERNATIONAL VALUE FUND
Schedule of Investments
As of December 31, 2023
| Shares | Fair Value | |
| Technology — (continued) | ||
| 57,300 | STMicroelectronics NV | $ 2,874,104 |
| 125,463 | Taiwan Semiconductor Manufacturing Co Ltd Sponsored ADR | 13,048,152 |
| 17,700 | Tokyo Seimitsu Co Ltd(a) | 1,085,530 |
| 113,477,516 | ||
| Utilities — 1.03% | ||
| 1,366,800 | A2A SpA | 2,807,502 |
| 304,600 | AGL Energy Ltd | 1,969,002 |
| 441,300 | Drax Group PLC | 2,754,012 |
| 304,500 | Engie SA | 5,364,152 |
| 12,894,668 | ||
| TOTAL COMMON STOCK — 97.68% (Cost $1,103,680,282) | $1,228,383,390 | |
| PREFERRED STOCK | ||
| Consumer, Cyclical — 0.49% | ||
| 423,994 | Schaeffler AG | 2,621,017 |
| 28,400 | Volkswagen AG | 3,500,473 |
| TOTAL PREFERRED STOCK — 0.49% (Cost $10,417,817) | $ 6,121,490 | |
| Principal Amount | ||
| SHORT TERM INVESTMENTS | ||
| Repurchase Agreements — 2.93% | ||
| $ 2 | Undivided interest of 0.00% in a repurchase agreement (principal amount/value $7,826,153 with a maturity value of $7,830,805) with TD Securities (USA) LLC, 5.35%, dated 12/31/23 to be repurchased at $2 on 1/2/24 collateralized by various U.S. Government Agency securities, 2.50% - 7.00%, 7/1/37 - 1/1/54, with a value of $7,982,676.(d) | 2 |
| 9,226,237 | Undivided interest of 11.03% in a repurchase agreement (principal amount/value $83,874,265 with a maturity value of $83,924,030) with Bank of Montreal, 5.34%, dated 12/31/23 to be repurchased at $9,226,237 on 1/2/24 collateralized by various U.S. Government Agency securities, 0.00% - 6.50%, 12/1/38 - 12/1/53, with a value of $85,551,750.(d) | 9,226,237 |
| Principal Amount | Fair Value | |
| Repurchase Agreements — (continued) | ||
| $9,226,237 | Undivided interest of 7.68% in a repurchase agreement (principal amount/value $120,466,826 with a maturity value of $120,538,303) with RBC Capital Markets Corp, 5.34%, dated 12/31/23 to be repurchased at $9,226,237 on 1/2/24 collateralized by U.S. Treasury securities and various U.S. Government Agency securities, 0.00% - 7.50%, 1/15/24 - 12/1/53, with a value of $122,876,165.(d) | $ 9,226,237 |
| 9,226,237 | Undivided interest of 7.80% in a repurchase agreement (principal amount/value $118,664,201 with a maturity value of $118,734,608) with Citigroup Global Markets Inc, 5.34%, dated 12/31/23 to be repurchased at $9,226,237 on 1/2/24 collateralized by Government National Mortgage Association securities, 2.00% - 7.50%, 7/20/37 - 12/20/53, with a value of $121,037,485.(d) | 9,226,237 |
| 9,226,237 | Undivided interest of 9.88% in a repurchase agreement (principal amount/value $93,637,100 with a maturity value of $93,692,762) with Bank of America Securities Inc, 5.35%, dated 12/31/23 to be repurchased at $9,226,237 on 1/2/24 collateralized by various U.S. Government Agency securities, 0.00% - 7.00%, 11/1/28 - 12/20/63, with a value of $95,509,842.(d) | 9,226,237 |
| TOTAL SHORT TERM INVESTMENTS — 2.93% (Cost $36,904,950) | $ 36,904,950 | |
| TOTAL INVESTMENTS — 101.10% (Cost $1,151,003,049) | $1,271,409,830 | |
| OTHER ASSETS & LIABILITIES, NET — (1.10)% | $ (13,887,791) | |
| TOTAL NET ASSETS — 100.00% | $1,257,522,039 | |
See Notes to Financial Statements.
Annual Report - December 31, 2023
EMPOWER FUNDS, INC.
EMPOWER INTERNATIONAL VALUE FUND
Schedule of Investments
As of December 31, 2023
| (a) | Non-income producing security. |
| (b) | All or a portion of the security is on loan at December 31, 2023. |
| (c) | Represents securities sold under Rule 144A, which are exempt from registration under the Securities Act of 1933, as amended. |
| (d) | Collateral received for securities on loan. |
| ADR | American Depositary Receipt |
| REIT | Real Estate Investment Trust |
Summary of Investments by Country as of December 31, 2023.
| Country | Fair Value | Percentage of Fund Investments | |
| Japan | $ 233,726,446 | 18.38% | |
| France | 174,413,874 | 13.72 | |
| United Kingdom | 153,821,196 | 12.10 | |
| Switzerland | 124,772,350 | 9.81 | |
| Germany | 108,694,942 | 8.55 | |
| United States | 82,559,032 | 6.49 | |
| Australia | 53,521,839 | 4.21 | |
| Netherlands | 48,637,770 | 3.83 | |
| Ireland | 46,923,768 | 3.69 | |
| Spain | 38,149,735 | 3.00 | |
| Sweden | 30,375,925 | 2.39 | |
| Canada | 26,085,292 | 2.05 | |
| Denmark | 23,860,939 | 1.88 | |
| South Korea | 16,692,607 | 1.31 | |
| Italy | 16,555,706 | 1.30 | |
| Hong Kong | 13,087,329 | 1.03 | |
| Taiwan | 13,048,152 | 1.03 | |
| Norway | 12,891,922 | 1.01 | |
| Finland | 12,847,319 | 1.01 | |
| Singapore | 8,619,296 | 0.68 | |
| Austria | 7,838,868 | 0.62 | |
| Portugal | 5,686,851 | 0.45 | |
| Israel | 5,074,174 | 0.40 | |
| Brazil | 4,358,712 | 0.34 | |
| Belgium | 4,254,871 | 0.33 | |
| Bermuda | 3,021,250 | 0.24 | |
| Malta | 1,889,665 | 0.15 | |
| Total | $1,271,409,830 | 100.00% |
See Notes to Financial Statements.
Annual Report - December 31, 2023
EMPOWER FUNDS, INC.
Statement of Assets and Liabilities
As of December 31, 2023
| Empower Emerging Markets Equity Fund | Empower International Growth Fund | Empower International Index Fund | |||
| ASSETS: | |||||
| Investments in securities, fair value(a)(b) | $860,968,448 | $476,117,075 | $1,762,456,062 | ||
| Repurchase agreements, fair value(c) | 6,359,505 | 13,794,200 | 47,295,333 | ||
| Cash | 7,328,018 | 3,798,391 | 16,176,472 | ||
| Cash denominated in foreign currencies, fair value(d) | 1,667,683 | 89,686 | 3,719,525 | ||
| Cash pledged on futures contracts | - | - | 2,581,639 | ||
| Dividends receivable | 2,192,993 | 1,657,345 | 6,330,466 | ||
| Subscriptions receivable | 367,933 | 42,408 | 1,552,189 | ||
| Receivable for investments sold | 3,973 | - | - | ||
| Variation margin on futures contracts | - | - | 27,780 | ||
| Unrealized appreciation on forward foreign currency contracts | - | - | 730 | ||
| Total Assets | 878,888,553 | 495,499,105 | 1,840,140,196 | ||
| LIABILITIES: | |||||
| Payable for director fees | 7,018 | 7,018 | 7,018 | ||
| Payable for investments purchased | 2,063,152 | - | - | ||
| Payable for other accrued fees | 204,739 | 86,866 | 174,925 | ||
| Payable for shareholder services fees | 126,724 | 5,973 | 323,123 | ||
| Payable to investment adviser | 754,011 | 321,250 | 338,445 | ||
| Payable upon return of securities loaned | 6,359,505 | 13,794,200 | 47,295,333 | ||
| Redemptions payable | 1,668,042 | 726,957 | 2,394,940 | ||
| Unrealized depreciation on forward foreign currency contracts | - | - | 302,523 | ||
| Total Liabilities | 11,183,191 | 14,942,264 | 50,836,307 | ||
| NET ASSETS | $867,705,362 | $480,556,841 | $1,789,303,889 | ||
| NET ASSETS REPRESENTED BY: | |||||
| Capital stock, $0.10 par value | $10,289,418 | $5,173,885 | $15,556,642 | ||
| Paid-in capital in excess of par | 952,726,682 | 414,963,129 | 1,575,341,496 | ||
| Undistributed/accumulated earnings (deficit) | (95,310,738) | 60,419,827 | 198,405,751 | ||
| NET ASSETS | $867,705,362 | $480,556,841 | $1,789,303,889 | ||
| NET ASSETS BY CLASS | |||||
| Investor Class | $441,799,873 | $20,290,137 | $1,124,570,056 | ||
| Institutional Class | $425,905,489 | $460,266,704 | $664,733,833 | ||
| CAPITAL STOCK: | |||||
| Authorized | |||||
| Investor Class | 235,000,000 | 20,000 | 385,000,000 | ||
| Institutional Class | 230,000,000 | 250,000 | 350,000,000 | ||
| Issued and Outstanding | |||||
| Investor Class | 52,848,531 | 1,591,132 | 91,065,857 | ||
| Institutional Class | 50,045,650 | 50,147,715 | 64,500,563 | ||
| NET ASSET VALUE, REDEMPTION PRICE AND OFFERING PRICE PER SHARE: | |||||
| Investor Class | $8.36 | $12.75 | $12.35 | ||
| Institutional Class | $8.51 | $9.18 | $10.31 | ||
| (a) Cost of investments | $816,712,612 | $409,735,294 | $1,551,322,997 | ||
| (b) Including fair value of securities on loan | $5,950,802 | $12,909,808 | $44,113,026 | ||
| (c) Cost of repurchase agreements | $6,359,505 | $13,794,200 | $47,295,333 | ||
| (d) Cost of cash denominated in foreign currencies | $1,668,612 | $85,826 | $3,347,779 |
See Notes to Financial Statements.
Annual Report - December 31, 2023
EMPOWER FUNDS, INC.
Statement of Assets and Liabilities
As of December 31, 2023
| Empower International Value Fund | |
| ASSETS: | |
| Investments in securities, fair value(a)(b) | $1,234,504,880 |
| Repurchase agreements, fair value(c) | 36,904,950 |
| Cash | 18,863,530 |
| Cash denominated in foreign currencies, fair value(d) | 1,308,137 |
| Dividends receivable | 6,472,996 |
| Subscriptions receivable | 500,369 |
| Receivable for investments sold | 111,108 |
| Total Assets | 1,298,665,970 |
| LIABILITIES: | |
| Payable for director fees | 7,018 |
| Payable for investments purchased | 248,277 |
| Payable for other accrued fees | 160,803 |
| Payable for shareholder services fees | 85,625 |
| Payable to investment adviser | 735,925 |
| Payable upon return of securities loaned | 36,904,950 |
| Redemptions payable | 3,001,333 |
| Total Liabilities | 41,143,931 |
| NET ASSETS | $1,257,522,039 |
| NET ASSETS REPRESENTED BY: | |
| Capital stock, $0.10 par value | $14,038,031 |
| Paid-in capital in excess of par | 1,133,349,009 |
| Undistributed/accumulated earnings | 110,134,999 |
| NET ASSETS | $1,257,522,039 |
| NET ASSETS BY CLASS | |
| Investor Class | $293,534,462 |
| Institutional Class | $963,987,577 |
| CAPITAL STOCK: | |
| Authorized | |
| Investor Class | 350,000,000 |
| Institutional Class | 560,000,000 |
| Issued and Outstanding | |
| Investor Class | 24,393,795 |
| Institutional Class | 115,986,510 |
| NET ASSET VALUE, REDEMPTION PRICE AND OFFERING PRICE PER SHARE: | |
| Investor Class | $12.03 |
| Institutional Class | $8.31 |
| (a) Cost of investments | $1,114,098,099 |
| (b) Including fair value of securities on loan | $33,010,996 |
| (c) Cost of repurchase agreements | $36,904,950 |
| (d) Cost of cash denominated in foreign currencies | $1,250,723 |
See Notes to Financial Statements.
Annual Report - December 31, 2023
EMPOWER FUNDS, INC.
Statement of Operations
For the fiscal year ended December 31, 2023
| Empower Emerging Markets Equity Fund | Empower International Growth Fund | Empower International Index Fund | |||
| INVESTMENT INCOME: | |||||
| Interest | $- | $121,095 | $899,742 | ||
| Income from securities lending | 36,859 | 18,969 | 310,475 | ||
| Dividends | 17,270,449 | 7,050,875 | 50,608,515 | ||
| Foreign withholding tax | (2,302,190) | (611,419) | (4,971,024) | ||
| Total Income | 15,005,118 | 6,579,520 | 46,847,708 | ||
| EXPENSES: | |||||
| Management fees | 5,935,734 | 3,605,756 | 3,671,480 | ||
| Shareholder services fees – Investor Class | 986,285 | 75,458 | 3,280,228 | ||
| Audit and tax fees | 89,460 | 57,830 | 51,647 | ||
| Custodian fees | 486,281 | 116,395 | 260,372 | ||
| Directors fees | 31,396 | 31,396 | 31,396 | ||
| Legal fees | 9,915 | 9,914 | 9,914 | ||
| Pricing fees | 25,286 | 2,700 | 34,470 | ||
| Registration fees | 37,059 | 28,424 | 87,093 | ||
| Shareholder report fees | 30,077 | 426 | 51,835 | ||
| Transfer agent fees | 8,796 | 9,061 | 10,334 | ||
| Other fees | 17,701 | 17,222 | 19,427 | ||
| Total Expenses | 7,657,990 | 3,954,582 | 7,508,196 | ||
| Less amount waived by investment adviser | 927,371 | 141,113 | - | ||
| Net Expenses | 6,730,619 | 3,813,469 | 7,508,196 | ||
| NET INVESTMENT INCOME | 8,274,499 | 2,766,051 | 39,339,512 | ||
| NET REALIZED AND UNREALIZED GAIN (LOSS): | |||||
| Net realized gain (loss) on investments and foreign currency transactions | (57,030,658) | 4,278,516 | 34,341,152 | ||
| Net realized gain on futures contracts | - | - | 4,758,083 | ||
| Net realized gain (loss) on forward foreign currency contracts | (23,082) | - | 83,604 | ||
| Net Realized Gain (Loss) | (57,053,740) | 4,278,516 | 39,182,839 | ||
| Net change in unrealized appreciation on investments and foreign currency translations | 120,560,541 | 65,546,303 | 193,589,060 | ||
| Net change in unrealized appreciation on futures contracts | - | - | 1,961,464 | ||
| Net change in unrealized depreciation on forward foreign currency contracts | - | - | (27,318) | ||
| Net Change in Unrealized Appreciation | 120,560,541 | 65,546,303 | 195,523,206 | ||
| Net Realized and Unrealized Gain | 63,506,801 | 69,824,819 | 234,706,045 | ||
| NET INCREASE IN NET ASSETS RESULTING FROM OPERATIONS | $71,781,300 | $72,590,870 | $274,045,557 |
See Notes to Financial Statements.
Annual Report - December 31, 2023
EMPOWER FUNDS, INC.
Statement of Operations
For the fiscal year ended December 31, 2023
| Empower International Value Fund | |
| INVESTMENT INCOME: | |
| Interest | $509,292 |
| Income from securities lending | 385,651 |
| Dividends | 50,794,698 |
| Foreign withholding tax | (5,723,034) |
| Total Income | 45,966,607 |
| EXPENSES: | |
| Management fees | 9,281,434 |
| Shareholder services fees – Investor Class | 1,787,156 |
| Audit and tax fees | 60,079 |
| Custodian fees | 300,322 |
| Directors fees | 31,396 |
| Legal fees | 9,915 |
| Pricing fees | 13,277 |
| Registration fees | 64,962 |
| Shareholder report fees | 52,681 |
| Transfer agent fees | 15,664 |
| Other fees | 19,085 |
| Total Expenses | 11,635,971 |
| NET INVESTMENT INCOME | 34,330,636 |
| NET REALIZED AND UNREALIZED GAIN (LOSS): | |
| Net realized gain on investments and foreign currency transactions | 22,958,849 |
| Net Realized Gain | 22,958,849 |
| Net change in unrealized appreciation on investments and foreign currency translations | 165,661,063 |
| Net Change in Unrealized Appreciation | 165,661,063 |
| Net Realized and Unrealized Gain | 188,619,912 |
| NET INCREASE IN NET ASSETS RESULTING FROM OPERATIONS | $222,950,548 |
See Notes to Financial Statements.
Annual Report - December 31, 2023
EMPOWER FUNDS, INC.
Statement of Changes in Net Assets
For the fiscal years ended December 31, 2023 and December 31, 2022
| Empower Emerging Markets Equity Fund | 2023 | 2022 | |
| OPERATIONS: | |||
| Net investment income | $8,274,499 | $14,311,731 | |
| Net realized loss | (57,053,740) | (70,033,894) | |
| Net change in unrealized appreciation (depreciation) | 120,560,541 | (96,639,202) | |
| Net Increase (Decrease) in Net Assets Resulting from Operations | 71,781,300 | (152,361,365) | |
| DISTRIBUTIONS TO SHAREHOLDERS: | |||
| From net investment income and net realized gains | |||
| Investor Class | (6,545,764) | (5,272,152) | |
| Institutional Class | (6,514,135) | (5,581,629) | |
| From Net Investment Income and Net Realized Gains | (13,059,899) | (10,853,781) | |
| CAPITAL SHARE TRANSACTIONS: | |||
| Shares sold | |||
| Investor Class | 319,990,833 | 231,759,005 | |
| Institutional Class | 126,003,934 | 84,759,543 | |
| Shares issued in reinvestment of distributions | |||
| Investor Class | 6,545,764 | 5,272,152 | |
| Institutional Class | 6,514,135 | 5,581,629 | |
| Shares redeemed | |||
| Investor Class | (238,492,245) | (95,675,102) | |
| Institutional Class | (70,437,383) | (77,900,595) | |
| Net Increase in Net Assets Resulting from Capital Share Transactions | 150,125,038 | 153,796,632 | |
| Total Increase (Decrease) in Net Assets | 208,846,439 | (9,418,514) | |
| NET ASSETS: | |||
| Beginning of year | 658,858,923 | 668,277,437 | |
| End of year | $867,705,362 | $658,858,923 | |
| CAPITAL SHARE TRANSACTIONS - SHARES: | |||
| Shares sold | |||
| Investor Class | 39,994,070 | 28,065,311 | |
| Institutional Class | 15,438,927 | 9,948,822 | |
| Shares issued in reinvestment of distributions | |||
| Investor Class | 798,525 | 678,003 | |
| Institutional Class | 781,340 | 709,583 | |
| Shares redeemed | |||
| Investor Class | (29,871,761) | (11,650,053) | |
| Institutional Class | (8,487,019) | (8,835,580) | |
| Net Increase | 18,654,082 | 18,916,086 |
See Notes to Financial Statements.
Annual Report - December 31, 2023
EMPOWER FUNDS, INC.
Statement of Changes in Net Assets
For the fiscal years ended December 31, 2023 and December 31, 2022
| Empower International Growth Fund | 2023 | 2022 | |
| OPERATIONS: | |||
| Net investment income | $2,766,051 | $1,379,693 | |
| Net realized gain (loss) | 4,278,516 | (9,051,497) | |
| Net change in unrealized appreciation (depreciation) | 65,546,303 | (155,857,263) | |
| Net Increase (Decrease) in Net Assets Resulting from Operations | 72,590,870 | (163,529,067) | |
| DISTRIBUTIONS TO SHAREHOLDERS: | |||
| From net investment income and net realized gains | |||
| Investor Class | - | (266,437) | |
| Institutional Class | (3,471,235) | (7,129,784) | |
| From Net Investment Income and Net Realized Gains | (3,471,235) | (7,396,221) | |
| CAPITAL SHARE TRANSACTIONS: | |||
| Shares sold | |||
| Investor Class | 9,878,717 | 9,503,751 | |
| Institutional Class | 101,440,091 | 140,670,108 | |
| Shares issued in reinvestment of distributions | |||
| Investor Class | - | 266,437 | |
| Institutional Class | 3,471,235 | 7,129,784 | |
| Shares redeemed | |||
| Investor Class | (13,483,048) | (11,327,710) | |
| Institutional Class | (111,631,791) | (73,168,787) | |
| Net Increase (Decrease) in Net Assets Resulting from Capital Share Transactions | (10,324,796) | 73,073,583 | |
| Total Increase (Decrease) in Net Assets | 58,794,839 | (97,851,705) | |
| NET ASSETS: | |||
| Beginning of year | 421,762,002 | 519,613,707 | |
| End of year | $480,556,841 | $421,762,002 | |
| CAPITAL SHARE TRANSACTIONS - SHARES: | |||
| Shares sold | |||
| Investor Class | 818,748 | 832,112 | |
| Institutional Class | 12,017,372 | 16,308,712 | |
| Shares issued in reinvestment of distributions | |||
| Investor Class | - | 25,570 | |
| Institutional Class | 377,308 | 948,109 | |
| Shares redeemed | |||
| Investor Class | (1,128,921) | (928,515) | |
| Institutional Class | (12,955,855) | (8,907,420) | |
| Net Increase (Decrease) | (871,348) | 8,278,568 |
See Notes to Financial Statements.
Annual Report - December 31, 2023
EMPOWER FUNDS, INC.
Statement of Changes in Net Assets
For the fiscal years ended December 31, 2023 and December 31, 2022
| Empower International Index Fund | 2023 | 2022 | |
| OPERATIONS: | |||
| Net investment income | $39,339,512 | $33,615,239 | |
| Net realized gain | 39,182,839 | 3,930,321 | |
| Net change in unrealized appreciation (depreciation) | 195,523,206 | (241,607,411) | |
| Net Increase (Decrease) in Net Assets Resulting from Operations | 274,045,557 | (204,061,851) | |
| DISTRIBUTIONS TO SHAREHOLDERS: | |||
| From net investment income and net realized gains | |||
| Investor Class | (46,911,906) | (14,925,612) | |
| Institutional Class | (35,425,781) | (15,819,143) | |
| From Net Investment Income and Net Realized Gains | (82,337,687) | (30,744,755) | |
| CAPITAL SHARE TRANSACTIONS: | |||
| Shares sold | |||
| Investor Class | 595,360,594 | 546,458,905 | |
| Institutional Class | 91,988,206 | 122,967,658 | |
| Shares issued in reinvestment of distributions | |||
| Investor Class | 46,911,906 | 14,925,612 | |
| Institutional Class | 35,425,781 | 15,819,143 | |
| Shares redeemed | |||
| Investor Class | (472,181,095) | (233,488,499) | |
| Institutional Class | (168,475,314) | (144,705,376) | |
| Net Increase in Net Assets Resulting from Capital Share Transactions | 129,030,078 | 321,977,443 | |
| Total Increase in Net Assets | 320,737,948 | 87,170,837 | |
| NET ASSETS: | |||
| Beginning of year | 1,468,565,941 | 1,381,395,104 | |
| End of year | $1,789,303,889 | $1,468,565,941 | |
| CAPITAL SHARE TRANSACTIONS - SHARES: | |||
| Shares sold | |||
| Investor Class | 50,476,990 | 48,507,315 | |
| Institutional Class | 9,132,761 | 12,981,207 | |
| Shares issued in reinvestment of distributions | |||
| Investor Class | 3,796,085 | 1,374,005 | |
| Institutional Class | 3,435,083 | 1,731,593 | |
| Shares redeemed | |||
| Investor Class | (39,365,918) | (20,872,432) | |
| Institutional Class | (16,745,845) | (15,102,645) | |
| Net Increase | 10,729,156 | 28,619,043 |
See Notes to Financial Statements.
Annual Report - December 31, 2023
EMPOWER FUNDS, INC.
Statement of Changes in Net Assets
For the fiscal years ended December 31, 2023 and December 31, 2022
| Empower International Value Fund | 2023 | 2022 | |
| OPERATIONS: | |||
| Net investment income | $34,330,636 | $25,566,991 | |
| Net realized gain | 22,958,849 | 37,453,837 | |
| Net change in unrealized appreciation (depreciation) | 165,661,063 | (241,110,888) | |
| Net Increase (Decrease) in Net Assets Resulting from Operations | 222,950,548 | (178,090,060) | |
| DISTRIBUTIONS TO SHAREHOLDERS: | |||
| From net investment income and net realized gains | |||
| Investor Class | (11,526,819) | (16,314,868) | |
| Institutional Class | (60,824,301) | (35,292,444) | |
| From Net Investment Income and Net Realized Gains | (72,351,120) | (51,607,312) | |
| CAPITAL SHARE TRANSACTIONS: | |||
| Shares sold | |||
| Investor Class | 167,857,849 | 438,145,993 | |
| Class L(a) | - | 13,619 | |
| Institutional Class | 209,330,770 | 148,049,727 | |
| Shares issued in reinvestment of distributions | |||
| Investor Class | 11,526,819 | 16,314,868 | |
| Institutional Class | 60,824,301 | 35,292,444 | |
| Shares redeemed | |||
| Investor Class | (522,867,132) | (78,318,980) | |
| Class L(a) | - | (149,593) | |
| Institutional Class | (235,471,334) | (176,289,230) | |
| Net Increase (Decrease) in Net Assets Resulting from Capital Share Transactions | (308,798,727) | 383,058,848 | |
| Total Increase (Decrease) in Net Assets | (158,199,299) | 153,361,476 | |
| NET ASSETS: | |||
| Beginning of year | 1,415,721,338 | 1,262,359,862 | |
| End of year | $1,257,522,039 | $1,415,721,338 | |
| CAPITAL SHARE TRANSACTIONS - SHARES: | |||
| Shares sold | |||
| Investor Class | 14,672,132 | 41,356,733 | |
| Class L(a) | - | 1,168 | |
| Institutional Class | 25,816,618 | 19,001,412 | |
| Shares issued in reinvestment of distributions | |||
| Investor Class | 969,088 | 1,563,041 | |
| Institutional Class | 7,305,376 | 4,751,513 | |
| Shares redeemed | |||
| Investor Class | (46,306,033) | (7,224,556) | |
| Class L(a) | - | (13,166) | |
| Institutional Class | (28,729,562) | (22,560,307) | |
| Net Increase (Decrease) | (26,272,381) | 36,875,838 |
| (a) | Class L ceased operations on April 22, 2022. |
See Notes to Financial Statements.
Annual Report - December 31, 2023
EMPOWER FUNDS, INC.
EMPOWER EMERGING MARKETS EQUITY FUND
Financial Highlights
Selected data for a share of capital stock of the Fund throughout the periods indicated.
| Income (Loss) from Investment Operations: | Less Distributions: | ||||||||||
| Net asset value, beginning of year | Net investment income(a) | Net realized and unrealized gain (loss) | Total from investment operations | From return of capital | From net investment income | From net realized gains | Total Distributions | Net asset value, end of year | Total Return(b)(c) | ||
| Investor Class | |||||||||||
| 12/31/2023 | $ 7.78 | 0.08 | 0.67 | 0.75 | — | (0.17) | — | (0.17) | $ 8.36 | 9.67% | |
| 12/31/2022 | $10.18 | 0.17 | (2.44) | (2.27) | — | (0.11) | (0.02) | (0.13) | $ 7.78 | (22.34%) | |
| 12/31/2021 | $11.02 | 0.09 | (0.58) | (0.49) | — | (0.14) | (0.21) | (0.35) | $10.18 | (4.43%) | |
| 12/31/2020 | $ 9.39 | 0.16 | 1.67 | 1.83 | (0.01) | (0.19) | — | (0.20) | $11.02 | 19.57% | |
| 12/31/2019 | $ 7.79 | 0.10 | 1.59 | 1.69 | (0.01) | (0.08) | — | (0.09) | $ 9.39 | 21.67% | |
| Institutional Class | |||||||||||
| 12/31/2023 | $ 7.86 | 0.13 | 0.66 | 0.79 | — | (0.14) | — | (0.14) | $ 8.51 | 10.12% | |
| 12/31/2022 | $10.26 | 0.21 | (2.47) | (2.26) | — | (0.12) | (0.02) | (0.14) | $ 7.86 | (22.09%) | |
| 12/31/2021 | $11.03 | 0.15 | (0.60) | (0.45) | — | (0.11) | (0.21) | (0.32) | $10.26 | (4.08%) | |
| 12/31/2020 | $ 9.35 | 0.13 | 1.74 | 1.87 | (0.01) | (0.18) | — | (0.19) | $11.03 | 20.05% | |
| 12/31/2019 | $ 7.78 | 0.14 | 1.57 | 1.71 | (0.01) | (0.13) | — | (0.14) | $ 9.35 | 21.97% | |
| Net assets, end of year (000) | Ratio of expenses to average net assets (before reimbursement and/or waiver, if applicable) | Ratio of expenses to average net assets (after reimbursement and/or waiver, if applicable) | Ratio of net investment income to average net assets (after reimbursement and/or waiver, if applicable) | Portfolio turnover rate(d) | ||
| Investor Class | ||||||
| 12/31/2023 | $441,800 | 1.40% | 1.25% | 0.97% | 93% | |
| 12/31/2022 | $326,138 | 1.41% | 1.23% | 2.04% | 53% | |
| 12/31/2021 | $252,800 | 1.41% | 1.23% | 0.83% | 84% | |
| 12/31/2020 | $ 51,824 | 1.49% | 1.23% | 1.59% | 78% | |
| 12/31/2019 | $ 10,129 | 1.50% | 1.23% | 1.21% | 66% | |
| Institutional Class | ||||||
| 12/31/2023 | $425,905 | 1.04% | 0.90% | 1.55% | 93% | |
| 12/31/2022 | $332,721 | 1.05% | 0.88% | 2.40% | 53% | |
| 12/31/2021 | $415,478 | 1.02% | 0.88% | 1.35% | 84% | |
| 12/31/2020 | $382,081 | 1.03% | 0.88% | 1.39% | 78% | |
| 12/31/2019 | $355,796 | 1.01% | 0.88% | 1.63% | 66% | |
| (a) | Per share amounts are based upon average shares outstanding. |
| (b) | Total return does not include any fees or expenses of variable insurance contracts, if applicable. If such fees or expenses were included, the return shown would have been lower. |
| (c) | Total return shown net of expenses reimbursed and/or waived, if applicable. Without the expense reimbursement and/or waiver, the return shown would have been lower. |
| (d) | Portfolio turnover is calculated at the Fund level. |
EMPOWER FUNDS, INC.
EMPOWER INTERNATIONAL GROWTH FUND
EMPOWER INTERNATIONAL GROWTH FUND
Financial Highlights
Selected data for a share of capital stock of the Fund throughout the periods indicated.
| Income (Loss) from Investment Operations: | Less Distributions: | ||||||||||
| Net asset value, beginning of year | Net investment income (loss)(a) | Net realized and unrealized gain (loss) | Total from investment operations | From return of capital | From net investment income | From net realized gains | Total Distributions | Net asset value, end of year | Total Return(b)(c) | ||
| Investor Class | |||||||||||
| 12/31/2023 | $10.94 | 0.04 | 1.77 | 1.81 | — | — | — | — | $12.75 | 16.54% | |
| 12/31/2022 | $15.92 | (0.00) (d)(e) | (4.84) | (4.84) | — | — | (0.14) | (0.14) | $10.94 | (30.35%) | |
| 12/31/2021 | $16.07 | (0.04) (e) | 1.02 | 0.98 | — | (0.02) | (1.11) | (1.13) | $15.92 | 6.04% | |
| 12/31/2020 | $12.63 | (0.02) (e) | 3.60 | 3.58 | — | — | (0.14) | (0.14) | $16.07 | 28.35% | |
| 12/31/2019 | $ 9.44 | 0.04 | 3.17 | 3.21 | (0.00) (d) | (0.01) | (0.01) | (0.02) | $12.63 | 34.07% | |
| Institutional Class | |||||||||||
| 12/31/2023 | $ 7.91 | 0.06 | 1.28 | 1.34 | — | (0.07) | — | (0.07) | $ 9.18 | 16.93% | |
| 12/31/2022 | $11.53 | 0.03 | (3.51) | (3.48) | — | — | (0.14) | (0.14) | $ 7.91 | (30.11%) | |
| 12/31/2021 | $11.93 | 0.01 | 0.77 | 0.78 | — | (0.07) | (1.11) | (1.18) | $11.53 | 6.45% | |
| 12/31/2020 | $ 9.38 | 0.02 | 2.69 | 2.71 | — | (0.02) | (0.14) | (0.16) | $11.93 | 28.88% | |
| 12/31/2019 | $ 7.03 | 0.06 | 2.37 | 2.43 | (0.00) (d) | (0.07) | (0.01) | (0.08) | $ 9.38 | 34.57% | |
| Net assets, end of year (000) | Ratio of expenses to average net assets (before reimbursement and/or waiver, if applicable) | Ratio of expenses to average net assets (after reimbursement and/or waiver, if applicable) | Ratio of net investment income (loss) to average net assets (after reimbursement and/or waiver, if applicable) | Portfolio turnover rate(f) | ||
| Investor Class | ||||||
| 12/31/2023 | $ 20,290 | 1.36% | 1.20% | 0.30% | 63% | |
| 12/31/2022 | $ 20,804 | 1.36% | 1.20% | (0.04%) | 33% | |
| 12/31/2021 | $ 31,403 | 1.28% | 1.20% | (0.23%) | 34% | |
| 12/31/2020 | $ 42,126 | 1.28% | 1.20% | (0.19%) | 27% | |
| 12/31/2019 | $ 40,066 | 1.28% | 1.20% | 0.34% | 30% | |
| Institutional Class | ||||||
| 12/31/2023 | $460,267 | 0.88% | 0.85% | 0.65% | 63% | |
| 12/31/2022 | $400,958 | 0.88% | 0.85% | 0.33% | 33% | |
| 12/31/2021 | $488,211 | 0.86% | 0.85% | 0.09% | 34% | |
| 12/31/2020 | $437,865 | 0.86% | 0.85% | 0.17% | 27% | |
| 12/31/2019 | $435,749 | 0.85% | 0.85% | 0.71% | 30% | |
| (a) | Per share amounts are based upon average shares outstanding. |
| (b) | Total return does not include any fees or expenses of variable insurance contracts, if applicable. If such fees or expenses were included, the return shown would have been lower. |
| (c) | Total return shown net of expenses reimbursed and/or waived, if applicable. Without the expense reimbursement and/or waiver, the return shown would have been lower. |
| (d) | Amount was less than $0.01 per share. |
| (e) | The per share amount does not correspond to activity reflected in the Statement of Operations due to class specific expenses during the period. |
| (f) | Portfolio turnover is calculated at the Fund level. |
EMPOWER FUNDS, INC.
EMPOWER INTERNATIONAL INDEX FUND
EMPOWER INTERNATIONAL INDEX FUND
Financial Highlights
Selected data for a share of capital stock of the Fund throughout the periods indicated.
| Income (Loss) from Investment Operations: | Less Distributions: | ||||||||
| Net asset value, beginning of year | Net investment income(a) | Net realized and unrealized gain (loss) | Total from investment operations | From net investment income | From net realized gains | Total Distributions | Net asset value, end of year | Total Return(b)(c) | |
| Investor Class | |||||||||
| 12/31/2023 | $10.96 | 0.28 | 1.65 | 1.93 | (0.28) | (0.26) | (0.54) | $12.35 | 17.52% |
| 12/31/2022 | $13.10 | 0.24 | (2.18) | (1.94) | (0.20) | — | (0.20) | $10.96 | (14.74%) |
| 12/31/2021 | $12.50 | 0.20 | 1.15 | 1.35 | (0.29) | (0.46) | (0.75) | $13.10 | 10.75% |
| 12/31/2020 | $11.92 | 0.19 | 0.69 | 0.88 | (0.19) | (0.11) | (0.30) | $12.50 | 7.52% |
| 12/31/2019 | $10.09 | 0.29 | 1.86 | 2.15 | (0.28) | (0.04) | (0.32) | $11.92 | 21.25% |
| Institutional Class | |||||||||
| 12/31/2023 | $ 9.22 | 0.27 | 1.40 | 1.67 | (0.32) | (0.26) | (0.58) | $10.31 | 17.96% |
| 12/31/2022 | $11.06 | 0.25 | (1.86) | (1.61) | (0.23) | — | (0.23) | $ 9.22 | (14.41%) |
| 12/31/2021 | $10.61 | 0.24 | 0.96 | 1.20 | (0.29) | (0.46) | (0.75) | $11.06 | 11.24% |
| 12/31/2020 | $10.16 | 0.21 | 0.57 | 0.78 | (0.22) | (0.11) | (0.33) | $10.61 | 7.84% |
| 12/31/2019 | $ 8.64 | 0.28 | 1.61 | 1.89 | (0.33) | (0.04) | (0.37) | $10.16 | 21.80% |
| Net assets, end of year (000) | Ratio of expenses to average net assets (before reimbursement and/or waiver, if applicable) | Ratio of expenses to average net assets (after reimbursement and/or waiver, if applicable) | Ratio of net investment income to average net assets (after reimbursement and/or waiver, if applicable) | Portfolio turnover rate(d) | ||
| Investor Class | ||||||
| 12/31/2023 | $1,124,570 | 0.62% | 0.62% | 2.35% | 19% | |
| 12/31/2022 | $ 835,079 | 0.65% | 0.65% | 2.19% | 13% | |
| 12/31/2021 | $ 617,570 | 0.65% | 0.65% | 1.49% | 13% | |
| 12/31/2020 | $ 271,563 | 0.65% | 0.65% | 1.76% | 6% | |
| 12/31/2019 | $ 197,206 | 0.64% | 0.64% | 2.57% | 8% | |
| Institutional Class | ||||||
| 12/31/2023 | $ 664,734 | 0.26% | 0.26% | 2.67% | 19% | |
| 12/31/2022 | $ 633,487 | 0.28% | 0.28% | 2.61% | 13% | |
| 12/31/2021 | $ 763,825 | 0.28% | 0.28% | 2.10% | 13% | |
| 12/31/2020 | $ 739,271 | 0.28% | 0.28% | 2.22% | 6% | |
| 12/31/2019 | $ 769,900 | 0.27% | 0.27% | 2.91% | 8% | |
| (a) | Per share amounts are based upon average shares outstanding. |
| (b) | Total return does not include any fees or expenses of variable insurance contracts, if applicable. If such fees or expenses were included, the return shown would have been lower. |
| (c) | Total return shown net of expenses reimbursed and/or waived, if applicable. Without the expense reimbursement and/or waiver, the return shown would have been lower. |
| (d) | Portfolio turnover is calculated at the Fund level. |
EMPOWER FUNDS, INC.
EMPOWER INTERNATIONAL VALUE FUND
EMPOWER INTERNATIONAL VALUE FUND
Financial Highlights
Selected data for a share of capital stock of the Fund throughout the periods indicated.
| Income (Loss) from Investment Operations: | Less Distributions: | ||||||||
| Net asset value, beginning of year | Net investment income(a) | Net realized and unrealized gain (loss) | Total from investment operations | From net investment income | From net realized gains | Total Distributions | Net asset value, end of year | Total Return(b)(c) | |
| Investor Class | |||||||||
| 12/31/2023 | $10.53 | 0.27 | 1.62 | 1.89 | (0.17) | (0.22) | (0.39) | $12.03 | 18.03% |
| 12/31/2022 | $12.79 | 0.17 | (2.12) | (1.95) | (0.13) | (0.18) | (0.31) | $10.53 | (15.18%) |
| 12/31/2021 | $12.03 | 0.20 | 1.10 | 1.30 | (0.21) | (0.33) | (0.54) | $12.79 | 10.83% |
| 12/31/2020 | $11.19 | 0.13 | 0.95 | 1.08 | (0.11) | (0.13) | (0.24) | $12.03 | 9.73% |
| 12/31/2019 | $ 9.39 | 0.21 | 1.86 | 2.07 | (0.14) | (0.13) | (0.27) | $11.19 | 22.06% |
| Institutional Class | |||||||||
| 12/31/2023 | $ 7.49 | 0.21 | 1.17 | 1.38 | (0.34) | (0.22) | (0.56) | $ 8.31 | 18.44% |
| 12/31/2022 | $ 9.19 | 0.18 | (1.56) | (1.38) | (0.14) | (0.18) | (0.32) | $ 7.49 | (14.90%) |
| 12/31/2021 | $ 8.81 | 0.18 | 0.81 | 0.99 | (0.28) | (0.33) | (0.61) | $ 9.19 | 11.26% |
| 12/31/2020 | $ 8.27 | 0.13 | 0.70 | 0.83 | (0.16) | (0.13) | (0.29) | $ 8.81 | 10.21% |
| 12/31/2019 | $ 7.04 | 0.18 | 1.40 | 1.58 | (0.22) | (0.13) | (0.35) | $ 8.27 | 22.43% |
| Net assets, end of year (000) | Ratio of expenses to average net assets (before reimbursement and/or waiver, if applicable) | Ratio of expenses to average net assets (after reimbursement and/or waiver, if applicable) | Ratio of net investment income to average net assets (after reimbursement and/or waiver, if applicable) | Portfolio turnover rate(d) | ||
| Investor Class | ||||||
| 12/31/2023 | $ 293,534 | 1.07% | 1.07% | 2.38% | 18% | |
| 12/31/2022 | $ 579,880 | 1.09% | 1.07% | 1.63% | 30% | |
| 12/31/2021 | $ 247,738 | 1.06% | 1.06% | 1.57% | 17% | |
| 12/31/2020 | $ 220,602 | 1.07% | 1.07% | 1.27% | 20% | |
| 12/31/2019 | $ 216,315 | 1.06% | 1.06% | 2.02% | 24% | |
| Institutional Class | ||||||
| 12/31/2023 | $ 963,988 | 0.71% | 0.71% | 2.54% | 18% | |
| 12/31/2022 | $ 835,841 | 0.71% | 0.71% | 2.27% | 30% | |
| 12/31/2021 | $1,014,470 | 0.70% | 0.70% | 1.93% | 17% | |
| 12/31/2020 | $ 906,166 | 0.70% | 0.70% | 1.66% | 20% | |
| 12/31/2019 | $ 885,852 | 0.69% | 0.69% | 2.32% | 24% | |
| (a) | Per share amounts are based upon average shares outstanding. |
| (b) | Total return does not include any fees or expenses of variable insurance contracts, if applicable. If such fees or expenses were included, the return shown would have been lower. |
| (c) | Total return shown net of expenses reimbursed and/or waived, if applicable. Without the expense reimbursement and/or waiver, the return shown would have been lower. |
| (d) | Portfolio turnover is calculated at the Fund level. |
EMPOWER FUNDS, INC.
Notes to Financial Statements
1. ORGANIZATION AND SIGNIFICANT ACCOUNTING POLICIES
Empower Funds, Inc. (Empower Funds), a Maryland corporation, was organized on December 7, 1981 and is registered under the Investment Company Act of 1940 (the 1940 Act) as an open-end management investment company. Empower Funds presently consists of forty-five funds. Interests in the Empower Emerging Markets Equity Fund,Empower International Growth Fund, Empower International Index Fund, and Empower International Value Fund (each a Fund, collectively the Funds) are included herein. Each Fund is diversified as defined in the 1940 Act. The Funds are available as an investment option to insurance company separate accounts for certain variable annuity contracts and variable life insurance policies, to individual retirement account custodians or trustees, to plan sponsors of qualified retirement plans, to college savings programs, and to asset allocation funds that are a series of Empower Funds.
Investment Objectives
Empower Emerging Markets Equity Fund - seeks long-term capital appreciation
Empower International Growth Fund - seeks long-term growth of capital
Empower International Index Fund - seeks investment results that track the total return of the common stocks that comprise the MSCI EAFE Index
Empower International Value Fund - seeks long-term capital growth
The Funds each offer two share classes, referred to as Investor Class and Institutional Class shares. All shares of each Fund represent an equal pro rata interest in the net assets of the class to which such shares belong, and have identical voting, dividend, liquidation and other rights and the same terms and conditions, except for class specific expenses and exclusive rights to vote on matters affecting only individual classes. Income, expenses (other than those attributable to a specific class) and realized and unrealized gains and losses are allocated daily to each class of shares based on the relative proportion of net assets represented by such class. Operating expenses directly attributable to a specific class are charged against operations of that class. Expenses incurred by Empower Funds, which are not Fund specific, are allocated based on relative net assets or other appropriate allocation methods.
The preparation of financial statements in conformity with accounting principles generally accepted in the United States of America (U.S. GAAP) requires management to make estimates and assumptions that affect the reported amounts of assets and liabilities and disclosure of contingent assets and liabilities at the date of the financial statements and the reported amounts of revenue and expenses during the reporting period. Actual results could differ from those estimates. Each Fund is also an investment company and accordingly follows the investment company accounting and reporting guidance of the Financial Accounting Standards Board ("FASB") Accounting Standards Codification Topic 946, Financial Services - Investment Companies. The following is a summary of the significant accounting policies of the Funds.
Security Valuation
The board of directors of Empower Funds (Board of Directors) has adopted policies and procedures for the valuation of each Fund's securities and assets, and has appointed the Fair Value Pricing Committee of the investment adviser, Empower Capital Management, LLC (ECM or the Adviser), to complete valuation determinations under those policies and procedures. Pursuant to Rule 2a-5 under the 1940 Act, the Board of Directors approved the Adviser as the Funds' valuation designee to make all fair value determinations with respect to the Funds' investments, subject to oversight by the Board of Directors.
Each Fund generally values its securities, including Exchange Traded Funds, based on market prices determined at the close of regular trading on the New York Stock Exchange (NYSE) on each day the NYSE is open for trading. The net asset value (NAV) of each class of a Fund's shares is determined by dividing the net assets attributable to each class of shares of the Fund by the number of issued and outstanding shares of each class of the Fund on each valuation date.
Annual Report - December 31, 2023
For securities that are traded on only one exchange, the last sale price as of the close of business of that exchange will be used. If the closing price is not available, the current bid as of the close of business will be used. For securities traded on more than one exchange, or upon one or more exchanges and in the over-the-counter (OTC) market, the last sale price as of the close of business on the market which the security is traded most extensively will be used. If the closing price is not available, the current bid as of the close of business will be used. For securities that principally trade on the NASDAQ National Market System, the NASDAQ official closing price will be used.
For private equity securities that are not traded on an exchange, an appropriate source, which may include the use of an internally developed or approved valuation model, a different external pricing vendor, or sourcing a price from a broker will be used. Valuation of these securities will be reviewed regularly by the Fair Value Pricing Committee.
Short term securities purchased with less than 60 days remaining until maturity and all U.S. Treasury Bills are valued on the basis of amortized cost, which has been determined to approximate fair value. Short term securities purchased with more than 60 days remaining until maturity are valued using pricing services, or in the event a price is not available from a pricing service, may be priced using other methodologies approved by the Board of Directors, including model pricing or pricing on the basis of quotations from brokers or dealers, and will continue to be priced until final maturity.
Foreign equity securities are generally valued using an adjusted systematic fair value price from an independent pricing service. Foreign exchange rates are determined at a time that corresponds to the closing of the NYSE.
For derivatives that are traded on an exchange, the last sale price as of the close of business of the exchange will be used. For derivatives traded OTC, independent pricing services will be utilized when possible. If a price cannot be located from the primary source, other appropriate sources, which may include the use of an internally developed valuation model, another external pricing vendor or sourcing a price from a broker, may be used.
Independent pricing services are approved by the Board of Directors and are utilized for all investment types when available. In some instances valuations from independent pricing services are not available or do not reflect events in the market between the time the market closed and the valuation time and therefore fair valuation procedures are implemented. The fair value for some securities may be obtained from pricing services or other pricing sources. The inputs used by the pricing services are reviewed quarterly or when the pricing vendor issues updates to its pricing methodologies. Broker quotes are analyzed through an internal review process, which includes a review of known market conditions and other relevant data. Developments that might trigger fair value pricing could be natural disasters, government actions or fluctuations in domestic and foreign markets.
The following table provides examples of the inputs that are commonly used for valuing particular classes of securities. These classifications are not exclusive, and any inputs may be used to value any other security class.
| Class | Inputs |
| Common Stock | Exchange traded close price, bids, evaluated bids, open and close price of the local exchange, exchange rates, fair values based on significant market movement and various index data |
| Preferred Stock | Benchmark yields, reported trades, broker/dealer quotes, issuer spreads, two-sided markets, benchmark securities, bids, evaluated bids, offers and reference data including market research publications. Inputs also may include exchange prices. |
| Rights | Exchange traded close price, bids and evaluated bids |
| Exchange Traded Funds | Exchange traded close price |
| Short Term Investments | Maturity date, credit quality and interest rates |
| Futures Contracts | Exchange traded close price |
| Forward Foreign Currency Contracts | Foreign currency spot and forward rates |
The Funds classify their valuations into three levels based upon the observability of inputs to the valuation of each Fund’s investments. The valuation levels are not necessarily an indication of the risk or liquidity associated with the underlying investment. Classification is based on the lowest level of input significant to the fair value measurement. The three levels are defined as follows:
Level 1 – Unadjusted quoted prices for identical securities in active markets.
Annual Report - December 31, 2023
Level 2 – Inputs other than quoted prices included in Level 1 that are observable either directly or indirectly. These may include quoted prices for similar assets in active markets.
Level 3 – Unobservable inputs to the extent observable inputs are not available and may include prices obtained from single broker quotes. Unobservable inputs reflect a Fund’s own assumptions and would be based on the best information available under the circumstances.
As of December 31, 2023, the inputs used to value each Fund’s investments are detailed in the following table. More information regarding the sector or geography classifications, as applicable, are included in the Schedule of Investments.
Empower Emerging Markets Equity Fund
| Level 1 | Level 2 | Level 3 | Total | ||||
| Assets | |||||||
| Investments, at fair value: | |||||||
| Common Stock | |||||||
| Basic Materials | $ 9,032,140 | $ 21,666,144 | $ — | $ 30,698,284 | |||
| Communications | 28,149,749 | 103,920,077 | — | 132,069,826 | |||
| Consumer, Cyclical | 19,079,421 | 73,692,796 | — | 92,772,217 | |||
| Consumer, Non-cyclical | 27,776,316 | 69,182,687 | — | 96,959,003 | |||
| Energy | 9,751,707 | 27,397,293 | — | 37,149,000 | |||
| Financial | 39,310,158 | 158,645,785 | — | 197,955,943 | |||
| Industrial | 8,295,666 | 55,890,484 | — | 64,186,150 | |||
| Technology | 5,196,337 | 178,013,636 | — | 183,209,973 | |||
| Utilities | 4,390,175 | 7,008,210 | — | 11,398,385 | |||
| 150,981,669 | 695,417,112 | — | 846,398,781 | ||||
| Exchange Traded Funds | 14,569,667 | — | — | 14,569,667 | |||
| Short Term Investments | — | 6,359,505 | — | 6,359,505 | |||
| Total Assets | $ 165,551,336 | $ 701,776,617 | $ — | $ 867,327,953 |
Empower International Growth Fund
| Level 1 | Level 2 | Level 3 | Total | ||||
| Assets | |||||||
| Investments, at fair value: | |||||||
| Common Stock | |||||||
| Basic Materials | $ 5,199,589 | $ 20,819,511 | $ — | $ 26,019,100 | |||
| Communications | 17,341,337 | 7,228,505 | — | 24,569,842 | |||
| Consumer, Cyclical | 4,117,852 | 67,222,174 | — | 71,340,026 | |||
| Consumer, Non-cyclical | 3,390,443 | 134,376,195 | — | 137,766,638 | |||
| Financial | 3,110,884 | 46,901,715 | — | 50,012,599 | |||
| Industrial | — | 84,663,943 | — | 84,663,943 | |||
| Technology | 32,339,091 | 46,555,310 | — | 78,894,401 | |||
| Utilities | — | 2,850,526 | — | 2,850,526 | |||
| 65,499,196 | 410,617,879 | — | 476,117,075 | ||||
| Short Term Investments | — | 13,794,200 | — | 13,794,200 | |||
| Total Assets | $ 65,499,196 | $ 424,412,079 | $ — | $ 489,911,275 |
Annual Report - December 31, 2023
Empower International Index Fund
| Level 1 | Level 2 | Level 3 | Total | ||||
| Assets | |||||||
| Investments, at fair value: | |||||||
| Common Stock | |||||||
| Basic Materials | $ 816,336 | $ 114,901,423 | $ — | $ 115,717,759 | |||
| Communications | 10,144,300 | 65,952,451 | — | 76,096,751 | |||
| Consumer, Cyclical | — | 238,462,316 | — | 238,462,316 | |||
| Consumer, Non-cyclical | 3,974,096 | 421,928,751 | 458 | 425,903,305 | |||
| Diversified | 721,607 | 389,604 | — | 1,111,211 | |||
| Energy | — | 79,883,937 | — | 79,883,937 | |||
| Financial | 1,915,774 | 363,403,964 | — | 365,319,738 | |||
| Industrial | 5,370,515 | 244,630,859 | — | 250,001,374 | |||
| Technology | 3,440,816 | 115,399,438 | — | 118,840,254 | |||
| Utilities | 325,448 | 58,383,084 | — | 58,708,532 | |||
| 26,708,892 | 1,703,335,827 | 458 | 1,730,045,177 | ||||
| Preferred Stock | — | 7,774,790 | — | 7,774,790 | |||
| Rights | — | — | 19,290 | 19,290 | |||
| Short Term Investments | — | 71,912,138 | — | 71,912,138 | |||
| Total investments, at fair value: | 26,708,892 | 1,783,022,755 | 19,748 | 1,809,751,395 | |||
| Other Financial Investments: | |||||||
| Forward Foreign Currency Contracts(a) | — | 730 | — | 730 | |||
| Futures Contracts(a) | 1,727,921 | — | — | 1,727,921 | |||
| Total Assets | $ 28,436,813 | $ 1,783,023,485 | $ 19,748 | $ 1,811,480,046 | |||
| Liabilities | |||||||
| Other Financial Investments: | |||||||
| Forward Foreign Currency Contracts(a) | — | (302,523) | — | (302,523) | |||
| Total Liabilities | $ 0 | $ (302,523) | $ — | $ (302,523) |
| (a) | Forward Foreign Currency Contracts and Futures Contracts are reported at the security's unrealized appreciation (depreciation), which represents the change in the contract's value from trade date. |
Empower International Value Fund
| Level 1 | Level 2 | Level 3 | Total | ||||
| Assets | |||||||
| Investments, at fair value: | |||||||
| Common Stock | |||||||
| Basic Materials | $ 26,085,292 | $ 67,709,174 | $ — | $ 93,794,466 | |||
| Communications | 6,102,746 | 28,235,824 | — | 34,338,570 | |||
| Consumer, Cyclical | 7,627,764 | 146,408,851 | — | 154,036,615 | |||
| Consumer, Non-cyclical | 18,087,859 | 233,062,607 | — | 251,150,466 | |||
| Energy | 4,358,712 | 80,895,266 | — | 85,253,978 | |||
| Financial | 7,999,618 | 253,362,211 | — | 261,361,829 | |||
| Industrial | 14,125,849 | 207,949,433 | — | 222,075,282 | |||
| Technology | 44,180,155 | 69,297,361 | — | 113,477,516 | |||
| Utilities | 2,754,012 | 10,140,656 | — | 12,894,668 | |||
| 131,322,007 | 1,097,061,383 | — | 1,228,383,390 | ||||
| Preferred Stock | — | 6,121,490 | — | 6,121,490 | |||
| Short Term Investments | — | 36,904,950 | — | 36,904,950 | |||
| Total Assets | $ 131,322,007 | $ 1,140,087,823 | $ — | $ 1,271,409,830 |
Annual Report - December 31, 2023
Repurchase Agreements
A Fund may engage in repurchase agreement transactions with institutions that the Funds’ investment adviser has determined are creditworthy. A Fund that engages in repurchase agreement transactions will purchase securities at a specified price with an agreement to sell the securities to the same counterparty at a specified time, price and interest rate. The Funds' custodian and/or securities lending agent receives delivery of the underlying securities collateralizing a repurchase agreement. Collateral is at least equal to the value of the repurchase obligation including interest. A repurchase agreement transaction involves certain risks in the event of default or insolvency of the counterparty. These risks include possible delays or restrictions upon a Fund's ability to dispose of the underlying securities and a possible decline in the value of the underlying securities during the period while the Fund seeks to assert its rights.
Foreign Currency Translations and Transactions
The accounting records of the Funds are maintained in U.S. dollars. Investment securities, and other assets and liabilities denominated in a foreign currency are translated into U.S. dollars at the current exchange rate. Purchases and sales of securities, income receipts and expense payments are translated into U.S. dollars at the exchange rate on the dates of the transactions.
The Fund(s) do not isolate the portion of the results of operations resulting from changes in foreign exchange rates on investments from the fluctuations arising from changes in market prices of securities held. Such fluctuations are included with the net realized and unrealized gain or loss.
Net realized foreign exchange gains or losses arise from sales of foreign currencies, currency gains or losses realized between the trade and settlement dates on securities transactions, and the difference between the amounts of dividends, interest, and foreign withholding taxes recorded by the Fund(s) and the U.S. dollar equivalent of the amounts actually received or paid. Net unrealized foreign exchange gains and losses arise from changes in the fair values of assets and liabilities, other than investments in securities at fiscal period end, resulting from changes in exchange rates. These gains and losses are included in net realized gain or loss and change in net unrealized appreciation or depreciation on the Statement of Operations.
Security Transactions
Security transactions are accounted for on the date the security is purchased or sold (trade date). Realized gains and losses from investments sold are determined on a specific lot selection. Dividend income for a Fund is accrued as of the ex-dividend date and interest income, including amortization of discounts and premiums, is recorded daily.
Federal Income Taxes and Distributions to Shareholders
The Funds intend to comply with provisions under Subchapter M of the Internal Revenue Code applicable to regulated investment companies and to distribute substantially all of its net taxable income, including any net realized gain on investments not offset by capital loss carryforwards, if any, to shareholders. Therefore, no provision of federal income or excise tax is required. The Funds file income tax returns in U.S. federal and applicable state jurisdictions. The statute of limitations on each Fund’s tax return filings generally remains open for the three preceding fiscal reporting period ends. State tax returns may remain open for an additional fiscal year.
Distributions to shareholders from net investment income of the Funds, if any, are declared and paid semi-annually. Capital gain distributions of the Funds, if any, are declared and paid annually. Distributions are reinvested in additional shares of the Funds at net asset value and are declared separately for each class. Distributions are determined in accordance with income tax regulations, which may differ from U.S. generally accepted accounting principles.
The tax character of distributions paid during the years ended December 31, 2023 and 2022 were as follows:
| Empower Emerging Markets Equity Fund | 2023 | 2022 | |
| Ordinary income | $13,059,899 | $9,420,033 | |
| Long-term capital gain | - | 1,433,748 | |
| $13,059,899 | $10,853,781 |
Annual Report - December 31, 2023
| Empower International Growth Fund | 2023 | 2022 | |
| Ordinary income | $3,471,235 | $- | |
| Long-term capital gain | - | 7,396,221 | |
| $3,471,235 | $7,396,221 |
| Empower International Index Fund | 2023 | 2022 | |
| Ordinary income | $44,280,701 | $30,744,755 | |
| Long-term capital gain | 38,056,986 | - | |
| $82,337,687 | $30,744,755 |
| Empower International Value Fund | 2023 | 2022 | |
| Ordinary income | $41,620,359 | $22,117,380 | |
| Long-term capital gain | 30,730,761 | 29,489,932 | |
| $72,351,120 | $51,607,312 |
Net investment income (loss) and net realized gain (loss) for federal income tax purposes may differ from those reported on the financial statements because of temporary and permanent book-tax basis differences. Book-tax differences may include but are not limited to the following: wash sales, distribution adjustments, adjustments to the accounting treatment of partnerships, adjustments for passive foreign investment corporations and foreign currency reclassifications.
The tax components of capital shown in the following tables represent distribution requirements each Fund must satisfy under the income tax regulations, losses each Fund may be able to offset against income and gains realized in future years and unrealized appreciation or depreciation for federal income tax purposes. At December 31, 2023, the components of distributable earnings on a tax basis were as follows:
| Empower Emerging Markets Equity Fund | |
| Undistributed net investment income | $5,190,943 |
| Undistributed long-term capital gains | — |
| Capital loss carryforwards | (119,629,551) |
| Post-October losses | — |
| Net unrealized appreciation | 19,127,870 |
| Tax composition of capital | $(95,310,738) |
| Empower International Growth Fund | |
| Undistributed net investment income | $3,116,744 |
| Undistributed long-term capital gains | — |
| Capital loss carryforwards | (2,843,185) |
| Post-October losses | — |
| Net unrealized appreciation | 60,146,268 |
| Tax composition of capital | $60,419,827 |
| Empower International Index Fund | |
| Undistributed net investment income | $4,979,501 |
| Undistributed long-term capital gains | 2,524,064 |
| Capital loss carryforwards | — |
| Post-October losses | — |
| Net unrealized appreciation | 190,902,186 |
| Tax composition of capital | $198,405,751 |
Annual Report - December 31, 2023
| Empower International Value Fund | |
| Undistributed net investment income | $2,575,584 |
| Undistributed long-term capital gains | 731,233 |
| Capital loss carryforwards | — |
| Post-October losses | — |
| Net unrealized appreciation | 106,828,182 |
| Tax composition of capital | $110,134,999 |
At December 31, 2023, the Funds had capital loss carryforwards available to offset future realized capital gains, if any, and thereby reduce future taxable gain distributions. Capital loss carryforwards with no expiration, if any, must be utilized prior to those with expiration dates. During the year ended December 31, 2023, the Empower International Index Fund utilized $(934,829) of capital loss carryforwards to offset capital gains realized in that fiscal year. Details of the capital loss carryforwards as of December 31, 2023, were as follows:
| No Expiration | |
| Empower Emerging Markets Equity Fund | $(119,629,551) |
| Empower International Growth Fund | $(2,843,185) |
The aggregate cost of securities and other investments and the composition of unrealized appreciation and depreciation for federal income tax purposes as of December 31, 2023 were as follows:
| Federal Tax Cost of Investments | Gross Unrealized Appreciation on Investments | Gross Unrealized Depreciation on Investments | Net Unrealized Appreciation on Investments | ||||
| Empower Emerging Markets Equity Fund | $848,200,083 | $81,573,352 | $(62,445,482) | $19,127,870 | |||
| Empower International Growth Fund | 429,765,007 | 77,317,502 | (17,171,234) | 60,146,268 | |||
| Empower International Index Fund | 1,620,275,337 | 326,931,033 | (136,028,847) | 190,902,186 | |||
| Empower International Value Fund | 1,164,581,648 | 191,764,557 | (84,936,375) | 106,828,182 |
2. DERIVATIVE FINANCIAL INSTRUMENTS
The Funds' investment objectives allow each Fund to enter into various types of derivative contracts as outlined in each Fund's prospectus.
In pursuit of the Funds' investment objectives, each Fund may seek to use derivatives to increase or decrease their exposure to the following market risks:
Equity Risk - The risk that relates to the change in value of equity securities as they relate to increases or decreases in the general market.
Foreign Exchange Risk - The risk that adverse fluctuations in exchange rates between the U.S. dollar and other currencies may cause a Fund to lose money on investments denominated in foreign currencies.
A Fund may be exposed to additional risks from investing in derivatives, such as liquidity and counterparty credit risk. Liquidity risk is the risk that a Fund may be unable to sell or close out the derivative in the open market in a timely manner. Counterparty credit risk is the risk that the counterparty will not be able to fulfill its obligations to a Fund, if applicable. Investing in derivatives may also involve greater risks than investing directly in the underlying assets, such as losses in excess of any initial investment and collateral received. In addition, there may be the risk that the change in value of the derivative contract does not correspond to the change in value of the underlying instrument.
Annual Report - December 31, 2023
Futures Contracts
A Fund may use futures contracts in order to capitalize on expected changes in the shape of the yield curve and to control overall interest rate exposure. A futures contract is an agreement between two parties to buy or sell a specified underlying investment for a fixed price at a specified future date. Futures contracts are generally entered into on a regulated futures exchange and cleared through a clearinghouse associated with the exchange. The use of futures contracts may involve risks such as the possibility of illiquid markets or imperfect correlation between the value of the contracts and the underlying securities that comprise the index, or that the clearinghouse will fail to perform its obligations.
Futures contracts are reported in a table following the Schedule of Investments. Upon entering into a futures contract, a Fund is required to pledge to the broker an amount of cash and/or other assets equal to a certain percentage of the contract amount (initial margin deposit). Receipts or payments, known as variation margin, are made or received by a Fund each day, depending on the daily fluctuations in the fair value of the underlying security. This is recorded as variation margin on futures contracts on the Statement of Assets and Liabilities. When a Fund enters into a closing transaction, it will realize, for book purposes, a gain or loss equal to the difference between the value of the futures contract at the time it was opened or purchased and its value at the time it was closed, and is reflected in net realized gain or loss on the Statement of Operations.
Forward Foreign Currency Contracts
A Fund may enter into OTC forward foreign currency contracts (forward contracts) primarily to capture potential returns from changes in currency exchange rates or to reduce the risk of undesired currency exposure. A forward contract is a commitment to purchase or sell a foreign currency at a future date at a negotiated rate.
Forward contracts are reported in a table following the Schedule of Investments. The unrealized appreciation or depreciation is reported on the Statement of Assets and Liabilities and on the Statement of Operations within the net change in unrealized appreciation or depreciation. Upon the closing of such contract the difference between the U.S. dollar cost of the original contract and the value of the foreign currency in U.S. dollars is recorded as net realized gain or loss on the Statement of Operations.
The following tables represent the average month-end volume of each Fund’s derivative transactions, if any, during the reporting period:
| Empower Emerging Markets Equity Fund | |
| Forward Currency Exchange Contracts: | |
| Average notional amount | $104,513 |
| Empower International Index Fund | |
| Futures Contracts: | |
| Average long contracts | 388 |
| Average notional long | $40,701,645 |
| Forward Currency Exchange Contracts: | |
| Average notional amount | $7,092,774 |
Annual Report - December 31, 2023
Derivative Financial Instruments Categorized by Risk Exposure
Valuation of derivative investments as of December 31, 2023 is as follows:
Empower International Index Fund
| Asset Derivatives | Liability Derivatives | |||||||
| Risk Exposure | Statement of Assets and Liabilities Location | Fair Value | Statement of Assets and Liabilities Location | Fair Value | ||||
| Equity contracts (futures contracts) | Net unrealized appreciation on futures contracts | $1,727,921 (a) | ||||||
| Foreign exchange contracts (forwards) | Unrealized appreciation on forward foreign currency contracts | $ 730 | Unrealized depreciation on forward foreign currency contracts | $(302,523) | ||||
| (a)Includes cumulative appreciation of futures contracts as reported in the Fund’s Schedule of Investments. Only current day’s variation margin is reported within the Statement of Assets and Liabilities. |
The effect of derivative investments for the year ended December 31, 2023 is as follows:
Empower Emerging Markets Equity Fund
| Net Change in Unrealized Gain (Loss) | ||||
| Risk Exposure | Statement of Operations Location | Fair Value | ||
| Foreign exchange contracts (forwards) | Net realized loss on forward foreign currency contracts | $(23,082) | ||
Empower International Index Fund
| Realized Gain or (Loss) | Change in Unrealized Appreciation or (Depreciation) | |||||
| Risk Exposure | Statement of Operations Location | Statement of Operations Location | ||||
| Equity contracts (futures contracts) | Net realized gain on futures contracts | $4,758,083 | Net change in unrealized appreciation on futures contracts | $1,961,464 | ||
| Foreign exchange contracts (forwards) | Net realized gain on forward foreign currency contracts | $ 83,604 | Net change in unrealized depreciation on forward foreign currency contracts | $ (27,318) | ||
Concentration Risk
A Fund may have elements of risk due to concentrated investments in foreign issuers located in a specific country. Such concentrations may subject a Fund to additional risks resulting from future political or economic conditions and/or possible impositions of adverse foreign governmental laws or currency exchange restrictions. Investments in securities of non-U.S. issuers have unique risks not present in securities of U.S. issuers, such as greater price volatility and less liquidity.
3. OFFSETTING ASSETS AND LIABILITIES
The Empower International Index Fund may enter into derivative transactions with several approved counterparties. Certain transactions are effected under agreements which include master netting arrangements which provide for the netting of payment obligations and/or netting in situations of counterparty default. The following table summarizes this Fund's financial investments that are subject to an enforceable master netting arrangement at December 31, 2023.
Empower International Index Fund
| Investments: | Gross Amount Presented in the Statement of Assets and Liabilities (a) | Financial Instruments Available for Offset | Financial Instruments Collateral Received | Cash Collateral Pledged (Received) | Net Amount |
| Derivative Assets (forward contracts) | $ 730 | $(730) | $— | $— | $ — |
| Derivative Liabilities (forward contracts) | $(302,523) | $ 730 | $— | $— | $(301,793) |
| (a) OTC derivatives are reported gross on the Statement of Assets and Liabilities. | |||||
Annual Report - December 31, 2023
4. INVESTMENT ADVISORY AGREEMENT AND OTHER TRANSACTIONS WITH AFFILIATES
Empower Funds entered into an investment advisory agreement with ECM, a wholly-owned subsidiary of Empower Annuity Insurance Company of America (Empower of America) as of December 31, 2023. As compensation for its services to Empower Funds, the Adviser receives the below monthly compensation at the described annual rate of each Fund’s average daily net assets. Certain administration and accounting services fees for each Fund are included in the investment advisory agreement.
| Fund Name | Annual Advisory Rate |
| Empower Emerging Markets Equity Fund | 0.93% up to $1 billion dollars |
| 0.88% over $1 billion dollars | |
| 0.83% over $2 billion dollars | |
| Empower International Growth Fund | 0.82% up to $1 billion dollars |
| 0.77% over $1 billion dollars | |
| 0.72% over $2 billion dollars | |
| Empower International Index Fund | 0.25% up to $1 billion dollars |
| 0.20% over $1 billion dollars | |
| 0.15% over $2 billion dollars | |
| Empower International Value Fund | 0.67% |
The Adviser contractually agreed to waive fees or reimburse expenses that exceed the annual rate, shown in the table below, of each Fund’s average daily net assets attributable to each Class, including management fees and expenses paid directly by each Fund, excluding shareholder service fees, distribution fees (if applicable) and certain extraordinary expenses (the “Expense Limit”). The agreement's current term ends on April 30, 2024 and automatically renews for one-year unless terminated upon written notice within 90 days of the end of the current term or upon termination of the investment advisory agreement. The amount waived or reimbursed, if any, is reflected in the Statement of Operations.
| Fund Name | Expense Limit Annual Rate |
| Empower Emerging Markets Equity Fund(a) | 0.91% |
| Empower International Growth Fund | 0.85% |
| Empower International Index Fund | 0.32% |
| Empower International Value Fund | 0.72% |
(a) Prior to April 28, 2023, the Empower Emerging Markets Equity Fund expense limit annual rate was 0.88%
The Adviser is permitted upon approval by the Board of Directors to recoup amounts waived or reimbursed by each Fund in future periods, not exceeding three years following the particular waiver/reimbursement, provided the total annual operating expenses of each Class of each Fund plus such recoupment do not exceed the lesser of the Expense Limit that was in place at the time of the waiver/reimbursement or the Expense Limit in place at the time of recoupment. At December 31, 2023, the amounts subject to recoupment were as follows:
Empower Emerging Markets Equity Fund
| Expires December 31, 2024 | Expires December 31, 2025 | Expires December 31, 2026 | Recoupment of Past Reimbursed Fees by the Adviser | |||
| $791,665 | $1,124,036 | $927,371 | $0 |
Annual Report - December 31, 2023
Empower International Growth Fund
| Expires December 31, 2024 | Expires December 31, 2025 | Expires December 31, 2026 | Recoupment of Past Reimbursed Fees by the Adviser | |||
| $80,917 | $149,953 | $141,113 | $0 |
Empower International Index Fund
| Expires December 31, 2024 | Expires December 31, 2025 | Expires December 31, 2026 | Recoupment of Past Reimbursed Fees by the Adviser | |||
| $0 | $0 | $0 | $0 |
Empower International Value Fund
| Expires December 31, 2024 | Expires December 31, 2025 | Expires December 31, 2026 | Recoupment of Past Reimbursed Fees by the Adviser | |||
| $4,090 | $63,952 | $0 | $0 |
The Adviser and Empower Funds entered into a sub-advisory agreement with and is responsible for compensating the Sub-Advisers below for their services:
Empower Emerging Markets Equity Fund - Lazard Asset Management LLC and Goldman Sachs Asset Management, L.P. Effective June 1, 2023, GSAM replaced UBS Asset Management (Americas) Inc. as sub-adviser to the Fund.
Empower International Growth Fund - Franklin Templeton Institutional, LLC and J.P. Morgan Investment Management, Inc.
Empower International Index Fund - Irish Life Investment Managers Limited ILIM, is an affiliate of the Adviser and Empower of America and receives monthly compensation for its services at the annual rate of 0.02% of the Fund's net assets.
Empower International Value Fund - LSV Asset Management and Massachusetts Financial Services Company.
Empower Funds entered into a shareholder services agreement with Empower Retirement, LLC (Empower), an affiliate of ECM and subsidiary of Empower of America. Pursuant to the shareholder services agreement, Empower provides various recordkeeping, administrative and shareholder services to shareholders and receives from the Investor Class shares of each Fund a fee equal to 0.35% of the average daily net asset value of the applicable share class.
Empower Financial Services, Inc (the Distributor), is a wholly-owned subsidiary of Empower of America and the principal underwriter to distribute and market each Fund.
Certain officers of Empower Funds are also directors and/or officers of Empower of America or its subsidiaries. No officer or interested director of Empower Funds receives any compensation directly from Empower Funds. The total compensation paid to the independent directors with respect to all forty-five funds for which they serve as directors was $1,223,500 for the fiscal year ended December 31, 2023.
5. PURCHASES AND SALES OF INVESTMENTS
For the year ended December 31, 2023, the aggregate cost of purchases and proceeds from sales of investments (excluding all U.S. Government securities and short-term securities) were as follows:
| Purchases | Sales | ||
| Empower Emerging Markets Equity Fund | $741,372,588 | $589,826,602 | |
| Empower International Growth Fund | 268,980,031 | 273,392,256 | |
| Empower International Index Fund | 365,442,140 | 295,171,668 | |
| Empower International Value Fund | 243,372,321 | 560,301,828 |
For the same period, there were no purchases or sales of long-term U.S. Government securities.
Annual Report - December 31, 2023
6. SECURITIES LOANED
Each Fund has entered into a securities lending agreement with its custodian as securities lending agent. Under the terms of the agreement each Fund receives income after deductions of other amounts payable to the securities lending agent or to the borrower from lending transactions. In exchange for such fees, the securities lending agent is authorized to loan securities on behalf of each Fund against receipt of cash collateral at least equal in value at all times to the value of the securities loaned plus accrued interest. The fair value of the loaned securities is determined daily at the close of business of each Fund and necessary collateral adjustments are made between such Fund and its counterparties on the next business day through the delivery or receipt of additional collateral. Each Fund also continues to receive interest or dividends on the securities loaned. Cash collateral is invested in securities approved by the Board of Directors. Each Fund bears the risk of any deficiency in the amount of collateral available for return to a borrower due to a loss in an approved investment.
Collateral was invested in Repurchase Agreements collateralized by U.S. Government or U.S. Government Agency securities. The Repurchase Agreements can be jointly purchased with other lending agent clients and in the event of a default by the counterparty, all lending agent clients would share ratably in the collateral. As of December 31, 2023, each Fund's securities on loan value and collateral received, as reported on the Statement of Assets and Liabilities, were as follows:
| Market Value | Collateral Received | ||
| Empower Emerging Markets Equity Fund | $5,950,802 | $6,359,505 | |
| Empower International Growth Fund | 12,909,808 | 13,794,200 | |
| Empower International Index Fund | 44,113,026 | 47,295,333 | |
| Empower International Value Fund | 33,010,996 | 36,904,950 | |
Under the securities lending agreement, the collateral pledged is, by definition, the securities loaned against the cash borrowed. The following tables summarizes the cash collateral liability under the securities lending agreement by class of securities loaned as of December 31, 2023. Additional information regarding each Fund's securities on loan is included in the Schedule of Investments.
| Empower Emerging Markets Equity Fund | Total (a) |
| Common Stocks | $6,359,505 |
| Total secured borrowings | $6,359,505 |
| Empower International Growth Fund | Total (a) |
| Common Stocks | $13,794,200 |
| Total secured borrowings | $13,794,200 |
| Empower International Index Fund | Total (a) |
| Common Stocks | $47,295,333 |
| Total secured borrowings | $47,295,333 |
| Empower International Value Fund | Total (a) |
| Common Stocks | $36,904,950 |
| Total secured borrowings | $36,904,950 |
| (a) | The remaining contractual maturity of the secured borrowing related to each class of collateral is overnight and continuous. |
7. INDEMNIFICATIONS
The Funds' organizational documents provide current and former officers and directors with a limited indemnification against liabilities arising in connection with the performance of their duties to the Funds. In the normal course of business, a Fund may also enter into contracts that provide general indemnifications. A Fund's maximum exposure under these arrangements is unknown as this would be dependent on future claims that may be made against the Fund. The risk of material loss from such claims is considered remote.
Annual Report - December 31, 2023
8. SUBSEQUENT EVENTS
Management has reviewed all events subsequent to December 31, 2023, including the estimates inherent in the process of preparing these financial statements through the date the financial statements were issued. No subsequent events requiring adjustments or disclosures have occurred.
Annual Report - December 31, 2023
REPORT OF INDEPENDENT REGISTERED PUBLIC ACCOUNTING FIRM
To the Shareholders and the Board of Directors of Empower Funds, Inc.
Opinion on the Financial Statements and Financial Highlights
We have audited the accompanying statements of assets and liabilities, including the schedules of investments, of Empower Emerging Markets Equity Fund, Empower International Growth Fund, Empower International Index Fund, and Empower International Value Fund (the “Funds”), four of the funds comprising Empower Funds, Inc., as of December 31, 2023, the related statements of operations for the year then ended, the statements of changes in net assets for each of the two years in the period then ended, the financial highlights for each of the five years in the period then ended, and the related notes. In our opinion, the financial statements and financial highlights present fairly, in all material respects, the financial position of each of the Funds as of December 31, 2023, and the results of their operations for the year then ended, the changes in their net assets for each of the two years in the period then ended, and the financial highlights for each of the five years in the period then ended in conformity with accounting principles generally accepted in the United States of America.
Basis for Opinion
These financial statements and financial highlights are the responsibility of the Funds’ management. Our responsibility is to express an opinion on the Funds’ financial statements and financial highlights based on our audits. We are a public accounting firm registered with the Public Company Accounting Oversight Board (United States) (PCAOB) and are required to be independent with respect to the Funds in accordance with the U.S. federal securities laws and the applicable rules and regulations of the Securities and Exchange Commission and the PCAOB.
We conducted our audits in accordance with the standards of the PCAOB. Those standards require that we plan and perform the audit to obtain reasonable assurance about whether the financial statements and financial highlights are free of material misstatement, whether due to error or fraud. The Funds are not required to have, nor were we engaged to perform, an audit of their internal control over financial reporting. As part of our audits, we are required to obtain an understanding of internal control over financial reporting but not for the purpose of expressing an opinion on the effectiveness of the Funds’ internal control over financial reporting. Accordingly, we express no such opinion.
Our audits included performing procedures to assess the risks of material misstatement of the financial statements and financial highlights, whether due to error or fraud, and performing procedures that respond to those risks. Such procedures included examining, on a test basis, evidence regarding the amounts and disclosures in the financial statements and financial highlights. Our audits also included evaluating the accounting principles used and significant estimates made by management, as well as evaluating the overall presentation of the financial statements and financial highlights. Our procedures included confirmation of securities owned as of December 31, 2023, by correspondence with the custodian and brokers; when replies were not received from brokers, we performed other auditing procedures. We believe that our audits provide a reasonable basis for our opinion.
DELOITTE & TOUCHE LLP
Denver, Colorado
February 23, 2024
February 23, 2024
We have served as the auditor of one or more Empower investment companies since 1982.
TAX INFORMATION (unaudited)
Each Fund intends to pass through foreign tax credits and have derived gross income from sources within foreign countries. For the year ended December 31, 2023, the following are the foreign taxes credits and gross income from foreign countries amounts for each Fund.
| Foreign Tax Credits | Gross Income from Foreign Countries | ||
| Empower Emerging Markets Equity Fund | $18,273,944 | $2,263,567 | |
| Empower International Growth Fund | 486,356 | 6,962,069 | |
| Empower International Index Fund | 50,675,050 | 4,029,957 | |
| Empower International Value Fund | 50,708,133 | 4,662,816 |
Dividends paid by each Fund from net investment income and distributions of net realized short-term capital gains are, for federal income tax purposes, taxable as ordinary income to shareholders. Of the ordinary income distributions declared for the year ended December 31, 2023, the following are the percentages that qualify for the dividend received deduction available to each Fund's corporate shareholders.
| Percent of Ordinary Income Distributions Qualifying for Dividends Received | |
| Empower Emerging Markets Equity Fund | 2% |
| Empower International Growth Fund | 0% |
| Empower International Index Fund | 0% |
| Empower International Value Fund | 0% |
Fund Directors and Officers
Empower Funds is organized under Maryland law, and is governed by the Board of Directors. The following table provides information about each of the Directors and executive officers of Empower Funds.
| Independent Directors* | |||||
| Name, Address, and Age | Positions(s) Held with Empower Funds | Term of Office and Length of Time Served** | Principal Occupation(s) During Past 5 Years | Number of Funds in Fund Complex Overseen by Director | Other Directorships Held by Director |
| Gail H. Klapper 8515 East Orchard Road, Greenwood Village, CO 80111 80 | Chair & Independent Director | Since 2016 (as Chair) Since 2007 (as Independent Director) | Managing Attorney, Klapper Law Firm; Member/Director, The Colorado Forum; Manager, 6K Ranch, LLC; and former Director, Guaranty Bancorp | 45 | Director, Gold, Inc. |
| James A. Hillary*** 8515 East Orchard Road, Greenwood Village, CO 80111 60 | Independent Director | Since 2017 | Principal and Founding Partner, Fios Capital, LLC; Member, Fios Partners LLC, Fios Holdings LLC; Sole Member, Fios Companies LLC, Resolute Capital Asset Partners; Manager, Applejack Holdings, LLC; and Manager and Member, Prestige Land Holdings, LLC | 45 | N/A |
| R. Timothy Hudner**** 8515 East Orchard Road, Greenwood Village, CO 80111 64 | Independent Director | Since 2017 | Director, Colorado State Housing Board; and former Director, Grand Junction Housing Authority; Counseling and Education Center | 45 | N/A |
| Steven A. Lake 8515 East Orchard Road, Greenwood Village, CO 80111 69 | Independent Director | Since 2017 | Managing Member, Lake Advisors, LLC; Member, Gart Capital Partners, LLC; and Executive Member, Sage Enterprise Holdings, LLC | 45 | N/A |
| Stephen G. McConahey 8515 East Orchard Road, Greenwood Village, CO 80111 80 | Independent Director & Audit Committee Chair | Since 2011 (as Independent Director) Since 2015 (as Audit Committee Chair) | Chairman, SGM Capital, LLC; Partner, Iron Gate Capital, LLC; Director, The IMA Financial Group, Inc.; and former Director, Guaranty Bancorp | 45 | N/A |
| Interested Director***** | |||||
| Name, Address, and Age | Positions(s) Held with Empower Funds | Term of Office and Length of Time Served | Principal Occupation(s) During Past 5 Years | Number of Funds in Fund Complex Overseen by Director | Other Directorships Held by Director |
| Jonathan D. Kreider 8515 East Orchard Road, Greenwood Village, CO 80111 40 | Director, President & Chief Executive Officer | Since 2020 | Executive Vice President & Head of Empower Investments, Empower, Empower of America and Empower Life & Annuity Insurance Company of New York (“Empower of NY”); President, Chief Executive Officer & Manager, ECM; formerly, Vice President, Empower Funds Investment Products and Empower Advisory Group, LLC (“EAG”) | 45 | N/A |
| Officers | |||||
| Name, Address, and Age | Positions(s) Held with Empower Funds | Term of Office and Length of Time Served | Principal Occupation(s) During Past 5 Years | Number of Fund in Fund Complex Overseen by Director | Other Directorships Held by Director |
| Jonathan D. Kreider 8515 East Orchard Road, Greenwood Village, CO 80111 40 | Director, President & Chief Executive Officer | Since 2020 | Executive Vice President & Head of Empower Investments, Empower, Empower of America and Empower of NY; President, Chief Executive Officer & Manager, ECM; formerly, Vice President, Empower Funds Investment Products and EAG | 45 | N/A |
| Katherine Stoner 8515 East Orchard Road, Greenwood Village, CO 80111 67 | Chief Compliance Officer | Since 2016 | Vice President, Compliance Empower Investments, Empower; Chief Compliance Officer, ECM and EAG | N/A | N/A |
| Ryan L. Logsdon 8515 East Orchard Road, Greenwood Village, CO 80111 49 | Chief Legal Officer & Secretary | Since 2010 (as Secretary) Since 2021 (as Chief Legal Officer) | Vice President, Deputy General Counsel & Corporate Secretary, Empower, Empower of America & Empower of NY; Vice President & Counsel, ECM; formerly, Vice President & Counsel, Empower Funds; Vice President, Counsel & Secretary, EAG & EFSI | N/A | N/A |
| Kelly B. New 8515 East Orchard Road, Greenwood Village, CO 80111 48 | Chief Financial Officer & Treasurer | Since 2021 | Vice President, Fund Administration, Empower; Chief Financial Officer & Treasurer, ECM; Vice President & Treasurer, CITs, Empower Trust Company, LLC (“ETC”); formerly, Assistant Treasurer Empower Funds, ECM & ETC | N/A | N/A |
| Officers | |||||
| Name, Address, and Age | Positions(s) Held with Empower Funds | Term of Office and Length of Time Served | Principal Occupation(s) During Past 5 Years | Number of Fund in Fund Complex Overseen by Director | Other Directorships Held by Director |
| John A. Clouthier 8515 East Orchard Road, Greenwood Village, CO 80111 56 | Assistant Treasurer | Since 2007 | Vice President, Fund Administration, Empower; Assistant Treasurer, ECM; Assistant Vice President and Assistant Treasurer, ETC | N/A | N/A |
| Abhijit Dande 8515 East Orchard Road, Greenwood Village, CO 80111 43 | Derivatives Risk Manager | Since 2022 | Vice President, Financial Risk Management, Empower; Derivatives Risk Manager, ECM | N/A | N/A |
* A Director who is not an “interested person” of Empower Funds (as defined in Section 2(a)(19) of the 1940 Act, as amended) is referred to as an “Independent Director.”
** Each Director serves until the next shareholders’ meeting (and until the election and qualification of a successor), or until death, resignation, removal or retirement which takes effect no later than May 1 following his or her 75th birthday unless otherwise determined by the remaining directors. The remaining Independent Directors determined that Ms. Klapper and Mr. McConahey should continue on the Board until at least May 1, 2024. Officers are elected by the Board on an annual basis to serve until their successors have been elected and qualified.
*** Mr. Hillary is the sole member of Resolute Capital Asset Partners LLC, which is the general partner for Resolute Capital Asset Partners Fund I LP. Goldman Sachs & Co. LLC, the clearing agent and custodian for Resolute Capital Asset Partners Fund I LP, is the parent company of Goldman Sachs Asset Management, LP, the Sub-Adviser of the Empower Inflation-Protected Securities Fund, Empower Mid Cap Value Fund and other series of Empower Funds; and a Sub-Adviser of the Empower Core Bond Fund. Mr. Hillary has personal banking accounts with an affiliate of J.P. Morgan Investment Management Inc., a Sub-Adviser of the Empower International Growth Fund, Empower Large Cap Growth Fund and other series of Empower Funds. Mr. Hillary receives no special treatment due to the relationship.
**** Mr. Hudner’s daughter is employed by JP Morgan Chase, N.A., an affiliate of J.P. Morgan Investment Management Inc., a Sub-Adviser of the Empower International Growth Fund, Empower Large Cap Growth Fund and other series of Empower Funds. Mr. Hudner has personal investments in the following: (1) a mutual fund advised by Lazard Asset Management LLC, a Sub-Adviser of the Empower Emerging Markets Equity Fund, (2) a mutual fund advised by Massachusetts Financial Services Company, a Sub-Adviser of the Empower International Value Fund, and (3) a mutual fund advised by Virtus Investment Advisers, Inc., an affiliate of Virtus Fixed Income Advisers, LLC, a Sub-Adviser of the Empower Multi-Sector Bond Fund. Mr. Hudner receives no special treatment due to his ownership of such mutual funds.
***** An “Interested Director” refers to a Director who is an “interested person” of Empower Funds (as defined in Section 2(a)(19) of the 1940 Act, as amended) by virtue of their affiliation with ECM.
There are no arrangements or understandings between any Director or officer and any other person(s) pursuant to which s/he was elected as Director or officer.
Additional information about Empower Funds and its Directors is available in the Empower Funds’ Statement of Additional Information (“SAI”), which can be obtained free of charge upon request to: Secretary, Empower Funds, Inc., 8525 East Orchard Road, Greenwood Village, Colorado 80111; (866) 831-7129. The SAI is also available on the Fund’s web site at https://www.empower.com.
Availability of Quarterly Portfolio Schedule
Empower Funds files its complete schedule of portfolio holdings with the Securities and Exchange Commission for the first and third quarters of each fiscal year as an exhibit to its reports on Form N-PORT. Empower Funds’ Form N-PORT reports are available on the Commission’s website at http://www.sec.gov.
Availability of Proxy Voting Policies and Procedures
A description of the policies and procedures that Empower Funds uses to determine how to vote proxies relating to portfolio securities is available without charge, upon request, by calling (866) 831-7129, and on the Securities and Exchange Commission’s website at http://www.sec.gov.
Availability of Proxy Voting Record
Information regarding how Empower Funds voted proxies relating to portfolio securities during the most recent 12-month period ended June 30 is available without charge, upon request, by calling (866) 831-7129, and on the Securities and Exchange Commission’s website at http://www.sec.gov.
ITEM 2. CODE OF ETHICS.
(a) As of the end of the period covered by this report, the registrant has adopted a Code of Ethics (the “Code of Ethics”) that applies to the registrant's principal executive officer, principal financial officer, principal accounting officer or controller, or persons performing similar functions, regardless of whether these individuals are employed by the registrant or a third party.
(b) For purposes of this Item, "code of ethics" means written standards that are reasonably designed to deter wrongdoing and to promote:
(1) Honest and ethical conduct, including the ethical handling of actual or apparent conflicts of interest between personal and professional relationships;
(2) Full, fair, accurate, timely, and understandable disclosure in reports and documents that a registrant files with, or submits to, the Commission and in other public communications made by the registrant;
(3) Compliance with applicable governmental laws, rules, and regulations;
(4) The prompt internal reporting of violations of the code to an appropriate person or persons identified in the code; and
(5) Accountability for adherence to the code.
(c) During the period covered by this report, there have been no amendments to the registrant’s Code of Ethics.
(d) During the period covered by this report, the registrant has not granted any express or implicit waivers from the provisions of the Code of Ethics.
(e) Registrant’s Code of Ethics is attached hereto.
ITEM 3. AUDIT COMMITTEE FINANCIAL EXPERT.
Mr. Stephen A. Lake is the audit committee financial expert and is "independent," pursuant to general instructions on Form N-CSR, Item 3.
An “audit committee financial expert” is not an “expert” for any purpose, including for purposes of Section 11 of the Securities Act of 1933, as a result of being designated as an “audit committee financial expert.” Further, the designation of a person as an “audit committee financial expert” does not mean that the person has any greater duties, obligations, or liability than those imposed on the person without the “audit committee financial expert” designation. Similarly, the designation of a person as an “audit committee financial expert” does not affect the duties, obligations, or liability of any other member of the Audit Committee or Board of Directors.
ITEM 4. PRINCIPAL ACCOUNTANT FEES AND SERVICES.
(a) Audit Fees. The aggregate fees billed for each of the last two fiscal years for professional services rendered by the principal accountant for the audit of the registrant’s annual financial statements or services that are normally provided by the accountant in connection with statutory and regulatory filings or engagements for those fiscal years were: $1,031,500 for fiscal year 2022 and $1,050,700 for fiscal year 2023.
(b) Audit-Related Fees. The aggregate fees billed in each of the last two fiscal years for assurance and related services by the principal accountant that are reasonably related to the performance of the audit of the registrant’s financial statements and are not reported under paragraph (a) of this Item were: $42,000 for fiscal year 2022 and $44,680 for fiscal year 2023. The nature of the services comprising the fees disclosed under this category involved performance of 17f-2 (self-custody) audits and administrative services related to the audit.
(c) Tax Fees. The aggregate fees billed in each of the last two fiscal years for professional services rendered by the principal accountant for tax compliance, tax advice, and tax planning were: $0 for fiscal year 2022 and $0 for fiscal year 2023.
(d) All Other Fees. There were no fees billed in each of the last two fiscal years for products and services provided by the principal accountant, other than the services reported in paragraphs ((a) through (c) of this Item).
(e) (1) Audit Committee’s Pre-Approval Policies and Procedures.
Pre-Approval of Audit Services. The Audit Committee must approve prior to retention all audit, review or attest engagements required under the securities laws that are provided to Empower Funds by its independent auditors. The Audit Committee will not grant such approval to any auditors that are proposed to perform an audit for Empower Funds if a chief executive officer, controller, chief financial officer, chief accounting officer or any person serving in an equivalent position for Empower Funds that is responsible for the financial reporting or operations of Empower Funds was employed by those auditors and participated in any capacity in an audit of Empower Funds during the year period (or such other period proscribed under Securities Exchange Commission rules) preceding the date of initiation of such audit.
Pre-Approval of Non-Audit Services. The Audit Committee must pre-approve any non-audit services, including tax services, to be provided to Empower Funds by its independent auditors (except those within applicable de minimis statutory or regulatory exceptions)1 provided that Empower Funds’ auditors will not provide the following non-audit services to Empower Funds: (a) bookkeeping or other services related to the accounting records or financial statements of Empower Funds; (b) financial information systems design and implementation; (c) appraisal or valuation services, fairness opinions, or contribution-in-kind reports; (d) actuarial services; (e) internal audit outsourcing services; (f) management functions or human resources; (g) broker-dealer, investment adviser, or investment banking services; (h) legal services; (i) expert services unrelated to the audit; and (j) any other service that the Public Company Accounting Oversight Board determines, by regulation, is impermissible. 2
Pre-approval with respect to Non-Empower Funds Entities. The Audit Committee must pre-approve any non-audit services that relate directly to the operations and financial reporting of Empower Funds (except those within applicable de minimis statutory or regulatory exceptions)3 to be provided by Empower Funds’ auditors to (a) Empower Funds’ investment adviser; and (b) any entity controlling, controlled by, or under common control with the investment adviser if that entity provides ongoing services to Empower Funds.4 The Audit Committee may approve audit and non-audit services on a case-by-case basis or adopt pre-approval policies and procedures that are detailed as to a particular service, provided that the Audit Committee is informed promptly of each service, or use a combination of these approaches.
Delegation . The Audit Committee may delegate pre-approval authority to one or more of the Audit Committee's members. Any member or members to whom such pre-approval authority is delegated
must report any pre-approval decisions to the Audit Committee at its next scheduled meeting.
(f) (2) 100% of the services described pursuant to paragraphs (b) through (d) of this Item 4 of Form N-CSR were approved by the Audit Committee, and no such services were approved by the Audit Committee pursuant to paragraph (c)(7)(i)(C) of Rule 2-01 of Regulation S-X.
(g) Not Applicable.
(h) The aggregate non-audit fees billed by the registrant’s accountant for services rendered to the registrant, and rendered to the registrant’s investment adviser (not including any sub-adviser whose role is primarily portfolio management and is subcontracted with or overseen by another investment adviser), and any entity controlling, controlled by, or under common control with the adviser that provides ongoing services to the registrant for fiscal year 2022 equaled $1,022,840 and for fiscal year 2023 equaled $1,795,449.
(i) The registrant’s Audit Committee of the Board of Directors has considered whether the provision of non-audit services that were rendered to the registrant’s investment adviser (not including any subadviser whose role is primarily portfolio management and is subcontracted with or overseen by another investment adviser), and any entity controlling, controlled by, or under common control with the investment adviser that provides ongoing services to the registrant that were not pre-approved pursuant to paragraph (c)(7)(ii) of Rule 2-01 of Regulation S-X is compatible with maintaining the principal accountant’s independence.
ITEM 5. AUDIT COMMITTEE OF LISTED REGISTRANTS.
Not applicable.
ITEM 6. INVESTMENTS.
(a) The schedule is included as part of the report to shareholders filed under Item 1 of this Form.
(b) Not applicable.
ITEM 7. DISCLOSURE OF PROXY VOTING POLICIES AND PROCEDURES FOR CLOSED-END MANAGEMENT INVESTMENT COMPANIES.
Not applicable.
ITEM 8. PORTFOLIO MANAGERS OF CLOSED-END MANAGEMENT INVESTMENT COMPANIES.
Not applicable.
ITEM 9. PURCHASE OF EQUITY SECURITIES BY CLOSED-END MANAGEMENT INVESTMENT COMPANY AND AFFILIATED PURCHASERS.
Not applicable.
ITEM 10. SUBMISSION OF MATTERS TO A VOTE OF SECURITY HOLDERS.
There have been no material changes to the procedures by which shareholders may recommend nominees to the registrant’s board of directors that were implemented after the registrant last provided disclosure in response to this Item.
ITEM 11. CONTROLS AND PROCEDURES.
(a) The registrant's principal executive officer and principal financial officer have concluded, based upon their evaluation of the registrant's disclosure controls and procedures as conducted within 90 days of the filing date of this report, that these disclosure controls and procedures provide reasonable assurance that material information required to be disclosed by the registrant in the report it files or submits on Form N-CSR is recorded, processed, summarized and reported, within the time periods specified in the commission's rules and forms and that such material information is accumulated and communicated to the registrant's management, including its principal executive officer and principal financial officer, as appropriate, in order to allow timely decisions regarding required disclosure.
(b) The registrant's principal executive officer and principal financial officer are aware of no changes in the registrant's internal control over financial reporting that occurred during the registrant's most recent fiscal half-year that has materially affected, or is reasonably likely to materially affect, the registrant's internal control over financial reporting.
ITEM 12. DISCLOSURE OF LENDING ACTIVITES FOR CLOSED-END MANAGEMENT INVESTMENT COMPANIES.
(a) Not applicable.
ITEM 13. EXHIBITS.
(3) Not applicable.
(4) Not applicable.
1No pre-approval is required as to non-audit services provided to Empower Funds if: (a) the aggregate amount of all non-audit services provided to Empower Funds constitute not more than 5% of the total amount of revenues paid by Empower Funds to the independent auditors during the fiscal year in which the services are provided; (b) these services were not recognized by Empower Funds at the time of the engagement to be non-audit services; and (c) the services are promptly brought to the attention of the Audit Committee and approved by the Audit Committee prior to the completion of the audit.
2With respect to the prohibitions on (a) bookkeeping; (b) financial information systems design and implementation; (c) appraisal, valuation, fairness opinions, or contribution-in-kind reports; (d) actuarial; and (e) internal audit outsourcing, such services are permitted to be provided if it is reasonable to conclude that the results of these services will not be subject to audit procedures during an audit of the audit client's financial statements.
3For non-audit services provided to the adviser and entities in a control relationship with the adviser, no pre-approval is required if: (a) the aggregate amount of all non-audit services provided constitute not more than 5% of the total amount of revenues paid to the independent auditors during the fiscal year in which the services are provided to Empower Funds, Empower Funds’ investment adviser, and any entity controlling, controlled by, or under common control with the investment adviser if that entity provides ongoing services to Empower Funds; (b) these services were not recognized by Empower Funds at the time of the engagement to be non-audit services; and (c) the services are promptly brought to the attention of the Audit Committee and approved by the Audit Committee prior to the completion of the audit.
4No pre-approval is required by the Audit Committee as to non-audit services provided to any Empower Funds sub-adviser that primarily provides portfolio management services and is under the direction of another investment adviser and is not affiliated with Empower Funds’ primary investment adviser.
SIGNATURES
Pursuant to the requirements of the Securities Exchange Act of 1934 and the Investment Company Act of 1940, the registrant has duly caused this report to be signed on its behalf by the undersigned, thereunto duly authorized.
EMPOWER FUNDS, INC.
| By: | /s/ Jonathan D. Kreider |
Jonathan D. Kreider
Director, President & Chief Executive Officer
Director, President & Chief Executive Officer
Date:February 23, 2024
Pursuant to the requirements of the Securities Exchange Act of 1934 and the Investment Company Act of 1940, this report has been signed below by the following persons on behalf of the registrant and in the capacities and on the dates indicated.
| By: | /s/ Jonathan D. Kreider |
Jonathan D. Kreider
Director, President & Chief Executive Officer
Director, President & Chief Executive Officer
Date:February 23, 2024
| By: | /s/ Kelly B. New |
Kelly B. New
Chief Financial Officer & Treasurer
Chief Financial Officer & Treasurer
Date:February 23, 2024