UNITED STATES
SECURITIES AND EXCHANGE COMMISSION
Washington, D.C. 20549
FORM N-CSR
CERTIFIED SHAREHOLDER REPORT OF REGISTERED
MANAGEMENT INVESTMENT COMPANIES
Investment Company Act file number 811-3329
Variable Insurance Products Fund
(Exact name of registrant as specified in charter)
82 Devonshire St., Boston, Massachusetts 02109
(Address of principal executive offices) (Zip code)
Scott C. Goebel, Secretary
82 Devonshire St.
Boston, Massachusetts 02109
(Name and address of agent for service)
Registrant's telephone number, including area code: 617-563-7000
Date of fiscal year end: | December 31 |
| |
Date of reporting period: | June 30, 2010 |
Item 1. Reports to Stockholders
Fidelity® Variable Insurance Products:
Equity-Income Portfolio
Semiannual Report
June 30, 2010
(2_fidelity_logos) (Registered_Trademark)
Contents
Shareholder Expense Example | <Click Here> | An example of shareholder expenses. |
Investment Changes | <Click Here> | A summary of major shifts in the fund's investments over the past six months. |
Investments | <Click Here> | A complete list of the fund's investments with their market values. |
Financial Statements | <Click Here> | Statements of assets and liabilities, operations, and changes in net assets, as well as financial highlights. |
Notes | <Click Here> | Notes to the financial statements. |
To view a fund's proxy voting guidelines and proxy voting record for the 12-month period ended June 30, visit http://www.fidelity.com/proxyvotingresults or visit the Securities and Exchange Commission's (SEC) web site at http://www.sec.gov. You may also call 1-877-208-0098 to request a free copy of the proxy voting guidelines.
Fidelity Variable Insurance Products are separate account options which are purchased through a variable insurance contract.
Standard & Poor's, S&P and S&P 500 are registered service marks of The McGraw-Hill Companies, Inc. and have been licensed for use by Fidelity Distributors Corporation.
Other third party marks appearing herein are the property of their respective owners.
All other marks appearing herein are registered or unregistered trademarks or service marks of FMR LLC or an affiliated company.
This report and the financial statements contained herein are submitted for the general information of the shareholders of the fund. This report is not authorized for distribution to prospective investors in the fund unless preceded or accompanied by an effective prospectus.
A fund files its complete schedule of portfolio holdings with the SEC for the first and third quarters of each fiscal year on Form N-Q. Forms N-Q are available on the SEC's web site at http://www.sec.gov. A fund's Forms N-Q may be reviewed and copied at the SEC's Public Reference Room in Washington, DC. Information regarding the operation of the SEC's Public Reference Room may be obtained by calling 1-800-SEC-0330. For a complete list of a fund's portfolio holdings, view the most recent holdings listing, semiannual report, or annual report on Fidelity's web site at http://www.fidelity.com or http://www.advisor.fidelity.com, as applicable.
NOT FDIC INSURED • MAY LOSE VALUE • NO BANK GUARANTEE
Neither the fund nor Fidelity Distributors Corporation is a bank.
Semiannual Report
As a shareholder of the Fund, you incur two types of costs: (1) transaction costs, including redemption fees, and (2) ongoing costs, including management fees, distribution and/or service (12b-1) fees and other Fund expenses. This Example is intended to help you understand your ongoing costs (in dollars) of investing in the Fund and to compare these costs with the ongoing costs of investing in other mutual funds.
The Example is based on an investment of $1,000 invested at the beginning of the period and held for the entire period (January 1, 2010 to June 30, 2010).
Actual Expenses
The first line of the accompanying table for each class of the Fund provides information about actual account values and actual expenses. You may use the information in this line, together with the amount you invested, to estimate the expenses that you paid over the period. Simply divide your account value by $1,000.00 (for example, an $8,600 account value divided by $1,000.00 = 8.6), then multiply the result by the number in the first line for a class of the Fund under the heading entitled "Expenses Paid During Period" to estimate the expenses you paid on your account during this period. The estimate of expenses does not include any fees or other expenses of any variable annuity or variable life insurance product. If they were, the estimate of expenses you paid during the period would be higher, and your ending account value would be lower. In addition, the Fund, as a shareholder in the underlying Fidelity Central Funds, will indirectly bear its pro-rata share of the fees and expenses incurred by the underlying Fidelity Central Funds. These fees and expenses are not included in the Fund's annualized expense ratio used to calculate the expense estimate in the table below.
Hypothetical Example for Comparison Purposes
The second line of the accompanying table for each class of the Fund provides information about hypothetical account values and hypothetical expenses based on a Class' actual expense ratio and an assumed rate of return of 5% per year before expenses, which is not the Class' actual return. The hypothetical account values and expenses may not be used to estimate the actual ending account balance or expenses you paid for the period. You may use this information to compare the ongoing costs of investing in the Fund and other funds. To do so, compare this 5% hypothetical example with the 5% hypothetical examples that appear in the shareholder reports of the other funds. The estimate of expenses does not include any fees or other expenses of any variable annuity or variable life insurance product. If they were, the estimate of expenses you paid during the period would be higher, and your ending account value would be lower. In addition, the Fund, as a shareholder in the underlying Fidelity Central Funds, will indirectly bear its pro-rata share of the fees and expenses incurred by the underlying Fidelity Central Funds. These fees and expenses are not included in the Fund's annualized expense ratio used to calculate the expense estimate in the table below.
Please note that the expenses shown in the table are meant to highlight your ongoing costs only and do not reflect any transaction costs. Therefore, the second line of the table is useful in comparing ongoing costs only, and will not help you determine the relative total costs of owning different funds. In addition, if these transactional costs were included, your costs would have been higher.
| Annualized Expense Ratio | Beginning
Account Value
January 1, 2010 | Ending
Account Value
June 30, 2010 | Expenses Paid
During Period*
January 1, 2010
to June 30, 2010 |
Initial Class | .56% | | | |
Actual | | $ 1,000.00 | $ 928.60 | $ 2.68 |
HypotheticalA | | $ 1,000.00 | $ 1,022.02 | $ 2.81 |
Service Class | .66% | | | |
Actual | | $ 1,000.00 | $ 928.30 | $ 3.16 |
HypotheticalA | | $ 1,000.00 | $ 1,021.52 | $ 3.31 |
Service Class 2 | .81% | | | |
Actual | | $ 1,000.00 | $ 927.60 | $ 3.87 |
HypotheticalA | | $ 1,000.00 | $ 1,020.78 | $ 4.06 |
Service Class 2R | .81% | | | |
Actual | | $ 1,000.00 | $ 927.20 | $ 3.87 |
HypotheticalA | | $ 1,000.00 | $ 1,020.78 | $ 4.06 |
Investor Class | .65% | | | |
Actual | | $ 1,000.00 | $ 927.80 | $ 3.11 |
HypotheticalA | | $ 1,000.00 | $ 1,021.57 | $ 3.26 |
A 5% return per year before expenses
* Expenses are equal to each Class' annualized expense ratio, multiplied by the average account value over the period, multiplied by 181/365 (to reflect the one-half year period).
Semiannual Report
Investment Changes (Unaudited)
Top Ten Stocks as of June 30, 2010 |
| % of fund's
net assets | % of fund's net assets
6 months ago |
JPMorgan Chase & Co. | 3.4 | 3.7 |
Exxon Mobil Corp. | 3.4 | 2.5 |
Wells Fargo & Co. | 3.3 | 3.4 |
Bank of America Corp. | 3.2 | 2.7 |
AT&T, Inc. | 2.4 | 3.1 |
PNC Financial Services Group, Inc. | 2.4 | 1.9 |
Chevron Corp. | 2.3 | 2.8 |
Pfizer, Inc. | 2.1 | 2.5 |
Verizon Communications, Inc. | 1.9 | 1.6 |
Merck & Co., Inc. | 1.7 | 1.7 |
| 26.1 | |
Top Five Market Sectors as of June 30, 2010 |
| % of fund's
net assets | % of fund's net assets
6 months ago |
Financials | 27.5 | 26.4 |
Energy | 15.5 | 15.3 |
Consumer Discretionary | 15.3 | 14.7 |
Industrials | 10.4 | 10.1 |
Information Technology | 7.5 | 8.6 |
Asset Allocation (% of fund's net assets) |
As of June 30, 2010 * | As of December 31, 2009 ** |
 | Stocks 97.3% | | | Stocks 97.8% | |
 | Bonds 2.4% | | | Bonds 2.2% | |
 | Short-Term
Investments and
Net Other Assets 0.3% | | | Short-Term
Investments and
Net Other Assets† 0.0% | |
* Foreign investments | 11.9% | | ** Foreign investments | 13.1% | |

† Amount represents less than 0.1%
Semiannual Report
Investments June 30, 2010 (Unaudited)
Showing Percentage of Net Assets
Common Stocks - 96.4% |
| Shares | | Value |
CONSUMER DISCRETIONARY - 14.0% |
Auto Components - 1.6% |
Johnson Controls, Inc. | 1,580,483 | | $ 42,467,578 |
Michelin CGDE Series B (d) | 241,574 | | 16,830,312 |
The Goodyear Tire & Rubber Co. (a) | 2,128,700 | | 21,159,278 |
| | 80,457,168 |
Automobiles - 1.4% |
Bayerische Motoren Werke AG (BMW) | 166,905 | | 8,111,508 |
Daimler AG (Germany) (a) | 304,125 | | 15,373,518 |
Fiat SpA | 928,477 | | 9,536,562 |
Harley-Davidson, Inc. | 1,437,350 | | 31,952,291 |
Thor Industries, Inc. | 209,500 | | 4,975,625 |
Winnebago Industries, Inc. (a) | 407,511 | | 4,050,659 |
| | 74,000,163 |
Diversified Consumer Services - 0.6% |
Career Education Corp. (a) | 155,414 | | 3,577,630 |
H&R Block, Inc. | 1,687,086 | | 26,470,379 |
| | 30,048,009 |
Hotels, Restaurants & Leisure - 0.7% |
Las Vegas Sands Corp. unit | 85,200 | | 31,948,296 |
Sands China Ltd. | 4,370,400 | | 6,459,570 |
| | 38,407,866 |
Household Durables - 2.5% |
KB Home | 295,900 | | 3,254,900 |
Lennar Corp. Class A | 603,166 | | 8,390,039 |
Newell Rubbermaid, Inc. | 1,898,820 | | 27,798,725 |
Pulte Group, Inc. (a) | 1,665,768 | | 13,792,559 |
Stanley Black & Decker, Inc. | 695,153 | | 35,119,130 |
Techtronic Industries Co. Ltd. | 2,760,500 | | 2,150,976 |
Toll Brothers, Inc. (a) | 170,987 | | 2,797,347 |
Whirlpool Corp. | 413,834 | | 36,342,902 |
| | 129,646,578 |
Internet & Catalog Retail - 0.2% |
Liberty Media Corp. Interactive Series A (a) | 844,241 | | 8,864,531 |
Leisure Equipment & Products - 0.3% |
Brunswick Corp. | 1,013,757 | | 12,601,000 |
Media - 2.7% |
Belo Corp. Series A | 952,224 | | 5,418,155 |
Cablevision Systems Corp. - NY Group Class A | 32,044 | | 769,376 |
CC Media Holdings, Inc. Class A (a) | 693,958 | | 4,614,821 |
Comcast Corp. Class A | 2,031,436 | | 35,286,043 |
Informa PLC | 1,340,858 | | 7,082,087 |
Interpublic Group of Companies, Inc. (a) | 1,023,300 | | 7,296,129 |
The Walt Disney Co. | 1,135,300 | | 35,761,950 |
Time Warner, Inc. | 1,338,383 | | 38,692,653 |
Vivendi | 307,933 | | 6,257,586 |
| | 141,178,800 |
|
| Shares | | Value |
Multiline Retail - 1.7% |
Kohl's Corp. (a) | 597,124 | | $ 28,363,390 |
Macy's, Inc. | 1,157,800 | | 20,724,620 |
Target Corp. | 790,200 | | 38,854,134 |
Tuesday Morning Corp. (a) | 508,423 | | 2,028,608 |
| | 89,970,752 |
Specialty Retail - 2.2% |
Home Depot, Inc. | 2,038,900 | | 57,231,923 |
Lowe's Companies, Inc. | 973,978 | | 19,888,631 |
OfficeMax, Inc. (a) | 429,700 | | 5,611,882 |
RadioShack Corp. | 569,500 | | 11,110,945 |
Staples, Inc. | 986,045 | | 18,784,157 |
| | 112,627,538 |
Textiles, Apparel & Luxury Goods - 0.1% |
Phillips-Van Heusen Corp. | 119,116 | | 5,511,497 |
TOTAL CONSUMER DISCRETIONARY | | 723,313,902 |
CONSUMER STAPLES - 4.2% |
Beverages - 0.7% |
Carlsberg AS Series B | 168,362 | | 12,829,755 |
The Coca-Cola Co. | 499,829 | | 25,051,429 |
| | 37,881,184 |
Food & Staples Retailing - 1.1% |
CVS Caremark Corp. | 567,205 | | 16,630,451 |
Kroger Co. | 1,059,000 | | 20,851,710 |
Walgreen Co. | 492,462 | | 13,148,735 |
Winn-Dixie Stores, Inc. (a) | 587,020 | | 5,658,873 |
| | 56,289,769 |
Food Products - 0.6% |
Marine Harvest ASA | 7,289,000 | | 4,813,315 |
Nestle SA | 610,401 | | 29,432,824 |
| | 34,246,139 |
Household Products - 1.0% |
Kimberly-Clark Corp. | 19,500 | | 1,182,285 |
Procter & Gamble Co. | 821,313 | | 49,262,354 |
| | 50,444,639 |
Tobacco - 0.8% |
Philip Morris International, Inc. | 862,605 | | 39,541,813 |
TOTAL CONSUMER STAPLES | | 218,403,544 |
ENERGY - 15.5% |
Energy Equipment & Services - 2.6% |
Baker Hughes, Inc. | 815,431 | | 33,897,467 |
Halliburton Co. | 689,895 | | 16,936,922 |
Nabors Industries Ltd. (a) | 868,013 | | 15,294,389 |
Noble Corp. | 1,142,902 | | 35,327,101 |
Pride International, Inc. (a) | 391,500 | | 8,746,110 |
Schlumberger Ltd. | 430,712 | | 23,835,602 |
| | 134,037,591 |
Common Stocks - continued |
| Shares | | Value |
ENERGY - continued |
Oil, Gas & Consumable Fuels - 12.9% |
Anadarko Petroleum Corp. | 501,960 | | $ 18,115,736 |
Apache Corp. | 221,680 | | 18,663,239 |
Chevron Corp. | 1,786,829 | | 121,254,216 |
Cloud Peak Energy, Inc. | 186,600 | | 2,474,316 |
ConocoPhillips | 1,248,410 | | 61,284,447 |
CONSOL Energy, Inc. | 574,690 | | 19,401,534 |
Devon Energy Corp. | 199,500 | | 12,153,540 |
EOG Resources, Inc. | 347,600 | | 34,193,412 |
Exxon Mobil Corp. | 3,080,463 | | 175,802,023 |
Marathon Oil Corp. | 840,278 | | 26,124,243 |
Occidental Petroleum Corp. | 571,775 | | 44,112,441 |
Reliance Industries Ltd. | 484,316 | | 11,276,589 |
Royal Dutch Shell PLC: | | | |
Class A sponsored ADR (d) | 1,578,000 | | 79,247,160 |
Class B ADR | 226,700 | | 10,945,076 |
Southwestern Energy Co. (a) | 755,200 | | 29,180,928 |
Ultra Petroleum Corp. (a) | 96,400 | | 4,265,700 |
| | 668,494,600 |
TOTAL ENERGY | | 802,532,191 |
FINANCIALS - 26.5% |
Capital Markets - 4.7% |
Bank of New York Mellon Corp. | 1,750,499 | | 43,219,820 |
Bank Sarasin & Co. Ltd. Series B (Reg.) | 157,743 | | 6,313,315 |
Goldman Sachs Group, Inc. | 418,094 | | 54,883,199 |
Morgan Stanley | 2,868,077 | | 66,568,067 |
State Street Corp. | 903,680 | | 30,562,458 |
T. Rowe Price Group, Inc. | 202,623 | | 8,994,435 |
UBS AG (a) | 640,888 | | 8,490,367 |
UBS AG (NY Shares) (a) | 1,764,621 | | 23,328,290 |
| | 242,359,951 |
Commercial Banks - 8.6% |
Associated Banc-Corp. | 1,791,266 | | 21,960,921 |
Barclays PLC | 2,558,217 | | 10,208,060 |
BB&T Corp. | 256,000 | | 6,735,360 |
Comerica, Inc. | 495,200 | | 18,238,216 |
Huntington Bancshares, Inc. | 1,630,500 | | 9,032,970 |
KeyCorp | 3,021,200 | | 23,233,028 |
Marshall & Ilsley Corp. | 501,000 | | 3,597,180 |
Mitsubishi UFJ Financial Group, Inc. sponsored ADR | 3,609,825 | | 16,460,802 |
PNC Financial Services Group, Inc. | 2,179,030 | | 123,115,195 |
Standard Chartered PLC (United Kingdom) | 402,596 | | 9,800,428 |
U.S. Bancorp, Delaware | 1,445,538 | | 32,307,774 |
Wells Fargo & Co. | 6,687,409 | | 171,197,670 |
| | 445,887,604 |
Consumer Finance - 1.9% |
American Express Co. | 637,254 | | 25,298,984 |
|
| Shares | | Value |
Capital One Financial Corp. | 688,150 | | $ 27,732,445 |
Discover Financial Services | 2,519,369 | | 35,220,779 |
SLM Corp. (a) | 904,032 | | 9,392,892 |
| | 97,645,100 |
Diversified Financial Services - 8.1% |
Bank of America Corp. | 11,703,679 | | 168,181,867 |
Citigroup, Inc. (a) | 11,726,123 | | 44,090,222 |
CME Group, Inc. | 16,146 | | 4,545,906 |
JPMorgan Chase & Co. | 4,840,612 | | 177,214,804 |
Moody's Corp. (d) | 1,235,829 | | 24,617,714 |
| | 418,650,513 |
Insurance - 1.5% |
Berkshire Hathaway, Inc. Class B (a) | 118,700 | | 9,459,203 |
First American Financial Corp. | 289,320 | | 3,668,578 |
Hartford Financial Services Group, Inc. | 409,800 | | 9,068,874 |
Marsh & McLennan Companies, Inc. | 159,500 | | 3,596,725 |
Montpelier Re Holdings Ltd. | 1,100,900 | | 16,436,437 |
The Travelers Companies, Inc. | 397,756 | | 19,589,483 |
Unum Group | 443,641 | | 9,627,010 |
XL Capital Ltd. Class A | 315,400 | | 5,049,554 |
| | 76,495,864 |
Real Estate Investment Trusts - 0.9% |
Boston Properties, Inc. | 136,475 | | 9,736,127 |
HCP, Inc. | 980,095 | | 31,608,064 |
Segro PLC | 1,278,288 | | 4,818,243 |
| | 46,162,434 |
Real Estate Management & Development - 0.8% |
Allgreen Properties Ltd. | 2,411,000 | | 1,758,152 |
CB Richard Ellis Group, Inc. Class A (a) | 2,107,041 | | 28,676,828 |
Indiabulls Real Estate Ltd. (a) | 2,750,085 | | 9,212,044 |
Unite Group PLC (a) | 683,979 | | 1,765,978 |
| | 41,413,002 |
TOTAL FINANCIALS | | 1,368,614,468 |
HEALTH CARE - 7.2% |
Biotechnology - 1.1% |
Amgen, Inc. (a) | 581,022 | | 30,561,757 |
Biogen Idec, Inc. (a) | 233,000 | | 11,055,850 |
Cephalon, Inc. (a) | 131,000 | | 7,434,250 |
Gilead Sciences, Inc. (a) | 138,060 | | 4,732,697 |
| | 53,784,554 |
Health Care Equipment & Supplies - 0.7% |
C. R. Bard, Inc. | 145,400 | | 11,272,862 |
CareFusion Corp. (a) | 828,600 | | 18,809,220 |
Stryker Corp. | 98,600 | | 4,935,916 |
| | 35,017,998 |
Health Care Providers & Services - 0.4% |
UnitedHealth Group, Inc. | 752,700 | | 21,376,680 |
Common Stocks - continued |
| Shares | | Value |
HEALTH CARE - continued |
Pharmaceuticals - 5.0% |
Johnson & Johnson | 560,317 | | $ 33,092,322 |
Merck & Co., Inc. | 2,524,572 | | 88,284,283 |
Pfizer, Inc. | 7,613,015 | | 108,561,594 |
Sanofi-Aventis | 499,683 | | 30,093,329 |
| | 260,031,528 |
TOTAL HEALTH CARE | | 370,210,760 |
INDUSTRIALS - 10.2% |
Aerospace & Defense - 2.7% |
Goodrich Corp. | 128,142 | | 8,489,408 |
Honeywell International, Inc. | 1,102,025 | | 43,012,036 |
Spirit AeroSystems Holdings, Inc. Class A (a) | 711,982 | | 13,570,377 |
The Boeing Co. | 445,784 | | 27,972,946 |
United Technologies Corp. | 715,540 | | 46,445,701 |
| | 139,490,468 |
Building Products - 0.3% |
Armstrong World Industries, Inc. (a) | 67,514 | | 2,037,573 |
Masco Corp. | 1,342,200 | | 14,442,072 |
| | 16,479,645 |
Commercial Services & Supplies - 0.2% |
Pitney Bowes, Inc. | 355,000 | | 7,795,800 |
Republic Services, Inc. | 58,500 | | 1,739,205 |
| | 9,535,005 |
Construction & Engineering - 0.5% |
Fluor Corp. | 316,900 | | 13,468,250 |
KBR, Inc. | 728,574 | | 14,819,195 |
| | 28,287,445 |
Electrical Equipment - 0.2% |
Schneider Electric SA | 86,546 | | 8,740,786 |
Industrial Conglomerates - 3.2% |
General Electric Co. | 5,097,903 | | 73,511,761 |
Koninklijke Philips Electronics NV unit | 118,300 | | 3,530,072 |
Rheinmetall AG | 317,633 | | 18,137,735 |
Siemens AG sponsored ADR | 455,900 | | 40,816,727 |
Textron, Inc. | 858,000 | | 14,560,260 |
Tyco International Ltd. | 396,236 | | 13,959,394 |
| | 164,515,949 |
Machinery - 2.4% |
ArvinMeritor, Inc. (a) | 126,000 | | 1,650,600 |
Briggs & Stratton Corp. | 1,067,988 | | 18,177,156 |
Caterpillar, Inc. | 101,800 | | 6,115,126 |
Cummins, Inc. | 372,200 | | 24,241,386 |
Eaton Corp. | 253,600 | | 16,595,584 |
Ingersoll-Rand Co. Ltd. | 673,888 | | 23,242,397 |
Kennametal, Inc. | 481,691 | | 12,249,402 |
Navistar International Corp. (a) | 242,970 | | 11,954,124 |
|
| Shares | | Value |
SPX Corp. | 145,800 | | $ 7,699,698 |
Vallourec SA (d) | 21,100 | | 3,637,751 |
| | 125,563,224 |
Road & Rail - 0.7% |
CSX Corp. | 370,400 | | 18,382,952 |
Union Pacific Corp. | 246,000 | | 17,099,460 |
| | 35,482,412 |
TOTAL INDUSTRIALS | | 528,094,934 |
INFORMATION TECHNOLOGY - 7.1% |
Communications Equipment - 0.8% |
Cisco Systems, Inc. (a) | 917,603 | | 19,554,120 |
Comverse Technology, Inc. (a) | 1,295,139 | | 10,102,084 |
Motorola, Inc. (a) | 1,756,493 | | 11,452,334 |
| | 41,108,538 |
Computers & Peripherals - 0.8% |
Hewlett-Packard Co. | 962,645 | | 41,663,276 |
Electronic Equipment & Components - 1.7% |
Agilent Technologies, Inc. (a) | 724,881 | | 20,608,367 |
Arrow Electronics, Inc. (a) | 756,900 | | 16,916,715 |
Avnet, Inc. (a) | 919,854 | | 22,177,680 |
Tyco Electronics Ltd. | 1,052,736 | | 26,718,440 |
| | 86,421,202 |
IT Services - 0.5% |
CoreLogic, Inc. (a) | 289,320 | | 5,109,391 |
Hewitt Associates, Inc. Class A (a) | 371,985 | | 12,818,603 |
MoneyGram International, Inc. (a) | 438,950 | | 1,075,428 |
Visa, Inc. Class A | 77,976 | | 5,516,802 |
| | 24,520,224 |
Office Electronics - 0.2% |
Xerox Corp. | 1,705,878 | | 13,715,259 |
Semiconductors & Semiconductor Equipment - 3.1% |
Analog Devices, Inc. | 175,219 | | 4,881,601 |
Applied Materials, Inc. | 1,848,200 | | 22,215,364 |
Intel Corp. | 3,001,300 | | 58,375,285 |
Micron Technology, Inc. (a) | 1,507,800 | | 12,801,222 |
National Semiconductor Corp. | 1,524,747 | | 20,523,095 |
Novellus Systems, Inc. (a) | 313,539 | | 7,951,349 |
Samsung Electronics Co. Ltd. | 12,977 | | 8,130,805 |
Teradyne, Inc. (a) | 1,659,200 | | 16,177,200 |
Varian Semiconductor Equipment Associates, Inc. (a) | 350,600 | | 10,048,196 |
| | 161,104,117 |
TOTAL INFORMATION TECHNOLOGY | | 368,532,616 |
MATERIALS - 2.5% |
Chemicals - 1.6% |
Celanese Corp. Class A | 481,012 | | 11,982,009 |
Clariant AG (Reg.) (a) | 1,506,845 | | 19,080,283 |
Dow Chemical Co. | 413,800 | | 9,815,336 |
Common Stocks - continued |
| Shares | | Value |
MATERIALS - continued |
Chemicals - continued |
E.I. du Pont de Nemours & Co. | 775,700 | | $ 26,831,463 |
Monsanto Co. | 203,100 | | 9,387,282 |
Wacker Chemie AG (d) | 58,400 | | 8,468,949 |
| | 85,565,322 |
Construction Materials - 0.2% |
HeidelbergCement AG | 192,600 | | 9,151,177 |
Metals & Mining - 0.5% |
Alcoa, Inc. | 1,126,371 | | 11,331,292 |
Commercial Metals Co. | 442,971 | | 5,856,077 |
Freeport-McMoRan Copper & Gold, Inc. | 135,551 | | 8,015,131 |
| | 25,202,500 |
Paper & Forest Products - 0.2% |
Weyerhaeuser Co. | 281,484 | | 9,908,237 |
TOTAL MATERIALS | | 129,827,236 |
TELECOMMUNICATION SERVICES - 5.5% |
Diversified Telecommunication Services - 5.0% |
AT&T, Inc. | 5,151,969 | | 124,626,130 |
Qwest Communications International, Inc. | 7,149,900 | | 37,536,975 |
Verizon Communications, Inc. | 3,388,202 | | 94,937,420 |
| | 257,100,525 |
Wireless Telecommunication Services - 0.5% |
Sprint Nextel Corp. (a) | 6,587,878 | | 27,932,603 |
TOTAL TELECOMMUNICATION SERVICES | | 285,033,128 |
UTILITIES - 3.7% |
Electric Utilities - 2.6% |
Allegheny Energy, Inc. | 1,238,409 | | 25,610,298 |
American Electric Power Co., Inc. | 1,344,579 | | 43,429,902 |
Entergy Corp. | 335,159 | | 24,004,088 |
FirstEnergy Corp. | 1,056,300 | | 37,213,449 |
PPL Corp. | 156,100 | | 3,894,695 |
| | 134,152,432 |
Independent Power Producers & Energy Traders - 0.8% |
AES Corp. (a) | 2,879,421 | | 26,605,850 |
Constellation Energy Group, Inc. | 388,406 | | 12,526,094 |
| | 39,131,944 |
|
| Shares | | Value |
Multi-Utilities - 0.3% |
Alliant Energy Corp. | 327,652 | | $ 10,399,674 |
CMS Energy Corp. | 507,324 | | 7,432,297 |
| | 17,831,971 |
TOTAL UTILITIES | | 191,116,347 |
TOTAL COMMON STOCKS (Cost $5,451,596,027) | 4,985,679,126 |
Preferred Stocks - 0.9% |
| | | |
Convertible Preferred Stocks - 0.9% |
FINANCIALS - 0.8% |
Commercial Banks - 0.2% |
Huntington Bancshares, Inc. 8.50% | 9,000 | | 8,910,000 |
Diversified Financial Services - 0.2% |
Citigroup, Inc. 7.50% | 87,000 | | 9,831,000 |
Insurance - 0.4% |
Hartford Financial Services Group, Inc. Series F 7.25% | 310,900 | | 7,169,354 |
XL Capital Ltd. 10.75% | 494,600 | | 12,429,298 |
| | 19,598,652 |
TOTAL FINANCIALS | | 38,339,652 |
UTILITIES - 0.1% |
Electric Utilities - 0.1% |
PPL Corp. 9.50% (a) | 121,900 | | 6,320,515 |
TOTAL CONVERTIBLE PREFERRED STOCKS | | 44,660,167 |
Nonconvertible Preferred Stocks - 0.0% |
FINANCIALS - 0.0% |
Insurance - 0.0% |
Fondiaria-Sai SpA (Risparmio Shares) | 317,862 | | 1,846,537 |
TOTAL PREFERRED STOCKS (Cost $48,754,472) | 46,506,704 |
Corporate Bonds - 2.4% |
| Principal Amount | | |
Convertible Bonds - 2.2% |
CONSUMER DISCRETIONARY - 1.3% |
Automobiles - 0.3% |
Ford Motor Co. 4.25% 11/15/16 | | $ 10,390,000 | | 12,903,341 |
Hotels, Restaurants & Leisure - 0.1% |
MGM Mirage, Inc. 4.25% 4/15/15 (e) | | 7,050,000 | | 5,529,844 |
Leisure Equipment & Products - 0.0% |
Eastman Kodak Co. 7% 4/1/17 (e) | | 2,030,000 | | 1,801,422 |
Corporate Bonds - continued |
| Principal Amount | | Value |
Convertible Bonds - continued |
CONSUMER DISCRETIONARY - continued |
Media - 0.9% |
Liberty Global, Inc. 4.5% 11/15/16 (e) | | $ 3,400,000 | | $ 3,952,500 |
Liberty Media Corp.: | | | | |
3.5% 1/15/31 | | 255,482 | | 157,877 |
4% 11/15/29 | | 4,750,000 | | 2,434,375 |
3.5% 1/15/31 (e) | | 9,342,795 | | 5,773,436 |
News America, Inc. liquid yield option note: | | | | |
0% 2/28/21 (e) | | 22,670,000 | | 15,693,988 |
0% 2/28/21 | | 3,490,000 | | 2,416,057 |
Virgin Media, Inc. 6.5% 11/15/16 | | 12,614,000 | | 14,671,343 |
| | 45,099,576 |
TOTAL CONSUMER DISCRETIONARY | | 65,334,183 |
FINANCIALS - 0.2% |
Thrifts & Mortgage Finance - 0.2% |
MGIC Investment Corp. 0% 4/1/63 (a)(c)(e) | | 10,438,000 | | 8,976,680 |
INDUSTRIALS - 0.2% |
Airlines - 0.2% |
AMR Corp. 6.25% 10/15/14 | | 1,930,000 | | 1,843,536 |
UAL Corp.: | | | | |
4.5% 6/30/21 (e) | | 8,490,000 | | 8,296,428 |
4.5% 6/30/21 | | 280,000 | | 273,616 |
| | 10,413,580 |
INFORMATION TECHNOLOGY - 0.4% |
Semiconductors & Semiconductor Equipment - 0.4% |
Advanced Micro Devices, Inc.: | | | | |
6% 5/1/15 (e) | | 13,250,000 | | 12,571,600 |
6% 5/1/15 | | 5,870,000 | | 5,569,456 |
Micron Technology, Inc. 1.875% 6/1/14 | | 5,570,000 | | 4,905,081 |
| | 23,046,137 |
MATERIALS - 0.1% |
Metals & Mining - 0.1% |
United States Steel Corp. 4% 5/15/14 | | 3,150,000 | | 4,421,813 |
TOTAL CONVERTIBLE BONDS | | 112,192,393 |
|
| Principal Amount | | Value |
Nonconvertible Bonds - 0.2% |
MATERIALS - 0.2% |
Chemicals - 0.2% |
Hercules, Inc. 6.5% 6/30/29 unit | | $ 15,700,000 | | $ 10,715,250 |
TOTAL CORPORATE BONDS (Cost $123,054,787) | 122,907,643 |
Money Market Funds - 0.4% |
| Shares | | |
Fidelity Cash Central Fund, 0.20% (f) | 12,629,648 | | 12,629,648 |
Fidelity Securities Lending Cash Central Fund, 0.24% (b)(f) | 10,005,431 | | 10,005,431 |
TOTAL MONEY MARKET FUNDS (Cost $22,635,079) | 22,635,079 |
TOTAL INVESTMENT PORTFOLIO - 100.1% (Cost $5,646,040,365) | 5,177,728,552 |
NET OTHER ASSETS (LIABILITIES) - (0.1)% | | (5,825,696) |
NET ASSETS - 100% | $ 5,171,902,856 |
Legend |
(a) Non-income producing |
(b) Investment made with cash collateral received from securities on loan. |
(c) Security initially issued in zero coupon form which converts to coupon form at a specified rate and date. The rate shown is the rate at period end. |
(d) Security or a portion of the security is on loan at period end. |
(e) Security exempt from registration under Rule 144A of the Securities Act of 1933. These securities may be resold in transactions exempt from registration, normally to qualified institutional buyers. At the end of the period, the value of these securities amounted to $62,595,898 or 1.2% of net assets. |
(f) Affiliated fund that is available only to investment companies and other accounts managed by Fidelity Investments. The rate quoted is the annualized seven-day yield of the fund at period end. A complete unaudited listing of the fund's holdings as of its most recent quarter end is available upon request. |
Affiliated Central Funds |
Information regarding fiscal year to date income earned by the Fund from investments in Fidelity Central Funds is as follows: |
Fund | Income earned |
Fidelity Cash Central Fund | $ 12,887 |
Fidelity Securities Lending Cash Central Fund | 623,083 |
Total | $ 635,970 |
Other Information |
The following is a summary of the inputs used, as of June 30, 2010, involving the Fund's assets and liabilities carried at value. The inputs or methodology used for valuing securities may not be an indication of the risk associated with investing in those securities. For more information on valuation inputs, and their aggregation into the levels used in the table below, please refer to the Security Valuation section in the accompanying Notes to Financial Statements. |
Valuation Inputs at Reporting Date: |
Description | Total | Level 1 | Level 2 | Level 3 |
Investments in Securities: | | | | |
Equities: | | | | |
Consumer Discretionary | $ 723,313,902 | $ 619,563,487 | $ 103,750,415 | $ - |
Consumer Staples | 218,403,544 | 171,327,650 | 47,075,894 | - |
Energy | 802,532,191 | 791,255,602 | 11,276,589 | - |
Financials | 1,408,800,657 | 1,338,508,179 | 70,292,478 | - |
Health Care | 370,210,760 | 340,117,431 | 30,093,329 | - |
Industrials | 528,094,934 | 497,578,662 | 30,516,272 | - |
Information Technology | 368,532,616 | 360,401,811 | 8,130,805 | - |
Materials | 129,827,236 | 93,126,827 | 36,700,409 | - |
Telecommunication Services | 285,033,128 | 285,033,128 | - | - |
Utilities | 197,436,862 | 191,116,347 | 6,320,515 | - |
Corporate Bonds | 122,907,643 | - | 122,907,643 | - |
Money Market Funds | 22,635,079 | 22,635,079 | - | - |
Total Investments in Securities: | $ 5,177,728,552 | $ 4,710,664,203 | $ 467,064,349 | $ - |
Distribution of investments by country of issue, as a percentage of total net assets, is as follows: (Unaudited) |
United States of America | 88.1% |
Switzerland | 3.1% |
United Kingdom | 2.2% |
Germany | 1.8% |
France | 1.4% |
Others (Individually Less Than 1%) | 3.4% |
| 100.0% |
Income Tax Information |
At December 31, 2009, the Fund had a capital loss carryforward of approximately $535,850,194 of which $240,221,884 and $295,628,310 will expire on December 31, 2016 and 2017, respectively. Capital loss carryforwards are only available to offset future capital gains of the Fund to the extent provided by regulations and may be limited. |
See accompanying notes which are an integral part of the financial statements.
Semiannual Report
Statement of Assets and Liabilities
| June 30, 2010 (Unaudited) |
| | |
Assets | | |
Investment in securities, at value (including securities loaned of $9,617,421) - See accompanying schedule: Unaffiliated issuers (cost $5,623,405,286) | $ 5,155,093,473 | |
Fidelity Central Funds (cost $22,635,079) | 22,635,079 | |
Total Investments (cost $5,646,040,365) | | $ 5,177,728,552 |
Cash | | 235,211 |
Foreign currency held at value (cost $159,889) | | 159,980 |
Receivable for investments sold | | 13,166,807 |
Receivable for fund shares sold | | 4,852,853 |
Dividends receivable | | 5,484,066 |
Interest receivable | | 685,230 |
Distributions receivable from Fidelity Central Funds | | 82,362 |
Other receivables | | 270,691 |
Total assets | | 5,202,665,752 |
| | |
Liabilities | | |
Payable for investments purchased | $ 14,454,648 | |
Payable for fund shares redeemed | 2,934,592 | |
Accrued management fee | 2,107,198 | |
Distribution fees payable | 337,157 | |
Other affiliated payables | 405,902 | |
Other payables and accrued expenses | 517,968 | |
Collateral on securities loaned, at value | 10,005,431 | |
Total liabilities | | 30,762,896 |
| | |
Net Assets | | $ 5,171,902,856 |
Net Assets consist of: | | |
Paid in capital | | $ 6,003,774,681 |
Undistributed net investment income | | 44,962,234 |
Accumulated undistributed net realized gain (loss) on investments and foreign currency transactions | | (408,521,352) |
Net unrealized appreciation (depreciation) on investments and assets and liabilities in foreign currencies | | (468,312,707) |
Net Assets | | $ 5,171,902,856 |
Statement of Assets and Liabilities - continued
| June 30, 2010 (Unaudited) |
| | |
Initial Class:
Net Asset Value, offering price and redemption price per share ($3,293,218,503 ÷ 211,167,883 shares) | | $ 15.60 |
| | |
Service Class:
Net Asset Value, offering price and redemption price per share ($367,066,140 ÷ 23,624,789 shares) | | $ 15.54 |
| | |
Service Class 2:
Net Asset Value, offering price and redemption price per share ($1,372,332,592 ÷ 89,369,679 shares) | | $ 15.36 |
| | |
Service Class 2R:
Net Asset Value, offering price and redemption price per share ($6,204,322 ÷ 406,006 shares) | | $ 15.28 |
| | |
Investor Class:
Net Asset Value, offering price and redemption price per share ($133,081,299 ÷ 8,556,492 shares) | | $ 15.55 |
See accompanying notes which are an integral part of the financial statements.
Semiannual Report
Statement of Operations
Six months ended June 30, 2010 (Unaudited) |
| | |
Investment Income | | |
Dividends | | $ 59,419,467 |
Interest | | 3,466,757 |
Income from Fidelity Central Funds | | 635,970 |
Total income | | 63,522,194 |
| | |
Expenses | | |
Management fee | $ 13,487,760 | |
Transfer agent fees | 2,069,724 | |
Distribution fees | 2,160,257 | |
Accounting and security lending fees | 577,005 | |
Custodian fees and expenses | 78,563 | |
Independent trustees' compensation | 17,026 | |
Appreciation in deferred trustee compensation account | 14 | |
Audit | 36,975 | |
Legal | 10,455 | |
Interest | 3,781 | |
Miscellaneous | 266,265 | |
Total expenses before reductions | 18,707,825 | |
Expense reductions | (87,717) | 18,620,108 |
Net investment income (loss) | | 44,902,086 |
Realized and Unrealized Gain (Loss) Net realized gain (loss) on: | | |
Investment securities: | | |
Unaffiliated issuers | 199,295,109 | |
Foreign currency transactions | (205,128) | |
Total net realized gain (loss) | | 199,089,981 |
Change in net unrealized appreciation (depreciation) on: Investment securities (net of decrease in deferred foreign taxes of $170,609) | (636,485,507) | |
Assets and liabilities in foreign currencies | (6,411) | |
Total change in net unrealized appreciation (depreciation) | | (636,491,918) |
Net gain (loss) | | (437,401,937) |
Net increase (decrease) in net assets resulting from operations | | $ (392,499,851) |
Statement of Changes in Net Assets
| Six months ended June 30, 2010
(Unaudited) | Year ended
December 31, 2009 |
Increase (Decrease) in Net Assets | | |
Operations | | |
Net investment income (loss) | $ 44,902,086 | $ 115,365,664 |
Net realized gain (loss) | 199,089,981 | (309,873,827) |
Change in net unrealized appreciation (depreciation) | (636,491,918) | 1,591,452,108 |
Net increase (decrease) in net assets resulting from operations | (392,499,851) | 1,396,943,945 |
Distributions to shareholders from net investment income | (3,492,089) | (115,095,209) |
Share transactions - net increase (decrease) | (345,260,987) | (545,969,487) |
Redemption fees | 2,218 | 1,473 |
Total increase (decrease) in net assets | (741,250,709) | 735,880,722 |
| | |
Net Assets | | |
Beginning of period | 5,913,153,565 | 5,177,272,843 |
End of period (including undistributed net investment income of $44,962,234 and undistributed net investment income of $3,552,237, respectively) | $ 5,171,902,856 | $ 5,913,153,565 |
See accompanying notes which are an integral part of the financial statements.
Semiannual Report
Financial Highlights - Initial Class
| Six months ended June 30, 2010 | Years ended December 31, |
| (Unaudited) | 2009 | 2008 | 2007 | 2006 | 2005 |
Selected Per-Share Data | | | | | | |
Net asset value, beginning of period | $ 16.81 | $ 13.18 | $ 23.91 | $ 26.20 | $ 25.49 | $ 25.37 |
Income from Investment Operations | | | | | | |
Net investment income (loss) E | .14 | .33 | .47 | .47 | .45 | .42 |
Net realized and unrealized gain (loss) | (1.34) | 3.64 | (10.67) | (.05) | 4.37 | 1.00 |
Total from investment operations | (1.20) | 3.97 | (10.20) | .42 | 4.82 | 1.42 |
Distributions from net investment income | (.01) | (.34) | (.51) | (.50) | (.89) | (.41) |
Distributions from net realized gain | - | - | (.02) | (2.21) | (3.22) | (.89) |
Total distributions | (.01) | (.34) | (.53) | (2.71) | (4.11) | (1.30) |
Redemption fees added to paid in capital E, I | - | - | - | - | - | - |
Net asset value, end of period | $ 15.60 | $ 16.81 | $ 13.18 | $ 23.91 | $ 26.20 | $ 25.49 |
Total Return B, C, D | (7.14)% | 30.21% | (42.65)% | 1.53% | 20.19% | 5.87% |
Ratios to Average Net Assets F, H | | | | | | |
Expenses before reductions | .56% A | .58% | .57% | .55% | .57% | .56% |
Expenses net of fee waivers, if any | .56% A | .58% | .57% | .55% | .57% | .56% |
Expenses net of all reductions | .56% A | .58% | .57% | .54% | .56% | .55% |
Net investment income (loss) | 1.60% A | 2.29% | 2.37% | 1.71% | 1.76% | 1.71% |
Supplemental Data | | | | | | |
Net assets, end of period (000 omitted) | $ 3,293,219 | $ 3,771,733 | $ 3,322,799 | $ 7,201,655 | $ 8,315,159 | $ 7,875,801 |
Portfolio turnover rate G | 30% A | 29% | 34% | 20% | 22% | 19% |
A Annualized B Total returns for periods of less than one year are not annualized. C Total returns do not reflect charges attributable to your insurance company's separate account. Inclusion of these charges would reduce the total returns shown. D Total returns would have been lower had certain expenses not been reduced during the periods shown. E Calculated based on average shares outstanding during the period. F Fees and expenses of the underlying Fidelity Central Funds are not included in the Fund's expense ratio. The Fund indirectly bears its proportionate share of the expenses of any underlying Fidelity Central Funds. G Amount does not include the portfolio activity of any underlying Fidelity Central Funds. H Expense ratios reflect operating expenses of the class. Expenses before reductions do not reflect amounts reimbursed by the investment adviser or reductions from brokerage service arrangements or reductions from other expense offset arrangements and do not represent the amount paid by the class during periods when reimbursements or reductions occur. Expenses net of fee waivers reflect expenses after reimbursement by the investment adviser but prior to reductions from brokerage service arrangements or other expense offset arrangements. Expenses net of all reductions represent the net expenses paid by the class. I Amount represents less than $.01 per share. |
Financial Highlights - Service Class
| Six months ended June 30, 2010 | Years ended December 31, |
| (Unaudited) | 2009 | 2008 | 2007 | 2006 | 2005 |
Selected Per-Share Data | | | | | | |
Net asset value, beginning of period | $ 16.75 | $ 13.14 | $ 23.82 | $ 26.11 | $ 25.39 | $ 25.28 |
Income from Investment Operations | | | | | | |
Net investment income (loss) E | .13 | .31 | .44 | .44 | .43 | .39 |
Net realized and unrealized gain (loss) | (1.33) | 3.63 | (10.62) | (.05) | 4.35 | 1.00 |
Total from investment operations | (1.20) | 3.94 | (10.18) | .39 | 4.78 | 1.39 |
Distributions from net investment income | (.01) | (.33) | (.48) | (.47) | (.84) | (.39) |
Distributions from net realized gain | - | - | (.02) | (2.21) | (3.22) | (.89) |
Total distributions | (.01) | (.33) | (.50) | (2.68) | (4.06) | (1.28) |
Redemption fees added to paid in capital E,I | - | - | - | - | - | - |
Net asset value, end of period | $ 15.54 | $ 16.75 | $ 13.14 | $ 23.82 | $ 26.11 | $ 25.39 |
Total Return B, C, D | (7.17)% | 30.03% | (42.70)% | 1.42% | 20.08% | 5.76% |
Ratios to Average Net Assets F, H | | | | | | |
Expenses before reductions | .66% A | .68% | .67% | .65% | .67% | .66% |
Expenses net of fee waivers, if any | .66% A | .68% | .67% | .65% | .67% | .66% |
Expenses net of all reductions | .66% A | .68% | .67% | .64% | .66% | .65% |
Net investment income (loss) | 1.50% A | 2.19% | 2.27% | 1.61% | 1.66% | 1.61% |
Supplemental Data | | | | | | |
Net assets, end of period (000 omitted) | $ 367,066 | $ 430,383 | $ 405,082 | $ 920,054 | $ 1,118,333 | $ 1,079,838 |
Portfolio turnover rate G | 30% A | 29% | 34% | 20% | 22% | 19% |
A Annualized B Total returns for periods of less than one year are not annualized. C Total returns do not reflect charges attributable to your insurance company's separate account. Inclusion of these charges would reduce the total returns shown. D Total returns would have been lower had certain expenses not been reduced during the periods shown. E Calculated based on average shares outstanding during the period. F Fees and expenses of the underlying Fidelity Central Funds are not included in the Fund's expense ratio. The Fund indirectly bears its proportionate share of the expenses of any underlying Fidelity Central Funds. G Amount does not include the portfolio activity of any underlying Fidelity Central Funds. H Expense ratios reflect operating expenses of the class. Expenses before reductions do not reflect amounts reimbursed by the investment adviser or reductions from brokerage service arrangements or reductions from other expense offset arrangements and do not represent the amount paid by the class during periods when reimbursements or reductions occur. Expenses net of fee waivers reflect expenses after reimbursement by the investment adviser but prior to reductions from brokerage service arrangements or other expense offset arrangements. Expenses net of all reductions represent the net expenses paid by the class. I Amount represents less than $.01 per share. |
See accompanying notes which are an integral part of the financial statements.
Semiannual Report
Financial Highlights - Service Class 2
| Six months ended
June 30, 2010 | Years ended December 31, |
| (Unaudited) | 2009 | 2008 | 2007 | 2006 | 2005 |
Selected Per-Share Data | | | | | | |
Net asset value, beginning of period | $ 16.57 | $ 13.00 | $ 23.57 | $ 25.87 | $ 25.17 | $ 25.09 |
Income from Investment Operations | | | | | | |
Net investment income (loss) E | .11 | .29 | .41 | .39 | .38 | .35 |
Net realized and unrealized gain (loss) | (1.31) | 3.58 | (10.50) | (.04) | 4.32 | .98 |
Total from investment operations | (1.20) | 3.87 | (10.09) | .35 | 4.70 | 1.33 |
Distributions from net investment income | (.01) | (.30) | (.46) | (.44) | (.78) | (.36) |
Distributions from net realized gain | - | - | (.02) | (2.21) | (3.22) | (.89) |
Total distributions | (.01) | (.30) | (.48) | (2.65) | (4.00) | (1.25) |
Redemption fees added to paid in capital E, I | - | - | - | - | - | - |
Net asset value, end of period | $ 15.36 | $ 16.57 | $ 13.00 | $ 23.57 | $ 25.87 | $ 25.17 |
Total Return B, C, D | (7.24)% | 29.88% | (42.81)% | 1.27% | 19.93% | 5.57% |
Ratios to Average Net Assets F, H | | | | | | |
Expenses before reductions | .81% A | .83% | .82% | .80% | .82% | .81% |
Expenses net of fee waivers, if any | .81% A | .83% | .82% | .80% | .82% | .81% |
Expenses net of all reductions | .81% A | .83% | .82% | .80% | .82% | .80% |
Net investment income (loss) | 1.35% A | 2.04% | 2.12% | 1.46% | 1.51% | 1.46% |
Supplemental Data |
| | | | | |
Net assets, end of period (000 omitted) | $ 1,372,333 | $ 1,558,421 | $ 1,321,569 | $ 2,583,129 | $ 2,373,059 | $ 1,723,546 |
Portfolio turnover rate G | 30% A | 29% | 34% | 20% | 22% | 19% |
A Annualized B Total returns for periods of less than one year are not annualized. C Total returns do not reflect charges attributable to your insurance company's separate account. Inclusion of these charges would reduce the total returns shown. D Total returns would have been lower had certain expenses not been reduced during the periods shown. E Calculated based on average shares outstanding during the period. F Fees and expenses of the underlying Fidelity Central Funds are not included in the Fund's expense ratio. The Fund indirectly bears its proportionate share of the expenses of any underlying Fidelity Central Funds. G Amount does not include the portfolio activity of any underlying Fidelity Central Funds. H Expense ratios reflect operating expenses of the class. Expenses before reductions do not reflect amounts reimbursed by the investment adviser or reductions from brokerage service arrangements or reductions from other expense offset arrangements and do not represent the amount paid by the class during periods when reimbursements or reductions occur. Expenses net of fee waivers reflect expenses after reimbursement by the investment adviser but prior to reductions from brokerage service arrangements or other expense offset arrangements. Expenses net of all reductions represent the net expenses paid by the class. I Amount represents less than $.01 per share. |
Financial Highlights - Service Class 2R
| Six months ended
June 30, 2010 | Years ended December 31, |
| (Unaudited) | 2009 | 2008 | 2007 | 2006 | 2005 |
Selected Per-Share Data | | | | | | |
Net asset value, beginning of period | $ 16.49 | $ 12.93 | $ 23.44 | $ 25.73 | $ 25.08 | $ 25.01 |
Income from Investment Operations | | | | | | |
Net investment income (loss) E | .11 | .28 | .41 | .39 | .38 | .35 |
Net realized and unrealized gain (loss) | (1.31) | 3.58 | (10.45) | (.04) | 4.29 | .99 |
Total from investment operations | (1.20) | 3.86 | (10.04) | .35 | 4.67 | 1.34 |
Distributions from net investment income | (.01) | (.30) | (.45) | (.43) | (.80) | (.38) |
Distributions from net realized gain | - | - | (.02) | (2.21) | (3.22) | (.89) |
Total distributions | (.01) | (.30) | (.47) | (2.64) | (4.02) | (1.27) |
Redemption fees added to paid in capital E, I | - | - | - | - | - | - |
Net asset value, end of period | $ 15.28 | $ 16.49 | $ 12.93 | $ 23.44 | $ 25.73 | $ 25.08 |
Total Return B, C, D | (7.28)% | 29.95% | (42.82)% | 1.27% | 19.89% | 5.61% |
Ratios to Average Net Assets F, H | | | | | | |
Expenses before reductions | .81% A | .83% | .82% | .80% | .82% | .81% |
Expenses net of fee waivers, if any | .81% A | .83% | .82% | .80% | .82% | .81% |
Expenses net of all reductions | .81% A | .83% | .81% | .79% | .81% | .80% |
Net investment income (loss) | 1.35% A | 2.04% | 2.12% | 1.46% | 1.51% | 1.46% |
Supplemental Data | | | | | | |
Net assets, end of period (000 omitted) | $ 6,204 | $ 5,259 | $ 5,339 | $ 13,558 | $ 17,089 | $ 9,651 |
Portfolio turnover rate G | 30% A | 29% | 34% | 20% | 22% | 19% |
A Annualized B Total returns for periods of less than one year are not annualized. C Total returns do not reflect charges attributable to your insurance company's separate account. Inclusion of these charges would reduce the total returns shown. D Total returns would have been lower had certain expenses not been reduced during the periods shown. E Calculated based on average shares outstanding during the period. F Fees and expenses of the underlying Fidelity Central Funds are not included in the Fund's expense ratio. The Fund indirectly bears its proportionate share of the expenses of any underlying Fidelity Central Funds. G Amount does not include the portfolio activity of any underlying Fidelity Central Funds. H Expense ratios reflect operating expenses of the class. Expenses before reductions do not reflect amounts reimbursed by the investment adviser or reductions from brokerage service arrangements or reductions from other expense offset arrangements and do not represent the amount paid by the class during periods when reimbursements or reductions occur. Expenses net of fee waivers reflect expenses after reimbursement by the investment adviser but prior to reductions from brokerage service arrangements or other expense offset arrangements. Expenses net of all reductions represent the net expenses paid by the class. I Amount represents less than $.01 per share. |
See accompanying notes which are an integral part of the financial statements.
Semiannual Report
Financial Highlights - Investor Class
| Six months ended
June 30, 2010 | Years ended December 31, |
| (Unaudited) | 2009 | 2008 | 2007 | 2006 | 2005 H |
Selected Per-Share Data | | | | | | |
Net asset value, beginning of period | $ 16.77 | $ 13.15 | $ 23.85 | $ 26.15 | $ 25.48 | $ 24.46 |
Income from Investment Operations | | | | | | |
Net investment income (loss) E | .13 | .31 | .44 | .44 | .42 | .17 |
Net realized and unrealized gain (loss) | (1.34) | 3.64 | (10.63) | (.05) | 4.36 | .85 |
Total from investment operations | (1.21) | 3.95 | (10.19) | .39 | 4.78 | 1.02 |
Distributions from net investment income | (.01) | (.33) | (.49) | (.48) | (.89) | - |
Distributions from net realized gain | - | - | (.02) | (2.21) | (3.22) | - |
Total distributions | (.01) | (.33) | (.51) | (2.69) | (4.11) | - |
Redemption fees added to paid in capital E, J | - | - | - | - | - | - |
Net asset value, end of period | $ 15.55 | $ 16.77 | $ 13.15 | $ 23.85 | $ 26.15 | $ 25.48 |
Total Return B, C, D | (7.22)% | 30.09% | (42.71)% | 1.39% | 20.04% | 4.17% |
Ratios to Average Net Assets F, I | | | | | | |
Expenses before reductions | .65% A | .68% | .66% | .66% | .69% | .74% A |
Expenses net of fee waivers, if any | .65% A | .68% | .66% | .66% | .69% | .74% A |
Expenses net of all reductions | .65% A | .68% | .66% | .66% | .69% | .73% A |
Net investment income (loss) | 1.52% A | 2.19% | 2.28% | 1.60% | 1.63% | 1.54% A |
Supplemental Data | | | | | | |
Net assets, end of period (000 omitted) | $ 133,081 | $ 147,358 | $ 122,483 | $ 230,534 | $ 170,050 | $ 37,500 |
Portfolio turnover rate G | 30% A | 29% | 34% | 20% | 22% | 19% |
A Annualized B Total returns for periods of less than one year are not annualized. C Total returns do not reflect charges attributable to your insurance company's separate account. Inclusion of these charges would reduce the total returns shown. D Total returns would have been lower had certain expenses not been reduced during the periods shown. E Calculated based on average shares outstanding during the period. F Fees and expenses of the underlying Fidelity Central Funds are not included in the Fund's expense ratio. The Fund indirectly bears its proportionate share of the expenses of any underlying Fidelity Central Funds. G Amount does not include the portfolio activity of any underlying Fidelity Central Funds. H For the period July 21, 2005 (commencement of sale of shares) to December 31, 2005. I Expense ratios reflect operating expenses of the class. Expenses before reductions do not reflect amounts reimbursed by the investment adviser or reductions from brokerage service arrangements or reductions from other expense offset arrangements and do not represent the amount paid by the class during periods when reimbursements or reductions occur. Expense ratios before reductions for start-up periods may not be representative of longer-term operating periods. Expenses net of fee waivers reflect expenses after reimbursement by the investment adviser but prior to reductions from brokerage service arrangements or other expense offset arrangements. Expenses net of all reductions represent the net expenses paid by the class. J Amount represents less than $.01 per share. |
See accompanying notes which are an integral part of the financial statements.
Semiannual Report
Notes to Financial Statements
For the period ended June 30, 2010 (Unaudited)
1. Organization.
VIP Equity-Income Portfolio (the Fund) is a fund of Variable Insurance Products Fund (the Trust) and is authorized to issue an unlimited number of shares. The Trust is registered under the Investment Company Act of 1940, as amended (the 1940 Act), as an open-end management investment company organized as a Massachusetts business trust. Shares of the Fund may only be purchased by insurance companies for the purpose of funding variable annuity or variable life insurance contracts. The Fund offers the following classes of shares: Initial Class shares, Service Class shares, Service Class 2 shares, Service Class 2R shares, and Investor Class shares. All classes have equal rights and voting privileges, except for matters affecting a single class. Investment income, realized and unrealized capital gains and losses, the common expenses of the Fund, and certain fund-level expense reductions, if any, are allocated on a pro-rata basis to each class based on the relative net assets of each class to the total net assets of the Fund. Each class differs with respect to transfer agent and distribution and service plan fees incurred. Certain expense reductions also differ by class.
2. Investments in Fidelity Central Funds.
The Fund may invest in Fidelity Central Funds, which are open-end investment companies available only to other investment companies and accounts managed by Fidelity Management & Research Company (FMR) and its affiliates. The Fund's Schedule of Investments lists each of the Fidelity Central Funds held as of period end, if any, as an investment of the Fund, but does not include the underlying holdings of each Fidelity Central Fund. As an Investing Fund, the Fund indirectly bears its proportionate share of the expenses of the underlying Fidelity Central Funds.
The Money Market Central Funds seek preservation of capital and current income and are managed by Fidelity Investments Money Management, Inc. (FIMM), an affiliate of FMR.
A complete unaudited list of holdings for each Fidelity Central Fund is available upon request or at the Securities and Exchange Commission (the SEC) web site at www.sec.gov. In addition, the financial statements of the Fidelity Central Funds are available on the SEC web site or upon request.
3. Significant Accounting Policies.
The financial statements have been prepared in conformity with accounting principles generally accepted in the United States of America (GAAP), which require management to make certain estimates and assumptions at the date of the financial statements. Actual results could differ from those estimates. The following summarizes the significant accounting policies of the Fund:
Security Valuation. Investments are valued as of 4:00 p.m. Eastern time on the last calendar day of the period. The Fund uses independent pricing services approved by the Board of Trustees to value its investments. When current market prices or quotations are not readily available or reliable, valuations may be determined in good faith in accordance with procedures adopted by the Board of Trustees. Factors used in determining value may include market or security specific events, changes in interest rates and credit quality. The frequency with which these procedures are used cannot be predicted and they may be utilized to a significant extent. The value used for net asset value (NAV) calculation under these procedures may differ from published prices for the same securities.
The Fund categorizes the inputs to valuation techniques used to value its investments into a disclosure hierarchy consisting of three levels as shown below.
Level 1 - quoted prices in active markets for identical investments
Level 2 - other significant observable inputs (including quoted prices for similar investments, interest rates, prepayment speeds, etc.)
Level 3 - unobservable inputs (including the fund's own assumptions based on the best information available)
Changes in valuation techniques may result in transfers in or out of an assigned level within the disclosure hierarchy. The aggregate value of investments by input level, as of June 30, 2010 is included at the end of the Fund's Schedule of Investments. Valuation techniques used to value the Fund's investments by major category are as follows.
Equity securities, including restricted securities, for which market quotations are readily available, are valued at the last reported sale price or official closing price as reported by an independent pricing service on the primary market or exchange on which they are traded and are categorized as Level 1 in the hierarchy. In the event there were no sales during the day or closing prices are not available, securities are valued at the last quoted bid price or may be valued using the last available price and are generally categorized as Level 2 in the hierarchy. For foreign equity securities, when significant market or security specific events arise, comparisons to the valuation of American Depositary Receipts (ADRs), futures contracts, Exchange-traded funds (ETFs) and certain indexes as well as quoted prices for similar securities are used and are categorized as Level 2 in the hierarchy in these circumstances. Utilizing these techniques may result in transfers between Level 1 and Level 2. For restricted equity securities and private placements where observable inputs are limited, assumptions about market activity and risk are used and are categorized as Level 3 in the hierarchy.
Semiannual Report
Notes to Financial Statements (Unaudited) - continued
3. Significant Accounting Policies - continued
Security Valuation - continued
Debt securities, including restricted securities, are valued based on evaluated prices received from independent pricing services or from dealers who make markets in such securities. For corporate bonds, pricing services utilize matrix pricing which considers yield or price of bonds of comparable quality, coupon, maturity and type as well as dealer supplied prices and are generally categorized as Level 2 in the hierarchy.
Investments in open-end mutual funds, including the Fidelity Central Funds, are valued at their closing net asset value each business day and are categorized as Level 1 in the hierarchy. Short-term securities with remaining maturities of sixty days or less for which quotations are not readily available are valued at amortized cost, which approximates value and are categorized as Level 2 in the hierarchy.
When independent prices are unavailable or unreliable, debt securities may be valued utilizing pricing matrices which consider similar factors that would be used by independent pricing services. These are generally categorized as Level 2 in the hierarchy but may be Level 3 depending on the circumstances.
Foreign Currency. The Fund uses foreign currency contracts to facilitate transactions in foreign-denominated securities. Gains and losses from these transactions may arise from changes in the value of the foreign currency or if the counterparties do not perform under the contracts' terms.
Foreign-denominated assets, including investment securities, and liabilities are translated into U.S. dollars at the exchange rate at period end. Purchases and sales of investment securities, income and dividends received and expenses denominated in foreign currencies are translated into U.S. dollars at the exchange rate in effect on the transaction date.
The effects of exchange rate fluctuations on investments are included with the net realized and unrealized gain (loss) on investment securities. Other foreign currency transactions resulting in realized and unrealized gain (loss) are disclosed separately.
Investment Transactions and Income. For financial reporting purposes, the Fund's investment holdings and NAV include trades executed through the end of the last business day of the period. The NAV per share for processing shareholder transactions is calculated as of the close of business of the New York Stock Exchange (NYSE), normally 4:00 p.m. Eastern time and includes trades executed through the end of the prior business day. Gains and losses on securities sold are determined on the basis of identified cost and may include proceeds received from litigation. Dividend income is recorded on the ex-dividend date, except for certain dividends from foreign securities where the ex-dividend date may have passed, which are recorded as soon as the Fund is informed of the ex-dividend date. Non-cash dividends included in dividend income, if any, are recorded at the fair market value of the securities received. Distributions received on securities that represent a return of capital or capital gain are recorded as a reduction of cost of investments and/or as a realized gain. The Fund estimates the components of distributions received that may be considered return of capital distributions or capital gain distributions. Interest income and distributions from the Fidelity Central Funds are accrued as earned. Interest income includes coupon interest and amortization of premium and accretion of discount on debt securities. Investment income is recorded net of foreign taxes withheld where recovery of such taxes is uncertain. Debt obligations may be placed on non-accrual status and related interest income may be reduced by ceasing current accruals and writing off interest receivables when the collection of all or a portion of interest has become doubtful based on consistently applied procedures. A debt obligation is removed from non-accrual status when the issuer resumes interest payments or when collectability of interest is reasonably assured.
Expenses. Most expenses of the Trust can be directly attributed to a fund. Expenses which cannot be directly attributed are apportioned amongst each fund in the Trust. Expense estimates are accrued in the period to which they relate and adjustments are made when actual amounts are known.
Deferred Trustee Compensation. Under a Deferred Compensation Plan (the Plan), independent Trustees may elect to defer receipt of a portion of their annual compensation. Deferred amounts are invested in a cross-section of Fidelity funds, are marked-to-market and remain in the Fund until distributed in accordance with the Plan. The investment of deferred amounts and the offsetting payable to the Trustees are included in the accompanying Statement of Assets and Liabilities.
Income Tax Information and Distributions to Shareholders. Each year, the Fund intends to qualify as a regulated investment company by distributing substantially all of its taxable income and realized gains under Subchapter M of the Internal Revenue Code and filing its U.S. federal tax return. As a result, no provision for income taxes is required. A fund's federal tax return is subject to examination by the Internal Revenue Service (IRS) for a period of three years. Foreign taxes are provided for based on the Fund's understanding of the tax rules and rates that exist in the foreign markets in which it invests.
Distributions are recorded on the ex-dividend date. Income dividends and capital gain distributions are declared separately for each class. Income and capital gain distributions are determined in accordance with income tax regulations, which may differ from GAAP.
Capital accounts within the financial statements are adjusted for permanent book-tax differences. These adjustments have no impact on net assets or the results of operations. Temporary book-tax differences will reverse in a subsequent period.
Semiannual Report
3. Significant Accounting Policies - continued
Income Tax Information and Distributions to Shareholders - continued
Book-tax differences are primarily due to the short-term gain distributions from the Fidelity Central Funds, foreign currency transactions, certain foreign taxes, passive foreign investment companies (PFIC), market discount, partnerships, deferred trustees compensation, capital loss carryforwards and losses deferred due to wash sales.
The federal tax cost of investment securities and unrealized appreciation (depreciation) as of period end were as follows:
Gross unrealized appreciation | $ 805,550,846 |
Gross unrealized depreciation | (1,305,424,800) |
Net unrealized appreciation (depreciation) | $ (499,873,954) |
| |
Tax cost | $ 5,677,602,506 |
Trading (Redemption) Fees. Service Class 2 R shares held less than 60 days are subject to a redemption fee equal to 1% of the proceeds of the redeemed shares. All redemption fees, including any estimated redemption fees paid by FMR, are retained by the Fund and accounted for as an addition to paid in capital.
4. Operating Policies.
Restricted Securities. The Fund may invest in securities that are subject to legal or contractual restrictions on resale. These securities generally may be resold in transactions exempt from registration or to the public if the securities are registered. Disposal of these securities may involve time-consuming negotiations and expense, and prompt sale at an acceptable price may be difficult. Information regarding restricted securities is included at the end of the Fund's Schedule of Investments.
5. Purchases and Sales of Investments.
Purchases and sales of securities, other than short-term securities, aggregated $873,122,930 and $1,192,225,755, respectively.
6. Fees and Other Transactions with Affiliates.
Management Fee. FMR and its affiliates provide the Fund with investment management related services for which the Fund pays a monthly management fee. The management fee is the sum of an individual fund fee rate that is based on an annual rate of .20% of the Fund's average net assets and a group fee rate that averaged .26% during the period. The group fee rate is based upon the average net assets of all the mutual funds advised by FMR. The group fee rate decreases as assets under management increase and increases as assets under management decrease. For the period, the total annualized management fee rate was .46% of the Fund's average net assets.
Distribution and Service Plan. In accordance with Rule 12b-1 of the 1940 Act, the Fund has adopted separate 12b-1 Plans for each Service Class of shares. Each Service Class pays Fidelity Distributors Corporation (FDC), an affiliate of FMR, a service fee. For the period, the service fee is based on an annual rate of .10% of Service Class' average net assets and .25% of Service Class 2's and Service Class 2R's average net assets.
For the period, each class paid FDC the following amounts, all of which were re-allowed to insurance companies for the distribution of shares and providing shareholder support services:
Service Class | $ 212,087 |
Service Class 2 | 1,941,019 |
Service Class 2 R | 7,151 |
| $ 2,160,257 |
Transfer Agent Fees. Fidelity Investments Institutional Operations Company, Inc. (FIIOC), an affiliate of FMR, is the Fund's transfer, dividend disbursing, and shareholder servicing agent. FIIOC receives an asset-based fee with respect to each class. Each class (with the exception of Investor Class) pays a transfer agent fee, excluding out of pocket expenses, equal to an annual rate of .07% of average net assets. Investor Class pays a monthly asset-based transfer agent fee of .15% of average net assets. The total transfer agent fees paid by each class to FIIOC, including out of pocket expenses, were as follows:
Initial Class | $ 1,276,106 |
Service Class | 144,199 |
Service Class 2 | 530,528 |
Service Class 2R | 1,924 |
Investor Class | 116,967 |
| $ 2,069,724 |
Semiannual Report
Notes to Financial Statements (Unaudited) - continued
6. Fees and Other Transactions with Affiliates - continued
Accounting and Security Lending Fees. Fidelity Service Company, Inc. (FSC), an affiliate of FMR, maintains the Fund's accounting records. The accounting fee is based on the level of average net assets for the month. Under a separate contract, FSC administers the security lending program. The security lending fee is based on the number and duration of lending transactions.
Brokerage Commissions. The Fund placed a portion of its portfolio transactions with brokerage firms which are affiliates of the investment adviser. The commissions paid to these affiliated firms were $9,444 for the period.
Interfund Lending Program. Pursuant to an Exemptive Order issued by the SEC, the Fund, along with other registered investment companies having management contracts with FMR, may participate in an interfund lending program. This program provides an alternative credit facility allowing the funds to borrow from, or lend money to, other participating affiliated funds. At period end, there were no interfund loans outstanding. The Fund's activity in this program during the period for which loans were outstanding was as follows:
Borrower or Lender | Average Daily Loan Balance | Weighted Average Interest Rate | Interest Expense |
Borrower | $ 8,064,108 | .43% | $ 3,601 |
7. Committed Line of Credit.
The Fund participates with other funds managed by FMR in a $3.75 billion credit facility (the "line of credit") to be utilized for temporary or emergency purposes to fund shareholder redemptions or for other short-term liquidity purposes. The Fund has agreed to pay commitment fees on its pro-rata portion of the line of credit, which amounted to $11,862 and is reflected in Miscellaneous expenses on the Statement of Operations. During the period, there were no borrowings on this line of credit.
8. Security Lending.
The Fund lends portfolio securities from time to time in order to earn additional income. On the settlement date of the loan, the Fund receives collateral (in the form of U.S. Treasury obligations, letters of credit and/or cash) against the loaned securities and maintains collateral in an amount not less than 100% of the market value of the loaned securities during the period of the loan. The market value of the loaned securities is determined at the close of business of the Fund and any additional required collateral is delivered to the Fund on the next business day. If the borrower defaults on its obligation to return the securities loaned because of insolvency or other reasons, a fund could experience delays and costs in recovering the securities loaned or in gaining access to the collateral. Any cash collateral received is invested in the Fidelity Securities Lending Cash Central Fund. The value of loaned securities and cash collateral at period end are disclosed on the Fund's Statement of Assets and Liabilities. Security lending income represents the income earned on investing cash collateral, less fees and expenses associated with the loan, plus any premium payments that may be received on the loan of certain types of securities. Security lending income is presented in the Statement of Operations as a component of income from Fidelity Central Funds. Net income from lending portfolio securities during the period amounted to $623,083.
9. Bank Borrowings.
The Fund is permitted to have bank borrowings for temporary or emergency purposes to fund shareholder redemptions. The Fund has established borrowing arrangements with certain banks. The interest rate on the borrowings is the bank's base rate, as revised from time to time. The average daily loan balance during the period for which loans were outstanding amounted to $9,231,000. The weighted average interest rate was .70%. The interest expense amounted to $180 under the bank borrowing program. At period end, there were no bank borrowings outstanding.
10. Expense Reductions.
Many of the brokers with whom FMR places trades on behalf of the Fund provided services to the Fund in addition to trade execution. These services included payments of certain expenses on behalf of the Fund totaling $87,717 for the period.
Semiannual Report
11. Distributions to Shareholders.
Distributions to shareholders of each class were as follows:
| Six months ended
June 30, 2010 | Year ended
December 31, 2009 |
From net investment income | | |
Initial Class | $ 2,217,576 | $ 75,517,681 |
Service Class | 253,392 | 8,350,109 |
Service Class 2 | 929,687 | 28,318,758 |
Service Class 2R | 3,105 | 96,589 |
Investor Class | 88,329 | 2,812,072 |
Total | $ 3,492,089 | $ 115,095,209 |
12. Share Transactions.
Transactions for each class of shares were as follows:
| Shares | Dollars |
| Six months ended June 30, 2010 | Year ended December 31, 2009 | Six months ended June 30, 2010 | Year ended December 31, 2009 |
Initial Class | | | | |
Shares sold | 2,589,688 | 8,717,811 | $ 44,777,781 | $ 119,199,048 |
Reinvestment of distributions | 138,081 | 4,649,155 | 2,217,576 | 75,517,681 |
Shares redeemed | (15,983,025) | (41,112,018) | (274,866,035) | (560,835,381) |
Net increase (decrease) | (13,255,256) | (27,745,052) | $ (227,870,678) | $ (366,118,652) |
Service Class | | | | |
Shares sold | 413,298 | 1,374,191 | $ 7,103,293 | $ 18,756,098 |
Reinvestment of distributions | 15,827 | 516,788 | 253,392 | 8,350,109 |
Shares redeemed | (2,495,293) | (7,035,493) | (42,740,428) | (95,421,754) |
Net increase (decrease) | (2,066,168) | (5,144,514) | $ (35,383,743) | $ (68,315,547) |
Service Class 2 | | | | |
Shares sold | 2,927,261 | 9,883,762 | $ 49,401,550 | $ 131,168,937 |
Reinvestment of distributions | 58,729 | 1,771,906 | 929,687 | 28,318,758 |
Shares redeemed | (7,672,531) | (19,265,158) | (129,938,653) | (264,471,751) |
Net increase (decrease) | (4,686,541) | (7,609,490) | $ (79,607,416) | $ (104,984,056) |
Service Class 2R | | | | |
Shares sold | 156,354 | 65,422 | $ 2,642,315 | $ 914,849 |
Reinvestment of distributions | 197 | 6,094 | 3,105 | 96,589 |
Shares redeemed | (69,509) | (165,320) | (1,167,636) | (2,222,121) |
Net increase (decrease) | 87,042 | (93,804) | $ 1,477,784 | $ (1,210,683) |
Investor Class | | | | |
Shares sold | 662,402 | 1,142,867 | $ 11,452,697 | $ 16,328,956 |
Reinvestment of distributions | 5,510 | 173,430 | 88,329 | 2,812,072 |
Shares redeemed | (899,227) | (1,842,484) | (15,417,960) | (24,481,577) |
Net increase (decrease) | (231,315) | (526,187) | $ (3,876,934) | $ (5,340,549) |
13. Other.
The Fund's organizational documents provide former and current trustees and officers with a limited indemnification against liabilities arising in connection with the performance of their duties to the Fund. In the normal course of business, the Fund may also enter into contracts that provide general indemnifications. The Fund's maximum exposure under these arrangements is unknown as this would be dependent on future claims that may be made against the Fund. The risk of material loss from such claims is considered remote.
At the end of the period, FMR or its affiliates were the owners of record of 12% of the total outstanding shares of the Fund and two otherwise unaffiliated shareholders were the owners of record of 30% of the total outstanding shares of the Fund.
Semiannual Report
Investment Adviser
Fidelity Management & Research Company
Boston, MA
Investment Sub-Advisers
FMR Co., Inc.
Fidelity Management & Research (U.K.) Inc.
Fidelity Research & Analysis Company
FIL Investments (Japan) Limited
FIL Investment Advisors
FIL Investment Advisors (U.K.) Ltd.
Fidelity Management & Research (Hong Kong) Limited
Fidelity Management & Research (Japan) Inc.
General Distributor
Fidelity Distributors Corporation
Boston, MA
Transfer and Service Agents
Fidelity Investments Institutional Operations Company, Inc.
Boston, MA
Fidelity Service Company, Inc.
Boston, MA
Custodian
The Northern Trust Company
Chicago, IL
VIPEI-SANN-0810
1.705693.112
Fidelity® Variable Insurance Products:
Equity-Income Portfolio - Service Class 2R
Semiannual Report
June 30, 2010
(2_fidelity_logos) (Registered_Trademark)
Contents
Shareholder Expense Example | <Click Here> | An example of shareholder expenses. |
Investment Changes | <Click Here> | A summary of major shifts in the fund's investments over the past six months. |
Investments | <Click Here> | A complete list of the fund's investments with their market values. |
Financial Statements | <Click Here> | Statements of assets and liabilities, operations, and changes in net assets, as well as financial highlights. |
Notes | <Click Here> | Notes to the financial statements. |
To view a fund's proxy voting guidelines and proxy voting record for the 12-month period ended June 30, visit http://www.fidelity.com/proxyvotingresults or visit the Securities and Exchange Commission's (SEC) web site at http://www.sec.gov. You may also call 1-877-208-0098 to request a free copy of the proxy voting guidelines.
Fidelity Variable Insurance Products are separate account options which are purchased through a variable insurance contract.
Standard & Poor's, S&P and S&P 500 are registered service marks of The McGraw-Hill Companies, Inc. and have been licensed for use by Fidelity Distributors Corporation.
Other third party marks appearing herein are the property of their respective owners.
All other marks appearing herein are registered or unregistered trademarks or service marks of FMR LLC or an affiliated company.
This report and the financial statements contained herein are submitted for the general information of the shareholders of the fund. This report is not authorized for distribution to prospective investors in the fund unless preceded or accompanied by an effective prospectus.
A fund files its complete schedule of portfolio holdings with the SEC for the first and third quarters of each fiscal year on Form N-Q. Forms N-Q are available on the SEC's web site at http://www.sec.gov. A fund's Forms N-Q may be reviewed and copied at the SEC's Public Reference Room in Washington, DC. Information regarding the operation of the SEC's Public Reference Room may be obtained by calling 1-800-SEC-0330. For a complete list of a fund's portfolio holdings, view the most recent holdings listing, semiannual report, or annual report on Fidelity's web site at http://www.fidelity.com, or http://www.advisor.fidelity.com, as applicable.
NOT FDIC INSURED • MAY LOSE VALUE • NO BANK GUARANTEE
Neither the fund nor Fidelity Distributors Corporation is a bank.
Semiannual Report
As a shareholder of the Fund, you incur two types of costs: (1) transaction costs, including redemption fees, and (2) ongoing costs, including management fees, distribution and/or service (12b-1) fees and other Fund expenses. This Example is intended to help you understand your ongoing costs (in dollars) of investing in the Fund and to compare these costs with the ongoing costs of investing in other mutual funds.
The Example is based on an investment of $1,000 invested at the beginning of the period and held for the entire period (January 1, 2010 to June 30, 2010).
Actual Expenses
The first line of the accompanying table for each class of the Fund provides information about actual account values and actual expenses. You may use the information in this line, together with the amount you invested, to estimate the expenses that you paid over the period. Simply divide your account value by $1,000.00 (for example, an $8,600 account value divided by $1,000.00 = 8.6), then multiply the result by the number in the first line for a class of the Fund under the heading entitled "Expenses Paid During Period" to estimate the expenses you paid on your account during this period. The estimate of expenses does not include any fees or other expenses of any variable annuity or variable life insurance product. If they were, the estimate of expenses you paid during the period would be higher, and your ending account value would be lower. In addition, the Fund, as a shareholder in the underlying Fidelity Central Funds, will indirectly bear its pro-rata share of the fees and expenses incurred by the underlying Fidelity Central Funds. These fees and expenses are not included in the Fund's annualized expense ratio used to calculate the expense estimate in the table below.
Hypothetical Example for Comparison Purposes
The second line of the accompanying table for each class of the Fund provides information about hypothetical account values and hypothetical expenses based on a Class' actual expense ratio and an assumed rate of return of 5% per year before expenses, which is not the Class' actual return. The hypothetical account values and expenses may not be used to estimate the actual ending account balance or expenses you paid for the period. You may use this information to compare the ongoing costs of investing in the Fund and other funds. To do so, compare this 5% hypothetical example with the 5% hypothetical examples that appear in the shareholder reports of the other funds. The estimate of expenses does not include any fees or other expenses of any variable annuity or variable life insurance product. If they were, the estimate of expenses you paid during the period would be higher, and your ending account value would be lower. In addition, the Fund, as a shareholder in the underlying Fidelity Central Funds, will indirectly bear its pro-rata share of the fees and expenses incurred by the underlying Fidelity Central Funds. These fees and expenses are not included in the Fund's annualized expense ratio used to calculate the expense estimate in the table below.
Please note that the expenses shown in the table are meant to highlight your ongoing costs only and do not reflect any transaction costs. Therefore, the second line of the table is useful in comparing ongoing costs only, and will not help you determine the relative total costs of owning different funds. In addition, if these transactional costs were included, your costs would have been higher.
| Annualized Expense Ratio | Beginning
Account Value
January 1, 2010 | Ending
Account Value
June 30, 2010 | Expenses Paid
During Period*
January 1, 2010
to June 30, 2010 |
Initial Class | .56% | | | |
Actual | | $ 1,000.00 | $ 928.60 | $ 2.68 |
HypotheticalA | | $ 1,000.00 | $ 1,022.02 | $ 2.81 |
Service Class | .66% | | | |
Actual | | $ 1,000.00 | $ 928.30 | $ 3.16 |
HypotheticalA | | $ 1,000.00 | $ 1,021.52 | $ 3.31 |
Service Class 2 | .81% | | | |
Actual | | $ 1,000.00 | $ 927.60 | $ 3.87 |
HypotheticalA | | $ 1,000.00 | $ 1,020.78 | $ 4.06 |
Service Class 2R | .81% | | | |
Actual | | $ 1,000.00 | $ 927.20 | $ 3.87 |
HypotheticalA | | $ 1,000.00 | $ 1,020.78 | $ 4.06 |
Investor Class | .65% | | | |
Actual | | $ 1,000.00 | $ 927.80 | $ 3.11 |
HypotheticalA | | $ 1,000.00 | $ 1,021.57 | $ 3.26 |
A 5% return per year before expenses
* Expenses are equal to each Class' annualized expense ratio, multiplied by the average account value over the period, multiplied by 181/365 (to reflect the one-half year period).
Semiannual Report
Investment Changes (Unaudited)
Top Ten Stocks as of June 30, 2010 |
| % of fund's
net assets | % of fund's net assets
6 months ago |
JPMorgan Chase & Co. | 3.4 | 3.7 |
Exxon Mobil Corp. | 3.4 | 2.5 |
Wells Fargo & Co. | 3.3 | 3.4 |
Bank of America Corp. | 3.2 | 2.7 |
AT&T, Inc. | 2.4 | 3.1 |
PNC Financial Services Group, Inc. | 2.4 | 1.9 |
Chevron Corp. | 2.3 | 2.8 |
Pfizer, Inc. | 2.1 | 2.5 |
Verizon Communications, Inc. | 1.9 | 1.6 |
Merck & Co., Inc. | 1.7 | 1.7 |
| 26.1 | |
Top Five Market Sectors as of June 30, 2010 |
| % of fund's
net assets | % of fund's net assets
6 months ago |
Financials | 27.5 | 26.4 |
Energy | 15.5 | 15.3 |
Consumer Discretionary | 15.3 | 14.7 |
Industrials | 10.4 | 10.1 |
Information Technology | 7.5 | 8.6 |
Asset Allocation (% of fund's net assets) |
As of June 30, 2010 * | As of December 31, 2009 ** |
| Stocks 97.3% | | | Stocks 97.8% | |
| Bonds 2.4% | | | Bonds 2.2% | |
| Short-Term
Investments and
Net Other Assets 0.3% | | | Short-Term
Investments and
Net Other Assets† 0.0% | |
* Foreign investments | 11.9% | | ** Foreign investments | 13.1% | |

† Amount represents less than 0.1%
Semiannual Report
Investments June 30, 2010 (Unaudited)
Showing Percentage of Net Assets
Common Stocks - 96.4% |
| Shares | | Value |
CONSUMER DISCRETIONARY - 14.0% |
Auto Components - 1.6% |
Johnson Controls, Inc. | 1,580,483 | | $ 42,467,578 |
Michelin CGDE Series B (d) | 241,574 | | 16,830,312 |
The Goodyear Tire & Rubber Co. (a) | 2,128,700 | | 21,159,278 |
| | 80,457,168 |
Automobiles - 1.4% |
Bayerische Motoren Werke AG (BMW) | 166,905 | | 8,111,508 |
Daimler AG (Germany) (a) | 304,125 | | 15,373,518 |
Fiat SpA | 928,477 | | 9,536,562 |
Harley-Davidson, Inc. | 1,437,350 | | 31,952,291 |
Thor Industries, Inc. | 209,500 | | 4,975,625 |
Winnebago Industries, Inc. (a) | 407,511 | | 4,050,659 |
| | 74,000,163 |
Diversified Consumer Services - 0.6% |
Career Education Corp. (a) | 155,414 | | 3,577,630 |
H&R Block, Inc. | 1,687,086 | | 26,470,379 |
| | 30,048,009 |
Hotels, Restaurants & Leisure - 0.7% |
Las Vegas Sands Corp. unit | 85,200 | | 31,948,296 |
Sands China Ltd. | 4,370,400 | | 6,459,570 |
| | 38,407,866 |
Household Durables - 2.5% |
KB Home | 295,900 | | 3,254,900 |
Lennar Corp. Class A | 603,166 | | 8,390,039 |
Newell Rubbermaid, Inc. | 1,898,820 | | 27,798,725 |
Pulte Group, Inc. (a) | 1,665,768 | | 13,792,559 |
Stanley Black & Decker, Inc. | 695,153 | | 35,119,130 |
Techtronic Industries Co. Ltd. | 2,760,500 | | 2,150,976 |
Toll Brothers, Inc. (a) | 170,987 | | 2,797,347 |
Whirlpool Corp. | 413,834 | | 36,342,902 |
| | 129,646,578 |
Internet & Catalog Retail - 0.2% |
Liberty Media Corp. Interactive Series A (a) | 844,241 | | 8,864,531 |
Leisure Equipment & Products - 0.3% |
Brunswick Corp. | 1,013,757 | | 12,601,000 |
Media - 2.7% |
Belo Corp. Series A | 952,224 | | 5,418,155 |
Cablevision Systems Corp. - NY Group Class A | 32,044 | | 769,376 |
CC Media Holdings, Inc. Class A (a) | 693,958 | | 4,614,821 |
Comcast Corp. Class A | 2,031,436 | | 35,286,043 |
Informa PLC | 1,340,858 | | 7,082,087 |
Interpublic Group of Companies, Inc. (a) | 1,023,300 | | 7,296,129 |
The Walt Disney Co. | 1,135,300 | | 35,761,950 |
Time Warner, Inc. | 1,338,383 | | 38,692,653 |
Vivendi | 307,933 | | 6,257,586 |
| | 141,178,800 |
|
| Shares | | Value |
Multiline Retail - 1.7% |
Kohl's Corp. (a) | 597,124 | | $ 28,363,390 |
Macy's, Inc. | 1,157,800 | | 20,724,620 |
Target Corp. | 790,200 | | 38,854,134 |
Tuesday Morning Corp. (a) | 508,423 | | 2,028,608 |
| | 89,970,752 |
Specialty Retail - 2.2% |
Home Depot, Inc. | 2,038,900 | | 57,231,923 |
Lowe's Companies, Inc. | 973,978 | | 19,888,631 |
OfficeMax, Inc. (a) | 429,700 | | 5,611,882 |
RadioShack Corp. | 569,500 | | 11,110,945 |
Staples, Inc. | 986,045 | | 18,784,157 |
| | 112,627,538 |
Textiles, Apparel & Luxury Goods - 0.1% |
Phillips-Van Heusen Corp. | 119,116 | | 5,511,497 |
TOTAL CONSUMER DISCRETIONARY | | 723,313,902 |
CONSUMER STAPLES - 4.2% |
Beverages - 0.7% |
Carlsberg AS Series B | 168,362 | | 12,829,755 |
The Coca-Cola Co. | 499,829 | | 25,051,429 |
| | 37,881,184 |
Food & Staples Retailing - 1.1% |
CVS Caremark Corp. | 567,205 | | 16,630,451 |
Kroger Co. | 1,059,000 | | 20,851,710 |
Walgreen Co. | 492,462 | | 13,148,735 |
Winn-Dixie Stores, Inc. (a) | 587,020 | | 5,658,873 |
| | 56,289,769 |
Food Products - 0.6% |
Marine Harvest ASA | 7,289,000 | | 4,813,315 |
Nestle SA | 610,401 | | 29,432,824 |
| | 34,246,139 |
Household Products - 1.0% |
Kimberly-Clark Corp. | 19,500 | | 1,182,285 |
Procter & Gamble Co. | 821,313 | | 49,262,354 |
| | 50,444,639 |
Tobacco - 0.8% |
Philip Morris International, Inc. | 862,605 | | 39,541,813 |
TOTAL CONSUMER STAPLES | | 218,403,544 |
ENERGY - 15.5% |
Energy Equipment & Services - 2.6% |
Baker Hughes, Inc. | 815,431 | | 33,897,467 |
Halliburton Co. | 689,895 | | 16,936,922 |
Nabors Industries Ltd. (a) | 868,013 | | 15,294,389 |
Noble Corp. | 1,142,902 | | 35,327,101 |
Pride International, Inc. (a) | 391,500 | | 8,746,110 |
Schlumberger Ltd. | 430,712 | | 23,835,602 |
| | 134,037,591 |
Common Stocks - continued |
| Shares | | Value |
ENERGY - continued |
Oil, Gas & Consumable Fuels - 12.9% |
Anadarko Petroleum Corp. | 501,960 | | $ 18,115,736 |
Apache Corp. | 221,680 | | 18,663,239 |
Chevron Corp. | 1,786,829 | | 121,254,216 |
Cloud Peak Energy, Inc. | 186,600 | | 2,474,316 |
ConocoPhillips | 1,248,410 | | 61,284,447 |
CONSOL Energy, Inc. | 574,690 | | 19,401,534 |
Devon Energy Corp. | 199,500 | | 12,153,540 |
EOG Resources, Inc. | 347,600 | | 34,193,412 |
Exxon Mobil Corp. | 3,080,463 | | 175,802,023 |
Marathon Oil Corp. | 840,278 | | 26,124,243 |
Occidental Petroleum Corp. | 571,775 | | 44,112,441 |
Reliance Industries Ltd. | 484,316 | | 11,276,589 |
Royal Dutch Shell PLC: | | | |
Class A sponsored ADR (d) | 1,578,000 | | 79,247,160 |
Class B ADR | 226,700 | | 10,945,076 |
Southwestern Energy Co. (a) | 755,200 | | 29,180,928 |
Ultra Petroleum Corp. (a) | 96,400 | | 4,265,700 |
| | 668,494,600 |
TOTAL ENERGY | | 802,532,191 |
FINANCIALS - 26.5% |
Capital Markets - 4.7% |
Bank of New York Mellon Corp. | 1,750,499 | | 43,219,820 |
Bank Sarasin & Co. Ltd. Series B (Reg.) | 157,743 | | 6,313,315 |
Goldman Sachs Group, Inc. | 418,094 | | 54,883,199 |
Morgan Stanley | 2,868,077 | | 66,568,067 |
State Street Corp. | 903,680 | | 30,562,458 |
T. Rowe Price Group, Inc. | 202,623 | | 8,994,435 |
UBS AG (a) | 640,888 | | 8,490,367 |
UBS AG (NY Shares) (a) | 1,764,621 | | 23,328,290 |
| | 242,359,951 |
Commercial Banks - 8.6% |
Associated Banc-Corp. | 1,791,266 | | 21,960,921 |
Barclays PLC | 2,558,217 | | 10,208,060 |
BB&T Corp. | 256,000 | | 6,735,360 |
Comerica, Inc. | 495,200 | | 18,238,216 |
Huntington Bancshares, Inc. | 1,630,500 | | 9,032,970 |
KeyCorp | 3,021,200 | | 23,233,028 |
Marshall & Ilsley Corp. | 501,000 | | 3,597,180 |
Mitsubishi UFJ Financial Group, Inc. sponsored ADR | 3,609,825 | | 16,460,802 |
PNC Financial Services Group, Inc. | 2,179,030 | | 123,115,195 |
Standard Chartered PLC (United Kingdom) | 402,596 | | 9,800,428 |
U.S. Bancorp, Delaware | 1,445,538 | | 32,307,774 |
Wells Fargo & Co. | 6,687,409 | | 171,197,670 |
| | 445,887,604 |
Consumer Finance - 1.9% |
American Express Co. | 637,254 | | 25,298,984 |
|
| Shares | | Value |
Capital One Financial Corp. | 688,150 | | $ 27,732,445 |
Discover Financial Services | 2,519,369 | | 35,220,779 |
SLM Corp. (a) | 904,032 | | 9,392,892 |
| | 97,645,100 |
Diversified Financial Services - 8.1% |
Bank of America Corp. | 11,703,679 | | 168,181,867 |
Citigroup, Inc. (a) | 11,726,123 | | 44,090,222 |
CME Group, Inc. | 16,146 | | 4,545,906 |
JPMorgan Chase & Co. | 4,840,612 | | 177,214,804 |
Moody's Corp. (d) | 1,235,829 | | 24,617,714 |
| | 418,650,513 |
Insurance - 1.5% |
Berkshire Hathaway, Inc. Class B (a) | 118,700 | | 9,459,203 |
First American Financial Corp. | 289,320 | | 3,668,578 |
Hartford Financial Services Group, Inc. | 409,800 | | 9,068,874 |
Marsh & McLennan Companies, Inc. | 159,500 | | 3,596,725 |
Montpelier Re Holdings Ltd. | 1,100,900 | | 16,436,437 |
The Travelers Companies, Inc. | 397,756 | | 19,589,483 |
Unum Group | 443,641 | | 9,627,010 |
XL Capital Ltd. Class A | 315,400 | | 5,049,554 |
| | 76,495,864 |
Real Estate Investment Trusts - 0.9% |
Boston Properties, Inc. | 136,475 | | 9,736,127 |
HCP, Inc. | 980,095 | | 31,608,064 |
Segro PLC | 1,278,288 | | 4,818,243 |
| | 46,162,434 |
Real Estate Management & Development - 0.8% |
Allgreen Properties Ltd. | 2,411,000 | | 1,758,152 |
CB Richard Ellis Group, Inc. Class A (a) | 2,107,041 | | 28,676,828 |
Indiabulls Real Estate Ltd. (a) | 2,750,085 | | 9,212,044 |
Unite Group PLC (a) | 683,979 | | 1,765,978 |
| | 41,413,002 |
TOTAL FINANCIALS | | 1,368,614,468 |
HEALTH CARE - 7.2% |
Biotechnology - 1.1% |
Amgen, Inc. (a) | 581,022 | | 30,561,757 |
Biogen Idec, Inc. (a) | 233,000 | | 11,055,850 |
Cephalon, Inc. (a) | 131,000 | | 7,434,250 |
Gilead Sciences, Inc. (a) | 138,060 | | 4,732,697 |
| | 53,784,554 |
Health Care Equipment & Supplies - 0.7% |
C. R. Bard, Inc. | 145,400 | | 11,272,862 |
CareFusion Corp. (a) | 828,600 | | 18,809,220 |
Stryker Corp. | 98,600 | | 4,935,916 |
| | 35,017,998 |
Health Care Providers & Services - 0.4% |
UnitedHealth Group, Inc. | 752,700 | | 21,376,680 |
Common Stocks - continued |
| Shares | | Value |
HEALTH CARE - continued |
Pharmaceuticals - 5.0% |
Johnson & Johnson | 560,317 | | $ 33,092,322 |
Merck & Co., Inc. | 2,524,572 | | 88,284,283 |
Pfizer, Inc. | 7,613,015 | | 108,561,594 |
Sanofi-Aventis | 499,683 | | 30,093,329 |
| | 260,031,528 |
TOTAL HEALTH CARE | | 370,210,760 |
INDUSTRIALS - 10.2% |
Aerospace & Defense - 2.7% |
Goodrich Corp. | 128,142 | | 8,489,408 |
Honeywell International, Inc. | 1,102,025 | | 43,012,036 |
Spirit AeroSystems Holdings, Inc. Class A (a) | 711,982 | | 13,570,377 |
The Boeing Co. | 445,784 | | 27,972,946 |
United Technologies Corp. | 715,540 | | 46,445,701 |
| | 139,490,468 |
Building Products - 0.3% |
Armstrong World Industries, Inc. (a) | 67,514 | | 2,037,573 |
Masco Corp. | 1,342,200 | | 14,442,072 |
| | 16,479,645 |
Commercial Services & Supplies - 0.2% |
Pitney Bowes, Inc. | 355,000 | | 7,795,800 |
Republic Services, Inc. | 58,500 | | 1,739,205 |
| | 9,535,005 |
Construction & Engineering - 0.5% |
Fluor Corp. | 316,900 | | 13,468,250 |
KBR, Inc. | 728,574 | | 14,819,195 |
| | 28,287,445 |
Electrical Equipment - 0.2% |
Schneider Electric SA | 86,546 | | 8,740,786 |
Industrial Conglomerates - 3.2% |
General Electric Co. | 5,097,903 | | 73,511,761 |
Koninklijke Philips Electronics NV unit | 118,300 | | 3,530,072 |
Rheinmetall AG | 317,633 | | 18,137,735 |
Siemens AG sponsored ADR | 455,900 | | 40,816,727 |
Textron, Inc. | 858,000 | | 14,560,260 |
Tyco International Ltd. | 396,236 | | 13,959,394 |
| | 164,515,949 |
Machinery - 2.4% |
ArvinMeritor, Inc. (a) | 126,000 | | 1,650,600 |
Briggs & Stratton Corp. | 1,067,988 | | 18,177,156 |
Caterpillar, Inc. | 101,800 | | 6,115,126 |
Cummins, Inc. | 372,200 | | 24,241,386 |
Eaton Corp. | 253,600 | | 16,595,584 |
Ingersoll-Rand Co. Ltd. | 673,888 | | 23,242,397 |
Kennametal, Inc. | 481,691 | | 12,249,402 |
Navistar International Corp. (a) | 242,970 | | 11,954,124 |
|
| Shares | | Value |
SPX Corp. | 145,800 | | $ 7,699,698 |
Vallourec SA (d) | 21,100 | | 3,637,751 |
| | 125,563,224 |
Road & Rail - 0.7% |
CSX Corp. | 370,400 | | 18,382,952 |
Union Pacific Corp. | 246,000 | | 17,099,460 |
| | 35,482,412 |
TOTAL INDUSTRIALS | | 528,094,934 |
INFORMATION TECHNOLOGY - 7.1% |
Communications Equipment - 0.8% |
Cisco Systems, Inc. (a) | 917,603 | | 19,554,120 |
Comverse Technology, Inc. (a) | 1,295,139 | | 10,102,084 |
Motorola, Inc. (a) | 1,756,493 | | 11,452,334 |
| | 41,108,538 |
Computers & Peripherals - 0.8% |
Hewlett-Packard Co. | 962,645 | | 41,663,276 |
Electronic Equipment & Components - 1.7% |
Agilent Technologies, Inc. (a) | 724,881 | | 20,608,367 |
Arrow Electronics, Inc. (a) | 756,900 | | 16,916,715 |
Avnet, Inc. (a) | 919,854 | | 22,177,680 |
Tyco Electronics Ltd. | 1,052,736 | | 26,718,440 |
| | 86,421,202 |
IT Services - 0.5% |
CoreLogic, Inc. (a) | 289,320 | | 5,109,391 |
Hewitt Associates, Inc. Class A (a) | 371,985 | | 12,818,603 |
MoneyGram International, Inc. (a) | 438,950 | | 1,075,428 |
Visa, Inc. Class A | 77,976 | | 5,516,802 |
| | 24,520,224 |
Office Electronics - 0.2% |
Xerox Corp. | 1,705,878 | | 13,715,259 |
Semiconductors & Semiconductor Equipment - 3.1% |
Analog Devices, Inc. | 175,219 | | 4,881,601 |
Applied Materials, Inc. | 1,848,200 | | 22,215,364 |
Intel Corp. | 3,001,300 | | 58,375,285 |
Micron Technology, Inc. (a) | 1,507,800 | | 12,801,222 |
National Semiconductor Corp. | 1,524,747 | | 20,523,095 |
Novellus Systems, Inc. (a) | 313,539 | | 7,951,349 |
Samsung Electronics Co. Ltd. | 12,977 | | 8,130,805 |
Teradyne, Inc. (a) | 1,659,200 | | 16,177,200 |
Varian Semiconductor Equipment Associates, Inc. (a) | 350,600 | | 10,048,196 |
| | 161,104,117 |
TOTAL INFORMATION TECHNOLOGY | | 368,532,616 |
MATERIALS - 2.5% |
Chemicals - 1.6% |
Celanese Corp. Class A | 481,012 | | 11,982,009 |
Clariant AG (Reg.) (a) | 1,506,845 | | 19,080,283 |
Dow Chemical Co. | 413,800 | | 9,815,336 |
Common Stocks - continued |
| Shares | | Value |
MATERIALS - continued |
Chemicals - continued |
E.I. du Pont de Nemours & Co. | 775,700 | | $ 26,831,463 |
Monsanto Co. | 203,100 | | 9,387,282 |
Wacker Chemie AG (d) | 58,400 | | 8,468,949 |
| | 85,565,322 |
Construction Materials - 0.2% |
HeidelbergCement AG | 192,600 | | 9,151,177 |
Metals & Mining - 0.5% |
Alcoa, Inc. | 1,126,371 | | 11,331,292 |
Commercial Metals Co. | 442,971 | | 5,856,077 |
Freeport-McMoRan Copper & Gold, Inc. | 135,551 | | 8,015,131 |
| | 25,202,500 |
Paper & Forest Products - 0.2% |
Weyerhaeuser Co. | 281,484 | | 9,908,237 |
TOTAL MATERIALS | | 129,827,236 |
TELECOMMUNICATION SERVICES - 5.5% |
Diversified Telecommunication Services - 5.0% |
AT&T, Inc. | 5,151,969 | | 124,626,130 |
Qwest Communications International, Inc. | 7,149,900 | | 37,536,975 |
Verizon Communications, Inc. | 3,388,202 | | 94,937,420 |
| | 257,100,525 |
Wireless Telecommunication Services - 0.5% |
Sprint Nextel Corp. (a) | 6,587,878 | | 27,932,603 |
TOTAL TELECOMMUNICATION SERVICES | | 285,033,128 |
UTILITIES - 3.7% |
Electric Utilities - 2.6% |
Allegheny Energy, Inc. | 1,238,409 | | 25,610,298 |
American Electric Power Co., Inc. | 1,344,579 | | 43,429,902 |
Entergy Corp. | 335,159 | | 24,004,088 |
FirstEnergy Corp. | 1,056,300 | | 37,213,449 |
PPL Corp. | 156,100 | | 3,894,695 |
| | 134,152,432 |
Independent Power Producers & Energy Traders - 0.8% |
AES Corp. (a) | 2,879,421 | | 26,605,850 |
Constellation Energy Group, Inc. | 388,406 | | 12,526,094 |
| | 39,131,944 |
|
| Shares | | Value |
Multi-Utilities - 0.3% |
Alliant Energy Corp. | 327,652 | | $ 10,399,674 |
CMS Energy Corp. | 507,324 | | 7,432,297 |
| | 17,831,971 |
TOTAL UTILITIES | | 191,116,347 |
TOTAL COMMON STOCKS (Cost $5,451,596,027) | 4,985,679,126 |
Preferred Stocks - 0.9% |
| | | |
Convertible Preferred Stocks - 0.9% |
FINANCIALS - 0.8% |
Commercial Banks - 0.2% |
Huntington Bancshares, Inc. 8.50% | 9,000 | | 8,910,000 |
Diversified Financial Services - 0.2% |
Citigroup, Inc. 7.50% | 87,000 | | 9,831,000 |
Insurance - 0.4% |
Hartford Financial Services Group, Inc. Series F 7.25% | 310,900 | | 7,169,354 |
XL Capital Ltd. 10.75% | 494,600 | | 12,429,298 |
| | 19,598,652 |
TOTAL FINANCIALS | | 38,339,652 |
UTILITIES - 0.1% |
Electric Utilities - 0.1% |
PPL Corp. 9.50% (a) | 121,900 | | 6,320,515 |
TOTAL CONVERTIBLE PREFERRED STOCKS | | 44,660,167 |
Nonconvertible Preferred Stocks - 0.0% |
FINANCIALS - 0.0% |
Insurance - 0.0% |
Fondiaria-Sai SpA (Risparmio Shares) | 317,862 | | 1,846,537 |
TOTAL PREFERRED STOCKS (Cost $48,754,472) | 46,506,704 |
Corporate Bonds - 2.4% |
| Principal Amount | | |
Convertible Bonds - 2.2% |
CONSUMER DISCRETIONARY - 1.3% |
Automobiles - 0.3% |
Ford Motor Co. 4.25% 11/15/16 | | $ 10,390,000 | | 12,903,341 |
Hotels, Restaurants & Leisure - 0.1% |
MGM Mirage, Inc. 4.25% 4/15/15 (e) | | 7,050,000 | | 5,529,844 |
Leisure Equipment & Products - 0.0% |
Eastman Kodak Co. 7% 4/1/17 (e) | | 2,030,000 | | 1,801,422 |
Corporate Bonds - continued |
| Principal Amount | | Value |
Convertible Bonds - continued |
CONSUMER DISCRETIONARY - continued |
Media - 0.9% |
Liberty Global, Inc. 4.5% 11/15/16 (e) | | $ 3,400,000 | | $ 3,952,500 |
Liberty Media Corp.: | | | | |
3.5% 1/15/31 | | 255,482 | | 157,877 |
4% 11/15/29 | | 4,750,000 | | 2,434,375 |
3.5% 1/15/31 (e) | | 9,342,795 | | 5,773,436 |
News America, Inc. liquid yield option note: | | | | |
0% 2/28/21 (e) | | 22,670,000 | | 15,693,988 |
0% 2/28/21 | | 3,490,000 | | 2,416,057 |
Virgin Media, Inc. 6.5% 11/15/16 | | 12,614,000 | | 14,671,343 |
| | 45,099,576 |
TOTAL CONSUMER DISCRETIONARY | | 65,334,183 |
FINANCIALS - 0.2% |
Thrifts & Mortgage Finance - 0.2% |
MGIC Investment Corp. 0% 4/1/63 (a)(c)(e) | | 10,438,000 | | 8,976,680 |
INDUSTRIALS - 0.2% |
Airlines - 0.2% |
AMR Corp. 6.25% 10/15/14 | | 1,930,000 | | 1,843,536 |
UAL Corp.: | | | | |
4.5% 6/30/21 (e) | | 8,490,000 | | 8,296,428 |
4.5% 6/30/21 | | 280,000 | | 273,616 |
| | 10,413,580 |
INFORMATION TECHNOLOGY - 0.4% |
Semiconductors & Semiconductor Equipment - 0.4% |
Advanced Micro Devices, Inc.: | | | | |
6% 5/1/15 (e) | | 13,250,000 | | 12,571,600 |
6% 5/1/15 | | 5,870,000 | | 5,569,456 |
Micron Technology, Inc. 1.875% 6/1/14 | | 5,570,000 | | 4,905,081 |
| | 23,046,137 |
MATERIALS - 0.1% |
Metals & Mining - 0.1% |
United States Steel Corp. 4% 5/15/14 | | 3,150,000 | | 4,421,813 |
TOTAL CONVERTIBLE BONDS | | 112,192,393 |
|
| Principal Amount | | Value |
Nonconvertible Bonds - 0.2% |
MATERIALS - 0.2% |
Chemicals - 0.2% |
Hercules, Inc. 6.5% 6/30/29 unit | | $ 15,700,000 | | $ 10,715,250 |
TOTAL CORPORATE BONDS (Cost $123,054,787) | 122,907,643 |
Money Market Funds - 0.4% |
| Shares | | |
Fidelity Cash Central Fund, 0.20% (f) | 12,629,648 | | 12,629,648 |
Fidelity Securities Lending Cash Central Fund, 0.24% (b)(f) | 10,005,431 | | 10,005,431 |
TOTAL MONEY MARKET FUNDS (Cost $22,635,079) | 22,635,079 |
TOTAL INVESTMENT PORTFOLIO - 100.1% (Cost $5,646,040,365) | 5,177,728,552 |
NET OTHER ASSETS (LIABILITIES) - (0.1)% | | (5,825,696) |
NET ASSETS - 100% | $ 5,171,902,856 |
Legend |
(a) Non-income producing |
(b) Investment made with cash collateral received from securities on loan. |
(c) Security initially issued in zero coupon form which converts to coupon form at a specified rate and date. The rate shown is the rate at period end. |
(d) Security or a portion of the security is on loan at period end. |
(e) Security exempt from registration under Rule 144A of the Securities Act of 1933. These securities may be resold in transactions exempt from registration, normally to qualified institutional buyers. At the end of the period, the value of these securities amounted to $62,595,898 or 1.2% of net assets. |
(f) Affiliated fund that is available only to investment companies and other accounts managed by Fidelity Investments. The rate quoted is the annualized seven-day yield of the fund at period end. A complete unaudited listing of the fund's holdings as of its most recent quarter end is available upon request. |
Affiliated Central Funds |
Information regarding fiscal year to date income earned by the Fund from investments in Fidelity Central Funds is as follows: |
Fund | Income earned |
Fidelity Cash Central Fund | $ 12,887 |
Fidelity Securities Lending Cash Central Fund | 623,083 |
Total | $ 635,970 |
Other Information |
The following is a summary of the inputs used, as of June 30, 2010, involving the Fund's assets and liabilities carried at value. The inputs or methodology used for valuing securities may not be an indication of the risk associated with investing in those securities. For more information on valuation inputs, and their aggregation into the levels used in the table below, please refer to the Security Valuation section in the accompanying Notes to Financial Statements. |
Valuation Inputs at Reporting Date: |
Description | Total | Level 1 | Level 2 | Level 3 |
Investments in Securities: | | | | |
Equities: | | | | |
Consumer Discretionary | $ 723,313,902 | $ 619,563,487 | $ 103,750,415 | $ - |
Consumer Staples | 218,403,544 | 171,327,650 | 47,075,894 | - |
Energy | 802,532,191 | 791,255,602 | 11,276,589 | - |
Financials | 1,408,800,657 | 1,338,508,179 | 70,292,478 | - |
Health Care | 370,210,760 | 340,117,431 | 30,093,329 | - |
Industrials | 528,094,934 | 497,578,662 | 30,516,272 | - |
Information Technology | 368,532,616 | 360,401,811 | 8,130,805 | - |
Materials | 129,827,236 | 93,126,827 | 36,700,409 | - |
Telecommunication Services | 285,033,128 | 285,033,128 | - | - |
Utilities | 197,436,862 | 191,116,347 | 6,320,515 | - |
Corporate Bonds | 122,907,643 | - | 122,907,643 | - |
Money Market Funds | 22,635,079 | 22,635,079 | - | - |
Total Investments in Securities: | $ 5,177,728,552 | $ 4,710,664,203 | $ 467,064,349 | $ - |
Distribution of investments by country of issue, as a percentage of total net assets, is as follows: (Unaudited) |
United States of America | 88.1% |
Switzerland | 3.1% |
United Kingdom | 2.2% |
Germany | 1.8% |
France | 1.4% |
Others (Individually Less Than 1%) | 3.4% |
| 100.0% |
Income Tax Information |
At December 31, 2009, the Fund had a capital loss carryforward of approximately $535,850,194 of which $240,221,884 and $295,628,310 will expire on December 31, 2016 and 2017, respectively. Capital loss carryforwards are only available to offset future capital gains of the Fund to the extent provided by regulations and may be limited. |
See accompanying notes which are an integral part of the financial statements.
Semiannual Report
Statement of Assets and Liabilities
| June 30, 2010 (Unaudited) |
| | |
Assets | | |
Investment in securities, at value (including securities loaned of $9,617,421) - See accompanying schedule: Unaffiliated issuers (cost $5,623,405,286) | $ 5,155,093,473 | |
Fidelity Central Funds (cost $22,635,079) | 22,635,079 | |
Total Investments (cost $5,646,040,365) | | $ 5,177,728,552 |
Cash | | 235,211 |
Foreign currency held at value (cost $159,889) | | 159,980 |
Receivable for investments sold | | 13,166,807 |
Receivable for fund shares sold | | 4,852,853 |
Dividends receivable | | 5,484,066 |
Interest receivable | | 685,230 |
Distributions receivable from Fidelity Central Funds | | 82,362 |
Other receivables | | 270,691 |
Total assets | | 5,202,665,752 |
| | |
Liabilities | | |
Payable for investments purchased | $ 14,454,648 | |
Payable for fund shares redeemed | 2,934,592 | |
Accrued management fee | 2,107,198 | |
Distribution fees payable | 337,157 | |
Other affiliated payables | 405,902 | |
Other payables and accrued expenses | 517,968 | |
Collateral on securities loaned, at value | 10,005,431 | |
Total liabilities | | 30,762,896 |
| | |
Net Assets | | $ 5,171,902,856 |
Net Assets consist of: | | |
Paid in capital | | $ 6,003,774,681 |
Undistributed net investment income | | 44,962,234 |
Accumulated undistributed net realized gain (loss) on investments and foreign currency transactions | | (408,521,352) |
Net unrealized appreciation (depreciation) on investments and assets and liabilities in foreign currencies | | (468,312,707) |
Net Assets | | $ 5,171,902,856 |
Statement of Assets and Liabilities - continued
| June 30, 2010 (Unaudited) |
| | |
Initial Class:
Net Asset Value, offering price and redemption price per share ($3,293,218,503 ÷ 211,167,883 shares) | | $ 15.60 |
| | |
Service Class:
Net Asset Value, offering price and redemption price per share ($367,066,140 ÷ 23,624,789 shares) | | $ 15.54 |
| | |
Service Class 2:
Net Asset Value, offering price and redemption price per share ($1,372,332,592 ÷ 89,369,679 shares) | | $ 15.36 |
| | |
Service Class 2R:
Net Asset Value, offering price and redemption price per share ($6,204,322 ÷ 406,006 shares) | | $ 15.28 |
| | |
Investor Class:
Net Asset Value, offering price and redemption price per share ($133,081,299 ÷ 8,556,492 shares) | | $ 15.55 |
See accompanying notes which are an integral part of the financial statements.
Semiannual Report
Statement of Operations
Six months ended June 30, 2010 (Unaudited) |
| | |
Investment Income | | |
Dividends | | $ 59,419,467 |
Interest | | 3,466,757 |
Income from Fidelity Central Funds | | 635,970 |
Total income | | 63,522,194 |
| | |
Expenses | | |
Management fee | $ 13,487,760 | |
Transfer agent fees | 2,069,724 | |
Distribution fees | 2,160,257 | |
Accounting and security lending fees | 577,005 | |
Custodian fees and expenses | 78,563 | |
Independent trustees' compensation | 17,026 | |
Appreciation in deferred trustee compensation account | 14 | |
Audit | 36,975 | |
Legal | 10,455 | |
Interest | 3,781 | |
Miscellaneous | 266,265 | |
Total expenses before reductions | 18,707,825 | |
Expense reductions | (87,717) | 18,620,108 |
Net investment income (loss) | | 44,902,086 |
Realized and Unrealized Gain (Loss) Net realized gain (loss) on: | | |
Investment securities: | | |
Unaffiliated issuers | 199,295,109 | |
Foreign currency transactions | (205,128) | |
Total net realized gain (loss) | | 199,089,981 |
Change in net unrealized appreciation (depreciation) on: Investment securities (net of decrease in deferred foreign taxes of $170,609) | (636,485,507) | |
Assets and liabilities in foreign currencies | (6,411) | |
Total change in net unrealized appreciation (depreciation) | | (636,491,918) |
Net gain (loss) | | (437,401,937) |
Net increase (decrease) in net assets resulting from operations | | $ (392,499,851) |
Statement of Changes in Net Assets
| Six months ended June 30, 2010
(Unaudited) | Year ended
December 31, 2009 |
Increase (Decrease) in Net Assets | | |
Operations | | |
Net investment income (loss) | $ 44,902,086 | $ 115,365,664 |
Net realized gain (loss) | 199,089,981 | (309,873,827) |
Change in net unrealized appreciation (depreciation) | (636,491,918) | 1,591,452,108 |
Net increase (decrease) in net assets resulting from operations | (392,499,851) | 1,396,943,945 |
Distributions to shareholders from net investment income | (3,492,089) | (115,095,209) |
Share transactions - net increase (decrease) | (345,260,987) | (545,969,487) |
Redemption fees | 2,218 | 1,473 |
Total increase (decrease) in net assets | (741,250,709) | 735,880,722 |
| | |
Net Assets | | |
Beginning of period | 5,913,153,565 | 5,177,272,843 |
End of period (including undistributed net investment income of $44,962,234 and undistributed net investment income of $3,552,237, respectively) | $ 5,171,902,856 | $ 5,913,153,565 |
See accompanying notes which are an integral part of the financial statements.
Semiannual Report
Financial Highlights - Initial Class
| Six months ended June 30, 2010 | Years ended December 31, |
| (Unaudited) | 2009 | 2008 | 2007 | 2006 | 2005 |
Selected Per-Share Data | | | | | | |
Net asset value, beginning of period | $ 16.81 | $ 13.18 | $ 23.91 | $ 26.20 | $ 25.49 | $ 25.37 |
Income from Investment Operations | | | | | | |
Net investment income (loss) E | .14 | .33 | .47 | .47 | .45 | .42 |
Net realized and unrealized gain (loss) | (1.34) | 3.64 | (10.67) | (.05) | 4.37 | 1.00 |
Total from investment operations | (1.20) | 3.97 | (10.20) | .42 | 4.82 | 1.42 |
Distributions from net investment income | (.01) | (.34) | (.51) | (.50) | (.89) | (.41) |
Distributions from net realized gain | - | - | (.02) | (2.21) | (3.22) | (.89) |
Total distributions | (.01) | (.34) | (.53) | (2.71) | (4.11) | (1.30) |
Redemption fees added to paid in capital E, I | - | - | - | - | - | - |
Net asset value, end of period | $ 15.60 | $ 16.81 | $ 13.18 | $ 23.91 | $ 26.20 | $ 25.49 |
Total Return B, C, D | (7.14)% | 30.21% | (42.65)% | 1.53% | 20.19% | 5.87% |
Ratios to Average Net Assets F, H | | | | | | |
Expenses before reductions | .56% A | .58% | .57% | .55% | .57% | .56% |
Expenses net of fee waivers, if any | .56% A | .58% | .57% | .55% | .57% | .56% |
Expenses net of all reductions | .56% A | .58% | .57% | .54% | .56% | .55% |
Net investment income (loss) | 1.60% A | 2.29% | 2.37% | 1.71% | 1.76% | 1.71% |
Supplemental Data | | | | | | |
Net assets, end of period (000 omitted) | $ 3,293,219 | $ 3,771,733 | $ 3,322,799 | $ 7,201,655 | $ 8,315,159 | $ 7,875,801 |
Portfolio turnover rate G | 30% A | 29% | 34% | 20% | 22% | 19% |
A Annualized B Total returns for periods of less than one year are not annualized. C Total returns do not reflect charges attributable to your insurance company's separate account. Inclusion of these charges would reduce the total returns shown. D Total returns would have been lower had certain expenses not been reduced during the periods shown. E Calculated based on average shares outstanding during the period. F Fees and expenses of the underlying Fidelity Central Funds are not included in the Fund's expense ratio. The Fund indirectly bears its proportionate share of the expenses of any underlying Fidelity Central Funds. G Amount does not include the portfolio activity of any underlying Fidelity Central Funds. H Expense ratios reflect operating expenses of the class. Expenses before reductions do not reflect amounts reimbursed by the investment adviser or reductions from brokerage service arrangements or reductions from other expense offset arrangements and do not represent the amount paid by the class during periods when reimbursements or reductions occur. Expenses net of fee waivers reflect expenses after reimbursement by the investment adviser but prior to reductions from brokerage service arrangements or other expense offset arrangements. Expenses net of all reductions represent the net expenses paid by the class. I Amount represents less than $.01 per share. |
Financial Highlights - Service Class
| Six months ended June 30, 2010 | Years ended December 31, |
| (Unaudited) | 2009 | 2008 | 2007 | 2006 | 2005 |
Selected Per-Share Data | | | | | | |
Net asset value, beginning of period | $ 16.75 | $ 13.14 | $ 23.82 | $ 26.11 | $ 25.39 | $ 25.28 |
Income from Investment Operations | | | | | | |
Net investment income (loss) E | .13 | .31 | .44 | .44 | .43 | .39 |
Net realized and unrealized gain (loss) | (1.33) | 3.63 | (10.62) | (.05) | 4.35 | 1.00 |
Total from investment operations | (1.20) | 3.94 | (10.18) | .39 | 4.78 | 1.39 |
Distributions from net investment income | (.01) | (.33) | (.48) | (.47) | (.84) | (.39) |
Distributions from net realized gain | - | - | (.02) | (2.21) | (3.22) | (.89) |
Total distributions | (.01) | (.33) | (.50) | (2.68) | (4.06) | (1.28) |
Redemption fees added to paid in capital E,I | - | - | - | - | - | - |
Net asset value, end of period | $ 15.54 | $ 16.75 | $ 13.14 | $ 23.82 | $ 26.11 | $ 25.39 |
Total Return B, C, D | (7.17)% | 30.03% | (42.70)% | 1.42% | 20.08% | 5.76% |
Ratios to Average Net Assets F, H | | | | | | |
Expenses before reductions | .66% A | .68% | .67% | .65% | .67% | .66% |
Expenses net of fee waivers, if any | .66% A | .68% | .67% | .65% | .67% | .66% |
Expenses net of all reductions | .66% A | .68% | .67% | .64% | .66% | .65% |
Net investment income (loss) | 1.50% A | 2.19% | 2.27% | 1.61% | 1.66% | 1.61% |
Supplemental Data | | | | | | |
Net assets, end of period (000 omitted) | $ 367,066 | $ 430,383 | $ 405,082 | $ 920,054 | $ 1,118,333 | $ 1,079,838 |
Portfolio turnover rate G | 30% A | 29% | 34% | 20% | 22% | 19% |
A Annualized B Total returns for periods of less than one year are not annualized. C Total returns do not reflect charges attributable to your insurance company's separate account. Inclusion of these charges would reduce the total returns shown. D Total returns would have been lower had certain expenses not been reduced during the periods shown. E Calculated based on average shares outstanding during the period. F Fees and expenses of the underlying Fidelity Central Funds are not included in the Fund's expense ratio. The Fund indirectly bears its proportionate share of the expenses of any underlying Fidelity Central Funds. G Amount does not include the portfolio activity of any underlying Fidelity Central Funds. H Expense ratios reflect operating expenses of the class. Expenses before reductions do not reflect amounts reimbursed by the investment adviser or reductions from brokerage service arrangements or reductions from other expense offset arrangements and do not represent the amount paid by the class during periods when reimbursements or reductions occur. Expenses net of fee waivers reflect expenses after reimbursement by the investment adviser but prior to reductions from brokerage service arrangements or other expense offset arrangements. Expenses net of all reductions represent the net expenses paid by the class. I Amount represents less than $.01 per share. |
See accompanying notes which are an integral part of the financial statements.
Semiannual Report
Financial Highlights - Service Class 2
| Six months ended
June 30, 2010 | Years ended December 31, |
| (Unaudited) | 2009 | 2008 | 2007 | 2006 | 2005 |
Selected Per-Share Data | | | | | | |
Net asset value, beginning of period | $ 16.57 | $ 13.00 | $ 23.57 | $ 25.87 | $ 25.17 | $ 25.09 |
Income from Investment Operations | | | | | | |
Net investment income (loss) E | .11 | .29 | .41 | .39 | .38 | .35 |
Net realized and unrealized gain (loss) | (1.31) | 3.58 | (10.50) | (.04) | 4.32 | .98 |
Total from investment operations | (1.20) | 3.87 | (10.09) | .35 | 4.70 | 1.33 |
Distributions from net investment income | (.01) | (.30) | (.46) | (.44) | (.78) | (.36) |
Distributions from net realized gain | - | - | (.02) | (2.21) | (3.22) | (.89) |
Total distributions | (.01) | (.30) | (.48) | (2.65) | (4.00) | (1.25) |
Redemption fees added to paid in capital E, I | - | - | - | - | - | - |
Net asset value, end of period | $ 15.36 | $ 16.57 | $ 13.00 | $ 23.57 | $ 25.87 | $ 25.17 |
Total Return B, C, D | (7.24)% | 29.88% | (42.81)% | 1.27% | 19.93% | 5.57% |
Ratios to Average Net Assets F, H | | | | | | |
Expenses before reductions | .81% A | .83% | .82% | .80% | .82% | .81% |
Expenses net of fee waivers, if any | .81% A | .83% | .82% | .80% | .82% | .81% |
Expenses net of all reductions | .81% A | .83% | .82% | .80% | .82% | .80% |
Net investment income (loss) | 1.35% A | 2.04% | 2.12% | 1.46% | 1.51% | 1.46% |
Supplemental Data |
| | | | | |
Net assets, end of period (000 omitted) | $ 1,372,333 | $ 1,558,421 | $ 1,321,569 | $ 2,583,129 | $ 2,373,059 | $ 1,723,546 |
Portfolio turnover rate G | 30% A | 29% | 34% | 20% | 22% | 19% |
A Annualized B Total returns for periods of less than one year are not annualized. C Total returns do not reflect charges attributable to your insurance company's separate account. Inclusion of these charges would reduce the total returns shown. D Total returns would have been lower had certain expenses not been reduced during the periods shown. E Calculated based on average shares outstanding during the period. F Fees and expenses of the underlying Fidelity Central Funds are not included in the Fund's expense ratio. The Fund indirectly bears its proportionate share of the expenses of any underlying Fidelity Central Funds. G Amount does not include the portfolio activity of any underlying Fidelity Central Funds. H Expense ratios reflect operating expenses of the class. Expenses before reductions do not reflect amounts reimbursed by the investment adviser or reductions from brokerage service arrangements or reductions from other expense offset arrangements and do not represent the amount paid by the class during periods when reimbursements or reductions occur. Expenses net of fee waivers reflect expenses after reimbursement by the investment adviser but prior to reductions from brokerage service arrangements or other expense offset arrangements. Expenses net of all reductions represent the net expenses paid by the class. I Amount represents less than $.01 per share. |
Financial Highlights - Service Class 2R
| Six months ended
June 30, 2010 | Years ended December 31, |
| (Unaudited) | 2009 | 2008 | 2007 | 2006 | 2005 |
Selected Per-Share Data | | | | | | |
Net asset value, beginning of period | $ 16.49 | $ 12.93 | $ 23.44 | $ 25.73 | $ 25.08 | $ 25.01 |
Income from Investment Operations | | | | | | |
Net investment income (loss) E | .11 | .28 | .41 | .39 | .38 | .35 |
Net realized and unrealized gain (loss) | (1.31) | 3.58 | (10.45) | (.04) | 4.29 | .99 |
Total from investment operations | (1.20) | 3.86 | (10.04) | .35 | 4.67 | 1.34 |
Distributions from net investment income | (.01) | (.30) | (.45) | (.43) | (.80) | (.38) |
Distributions from net realized gain | - | - | (.02) | (2.21) | (3.22) | (.89) |
Total distributions | (.01) | (.30) | (.47) | (2.64) | (4.02) | (1.27) |
Redemption fees added to paid in capital E, I | - | - | - | - | - | - |
Net asset value, end of period | $ 15.28 | $ 16.49 | $ 12.93 | $ 23.44 | $ 25.73 | $ 25.08 |
Total Return B, C, D | (7.28)% | 29.95% | (42.82)% | 1.27% | 19.89% | 5.61% |
Ratios to Average Net Assets F, H | | | | | | |
Expenses before reductions | .81% A | .83% | .82% | .80% | .82% | .81% |
Expenses net of fee waivers, if any | .81% A | .83% | .82% | .80% | .82% | .81% |
Expenses net of all reductions | .81% A | .83% | .81% | .79% | .81% | .80% |
Net investment income (loss) | 1.35% A | 2.04% | 2.12% | 1.46% | 1.51% | 1.46% |
Supplemental Data | | | | | | |
Net assets, end of period (000 omitted) | $ 6,204 | $ 5,259 | $ 5,339 | $ 13,558 | $ 17,089 | $ 9,651 |
Portfolio turnover rate G | 30% A | 29% | 34% | 20% | 22% | 19% |
A Annualized B Total returns for periods of less than one year are not annualized. C Total returns do not reflect charges attributable to your insurance company's separate account. Inclusion of these charges would reduce the total returns shown. D Total returns would have been lower had certain expenses not been reduced during the periods shown. E Calculated based on average shares outstanding during the period. F Fees and expenses of the underlying Fidelity Central Funds are not included in the Fund's expense ratio. The Fund indirectly bears its proportionate share of the expenses of any underlying Fidelity Central Funds. G Amount does not include the portfolio activity of any underlying Fidelity Central Funds. H Expense ratios reflect operating expenses of the class. Expenses before reductions do not reflect amounts reimbursed by the investment adviser or reductions from brokerage service arrangements or reductions from other expense offset arrangements and do not represent the amount paid by the class during periods when reimbursements or reductions occur. Expenses net of fee waivers reflect expenses after reimbursement by the investment adviser but prior to reductions from brokerage service arrangements or other expense offset arrangements. Expenses net of all reductions represent the net expenses paid by the class. I Amount represents less than $.01 per share. |
See accompanying notes which are an integral part of the financial statements.
Semiannual Report
Financial Highlights - Investor Class
| Six months ended
June 30, 2010 | Years ended December 31, |
| (Unaudited) | 2009 | 2008 | 2007 | 2006 | 2005 H |
Selected Per-Share Data | | | | | | |
Net asset value, beginning of period | $ 16.77 | $ 13.15 | $ 23.85 | $ 26.15 | $ 25.48 | $ 24.46 |
Income from Investment Operations | | | | | | |
Net investment income (loss) E | .13 | .31 | .44 | .44 | .42 | .17 |
Net realized and unrealized gain (loss) | (1.34) | 3.64 | (10.63) | (.05) | 4.36 | .85 |
Total from investment operations | (1.21) | 3.95 | (10.19) | .39 | 4.78 | 1.02 |
Distributions from net investment income | (.01) | (.33) | (.49) | (.48) | (.89) | - |
Distributions from net realized gain | - | - | (.02) | (2.21) | (3.22) | - |
Total distributions | (.01) | (.33) | (.51) | (2.69) | (4.11) | - |
Redemption fees added to paid in capital E, J | - | - | - | - | - | - |
Net asset value, end of period | $ 15.55 | $ 16.77 | $ 13.15 | $ 23.85 | $ 26.15 | $ 25.48 |
Total Return B, C, D | (7.22)% | 30.09% | (42.71)% | 1.39% | 20.04% | 4.17% |
Ratios to Average Net Assets F, I | | | | | | |
Expenses before reductions | .65% A | .68% | .66% | .66% | .69% | .74% A |
Expenses net of fee waivers, if any | .65% A | .68% | .66% | .66% | .69% | .74% A |
Expenses net of all reductions | .65% A | .68% | .66% | .66% | .69% | .73% A |
Net investment income (loss) | 1.52% A | 2.19% | 2.28% | 1.60% | 1.63% | 1.54% A |
Supplemental Data | | | | | | |
Net assets, end of period (000 omitted) | $ 133,081 | $ 147,358 | $ 122,483 | $ 230,534 | $ 170,050 | $ 37,500 |
Portfolio turnover rate G | 30% A | 29% | 34% | 20% | 22% | 19% |
A Annualized B Total returns for periods of less than one year are not annualized. C Total returns do not reflect charges attributable to your insurance company's separate account. Inclusion of these charges would reduce the total returns shown. D Total returns would have been lower had certain expenses not been reduced during the periods shown. E Calculated based on average shares outstanding during the period. F Fees and expenses of the underlying Fidelity Central Funds are not included in the Fund's expense ratio. The Fund indirectly bears its proportionate share of the expenses of any underlying Fidelity Central Funds. G Amount does not include the portfolio activity of any underlying Fidelity Central Funds. H For the period July 21, 2005 (commencement of sale of shares) to December 31, 2005. I Expense ratios reflect operating expenses of the class. Expenses before reductions do not reflect amounts reimbursed by the investment adviser or reductions from brokerage service arrangements or reductions from other expense offset arrangements and do not represent the amount paid by the class during periods when reimbursements or reductions occur. Expense ratios before reductions for start-up periods may not be representative of longer-term operating periods. Expenses net of fee waivers reflect expenses after reimbursement by the investment adviser but prior to reductions from brokerage service arrangements or other expense offset arrangements. Expenses net of all reductions represent the net expenses paid by the class. J Amount represents less than $.01 per share. |
See accompanying notes which are an integral part of the financial statements.
Semiannual Report
Notes to Financial Statements
For the period ended June 30, 2010 (Unaudited)
1. Organization.
VIP Equity-Income Portfolio (the Fund) is a fund of Variable Insurance Products Fund (the Trust) and is authorized to issue an unlimited number of shares. The Trust is registered under the Investment Company Act of 1940, as amended (the 1940 Act), as an open-end management investment company organized as a Massachusetts business trust. Shares of the Fund may only be purchased by insurance companies for the purpose of funding variable annuity or variable life insurance contracts. The Fund offers the following classes of shares: Initial Class shares, Service Class shares, Service Class 2 shares, Service Class 2R shares, and Investor Class shares. All classes have equal rights and voting privileges, except for matters affecting a single class. Investment income, realized and unrealized capital gains and losses, the common expenses of the Fund, and certain fund-level expense reductions, if any, are allocated on a pro-rata basis to each class based on the relative net assets of each class to the total net assets of the Fund. Each class differs with respect to transfer agent and distribution and service plan fees incurred. Certain expense reductions also differ by class.
2. Investments in Fidelity Central Funds.
The Fund may invest in Fidelity Central Funds, which are open-end investment companies available only to other investment companies and accounts managed by Fidelity Management & Research Company (FMR) and its affiliates. The Fund's Schedule of Investments lists each of the Fidelity Central Funds held as of period end, if any, as an investment of the Fund, but does not include the underlying holdings of each Fidelity Central Fund. As an Investing Fund, the Fund indirectly bears its proportionate share of the expenses of the underlying Fidelity Central Funds.
The Money Market Central Funds seek preservation of capital and current income and are managed by Fidelity Investments Money Management, Inc. (FIMM), an affiliate of FMR.
A complete unaudited list of holdings for each Fidelity Central Fund is available upon request or at the Securities and Exchange Commission (the SEC) web site at www.sec.gov. In addition, the financial statements of the Fidelity Central Funds are available on the SEC web site or upon request.
3. Significant Accounting Policies.
The financial statements have been prepared in conformity with accounting principles generally accepted in the United States of America (GAAP), which require management to make certain estimates and assumptions at the date of the financial statements. Actual results could differ from those estimates. The following summarizes the significant accounting policies of the Fund:
Security Valuation. Investments are valued as of 4:00 p.m. Eastern time on the last calendar day of the period. The Fund uses independent pricing services approved by the Board of Trustees to value its investments. When current market prices or quotations are not readily available or reliable, valuations may be determined in good faith in accordance with procedures adopted by the Board of Trustees. Factors used in determining value may include market or security specific events, changes in interest rates and credit quality. The frequency with which these procedures are used cannot be predicted and they may be utilized to a significant extent. The value used for net asset value (NAV) calculation under these procedures may differ from published prices for the same securities.
The Fund categorizes the inputs to valuation techniques used to value its investments into a disclosure hierarchy consisting of three levels as shown below.
Level 1 - quoted prices in active markets for identical investments
Level 2 - other significant observable inputs (including quoted prices for similar investments, interest rates, prepayment speeds, etc.)
Level 3 - unobservable inputs (including the fund's own assumptions based on the best information available)
Changes in valuation techniques may result in transfers in or out of an assigned level within the disclosure hierarchy. The aggregate value of investments by input level, as of June 30, 2010 is included at the end of the Fund's Schedule of Investments. Valuation techniques used to value the Fund's investments by major category are as follows.
Equity securities, including restricted securities, for which market quotations are readily available, are valued at the last reported sale price or official closing price as reported by an independent pricing service on the primary market or exchange on which they are traded and are categorized as Level 1 in the hierarchy. In the event there were no sales during the day or closing prices are not available, securities are valued at the last quoted bid price or may be valued using the last available price and are generally categorized as Level 2 in the hierarchy. For foreign equity securities, when significant market or security specific events arise, comparisons to the valuation of American Depositary Receipts (ADRs), futures contracts, Exchange-traded funds (ETFs) and certain indexes as well as quoted prices for similar securities are used and are categorized as Level 2 in the hierarchy in these circumstances. Utilizing these techniques may result in transfers between Level 1 and Level 2. For restricted equity securities and private placements where observable inputs are limited, assumptions about market activity and risk are used and are categorized as Level 3 in the hierarchy.
Semiannual Report
Notes to Financial Statements (Unaudited) - continued
3. Significant Accounting Policies - continued
Security Valuation - continued
Debt securities, including restricted securities, are valued based on evaluated prices received from independent pricing services or from dealers who make markets in such securities. For corporate bonds, pricing services utilize matrix pricing which considers yield or price of bonds of comparable quality, coupon, maturity and type as well as dealer supplied prices and are generally categorized as Level 2 in the hierarchy.
Investments in open-end mutual funds, including the Fidelity Central Funds, are valued at their closing net asset value each business day and are categorized as Level 1 in the hierarchy. Short-term securities with remaining maturities of sixty days or less for which quotations are not readily available are valued at amortized cost, which approximates value and are categorized as Level 2 in the hierarchy.
When independent prices are unavailable or unreliable, debt securities may be valued utilizing pricing matrices which consider similar factors that would be used by independent pricing services. These are generally categorized as Level 2 in the hierarchy but may be Level 3 depending on the circumstances.
Foreign Currency. The Fund uses foreign currency contracts to facilitate transactions in foreign-denominated securities. Gains and losses from these transactions may arise from changes in the value of the foreign currency or if the counterparties do not perform under the contracts' terms.
Foreign-denominated assets, including investment securities, and liabilities are translated into U.S. dollars at the exchange rate at period end. Purchases and sales of investment securities, income and dividends received and expenses denominated in foreign currencies are translated into U.S. dollars at the exchange rate in effect on the transaction date.
The effects of exchange rate fluctuations on investments are included with the net realized and unrealized gain (loss) on investment securities. Other foreign currency transactions resulting in realized and unrealized gain (loss) are disclosed separately.
Investment Transactions and Income. For financial reporting purposes, the Fund's investment holdings and NAV include trades executed through the end of the last business day of the period. The NAV per share for processing shareholder transactions is calculated as of the close of business of the New York Stock Exchange (NYSE), normally 4:00 p.m. Eastern time and includes trades executed through the end of the prior business day. Gains and losses on securities sold are determined on the basis of identified cost and may include proceeds received from litigation. Dividend income is recorded on the ex-dividend date, except for certain dividends from foreign securities where the ex-dividend date may have passed, which are recorded as soon as the Fund is informed of the ex-dividend date. Non-cash dividends included in dividend income, if any, are recorded at the fair market value of the securities received. Distributions received on securities that represent a return of capital or capital gain are recorded as a reduction of cost of investments and/or as a realized gain. The Fund estimates the components of distributions received that may be considered return of capital distributions or capital gain distributions. Interest income and distributions from the Fidelity Central Funds are accrued as earned. Interest income includes coupon interest and amortization of premium and accretion of discount on debt securities. Investment income is recorded net of foreign taxes withheld where recovery of such taxes is uncertain. Debt obligations may be placed on non-accrual status and related interest income may be reduced by ceasing current accruals and writing off interest receivables when the collection of all or a portion of interest has become doubtful based on consistently applied procedures. A debt obligation is removed from non-accrual status when the issuer resumes interest payments or when collectability of interest is reasonably assured.
Expenses. Most expenses of the Trust can be directly attributed to a fund. Expenses which cannot be directly attributed are apportioned amongst each fund in the Trust. Expense estimates are accrued in the period to which they relate and adjustments are made when actual amounts are known.
Deferred Trustee Compensation. Under a Deferred Compensation Plan (the Plan), independent Trustees may elect to defer receipt of a portion of their annual compensation. Deferred amounts are invested in a cross-section of Fidelity funds, are marked-to-market and remain in the Fund until distributed in accordance with the Plan. The investment of deferred amounts and the offsetting payable to the Trustees are included in the accompanying Statement of Assets and Liabilities.
Income Tax Information and Distributions to Shareholders. Each year, the Fund intends to qualify as a regulated investment company by distributing substantially all of its taxable income and realized gains under Subchapter M of the Internal Revenue Code and filing its U.S. federal tax return. As a result, no provision for income taxes is required. A fund's federal tax return is subject to examination by the Internal Revenue Service (IRS) for a period of three years. Foreign taxes are provided for based on the Fund's understanding of the tax rules and rates that exist in the foreign markets in which it invests.
Distributions are recorded on the ex-dividend date. Income dividends and capital gain distributions are declared separately for each class. Income and capital gain distributions are determined in accordance with income tax regulations, which may differ from GAAP.
Capital accounts within the financial statements are adjusted for permanent book-tax differences. These adjustments have no impact on net assets or the results of operations. Temporary book-tax differences will reverse in a subsequent period.
Semiannual Report
3. Significant Accounting Policies - continued
Income Tax Information and Distributions to Shareholders - continued
Book-tax differences are primarily due to the short-term gain distributions from the Fidelity Central Funds, foreign currency transactions, certain foreign taxes, passive foreign investment companies (PFIC), market discount, partnerships, deferred trustees compensation, capital loss carryforwards and losses deferred due to wash sales.
The federal tax cost of investment securities and unrealized appreciation (depreciation) as of period end were as follows:
Gross unrealized appreciation | $ 805,550,846 |
Gross unrealized depreciation | (1,305,424,800) |
Net unrealized appreciation (depreciation) | $ (499,873,954) |
| |
Tax cost | $ 5,677,602,506 |
Trading (Redemption) Fees. Service Class 2 R shares held less than 60 days are subject to a redemption fee equal to 1% of the proceeds of the redeemed shares. All redemption fees, including any estimated redemption fees paid by FMR, are retained by the Fund and accounted for as an addition to paid in capital.
4. Operating Policies.
Restricted Securities. The Fund may invest in securities that are subject to legal or contractual restrictions on resale. These securities generally may be resold in transactions exempt from registration or to the public if the securities are registered. Disposal of these securities may involve time-consuming negotiations and expense, and prompt sale at an acceptable price may be difficult. Information regarding restricted securities is included at the end of the Fund's Schedule of Investments.
5. Purchases and Sales of Investments.
Purchases and sales of securities, other than short-term securities, aggregated $873,122,930 and $1,192,225,755, respectively.
6. Fees and Other Transactions with Affiliates.
Management Fee. FMR and its affiliates provide the Fund with investment management related services for which the Fund pays a monthly management fee. The management fee is the sum of an individual fund fee rate that is based on an annual rate of .20% of the Fund's average net assets and a group fee rate that averaged .26% during the period. The group fee rate is based upon the average net assets of all the mutual funds advised by FMR. The group fee rate decreases as assets under management increase and increases as assets under management decrease. For the period, the total annualized management fee rate was .46% of the Fund's average net assets.
Distribution and Service Plan. In accordance with Rule 12b-1 of the 1940 Act, the Fund has adopted separate 12b-1 Plans for each Service Class of shares. Each Service Class pays Fidelity Distributors Corporation (FDC), an affiliate of FMR, a service fee. For the period, the service fee is based on an annual rate of .10% of Service Class' average net assets and .25% of Service Class 2's and Service Class 2R's average net assets.
For the period, each class paid FDC the following amounts, all of which were re-allowed to insurance companies for the distribution of shares and providing shareholder support services:
Service Class | $ 212,087 |
Service Class 2 | 1,941,019 |
Service Class 2 R | 7,151 |
| $ 2,160,257 |
Transfer Agent Fees. Fidelity Investments Institutional Operations Company, Inc. (FIIOC), an affiliate of FMR, is the Fund's transfer, dividend disbursing, and shareholder servicing agent. FIIOC receives an asset-based fee with respect to each class. Each class (with the exception of Investor Class) pays a transfer agent fee, excluding out of pocket expenses, equal to an annual rate of .07% of average net assets. Investor Class pays a monthly asset-based transfer agent fee of .15% of average net assets. The total transfer agent fees paid by each class to FIIOC, including out of pocket expenses, were as follows:
Initial Class | $ 1,276,106 |
Service Class | 144,199 |
Service Class 2 | 530,528 |
Service Class 2R | 1,924 |
Investor Class | 116,967 |
| $ 2,069,724 |
Semiannual Report
Notes to Financial Statements (Unaudited) - continued
6. Fees and Other Transactions with Affiliates - continued
Accounting and Security Lending Fees. Fidelity Service Company, Inc. (FSC), an affiliate of FMR, maintains the Fund's accounting records. The accounting fee is based on the level of average net assets for the month. Under a separate contract, FSC administers the security lending program. The security lending fee is based on the number and duration of lending transactions.
Brokerage Commissions. The Fund placed a portion of its portfolio transactions with brokerage firms which are affiliates of the investment adviser. The commissions paid to these affiliated firms were $9,444 for the period.
Interfund Lending Program. Pursuant to an Exemptive Order issued by the SEC, the Fund, along with other registered investment companies having management contracts with FMR, may participate in an interfund lending program. This program provides an alternative credit facility allowing the funds to borrow from, or lend money to, other participating affiliated funds. At period end, there were no interfund loans outstanding. The Fund's activity in this program during the period for which loans were outstanding was as follows:
Borrower or Lender | Average Daily Loan Balance | Weighted Average Interest Rate | Interest Expense |
Borrower | $ 8,064,108 | .43% | $ 3,601 |
7. Committed Line of Credit.
The Fund participates with other funds managed by FMR in a $3.75 billion credit facility (the "line of credit") to be utilized for temporary or emergency purposes to fund shareholder redemptions or for other short-term liquidity purposes. The Fund has agreed to pay commitment fees on its pro-rata portion of the line of credit, which amounted to $11,862 and is reflected in Miscellaneous expenses on the Statement of Operations. During the period, there were no borrowings on this line of credit.
8. Security Lending.
The Fund lends portfolio securities from time to time in order to earn additional income. On the settlement date of the loan, the Fund receives collateral (in the form of U.S. Treasury obligations, letters of credit and/or cash) against the loaned securities and maintains collateral in an amount not less than 100% of the market value of the loaned securities during the period of the loan. The market value of the loaned securities is determined at the close of business of the Fund and any additional required collateral is delivered to the Fund on the next business day. If the borrower defaults on its obligation to return the securities loaned because of insolvency or other reasons, a fund could experience delays and costs in recovering the securities loaned or in gaining access to the collateral. Any cash collateral received is invested in the Fidelity Securities Lending Cash Central Fund. The value of loaned securities and cash collateral at period end are disclosed on the Fund's Statement of Assets and Liabilities. Security lending income represents the income earned on investing cash collateral, less fees and expenses associated with the loan, plus any premium payments that may be received on the loan of certain types of securities. Security lending income is presented in the Statement of Operations as a component of income from Fidelity Central Funds. Net income from lending portfolio securities during the period amounted to $623,083.
9. Bank Borrowings.
The Fund is permitted to have bank borrowings for temporary or emergency purposes to fund shareholder redemptions. The Fund has established borrowing arrangements with certain banks. The interest rate on the borrowings is the bank's base rate, as revised from time to time. The average daily loan balance during the period for which loans were outstanding amounted to $9,231,000. The weighted average interest rate was .70%. The interest expense amounted to $180 under the bank borrowing program. At period end, there were no bank borrowings outstanding.
10. Expense Reductions.
Many of the brokers with whom FMR places trades on behalf of the Fund provided services to the Fund in addition to trade execution. These services included payments of certain expenses on behalf of the Fund totaling $87,717 for the period.
Semiannual Report
11. Distributions to Shareholders.
Distributions to shareholders of each class were as follows:
| Six months ended
June 30, 2010 | Year ended
December 31, 2009 |
From net investment income | | |
Initial Class | $ 2,217,576 | $ 75,517,681 |
Service Class | 253,392 | 8,350,109 |
Service Class 2 | 929,687 | 28,318,758 |
Service Class 2R | 3,105 | 96,589 |
Investor Class | 88,329 | 2,812,072 |
Total | $ 3,492,089 | $ 115,095,209 |
12. Share Transactions.
Transactions for each class of shares were as follows:
| Shares | Dollars |
| Six months ended June 30, 2010 | Year ended December 31, 2009 | Six months ended June 30, 2010 | Year ended December 31, 2009 |
Initial Class | | | | |
Shares sold | 2,589,688 | 8,717,811 | $ 44,777,781 | $ 119,199,048 |
Reinvestment of distributions | 138,081 | 4,649,155 | 2,217,576 | 75,517,681 |
Shares redeemed | (15,983,025) | (41,112,018) | (274,866,035) | (560,835,381) |
Net increase (decrease) | (13,255,256) | (27,745,052) | $ (227,870,678) | $ (366,118,652) |
Service Class | | | | |
Shares sold | 413,298 | 1,374,191 | $ 7,103,293 | $ 18,756,098 |
Reinvestment of distributions | 15,827 | 516,788 | 253,392 | 8,350,109 |
Shares redeemed | (2,495,293) | (7,035,493) | (42,740,428) | (95,421,754) |
Net increase (decrease) | (2,066,168) | (5,144,514) | $ (35,383,743) | $ (68,315,547) |
Service Class 2 | | | | |
Shares sold | 2,927,261 | 9,883,762 | $ 49,401,550 | $ 131,168,937 |
Reinvestment of distributions | 58,729 | 1,771,906 | 929,687 | 28,318,758 |
Shares redeemed | (7,672,531) | (19,265,158) | (129,938,653) | (264,471,751) |
Net increase (decrease) | (4,686,541) | (7,609,490) | $ (79,607,416) | $ (104,984,056) |
Service Class 2R | | | | |
Shares sold | 156,354 | 65,422 | $ 2,642,315 | $ 914,849 |
Reinvestment of distributions | 197 | 6,094 | 3,105 | 96,589 |
Shares redeemed | (69,509) | (165,320) | (1,167,636) | (2,222,121) |
Net increase (decrease) | 87,042 | (93,804) | $ 1,477,784 | $ (1,210,683) |
Investor Class | | | | |
Shares sold | 662,402 | 1,142,867 | $ 11,452,697 | $ 16,328,956 |
Reinvestment of distributions | 5,510 | 173,430 | 88,329 | 2,812,072 |
Shares redeemed | (899,227) | (1,842,484) | (15,417,960) | (24,481,577) |
Net increase (decrease) | (231,315) | (526,187) | $ (3,876,934) | $ (5,340,549) |
13. Other.
The Fund's organizational documents provide former and current trustees and officers with a limited indemnification against liabilities arising in connection with the performance of their duties to the Fund. In the normal course of business, the Fund may also enter into contracts that provide general indemnifications. The Fund's maximum exposure under these arrangements is unknown as this would be dependent on future claims that may be made against the Fund. The risk of material loss from such claims is considered remote.
At the end of the period, FMR or its affiliates were the owners of record of 12% of the total outstanding shares of the Fund and two otherwise unaffiliated shareholders were the owners of record of 30% of the total outstanding shares of the Fund.
Semiannual Report
Investment Adviser
Fidelity Management & Research Company
Boston, MA
Investment Sub-Adviser
FMR Co., Inc.
Fidelity Management & Research (U.K.) Inc.
Fidelity Research & Analysis Company
FIL Investments (Japan) Limited
FIL Investment Advisors
FIL Investment Advisors (U.K.) Ltd.
Fidelity Management & Research (Hong Kong) Limited
Fidelity Management & Research (Japan) Inc.
General Distributor
Fidelity Distributors Corporation
Boston, MA
Transfer and Service Agents
Fidelity Investments Institutional Operations Company, Inc.
Boston, MA
Fidelity Service Company, Inc.
Boston, MA
Custodian
The Northern Trust Company
Chicago, IL
VIPEI2R-SANN-0810
1.833447.104
Fidelity® Variable Insurance Products:
Growth Portfolio
Semiannual Report
June 30, 2010
(2_fidelity_logos) (Registered_Trademark)
Contents
Shareholder Expense Example | <Click Here> | An example of shareholder expenses. |
Investment Changes | <Click Here> | A summary of major shifts in the fund's investments over the past six months. |
Investments | <Click Here> | A complete list of the fund's investments with their market values. |
Financial Statements | <Click Here> | Statements of assets and liabilities, operations, and changes in net assets, as well as financial highlights. |
Notes | <Click Here> | Notes to the financial statements. |
To view a fund's proxy voting guidelines and proxy voting record for the 12-month period ended June 30, visit http://www.fidelity.com/proxyvotingresults or visit the Securities and Exchange Commission's (SEC) web site at http://www.sec.gov. You may also call 1-877-208-0098 to request a free copy of the proxy voting guidelines.
Fidelity Variable Insurance Products are separate account options which are purchased through a variable insurance contract.
Standard & Poor's, S&P and S&P 500 are registered service marks of The McGraw-Hill Companies, Inc. and have been licensed for use by Fidelity Distributors Corporation.
Other third party marks appearing herein are the property of their respective owners.
All other marks appearing herein are registered or unregistered trademarks or service marks of FMR LLC or an affiliated company.
This report and the financial statements contained herein are submitted for the general information of the shareholders of the fund. This report is not authorized for distribution to prospective investors in the fund unless preceded or accompanied by an effective prospectus.
A fund files its complete schedule of portfolio holdings with the SEC for the first and third quarters of each fiscal year on Form N-Q. Forms N-Q are available on the SEC's web site at http://www.sec.gov. A fund's Forms N-Q may be reviewed and copied at the SEC's Public Reference Room in Washington, DC. Information regarding the operation of the SEC's Public Reference Room may be obtained by calling 1-800-SEC-0330. For a complete list of a fund's portfolio holdings, view the most recent holdings listing, semiannual report, or annual report on Fidelity's web site at http://www.fidelity.com or http://www.advisor.fidelity.com, as applicable.
NOT FDIC INSURED • MAY LOSE VALUE • NO BANK GUARANTEE
Neither the fund nor Fidelity Distributors Corporation is a bank.
Semiannual Report
As a shareholder of the Fund, you incur two types of costs: (1) transaction costs, including redemption fees, and (2) ongoing costs, including management fees, distribution and/or service (12b-1) fees and other Fund expenses. This Example is intended to help you understand your ongoing costs (in dollars) of investing in the Fund and to compare these costs with the ongoing costs of investing in other mutual funds.
The Example is based on an investment of $1,000 invested at the beginning of the period and held for the entire period (January 1, 2010 to June 30, 2010).
Actual Expenses
The first line of the accompanying table for each class of the Fund provides information about actual account values and actual expenses. You may use the information in this line, together with the amount you invested, to estimate the expenses that you paid over the period. Simply divide your account value by $1,000.00 (for example, an $8,600 account value divided by $1,000.00 = 8.6), then multiply the result by the number in the first line for a class of the Fund under the heading entitled "Expenses Paid During Period" to estimate the expenses you paid on your account during this period. The estimate of expenses does not include any fees or other expenses of any variable annuity or variable life insurance product. If they were, the estimate of expenses you paid during the period would be higher, and your ending account value would be lower. In addition, the Fund, as a shareholder in the underlying Fidelity Central Funds, will indirectly bear its pro-rata share of the fees and expenses incurred by the underlying Fidelity Central Funds. These fees and expenses are not included in the Fund's annualized expense ratio used to calculate the expense estimate in the table below.
Hypothetical Example for Comparison Purposes
The second line of the accompanying table for each class of the Fund provides information about hypothetical account values and hypothetical expenses based on a Class' actual expense ratio and an assumed rate of return of 5% per year before expenses, which is not the Class' actual return. The hypothetical account values and expenses may not be used to estimate the actual ending account balance or expenses you paid for the period. You may use this information to compare the ongoing costs of investing in the Fund and other funds. To do so, compare this 5% hypothetical example with the 5% hypothetical examples that appear in the shareholder reports of the other funds. The estimate of expenses does not include any fees or other expenses of any variable annuity or variable life insurance product. If they were, the estimate of expenses you paid during the period would be higher, and your ending account value would be lower. In addition, the Fund, as a shareholder in the underlying Fidelity Central Funds, will indirectly bear its pro-rata share of the fees and expenses incurred by the underlying Fidelity Central Funds. These fees and expenses are not included in the Fund's annualized expense ratio used to calculate the expense estimate in the table below.
Please note that the expenses shown in the table are meant to highlight your ongoing costs only and do not reflect any transaction costs. Therefore, the second line of the table is useful in comparing ongoing costs only, and will not help you determine the relative total costs of owning different funds. In addition, if these transactional costs were included, your costs would have been higher.
| Annualized Expense Ratio | Beginning
Account Value
January 1, 2010 | Ending
Account Value
June 30, 2010 | Expenses Paid
During Period*
January 1, 2010
to June 30, 2010 |
Initial Class | .67% | | | |
Actual | | $ 1,000.00 | $ 950.20 | $ 3.24 |
HypotheticalA | | $ 1,000.00 | $ 1,021.47 | $ 3.36 |
Service Class | .77% | | | |
Actual | | $ 1,000.00 | $ 950.10 | $ 3.72 |
HypotheticalA | | $ 1,000.00 | $ 1,020.98 | $ 3.86 |
Service Class 2 | .92% | | | |
Actual | | $ 1,000.00 | $ 949.10 | $ 4.45 |
HypotheticalA | | $ 1,000.00 | $ 1,020.23 | $ 4.61 |
Service Class 2R | .92% | | | |
Actual | | $ 1,000.00 | $ 949.00 | $ 4.45 |
HypotheticalA | | $ 1,000.00 | $ 1,020.23 | $ 4.61 |
Investor Class | .76% | | | |
Actual | | $ 1,000.00 | $ 950.10 | $ 3.67 |
HypotheticalA | | $ 1,000.00 | $ 1,021.03 | $ 3.81 |
A 5% return per year before expenses
* Expenses are equal to each Class' annualized expense ratio, multiplied by the average account value over the period, multiplied by 181/365 (to reflect the one-half year period).
Semiannual Report
Investment Changes (Unaudited)
Top Ten Stocks as of June 30, 2010 |
| % of fund's
net assets | % of fund's net assets
6 months ago |
Apple, Inc. | 5.9 | 4.0 |
Cisco Systems, Inc. | 5.0 | 4.8 |
QUALCOMM, Inc. | 3.1 | 3.5 |
United Technologies Corp. | 2.6 | 2.0 |
Procter & Gamble Co. | 2.6 | 1.0 |
Juniper Networks, Inc. | 2.5 | 1.4 |
Google, Inc. Class A | 2.3 | 4.5 |
Medco Health Solutions, Inc. | 2.1 | 2.4 |
Agilent Technologies, Inc. | 1.9 | 2.1 |
Express Scripts, Inc. | 1.6 | 1.3 |
| 29.6 | |
Top Five Market Sectors as of June 30, 2010 |
| % of fund's
net assets | % of fund's net assets
6 months ago |
Information Technology | 34.0 | 37.4 |
Health Care | 15.7 | 12.6 |
Consumer Discretionary | 15.3 | 13.2 |
Industrials | 12.7 | 9.7 |
Consumer Staples | 8.4 | 7.6 |
Asset Allocation (% of fund's net assets) |
As of June 30, 2010 * | As of December 31, 2009 ** |
| Stocks 97.8% | | | Stocks 98.5% | |
| Short-Term
Investments and
Net Other Assets 2.2% | | | Short-Term
Investments and
Net Other Assets 1.5% | |
* Foreign investments | 9.7% | | ** Foreign investments | 12.9% | |

Semiannual Report
Investments June 30, 2010 (Unaudited)
Showing Percentage of Net Assets
Common Stocks - 97.8% |
| Shares | | Value |
CONSUMER DISCRETIONARY - 15.3% |
Auto Components - 0.2% |
Gentex Corp. | 405,800 | | $ 7,296,284 |
Automobiles - 0.9% |
Harley-Davidson, Inc. | 1,341,421 | | 29,819,789 |
Diversified Consumer Services - 1.8% |
Navitas Ltd. | 2,440,338 | | 9,471,199 |
Strayer Education, Inc. (c) | 184,469 | | 38,349,260 |
Universal Technical Institute, Inc. | 421,355 | | 9,960,832 |
| | 57,781,291 |
Hotels, Restaurants & Leisure - 3.3% |
Chipotle Mexican Grill, Inc. (a) | 13,893 | | 1,900,701 |
Denny's Corp. (a) | 1,076,027 | | 2,797,670 |
Home Inns & Hotels Management, Inc. sponsored ADR (a) | 122,172 | | 4,769,595 |
Marriott International, Inc. Class A | 213,213 | | 6,383,597 |
McDonald's Corp. | 572,800 | | 37,730,336 |
Starbucks Corp. | 1,322,073 | | 32,126,374 |
Starwood Hotels & Resorts Worldwide, Inc. | 279,900 | | 11,596,257 |
The Cheesecake Factory, Inc. (a) | 412,925 | | 9,191,711 |
| | 106,496,241 |
Household Durables - 0.4% |
Mohawk Industries, Inc. (a) | 272,299 | | 12,460,402 |
Internet & Catalog Retail - 1.2% |
Amazon.com, Inc. (a) | 353,069 | | 38,576,319 |
Media - 1.4% |
DIRECTV (a) | 405,000 | | 13,737,600 |
Discovery Communications, Inc.
Class C (a) | 339,191 | | 10,491,178 |
Interpublic Group of Companies, Inc. (a) | 1,581,443 | | 11,275,689 |
McGraw-Hill Companies, Inc. | 402,710 | | 11,332,259 |
| | 46,836,726 |
Multiline Retail - 1.3% |
Dollarama, Inc. | 718,740 | | 16,710,173 |
Dollarama, Inc. (d) | 128,200 | | 2,980,555 |
Target Corp. | 436,024 | | 21,439,300 |
| | 41,130,028 |
Specialty Retail - 3.0% |
Lowe's Companies, Inc. | 1,075,491 | | 21,961,526 |
Ross Stores, Inc. | 303,509 | | 16,173,995 |
TJX Companies, Inc. | 554,895 | | 23,277,845 |
Urban Outfitters, Inc. (a) | 566,298 | | 19,474,988 |
Vitamin Shoppe, Inc. | 675,100 | | 17,316,315 |
| | 98,204,669 |
Textiles, Apparel & Luxury Goods - 1.8% |
Coach, Inc. | 498,100 | | 18,205,555 |
|
| Shares | | Value |
lululemon athletica, Inc. (a) | 666,600 | | $ 24,810,852 |
Polo Ralph Lauren Corp. Class A | 207,900 | | 15,168,384 |
| | 58,184,791 |
TOTAL CONSUMER DISCRETIONARY | | 496,786,540 |
CONSUMER STAPLES - 8.4% |
Beverages - 0.7% |
The Coca-Cola Co. | 447,541 | | 22,430,755 |
Food & Staples Retailing - 2.1% |
Costco Wholesale Corp. | 69,600 | | 3,816,168 |
Walgreen Co. | 1,045,369 | | 27,911,352 |
Whole Foods Market, Inc. (a) | 998,000 | | 35,947,960 |
| | 67,675,480 |
Food Products - 0.9% |
Diamond Foods, Inc. | 432,549 | | 17,777,764 |
Mead Johnson Nutrition Co. Class A | 224,969 | | 11,275,446 |
| | 29,053,210 |
Household Products - 3.8% |
Colgate-Palmolive Co. | 510,049 | | 40,171,459 |
Procter & Gamble Co. | 1,391,236 | | 83,446,335 |
| | 123,617,794 |
Personal Products - 0.9% |
Estee Lauder Companies, Inc. Class A | 205,076 | | 11,428,885 |
Herbalife Ltd. | 377,907 | | 17,402,617 |
| | 28,831,502 |
TOTAL CONSUMER STAPLES | | 271,608,741 |
ENERGY - 2.3% |
Energy Equipment & Services - 0.9% |
Schlumberger Ltd. | 541,233 | | 29,951,834 |
Oil, Gas & Consumable Fuels - 1.4% |
Denbury Resources, Inc. (a) | 1,458,101 | | 21,346,599 |
Southwestern Energy Co. (a) | 411,474 | | 15,899,355 |
Whiting Petroleum Corp. (a) | 98,800 | | 7,747,896 |
| | 44,993,850 |
TOTAL ENERGY | | 74,945,684 |
FINANCIALS - 5.6% |
Capital Markets - 0.8% |
BlackRock, Inc. Class A | 72,709 | | 10,426,471 |
Charles Schwab Corp. | 855,448 | | 12,130,253 |
Goldman Sachs Group, Inc. | 25,158 | | 3,302,491 |
JMP Group, Inc. | 127,100 | | 786,749 |
| | 26,645,964 |
Commercial Banks - 2.1% |
M&T Bank Corp. (c) | 88,785 | | 7,542,286 |
PNC Financial Services Group, Inc. | 399,089 | | 22,548,529 |
Wells Fargo & Co. | 1,445,227 | | 36,997,811 |
| | 67,088,626 |
Common Stocks - continued |
| Shares | | Value |
FINANCIALS - continued |
Consumer Finance - 1.2% |
American Express Co. | 1,027,200 | | $ 40,779,840 |
Diversified Financial Services - 0.9% |
CME Group, Inc. | 40,707 | | 11,461,056 |
JPMorgan Chase & Co. | 454,198 | | 16,628,189 |
| | 28,089,245 |
Insurance - 0.4% |
AFLAC, Inc. | 321,900 | | 13,735,473 |
Real Estate Management & Development - 0.2% |
CB Richard Ellis Group, Inc. Class A (a) | 436,297 | | 5,938,002 |
TOTAL FINANCIALS | | 182,277,150 |
HEALTH CARE - 15.7% |
Biotechnology - 2.5% |
Alexion Pharmaceuticals, Inc. (a) | 176,642 | | 9,042,304 |
Celgene Corp. (a) | 99,335 | | 5,048,205 |
Clinical Data, Inc. (a) | 707,221 | | 8,797,829 |
Human Genome Sciences, Inc. (a) | 396,700 | | 8,989,222 |
Incyte Corp. (a) | 734,200 | | 8,127,594 |
United Therapeutics Corp. (a) | 806,660 | | 39,373,075 |
| | 79,378,229 |
Health Care Equipment & Supplies - 2.0% |
AGA Medical Holdings, Inc. | 801,896 | | 10,176,060 |
C. R. Bard, Inc. | 36,000 | | 2,791,080 |
Conceptus, Inc. (a)(c) | 392,266 | | 6,111,504 |
Covidien PLC | 128,396 | | 5,158,951 |
DENTSPLY International, Inc. | 61,814 | | 1,848,857 |
Edwards Lifesciences Corp. (a) | 269,112 | | 15,075,654 |
NuVasive, Inc. (a)(c) | 522,251 | | 18,519,020 |
Sonova Holding AG Class B | 51,697 | | 6,344,132 |
| | 66,025,258 |
Health Care Providers & Services - 4.9% |
Emergency Medical Services Corp. Class A (a) | 208,400 | | 10,217,852 |
Express Scripts, Inc. (a) | 1,138,010 | | 53,509,230 |
Henry Schein, Inc. (a) | 99,019 | | 5,436,143 |
Medco Health Solutions, Inc. (a) | 1,224,306 | | 67,434,774 |
VCA Antech, Inc. (a) | 914,488 | | 22,642,723 |
| | 159,240,722 |
Life Sciences Tools & Services - 2.5% |
Illumina, Inc. (a) | 692,449 | | 30,142,305 |
Life Technologies Corp. (a) | 518,390 | | 24,493,928 |
QIAGEN NV (a) | 605,130 | | 11,630,599 |
Thermo Fisher Scientific, Inc. (a) | 281,400 | | 13,802,670 |
| | 80,069,502 |
Pharmaceuticals - 3.8% |
Allergan, Inc. | 180,200 | | 10,498,452 |
Biovail Corp. | 1,048,700 | | 20,204,628 |
Novo Nordisk AS Series B | 512,963 | | 41,440,628 |
|
| Shares | | Value |
Perrigo Co. | 288,400 | | $ 17,035,788 |
Teva Pharmaceutical Industries Ltd. sponsored ADR | 480,600 | | 24,986,394 |
Valeant Pharmaceuticals International (a) | 172,200 | | 9,004,338 |
| | 123,170,228 |
TOTAL HEALTH CARE | | 507,883,939 |
INDUSTRIALS - 12.7% |
Aerospace & Defense - 5.5% |
Esterline Technologies Corp. (a) | 283,674 | | 13,460,331 |
Goodrich Corp. | 404,979 | | 26,829,859 |
Honeywell International, Inc. | 745,307 | | 29,089,332 |
Precision Castparts Corp. | 216,000 | | 22,230,720 |
TransDigm Group, Inc. | 67,298 | | 3,434,217 |
United Technologies Corp. | 1,290,900 | | 83,792,319 |
| | 178,836,778 |
Air Freight & Logistics - 0.6% |
C.H. Robinson Worldwide, Inc. | 324,900 | | 18,083,934 |
Airlines - 0.4% |
Southwest Airlines Co. | 1,176,908 | | 13,075,448 |
Building Products - 0.3% |
Lennox International, Inc. | 209,322 | | 8,701,516 |
Commercial Services & Supplies - 0.9% |
Higher One Holdings, Inc. | 490,600 | | 7,113,700 |
Republic Services, Inc. | 505,000 | | 15,013,650 |
Steelcase, Inc. Class A | 431,402 | | 3,343,366 |
Waste Connections, Inc. (a) | 142,300 | | 4,964,847 |
| | 30,435,563 |
Construction & Engineering - 0.1% |
Fluor Corp. | 75,600 | | 3,213,000 |
Electrical Equipment - 0.8% |
Acuity Brands, Inc. | 217,600 | | 7,916,288 |
AMETEK, Inc. | 406,800 | | 16,333,020 |
Crompton Greaves Ltd. | 576,754 | | 3,185,525 |
| | 27,434,833 |
Industrial Conglomerates - 0.7% |
3M Co. | 302,892 | | 23,925,439 |
Machinery - 2.2% |
Cummins, Inc. | 347,234 | | 22,615,350 |
Danaher Corp. | 483,168 | | 17,935,196 |
Gardner Denver, Inc. | 150,725 | | 6,720,828 |
Ingersoll-Rand Co. Ltd. | 215,347 | | 7,427,318 |
PACCAR, Inc. | 250,300 | | 9,979,461 |
Weg SA | 735,600 | | 6,815,222 |
| | 71,493,375 |
Professional Services - 0.8% |
51job, Inc. sponsored ADR (a) | 97,726 | | 2,033,678 |
CoStar Group, Inc. (a)(c) | 43,900 | | 1,703,320 |
Equifax, Inc. | 59,900 | | 1,680,794 |
Common Stocks - continued |
| Shares | | Value |
INDUSTRIALS - continued |
Professional Services - continued |
IHS, Inc. Class A (a) | 60,702 | | $ 3,546,211 |
Robert Half International, Inc. | 662,050 | | 15,591,278 |
| | 24,555,281 |
Road & Rail - 0.4% |
Union Pacific Corp. | 201,132 | | 13,980,685 |
TOTAL INDUSTRIALS | | 413,735,852 |
INFORMATION TECHNOLOGY - 34.0% |
Communications Equipment - 11.9% |
Cisco Systems, Inc. (a) | 7,546,537 | | 160,816,703 |
DG FastChannel, Inc. (a) | 109,045 | | 3,552,686 |
Juniper Networks, Inc. (a) | 3,562,138 | | 81,287,989 |
Polycom, Inc. (a) | 540,519 | | 16,102,061 |
QUALCOMM, Inc. | 3,097,803 | | 101,731,851 |
Riverbed Technology, Inc. (a) | 778,281 | | 21,496,121 |
| | 384,987,411 |
Computers & Peripherals - 6.9% |
Apple, Inc. (a) | 757,412 | | 190,511,840 |
EMC Corp. (a) | 208,885 | | 3,822,596 |
NetApp, Inc. (a) | 792,600 | | 29,571,906 |
| | 223,906,342 |
Electronic Equipment & Components - 2.5% |
Agilent Technologies, Inc. (a) | 2,168,146 | | 61,640,391 |
Corning, Inc. | 787,612 | | 12,719,934 |
IPG Photonics Corp. (a) | 280,198 | | 4,267,416 |
Keyence Corp. | 15,800 | | 3,654,250 |
| | 82,281,991 |
Internet Software & Services - 5.5% |
Baidu.com, Inc. sponsored ADR (a) | 417,575 | | 28,428,506 |
eBay, Inc. (a) | 982,251 | | 19,261,942 |
Google, Inc. Class A (a) | 170,793 | | 75,994,345 |
The Knot, Inc. (a) | 363,317 | | 2,826,606 |
VeriSign, Inc. (a) | 829,618 | | 22,026,358 |
WebMD Health Corp. (a) | 647,450 | | 30,061,104 |
| | 178,598,861 |
IT Services - 2.6% |
Accenture PLC Class A | 187,435 | | 7,244,363 |
Cognizant Technology Solutions Corp. Class A (a) | 536,200 | | 26,842,172 |
MasterCard, Inc. Class A | 86,414 | | 17,242,185 |
Visa, Inc. Class A | 457,593 | | 32,374,705 |
| | 83,703,425 |
|
| Shares | | Value |
Semiconductors & Semiconductor Equipment - 1.5% |
Applied Micro Circuits Corp. (a) | 512,406 | | $ 5,370,015 |
ARM Holdings PLC | 806,300 | | 3,336,178 |
Avago Technologies Ltd. | 612,600 | | 12,901,356 |
Monolithic Power Systems, Inc. (a) | 1,034,529 | | 18,476,688 |
PMC-Sierra, Inc. (a) | 234,400 | | 1,762,688 |
Power Integrations, Inc. | 51,201 | | 1,648,416 |
Rubicon Technology, Inc. (a) | 195,634 | | 5,827,937 |
| | 49,323,278 |
Software - 3.1% |
Advent Software, Inc. (a)(c) | 9,710 | | 455,982 |
Citrix Systems, Inc. (a) | 714,984 | | 30,193,774 |
Concur Technologies, Inc. (a) | 39,505 | | 1,686,073 |
Informatica Corp. (a) | 152,600 | | 3,644,088 |
Kingdee International Software Group Co. Ltd. | 4,414,000 | | 1,663,047 |
Oracle Corp. | 722,431 | | 15,503,369 |
Red Hat, Inc. (a) | 204,900 | | 5,929,806 |
Salesforce.com, Inc. (a) | 141,579 | | 12,150,310 |
Solera Holdings, Inc. | 96,320 | | 3,486,784 |
VanceInfo Technologies, Inc. ADR (a) | 302,915 | | 7,051,861 |
VMware, Inc. Class A (a) | 288,200 | | 18,038,438 |
| | 99,803,532 |
TOTAL INFORMATION TECHNOLOGY | | 1,102,604,840 |
MATERIALS - 2.7% |
Chemicals - 1.6% |
Air Products & Chemicals, Inc. | 462,200 | | 29,955,182 |
Ecolab, Inc. | 149,600 | | 6,718,536 |
Sherwin-Williams Co. | 140,298 | | 9,707,219 |
The Mosaic Co. | 115,300 | | 4,494,394 |
| | 50,875,331 |
Metals & Mining - 1.1% |
Compass Minerals International, Inc. | 81,793 | | 5,748,412 |
Consolidated Thompson Iron Mines Ltd. (a) | 2,918,100 | | 19,900,809 |
Newmont Mining Corp. | 172,700 | | 10,662,498 |
| | 36,311,719 |
TOTAL MATERIALS | | 87,187,050 |
TELECOMMUNICATION SERVICES - 1.1% |
Wireless Telecommunication Services - 1.1% |
Syniverse Holdings, Inc. (a) | 534,197 | | 10,924,329 |
Vivo Participacoes SA sponsored ADR | 989,700 | | 25,653,024 |
| | 36,577,353 |
TOTAL COMMON STOCKS (Cost $3,106,581,967) | 3,173,607,149 |
Money Market Funds - 2.6% |
| Shares | | Value |
Fidelity Cash Central Fund, 0.20% (e) | 44,742,294 | | $ 44,742,294 |
Fidelity Securities Lending Cash Central Fund, 0.24% (b)(e) | 40,308,823 | | 40,308,823 |
TOTAL MONEY MARKET FUNDS (Cost $85,051,117) | 85,051,117 |
TOTAL INVESTMENT PORTFOLIO - 100.4% (Cost $3,191,633,084) | 3,258,658,266 |
NET OTHER ASSETS (LIABILITIES) - (0.4)% | (12,545,143) |
NET ASSETS - 100% | $ 3,246,113,123 |
Legend |
(a) Non-income producing |
(b) Investment made with cash collateral received from securities on loan. |
(c) Security or a portion of the security is on loan at period end. |
(d) Security exempt from registration under Rule 144A of the Securities Act of 1933. These securities may be resold in transactions exempt from registration, normally to qualified institutional buyers. At the end of the period, the value of these securities amounted to $2,980,555 or 0.1% of net assets. |
(e) Affiliated fund that is available only to investment companies and other accounts managed by Fidelity Investments. The rate quoted is the annualized seven-day yield of the fund at period end. A complete unaudited listing of the fund's holdings as of its most recent quarter end is available upon request. |
Affiliated Central Funds |
Information regarding fiscal year to date income earned by the Fund from investments in Fidelity Central Funds is as follows: |
Fund | Income earned |
Fidelity Cash Central Fund | $ 64,687 |
Fidelity Securities Lending Cash Central Fund | 296,413 |
Total | $ 361,100 |
Other Information |
The following is a summary of the inputs used, as of June 30, 2010, involving the Fund's assets and liabilities carried at value. The inputs or methodology used for valuing securities may not be an indication of the risk associated with investing in those securities. For more information on valuation inputs, and their aggregation into the levels used in the table below, please refer to the Security Valuation section in the accompanying Notes to Financial Statements. |
Valuation Inputs at Reporting Date: |
Description | Total | Level 1 | Level 2 | Level 3 |
Investments in Securities: | | | | |
Equities: | | | | |
Consumer Discretionary | $ 496,786,540 | $ 487,315,341 | $ 9,471,199 | $ - |
Consumer Staples | 271,608,741 | 271,608,741 | - | - |
Energy | 74,945,684 | 74,945,684 | - | - |
Financials | 182,277,150 | 182,277,150 | - | - |
Health Care | 507,883,939 | 460,099,179 | 47,784,760 | - |
Industrials | 413,735,852 | 410,550,327 | 3,185,525 | - |
Information Technology | 1,102,604,840 | 1,093,951,365 | 8,653,475 | - |
Materials | 87,187,050 | 87,187,050 | - | - |
Telecommunication Services | 36,577,353 | 36,577,353 | - | - |
Money Market Funds | 85,051,117 | 85,051,117 | - | - |
Total Investments in Securities: | $ 3,258,658,266 | $ 3,189,563,307 | $ 69,094,959 | $ - |
Income Tax Information |
At December 31, 2009, the Fund had a capital loss carryforward of approximately $1,959,160,108 of which $351,276,710, $44,707,854, $1,104,811,876 and $458,363,668 will expire on December 31, 2010, 2011, 2016 and 2017, respectively. Capital loss carryforwards are only available to offset future capital gains of the Fund to the extent provided by regulations and may be limited. |
See accompanying notes which are an integral part of the financial statements.
Semiannual Report
Statement of Assets and Liabilities
| June 30, 2010 (Unaudited) |
| | |
Assets | | |
Investment in securities, at value (including securities loaned of $38,728,784) - See accompanying schedule: Unaffiliated issuers (cost $3,106,581,967) | $ 3,173,607,149 | |
Fidelity Central Funds (cost $85,051,117) | 85,051,117 | |
Total Investments (cost $3,191,633,084) | | $ 3,258,658,266 |
Cash | | 273,456 |
Foreign currency held at value
(cost $3) | | 3 |
Receivable for investments sold | | 56,453,282 |
Receivable for fund shares sold | | 558,248 |
Dividends receivable | | 1,362,589 |
Distributions receivable from Fidelity Central Funds | | 82,558 |
Other receivables | | 215,605 |
Total assets | | 3,317,604,007 |
| | |
Liabilities | | |
Payable for investments purchased | $ 26,408,784 | |
Payable for fund shares redeemed | 2,402,028 | |
Accrued management fee | 1,611,272 | |
Distribution fees payable | 135,929 | |
Other affiliated payables | 281,625 | |
Other payables and accrued expenses | 342,423 | |
Collateral on securities loaned, at value | 40,308,823 | |
Total liabilities | | 71,490,884 |
| | |
Net Assets | | $ 3,246,113,123 |
Net Assets consist of: | | |
Paid in capital | | $ 4,933,915,811 |
Undistributed net investment income | | 1,537,558 |
Accumulated undistributed net realized gain (loss) on investments and foreign currency transactions | | (1,756,354,491) |
Net unrealized appreciation (depreciation) on investments and assets and liabilities in foreign currencies | | 67,014,245 |
Net Assets | | $ 3,246,113,123 |
Statement of Assets and Liabilities - continued
| June 30, 2010 (Unaudited) |
| | |
Initial Class:
Net Asset Value, offering price and redemption price per share ($2,321,664,802 ÷ 81,406,259 shares) | | $ 28.52 |
| | |
Service Class:
Net Asset Value, offering price and redemption price per share ($370,906,199 ÷ 13,043,594 shares) | | $ 28.44 |
| | |
Service Class 2:
Net Asset Value, offering price and redemption price per share ($462,227,777 ÷ 16,383,161 shares) | | $ 28.21 |
| | |
Service Class 2R:
Net Asset Value, offering price and redemption price per share ($3,213,862 ÷ 114,110 shares) | | $ 28.16 |
| | |
Investor Class:
Net Asset Value, offering price and redemption price per share ($88,100,483 ÷ 3,097,175 shares) | | $ 28.45 |
See accompanying notes which are an integral part of the financial statements.
Semiannual Report
Financial Statements - continued
Statement of Operations
Six months ended June 30, 2010 (Unaudited) |
| | |
Investment Income | | |
Dividends | | $ 13,945,915 |
Interest | | 82 |
Income from Fidelity Central Funds | | 361,100 |
Total income | | 14,307,097 |
| | |
Expenses | | |
Management fee | $ 10,137,026 | |
Transfer agent fees | 1,287,529 | |
Distribution fees | 861,208 | |
Accounting and security lending fees | 525,115 | |
Custodian fees and expenses | 56,435 | |
Independent trustees' compensation | 10,803 | |
Appreciation in deferred trustee compensation account | 54 | |
Audit | 33,843 | |
Legal | 6,833 | |
Miscellaneous | 165,606 | |
Total expenses before reductions | 13,084,452 | |
Expense reductions | (95,727) | 12,988,725 |
Net investment income (loss) | | 1,318,372 |
Realized and Unrealized Gain (Loss) Net realized gain (loss) on: | | |
Investment securities: | | |
Unaffiliated issuers | 233,648,174 | |
Foreign currency transactions | (219,269) | |
Total net realized gain (loss) | | 233,428,905 |
Change in net unrealized appreciation (depreciation) on: Investment securities | (400,487,151) | |
Assets and liabilities in foreign currencies | (8,737) | |
Total change in net unrealized appreciation (depreciation) | | (400,495,888) |
Net gain (loss) | | (167,066,983) |
Net increase (decrease) in net assets resulting from operations | | $ (165,748,611) |
Statement of Changes in Net Assets
| Six months ended June 30, 2010 (Unaudited) | Year ended December 31, 2009 |
Increase (Decrease) in Net Assets | | |
Operations | | |
Net investment income (loss) | $ 1,318,372 | $ 11,842,787 |
Net realized gain (loss) | 233,428,905 | (453,010,967) |
Change in net unrealized appreciation (depreciation) | (400,495,888) | 1,274,194,307 |
Net increase (decrease) in net assets resulting from operations | (165,748,611) | 833,026,127 |
Distributions to shareholders from net investment income | - | (12,825,130) |
Distributions to shareholders from net realized gain | (3,011,926) | (2,861,216) |
Total distributions | (3,011,926) | (15,686,346) |
Share transactions - net increase (decrease) | (254,511,066) | (425,627,981) |
Redemption fees | 1,231 | 1,078 |
Total increase (decrease) in net assets | (423,270,372) | 391,712,878 |
| | |
Net Assets | | |
Beginning of period | 3,669,383,495 | 3,277,670,617 |
End of period (including undistributed net investment income of $1,537,558 and undistributed net investment income of $219,186, respectively) | $ 3,246,113,123 | $ 3,669,383,495 |
See accompanying notes which are an integral part of the financial statements.
Semiannual Report
Financial Highlights - Initial Class
| Six months ended June 30, 2010 | Years ended December 31, |
| (Unaudited) | 2009 | 2008 | 2007 | 2006 | 2005 |
Selected Per-Share Data | | | | | | |
Net asset value, beginning of period | $ 30.04 | $ 23.53 | $ 45.12 | $ 35.87 | $ 33.70 | $ 32.01 |
Income from Investment Operations | | | | | | |
Net investment income (loss) E | .02 | .10 | .27 | .09 | .21 | .11 |
Net realized and unrealized gain (loss) | (1.51) | 6.55 | (21.55) | 9.53 | 2.09 | 1.74 |
Total from investment operations | (1.49) | 6.65 | (21.28) | 9.62 | 2.30 | 1.85 |
Distributions from net investment income | - | (.12) | (.31) | (.33) | (.13) | (.16) |
Distributions from net realized gain | (.03) | (.02) | - | (.04) | - | - |
Total distributions | (.03) | (.14) J | (.31) | (.37) | (.13) | (.16) |
Redemption fees added to paid in capital E, I | - | - | - | - | - | - |
Net asset value, end of period | $ 28.52 | $ 30.04 | $ 23.53 | $ 45.12 | $ 35.87 | $ 33.70 |
Total Return B, C, D | (4.98)% | 28.29% | (47.17)% | 26.96% | 6.85% | 5.80% |
Ratios to Average Net Assets F, H | | | | | | |
Expenses before reductions | .67% A | .69% | .68% | .65% | .68% | .67% |
Expenses net of fee waivers, if any | .67% A | .69% | .68% | .65% | .68% | .67% |
Expenses net of all reductions | .67% A | .68% | .67% | .64% | .67% | .63% |
Net investment income (loss) | .12% A | .41% | .74% | .21% | .61% | .36% |
Supplemental Data | | | | | | |
Net assets, end of period (000 omitted) | $ 2,321,665 | $ 2,618,954 | $ 2,337,892 | $ 6,002,656 | $ 5,610,629 | $ 6,726,655 |
Portfolio turnover rate G | 83% A | 134% | 161% | 109% | 114% | 79% |
A Annualized B Total returns for periods of less than one year are not annualized. C Total returns do not reflect charges attributable to your insurance company's separate account. Inclusion of these charges would reduce the total returns shown. D Total returns would have been lower had certain expenses not been reduced during the periods shown. E Calculated based on average shares outstanding during the period. F Fees and expenses of the underlying Fidelity Central Funds are not included in the Fund's expense ratio. The Fund indirectly bears its proportionate share of the expenses of any underlying Fidelity Central Funds. G Amount does not include the portfolio activity of any underlying Fidelity Central Funds. H Expense ratios reflect operating expenses of the class. Expenses before reductions do not reflect amounts reimbursed by the investment adviser or reductions from brokerage service arrangements or reductions from other expense offset arrangements and do not represent the amount paid by the class during periods when reimbursements or reductions occur. Expenses net of fee waivers reflect expenses after reimbursement by the investment adviser but prior to reductions from brokerage service arrangements or other expense offset arrangements. Expenses net of all reductions represent the net expenses paid by the class. I Amount represents less than $.01 per share. J Total distributions of $.14 per share is comprised of distributions from net investment income of $.118 and distributions from net realized gain of $.023 per share. |
Financial Highlights - Service Class
| Six months ended June 30, 2010 | Years ended December 31, |
| (Unaudited) | 2009 | 2008 | 2007 | 2006 | 2005 |
Selected Per-Share Data | | | | | | |
Net asset value, beginning of period | $ 29.96 | $ 23.47 | $ 44.99 | $ 35.72 | $ 33.56 | $ 31.88 |
Income from Investment Operations | | | | | | |
Net investment income (loss) E | - I | .08 | .23 | .04 | .18 | .08 |
Net realized and unrealized gain (loss) | (1.49) | 6.52 | (21.48) | 9.51 | 2.07 | 1.72 |
Total from investment operations | (1.49) | 6.60 | (21.25) | 9.55 | 2.25 | 1.80 |
Distributions from net investment income | - | (.09) | (.27) | (.24) | (.09) | (.12) |
Distributions from net realized gain | (.03) | (.02) | - | (.04) | - | - |
Total distributions | (.03) | (.11) J | (.27) | (.28) | (.09) | (.12) |
Redemption fees added to paid in capital E, I | - | - | - | - | - | - |
Net asset value, end of period | $ 28.44 | $ 29.96 | $ 23.47 | $ 44.99 | $ 35.72 | $ 33.56 |
Total Return B, C, D | (4.99)% | 28.15% | (47.23)% | 26.87% | 6.73% | 5.67% |
Ratios to Average Net Assets F, H | | | | | | |
Expenses before reductions | .77% A | .79% | .78% | .75% | .78% | .77% |
Expenses net of fee waivers, if any | .77% A | .79% | .78% | .75% | .78% | .77% |
Expenses net of all reductions | .77% A | .78% | .77% | .74% | .77% | .73% |
Net investment income (loss) | .02% A | .31% | .64% | .11% | .51% | .26% |
Supplemental Data | | | | | | |
Net assets, end of period (000 omitted) | $ 370,906 | $ 421,996 | $ 395,759 | $ 929,848 | $ 877,279 | $ 1,086,172 |
Portfolio turnover rate G | 83% A | 134% | 161% | 109% | 114% | 79% |
A Annualized B Total returns for periods of less than one year are not annualized. C Total returns do not reflect charges attributable to your insurance company's separate account. Inclusion of these charges would reduce the total returns shown. D Total returns would have been lower had certain expenses not been reduced during the periods shown. E Calculated based on average shares outstanding during the period. F Fees and expenses of the underlying Fidelity Central Funds are not included in the Fund's expense ratio. The Fund indirectly bears its proportionate share of the expenses of any underlying Fidelity Central Funds. G Amount does not include the portfolio activity of any underlying Fidelity Central Funds. H Expense ratios reflect operating expenses of the class. Expenses before reductions do not reflect amounts reimbursed by the investment adviser or reductions from brokerage service arrangements or reductions from other expense offset arrangements and do not represent the amount paid by the class during periods when reimbursements or reductions occur. Expenses net of fee waivers reflect expenses after reimbursement by the investment adviser but prior to reductions from brokerage service arrangements or other expense offset arrangements. Expenses net of all reductions represent the net expenses paid by the class. I Amount represents less than $.01 per share. J Total distributions of $.11 per share is comprised of distributions from net investment income of $.089 and distributions from net realized gain of $.023 per share. |
See accompanying notes which are an integral part of the financial statements.
Semiannual Report
Financial Highlights - Service Class 2
| Six months ended June 30, 2010 | Years ended December 31, |
| (Unaudited) | 2009 | 2008 | 2007 | 2006 | 2005 |
Selected Per-Share Data | | | | | | |
Net asset value, beginning of period | $ 29.75 | $ 23.31 | $ 44.65 | $ 35.42 | $ 33.29 | $ 31.64 |
Income from Investment Operations | | | | | | |
Net investment income (loss) E | (.02) | .04 | .17 | (.02) | .12 | .03 |
Net realized and unrealized gain (loss) | (1.49) | 6.48 | (21.29) | 9.43 | 2.07 | 1.71 |
Total from investment operations | (1.51) | 6.52 | (21.12) | 9.41 | 2.19 | 1.74 |
Distributions from net investment income | - | (.05) | (.22) | (.15) | (.06) | (.09) |
Distributions from net realized gain | (.03) | (.02) | - | (.03) | - | - |
Total distributions | (.03) | (.08) J | (.22) | (.18) | (.06) | (.09) |
Redemption fees added to paid in capital E, I | - | - | - | - | - | - |
Net asset value, end of period | $ 28.21 | $ 29.75 | $ 23.31 | $ 44.65 | $ 35.42 | $ 33.29 |
Total Return B, C, D | (5.09)% | 27.97% | (47.31)% | 26.66% | 6.57% | 5.50% |
Ratios to Average Net Assets F, H | | | | | | |
Expenses before reductions | .92% A | .94% | .93% | .90% | .94% | .92% |
Expenses net of fee waivers, if any | .92% A | .94% | .93% | .90% | .94% | .92% |
Expenses net of all reductions | .92% A | .93% | .92% | .89% | .92% | .88% |
Net investment income (loss) | (.13)% A | .16% | .49% | (.04)% | .36% | .11% |
Supplemental Data | | | | | | |
Net assets, end of period (000 omitted) | $ 462,228 | $ 528,819 | $ 447,530 | $ 898,204 | $ 627,754 | $ 858,587 |
Portfolio turnover rate G | 83% A | 134% | 161% | 109% | 114% | 79% |
A Annualized B Total returns for periods of less than one year are not annualized. C Total returns do not reflect charges attributable to your insurance company's separate account. Inclusion of these charges would reduce the total returns shown. D Total returns would have been lower had certain expenses not been reduced during the periods shown. E Calculated based on average shares outstanding during the period. F Fees and expenses of the underlying Fidelity Central Funds are not included in the Fund's expense ratio. The Fund indirectly bears its proportionate share of the expenses of any underlying Fidelity Central Funds. G Amount does not include the portfolio activity of any underlying Fidelity Central Funds. H Expense ratios reflect operating expenses of the class. Expenses before reductions do not reflect amounts reimbursed by the investment adviser or reductions from brokerage service arrangements or reductions from other expense offset arrangements and do not represent the amount paid by the class during periods when reimbursements or reductions occur. Expenses net of fee waivers reflect expenses after reimbursement by the investment adviser but prior to reductions from brokerage service arrangements or other expense offset arrangements. Expenses net of all reductions represent the net expenses paid by the class. I Amount represents less than $.01 per share. J Total distributions of $.08 per share is comprised of distributions from net investment income of $.052 and distributions from net realized gain of $.023 per share. |
Financial Highlights - Service Class 2R
| Six months ended June 30, 2010 | Years ended December 31, |
| (Unaudited) | 2009 | 2008 | 2007 | 2006 | 2005 |
Selected Per-Share Data | | | | | | |
Net asset value, beginning of period | $ 29.70 | $ 23.26 | $ 44.42 | $ 35.28 | $ 33.18 | $ 31.54 |
Income from Investment Operations | | | | | | |
Net investment income (loss) E | (.02) | .04 | .18 | (.01) | .12 | .04 |
Net realized and unrealized gain (loss) | (1.49) | 6.46 | (21.20) | 9.38 | 2.06 | 1.70 |
Total from investment operations | (1.51) | 6.50 | (21.02) | 9.37 | 2.18 | 1.74 |
Distributions from net investment income | - | (.04) | (.14) | (.19) | (.08) | (.10) |
Distributions from net realized gain | (.03) | (.02) | - | (.04) | - | - |
Total distributions | (.03) | (.06) J | (.14) | (.23) | (.08) | (.10) |
Redemption fees added to paid in capital E, I | - | - | - | - | - | - |
Net asset value, end of period | $ 28.16 | $ 29.70 | $ 23.26 | $ 44.42 | $ 35.28 | $ 33.18 |
Total Return B, C, D | (5.10)% | 27.98% | (47.31)% | 26.66% | 6.58% | 5.52% |
Ratios to Average Net Assets F, H | | | | | | |
Expenses before reductions | .92% A | .94% | .93% | .89% | .93% | .92% |
Expenses net of fee waivers, if any | .92% A | .94% | .93% | .89% | .93% | .92% |
Expenses net of all reductions | .91% A | .93% | .92% | .89% | .92% | .88% |
Net investment income (loss) | (.13)% A | .16% | .49% | (.04)% | .36% | .12% |
Supplemental Data | | | | | | |
Net assets, end of period (000 omitted) | $ 3,214 | $ 4,084 | $ 3,061 | $ 20,051 | $ 5,063 | $ 5,409 |
Portfolio turnover rate G | 83% A | 134% | 161% | 109% | 114% | 79% |
A Annualized B Total returns for periods of less than one year are not annualized. C Total returns do not reflect charges attributable to your insurance company's separate account. Inclusion of these charges would reduce the total returns shown. D Total returns would have been lower had certain expenses not been reduced during the periods shown. E Calculated based on average shares outstanding during the period. F Fees and expenses of the underlying Fidelity Central Funds are not included in the Fund's expense ratio. The Fund indirectly bears its proportionate share of the expenses of any underlying Fidelity Central Funds. G Amount does not include the portfolio activity of any underlying Fidelity Central Funds. H Expense ratios reflect operating expenses of the class. Expenses before reductions do not reflect amounts reimbursed by the investment adviser or reductions from brokerage service arrangements or reductions from other expense offset arrangements and do not represent the amount paid by the class during periods when reimbursements or reductions occur. Expenses net of fee waivers reflect expenses after reimbursement by the investment adviser but prior to reductions from brokerage service arrangements or other expense offset arrangements. Expenses net of all reductions represent the net expenses paid by the class. I Amount represents less than $.01 per share. J Total distributions of $.06 per share is comprised of distributions from net investment income of $.041 and distributions from net realized gain of $.023 per share. |
See accompanying notes which are an integral part of the financial statements.
Semiannual Report
Financial Highlights - Investor Class
| Six months ended June 30, 2010 | Years ended December 31, |
| (Unaudited) | 2009 | 2008 | 2007 | 2006 | 2005 H |
Selected Per-Share Data | | | | | | |
Net asset value, beginning of period | $ 29.97 | $ 23.48 | $ 45.00 | $ 35.78 | $ 33.67 | $ 32.60 |
Income from Investment Operations | | | | | | |
Net investment income (loss) E | .01 | .08 | .24 | .04 | .17 | .03 |
Net realized and unrealized gain (loss) | (1.50) | 6.52 | (21.49) | 9.50 | 2.08 | 1.04 |
Total from investment operations | (1.49) | 6.60 | (21.25) | 9.54 | 2.25 | 1.07 |
Distributions from net investment income | - | (.09) | (.27) | (.28) | (.14) | - |
Distributions from net realized gain | (.03) | (.02) | - | (.04) | - | - |
Total distributions | (.03) | (.11) K | (.27) | (.32) | (.14) | - |
Redemption fees added to paid in capital E, J | - | - | - | - | - | - |
Net asset value, end of period | $ 28.45 | $ 29.97 | $ 23.48 | $ 45.00 | $ 35.78 | $ 33.67 |
Total Return B, C, D | (4.99)% | 28.14% | (47.22)% | 26.81% | 6.72% | 3.28% |
Ratios to Average Net Assets F, I | | | | | | |
Expenses before reductions | .76% A | .79% | .77% | .76% | .81% | .83% A |
Expenses net of fee waivers, if any | .76% A | .79% | .77% | .76% | .81% | .83% A |
Expenses net of all reductions | .75% A | .78% | .76% | .76% | .80% | .79% A |
Net investment income (loss) | .03% A | .31% | .65% | .09% | .49% | .23% A |
Supplemental Data | | | | | | |
Net assets, end of period (000 omitted) | $ 88,100 | $ 95,531 | $ 93,428 | $ 181,705 | $ 76,965 | $ 24,166 |
Portfolio turnover rate G | 83% A | 134% | 161% | 109% | 114% | 79% |
A Annualized B Total returns for periods of less than one year are not annualized. C Total returns do not reflect charges attributable to your insurance company's separate account. Inclusion of these charges would reduce the total returns shown. D Total returns would have been lower had certain expenses not been reduced during the periods shown. E Calculated based on average shares outstanding during the period. F Fees and expenses of the underlying Fidelity Central Funds are not included in the Fund's expense ratio. The Fund indirectly bears its proportionate share of the expenses of any underlying Fidelity Central Funds. G Amount does not include the portfolio activity of any underlying Fidelity Central Funds. H For the period July 21, 2005 (commencement of sale of shares) to December 31, 2005. I Expense ratios reflect operating expenses of the class. Expenses before reductions do not reflect amounts reimbursed by the investment adviser or reductions from brokerage service arrangements or reductions from other expense offset arrangements and do not represent the amount paid by the class during periods when reimbursements or reductions occur. Expense ratios before reductions for start-up periods may not be representative of longer-term operating periods. Expenses net of fee waivers reflect expenses after reimbursement by the investment adviser but prior to reductions from brokerage service arrangements or other expense offset arrangements. Expenses net of all reductions represent the net expenses paid by the class. J Amount represents less than $.01 per share. K Total distributions of $.11 per share is comprised of distributions from net investment income of $.089 and distributions from net realized gain of $.023 per share. |
See accompanying notes which are an integral part of the financial statements.
Semiannual Report
Notes to Financial Statements
For the period ended June 30, 2010 (Unaudited)
1. Organization.
VIP Growth Portfolio (the Fund) is a fund of Variable Insurance Products Fund (the Trust) and is authorized to issue an unlimited number of shares. The Trust is registered under the Investment Company Act of 1940, as amended (the 1940 Act), as an open-end management investment company organized as a Massachusetts business trust. Shares of the Fund may only be purchased by insurance companies for the purpose of funding variable annuity or variable life insurance contracts. The Fund offers the following classes of shares: Initial Class shares, Service Class shares, Service Class 2 shares, Service Class 2R shares and Investor Class shares. All classes have equal rights and voting privileges, except for matters affecting a single class. Investment income, realized and unrealized capital gains and losses, the common expenses of the Fund, and certain fund-level expense reductions, if any, are allocated on a pro-rata basis to each class based on the relative net assets of each class to the total net assets of the Fund. Each class differs with respect to transfer agent and distribution and service plan fees incurred. Certain expense reductions also differ by class.
2. Investments in Fidelity Central Funds.
The Fund may invest in Fidelity Central Funds, which are open-end investment companies available only to other investment companies and accounts managed by Fidelity Management & Research Company (FMR) and its affiliates. The Fund's Schedule of Investments lists each of the Fidelity Central Funds held as of period end, if any, as an investment of the Fund, but does not include the underlying holdings of each Fidelity Central Fund. As an Investing Fund, the Fund indirectly bears its proportionate share of the expenses of the underlying Fidelity Central Funds.
The Money Market Central Funds seek preservation of capital and current income and are managed by Fidelity Investments Money Management, Inc. (FIMM), an affiliate of FMR.
A complete unaudited list of holdings for each Fidelity Central Fund is available upon request or at the Securities and Exchange Commission (the SEC) web site at www.sec.gov. In addition, the financial statements of the Fidelity Central Funds are available on the SEC web site or upon request.
3. Significant Accounting Policies.
The financial statements have been prepared in conformity with accounting principles generally accepted in the United States of America (GAAP), which require management to make certain estimates and assumptions at the date of the financial statements. Actual results could differ from those estimates. The following summarizes the significant accounting policies of the Fund:
Security Valuation. Investments are valued as of 4:00 p.m. Eastern time on the last calendar day of the period. The Fund uses independent pricing services approved by the Board of Trustees to value its investments. When current market prices or quotations are not readily available or reliable, valuations may be determined in good faith in accordance with procedures adopted by the Board of Trustees. Factors used in determining value may include market or security specific events. The frequency with which these procedures are used cannot be predicted and they may be utilized to a significant extent. The value used for net asset value (NAV) calculation under these procedures may differ from published prices for the same securities.
The Fund categorizes the inputs to valuation techniques used to value its investments into a disclosure hierarchy consisting of three levels as shown below.
Level 1 - quoted prices in active markets for identical investments
Level 2 - other significant observable inputs (including quoted prices for similar investments, interest rates, prepayment speeds, etc.)
Level 3 - unobservable inputs (including the fund's own assumptions based on the best information available)
Changes in valuation techniques may result in transfers in or out of an assigned level within the disclosure hierarchy. The aggregate value of investments by input level, as of June 30, 2010, is included at the end of the Fund's Schedule of Investments. Valuation techniques used to value the Fund's investments by major category are as follows.
Equity securities, including restricted securities, for which market quotations are readily available, are valued at the last reported sale price or official closing price as reported by an independent pricing service on the primary market or exchange on which they are traded and are categorized as Level 1 in the hierarchy. In the event there were no sales during the day or closing prices are not available, securities are valued at the last quoted bid price or may be valued using the last available price and are generally categorized as Level 2 in the hierarchy. For foreign equity securities, when significant market or security specific events arise, comparisons to the valuation of American Depositary Receipts (ADRs), futures contracts, Exchange-traded funds (ETFs) and certain indexes as well as quoted prices for similar securities are used and are categorized as Level 2 in the hierarchy in these circumstances. Utilizing these techniques may result in transfers between Level 1 and Level 2. For restricted equity securities and private placements where observable inputs are limited, assumptions about market activity and risk are used and are categorized as Level 3 in the hierarchy.
Investments in open-end mutual funds, including the Fidelity Central Funds, are valued at their closing net asset value each business day and are categorized as Level 1 in the hierarchy. Short-term securities with remaining maturities of sixty days or less for which quotations are not readily available are valued at amortized cost, which approximates value and are categorized as Level 2 in the hierarchy.
Semiannual Report
3. Significant Accounting Policies - continued
Foreign Currency. The Fund uses foreign currency contracts to facilitate transactions in foreign-denominated securities. Gains and losses from these transactions may arise from changes in the value of the foreign currency or if the counterparties do not perform under the contracts' terms.
Foreign-denominated assets, including investment securities, and liabilities are translated into U.S. dollars at the exchange rate at period end. Purchases and sales of investment securities, income and dividends received and expenses denominated in foreign currencies are translated into U.S. dollars at the exchange rate in effect on the transaction date.
The effects of exchange rate fluctuations on investments are included with the net realized and unrealized gain (loss) on investment securities. Other foreign currency transactions resulting in realized and unrealized gain (loss) are disclosed separately.
Investment Transactions and Income. For financial reporting purposes, the Fund's investment holdings and NAV include trades executed through the end of the last business day of the period. The NAV per share for processing shareholder transactions is calculated as of the close of business of the New York Stock Exchange (NYSE), normally 4:00 p.m. Eastern time and includes trades executed through the end of the prior business day. Gains and losses on securities sold are determined on the basis of identified cost and may include proceeds received from litigation. Dividend income is recorded on the ex-dividend date, except for certain dividends from foreign securities where the ex-dividend date may have passed, which are recorded as soon as the Fund is informed of the ex-dividend date. Non-cash dividends included in dividend income, if any, are recorded at the fair market value of the securities received. Distributions received on securities that represent a return of capital or capital gain are recorded as a reduction of cost of investments and/or as a realized gain. The Fund estimates the components of distributions received that may be considered return of capital distributions or capital gain distributions. Interest income and distributions from the Fidelity Central Funds are accrued as earned. Interest income includes coupon interest and amortization of premium and accretion of discount on debt securities. Investment income is recorded net of foreign taxes withheld where recovery of such taxes is uncertain.
Expenses. Most expenses of the Trust can be directly attributed to a fund. Expenses which cannot be directly attributed are apportioned amongst each fund in the Trust. Expense estimates are accrued in the period to which they relate and adjustments are made when actual amounts are known.
Deferred Trustee Compensation. Under a Deferred Compensation Plan (the Plan), independent Trustees may elect to defer receipt of a portion of their annual compensation. Deferred amounts are invested in a cross-section of Fidelity funds, are marked-to-market and remain in the Fund until distributed in accordance with the Plan. The investment of deferred amounts and the offsetting payable to the Trustees are included in the accompanying Statement of Assets and Liabilities.
Income Tax Information and Distributions to Shareholders. Each year, the Fund intends to qualify as a regulated investment company by distributing substantially all of its taxable income and realized gains under Subchapter M of the Internal Revenue Code and filing its U.S. federal tax return. As a result, no provision for income taxes is required. A fund's federal tax return is subject to examination by the Internal Revenue Service (IRS) for a period of three years. Foreign taxes are provided for based on the Fund's understanding of the tax rules and rates that exist in the foreign markets in which it invests.
Distributions are recorded on the ex-dividend date. Income dividends and capital gain distributions are declared separately for each class. Income and capital gain distributions are determined in accordance with income tax regulations, which may differ from GAAP.
Capital accounts within the financial statements are adjusted for permanent book-tax differences. These adjustments have no impact on net assets or the results of operations. Temporary book-tax differences will reverse in a subsequent period.
Book-tax differences are primarily due to short-term gain distributions from the Fidelity Central Funds, foreign currency transactions, passive foreign investment companies (PFIC), partnerships, capital loss carryforwards and losses deferred due to wash sales.
The federal tax cost of investment securities and unrealized appreciation (depreciation) as of period end were as follows:
Gross unrealized appreciation | $ 329,292,939 |
Gross unrealized depreciation | (278,957,974) |
Net unrealized appreciation (depreciation) | $ 50,334,965 |
| |
Tax cost | $ 3,208,323,301 |
Trading (Redemption) Fees. Service Class 2R shares held less than 60 days are subject to a redemption fee equal to 1% of the proceeds of the redeemed shares. All redemption fees, including any estimated redemption fees paid by FMR, are retained by the Fund and accounted for as an addition to paid in capital.
Semiannual Report
Notes to Financial Statements (Unaudited) - continued
4. Operating Policies.
Restricted Securities. The Fund may invest in securities that are subject to legal or contractual restrictions on resale. These securities generally may be resold in transactions exempt from registration or to the public if the securities are registered. Disposal of these securities may involve time-consuming negotiations and expense, and prompt sale at an acceptable price may be difficult. Information regarding restricted securities is included at the end of the Fund's Schedule of Investments.
5. Purchases and Sales of Investments.
Purchases and sales of securities, other than short-term securities, aggregated $1,451,758,022 and $1,722,544,277, respectively.
6. Fees and Other Transactions with Affiliates.
Management Fee. FMR and its affiliates provide the Fund with investment management related services for which the Fund pays a monthly management fee. The management fee is the sum of an individual fund fee rate that is based on an annual rate of .30% of the Fund's average net assets and a group fee rate that averaged .26% during the period. The group fee rate is based upon the average net assets of all the mutual funds advised by FMR. The group fee rate decreases as assets under management increase and increases as assets under management decrease. For the period, the total annualized management fee rate was .56% of the Fund's average net assets.
Distribution and Service Plan. In accordance with Rule 12b-1 of the 1940 Act, the Fund has adopted separate 12b-1 Plans for each Service Class of shares. Each Service Class pays Fidelity Distributors Corporation (FDC), an affiliate of FMR, a service fee. For the period, the service fee is based on an annual rate of .10% of Service Class' average net assets and .25% of Service Class 2's and Service Class 2R's average net assets.
For the period, each class paid FDC the following amounts, all of which were re-allowed to insurance companies for the distribution of shares and providing shareholder support services:
Service Class | $ 208,676 |
Service Class 2 | 647,760 |
Service Class 2R | 4,772 |
| $ 861,208 |
Transfer Agent Fees. Fidelity Investments Institutional Operations Company, Inc. (FIIOC), an affiliate of FMR, is the Fund's transfer, dividend disbursing, and shareholder servicing agent. FIIOC receives an asset-based fee with respect to each class. Each class (with the exception of Investor Class) pays a transfer agent fee, excluding out of pocket expenses, equal to an annual rate of .07% of average net assets. Investor Class pays a monthly asset-based transfer agent fee of .15% of average net assets. The total transfer agent fees paid by each class to FIIOC, including out of pocket expenses, were as follows:
Initial Class | $ 885,752 |
Service Class | 143,722 |
Service Class 2 | 181,221 |
Service Class 2R | 1,286 |
Investor Class | 75,548 |
| $ 1,287,529 |
Accounting and Security Lending Fees. Fidelity Service Company, Inc. (FSC), an affiliate of FMR, maintains the Fund's accounting records. The accounting fee is based on the level of average net assets for the month. Under a separate contract, FSC administers the security lending program. The security lending fee is based on the number and duration of lending transactions.
Brokerage Commissions. The Fund placed a portion of its portfolio transactions with brokerage firms which are affiliates of the investment adviser. The commissions paid to these affiliated firms were $23,499 for the period.
Semiannual Report
7. Committed Line of Credit.
The Fund participates with other funds managed by FMR in a $3.75 billion credit facility (the "line of credit") to be utilized for temporary or emergency purposes to fund shareholder redemptions or for other short-term liquidity purposes. The Fund has agreed to pay commitment fees on its pro-rata portion of the line of credit, which amounted to $7,257 and is reflected in Miscellaneous expenses on the Statement of Operations. During the period, there were no borrowings on this line of credit.
8. Security Lending.
The Fund lends portfolio securities from time to time in order to earn additional income. On the settlement date of the loan, the Fund receives collateral (in the form of U.S. Treasury obligations, letters of credit and/or cash) against the loaned securities and maintains collateral in an amount not less than 100% of the market value of the loaned securities during the period of the loan. The market value of the loaned securities is determined at the close of business of the Fund and any additional required collateral is delivered to the Fund on the next business day. If the borrower defaults on its obligation to return the securities loaned because of insolvency or other reasons, a fund could experience delays and costs in recovering the securities loaned or in gaining access to the collateral. Any cash collateral received is invested in the Fidelity Securities Lending Cash Central Fund. The value of loaned securities and cash collateral at period end are disclosed on the Fund's Statement of Assets and Liabilities. Security lending income represents the income earned on investing cash collateral, less fees and expenses associated with the loan, plus any premium payments that may be received on the loan of certain types of securities. Security lending income is presented in the Statement of Operations as a component of income from Fidelity Central Funds. Net income from lending portfolio securities during the period amounted to $296,413.
9. Expense Reductions.
Many of the brokers with whom FMR places trades on behalf of the Fund provided services to the Fund in addition to trade execution. These services included payments of certain expenses on behalf of the Fund totaling $95,690 for the period. In addition, through arrangements with the Fund's custodian, credits realized as a result of uninvested cash balances were used to reduce the Fund's expenses. During the period, these credits reduced the Fund's custody expenses by $37.
10. Distributions to Shareholders.
Distributions to shareholders of each class were as follows:
| Six months ended
June 30, 2010 | Year ended
December 31, 2009 |
From net investment income | | |
Initial Class | $ - | $ 10,334,573 |
Service Class | - | 1,267,138 |
Service Class 2 | - | 932,585 |
Service Class 2R | - | 5,914 |
Investor Class | - | 284,920 |
Total | $ - | $ 12,825,130 |
From net realized gain | | |
Initial Class | $ 2,147,000 | $ 2,036,641 |
Service Class | 347,612 | 332,083 |
Service Class 2 | 434,679 | 414,242 |
Service Class 2R | 3,236 | 3,345 |
Investor Class | 79,399 | 74,905 |
Total | $ 3,011,926 | $ 2,861,216 |
Semiannual Report
Notes to Financial Statements (Unaudited) - continued
11. Share Transactions.
Transactions for each class of shares were as follows:
| Shares | Dollars |
| Six months ended June 30, 2010 | Year ended
December 31, 2009 | Six months ended June 30, 2010 | Year ended
December 31, 2009 |
Initial Class | | | | |
Shares sold | 1,654,014 | 3,168,252 | $ 51,485,327 | $ 80,283,755 |
Reinvestment of distributions | 75,892 | 426,627 | 2,147,000 | 12,371,214 |
Shares redeemed | (7,518,163) | (15,761,725) | (231,058,545) | (393,809,218) |
Net increase (decrease) | (5,788,257) | (12,166,846) | $ (177,426,218) | $ (301,154,249) |
Service Class | | | | |
Shares sold | 287,751 | 601,860 | $ 8,955,856 | $ 15,078,974 |
Reinvestment of distributions | 12,322 | 55,581 | 347,612 | 1,599,221 |
Shares redeemed | (1,340,437) | (3,433,675) | (40,997,487) | (86,029,416) |
Net increase (decrease) | (1,040,364) | (2,776,234) | $ (31,694,019) | $ (69,351,221) |
Service Class 2 | | | | |
Shares sold | 785,418 | 3,094,007 | $ 24,123,564 | $ 75,154,813 |
Reinvestment of distributions | 15,519 | 47,559 | 434,679 | 1,346,827 |
Shares redeemed | (2,192,411) | (4,562,964) | (66,621,414) | (113,322,366) |
Net increase (decrease) | (1,391,474) | (1,421,398) | $ (42,063,171) | $ (36,820,726) |
Service Class 2R | | | | |
Shares sold | 12,420 | 70,980 | $ 382,064 | $ 1,731,048 |
Reinvestment of distributions | 116 | 331 | 3,236 | 9,259 |
Shares redeemed | (35,929) | (65,400) | (1,096,877) | (1,732,958) |
Net increase (decrease) | (23,393) | 5,911 | $ (711,577) | $ 7,349 |
Investor Class | | | | |
Shares sold | 267,186 | 347,569 | $ 8,265,658 | $ 9,118,954 |
Reinvestment of distributions | 2,814 | 12,514 | 79,399 | 359,825 |
Shares redeemed | (360,248) | (1,151,644) | (10,961,138) | (27,787,913) |
Net increase (decrease) | (90,248) | (791,561) | $ (2,616,081) | $ (18,309,134) |
12. Other.
The Fund's organizational documents provide former and current trustees and officers with a limited indemnification against liabilities arising in connection with the performance of their duties to the Fund. In the normal course of business, the Fund may also enter into contracts that provide general indemnifications. The Fund's maximum exposure under these arrangements is unknown as this would be dependent on future claims that may be made against the Fund. The risk of material loss from such claims is considered remote.
At the end of the period, FMR or its affiliates were the owners of record of 15% of the total outstanding shares of the Fund and three otherwise unaffiliated shareholders were the owners of record of 45% of the total outstanding shares of the Fund.
Semiannual Report
Investment Adviser
Fidelity Management & Research Company
Boston, MA
Investment Sub-Adviser
FMR Co., Inc.
Fidelity Management & Research (U.K.) Inc.
Fidelity Management & Research (Hong Kong) Limited
Fidelity Management & Research (Japan) Inc.
Fidelity Research & Analysis Company
FIL Investment Advisors
FIL Investment Advisors (U.K.) Ltd.
FIL Investments (Japan) Limited
General Distributor
Fidelity Distributors Corporation
Boston, MA
Transfer and Service Agents
Fidelity Investments Institutional Operations Company, Inc.
Boston, MA
Fidelity Service Company, Inc.
Boston, MA
Custodian
The Bank of New York Mellon
New York, NY
VIPGRWT-SANN-0810
1.705692.112
Fidelity® Variable Insurance Products:
Growth Portfolio - Service Class 2R
Semiannual Report
June 30, 2010
(2_fidelity_logos) (Registered_Trademark)
Contents
Shareholder Expense Example | <Click Here> | An example of shareholder expenses. |
Investment Changes | <Click Here> | A summary of major shifts in the fund's investments over the past six months. |
Investments | <Click Here> | A complete list of the fund's investments with their market values. |
Financial Statements | <Click Here> | Statements of assets and liabilities, operations, and changes in net assets, as well as financial highlights. |
Notes | <Click Here> | Notes to the financial statements. |
To view a fund's proxy voting guidelines and proxy voting record for the 12-month period ended June 30, visit http://www.fidelity.com/proxyvotingresults or visit the Securities and Exchange Commission's (SEC) web site at http://www.sec.gov. You may also call 1-877-208-0098 to request a free copy of the proxy voting guidelines.
Fidelity Variable Insurance Products are separate account options which are purchased through a variable insurance contract.
Standard & Poor's, S&P and S&P 500 are registered service marks of The McGraw-Hill Companies, Inc. and have been licensed for use by Fidelity Distributors Corporation.
Other third party marks appearing herein are the property of their respective owners.
All other marks appearing herein are registered or unregistered trademarks or service marks of FMR LLC or an affiliated company.
This report and the financial statements contained herein are submitted for the general information of the shareholders of the fund. This report is not authorized for distribution to prospective investors in the fund unless preceded or accompanied by an effective prospectus.
A fund files its complete schedule of portfolio holdings with the SEC for the first and third quarters of each fiscal year on Form N-Q. Forms N-Q are available on the SEC's web site at http://www.sec.gov. A fund's Forms N-Q may be reviewed and copied at the SEC's Public Reference Room in Washington, DC. Information regarding the operation of the SEC's Public Reference Room may be obtained by calling 1-800-SEC-0330. For a complete list of a fund's portfolio holdings, view the most recent holdings listing, semiannual report, or annual report on Fidelity's web site at http://www.fidelity.com or http://www.advisor.fidelity.com, as applicable.
NOT FDIC INSURED • MAY LOSE VALUE • NO BANK GUARANTEE
Neither the fund nor Fidelity Distributors Corporation is a bank.
Semiannual Report
As a shareholder of the Fund, you incur two types of costs: (1) transaction costs, including redemption fees, and (2) ongoing costs, including management fees, distribution and/or service (12b-1) fees and other Fund expenses. This Example is intended to help you understand your ongoing costs (in dollars) of investing in the Fund and to compare these costs with the ongoing costs of investing in other mutual funds.
The Example is based on an investment of $1,000 invested at the beginning of the period and held for the entire period (January 1, 2010 to June 30, 2010).
Actual Expenses
The first line of the accompanying table for each class of the Fund provides information about actual account values and actual expenses. You may use the information in this line, together with the amount you invested, to estimate the expenses that you paid over the period. Simply divide your account value by $1,000.00 (for example, an $8,600 account value divided by $1,000.00 = 8.6), then multiply the result by the number in the first line for a class of the Fund under the heading entitled "Expenses Paid During Period" to estimate the expenses you paid on your account during this period. The estimate of expenses does not include any fees or other expenses of any variable annuity or variable life insurance product. If they were, the estimate of expenses you paid during the period would be higher, and your ending account value would be lower. In addition, the Fund, as a shareholder in the underlying Fidelity Central Funds, will indirectly bear its pro-rata share of the fees and expenses incurred by the underlying Fidelity Central Funds. These fees and expenses are not included in the Fund's annualized expense ratio used to calculate the expense estimate in the table below.
Hypothetical Example for Comparison Purposes
The second line of the accompanying table for each class of the Fund provides information about hypothetical account values and hypothetical expenses based on a Class' actual expense ratio and an assumed rate of return of 5% per year before expenses, which is not the Class' actual return. The hypothetical account values and expenses may not be used to estimate the actual ending account balance or expenses you paid for the period. You may use this information to compare the ongoing costs of investing in the Fund and other funds. To do so, compare this 5% hypothetical example with the 5% hypothetical examples that appear in the shareholder reports of the other funds. The estimate of expenses does not include any fees or other expenses of any variable annuity or variable life insurance product. If they were, the estimate of expenses you paid during the period would be higher, and your ending account value would be lower. In addition, the Fund, as a shareholder in the underlying Fidelity Central Funds, will indirectly bear its pro-rata share of the fees and expenses incurred by the underlying Fidelity Central Funds. These fees and expenses are not included in the Fund's annualized expense ratio used to calculate the expense estimate in the table below.
Please note that the expenses shown in the table are meant to highlight your ongoing costs only and do not reflect any transaction costs. Therefore, the second line of the table is useful in comparing ongoing costs only, and will not help you determine the relative total costs of owning different funds. In addition, if these transactional costs were included, your costs would have been higher.
| Annualized Expense Ratio | Beginning
Account Value
January 1, 2010 | Ending
Account Value
June 30, 2010 | Expenses Paid
During Period*
January 1, 2010
to June 30, 2010 |
Initial Class | .67% | | | |
Actual | | $ 1,000.00 | $ 950.20 | $ 3.24 |
HypotheticalA | | $ 1,000.00 | $ 1,021.47 | $ 3.36 |
Service Class | .77% | | | |
Actual | | $ 1,000.00 | $ 950.10 | $ 3.72 |
HypotheticalA | | $ 1,000.00 | $ 1,020.98 | $ 3.86 |
Service Class 2 | .92% | | | |
Actual | | $ 1,000.00 | $ 949.10 | $ 4.45 |
HypotheticalA | | $ 1,000.00 | $ 1,020.23 | $ 4.61 |
Service Class 2R | .92% | | | |
Actual | | $ 1,000.00 | $ 949.00 | $ 4.45 |
HypotheticalA | | $ 1,000.00 | $ 1,020.23 | $ 4.61 |
Investor Class | .76% | | | |
Actual | | $ 1,000.00 | $ 950.10 | $ 3.67 |
HypotheticalA | | $ 1,000.00 | $ 1,021.03 | $ 3.81 |
A 5% return per year before expenses
* Expenses are equal to each Class' annualized expense ratio, multiplied by the average account value over the period, multiplied by 181/365 (to reflect the one-half year period).
Semiannual Report
Investment Changes (Unaudited)
Top Ten Stocks as of June 30, 2010 |
| % of fund's
net assets | % of fund's net assets
6 months ago |
Apple, Inc. | 5.9 | 4.0 |
Cisco Systems, Inc. | 5.0 | 4.8 |
QUALCOMM, Inc. | 3.1 | 3.5 |
United Technologies Corp. | 2.6 | 2.0 |
Procter & Gamble Co. | 2.6 | 1.0 |
Juniper Networks, Inc. | 2.5 | 1.4 |
Google, Inc. Class A | 2.3 | 4.5 |
Medco Health Solutions, Inc. | 2.1 | 2.4 |
Agilent Technologies, Inc. | 1.9 | 2.1 |
Express Scripts, Inc. | 1.6 | 1.3 |
| 29.6 | |
Top Five Market Sectors as of June 30, 2010 |
| % of fund's
net assets | % of fund's net assets
6 months ago |
Information Technology | 34.0 | 37.4 |
Health Care | 15.7 | 12.6 |
Consumer Discretionary | 15.3 | 13.2 |
Industrials | 12.7 | 9.7 |
Consumer Staples | 8.4 | 7.6 |
Asset Allocation (% of fund's net assets) |
As of June 30, 2010 * | As of December 31, 2009 ** |
| Stocks 97.8% | | | Stocks 98.5% | |
| Short-Term
Investments and
Net Other Assets 2.2% | | | Short-Term
Investments and
Net Other Assets 1.5% | |
* Foreign investments | 9.7% | | ** Foreign investments | 12.9% | |

Semiannual Report
Investments June 30, 2010 (Unaudited)
Showing Percentage of Net Assets
Common Stocks - 97.8% |
| Shares | | Value |
CONSUMER DISCRETIONARY - 15.3% |
Auto Components - 0.2% |
Gentex Corp. | 405,800 | | $ 7,296,284 |
Automobiles - 0.9% |
Harley-Davidson, Inc. | 1,341,421 | | 29,819,789 |
Diversified Consumer Services - 1.8% |
Navitas Ltd. | 2,440,338 | | 9,471,199 |
Strayer Education, Inc. (c) | 184,469 | | 38,349,260 |
Universal Technical Institute, Inc. | 421,355 | | 9,960,832 |
| | 57,781,291 |
Hotels, Restaurants & Leisure - 3.3% |
Chipotle Mexican Grill, Inc. (a) | 13,893 | | 1,900,701 |
Denny's Corp. (a) | 1,076,027 | | 2,797,670 |
Home Inns & Hotels Management, Inc. sponsored ADR (a) | 122,172 | | 4,769,595 |
Marriott International, Inc. Class A | 213,213 | | 6,383,597 |
McDonald's Corp. | 572,800 | | 37,730,336 |
Starbucks Corp. | 1,322,073 | | 32,126,374 |
Starwood Hotels & Resorts Worldwide, Inc. | 279,900 | | 11,596,257 |
The Cheesecake Factory, Inc. (a) | 412,925 | | 9,191,711 |
| | 106,496,241 |
Household Durables - 0.4% |
Mohawk Industries, Inc. (a) | 272,299 | | 12,460,402 |
Internet & Catalog Retail - 1.2% |
Amazon.com, Inc. (a) | 353,069 | | 38,576,319 |
Media - 1.4% |
DIRECTV (a) | 405,000 | | 13,737,600 |
Discovery Communications, Inc.
Class C (a) | 339,191 | | 10,491,178 |
Interpublic Group of Companies, Inc. (a) | 1,581,443 | | 11,275,689 |
McGraw-Hill Companies, Inc. | 402,710 | | 11,332,259 |
| | 46,836,726 |
Multiline Retail - 1.3% |
Dollarama, Inc. | 718,740 | | 16,710,173 |
Dollarama, Inc. (d) | 128,200 | | 2,980,555 |
Target Corp. | 436,024 | | 21,439,300 |
| | 41,130,028 |
Specialty Retail - 3.0% |
Lowe's Companies, Inc. | 1,075,491 | | 21,961,526 |
Ross Stores, Inc. | 303,509 | | 16,173,995 |
TJX Companies, Inc. | 554,895 | | 23,277,845 |
Urban Outfitters, Inc. (a) | 566,298 | | 19,474,988 |
Vitamin Shoppe, Inc. | 675,100 | | 17,316,315 |
| | 98,204,669 |
Textiles, Apparel & Luxury Goods - 1.8% |
Coach, Inc. | 498,100 | | 18,205,555 |
|
| Shares | | Value |
lululemon athletica, Inc. (a) | 666,600 | | $ 24,810,852 |
Polo Ralph Lauren Corp. Class A | 207,900 | | 15,168,384 |
| | 58,184,791 |
TOTAL CONSUMER DISCRETIONARY | | 496,786,540 |
CONSUMER STAPLES - 8.4% |
Beverages - 0.7% |
The Coca-Cola Co. | 447,541 | | 22,430,755 |
Food & Staples Retailing - 2.1% |
Costco Wholesale Corp. | 69,600 | | 3,816,168 |
Walgreen Co. | 1,045,369 | | 27,911,352 |
Whole Foods Market, Inc. (a) | 998,000 | | 35,947,960 |
| | 67,675,480 |
Food Products - 0.9% |
Diamond Foods, Inc. | 432,549 | | 17,777,764 |
Mead Johnson Nutrition Co. Class A | 224,969 | | 11,275,446 |
| | 29,053,210 |
Household Products - 3.8% |
Colgate-Palmolive Co. | 510,049 | | 40,171,459 |
Procter & Gamble Co. | 1,391,236 | | 83,446,335 |
| | 123,617,794 |
Personal Products - 0.9% |
Estee Lauder Companies, Inc. Class A | 205,076 | | 11,428,885 |
Herbalife Ltd. | 377,907 | | 17,402,617 |
| | 28,831,502 |
TOTAL CONSUMER STAPLES | | 271,608,741 |
ENERGY - 2.3% |
Energy Equipment & Services - 0.9% |
Schlumberger Ltd. | 541,233 | | 29,951,834 |
Oil, Gas & Consumable Fuels - 1.4% |
Denbury Resources, Inc. (a) | 1,458,101 | | 21,346,599 |
Southwestern Energy Co. (a) | 411,474 | | 15,899,355 |
Whiting Petroleum Corp. (a) | 98,800 | | 7,747,896 |
| | 44,993,850 |
TOTAL ENERGY | | 74,945,684 |
FINANCIALS - 5.6% |
Capital Markets - 0.8% |
BlackRock, Inc. Class A | 72,709 | | 10,426,471 |
Charles Schwab Corp. | 855,448 | | 12,130,253 |
Goldman Sachs Group, Inc. | 25,158 | | 3,302,491 |
JMP Group, Inc. | 127,100 | | 786,749 |
| | 26,645,964 |
Commercial Banks - 2.1% |
M&T Bank Corp. (c) | 88,785 | | 7,542,286 |
PNC Financial Services Group, Inc. | 399,089 | | 22,548,529 |
Wells Fargo & Co. | 1,445,227 | | 36,997,811 |
| | 67,088,626 |
Common Stocks - continued |
| Shares | | Value |
FINANCIALS - continued |
Consumer Finance - 1.2% |
American Express Co. | 1,027,200 | | $ 40,779,840 |
Diversified Financial Services - 0.9% |
CME Group, Inc. | 40,707 | | 11,461,056 |
JPMorgan Chase & Co. | 454,198 | | 16,628,189 |
| | 28,089,245 |
Insurance - 0.4% |
AFLAC, Inc. | 321,900 | | 13,735,473 |
Real Estate Management & Development - 0.2% |
CB Richard Ellis Group, Inc. Class A (a) | 436,297 | | 5,938,002 |
TOTAL FINANCIALS | | 182,277,150 |
HEALTH CARE - 15.7% |
Biotechnology - 2.5% |
Alexion Pharmaceuticals, Inc. (a) | 176,642 | | 9,042,304 |
Celgene Corp. (a) | 99,335 | | 5,048,205 |
Clinical Data, Inc. (a) | 707,221 | | 8,797,829 |
Human Genome Sciences, Inc. (a) | 396,700 | | 8,989,222 |
Incyte Corp. (a) | 734,200 | | 8,127,594 |
United Therapeutics Corp. (a) | 806,660 | | 39,373,075 |
| | 79,378,229 |
Health Care Equipment & Supplies - 2.0% |
AGA Medical Holdings, Inc. | 801,896 | | 10,176,060 |
C. R. Bard, Inc. | 36,000 | | 2,791,080 |
Conceptus, Inc. (a)(c) | 392,266 | | 6,111,504 |
Covidien PLC | 128,396 | | 5,158,951 |
DENTSPLY International, Inc. | 61,814 | | 1,848,857 |
Edwards Lifesciences Corp. (a) | 269,112 | | 15,075,654 |
NuVasive, Inc. (a)(c) | 522,251 | | 18,519,020 |
Sonova Holding AG Class B | 51,697 | | 6,344,132 |
| | 66,025,258 |
Health Care Providers & Services - 4.9% |
Emergency Medical Services Corp. Class A (a) | 208,400 | | 10,217,852 |
Express Scripts, Inc. (a) | 1,138,010 | | 53,509,230 |
Henry Schein, Inc. (a) | 99,019 | | 5,436,143 |
Medco Health Solutions, Inc. (a) | 1,224,306 | | 67,434,774 |
VCA Antech, Inc. (a) | 914,488 | | 22,642,723 |
| | 159,240,722 |
Life Sciences Tools & Services - 2.5% |
Illumina, Inc. (a) | 692,449 | | 30,142,305 |
Life Technologies Corp. (a) | 518,390 | | 24,493,928 |
QIAGEN NV (a) | 605,130 | | 11,630,599 |
Thermo Fisher Scientific, Inc. (a) | 281,400 | | 13,802,670 |
| | 80,069,502 |
Pharmaceuticals - 3.8% |
Allergan, Inc. | 180,200 | | 10,498,452 |
Biovail Corp. | 1,048,700 | | 20,204,628 |
Novo Nordisk AS Series B | 512,963 | | 41,440,628 |
|
| Shares | | Value |
Perrigo Co. | 288,400 | | $ 17,035,788 |
Teva Pharmaceutical Industries Ltd. sponsored ADR | 480,600 | | 24,986,394 |
Valeant Pharmaceuticals International (a) | 172,200 | | 9,004,338 |
| | 123,170,228 |
TOTAL HEALTH CARE | | 507,883,939 |
INDUSTRIALS - 12.7% |
Aerospace & Defense - 5.5% |
Esterline Technologies Corp. (a) | 283,674 | | 13,460,331 |
Goodrich Corp. | 404,979 | | 26,829,859 |
Honeywell International, Inc. | 745,307 | | 29,089,332 |
Precision Castparts Corp. | 216,000 | | 22,230,720 |
TransDigm Group, Inc. | 67,298 | | 3,434,217 |
United Technologies Corp. | 1,290,900 | | 83,792,319 |
| | 178,836,778 |
Air Freight & Logistics - 0.6% |
C.H. Robinson Worldwide, Inc. | 324,900 | | 18,083,934 |
Airlines - 0.4% |
Southwest Airlines Co. | 1,176,908 | | 13,075,448 |
Building Products - 0.3% |
Lennox International, Inc. | 209,322 | | 8,701,516 |
Commercial Services & Supplies - 0.9% |
Higher One Holdings, Inc. | 490,600 | | 7,113,700 |
Republic Services, Inc. | 505,000 | | 15,013,650 |
Steelcase, Inc. Class A | 431,402 | | 3,343,366 |
Waste Connections, Inc. (a) | 142,300 | | 4,964,847 |
| | 30,435,563 |
Construction & Engineering - 0.1% |
Fluor Corp. | 75,600 | | 3,213,000 |
Electrical Equipment - 0.8% |
Acuity Brands, Inc. | 217,600 | | 7,916,288 |
AMETEK, Inc. | 406,800 | | 16,333,020 |
Crompton Greaves Ltd. | 576,754 | | 3,185,525 |
| | 27,434,833 |
Industrial Conglomerates - 0.7% |
3M Co. | 302,892 | | 23,925,439 |
Machinery - 2.2% |
Cummins, Inc. | 347,234 | | 22,615,350 |
Danaher Corp. | 483,168 | | 17,935,196 |
Gardner Denver, Inc. | 150,725 | | 6,720,828 |
Ingersoll-Rand Co. Ltd. | 215,347 | | 7,427,318 |
PACCAR, Inc. | 250,300 | | 9,979,461 |
Weg SA | 735,600 | | 6,815,222 |
| | 71,493,375 |
Professional Services - 0.8% |
51job, Inc. sponsored ADR (a) | 97,726 | | 2,033,678 |
CoStar Group, Inc. (a)(c) | 43,900 | | 1,703,320 |
Equifax, Inc. | 59,900 | | 1,680,794 |
Common Stocks - continued |
| Shares | | Value |
INDUSTRIALS - continued |
Professional Services - continued |
IHS, Inc. Class A (a) | 60,702 | | $ 3,546,211 |
Robert Half International, Inc. | 662,050 | | 15,591,278 |
| | 24,555,281 |
Road & Rail - 0.4% |
Union Pacific Corp. | 201,132 | | 13,980,685 |
TOTAL INDUSTRIALS | | 413,735,852 |
INFORMATION TECHNOLOGY - 34.0% |
Communications Equipment - 11.9% |
Cisco Systems, Inc. (a) | 7,546,537 | | 160,816,703 |
DG FastChannel, Inc. (a) | 109,045 | | 3,552,686 |
Juniper Networks, Inc. (a) | 3,562,138 | | 81,287,989 |
Polycom, Inc. (a) | 540,519 | | 16,102,061 |
QUALCOMM, Inc. | 3,097,803 | | 101,731,851 |
Riverbed Technology, Inc. (a) | 778,281 | | 21,496,121 |
| | 384,987,411 |
Computers & Peripherals - 6.9% |
Apple, Inc. (a) | 757,412 | | 190,511,840 |
EMC Corp. (a) | 208,885 | | 3,822,596 |
NetApp, Inc. (a) | 792,600 | | 29,571,906 |
| | 223,906,342 |
Electronic Equipment & Components - 2.5% |
Agilent Technologies, Inc. (a) | 2,168,146 | | 61,640,391 |
Corning, Inc. | 787,612 | | 12,719,934 |
IPG Photonics Corp. (a) | 280,198 | | 4,267,416 |
Keyence Corp. | 15,800 | | 3,654,250 |
| | 82,281,991 |
Internet Software & Services - 5.5% |
Baidu.com, Inc. sponsored ADR (a) | 417,575 | | 28,428,506 |
eBay, Inc. (a) | 982,251 | | 19,261,942 |
Google, Inc. Class A (a) | 170,793 | | 75,994,345 |
The Knot, Inc. (a) | 363,317 | | 2,826,606 |
VeriSign, Inc. (a) | 829,618 | | 22,026,358 |
WebMD Health Corp. (a) | 647,450 | | 30,061,104 |
| | 178,598,861 |
IT Services - 2.6% |
Accenture PLC Class A | 187,435 | | 7,244,363 |
Cognizant Technology Solutions Corp. Class A (a) | 536,200 | | 26,842,172 |
MasterCard, Inc. Class A | 86,414 | | 17,242,185 |
Visa, Inc. Class A | 457,593 | | 32,374,705 |
| | 83,703,425 |
|
| Shares | | Value |
Semiconductors & Semiconductor Equipment - 1.5% |
Applied Micro Circuits Corp. (a) | 512,406 | | $ 5,370,015 |
ARM Holdings PLC | 806,300 | | 3,336,178 |
Avago Technologies Ltd. | 612,600 | | 12,901,356 |
Monolithic Power Systems, Inc. (a) | 1,034,529 | | 18,476,688 |
PMC-Sierra, Inc. (a) | 234,400 | | 1,762,688 |
Power Integrations, Inc. | 51,201 | | 1,648,416 |
Rubicon Technology, Inc. (a) | 195,634 | | 5,827,937 |
| | 49,323,278 |
Software - 3.1% |
Advent Software, Inc. (a)(c) | 9,710 | | 455,982 |
Citrix Systems, Inc. (a) | 714,984 | | 30,193,774 |
Concur Technologies, Inc. (a) | 39,505 | | 1,686,073 |
Informatica Corp. (a) | 152,600 | | 3,644,088 |
Kingdee International Software Group Co. Ltd. | 4,414,000 | | 1,663,047 |
Oracle Corp. | 722,431 | | 15,503,369 |
Red Hat, Inc. (a) | 204,900 | | 5,929,806 |
Salesforce.com, Inc. (a) | 141,579 | | 12,150,310 |
Solera Holdings, Inc. | 96,320 | | 3,486,784 |
VanceInfo Technologies, Inc. ADR (a) | 302,915 | | 7,051,861 |
VMware, Inc. Class A (a) | 288,200 | | 18,038,438 |
| | 99,803,532 |
TOTAL INFORMATION TECHNOLOGY | | 1,102,604,840 |
MATERIALS - 2.7% |
Chemicals - 1.6% |
Air Products & Chemicals, Inc. | 462,200 | | 29,955,182 |
Ecolab, Inc. | 149,600 | | 6,718,536 |
Sherwin-Williams Co. | 140,298 | | 9,707,219 |
The Mosaic Co. | 115,300 | | 4,494,394 |
| | 50,875,331 |
Metals & Mining - 1.1% |
Compass Minerals International, Inc. | 81,793 | | 5,748,412 |
Consolidated Thompson Iron Mines Ltd. (a) | 2,918,100 | | 19,900,809 |
Newmont Mining Corp. | 172,700 | | 10,662,498 |
| | 36,311,719 |
TOTAL MATERIALS | | 87,187,050 |
TELECOMMUNICATION SERVICES - 1.1% |
Wireless Telecommunication Services - 1.1% |
Syniverse Holdings, Inc. (a) | 534,197 | | 10,924,329 |
Vivo Participacoes SA sponsored ADR | 989,700 | | 25,653,024 |
| | 36,577,353 |
TOTAL COMMON STOCKS (Cost $3,106,581,967) | 3,173,607,149 |
Money Market Funds - 2.6% |
| Shares | | Value |
Fidelity Cash Central Fund, 0.20% (e) | 44,742,294 | | $ 44,742,294 |
Fidelity Securities Lending Cash Central Fund, 0.24% (b)(e) | 40,308,823 | | 40,308,823 |
TOTAL MONEY MARKET FUNDS (Cost $85,051,117) | 85,051,117 |
TOTAL INVESTMENT PORTFOLIO - 100.4% (Cost $3,191,633,084) | 3,258,658,266 |
NET OTHER ASSETS (LIABILITIES) - (0.4)% | (12,545,143) |
NET ASSETS - 100% | $ 3,246,113,123 |
Legend |
(a) Non-income producing |
(b) Investment made with cash collateral received from securities on loan. |
(c) Security or a portion of the security is on loan at period end. |
(d) Security exempt from registration under Rule 144A of the Securities Act of 1933. These securities may be resold in transactions exempt from registration, normally to qualified institutional buyers. At the end of the period, the value of these securities amounted to $2,980,555 or 0.1% of net assets. |
(e) Affiliated fund that is available only to investment companies and other accounts managed by Fidelity Investments. The rate quoted is the annualized seven-day yield of the fund at period end. A complete unaudited listing of the fund's holdings as of its most recent quarter end is available upon request. |
Affiliated Central Funds |
Information regarding fiscal year to date income earned by the Fund from investments in Fidelity Central Funds is as follows: |
Fund | Income earned |
Fidelity Cash Central Fund | $ 64,687 |
Fidelity Securities Lending Cash Central Fund | 296,413 |
Total | $ 361,100 |
Other Information |
The following is a summary of the inputs used, as of June 30, 2010, involving the Fund's assets and liabilities carried at value. The inputs or methodology used for valuing securities may not be an indication of the risk associated with investing in those securities. For more information on valuation inputs, and their aggregation into the levels used in the table below, please refer to the Security Valuation section in the accompanying Notes to Financial Statements. |
Valuation Inputs at Reporting Date: |
Description | Total | Level 1 | Level 2 | Level 3 |
Investments in Securities: | | | | |
Equities: | | | | |
Consumer Discretionary | $ 496,786,540 | $ 487,315,341 | $ 9,471,199 | $ - |
Consumer Staples | 271,608,741 | 271,608,741 | - | - |
Energy | 74,945,684 | 74,945,684 | - | - |
Financials | 182,277,150 | 182,277,150 | - | - |
Health Care | 507,883,939 | 460,099,179 | 47,784,760 | - |
Industrials | 413,735,852 | 410,550,327 | 3,185,525 | - |
Information Technology | 1,102,604,840 | 1,093,951,365 | 8,653,475 | - |
Materials | 87,187,050 | 87,187,050 | - | - |
Telecommunication Services | 36,577,353 | 36,577,353 | - | - |
Money Market Funds | 85,051,117 | 85,051,117 | - | - |
Total Investments in Securities: | $ 3,258,658,266 | $ 3,189,563,307 | $ 69,094,959 | $ - |
Income Tax Information |
At December 31, 2009, the Fund had a capital loss carryforward of approximately $1,959,160,108 of which $351,276,710, $44,707,854, $1,104,811,876 and $458,363,668 will expire on December 31, 2010, 2011, 2016 and 2017, respectively. Capital loss carryforwards are only available to offset future capital gains of the Fund to the extent provided by regulations and may be limited. |
See accompanying notes which are an integral part of the financial statements.
Semiannual Report
Statement of Assets and Liabilities
| June 30, 2010 (Unaudited) |
| | |
Assets | | |
Investment in securities, at value (including securities loaned of $38,728,784) - See accompanying schedule: Unaffiliated issuers (cost $3,106,581,967) | $ 3,173,607,149 | |
Fidelity Central Funds (cost $85,051,117) | 85,051,117 | |
Total Investments (cost $3,191,633,084) | | $ 3,258,658,266 |
Cash | | 273,456 |
Foreign currency held at value
(cost $3) | | 3 |
Receivable for investments sold | | 56,453,282 |
Receivable for fund shares sold | | 558,248 |
Dividends receivable | | 1,362,589 |
Distributions receivable from Fidelity Central Funds | | 82,558 |
Other receivables | | 215,605 |
Total assets | | 3,317,604,007 |
| | |
Liabilities | | |
Payable for investments purchased | $ 26,408,784 | |
Payable for fund shares redeemed | 2,402,028 | |
Accrued management fee | 1,611,272 | |
Distribution fees payable | 135,929 | |
Other affiliated payables | 281,625 | |
Other payables and accrued expenses | 342,423 | |
Collateral on securities loaned, at value | 40,308,823 | |
Total liabilities | | 71,490,884 |
| | |
Net Assets | | $ 3,246,113,123 |
Net Assets consist of: | | |
Paid in capital | | $ 4,933,915,811 |
Undistributed net investment income | | 1,537,558 |
Accumulated undistributed net realized gain (loss) on investments and foreign currency transactions | | (1,756,354,491) |
Net unrealized appreciation (depreciation) on investments and assets and liabilities in foreign currencies | | 67,014,245 |
Net Assets | | $ 3,246,113,123 |
Statement of Assets and Liabilities - continued
| June 30, 2010 (Unaudited) |
| | |
Initial Class:
Net Asset Value, offering price and redemption price per share ($2,321,664,802 ÷ 81,406,259 shares) | | $ 28.52 |
| | |
Service Class:
Net Asset Value, offering price and redemption price per share ($370,906,199 ÷ 13,043,594 shares) | | $ 28.44 |
| | |
Service Class 2:
Net Asset Value, offering price and redemption price per share ($462,227,777 ÷ 16,383,161 shares) | | $ 28.21 |
| | |
Service Class 2R:
Net Asset Value, offering price and redemption price per share ($3,213,862 ÷ 114,110 shares) | | $ 28.16 |
| | |
Investor Class:
Net Asset Value, offering price and redemption price per share ($88,100,483 ÷ 3,097,175 shares) | | $ 28.45 |
See accompanying notes which are an integral part of the financial statements.
Semiannual Report
Financial Statements - continued
Statement of Operations
Six months ended June 30, 2010 (Unaudited) |
| | |
Investment Income | | |
Dividends | | $ 13,945,915 |
Interest | | 82 |
Income from Fidelity Central Funds | | 361,100 |
Total income | | 14,307,097 |
| | |
Expenses | | |
Management fee | $ 10,137,026 | |
Transfer agent fees | 1,287,529 | |
Distribution fees | 861,208 | |
Accounting and security lending fees | 525,115 | |
Custodian fees and expenses | 56,435 | |
Independent trustees' compensation | 10,803 | |
Appreciation in deferred trustee compensation account | 54 | |
Audit | 33,843 | |
Legal | 6,833 | |
Miscellaneous | 165,606 | |
Total expenses before reductions | 13,084,452 | |
Expense reductions | (95,727) | 12,988,725 |
Net investment income (loss) | | 1,318,372 |
Realized and Unrealized Gain (Loss) Net realized gain (loss) on: | | |
Investment securities: | | |
Unaffiliated issuers | 233,648,174 | |
Foreign currency transactions | (219,269) | |
Total net realized gain (loss) | | 233,428,905 |
Change in net unrealized appreciation (depreciation) on: Investment securities | (400,487,151) | |
Assets and liabilities in foreign currencies | (8,737) | |
Total change in net unrealized appreciation (depreciation) | | (400,495,888) |
Net gain (loss) | | (167,066,983) |
Net increase (decrease) in net assets resulting from operations | | $ (165,748,611) |
Statement of Changes in Net Assets
| Six months ended June 30, 2010 (Unaudited) | Year ended December 31, 2009 |
Increase (Decrease) in Net Assets | | |
Operations | | |
Net investment income (loss) | $ 1,318,372 | $ 11,842,787 |
Net realized gain (loss) | 233,428,905 | (453,010,967) |
Change in net unrealized appreciation (depreciation) | (400,495,888) | 1,274,194,307 |
Net increase (decrease) in net assets resulting from operations | (165,748,611) | 833,026,127 |
Distributions to shareholders from net investment income | - | (12,825,130) |
Distributions to shareholders from net realized gain | (3,011,926) | (2,861,216) |
Total distributions | (3,011,926) | (15,686,346) |
Share transactions - net increase (decrease) | (254,511,066) | (425,627,981) |
Redemption fees | 1,231 | 1,078 |
Total increase (decrease) in net assets | (423,270,372) | 391,712,878 |
| | |
Net Assets | | |
Beginning of period | 3,669,383,495 | 3,277,670,617 |
End of period (including undistributed net investment income of $1,537,558 and undistributed net investment income of $219,186, respectively) | $ 3,246,113,123 | $ 3,669,383,495 |
See accompanying notes which are an integral part of the financial statements.
Semiannual Report
Financial Highlights - Initial Class
| Six months ended June 30, 2010 | Years ended December 31, |
| (Unaudited) | 2009 | 2008 | 2007 | 2006 | 2005 |
Selected Per-Share Data | | | | | | |
Net asset value, beginning of period | $ 30.04 | $ 23.53 | $ 45.12 | $ 35.87 | $ 33.70 | $ 32.01 |
Income from Investment Operations | | | | | | |
Net investment income (loss) E | .02 | .10 | .27 | .09 | .21 | .11 |
Net realized and unrealized gain (loss) | (1.51) | 6.55 | (21.55) | 9.53 | 2.09 | 1.74 |
Total from investment operations | (1.49) | 6.65 | (21.28) | 9.62 | 2.30 | 1.85 |
Distributions from net investment income | - | (.12) | (.31) | (.33) | (.13) | (.16) |
Distributions from net realized gain | (.03) | (.02) | - | (.04) | - | - |
Total distributions | (.03) | (.14) J | (.31) | (.37) | (.13) | (.16) |
Redemption fees added to paid in capital E, I | - | - | - | - | - | - |
Net asset value, end of period | $ 28.52 | $ 30.04 | $ 23.53 | $ 45.12 | $ 35.87 | $ 33.70 |
Total Return B, C, D | (4.98)% | 28.29% | (47.17)% | 26.96% | 6.85% | 5.80% |
Ratios to Average Net Assets F, H | | | | | | |
Expenses before reductions | .67% A | .69% | .68% | .65% | .68% | .67% |
Expenses net of fee waivers, if any | .67% A | .69% | .68% | .65% | .68% | .67% |
Expenses net of all reductions | .67% A | .68% | .67% | .64% | .67% | .63% |
Net investment income (loss) | .12% A | .41% | .74% | .21% | .61% | .36% |
Supplemental Data | | | | | | |
Net assets, end of period (000 omitted) | $ 2,321,665 | $ 2,618,954 | $ 2,337,892 | $ 6,002,656 | $ 5,610,629 | $ 6,726,655 |
Portfolio turnover rate G | 83% A | 134% | 161% | 109% | 114% | 79% |
A Annualized B Total returns for periods of less than one year are not annualized. C Total returns do not reflect charges attributable to your insurance company's separate account. Inclusion of these charges would reduce the total returns shown. D Total returns would have been lower had certain expenses not been reduced during the periods shown. E Calculated based on average shares outstanding during the period. F Fees and expenses of the underlying Fidelity Central Funds are not included in the Fund's expense ratio. The Fund indirectly bears its proportionate share of the expenses of any underlying Fidelity Central Funds. G Amount does not include the portfolio activity of any underlying Fidelity Central Funds. H Expense ratios reflect operating expenses of the class. Expenses before reductions do not reflect amounts reimbursed by the investment adviser or reductions from brokerage service arrangements or reductions from other expense offset arrangements and do not represent the amount paid by the class during periods when reimbursements or reductions occur. Expenses net of fee waivers reflect expenses after reimbursement by the investment adviser but prior to reductions from brokerage service arrangements or other expense offset arrangements. Expenses net of all reductions represent the net expenses paid by the class. I Amount represents less than $.01 per share. J Total distributions of $.14 per share is comprised of distributions from net investment income of $.118 and distributions from net realized gain of $.023 per share. |
Financial Highlights - Service Class
| Six months ended June 30, 2010 | Years ended December 31, |
| (Unaudited) | 2009 | 2008 | 2007 | 2006 | 2005 |
Selected Per-Share Data | | | | | | |
Net asset value, beginning of period | $ 29.96 | $ 23.47 | $ 44.99 | $ 35.72 | $ 33.56 | $ 31.88 |
Income from Investment Operations | | | | | | |
Net investment income (loss) E | - I | .08 | .23 | .04 | .18 | .08 |
Net realized and unrealized gain (loss) | (1.49) | 6.52 | (21.48) | 9.51 | 2.07 | 1.72 |
Total from investment operations | (1.49) | 6.60 | (21.25) | 9.55 | 2.25 | 1.80 |
Distributions from net investment income | - | (.09) | (.27) | (.24) | (.09) | (.12) |
Distributions from net realized gain | (.03) | (.02) | - | (.04) | - | - |
Total distributions | (.03) | (.11) J | (.27) | (.28) | (.09) | (.12) |
Redemption fees added to paid in capital E, I | - | - | - | - | - | - |
Net asset value, end of period | $ 28.44 | $ 29.96 | $ 23.47 | $ 44.99 | $ 35.72 | $ 33.56 |
Total Return B, C, D | (4.99)% | 28.15% | (47.23)% | 26.87% | 6.73% | 5.67% |
Ratios to Average Net Assets F, H | | | | | | |
Expenses before reductions | .77% A | .79% | .78% | .75% | .78% | .77% |
Expenses net of fee waivers, if any | .77% A | .79% | .78% | .75% | .78% | .77% |
Expenses net of all reductions | .77% A | .78% | .77% | .74% | .77% | .73% |
Net investment income (loss) | .02% A | .31% | .64% | .11% | .51% | .26% |
Supplemental Data | | | | | | |
Net assets, end of period (000 omitted) | $ 370,906 | $ 421,996 | $ 395,759 | $ 929,848 | $ 877,279 | $ 1,086,172 |
Portfolio turnover rate G | 83% A | 134% | 161% | 109% | 114% | 79% |
A Annualized B Total returns for periods of less than one year are not annualized. C Total returns do not reflect charges attributable to your insurance company's separate account. Inclusion of these charges would reduce the total returns shown. D Total returns would have been lower had certain expenses not been reduced during the periods shown. E Calculated based on average shares outstanding during the period. F Fees and expenses of the underlying Fidelity Central Funds are not included in the Fund's expense ratio. The Fund indirectly bears its proportionate share of the expenses of any underlying Fidelity Central Funds. G Amount does not include the portfolio activity of any underlying Fidelity Central Funds. H Expense ratios reflect operating expenses of the class. Expenses before reductions do not reflect amounts reimbursed by the investment adviser or reductions from brokerage service arrangements or reductions from other expense offset arrangements and do not represent the amount paid by the class during periods when reimbursements or reductions occur. Expenses net of fee waivers reflect expenses after reimbursement by the investment adviser but prior to reductions from brokerage service arrangements or other expense offset arrangements. Expenses net of all reductions represent the net expenses paid by the class. I Amount represents less than $.01 per share. J Total distributions of $.11 per share is comprised of distributions from net investment income of $.089 and distributions from net realized gain of $.023 per share. |
See accompanying notes which are an integral part of the financial statements.
Semiannual Report
Financial Highlights - Service Class 2
| Six months ended June 30, 2010 | Years ended December 31, |
| (Unaudited) | 2009 | 2008 | 2007 | 2006 | 2005 |
Selected Per-Share Data | | | | | | |
Net asset value, beginning of period | $ 29.75 | $ 23.31 | $ 44.65 | $ 35.42 | $ 33.29 | $ 31.64 |
Income from Investment Operations | | | | | | |
Net investment income (loss) E | (.02) | .04 | .17 | (.02) | .12 | .03 |
Net realized and unrealized gain (loss) | (1.49) | 6.48 | (21.29) | 9.43 | 2.07 | 1.71 |
Total from investment operations | (1.51) | 6.52 | (21.12) | 9.41 | 2.19 | 1.74 |
Distributions from net investment income | - | (.05) | (.22) | (.15) | (.06) | (.09) |
Distributions from net realized gain | (.03) | (.02) | - | (.03) | - | - |
Total distributions | (.03) | (.08) J | (.22) | (.18) | (.06) | (.09) |
Redemption fees added to paid in capital E, I | - | - | - | - | - | - |
Net asset value, end of period | $ 28.21 | $ 29.75 | $ 23.31 | $ 44.65 | $ 35.42 | $ 33.29 |
Total Return B, C, D | (5.09)% | 27.97% | (47.31)% | 26.66% | 6.57% | 5.50% |
Ratios to Average Net Assets F, H | | | | | | |
Expenses before reductions | .92% A | .94% | .93% | .90% | .94% | .92% |
Expenses net of fee waivers, if any | .92% A | .94% | .93% | .90% | .94% | .92% |
Expenses net of all reductions | .92% A | .93% | .92% | .89% | .92% | .88% |
Net investment income (loss) | (.13)% A | .16% | .49% | (.04)% | .36% | .11% |
Supplemental Data | | | | | | |
Net assets, end of period (000 omitted) | $ 462,228 | $ 528,819 | $ 447,530 | $ 898,204 | $ 627,754 | $ 858,587 |
Portfolio turnover rate G | 83% A | 134% | 161% | 109% | 114% | 79% |
A Annualized B Total returns for periods of less than one year are not annualized. C Total returns do not reflect charges attributable to your insurance company's separate account. Inclusion of these charges would reduce the total returns shown. D Total returns would have been lower had certain expenses not been reduced during the periods shown. E Calculated based on average shares outstanding during the period. F Fees and expenses of the underlying Fidelity Central Funds are not included in the Fund's expense ratio. The Fund indirectly bears its proportionate share of the expenses of any underlying Fidelity Central Funds. G Amount does not include the portfolio activity of any underlying Fidelity Central Funds. H Expense ratios reflect operating expenses of the class. Expenses before reductions do not reflect amounts reimbursed by the investment adviser or reductions from brokerage service arrangements or reductions from other expense offset arrangements and do not represent the amount paid by the class during periods when reimbursements or reductions occur. Expenses net of fee waivers reflect expenses after reimbursement by the investment adviser but prior to reductions from brokerage service arrangements or other expense offset arrangements. Expenses net of all reductions represent the net expenses paid by the class. I Amount represents less than $.01 per share. J Total distributions of $.08 per share is comprised of distributions from net investment income of $.052 and distributions from net realized gain of $.023 per share. |
Financial Highlights - Service Class 2R
| Six months ended June 30, 2010 | Years ended December 31, |
| (Unaudited) | 2009 | 2008 | 2007 | 2006 | 2005 |
Selected Per-Share Data | | | | | | |
Net asset value, beginning of period | $ 29.70 | $ 23.26 | $ 44.42 | $ 35.28 | $ 33.18 | $ 31.54 |
Income from Investment Operations | | | | | | |
Net investment income (loss) E | (.02) | .04 | .18 | (.01) | .12 | .04 |
Net realized and unrealized gain (loss) | (1.49) | 6.46 | (21.20) | 9.38 | 2.06 | 1.70 |
Total from investment operations | (1.51) | 6.50 | (21.02) | 9.37 | 2.18 | 1.74 |
Distributions from net investment income | - | (.04) | (.14) | (.19) | (.08) | (.10) |
Distributions from net realized gain | (.03) | (.02) | - | (.04) | - | - |
Total distributions | (.03) | (.06) J | (.14) | (.23) | (.08) | (.10) |
Redemption fees added to paid in capital E, I | - | - | - | - | - | - |
Net asset value, end of period | $ 28.16 | $ 29.70 | $ 23.26 | $ 44.42 | $ 35.28 | $ 33.18 |
Total Return B, C, D | (5.10)% | 27.98% | (47.31)% | 26.66% | 6.58% | 5.52% |
Ratios to Average Net Assets F, H | | | | | | |
Expenses before reductions | .92% A | .94% | .93% | .89% | .93% | .92% |
Expenses net of fee waivers, if any | .92% A | .94% | .93% | .89% | .93% | .92% |
Expenses net of all reductions | .91% A | .93% | .92% | .89% | .92% | .88% |
Net investment income (loss) | (.13)% A | .16% | .49% | (.04)% | .36% | .12% |
Supplemental Data | | | | | | |
Net assets, end of period (000 omitted) | $ 3,214 | $ 4,084 | $ 3,061 | $ 20,051 | $ 5,063 | $ 5,409 |
Portfolio turnover rate G | 83% A | 134% | 161% | 109% | 114% | 79% |
A Annualized B Total returns for periods of less than one year are not annualized. C Total returns do not reflect charges attributable to your insurance company's separate account. Inclusion of these charges would reduce the total returns shown. D Total returns would have been lower had certain expenses not been reduced during the periods shown. E Calculated based on average shares outstanding during the period. F Fees and expenses of the underlying Fidelity Central Funds are not included in the Fund's expense ratio. The Fund indirectly bears its proportionate share of the expenses of any underlying Fidelity Central Funds. G Amount does not include the portfolio activity of any underlying Fidelity Central Funds. H Expense ratios reflect operating expenses of the class. Expenses before reductions do not reflect amounts reimbursed by the investment adviser or reductions from brokerage service arrangements or reductions from other expense offset arrangements and do not represent the amount paid by the class during periods when reimbursements or reductions occur. Expenses net of fee waivers reflect expenses after reimbursement by the investment adviser but prior to reductions from brokerage service arrangements or other expense offset arrangements. Expenses net of all reductions represent the net expenses paid by the class. I Amount represents less than $.01 per share. J Total distributions of $.06 per share is comprised of distributions from net investment income of $.041 and distributions from net realized gain of $.023 per share. |
See accompanying notes which are an integral part of the financial statements.
Semiannual Report
Financial Highlights - Investor Class
| Six months ended June 30, 2010 | Years ended December 31, |
| (Unaudited) | 2009 | 2008 | 2007 | 2006 | 2005 H |
Selected Per-Share Data | | | | | | |
Net asset value, beginning of period | $ 29.97 | $ 23.48 | $ 45.00 | $ 35.78 | $ 33.67 | $ 32.60 |
Income from Investment Operations | | | | | | |
Net investment income (loss) E | .01 | .08 | .24 | .04 | .17 | .03 |
Net realized and unrealized gain (loss) | (1.50) | 6.52 | (21.49) | 9.50 | 2.08 | 1.04 |
Total from investment operations | (1.49) | 6.60 | (21.25) | 9.54 | 2.25 | 1.07 |
Distributions from net investment income | - | (.09) | (.27) | (.28) | (.14) | - |
Distributions from net realized gain | (.03) | (.02) | - | (.04) | - | - |
Total distributions | (.03) | (.11) K | (.27) | (.32) | (.14) | - |
Redemption fees added to paid in capital E, J | - | - | - | - | - | - |
Net asset value, end of period | $ 28.45 | $ 29.97 | $ 23.48 | $ 45.00 | $ 35.78 | $ 33.67 |
Total Return B, C, D | (4.99)% | 28.14% | (47.22)% | 26.81% | 6.72% | 3.28% |
Ratios to Average Net Assets F, I | | | | | | |
Expenses before reductions | .76% A | .79% | .77% | .76% | .81% | .83% A |
Expenses net of fee waivers, if any | .76% A | .79% | .77% | .76% | .81% | .83% A |
Expenses net of all reductions | .75% A | .78% | .76% | .76% | .80% | .79% A |
Net investment income (loss) | .03% A | .31% | .65% | .09% | .49% | .23% A |
Supplemental Data | | | | | | |
Net assets, end of period (000 omitted) | $ 88,100 | $ 95,531 | $ 93,428 | $ 181,705 | $ 76,965 | $ 24,166 |
Portfolio turnover rate G | 83% A | 134% | 161% | 109% | 114% | 79% |
A Annualized B Total returns for periods of less than one year are not annualized. C Total returns do not reflect charges attributable to your insurance company's separate account. Inclusion of these charges would reduce the total returns shown. D Total returns would have been lower had certain expenses not been reduced during the periods shown. E Calculated based on average shares outstanding during the period. F Fees and expenses of the underlying Fidelity Central Funds are not included in the Fund's expense ratio. The Fund indirectly bears its proportionate share of the expenses of any underlying Fidelity Central Funds. G Amount does not include the portfolio activity of any underlying Fidelity Central Funds. H For the period July 21, 2005 (commencement of sale of shares) to December 31, 2005. I Expense ratios reflect operating expenses of the class. Expenses before reductions do not reflect amounts reimbursed by the investment adviser or reductions from brokerage service arrangements or reductions from other expense offset arrangements and do not represent the amount paid by the class during periods when reimbursements or reductions occur. Expense ratios before reductions for start-up periods may not be representative of longer-term operating periods. Expenses net of fee waivers reflect expenses after reimbursement by the investment adviser but prior to reductions from brokerage service arrangements or other expense offset arrangements. Expenses net of all reductions represent the net expenses paid by the class. J Amount represents less than $.01 per share. K Total distributions of $.11 per share is comprised of distributions from net investment income of $.089 and distributions from net realized gain of $.023 per share. |
See accompanying notes which are an integral part of the financial statements.
Semiannual Report
Notes to Financial Statements
For the period ended June 30, 2010 (Unaudited)
1. Organization.
VIP Growth Portfolio (the Fund) is a fund of Variable Insurance Products Fund (the Trust) and is authorized to issue an unlimited number of shares. The Trust is registered under the Investment Company Act of 1940, as amended (the 1940 Act), as an open-end management investment company organized as a Massachusetts business trust. Shares of the Fund may only be purchased by insurance companies for the purpose of funding variable annuity or variable life insurance contracts. The Fund offers the following classes of shares: Initial Class shares, Service Class shares, Service Class 2 shares, Service Class 2R shares and Investor Class shares. All classes have equal rights and voting privileges, except for matters affecting a single class. Investment income, realized and unrealized capital gains and losses, the common expenses of the Fund, and certain fund-level expense reductions, if any, are allocated on a pro-rata basis to each class based on the relative net assets of each class to the total net assets of the Fund. Each class differs with respect to transfer agent and distribution and service plan fees incurred. Certain expense reductions also differ by class.
2. Investments in Fidelity Central Funds.
The Fund may invest in Fidelity Central Funds, which are open-end investment companies available only to other investment companies and accounts managed by Fidelity Management & Research Company (FMR) and its affiliates. The Fund's Schedule of Investments lists each of the Fidelity Central Funds held as of period end, if any, as an investment of the Fund, but does not include the underlying holdings of each Fidelity Central Fund. As an Investing Fund, the Fund indirectly bears its proportionate share of the expenses of the underlying Fidelity Central Funds.
The Money Market Central Funds seek preservation of capital and current income and are managed by Fidelity Investments Money Management, Inc. (FIMM), an affiliate of FMR.
A complete unaudited list of holdings for each Fidelity Central Fund is available upon request or at the Securities and Exchange Commission (the SEC) web site at www.sec.gov. In addition, the financial statements of the Fidelity Central Funds are available on the SEC web site or upon request.
3. Significant Accounting Policies.
The financial statements have been prepared in conformity with accounting principles generally accepted in the United States of America (GAAP), which require management to make certain estimates and assumptions at the date of the financial statements. Actual results could differ from those estimates. The following summarizes the significant accounting policies of the Fund:
Security Valuation. Investments are valued as of 4:00 p.m. Eastern time on the last calendar day of the period. The Fund uses independent pricing services approved by the Board of Trustees to value its investments. When current market prices or quotations are not readily available or reliable, valuations may be determined in good faith in accordance with procedures adopted by the Board of Trustees. Factors used in determining value may include market or security specific events. The frequency with which these procedures are used cannot be predicted and they may be utilized to a significant extent. The value used for net asset value (NAV) calculation under these procedures may differ from published prices for the same securities.
The Fund categorizes the inputs to valuation techniques used to value its investments into a disclosure hierarchy consisting of three levels as shown below.
Level 1 - quoted prices in active markets for identical investments
Level 2 - other significant observable inputs (including quoted prices for similar investments, interest rates, prepayment speeds, etc.)
Level 3 - unobservable inputs (including the fund's own assumptions based on the best information available)
Changes in valuation techniques may result in transfers in or out of an assigned level within the disclosure hierarchy. The aggregate value of investments by input level, as of June 30, 2010, is included at the end of the Fund's Schedule of Investments. Valuation techniques used to value the Fund's investments by major category are as follows.
Equity securities, including restricted securities, for which market quotations are readily available, are valued at the last reported sale price or official closing price as reported by an independent pricing service on the primary market or exchange on which they are traded and are categorized as Level 1 in the hierarchy. In the event there were no sales during the day or closing prices are not available, securities are valued at the last quoted bid price or may be valued using the last available price and are generally categorized as Level 2 in the hierarchy. For foreign equity securities, when significant market or security specific events arise, comparisons to the valuation of American Depositary Receipts (ADRs), futures contracts, Exchange-traded funds (ETFs) and certain indexes as well as quoted prices for similar securities are used and are categorized as Level 2 in the hierarchy in these circumstances. Utilizing these techniques may result in transfers between Level 1 and Level 2. For restricted equity securities and private placements where observable inputs are limited, assumptions about market activity and risk are used and are categorized as Level 3 in the hierarchy.
Investments in open-end mutual funds, including the Fidelity Central Funds, are valued at their closing net asset value each business day and are categorized as Level 1 in the hierarchy. Short-term securities with remaining maturities of sixty days or less for which quotations are not readily available are valued at amortized cost, which approximates value and are categorized as Level 2 in the hierarchy.
Semiannual Report
3. Significant Accounting Policies - continued
Foreign Currency. The Fund uses foreign currency contracts to facilitate transactions in foreign-denominated securities. Gains and losses from these transactions may arise from changes in the value of the foreign currency or if the counterparties do not perform under the contracts' terms.
Foreign-denominated assets, including investment securities, and liabilities are translated into U.S. dollars at the exchange rate at period end. Purchases and sales of investment securities, income and dividends received and expenses denominated in foreign currencies are translated into U.S. dollars at the exchange rate in effect on the transaction date.
The effects of exchange rate fluctuations on investments are included with the net realized and unrealized gain (loss) on investment securities. Other foreign currency transactions resulting in realized and unrealized gain (loss) are disclosed separately.
Investment Transactions and Income. For financial reporting purposes, the Fund's investment holdings and NAV include trades executed through the end of the last business day of the period. The NAV per share for processing shareholder transactions is calculated as of the close of business of the New York Stock Exchange (NYSE), normally 4:00 p.m. Eastern time and includes trades executed through the end of the prior business day. Gains and losses on securities sold are determined on the basis of identified cost and may include proceeds received from litigation. Dividend income is recorded on the ex-dividend date, except for certain dividends from foreign securities where the ex-dividend date may have passed, which are recorded as soon as the Fund is informed of the ex-dividend date. Non-cash dividends included in dividend income, if any, are recorded at the fair market value of the securities received. Distributions received on securities that represent a return of capital or capital gain are recorded as a reduction of cost of investments and/or as a realized gain. The Fund estimates the components of distributions received that may be considered return of capital distributions or capital gain distributions. Interest income and distributions from the Fidelity Central Funds are accrued as earned. Interest income includes coupon interest and amortization of premium and accretion of discount on debt securities. Investment income is recorded net of foreign taxes withheld where recovery of such taxes is uncertain.
Expenses. Most expenses of the Trust can be directly attributed to a fund. Expenses which cannot be directly attributed are apportioned amongst each fund in the Trust. Expense estimates are accrued in the period to which they relate and adjustments are made when actual amounts are known.
Deferred Trustee Compensation. Under a Deferred Compensation Plan (the Plan), independent Trustees may elect to defer receipt of a portion of their annual compensation. Deferred amounts are invested in a cross-section of Fidelity funds, are marked-to-market and remain in the Fund until distributed in accordance with the Plan. The investment of deferred amounts and the offsetting payable to the Trustees are included in the accompanying Statement of Assets and Liabilities.
Income Tax Information and Distributions to Shareholders. Each year, the Fund intends to qualify as a regulated investment company by distributing substantially all of its taxable income and realized gains under Subchapter M of the Internal Revenue Code and filing its U.S. federal tax return. As a result, no provision for income taxes is required. A fund's federal tax return is subject to examination by the Internal Revenue Service (IRS) for a period of three years. Foreign taxes are provided for based on the Fund's understanding of the tax rules and rates that exist in the foreign markets in which it invests.
Distributions are recorded on the ex-dividend date. Income dividends and capital gain distributions are declared separately for each class. Income and capital gain distributions are determined in accordance with income tax regulations, which may differ from GAAP.
Capital accounts within the financial statements are adjusted for permanent book-tax differences. These adjustments have no impact on net assets or the results of operations. Temporary book-tax differences will reverse in a subsequent period.
Book-tax differences are primarily due to short-term gain distributions from the Fidelity Central Funds, foreign currency transactions, passive foreign investment companies (PFIC), partnerships, capital loss carryforwards and losses deferred due to wash sales.
The federal tax cost of investment securities and unrealized appreciation (depreciation) as of period end were as follows:
Gross unrealized appreciation | $ 329,292,939 |
Gross unrealized depreciation | (278,957,974) |
Net unrealized appreciation (depreciation) | $ 50,334,965 |
| |
Tax cost | $ 3,208,323,301 |
Trading (Redemption) Fees. Service Class 2R shares held less than 60 days are subject to a redemption fee equal to 1% of the proceeds of the redeemed shares. All redemption fees, including any estimated redemption fees paid by FMR, are retained by the Fund and accounted for as an addition to paid in capital.
Semiannual Report
Notes to Financial Statements (Unaudited) - continued
4. Operating Policies.
Restricted Securities. The Fund may invest in securities that are subject to legal or contractual restrictions on resale. These securities generally may be resold in transactions exempt from registration or to the public if the securities are registered. Disposal of these securities may involve time-consuming negotiations and expense, and prompt sale at an acceptable price may be difficult. Information regarding restricted securities is included at the end of the Fund's Schedule of Investments.
5. Purchases and Sales of Investments.
Purchases and sales of securities, other than short-term securities, aggregated $1,451,758,022 and $1,722,544,277, respectively.
6. Fees and Other Transactions with Affiliates.
Management Fee. FMR and its affiliates provide the Fund with investment management related services for which the Fund pays a monthly management fee. The management fee is the sum of an individual fund fee rate that is based on an annual rate of .30% of the Fund's average net assets and a group fee rate that averaged .26% during the period. The group fee rate is based upon the average net assets of all the mutual funds advised by FMR. The group fee rate decreases as assets under management increase and increases as assets under management decrease. For the period, the total annualized management fee rate was .56% of the Fund's average net assets.
Distribution and Service Plan. In accordance with Rule 12b-1 of the 1940 Act, the Fund has adopted separate 12b-1 Plans for each Service Class of shares. Each Service Class pays Fidelity Distributors Corporation (FDC), an affiliate of FMR, a service fee. For the period, the service fee is based on an annual rate of .10% of Service Class' average net assets and .25% of Service Class 2's and Service Class 2R's average net assets.
For the period, each class paid FDC the following amounts, all of which were re-allowed to insurance companies for the distribution of shares and providing shareholder support services:
Service Class | $ 208,676 |
Service Class 2 | 647,760 |
Service Class 2R | 4,772 |
| $ 861,208 |
Transfer Agent Fees. Fidelity Investments Institutional Operations Company, Inc. (FIIOC), an affiliate of FMR, is the Fund's transfer, dividend disbursing, and shareholder servicing agent. FIIOC receives an asset-based fee with respect to each class. Each class (with the exception of Investor Class) pays a transfer agent fee, excluding out of pocket expenses, equal to an annual rate of .07% of average net assets. Investor Class pays a monthly asset-based transfer agent fee of .15% of average net assets. The total transfer agent fees paid by each class to FIIOC, including out of pocket expenses, were as follows:
Initial Class | $ 885,752 |
Service Class | 143,722 |
Service Class 2 | 181,221 |
Service Class 2R | 1,286 |
Investor Class | 75,548 |
| $ 1,287,529 |
Accounting and Security Lending Fees. Fidelity Service Company, Inc. (FSC), an affiliate of FMR, maintains the Fund's accounting records. The accounting fee is based on the level of average net assets for the month. Under a separate contract, FSC administers the security lending program. The security lending fee is based on the number and duration of lending transactions.
Brokerage Commissions. The Fund placed a portion of its portfolio transactions with brokerage firms which are affiliates of the investment adviser. The commissions paid to these affiliated firms were $23,499 for the period.
Semiannual Report
7. Committed Line of Credit.
The Fund participates with other funds managed by FMR in a $3.75 billion credit facility (the "line of credit") to be utilized for temporary or emergency purposes to fund shareholder redemptions or for other short-term liquidity purposes. The Fund has agreed to pay commitment fees on its pro-rata portion of the line of credit, which amounted to $7,257 and is reflected in Miscellaneous expenses on the Statement of Operations. During the period, there were no borrowings on this line of credit.
8. Security Lending.
The Fund lends portfolio securities from time to time in order to earn additional income. On the settlement date of the loan, the Fund receives collateral (in the form of U.S. Treasury obligations, letters of credit and/or cash) against the loaned securities and maintains collateral in an amount not less than 100% of the market value of the loaned securities during the period of the loan. The market value of the loaned securities is determined at the close of business of the Fund and any additional required collateral is delivered to the Fund on the next business day. If the borrower defaults on its obligation to return the securities loaned because of insolvency or other reasons, a fund could experience delays and costs in recovering the securities loaned or in gaining access to the collateral. Any cash collateral received is invested in the Fidelity Securities Lending Cash Central Fund. The value of loaned securities and cash collateral at period end are disclosed on the Fund's Statement of Assets and Liabilities. Security lending income represents the income earned on investing cash collateral, less fees and expenses associated with the loan, plus any premium payments that may be received on the loan of certain types of securities. Security lending income is presented in the Statement of Operations as a component of income from Fidelity Central Funds. Net income from lending portfolio securities during the period amounted to $296,413.
9. Expense Reductions.
Many of the brokers with whom FMR places trades on behalf of the Fund provided services to the Fund in addition to trade execution. These services included payments of certain expenses on behalf of the Fund totaling $95,690 for the period. In addition, through arrangements with the Fund's custodian, credits realized as a result of uninvested cash balances were used to reduce the Fund's expenses. During the period, these credits reduced the Fund's custody expenses by $37.
10. Distributions to Shareholders.
Distributions to shareholders of each class were as follows:
| Six months ended
June 30, 2010 | Year ended
December 31, 2009 |
From net investment income | | |
Initial Class | $ - | $ 10,334,573 |
Service Class | - | 1,267,138 |
Service Class 2 | - | 932,585 |
Service Class 2R | - | 5,914 |
Investor Class | - | 284,920 |
Total | $ - | $ 12,825,130 |
From net realized gain | | |
Initial Class | $ 2,147,000 | $ 2,036,641 |
Service Class | 347,612 | 332,083 |
Service Class 2 | 434,679 | 414,242 |
Service Class 2R | 3,236 | 3,345 |
Investor Class | 79,399 | 74,905 |
Total | $ 3,011,926 | $ 2,861,216 |
Semiannual Report
Notes to Financial Statements (Unaudited) - continued
11. Share Transactions.
Transactions for each class of shares were as follows:
| Shares | Dollars |
| Six months ended June 30, 2010 | Year ended
December 31, 2009 | Six months ended June 30, 2010 | Year ended
December 31, 2009 |
Initial Class | | | | |
Shares sold | 1,654,014 | 3,168,252 | $ 51,485,327 | $ 80,283,755 |
Reinvestment of distributions | 75,892 | 426,627 | 2,147,000 | 12,371,214 |
Shares redeemed | (7,518,163) | (15,761,725) | (231,058,545) | (393,809,218) |
Net increase (decrease) | (5,788,257) | (12,166,846) | $ (177,426,218) | $ (301,154,249) |
Service Class | | | | |
Shares sold | 287,751 | 601,860 | $ 8,955,856 | $ 15,078,974 |
Reinvestment of distributions | 12,322 | 55,581 | 347,612 | 1,599,221 |
Shares redeemed | (1,340,437) | (3,433,675) | (40,997,487) | (86,029,416) |
Net increase (decrease) | (1,040,364) | (2,776,234) | $ (31,694,019) | $ (69,351,221) |
Service Class 2 | | | | |
Shares sold | 785,418 | 3,094,007 | $ 24,123,564 | $ 75,154,813 |
Reinvestment of distributions | 15,519 | 47,559 | 434,679 | 1,346,827 |
Shares redeemed | (2,192,411) | (4,562,964) | (66,621,414) | (113,322,366) |
Net increase (decrease) | (1,391,474) | (1,421,398) | $ (42,063,171) | $ (36,820,726) |
Service Class 2R | | | | |
Shares sold | 12,420 | 70,980 | $ 382,064 | $ 1,731,048 |
Reinvestment of distributions | 116 | 331 | 3,236 | 9,259 |
Shares redeemed | (35,929) | (65,400) | (1,096,877) | (1,732,958) |
Net increase (decrease) | (23,393) | 5,911 | $ (711,577) | $ 7,349 |
Investor Class | | | | |
Shares sold | 267,186 | 347,569 | $ 8,265,658 | $ 9,118,954 |
Reinvestment of distributions | 2,814 | 12,514 | 79,399 | 359,825 |
Shares redeemed | (360,248) | (1,151,644) | (10,961,138) | (27,787,913) |
Net increase (decrease) | (90,248) | (791,561) | $ (2,616,081) | $ (18,309,134) |
12. Other.
The Fund's organizational documents provide former and current trustees and officers with a limited indemnification against liabilities arising in connection with the performance of their duties to the Fund. In the normal course of business, the Fund may also enter into contracts that provide general indemnifications. The Fund's maximum exposure under these arrangements is unknown as this would be dependent on future claims that may be made against the Fund. The risk of material loss from such claims is considered remote.
At the end of the period, FMR or its affiliates were the owners of record of 15% of the total outstanding shares of the Fund and three otherwise unaffiliated shareholders were the owners of record of 45% of the total outstanding shares of the Fund.
Semiannual Report
Investment Adviser
Fidelity Management & Research Company
Boston, MA
Investment Sub-Adviser
FMR Co., Inc.
Fidelity Management & Research (U.K.) Inc.
Fidelity Management & Research (Hong Kong) Limited
Fidelity Management & Research (Japan) Inc.
Fidelity Research & Analysis Company
FIL Investment Advisors
FIL Investment Advisors (U.K.) Ltd.
FIL Investments (Japan) Limited
General Distributor
Fidelity Distributors Corporation
Boston, MA
Transfer and Service Agents
Fidelity Investments Institutional Operations Company, Inc.
Boston, MA
Fidelity Service Company, Inc.
Boston, MA
Custodian
The Bank of New York Mellon
New York, NY
VIPGRWTR-SANN-0810
1.833448.104
Fidelity® Variable Insurance Products:
High Income Portfolio
Semiannual Report
June 30, 2010
(2_fidelity_logos) (Registered_Trademark)
Contents
Shareholder Expense Example | <Click Here> | An example of shareholder expenses. |
Investment Changes | <Click Here> | A summary of major shifts in the fund's investments over the past six months. |
Investments | <Click Here> | A complete list of the fund's investments with their market values. |
Financial Statements | <Click Here> | Statements of assets and liabilities, operations, and changes in net assets, as well as financial highlights. |
Notes | <Click Here> | Notes to the financial statements. |
To view a fund's proxy voting guidelines and proxy voting record for the 12-month period ended June 30, visit http://www.fidelity.com/proxyvotingresults or visit the Securities and Exchange Commission's (SEC) web site at http://www.sec.gov. You may also call 1-877-208-0098 to request a free copy of the proxy voting guidelines.
Fidelity Variable Insurance Products are separate account options which are purchased through a variable insurance contract.
Standard & Poor's, S&P and S&P 500 are registered service marks of The McGraw-Hill Companies, Inc. and have been licensed for use by Fidelity Distributors Corporation.
Other third party marks appearing herein are the property of their respective owners.
All other marks appearing herein are registered or unregistered trademarks or service marks of FMR LLC or an affiliated company.
This report and the financial statements contained herein are submitted for the general information of the shareholders of the fund. This report is not authorized for distribution to prospective investors in the fund unless preceded or accompanied by an effective prospectus.
A fund files its complete schedule of portfolio holdings with the SEC for the first and third quarters of each fiscal year on Form N-Q. Forms N-Q are available on the SEC's web site at http://www.sec.gov. A fund's Forms N-Q may be reviewed and copied at the SEC's Public Reference Room in Washington, DC. Information regarding the operation of the SEC's Public Reference Room may be obtained by calling 1-800-SEC-0330. For a complete list of a fund's portfolio holdings, view the most recent holdings listing, semiannual report, or annual report on Fidelity's web site at http://www.fidelity.com or http://www.advisor.fidelity.com, as applicable.
NOT FDIC INSURED • MAY LOSE VALUE • NO BANK GUARANTEE
Neither the fund nor Fidelity Distributors Corporation is a bank.
Semiannual Report
Shareholder Expense Example
As a shareholder of the Fund, you incur two types of costs: (1) transaction costs, including redemption fees, and (2) ongoing costs, including management fees, distribution and/or service (12b-1) fees and other Fund expenses. This Example is intended to help you understand your ongoing costs (in dollars) of investing in the Fund and to compare these costs with the ongoing costs of investing in other mutual funds.
The Example is based on an investment of $1,000 invested at the beginning of the period and held for the entire period (January 1, 2010 to June 30, 2010).
Actual Expenses
The first line of the accompanying table for each class of the Fund provides information about actual account values and actual expenses. You may use the information in this line, together with the amount you invested, to estimate the expenses that you paid over the period. Simply divide your account value by $1,000.00 (for example, an $8,600 account value divided by $1,000.00 = 8.6), then multiply the result by the number in the first line for a class of the Fund under the heading entitled "Expenses Paid During Period" to estimate the expenses you paid on your account during this period. The estimate of expenses does not include any fees or other expenses of any variable annuity or variable life insurance product. If they were, the estimate of expenses you paid during the period would be higher, and your ending account value would be lower. In addition, the Fund, as a shareholder in the underlying Fidelity Central Funds, will indirectly bear its pro-rata share of the fees and expenses incurred by the underlying Fidelity Central Funds. These fees and expenses are not included in the Fund's annualized expense ratio used to calculate the expense estimate in the table below.
Hypothetical Example for Comparison Purposes
The second line of the accompanying table for each class of the Fund provides information about hypothetical account values and hypothetical expenses based on a Class' actual expense ratio and an assumed rate of return of 5% per year before expenses, which is not the Class' actual return. The hypothetical account values and expenses may not be used to estimate the actual ending account balance or expenses you paid for the period. You may use this information to compare the ongoing costs of investing in the Fund and other funds. To do so, compare this 5% hypothetical example with the 5% hypothetical examples that appear in the shareholder reports of the other funds. The estimate of expenses does not include any fees or other expenses of any variable annuity or variable life insurance product. If they were, the estimate of expenses you paid during the period would be higher, and your ending account value would be lower. In addition, the Fund, as a shareholder in the underlying Fidelity Central Funds, will indirectly bear its pro-rata share of the fees and expenses incurred by the underlying Fidelity Central Funds. These fees and expenses are not included in the Fund's annualized expense ratio used to calculate the expense estimate in the table below.
Please note that the expenses shown in the table are meant to highlight your ongoing costs only and do not reflect any transaction costs. Therefore, the second line of the table is useful in comparing ongoing costs only, and will not help you determine the relative total costs of owning different funds. In addition, if these transactional costs were included, your costs would have been higher.
| Annualized
Expense Ratio | Beginning
Account Value
January 1, 2010 | Ending
Account Value
June 30, 2010 | Expenses Paid
During Period*
January 1, 2010 to
June 30, 2010 |
Initial Class | .70% | | | |
Actual | | $ 1,000.00 | $ 1,034.00 | $ 3.53 |
HypotheticalA | | $ 1,000.00 | $ 1,021.32 | $ 3.51 |
Service Class | .80% | | | |
Actual | | $ 1,000.00 | $ 1,034.20 | $ 4.03 |
HypotheticalA | | $ 1,000.00 | $ 1,020.83 | $ 4.01 |
Service Class 2 | .95% | | | |
Actual | | $ 1,000.00 | $ 1,032.80 | $ 4.79 |
HypotheticalA | | $ 1,000.00 | $ 1,020.08 | $ 4.76 |
Initial Class R | .70% | | | |
Actual | | $ 1,000.00 | $ 1,034.20 | $ 3.53 |
HypotheticalA | | $ 1,000.00 | $ 1,021.32 | $ 3.51 |
Service Class R | .80% | | | |
Actual | | $ 1,000.00 | $ 1,032.40 | $ 4.03 |
HypotheticalA | | $ 1,000.00 | $ 1,020.83 | $ 4.01 |
Service Class 2R | .95% | | | |
Actual | | $ 1,000.00 | $ 1,034.80 | $ 4.79 |
HypotheticalA | | $ 1,000.00 | $ 1,020.08 | $ 4.76 |
Investor Class | .73% | | | |
Actual | | $ 1,000.00 | $ 1,034.20 | $ 3.68 |
HypotheticalA | | $ 1,000.00 | $ 1,021.17 | $ 3.66 |
A 5% return per year before expenses
* Expenses are equal to each Class' annualized expense ratio, multiplied by the average account value over the period, multiplied by 181/365 (to reflect the one-half year period).
Semiannual Report
Investment Changes (Unaudited)
Top Five Holdings as of June 30, 2010 |
(by issuer, excluding cash equivalents) | % of fund's
net assets | % of fund's net assets
6 months ago |
HCA, Inc. | 2.5 | 2.8 |
Nielsen Finance LLC/Nielsen Finance Co. | 2.0 | 1.9 |
Ship Finance International Ltd. | 1.9 | 1.8 |
Nextel Communications, Inc. | 1.5 | 1.3 |
International Lease Finance Corp. | 1.4 | 0.2 |
| 9.3 | |
Top Five Market Sectors as of June 30, 2010 |
| % of fund's
net assets | % of fund's net assets
6 months ago |
Telecommunications | 15.0 | 14.3 |
Energy | 7.8 | 7.8 |
Healthcare | 7.0 | 7.6 |
Diversified Financial Services | 6.5 | 1.2 |
Electric Utilities | 6.2 | 8.2 |
Quality Diversification (% of fund's net assets) |
As of June 30, 2010 | As of December 31, 2009 |
 | AAA,AA,A 0.0% | | | AAA,AA,A 0.4% | |
 | BBB 2.2% | | | BBB 2.2% | |
 | BB 28.5% | | | BB 30.8% | |
 | B 46.7% | | | B 39.0% | |
 | CCC,CC,C 14.8% | | | CCC,CC,C 21.5% | |
 | Not Rated 2.7% | | | Not Rated 2.3% | |
 | Equities 0.5% | | | Equities 0.3% | |
 | Short-Term
Investments and
Net Other Assets 4.6% | | | Short-Term
Investments and
Net Other Assets 3.5% | |

We have used ratings from Moody's® Investors Service, Inc. Where Moody's ratings are not available, we have used S&P® ratings. All ratings are as of the report date and do not reflect subsequent downgrades. |
Asset Allocation (% of fund's net assets) |
As of June 30, 2010 * | As of December 31, 2009 ** |
| Nonconvertible Bonds 88.4% | | | Nonconvertible Bonds 88.8% | |
| Convertible Bonds,
Preferred Stocks 0.9% | | | Convertible Bonds,
Preferred Stocks 0.7% | |
| Common Stocks 0.1% | | | Common Stocks 0.1% | |
| Floating Rate Loans 6.0% | | | Floating Rate Loans 6.9% | |
| Short-Term
Investments and
Net Other Assets 4.6% | | | Short-Term
Investments and
Net Other Assets 3.5% | |
* Foreign investments | 17.2% | | ** Foreign investments | 15.9% | |
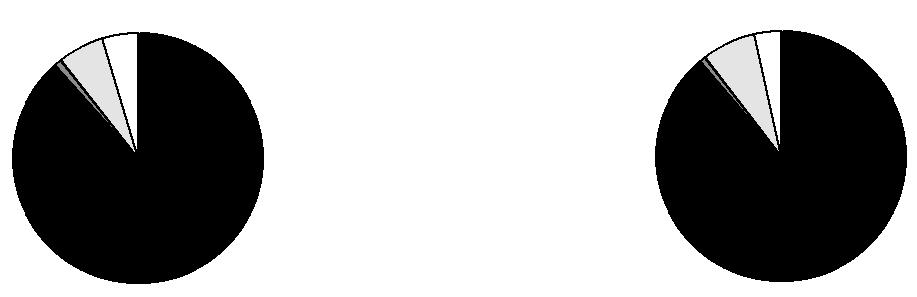
Semiannual Report
Investments June 30, 2010 (Unaudited)
Showing Percentage of Net Assets
Corporate Bonds - 88.9% |
| Principal Amount | | Value |
Convertible Bonds - 0.5% |
Energy - 0.1% |
Energy Conversion Devices, Inc. 3% 6/15/13 | | $ 1,040,000 | | $ 577,200 |
Metals/Mining - 0.2% |
Massey Energy Co. 3.25% 8/1/15 | | 2,230,000 | | 1,839,750 |
Technology - 0.2% |
Lucent Technologies, Inc. 2.875% 6/15/25 | | 2,902,600 | | 2,436,370 |
TOTAL CONVERTIBLE BONDS | | 4,853,320 |
Nonconvertible Bonds - 88.4% |
Aerospace - 0.9% |
BE Aerospace, Inc. 8.5% 7/1/18 | | 3,730,000 | | 3,916,500 |
Sequa Corp.: | | | | |
11.75% 12/1/15 (c) | | 3,750,000 | | 3,693,750 |
13.5% 12/1/15 pay-in-kind (c) | | 1,345,605 | | 1,365,789 |
| | 8,976,039 |
Air Transportation - 2.7% |
American Airlines, Inc. 10.5% 10/15/12 (c) | | 1,990,000 | | 2,079,550 |
American Airlines, Inc. pass-thru trust certificates: | | | | |
6.977% 11/23/22 | | 475,729 | | 390,098 |
8.608% 10/1/12 | | 535,000 | | 516,275 |
10.375% 7/2/19 | | 1,876,983 | | 2,092,836 |
AMR Corp. 9% 8/1/12 | | 1,980,000 | | 1,732,500 |
Continental Airlines, Inc. pass-thru trust certificates: | | | | |
7.875% 7/2/18 | | 550,465 | | 489,913 |
8.388% 5/1/22 | | 387,913 | | 360,759 |
9.798% 4/1/21 | | 6,093,647 | | 5,667,092 |
Continental Airlines, Inc. 9.25% 5/10/17 | | 1,075,000 | | 1,107,250 |
Delta Air Lines, Inc. 9.5% 9/15/14 (c) | | 1,690,000 | | 1,782,950 |
Delta Air Lines, Inc. pass-thru trust certificates: | | | | |
8.021% 8/10/22 | | 2,213,341 | | 2,124,808 |
8.954% 8/10/14 | | 1,922,152 | | 1,893,319 |
Northwest Airlines, Inc. pass-thru trust certificates 8.028% 11/1/17 | | 918,557 | | 808,330 |
United Air Lines, Inc.: | | | | |
9.875% 8/1/13 (c) | | 795,000 | | 822,030 |
12% 11/1/13 (c) | | 1,005,000 | | 1,052,738 |
United Air Lines, Inc. pass-thru trust certificates: | | | | |
Class B, 7.336% 7/2/19 | | 2,821,893 | | 2,342,171 |
9.75% 1/15/17 | | 2,445,000 | | 2,597,813 |
12% 1/15/16 (c) | | 875,000 | | 916,563 |
| | 28,776,995 |
|
| Principal Amount | | Value |
Automotive - 2.8% |
ArvinMeritor, Inc.: | | | | |
8.125% 9/15/15 | | $ 3,250,000 | | $ 3,120,000 |
10.625% 3/15/18 | | 710,000 | | 747,275 |
Ford Motor Credit Co. LLC: | | | | |
7% 4/15/15 | | 3,380,000 | | 3,363,100 |
8% 6/1/14 | | 1,840,000 | | 1,890,600 |
8% 12/15/16 | | 4,870,000 | | 4,982,502 |
12% 5/15/15 | | 3,495,000 | | 4,027,988 |
General Motors Acceptance Corp. 6.875% 8/28/12 | | 4,155,000 | | 4,144,613 |
Lear Corp. 7.875% 3/15/18 | | 2,850,000 | | 2,842,875 |
Navistar International Corp. 8.25% 11/1/21 | | 4,720,000 | | 4,779,000 |
| | 29,897,953 |
Banks and Thrifts - 3.1% |
Bank of America Corp.: | | | | |
8% (d) | | 995,000 | | 962,663 |
8.125% (d) | | 2,985,000 | | 2,902,913 |
CIT Group, Inc.: | | | | |
7% 5/1/13 | | 372,017 | | 357,136 |
7% 5/1/14 | | 3,723,026 | | 3,481,029 |
7% 5/1/15 | | 1,548,026 | | 1,420,314 |
7% 5/1/16 | | 3,540,044 | | 3,212,590 |
7% 5/1/17 | | 5,417,062 | | 4,888,898 |
Fifth Third Capital Trust IV 6.5% 4/15/67 (d) | | 5,245,000 | | 4,327,125 |
GMAC LLC: | | | | |
6.75% 12/1/14 | | 4,400,000 | | 4,268,000 |
8% 12/31/18 | | 1,220,000 | | 1,128,500 |
8% 11/1/31 | | 2,275,000 | | 2,104,375 |
Zions Bancorp. 7.75% 9/23/14 | | 3,225,000 | | 3,287,372 |
| | 32,340,915 |
Broadcasting - 1.8% |
Belo Corp. 8% 11/15/16 | | 1,700,000 | | 1,759,500 |
Clear Channel Communications, Inc.: | | | | |
5.5% 9/15/14 | | 3,360,000 | | 1,848,000 |
11.75% 8/1/16 pay-in-kind (d) | | 2,190,000 | | 1,381,981 |
Clear Channel Worldwide Holdings, Inc.: | | | | |
Series A 9.25% 12/15/17 (c) | | 560,000 | | 557,200 |
Series B 9.25% 12/15/17 (c) | | 3,780,000 | | 3,798,900 |
Nexstar Broadcasting, Inc./Mission, Inc. 8.875% 4/15/17 (c) | | 2,390,000 | | 2,366,100 |
Umbrella Acquisition, Inc. 10.5% 3/15/15 pay-in-kind (c)(d) | | 6,904,400 | | 5,530,424 |
Univision Communications, Inc. 12% 7/1/14 (c) | | 1,975,000 | | 2,118,188 |
| | 19,360,293 |
Corporate Bonds - continued |
| Principal Amount | | Value |
Nonconvertible Bonds - continued |
Cable TV - 4.0% |
Cablevision Systems Corp.: | | | | |
7.75% 4/15/18 | | $ 1,635,000 | | $ 1,635,000 |
8% 4/15/20 | | 1,635,000 | | 1,659,525 |
8.625% 9/15/17 (c) | | 2,525,000 | | 2,550,250 |
CCO Holdings LLC/CCO Holdings Capital Corp.: | | | | |
7.875% 4/30/18 (c) | | 985,000 | | 987,463 |
8.125% 4/30/20 (c) | | 2,345,000 | | 2,374,313 |
Cequel Communications Holdings I LLC/Cequel Capital Corp. 8.625% 11/15/17 (c) | | 7,435,000 | | 7,407,119 |
Charter Communications Holdings II LLC/Charter Communications Holdings II Capital Corp. 13.5% 11/30/16 | | 2,137,796 | | 2,498,549 |
CSC Holdings LLC: | | | | |
8.5% 4/15/14 | | 2,370,000 | | 2,476,650 |
8.5% 6/15/15 | | 3,680,000 | | 3,799,600 |
8.625% 2/15/19 | | 1,940,000 | | 2,039,328 |
EchoStar Communications Corp. 7.125% 2/1/16 | | 1,280,000 | | 1,286,400 |
Insight Communications, Inc. 9.375% 7/15/18 (c) | | 2,660,000 | | 2,660,000 |
Kabel Deutschland GmbH 10.625% 7/1/14 | | 5,050,000 | | 5,214,125 |
UPC Germany GmbH 8.125% 12/1/17 (c) | | 2,880,000 | | 2,822,400 |
Videotron Ltd. 9.125% 4/15/18 | | 2,010,000 | | 2,185,875 |
| | 41,596,597 |
Capital Goods - 1.1% |
Amsted Industries, Inc. 8.125% 3/15/18 (c) | | 2,840,000 | | 2,811,600 |
Coleman Cable, Inc. 9% 2/15/18 (c) | | 2,815,000 | | 2,744,625 |
RBS Global, Inc. / Rexnord Corp.: | | | | |
8.5% 5/1/18 (c) | | 3,480,000 | | 3,366,900 |
11.75% 8/1/16 | | 2,145,000 | | 2,252,250 |
| | 11,175,375 |
Chemicals - 2.3% |
Huntsman International LLC: | | | | |
5.5% 6/30/16 (c) | | 3,245,000 | | 2,855,600 |
7.875% 11/15/14 | | 490,000 | | 474,075 |
LBI Escrow Corp. 8% 11/1/17 (c) | | 4,300,000 | | 4,418,250 |
Lyondell Chemical Co. 11% 5/1/18 | | 4,945,000 | | 5,303,513 |
NOVA Chemicals Corp.: | | | | |
3.7476% 11/15/13 (d) | | 5,325,000 | | 4,899,000 |
6.5% 1/15/12 | | 2,320,000 | | 2,331,600 |
8.375% 11/1/16 | | 1,990,000 | | 1,990,000 |
8.625% 11/1/19 | | 1,985,000 | | 1,985,000 |
| | 24,257,038 |
|
| Principal Amount | | Value |
Consumer Products - 0.5% |
ACCO Brands Corp. 10.625% 3/15/15 | | $ 2,030,000 | | $ 2,172,100 |
Jostens Holding Corp. 10.25% 12/1/13 | | 3,050,000 | | 3,114,813 |
| | 5,286,913 |
Containers - 1.5% |
Berry Plastics Corp.: | | | | |
5.0528% 2/15/15 (d) | | 1,980,000 | | 1,881,000 |
8.25% 11/15/15 | | 3,880,000 | | 3,880,000 |
8.875% 9/15/14 | | 2,490,000 | | 2,390,400 |
9.5% 5/15/18 (c) | | 4,465,000 | | 4,063,150 |
Crown Cork & Seal, Inc. 7.375% 12/15/26 | | 3,648,000 | | 3,319,680 |
| | 15,534,230 |
Diversified Financial Services - 5.1% |
GMAC, Inc. 8% 3/15/20 (c) | | 6,215,000 | | 6,137,313 |
Icahn Enterprises LP/Icahn Enterprises Finance Corp.: | | | | |
7.75% 1/15/16 (c) | | 4,405,000 | | 4,272,850 |
8% 1/15/18 (c) | | 3,995,000 | | 3,875,150 |
ILFC E-Capital Trust II 6.25% 12/21/65 (c)(d) | | 1,275,000 | | 816,000 |
Ineos Finance PLC 9% 5/15/15 (c) | | 2,505,000 | | 2,495,606 |
International Lease Finance Corp.: | | | | |
5.625% 9/20/13 | | 1,530,000 | | 1,380,825 |
5.65% 6/1/14 | | 1,315,000 | | 1,167,063 |
6.375% 3/25/13 | | 360,000 | | 337,500 |
6.625% 11/15/13 | | 1,640,000 | | 1,508,800 |
8.625% 9/15/15 (c) | | 3,090,000 | | 2,920,050 |
8.75% 3/15/17 (c) | | 6,100,000 | | 5,734,000 |
MU Finance PLC 8.375% 2/1/17 (c) | | 2,755,000 | | 2,644,800 |
National Money Mart Co. 10.375% 12/15/16 (c) | | 3,010,000 | | 3,055,150 |
Nuveen Investments, Inc.: | | | | |
5.5% 9/15/15 | | 1,025,000 | | 707,250 |
10.5% 11/15/15 | | 1,025,000 | | 896,875 |
Penson Worldwide, Inc. 12.5% 5/15/17 (c) | | 1,245,000 | | 1,241,888 |
Reliance Intermediate Holdings LP 9.5% 12/15/19 (c) | | 3,055,000 | | 3,177,200 |
SLM Corp. 8% 3/25/20 | | 5,650,000 | | 4,965,887 |
Sprint Capital Corp. 8.75% 3/15/32 | | 3,345,000 | | 3,194,475 |
Trans Union LLC/Trans Union Financing Corp. 11.375% 6/15/18 (c) | | 3,225,000 | | 3,365,933 |
| | 53,894,615 |
Diversified Media - 3.6% |
Affinion Group, Inc. 11.5% 10/15/15 | | 5,340,000 | | 5,607,000 |
Catalina Marketing Corp. 10.5% 10/1/15 pay-in-kind (c)(d) | | 2,200,000 | | 2,271,500 |
Corporate Bonds - continued |
| Principal Amount | | Value |
Nonconvertible Bonds - continued |
Diversified Media - continued |
Interpublic Group of Companies, Inc.: | | | | |
6.25% 11/15/14 | | $ 490,000 | | $ 480,200 |
10% 7/15/17 | | 1,120,000 | | 1,234,800 |
Liberty Media Corp. 8.25% 2/1/30 | | 255,000 | | 234,600 |
Nielsen Finance LLC/Nielsen Finance Co.: | | | | |
0% 8/1/16 (b) | | 8,345,000 | | 7,865,163 |
10% 8/1/14 | | 5,140,000 | | 5,281,350 |
11.5% 5/1/16 | | 2,275,000 | | 2,491,125 |
11.625% 2/1/14 | | 4,320,000 | | 4,730,400 |
Quebecor Media, Inc.: | | | | |
7.75% 3/15/16 | | 3,905,000 | | 3,826,900 |
7.75% 3/15/16 | | 3,585,000 | | 3,513,300 |
| | 37,536,338 |
Electric Utilities - 5.0% |
AES Corp.: | | | | |
7.75% 3/1/14 | | 905,000 | | 916,313 |
7.75% 10/15/15 | | 3,745,000 | | 3,791,813 |
8% 10/15/17 | | 2,060,000 | | 2,070,300 |
9.75% 4/15/16 (c) | | 3,010,000 | | 3,235,750 |
Calpine Construction Finance Co. LP 8% 6/1/16 (c) | | 5,775,000 | | 5,890,500 |
Dynegy Holdings, Inc. 7.5% 6/1/15 (c) | | 3,190,000 | | 2,508,138 |
Intergen NV 9% 6/30/17 (c) | | 3,755,000 | | 3,736,225 |
Mirant Americas Generation LLC: | | | | |
8.5% 10/1/21 | | 5,990,000 | | 5,510,800 |
9.125% 5/1/31 | | 4,630,000 | | 4,259,600 |
NRG Energy, Inc. 7.375% 2/1/16 | | 3,710,000 | | 3,682,175 |
NSG Holdings II, LLC 7.75% 12/15/25 (c) | | 9,620,000 | | 8,465,600 |
Otter Tail Corp. 9% 12/15/16 | | 2,460,000 | | 2,632,200 |
RRI Energy, Inc. 7.625% 6/15/14 | | 6,280,000 | | 6,185,800 |
| | 52,885,214 |
Energy - 7.7% |
Anadarko Petroleum Corp.: | | | | |
5.95% 9/15/16 | | 2,110,000 | | 1,816,974 |
6.95% 6/15/19 | | 990,000 | | 864,855 |
Antero Resources Finance Corp. 9.375% 12/1/17 (c) | | 3,240,000 | | 3,240,000 |
Atlas Pipeline Partners LP 8.125% 12/15/15 | | 360,000 | | 331,200 |
Compagnie Generale de Geophysique SA: | | | | |
7.5% 5/15/15 | | 430,000 | | 408,500 |
7.75% 5/15/17 | | 890,000 | | 845,500 |
9.5% 5/15/16 | | 1,225,000 | | 1,237,250 |
Crosstex Energy/Crosstex Energy Finance Corp. 8.875% 2/15/18 | | 3,745,000 | | 3,745,000 |
|
| Principal Amount | | Value |
Denbury Resources, Inc. 9.75% 3/1/16 | | $ 3,675,000 | | $ 3,941,438 |
Drummond Co., Inc. 7.375% 2/15/16 | | 5,510,000 | | 5,289,600 |
Forest Oil Corp. 8.5% 2/15/14 | | 4,380,000 | | 4,566,150 |
Frontier Oil Corp. 8.5% 9/15/16 | | 2,700,000 | | 2,733,750 |
Hercules Offshore, Inc. 10.5% 10/15/17 (c) | | 1,990,000 | | 1,766,125 |
LINN Energy LLC 8.625% 4/15/20 (c) | | 3,055,000 | | 3,127,556 |
OPTI Canada, Inc.: | | | | |
8.25% 12/15/14 | | 3,920,000 | | 3,430,000 |
9% 12/15/12 (c) | | 1,710,000 | | 1,727,100 |
Pan American Energy LLC 7.875% 5/7/21 (c) | | 4,125,000 | | 4,083,750 |
Parker Drilling Co. 9.125% 4/1/18 (c) | | 2,605,000 | | 2,448,700 |
Petrohawk Energy Corp.: | | | | |
7.875% 6/1/15 | | 770,000 | | 771,925 |
9.125% 7/15/13 | | 5,320,000 | | 5,572,700 |
10.5% 8/1/14 | | 725,000 | | 779,375 |
Petroleum Development Corp. 12% 2/15/18 | | 2,810,000 | | 2,901,325 |
Pioneer Natural Resources Co.: | | | | |
6.65% 3/15/17 | | 3,365,000 | | 3,365,000 |
7.5% 1/15/20 | | 3,360,000 | | 3,460,800 |
Plains Exploration & Production Co.: | | | | |
7% 3/15/17 | | 4,230,000 | | 4,029,075 |
7.625% 6/1/18 | | 1,535,000 | | 1,506,142 |
10% 3/1/16 | | 3,207,000 | | 3,399,420 |
Quicksilver Resources, Inc.: | | | | |
7.125% 4/1/16 | | 4,920,000 | | 4,514,100 |
9.125% 8/15/19 | | 2,080,000 | | 2,100,800 |
11.75% 1/1/16 | | 2,250,000 | | 2,486,250 |
| | 80,490,360 |
Entertainment/Film - 0.3% |
MCE Finance Ltd. 10.25% 5/15/18 (c) | | 3,125,000 | | 3,281,250 |
Food and Drug Retail - 0.7% |
Albertsons, Inc. 7.75% 6/15/26 | | 435,000 | | 361,050 |
SUPERVALU, Inc. 8% 5/1/16 | | 2,500,000 | | 2,468,750 |
The Great Atlantic & Pacific Tea Co. 11.375% 8/1/15 (c) | | 3,365,000 | | 2,767,713 |
Tops Markets LLC 10.125% 10/15/15 (c) | | 1,870,000 | | 1,926,100 |
| | 7,523,613 |
Food/Beverage/Tobacco - 0.1% |
C&S Group Enterprises LLC 8.375% 5/1/17 (c) | | 735,000 | | 711,113 |
Gaming - 2.3% |
Chukchansi Economic Development Authority: | | | | |
4.1226% 11/15/12 (c)(d) | | 1,010,000 | | 666,600 |
Corporate Bonds - continued |
| Principal Amount | | Value |
Nonconvertible Bonds - continued |
Gaming - continued |
Chukchansi Economic Development Authority: - continued | | | | |
8% 11/15/13 (c) | | $ 3,410,000 | | $ 2,387,000 |
Las Vegas Sands Corp. 6.375% 2/15/15 | | 1,295,000 | | 1,243,200 |
MGM Mirage, Inc.: | | | | |
6.625% 7/15/15 | | 1,600,000 | | 1,248,000 |
7.5% 6/1/16 | | 400,000 | | 316,000 |
Scientific Games Corp.: | | | | |
7.875% 6/15/16 (c) | | 5,230,000 | | 5,151,550 |
9.25% 6/15/19 | | 1,920,000 | | 1,968,000 |
Seneca Gaming Corp.: | | | | |
Series B, 7.25% 5/1/12 | | 5,205,000 | | 5,087,888 |
7.25% 5/1/12 | | 2,075,000 | | 2,028,313 |
Snoqualmie Entertainment Authority: | | | | |
4.1356% 2/1/14 (c)(d) | | 3,525,000 | | 2,811,188 |
9.125% 2/1/15 (c) | | 1,290,000 | | 1,080,375 |
| | 23,988,114 |
Healthcare - 7.0% |
Apria Healthcare Group, Inc.: | | | | |
11.25% 11/1/14 (c) | | 1,830,000 | | 1,944,375 |
12.375% 11/1/14 (c) | | 1,000,000 | | 1,067,500 |
Biomet, Inc. 10.375% 10/15/17 pay-in-kind (d) | | 995,000 | | 1,069,625 |
DJO Finance LLC / DJO Finance Corp. 10.875% 11/15/14 | | 8,375,000 | | 8,730,938 |
HCA, Inc.: | | | | |
8.5% 4/15/19 | | 2,125,000 | | 2,241,875 |
9.125% 11/15/14 | | 6,670,000 | | 6,953,475 |
9.25% 11/15/16 | | 8,519,000 | | 8,987,545 |
9.625% 11/15/16 pay-in-kind (d) | | 5,401,000 | | 5,725,060 |
9.875% 2/15/17 | | 1,610,000 | | 1,710,625 |
Inverness Medical Innovations, Inc.: | | | | |
7.875% 2/1/16 | | 1,830,000 | | 1,788,825 |
9% 5/15/16 | | 2,875,000 | | 2,882,188 |
Mylan, Inc. 7.625% 7/15/17 (c) | | 1,255,000 | | 1,289,513 |
Omega Healthcare Investors, Inc.: | | | | |
7% 4/1/14 | | 9,235,000 | | 9,211,913 |
7% 1/15/16 | | 1,665,000 | | 1,644,188 |
Psychiatric Solutions, Inc. 7.75% 7/15/15 | | 435,000 | | 438,263 |
Senior Housing Properties Trust 6.75% 4/15/20 | | 2,640,000 | | 2,607,000 |
Valeant Pharmaceuticals International: | | | | |
7.625% 3/15/20 (c) | | 1,955,000 | | 2,306,900 |
8.375% 6/15/16 | | 485,000 | | 557,750 |
|
| Principal Amount | | Value |
Vanguard Health Holding Co. II LLC/Vanguard Health Holding Co. II, Inc.: | | | | |
8% 2/1/18 | | $ 5,045,000 | | $ 4,868,425 |
8% 2/1/18 (c) | | 2,690,000 | | 2,595,850 |
Ventas Realty LP: | | | | |
6.5% 6/1/16 | | 1,200,000 | | 1,203,000 |
6.5% 6/1/16 | | 460,000 | | 461,150 |
6.625% 10/15/14 | | 2,835,000 | | 2,877,525 |
| | 73,163,508 |
Homebuilding/Real Estate - 0.8% |
KB Home 7.25% 6/15/18 | | 2,965,000 | | 2,631,438 |
Lennar Corp. 12.25% 6/1/17 | | 1,650,000 | | 1,864,500 |
Standard Pacific Corp.: | | | | |
7% 8/15/15 | | 1,070,000 | | 984,400 |
8.375% 5/15/18 | | 995,000 | | 947,738 |
10.75% 9/15/16 | | 2,405,000 | | 2,525,250 |
| | 8,953,326 |
Hotels - 0.9% |
Host Hotels & Resorts LP 9% 5/15/17 | | 2,195,000 | | 2,326,700 |
Host Marriott LP 7.125% 11/1/13 | | 6,900,000 | | 6,934,500 |
| | 9,261,200 |
Leisure - 2.6% |
Equinox Holdings, Inc. 9.5% 2/1/16 (c) | | 3,080,000 | | 3,045,350 |
GWR Operating Partnership LLP 10.875% 4/1/17 (c) | | 1,865,000 | | 1,846,350 |
NCL Corp. Ltd. 11.75% 11/15/16 | | 1,490,000 | | 1,579,400 |
Royal Caribbean Cruises Ltd.: | | | | |
7.25% 3/15/18 | | 1,815,000 | | 1,746,938 |
11.875% 7/15/15 | | 1,440,000 | | 1,652,400 |
yankee: | | | | |
7% 6/15/13 | | 3,985,000 | | 3,965,075 |
7.25% 6/15/16 | | 6,940,000 | | 6,801,200 |
7.5% 10/15/27 | | 1,400,000 | | 1,226,680 |
Town Sports International Holdings, Inc. 11% 2/1/14 | | 1,772,000 | | 1,612,520 |
Universal City Development Partners Ltd./UCDP Finance, Inc.: | | | | |
8.875% 11/15/15 (c) | | 1,245,000 | | 1,251,225 |
10.875% 11/15/16 (c) | | 2,130,000 | | 2,204,550 |
| | 26,931,688 |
Metals/Mining - 1.9% |
Arch Coal, Inc. 8.75% 8/1/16 (c) | | 1,035,000 | | 1,077,746 |
CONSOL Energy, Inc.: | | | | |
8% 4/1/17 (c) | | 2,640,000 | | 2,732,400 |
8.25% 4/1/20 (c) | | 1,760,000 | | 1,839,200 |
Drummond Co., Inc. 9% 10/15/14 (c) | | 830,000 | | 842,450 |
FMG Finance Property Ltd. 10% 9/1/13 (c) | | 3,100,000 | | 3,270,500 |
Corporate Bonds - continued |
| Principal Amount | | Value |
Nonconvertible Bonds - continued |
Metals/Mining - continued |
Massey Energy Co. 6.875% 12/15/13 | | $ 5,595,000 | | $ 5,462,119 |
Severstal Columbus LLC 10.25% 2/15/18 (c) | | 4,340,000 | | 4,383,400 |
| | 19,607,815 |
Paper - 1.0% |
Boise Paper LLC/Boise Co-Issuer Co. 8% 4/1/20 (c) | | 2,790,000 | | 2,741,175 |
Domtar Corp.: | | | | |
7.125% 8/15/15 | | 357,000 | | 374,850 |
10.75% 6/1/17 | | 2,305,000 | | 2,760,238 |
Rock-Tenn Co. 9.25% 3/15/16 | | 420,000 | | 445,200 |
Verso Paper Holdings LLC/Verso Paper, Inc.: | | | | |
9.125% 8/1/14 | | 1,495,000 | | 1,420,250 |
11.5% 7/1/14 | | 2,615,000 | | 2,804,588 |
| | 10,546,301 |
Services - 3.3% |
ARAMARK Corp.: | | | | |
3.8466% 2/1/15 (d) | | 7,820,000 | | 7,194,400 |
8.5% 2/1/15 | | 3,080,000 | | 3,118,500 |
Avis Budget Car Rental LLC/Avis Budget Finance, Inc.: | | | | |
7.625% 5/15/14 | | 2,750,000 | | 2,640,000 |
7.75% 5/15/16 | | 3,195,000 | | 3,003,300 |
9.625% 3/15/18 (c) | | 825,000 | | 833,250 |
FTI Consulting, Inc. 7.625% 6/15/13 | | 1,960,000 | | 1,940,400 |
Hertz Corp.: | | | | |
8.875% 1/1/14 | | 3,460,000 | | 3,494,600 |
10.5% 1/1/16 | | 2,085,000 | | 2,163,188 |
McJunkin Red Man Corp. 9.5% 12/15/16 (c) | | 5,700,000 | | 5,429,250 |
Rural/Metro Corp. 12.75% 3/15/16 | | 1,770,000 | | 1,876,200 |
ServiceMaster Co. 10.75% 7/15/15 pay-in-kind (c)(d) | | 3,000,000 | | 3,075,000 |
| | 34,768,088 |
Shipping - 2.9% |
Navios Maritime Holdings, Inc.: | | | | |
8.875% 11/1/17 (c) | | 2,255,000 | | 2,266,275 |
9.5% 12/15/14 | | 4,737,000 | | 4,547,520 |
Overseas Shipholding Group, Inc.: | | | | |
7.5% 2/15/24 | | 475,000 | | 408,500 |
8.125% 3/30/18 | | 2,895,000 | | 2,847,956 |
Ship Finance International Ltd. 8.5% 12/15/13 | | 20,075,000 | | 19,673,473 |
Western Express, Inc. 12.5% 4/15/15 (c) | | 1,025,000 | | 940,438 |
| | 30,684,162 |
|
| Principal Amount | | Value |
Steels - 1.7% |
Algoma Acquisition Corp. 9.875% 6/15/15 (c) | | $ 3,210,000 | | $ 2,728,500 |
Edgen Murray Corp. 12.25% 1/15/15 (c) | | 5,015,000 | | 4,237,675 |
Essar Steel Algoma, Inc. 9.375% 3/15/15 (c) | | 3,155,000 | | 2,997,250 |
Steel Dynamics, Inc.: | | | | |
6.75% 4/1/15 | | 5,775,000 | | 5,652,570 |
7.625% 3/15/20 (c) | | 450,000 | | 442,125 |
Tube City IMS Corp. 9.75% 2/1/15 | | 1,695,000 | | 1,639,913 |
| | 17,698,033 |
Super Retail - 1.3% |
AutoNation, Inc. 6.75% 4/15/18 | | 2,325,000 | | 2,295,938 |
Intcomex, Inc. 13.25% 12/15/14 (c) | | 2,550,000 | | 2,652,000 |
Netflix, Inc. 8.5% 11/15/17 | | 2,140,000 | | 2,228,168 |
QVC, Inc. 7.125% 4/15/17 (c) | | 1,470,000 | | 1,462,650 |
Sonic Automotive, Inc. 9% 3/15/18 | | 965,000 | | 969,825 |
Toys 'R' Us Property Co. I LLC 10.75% 7/15/17 (c) | | 830,000 | | 913,000 |
Toys 'R' Us Property Co. II LLC 8.5% 12/1/17 (c) | | 3,575,000 | | 3,673,313 |
| | 14,194,894 |
Technology - 4.8% |
Amkor Technology, Inc. 7.375% 5/1/18 (c) | | 3,460,000 | | 3,373,500 |
Avaya, Inc.: | | | | |
9.75% 11/1/15 | | 2,160,000 | | 2,019,600 |
10.125% 11/1/15 pay-in-kind (d) | | 7,399,645 | | 6,918,668 |
First Data Corp. 10.55% 9/24/15 pay-in-kind (d) | | 3,213,015 | | 2,258,875 |
Freescale Semiconductor, Inc.: | | | | |
9.125% 12/15/14 pay-in-kind (d) | | 3,145,979 | | 2,815,651 |
9.25% 4/15/18 (c) | | 2,705,000 | | 2,650,900 |
10.125% 12/15/16 | | 1,200,000 | | 948,000 |
Jabil Circuit, Inc.: | | | | |
7.75% 7/15/16 | | 2,385,000 | | 2,492,325 |
8.25% 3/15/18 | | 430,000 | | 455,800 |
Lucent Technologies, Inc.: | | | | |
6.45% 3/15/29 | | 5,430,000 | | 3,583,800 |
6.5% 1/15/28 | | 4,915,000 | | 3,243,900 |
Seagate HDD Cayman 6.875% 5/1/20 (c) | | 1,730,000 | | 1,639,175 |
SunGard Data Systems, Inc. 10.25% 8/15/15 | | 2,045,000 | | 2,111,463 |
Terremark Worldwide, Inc. 12% 6/15/17 | | 4,020,000 | | 4,542,600 |
Corporate Bonds - continued |
| Principal Amount | | Value |
Nonconvertible Bonds - continued |
Technology - continued |
Viasystems, Inc. 12% 1/15/15 (c) | | $ 1,625,000 | | $ 1,755,000 |
Xerox Capital Trust I 8% 2/1/27 | | 9,405,000 | | 9,468,568 |
| | 50,277,825 |
Telecommunications - 14.5% |
Citizens Communications Co.: | | | | |
7.875% 1/15/27 | | 940,000 | | 836,600 |
9% 8/15/31 | | 2,685,000 | | 2,490,338 |
Clearwire Communications LLC/Clearwire Finance, Inc. 12% 12/1/15 (c) | | 3,195,000 | | 3,187,013 |
Clearwire Escrow Corp. 12% 12/1/15 (c) | | 7,570,000 | | 7,551,075 |
Cleveland Unlimited, Inc. 13.5% 12/15/10 (c)(d) | | 1,275,000 | | 1,198,500 |
Cricket Communications, Inc.: | | | | |
7.75% 5/15/16 | | 1,915,000 | | 1,953,300 |
9.375% 11/1/14 | | 1,020,000 | | 1,035,300 |
10% 7/15/15 | | 2,055,000 | | 2,147,475 |
Digicel Group Ltd.: | | | | |
8.25% 9/1/17 (c) | | 3,145,000 | | 3,082,100 |
8.875% 1/15/15 (c) | | 5,750,000 | | 5,548,750 |
9.125% 1/15/15 pay-in-kind (c)(d) | | 3,357,000 | | 3,256,290 |
10.5% 4/15/18 (c) | | 830,000 | | 850,750 |
12% 4/1/14 (c) | | 1,430,000 | | 1,594,450 |
Equinix, Inc. 8.125% 3/1/18 | | 2,745,000 | | 2,786,175 |
Frontier Communications Corp.: | | | | |
7.875% 4/15/15 (c) | | 1,760,000 | | 1,777,600 |
8.125% 10/1/18 | | 5,125,000 | | 5,073,750 |
8.25% 5/1/14 | | 1,945,000 | | 2,022,800 |
8.25% 4/15/17 (c) | | 2,585,000 | | 2,604,388 |
8.5% 4/15/20 (c) | | 880,000 | | 884,400 |
Global Crossing Ltd. 12% 9/15/15 (c) | | 915,000 | | 969,900 |
Intelsat Bermuda Ltd. 12.5% 2/4/17 pay-in-kind (d) | | 10,155,000 | | 9,675,458 |
Intelsat Jackson Holdings Ltd.: | | | | |
9.5% 6/15/16 | | 5,125,000 | | 5,368,438 |
11.5% 6/15/16 | | 1,203,000 | | 1,278,188 |
Intelsat Ltd.: | | | | |
6.5% 11/1/13 | | 7,705,000 | | 7,223,438 |
7.625% 4/15/12 | | 3,855,000 | | 3,855,000 |
Intelsat Subsidiary Holding Co. Ltd.: | | | | |
8.875% 1/15/15 (c) | | 585,000 | | 591,581 |
8.875% 1/15/15 | | 6,240,000 | | 6,341,400 |
MetroPCS Wireless, Inc.: | | | | |
9.25% 11/1/14 | | 3,335,000 | | 3,435,050 |
9.25% 11/1/14 | | 1,755,000 | | 1,807,650 |
Nextel Communications, Inc.: | | | | |
5.95% 3/15/14 | | 4,895,000 | | 4,540,113 |
6.875% 10/31/13 | | 3,945,000 | | 3,821,719 |
|
| Principal Amount | | Value |
7.375% 8/1/15 | | $ 7,615,000 | | $ 7,234,250 |
NII Capital Corp.: | | | | |
8.875% 12/15/19 | | 2,735,000 | | 2,803,375 |
10% 8/15/16 | | 2,495,000 | | 2,625,988 |
PAETEC Holding Corp.: | | | | |
8.875% 6/30/17 | | 2,590,000 | | 2,577,050 |
8.875% 6/30/17 (c) | | 1,005,000 | | 999,975 |
Qwest Communications International, Inc.: | | | | |
7.125% 4/1/18 (c) | | 2,465,000 | | 2,452,675 |
7.5% 2/15/14 | | 900,000 | | 902,250 |
8% 10/1/15 (c) | | 2,080,000 | | 2,137,200 |
Qwest Corp. 3.7871% 6/15/13 (d) | | 385,000 | | 381,150 |
Sprint Capital Corp. 6.875% 11/15/28 | | 4,075,000 | | 3,382,250 |
Sprint Nextel Corp.: | | | | |
6% 12/1/16 | | 8,405,000 | | 7,543,488 |
8.375% 8/15/17 | | 5,065,000 | | 5,065,000 |
U.S. West Communications 7.5% 6/15/23 | | 6,035,000 | | 5,778,513 |
Wind Acquisition Finance SA 11.75% 7/15/17 (c) | | 4,510,000 | | 4,622,750 |
Wind Acquisition Holdings Finance SA 12.25% 7/15/17 pay-in-kind (c)(d) | | 4,825,000 | | 4,379,291 |
| | 151,674,194 |
Trucking & Freight - 0.2% |
Swift Transportation Co., Inc. 12.5% 5/15/17 (c) | | 2,680,000 | | 2,559,400 |
TOTAL NONCONVERTIBLE BONDS | | 927,833,399 |
TOTAL CORPORATE BONDS (Cost $912,092,414) | 932,686,719 |
Commercial Mortgage Securities - 0.0% |
|
LB Multi-family Mortgage Trust Series 1991-4 Class A1, 7.0832% 4/25/21 (c)(d)
(Cost $57,833) | | 92,036 | | 60,238 |
Common Stocks - 0.1% |
| Shares | | |
Cable TV - 0.1% |
Charter Communications, Inc. Class A (a) | 23,060 | | 814,018 |
Chemicals - 0.0% |
LyondellBasell Industries NV Class B (a) | 54 | | 872 |
Common Stocks - continued |
| Shares | | Value |
Textiles & Apparel - 0.0% |
Arena Brands Holding Corp. Class B (a)(f) | 48,889 | | $ 303,601 |
TOTAL COMMON STOCKS (Cost $2,736,180) | 1,118,491 |
Preferred Stocks - 0.4% |
| | | |
Convertible Preferred Stocks - 0.2% |
Electric Utilities - 0.2% |
AES Trust III 6.75% | 51,000 | | 2,203,710 |
Nonconvertible Preferred Stocks - 0.2% |
Diversified Financial Services - 0.2% |
GMAC, Inc. 7.00% (c) | 2,510 | | 1,945,250 |
TOTAL PREFERRED STOCKS (Cost $4,609,697) | 4,148,960 |
Floating Rate Loans - 6.0% |
| Principal Amount | | |
Aerospace - 0.2% |
Sequa Corp. term loan 3.5651% 12/3/14 (d) | | $ 2,370,000 | | 2,144,850 |
Air Transportation - 0.6% |
Delta Air Lines, Inc. Tranche 2LN, term loan 3.5478% 4/30/14 (d) | | 2,967,758 | | 2,641,304 |
US Airways Group, Inc. term loan 2.8128% 3/23/14 (d) | | 4,295,000 | | 3,393,050 |
| | 6,034,354 |
Automotive - 0.9% |
Federal-Mogul Corp.: | | | | |
Tranche B, term loan 2.2875% 12/27/14 (d) | | 3,664,698 | | 3,215,773 |
Tranche C, term loan 2.2875% 12/27/15 (d) | | 2,466,044 | | 2,139,293 |
Ford Motor Co. term loan 3.331% 12/15/13 (d) | | 4,224,214 | | 3,986,602 |
| | 9,341,668 |
Broadcasting - 0.3% |
Univision Communications, Inc. Tranche 1LN, term loan 2.5972% 9/29/14 (d) | | 3,835,648 | | 3,183,588 |
Capital Goods - 0.4% |
Dresser, Inc. Tranche 2LN, term loan 6.1951% 5/4/15 pay-in-kind (d) | | 4,950,000 | | 4,554,000 |
Containers - 0.4% |
Anchor Glass Container Corp.: | | | | |
Tranche 1LN, term loan 6% 3/2/16 (d) | | 1,833,144 | | 1,819,396 |
Tranche 2LN, term loan 10% 9/2/16 (d) | | 2,070,000 | | 2,028,600 |
| | 3,847,996 |
|
| Principal Amount | | Value |
Diversified Financial Services - 1.2% |
AWAS Aviation Acquisitions Ltd. term loan 7.75% 6/2/16 (d) | | $ 4,195,000 | | $ 4,168,781 |
Blackstone UTP Capital LLC term loan 7.75% 11/2/14 | | 3,965,075 | | 3,965,075 |
Clear Channel Capital I LLC Tranche B, term loan 3.9972% 1/29/16 (d) | | 2,130,000 | | 1,629,450 |
International Lease Finance Corp.: | | | | |
Tranche 1LN, term loan 6.75% 3/17/15 (d) | | 1,964,000 | | 1,944,360 |
Tranche 2LN, term loan 7% 3/17/16 (d) | | 1,441,000 | | 1,422,988 |
| | 13,130,654 |
Electric Utilities - 1.0% |
Ashmore Energy International: | | | | |
Revolving Credit-Linked Deposit 3.5334% 3/30/12 (d) | | 940,239 | | 866,195 |
term loan 3.5334% 3/30/14 (d) | | 10,240,082 | | 9,433,676 |
| | 10,299,871 |
Publishing/Printing - 0.1% |
Newsday LLC term loan 10.5% 8/1/13 | | 925,000 | | 957,375 |
Technology - 0.4% |
Avaya, Inc. term loan 3.2597% 10/24/14 (d) | | 2,298,106 | | 1,962,008 |
First Data Corp.: | | | | |
Tranche B1, term loan 3.0972% 9/24/14 (d) | | 900,738 | | 758,872 |
Tranche B3, term loan 3.0972% 9/24/14 (d) | | 1,259,967 | | 1,061,522 |
| | 3,782,402 |
Telecommunications - 0.5% |
Asurion Corp. Tranche 2LN, term loan 6.8503% 7/3/15 (d) | | 4,425,000 | | 4,314,375 |
Intelsat Jackson Holdings Ltd. term loan 3.2915% 2/1/14 (d) | | 830,000 | | 763,600 |
| | 5,077,975 |
TOTAL FLOATING RATE LOANS (Cost $60,529,716) | 62,354,733 |
Money Market Funds - 4.7% |
| Shares | | Value |
Fidelity Cash Central Fund, 0.20% (e)
(Cost $49,611,513) | 49,611,513 | | $ 49,611,513 |
TOTAL INVESTMENT PORTFOLIO - 100.1% (Cost $1,029,637,353) | | 1,049,980,654 |
NET OTHER ASSETS (LIABILITIES) - (0.1)% | | (1,032,155) |
NET ASSETS - 100% | $ 1,048,948,499 |
Legend |
(a) Non-income producing |
(b) Security initially issued in zero coupon form which converts to coupon form at a specified rate and date. The rate shown is the rate at period end. |
(c) Security exempt from registration under Rule 144A of the Securities Act of 1933. These securities may be resold in transactions exempt from registration, normally to qualified institutional buyers. At the end of the period, the value of these securities amounted to $295,926,986 or 28.2% of net assets. |
(d) The coupon rate shown on floating or adjustable rate securities represents the rate at period end. |
(e) Affiliated fund that is available only to investment companies and other accounts managed by Fidelity Investments. The rate quoted is the annualized seven-day yield of the fund at period end. A complete unaudited listing of the fund's holdings as of its most recent quarter end is available upon request. |
(f) Restricted securities - Investment in securities not registered under the Securities Act of 1933 (excluding 144A issues). At the end of the period, the value of restricted securities (excluding 144A issues) amounted to $303,601 or 0.0% of net assets. |
Additional information on each holding is as follows: |
Security | Acquisition Date | Acquisition Cost |
Arena Brands Holding Corp. Class B | 6/18/97 | $ 1,974,627 |
Affiliated Central Funds |
Information regarding fiscal year to date income earned by the Fund from investments in Fidelity Central Funds is as follows: |
Fund | Income earned |
Fidelity Cash Central Fund | $ 40,026 |
Other Information |
The following is a summary of the inputs used, as of June 30, 2010, involving the Fund's assets and liabilities carried at value. The inputs or methodology used for valuing securities may not be an indication of the risk associated with investing in those securities. For more information on valuation inputs, and their aggregation into the levels used in the tables below, please refer to the Security Valuation section in the accompanying Notes to Financial Statements. |
Valuation Inputs at Reporting Date: |
Description | Total | Level 1 | Level 2 | Level 3 |
Investments in Securities: | | | | |
Equities: | | | | |
Consumer Discretionary | $ 1,117,619 | $ 814,018 | $ - | $ 303,601 |
Financials | 1,945,250 | - | 1,945,250 | - |
Materials | 872 | 872 | - | - |
Utilities | 2,203,710 | - | 2,203,710 | - |
Corporate Bonds | 932,686,719 | - | 932,686,719 | - |
Commercial Mortgage Securities | 60,238 | - | - | 60,238 |
Floating Rate Loans | 62,354,733 | - | 62,354,733 | - |
Money Market Funds | 49,611,513 | 49,611,513 | - | - |
Total Investments in Securities: | $ 1,049,980,654 | $ 50,426,403 | $ 999,190,412 | $ 363,839 |
Other Information - continued |
The following is a reconciliation of Investments in Securities for which Level 3 inputs were used in determining value: |
Investments in Securities: | |
Beginning Balance | $ 431,931 |
Total Realized Gain (Loss) | - |
Total Unrealized Gain (Loss) | (64,519) |
Cost of Purchases | - |
Proceeds of Sales | (3,875) |
Amortization/Accretion | 302 |
Transfers in to Level 3 | - |
Transfers out of Level 3 | - |
Ending Balance | $ 363,839 |
The change in unrealized gain (loss) for the period attributable to Level 3 securities held at June 30, 2010 | $ (64,519) |
The information used in the above reconciliation represents fiscal year to date activity for any Investments in Securities identified as using Level 3 inputs at either the beginning or the end of the current fiscal period. Transfers in or out of Level 3 represent the beginning value of any Security or Instrument where a change in the pricing level occurred from the beginning to the end of the period. The cost of purchases and the proceeds of sales may include securities received or delivered through corporate actions or exchanges. Realized and unrealized gains (losses) disclosed in the reconciliation are included in Net Gain (Loss) on the Fund's Statement of Operations. |
Distribution of investments by country of issue, as a percentage of total net assets, is as follows: (Unaudited) |
United States of America | 82.4% |
Bermuda | 6.9% |
Canada | 3.7% |
Liberia | 1.5% |
Cayman Islands | 1.5% |
Others (Individually Less Than 1%) | 4.0% |
| 100.0% |
Income Tax Information |
At December 31, 2009, the Fund had a capital loss carryforward of approximately $238,711,832 of which $88,480,642, $70,783,139 and $79,448,051 will expire on December 31, 2010, 2016 and 2017, respectively. Capital loss carryforwards are only available to offset future capital gains of the Fund to the extent provided by regulations and may be limited. |
See accompanying notes which are an integral part of the financial statements.
Semiannual Report
Financial Statements
Statement of Assets and Liabilities
| June 30, 2010 (Unaudited) |
| | |
Assets | | |
Investment in securities, at value - See accompanying schedule: Unaffiliated issuers (cost $980,025,840) | $ 1,000,369,141 | |
Fidelity Central Funds (cost $49,611,513) | 49,611,513 | |
Total Investments (cost $1,029,637,353) | | $ 1,049,980,654 |
Cash | | 592,150 |
Receivable for investments sold | | 9,165,728 |
Receivable for fund shares sold | | 159,636 |
Interest receivable | | 19,233,988 |
Distributions receivable from Fidelity Central Funds | | 7,637 |
Other receivables | | 1,415 |
Total assets | | 1,079,141,208 |
| | |
Liabilities | | |
Payable for investments purchased | $ 26,754,314 | |
Payable for fund shares redeemed | 2,733,276 | |
Accrued management fee | 486,461 | |
Distribution fees payable | 38,367 | |
Other affiliated payables | 92,363 | |
Other payables and accrued expenses | 87,928 | |
Total liabilities | | 30,192,709 |
| | |
Net Assets | | $ 1,048,948,499 |
Net Assets consist of: | | |
Paid in capital | | $ 1,199,914,615 |
Undistributed net investment income | | 52,555,115 |
Accumulated undistributed net realized gain (loss) on investments | | (223,853,670) |
Net unrealized appreciation (depreciation) on investments | | 20,332,439 |
Net Assets | | $ 1,048,948,499 |
Statement of Assets and Liabilities - continued
| June 30, 2010 (Unaudited) |
| | |
Initial Class:
Net Asset Value, offering price and redemption price per share ($569,349,690 ÷ 104,073,330 shares) | | $ 5.47 |
| | |
Service Class:
Net Asset Value, offering price and redemption price per share ($95,816,811 ÷ 17,606,851 shares) | | $ 5.44 |
| | |
Service Class 2:
Net Asset Value, offering price and redemption price per share ($125,191,990 ÷ 23,387,878 shares) | | $ 5.35 |
| | |
Initial Class R:
Net Asset Value, offering price and redemption price per share ($29,410,469 ÷ 5,392,805 shares) | | $ 5.45 |
| | |
Service Class R:
Net Asset Value, offering price and redemption price per share ($37,311,614 ÷ 6,878,971 shares) | | $ 5.42 |
| | |
Service Class 2R:
Net Asset Value, offering price and redemption price per share ($1,968,209 ÷ 368,212 shares) | | $ 5.35 |
| | |
Investor Class:
Net Asset Value, offering price and redemption price per share ($189,899,716 ÷ 34,813,113 shares) | | $ 5.45 |
See accompanying notes which are an integral part of the financial statements.
Semiannual Report
Statement of Operations
Six months ended June 30, 2010 (Unaudited) |
| | |
Investment Income | | |
Dividends | | $ 86,062 |
Interest | | 48,492,872 |
Income from Fidelity Central Funds | | 40,026 |
Total income | | 48,618,960 |
| | |
Expenses | | |
Management fee | $ 3,141,381 | |
Transfer agent fees | 417,418 | |
Distribution fees | 273,065 | |
Accounting fees and expenses | 195,524 | |
Custodian fees and expenses | 13,032 | |
Independent trustees' compensation | 3,266 | |
Audit | 34,102 | |
Legal | 16,136 | |
Interest | 902 | |
Miscellaneous | 52,622 | |
Total expenses before reductions | 4,147,448 | |
Expense reductions | (661) | 4,146,787 |
Net investment income | | 44,472,173 |
Realized and Unrealized Gain (Loss) Net realized gain (loss) on: | | |
Investment securities: | | |
Unaffiliated issuers | | 15,828,409 |
Change in net unrealized appreciation (depreciation) on investment securities | | (24,518,045) |
Net gain (loss) | | (8,689,636) |
Net increase (decrease) in net assets resulting from operations | | $ 35,782,537 |
Statement of Changes in Net Assets
| Six months ended
June 30, 2010
(Unaudited) | Year ended
December 31,
2009 |
Increase (Decrease) in Net Assets | | |
Operations | | |
Net investment income | $ 44,472,173 | $ 88,146,519 |
Net realized gain (loss) | 15,828,409 | (80,957,504) |
Change in net unrealized appreciation (depreciation) | (24,518,045) | 340,753,509 |
Net increase (decrease) in net assets resulting from operations | 35,782,537 | 347,942,524 |
Distributions to shareholders from net investment income | - | (82,969,090) |
Share transactions - net increase (decrease) | (147,396,238) | 122,868,111 |
Redemption fees | 97,688 | 89,023 |
Total increase (decrease) in net assets | (111,516,013) | 387,930,568 |
| | |
Net Assets | | |
Beginning of period | 1,160,464,512 | 772,533,944 |
End of period (including undistributed net investment income of $52,555,115 and undistributed net investment income of $8,082,942, respectively) | $ 1,048,948,499 | $ 1,160,464,512 |
See accompanying notes which are an integral part of the financial statements.
Semiannual Report
Financial Highlights - Initial Class
| Six months ended
June 30, 2010 | Years ended December 31, |
| (Unaudited) | 2009 | 2008 | 2007 | 2006 | 2005 |
Selected Per-Share Data | | | | | | |
Net asset value, beginning of period | $ 5.29 | $ 3.96 | $ 5.98 | $ 6.35 | $ 6.17 | $ 7.00 |
Income from Investment Operations | | | | | | |
Net investment income E | .219 | .438 | .475 | .485 | .476 | .457 |
Net realized and unrealized gain (loss) | (.039) | 1.298 | (1.990) | (.311) | .216 | (.281) |
Total from investment operations | .180 | 1.736 | (1.515) | .174 | .692 | .176 |
Distributions from net investment income | - | (.406) | (.506) | (.545) | (.512) | (1.006) |
Redemption fees added to paid in capital E | - I | - I | .001 | .001 | - | - |
Net asset value, end of period | $ 5.47 | $ 5.29 | $ 3.96 | $ 5.98 | $ 6.35 | $ 6.17 |
Total Return B, C, D | 3.40% | 43.96% | (24.98)% | 2.79% | 11.24% | 2.70% |
Ratios to Average Net Assets F, H | | | | | | |
Expenses before reductions | .70% A | .70% | .71% | .68% | .71% | .70% |
Expenses net of fee waivers, if any | .70% A | .70% | .71% | .68% | .71% | .70% |
Expenses net of all reductions | .70% A | .70% | .70% | .68% | .71% | .70% |
Net investment income | 8.14% A | 9.02% | 8.48% | 7.47% | 7.40% | 6.98% |
Supplemental Data | | | | | | |
Net assets, end of period (000 omitted) | $ 569,350 | $ 608,802 | $ 451,824 | $ 726,409 | $ 922,565 | $ 1,080,002 |
Portfolio turnover rate G | 88% A | 70% | 58% | 70% | 65% | 95% |
A Annualized
B Total returns for periods of less than one year are not annualized.
C Total returns do not reflect charges attributable to your insurance company's separate account. Inclusion of these charges would reduce the total returns shown.
D Total returns would have been lower had certain expenses not been reduced during the periods shown.
E Calculated based on average shares outstanding during the period.
F Fees and expenses of the underlying Fidelity Central Funds are not included in the Fund's expense ratio. The Fund indirectly bears its proportionate share of the expenses of any underlying Fidelity Central Funds.
G Amount does not include the portfolio activity of any underlying Fidelity Central Funds.
H Expense ratios reflect operating expenses of the class. Expenses before reductions do not reflect amounts reimbursed by the investment adviser or reductions from brokerage service arrangements or reductions from other expense offset arrangements and do not represent the amount paid by the class during periods when reimbursements or reductions occur. Expenses net of fee waivers reflect expenses after reimbursement by the investment adviser but prior to reductions from brokerage service arrangements or other expense offset arrangements. Expenses net of all reductions represent the net expenses paid by the class.
I Amount represents less than $.001 per share.
Financial Highlights - Service Class
| Six months ended
June 30, 2010 | Years ended December 31, |
| (Unaudited) | 2009 | 2008 | 2007 | 2006 | 2005 |
Selected Per-Share Data | | | | | | |
Net asset value, beginning of period | $ 5.26 | $ 3.95 | $ 5.95 | $ 6.32 | $ 6.14 | $ 6.97 |
Income from Investment Operations | | | | | | |
Net investment income E | .215 | .429 | .469 | .477 | .467 | .448 |
Net realized and unrealized gain (loss) | (.035) | 1.281 | (1.971) | (.312) | .218 | (.283) |
Total from investment operations | .180 | 1.710 | (1.502) | .165 | .685 | .165 |
Distributions from net investment income | - | (.400) | (.499) | (.536) | (.505) | (.995) |
Redemption fees added to paid in capital E | - I | - I | .001 | .001 | - | - |
Net asset value, end of period | $ 5.44 | $ 5.26 | $ 3.95 | $ 5.95 | $ 6.32 | $ 6.14 |
Total Return B, C, D | 3.42% | 43.41% | (24.87)% | 2.66% | 11.18% | 2.52% |
Ratios to Average Net Assets F, H | | | | | | |
Expenses before reductions | .80% A | .80% | .80% | .78% | .81% | .80% |
Expenses net of fee waivers, if any | .80% A | .80% | .80% | .78% | .81% | .80% |
Expenses net of all reductions | .80% A | .80% | .80% | .78% | .81% | .80% |
Net investment income | 8.04% A | 8.92% | 8.39% | 7.37% | 7.30% | 6.88% |
Supplemental Data | | | | | | |
Net assets, end of period (000 omitted) | $ 95,817 | $ 103,511 | $ 95,461 | $ 180,837 | $ 277,546 | $ 319,380 |
Portfolio turnover rate G | 88% A | 70% | 58% | 70% | 65% | 95% |
A Annualized
B Total returns for periods of less than one year are not annualized.
C Total returns do not reflect charges attributable to your insurance company's separate account. Inclusion of these charges would reduce the total returns shown.
D Total returns would have been lower had certain expenses not been reduced during the periods shown.
E Calculated based on average shares outstanding during the period.
F Fees and expenses of the underlying Fidelity Central Funds are not included in the Fund's expense ratio. The Fund indirectly bears its proportionate share of the expenses of any underlying Fidelity Central Funds.
G Amount does not include the portfolio activity of any underlying Fidelity Central Funds.
H Expense ratios reflect operating expenses of the class. Expenses before reductions do not reflect amounts reimbursed by the investment adviser or reductions from brokerage service arrangements or reductions from other expense offset arrangements and do not represent the amount paid by the class during periods when reimbursements or reductions occur. Expenses net of fee waivers reflect expenses after reimbursement by the investment adviser but prior to reductions from brokerage service arrangements or other expense offset arrangements. Expenses net of all reductions represent the net expenses paid by the class.
I Amount represents less than $.001 per share.
See accompanying notes which are an integral part of the financial statements.
Semiannual Report
Financial Highlights - Service Class 2
| Six months ended
June 30, 2010 | Years ended December 31, |
| (Unaudited) | 2009 | 2008 | 2007 | 2006 | 2005 |
Selected Per-Share Data | | | | | | |
Net asset value, beginning of period | $ 5.18 | $ 3.89 | $ 5.88 | $ 6.25 | $ 6.08 | $ 6.91 |
Income from Investment Operations | | | | | | |
Net investment income E | .209 | .422 | .450 | .461 | .453 | .433 |
Net realized and unrealized gain (loss) | (.039) | 1.264 | (1.949) | (.305) | .216 | (.284) |
Total from investment operations | .170 | 1.686 | (1.499) | .156 | .669 | .149 |
Distributions from net investment income | - | (.396) | (.492) | (.527) | (.499) | (.979) |
Redemption fees added to paid in capital E | - I | - I | .001 | .001 | - | - |
Net asset value, end of period | $ 5.35 | $ 5.18 | $ 3.89 | $ 5.88 | $ 6.25 | $ 6.08 |
Total Return B, C, D | 3.28% | 43.46% | (25.14)% | 2.54% | 11.02% | 2.31% |
Ratios to Average Net Assets F, H | | | | | | |
Expenses before reductions | .95% A | .95% | .96% | .93% | .97% | .95% |
Expenses net of fee waivers, if any | .95% A | .95% | .96% | .93% | .97% | .95% |
Expenses net of all reductions | .95% A | .95% | .96% | .93% | .97% | .95% |
Net investment income | 7.89% A | 8.77% | 8.23% | 7.22% | 7.14% | 6.72% |
Supplemental Data | | | | | | |
Net assets, end of period (000 omitted) | $ 125,192 | $ 181,377 | $ 87,077 | $ 97,266 | $ 110,503 | $ 86,757 |
Portfolio turnover rate G | 88% A | 70% | 58% | 70% | 65% | 95% |
A Annualized
B Total returns for periods of less than one year are not annualized.
C Total returns do not reflect charges attributable to your insurance company's separate account. Inclusion of these charges would reduce the total returns shown.
D Total returns would have been lower had certain expenses not been reduced during the periods shown.
E Calculated based on average shares outstanding during the period.
F Fees and expenses of the underlying Fidelity Central Funds are not included in the Fund's expense ratio. The Fund indirectly bears its proportionate share of the expenses of any underlying Fidelity Central Funds.
G Amount does not include the portfolio activity of any underlying Fidelity Central Funds.
H Expense ratios reflect operating expenses of the class. Expenses before reductions do not reflect amounts reimbursed by the investment adviser or reductions from brokerage service arrangements or reductions from other expense offset arrangements and do not represent the amount paid by the class during periods when reimbursements or reductions occur. Expenses net of fee waivers reflect expenses after reimbursement by the investment adviser but prior to reductions from brokerage service arrangements or other expense offset arrangements. Expenses net of all reductions represent the net expenses paid by the class.
I Amount represents less than $.001 per share.
Financial Highlights - Initial Class R
| Six months ended
June 30, 2010 | Years ended December 31, |
| (Unaudited) | 2009 | 2008 | 2007 | 2006 | 2005 |
Selected Per-Share Data | | | | | | |
Net asset value, beginning of period | $ 5.27 | $ 3.95 | $ 5.96 | $ 6.34 | $ 6.16 | $ 7.00 |
Income from Investment Operations | | | | | | |
Net investment income E | .219 | .440 | .471 | .479 | .475 | .455 |
Net realized and unrealized gain (loss) | (.039) | 1.286 | (1.975) | (.313) | .218 | (.288) |
Total from investment operations | .180 | 1.726 | (1.504) | .166 | .693 | .167 |
Distributions from net investment income | - | (.406) | (.507) | (.547) | (.513) | (1.007) |
Redemption fees added to paid in capital E | - I | - I | .001 | .001 | - | - |
Net asset value, end of period | $ 5.45 | $ 5.27 | $ 3.95 | $ 5.96 | $ 6.34 | $ 6.16 |
Total Return B, C, D | 3.42% | 43.82% | (24.88)% | 2.65% | 11.27% | 2.55% |
Ratios to Average Net Assets F, H | | | | | | |
Expenses before reductions | .70% A | .70% | .70% | .68% | .71% | .70% |
Expenses net of fee waivers, if any | .70% A | .70% | .70% | .68% | .71% | .70% |
Expenses net of all reductions | .70% A | .69% | .70% | .67% | .71% | .70% |
Net investment income | 8.14% A | 9.02% | 8.49% | 7.47% | 7.39% | 6.98% |
Supplemental Data | | | | | | |
Net assets, end of period (000 omitted) | $ 29,410 | $ 34,080 | $ 19,801 | $ 19,401 | $ 93 | $ 83 |
Portfolio turnover rate G | 88% A | 70% | 58% | 70% | 65% | 95% |
A Annualized
B Total returns for periods of less than one year are not annualized.
C Total returns do not reflect charges attributable to your insurance company's separate account. Inclusion of these charges would reduce the total returns shown.
D Total returns would have been lower had certain expenses not been reduced during the periods shown.
E Calculated based on average shares outstanding during the period.
F Fees and expenses of the underlying Fidelity Central Funds are not included in the Fund's expense ratio. The Fund indirectly bears its proportionate share of the expenses of any underlying Fidelity Central Funds.
G Amount does not include the portfolio activity of any underlying Fidelity Central Funds.
H Expense ratios reflect operating expenses of the class. Expenses before reductions do not reflect amounts reimbursed by the investment adviser or reductions from brokerage service arrangements or reductions from other expense offset arrangements and do not represent the amount paid by the class during periods when reimbursements or reductions occur. Expenses net of fee waivers reflect expenses after reimbursement by the investment adviser but prior to reductions from brokerage service arrangements or other expense offset arrangements. Expenses net of all reductions represent the net expenses paid by the class.
I Amount represents less than $.001 per share.
See accompanying notes which are an integral part of the financial statements.
Semiannual Report
Financial Highlights - Service Class R
| Six months ended
June 30, 2010 | Years ended December 31, |
| (Unaudited) | 2009 | 2008 | 2007 | 2006 | 2005 |
Selected Per-Share Data | | | | | | |
Net asset value, beginning of period | $ 5.25 | $ 3.94 | $ 5.93 | $ 6.32 | $ 6.14 | $ 6.97 |
Income from Investment Operations | | | | | | |
Net investment income E | .215 | .431 | .467 | .471 | .467 | .447 |
Net realized and unrealized gain (loss) | (.045) | 1.280 | (1.959) | (.318) | .219 | (.282) |
Total from investment operations | .170 | 1.711 | (1.492) | .153 | .686 | .165 |
Distributions from net investment income | - | (.401) | (.499) | (.544) | (.506) | (.995) |
Redemption fees added to paid in capital E | - I | - I | .001 | .001 | - | - |
Net asset value, end of period | $ 5.42 | $ 5.25 | $ 3.94 | $ 5.93 | $ 6.32 | $ 6.14 |
Total Return B, C, D | 3.24% | 43.56% | (24.79)% | 2.45% | 11.19% | 2.53% |
Ratios to Average Net Assets F, H | | | | | | |
Expenses before reductions | .80% A | .80% | .80% | .78% | .81% | .80% |
Expenses net of fee waivers, if any | .80% A | .80% | .80% | .78% | .81% | .80% |
Expenses net of all reductions | .80% A | .80% | .80% | .77% | .81% | .80% |
Net investment income | 8.04% A | 8.92% | 8.39% | 7.37% | 7.30% | 6.88% |
Supplemental Data | | | | | | |
Net assets, end of period (000 omitted) | $ 37,312 | $ 47,873 | $ 26,572 | $ 33,129 | $ 92 | $ 83 |
Portfolio turnover rate G | 88% A | 70% | 58% | 70% | 65% | 95% |
A Annualized
B Total returns for periods of less than one year are not annualized.
C Total returns do not reflect charges attributable to your insurance company's separate account. Inclusion of these charges would reduce the total returns shown.
D Total returns would have been lower had certain expenses not been reduced during the periods shown.
E Calculated based on average shares outstanding during the period.
F Fees and expenses of the underlying Fidelity Central Funds are not included in the Fund's expense ratio. The Fund indirectly bears its proportionate share of the expenses of any underlying Fidelity Central Funds.
G Amount does not include the portfolio activity of any underlying Fidelity Central Funds.
H Expense ratios reflect operating expenses of the class. Expenses before reductions do not reflect amounts reimbursed by the investment adviser or reductions from brokerage service arrangements or reductions from other expense offset arrangements and do not represent the amount paid by the class during periods when reimbursements or reductions occur. Expenses net of fee waivers reflect expenses after reimbursement by the investment adviser but prior to reductions from brokerage service arrangements or other expense offset arrangements. Expenses net of all reductions represent the net expenses paid by the class.
I Amount represents less than $.001 per share.
Financial Highlights - Service Class 2R
| Six months ended
June 30, 2010 | Years ended December 31, |
| (Unaudited) | 2009 | 2008 | 2007 | 2006 | 2005 |
Selected Per-Share Data | | | | | | |
Net asset value, beginning of period | $ 5.17 | $ 3.89 | $ 5.87 | $ 6.25 | $ 6.08 | $ 6.91 |
Income from Investment Operations | | | | | | |
Net investment income E | .208 | .416 | .451 | .453 | .453 | .433 |
Net realized and unrealized gain (loss) | (.028) | 1.257 | (1.940) | (.294) | .214 | (.282) |
Total from investment operations | .180 | 1.673 | (1.489) | .159 | .667 | .151 |
Distributions from net investment income | - | (.393) | (.492) | (.540) | (.497) | (.981) |
Redemption fees added to paid in capital E | - I | - I | .001 | .001 | - | - |
Net asset value, end of period | $ 5.35 | $ 5.17 | $ 3.89 | $ 5.87 | $ 6.25 | $ 6.08 |
Total Return B, C, D | 3.48% | 43.13% | (24.99)% | 2.59% | 10.99% | 2.33% |
Ratios to Average Net Assets F, H | | | | | | |
Expenses before reductions | .95% A | .95% | .95% | .93% | .96% | .94% |
Expenses net of fee waivers, if any | .95% A | .95% | .95% | .93% | .96% | .94% |
Expenses net of all reductions | .95% A | .94% | .95% | .92% | .96% | .94% |
Net investment income | 7.89% A | 8.77% | 8.24% | 7.23% | 7.14% | 6.73% |
Supplemental Data | | | | | | |
Net assets, end of period (000 omitted) | $ 1,968 | $ 2,016 | $ 1,487 | $ 2,347 | $ 92 | $ 83 |
Portfolio turnover rate G | 88% A | 70% | 58% | 70% | 65% | 95% |
A Annualized
B Total returns for periods of less than one year are not annualized.
C Total returns do not reflect charges attributable to your insurance company's separate account. Inclusion of these charges would reduce the total returns shown.
D Total returns would have been lower had certain expenses not been reduced during the periods shown.
E Calculated based on average shares outstanding during the period.
F Fees and expenses of the underlying Fidelity Central Funds are not included in the Fund's expense ratio. The Fund indirectly bears its proportionate share of the expenses of any underlying Fidelity Central Funds.
G Amount does not include the portfolio activity of any underlying Fidelity Central Funds.
H Expense ratios reflect operating expenses of the class. Expenses before reductions do not reflect amounts reimbursed by the investment adviser or reductions from brokerage service arrangements or reductions from other expense offset arrangements and do not represent the amount paid by the class during periods when reimbursements or reductions occur. Expenses net of fee waivers reflect expenses after reimbursement by the investment adviser but prior to reductions from brokerage service arrangements or other expense offset arrangements. Expenses net of all reductions represent the net expenses paid by the class.
I Amount represents less than $.001 per share.
See accompanying notes which are an integral part of the financial statements.
Semiannual Report
Financial Highlights - Investor Class
| Six months ended
June 30, 2010 | Years ended December 31, |
| (Unaudited) | 2009 | 2008 | 2007 | 2006 | 2005 H |
Selected Per-Share Data | | | | | | |
Net asset value, beginning of period | $ 5.27 | $ 3.96 | $ 5.96 | $ 6.34 | $ 6.16 | $ 6.54 |
Income from Investment Operations | | | | | | |
Net investment income E | .218 | .441 | .473 | .477 | .471 | .193 |
Net realized and unrealized gain (loss) | (.038) | 1.274 | (1.971) | (.317) | .220 | (.089) |
Total from investment operations | .180 | 1.715 | (1.498) | .160 | .691 | .104 |
Distributions from net investment income | - | (.405) | (.503) | (.541) | (.511) | (.484) |
Redemption fees added to paid in capital E | - J | - J | .001 | .001 | - | - |
Net asset value, end of period | $ 5.45 | $ 5.27 | $ 3.96 | $ 5.96 | $ 6.34 | $ 6.16 |
Total Return B, C, D | 3.42% | 43.43% | (24.76)% | 2.56% | 11.24% | 1.60% |
Ratios to Average Net Assets F, I | | | | | | |
Expenses before reductions | .73% A | .73% | .74% | .75% | .80% | .82% A |
Expenses net of fee waivers, if any | .73% A | .73% | .74% | .75% | .80% | .82% A |
Expenses net of all reductions | .73% A | .73% | .74% | .75% | .79% | .82% A |
Net investment income | 8.11% A | 8.99% | 8.45% | 7.40% | 7.31% | 6.86% A |
Supplemental Data | | | | | | |
Net assets, end of period (000 omitted) | $ 189,900 | $ 182,806 | $ 90,312 | $ 105,920 | $ 78,122 | $ 17,363 |
Portfolio turnover rate G | 88% A | 70% | 58% | 70% | 65% | 95% |
A Annualized
B Total returns for periods of less than one year are not annualized.
C Total returns do not reflect charges attributable to your insurance company's separate account. Inclusion of these charges would reduce the total returns shown.
D Total returns would have been lower had certain expenses not been reduced during the periods shown.
E Calculated based on average shares outstanding during the period.
F Fees and expenses of the underlying Fidelity Central Funds are not included in the Fund's expense ratio. The Fund indirectly bears its proportionate share of the expenses of any underlying Fidelity Central Funds.
G Amount does not include the portfolio activity of any underlying Fidelity Central Funds.
H For the period July 21, 2005 (commencement of sale of shares) to December 31, 2005.
I Expense ratios reflect operating expenses of the class. Expenses before reductions do not reflect amounts reimbursed by the investment adviser or reductions from brokerage service arrangements or reductions from other expense offset arrangements and do not represent the amount paid by the class during periods when reimbursements or reductions occur. Expense ratios before reductions for start-up periods may not be representative of longer-term operating periods. Expenses net of fee waivers reflect expenses after reimbursement by the investment adviser but prior to reductions from brokerage service arrangements or other expense offset arrangements. Expenses net of all reductions represent the net expenses paid by the class.
J Amount represents less than $.001 per share.
See accompanying notes which are an integral part of the financial statements.
Semiannual Report
Notes to Financial Statements
For the period ended June 30, 2010 (Unaudited)
1. Organization.
VIP High Income Portfolio (the Fund) is a fund of Variable Insurance Products Fund (the Trust) and is authorized to issue an unlimited number of shares. The Trust is registered under the Investment Company Act of 1940, as amended (the 1940 Act), as an open-end management investment company organized as a Massachusetts business trust. Shares of the Fund may only be purchased by insurance companies for the purpose of funding variable annuity or variable life insurance contracts. The Fund offers the following classes of shares: Initial Class shares, Service Class shares, Service Class 2 shares, Initial Class R shares, Service Class R shares, Service Class 2R shares, and Investor Class shares. All classes have equal rights and voting privileges, except for matters affecting a single class. Investment income, realized and unrealized capital gains and losses, the common expenses of the Fund, and certain fund-level expense reductions, if any, are allocated on a pro-rata basis to each class based on the relative net assets of each class to the total net assets of the Fund. Each class differs with respect to transfer agent and distribution and service plan fees incurred. Certain expense reductions also differ by class.
2. Investments in Fidelity Central Funds.
The Fund may invest in Fidelity Central Funds, which are open-end investment companies available only to other investment companies and accounts managed by Fidelity Management & Research Company (FMR) and its affiliates. The Fund's Schedule of Investments lists each of the Fidelity Central Funds held as of period end, if any, as an investment of the Fund, but does not include the underlying holdings of each Fidelity Central Fund. As an Investing Fund, the Fund indirectly bears its proportionate share of the expenses of the underlying Fidelity Central Funds.
The Money Market Central Funds seek preservation of capital and current income and are managed by Fidelity Investments Money Management, Inc. (FIMM), an affiliate of FMR.
A complete unaudited list of holdings for each Fidelity Central Fund is available upon request or at the Securities and Exchange Commission (the SEC) web site at www.sec.gov. In addition, the financial statements of the Fidelity Central Funds are available on the SEC web site or upon request.
3. Significant Accounting Policies.
The financial statements have been prepared in conformity with accounting principles generally accepted in the United States of America (GAAP), which require management to make certain estimates and assumptions at the date of the financial statements. Actual results could differ from those estimates. The following summarizes the significant accounting policies of the Fund:
Security Valuation. Investments are valued as of 4:00 p.m. Eastern time on the last calendar day of the period. The Fund uses independent pricing services approved by the Board of Trustees to value its investments. When current market prices or quotations are not readily available or reliable, valuations may be determined in good faith in accordance with procedures adopted by the Board of Trustees. Factors used in determining value may include market or security specific events, changes in interest rates and credit quality. The frequency with which these procedures are used cannot be predicted and they may be utilized to a significant extent. The value used for net asset value (NAV) calculation under these procedures may differ from published prices for the same securities.
The Fund categorizes the inputs to valuation techniques used to value its investments into a disclosure hierarchy consisting of three levels as shown below.
Level 1 - quoted prices in active markets for identical investments
Level 2 - other significant observable inputs (including quoted prices for similar investments, interest rates, prepayment speeds, etc.)
Level 3 - unobservable inputs (including the fund's own assumptions based on the best information available)
Changes in valuation techniques may result in transfers in or out of an assigned level within the disclosure hierarchy. The aggregate value of investments by input level, as of June 30, 2010, for the Fund's investments, as well as a roll forward of Level 3 securities, is included at the end of the Fund's Schedule of Investments. Valuation techniques used to value the Fund's investments by major category are as follows.
Debt securities, including restricted securities, are valued based on evaluated prices received from independent pricing services or from dealers who make markets in such securities. For corporate bonds and floating rate loans, pricing services utilize matrix pricing which considers yield or price of bonds of comparable quality, coupon, maturity and type as well as dealer supplied prices and are generally categorized as Level 2 in the hierarchy. For commercial mortgage securities, pricing services utilize matrix pricing which considers prepayment speed assumptions, attributes of the collateral, yield or price of bonds of comparable quality, coupon, maturity and type as well as dealer supplied prices and, accordingly, such securities are generally categorized as Level 2 in the hierarchy. Dealers which make markets in asset backed securities, collateralized mortgage obligations and commercial mortgage securities may also consider such factors as the structure of the issue, cash flow assumptions, the value of underlying assets as well as any guarantees. Short-term securities with remaining maturities of sixty days or less for which quotations are not readily available are valued at amortized cost, which approximates value and are categorized as Level 2 in the hierarchy. The Fund invests a significant portion of its assets in below investment
Semiannual Report
3. Significant Accounting Policies - continued
Security Valuation - continued
grade securities. The value of these securities can be more volatile due to changes in the credit quality of the issuer and is sensitive to changes in economic, market and regulatory conditions.
When independent prices are unavailable or unreliable, debt securities may be valued utilizing pricing matrices which consider similar factors that would be used by independent pricing services. These are generally categorized as Level 2 in the hierarchy but may be Level 3 depending on the circumstances.
Equity securities, including restricted securities, for which market quotations are readily available, are valued at the last reported sale price or official closing price as reported by an independent pricing service on the primary market or exchange on which they are traded and are categorized as Level 1 in the hierarchy. In the event there were no sales during the day or closing prices are not available, securities are valued at the last quoted bid price or may be valued using the last available price and are generally categorized as Level 2 in the hierarchy. For restricted securities and private placements where observable inputs are limited, assumptions about market activity and risk are used and are categorized as Level 3 in the hierarchy.
Investments in open-end mutual funds, including the Fidelity Central Funds, are valued at their closing net asset value each business day and are categorized as Level 1 in the hierarchy.
Investment Transactions and Income. For financial reporting purposes, the Fund's investment holdings and NAV include trades executed through the end of the last business day of the period. The NAV per share for processing shareholder transactions is calculated as of the close of business of the New York Stock Exchange (NYSE), normally 4:00 p.m. Eastern time and includes trades executed through the end of the prior business day. Gains and losses on securities sold are determined on the basis of identified cost and may include proceeds received from litigation. Dividend income is recorded on the ex-dividend date, except for certain dividends from foreign securities where the ex-dividend date may have passed, which are recorded as soon as the Fund is informed of the ex-dividend date. Non-cash dividends included in dividend income, if any, are recorded at the fair market value of the securities received. Interest income and distributions from the Fidelity Central Funds are accrued as earned. Interest income includes coupon interest and amortization of premium and accretion of discount on debt securities.
Expenses. Most expenses of the Trust can be directly attributed to a fund. Expenses which cannot be directly attributed are apportioned amongst each fund in the Trust. Expense estimates are accrued in the period to which they relate and adjustments are made when actual amounts are known.
Income Tax Information and Distributions to Shareholders. Each year, the Fund intends to qualify as a regulated investment company by distributing substantially all of its taxable income and realized gains under Subchapter M of the Internal Revenue Code and filing its U.S. federal tax return. As a result, no provision for income taxes is required. A fund's federal tax return is subject to examination by the Internal Revenue Service (IRS) for a period of three years.
Distributions are recorded on the ex-dividend date. Income dividends and capital gain distributions are declared separately for each class. Income and capital gain distributions are determined in accordance with income tax regulations, which may differ from GAAP.
Capital accounts within the financial statements are adjusted for permanent book-tax differences. These adjustments have no impact on net assets or the results of operations. Temporary book-tax differences will reverse in a subsequent period.
Book-tax differences are primarily due to market discount, deferred trustees compensation, capital loss carryforwards, expiring capital loss carryforwards, and losses deferred due to wash sales.
The federal tax cost of investment securities and unrealized appreciation (depreciation) as of period end were as follows:
Gross unrealized appreciation | $ 48,829,700 |
Gross unrealized depreciation | (21,965,480) |
Net unrealized appreciation (depreciation) | $ 26,864,220 |
Tax cost | $ 1,023,116,434 |
Trading (Redemption) Fees. Initial Class R shares, Service Class R shares, and Service Class 2 R shares held less than 60 days are subject to a redemption fee equal to 1% of the proceeds of the redeemed shares. All redemption fees, including any estimated redemption fees paid by FMR, are retained by the Fund and accounted for as an addition to paid in capital.
Semiannual Report
Notes to Financial Statements (Unaudited) - continued
4. Operating Policies.
Restricted Securities. The Fund may invest in securities that are subject to legal or contractual restrictions on resale. These securities generally may be resold in transactions exempt from registration or to the public if the securities are registered. Disposal of these securities may involve time-consuming negotiations and expense, and prompt sale at an acceptable price may be difficult. Information regarding restricted securities is included at the end of the Fund's Schedule of Investments.
Loans and Other Direct Debt Instruments. The Fund may invest in loans and loan participations, trade claims or other receivables. These investments may include standby financing commitments, including revolving credit facilities, that obligate the Fund to supply additional cash to the borrower on demand. Loan participations involve a risk of insolvency of the lending bank or other financial intermediary. The Fund may be contractually obligated to receive approval from the agent bank and/or borrower prior to the sale of these investments.
5. Purchases and Sales of Investments.
Purchases and sales of securities, other than short-term securities, aggregated $458,575,055 and $568,889,167, respectively.
6. Fees and Other Transactions with Affiliates.
Management Fee. FMR and its affiliates provide the Fund with investment management related services for which the Fund pays a monthly management fee. The management fee is the sum of an individual fund fee rate that is based on an annual rate of .45% of the Fund's average net assets and a group fee rate that averaged .12% during the period. The group fee rate is based upon the average net assets of all the mutual funds advised by FMR. The group fee rate decreases as assets under management increase and increases as assets under management decrease. For the period, the total annualized management fee rate was .57% of the Fund's average net assets.
Distribution and Service Plan. In accordance with Rule 12b-1 of the 1940 Act, the Fund has adopted separate 12b-1 Plans for each Service Class of shares. Each Service Class pays Fidelity Distributors Corporation (FDC), an affiliate of FMR, a service fee. For the period, the service fee is based on an annual rate of .10% of Service Class' and Service Class R's average net assets and .25% of Service Class 2's and Service Class 2R's average net assets.
For the period, each class paid FDC the following amounts, all of which were re-allowed to insurance companies for the distribution of shares and providing shareholder support services:
Service Class | $ 50,657 |
Service Class 2 | 198,447 |
Service Class R | 21,314 |
Service Class 2R | 2,647 |
| $ 273,065 |
Transfer Agent Fees. Fidelity Investments Institutional Operations Company, Inc. (FIIOC), an affiliate of FMR, is the Fund's transfer, dividend disbursing, and shareholder servicing agent. FIIOC receives an asset-based fee with respect to each class. Each class (with the exception of Investor Class) pays a transfer agent fee, excluding out of pocket expenses, equal to an annual rate of .07% of average net assets. Investor Class pays a monthly asset-based transfer agent fee of .10% of average net assets. The total transfer agent fees paid by each class to FIIOC, including out of pocket expenses, were as follows:
Initial Class | $ 211,550 |
Service Class | 34,457 |
Service Class 2 | 55,509 |
Initial Class R | 10,346 |
Service Class R | 14,083 |
Service Class 2R | 699 |
Investor Class | 90,774 |
| $ 417,418 |
Accounting Fees. Fidelity Service Company, Inc. (FSC), an affiliate of FMR, maintains the Fund's accounting records. The fee is based on the level of average net assets for the month.
Interfund Lending Program. Pursuant to an Exemptive Order issued by the SEC, the Fund, along with other registered investment companies having management contracts with FMR, may participate in an interfund lending program. This program provides an alternative credit facility allowing the funds to borrow from, or lend money to, other participating affiliated funds. At period end, there were no interfund loans outstanding.
Semiannual Report
6. Fees and Other Transactions with Affiliates - continued
Interfund Lending Program - continued
The Fund's activity in this program during the period for which loans were outstanding was as follows:
Borrower or Lender | Average Daily
Loan Balance | Weighted Average
Interest Rate | Interest
Expense |
Borrower | $ 25,458,333 | .43% | $ 902 |
7. Committed Line of Credit.
The Fund participates with other funds managed by FMR in a $3.75 billion credit facility (the "line of credit") to be utilized for temporary or emergency purposes to fund shareholder redemptions or for other short-term liquidity purposes. The Fund has agreed to pay commitment fees on its pro-rata portion of the line of credit, which amounted to $2,276 and is reflected in Miscellaneous expenses on the Statement of Operations. During the period, there were no borrowings on this line of credit.
8. Expense Reductions.
Through arrangements with the Fund's custodian, credits realized as a result of uninvested cash balances were used to reduce the Fund's expenses. During the period, these credits reduced the Fund's custody expenses by $661.
9. Distributions to Shareholders.
Distributions to shareholders of each class were as follows:
| Six months ended
June 30,
2010 | Year ended
December 31,
2009 |
From net investment income | | |
Initial Class | $ - | $ 43,747,787 |
Service Class | - | 7,425,935 |
Service Class 2 | - | 12,835,833 |
Initial Class R | - | 2,441,349 |
Service Class R | - | 3,419,501 |
Service Class 2R | - | 146,215 |
Investor Class | - | 12,952,470 |
Total | $ - | $ 82,969,090 |
10. Share Transactions.
Transactions for each class of shares were as follows:
| Shares | Dollars |
| Six months ended
June 30,
2010 | Year ended
December 31,
2009 | Six months ended
June 30,
2010 | Year ended
December 31,
2009 |
Initial Class | | | | |
Shares sold | 6,514,992 | 20,216,701 | $ 35,437,949 | $ 94,993,807 |
Reinvestment of distributions | - | 8,357,240 | - | 43,747,787 |
Shares redeemed | (17,558,642) | (27,414,117) | (94,989,140) | (129,625,734) |
Net increase (decrease) | (11,043,650) | 1,159,824 | $ (59,551,191) | $ 9,115,860 |
Service Class | | | | |
Shares sold | 844,955 | 2,777,781 | $ 4,584,743 | $ 12,897,331 |
Reinvestment of distributions | - | 1,427,657 | - | 7,425,935 |
Shares redeemed | (2,904,196) | (8,725,159) | (15,653,381) | (41,193,317) |
Net increase (decrease) | (2,059,241) | (4,519,721) | $ (11,068,638) | $ (20,870,051) |
Service Class 2 | | | | |
Shares sold | 11,246,887 | 24,366,893 | $ 60,513,503 | $ 112,451,939 |
Reinvestment of distributions | - | 2,502,443 | - | 12,835,833 |
Shares redeemed | (22,866,014) | (14,230,958) | (120,978,123) | (64,857,511) |
Net increase (decrease) | (11,619,127) | 12,638,378 | $ (60,464,620) | $ 60,430,261 |
Semiannual Report
Notes to Financial Statements (Unaudited) - continued
10. Share Transactions - continued
| Shares | Dollars |
| Six months ended
June 30,
2010 | Year ended
December 31,
2009 | Six months ended
June 30,
2010 | Year ended
December 31,
2009 |
Initial Class R | | | | |
Shares sold | 1,518,026 | 4,004,167 | $ 8,268,535 | $ 17,798,935 |
Reinvestment of distributions | - | 468,040 | - | 2,441,349 |
Shares redeemed | (2,589,632) | (3,016,877) | (13,896,361) | (13,725,409) |
Net increase (decrease) | (1,071,606) | 1,455,330 | $ (5,627,826) | $ 6,514,875 |
Service Class R | | | | |
Shares sold | 2,648,462 | 7,453,151 | $ 14,416,667 | $ 33,119,246 |
Reinvestment of distributions | - | 659,445 | - | 3,419,501 |
Shares redeemed | (4,895,149) | (5,739,021) | (26,219,943) | (26,100,257) |
Net increase (decrease) | (2,246,687) | 2,373,575 | $ (11,803,276) | $ 10,438,490 |
Service Class 2R | | | | |
Shares sold | 63,981 | 190,944 | $ 339,387 | $ 835,730 |
Reinvestment of distributions | - | 28,591 | - | 146,215 |
Shares redeemed | (85,473) | (212,466) | (455,064) | (995,434) |
Net increase (decrease) | (21,492) | 7,069 | $ (115,677) | $ (13,489) |
Investor Class | | | | |
Shares sold | 15,091,746 | 20,189,376 | $ 81,631,928 | $ 92,880,106 |
Reinvestment of distributions | - | 2,482,010 | - | 12,952,470 |
Shares redeemed | (14,939,961) | (10,842,692) | (80,396,938) | (48,580,411) |
Net increase (decrease) | 151,785 | 11,828,694 | $ 1,234,990 | $ 57,252,165 |
11. Other.
The Fund's organizational documents provide former and current trustees and officers with a limited indemnification against liabilities arising in connection with the performance of their duties to the Fund. In the normal course of business, the Fund may also enter into contracts that provide general indemnifications. The Fund's maximum exposure under these arrangements is unknown as this would be dependent on future claims that may be made against the Fund. The risk of material loss from such claims is considered remote.
At the end of the period, FMR or its affiliates were the owners of record of 37% of the total outstanding shares of the Fund and one otherwise unaffiliated shareholder was the owner of record of 24% of the total outstanding shares of the Fund.
Semiannual Report
Investment Adviser
Fidelity Management & Research Company
Boston, MA
Investment Sub-Advisers
FMR Co., Inc.
Fidelity Research & Analysis Company
FIL Investments (Japan) Limited
FIL Investment Advisors
FIL Investment Advisors (U.K.) Ltd.
Fidelity Management & Research (U.K.) Inc.
Fidelity Management & Research (Hong Kong) Limited
Fidelity Management & Research (Japan) Inc.
General Distributor
Fidelity Distributors Corporation
Boston, MA
Transfer and Service Agents
Fidelity Investments Institutional Operations Company, Inc.
Boston, MA
Fidelity Service Company, Inc.
Boston, MA
Custodian
The Bank of New York Mellon
New York, NY
VIPHI-SANN-0810
1.705694.112
Fidelity® Variable Insurance Products:
High Income Portfolio - Class R
Semiannual Report
June 30, 2010
(2_fidelity_logos) (Registered_Trademark)
Contents
Shareholder Expense Example | <Click Here> | An example of shareholder expenses. |
Investment Changes | <Click Here> | A summary of major shifts in the fund's investments over the past six months. |
Investments | <Click Here> | A complete list of the fund's investments with their market values. |
Financial Statements | <Click Here> | Statements of assets and liabilities, operations, and changes in net assets, as well as financial highlights. |
Notes | <Click Here> | Notes to the financial statements. |
To view a fund's proxy voting guidelines and proxy voting record for the 12-month period ended June 30, visit http://www.fidelity.com/proxyvotingresults or visit the Securities and Exchange Commission's (SEC) web site at http://www.sec.gov. You may also call 1-877-208-0098 to request a free copy of the proxy voting guidelines.
Fidelity Variable Insurance Products are separate account options which are purchased through a variable insurance contract.
Standard & Poor's, S&P and S&P 500 are registered service marks of The McGraw-Hill Companies, Inc. and have been licensed for use by Fidelity Distributors Corporation.
Other third party marks appearing herein are the property of their respective owners.
All other marks appearing herein are registered or unregistered trademarks or service marks of FMR LLC or an affiliated company.
This report and the financial statements contained herein are submitted for the general information of the shareholders of the fund. This report is not authorized for distribution to prospective investors in the fund unless preceded or accompanied by an effective prospectus.
A fund files its complete schedule of portfolio holdings with the SEC for the first and third quarters of each fiscal year on Form N-Q. Forms N-Q are available on the SEC's web site at http://www.sec.gov. A fund's Forms N-Q may be reviewed and copied at the SEC's Public Reference Room in Washington, DC. Information regarding the operation of the SEC's Public Reference Room may be obtained by calling 1-800-SEC-0330. For a complete list of a fund's portfolio holdings, view the most recent holdings listing, semiannual report, or annual report on Fidelity's web site at http://www.fidelity.com or http://www.advisor.fidelity.com, as applicable.
NOT FDIC INSURED • MAY LOSE VALUE • NO BANK GUARANTEE
Neither the fund nor Fidelity Distributors Corporation is a bank.
Semiannual Report
Shareholder Expense Example
As a shareholder of the Fund, you incur two types of costs: (1) transaction costs, including redemption fees, and (2) ongoing costs, including management fees, distribution and/or service (12b-1) fees and other Fund expenses. This Example is intended to help you understand your ongoing costs (in dollars) of investing in the Fund and to compare these costs with the ongoing costs of investing in other mutual funds.
The Example is based on an investment of $1,000 invested at the beginning of the period and held for the entire period (January 1, 2010 to June 30, 2010).
Actual Expenses
The first line of the accompanying table for each class of the Fund provides information about actual account values and actual expenses. You may use the information in this line, together with the amount you invested, to estimate the expenses that you paid over the period. Simply divide your account value by $1,000.00 (for example, an $8,600 account value divided by $1,000.00 = 8.6), then multiply the result by the number in the first line for a class of the Fund under the heading entitled "Expenses Paid During Period" to estimate the expenses you paid on your account during this period. The estimate of expenses does not include any fees or other expenses of any variable annuity or variable life insurance product. If they were, the estimate of expenses you paid during the period would be higher, and your ending account value would be lower. In addition, the Fund, as a shareholder in the underlying Fidelity Central Funds, will indirectly bear its pro-rata share of the fees and expenses incurred by the underlying Fidelity Central Funds. These fees and expenses are not included in the Fund's annualized expense ratio used to calculate the expense estimate in the table below.
Hypothetical Example for Comparison Purposes
The second line of the accompanying table for each class of the Fund provides information about hypothetical account values and hypothetical expenses based on a Class' actual expense ratio and an assumed rate of return of 5% per year before expenses, which is not the Class' actual return. The hypothetical account values and expenses may not be used to estimate the actual ending account balance or expenses you paid for the period. You may use this information to compare the ongoing costs of investing in the Fund and other funds. To do so, compare this 5% hypothetical example with the 5% hypothetical examples that appear in the shareholder reports of the other funds. The estimate of expenses does not include any fees or other expenses of any variable annuity or variable life insurance product. If they were, the estimate of expenses you paid during the period would be higher, and your ending account value would be lower. In addition, the Fund, as a shareholder in the underlying Fidelity Central Funds, will indirectly bear its pro-rata share of the fees and expenses incurred by the underlying Fidelity Central Funds. These fees and expenses are not included in the Fund's annualized expense ratio used to calculate the expense estimate in the table below.
Please note that the expenses shown in the table are meant to highlight your ongoing costs only and do not reflect any transaction costs. Therefore, the second line of the table is useful in comparing ongoing costs only, and will not help you determine the relative total costs of owning different funds. In addition, if these transactional costs were included, your costs would have been higher.
| Annualized
Expense Ratio | Beginning
Account Value
January 1, 2010 | Ending
Account Value
June 30, 2010 | Expenses Paid
During Period*
January 1, 2010 to
June 30, 2010 |
Initial Class | .70% | | | |
Actual | | $ 1,000.00 | $ 1,034.00 | $ 3.53 |
HypotheticalA | | $ 1,000.00 | $ 1,021.32 | $ 3.51 |
Service Class | .80% | | | |
Actual | | $ 1,000.00 | $ 1,034.20 | $ 4.03 |
HypotheticalA | | $ 1,000.00 | $ 1,020.83 | $ 4.01 |
Service Class 2 | .95% | | | |
Actual | | $ 1,000.00 | $ 1,032.80 | $ 4.79 |
HypotheticalA | | $ 1,000.00 | $ 1,020.08 | $ 4.76 |
Initial Class R | .70% | | | |
Actual | | $ 1,000.00 | $ 1,034.20 | $ 3.53 |
HypotheticalA | | $ 1,000.00 | $ 1,021.32 | $ 3.51 |
Service Class R | .80% | | | |
Actual | | $ 1,000.00 | $ 1,032.40 | $ 4.03 |
HypotheticalA | | $ 1,000.00 | $ 1,020.83 | $ 4.01 |
Service Class 2R | .95% | | | |
Actual | | $ 1,000.00 | $ 1,034.80 | $ 4.79 |
HypotheticalA | | $ 1,000.00 | $ 1,020.08 | $ 4.76 |
Investor Class | .73% | | | |
Actual | | $ 1,000.00 | $ 1,034.20 | $ 3.68 |
HypotheticalA | | $ 1,000.00 | $ 1,021.17 | $ 3.66 |
A 5% return per year before expenses
* Expenses are equal to each Class' annualized expense ratio, multiplied by the average account value over the period, multiplied by 181/365 (to reflect the one-half year period).
Semiannual Report
Investment Changes (Unaudited)
Top Five Holdings as of June 30, 2010 |
(by issuer, excluding cash equivalents) | % of fund's
net assets | % of fund's net assets
6 months ago |
HCA, Inc. | 2.5 | 2.8 |
Nielsen Finance LLC/Nielsen Finance Co. | 2.0 | 1.9 |
Ship Finance International Ltd. | 1.9 | 1.8 |
Nextel Communications, Inc. | 1.5 | 1.3 |
International Lease Finance Corp. | 1.4 | 0.2 |
| 9.3 | |
Top Five Market Sectors as of June 30, 2010 |
| % of fund's
net assets | % of fund's net assets
6 months ago |
Telecommunications | 15.0 | 14.3 |
Energy | 7.8 | 7.8 |
Healthcare | 7.0 | 7.6 |
Diversified Financial Services | 6.5 | 1.2 |
Electric Utilities | 6.2 | 8.2 |
Quality Diversification (% of fund's net assets) |
As of June 30, 2010 | As of December 31, 2009 |
| AAA,AA,A 0.0% | | | AAA,AA,A 0.4% | |
| BBB 2.2% | | | BBB 2.2% | |
| BB 28.5% | | | BB 30.8% | |
| B 46.7% | | | B 39.0% | |
| CCC,CC,C 14.8% | | | CCC,CC,C 21.5% | |
| Not Rated 2.7% | | | Not Rated 2.3% | |
| Equities 0.5% | | | Equities 0.3% | |
| Short-Term
Investments and
Net Other Assets 4.6% | | | Short-Term
Investments and
Net Other Assets 3.5% | |
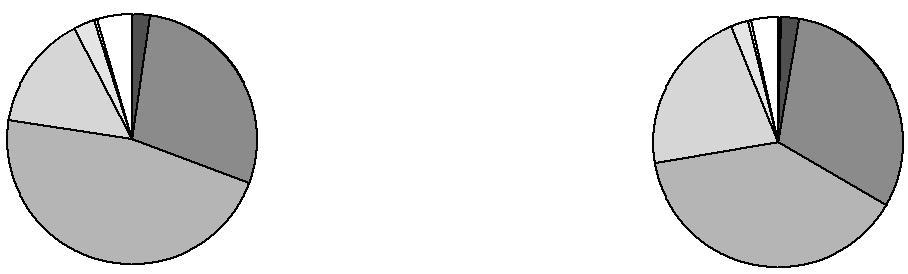
We have used ratings from Moody's® Investors Service, Inc. Where Moody's ratings are not available, we have used S&P® ratings. All ratings are as of the report date and do not reflect subsequent downgrades. |
Asset Allocation (% of fund's net assets) |
As of June 30, 2010 * | As of December 31, 2009 ** |
| Nonconvertible Bonds 88.4% | | | Nonconvertible Bonds 88.8% | |
| Convertible Bonds,
Preferred Stocks 0.9% | | | Convertible Bonds,
Preferred Stocks 0.7% | |
| Common Stocks 0.1% | | | Common Stocks 0.1% | |
| Floating Rate Loans 6.0% | | | Floating Rate Loans 6.9% | |
| Short-Term
Investments and
Net Other Assets 4.6% | | | Short-Term
Investments and
Net Other Assets 3.5% | |
* Foreign investments | 17.2% | | ** Foreign investments | 15.9% | |

Semiannual Report
Investments June 30, 2010 (Unaudited)
Showing Percentage of Net Assets
Corporate Bonds - 88.9% |
| Principal Amount | | Value |
Convertible Bonds - 0.5% |
Energy - 0.1% |
Energy Conversion Devices, Inc. 3% 6/15/13 | | $ 1,040,000 | | $ 577,200 |
Metals/Mining - 0.2% |
Massey Energy Co. 3.25% 8/1/15 | | 2,230,000 | | 1,839,750 |
Technology - 0.2% |
Lucent Technologies, Inc. 2.875% 6/15/25 | | 2,902,600 | | 2,436,370 |
TOTAL CONVERTIBLE BONDS | | 4,853,320 |
Nonconvertible Bonds - 88.4% |
Aerospace - 0.9% |
BE Aerospace, Inc. 8.5% 7/1/18 | | 3,730,000 | | 3,916,500 |
Sequa Corp.: | | | | |
11.75% 12/1/15 (c) | | 3,750,000 | | 3,693,750 |
13.5% 12/1/15 pay-in-kind (c) | | 1,345,605 | | 1,365,789 |
| | 8,976,039 |
Air Transportation - 2.7% |
American Airlines, Inc. 10.5% 10/15/12 (c) | | 1,990,000 | | 2,079,550 |
American Airlines, Inc. pass-thru trust certificates: | | | | |
6.977% 11/23/22 | | 475,729 | | 390,098 |
8.608% 10/1/12 | | 535,000 | | 516,275 |
10.375% 7/2/19 | | 1,876,983 | | 2,092,836 |
AMR Corp. 9% 8/1/12 | | 1,980,000 | | 1,732,500 |
Continental Airlines, Inc. pass-thru trust certificates: | | | | |
7.875% 7/2/18 | | 550,465 | | 489,913 |
8.388% 5/1/22 | | 387,913 | | 360,759 |
9.798% 4/1/21 | | 6,093,647 | | 5,667,092 |
Continental Airlines, Inc. 9.25% 5/10/17 | | 1,075,000 | | 1,107,250 |
Delta Air Lines, Inc. 9.5% 9/15/14 (c) | | 1,690,000 | | 1,782,950 |
Delta Air Lines, Inc. pass-thru trust certificates: | | | | |
8.021% 8/10/22 | | 2,213,341 | | 2,124,808 |
8.954% 8/10/14 | | 1,922,152 | | 1,893,319 |
Northwest Airlines, Inc. pass-thru trust certificates 8.028% 11/1/17 | | 918,557 | | 808,330 |
United Air Lines, Inc.: | | | | |
9.875% 8/1/13 (c) | | 795,000 | | 822,030 |
12% 11/1/13 (c) | | 1,005,000 | | 1,052,738 |
United Air Lines, Inc. pass-thru trust certificates: | | | | |
Class B, 7.336% 7/2/19 | | 2,821,893 | | 2,342,171 |
9.75% 1/15/17 | | 2,445,000 | | 2,597,813 |
12% 1/15/16 (c) | | 875,000 | | 916,563 |
| | 28,776,995 |
|
| Principal Amount | | Value |
Automotive - 2.8% |
ArvinMeritor, Inc.: | | | | |
8.125% 9/15/15 | | $ 3,250,000 | | $ 3,120,000 |
10.625% 3/15/18 | | 710,000 | | 747,275 |
Ford Motor Credit Co. LLC: | | | | |
7% 4/15/15 | | 3,380,000 | | 3,363,100 |
8% 6/1/14 | | 1,840,000 | | 1,890,600 |
8% 12/15/16 | | 4,870,000 | | 4,982,502 |
12% 5/15/15 | | 3,495,000 | | 4,027,988 |
General Motors Acceptance Corp. 6.875% 8/28/12 | | 4,155,000 | | 4,144,613 |
Lear Corp. 7.875% 3/15/18 | | 2,850,000 | | 2,842,875 |
Navistar International Corp. 8.25% 11/1/21 | | 4,720,000 | | 4,779,000 |
| | 29,897,953 |
Banks and Thrifts - 3.1% |
Bank of America Corp.: | | | | |
8% (d) | | 995,000 | | 962,663 |
8.125% (d) | | 2,985,000 | | 2,902,913 |
CIT Group, Inc.: | | | | |
7% 5/1/13 | | 372,017 | | 357,136 |
7% 5/1/14 | | 3,723,026 | | 3,481,029 |
7% 5/1/15 | | 1,548,026 | | 1,420,314 |
7% 5/1/16 | | 3,540,044 | | 3,212,590 |
7% 5/1/17 | | 5,417,062 | | 4,888,898 |
Fifth Third Capital Trust IV 6.5% 4/15/67 (d) | | 5,245,000 | | 4,327,125 |
GMAC LLC: | | | | |
6.75% 12/1/14 | | 4,400,000 | | 4,268,000 |
8% 12/31/18 | | 1,220,000 | | 1,128,500 |
8% 11/1/31 | | 2,275,000 | | 2,104,375 |
Zions Bancorp. 7.75% 9/23/14 | | 3,225,000 | | 3,287,372 |
| | 32,340,915 |
Broadcasting - 1.8% |
Belo Corp. 8% 11/15/16 | | 1,700,000 | | 1,759,500 |
Clear Channel Communications, Inc.: | | | | |
5.5% 9/15/14 | | 3,360,000 | | 1,848,000 |
11.75% 8/1/16 pay-in-kind (d) | | 2,190,000 | | 1,381,981 |
Clear Channel Worldwide Holdings, Inc.: | | | | |
Series A 9.25% 12/15/17 (c) | | 560,000 | | 557,200 |
Series B 9.25% 12/15/17 (c) | | 3,780,000 | | 3,798,900 |
Nexstar Broadcasting, Inc./Mission, Inc. 8.875% 4/15/17 (c) | | 2,390,000 | | 2,366,100 |
Umbrella Acquisition, Inc. 10.5% 3/15/15 pay-in-kind (c)(d) | | 6,904,400 | | 5,530,424 |
Univision Communications, Inc. 12% 7/1/14 (c) | | 1,975,000 | | 2,118,188 |
| | 19,360,293 |
Corporate Bonds - continued |
| Principal Amount | | Value |
Nonconvertible Bonds - continued |
Cable TV - 4.0% |
Cablevision Systems Corp.: | | | | |
7.75% 4/15/18 | | $ 1,635,000 | | $ 1,635,000 |
8% 4/15/20 | | 1,635,000 | | 1,659,525 |
8.625% 9/15/17 (c) | | 2,525,000 | | 2,550,250 |
CCO Holdings LLC/CCO Holdings Capital Corp.: | | | | |
7.875% 4/30/18 (c) | | 985,000 | | 987,463 |
8.125% 4/30/20 (c) | | 2,345,000 | | 2,374,313 |
Cequel Communications Holdings I LLC/Cequel Capital Corp. 8.625% 11/15/17 (c) | | 7,435,000 | | 7,407,119 |
Charter Communications Holdings II LLC/Charter Communications Holdings II Capital Corp. 13.5% 11/30/16 | | 2,137,796 | | 2,498,549 |
CSC Holdings LLC: | | | | |
8.5% 4/15/14 | | 2,370,000 | | 2,476,650 |
8.5% 6/15/15 | | 3,680,000 | | 3,799,600 |
8.625% 2/15/19 | | 1,940,000 | | 2,039,328 |
EchoStar Communications Corp. 7.125% 2/1/16 | | 1,280,000 | | 1,286,400 |
Insight Communications, Inc. 9.375% 7/15/18 (c) | | 2,660,000 | | 2,660,000 |
Kabel Deutschland GmbH 10.625% 7/1/14 | | 5,050,000 | | 5,214,125 |
UPC Germany GmbH 8.125% 12/1/17 (c) | | 2,880,000 | | 2,822,400 |
Videotron Ltd. 9.125% 4/15/18 | | 2,010,000 | | 2,185,875 |
| | 41,596,597 |
Capital Goods - 1.1% |
Amsted Industries, Inc. 8.125% 3/15/18 (c) | | 2,840,000 | | 2,811,600 |
Coleman Cable, Inc. 9% 2/15/18 (c) | | 2,815,000 | | 2,744,625 |
RBS Global, Inc. / Rexnord Corp.: | | | | |
8.5% 5/1/18 (c) | | 3,480,000 | | 3,366,900 |
11.75% 8/1/16 | | 2,145,000 | | 2,252,250 |
| | 11,175,375 |
Chemicals - 2.3% |
Huntsman International LLC: | | | | |
5.5% 6/30/16 (c) | | 3,245,000 | | 2,855,600 |
7.875% 11/15/14 | | 490,000 | | 474,075 |
LBI Escrow Corp. 8% 11/1/17 (c) | | 4,300,000 | | 4,418,250 |
Lyondell Chemical Co. 11% 5/1/18 | | 4,945,000 | | 5,303,513 |
NOVA Chemicals Corp.: | | | | |
3.7476% 11/15/13 (d) | | 5,325,000 | | 4,899,000 |
6.5% 1/15/12 | | 2,320,000 | | 2,331,600 |
8.375% 11/1/16 | | 1,990,000 | | 1,990,000 |
8.625% 11/1/19 | | 1,985,000 | | 1,985,000 |
| | 24,257,038 |
|
| Principal Amount | | Value |
Consumer Products - 0.5% |
ACCO Brands Corp. 10.625% 3/15/15 | | $ 2,030,000 | | $ 2,172,100 |
Jostens Holding Corp. 10.25% 12/1/13 | | 3,050,000 | | 3,114,813 |
| | 5,286,913 |
Containers - 1.5% |
Berry Plastics Corp.: | | | | |
5.0528% 2/15/15 (d) | | 1,980,000 | | 1,881,000 |
8.25% 11/15/15 | | 3,880,000 | | 3,880,000 |
8.875% 9/15/14 | | 2,490,000 | | 2,390,400 |
9.5% 5/15/18 (c) | | 4,465,000 | | 4,063,150 |
Crown Cork & Seal, Inc. 7.375% 12/15/26 | | 3,648,000 | | 3,319,680 |
| | 15,534,230 |
Diversified Financial Services - 5.1% |
GMAC, Inc. 8% 3/15/20 (c) | | 6,215,000 | | 6,137,313 |
Icahn Enterprises LP/Icahn Enterprises Finance Corp.: | | | | |
7.75% 1/15/16 (c) | | 4,405,000 | | 4,272,850 |
8% 1/15/18 (c) | | 3,995,000 | | 3,875,150 |
ILFC E-Capital Trust II 6.25% 12/21/65 (c)(d) | | 1,275,000 | | 816,000 |
Ineos Finance PLC 9% 5/15/15 (c) | | 2,505,000 | | 2,495,606 |
International Lease Finance Corp.: | | | | |
5.625% 9/20/13 | | 1,530,000 | | 1,380,825 |
5.65% 6/1/14 | | 1,315,000 | | 1,167,063 |
6.375% 3/25/13 | | 360,000 | | 337,500 |
6.625% 11/15/13 | | 1,640,000 | | 1,508,800 |
8.625% 9/15/15 (c) | | 3,090,000 | | 2,920,050 |
8.75% 3/15/17 (c) | | 6,100,000 | | 5,734,000 |
MU Finance PLC 8.375% 2/1/17 (c) | | 2,755,000 | | 2,644,800 |
National Money Mart Co. 10.375% 12/15/16 (c) | | 3,010,000 | | 3,055,150 |
Nuveen Investments, Inc.: | | | | |
5.5% 9/15/15 | | 1,025,000 | | 707,250 |
10.5% 11/15/15 | | 1,025,000 | | 896,875 |
Penson Worldwide, Inc. 12.5% 5/15/17 (c) | | 1,245,000 | | 1,241,888 |
Reliance Intermediate Holdings LP 9.5% 12/15/19 (c) | | 3,055,000 | | 3,177,200 |
SLM Corp. 8% 3/25/20 | | 5,650,000 | | 4,965,887 |
Sprint Capital Corp. 8.75% 3/15/32 | | 3,345,000 | | 3,194,475 |
Trans Union LLC/Trans Union Financing Corp. 11.375% 6/15/18 (c) | | 3,225,000 | | 3,365,933 |
| | 53,894,615 |
Diversified Media - 3.6% |
Affinion Group, Inc. 11.5% 10/15/15 | | 5,340,000 | | 5,607,000 |
Catalina Marketing Corp. 10.5% 10/1/15 pay-in-kind (c)(d) | | 2,200,000 | | 2,271,500 |
Corporate Bonds - continued |
| Principal Amount | | Value |
Nonconvertible Bonds - continued |
Diversified Media - continued |
Interpublic Group of Companies, Inc.: | | | | |
6.25% 11/15/14 | | $ 490,000 | | $ 480,200 |
10% 7/15/17 | | 1,120,000 | | 1,234,800 |
Liberty Media Corp. 8.25% 2/1/30 | | 255,000 | | 234,600 |
Nielsen Finance LLC/Nielsen Finance Co.: | | | | |
0% 8/1/16 (b) | | 8,345,000 | | 7,865,163 |
10% 8/1/14 | | 5,140,000 | | 5,281,350 |
11.5% 5/1/16 | | 2,275,000 | | 2,491,125 |
11.625% 2/1/14 | | 4,320,000 | | 4,730,400 |
Quebecor Media, Inc.: | | | | |
7.75% 3/15/16 | | 3,905,000 | | 3,826,900 |
7.75% 3/15/16 | | 3,585,000 | | 3,513,300 |
| | 37,536,338 |
Electric Utilities - 5.0% |
AES Corp.: | | | | |
7.75% 3/1/14 | | 905,000 | | 916,313 |
7.75% 10/15/15 | | 3,745,000 | | 3,791,813 |
8% 10/15/17 | | 2,060,000 | | 2,070,300 |
9.75% 4/15/16 (c) | | 3,010,000 | | 3,235,750 |
Calpine Construction Finance Co. LP 8% 6/1/16 (c) | | 5,775,000 | | 5,890,500 |
Dynegy Holdings, Inc. 7.5% 6/1/15 (c) | | 3,190,000 | | 2,508,138 |
Intergen NV 9% 6/30/17 (c) | | 3,755,000 | | 3,736,225 |
Mirant Americas Generation LLC: | | | | |
8.5% 10/1/21 | | 5,990,000 | | 5,510,800 |
9.125% 5/1/31 | | 4,630,000 | | 4,259,600 |
NRG Energy, Inc. 7.375% 2/1/16 | | 3,710,000 | | 3,682,175 |
NSG Holdings II, LLC 7.75% 12/15/25 (c) | | 9,620,000 | | 8,465,600 |
Otter Tail Corp. 9% 12/15/16 | | 2,460,000 | | 2,632,200 |
RRI Energy, Inc. 7.625% 6/15/14 | | 6,280,000 | | 6,185,800 |
| | 52,885,214 |
Energy - 7.7% |
Anadarko Petroleum Corp.: | | | | |
5.95% 9/15/16 | | 2,110,000 | | 1,816,974 |
6.95% 6/15/19 | | 990,000 | | 864,855 |
Antero Resources Finance Corp. 9.375% 12/1/17 (c) | | 3,240,000 | | 3,240,000 |
Atlas Pipeline Partners LP 8.125% 12/15/15 | | 360,000 | | 331,200 |
Compagnie Generale de Geophysique SA: | | | | |
7.5% 5/15/15 | | 430,000 | | 408,500 |
7.75% 5/15/17 | | 890,000 | | 845,500 |
9.5% 5/15/16 | | 1,225,000 | | 1,237,250 |
Crosstex Energy/Crosstex Energy Finance Corp. 8.875% 2/15/18 | | 3,745,000 | | 3,745,000 |
|
| Principal Amount | | Value |
Denbury Resources, Inc. 9.75% 3/1/16 | | $ 3,675,000 | | $ 3,941,438 |
Drummond Co., Inc. 7.375% 2/15/16 | | 5,510,000 | | 5,289,600 |
Forest Oil Corp. 8.5% 2/15/14 | | 4,380,000 | | 4,566,150 |
Frontier Oil Corp. 8.5% 9/15/16 | | 2,700,000 | | 2,733,750 |
Hercules Offshore, Inc. 10.5% 10/15/17 (c) | | 1,990,000 | | 1,766,125 |
LINN Energy LLC 8.625% 4/15/20 (c) | | 3,055,000 | | 3,127,556 |
OPTI Canada, Inc.: | | | | |
8.25% 12/15/14 | | 3,920,000 | | 3,430,000 |
9% 12/15/12 (c) | | 1,710,000 | | 1,727,100 |
Pan American Energy LLC 7.875% 5/7/21 (c) | | 4,125,000 | | 4,083,750 |
Parker Drilling Co. 9.125% 4/1/18 (c) | | 2,605,000 | | 2,448,700 |
Petrohawk Energy Corp.: | | | | |
7.875% 6/1/15 | | 770,000 | | 771,925 |
9.125% 7/15/13 | | 5,320,000 | | 5,572,700 |
10.5% 8/1/14 | | 725,000 | | 779,375 |
Petroleum Development Corp. 12% 2/15/18 | | 2,810,000 | | 2,901,325 |
Pioneer Natural Resources Co.: | | | | |
6.65% 3/15/17 | | 3,365,000 | | 3,365,000 |
7.5% 1/15/20 | | 3,360,000 | | 3,460,800 |
Plains Exploration & Production Co.: | | | | |
7% 3/15/17 | | 4,230,000 | | 4,029,075 |
7.625% 6/1/18 | | 1,535,000 | | 1,506,142 |
10% 3/1/16 | | 3,207,000 | | 3,399,420 |
Quicksilver Resources, Inc.: | | | | |
7.125% 4/1/16 | | 4,920,000 | | 4,514,100 |
9.125% 8/15/19 | | 2,080,000 | | 2,100,800 |
11.75% 1/1/16 | | 2,250,000 | | 2,486,250 |
| | 80,490,360 |
Entertainment/Film - 0.3% |
MCE Finance Ltd. 10.25% 5/15/18 (c) | | 3,125,000 | | 3,281,250 |
Food and Drug Retail - 0.7% |
Albertsons, Inc. 7.75% 6/15/26 | | 435,000 | | 361,050 |
SUPERVALU, Inc. 8% 5/1/16 | | 2,500,000 | | 2,468,750 |
The Great Atlantic & Pacific Tea Co. 11.375% 8/1/15 (c) | | 3,365,000 | | 2,767,713 |
Tops Markets LLC 10.125% 10/15/15 (c) | | 1,870,000 | | 1,926,100 |
| | 7,523,613 |
Food/Beverage/Tobacco - 0.1% |
C&S Group Enterprises LLC 8.375% 5/1/17 (c) | | 735,000 | | 711,113 |
Gaming - 2.3% |
Chukchansi Economic Development Authority: | | | | |
4.1226% 11/15/12 (c)(d) | | 1,010,000 | | 666,600 |
Corporate Bonds - continued |
| Principal Amount | | Value |
Nonconvertible Bonds - continued |
Gaming - continued |
Chukchansi Economic Development Authority: - continued | | | | |
8% 11/15/13 (c) | | $ 3,410,000 | | $ 2,387,000 |
Las Vegas Sands Corp. 6.375% 2/15/15 | | 1,295,000 | | 1,243,200 |
MGM Mirage, Inc.: | | | | |
6.625% 7/15/15 | | 1,600,000 | | 1,248,000 |
7.5% 6/1/16 | | 400,000 | | 316,000 |
Scientific Games Corp.: | | | | |
7.875% 6/15/16 (c) | | 5,230,000 | | 5,151,550 |
9.25% 6/15/19 | | 1,920,000 | | 1,968,000 |
Seneca Gaming Corp.: | | | | |
Series B, 7.25% 5/1/12 | | 5,205,000 | | 5,087,888 |
7.25% 5/1/12 | | 2,075,000 | | 2,028,313 |
Snoqualmie Entertainment Authority: | | | | |
4.1356% 2/1/14 (c)(d) | | 3,525,000 | | 2,811,188 |
9.125% 2/1/15 (c) | | 1,290,000 | | 1,080,375 |
| | 23,988,114 |
Healthcare - 7.0% |
Apria Healthcare Group, Inc.: | | | | |
11.25% 11/1/14 (c) | | 1,830,000 | | 1,944,375 |
12.375% 11/1/14 (c) | | 1,000,000 | | 1,067,500 |
Biomet, Inc. 10.375% 10/15/17 pay-in-kind (d) | | 995,000 | | 1,069,625 |
DJO Finance LLC / DJO Finance Corp. 10.875% 11/15/14 | | 8,375,000 | | 8,730,938 |
HCA, Inc.: | | | | |
8.5% 4/15/19 | | 2,125,000 | | 2,241,875 |
9.125% 11/15/14 | | 6,670,000 | | 6,953,475 |
9.25% 11/15/16 | | 8,519,000 | | 8,987,545 |
9.625% 11/15/16 pay-in-kind (d) | | 5,401,000 | | 5,725,060 |
9.875% 2/15/17 | | 1,610,000 | | 1,710,625 |
Inverness Medical Innovations, Inc.: | | | | |
7.875% 2/1/16 | | 1,830,000 | | 1,788,825 |
9% 5/15/16 | | 2,875,000 | | 2,882,188 |
Mylan, Inc. 7.625% 7/15/17 (c) | | 1,255,000 | | 1,289,513 |
Omega Healthcare Investors, Inc.: | | | | |
7% 4/1/14 | | 9,235,000 | | 9,211,913 |
7% 1/15/16 | | 1,665,000 | | 1,644,188 |
Psychiatric Solutions, Inc. 7.75% 7/15/15 | | 435,000 | | 438,263 |
Senior Housing Properties Trust 6.75% 4/15/20 | | 2,640,000 | | 2,607,000 |
Valeant Pharmaceuticals International: | | | | |
7.625% 3/15/20 (c) | | 1,955,000 | | 2,306,900 |
8.375% 6/15/16 | | 485,000 | | 557,750 |
|
| Principal Amount | | Value |
Vanguard Health Holding Co. II LLC/Vanguard Health Holding Co. II, Inc.: | | | | |
8% 2/1/18 | | $ 5,045,000 | | $ 4,868,425 |
8% 2/1/18 (c) | | 2,690,000 | | 2,595,850 |
Ventas Realty LP: | | | | |
6.5% 6/1/16 | | 1,200,000 | | 1,203,000 |
6.5% 6/1/16 | | 460,000 | | 461,150 |
6.625% 10/15/14 | | 2,835,000 | | 2,877,525 |
| | 73,163,508 |
Homebuilding/Real Estate - 0.8% |
KB Home 7.25% 6/15/18 | | 2,965,000 | | 2,631,438 |
Lennar Corp. 12.25% 6/1/17 | | 1,650,000 | | 1,864,500 |
Standard Pacific Corp.: | | | | |
7% 8/15/15 | | 1,070,000 | | 984,400 |
8.375% 5/15/18 | | 995,000 | | 947,738 |
10.75% 9/15/16 | | 2,405,000 | | 2,525,250 |
| | 8,953,326 |
Hotels - 0.9% |
Host Hotels & Resorts LP 9% 5/15/17 | | 2,195,000 | | 2,326,700 |
Host Marriott LP 7.125% 11/1/13 | | 6,900,000 | | 6,934,500 |
| | 9,261,200 |
Leisure - 2.6% |
Equinox Holdings, Inc. 9.5% 2/1/16 (c) | | 3,080,000 | | 3,045,350 |
GWR Operating Partnership LLP 10.875% 4/1/17 (c) | | 1,865,000 | | 1,846,350 |
NCL Corp. Ltd. 11.75% 11/15/16 | | 1,490,000 | | 1,579,400 |
Royal Caribbean Cruises Ltd.: | | | | |
7.25% 3/15/18 | | 1,815,000 | | 1,746,938 |
11.875% 7/15/15 | | 1,440,000 | | 1,652,400 |
yankee: | | | | |
7% 6/15/13 | | 3,985,000 | | 3,965,075 |
7.25% 6/15/16 | | 6,940,000 | | 6,801,200 |
7.5% 10/15/27 | | 1,400,000 | | 1,226,680 |
Town Sports International Holdings, Inc. 11% 2/1/14 | | 1,772,000 | | 1,612,520 |
Universal City Development Partners Ltd./UCDP Finance, Inc.: | | | | |
8.875% 11/15/15 (c) | | 1,245,000 | | 1,251,225 |
10.875% 11/15/16 (c) | | 2,130,000 | | 2,204,550 |
| | 26,931,688 |
Metals/Mining - 1.9% |
Arch Coal, Inc. 8.75% 8/1/16 (c) | | 1,035,000 | | 1,077,746 |
CONSOL Energy, Inc.: | | | | |
8% 4/1/17 (c) | | 2,640,000 | | 2,732,400 |
8.25% 4/1/20 (c) | | 1,760,000 | | 1,839,200 |
Drummond Co., Inc. 9% 10/15/14 (c) | | 830,000 | | 842,450 |
FMG Finance Property Ltd. 10% 9/1/13 (c) | | 3,100,000 | | 3,270,500 |
Corporate Bonds - continued |
| Principal Amount | | Value |
Nonconvertible Bonds - continued |
Metals/Mining - continued |
Massey Energy Co. 6.875% 12/15/13 | | $ 5,595,000 | | $ 5,462,119 |
Severstal Columbus LLC 10.25% 2/15/18 (c) | | 4,340,000 | | 4,383,400 |
| | 19,607,815 |
Paper - 1.0% |
Boise Paper LLC/Boise Co-Issuer Co. 8% 4/1/20 (c) | | 2,790,000 | | 2,741,175 |
Domtar Corp.: | | | | |
7.125% 8/15/15 | | 357,000 | | 374,850 |
10.75% 6/1/17 | | 2,305,000 | | 2,760,238 |
Rock-Tenn Co. 9.25% 3/15/16 | | 420,000 | | 445,200 |
Verso Paper Holdings LLC/Verso Paper, Inc.: | | | | |
9.125% 8/1/14 | | 1,495,000 | | 1,420,250 |
11.5% 7/1/14 | | 2,615,000 | | 2,804,588 |
| | 10,546,301 |
Services - 3.3% |
ARAMARK Corp.: | | | | |
3.8466% 2/1/15 (d) | | 7,820,000 | | 7,194,400 |
8.5% 2/1/15 | | 3,080,000 | | 3,118,500 |
Avis Budget Car Rental LLC/Avis Budget Finance, Inc.: | | | | |
7.625% 5/15/14 | | 2,750,000 | | 2,640,000 |
7.75% 5/15/16 | | 3,195,000 | | 3,003,300 |
9.625% 3/15/18 (c) | | 825,000 | | 833,250 |
FTI Consulting, Inc. 7.625% 6/15/13 | | 1,960,000 | | 1,940,400 |
Hertz Corp.: | | | | |
8.875% 1/1/14 | | 3,460,000 | | 3,494,600 |
10.5% 1/1/16 | | 2,085,000 | | 2,163,188 |
McJunkin Red Man Corp. 9.5% 12/15/16 (c) | | 5,700,000 | | 5,429,250 |
Rural/Metro Corp. 12.75% 3/15/16 | | 1,770,000 | | 1,876,200 |
ServiceMaster Co. 10.75% 7/15/15 pay-in-kind (c)(d) | | 3,000,000 | | 3,075,000 |
| | 34,768,088 |
Shipping - 2.9% |
Navios Maritime Holdings, Inc.: | | | | |
8.875% 11/1/17 (c) | | 2,255,000 | | 2,266,275 |
9.5% 12/15/14 | | 4,737,000 | | 4,547,520 |
Overseas Shipholding Group, Inc.: | | | | |
7.5% 2/15/24 | | 475,000 | | 408,500 |
8.125% 3/30/18 | | 2,895,000 | | 2,847,956 |
Ship Finance International Ltd. 8.5% 12/15/13 | | 20,075,000 | | 19,673,473 |
Western Express, Inc. 12.5% 4/15/15 (c) | | 1,025,000 | | 940,438 |
| | 30,684,162 |
|
| Principal Amount | | Value |
Steels - 1.7% |
Algoma Acquisition Corp. 9.875% 6/15/15 (c) | | $ 3,210,000 | | $ 2,728,500 |
Edgen Murray Corp. 12.25% 1/15/15 (c) | | 5,015,000 | | 4,237,675 |
Essar Steel Algoma, Inc. 9.375% 3/15/15 (c) | | 3,155,000 | | 2,997,250 |
Steel Dynamics, Inc.: | | | | |
6.75% 4/1/15 | | 5,775,000 | | 5,652,570 |
7.625% 3/15/20 (c) | | 450,000 | | 442,125 |
Tube City IMS Corp. 9.75% 2/1/15 | | 1,695,000 | | 1,639,913 |
| | 17,698,033 |
Super Retail - 1.3% |
AutoNation, Inc. 6.75% 4/15/18 | | 2,325,000 | | 2,295,938 |
Intcomex, Inc. 13.25% 12/15/14 (c) | | 2,550,000 | | 2,652,000 |
Netflix, Inc. 8.5% 11/15/17 | | 2,140,000 | | 2,228,168 |
QVC, Inc. 7.125% 4/15/17 (c) | | 1,470,000 | | 1,462,650 |
Sonic Automotive, Inc. 9% 3/15/18 | | 965,000 | | 969,825 |
Toys 'R' Us Property Co. I LLC 10.75% 7/15/17 (c) | | 830,000 | | 913,000 |
Toys 'R' Us Property Co. II LLC 8.5% 12/1/17 (c) | | 3,575,000 | | 3,673,313 |
| | 14,194,894 |
Technology - 4.8% |
Amkor Technology, Inc. 7.375% 5/1/18 (c) | | 3,460,000 | | 3,373,500 |
Avaya, Inc.: | | | | |
9.75% 11/1/15 | | 2,160,000 | | 2,019,600 |
10.125% 11/1/15 pay-in-kind (d) | | 7,399,645 | | 6,918,668 |
First Data Corp. 10.55% 9/24/15 pay-in-kind (d) | | 3,213,015 | | 2,258,875 |
Freescale Semiconductor, Inc.: | | | | |
9.125% 12/15/14 pay-in-kind (d) | | 3,145,979 | | 2,815,651 |
9.25% 4/15/18 (c) | | 2,705,000 | | 2,650,900 |
10.125% 12/15/16 | | 1,200,000 | | 948,000 |
Jabil Circuit, Inc.: | | | | |
7.75% 7/15/16 | | 2,385,000 | | 2,492,325 |
8.25% 3/15/18 | | 430,000 | | 455,800 |
Lucent Technologies, Inc.: | | | | |
6.45% 3/15/29 | | 5,430,000 | | 3,583,800 |
6.5% 1/15/28 | | 4,915,000 | | 3,243,900 |
Seagate HDD Cayman 6.875% 5/1/20 (c) | | 1,730,000 | | 1,639,175 |
SunGard Data Systems, Inc. 10.25% 8/15/15 | | 2,045,000 | | 2,111,463 |
Terremark Worldwide, Inc. 12% 6/15/17 | | 4,020,000 | | 4,542,600 |
Corporate Bonds - continued |
| Principal Amount | | Value |
Nonconvertible Bonds - continued |
Technology - continued |
Viasystems, Inc. 12% 1/15/15 (c) | | $ 1,625,000 | | $ 1,755,000 |
Xerox Capital Trust I 8% 2/1/27 | | 9,405,000 | | 9,468,568 |
| | 50,277,825 |
Telecommunications - 14.5% |
Citizens Communications Co.: | | | | |
7.875% 1/15/27 | | 940,000 | | 836,600 |
9% 8/15/31 | | 2,685,000 | | 2,490,338 |
Clearwire Communications LLC/Clearwire Finance, Inc. 12% 12/1/15 (c) | | 3,195,000 | | 3,187,013 |
Clearwire Escrow Corp. 12% 12/1/15 (c) | | 7,570,000 | | 7,551,075 |
Cleveland Unlimited, Inc. 13.5% 12/15/10 (c)(d) | | 1,275,000 | | 1,198,500 |
Cricket Communications, Inc.: | | | | |
7.75% 5/15/16 | | 1,915,000 | | 1,953,300 |
9.375% 11/1/14 | | 1,020,000 | | 1,035,300 |
10% 7/15/15 | | 2,055,000 | | 2,147,475 |
Digicel Group Ltd.: | | | | |
8.25% 9/1/17 (c) | | 3,145,000 | | 3,082,100 |
8.875% 1/15/15 (c) | | 5,750,000 | | 5,548,750 |
9.125% 1/15/15 pay-in-kind (c)(d) | | 3,357,000 | | 3,256,290 |
10.5% 4/15/18 (c) | | 830,000 | | 850,750 |
12% 4/1/14 (c) | | 1,430,000 | | 1,594,450 |
Equinix, Inc. 8.125% 3/1/18 | | 2,745,000 | | 2,786,175 |
Frontier Communications Corp.: | | | | |
7.875% 4/15/15 (c) | | 1,760,000 | | 1,777,600 |
8.125% 10/1/18 | | 5,125,000 | | 5,073,750 |
8.25% 5/1/14 | | 1,945,000 | | 2,022,800 |
8.25% 4/15/17 (c) | | 2,585,000 | | 2,604,388 |
8.5% 4/15/20 (c) | | 880,000 | | 884,400 |
Global Crossing Ltd. 12% 9/15/15 (c) | | 915,000 | | 969,900 |
Intelsat Bermuda Ltd. 12.5% 2/4/17 pay-in-kind (d) | | 10,155,000 | | 9,675,458 |
Intelsat Jackson Holdings Ltd.: | | | | |
9.5% 6/15/16 | | 5,125,000 | | 5,368,438 |
11.5% 6/15/16 | | 1,203,000 | | 1,278,188 |
Intelsat Ltd.: | | | | |
6.5% 11/1/13 | | 7,705,000 | | 7,223,438 |
7.625% 4/15/12 | | 3,855,000 | | 3,855,000 |
Intelsat Subsidiary Holding Co. Ltd.: | | | | |
8.875% 1/15/15 (c) | | 585,000 | | 591,581 |
8.875% 1/15/15 | | 6,240,000 | | 6,341,400 |
MetroPCS Wireless, Inc.: | | | | |
9.25% 11/1/14 | | 3,335,000 | | 3,435,050 |
9.25% 11/1/14 | | 1,755,000 | | 1,807,650 |
Nextel Communications, Inc.: | | | | |
5.95% 3/15/14 | | 4,895,000 | | 4,540,113 |
6.875% 10/31/13 | | 3,945,000 | | 3,821,719 |
|
| Principal Amount | | Value |
7.375% 8/1/15 | | $ 7,615,000 | | $ 7,234,250 |
NII Capital Corp.: | | | | |
8.875% 12/15/19 | | 2,735,000 | | 2,803,375 |
10% 8/15/16 | | 2,495,000 | | 2,625,988 |
PAETEC Holding Corp.: | | | | |
8.875% 6/30/17 | | 2,590,000 | | 2,577,050 |
8.875% 6/30/17 (c) | | 1,005,000 | | 999,975 |
Qwest Communications International, Inc.: | | | | |
7.125% 4/1/18 (c) | | 2,465,000 | | 2,452,675 |
7.5% 2/15/14 | | 900,000 | | 902,250 |
8% 10/1/15 (c) | | 2,080,000 | | 2,137,200 |
Qwest Corp. 3.7871% 6/15/13 (d) | | 385,000 | | 381,150 |
Sprint Capital Corp. 6.875% 11/15/28 | | 4,075,000 | | 3,382,250 |
Sprint Nextel Corp.: | | | | |
6% 12/1/16 | | 8,405,000 | | 7,543,488 |
8.375% 8/15/17 | | 5,065,000 | | 5,065,000 |
U.S. West Communications 7.5% 6/15/23 | | 6,035,000 | | 5,778,513 |
Wind Acquisition Finance SA 11.75% 7/15/17 (c) | | 4,510,000 | | 4,622,750 |
Wind Acquisition Holdings Finance SA 12.25% 7/15/17 pay-in-kind (c)(d) | | 4,825,000 | | 4,379,291 |
| | 151,674,194 |
Trucking & Freight - 0.2% |
Swift Transportation Co., Inc. 12.5% 5/15/17 (c) | | 2,680,000 | | 2,559,400 |
TOTAL NONCONVERTIBLE BONDS | | 927,833,399 |
TOTAL CORPORATE BONDS (Cost $912,092,414) | 932,686,719 |
Commercial Mortgage Securities - 0.0% |
|
LB Multi-family Mortgage Trust Series 1991-4 Class A1, 7.0832% 4/25/21 (c)(d)
(Cost $57,833) | | 92,036 | | 60,238 |
Common Stocks - 0.1% |
| Shares | | |
Cable TV - 0.1% |
Charter Communications, Inc. Class A (a) | 23,060 | | 814,018 |
Chemicals - 0.0% |
LyondellBasell Industries NV Class B (a) | 54 | | 872 |
Common Stocks - continued |
| Shares | | Value |
Textiles & Apparel - 0.0% |
Arena Brands Holding Corp. Class B (a)(f) | 48,889 | | $ 303,601 |
TOTAL COMMON STOCKS (Cost $2,736,180) | 1,118,491 |
Preferred Stocks - 0.4% |
| | | |
Convertible Preferred Stocks - 0.2% |
Electric Utilities - 0.2% |
AES Trust III 6.75% | 51,000 | | 2,203,710 |
Nonconvertible Preferred Stocks - 0.2% |
Diversified Financial Services - 0.2% |
GMAC, Inc. 7.00% (c) | 2,510 | | 1,945,250 |
TOTAL PREFERRED STOCKS (Cost $4,609,697) | 4,148,960 |
Floating Rate Loans - 6.0% |
| Principal Amount | | |
Aerospace - 0.2% |
Sequa Corp. term loan 3.5651% 12/3/14 (d) | | $ 2,370,000 | | 2,144,850 |
Air Transportation - 0.6% |
Delta Air Lines, Inc. Tranche 2LN, term loan 3.5478% 4/30/14 (d) | | 2,967,758 | | 2,641,304 |
US Airways Group, Inc. term loan 2.8128% 3/23/14 (d) | | 4,295,000 | | 3,393,050 |
| | 6,034,354 |
Automotive - 0.9% |
Federal-Mogul Corp.: | | | | |
Tranche B, term loan 2.2875% 12/27/14 (d) | | 3,664,698 | | 3,215,773 |
Tranche C, term loan 2.2875% 12/27/15 (d) | | 2,466,044 | | 2,139,293 |
Ford Motor Co. term loan 3.331% 12/15/13 (d) | | 4,224,214 | | 3,986,602 |
| | 9,341,668 |
Broadcasting - 0.3% |
Univision Communications, Inc. Tranche 1LN, term loan 2.5972% 9/29/14 (d) | | 3,835,648 | | 3,183,588 |
Capital Goods - 0.4% |
Dresser, Inc. Tranche 2LN, term loan 6.1951% 5/4/15 pay-in-kind (d) | | 4,950,000 | | 4,554,000 |
Containers - 0.4% |
Anchor Glass Container Corp.: | | | | |
Tranche 1LN, term loan 6% 3/2/16 (d) | | 1,833,144 | | 1,819,396 |
Tranche 2LN, term loan 10% 9/2/16 (d) | | 2,070,000 | | 2,028,600 |
| | 3,847,996 |
|
| Principal Amount | | Value |
Diversified Financial Services - 1.2% |
AWAS Aviation Acquisitions Ltd. term loan 7.75% 6/2/16 (d) | | $ 4,195,000 | | $ 4,168,781 |
Blackstone UTP Capital LLC term loan 7.75% 11/2/14 | | 3,965,075 | | 3,965,075 |
Clear Channel Capital I LLC Tranche B, term loan 3.9972% 1/29/16 (d) | | 2,130,000 | | 1,629,450 |
International Lease Finance Corp.: | | | | |
Tranche 1LN, term loan 6.75% 3/17/15 (d) | | 1,964,000 | | 1,944,360 |
Tranche 2LN, term loan 7% 3/17/16 (d) | | 1,441,000 | | 1,422,988 |
| | 13,130,654 |
Electric Utilities - 1.0% |
Ashmore Energy International: | | | | |
Revolving Credit-Linked Deposit 3.5334% 3/30/12 (d) | | 940,239 | | 866,195 |
term loan 3.5334% 3/30/14 (d) | | 10,240,082 | | 9,433,676 |
| | 10,299,871 |
Publishing/Printing - 0.1% |
Newsday LLC term loan 10.5% 8/1/13 | | 925,000 | | 957,375 |
Technology - 0.4% |
Avaya, Inc. term loan 3.2597% 10/24/14 (d) | | 2,298,106 | | 1,962,008 |
First Data Corp.: | | | | |
Tranche B1, term loan 3.0972% 9/24/14 (d) | | 900,738 | | 758,872 |
Tranche B3, term loan 3.0972% 9/24/14 (d) | | 1,259,967 | | 1,061,522 |
| | 3,782,402 |
Telecommunications - 0.5% |
Asurion Corp. Tranche 2LN, term loan 6.8503% 7/3/15 (d) | | 4,425,000 | | 4,314,375 |
Intelsat Jackson Holdings Ltd. term loan 3.2915% 2/1/14 (d) | | 830,000 | | 763,600 |
| | 5,077,975 |
TOTAL FLOATING RATE LOANS (Cost $60,529,716) | 62,354,733 |
Money Market Funds - 4.7% |
| Shares | | Value |
Fidelity Cash Central Fund, 0.20% (e)
(Cost $49,611,513) | 49,611,513 | | $ 49,611,513 |
TOTAL INVESTMENT PORTFOLIO - 100.1% (Cost $1,029,637,353) | | 1,049,980,654 |
NET OTHER ASSETS (LIABILITIES) - (0.1)% | | (1,032,155) |
NET ASSETS - 100% | $ 1,048,948,499 |
Legend |
(a) Non-income producing |
(b) Security initially issued in zero coupon form which converts to coupon form at a specified rate and date. The rate shown is the rate at period end. |
(c) Security exempt from registration under Rule 144A of the Securities Act of 1933. These securities may be resold in transactions exempt from registration, normally to qualified institutional buyers. At the end of the period, the value of these securities amounted to $295,926,986 or 28.2% of net assets. |
(d) The coupon rate shown on floating or adjustable rate securities represents the rate at period end. |
(e) Affiliated fund that is available only to investment companies and other accounts managed by Fidelity Investments. The rate quoted is the annualized seven-day yield of the fund at period end. A complete unaudited listing of the fund's holdings as of its most recent quarter end is available upon request. |
(f) Restricted securities - Investment in securities not registered under the Securities Act of 1933 (excluding 144A issues). At the end of the period, the value of restricted securities (excluding 144A issues) amounted to $303,601 or 0.0% of net assets. |
Additional information on each holding is as follows: |
Security | Acquisition Date | Acquisition Cost |
Arena Brands Holding Corp. Class B | 6/18/97 | $ 1,974,627 |
Affiliated Central Funds |
Information regarding fiscal year to date income earned by the Fund from investments in Fidelity Central Funds is as follows: |
Fund | Income earned |
Fidelity Cash Central Fund | $ 40,026 |
Other Information |
The following is a summary of the inputs used, as of June 30, 2010, involving the Fund's assets and liabilities carried at value. The inputs or methodology used for valuing securities may not be an indication of the risk associated with investing in those securities. For more information on valuation inputs, and their aggregation into the levels used in the tables below, please refer to the Security Valuation section in the accompanying Notes to Financial Statements. |
Valuation Inputs at Reporting Date: |
Description | Total | Level 1 | Level 2 | Level 3 |
Investments in Securities: | | | | |
Equities: | | | | |
Consumer Discretionary | $ 1,117,619 | $ 814,018 | $ - | $ 303,601 |
Financials | 1,945,250 | - | 1,945,250 | - |
Materials | 872 | 872 | - | - |
Utilities | 2,203,710 | - | 2,203,710 | - |
Corporate Bonds | 932,686,719 | - | 932,686,719 | - |
Commercial Mortgage Securities | 60,238 | - | - | 60,238 |
Floating Rate Loans | 62,354,733 | - | 62,354,733 | - |
Money Market Funds | 49,611,513 | 49,611,513 | - | - |
Total Investments in Securities: | $ 1,049,980,654 | $ 50,426,403 | $ 999,190,412 | $ 363,839 |
Other Information - continued |
The following is a reconciliation of Investments in Securities for which Level 3 inputs were used in determining value: |
Investments in Securities: | |
Beginning Balance | $ 431,931 |
Total Realized Gain (Loss) | - |
Total Unrealized Gain (Loss) | (64,519) |
Cost of Purchases | - |
Proceeds of Sales | (3,875) |
Amortization/Accretion | 302 |
Transfers in to Level 3 | - |
Transfers out of Level 3 | - |
Ending Balance | $ 363,839 |
The change in unrealized gain (loss) for the period attributable to Level 3 securities held at June 30, 2010 | $ (64,519) |
The information used in the above reconciliation represents fiscal year to date activity for any Investments in Securities identified as using Level 3 inputs at either the beginning or the end of the current fiscal period. Transfers in or out of Level 3 represent the beginning value of any Security or Instrument where a change in the pricing level occurred from the beginning to the end of the period. The cost of purchases and the proceeds of sales may include securities received or delivered through corporate actions or exchanges. Realized and unrealized gains (losses) disclosed in the reconciliation are included in Net Gain (Loss) on the Fund's Statement of Operations. |
Distribution of investments by country of issue, as a percentage of total net assets, is as follows: (Unaudited) |
United States of America | 82.4% |
Bermuda | 6.9% |
Canada | 3.7% |
Liberia | 1.5% |
Cayman Islands | 1.5% |
Others (Individually Less Than 1%) | 4.0% |
| 100.0% |
Income Tax Information |
At December 31, 2009, the Fund had a capital loss carryforward of approximately $238,711,832 of which $88,480,642, $70,783,139 and $79,448,051 will expire on December 31, 2010, 2016 and 2017, respectively. Capital loss carryforwards are only available to offset future capital gains of the Fund to the extent provided by regulations and may be limited. |
See accompanying notes which are an integral part of the financial statements.
Semiannual Report
Financial Statements
Statement of Assets and Liabilities
| June 30, 2010 (Unaudited) |
| | |
Assets | | |
Investment in securities, at value - See accompanying schedule: Unaffiliated issuers (cost $980,025,840) | $ 1,000,369,141 | |
Fidelity Central Funds (cost $49,611,513) | 49,611,513 | |
Total Investments (cost $1,029,637,353) | | $ 1,049,980,654 |
Cash | | 592,150 |
Receivable for investments sold | | 9,165,728 |
Receivable for fund shares sold | | 159,636 |
Interest receivable | | 19,233,988 |
Distributions receivable from Fidelity Central Funds | | 7,637 |
Other receivables | | 1,415 |
Total assets | | 1,079,141,208 |
| | |
Liabilities | | |
Payable for investments purchased | $ 26,754,314 | |
Payable for fund shares redeemed | 2,733,276 | |
Accrued management fee | 486,461 | |
Distribution fees payable | 38,367 | |
Other affiliated payables | 92,363 | |
Other payables and accrued expenses | 87,928 | |
Total liabilities | | 30,192,709 |
| | |
Net Assets | | $ 1,048,948,499 |
Net Assets consist of: | | |
Paid in capital | | $ 1,199,914,615 |
Undistributed net investment income | | 52,555,115 |
Accumulated undistributed net realized gain (loss) on investments | | (223,853,670) |
Net unrealized appreciation (depreciation) on investments | | 20,332,439 |
Net Assets | | $ 1,048,948,499 |
Statement of Assets and Liabilities - continued
| June 30, 2010 (Unaudited) |
| | |
Initial Class:
Net Asset Value, offering price and redemption price per share ($569,349,690 ÷ 104,073,330 shares) | | $ 5.47 |
| | |
Service Class:
Net Asset Value, offering price and redemption price per share ($95,816,811 ÷ 17,606,851 shares) | | $ 5.44 |
| | |
Service Class 2:
Net Asset Value, offering price and redemption price per share ($125,191,990 ÷ 23,387,878 shares) | | $ 5.35 |
| | |
Initial Class R:
Net Asset Value, offering price and redemption price per share ($29,410,469 ÷ 5,392,805 shares) | | $ 5.45 |
| | |
Service Class R:
Net Asset Value, offering price and redemption price per share ($37,311,614 ÷ 6,878,971 shares) | | $ 5.42 |
| | |
Service Class 2R:
Net Asset Value, offering price and redemption price per share ($1,968,209 ÷ 368,212 shares) | | $ 5.35 |
| | |
Investor Class:
Net Asset Value, offering price and redemption price per share ($189,899,716 ÷ 34,813,113 shares) | | $ 5.45 |
See accompanying notes which are an integral part of the financial statements.
Semiannual Report
Statement of Operations
Six months ended June 30, 2010 (Unaudited) |
| | |
Investment Income | | |
Dividends | | $ 86,062 |
Interest | | 48,492,872 |
Income from Fidelity Central Funds | | 40,026 |
Total income | | 48,618,960 |
| | |
Expenses | | |
Management fee | $ 3,141,381 | |
Transfer agent fees | 417,418 | |
Distribution fees | 273,065 | |
Accounting fees and expenses | 195,524 | |
Custodian fees and expenses | 13,032 | |
Independent trustees' compensation | 3,266 | |
Audit | 34,102 | |
Legal | 16,136 | |
Interest | 902 | |
Miscellaneous | 52,622 | |
Total expenses before reductions | 4,147,448 | |
Expense reductions | (661) | 4,146,787 |
Net investment income | | 44,472,173 |
Realized and Unrealized Gain (Loss) Net realized gain (loss) on: | | |
Investment securities: | | |
Unaffiliated issuers | | 15,828,409 |
Change in net unrealized appreciation (depreciation) on investment securities | | (24,518,045) |
Net gain (loss) | | (8,689,636) |
Net increase (decrease) in net assets resulting from operations | | $ 35,782,537 |
Statement of Changes in Net Assets
| Six months ended
June 30, 2010
(Unaudited) | Year ended
December 31,
2009 |
Increase (Decrease) in Net Assets | | |
Operations | | |
Net investment income | $ 44,472,173 | $ 88,146,519 |
Net realized gain (loss) | 15,828,409 | (80,957,504) |
Change in net unrealized appreciation (depreciation) | (24,518,045) | 340,753,509 |
Net increase (decrease) in net assets resulting from operations | 35,782,537 | 347,942,524 |
Distributions to shareholders from net investment income | - | (82,969,090) |
Share transactions - net increase (decrease) | (147,396,238) | 122,868,111 |
Redemption fees | 97,688 | 89,023 |
Total increase (decrease) in net assets | (111,516,013) | 387,930,568 |
| | |
Net Assets | | |
Beginning of period | 1,160,464,512 | 772,533,944 |
End of period (including undistributed net investment income of $52,555,115 and undistributed net investment income of $8,082,942, respectively) | $ 1,048,948,499 | $ 1,160,464,512 |
See accompanying notes which are an integral part of the financial statements.
Semiannual Report
Financial Highlights - Initial Class
| Six months ended
June 30, 2010 | Years ended December 31, |
| (Unaudited) | 2009 | 2008 | 2007 | 2006 | 2005 |
Selected Per-Share Data | | | | | | |
Net asset value, beginning of period | $ 5.29 | $ 3.96 | $ 5.98 | $ 6.35 | $ 6.17 | $ 7.00 |
Income from Investment Operations | | | | | | |
Net investment income E | .219 | .438 | .475 | .485 | .476 | .457 |
Net realized and unrealized gain (loss) | (.039) | 1.298 | (1.990) | (.311) | .216 | (.281) |
Total from investment operations | .180 | 1.736 | (1.515) | .174 | .692 | .176 |
Distributions from net investment income | - | (.406) | (.506) | (.545) | (.512) | (1.006) |
Redemption fees added to paid in capital E | - I | - I | .001 | .001 | - | - |
Net asset value, end of period | $ 5.47 | $ 5.29 | $ 3.96 | $ 5.98 | $ 6.35 | $ 6.17 |
Total Return B, C, D | 3.40% | 43.96% | (24.98)% | 2.79% | 11.24% | 2.70% |
Ratios to Average Net Assets F, H | | | | | | |
Expenses before reductions | .70% A | .70% | .71% | .68% | .71% | .70% |
Expenses net of fee waivers, if any | .70% A | .70% | .71% | .68% | .71% | .70% |
Expenses net of all reductions | .70% A | .70% | .70% | .68% | .71% | .70% |
Net investment income | 8.14% A | 9.02% | 8.48% | 7.47% | 7.40% | 6.98% |
Supplemental Data | | | | | | |
Net assets, end of period (000 omitted) | $ 569,350 | $ 608,802 | $ 451,824 | $ 726,409 | $ 922,565 | $ 1,080,002 |
Portfolio turnover rate G | 88% A | 70% | 58% | 70% | 65% | 95% |
A Annualized
B Total returns for periods of less than one year are not annualized.
C Total returns do not reflect charges attributable to your insurance company's separate account. Inclusion of these charges would reduce the total returns shown.
D Total returns would have been lower had certain expenses not been reduced during the periods shown.
E Calculated based on average shares outstanding during the period.
F Fees and expenses of the underlying Fidelity Central Funds are not included in the Fund's expense ratio. The Fund indirectly bears its proportionate share of the expenses of any underlying Fidelity Central Funds.
G Amount does not include the portfolio activity of any underlying Fidelity Central Funds.
H Expense ratios reflect operating expenses of the class. Expenses before reductions do not reflect amounts reimbursed by the investment adviser or reductions from brokerage service arrangements or reductions from other expense offset arrangements and do not represent the amount paid by the class during periods when reimbursements or reductions occur. Expenses net of fee waivers reflect expenses after reimbursement by the investment adviser but prior to reductions from brokerage service arrangements or other expense offset arrangements. Expenses net of all reductions represent the net expenses paid by the class.
I Amount represents less than $.001 per share.
Financial Highlights - Service Class
| Six months ended
June 30, 2010 | Years ended December 31, |
| (Unaudited) | 2009 | 2008 | 2007 | 2006 | 2005 |
Selected Per-Share Data | | | | | | |
Net asset value, beginning of period | $ 5.26 | $ 3.95 | $ 5.95 | $ 6.32 | $ 6.14 | $ 6.97 |
Income from Investment Operations | | | | | | |
Net investment income E | .215 | .429 | .469 | .477 | .467 | .448 |
Net realized and unrealized gain (loss) | (.035) | 1.281 | (1.971) | (.312) | .218 | (.283) |
Total from investment operations | .180 | 1.710 | (1.502) | .165 | .685 | .165 |
Distributions from net investment income | - | (.400) | (.499) | (.536) | (.505) | (.995) |
Redemption fees added to paid in capital E | - I | - I | .001 | .001 | - | - |
Net asset value, end of period | $ 5.44 | $ 5.26 | $ 3.95 | $ 5.95 | $ 6.32 | $ 6.14 |
Total Return B, C, D | 3.42% | 43.41% | (24.87)% | 2.66% | 11.18% | 2.52% |
Ratios to Average Net Assets F, H | | | | | | |
Expenses before reductions | .80% A | .80% | .80% | .78% | .81% | .80% |
Expenses net of fee waivers, if any | .80% A | .80% | .80% | .78% | .81% | .80% |
Expenses net of all reductions | .80% A | .80% | .80% | .78% | .81% | .80% |
Net investment income | 8.04% A | 8.92% | 8.39% | 7.37% | 7.30% | 6.88% |
Supplemental Data | | | | | | |
Net assets, end of period (000 omitted) | $ 95,817 | $ 103,511 | $ 95,461 | $ 180,837 | $ 277,546 | $ 319,380 |
Portfolio turnover rate G | 88% A | 70% | 58% | 70% | 65% | 95% |
A Annualized
B Total returns for periods of less than one year are not annualized.
C Total returns do not reflect charges attributable to your insurance company's separate account. Inclusion of these charges would reduce the total returns shown.
D Total returns would have been lower had certain expenses not been reduced during the periods shown.
E Calculated based on average shares outstanding during the period.
F Fees and expenses of the underlying Fidelity Central Funds are not included in the Fund's expense ratio. The Fund indirectly bears its proportionate share of the expenses of any underlying Fidelity Central Funds.
G Amount does not include the portfolio activity of any underlying Fidelity Central Funds.
H Expense ratios reflect operating expenses of the class. Expenses before reductions do not reflect amounts reimbursed by the investment adviser or reductions from brokerage service arrangements or reductions from other expense offset arrangements and do not represent the amount paid by the class during periods when reimbursements or reductions occur. Expenses net of fee waivers reflect expenses after reimbursement by the investment adviser but prior to reductions from brokerage service arrangements or other expense offset arrangements. Expenses net of all reductions represent the net expenses paid by the class.
I Amount represents less than $.001 per share.
See accompanying notes which are an integral part of the financial statements.
Semiannual Report
Financial Highlights - Service Class 2
| Six months ended
June 30, 2010 | Years ended December 31, |
| (Unaudited) | 2009 | 2008 | 2007 | 2006 | 2005 |
Selected Per-Share Data | | | | | | |
Net asset value, beginning of period | $ 5.18 | $ 3.89 | $ 5.88 | $ 6.25 | $ 6.08 | $ 6.91 |
Income from Investment Operations | | | | | | |
Net investment income E | .209 | .422 | .450 | .461 | .453 | .433 |
Net realized and unrealized gain (loss) | (.039) | 1.264 | (1.949) | (.305) | .216 | (.284) |
Total from investment operations | .170 | 1.686 | (1.499) | .156 | .669 | .149 |
Distributions from net investment income | - | (.396) | (.492) | (.527) | (.499) | (.979) |
Redemption fees added to paid in capital E | - I | - I | .001 | .001 | - | - |
Net asset value, end of period | $ 5.35 | $ 5.18 | $ 3.89 | $ 5.88 | $ 6.25 | $ 6.08 |
Total Return B, C, D | 3.28% | 43.46% | (25.14)% | 2.54% | 11.02% | 2.31% |
Ratios to Average Net Assets F, H | | | | | | |
Expenses before reductions | .95% A | .95% | .96% | .93% | .97% | .95% |
Expenses net of fee waivers, if any | .95% A | .95% | .96% | .93% | .97% | .95% |
Expenses net of all reductions | .95% A | .95% | .96% | .93% | .97% | .95% |
Net investment income | 7.89% A | 8.77% | 8.23% | 7.22% | 7.14% | 6.72% |
Supplemental Data | | | | | | |
Net assets, end of period (000 omitted) | $ 125,192 | $ 181,377 | $ 87,077 | $ 97,266 | $ 110,503 | $ 86,757 |
Portfolio turnover rate G | 88% A | 70% | 58% | 70% | 65% | 95% |
A Annualized
B Total returns for periods of less than one year are not annualized.
C Total returns do not reflect charges attributable to your insurance company's separate account. Inclusion of these charges would reduce the total returns shown.
D Total returns would have been lower had certain expenses not been reduced during the periods shown.
E Calculated based on average shares outstanding during the period.
F Fees and expenses of the underlying Fidelity Central Funds are not included in the Fund's expense ratio. The Fund indirectly bears its proportionate share of the expenses of any underlying Fidelity Central Funds.
G Amount does not include the portfolio activity of any underlying Fidelity Central Funds.
H Expense ratios reflect operating expenses of the class. Expenses before reductions do not reflect amounts reimbursed by the investment adviser or reductions from brokerage service arrangements or reductions from other expense offset arrangements and do not represent the amount paid by the class during periods when reimbursements or reductions occur. Expenses net of fee waivers reflect expenses after reimbursement by the investment adviser but prior to reductions from brokerage service arrangements or other expense offset arrangements. Expenses net of all reductions represent the net expenses paid by the class.
I Amount represents less than $.001 per share.
Financial Highlights - Initial Class R
| Six months ended
June 30, 2010 | Years ended December 31, |
| (Unaudited) | 2009 | 2008 | 2007 | 2006 | 2005 |
Selected Per-Share Data | | | | | | |
Net asset value, beginning of period | $ 5.27 | $ 3.95 | $ 5.96 | $ 6.34 | $ 6.16 | $ 7.00 |
Income from Investment Operations | | | | | | |
Net investment income E | .219 | .440 | .471 | .479 | .475 | .455 |
Net realized and unrealized gain (loss) | (.039) | 1.286 | (1.975) | (.313) | .218 | (.288) |
Total from investment operations | .180 | 1.726 | (1.504) | .166 | .693 | .167 |
Distributions from net investment income | - | (.406) | (.507) | (.547) | (.513) | (1.007) |
Redemption fees added to paid in capital E | - I | - I | .001 | .001 | - | - |
Net asset value, end of period | $ 5.45 | $ 5.27 | $ 3.95 | $ 5.96 | $ 6.34 | $ 6.16 |
Total Return B, C, D | 3.42% | 43.82% | (24.88)% | 2.65% | 11.27% | 2.55% |
Ratios to Average Net Assets F, H | | | | | | |
Expenses before reductions | .70% A | .70% | .70% | .68% | .71% | .70% |
Expenses net of fee waivers, if any | .70% A | .70% | .70% | .68% | .71% | .70% |
Expenses net of all reductions | .70% A | .69% | .70% | .67% | .71% | .70% |
Net investment income | 8.14% A | 9.02% | 8.49% | 7.47% | 7.39% | 6.98% |
Supplemental Data | | | | | | |
Net assets, end of period (000 omitted) | $ 29,410 | $ 34,080 | $ 19,801 | $ 19,401 | $ 93 | $ 83 |
Portfolio turnover rate G | 88% A | 70% | 58% | 70% | 65% | 95% |
A Annualized
B Total returns for periods of less than one year are not annualized.
C Total returns do not reflect charges attributable to your insurance company's separate account. Inclusion of these charges would reduce the total returns shown.
D Total returns would have been lower had certain expenses not been reduced during the periods shown.
E Calculated based on average shares outstanding during the period.
F Fees and expenses of the underlying Fidelity Central Funds are not included in the Fund's expense ratio. The Fund indirectly bears its proportionate share of the expenses of any underlying Fidelity Central Funds.
G Amount does not include the portfolio activity of any underlying Fidelity Central Funds.
H Expense ratios reflect operating expenses of the class. Expenses before reductions do not reflect amounts reimbursed by the investment adviser or reductions from brokerage service arrangements or reductions from other expense offset arrangements and do not represent the amount paid by the class during periods when reimbursements or reductions occur. Expenses net of fee waivers reflect expenses after reimbursement by the investment adviser but prior to reductions from brokerage service arrangements or other expense offset arrangements. Expenses net of all reductions represent the net expenses paid by the class.
I Amount represents less than $.001 per share.
See accompanying notes which are an integral part of the financial statements.
Semiannual Report
Financial Highlights - Service Class R
| Six months ended
June 30, 2010 | Years ended December 31, |
| (Unaudited) | 2009 | 2008 | 2007 | 2006 | 2005 |
Selected Per-Share Data | | | | | | |
Net asset value, beginning of period | $ 5.25 | $ 3.94 | $ 5.93 | $ 6.32 | $ 6.14 | $ 6.97 |
Income from Investment Operations | | | | | | |
Net investment income E | .215 | .431 | .467 | .471 | .467 | .447 |
Net realized and unrealized gain (loss) | (.045) | 1.280 | (1.959) | (.318) | .219 | (.282) |
Total from investment operations | .170 | 1.711 | (1.492) | .153 | .686 | .165 |
Distributions from net investment income | - | (.401) | (.499) | (.544) | (.506) | (.995) |
Redemption fees added to paid in capital E | - I | - I | .001 | .001 | - | - |
Net asset value, end of period | $ 5.42 | $ 5.25 | $ 3.94 | $ 5.93 | $ 6.32 | $ 6.14 |
Total Return B, C, D | 3.24% | 43.56% | (24.79)% | 2.45% | 11.19% | 2.53% |
Ratios to Average Net Assets F, H | | | | | | |
Expenses before reductions | .80% A | .80% | .80% | .78% | .81% | .80% |
Expenses net of fee waivers, if any | .80% A | .80% | .80% | .78% | .81% | .80% |
Expenses net of all reductions | .80% A | .80% | .80% | .77% | .81% | .80% |
Net investment income | 8.04% A | 8.92% | 8.39% | 7.37% | 7.30% | 6.88% |
Supplemental Data | | | | | | |
Net assets, end of period (000 omitted) | $ 37,312 | $ 47,873 | $ 26,572 | $ 33,129 | $ 92 | $ 83 |
Portfolio turnover rate G | 88% A | 70% | 58% | 70% | 65% | 95% |
A Annualized
B Total returns for periods of less than one year are not annualized.
C Total returns do not reflect charges attributable to your insurance company's separate account. Inclusion of these charges would reduce the total returns shown.
D Total returns would have been lower had certain expenses not been reduced during the periods shown.
E Calculated based on average shares outstanding during the period.
F Fees and expenses of the underlying Fidelity Central Funds are not included in the Fund's expense ratio. The Fund indirectly bears its proportionate share of the expenses of any underlying Fidelity Central Funds.
G Amount does not include the portfolio activity of any underlying Fidelity Central Funds.
H Expense ratios reflect operating expenses of the class. Expenses before reductions do not reflect amounts reimbursed by the investment adviser or reductions from brokerage service arrangements or reductions from other expense offset arrangements and do not represent the amount paid by the class during periods when reimbursements or reductions occur. Expenses net of fee waivers reflect expenses after reimbursement by the investment adviser but prior to reductions from brokerage service arrangements or other expense offset arrangements. Expenses net of all reductions represent the net expenses paid by the class.
I Amount represents less than $.001 per share.
Financial Highlights - Service Class 2R
| Six months ended
June 30, 2010 | Years ended December 31, |
| (Unaudited) | 2009 | 2008 | 2007 | 2006 | 2005 |
Selected Per-Share Data | | | | | | |
Net asset value, beginning of period | $ 5.17 | $ 3.89 | $ 5.87 | $ 6.25 | $ 6.08 | $ 6.91 |
Income from Investment Operations | | | | | | |
Net investment income E | .208 | .416 | .451 | .453 | .453 | .433 |
Net realized and unrealized gain (loss) | (.028) | 1.257 | (1.940) | (.294) | .214 | (.282) |
Total from investment operations | .180 | 1.673 | (1.489) | .159 | .667 | .151 |
Distributions from net investment income | - | (.393) | (.492) | (.540) | (.497) | (.981) |
Redemption fees added to paid in capital E | - I | - I | .001 | .001 | - | - |
Net asset value, end of period | $ 5.35 | $ 5.17 | $ 3.89 | $ 5.87 | $ 6.25 | $ 6.08 |
Total Return B, C, D | 3.48% | 43.13% | (24.99)% | 2.59% | 10.99% | 2.33% |
Ratios to Average Net Assets F, H | | | | | | |
Expenses before reductions | .95% A | .95% | .95% | .93% | .96% | .94% |
Expenses net of fee waivers, if any | .95% A | .95% | .95% | .93% | .96% | .94% |
Expenses net of all reductions | .95% A | .94% | .95% | .92% | .96% | .94% |
Net investment income | 7.89% A | 8.77% | 8.24% | 7.23% | 7.14% | 6.73% |
Supplemental Data | | | | | | |
Net assets, end of period (000 omitted) | $ 1,968 | $ 2,016 | $ 1,487 | $ 2,347 | $ 92 | $ 83 |
Portfolio turnover rate G | 88% A | 70% | 58% | 70% | 65% | 95% |
A Annualized
B Total returns for periods of less than one year are not annualized.
C Total returns do not reflect charges attributable to your insurance company's separate account. Inclusion of these charges would reduce the total returns shown.
D Total returns would have been lower had certain expenses not been reduced during the periods shown.
E Calculated based on average shares outstanding during the period.
F Fees and expenses of the underlying Fidelity Central Funds are not included in the Fund's expense ratio. The Fund indirectly bears its proportionate share of the expenses of any underlying Fidelity Central Funds.
G Amount does not include the portfolio activity of any underlying Fidelity Central Funds.
H Expense ratios reflect operating expenses of the class. Expenses before reductions do not reflect amounts reimbursed by the investment adviser or reductions from brokerage service arrangements or reductions from other expense offset arrangements and do not represent the amount paid by the class during periods when reimbursements or reductions occur. Expenses net of fee waivers reflect expenses after reimbursement by the investment adviser but prior to reductions from brokerage service arrangements or other expense offset arrangements. Expenses net of all reductions represent the net expenses paid by the class.
I Amount represents less than $.001 per share.
See accompanying notes which are an integral part of the financial statements.
Semiannual Report
Financial Highlights - Investor Class
| Six months ended
June 30, 2010 | Years ended December 31, |
| (Unaudited) | 2009 | 2008 | 2007 | 2006 | 2005 H |
Selected Per-Share Data | | | | | | |
Net asset value, beginning of period | $ 5.27 | $ 3.96 | $ 5.96 | $ 6.34 | $ 6.16 | $ 6.54 |
Income from Investment Operations | | | | | | |
Net investment income E | .218 | .441 | .473 | .477 | .471 | .193 |
Net realized and unrealized gain (loss) | (.038) | 1.274 | (1.971) | (.317) | .220 | (.089) |
Total from investment operations | .180 | 1.715 | (1.498) | .160 | .691 | .104 |
Distributions from net investment income | - | (.405) | (.503) | (.541) | (.511) | (.484) |
Redemption fees added to paid in capital E | - J | - J | .001 | .001 | - | - |
Net asset value, end of period | $ 5.45 | $ 5.27 | $ 3.96 | $ 5.96 | $ 6.34 | $ 6.16 |
Total Return B, C, D | 3.42% | 43.43% | (24.76)% | 2.56% | 11.24% | 1.60% |
Ratios to Average Net Assets F, I | | | | | | |
Expenses before reductions | .73% A | .73% | .74% | .75% | .80% | .82% A |
Expenses net of fee waivers, if any | .73% A | .73% | .74% | .75% | .80% | .82% A |
Expenses net of all reductions | .73% A | .73% | .74% | .75% | .79% | .82% A |
Net investment income | 8.11% A | 8.99% | 8.45% | 7.40% | 7.31% | 6.86% A |
Supplemental Data | | | | | | |
Net assets, end of period (000 omitted) | $ 189,900 | $ 182,806 | $ 90,312 | $ 105,920 | $ 78,122 | $ 17,363 |
Portfolio turnover rate G | 88% A | 70% | 58% | 70% | 65% | 95% |
A Annualized
B Total returns for periods of less than one year are not annualized.
C Total returns do not reflect charges attributable to your insurance company's separate account. Inclusion of these charges would reduce the total returns shown.
D Total returns would have been lower had certain expenses not been reduced during the periods shown.
E Calculated based on average shares outstanding during the period.
F Fees and expenses of the underlying Fidelity Central Funds are not included in the Fund's expense ratio. The Fund indirectly bears its proportionate share of the expenses of any underlying Fidelity Central Funds.
G Amount does not include the portfolio activity of any underlying Fidelity Central Funds.
H For the period July 21, 2005 (commencement of sale of shares) to December 31, 2005.
I Expense ratios reflect operating expenses of the class. Expenses before reductions do not reflect amounts reimbursed by the investment adviser or reductions from brokerage service arrangements or reductions from other expense offset arrangements and do not represent the amount paid by the class during periods when reimbursements or reductions occur. Expense ratios before reductions for start-up periods may not be representative of longer-term operating periods. Expenses net of fee waivers reflect expenses after reimbursement by the investment adviser but prior to reductions from brokerage service arrangements or other expense offset arrangements. Expenses net of all reductions represent the net expenses paid by the class.
J Amount represents less than $.001 per share.
See accompanying notes which are an integral part of the financial statements.
Semiannual Report
Notes to Financial Statements
For the period ended June 30, 2010 (Unaudited)
1. Organization.
VIP High Income Portfolio (the Fund) is a fund of Variable Insurance Products Fund (the Trust) and is authorized to issue an unlimited number of shares. The Trust is registered under the Investment Company Act of 1940, as amended (the 1940 Act), as an open-end management investment company organized as a Massachusetts business trust. Shares of the Fund may only be purchased by insurance companies for the purpose of funding variable annuity or variable life insurance contracts. The Fund offers the following classes of shares: Initial Class shares, Service Class shares, Service Class 2 shares, Initial Class R shares, Service Class R shares, Service Class 2R shares, and Investor Class shares. All classes have equal rights and voting privileges, except for matters affecting a single class. Investment income, realized and unrealized capital gains and losses, the common expenses of the Fund, and certain fund-level expense reductions, if any, are allocated on a pro-rata basis to each class based on the relative net assets of each class to the total net assets of the Fund. Each class differs with respect to transfer agent and distribution and service plan fees incurred. Certain expense reductions also differ by class.
2. Investments in Fidelity Central Funds.
The Fund may invest in Fidelity Central Funds, which are open-end investment companies available only to other investment companies and accounts managed by Fidelity Management & Research Company (FMR) and its affiliates. The Fund's Schedule of Investments lists each of the Fidelity Central Funds held as of period end, if any, as an investment of the Fund, but does not include the underlying holdings of each Fidelity Central Fund. As an Investing Fund, the Fund indirectly bears its proportionate share of the expenses of the underlying Fidelity Central Funds.
The Money Market Central Funds seek preservation of capital and current income and are managed by Fidelity Investments Money Management, Inc. (FIMM), an affiliate of FMR.
A complete unaudited list of holdings for each Fidelity Central Fund is available upon request or at the Securities and Exchange Commission (the SEC) web site at www.sec.gov. In addition, the financial statements of the Fidelity Central Funds are available on the SEC web site or upon request.
3. Significant Accounting Policies.
The financial statements have been prepared in conformity with accounting principles generally accepted in the United States of America (GAAP), which require management to make certain estimates and assumptions at the date of the financial statements. Actual results could differ from those estimates. The following summarizes the significant accounting policies of the Fund:
Security Valuation. Investments are valued as of 4:00 p.m. Eastern time on the last calendar day of the period. The Fund uses independent pricing services approved by the Board of Trustees to value its investments. When current market prices or quotations are not readily available or reliable, valuations may be determined in good faith in accordance with procedures adopted by the Board of Trustees. Factors used in determining value may include market or security specific events, changes in interest rates and credit quality. The frequency with which these procedures are used cannot be predicted and they may be utilized to a significant extent. The value used for net asset value (NAV) calculation under these procedures may differ from published prices for the same securities.
The Fund categorizes the inputs to valuation techniques used to value its investments into a disclosure hierarchy consisting of three levels as shown below.
Level 1 - quoted prices in active markets for identical investments
Level 2 - other significant observable inputs (including quoted prices for similar investments, interest rates, prepayment speeds, etc.)
Level 3 - unobservable inputs (including the fund's own assumptions based on the best information available)
Changes in valuation techniques may result in transfers in or out of an assigned level within the disclosure hierarchy. The aggregate value of investments by input level, as of June 30, 2010, for the Fund's investments, as well as a roll forward of Level 3 securities, is included at the end of the Fund's Schedule of Investments. Valuation techniques used to value the Fund's investments by major category are as follows.
Debt securities, including restricted securities, are valued based on evaluated prices received from independent pricing services or from dealers who make markets in such securities. For corporate bonds and floating rate loans, pricing services utilize matrix pricing which considers yield or price of bonds of comparable quality, coupon, maturity and type as well as dealer supplied prices and are generally categorized as Level 2 in the hierarchy. For commercial mortgage securities, pricing services utilize matrix pricing which considers prepayment speed assumptions, attributes of the collateral, yield or price of bonds of comparable quality, coupon, maturity and type as well as dealer supplied prices and, accordingly, such securities are generally categorized as Level 2 in the hierarchy. Dealers which make markets in asset backed securities, collateralized mortgage obligations and commercial mortgage securities may also consider such factors as the structure of the issue, cash flow assumptions, the value of underlying assets as well as any guarantees. Short-term securities with remaining maturities of sixty days or less for which quotations are not readily available are valued at amortized cost, which approximates value and are categorized as Level 2 in the hierarchy. The Fund invests a significant portion of its assets in below investment
Semiannual Report
3. Significant Accounting Policies - continued
Security Valuation - continued
grade securities. The value of these securities can be more volatile due to changes in the credit quality of the issuer and is sensitive to changes in economic, market and regulatory conditions.
When independent prices are unavailable or unreliable, debt securities may be valued utilizing pricing matrices which consider similar factors that would be used by independent pricing services. These are generally categorized as Level 2 in the hierarchy but may be Level 3 depending on the circumstances.
Equity securities, including restricted securities, for which market quotations are readily available, are valued at the last reported sale price or official closing price as reported by an independent pricing service on the primary market or exchange on which they are traded and are categorized as Level 1 in the hierarchy. In the event there were no sales during the day or closing prices are not available, securities are valued at the last quoted bid price or may be valued using the last available price and are generally categorized as Level 2 in the hierarchy. For restricted securities and private placements where observable inputs are limited, assumptions about market activity and risk are used and are categorized as Level 3 in the hierarchy.
Investments in open-end mutual funds, including the Fidelity Central Funds, are valued at their closing net asset value each business day and are categorized as Level 1 in the hierarchy.
Investment Transactions and Income. For financial reporting purposes, the Fund's investment holdings and NAV include trades executed through the end of the last business day of the period. The NAV per share for processing shareholder transactions is calculated as of the close of business of the New York Stock Exchange (NYSE), normally 4:00 p.m. Eastern time and includes trades executed through the end of the prior business day. Gains and losses on securities sold are determined on the basis of identified cost and may include proceeds received from litigation. Dividend income is recorded on the ex-dividend date, except for certain dividends from foreign securities where the ex-dividend date may have passed, which are recorded as soon as the Fund is informed of the ex-dividend date. Non-cash dividends included in dividend income, if any, are recorded at the fair market value of the securities received. Interest income and distributions from the Fidelity Central Funds are accrued as earned. Interest income includes coupon interest and amortization of premium and accretion of discount on debt securities.
Expenses. Most expenses of the Trust can be directly attributed to a fund. Expenses which cannot be directly attributed are apportioned amongst each fund in the Trust. Expense estimates are accrued in the period to which they relate and adjustments are made when actual amounts are known.
Income Tax Information and Distributions to Shareholders. Each year, the Fund intends to qualify as a regulated investment company by distributing substantially all of its taxable income and realized gains under Subchapter M of the Internal Revenue Code and filing its U.S. federal tax return. As a result, no provision for income taxes is required. A fund's federal tax return is subject to examination by the Internal Revenue Service (IRS) for a period of three years.
Distributions are recorded on the ex-dividend date. Income dividends and capital gain distributions are declared separately for each class. Income and capital gain distributions are determined in accordance with income tax regulations, which may differ from GAAP.
Capital accounts within the financial statements are adjusted for permanent book-tax differences. These adjustments have no impact on net assets or the results of operations. Temporary book-tax differences will reverse in a subsequent period.
Book-tax differences are primarily due to market discount, deferred trustees compensation, capital loss carryforwards, expiring capital loss carryforwards, and losses deferred due to wash sales.
The federal tax cost of investment securities and unrealized appreciation (depreciation) as of period end were as follows:
Gross unrealized appreciation | $ 48,829,700 |
Gross unrealized depreciation | (21,965,480) |
Net unrealized appreciation (depreciation) | $ 26,864,220 |
Tax cost | $ 1,023,116,434 |
Trading (Redemption) Fees. Initial Class R shares, Service Class R shares, and Service Class 2 R shares held less than 60 days are subject to a redemption fee equal to 1% of the proceeds of the redeemed shares. All redemption fees, including any estimated redemption fees paid by FMR, are retained by the Fund and accounted for as an addition to paid in capital.
Semiannual Report
Notes to Financial Statements (Unaudited) - continued
4. Operating Policies.
Restricted Securities. The Fund may invest in securities that are subject to legal or contractual restrictions on resale. These securities generally may be resold in transactions exempt from registration or to the public if the securities are registered. Disposal of these securities may involve time-consuming negotiations and expense, and prompt sale at an acceptable price may be difficult. Information regarding restricted securities is included at the end of the Fund's Schedule of Investments.
Loans and Other Direct Debt Instruments. The Fund may invest in loans and loan participations, trade claims or other receivables. These investments may include standby financing commitments, including revolving credit facilities, that obligate the Fund to supply additional cash to the borrower on demand. Loan participations involve a risk of insolvency of the lending bank or other financial intermediary. The Fund may be contractually obligated to receive approval from the agent bank and/or borrower prior to the sale of these investments.
5. Purchases and Sales of Investments.
Purchases and sales of securities, other than short-term securities, aggregated $458,575,055 and $568,889,167, respectively.
6. Fees and Other Transactions with Affiliates.
Management Fee. FMR and its affiliates provide the Fund with investment management related services for which the Fund pays a monthly management fee. The management fee is the sum of an individual fund fee rate that is based on an annual rate of .45% of the Fund's average net assets and a group fee rate that averaged .12% during the period. The group fee rate is based upon the average net assets of all the mutual funds advised by FMR. The group fee rate decreases as assets under management increase and increases as assets under management decrease. For the period, the total annualized management fee rate was .57% of the Fund's average net assets.
Distribution and Service Plan. In accordance with Rule 12b-1 of the 1940 Act, the Fund has adopted separate 12b-1 Plans for each Service Class of shares. Each Service Class pays Fidelity Distributors Corporation (FDC), an affiliate of FMR, a service fee. For the period, the service fee is based on an annual rate of .10% of Service Class' and Service Class R's average net assets and .25% of Service Class 2's and Service Class 2R's average net assets.
For the period, each class paid FDC the following amounts, all of which were re-allowed to insurance companies for the distribution of shares and providing shareholder support services:
Service Class | $ 50,657 |
Service Class 2 | 198,447 |
Service Class R | 21,314 |
Service Class 2R | 2,647 |
| $ 273,065 |
Transfer Agent Fees. Fidelity Investments Institutional Operations Company, Inc. (FIIOC), an affiliate of FMR, is the Fund's transfer, dividend disbursing, and shareholder servicing agent. FIIOC receives an asset-based fee with respect to each class. Each class (with the exception of Investor Class) pays a transfer agent fee, excluding out of pocket expenses, equal to an annual rate of .07% of average net assets. Investor Class pays a monthly asset-based transfer agent fee of .10% of average net assets. The total transfer agent fees paid by each class to FIIOC, including out of pocket expenses, were as follows:
Initial Class | $ 211,550 |
Service Class | 34,457 |
Service Class 2 | 55,509 |
Initial Class R | 10,346 |
Service Class R | 14,083 |
Service Class 2R | 699 |
Investor Class | 90,774 |
| $ 417,418 |
Accounting Fees. Fidelity Service Company, Inc. (FSC), an affiliate of FMR, maintains the Fund's accounting records. The fee is based on the level of average net assets for the month.
Interfund Lending Program. Pursuant to an Exemptive Order issued by the SEC, the Fund, along with other registered investment companies having management contracts with FMR, may participate in an interfund lending program. This program provides an alternative credit facility allowing the funds to borrow from, or lend money to, other participating affiliated funds. At period end, there were no interfund loans outstanding.
Semiannual Report
6. Fees and Other Transactions with Affiliates - continued
Interfund Lending Program - continued
The Fund's activity in this program during the period for which loans were outstanding was as follows:
Borrower or Lender | Average Daily
Loan Balance | Weighted Average
Interest Rate | Interest
Expense |
Borrower | $ 25,458,333 | .43% | $ 902 |
7. Committed Line of Credit.
The Fund participates with other funds managed by FMR in a $3.75 billion credit facility (the "line of credit") to be utilized for temporary or emergency purposes to fund shareholder redemptions or for other short-term liquidity purposes. The Fund has agreed to pay commitment fees on its pro-rata portion of the line of credit, which amounted to $2,276 and is reflected in Miscellaneous expenses on the Statement of Operations. During the period, there were no borrowings on this line of credit.
8. Expense Reductions.
Through arrangements with the Fund's custodian, credits realized as a result of uninvested cash balances were used to reduce the Fund's expenses. During the period, these credits reduced the Fund's custody expenses by $661.
9. Distributions to Shareholders.
Distributions to shareholders of each class were as follows:
| Six months ended
June 30,
2010 | Year ended
December 31,
2009 |
From net investment income | | |
Initial Class | $ - | $ 43,747,787 |
Service Class | - | 7,425,935 |
Service Class 2 | - | 12,835,833 |
Initial Class R | - | 2,441,349 |
Service Class R | - | 3,419,501 |
Service Class 2R | - | 146,215 |
Investor Class | - | 12,952,470 |
Total | $ - | $ 82,969,090 |
10. Share Transactions.
Transactions for each class of shares were as follows:
| Shares | Dollars |
| Six months ended
June 30,
2010 | Year ended
December 31,
2009 | Six months ended
June 30,
2010 | Year ended
December 31,
2009 |
Initial Class | | | | |
Shares sold | 6,514,992 | 20,216,701 | $ 35,437,949 | $ 94,993,807 |
Reinvestment of distributions | - | 8,357,240 | - | 43,747,787 |
Shares redeemed | (17,558,642) | (27,414,117) | (94,989,140) | (129,625,734) |
Net increase (decrease) | (11,043,650) | 1,159,824 | $ (59,551,191) | $ 9,115,860 |
Service Class | | | | |
Shares sold | 844,955 | 2,777,781 | $ 4,584,743 | $ 12,897,331 |
Reinvestment of distributions | - | 1,427,657 | - | 7,425,935 |
Shares redeemed | (2,904,196) | (8,725,159) | (15,653,381) | (41,193,317) |
Net increase (decrease) | (2,059,241) | (4,519,721) | $ (11,068,638) | $ (20,870,051) |
Service Class 2 | | | | |
Shares sold | 11,246,887 | 24,366,893 | $ 60,513,503 | $ 112,451,939 |
Reinvestment of distributions | - | 2,502,443 | - | 12,835,833 |
Shares redeemed | (22,866,014) | (14,230,958) | (120,978,123) | (64,857,511) |
Net increase (decrease) | (11,619,127) | 12,638,378 | $ (60,464,620) | $ 60,430,261 |
Semiannual Report
Notes to Financial Statements (Unaudited) - continued
10. Share Transactions - continued
| Shares | Dollars |
| Six months ended
June 30,
2010 | Year ended
December 31,
2009 | Six months ended
June 30,
2010 | Year ended
December 31,
2009 |
Initial Class R | | | | |
Shares sold | 1,518,026 | 4,004,167 | $ 8,268,535 | $ 17,798,935 |
Reinvestment of distributions | - | 468,040 | - | 2,441,349 |
Shares redeemed | (2,589,632) | (3,016,877) | (13,896,361) | (13,725,409) |
Net increase (decrease) | (1,071,606) | 1,455,330 | $ (5,627,826) | $ 6,514,875 |
Service Class R | | | | |
Shares sold | 2,648,462 | 7,453,151 | $ 14,416,667 | $ 33,119,246 |
Reinvestment of distributions | - | 659,445 | - | 3,419,501 |
Shares redeemed | (4,895,149) | (5,739,021) | (26,219,943) | (26,100,257) |
Net increase (decrease) | (2,246,687) | 2,373,575 | $ (11,803,276) | $ 10,438,490 |
Service Class 2R | | | | |
Shares sold | 63,981 | 190,944 | $ 339,387 | $ 835,730 |
Reinvestment of distributions | - | 28,591 | - | 146,215 |
Shares redeemed | (85,473) | (212,466) | (455,064) | (995,434) |
Net increase (decrease) | (21,492) | 7,069 | $ (115,677) | $ (13,489) |
Investor Class | | | | |
Shares sold | 15,091,746 | 20,189,376 | $ 81,631,928 | $ 92,880,106 |
Reinvestment of distributions | - | 2,482,010 | - | 12,952,470 |
Shares redeemed | (14,939,961) | (10,842,692) | (80,396,938) | (48,580,411) |
Net increase (decrease) | 151,785 | 11,828,694 | $ 1,234,990 | $ 57,252,165 |
11. Other.
The Fund's organizational documents provide former and current trustees and officers with a limited indemnification against liabilities arising in connection with the performance of their duties to the Fund. In the normal course of business, the Fund may also enter into contracts that provide general indemnifications. The Fund's maximum exposure under these arrangements is unknown as this would be dependent on future claims that may be made against the Fund. The risk of material loss from such claims is considered remote.
At the end of the period, FMR or its affiliates were the owners of record of 37% of the total outstanding shares of the Fund and one otherwise unaffiliated shareholder was the owner of record of 24% of the total outstanding shares of the Fund.
Semiannual Report
Investment Adviser
Fidelity Management & Research Company
Boston, MA
Investment Sub-Advisers
FMR Co., Inc.
Fidelity Research & Analysis Company
FIL Investments (Japan) Limited
FIL Investment Advisors
FIL Investment Advisors (U.K.) Ltd.
Fidelity Management & Research (U.K.) Inc.
Fidelity Management & Research (Hong Kong) Limited
Fidelity Management & Research (Japan) Inc.
General Distributor
Fidelity Distributors Corporation
Boston, MA
Transfer and Service Agents
Fidelity Investments Institutional Operations Company, Inc.
Boston, MA
Fidelity Service Company, Inc.
Boston, MA
Custodian
The Bank of New York Mellon
New York, NY
VIPHIR-SANN-0810
1.833449.104
Fidelity® Variable Insurance Products:
Overseas Portfolio
Semiannual Report
June 30, 2010
(2_fidelity_logos) (Registered_Trademark)
Contents
Shareholder Expense Example | <Click Here> | An example of shareholder expenses. |
Investment Changes | <Click Here> | A summary of major shifts in the fund's investments over the past six months. |
Investments | <Click Here> | A complete list of the fund's investments with their market values. |
Financial Statements | <Click Here> | Statements of assets and liabilities, operations, and changes in net assets, as well as financial highlights. |
Notes | <Click Here> | Notes to the financial statements. |
To view a fund's proxy voting guidelines and proxy voting record for the 12-month period ended June 30, visit http://www.fidelity.com/proxyvotingresults or visit the Securities and Exchange Commission's (SEC) web site at http://www.sec.gov. You may also call 1-877-208-0098 to request a free copy of the proxy voting guidelines.
Fidelity Variable Insurance Products are separate account options which are purchased through a variable insurance contract.
Standard & Poor's, S&P and S&P 500 are registered service marks of The McGraw-Hill Companies, Inc. and have been licensed for use by Fidelity Distributors Corporation.
Other third party marks appearing herein are the property of their respective owners.
All other marks appearing herein are registered or unregistered trademarks or service marks of FMR LLC or an affiliated company.
This report and the financial statements contained herein are submitted for the general information of the shareholders of the fund. This report is not authorized for distribution to prospective investors in the fund unless preceded or accompanied by an effective prospectus.
A fund files its complete schedule of portfolio holdings with the SEC for the first and third quarters of each fiscal year on Form N-Q. Forms N-Q are available on the SEC's web site at http://www.sec.gov. A fund's Forms N-Q may be reviewed and copied at the SEC's Public Reference Room in Washington, DC. Information regarding the operation of the SEC's Public Reference Room may be obtained by calling 1-800-SEC-0330. For a complete list of a fund's portfolio holdings, view the most recent holdings listing, semiannual report, or annual report on Fidelity's web site at http://www.fidelity.com or http://www.advisor.fidelity.com, as applicable.
NOT FDIC INSURED • MAY LOSE VALUE • NO BANK GUARANTEE
Neither the fund nor Fidelity Distributors Corporation is a bank.
Semiannual Report
As a shareholder of the Fund, you incur two types of costs: (1) transaction costs, including redemption fees, and (2) ongoing costs, including management fees, distribution and/or service (12b-1) fees and other Fund expenses. This Example is intended to help you understand your ongoing costs (in dollars) of investing in the Fund and to compare these costs with the ongoing costs of investing in other mutual funds.
The Example is based on an investment of $1,000 invested at the beginning of the period and held for the entire period (January 1, 2010 to June 30, 2010).
Actual Expenses
The first line of the accompanying table for each class of the Fund provides information about actual account values and actual expenses. You may use the information in this line, together with the amount you invested, to estimate the expenses that you paid over the period. Simply divide your account value by $1,000.00 (for example, an $8,600 account value divided by $1,000.00 = 8.6), then multiply the result by the number in the first line for a class of the Fund under the heading entitled "Expenses Paid During Period" to estimate the expenses you paid on your account during this period. The estimate of expenses does not include any fees or other expenses of any variable annuity or variable life insurance product. If they were, the estimate of expenses you paid during the period would be higher, and your ending account value would be lower. In addition, the Fund, as a shareholder in the underlying Fidelity Central Funds, will indirectly bear its pro-rata share of the fees and expenses incurred by the underlying Fidelity Central Funds. These fees and expenses are not included in the Fund's annualized expense ratio used to calculate the expense estimate in the table below.
Hypothetical Example for Comparison Purposes
The second line of the accompanying table for each class of the Fund provides information about hypothetical account values and hypothetical expenses based on a Class' actual expense ratio and an assumed rate of return of 5% per year before expenses, which is not the Class' actual return. The hypothetical account values and expenses may not be used to estimate the actual ending account balance or expenses you paid for the period. You may use this information to compare the ongoing costs of investing in the Fund and other funds. To do so, compare this 5% hypothetical example with the 5% hypothetical examples that appear in the shareholder reports of the other funds. The estimate of expenses does not include any fees or other expenses of any variable annuity or variable life insurance product. If they were, the estimate of expenses you paid during the period would be higher, and your ending account value would be lower. In addition, the Fund, as a shareholder in the underlying Fidelity Central Funds, will indirectly bear its pro-rata share of the fees and expenses incurred by the underlying Fidelity Central Funds. These fees and expenses are not included in the Fund's annualized expense ratio used to calculate the expense estimate in the table below.
Please note that the expenses shown in the table are meant to highlight your ongoing costs only and do not reflect any transaction costs. Therefore, the second line of the table is useful in comparing ongoing costs only, and will not help you determine the relative total costs of owning different funds. In addition, if these transactional costs were included, your costs would have been higher.
|
Annualized
Expense Ratio
|
Beginning
Account Value
January 1, 2010
|
Ending
Account Value
June 30, 2010
| Expenses Paid
During Period*
January 1, 2010 to
June 30, 2010 |
Initial Class | .86% | | | |
Actual | | $ 1,000.00 | $ 864.50 | $ 3.98 |
HypotheticalA | | $ 1,000.00 | $ 1,020.53 | $ 4.31 |
Service Class | .96% | | | |
Actual | | $ 1,000.00 | $ 863.90 | $ 4.44 |
HypotheticalA | | $ 1,000.00 | $ 1,020.03 | $ 4.81 |
Service Class 2 | 1.11% | | | |
Actual | | $ 1,000.00 | $ 863.30 | $ 5.13 |
HypotheticalA | | $ 1,000.00 | $ 1,019.29 | $ 5.56 |
Initial Class R | .86% | | | |
Actual | | $ 1,000.00 | $ 864.20 | $ 3.98 |
HypotheticalA | | $ 1,000.00 | $ 1,020.53 | $ 4.31 |
Service Class R | .96% | | | |
Actual | | $ 1,000.00 | $ 863.70 | $ 4.44 |
HypotheticalA | | $ 1,000.00 | $ 1,020.03 | $ 4.81 |
Service Class 2R | 1.11% | | | |
Actual | | $ 1,000.00 | $ 863.50 | $ 5.13 |
HypotheticalA | | $ 1,000.00 | $ 1,019.29 | $ 5.56 |
Investor Class R | .95% | | | |
Actual | | $ 1,000.00 | $ 864.10 | $ 4.39 |
HypotheticalA | | $ 1,000.00 | $ 1,020.08 | $ 4.76 |
A 5% return per year before expenses
* Expenses are equal to each Class' annualized expense ratio, multiplied by the average account value over the period, multiplied by 181/365 (to reflect the one-half year period).
Semiannual Report
Investment Changes (Unaudited)
Geographic Diversification (% of fund's net assets) |
As of June 30, 2010 |
 | Japan | 19.3% | |
 | United Kingdom | 17.8% | |
 | France | 10.5% | |
 | Germany | 7.7% | |
 | Switzerland | 7.3% | |
 | United States of America | 4.6% | |
 | Australia | 3.7% | |
 | Cayman Islands | 3.3% | |
 | Spain | 3.0% | |
 | Other | 22.8% | |

Percentages are adjusted for the effect of futures contracts, if applicable.
As of December 31, 2009 |
| United Kingdom | 19.6% | |
| Japan | 17.2% | |
| France | 12.0% | |
| Germany | 10.8% | |
| Switzerland | 5.9% | |
| Australia | 4.7% | |
| Spain | 3.6% | |
| Hong Kong | 2.9% | |
| Italy | 2.7% | |
| Other | 20.6% | |

Percentages are adjusted for the effect of futures contracts, if applicable.
Asset Allocation as of June 30, 2010 |
| % of fund's
net assets | % of fund's net assets
6 months ago |
Stocks | 98.2 | 99.6 |
Short-Term Investments and Net Other Assets | 1.8 | 0.4 |
Top Ten Stocks as of June 30, 2010 |
| % of fund's
net assets | % of fund's net assets
6 months ago |
HSBC Holdings PLC (United Kingdom, Commercial Banks) | 2.6 | 2.6 |
LVMH Moet Hennessy - Louis Vuitton (France, Textiles, Apparel & Luxury Goods) | 2.4 | 1.3 |
Roche Holding AG (participation certificate) (Switzerland, Pharmaceuticals) | 2.1 | 1.9 |
The Swatch Group AG (Bearer) (Switzerland, Textiles, Apparel & Luxury Goods) | 2.0 | 0.7 |
Anheuser-Busch InBev SA NV (Belgium, Beverages) | 1.8 | 1.2 |
Toyota Motor Corp. (Japan, Automobiles) | 1.7 | 1.6 |
Novo Nordisk AS Series B (Denmark, Pharmaceuticals) | 1.6 | 0.9 |
Clicks Group Ltd. (South Africa, Multiline Retail) | 1.6 | 0.0 |
Total SA (France, Oil, Gas & Consumable fuels) | 1.3 | 1.7 |
Vodafone Group PLC (United Kingdom, Wireless Telecommunication Services) | 1.3 | 1.7 |
| 18.4 | |
Market Sectors as of June 30, 2010 |
| % of fund's
net assets | % of fund's net assets
6 months ago |
Financials | 24.8 | 26.6 |
Consumer Discretionary | 21.9 | 16.6 |
Industrials | 9.7 | 9.9 |
Information Technology | 9.2 | 8.2 |
Materials | 8.8 | 11.3 |
Health Care | 8.6 | 5.9 |
Energy | 6.3 | 8.0 |
Consumer Staples | 5.0 | 5.2 |
Telecommunication Services | 3.0 | 5.3 |
Utilities | 0.9 | 2.6 |
Semiannual Report
Investments June 30, 2010 (Unaudited)
Showing Percentage of Net Assets
Common Stocks - 97.7% |
| Shares | | Value |
Australia - 3.7% |
AMP Ltd. | 1,384,931 | | $ 6,006,749 |
Aristocrat Leisure Ltd. | 2,371,900 | | 7,223,871 |
Australia & New Zealand Banking Group Ltd. | 161,823 | | 2,904,666 |
BHP Billiton Ltd. | 291,587 | | 9,065,216 |
Commonwealth Bank of Australia | 299,973 | | 12,119,240 |
Newcrest Mining Ltd. | 138,258 | | 4,031,253 |
Rio Tinto Ltd. | 24,301 | | 1,335,546 |
Wesfarmers Ltd. | 93,194 | | 2,226,012 |
Westfield Group unit | 945,730 | | 9,604,005 |
TOTAL AUSTRALIA | | 54,516,558 |
Austria - 0.4% |
Wienerberger AG (a)(c) | 479,120 | | 5,823,313 |
Bailiwick of Jersey - 1.2% |
Informa PLC | 1,288,973 | | 6,808,043 |
WPP PLC | 1,160,619 | | 10,930,303 |
TOTAL BAILIWICK OF JERSEY | | 17,738,346 |
Belgium - 2.1% |
Ageas | 722,100 | | 1,606,837 |
Anheuser-Busch InBev SA NV | 560,601 | | 26,953,309 |
Hamon & Compagnie International SA | 73,974 | | 2,586,507 |
TOTAL BELGIUM | | 31,146,653 |
Bermuda - 0.2% |
Huabao International Holdings Ltd. | 2,642,000 | | 3,377,170 |
Brazil - 0.0% |
Drogasil SA | 22,000 | | 420,324 |
Canada - 0.9% |
Barrick Gold Corp. | 73,000 | | 3,313,475 |
Suncor Energy, Inc. | 258,200 | | 7,598,897 |
Yamana Gold, Inc. | 288,100 | | 2,955,288 |
TOTAL CANADA | | 13,867,660 |
Cayman Islands - 3.3% |
Ajisen (China) Holdings Ltd. | 3,868,000 | | 4,317,827 |
BaWang International (Group) Holding Ltd. | 6,473,000 | | 4,592,283 |
Bosideng International Holdings Ltd. | 26,702,000 | | 7,170,793 |
China Dongxiang Group Co. Ltd. | 4,578,000 | | 3,051,479 |
China High Speed Transmission Equipment Group Co. Ltd. | 1,771,000 | | 3,720,082 |
CNinsure, Inc. ADR | 117,700 | | 3,053,138 |
Ctrip.com International Ltd. sponsored ADR (a) | 56,100 | | 2,107,116 |
Daphne International Holdings Ltd. | 3,632,000 | | 3,678,279 |
Hengdeli Holdings Ltd. | 26,694,000 | | 11,507,185 |
Little Sheep Group Ltd. | 2,618,000 | | 1,567,586 |
Natural Beauty Bio-Technology Ltd. | 1,060,000 | | 188,524 |
Peak Sport Products Co. Ltd. (c) | 5,433,000 | | 3,578,122 |
TOTAL CAYMAN ISLANDS | | 48,532,414 |
|
| Shares | | Value |
China - 0.7% |
Baidu.com, Inc. sponsored ADR (a) | 161,000 | | $ 10,960,880 |
Denmark - 2.0% |
Danske Bank AS (a) | 96,100 | | 1,849,060 |
Novo Nordisk AS: | | | |
Series B | 51,925 | | 4,194,853 |
Series B sponsored ADR | 236,100 | | 19,128,822 |
William Demant Holding AS (a) | 62,971 | | 4,605,501 |
TOTAL DENMARK | | 29,778,236 |
France - 10.5% |
Atos Origin SA (a) | 72,705 | | 2,919,199 |
AXA SA | 209,420 | | 3,199,199 |
AXA SA sponsored ADR | 158,600 | | 2,418,650 |
BNP Paribas SA | 223,399 | | 12,018,552 |
Carrefour SA | 130,903 | | 5,192,384 |
Credit Agricole SA | 315,700 | | 3,275,300 |
Danone | 250,812 | | 13,445,531 |
Essilor International SA | 70,800 | | 4,207,108 |
Iliad Group SA | 28,200 | | 2,189,749 |
Ingenico SA | 110,004 | | 2,354,037 |
Ipsos SA (c) | 113,100 | | 3,800,050 |
Laurent-Perrier Group | 21,000 | | 1,752,509 |
LVMH Moet Hennessy - Louis Vuitton | 326,512 | | 35,537,051 |
Sanofi-Aventis | 45,238 | | 2,724,451 |
Sanofi-Aventis sponsored ADR | 543,400 | | 16,334,604 |
Schneider Electric SA (c) | 101,394 | | 10,240,372 |
Societe Generale Series A | 180,737 | | 7,436,829 |
Total SA | 286,700 | | 12,797,425 |
Total SA sponsored ADR | 142,000 | | 6,338,880 |
Vallourec SA (c) | 26,321 | | 4,537,879 |
Wendel | 58,600 | | 2,950,466 |
TOTAL FRANCE | | 155,670,225 |
Germany - 7.2% |
Allianz AG | 77,600 | | 7,635,840 |
BASF AG | 101,781 | | 5,569,377 |
Bayer AG | 134,710 | | 7,516,658 |
Bayerische Motoren Werke AG (BMW) | 332,291 | | 16,149,193 |
Deutsche Bank AG | 91,246 | | 5,124,376 |
Deutsche Bank AG (NY Shares) | 33,900 | | 1,903,824 |
Deutsche Boerse AG | 191,620 | | 11,640,517 |
Deutsche Lufthansa AG (a) | 248,900 | | 3,438,870 |
Deutsche Post AG | 273,501 | | 3,984,456 |
Deutsche Postbank AG (a) | 60,800 | | 1,762,291 |
Linde AG | 69,387 | | 7,281,344 |
MAN SE | 64,363 | | 5,305,091 |
Munich Re Group | 35,062 | | 4,395,561 |
Puma AG | 15,683 | | 4,154,788 |
SAP AG (c) | 154,842 | | 6,859,501 |
SAP AG sponsored ADR (c) | 165,100 | | 7,313,930 |
Siemens AG | 87,749 | | 7,856,168 |
TOTAL GERMANY | | 107,891,785 |
Common Stocks - continued |
| Shares | | Value |
Hong Kong - 1.7% |
Cathay Pacific Airways Ltd. | 3,065,000 | | $ 6,061,941 |
Hang Seng Bank Ltd. | 131,600 | | 1,759,589 |
Henderson Land Development Co. Ltd. | 885,000 | | 5,183,663 |
Henderson Land Development Co. Ltd. warrants 6/1/11 (a) | 123,200 | | 20,593 |
Hong Kong Exchanges and Clearing Ltd. | 502,800 | | 7,842,158 |
Wharf Holdings Ltd. | 1,050,000 | | 5,086,956 |
TOTAL HONG KONG | | 25,954,900 |
Ireland - 1.5% |
CRH PLC | 554,756 | | 11,506,949 |
Kingspan Group PLC (United Kingdom) (a) | 882,000 | | 6,542,338 |
Paddy Power PLC (Ireland) | 146,800 | | 4,560,626 |
TOTAL IRELAND | | 22,609,913 |
Israel - 0.3% |
Teva Pharmaceutical Industries Ltd. sponsored ADR | 71,200 | | 3,701,688 |
Italy - 2.7% |
Bulgari SpA | 550,500 | | 3,934,279 |
Intesa Sanpaolo SpA | 3,187,500 | | 8,394,565 |
Saipem SpA | 558,496 | | 17,010,102 |
Tod's SpA | 43,100 | | 2,716,397 |
UniCredit SpA | 2,558,038 | | 5,658,243 |
Unione di Banche Italiane SCpA | 246,904 | | 2,125,797 |
TOTAL ITALY | | 39,839,383 |
Japan - 19.3% |
Asahi Glass Co. Ltd. | 421,000 | | 3,953,790 |
Canon, Inc. | 218,000 | | 8,126,119 |
Canon, Inc. sponsored ADR | 124,900 | | 4,660,019 |
Citizen Holdings Co. Ltd. | 776,600 | | 4,744,983 |
Denso Corp. | 123,700 | | 3,419,513 |
eAccess Ltd. | 3,575 | | 2,435,733 |
East Japan Railway Co. | 43,300 | | 2,883,644 |
Fanuc Ltd. | 56,200 | | 6,347,325 |
Fuji Media Holdings, Inc. | 1,132 | | 1,625,465 |
Hoya Corp. | 107,800 | | 2,294,123 |
Japan Retail Fund Investment Corp. | 3,506 | | 4,270,778 |
Japan Tobacco, Inc. | 916 | | 2,850,248 |
JFE Holdings, Inc. | 123,900 | | 3,833,745 |
JSR Corp. | 121,600 | | 2,042,956 |
Keyence Corp. | 30,200 | | 6,984,705 |
Konica Minolta Holdings, Inc. | 114,000 | | 1,096,897 |
Mazda Motor Corp. | 4,603,000 | | 10,758,331 |
Mitsubishi Corp. | 202,000 | | 4,179,774 |
Mitsubishi Electric Corp. | 1,084,000 | | 8,461,966 |
Mitsubishi Estate Co. Ltd. | 428,000 | | 5,959,487 |
Mitsubishi UFJ Financial Group, Inc. | 3,327,700 | | 15,112,675 |
Mitsubishi UFJ Financial Group, Inc. sponsored ADR | 851,200 | | 3,881,472 |
Mitsui & Co. Ltd. | 393,600 | | 4,592,433 |
|
| Shares | | Value |
Mizuho Financial Group, Inc. | 1,836,800 | | $ 3,014,353 |
MS&AD Insurance Group Holdings, Inc. | 141,900 | | 3,037,648 |
Murata Manufacturing Co. Ltd. | 98,100 | | 4,678,995 |
Nintendo Co. Ltd. | 17,100 | | 5,021,569 |
NKSJ Holdings, Inc. (a) | 380,000 | | 2,239,872 |
Nomura Holdings, Inc. | 1,325,200 | | 7,241,438 |
NSK Ltd. | 587,000 | | 4,077,485 |
Omron Corp. | 404,500 | | 8,819,360 |
ORIX Corp. | 110,910 | | 8,036,216 |
Rakuten, Inc. | 9,640 | | 6,966,417 |
Ricoh Co. Ltd. | 838,000 | | 10,687,588 |
Sharp Corp. | 473,000 | | 4,990,352 |
Shin-Etsu Chemical Co., Ltd. | 121,400 | | 5,645,474 |
Shiseido Co. Ltd. | 130,500 | | 2,876,877 |
SMC Corp. | 66,100 | | 8,843,815 |
SOFTBANK CORP. | 377,300 | | 10,008,925 |
Sony Corp. | 128,400 | | 3,425,396 |
Sony Corp. sponsored ADR | 34,500 | | 920,460 |
Sumitomo Corp. | 611,100 | | 6,104,096 |
Sumitomo Metal Industries Ltd. | 2,026,000 | | 4,581,644 |
Sumitomo Mitsui Financial Group, Inc. | 410,200 | | 11,611,600 |
T&D Holdings, Inc. | 186,650 | | 3,991,699 |
Tokio Marine Holdings, Inc. | 128,400 | | 3,376,189 |
Tokyo Electron Ltd. | 118,900 | | 6,405,895 |
Toshiba Corp. (a) | 1,336,000 | | 6,619,096 |
Toyota Motor Corp. | 412,300 | | 14,168,476 |
Toyota Motor Corp. sponsored ADR (c) | 142,800 | | 9,791,796 |
Yahoo! Japan Corp. | 12,647 | | 5,041,633 |
TOTAL JAPAN | | 286,740,545 |
Korea (South) - 0.4% |
Samsung Electronics Co. Ltd. | 9,803 | | 6,142,119 |
Luxembourg - 0.4% |
ArcelorMittal SA Class A unit | 198,100 | | 5,301,156 |
Netherlands - 2.3% |
Aegon NV (a) | 308,300 | | 1,637,569 |
ASML Holding NV | 146,200 | | 4,016,114 |
ING Groep NV: | | | |
(Certificaten Van Aandelen) unit (a) | 574,784 | | 4,253,524 |
sponsored ADR (a) | 87,600 | | 649,116 |
Koninklijke KPN NV | 121,101 | | 1,543,553 |
Koninklijke Philips Electronics NV | 346,416 | | 10,344,275 |
Koninklijke Philips Electronics NV unit | 138,500 | | 4,132,840 |
Randstad Holdings NV (a) | 116,500 | | 4,577,704 |
Royal DSM NV | 72,462 | | 2,880,390 |
TOTAL NETHERLANDS | | 34,035,085 |
Norway - 0.9% |
Aker Solutions ASA | 437,400 | | 5,001,175 |
DnB NOR ASA | 413,200 | | 3,974,272 |
Sevan Marine ASA (a) | 431,000 | | 311,537 |
StatoilHydro ASA sponsored ADR (c) | 206,500 | | 3,954,475 |
TOTAL NORWAY | | 13,241,459 |
Common Stocks - continued |
| Shares | | Value |
Papua New Guinea - 0.2% |
Lihir Gold Ltd. | 979,630 | | $ 3,522,013 |
Singapore - 0.4% |
United Overseas Bank Ltd. | 399,112 | | 5,552,394 |
South Africa - 2.2% |
Aspen Pharmacare Holdings Ltd. (a) | 640,300 | | 6,347,697 |
Clicks Group Ltd. | 5,240,662 | | 23,177,895 |
Nedbank Group Ltd. | 175,200 | | 2,738,819 |
TOTAL SOUTH AFRICA | | 32,264,411 |
Spain - 3.0% |
Antena 3 Television SA | 519,200 | | 2,938,947 |
Banco Bilbao Vizcaya Argentaria SA | 657,084 | | 6,769,613 |
Banco Santander SA | 1,338,097 | | 14,030,963 |
Banco Santander SA sponsored ADR | 124,500 | | 1,307,250 |
EDP Renovaveis SA (a) | 628,538 | | 3,701,552 |
Inditex SA | 41,545 | | 2,368,856 |
NH Hoteles SA (a)(c) | 901,900 | | 2,726,884 |
Telefonica SA | 609,471 | | 11,289,800 |
TOTAL SPAIN | | 45,133,865 |
Sweden - 1.7% |
Elekta AB (B Shares) | 565,300 | | 14,305,322 |
H&M Hennes & Mauritz AB (B Shares) | 180,318 | | 4,955,566 |
Nordea Bank AB | 188,800 | | 1,556,876 |
Svenska Handelsbanken AB (A Shares) | 98,900 | | 2,419,478 |
Swedbank AB (A Shares) (a) | 181,632 | | 1,666,779 |
TOTAL SWEDEN | | 24,904,021 |
Switzerland - 7.3% |
Adecco SA (Reg.) | 103,088 | | 4,918,001 |
Compagnie Financiere Richemont SA Series A | 362,264 | | 12,647,463 |
Credit Suisse Group sponsored ADR | 117,600 | | 4,401,768 |
Credit Suisse Group (Reg.) | 71,082 | | 2,672,487 |
Kuehne & Nagel International AG | 33,380 | | 3,436,098 |
Roche Holding AG (participation certificate) | 232,223 | | 31,963,572 |
Swiss Reinsurance Co. | 40,826 | | 1,677,469 |
The Swatch Group AG (Bearer) | 104,260 | | 29,403,937 |
UBS AG (a) | 447,317 | | 5,925,974 |
UBS AG (NY Shares) (a) | 300,443 | | 3,971,856 |
Zurich Financial Services AG | 32,844 | | 7,239,265 |
TOTAL SWITZERLAND | | 108,257,890 |
Taiwan - 0.6% |
Hon Hai Precision Industry Co. Ltd. (Foxconn) | 978,000 | | 3,412,817 |
HTC Corp. | 178,000 | | 2,353,349 |
Taiwan Semiconductor Manufacturing Co. Ltd. sponsored ADR | 376,267 | | 3,672,366 |
TOTAL TAIWAN | | 9,438,532 |
|
| Shares | | Value |
United Kingdom - 17.8% |
Aberdeen Asset Management PLC | 1,927,425 | | $ 3,688,871 |
Anglo American PLC: | | | |
ADR (a) | 238,400 | | 4,107,632 |
(United Kingdom) (a) | 259,780 | | 9,049,355 |
Aviva PLC | 431,600 | | 2,005,124 |
Barclays PLC | 1,845,252 | | 7,363,114 |
Barclays PLC Sponsored ADR | 548,200 | | 8,710,898 |
BG Group PLC | 582,221 | | 8,656,672 |
BHP Billiton PLC | 678,517 | | 17,587,658 |
BP PLC | 1,586,406 | | 7,592,103 |
BP PLC sponsored ADR | 80,800 | | 2,333,504 |
Burberry Group PLC | 337,100 | | 3,805,929 |
Cairn Energy PLC (a) | 746,766 | | 4,586,310 |
Centrica PLC | 2,518,600 | | 11,111,287 |
GlaxoSmithKline PLC | 569,600 | | 9,669,388 |
Great Portland Estates PLC | 805,600 | | 3,478,478 |
Hays PLC | 1,754,300 | | 2,392,661 |
Hikma Pharmaceuticals PLC | 223,300 | | 2,370,284 |
HSBC Holdings PLC: | | | |
(United Kingdom) | 915,380 | | 8,360,122 |
sponsored ADR | 643,232 | | 29,324,947 |
Imperial Tobacco Group PLC | 387,432 | | 10,821,855 |
InterContinental Hotel Group PLC | 443,064 | | 6,980,636 |
ITV PLC (a) | 6,089,400 | | 4,549,281 |
Johnson Matthey PLC | 233,470 | | 5,185,435 |
Legal & General Group PLC | 1,128,633 | | 1,315,073 |
Lloyds TSB Group PLC (a) | 4,266,744 | | 3,367,441 |
Man Group PLC | 1,135,453 | | 3,762,787 |
Prudential PLC | 1,215,821 | | 9,167,700 |
Rio Tinto PLC | 186,315 | | 8,179,445 |
Rio Tinto PLC sponsored ADR | 134,700 | | 5,872,920 |
Royal Bank of Scotland Group PLC (a) | 1,668,800 | | 1,016,027 |
Royal Dutch Shell PLC: | | | |
Class A (United Kingdom) | 485,400 | | 12,245,895 |
Class B | 236,000 | | 5,702,569 |
Schroders PLC | 297,000 | | 5,343,767 |
Standard Chartered PLC (United Kingdom) | 290,623 | | 7,074,660 |
Sthree PLC | 229,400 | | 861,033 |
Vodafone Group PLC | 9,287,698 | | 19,131,463 |
William Hill PLC | 1,690,331 | | 4,299,058 |
Xstrata PLC | 344,400 | | 4,508,442 |
TOTAL UNITED KINGDOM | | 265,579,824 |
United States of America - 2.8% |
Apple, Inc. (a) | 17,100 | | 4,301,163 |
Coach, Inc. | 289,200 | | 10,570,260 |
Deckers Outdoor Corp. (a) | 90,000 | | 12,858,300 |
Google, Inc. Class A (a) | 14,200 | | 6,318,290 |
Common Stocks - continued |
| Shares | | Value |
United States of America - continued |
Philip Morris International, Inc. | 86,700 | | $ 3,974,328 |
Scientific Games Corp. Class A (a) | 464,000 | | 4,268,800 |
TOTAL UNITED STATES OF AMERICA | | 42,291,141 |
TOTAL COMMON STOCKS (Cost $1,500,848,404) | 1,454,233,903 |
Nonconvertible Preferred Stocks - 0.5% |
| | | |
Germany - 0.5% |
ProSiebenSat.1 Media AG | 249,700 | | 3,669,518 |
Volkswagen AG | 44,347 | | 3,893,587 |
TOTAL NONCONVERTIBLE PREFERRED STOCKS (Cost $6,282,123) | 7,563,105 |
Money Market Funds - 2.4% |
| Shares | | Value |
Fidelity Cash Central Fund, 0.20% (d) | 19,590,025 | | $ 19,590,025 |
Fidelity Securities Lending Cash Central Fund, 0.24% (b)(d) | 15,916,564 | | 15,916,564 |
TOTAL MONEY MARKET FUNDS (Cost $35,506,589) | 35,506,589 |
TOTAL INVESTMENT PORTFOLIO - 100.6% (Cost $1,542,637,116) | 1,497,303,597 |
NET OTHER ASSETS (LIABILITIES) - (0.6)% | (8,663,620) |
NET ASSETS - 100% | $ 1,488,639,977 |
Legend |
(a) Non-income producing |
(b) Investment made with cash collateral received from securities on loan. |
(c) Security or a portion of the security is on loan at period end. |
(d) Affiliated fund that is available only to investment companies and other accounts managed by Fidelity Investments. The rate quoted is the annualized seven-day yield of the fund at period end. A complete unaudited listing of the fund's holdings as of its most recent quarter end is available upon request. |
Affiliated Central Funds |
Information regarding fiscal year to date income earned by the Fund from investments in Fidelity Central Funds is as follows: |
Fund | Income earned |
Fidelity Cash Central Fund | $ 7,035 |
Fidelity Securities Lending Cash Central Fund | 881,813 |
Total | $ 888,848 |
Other Information |
The following is a summary of the inputs used, as of June 30, 2010, involving the Fund's assets and liabilities carried at value. The inputs or methodology used for valuing securities may not be an indication of the risk associated with investing in those securities. For more information on valuation inputs, and their aggregation into the levels used in the table below, please refer to the Security Valuation section in the accompanying Notes to Financial Statements. |
Valuation Inputs at Reporting Date: |
Description | Total | Level 1 | Level 2 | Level 3 |
Investments in Securities: | | | | |
Equities: | | | | |
Japan | $ 286,740,545 | $ 19,253,747 | $ 267,486,798 | $ - |
United Kingdom | 265,579,824 | 50,349,901 | 215,229,923 | - |
France | 155,670,225 | 25,092,134 | 130,578,091 | - |
Germany | 115,454,890 | 9,217,754 | 106,237,136 | - |
Switzerland | 108,257,890 | 8,373,624 | 99,884,266 | - |
Australia | 54,516,558 | - | 54,516,558 | - |
Cayman Islands | 48,532,414 | 5,160,254 | 43,372,160 | - |
Spain | 45,133,865 | 1,307,250 | 43,826,615 | - |
United States of America | 42,291,141 | 42,291,141 | - | - |
Other | 339,619,656 | 102,069,852 | 237,549,804 | - |
Money Market Funds | 35,506,589 | 35,506,589 | - | - |
Total Investments in Securities: | $ 1,497,303,597 | $ 298,622,246 | $ 1,198,681,351 | $ - |
Income Tax Information |
At December 31, 2009, the Fund had a capital loss carryforward of approximately $523,704,930 of which $243,257,460 and $280,447,470 will expire on December 31, 2016 and 2017, respectively. Capital loss carryforwards are only available to offset future capital gains of the Fund to the extent provided by regulations and may be limited. |
See accompanying notes which are an integral part of the financial statements.
Semiannual Report
Statement of Assets and Liabilities
| June 30, 2010 (Unaudited) |
| | |
Assets | | |
Investment in securities, at value (including securities loaned of $15,166,563) - See accompanying schedule: Unaffiliated issuers (cost $1,507,130,527) | $ 1,461,797,008 | |
Fidelity Central Funds (cost $35,506,589) | 35,506,589 | |
Total Investments (cost $1,542,637,116) | | $ 1,497,303,597 |
Foreign currency held at value (cost $56) | | 56 |
Receivable for investments sold | | 1,230,696 |
Receivable for fund shares sold | | 4,604,678 |
Dividends receivable | | 4,892,007 |
Distributions receivable from Fidelity Central Funds | | 79,844 |
Other receivables | | 391,347 |
Total assets | | 1,508,502,225 |
| | |
Liabilities | | |
Payable for investments purchased | $ 774,408 | |
Payable for fund shares redeemed | 1,157,655 | |
Accrued management fee | 912,360 | |
Distribution fees payable | 107,624 | |
Other affiliated payables | 152,779 | |
Other payables and accrued expenses | 840,858 | |
Collateral on securities loaned, at value | 15,916,564 | |
Total liabilities | | 19,862,248 |
| | |
Net Assets | | $ 1,488,639,977 |
Net Assets consist of: | | |
Paid in capital | | $ 2,043,861,178 |
Undistributed net investment income | | 17,467,019 |
Accumulated undistributed net realized gain (loss) on investments and foreign currency transactions | | (527,348,384) |
Net unrealized appreciation (depreciation) on investments and assets and liabilities in foreign currencies | | (45,339,836) |
Net Assets | | $ 1,488,639,977 |
Statement of Assets and Liabilities - continued
| June 30, 2010 (Unaudited) |
| | |
Initial Class:
Net Asset Value, offering price and redemption price per share ($638,077,369 ÷ 49,043,501 shares) | | $ 13.01 |
| | |
Service Class:
Net Asset Value, offering price and redemption price per share ($135,939,690 ÷ 10,496,593 shares) | | $ 12.95 |
| | |
Service Class 2:
Net Asset Value, offering price and redemption price per share ($375,934,210 ÷ 29,182,344 shares) | | $ 12.88 |
| | |
Initial Class R:
Net Asset Value, offering price and redemption price per share ($100,897,455 ÷ 7,773,487 shares) | | $ 12.98 |
| | |
| | |
Service Class R:
Net Asset Value, offering price and redemption price per share ($51,538,855 ÷ 3,985,926 shares) | | $ 12.93 |
| | |
Service Class 2R:
Net Asset Value, offering price and redemption price per share ($49,692,966 ÷ 3,888,908 shares) | | $ 12.78 |
| | |
Investor Class R:
Net Asset Value, offering price and redemption price per share ($136,559,432 ÷ 10,526,349 shares) | | $ 12.97 |
See accompanying notes which are an integral part of the financial statements.
Semiannual Report
Financial Statements - continued
Statement of Operations
| Six months ended June 30, 2010 (Unaudited) |
| | |
Investment Income | | |
Dividends | | $ 26,911,468 |
Income from Fidelity Central Funds | | 888,848 |
| | 27,800,316 |
Less foreign taxes withheld | | (2,383,524) |
Total income | | 25,416,792 |
| | |
Expenses | | |
Management fee | $ 5,990,253 | |
Transfer agent fees | 656,294 | |
Distribution fees | 719,726 | |
Accounting and security lending fees | 384,270 | |
Custodian fees and expenses | 178,088 | |
Independent trustees' compensation | 4,879 | |
Depreciation in deferred trustee compensation account | (49) | |
Audit | 42,296 | |
Legal | 6,396 | |
Interest | 235 | |
Miscellaneous | 79,884 | |
Total expenses before reductions | 8,062,272 | |
Expense reductions | (157,939) | 7,904,333 |
Net investment income (loss) | | 17,512,459 |
Realized and Unrealized Gain (Loss) Net realized gain (loss) on: | | |
Investment securities: | | |
Unaffiliated issuers (net of foreign taxes of $1,318) | 22,223,249 | |
Foreign currency transactions | (508,782) | |
Total net realized gain (loss) | | 21,714,467 |
Change in net unrealized appreciation (depreciation) on: Investment securities | (275,024,322) | |
Assets and liabilities in foreign currencies | (17,909) | |
Total change in net unrealized appreciation (depreciation) | | (275,042,231) |
Net gain (loss) | | (253,327,764) |
Net increase (decrease) in net assets resulting from operations | | $ (235,815,305) |
Statement of Changes in Net Assets
| Six months ended
June 30, 2010
(Unaudited) | Year ended
December 31,
2009 |
Increase (Decrease) in Net Assets | | |
Operations | | |
Net investment income (loss) | $ 17,512,459 | $ 33,212,492 |
Net realized gain (loss) | 21,714,467 | (285,899,417) |
Change in net unrealized appreciation (depreciation) | (275,042,231) | 627,435,395 |
Net increase (decrease) in net assets resulting from operations | (235,815,305) | 374,748,470 |
Distributions to shareholders from net investment income | - | (32,759,678) |
Distributions to shareholders from net realized gain | - | (5,176,451) |
Total distributions | - | (37,936,129) |
Share transactions - net increase (decrease) | (70,506,098) | (176,347,409) |
Redemption fees | 10,368 | 22,016 |
Total increase (decrease) in net assets | (306,311,035) | 160,486,948 |
| | |
Net Assets | | |
Beginning of period | 1,794,951,012 | 1,634,464,064 |
End of period (including undistributed net investment income of $17,467,019 and distributions in excess of net investment income of $45,440, respectively) | $ 1,488,639,977 | $ 1,794,951,012 |
See accompanying notes which are an integral part of the financial statements.
Semiannual Report
Financial Highlights - Initial Class
| Six months ended June 30, 2010 | Years ended December 31, |
| (Unaudited) | 2009 | 2008 | 2007 | 2006 | 2005 |
Selected Per-Share Data | | | | | | |
Net asset value, beginning of period | $ 15.05 | $ 12.17 | $ 25.33 | $ 23.96 | $ 20.60 | $ 17.51 |
Income from Investment Operations | | | | | | |
Net investment income (loss) E | .16 | .28 | .46 | .45 | .38 | .20 |
Net realized and unrealized gain (loss) | (2.20) | 2.93 | (10.67) | 3.42 | 3.30 | 3.10 |
Total from investment operations | (2.04) | 3.21 | (10.21) | 3.87 | 3.68 | 3.30 |
Distributions from net investment income | - | (.29) | (.49) | (.84) | (.19) | (.12) |
Distributions from net realized gain | - | (.04) | (2.46) | (1.66) | (.13) | (.09) |
Total distributions | - | (.33) | (2.95) | (2.50) | (.32) | (.21) |
Redemption fees added to paid in capital E,I | - | - | - | - | - | - |
Net asset value, end of period | $ 13.01 | $ 15.05 | $ 12.17 | $ 25.33 | $ 23.96 | $ 20.60 |
Total Return B,C,D | (13.55)% | 26.53% | (43.83)% | 17.41% | 18.09% | 19.06% |
Ratios to Average Net Assets F,H | | | | | | |
Expenses before reductions | .86% A | .88% | .87% | .85% | .88% | .89% |
Expenses net of fee waivers, if any | .86% A | .88% | .87% | .85% | .88% | .89% |
Expenses net of all reductions | .84% A | .84% | .84% | .82% | .81% | .82% |
Net investment income (loss) | 2.16% A | 2.17% | 2.45% | 1.85% | 1.76% | 1.11% |
Supplemental Data | | | | | | |
Net assets, end of period (000 omitted) | $ 638,077 | $ 758,018 | $ 703,357 | $ 1,702,235 | $ 1,624,901 | $ 1,549,179 |
Portfolio turnover rate G | 56% A | 78% | 77% | 62% | 123% | 92% |
A Annualized B Total returns for periods of less than one year are not annualized. C Total returns do not reflect charges attributable to your insurance company's separate account. Inclusion of these charges would reduce the total returns shown. D Total returns would have been lower had certain expenses not been reduced during the periods shown. E Calculated based on average shares outstanding during the period. F Fees and expenses of the underlying Fidelity Central Funds are not included in the Fund's expense ratio. The Fund indirectly bears its proportionate share of the expenses of any underlying Fidelity Central Funds. G Amount does not include the portfolio activity of any underlying Fidelity Central Funds. H Expense ratios reflect operating expenses of the class. Expenses before reductions do not reflect amounts reimbursed by the investment adviser or reductions from brokerage service arrangements or reductions from other expense offset arrangements and do not represent the amount paid by the class during periods when reimbursements or reductions occur. Expenses net of fee waivers reflect expenses after reimbursement by the investment adviser but prior to reductions from brokerage service arrangements or other expense offset arrangements. Expenses net of all reductions represent the net expenses paid by the class. I Amount represents less than $.01 per share. |
Financial Highlights - Service Class
| Six months ended June 30, 2010 | Years ended December 31, |
| (Unaudited) | 2009 | 2008 | 2007 | 2006 | 2005 |
Selected Per-Share Data | | | | | | |
Net asset value, beginning of period | $ 14.99 | $ 12.12 | $ 25.23 | $ 23.86 | $ 20.52 | $ 17.44 |
Income from Investment Operations | | | | | | |
Net investment income (loss) E | .15 | .26 | .44 | .43 | .36 | .18 |
Net realized and unrealized gain (loss) | (2.19) | 2.93 | (10.61) | 3.39 | 3.28 | 3.09 |
Total from investment operations | (2.04) | 3.19 | (10.17) | 3.82 | 3.64 | 3.27 |
Distributions from net investment income | - | (.28) | (.48) | (.79) | (.17) | (.10) |
Distributions from net realized gain | - | (.04) | (2.46) | (1.66) | (.13) | (.09) |
Total distributions | - | (.32) | (2.94) | (2.45) | (.30) | (.19) |
Redemption fees added to paid in capital E,I | - | - | - | - | - | - |
Net asset value, end of period | $ 12.95 | $ 14.99 | $ 12.12 | $ 25.23 | $ 23.86 | $ 20.52 |
Total Return B,C,D | (13.61)% | 26.44% | (43.89)% | 17.25% | 17.95% | 18.97% |
Ratios to Average Net Assets F,H | | | | | | |
Expenses before reductions | .96% A | .98% | .97% | .95% | .98% | .99% |
Expenses net of fee waivers, if any | .96% A | .98% | .97% | .95% | .98% | .99% |
Expenses net of all reductions | .94% A | .94% | .94% | .92% | .91% | .92% |
Net investment income (loss) | 2.07% A | 2.07% | 2.35% | 1.75% | 1.66% | 1.02% |
Supplemental Data | | | | | | |
Net assets, end of period (000 omitted) | $ 135,940 | $ 171,252 | $ 165,608 | $ 366,777 | $ 362,060 | $ 329,759 |
Portfolio turnover rate G | 56% A | 78% | 77% | 62% | 123% | 92% |
A Annualized B Total returns for periods of less than one year are not annualized. C Total returns do not reflect charges attributable to your insurance company's separate account. Inclusion of these charges would reduce the total returns shown. D Total returns would have been lower had certain expenses not been reduced during the periods shown. E Calculated based on average shares outstanding during the period. F Fees and expenses of the underlying Fidelity Central Funds are not included in the Fund's expense ratio. The Fund indirectly bears its proportionate share of the expenses of any underlying Fidelity Central Funds. G Amount does not include the portfolio activity of any underlying Fidelity Central Funds. H Expense ratios reflect operating expenses of the class. Expenses before reductions do not reflect amounts reimbursed by the investment adviser or reductions from brokerage service arrangements or reductions from other expense offset arrangements and do not represent the amount paid by the class during periods when reimbursements or reductions occur. Expenses net of fee waivers reflect expenses after reimbursement by the investment adviser but prior to reductions from brokerage service arrangements or other expense offset arrangements. Expenses net of all reductions represent the net expenses paid by the class. I Amount represents less than $.01 per share. |
See accompanying notes which are an integral part of the financial statements.
Semiannual Report
Financial Highlights - Service Class 2
| Six months ended June 30, 2010 | Years ended December 31, |
| (Unaudited) | 2009 | 2008 | 2007 | 2006 | 2005 |
Selected Per-Share Data | | | | | | |
Net asset value, beginning of period | $ 14.92 | $ 12.07 | $ 25.12 | $ 23.75 | $ 20.43 | $ 17.39 |
Income from Investment Operations | | | | | | |
Net investment income (loss) E | .14 | .24 | .40 | .39 | .33 | .14 |
Net realized and unrealized gain (loss) | (2.18) | 2.91 | (10.54) | 3.37 | 3.27 | 3.08 |
Total from investment operations | (2.04) | 3.15 | (10.14) | 3.76 | 3.60 | 3.22 |
Distributions from net investment income | - | (.26) | (.45) | (.73) | (.15) | (.09) |
Distributions from net realized gain | - | (.04) | (2.46) | (1.66) | (.13) | (.09) |
Total distributions | - | (.30) | (2.91) | (2.39) | (.28) | (.18) |
Redemption fees added to paid in capital E,I | - | - | - | - | - | - |
Net asset value, end of period | $ 12.88 | $ 14.92 | $ 12.07 | $ 25.12 | $ 23.75 | $ 20.43 |
Total Return B,C,D | (13.67)% | 26.22% | (43.96)% | 17.05% | 17.83% | 18.72% |
Ratios to Average Net Assets F, H | | | | | | |
Expenses before reductions | 1.11% A | 1.12% | 1.12% | 1.10% | 1.13% | 1.14% |
Expenses net of fee waivers, if any | 1.11% A | 1.12% | 1.12% | 1.10% | 1.13% | 1.14% |
Expenses net of all reductions | 1.09% A | 1.09% | 1.09% | 1.07% | 1.06% | 1.07% |
Net investment income (loss) | 1.92% A | 1.93% | 2.21% | 1.60% | 1.51% | .79% |
Supplemental Data | | | | | | |
Net assets, end of period (000 omitted) | $ 375,934 | $ 457,971 | $ 414,492 | $ 821,943 | $ 703,421 | $ 502,801 |
Portfolio turnover rate G | 56% A | 78% | 77% | 62% | 123% | 92% |
A Annualized B Total returns for periods of less than one year are not annualized. C Total returns do not reflect charges attributable to your insurance company's separate account. Inclusion of these charges would reduce the total returns shown. D Total returns would have been lower had certain expenses not been reduced during the periods shown. .E Calculated based on average shares outstanding during the period. F Fees and expenses of the underlying Fidelity Central Funds are not included in the Fund's expense ratio. The Fund indirectly bears its proportionate share of the expenses of any underlying Fidelity Central Funds. G Amount does not include the portfolio activity of any underlying Fidelity Central Funds. H Expense ratios reflect operating expenses of the class. Expenses before reductions do not reflect amounts reimbursed by the investment adviser or reductions from brokerage service arrangements or reductions from other expense offset arrangements and do not represent the amount paid by the class during periods when reimbursements or reductions occur. Expenses net of fee waivers reflect expenses after reimbursement by the investment adviser but prior to reductions from brokerage service arrangements or other expense offset arrangements. Expenses net of all reductions represent the net expenses paid by the class. I Amount represents less than $.01 per share. |
Financial Highlights - Initial Class R
| Six months ended June 30, 2010 | Years ended December 31, |
| (Unaudited) | 2009 | 2008 | 2007 | 2006 | 2005 |
Selected Per-Share Data | | | | | | |
Net asset value, beginning of period | $ 15.02 | $ 12.14 | $ 25.28 | $ 23.92 | $ 20.57 | $ 17.49 |
Income from Investment Operations | | | | | | |
Net investment income (loss) E | .16 | .28 | .46 | .45 | .38 | .19 |
Net realized and unrealized gain (loss) | (2.20) | 2.93 | (10.65) | 3.41 | 3.29 | 3.10 |
Total from investment operations | (2.04) | 3.21 | (10.19) | 3.86 | 3.67 | 3.29 |
Distributions from net investment income | - | (.29) | (.49) | (.84) | (.19) | (.12) |
Distributions from net realized gain | - | (.04) | (2.46) | (1.66) | (.13) | (.09) |
Total distributions | - | (.33) | (2.95) | (2.50) | (.32) | (.21) |
Redemption fees added to paid in capital E,I | - | - | - | - | - | - |
Net asset value, end of period | $ 12.98 | $ 15.02 | $ 12.14 | $ 25.28 | $ 23.92 | $ 20.57 |
Total Return B,C,D | (13.58)% | 26.60% | (43.84)% | 17.40% | 18.08% | 19.05% |
Ratios to Average Net Assets F,H | | | | | | |
Expenses before reductions | .86% A | .88% | .87% | .85% | .88% | .89% |
Expenses net of fee waivers, if any | .86% A | .88% | .87% | .85% | .88% | .89% |
Expenses net of all reductions | .84% A | .84% | .84% | .82% | .81% | .82% |
Net investment income (loss) | 2.17% A | 2.17% | 2.46% | 1.85% | 1.76% | 1.08% |
Supplemental Data | | | | | | |
Net assets, end of period (000 omitted) | $ 100,897 | $ 128,689 | $ 118,749 | $ 275,678 | $ 240,693 | $ 184,245 |
Portfolio turnover rate G | 56% A | 78% | 77% | 62% | 123% | 92% |
A Annualized B Total returns for periods of less than one year are not annualized. C Total returns do not reflect charges attributable to your insurance company's separate account. Inclusion of these charges would reduce the total returns shown. D Total returns would have been lower had certain expenses not been reduced during the periods shown. E Calculated based on average shares outstanding during the period. F Fees and expenses of the underlying Fidelity Central Funds are not included in the Fund's expense ratio. The Fund indirectly bears its proportionate share of the expenses of any underlying Fidelity Central Funds. G Amount does not include the portfolio activity of any underlying Fidelity Central Funds. H Expense ratios reflect operating expenses of the class. Expenses before reductions do not reflect amounts reimbursed by the investment adviser or reductions from brokerage service arrangements or reductions from other expense offset arrangements and do not represent the amount paid by the class during periods when reimbursements or reductions occur. Expenses net of fee waivers reflect expenses after reimbursement by the investment adviser but prior to reductions from brokerage service arrangements or other expense offset arrangements. Expenses net of all reductions represent the net expenses paid by the class. I Amount represents less than $.01 per share. |
See accompanying notes which are an integral part of the financial statements.
Semiannual Report
Financial Highlights - Service Class R
| Six months ended
June 30, 2010 | Years ended December 31, |
| (Unaudited) | 2009 | 2008 | 2007 | 2006 | 2005 |
Selected Per-Share Data | | | | | | |
Net asset value, beginning of period | $ 14.97 | $ 12.10 | $ 25.19 | $ 23.83 | $ 20.50 | $ 17.43 |
Income from Investment Operations | | | | | | |
Net investment income (loss) E | .15 | .27 | .43 | .43 | .36 | .17 |
Net realized and unrealized gain (loss) | (2.19) | 2.92 | (10.58) | 3.38 | 3.27 | 3.09 |
Total from investment operations | (2.04) | 3.19 | (10.15) | 3.81 | 3.63 | 3.26 |
Distributions from net investment income | - | (.28) | (.48) | (.79) | (.17) | (.10) |
Distributions from net realized gain | - | (.04) | (2.46) | (1.66) | (.13) | (.09) |
Total distributions | - | (.32) | (2.94) | (2.45) | (.30) | (.19) |
Redemption fees added to paid in capital E,I | - | - | - | - | - | - |
Net asset value, end of period | $ 12.93 | $ 14.97 | $ 12.10 | $ 25.19 | $ 23.83 | $ 20.50 |
Total Return B,C,D | (13.63)% | 26.49% | (43.88)% | 17.23% | 17.95% | 18.92% |
Ratios to Average Net Assets F,H | | | | | | |
Expenses before reductions | .96% A | .97% | .96% | .94% | .98% | .99% |
Expenses net of fee waivers, if any | .96% A | .97% | .96% | .94% | .98% | .99% |
Expenses net of all reductions | .94% A | .94% | .94% | .92% | .91% | .92% |
Net investment income (loss) | 2.07% A | 2.08% | 2.36% | 1.75% | 1.66% | .96% |
Supplemental Data | | | | | | |
Net assets, end of period (000 omitted) | $ 51,539 | $ 66,014 | $ 61,825 | $ 135,038 | $ 133,934 | $ 115,449 |
Portfolio turnover rate G | 56% A | 78% | 77% | 62% | 123% | 92% |
A Annualized B Total returns for periods of less than one year are not annualized. C Total returns do not reflect charges attributable to your insurance company's separate account. Inclusion of these charges would reduce the total returns shown. D Total returns would have been lower had certain expenses not been reduced during the periods shown. E Calculated based on average shares outstanding during the period. F Fees and expenses of the underlying Fidelity Central Funds are not included in the Fund's expense ratio. The Fund indirectly bears its proportionate share of the expenses of any underlying Fidelity Central Funds. G Amount does not include the portfolio activity of any underlying Fidelity Central Funds. H Expense ratios reflect operating expenses of the class. Expenses before reductions do not reflect amounts reimbursed by the investment adviser or reductions from brokerage service arrangements or reductions from other expense offset arrangements and do not represent the amount paid by the class during periods when reimbursements or reductions occur. Expenses net of fee waivers reflect expenses after reimbursement by the investment adviser but prior to reductions from brokerage service arrangements or other expense offset arrangements. Expenses net of all reductions represent the net expenses paid by the class. I Amount represents less than $.01 per share. |
Financial Highlights - Service Class 2R
| Six months ended June 30, 2010 | Years ended December 31, |
| (Unaudited) | 2009 | 2008 | 2007 | 2006 | 2005 |
Selected Per-Share Data | | | | | | |
Net asset value, beginning of period | $ 14.80 | $ 11.98 | $ 24.95 | $ 23.61 | $ 20.32 | $ 17.30 |
Income from Investment Operations | | | | | | |
Net investment income (loss) E | .14 | .25 | .40 | .39 | .32 | .14 |
Net realized and unrealized gain (loss) | (2.16) | 2.87 | (10.46) | 3.35 | 3.26 | 3.07 |
Total from investment operations | (2.02) | 3.12 | (10.06) | 3.74 | 3.58 | 3.21 |
Distributions from net investment income | - | (.26) | (.45) | (.74) | (.16) | (.10) |
Distributions from net realized gain | - | (.04) | (2.46) | (1.66) | (.13) | (.09) |
Total distributions | - | (.30) | (2.91) | (2.40) | (.29) | (.19) |
Redemption fees added to paid in capital E,I | - | - | - | - | - | - |
Net asset value, end of period | $ 12.78 | $ 14.80 | $ 11.98 | $ 24.95 | $ 23.61 | $ 20.32 |
Total Return B,C,D | (13.65)% | 26.20% | (43.94)% | 17.06% | 17.81% | 18.74% |
Ratios to Average Net Assets F,H | | | | | | |
Expenses before reductions | 1.11% A | 1.12% | 1.11% | 1.09% | 1.13% | 1.14% |
Expenses net of fee waivers, if any | 1.11% A | 1.12% | 1.11% | 1.09% | 1.13% | 1.14% |
Expenses net of all reductions | 1.09% A | 1.09% | 1.09% | 1.07% | 1.06% | 1.07% |
Net investment income (loss) | 1.92% A | 1.93% | 2.21% | 1.60% | 1.51% | .77% |
Supplemental Data | | | | | | |
Net assets, end of period (000 omitted) | $ 49,693 | $ 64,200 | $ 46,323 | $ 95,871 | $ 68,729 | $ 49,373 |
Portfolio turnover rate G | 56% A | 78% | 77% | 62% | 123% | 92% |
A Annualized B Total returns for periods of less than one year are not annualized. CTotal returns do not reflect charges attributable to your insurance company's separate account. Inclusion of these charges would reduce the total returns shown. DTotal returns would have been lower had certain expenses not been reduced during the periods shown. ECalculated based on average shares outstanding during the period. FFees and expenses of the underlying Fidelity Central Funds are not included in the Fund's expense ratio. The Fund indirectly bears its proportionate share of the expenses of any underlying Fidelity Central Funds. GAmount does not include the portfolio activity of any underlying Fidelity Central Funds. HExpense ratios reflect operating expenses of the class. Expenses before reductions do not reflect amounts reimbursed by the investment adviser or reductions from brokerage service arrangements or reductions from other expense offset arrangements and do not represent the amount paid by the class during periods when reimbursements or reductions occur. Expenses net of fee waivers reflect expenses after reimbursement by the investment adviser but prior to reductions from brokerage service arrangements or other expense offset arrangements. Expenses net of all reductions represent the net expenses paid by the class. IAmount represents less than $.01 per share. |
See accompanying notes which are an integral part of the financial statements.
Semiannual Report
Financial Highlights - Investor Class R
| Six months ended
June 30, 2010 | Years ended December 31, |
| (Unaudited) | 2009 | 2008 | 2007 | 2006 | 2005 H |
Selected Per-Share Data | | | | | | |
Net asset value, beginning of period | $ 15.01 | $ 12.14 | $ 25.27 | $ 23.91 | $ 20.59 | $ 17.69 |
Income from Investment Operations | | | | | | |
Net investment income (loss) E | .15 | .27 | .43 | .42 | .36 | .02 |
Net realized and unrealized gain (loss) | (2.19) | 2.92 | (10.62) | 3.41 | 3.29 | 2.88 |
Total from investment operations | (2.04) | 3.19 | (10.19) | 3.83 | 3.65 | 2.90 |
Distributions from net investment income | - | (.28) | (.48) | (.81) | (.20) | - |
Distributions from net realized gain | - | (.04) | (2.46) | (1.66) | (.13) | - |
Total distributions | - | (.32) | (2.94) | (2.47) | (.33) | - |
Redemption fees added to paid in capital E,J | - | - | - | - | - | - |
Net asset value, end of period | $ 12.97 | $ 15.01 | $ 12.14 | $ 25.27 | $ 23.91 | $ 20.59 |
Total Return B,C,D | (13.59)% | 26.42% | (43.89)% | 17.25% | 17.94% | 16.39% |
Ratios to Average Net Assets F,I | | | | | | |
Expenses before reductions | .95% A | .97% | .96% | .96% | 1.01% | 1.07% A |
Expenses net of fee waivers, if any | .95% A | .97% | .96% | .96% | 1.01% | 1.07% A |
Expenses net of all reductions | .93% A | .94% | .93% | .94% | .93% | 1.00% A |
Net investment income (loss) | 2.08% A | 2.08% | 2.36% | 1.74% | 1.64% | .23% A |
Supplemental Data | | | | | | |
Net assets, end of period (000 omitted) | $ 136,559 | $ 148,806 | $ 124,111 | $ 229,829 | $ 122,018 | $ 29,544 |
Portfolio turnover rate G | 56% A | 78% | 77% | 62% | 123% | 92% |
A Annualized B Total returns for periods of less than one year are not annualized. C Total returns do not reflect charges attributable to your insurance company's separate account. Inclusion of these charges would reduce the total returns shown. D Total returns would have been lower had certain expenses not been reduced during the periods shown. E Calculated based on average shares outstanding during the period. F Fees and expenses of the underlying Fidelity Central Funds are not included in the Fund's expense ratio. The Fund indirectly bears its proportionate share of the expenses of any underlying Fidelity Central Funds. G Amount does not include the portfolio activity of any underlying Fidelity Central Funds. H For the period July 21, 2005 (commencement of sale of shares) to December 31, 2005. I Expense ratios reflect operating expenses of the class. Expenses before reductions do not reflect amounts reimbursed by the investment adviser or reductions from brokerage service arrangements or reductions from other expense offset arrangements and do not represent the amount paid by the class during periods when reimbursements or reductions occur. Expense ratios before reductions for start-up periods may not be representative of longer-term operating periods. Expenses net of fee waivers reflect expenses after reimbursement by the investment adviser but prior to reductions from brokerage service arrangements or other expense offset arrangements. Expenses net of all reductions represent the net expenses paid by the class. J Amount represents less than $.01 per share. |
See accompanying notes which are an integral part of the financial statements.
Semiannual Report
Notes to Financial Statements
For the period ended June 30, 2010 (Unaudited)
1. Organization.
VIP Overseas Portfolio (the Fund) is a fund of Variable Insurance Products Fund (the Trust) and is authorized to issue an unlimited number of shares. The Trust is registered under the Investment Company Act of 1940, as amended (the 1940 Act), as an open-end management investment company organized as a Massachusetts business trust. Shares of the Fund may only be purchased by insurance companies for the purpose of funding variable annuity or variable life insurance contracts. The Fund offers the following classes of shares: Initial Class shares, Service Class shares, Service Class 2 shares, Initial Class R shares, Service Class R shares, Service Class 2R shares, and Investor Class R shares. All classes have equal rights and voting privileges, except for matters affecting a single class. Investment income, realized and unrealized capital gains and losses, the common expenses of the Fund, and certain fund-level expense reductions, if any, are allocated on a pro-rata basis to each class based on the relative net assets of each class to the total net assets of the Fund. Each class differs with respect to transfer agent and distribution and service plan fees incurred. Certain expense reductions also differ by class.
2. Investments in Fidelity Central Funds.
The Fund may invest in Fidelity Central Funds, which are open-end investment companies available only to other investment companies and accounts managed by Fidelity Management & Research Company (FMR) and its affiliates. The Fund's Schedule of Investments lists each of the Fidelity Central Funds held as of period end, if any, as an investment of the Fund, but does not include the underlying holdings of each Fidelity Central Fund. As an Investing Fund, the Fund indirectly bears its proportionate share of the expenses of the underlying Fidelity Central Funds.
The Money Market Central Funds seek preservation of capital and current income and are managed by Fidelity Investments Money Management, Inc. (FIMM), an affiliate of FMR.
A complete unaudited list of holdings for each Fidelity Central Fund is available upon request or at the Securities and Exchange Commission (the SEC) web site at www.sec.gov. In addition, the financial statements of the Fidelity Central Funds are available on the SEC web site or upon request.
3. Significant Accounting Policies.
The financial statements have been prepared in conformity with accounting principles generally accepted in the United States of America (GAAP), which require management to make certain estimates and assumptions at the date of the financial statements. Actual results could differ from those estimates. The following summarizes the significant accounting policies of the Fund:
Security Valuation. Investments are valued as of 4:00 p.m. Eastern time on the last calendar day of the period. The Fund uses independent pricing services approved by the Board of Trustees to value its investments. When current market prices or quotations are not readily available or reliable, valuations may be determined in good faith in accordance with procedures adopted by the Board of Trustees. Factors used in determining value may include market or security specific events. The frequency with which these procedures are used cannot be predicted and they may be utilized to a significant extent. The value used for net asset value (NAV) calculation under these procedures may differ from published prices for the same securities.
The Fund categorizes the inputs to valuation techniques used to value its investments into a disclosure hierarchy consisting of three levels as shown below.
Level 1 - quoted prices in active markets for identical investments
Level 2 - other significant observable inputs (including quoted prices for similar investments, interest rates, prepayment speeds, etc.)
Level 3 - unobservable inputs (including the fund's own assumptions based on the best information available)
Changes in valuation techniques may result in transfers in or out of an assigned level within the disclosure hierarchy. Valuation techniques used to value the Fund's investments by major category are as follows.
Equity securities, including restricted securities, for which market quotations are readily available, are valued at the last reported sale price or official closing price as reported by an independent pricing service on the primary market or exchange on which they are traded and are categorized as Level 1 in the hierarchy. In the event there were no sales during the day or closing prices are not available, securities are valued at the last quoted bid price or may be valued using the last available price and are generally categorized as Level 2 in the hierarchy. For foreign equity securities, when significant market or security specific events arise, comparisons to the valuation of American Depositary Receipts (ADRs), futures contracts, Exchange-traded funds (ETFs) and certain indexes as well as quoted prices for similar securities are used and are categorized as Level 2 in the hierarchy in these circumstances. Utilizing these techniques may result in significant transfers between Level 1 and Level 2. For restricted equity securities and private placements where observable inputs are limited, assumptions about market activity and risk are used and are categorized as Level 3 in the hierarchy.
Semiannual Report
3. Significant Accounting Policies - continued
Security Valuation - continued
Investments in open-end mutual funds, including the Fidelity Central Funds, are valued at their closing net asset value each business day and are categorized as Level 1 in the hierarchy. Short-term securities with remaining maturities of sixty days or less for which quotations are not readily available are valued at amortized cost, which approximates value and are categorized as Level 2 in the hierarchy.
Foreign Currency. The Fund uses foreign currency contracts to facilitate transactions in foreign-denominated securities. Gains and losses from these transactions may arise from changes in the value of the foreign currency or if the counterparties do not perform under the contracts' terms.
Foreign-denominated assets, including investment securities, and liabilities are translated into U.S. dollars at the exchange rate at period end. Purchases and sales of investment securities, income and dividends received and expenses denominated in foreign currencies are translated into U.S. dollars at the exchange rate in effect on the transaction date.
The effects of exchange rate fluctuations on investments are included with the net realized and unrealized gain (loss) on investment securities. Other foreign currency transactions resulting in realized and unrealized gain (loss) are disclosed separately.
Investment Transactions and Income. For financial reporting purposes, the Fund's investment holdings and NAV include trades executed through the end of the last business day of the period. The NAV per share for processing shareholder transactions is calculated as of the close of business of the New York Stock Exchange (NYSE), normally 4:00 p.m. Eastern time and includes trades executed through the end of the prior business day. Gains and losses on securities sold are determined on the basis of identified cost and may include proceeds received from litigation. Dividend income is recorded on the ex-dividend date, except for certain dividends from foreign securities where the ex-dividend date may have passed, which are recorded as soon as the Fund is informed of the ex-dividend date. Non-cash dividends included in dividend income, if any, are recorded at the fair market value of the securities received. Interest income and distributions from the Fidelity Central Funds are accrued as earned. Interest income includes coupon interest and amortization of premium and accretion of discount on debt securities. Investment income is recorded net of foreign taxes withheld where recovery of such taxes is uncertain.
Expenses. Most expenses of the Trust can be directly attributed to a fund. Expenses which cannot be directly attributed are apportioned amongst each fund in the Trust. Expense estimates are accrued in the period to which they relate and adjustments are made when actual amounts are known.
Deferred Trustee Compensation. Under a Deferred Compensation Plan (the Plan), independent Trustees may elect to defer receipt of a portion of their annual compensation. Deferred amounts are invested in a cross-section of Fidelity funds, are marked-to-market and remain in the Fund until distributed in accordance with the Plan. The investment of deferred amounts and the offsetting payable to the Trustees are included in the accompanying Statement of Assets and Liabilities.
Income Tax Information and Distributions to Shareholders. Each year, the Fund intends to qualify as a regulated investment company by distributing substantially all of its taxable income and realized gains under Subchapter M of the Internal Revenue Code and filing its U.S. federal tax return. As a result, no provision for income taxes is required. A fund's federal tax return is subject to examination by the Internal Revenue Service (IRS) for a period of three years. Foreign taxes are provided for based on the Fund's understanding of the tax rules and rates that exist in the foreign markets in which it invests.
Distributions are recorded on the ex-dividend date. Income dividends and capital gain distributions are declared separately for each class. Income and capital gain distributions are determined in accordance with income tax regulations, which may differ from GAAP.
Capital accounts within the financial statements are adjusted for permanent book-tax differences. These adjustments have no impact on net assets or the results of operations. Temporary book-tax differences will reverse in a subsequent period.
Book-tax differences are primarily due to the short-term gain distributions from the Underlying Funds, foreign currency transactions, passive foreign investment companies (PFIC), deferred trustees compensation, capital loss carryforwards and losses deferred due to wash sales.
The federal tax cost of investment securities and unrealized appreciation (depreciation) as of period end were as follows:
Gross unrealized appreciation | $ 197,381,193 |
Gross unrealized depreciation | (263,012,657) |
Net unrealized appreciation (depreciation) | $ (65,631,464) |
| |
Tax cost | $ 1,562,935,061 |
Semiannual Report
Notes to Financial Statements (Unaudited) - continued
3. Significant Accounting Policies - continued
Trading (Redemption) Fees. Initial Class R shares, Service Class R shares, Service Class 2 R shares and Investor Class R shares held less than 60 days are subject to a redemption fee equal to 1% of the proceeds of the redeemed shares. All redemption fees, including any estimated redemption fees paid by FMR, are retained by the Fund and accounted for as an addition to paid in capital.
4. Purchases and Sales of Investments.
Purchases and sales of securities, other than short-term securities, aggregated $468,153,858 and $541,791,641, respectively.
5. Fees and Other Transactions with Affiliates.
Management Fee. FMR and its affiliates provide the Fund with investment management related services for which the Fund pays a monthly management fee. The management fee is the sum of an individual fund fee rate that is based on an annual rate of .45% of the Fund's average net assets and a group fee rate that averaged .26% during the period. The group fee rate is based upon the average net assets of all the mutual funds advised by FMR. The group fee rate decreases as assets under management increase and increases as assets under management decrease. For the period, the total annualized management fee rate was .71% of the Fund's average net assets.
Distribution and Service Plan. In accordance with Rule 12b-1 of the 1940 Act, the Fund has adopted separate 12b-1 Plans for each Service Class of shares. Each Service Class pays Fidelity Distributors Corporation (FDC), an affiliate of FMR, a service fee. For the period, the service fee is based on an annual rate of .10% of Service Class' and Service Class R's average net assets and .25% of Service Class 2's and Service Class 2R's average net assets.
For the period, each class paid FDC the following amounts, all of which were re-allowed to insurance companies for the distribution of shares and providing shareholder support services:
Service Class | $ 79,400 |
Service Class 2 | 536,457 |
Service Class R | 30,088 |
Service Class 2 R | 73,781 |
| $ 719,726 |
Transfer Agent Fees. Fidelity Investments Institutional Operations Company, Inc. (FIIOC), an affiliate of FMR, is the Fund's transfer, dividend disbursing, and shareholder servicing agent. FIIOC receives an asset-based fee with respect to each class. Each class (with the exception of Investor Class R) pays a transfer agent fee, excluding out of pocket expenses, equal to an annual rate of .07% of average net assets. Investor Class R pays a monthly asset-based transfer agent fee of .15% of average net assets. The total transfer agent fees paid by each class to FIIOC, including out of pocket expenses, were as follows:
Initial Class | $ 255,347 |
Service Class | 55,683 |
Service Class 2 | 148,833 |
Initial Class R | 41,264 |
Service Class R | 20,302 |
Service Class 2R | 19,908 |
Investor Class R | 114,957 |
| $ 656,294 |
Accounting and Security Lending Fees. Fidelity Service Company, Inc. (FSC), an affiliate of FMR, maintains the Fund's accounting records. The accounting fee is based on the level of average net assets for the month. Under a separate contract, FSC administers the security lending program. The security lending fee is based on the number and duration of lending transactions.
Brokerage Commissions. The Fund placed a portion of its portfolio transactions with brokerage firms which are affiliates of the investment adviser. The commissions paid to these affiliated firms were $504 for the period.
Interfund Lending Program. Pursuant to an Exemptive Order issued by the SEC, the Fund, along with other registered investment companies having management contracts with FMR, may participate in an interfund lending program. This program provides an alternative credit facility allowing the funds to borrow from, or lend money to, other participating affiliated funds. At period end, there were no interfund loans outstanding. The Fund's activity in this program during the period for which loans were outstanding was as follows:
Borrower or Lender | Average Daily
Loan Balance | Weighted Average
Interest Rate | Interest Expense |
Borrower | $ 6,226,667 | .45% | $ 235 |
Semiannual Report
6. Committed Line of Credit.
The Fund participates with other funds managed by FMR in a $3.75 billion credit facility (the "line of credit") to be utilized for temporary or emergency purposes to fund shareholder redemptions or for other short-term liquidity purposes. The Fund has agreed to pay commitment fees on its pro-rata portion of the line of credit, which amounted to $3,554 and is reflected in Miscellaneous expenses on the Statement of Operations. During the period, there were no borrowings on this line of credit.
7. Security Lending.
The Fund lends portfolio securities from time to time in order to earn additional income. On the settlement date of the loan, the Fund receives collateral (in the form of U.S. Treasury obligations, letters of credit and/or cash) against the loaned securities and maintains collateral in an amount not less than 100% of the market value of the loaned securities during the period of the loan. The market value of the loaned securities is determined at the close of business of the Fund and any additional required collateral is delivered to the Fund on the next business day. If the borrower defaults on its obligation to return the securities loaned because of insolvency or other reasons, a fund could experience delays and costs in recovering the securities loaned or in gaining access to the collateral. Any cash collateral received is invested in the Fidelity Securities Lending Cash Central Fund. The value of loaned securities and cash collateral at period end are disclosed on the Fund's Statement of Assets and Liabilities. Security lending income represents the income earned on investing cash collateral, less fees and expenses associated with the loan, plus any premium payments that may be received on the loan of certain types of securities. Security lending income is presented in the Statement of Operations as a component of income from Fidelity Central Funds. Net income from lending portfolio securities during the period amounted to $881,813.
8. Expense Reductions.
Many of the brokers with whom FMR places trades on behalf of the Fund provided services to the Fund in addition to trade execution. These services included payments of certain expenses on behalf of the Fund totaling $157,939 for the period.
9. Distributions to Shareholders.
Distributions to shareholders of each class were as follows:
| Six months ended
June 30, 2010 | Year ended
December 31, 2009 |
From net investment income | | |
Initial Class | $ - | $ 14,372,278 |
Service Class | - | 3,138,360 |
Service Class 2 | - | 7,783,553 |
Initial Class R | - | 2,454,887 |
Service Class R | - | 1,206,143 |
Service Class 2R | - | 1,088,142 |
Investor Class R | - | 2,716,315 |
Total | $ - | $ 32,759,678 |
From net realized gain | | |
Initial Class | $ - | $ 2,196,333 |
Service Class | - | 510,078 |
Service Class 2 | - | 1,322,412 |
Initial Class R | - | 370,967 |
Service Class R | - | 192,822 |
Service Class 2R | - | 169,786 |
Investor Class R | - | 414,053 |
Total | $ - | $ 5,176,451 |
Semiannual Report
Notes to Financial Statements (Unaudited) - continued
10. Share Transactions.
Transactions for each class of shares were as follows:
| Shares | Dollars |
| Six months ended
June 30, 2010 | Year ended
December 31, 2009 | Six months ended
June 30, 2010 | Year ended
December 31, 2009 |
Initial Class | | | | |
Shares sold | 3,550,981 | 5,347,946 | $ 50,205,226 | $ 70,803,136 |
Reinvestment of distributions | - | 1,154,164 | - | 16,568,611 |
Shares redeemed | (4,869,840) | (13,947,134) | (70,337,163) | (175,327,331) |
Net increase (decrease) | (1,318,859) | (7,445,024) | $ (20,131,937) | $ (87,955,584) |
Service Class | | | | |
Shares sold | 379,710 | 959,799 | $ 5,516,115 | $ 12,824,467 |
Reinvestment of distributions | - | 255,575 | - | 3,648,438 |
Shares redeemed | (1,307,728) | (3,455,536) | (18,715,035) | (43,871,038) |
Net increase (decrease) | (928,018) | (2,240,162) | $ (13,198,920) | $ (27,398,133) |
Service Class 2 | | | | |
Shares sold | 1,434,952 | 2,952,474 | $ 20,214,404 | $ 36,740,955 |
Reinvestment of distributions | - | 640,998 | - | 9,105,965 |
Shares redeemed | (2,944,613) | (7,248,281) | (41,534,863) | (89,623,254) |
Net increase (decrease) | (1,509,661) | (3,654,809) | $ (21,320,459) | $ (43,776,334) |
Initial Class R | | | | |
Shares sold | 174,244 | 612,315 | $ 2,518,767 | $ 8,157,631 |
Reinvestment of distributions | - | 197,166 | - | 2,825,854 |
Shares redeemed | (971,053) | (2,020,970) | (13,959,449) | (24,694,123) |
Net increase (decrease) | (796,809) | (1,211,489) | $ (11,440,682) | $ (13,710,638) |
Service Class R | | | | |
Shares sold | 132,145 | 305,936 | $ 1,875,102 | $ 4,003,822 |
Reinvestment of distributions | - | 98,069 | - | 1,398,965 |
Shares redeemed | (557,242) | (1,102,231) | (8,005,234) | (13,550,063) |
Net increase (decrease) | (425,097) | (698,226) | $ (6,130,132) | $ (8,147,276) |
Service Class 2R | | | | |
Shares sold | 233,787 | 1,006,368 | $ 3,393,003 | $ 12,396,135 |
Reinvestment of distributions | - | 88,897 | - | 1,257,928 |
Shares redeemed | (682,503) | (625,865) | (9,956,064) | (7,643,458) |
Net increase (decrease) | (448,716) | 469,400 | $ (6,563,061) | $ 6,010,605 |
Investor Class R | | | | |
Shares sold | 1,345,328 | 1,131,791 | $ 18,776,847 | $ 15,649,216 |
Reinvestment of distributions | - | 218,381 | - | 3,130,368 |
Shares redeemed | (729,823) | (1,661,407) | (10,497,754) | (20,149,633) |
Net increase (decrease) | 615,505 | (311,235) | $ 8,279,093 | $ (1,370,049) |
11. Other.
The Fund's organizational documents provide former and current trustees and officers with a limited indemnification against liabilities arising in connection with the performance of their duties to the Fund. In the normal course of business, the Fund may also enter into contracts that provide general indemnifications. The Fund's maximum exposure under these arrangements is unknown as this would be dependent on future claims that may be made against the Fund. The risk of material loss from such claims is considered remote.
At the end of the period, FMR or its affiliates were the owners of record of 16% of the total outstanding shares of the Fund and three otherwise unaffiliated shareholders were the owners of record of 44% of the total outstanding shares of the Fund.
Semiannual Report
Investment Adviser
Fidelity Management & Research Company
Boston, MA
Investment Sub-Advisers
FMR Co., Inc.
Fidelity Management & Research (U.K.) Inc.
Fidelity Research & Analysis Company
FIL Investment Advisors
FIL Investment Advisors (U.K.) Ltd.
FIL Investments (Japan) Limited
Fidelity Management & Research (Japan) Inc.
Fidelity Management & Research (Hong Kong) Limited
General Distributor
Fidelity Distributors Corporation
Boston, MA
Transfer and Service Agents
Fidelity Investments Institutional Operations Company, Inc.
Boston, MA
Fidelity Service Company, Inc.
Boston, MA
Custodian
JPMorgan Chase Bank
New York, NY
VIPOVRS-SANN-0810
1.705696.112
Fidelity® Variable Insurance Products:
Overseas Portfolio - Class R
Semiannual Report
June 30, 2010
(2_fidelity_logos) (Registered_Trademark)
Contents
Shareholder Expense Example | <Click Here> | An example of shareholder expenses. |
Investment Changes | <Click Here> | A summary of major shifts in the fund's investments over the past six months. |
Investments | <Click Here> | A complete list of the fund's investments with their market values. |
Financial Statements | <Click Here> | Statements of assets and liabilities, operations, and changes in net assets, as well as financial highlights. |
Notes | <Click Here> | Notes to the financial statements. |
To view a fund's proxy voting guidelines and proxy voting record for the 12-month period ended June 30, visit http://www.fidelity.com/proxyvotingresults or visit the Securities and Exchange Commission's (SEC) web site at http://www.sec.gov. You may also call 1-877-208-0098 to request a free copy of the proxy voting guidelines.
Fidelity Variable Insurance Products are separate account options which are purchased through a variable insurance contract.
Standard & Poor's, S&P and S&P 500 are registered service marks of The McGraw-Hill Companies, Inc. and have been licensed for use by Fidelity Distributors Corporation.
Other third party marks appearing herein are the property of their respective owners.
All other marks appearing herein are registered or unregistered trademarks or service marks of FMR LLC or an affiliated company.
This report and the financial statements contained herein are submitted for the general information of the shareholders of the fund. This report is not authorized for distribution to prospective investors in the fund unless preceded or accompanied by an effective prospectus.
A fund files its complete schedule of portfolio holdings with the SEC for the first and third quarters of each fiscal year on Form N-Q. Forms N-Q are available on the SEC's web site at http://www.sec.gov. A fund's Forms N-Q may be reviewed and copied at the SEC's Public Reference Room in Washington, DC. Information regarding the operation of the SEC's Public Reference Room may be obtained by calling 1-800-SEC-0330. For a complete list of a fund's portfolio holdings, view the most recent holdings listing, semiannual report, or annual report on Fidelity's web site at http://www.fidelity.com or http://www.advisor.fidelity.com, as applicable.
NOT FDIC INSURED • MAY LOSE VALUE • NO BANK GUARANTEE
Neither the fund nor Fidelity Distributors Corporation is a bank.
Semiannual Report
As a shareholder of the Fund, you incur two types of costs: (1) transaction costs, including redemption fees, and (2) ongoing costs, including management fees, distribution and/or service (12b-1) fees and other Fund expenses. This Example is intended to help you understand your ongoing costs (in dollars) of investing in the Fund and to compare these costs with the ongoing costs of investing in other mutual funds.
The Example is based on an investment of $1,000 invested at the beginning of the period and held for the entire period (January 1, 2010 to June 30, 2010).
Actual Expenses
The first line of the accompanying table for each class of the Fund provides information about actual account values and actual expenses. You may use the information in this line, together with the amount you invested, to estimate the expenses that you paid over the period. Simply divide your account value by $1,000.00 (for example, an $8,600 account value divided by $1,000.00 = 8.6), then multiply the result by the number in the first line for a class of the Fund under the heading entitled "Expenses Paid During Period" to estimate the expenses you paid on your account during this period. The estimate of expenses does not include any fees or other expenses of any variable annuity or variable life insurance product. If they were, the estimate of expenses you paid during the period would be higher, and your ending account value would be lower. In addition, the Fund, as a shareholder in the underlying Fidelity Central Funds, will indirectly bear its pro-rata share of the fees and expenses incurred by the underlying Fidelity Central Funds. These fees and expenses are not included in the Fund's annualized expense ratio used to calculate the expense estimate in the table below.
Hypothetical Example for Comparison Purposes
The second line of the accompanying table for each class of the Fund provides information about hypothetical account values and hypothetical expenses based on a Class' actual expense ratio and an assumed rate of return of 5% per year before expenses, which is not the Class' actual return. The hypothetical account values and expenses may not be used to estimate the actual ending account balance or expenses you paid for the period. You may use this information to compare the ongoing costs of investing in the Fund and other funds. To do so, compare this 5% hypothetical example with the 5% hypothetical examples that appear in the shareholder reports of the other funds. The estimate of expenses does not include any fees or other expenses of any variable annuity or variable life insurance product. If they were, the estimate of expenses you paid during the period would be higher, and your ending account value would be lower. In addition, the Fund, as a shareholder in the underlying Fidelity Central Funds, will indirectly bear its pro-rata share of the fees and expenses incurred by the underlying Fidelity Central Funds. These fees and expenses are not included in the Fund's annualized expense ratio used to calculate the expense estimate in the table below.
Please note that the expenses shown in the table are meant to highlight your ongoing costs only and do not reflect any transaction costs. Therefore, the second line of the table is useful in comparing ongoing costs only, and will not help you determine the relative total costs of owning different funds. In addition, if these transactional costs were included, your costs would have been higher.
|
Annualized
Expense Ratio
|
Beginning
Account Value
January 1, 2010
|
Ending
Account Value
June 30, 2010
| Expenses Paid
During Period*
January 1, 2010 to
June 30, 2010 |
Initial Class | .86% | | | |
Actual | | $ 1,000.00 | $ 864.50 | $ 3.98 |
HypotheticalA | | $ 1,000.00 | $ 1,020.53 | $ 4.31 |
Service Class | .96% | | | |
Actual | | $ 1,000.00 | $ 863.90 | $ 4.44 |
HypotheticalA | | $ 1,000.00 | $ 1,020.03 | $ 4.81 |
Service Class 2 | 1.11% | | | |
Actual | | $ 1,000.00 | $ 863.30 | $ 5.13 |
HypotheticalA | | $ 1,000.00 | $ 1,019.29 | $ 5.56 |
Initial Class R | .86% | | | |
Actual | | $ 1,000.00 | $ 864.20 | $ 3.98 |
HypotheticalA | | $ 1,000.00 | $ 1,020.53 | $ 4.31 |
Service Class R | .96% | | | |
Actual | | $ 1,000.00 | $ 863.70 | $ 4.44 |
HypotheticalA | | $ 1,000.00 | $ 1,020.03 | $ 4.81 |
Service Class 2R | 1.11% | | | |
Actual | | $ 1,000.00 | $ 863.50 | $ 5.13 |
HypotheticalA | | $ 1,000.00 | $ 1,019.29 | $ 5.56 |
Investor Class R | .95% | | | |
Actual | | $ 1,000.00 | $ 864.10 | $ 4.39 |
HypotheticalA | | $ 1,000.00 | $ 1,020.08 | $ 4.76 |
A 5% return per year before expenses
* Expenses are equal to each Class' annualized expense ratio, multiplied by the average account value over the period, multiplied by 181/365 (to reflect the one-half year period).
Semiannual Report
Investment Changes (Unaudited)
Geographic Diversification (% of fund's net assets) |
As of June 30, 2010 |
 | Japan | 19.3% | |
 | United Kingdom | 17.8% | |
 | France | 10.5% | |
 | Germany | 7.7% | |
 | Switzerland | 7.3% | |
 | United States of America | 4.6% | |
 | Australia | 3.7% | |
 | Cayman Islands | 3.3% | |
 | Spain | 3.0% | |
 | Other | 22.8% | |
Percentages are adjusted for the effect of futures contracts, if applicable.
As of December 31, 2009 |
| United Kingdom | 19.6% | |
| Japan | 17.2% | |
| France | 12.0% | |
| Germany | 10.8% | |
| Switzerland | 5.9% | |
| Australia | 4.7% | |
| Spain | 3.6% | |
| Hong Kong | 2.9% | |
| Italy | 2.7% | |
| Other | 20.6% | |
Percentages are adjusted for the effect of futures contracts, if applicable.
Asset Allocation as of June 30, 2010 |
| % of fund's
net assets | % of fund's net assets
6 months ago |
Stocks | 98.2 | 99.6 |
Short-Term Investments and Net Other Assets | 1.8 | 0.4 |
Top Ten Stocks as of June 30, 2010 |
| % of fund's
net assets | % of fund's net assets
6 months ago |
HSBC Holdings PLC (United Kingdom, Commercial Banks) | 2.6 | 2.6 |
LVMH Moet Hennessy - Louis Vuitton (France, Textiles, Apparel & Luxury Goods) | 2.4 | 1.3 |
Roche Holding AG (participation certificate) (Switzerland, Pharmaceuticals) | 2.1 | 1.9 |
The Swatch Group AG (Bearer) (Switzerland, Textiles, Apparel & Luxury Goods) | 2.0 | 0.7 |
Anheuser-Busch InBev SA NV (Belgium, Beverages) | 1.8 | 1.2 |
Toyota Motor Corp. (Japan, Automobiles) | 1.7 | 1.6 |
Novo Nordisk AS Series B (Denmark, Pharmaceuticals) | 1.6 | 0.9 |
Clicks Group Ltd. (South Africa, Multiline Retail) | 1.6 | 0.0 |
Total SA (France, Oil, Gas & Consumable fuels) | 1.3 | 1.7 |
Vodafone Group PLC (United Kingdom, Wireless Telecommunication Services) | 1.3 | 1.7 |
| 18.4 | |
Market Sectors as of June 30, 2010 |
| % of fund's
net assets | % of fund's net assets
6 months ago |
Financials | 24.8 | 26.6 |
Consumer Discretionary | 21.9 | 16.6 |
Industrials | 9.7 | 9.9 |
Information Technology | 9.2 | 8.2 |
Materials | 8.8 | 11.3 |
Health Care | 8.6 | 5.9 |
Energy | 6.3 | 8.0 |
Consumer Staples | 5.0 | 5.2 |
Telecommunication Services | 3.0 | 5.3 |
Utilities | 0.9 | 2.6 |
Semiannual Report
Investments June 30, 2010 (Unaudited)
Showing Percentage of Net Assets
Common Stocks - 97.7% |
| Shares | | Value |
Australia - 3.7% |
AMP Ltd. | 1,384,931 | | $ 6,006,749 |
Aristocrat Leisure Ltd. | 2,371,900 | | 7,223,871 |
Australia & New Zealand Banking Group Ltd. | 161,823 | | 2,904,666 |
BHP Billiton Ltd. | 291,587 | | 9,065,216 |
Commonwealth Bank of Australia | 299,973 | | 12,119,240 |
Newcrest Mining Ltd. | 138,258 | | 4,031,253 |
Rio Tinto Ltd. | 24,301 | | 1,335,546 |
Wesfarmers Ltd. | 93,194 | | 2,226,012 |
Westfield Group unit | 945,730 | | 9,604,005 |
TOTAL AUSTRALIA | | 54,516,558 |
Austria - 0.4% |
Wienerberger AG (a)(c) | 479,120 | | 5,823,313 |
Bailiwick of Jersey - 1.2% |
Informa PLC | 1,288,973 | | 6,808,043 |
WPP PLC | 1,160,619 | | 10,930,303 |
TOTAL BAILIWICK OF JERSEY | | 17,738,346 |
Belgium - 2.1% |
Ageas | 722,100 | | 1,606,837 |
Anheuser-Busch InBev SA NV | 560,601 | | 26,953,309 |
Hamon & Compagnie International SA | 73,974 | | 2,586,507 |
TOTAL BELGIUM | | 31,146,653 |
Bermuda - 0.2% |
Huabao International Holdings Ltd. | 2,642,000 | | 3,377,170 |
Brazil - 0.0% |
Drogasil SA | 22,000 | | 420,324 |
Canada - 0.9% |
Barrick Gold Corp. | 73,000 | | 3,313,475 |
Suncor Energy, Inc. | 258,200 | | 7,598,897 |
Yamana Gold, Inc. | 288,100 | | 2,955,288 |
TOTAL CANADA | | 13,867,660 |
Cayman Islands - 3.3% |
Ajisen (China) Holdings Ltd. | 3,868,000 | | 4,317,827 |
BaWang International (Group) Holding Ltd. | 6,473,000 | | 4,592,283 |
Bosideng International Holdings Ltd. | 26,702,000 | | 7,170,793 |
China Dongxiang Group Co. Ltd. | 4,578,000 | | 3,051,479 |
China High Speed Transmission Equipment Group Co. Ltd. | 1,771,000 | | 3,720,082 |
CNinsure, Inc. ADR | 117,700 | | 3,053,138 |
Ctrip.com International Ltd. sponsored ADR (a) | 56,100 | | 2,107,116 |
Daphne International Holdings Ltd. | 3,632,000 | | 3,678,279 |
Hengdeli Holdings Ltd. | 26,694,000 | | 11,507,185 |
Little Sheep Group Ltd. | 2,618,000 | | 1,567,586 |
Natural Beauty Bio-Technology Ltd. | 1,060,000 | | 188,524 |
Peak Sport Products Co. Ltd. (c) | 5,433,000 | | 3,578,122 |
TOTAL CAYMAN ISLANDS | | 48,532,414 |
|
| Shares | | Value |
China - 0.7% |
Baidu.com, Inc. sponsored ADR (a) | 161,000 | | $ 10,960,880 |
Denmark - 2.0% |
Danske Bank AS (a) | 96,100 | | 1,849,060 |
Novo Nordisk AS: | | | |
Series B | 51,925 | | 4,194,853 |
Series B sponsored ADR | 236,100 | | 19,128,822 |
William Demant Holding AS (a) | 62,971 | | 4,605,501 |
TOTAL DENMARK | | 29,778,236 |
France - 10.5% |
Atos Origin SA (a) | 72,705 | | 2,919,199 |
AXA SA | 209,420 | | 3,199,199 |
AXA SA sponsored ADR | 158,600 | | 2,418,650 |
BNP Paribas SA | 223,399 | | 12,018,552 |
Carrefour SA | 130,903 | | 5,192,384 |
Credit Agricole SA | 315,700 | | 3,275,300 |
Danone | 250,812 | | 13,445,531 |
Essilor International SA | 70,800 | | 4,207,108 |
Iliad Group SA | 28,200 | | 2,189,749 |
Ingenico SA | 110,004 | | 2,354,037 |
Ipsos SA (c) | 113,100 | | 3,800,050 |
Laurent-Perrier Group | 21,000 | | 1,752,509 |
LVMH Moet Hennessy - Louis Vuitton | 326,512 | | 35,537,051 |
Sanofi-Aventis | 45,238 | | 2,724,451 |
Sanofi-Aventis sponsored ADR | 543,400 | | 16,334,604 |
Schneider Electric SA (c) | 101,394 | | 10,240,372 |
Societe Generale Series A | 180,737 | | 7,436,829 |
Total SA | 286,700 | | 12,797,425 |
Total SA sponsored ADR | 142,000 | | 6,338,880 |
Vallourec SA (c) | 26,321 | | 4,537,879 |
Wendel | 58,600 | | 2,950,466 |
TOTAL FRANCE | | 155,670,225 |
Germany - 7.2% |
Allianz AG | 77,600 | | 7,635,840 |
BASF AG | 101,781 | | 5,569,377 |
Bayer AG | 134,710 | | 7,516,658 |
Bayerische Motoren Werke AG (BMW) | 332,291 | | 16,149,193 |
Deutsche Bank AG | 91,246 | | 5,124,376 |
Deutsche Bank AG (NY Shares) | 33,900 | | 1,903,824 |
Deutsche Boerse AG | 191,620 | | 11,640,517 |
Deutsche Lufthansa AG (a) | 248,900 | | 3,438,870 |
Deutsche Post AG | 273,501 | | 3,984,456 |
Deutsche Postbank AG (a) | 60,800 | | 1,762,291 |
Linde AG | 69,387 | | 7,281,344 |
MAN SE | 64,363 | | 5,305,091 |
Munich Re Group | 35,062 | | 4,395,561 |
Puma AG | 15,683 | | 4,154,788 |
SAP AG (c) | 154,842 | | 6,859,501 |
SAP AG sponsored ADR (c) | 165,100 | | 7,313,930 |
Siemens AG | 87,749 | | 7,856,168 |
TOTAL GERMANY | | 107,891,785 |
Common Stocks - continued |
| Shares | | Value |
Hong Kong - 1.7% |
Cathay Pacific Airways Ltd. | 3,065,000 | | $ 6,061,941 |
Hang Seng Bank Ltd. | 131,600 | | 1,759,589 |
Henderson Land Development Co. Ltd. | 885,000 | | 5,183,663 |
Henderson Land Development Co. Ltd. warrants 6/1/11 (a) | 123,200 | | 20,593 |
Hong Kong Exchanges and Clearing Ltd. | 502,800 | | 7,842,158 |
Wharf Holdings Ltd. | 1,050,000 | | 5,086,956 |
TOTAL HONG KONG | | 25,954,900 |
Ireland - 1.5% |
CRH PLC | 554,756 | | 11,506,949 |
Kingspan Group PLC (United Kingdom) (a) | 882,000 | | 6,542,338 |
Paddy Power PLC (Ireland) | 146,800 | | 4,560,626 |
TOTAL IRELAND | | 22,609,913 |
Israel - 0.3% |
Teva Pharmaceutical Industries Ltd. sponsored ADR | 71,200 | | 3,701,688 |
Italy - 2.7% |
Bulgari SpA | 550,500 | | 3,934,279 |
Intesa Sanpaolo SpA | 3,187,500 | | 8,394,565 |
Saipem SpA | 558,496 | | 17,010,102 |
Tod's SpA | 43,100 | | 2,716,397 |
UniCredit SpA | 2,558,038 | | 5,658,243 |
Unione di Banche Italiane SCpA | 246,904 | | 2,125,797 |
TOTAL ITALY | | 39,839,383 |
Japan - 19.3% |
Asahi Glass Co. Ltd. | 421,000 | | 3,953,790 |
Canon, Inc. | 218,000 | | 8,126,119 |
Canon, Inc. sponsored ADR | 124,900 | | 4,660,019 |
Citizen Holdings Co. Ltd. | 776,600 | | 4,744,983 |
Denso Corp. | 123,700 | | 3,419,513 |
eAccess Ltd. | 3,575 | | 2,435,733 |
East Japan Railway Co. | 43,300 | | 2,883,644 |
Fanuc Ltd. | 56,200 | | 6,347,325 |
Fuji Media Holdings, Inc. | 1,132 | | 1,625,465 |
Hoya Corp. | 107,800 | | 2,294,123 |
Japan Retail Fund Investment Corp. | 3,506 | | 4,270,778 |
Japan Tobacco, Inc. | 916 | | 2,850,248 |
JFE Holdings, Inc. | 123,900 | | 3,833,745 |
JSR Corp. | 121,600 | | 2,042,956 |
Keyence Corp. | 30,200 | | 6,984,705 |
Konica Minolta Holdings, Inc. | 114,000 | | 1,096,897 |
Mazda Motor Corp. | 4,603,000 | | 10,758,331 |
Mitsubishi Corp. | 202,000 | | 4,179,774 |
Mitsubishi Electric Corp. | 1,084,000 | | 8,461,966 |
Mitsubishi Estate Co. Ltd. | 428,000 | | 5,959,487 |
Mitsubishi UFJ Financial Group, Inc. | 3,327,700 | | 15,112,675 |
Mitsubishi UFJ Financial Group, Inc. sponsored ADR | 851,200 | | 3,881,472 |
Mitsui & Co. Ltd. | 393,600 | | 4,592,433 |
|
| Shares | | Value |
Mizuho Financial Group, Inc. | 1,836,800 | | $ 3,014,353 |
MS&AD Insurance Group Holdings, Inc. | 141,900 | | 3,037,648 |
Murata Manufacturing Co. Ltd. | 98,100 | | 4,678,995 |
Nintendo Co. Ltd. | 17,100 | | 5,021,569 |
NKSJ Holdings, Inc. (a) | 380,000 | | 2,239,872 |
Nomura Holdings, Inc. | 1,325,200 | | 7,241,438 |
NSK Ltd. | 587,000 | | 4,077,485 |
Omron Corp. | 404,500 | | 8,819,360 |
ORIX Corp. | 110,910 | | 8,036,216 |
Rakuten, Inc. | 9,640 | | 6,966,417 |
Ricoh Co. Ltd. | 838,000 | | 10,687,588 |
Sharp Corp. | 473,000 | | 4,990,352 |
Shin-Etsu Chemical Co., Ltd. | 121,400 | | 5,645,474 |
Shiseido Co. Ltd. | 130,500 | | 2,876,877 |
SMC Corp. | 66,100 | | 8,843,815 |
SOFTBANK CORP. | 377,300 | | 10,008,925 |
Sony Corp. | 128,400 | | 3,425,396 |
Sony Corp. sponsored ADR | 34,500 | | 920,460 |
Sumitomo Corp. | 611,100 | | 6,104,096 |
Sumitomo Metal Industries Ltd. | 2,026,000 | | 4,581,644 |
Sumitomo Mitsui Financial Group, Inc. | 410,200 | | 11,611,600 |
T&D Holdings, Inc. | 186,650 | | 3,991,699 |
Tokio Marine Holdings, Inc. | 128,400 | | 3,376,189 |
Tokyo Electron Ltd. | 118,900 | | 6,405,895 |
Toshiba Corp. (a) | 1,336,000 | | 6,619,096 |
Toyota Motor Corp. | 412,300 | | 14,168,476 |
Toyota Motor Corp. sponsored ADR (c) | 142,800 | | 9,791,796 |
Yahoo! Japan Corp. | 12,647 | | 5,041,633 |
TOTAL JAPAN | | 286,740,545 |
Korea (South) - 0.4% |
Samsung Electronics Co. Ltd. | 9,803 | | 6,142,119 |
Luxembourg - 0.4% |
ArcelorMittal SA Class A unit | 198,100 | | 5,301,156 |
Netherlands - 2.3% |
Aegon NV (a) | 308,300 | | 1,637,569 |
ASML Holding NV | 146,200 | | 4,016,114 |
ING Groep NV: | | | |
(Certificaten Van Aandelen) unit (a) | 574,784 | | 4,253,524 |
sponsored ADR (a) | 87,600 | | 649,116 |
Koninklijke KPN NV | 121,101 | | 1,543,553 |
Koninklijke Philips Electronics NV | 346,416 | | 10,344,275 |
Koninklijke Philips Electronics NV unit | 138,500 | | 4,132,840 |
Randstad Holdings NV (a) | 116,500 | | 4,577,704 |
Royal DSM NV | 72,462 | | 2,880,390 |
TOTAL NETHERLANDS | | 34,035,085 |
Norway - 0.9% |
Aker Solutions ASA | 437,400 | | 5,001,175 |
DnB NOR ASA | 413,200 | | 3,974,272 |
Sevan Marine ASA (a) | 431,000 | | 311,537 |
StatoilHydro ASA sponsored ADR (c) | 206,500 | | 3,954,475 |
TOTAL NORWAY | | 13,241,459 |
Common Stocks - continued |
| Shares | | Value |
Papua New Guinea - 0.2% |
Lihir Gold Ltd. | 979,630 | | $ 3,522,013 |
Singapore - 0.4% |
United Overseas Bank Ltd. | 399,112 | | 5,552,394 |
South Africa - 2.2% |
Aspen Pharmacare Holdings Ltd. (a) | 640,300 | | 6,347,697 |
Clicks Group Ltd. | 5,240,662 | | 23,177,895 |
Nedbank Group Ltd. | 175,200 | | 2,738,819 |
TOTAL SOUTH AFRICA | | 32,264,411 |
Spain - 3.0% |
Antena 3 Television SA | 519,200 | | 2,938,947 |
Banco Bilbao Vizcaya Argentaria SA | 657,084 | | 6,769,613 |
Banco Santander SA | 1,338,097 | | 14,030,963 |
Banco Santander SA sponsored ADR | 124,500 | | 1,307,250 |
EDP Renovaveis SA (a) | 628,538 | | 3,701,552 |
Inditex SA | 41,545 | | 2,368,856 |
NH Hoteles SA (a)(c) | 901,900 | | 2,726,884 |
Telefonica SA | 609,471 | | 11,289,800 |
TOTAL SPAIN | | 45,133,865 |
Sweden - 1.7% |
Elekta AB (B Shares) | 565,300 | | 14,305,322 |
H&M Hennes & Mauritz AB (B Shares) | 180,318 | | 4,955,566 |
Nordea Bank AB | 188,800 | | 1,556,876 |
Svenska Handelsbanken AB (A Shares) | 98,900 | | 2,419,478 |
Swedbank AB (A Shares) (a) | 181,632 | | 1,666,779 |
TOTAL SWEDEN | | 24,904,021 |
Switzerland - 7.3% |
Adecco SA (Reg.) | 103,088 | | 4,918,001 |
Compagnie Financiere Richemont SA Series A | 362,264 | | 12,647,463 |
Credit Suisse Group sponsored ADR | 117,600 | | 4,401,768 |
Credit Suisse Group (Reg.) | 71,082 | | 2,672,487 |
Kuehne & Nagel International AG | 33,380 | | 3,436,098 |
Roche Holding AG (participation certificate) | 232,223 | | 31,963,572 |
Swiss Reinsurance Co. | 40,826 | | 1,677,469 |
The Swatch Group AG (Bearer) | 104,260 | | 29,403,937 |
UBS AG (a) | 447,317 | | 5,925,974 |
UBS AG (NY Shares) (a) | 300,443 | | 3,971,856 |
Zurich Financial Services AG | 32,844 | | 7,239,265 |
TOTAL SWITZERLAND | | 108,257,890 |
Taiwan - 0.6% |
Hon Hai Precision Industry Co. Ltd. (Foxconn) | 978,000 | | 3,412,817 |
HTC Corp. | 178,000 | | 2,353,349 |
Taiwan Semiconductor Manufacturing Co. Ltd. sponsored ADR | 376,267 | | 3,672,366 |
TOTAL TAIWAN | | 9,438,532 |
|
| Shares | | Value |
United Kingdom - 17.8% |
Aberdeen Asset Management PLC | 1,927,425 | | $ 3,688,871 |
Anglo American PLC: | | | |
ADR (a) | 238,400 | | 4,107,632 |
(United Kingdom) (a) | 259,780 | | 9,049,355 |
Aviva PLC | 431,600 | | 2,005,124 |
Barclays PLC | 1,845,252 | | 7,363,114 |
Barclays PLC Sponsored ADR | 548,200 | | 8,710,898 |
BG Group PLC | 582,221 | | 8,656,672 |
BHP Billiton PLC | 678,517 | | 17,587,658 |
BP PLC | 1,586,406 | | 7,592,103 |
BP PLC sponsored ADR | 80,800 | | 2,333,504 |
Burberry Group PLC | 337,100 | | 3,805,929 |
Cairn Energy PLC (a) | 746,766 | | 4,586,310 |
Centrica PLC | 2,518,600 | | 11,111,287 |
GlaxoSmithKline PLC | 569,600 | | 9,669,388 |
Great Portland Estates PLC | 805,600 | | 3,478,478 |
Hays PLC | 1,754,300 | | 2,392,661 |
Hikma Pharmaceuticals PLC | 223,300 | | 2,370,284 |
HSBC Holdings PLC: | | | |
(United Kingdom) | 915,380 | | 8,360,122 |
sponsored ADR | 643,232 | | 29,324,947 |
Imperial Tobacco Group PLC | 387,432 | | 10,821,855 |
InterContinental Hotel Group PLC | 443,064 | | 6,980,636 |
ITV PLC (a) | 6,089,400 | | 4,549,281 |
Johnson Matthey PLC | 233,470 | | 5,185,435 |
Legal & General Group PLC | 1,128,633 | | 1,315,073 |
Lloyds TSB Group PLC (a) | 4,266,744 | | 3,367,441 |
Man Group PLC | 1,135,453 | | 3,762,787 |
Prudential PLC | 1,215,821 | | 9,167,700 |
Rio Tinto PLC | 186,315 | | 8,179,445 |
Rio Tinto PLC sponsored ADR | 134,700 | | 5,872,920 |
Royal Bank of Scotland Group PLC (a) | 1,668,800 | | 1,016,027 |
Royal Dutch Shell PLC: | | | |
Class A (United Kingdom) | 485,400 | | 12,245,895 |
Class B | 236,000 | | 5,702,569 |
Schroders PLC | 297,000 | | 5,343,767 |
Standard Chartered PLC (United Kingdom) | 290,623 | | 7,074,660 |
Sthree PLC | 229,400 | | 861,033 |
Vodafone Group PLC | 9,287,698 | | 19,131,463 |
William Hill PLC | 1,690,331 | | 4,299,058 |
Xstrata PLC | 344,400 | | 4,508,442 |
TOTAL UNITED KINGDOM | | 265,579,824 |
United States of America - 2.8% |
Apple, Inc. (a) | 17,100 | | 4,301,163 |
Coach, Inc. | 289,200 | | 10,570,260 |
Deckers Outdoor Corp. (a) | 90,000 | | 12,858,300 |
Google, Inc. Class A (a) | 14,200 | | 6,318,290 |
Common Stocks - continued |
| Shares | | Value |
United States of America - continued |
Philip Morris International, Inc. | 86,700 | | $ 3,974,328 |
Scientific Games Corp. Class A (a) | 464,000 | | 4,268,800 |
TOTAL UNITED STATES OF AMERICA | | 42,291,141 |
TOTAL COMMON STOCKS (Cost $1,500,848,404) | 1,454,233,903 |
Nonconvertible Preferred Stocks - 0.5% |
| | | |
Germany - 0.5% |
ProSiebenSat.1 Media AG | 249,700 | | 3,669,518 |
Volkswagen AG | 44,347 | | 3,893,587 |
TOTAL NONCONVERTIBLE PREFERRED STOCKS (Cost $6,282,123) | 7,563,105 |
Money Market Funds - 2.4% |
| Shares | | Value |
Fidelity Cash Central Fund, 0.20% (d) | 19,590,025 | | $ 19,590,025 |
Fidelity Securities Lending Cash Central Fund, 0.24% (b)(d) | 15,916,564 | | 15,916,564 |
TOTAL MONEY MARKET FUNDS (Cost $35,506,589) | 35,506,589 |
TOTAL INVESTMENT PORTFOLIO - 100.6% (Cost $1,542,637,116) | 1,497,303,597 |
NET OTHER ASSETS (LIABILITIES) - (0.6)% | (8,663,620) |
NET ASSETS - 100% | $ 1,488,639,977 |
Legend |
(a) Non-income producing |
(b) Investment made with cash collateral received from securities on loan. |
(c) Security or a portion of the security is on loan at period end. |
(d) Affiliated fund that is available only to investment companies and other accounts managed by Fidelity Investments. The rate quoted is the annualized seven-day yield of the fund at period end. A complete unaudited listing of the fund's holdings as of its most recent quarter end is available upon request. |
Affiliated Central Funds |
Information regarding fiscal year to date income earned by the Fund from investments in Fidelity Central Funds is as follows: |
Fund | Income earned |
Fidelity Cash Central Fund | $ 7,035 |
Fidelity Securities Lending Cash Central Fund | 881,813 |
Total | $ 888,848 |
Other Information |
The following is a summary of the inputs used, as of June 30, 2010, involving the Fund's assets and liabilities carried at value. The inputs or methodology used for valuing securities may not be an indication of the risk associated with investing in those securities. For more information on valuation inputs, and their aggregation into the levels used in the table below, please refer to the Security Valuation section in the accompanying Notes to Financial Statements. |
Valuation Inputs at Reporting Date: |
Description | Total | Level 1 | Level 2 | Level 3 |
Investments in Securities: | | | | |
Equities: | | | | |
Japan | $ 286,740,545 | $ 19,253,747 | $ 267,486,798 | $ - |
United Kingdom | 265,579,824 | 50,349,901 | 215,229,923 | - |
France | 155,670,225 | 25,092,134 | 130,578,091 | - |
Germany | 115,454,890 | 9,217,754 | 106,237,136 | - |
Switzerland | 108,257,890 | 8,373,624 | 99,884,266 | - |
Australia | 54,516,558 | - | 54,516,558 | - |
Cayman Islands | 48,532,414 | 5,160,254 | 43,372,160 | - |
Spain | 45,133,865 | 1,307,250 | 43,826,615 | - |
United States of America | 42,291,141 | 42,291,141 | - | - |
Other | 339,619,656 | 102,069,852 | 237,549,804 | - |
Money Market Funds | 35,506,589 | 35,506,589 | - | - |
Total Investments in Securities: | $ 1,497,303,597 | $ 298,622,246 | $ 1,198,681,351 | $ - |
Income Tax Information |
At December 31, 2009, the Fund had a capital loss carryforward of approximately $523,704,930 of which $243,257,460 and $280,447,470 will expire on December 31, 2016 and 2017, respectively. Capital loss carryforwards are only available to offset future capital gains of the Fund to the extent provided by regulations and may be limited. |
See accompanying notes which are an integral part of the financial statements.
Semiannual Report
Statement of Assets and Liabilities
| June 30, 2010 (Unaudited) |
| | |
Assets | | |
Investment in securities, at value (including securities loaned of $15,166,563) - See accompanying schedule: Unaffiliated issuers (cost $1,507,130,527) | $ 1,461,797,008 | |
Fidelity Central Funds (cost $35,506,589) | 35,506,589 | |
Total Investments (cost $1,542,637,116) | | $ 1,497,303,597 |
Foreign currency held at value (cost $56) | | 56 |
Receivable for investments sold | | 1,230,696 |
Receivable for fund shares sold | | 4,604,678 |
Dividends receivable | | 4,892,007 |
Distributions receivable from Fidelity Central Funds | | 79,844 |
Other receivables | | 391,347 |
Total assets | | 1,508,502,225 |
| | |
Liabilities | | |
Payable for investments purchased | $ 774,408 | |
Payable for fund shares redeemed | 1,157,655 | |
Accrued management fee | 912,360 | |
Distribution fees payable | 107,624 | |
Other affiliated payables | 152,779 | |
Other payables and accrued expenses | 840,858 | |
Collateral on securities loaned, at value | 15,916,564 | |
Total liabilities | | 19,862,248 |
| | |
Net Assets | | $ 1,488,639,977 |
Net Assets consist of: | | |
Paid in capital | | $ 2,043,861,178 |
Undistributed net investment income | | 17,467,019 |
Accumulated undistributed net realized gain (loss) on investments and foreign currency transactions | | (527,348,384) |
Net unrealized appreciation (depreciation) on investments and assets and liabilities in foreign currencies | | (45,339,836) |
Net Assets | | $ 1,488,639,977 |
Statement of Assets and Liabilities - continued
| June 30, 2010 (Unaudited) |
| | |
Initial Class:
Net Asset Value, offering price and redemption price per share ($638,077,369 ÷ 49,043,501 shares) | | $ 13.01 |
| | |
Service Class:
Net Asset Value, offering price and redemption price per share ($135,939,690 ÷ 10,496,593 shares) | | $ 12.95 |
| | |
Service Class 2:
Net Asset Value, offering price and redemption price per share ($375,934,210 ÷ 29,182,344 shares) | | $ 12.88 |
| | |
Initial Class R:
Net Asset Value, offering price and redemption price per share ($100,897,455 ÷ 7,773,487 shares) | | $ 12.98 |
| | |
| | |
Service Class R:
Net Asset Value, offering price and redemption price per share ($51,538,855 ÷ 3,985,926 shares) | | $ 12.93 |
| | |
Service Class 2R:
Net Asset Value, offering price and redemption price per share ($49,692,966 ÷ 3,888,908 shares) | | $ 12.78 |
| | |
Investor Class R:
Net Asset Value, offering price and redemption price per share ($136,559,432 ÷ 10,526,349 shares) | | $ 12.97 |
See accompanying notes which are an integral part of the financial statements.
Semiannual Report
Financial Statements - continued
Statement of Operations
| Six months ended June 30, 2010 (Unaudited) |
| | |
Investment Income | | |
Dividends | | $ 26,911,468 |
Income from Fidelity Central Funds | | 888,848 |
| | 27,800,316 |
Less foreign taxes withheld | | (2,383,524) |
Total income | | 25,416,792 |
| | |
Expenses | | |
Management fee | $ 5,990,253 | |
Transfer agent fees | 656,294 | |
Distribution fees | 719,726 | |
Accounting and security lending fees | 384,270 | |
Custodian fees and expenses | 178,088 | |
Independent trustees' compensation | 4,879 | |
Depreciation in deferred trustee compensation account | (49) | |
Audit | 42,296 | |
Legal | 6,396 | |
Interest | 235 | |
Miscellaneous | 79,884 | |
Total expenses before reductions | 8,062,272 | |
Expense reductions | (157,939) | 7,904,333 |
Net investment income (loss) | | 17,512,459 |
Realized and Unrealized Gain (Loss) Net realized gain (loss) on: | | |
Investment securities: | | |
Unaffiliated issuers (net of foreign taxes of $1,318) | 22,223,249 | |
Foreign currency transactions | (508,782) | |
Total net realized gain (loss) | | 21,714,467 |
Change in net unrealized appreciation (depreciation) on: Investment securities | (275,024,322) | |
Assets and liabilities in foreign currencies | (17,909) | |
Total change in net unrealized appreciation (depreciation) | | (275,042,231) |
Net gain (loss) | | (253,327,764) |
Net increase (decrease) in net assets resulting from operations | | $ (235,815,305) |
Statement of Changes in Net Assets
| Six months ended
June 30, 2010
(Unaudited) | Year ended
December 31,
2009 |
Increase (Decrease) in Net Assets | | |
Operations | | |
Net investment income (loss) | $ 17,512,459 | $ 33,212,492 |
Net realized gain (loss) | 21,714,467 | (285,899,417) |
Change in net unrealized appreciation (depreciation) | (275,042,231) | 627,435,395 |
Net increase (decrease) in net assets resulting from operations | (235,815,305) | 374,748,470 |
Distributions to shareholders from net investment income | - | (32,759,678) |
Distributions to shareholders from net realized gain | - | (5,176,451) |
Total distributions | - | (37,936,129) |
Share transactions - net increase (decrease) | (70,506,098) | (176,347,409) |
Redemption fees | 10,368 | 22,016 |
Total increase (decrease) in net assets | (306,311,035) | 160,486,948 |
| | |
Net Assets | | |
Beginning of period | 1,794,951,012 | 1,634,464,064 |
End of period (including undistributed net investment income of $17,467,019 and distributions in excess of net investment income of $45,440, respectively) | $ 1,488,639,977 | $ 1,794,951,012 |
See accompanying notes which are an integral part of the financial statements.
Semiannual Report
Financial Highlights - Initial Class
| Six months ended June 30, 2010 | Years ended December 31, |
| (Unaudited) | 2009 | 2008 | 2007 | 2006 | 2005 |
Selected Per-Share Data | | | | | | |
Net asset value, beginning of period | $ 15.05 | $ 12.17 | $ 25.33 | $ 23.96 | $ 20.60 | $ 17.51 |
Income from Investment Operations | | | | | | |
Net investment income (loss) E | .16 | .28 | .46 | .45 | .38 | .20 |
Net realized and unrealized gain (loss) | (2.20) | 2.93 | (10.67) | 3.42 | 3.30 | 3.10 |
Total from investment operations | (2.04) | 3.21 | (10.21) | 3.87 | 3.68 | 3.30 |
Distributions from net investment income | - | (.29) | (.49) | (.84) | (.19) | (.12) |
Distributions from net realized gain | - | (.04) | (2.46) | (1.66) | (.13) | (.09) |
Total distributions | - | (.33) | (2.95) | (2.50) | (.32) | (.21) |
Redemption fees added to paid in capital E,I | - | - | - | - | - | - |
Net asset value, end of period | $ 13.01 | $ 15.05 | $ 12.17 | $ 25.33 | $ 23.96 | $ 20.60 |
Total Return B,C,D | (13.55)% | 26.53% | (43.83)% | 17.41% | 18.09% | 19.06% |
Ratios to Average Net Assets F,H | | | | | | |
Expenses before reductions | .86% A | .88% | .87% | .85% | .88% | .89% |
Expenses net of fee waivers, if any | .86% A | .88% | .87% | .85% | .88% | .89% |
Expenses net of all reductions | .84% A | .84% | .84% | .82% | .81% | .82% |
Net investment income (loss) | 2.16% A | 2.17% | 2.45% | 1.85% | 1.76% | 1.11% |
Supplemental Data | | | | | | |
Net assets, end of period (000 omitted) | $ 638,077 | $ 758,018 | $ 703,357 | $ 1,702,235 | $ 1,624,901 | $ 1,549,179 |
Portfolio turnover rate G | 56% A | 78% | 77% | 62% | 123% | 92% |
A Annualized B Total returns for periods of less than one year are not annualized. C Total returns do not reflect charges attributable to your insurance company's separate account. Inclusion of these charges would reduce the total returns shown. D Total returns would have been lower had certain expenses not been reduced during the periods shown. E Calculated based on average shares outstanding during the period. F Fees and expenses of the underlying Fidelity Central Funds are not included in the Fund's expense ratio. The Fund indirectly bears its proportionate share of the expenses of any underlying Fidelity Central Funds. G Amount does not include the portfolio activity of any underlying Fidelity Central Funds. H Expense ratios reflect operating expenses of the class. Expenses before reductions do not reflect amounts reimbursed by the investment adviser or reductions from brokerage service arrangements or reductions from other expense offset arrangements and do not represent the amount paid by the class during periods when reimbursements or reductions occur. Expenses net of fee waivers reflect expenses after reimbursement by the investment adviser but prior to reductions from brokerage service arrangements or other expense offset arrangements. Expenses net of all reductions represent the net expenses paid by the class. I Amount represents less than $.01 per share. |
Financial Highlights - Service Class
| Six months ended June 30, 2010 | Years ended December 31, |
| (Unaudited) | 2009 | 2008 | 2007 | 2006 | 2005 |
Selected Per-Share Data | | | | | | |
Net asset value, beginning of period | $ 14.99 | $ 12.12 | $ 25.23 | $ 23.86 | $ 20.52 | $ 17.44 |
Income from Investment Operations | | | | | | |
Net investment income (loss) E | .15 | .26 | .44 | .43 | .36 | .18 |
Net realized and unrealized gain (loss) | (2.19) | 2.93 | (10.61) | 3.39 | 3.28 | 3.09 |
Total from investment operations | (2.04) | 3.19 | (10.17) | 3.82 | 3.64 | 3.27 |
Distributions from net investment income | - | (.28) | (.48) | (.79) | (.17) | (.10) |
Distributions from net realized gain | - | (.04) | (2.46) | (1.66) | (.13) | (.09) |
Total distributions | - | (.32) | (2.94) | (2.45) | (.30) | (.19) |
Redemption fees added to paid in capital E,I | - | - | - | - | - | - |
Net asset value, end of period | $ 12.95 | $ 14.99 | $ 12.12 | $ 25.23 | $ 23.86 | $ 20.52 |
Total Return B,C,D | (13.61)% | 26.44% | (43.89)% | 17.25% | 17.95% | 18.97% |
Ratios to Average Net Assets F,H | | | | | | |
Expenses before reductions | .96% A | .98% | .97% | .95% | .98% | .99% |
Expenses net of fee waivers, if any | .96% A | .98% | .97% | .95% | .98% | .99% |
Expenses net of all reductions | .94% A | .94% | .94% | .92% | .91% | .92% |
Net investment income (loss) | 2.07% A | 2.07% | 2.35% | 1.75% | 1.66% | 1.02% |
Supplemental Data | | | | | | |
Net assets, end of period (000 omitted) | $ 135,940 | $ 171,252 | $ 165,608 | $ 366,777 | $ 362,060 | $ 329,759 |
Portfolio turnover rate G | 56% A | 78% | 77% | 62% | 123% | 92% |
A Annualized B Total returns for periods of less than one year are not annualized. C Total returns do not reflect charges attributable to your insurance company's separate account. Inclusion of these charges would reduce the total returns shown. D Total returns would have been lower had certain expenses not been reduced during the periods shown. E Calculated based on average shares outstanding during the period. F Fees and expenses of the underlying Fidelity Central Funds are not included in the Fund's expense ratio. The Fund indirectly bears its proportionate share of the expenses of any underlying Fidelity Central Funds. G Amount does not include the portfolio activity of any underlying Fidelity Central Funds. H Expense ratios reflect operating expenses of the class. Expenses before reductions do not reflect amounts reimbursed by the investment adviser or reductions from brokerage service arrangements or reductions from other expense offset arrangements and do not represent the amount paid by the class during periods when reimbursements or reductions occur. Expenses net of fee waivers reflect expenses after reimbursement by the investment adviser but prior to reductions from brokerage service arrangements or other expense offset arrangements. Expenses net of all reductions represent the net expenses paid by the class. I Amount represents less than $.01 per share. |
See accompanying notes which are an integral part of the financial statements.
Semiannual Report
Financial Highlights - Service Class 2
| Six months ended June 30, 2010 | Years ended December 31, |
| (Unaudited) | 2009 | 2008 | 2007 | 2006 | 2005 |
Selected Per-Share Data | | | | | | |
Net asset value, beginning of period | $ 14.92 | $ 12.07 | $ 25.12 | $ 23.75 | $ 20.43 | $ 17.39 |
Income from Investment Operations | | | | | | |
Net investment income (loss) E | .14 | .24 | .40 | .39 | .33 | .14 |
Net realized and unrealized gain (loss) | (2.18) | 2.91 | (10.54) | 3.37 | 3.27 | 3.08 |
Total from investment operations | (2.04) | 3.15 | (10.14) | 3.76 | 3.60 | 3.22 |
Distributions from net investment income | - | (.26) | (.45) | (.73) | (.15) | (.09) |
Distributions from net realized gain | - | (.04) | (2.46) | (1.66) | (.13) | (.09) |
Total distributions | - | (.30) | (2.91) | (2.39) | (.28) | (.18) |
Redemption fees added to paid in capital E,I | - | - | - | - | - | - |
Net asset value, end of period | $ 12.88 | $ 14.92 | $ 12.07 | $ 25.12 | $ 23.75 | $ 20.43 |
Total Return B,C,D | (13.67)% | 26.22% | (43.96)% | 17.05% | 17.83% | 18.72% |
Ratios to Average Net Assets F, H | | | | | | |
Expenses before reductions | 1.11% A | 1.12% | 1.12% | 1.10% | 1.13% | 1.14% |
Expenses net of fee waivers, if any | 1.11% A | 1.12% | 1.12% | 1.10% | 1.13% | 1.14% |
Expenses net of all reductions | 1.09% A | 1.09% | 1.09% | 1.07% | 1.06% | 1.07% |
Net investment income (loss) | 1.92% A | 1.93% | 2.21% | 1.60% | 1.51% | .79% |
Supplemental Data | | | | | | |
Net assets, end of period (000 omitted) | $ 375,934 | $ 457,971 | $ 414,492 | $ 821,943 | $ 703,421 | $ 502,801 |
Portfolio turnover rate G | 56% A | 78% | 77% | 62% | 123% | 92% |
A Annualized B Total returns for periods of less than one year are not annualized. C Total returns do not reflect charges attributable to your insurance company's separate account. Inclusion of these charges would reduce the total returns shown. D Total returns would have been lower had certain expenses not been reduced during the periods shown. .E Calculated based on average shares outstanding during the period. F Fees and expenses of the underlying Fidelity Central Funds are not included in the Fund's expense ratio. The Fund indirectly bears its proportionate share of the expenses of any underlying Fidelity Central Funds. G Amount does not include the portfolio activity of any underlying Fidelity Central Funds. H Expense ratios reflect operating expenses of the class. Expenses before reductions do not reflect amounts reimbursed by the investment adviser or reductions from brokerage service arrangements or reductions from other expense offset arrangements and do not represent the amount paid by the class during periods when reimbursements or reductions occur. Expenses net of fee waivers reflect expenses after reimbursement by the investment adviser but prior to reductions from brokerage service arrangements or other expense offset arrangements. Expenses net of all reductions represent the net expenses paid by the class. I Amount represents less than $.01 per share. |
Financial Highlights - Initial Class R
| Six months ended June 30, 2010 | Years ended December 31, |
| (Unaudited) | 2009 | 2008 | 2007 | 2006 | 2005 |
Selected Per-Share Data | | | | | | |
Net asset value, beginning of period | $ 15.02 | $ 12.14 | $ 25.28 | $ 23.92 | $ 20.57 | $ 17.49 |
Income from Investment Operations | | | | | | |
Net investment income (loss) E | .16 | .28 | .46 | .45 | .38 | .19 |
Net realized and unrealized gain (loss) | (2.20) | 2.93 | (10.65) | 3.41 | 3.29 | 3.10 |
Total from investment operations | (2.04) | 3.21 | (10.19) | 3.86 | 3.67 | 3.29 |
Distributions from net investment income | - | (.29) | (.49) | (.84) | (.19) | (.12) |
Distributions from net realized gain | - | (.04) | (2.46) | (1.66) | (.13) | (.09) |
Total distributions | - | (.33) | (2.95) | (2.50) | (.32) | (.21) |
Redemption fees added to paid in capital E,I | - | - | - | - | - | - |
Net asset value, end of period | $ 12.98 | $ 15.02 | $ 12.14 | $ 25.28 | $ 23.92 | $ 20.57 |
Total Return B,C,D | (13.58)% | 26.60% | (43.84)% | 17.40% | 18.08% | 19.05% |
Ratios to Average Net Assets F,H | | | | | | |
Expenses before reductions | .86% A | .88% | .87% | .85% | .88% | .89% |
Expenses net of fee waivers, if any | .86% A | .88% | .87% | .85% | .88% | .89% |
Expenses net of all reductions | .84% A | .84% | .84% | .82% | .81% | .82% |
Net investment income (loss) | 2.17% A | 2.17% | 2.46% | 1.85% | 1.76% | 1.08% |
Supplemental Data | | | | | | |
Net assets, end of period (000 omitted) | $ 100,897 | $ 128,689 | $ 118,749 | $ 275,678 | $ 240,693 | $ 184,245 |
Portfolio turnover rate G | 56% A | 78% | 77% | 62% | 123% | 92% |
A Annualized B Total returns for periods of less than one year are not annualized. C Total returns do not reflect charges attributable to your insurance company's separate account. Inclusion of these charges would reduce the total returns shown. D Total returns would have been lower had certain expenses not been reduced during the periods shown. E Calculated based on average shares outstanding during the period. F Fees and expenses of the underlying Fidelity Central Funds are not included in the Fund's expense ratio. The Fund indirectly bears its proportionate share of the expenses of any underlying Fidelity Central Funds. G Amount does not include the portfolio activity of any underlying Fidelity Central Funds. H Expense ratios reflect operating expenses of the class. Expenses before reductions do not reflect amounts reimbursed by the investment adviser or reductions from brokerage service arrangements or reductions from other expense offset arrangements and do not represent the amount paid by the class during periods when reimbursements or reductions occur. Expenses net of fee waivers reflect expenses after reimbursement by the investment adviser but prior to reductions from brokerage service arrangements or other expense offset arrangements. Expenses net of all reductions represent the net expenses paid by the class. I Amount represents less than $.01 per share. |
See accompanying notes which are an integral part of the financial statements.
Semiannual Report
Financial Highlights - Service Class R
| Six months ended
June 30, 2010 | Years ended December 31, |
| (Unaudited) | 2009 | 2008 | 2007 | 2006 | 2005 |
Selected Per-Share Data | | | | | | |
Net asset value, beginning of period | $ 14.97 | $ 12.10 | $ 25.19 | $ 23.83 | $ 20.50 | $ 17.43 |
Income from Investment Operations | | | | | | |
Net investment income (loss) E | .15 | .27 | .43 | .43 | .36 | .17 |
Net realized and unrealized gain (loss) | (2.19) | 2.92 | (10.58) | 3.38 | 3.27 | 3.09 |
Total from investment operations | (2.04) | 3.19 | (10.15) | 3.81 | 3.63 | 3.26 |
Distributions from net investment income | - | (.28) | (.48) | (.79) | (.17) | (.10) |
Distributions from net realized gain | - | (.04) | (2.46) | (1.66) | (.13) | (.09) |
Total distributions | - | (.32) | (2.94) | (2.45) | (.30) | (.19) |
Redemption fees added to paid in capital E,I | - | - | - | - | - | - |
Net asset value, end of period | $ 12.93 | $ 14.97 | $ 12.10 | $ 25.19 | $ 23.83 | $ 20.50 |
Total Return B,C,D | (13.63)% | 26.49% | (43.88)% | 17.23% | 17.95% | 18.92% |
Ratios to Average Net Assets F,H | | | | | | |
Expenses before reductions | .96% A | .97% | .96% | .94% | .98% | .99% |
Expenses net of fee waivers, if any | .96% A | .97% | .96% | .94% | .98% | .99% |
Expenses net of all reductions | .94% A | .94% | .94% | .92% | .91% | .92% |
Net investment income (loss) | 2.07% A | 2.08% | 2.36% | 1.75% | 1.66% | .96% |
Supplemental Data | | | | | | |
Net assets, end of period (000 omitted) | $ 51,539 | $ 66,014 | $ 61,825 | $ 135,038 | $ 133,934 | $ 115,449 |
Portfolio turnover rate G | 56% A | 78% | 77% | 62% | 123% | 92% |
A Annualized B Total returns for periods of less than one year are not annualized. C Total returns do not reflect charges attributable to your insurance company's separate account. Inclusion of these charges would reduce the total returns shown. D Total returns would have been lower had certain expenses not been reduced during the periods shown. E Calculated based on average shares outstanding during the period. F Fees and expenses of the underlying Fidelity Central Funds are not included in the Fund's expense ratio. The Fund indirectly bears its proportionate share of the expenses of any underlying Fidelity Central Funds. G Amount does not include the portfolio activity of any underlying Fidelity Central Funds. H Expense ratios reflect operating expenses of the class. Expenses before reductions do not reflect amounts reimbursed by the investment adviser or reductions from brokerage service arrangements or reductions from other expense offset arrangements and do not represent the amount paid by the class during periods when reimbursements or reductions occur. Expenses net of fee waivers reflect expenses after reimbursement by the investment adviser but prior to reductions from brokerage service arrangements or other expense offset arrangements. Expenses net of all reductions represent the net expenses paid by the class. I Amount represents less than $.01 per share. |
Financial Highlights - Service Class 2R
| Six months ended June 30, 2010 | Years ended December 31, |
| (Unaudited) | 2009 | 2008 | 2007 | 2006 | 2005 |
Selected Per-Share Data | | | | | | |
Net asset value, beginning of period | $ 14.80 | $ 11.98 | $ 24.95 | $ 23.61 | $ 20.32 | $ 17.30 |
Income from Investment Operations | | | | | | |
Net investment income (loss) E | .14 | .25 | .40 | .39 | .32 | .14 |
Net realized and unrealized gain (loss) | (2.16) | 2.87 | (10.46) | 3.35 | 3.26 | 3.07 |
Total from investment operations | (2.02) | 3.12 | (10.06) | 3.74 | 3.58 | 3.21 |
Distributions from net investment income | - | (.26) | (.45) | (.74) | (.16) | (.10) |
Distributions from net realized gain | - | (.04) | (2.46) | (1.66) | (.13) | (.09) |
Total distributions | - | (.30) | (2.91) | (2.40) | (.29) | (.19) |
Redemption fees added to paid in capital E,I | - | - | - | - | - | - |
Net asset value, end of period | $ 12.78 | $ 14.80 | $ 11.98 | $ 24.95 | $ 23.61 | $ 20.32 |
Total Return B,C,D | (13.65)% | 26.20% | (43.94)% | 17.06% | 17.81% | 18.74% |
Ratios to Average Net Assets F,H | | | | | | |
Expenses before reductions | 1.11% A | 1.12% | 1.11% | 1.09% | 1.13% | 1.14% |
Expenses net of fee waivers, if any | 1.11% A | 1.12% | 1.11% | 1.09% | 1.13% | 1.14% |
Expenses net of all reductions | 1.09% A | 1.09% | 1.09% | 1.07% | 1.06% | 1.07% |
Net investment income (loss) | 1.92% A | 1.93% | 2.21% | 1.60% | 1.51% | .77% |
Supplemental Data | | | | | | |
Net assets, end of period (000 omitted) | $ 49,693 | $ 64,200 | $ 46,323 | $ 95,871 | $ 68,729 | $ 49,373 |
Portfolio turnover rate G | 56% A | 78% | 77% | 62% | 123% | 92% |
A Annualized B Total returns for periods of less than one year are not annualized. CTotal returns do not reflect charges attributable to your insurance company's separate account. Inclusion of these charges would reduce the total returns shown. DTotal returns would have been lower had certain expenses not been reduced during the periods shown. ECalculated based on average shares outstanding during the period. FFees and expenses of the underlying Fidelity Central Funds are not included in the Fund's expense ratio. The Fund indirectly bears its proportionate share of the expenses of any underlying Fidelity Central Funds. GAmount does not include the portfolio activity of any underlying Fidelity Central Funds. HExpense ratios reflect operating expenses of the class. Expenses before reductions do not reflect amounts reimbursed by the investment adviser or reductions from brokerage service arrangements or reductions from other expense offset arrangements and do not represent the amount paid by the class during periods when reimbursements or reductions occur. Expenses net of fee waivers reflect expenses after reimbursement by the investment adviser but prior to reductions from brokerage service arrangements or other expense offset arrangements. Expenses net of all reductions represent the net expenses paid by the class. IAmount represents less than $.01 per share. |
See accompanying notes which are an integral part of the financial statements.
Semiannual Report
Financial Highlights - Investor Class R
| Six months ended
June 30, 2010 | Years ended December 31, |
| (Unaudited) | 2009 | 2008 | 2007 | 2006 | 2005 H |
Selected Per-Share Data | | | | | | |
Net asset value, beginning of period | $ 15.01 | $ 12.14 | $ 25.27 | $ 23.91 | $ 20.59 | $ 17.69 |
Income from Investment Operations | | | | | | |
Net investment income (loss) E | .15 | .27 | .43 | .42 | .36 | .02 |
Net realized and unrealized gain (loss) | (2.19) | 2.92 | (10.62) | 3.41 | 3.29 | 2.88 |
Total from investment operations | (2.04) | 3.19 | (10.19) | 3.83 | 3.65 | 2.90 |
Distributions from net investment income | - | (.28) | (.48) | (.81) | (.20) | - |
Distributions from net realized gain | - | (.04) | (2.46) | (1.66) | (.13) | - |
Total distributions | - | (.32) | (2.94) | (2.47) | (.33) | - |
Redemption fees added to paid in capital E,J | - | - | - | - | - | - |
Net asset value, end of period | $ 12.97 | $ 15.01 | $ 12.14 | $ 25.27 | $ 23.91 | $ 20.59 |
Total Return B,C,D | (13.59)% | 26.42% | (43.89)% | 17.25% | 17.94% | 16.39% |
Ratios to Average Net Assets F,I | | | | | | |
Expenses before reductions | .95% A | .97% | .96% | .96% | 1.01% | 1.07% A |
Expenses net of fee waivers, if any | .95% A | .97% | .96% | .96% | 1.01% | 1.07% A |
Expenses net of all reductions | .93% A | .94% | .93% | .94% | .93% | 1.00% A |
Net investment income (loss) | 2.08% A | 2.08% | 2.36% | 1.74% | 1.64% | .23% A |
Supplemental Data | | | | | | |
Net assets, end of period (000 omitted) | $ 136,559 | $ 148,806 | $ 124,111 | $ 229,829 | $ 122,018 | $ 29,544 |
Portfolio turnover rate G | 56% A | 78% | 77% | 62% | 123% | 92% |
A Annualized B Total returns for periods of less than one year are not annualized. C Total returns do not reflect charges attributable to your insurance company's separate account. Inclusion of these charges would reduce the total returns shown. D Total returns would have been lower had certain expenses not been reduced during the periods shown. E Calculated based on average shares outstanding during the period. F Fees and expenses of the underlying Fidelity Central Funds are not included in the Fund's expense ratio. The Fund indirectly bears its proportionate share of the expenses of any underlying Fidelity Central Funds. G Amount does not include the portfolio activity of any underlying Fidelity Central Funds. H For the period July 21, 2005 (commencement of sale of shares) to December 31, 2005. I Expense ratios reflect operating expenses of the class. Expenses before reductions do not reflect amounts reimbursed by the investment adviser or reductions from brokerage service arrangements or reductions from other expense offset arrangements and do not represent the amount paid by the class during periods when reimbursements or reductions occur. Expense ratios before reductions for start-up periods may not be representative of longer-term operating periods. Expenses net of fee waivers reflect expenses after reimbursement by the investment adviser but prior to reductions from brokerage service arrangements or other expense offset arrangements. Expenses net of all reductions represent the net expenses paid by the class. J Amount represents less than $.01 per share. |
See accompanying notes which are an integral part of the financial statements.
Semiannual Report
Notes to Financial Statements
For the period ended June 30, 2010 (Unaudited)
1. Organization.
VIP Overseas Portfolio (the Fund) is a fund of Variable Insurance Products Fund (the Trust) and is authorized to issue an unlimited number of shares. The Trust is registered under the Investment Company Act of 1940, as amended (the 1940 Act), as an open-end management investment company organized as a Massachusetts business trust. Shares of the Fund may only be purchased by insurance companies for the purpose of funding variable annuity or variable life insurance contracts. The Fund offers the following classes of shares: Initial Class shares, Service Class shares, Service Class 2 shares, Initial Class R shares, Service Class R shares, Service Class 2R shares, and Investor Class R shares. All classes have equal rights and voting privileges, except for matters affecting a single class. Investment income, realized and unrealized capital gains and losses, the common expenses of the Fund, and certain fund-level expense reductions, if any, are allocated on a pro-rata basis to each class based on the relative net assets of each class to the total net assets of the Fund. Each class differs with respect to transfer agent and distribution and service plan fees incurred. Certain expense reductions also differ by class.
2. Investments in Fidelity Central Funds.
The Fund may invest in Fidelity Central Funds, which are open-end investment companies available only to other investment companies and accounts managed by Fidelity Management & Research Company (FMR) and its affiliates. The Fund's Schedule of Investments lists each of the Fidelity Central Funds held as of period end, if any, as an investment of the Fund, but does not include the underlying holdings of each Fidelity Central Fund. As an Investing Fund, the Fund indirectly bears its proportionate share of the expenses of the underlying Fidelity Central Funds.
The Money Market Central Funds seek preservation of capital and current income and are managed by Fidelity Investments Money Management, Inc. (FIMM), an affiliate of FMR.
A complete unaudited list of holdings for each Fidelity Central Fund is available upon request or at the Securities and Exchange Commission (the SEC) web site at www.sec.gov. In addition, the financial statements of the Fidelity Central Funds are available on the SEC web site or upon request.
3. Significant Accounting Policies.
The financial statements have been prepared in conformity with accounting principles generally accepted in the United States of America (GAAP), which require management to make certain estimates and assumptions at the date of the financial statements. Actual results could differ from those estimates. The following summarizes the significant accounting policies of the Fund:
Security Valuation. Investments are valued as of 4:00 p.m. Eastern time on the last calendar day of the period. The Fund uses independent pricing services approved by the Board of Trustees to value its investments. When current market prices or quotations are not readily available or reliable, valuations may be determined in good faith in accordance with procedures adopted by the Board of Trustees. Factors used in determining value may include market or security specific events. The frequency with which these procedures are used cannot be predicted and they may be utilized to a significant extent. The value used for net asset value (NAV) calculation under these procedures may differ from published prices for the same securities.
The Fund categorizes the inputs to valuation techniques used to value its investments into a disclosure hierarchy consisting of three levels as shown below.
Level 1 - quoted prices in active markets for identical investments
Level 2 - other significant observable inputs (including quoted prices for similar investments, interest rates, prepayment speeds, etc.)
Level 3 - unobservable inputs (including the fund's own assumptions based on the best information available)
Changes in valuation techniques may result in transfers in or out of an assigned level within the disclosure hierarchy. Valuation techniques used to value the Fund's investments by major category are as follows.
Equity securities, including restricted securities, for which market quotations are readily available, are valued at the last reported sale price or official closing price as reported by an independent pricing service on the primary market or exchange on which they are traded and are categorized as Level 1 in the hierarchy. In the event there were no sales during the day or closing prices are not available, securities are valued at the last quoted bid price or may be valued using the last available price and are generally categorized as Level 2 in the hierarchy. For foreign equity securities, when significant market or security specific events arise, comparisons to the valuation of American Depositary Receipts (ADRs), futures contracts, Exchange-traded funds (ETFs) and certain indexes as well as quoted prices for similar securities are used and are categorized as Level 2 in the hierarchy in these circumstances. Utilizing these techniques may result in significant transfers between Level 1 and Level 2. For restricted equity securities and private placements where observable inputs are limited, assumptions about market activity and risk are used and are categorized as Level 3 in the hierarchy.
Semiannual Report
3. Significant Accounting Policies - continued
Security Valuation - continued
Investments in open-end mutual funds, including the Fidelity Central Funds, are valued at their closing net asset value each business day and are categorized as Level 1 in the hierarchy. Short-term securities with remaining maturities of sixty days or less for which quotations are not readily available are valued at amortized cost, which approximates value and are categorized as Level 2 in the hierarchy.
Foreign Currency. The Fund uses foreign currency contracts to facilitate transactions in foreign-denominated securities. Gains and losses from these transactions may arise from changes in the value of the foreign currency or if the counterparties do not perform under the contracts' terms.
Foreign-denominated assets, including investment securities, and liabilities are translated into U.S. dollars at the exchange rate at period end. Purchases and sales of investment securities, income and dividends received and expenses denominated in foreign currencies are translated into U.S. dollars at the exchange rate in effect on the transaction date.
The effects of exchange rate fluctuations on investments are included with the net realized and unrealized gain (loss) on investment securities. Other foreign currency transactions resulting in realized and unrealized gain (loss) are disclosed separately.
Investment Transactions and Income. For financial reporting purposes, the Fund's investment holdings and NAV include trades executed through the end of the last business day of the period. The NAV per share for processing shareholder transactions is calculated as of the close of business of the New York Stock Exchange (NYSE), normally 4:00 p.m. Eastern time and includes trades executed through the end of the prior business day. Gains and losses on securities sold are determined on the basis of identified cost and may include proceeds received from litigation. Dividend income is recorded on the ex-dividend date, except for certain dividends from foreign securities where the ex-dividend date may have passed, which are recorded as soon as the Fund is informed of the ex-dividend date. Non-cash dividends included in dividend income, if any, are recorded at the fair market value of the securities received. Interest income and distributions from the Fidelity Central Funds are accrued as earned. Interest income includes coupon interest and amortization of premium and accretion of discount on debt securities. Investment income is recorded net of foreign taxes withheld where recovery of such taxes is uncertain.
Expenses. Most expenses of the Trust can be directly attributed to a fund. Expenses which cannot be directly attributed are apportioned amongst each fund in the Trust. Expense estimates are accrued in the period to which they relate and adjustments are made when actual amounts are known.
Deferred Trustee Compensation. Under a Deferred Compensation Plan (the Plan), independent Trustees may elect to defer receipt of a portion of their annual compensation. Deferred amounts are invested in a cross-section of Fidelity funds, are marked-to-market and remain in the Fund until distributed in accordance with the Plan. The investment of deferred amounts and the offsetting payable to the Trustees are included in the accompanying Statement of Assets and Liabilities.
Income Tax Information and Distributions to Shareholders. Each year, the Fund intends to qualify as a regulated investment company by distributing substantially all of its taxable income and realized gains under Subchapter M of the Internal Revenue Code and filing its U.S. federal tax return. As a result, no provision for income taxes is required. A fund's federal tax return is subject to examination by the Internal Revenue Service (IRS) for a period of three years. Foreign taxes are provided for based on the Fund's understanding of the tax rules and rates that exist in the foreign markets in which it invests.
Distributions are recorded on the ex-dividend date. Income dividends and capital gain distributions are declared separately for each class. Income and capital gain distributions are determined in accordance with income tax regulations, which may differ from GAAP.
Capital accounts within the financial statements are adjusted for permanent book-tax differences. These adjustments have no impact on net assets or the results of operations. Temporary book-tax differences will reverse in a subsequent period.
Book-tax differences are primarily due to the short-term gain distributions from the Underlying Funds, foreign currency transactions, passive foreign investment companies (PFIC), deferred trustees compensation, capital loss carryforwards and losses deferred due to wash sales.
The federal tax cost of investment securities and unrealized appreciation (depreciation) as of period end were as follows:
Gross unrealized appreciation | $ 197,381,193 |
Gross unrealized depreciation | (263,012,657) |
Net unrealized appreciation (depreciation) | $ (65,631,464) |
| |
Tax cost | $ 1,562,935,061 |
Semiannual Report
Notes to Financial Statements (Unaudited) - continued
3. Significant Accounting Policies - continued
Trading (Redemption) Fees. Initial Class R shares, Service Class R shares, Service Class 2 R shares and Investor Class R shares held less than 60 days are subject to a redemption fee equal to 1% of the proceeds of the redeemed shares. All redemption fees, including any estimated redemption fees paid by FMR, are retained by the Fund and accounted for as an addition to paid in capital.
4. Purchases and Sales of Investments.
Purchases and sales of securities, other than short-term securities, aggregated $468,153,858 and $541,791,641, respectively.
5. Fees and Other Transactions with Affiliates.
Management Fee. FMR and its affiliates provide the Fund with investment management related services for which the Fund pays a monthly management fee. The management fee is the sum of an individual fund fee rate that is based on an annual rate of .45% of the Fund's average net assets and a group fee rate that averaged .26% during the period. The group fee rate is based upon the average net assets of all the mutual funds advised by FMR. The group fee rate decreases as assets under management increase and increases as assets under management decrease. For the period, the total annualized management fee rate was .71% of the Fund's average net assets.
Distribution and Service Plan. In accordance with Rule 12b-1 of the 1940 Act, the Fund has adopted separate 12b-1 Plans for each Service Class of shares. Each Service Class pays Fidelity Distributors Corporation (FDC), an affiliate of FMR, a service fee. For the period, the service fee is based on an annual rate of .10% of Service Class' and Service Class R's average net assets and .25% of Service Class 2's and Service Class 2R's average net assets.
For the period, each class paid FDC the following amounts, all of which were re-allowed to insurance companies for the distribution of shares and providing shareholder support services:
Service Class | $ 79,400 |
Service Class 2 | 536,457 |
Service Class R | 30,088 |
Service Class 2 R | 73,781 |
| $ 719,726 |
Transfer Agent Fees. Fidelity Investments Institutional Operations Company, Inc. (FIIOC), an affiliate of FMR, is the Fund's transfer, dividend disbursing, and shareholder servicing agent. FIIOC receives an asset-based fee with respect to each class. Each class (with the exception of Investor Class R) pays a transfer agent fee, excluding out of pocket expenses, equal to an annual rate of .07% of average net assets. Investor Class R pays a monthly asset-based transfer agent fee of .15% of average net assets. The total transfer agent fees paid by each class to FIIOC, including out of pocket expenses, were as follows:
Initial Class | $ 255,347 |
Service Class | 55,683 |
Service Class 2 | 148,833 |
Initial Class R | 41,264 |
Service Class R | 20,302 |
Service Class 2R | 19,908 |
Investor Class R | 114,957 |
| $ 656,294 |
Accounting and Security Lending Fees. Fidelity Service Company, Inc. (FSC), an affiliate of FMR, maintains the Fund's accounting records. The accounting fee is based on the level of average net assets for the month. Under a separate contract, FSC administers the security lending program. The security lending fee is based on the number and duration of lending transactions.
Brokerage Commissions. The Fund placed a portion of its portfolio transactions with brokerage firms which are affiliates of the investment adviser. The commissions paid to these affiliated firms were $504 for the period.
Interfund Lending Program. Pursuant to an Exemptive Order issued by the SEC, the Fund, along with other registered investment companies having management contracts with FMR, may participate in an interfund lending program. This program provides an alternative credit facility allowing the funds to borrow from, or lend money to, other participating affiliated funds. At period end, there were no interfund loans outstanding. The Fund's activity in this program during the period for which loans were outstanding was as follows:
Borrower or Lender | Average Daily
Loan Balance | Weighted Average
Interest Rate | Interest Expense |
Borrower | $ 6,226,667 | .45% | $ 235 |
Semiannual Report
6. Committed Line of Credit.
The Fund participates with other funds managed by FMR in a $3.75 billion credit facility (the "line of credit") to be utilized for temporary or emergency purposes to fund shareholder redemptions or for other short-term liquidity purposes. The Fund has agreed to pay commitment fees on its pro-rata portion of the line of credit, which amounted to $3,554 and is reflected in Miscellaneous expenses on the Statement of Operations. During the period, there were no borrowings on this line of credit.
7. Security Lending.
The Fund lends portfolio securities from time to time in order to earn additional income. On the settlement date of the loan, the Fund receives collateral (in the form of U.S. Treasury obligations, letters of credit and/or cash) against the loaned securities and maintains collateral in an amount not less than 100% of the market value of the loaned securities during the period of the loan. The market value of the loaned securities is determined at the close of business of the Fund and any additional required collateral is delivered to the Fund on the next business day. If the borrower defaults on its obligation to return the securities loaned because of insolvency or other reasons, a fund could experience delays and costs in recovering the securities loaned or in gaining access to the collateral. Any cash collateral received is invested in the Fidelity Securities Lending Cash Central Fund. The value of loaned securities and cash collateral at period end are disclosed on the Fund's Statement of Assets and Liabilities. Security lending income represents the income earned on investing cash collateral, less fees and expenses associated with the loan, plus any premium payments that may be received on the loan of certain types of securities. Security lending income is presented in the Statement of Operations as a component of income from Fidelity Central Funds. Net income from lending portfolio securities during the period amounted to $881,813.
8. Expense Reductions.
Many of the brokers with whom FMR places trades on behalf of the Fund provided services to the Fund in addition to trade execution. These services included payments of certain expenses on behalf of the Fund totaling $157,939 for the period.
9. Distributions to Shareholders.
Distributions to shareholders of each class were as follows:
| Six months ended
June 30, 2010 | Year ended
December 31, 2009 |
From net investment income | | |
Initial Class | $ - | $ 14,372,278 |
Service Class | - | 3,138,360 |
Service Class 2 | - | 7,783,553 |
Initial Class R | - | 2,454,887 |
Service Class R | - | 1,206,143 |
Service Class 2R | - | 1,088,142 |
Investor Class R | - | 2,716,315 |
Total | $ - | $ 32,759,678 |
From net realized gain | | |
Initial Class | $ - | $ 2,196,333 |
Service Class | - | 510,078 |
Service Class 2 | - | 1,322,412 |
Initial Class R | - | 370,967 |
Service Class R | - | 192,822 |
Service Class 2R | - | 169,786 |
Investor Class R | - | 414,053 |
Total | $ - | $ 5,176,451 |
Semiannual Report
Notes to Financial Statements (Unaudited) - continued
10. Share Transactions.
Transactions for each class of shares were as follows:
| Shares | Dollars |
| Six months ended
June 30, 2010 | Year ended
December 31, 2009 | Six months ended
June 30, 2010 | Year ended
December 31, 2009 |
Initial Class | | | | |
Shares sold | 3,550,981 | 5,347,946 | $ 50,205,226 | $ 70,803,136 |
Reinvestment of distributions | - | 1,154,164 | - | 16,568,611 |
Shares redeemed | (4,869,840) | (13,947,134) | (70,337,163) | (175,327,331) |
Net increase (decrease) | (1,318,859) | (7,445,024) | $ (20,131,937) | $ (87,955,584) |
Service Class | | | | |
Shares sold | 379,710 | 959,799 | $ 5,516,115 | $ 12,824,467 |
Reinvestment of distributions | - | 255,575 | - | 3,648,438 |
Shares redeemed | (1,307,728) | (3,455,536) | (18,715,035) | (43,871,038) |
Net increase (decrease) | (928,018) | (2,240,162) | $ (13,198,920) | $ (27,398,133) |
Service Class 2 | | | | |
Shares sold | 1,434,952 | 2,952,474 | $ 20,214,404 | $ 36,740,955 |
Reinvestment of distributions | - | 640,998 | - | 9,105,965 |
Shares redeemed | (2,944,613) | (7,248,281) | (41,534,863) | (89,623,254) |
Net increase (decrease) | (1,509,661) | (3,654,809) | $ (21,320,459) | $ (43,776,334) |
Initial Class R | | | | |
Shares sold | 174,244 | 612,315 | $ 2,518,767 | $ 8,157,631 |
Reinvestment of distributions | - | 197,166 | - | 2,825,854 |
Shares redeemed | (971,053) | (2,020,970) | (13,959,449) | (24,694,123) |
Net increase (decrease) | (796,809) | (1,211,489) | $ (11,440,682) | $ (13,710,638) |
Service Class R | | | | |
Shares sold | 132,145 | 305,936 | $ 1,875,102 | $ 4,003,822 |
Reinvestment of distributions | - | 98,069 | - | 1,398,965 |
Shares redeemed | (557,242) | (1,102,231) | (8,005,234) | (13,550,063) |
Net increase (decrease) | (425,097) | (698,226) | $ (6,130,132) | $ (8,147,276) |
Service Class 2R | | | | |
Shares sold | 233,787 | 1,006,368 | $ 3,393,003 | $ 12,396,135 |
Reinvestment of distributions | - | 88,897 | - | 1,257,928 |
Shares redeemed | (682,503) | (625,865) | (9,956,064) | (7,643,458) |
Net increase (decrease) | (448,716) | 469,400 | $ (6,563,061) | $ 6,010,605 |
Investor Class R | | | | |
Shares sold | 1,345,328 | 1,131,791 | $ 18,776,847 | $ 15,649,216 |
Reinvestment of distributions | - | 218,381 | - | 3,130,368 |
Shares redeemed | (729,823) | (1,661,407) | (10,497,754) | (20,149,633) |
Net increase (decrease) | 615,505 | (311,235) | $ 8,279,093 | $ (1,370,049) |
11. Other.
The Fund's organizational documents provide former and current trustees and officers with a limited indemnification against liabilities arising in connection with the performance of their duties to the Fund. In the normal course of business, the Fund may also enter into contracts that provide general indemnifications. The Fund's maximum exposure under these arrangements is unknown as this would be dependent on future claims that may be made against the Fund. The risk of material loss from such claims is considered remote.
At the end of the period, FMR or its affiliates were the owners of record of 16% of the total outstanding shares of the Fund and three otherwise unaffiliated shareholders were the owners of record of 44% of the total outstanding shares of the Fund.
Semiannual Report
Investment Adviser
Fidelity Management & Research Company
Boston, MA
Investment Sub-Advisers
FMR Co., Inc.
Fidelity Management & Research (U.K.) Inc.
Fidelity Research & Analysis Company
FIL Investment Advisors
FIL Investment Advisors (U.K.) Ltd.
FIL Investments (Japan) Limited
Fidelity Management & Research (Japan) Inc.
Fidelity Management & Research (Hong Kong) Limited
General Distributor
Fidelity Distributors Corporation
Boston, MA
Transfer and Service Agents
Fidelity Investments Institutional Operations Company, Inc.
Boston, MA
Fidelity Service Company, Inc.
Boston, MA
Custodian
JPMorgan Chase Bank
New York, NY
VIPOVRSR-SANN-0810
1.774855.108
Fidelity® Variable Insurance Products:
Value Portfolio
Semiannual Report
June 30, 2010
(2_fidelity_logos) (Registered_Trademark)
Contents
Shareholder Expense Example | <Click Here> | An example of shareholder expenses. |
Investment Changes | <Click Here> | A summary of major shifts in the fund's investments over the past six months. |
Investments | <Click Here> | A complete list of the fund's investments with their market values. |
Financial Statements | <Click Here> | Statements of assets and liabilities, operations, and changes in net assets, as well as financial highlights. |
Notes | <Click Here> | Notes to the financial statements. |
To view a fund's proxy voting guidelines and proxy voting record for the 12-month period ended June 30, visit http://www.fidelity.com/proxyvotingresults or visit the Securities and Exchange Commission's (SEC) web site at http://www.sec.gov. You may also call 1-877-208-0098 to request a free copy of the proxy voting guidelines.
Fidelity Variable Insurance Products are separate account options which are purchased through a variable insurance contract.
Standard & Poor's, S&P and S&P 500 are registered service marks of The McGraw-Hill Companies, Inc. and have been licensed for use by Fidelity Distributors Corporation.
Other third party marks appearing herein are the property of their respective owners.
All other marks appearing herein are registered or unregistered trademarks or service marks of FMR LLC or an affiliated company.
This report and the financial statements contained herein are submitted for the general information of the shareholders of the fund. This report is not authorized for distribution to prospective investors in the fund unless preceded or accompanied by an effective prospectus.
A fund files its complete schedule of portfolio holdings with the SEC for the first and third quarters of each fiscal year on Form N-Q. Forms N-Q are available on the SEC's web site at http://www.sec.gov. A fund's Forms N-Q may be reviewed and copied at the SEC's Public Reference Room in Washington, DC. Information regarding the operation of the SEC's Public Reference Room may be obtained by calling 1-800-SEC-0330. For a complete list of a fund's portfolio holdings, view the most recent holdings listing, semiannual report, or annual report on Fidelity's web site at http://www.fidelity.com or http://www.advisor.fidelity.com, as applicable.
NOT FDIC INSURED • MAY LOSE VALUE • NO BANK GUARANTEE
Neither the fund nor Fidelity Distributors Corporation is a bank.
Semiannual Report
As a shareholder of the Fund, you incur two types of costs: (1) transaction costs, and (2) ongoing costs, including management fees, distribution and/or service (12b-1) fees and other Fund expenses. This Example is intended to help you understand your ongoing costs (in dollars) of investing in the Fund and to compare these costs with the ongoing costs of investing in other mutual funds.
The Example is based on an investment of $1,000 invested at the beginning of the period and held for the entire period (January 1, 2010 to June 30, 2010).
Actual Expenses
The first line of the accompanying table for each class of the Fund provides information about actual account values and actual expenses. You may use the information in this line, together with the amount you invested, to estimate the expenses that you paid over the period. Simply divide your account value by $1,000.00 (for example, an $8,600 account value divided by $1,000.00 = 8.6), then multiply the result by the number in the first line for a class of the Fund under the heading entitled "Expenses Paid During Period" to estimate the expenses you paid on your account during this period. The estimate of expenses does not include any fees or other expenses of any variable annuity or variable life insurance product. If they were, the estimate of expenses you paid during the period would be higher, and your ending account value would be lower. In addition, the Fund, as a shareholder in the underlying Fidelity Central Funds, will indirectly bear its pro-rata share of the fees and expenses incurred by the underlying Fidelity Central Funds. These fees and expenses are not included in the Fund's annualized expense ratio used to calculate the expense estimate in the table below.
Hypothetical Example for Comparison Purposes
The second line of the accompanying table for each class of the Fund provides information about hypothetical account values and hypothetical expenses based on a Class' actual expense ratio and an assumed rate of return of 5% per year before expenses, which is not the Class' actual return. The hypothetical account values and expenses may not be used to estimate the actual ending account balance or expenses you paid for the period. You may use this information to compare the ongoing costs of investing in the Fund and other funds. To do so, compare this 5% hypothetical example with the 5% hypothetical examples that appear in the shareholder reports of the other funds. The estimate of expenses does not include any fees or other expenses of any variable annuity or variable life insurance product. If they were, the estimate of expenses you paid during the period would be higher, and your ending account value would be lower. In addition, the Fund, as a shareholder in the underlying Fidelity Central Funds, will indirectly bear its pro-rata share of the fees and expenses incurred by the underlying Fidelity Central Funds. These fees and expenses are not included in the Fund's annualized expense ratio used to calculate the expense estimate in the table below.
Please note that the expenses shown in the table are meant to highlight your ongoing costs only and do not reflect any transaction costs. Therefore, the second line of the table is useful in comparing ongoing costs only, and will not help you determine the relative total costs of owning different funds.
| Annualized Expense Ratio | Beginning
Account Value
January 1, 2010 | Ending
Account Value
June 30, 2010 | Expenses Paid
During Period*
January 1, 2010
to June 30, 2010 |
Initial Class | .77% | | | |
Actual | | $ 1,000.00 | $ 956.70 | $ 3.74 |
HypotheticalA | | $ 1,000.00 | $ 1,020.98 | $ 3.86 |
Service Class | .86% | | | |
Actual | | $ 1,000.00 | $ 956.70 | $ 4.17 |
HypotheticalA | | $ 1,000.00 | $ 1,020.53 | $ 4.31 |
Service Class 2 | 1.02% | | | |
Actual | | $ 1,000.00 | $ 956.30 | $ 4.95 |
HypotheticalA | | $ 1,000.00 | $ 1,019.74 | $ 5.11 |
Investor Class | .85% | | | |
Actual | | $ 1,000.00 | $ 956.70 | $ 4.12 |
HypotheticalA | | $ 1,000.00 | $ 1,020.58 | $ 4.26 |
A 5% return per year before expenses
* Expenses are equal to each Class' annualized expense ratio, multiplied by the average account value over the period, multiplied by 181/365 (to reflect the one-half year period).
Semiannual Report
Investment Changes (Unaudited)
Top Ten Stocks as of June 30, 2010 |
| % of fund's
net assets | % of fund's net assets
6 months ago |
JPMorgan Chase & Co. | 3.1 | 1.2 |
Bank of America Corp. | 3.1 | 0.9 |
Wells Fargo & Co. | 2.9 | 1.2 |
Procter & Gamble Co. | 2.9 | 0.0 |
Merck & Co., Inc. | 2.1 | 0.0 |
Philip Morris International, Inc. | 2.1 | 0.0 |
Johnson & Johnson | 2.0 | 0.0 |
Citigroup, Inc. | 1.9 | 0.0 |
Pfizer, Inc. | 1.8 | 0.0 |
Royal Dutch Shell PLC Class B ADR | 1.7 | 0.0 |
| 23.6 | |
Top Five Market Sectors as of June 30, 2010 |
| % of fund's
net assets | % of fund's net assets
6 months ago |
Financials | 25.7 | 24.7 |
Health Care | 11.5 | 4.5 |
Energy | 10.8 | 10.1 |
Consumer Discretionary | 10.6 | 11.8 |
Industrials | 10.5 | 15.0 |
Asset Allocation (% of fund's net assets) |
As of June 30, 2010 * | As of December 31, 2009 ** |
| Stocks 98.0% | | | Stocks 99.3% | |
 | Bonds 0.0% | | | Bonds 0.4% | |
| Short-Term
Investments and
Net Other Assets 2.0% | | | Short-Term
Investments and
Net Other Assets 0.3% | |
* Foreign investments | 7.0% | | ** Foreign investments | 11.9% | |

Semiannual Report
Investments June 30, 2010 (Unaudited)
Showing Percentage of Net Assets
Common Stocks - 98.0% |
| Shares | | Value |
CONSUMER DISCRETIONARY - 10.6% |
Auto Components - 0.2% |
Tenneco, Inc. (a) | 11,700 | | $ 246,402 |
Automobiles - 0.4% |
Bayerische Motoren Werke AG (BMW) | 9,976 | | 484,829 |
Diversified Consumer Services - 0.0% |
Career Education Corp. (a) | 2,300 | | 52,946 |
Hotels, Restaurants & Leisure - 1.1% |
Brinker International, Inc. | 16,000 | | 231,360 |
Starwood Hotels & Resorts Worldwide, Inc. | 9,400 | | 389,442 |
WMS Industries, Inc. (a) | 11,426 | | 448,471 |
Wyndham Worldwide Corp. | 14,896 | | 300,005 |
| | 1,369,278 |
Household Durables - 4.4% |
D.R. Horton, Inc. | 53,634 | | 527,222 |
KB Home | 83,800 | | 921,800 |
Lennar Corp. Class A | 15,040 | | 209,206 |
Meritage Homes Corp. (a) | 32,571 | | 530,256 |
Pulte Group, Inc. (a) | 203,057 | | 1,681,312 |
Stanley Black & Decker, Inc. | 34,600 | | 1,747,992 |
| | 5,617,788 |
Media - 2.5% |
The Walt Disney Co. | 47,034 | | 1,481,571 |
Time Warner Cable, Inc. | 13,500 | | 703,080 |
Virgin Media, Inc. | 59,600 | | 994,724 |
| | 3,179,375 |
Specialty Retail - 1.1% |
Advance Auto Parts, Inc. | 2,600 | | 130,468 |
Best Buy Co., Inc. | 10,700 | | 362,302 |
Group 1 Automotive, Inc. (a) | 4,600 | | 108,238 |
O'Reilly Automotive, Inc. (a) | 7,300 | | 347,188 |
OfficeMax, Inc. (a) | 11,300 | | 147,578 |
Staples, Inc. | 13,300 | | 253,365 |
| | 1,349,139 |
Textiles, Apparel & Luxury Goods - 0.9% |
Polo Ralph Lauren Corp. Class A | 6,980 | | 509,261 |
VF Corp. | 9,400 | | 669,092 |
| | 1,178,353 |
TOTAL CONSUMER DISCRETIONARY | | 13,478,110 |
CONSUMER STAPLES - 7.2% |
Beverages - 0.2% |
Anheuser-Busch InBev SA NV | 4,200 | | 201,933 |
Food & Staples Retailing - 1.6% |
CVS Caremark Corp. | 12,900 | | 378,228 |
Kroger Co. | 31,200 | | 614,328 |
Susser Holdings Corp. (a) | 12,320 | | 145,253 |
|
| Shares | | Value |
Wal-Mart Stores, Inc. | 12,100 | | $ 581,647 |
Whole Foods Market, Inc. (a) | 10,400 | | 374,608 |
| | 2,094,064 |
Household Products - 2.9% |
Procter & Gamble Co. | 62,100 | | 3,724,758 |
Personal Products - 0.4% |
Avon Products, Inc. | 15,189 | | 402,509 |
USANA Health Sciences, Inc. (a) | 3,866 | | 141,225 |
| | 543,734 |
Tobacco - 2.1% |
Philip Morris International, Inc. | 58,082 | | 2,662,479 |
TOTAL CONSUMER STAPLES | | 9,226,968 |
ENERGY - 10.8% |
Energy Equipment & Services - 3.1% |
Baker Hughes, Inc. | 31,368 | | 1,303,968 |
Ensco International Ltd. ADR | 17,300 | | 679,544 |
National Oilwell Varco, Inc. | 23,300 | | 770,531 |
Noble Corp. | 22,500 | | 695,475 |
Pride International, Inc. (a) | 23,111 | | 516,300 |
| | 3,965,818 |
Oil, Gas & Consumable Fuels - 7.7% |
Alpha Natural Resources, Inc. (a) | 7,800 | | 264,186 |
Apache Corp. | 7,100 | | 597,749 |
Cabot Oil & Gas Corp. | 33,200 | | 1,039,824 |
Chevron Corp. | 18,600 | | 1,262,196 |
Frontier Oil Corp. | 12,900 | | 173,505 |
Marathon Oil Corp. | 40,172 | | 1,248,947 |
Pioneer Natural Resources Co. | 21,232 | | 1,262,242 |
Royal Dutch Shell PLC: | | | |
Class A sponsored ADR | 1,200 | | 60,264 |
Class B ADR | 44,600 | | 2,153,288 |
Southwestern Energy Co. (a) | 29,800 | | 1,151,472 |
Sunoco, Inc. | 9,200 | | 319,884 |
Talisman Energy, Inc. | 21,700 | | 328,186 |
| | 9,861,743 |
TOTAL ENERGY | | 13,827,561 |
FINANCIALS - 25.7% |
Capital Markets - 1.9% |
Goldman Sachs Group, Inc. | 4,797 | | 629,702 |
Morgan Stanley | 75,260 | | 1,746,785 |
| | 2,376,487 |
Commercial Banks - 6.5% |
City National Corp. | 6,000 | | 307,380 |
Huntington Bancshares, Inc. | 65,500 | | 362,870 |
PNC Financial Services Group, Inc. | 18,290 | | 1,033,385 |
Regions Financial Corp. | 39,420 | | 259,384 |
Southwest Bancorp, Inc., Oklahoma | 8,100 | | 107,649 |
SunTrust Banks, Inc. | 17,900 | | 417,070 |
Common Stocks - continued |
| Shares | | Value |
FINANCIALS - continued |
Commercial Banks - continued |
SVB Financial Group (a) | 8,542 | | $ 352,187 |
U.S. Bancorp, Delaware | 72,600 | | 1,622,610 |
Wells Fargo & Co. | 146,795 | | 3,757,952 |
Wilshire Bancorp, Inc. | 13,300 | | 116,375 |
| | 8,336,862 |
Consumer Finance - 2.3% |
American Express Co. | 36,577 | | 1,452,107 |
Capital One Financial Corp. | 26,103 | | 1,051,951 |
Discover Financial Services | 28,439 | | 397,577 |
| | 2,901,635 |
Diversified Financial Services - 8.1% |
Bank of America Corp. | 274,010 | | 3,937,524 |
Citigroup, Inc. (a) | 640,900 | | 2,409,784 |
JPMorgan Chase & Co. | 108,786 | | 3,982,652 |
| | 10,329,960 |
Insurance - 3.5% |
AFLAC, Inc. | 6,400 | | 273,088 |
Allstate Corp. | 24,700 | | 709,631 |
Assured Guaranty Ltd. | 13,300 | | 176,491 |
Delphi Financial Group, Inc. Class A | 18,750 | | 457,688 |
Everest Re Group Ltd. | 8,167 | | 577,570 |
Lincoln National Corp. | 31,768 | | 771,645 |
MetLife, Inc. | 17,300 | | 653,248 |
Unum Group | 7,720 | | 167,524 |
XL Capital Ltd. Class A | 45,500 | | 728,455 |
| | 4,515,340 |
Real Estate Investment Trusts - 1.9% |
CBL & Associates Properties, Inc. | 48,400 | | 602,096 |
DiamondRock Hospitality Co. | 45,254 | | 371,988 |
Public Storage | 4,100 | | 360,431 |
Segro PLC | 791 | | 2,982 |
The Macerich Co. | 29,263 | | 1,092,095 |
| | 2,429,592 |
Real Estate Management & Development - 1.5% |
CB Richard Ellis Group, Inc. Class A (a) | 99,922 | | 1,359,938 |
Jones Lang LaSalle, Inc. | 8,500 | | 557,940 |
| | 1,917,878 |
TOTAL FINANCIALS | | 32,807,754 |
HEALTH CARE - 11.5% |
Biotechnology - 1.6% |
Amgen, Inc. (a) | 18,300 | | 962,580 |
ARIAD Pharmaceuticals, Inc. (a) | 42,100 | | 118,722 |
BioMarin Pharmaceutical, Inc. (a) | 7,900 | | 149,784 |
Genzyme Corp. (a) | 2,700 | | 137,079 |
Incyte Corp. (a) | 5,300 | | 58,671 |
Keryx Biopharmaceuticals, Inc. (a) | 33,100 | | 121,146 |
|
| Shares | | Value |
NPS Pharmaceuticals, Inc. (a) | 12,300 | | $ 79,212 |
SIGA Technologies, Inc. (a) | 10,400 | | 80,080 |
United Therapeutics Corp. (a) | 4,700 | | 229,407 |
ZIOPHARM Oncology, Inc. (a) | 27,200 | | 86,496 |
| | 2,023,177 |
Health Care Equipment & Supplies - 0.9% |
Abiomed, Inc. (a) | 14,200 | | 137,456 |
AGA Medical Holdings, Inc. | 10,900 | | 138,321 |
Cooper Companies, Inc. | 7,100 | | 282,509 |
Edwards Lifesciences Corp. (a) | 1,600 | | 89,632 |
Stryker Corp. | 2,600 | | 130,156 |
Symmetry Medical, Inc. (a) | 12,737 | | 134,248 |
Wright Medical Group, Inc. (a) | 16,575 | | 275,311 |
| | 1,187,633 |
Health Care Providers & Services - 1.5% |
CIGNA Corp. | 20,300 | | 630,518 |
LHC Group, Inc. (a) | 8,364 | | 232,101 |
Medco Health Solutions, Inc. (a) | 15,900 | | 875,772 |
Sunrise Senior Living, Inc. (a) | 32,200 | | 89,516 |
| | 1,827,907 |
Health Care Technology - 0.2% |
Allscripts-Misys Healthcare Solutions, Inc. (a) | 7,300 | | 117,530 |
MedAssets, Inc. (a) | 5,600 | | 129,248 |
| | 246,778 |
Life Sciences Tools & Services - 0.6% |
Covance, Inc. (a) | 4,000 | | 205,280 |
PAREXEL International Corp. (a) | 13,400 | | 290,512 |
PerkinElmer, Inc. | 12,300 | | 254,241 |
| | 750,033 |
Pharmaceuticals - 6.7% |
Ardea Biosciences, Inc. (a) | 11,300 | | 232,328 |
Cadence Pharmaceuticals, Inc. (a) | 15,447 | | 108,283 |
Cardiome Pharma Corp. (a) | 9,500 | | 78,352 |
Johnson & Johnson | 42,800 | | 2,527,768 |
Merck & Co., Inc. | 76,400 | | 2,671,708 |
Optimer Pharmaceuticals, Inc. (a) | 12,900 | | 119,583 |
Pfizer, Inc. | 165,204 | | 2,355,809 |
Teva Pharmaceutical Industries Ltd. sponsored ADR | 9,300 | | 483,507 |
| | 8,577,338 |
TOTAL HEALTH CARE | | 14,612,866 |
INDUSTRIALS - 10.5% |
Aerospace & Defense - 2.0% |
DigitalGlobe, Inc. (a) | 2,400 | | 63,120 |
Precision Castparts Corp. | 7,500 | | 771,900 |
United Technologies Corp. | 26,400 | | 1,713,624 |
| | 2,548,644 |
Airlines - 0.6% |
AMR Corp. (a) | 15,500 | | 105,090 |
Common Stocks - continued |
| Shares | | Value |
INDUSTRIALS - continued |
Airlines - continued |
Southwest Airlines Co. | 38,931 | | $ 432,523 |
UAL Corp. (a) | 7,900 | | 162,424 |
| | 700,037 |
Building Products - 0.5% |
Owens Corning (a) | 20,375 | | 609,416 |
Commercial Services & Supplies - 0.3% |
Republic Services, Inc. | 6,700 | | 199,191 |
Schawk, Inc. Class A | 4,100 | | 61,295 |
The Geo Group, Inc. (a) | 7,400 | | 153,550 |
| | 414,036 |
Construction & Engineering - 0.1% |
KBR, Inc. | 8,602 | | 174,965 |
Electrical Equipment - 0.8% |
Regal-Beloit Corp. | 18,600 | | 1,037,508 |
Industrial Conglomerates - 0.9% |
General Electric Co. | 55,740 | | 803,771 |
Textron, Inc. | 22,900 | | 388,613 |
| | 1,192,384 |
Machinery - 2.4% |
ArvinMeritor, Inc. (a) | 21,500 | | 281,650 |
Cummins, Inc. | 15,481 | | 1,008,278 |
Danaher Corp. | 21,400 | | 794,368 |
Gardner Denver, Inc. | 9,100 | | 405,769 |
SPX Corp. | 5,600 | | 295,736 |
Timken Co. | 11,800 | | 306,682 |
| | 3,092,483 |
Marine - 0.1% |
Alexander & Baldwin, Inc. | 2,200 | | 65,516 |
Professional Services - 0.5% |
Equifax, Inc. | 8,500 | | 238,510 |
Manpower, Inc. | 7,908 | | 341,467 |
| | 579,977 |
Road & Rail - 2.3% |
Con-way, Inc. | 8,603 | | 258,262 |
CSX Corp. | 23,000 | | 1,141,490 |
Union Pacific Corp. | 22,700 | | 1,577,877 |
| | 2,977,629 |
TOTAL INDUSTRIALS | | 13,392,595 |
INFORMATION TECHNOLOGY - 10.1% |
Communications Equipment - 1.6% |
Adtran, Inc. | 28,000 | | 763,560 |
Cisco Systems, Inc. (a) | 31,200 | | 664,872 |
Juniper Networks, Inc. (a) | 27,000 | | 616,140 |
| | 2,044,572 |
Computers & Peripherals - 1.4% |
Hewlett-Packard Co. | 40,800 | | 1,765,824 |
|
| Shares | | Value |
Electronic Equipment & Components - 2.0% |
Amphenol Corp. Class A | 8,400 | | $ 329,952 |
Avnet, Inc. (a) | 33,234 | | 801,272 |
Flextronics International Ltd. (a) | 68,700 | | 384,720 |
Itron, Inc. (a) | 6,973 | | 431,071 |
Tyco Electronics Ltd. | 24,500 | | 621,810 |
| | 2,568,825 |
Internet Software & Services - 0.4% |
eBay, Inc. (a) | 27,300 | | 535,353 |
IT Services - 1.0% |
Hewitt Associates, Inc. Class A (a) | 13,717 | | 472,688 |
MasterCard, Inc. Class A | 4,221 | | 842,216 |
| | 1,314,904 |
Office Electronics - 0.1% |
Xerox Corp. | 23,800 | | 191,352 |
Semiconductors & Semiconductor Equipment - 3.1% |
Advanced Micro Devices, Inc. (a) | 42,300 | | 309,636 |
Analog Devices, Inc. | 9,400 | | 261,884 |
ASML Holding NV | 11,644 | | 319,861 |
Avago Technologies Ltd. | 15,000 | | 315,900 |
KLA-Tencor Corp. | 14,200 | | 395,896 |
Lam Research Corp. (a) | 18,700 | | 711,722 |
Marvell Technology Group Ltd. (a) | 19,149 | | 301,788 |
Micron Technology, Inc. (a) | 84,954 | | 721,259 |
Standard Microsystems Corp. (a) | 14,654 | | 341,145 |
Teradyne, Inc. (a) | 26,397 | | 257,371 |
| | 3,936,462 |
Software - 0.5% |
BMC Software, Inc. (a) | 7,800 | | 270,114 |
Oracle Corp. | 14,700 | | 315,462 |
| | 585,576 |
TOTAL INFORMATION TECHNOLOGY | | 12,942,868 |
MATERIALS - 4.7% |
Chemicals - 2.5% |
Air Products & Chemicals, Inc. | 3,200 | | 207,392 |
Albemarle Corp. | 16,026 | | 636,392 |
CF Industries Holdings, Inc. | 1,700 | | 107,865 |
Clariant AG (Reg.) (a) | 25,360 | | 321,119 |
Dow Chemical Co. | 53,000 | | 1,257,160 |
Solutia, Inc. (a) | 42,791 | | 560,562 |
Symrise AG | 3,200 | | 66,163 |
| | 3,156,653 |
Containers & Packaging - 0.5% |
Ball Corp. | 5,200 | | 274,716 |
Owens-Illinois, Inc. (a) | 15,212 | | 402,357 |
| | 677,073 |
Metals & Mining - 0.8% |
Carpenter Technology Corp. | 8,900 | | 292,187 |
Goldcorp, Inc. | 5,200 | | 227,676 |
Common Stocks - continued |
| Shares | | Value |
MATERIALS - continued |
Metals & Mining - continued |
Newcrest Mining Ltd. | 7,393 | | $ 215,561 |
Newmont Mining Corp. | 3,914 | | 241,650 |
| | 977,074 |
Paper & Forest Products - 0.9% |
Weyerhaeuser Co. | 33,045 | | 1,163,184 |
TOTAL MATERIALS | | 5,973,984 |
TELECOMMUNICATION SERVICES - 3.6% |
Diversified Telecommunication Services - 1.8% |
AboveNet, Inc. (a) | 15,400 | | 726,572 |
Cbeyond, Inc. (a) | 30,600 | | 382,500 |
China Unicom (Hong Kong) Ltd. sponsored ADR | 14,600 | | 194,180 |
Iliad Group SA | 1,555 | | 120,747 |
Qwest Communications International, Inc. | 166,366 | | 873,422 |
| | 2,297,421 |
Wireless Telecommunication Services - 1.8% |
American Tower Corp. Class A (a) | 16,800 | | 747,600 |
Leap Wireless International, Inc. (a) | 300 | | 3,894 |
SBA Communications Corp. Class A (a) | 10,400 | | 353,704 |
Sprint Nextel Corp. (a) | 285,187 | | 1,209,193 |
| | 2,314,391 |
TOTAL TELECOMMUNICATION SERVICES | | 4,611,812 |
|
| Shares | | Value |
UTILITIES - 3.3% |
Electric Utilities - 2.7% |
American Electric Power Co., Inc. | 29,229 | | $ 944,097 |
FirstEnergy Corp. | 24,800 | | 873,704 |
PPL Corp. | 62,227 | | 1,552,564 |
| | 3,370,365 |
Independent Power Producers & Energy Traders - 0.6% |
Calpine Corp. (a) | 63,808 | | 811,638 |
TOTAL UTILITIES | | 4,182,003 |
TOTAL COMMON STOCKS (Cost $138,872,459) | 125,056,521 |
Money Market Funds - 2.6% |
| | | |
Fidelity Cash Central Fund, 0.20% (b)
(Cost $3,251,404) | 3,251,404 | | 3,251,404 |
TOTAL INVESTMENT PORTFOLIO - 100.6% (Cost $142,123,863) | 128,307,925 |
NET OTHER ASSETS (LIABILITIES) - (0.6)% | (705,637) |
NET ASSETS - 100% | $ 127,602,288 |
Legend |
(a) Non-income producing |
(b) Affiliated fund that is available only to investment companies and other accounts managed by Fidelity Investments. The rate quoted is the annualized seven-day yield of the fund at period end. A complete unaudited listing of the fund's holdings as of its most recent quarter end is available upon request. |
Affiliated Central Funds |
Information regarding fiscal year to date income earned by the Fund from investments in Fidelity Central Funds is as follows: |
Fund | Income earned |
Fidelity Cash Central Fund | $ 2,863 |
Fidelity Securities Lending Cash Central Fund | 5,172 |
Total | $ 8,035 |
Other Information |
The following is a summary of the inputs used, as of June 30, 2010, involving the Fund's assets and liabilities carried at value. The inputs or methodology used for valuing securities may not be an indication of the risk associated with investing in those securities. For more information on valuation inputs, and their aggregation into the levels used in the table below, please refer to the Security Valuation section in the accompanying Notes to Financial Statements. |
Valuation Inputs at Reporting Date: |
Description | Total | Level 1 | Level 2 | Level 3 |
Investments in Securities: | | | | |
Equities: | | | | |
Consumer Discretionary | $ 13,478,110 | $ 12,993,281 | $ 484,829 | $ - |
Consumer Staples | 9,226,968 | 9,025,035 | 201,933 | - |
Energy | 13,827,561 | 13,827,561 | - | - |
Financials | 32,807,754 | 32,804,772 | 2,982 | - |
Health Care | 14,612,866 | 14,612,866 | - | - |
Industrials | 13,392,595 | 13,392,595 | - | - |
Information Technology | 12,942,868 | 12,942,868 | - | - |
Materials | 5,973,984 | 5,371,141 | 602,843 | - |
Telecommunication Services | 4,611,812 | 4,491,065 | 120,747 | - |
Utilities | 4,182,003 | 4,182,003 | - | - |
Money Market Funds | 3,251,404 | 3,251,404 | - | - |
Total Investments in Securities: | $ 128,307,925 | $ 126,894,591 | $ 1,413,334 | $ - |
Income Tax Information |
At December 31, 2009, the Fund had a capital loss carryforward of approximately $24,662,354 of which $9,078,392 and $15,583,962 will expire on December 31, 2016 and 2017, respectively. Capital loss carryforwards are only available to offset future capital gains of the Fund to the extent provided by regulations and may be limited. |
See accompanying notes which are an integral part of the financial statements.
Semiannual Report
Statement of Assets and Liabilities
| June 30, 2010 (Unaudited) |
| | |
Assets | | |
Investment in securities, at value - See accompanying schedule: Unaffiliated issuers
(cost $138,872,459) | $ 125,056,521 | |
Fidelity Central Funds
(cost $3,251,404) | 3,251,404 | |
Total Investments
(cost $142,123,863) | | $ 128,307,925 |
Foreign currency held at value
(cost $1,444) | | 1,446 |
Receivable for investments sold | | 3,737,097 |
Receivable for fund shares sold | | 97,576 |
Dividends receivable | | 113,507 |
Distributions receivable from Fidelity Central Funds | | 967 |
Other receivables | | 1,838 |
Total assets | | 132,260,356 |
| | |
Liabilities | | |
Payable to custodian bank | $ 97 | |
Payable for investments purchased | 4,176,668 | |
Payable for fund shares redeemed | 345,793 | |
Accrued management fee | 62,958 | |
Distribution fees payable | 2,243 | |
Other affiliated payables | 15,869 | |
Other payables and accrued expenses | 54,440 | |
Total liabilities | | 4,658,068 |
| | |
Net Assets | | $ 127,602,288 |
Net Assets consist of: | | |
Paid in capital | | $ 165,058,270 |
Undistributed net investment income | | 315,904 |
Accumulated undistributed net realized gain (loss) on investments and foreign currency transactions | | (23,955,595) |
Net unrealized appreciation (depreciation) on investments and assets and liabilities in foreign currencies | | (13,816,291) |
Net Assets | | $ 127,602,288 |
Statement of Assets and Liabilities - continued
| June 30, 2010 (Unaudited) |
| | |
Initial Class:
Net Asset Value, offering price and redemption price per share ($63,153,809 ÷ 6,969,377 shares) | | $ 9.06 |
| | |
Service Class:
Net Asset Value, offering price and redemption price per share ($222,572 ÷ 24,592 shares) | | $ 9.05 |
| | |
Service Class 2:
Net Asset Value, offering price and redemption price per share ($9,937,817 ÷ 1,108,176 shares) | | $ 8.97 |
| | |
Investor Class:
Net Asset Value, offering price and redemption price per share ($54,288,090 ÷ 5,997,861 shares) | | $ 9.05 |
See accompanying notes which are an integral part of the financial statements.
Semiannual Report
Financial Statements - continued
Statement of Operations
Six months ended June 30, 2010 (Unaudited) |
| | |
Investment Income | | |
Dividends | | $ 870,560 |
Interest | | 2,317 |
Income from Fidelity Central Funds | | 8,035 |
Total income | | 880,912 |
| | |
Expenses | | |
Management fee | $ 383,627 | |
Transfer agent fees | 79,650 | |
Distribution fees | 12,463 | |
Accounting and security lending fees | 26,905 | |
Custodian fees and expenses | 32,550 | |
Independent trustees' compensation | 371 | |
Audit | 26,315 | |
Legal | 260 | |
Miscellaneous | 5,834 | |
Total expenses before reductions | 567,975 | |
Expense reductions | (2,831) | 565,144 |
Net investment income (loss) | | 315,768 |
Realized and Unrealized Gain (Loss) Net realized gain (loss) on: | | |
Investment securities: | | |
Unaffiliated issuers | 2,678,590 | |
Foreign currency transactions | 29,376 | |
Total net realized gain (loss) | | 2,707,966 |
Change in net unrealized appreciation (depreciation) on: Investment securities (net of decrease in deferred foreign taxes of $56) | (9,681,592) | |
Assets and liabilities in foreign currencies | (391) | |
Total change in net unrealized appreciation (depreciation) | | (9,681,983) |
Net gain (loss) | | (6,974,017) |
Net increase (decrease) in net assets resulting from operations | | $ (6,658,249) |
Statement of Changes in Net Assets
| Six months ended June 30, 2010 (Unaudited) | Year ended
December 31, 2009 |
Increase (Decrease) in Net Assets | | |
Operations | | |
Net investment income (loss) | $ 315,768 | $ 888,333 |
Net realized gain (loss) | 2,707,966 | (11,420,401) |
Change in net unrealized appreciation (depreciation) | (9,681,983) | 47,255,164 |
Net increase (decrease) in net assets resulting from operations | (6,658,249) | 36,723,096 |
Distributions to shareholders from net investment income | - | (908,042) |
Share transactions - net increase (decrease) | 5,154,580 | 10,552,112 |
Total increase (decrease) in net assets | (1,503,669) | 46,367,166 |
| | |
Net Assets | | |
Beginning of period | 129,105,957 | 82,738,791 |
End of period (including undistributed net investment income of $315,904 and undistributed net investment income of $136, respectively) | $ 127,602,288 | $ 129,105,957 |
See accompanying notes which are an integral part of the financial statements.
Semiannual Report
Financial Highlights - Initial Class
| Six months ended June 30, 2010 | Years ended December 31, |
| (Unaudited) | 2009 | 2008 | 2007 | 2006 | 2005 |
Selected Per-Share Data | | | | | | |
Net asset value, beginning of period | $ 9.47 | $ 6.69 | $ 13.10 | $ 14.28 | $ 12.63 | $ 11.97 |
Income from Investment Operations | | | | | | |
Net investment income (loss) E | .03 | .07 | .13 | .10 | .16 | .15 |
Net realized and unrealized gain (loss) | (.44) | 2.78 | (6.07) | .22 | 1.70 | .58 |
Total from investment operations | (.41) | 2.85 | (5.94) | .32 | 1.86 | .73 |
Distributions from net investment income | - | (.07) | (.10) | (.09) | (.13) | (.07) |
Distributions from net realized gain | - | - | (.37) | (1.41) | (.08) | - |
Total distributions | - | (.07) | (.47) | (1.50) I | (.21) | (.07) |
Net asset value, end of period | $ 9.06 | $ 9.47 | $ 6.69 | $ 13.10 | $ 14.28 | $ 12.63 |
Total Return B, C, D | (4.33)% | 42.66% | (46.50)% | 2.02% | 14.75% | 6.09% |
Ratios to Average Net Assets F, H | | | | | | |
Expenses before reductions | .77% A | .80% | .79% | .77% | .88% | 1.19% |
Expenses net of fee waivers, if any | .77% A | .80% | .79% | .77% | .85% | .85% |
Expenses net of all reductions | .77% A | .80% | .79% | .77% | .84% | .78% |
Net investment income (loss) | .51% A | .95% | 1.25% | .68% | 1.16% | 1.21% |
Supplemental Data | | | | | | |
Net assets, end of period (000 omitted) | $ 63,154 | $ 64,198 | $ 41,306 | $ 52,544 | $ 35,416 | $ 18,478 |
Portfolio turnover rate G | 248% A | 73% | 53% | 52% | 263% | 181% |
A Annualized B Total returns for periods of less than one year are not annualized. C Total returns do not reflect charges attributable to your insurance company's separate account. Inclusion of these charges would reduce the total returns shown. D Total returns would have been lower had certain expenses not been reduced during the periods shown. E Calculated based on average shares outstanding during the period. F Fees and expenses of the underlying Fidelity Central Funds are not included in the Fund's expense ratio. The Fund indirectly bears its proportionate share of the expenses of any underlying Fidelity Central Funds. G Amount does not include the portfolio activity of any underlying Fidelity Central Funds. H Expense ratios reflect operating expenses of the class. Expenses before reductions do not reflect amounts reimbursed by the investment adviser or reductions from brokerage service arrangements or reductions from other expense offset arrangements and do not represent the amount paid by the class during periods when reimbursements or reductions occur. Expenses net of fee waivers reflect expenses after reimbursement by the investment adviser but prior to reductions from brokerage service arrangements or other expense offset arrangements. Expenses net of all reductions represent the net expenses paid by the class. I Total distributions of $1.50 per share is comprised of distributions from net investment income of $.092 and distributions from net realized gain of $1.405 per share. |
Financial Highlights - Service Class
| Six months ended June 30, 2010 | Years ended December 31, |
| (Unaudited) | 2009 | 2008 | 2007 | 2006 | 2005 |
Selected Per-Share Data | | | | | | |
Net asset value, beginning of period | $ 9.46 | $ 6.69 | $ 13.06 | $ 14.24 | $ 12.60 | $ 11.93 |
Income from Investment Operations | | | | | | |
Net investment income (loss) E | .02 | .06 | .13 | .09 | .14 | .13 |
Net realized and unrealized gain (loss) | (.43) | 2.77 | (6.05) | .21 | 1.69 | .60 |
Total from investment operations | (.41) | 2.83 | (5.92) | .30 | 1.83 | .73 |
Distributions from net investment income | - | (.06) | (.08) | (.08) | (.11) | (.06) |
Distributions from net realized gain | - | - | (.37) | (1.41) | (.08) | - |
Total distributions | - | (.06) | (.45) | (1.48) I | (.19) | (.06) |
Net asset value, end of period | $ 9.05 | $ 9.46 | $ 6.69 | $ 13.06 | $ 14.24 | $ 12.60 |
Total Return B, C, D | (4.33)% | 42.35% | (46.49)% | 1.92% | 14.56% | 6.08% |
Ratios to Average Net Assets F, H | | | | | | |
Expenses before reductions | .86% A | .91% | .88% | .86% | .96% | 1.60% |
Expenses net of fee waivers, if any | .86% A | .91% | .88% | .86% | .95% | .97% |
Expenses net of all reductions | .86% A | .90% | .88% | .86% | .94% | .90% |
Net investment income (loss) | .43% A | .84% | 1.17% | .60% | 1.06% | 1.09% |
Supplemental Data | | | | | | |
Net assets, end of period (000 omitted) | $ 223 | $ 251 | $ 293 | $ 958 | $ 1,017 | $ 1,232 |
Portfolio turnover rate G | 248% A | 73% | 53% | 52% | 263% | 181% |
A Annualized B Total returns for periods of less than one year are not annualized. C Total returns do not reflect charges attributable to your insurance company's separate account. Inclusion of these charges would reduce the total returns shown. D Total returns would have been lower had certain expenses not been reduced during the periods shown. E Calculated based on average shares outstanding during the period. F Fees and expenses of the underlying Fidelity Central Funds are not included in the Fund's expense ratio. The Fund indirectly bears its proportionate share of the expenses of any underlying Fidelity Central Funds. G Amount does not include the portfolio activity of any underlying Fidelity Central Funds. H Expense ratios reflect operating expenses of the class. Expenses before reductions do not reflect amounts reimbursed by the investment adviser or reductions from brokerage service arrangements or reductions from other expense offset arrangements and do not represent the amount paid by the class during periods when reimbursements or reductions occur. Expenses net of fee waivers reflect expenses after reimbursement by the investment adviser but prior to reductions from brokerage service arrangements or other expense offset arrangements. Expenses net of all reductions represent the net expenses paid by the class. I Total distributions of $1.48 per share is comprised of distributions from net investment income of $.077 and distributions from net realized gain of $1.405 per share. |
See accompanying notes which are an integral part of the financial statements.
Semiannual Report
Financial Highlights - Service Class 2
| Six months ended June 30, 2010 | Years ended December 31, |
| (Unaudited) | 2009 | 2008 | 2007 | 2006 | 2005 |
Selected Per-Share Data | | | | | | |
Net asset value, beginning of period | $ 9.38 | $ 6.63 | $ 12.97 | $ 14.14 | $ 12.53 | $ 11.87 |
Income from Investment Operations | | | | | | |
Net investment income (loss) E | .01 | .05 | .11 | .06 | .12 | .11 |
Net realized and unrealized gain (loss) | (.42) | 2.75 | (6.01) | .23 | 1.67 | .59 |
Total from investment operations | (.41) | 2.80 | (5.90) | .29 | 1.79 | .70 |
Distributions from net investment income | - | (.05) | (.07) | (.06) | (.10) | (.04) |
Distributions from net realized gain | - | - | (.37) | (1.41) | (.08) | - |
Total distributions | - | (.05) | (.44) | (1.46) I | (.18) | (.04) |
Net asset value, end of period | $ 8.97 | $ 9.38 | $ 6.63 | $ 12.97 | $ 14.14 | $ 12.53 |
Total Return B, C, D | (4.37)% | 42.32% | (46.68)% | 1.86% | 14.32% | 5.92% |
Ratios to Average Net Assets F, H | | | | | | |
Expenses before reductions | 1.02% A | 1.05% | 1.04% | 1.02% | 1.15% | 1.76% |
Expenses net of fee waivers, if any | 1.02% A | 1.05% | 1.04% | 1.02% | 1.10% | 1.11% |
Expenses net of all reductions | 1.02% A | 1.05% | 1.04% | 1.02% | 1.09% | 1.05% |
Net investment income (loss) | .26% A | .70% | 1.01% | .43% | .91% | .94% |
Supplemental Data | | | | | | |
Net assets, end of period (000 omitted) | $ 9,938 | $ 8,277 | $ 4,941 | $ 11,081 | $ 7,803 | $ 5,262 |
Portfolio turnover rate G | 248% A | 73% | 53% | 52% | 263% | 181% |
A Annualized B Total returns for periods of less than one year are not annualized. C Total returns do not reflect charges attributable to your insurance company's separate account. Inclusion of these charges would reduce the total returns shown. D Total returns would have been lower had certain expenses not been reduced during the periods shown. E Calculated based on average shares outstanding during the period. F Fees and expenses of the underlying Fidelity Central Funds are not included in the Fund's expense ratio. The Fund indirectly bears its proportionate share of the expenses of any underlying Fidelity Central Funds. G Amount does not include the portfolio activity of any underlying Fidelity Central Funds. H Expense ratios reflect operating expenses of the class. Expenses before reductions do not reflect amounts reimbursed by the investment adviser or reductions from brokerage service arrangements or reductions from other expense offset arrangements and do not represent the amount paid by the class during periods when reimbursements or reductions occur. Expenses net of fee waivers reflect expenses after reimbursement by the investment adviser but prior to reductions from brokerage service arrangements or other expense offset arrangements. Expenses net of all reductions represent the net expenses paid by the class. I Total distributions of $1.46 per share is comprised of distributions from net investment income of $.058 and distributions from net realized gain of $1.405 per share. |
Financial Highlights - Investor Class
| Six months ended June 30, 2010 | Years ended December 31, |
| (Unaudited) | 2009 | 2008 | 2007 | 2006 | 2005 H |
Selected Per-Share Data | | | | | | |
Net asset value, beginning of period | $ 9.46 | $ 6.69 | $ 13.09 | $ 14.26 | $ 12.63 | $ 12.23 |
Income from Investment Operations | | | | | | |
Net investment income (loss) E | .02 | .07 | .12 | .08 | .14 | .06 |
Net realized and unrealized gain (loss) | (.43) | 2.77 | (6.06) | .23 | 1.69 | .40 |
Total from investment operations | (.41) | 2.84 | (5.94) | .31 | 1.83 | .46 |
Distributions from net investment income | - | (.07) | (.09) | (.08) | (.12) | (.06) |
Distributions from net realized gain | - | - | (.37) | (1.41) | (.08) | - |
Total distributions | - | (.07) | (.46) | (1.48) J | (.20) | (.06) |
Net asset value, end of period | $ 9.05 | $ 9.46 | $ 6.69 | $ 13.09 | $ 14.26 | $ 12.63 |
Total Return B, C, D | (4.33)% | 42.41% | (46.53)% | 1.99% | 14.49% | 3.77% |
Ratios to Average Net Assets F, I | | | | | | |
Expenses before reductions | .85% A | .89% | .87% | .88% | .99% | 1.27% A |
Expenses net of fee waivers, if any | .85% A | .89% | .87% | .88% | .99% | 1.00% A |
Expenses net of all reductions | .85% A | .88% | .87% | .88% | .98% | .93% A |
Net investment income (loss) | .43% A | .86% | 1.17% | .58% | 1.01% | 1.06% A |
Supplemental Data | | | | | | |
Net assets, end of period (000 omitted) | $ 54,288 | $ 56,380 | $ 36,199 | $ 61,052 | $ 37,239 | $ 11,034 |
Portfolio turnover rate G | 248% A | 73% | 53% | 52% | 263% | 181% |
A Annualized B Total returns for periods of less than one year are not annualized. C Total returns do not reflect charges attributable to your insurance company's separate account. Inclusion of these charges would reduce the total returns shown. D Total returns would have been lower had certain expenses not been reduced during the periods shown. E Calculated based on average shares outstanding during the period. F Fees and expenses of the underlying Fidelity Central Funds are not included in the Fund's expense ratio. The Fund indirectly bears its proportionate share of the expenses of any underlying Fidelity Central Funds. G Amount does not include the portfolio activity of any underlying Fidelity Central Funds. H For the period July 21, 2005 (commencement of sale of shares) to December 31, 2005. I Expense ratios reflect operating expenses of the class. Expenses before reductions do not reflect amounts reimbursed by the investment adviser or reductions from brokerage service arrangements or reductions from other expense offset arrangements and do not represent the amount paid by the class during periods when reimbursements or reductions occur. Expense ratios before reductions for start-up periods may not be representative of longer-term operating periods. Expenses net of fee waivers reflect expenses after reimbursement by the investment adviser but prior to reductions from brokerage service arrangements or other expense offset arrangements. Expenses net of all reductions represent the net expenses paid by the class. J Total distributions of $1.48 per share is comprised of distributions from net investment income of $.078 and distributions from net realized gain of $1.405 per share. |
See accompanying notes which are an integral part of the financial statements.
Semiannual Report
Notes to Financial Statements
For the period ended June 30, 2010 (Unaudited)
1. Organization.
VIP Value Portfolio (the Fund) is a fund of Variable Insurance Products Fund (the Trust) and is authorized to issue an unlimited number of shares. The Trust is registered under the Investment Company Act of 1940, as amended (the 1940 Act), as an open-end management investment company organized as a Massachusetts business trust. Shares of the Fund may only be purchased by insurance companies for the purpose of funding variable annuity or variable life insurance contracts. The Fund offers the following classes of shares: Initial Class shares, Service Class shares, Service Class 2 shares and Investor Class shares. All classes have equal rights and voting privileges, except for matters affecting a single class. Investment income, realized and unrealized capital gains and losses, the common expenses of the Fund, and certain fund-level expense reductions, if any, are allocated on a pro-rata basis to each class based on the relative net assets of each class to the total net assets of the Fund. Each class differs with respect to transfer agent and distribution and service plan fees incurred. Certain expense reductions also differ by class.
2. Investments in Fidelity Central Funds.
The Fund may invest in Fidelity Central Funds, which are open-end investment companies available only to other investment companies and accounts managed by Fidelity Management & Research Company (FMR) and its affiliates. The Fund's Schedule of Investments lists each of the Fidelity Central Funds held as of period end, if any, as an investment of the Fund, but does not include the underlying holdings of each Fidelity Central Fund. As an Investing Fund, the Fund indirectly bears its proportionate share of the expenses of the underlying Fidelity Central Funds.
The Money Market Central Funds seek preservation of capital and current income and are managed by Fidelity Investments Money Management, Inc. (FIMM), an affiliate of FMR.
A complete unaudited list of holdings for each Fidelity Central Fund is available upon request or at the Securities and Exchange Commission (the SEC) web site at www.sec.gov. In addition, the financial statements of the Fidelity Central Funds are available on the SEC web site or upon request.
3. Significant Accounting Policies.
The financial statements have been prepared in conformity with accounting principles generally accepted in the United States of America (GAAP), which require management to make certain estimates and assumptions at the date of the financial statements. Actual results could differ from those estimates. The following summarizes the significant accounting policies of the Fund:
Security Valuation. Investments are valued as of 4:00 p.m. Eastern time on the last calendar day of the period. The Fund uses independent pricing services approved by the Board of Trustees to value its investments. When current market prices or quotations are not readily available or reliable, valuations may be determined in good faith in accordance with procedures adopted by the Board of Trustees. Factors used in determining value may include market or security specific events. The frequency with which these procedures are used cannot be predicted and they may be utilized to a significant extent. The value used for net asset value (NAV) calculation under these procedures may differ from published prices for the same securities.
The Fund categorizes the inputs to valuation techniques used to value its investments into a disclosure hierarchy consisting of three levels as shown below.
Level 1 - quoted prices in active markets for identical investments
Level 2 - other significant observable inputs (including quoted prices for similar investments, interest rates, prepayment speeds, etc.)
Level 3 - unobservable inputs (including the fund's own assumptions based on the best information available)
Changes in valuation techniques may result in transfers in or out of an assigned level within the disclosure hierarchy. The aggregate value of investments by input level, as of June 30, 2010, is included at the end of the Fund's Schedule of Investments. Valuation techniques used to value the Fund's investments by major category are as follows.
Equity securities, including restricted securities, for which market quotations are readily available, are valued at the last reported sale price or official closing price as reported by an independent pricing service on the primary market or exchange on which they are traded and are categorized as Level 1 in the hierarchy. In the event there were no sales during the day or closing prices are not available, securities are valued at the last quoted bid price or may be valued using the last available price and are generally categorized as Level 2 in the hierarchy. For foreign equity securities, when significant market or security specific events arise, comparisons to the valuation of American Depositary Receipts (ADRs), futures contracts, Exchange-traded funds (ETFs) and certain indexes as well as quoted prices for similar securities are used and are categorized as Level 2 in the hierarchy in these circumstances. Utilizing these techniques may result in transfers between Level 1 and Level 2. For restricted equity securities and private placements where observable inputs are limited, assumptions about market activity and risk are used and are categorized as Level 3 in the hierarchy.
Semiannual Report
Notes to Financial Statements (Unaudited) - continued
3. Significant Accounting Policies - continued
Security Valuation - continued
Investments in open-end mutual funds, including the Fidelity Central Funds, are valued at their closing net asset value each business day and are categorized as Level 1 in the hierarchy. Short-term securities with remaining maturities of sixty days or less for which quotations are not readily available are valued at amortized cost, which approximates value and are categorized as Level 2 in the hierarchy.
Foreign Currency. The Fund uses foreign currency contracts to facilitate transactions in foreign-denominated securities. Gains and losses from these transactions may arise from changes in the value of the foreign currency or if the counterparties do not perform under the contracts' terms.
Foreign-denominated assets, including investment securities, and liabilities are translated into U.S. dollars at the exchange rate at period end. Purchases and sales of investment securities, income and dividends received and expenses denominated in foreign currencies are translated into U.S. dollars at the exchange rate in effect on the transaction date.
The effects of exchange rate fluctuations on investments are included with the net realized and unrealized gain (loss) on investment securities. Other foreign currency transactions resulting in realized and unrealized gain (loss) are disclosed separately.
Investment Transactions and Income. For financial reporting purposes, the Fund's investment holdings and NAV include trades executed through the end of the last business day of the period. The NAV per share for processing shareholder transactions is calculated as of the close of business of the New York Stock Exchange (NYSE), normally 4:00 p.m. Eastern time and includes trades executed through the end of the prior business day. Gains and losses on securities sold are determined on the basis of identified cost and may include proceeds received from litigation. Dividend income is recorded on the ex-dividend date, except for certain dividends from foreign securities where the ex-dividend date may have passed, which are recorded as soon as the Fund is informed of the ex-dividend date. Non-cash dividends included in dividend income, if any, are recorded at the fair market value of the securities received. Distributions received on securities that represent a return of capital or capital gain are recorded as a reduction of cost of investments and/or as a realized gain. The Fund estimates the components of distributions received that may be considered return of capital distributions or capital gain distributions. Interest income and distributions from the Fidelity Central Funds are accrued as earned. Interest income includes coupon interest and amortization of premium and accretion of discount on debt securities. Investment income is recorded net of foreign taxes withheld where recovery of such taxes is uncertain.
Expenses. Most expenses of the Trust can be directly attributed to a fund. Expenses which cannot be directly attributed are apportioned amongst each fund in the Trust. Expense estimates are accrued in the period to which they relate and adjustments are made when actual amounts are known.
Income Tax Information and Distributions to Shareholders. Each year, the Fund intends to qualify as a regulated investment company by distributing substantially all of its taxable income and realized gains under Subchapter M of the Internal Revenue Code and filing its U.S. federal tax return. As a result, no provision for income taxes is required. A fund's federal tax return is subject to examination by the Internal Revenue Service (IRS) for a period of three years. Foreign taxes are provided for based on the Fund's understanding of the tax rules and rates that exist in the foreign markets in which it invests.
Distributions are recorded on the ex-dividend date. Income dividends and capital gain distributions are declared separately for each class. Income and capital gain distributions are determined in accordance with income tax regulations, which may differ from GAAP.
Capital accounts within the financial statements are adjusted for permanent book-tax differences. These adjustments have no impact on net assets or the results of operations. Temporary book-tax differences will reverse in a subsequent period.
Book-tax differences are primarily due to the short-term gain distributions from the Fidelity Central Funds, foreign currency transactions, market discount, partnerships, capital loss carryforwards and losses deferred due to wash sales and excise tax regulations.
The federal tax cost of investment securities and unrealized appreciation (depreciation) as of period end were as follows:
Gross unrealized appreciation | $ 5,630,845 |
Gross unrealized depreciation | (20,300,441) |
Net unrealized appreciation (depreciation) | $ (14,669,596) |
| |
Tax cost | $ 142,977,521 |
4. Purchases and Sales of Investments.
Purchases and sales of securities, other than short-term securities, aggregated $167,439,950 and $163,873,268, respectively.
Semiannual Report
5. Fees and Other Transactions with Affiliates.
Management Fee. FMR and its affiliates provide the Fund with investment management related services for which the Fund pays a monthly management fee. The management fee is the sum of an individual fund fee rate that is based on an annual rate of .30% of the Fund's average net assets and a group fee rate that averaged .26% during the period. The group fee rate is based upon the average net assets of all the mutual funds advised by FMR. The group fee rate decreases as assets under management increase and increases as assets under management decrease. For the period, the total annualized management fee rate was .56% of the Fund's average net assets.
Distribution and Service Plan. In accordance with Rule 12b-1 of the 1940 Act, the Fund has adopted separate 12b-1 Plans for each Service Class of shares. Each Service Class pays Fidelity Distributors Corporation (FDC), an affiliate of FMR, a service fee. For the period, the service fee is based on an annual rate of .10% of Service Class' average net assets and .25% of Service Class 2's average net assets.
For the period, each class paid FDC the following amounts, all of which were re-allowed to insurance companies for the distribution of shares and providing shareholder support services:
Service Class | $ 127 |
Service Class 2 | 12,336 |
| $ 12,463 |
Transfer Agent Fees. Fidelity Investments Institutional Operations Company, Inc. (FIIOC), an affiliate of FMR, is the Fund's transfer, dividend disbursing, and shareholder servicing agent. FIIOC receives an asset-based fee with respect to each class. Each class (with the exception of Investor Class) pays a transfer agent fee, excluding out of pocket expenses, equal to an annual rate of .07% of average net assets. Investor Class pays a monthly asset-based transfer agent fee of .15% of average net assets. The total transfer agent fees paid by each class to FIIOC, including out of pocket expenses, were as follows:
Initial Class | $ 27,532 |
Service Class | 85 |
Service Class 2 | 3,942 |
Investor Class | 48,091 |
| $ 79,650 |
Accounting and Security Lending Fees. Fidelity Service Company, Inc. (FSC), an affiliate of FMR, maintains the Fund's accounting records. The accounting fee is based on the level of average net assets for the month. Under a separate contract, FSC administers the security lending program. The security lending fee is based on the number and duration of lending transactions.
Brokerage Commissions. The Fund placed a portion of its portfolio transactions with brokerage firms which are affiliates of the investment adviser. The commissions paid to these affiliated firms were $2,914 for the period.
6. Committed Line of Credit.
The Fund participates with other funds managed by FMR in a $3.75 billion credit facility (the "line of credit") to be utilized for temporary or emergency purposes to fund shareholder redemptions or for other short-term liquidity purposes. The Fund has agreed to pay commitment fees on its pro-rata portion of the line of credit, which amounted to $260 and is reflected in Miscellaneous expenses on the Statement of Operations. During the period, there were no borrowings on this line of credit.
7. Security Lending.
The Fund lends portfolio securities from time to time in order to earn additional income. On the settlement date of the loan, the Fund receives collateral (in the form of U.S. Treasury obligations, letters of credit and/or cash) against the loaned securities and maintains collateral in an amount not less than 100% of the market value of the loaned securities during the period of the loan. The market value of the loaned securities is determined at the close of business of the Fund and any additional required collateral is delivered to the Fund on the next business day. If the borrower defaults on its obligation to return the securities loaned because of insolvency or other reasons, a fund could experience delays and costs in recovering the securities loaned or in gaining access to the collateral. Any cash collateral received is invested in the Fidelity Securities Lending Cash Central Fund. At period end, there were no security loans outstanding. Security lending income represents the income earned on investing cash collateral, less fees and expenses associated with the loan, plus any premium payments that may be received on the loan of certain types of securities. Security lending income is presented in the Statement of Operations as a component of income from Fidelity Central Funds. Net income from lending portfolio securities during the period amounted to $5,172.
Semiannual Report
Notes to Financial Statements (Unaudited) - continued
8. Expense Reductions.
Many of the brokers with whom FMR places trades on behalf of the Fund provided services to the Fund in addition to trade execution. These services included payments of certain expenses on behalf of the Fund totaling $2,831 for the period.
9. Distributions to Shareholders.
Distributions to shareholders of each class were as follows:
| Six months ended
June 30, 2010 | Year ended
December 31, 2009 |
From net investment income | | |
Initial Class | $ - | $ 478,243 |
Service Class | - | 1,636 |
Service Class 2 | - | 47,870 |
Investor Class | - | 380,293 |
Total | $ - | $ 908,042 |
10. Share Transactions.
Transactions for each class of shares were as follows:
| Shares | Dollars |
| Six months ended June 30,
2010 | Year ended
December 31,
2009 | Six months ended June 30,
2010 | Year ended
December 31,
2009 |
Initial Class | | | | |
Shares sold | 1,468,419 | 2,751,446 | $ 14,663,816 | $ 21,075,692 |
Reinvestment of distributions | - | 51,811 | - | 478,243 |
Shares redeemed | (1,280,455) | (2,194,877) | (12,529,392) | (16,803,915) |
Net increase (decrease) | 187,964 | 608,380 | $ 2,134,424 | $ 4,750,020 |
Service Class | | | | |
Shares sold | - | 1,781 | $ - | $ 15,343 |
Reinvestment of distributions | - | 180 | - | 1,636 |
Shares redeemed | (1,920) | (19,214) | (18,414) | (127,485) |
Net increase (decrease) | (1,920) | (17,253) | $ (18,414) | $ (110,506) |
Service Class 2 | | | | |
Shares sold | 381,059 | 426,973 | $ 3,871,478 | $ 3,212,958 |
Reinvestment of distributions | - | 5,254 | - | 47,870 |
Shares redeemed | (155,257) | (294,560) | (1,498,093) | (2,309,735) |
Net increase (decrease) | 225,802 | 137,667 | $ 2,373,385 | $ 951,093 |
Investor Class | | | | |
Shares sold | 993,468 | 2,278,184 | $ 10,022,993 | $ 17,900,905 |
Reinvestment of distributions | - | 41,298 | - | 380,293 |
Shares redeemed | (955,625) | (1,772,319) | (9,357,808) | (13,319,693) |
Net increase (decrease) | 37,843 | 547,163 | $ 665,185 | $ 4,961,505 |
11. Other.
The Fund's organizational documents provide former and current trustees and officers with a limited indemnification against liabilities arising in connection with the performance of their duties to the Fund. In the normal course of business, the Fund may also enter into contracts that provide general indemnifications. The Fund's maximum exposure under these arrangements is unknown as this would be dependent on future claims that may be made against the Fund. The risk of material loss from such claims is considered remote.
At the end of the period, VIP Freedom 2020 was the owner of record of approximately 16% of the total outstanding shares of the Fund. The VIP Freedom Funds, VIP Freedom Lifetime Funds and VIP Investor Freedom Funds were the owners of record, in the aggregate, of approximately 51% of the total outstanding shares of the Fund. FMR or its affiliates were the owners of record of 92% of the total outstanding shares of the Fund.
Semiannual Report
Investment Adviser
Fidelity Management & Research Company
Boston, MA
Investment Sub-Advisers
FMR Co., Inc.
Fidelity Management & Research (U.K.) Inc.
Fidelity Research & Analysis Company
FIL Investments (Japan) Limited
FIL Investment Advisors
FIL Investment Advisors (U.K.) Ltd.
Fidelity Management & Research (Hong Kong) Limited
Fidelity Management & Research (Japan) Inc.
General Distributor
Fidelity Distributors Corporation
Boston, MA
Transfer and Service Agents
Fidelity Investments Institutional Operations Company, Inc.
Boston, MA
Fidelity Service Company, Inc.
Boston, MA
Custodian
State Street Bank and Trust Company
Quincy, MA
VIPVAL-SANN-0810
1.761034.109
Item 2. Code of Ethics
Not applicable.
Item 3. Audit Committee Financial Expert
Not applicable.
Item 4. Principal Accountant Fees and Services
Not applicable.
Item 5. Audit Committee of Listed Registrants
Not applicable.
Item 6. Investments
(a) Not applicable.
(b) Not applicable
Item 7. Disclosure of Proxy Voting Policies and Procedures for Closed-End Management Investment Companies
Not applicable.
Item 8. Portfolio Managers of Closed-End Management Investment Companies
Not applicable.
Item 9. Purchase of Equity Securities by Closed-End Management Investment Company and Affiliated Purchasers
Not applicable.
Item 10. Submission of Matters to a Vote of Security Holders
There were no material changes to the procedures by which shareholders may recommend nominees to the Variable Insurance Products Fund's Board of Trustees.
Item 11. Controls and Procedures
(a)(i) The President and Treasurer and the Chief Financial Officer have concluded that the Variable Insurance Products Fund's (the "Trust") disclosure controls and procedures (as defined in Rule 30a-3(c) under the Investment Company Act) provide reasonable assurances that material information relating to the Trust is made known to them by the appropriate persons, based on their evaluation of these controls and procedures as of a date within 90 days of the filing date of this report.
(a)(ii) There was no change in the Trust's internal control over financial reporting (as defined in Rule 30a-3(d) under the Investment Company Act) that occurred during the second fiscal quarter of the period covered by this report that has materially affected, or is reasonably likely to materially affect, the Trust's internal control over financial reporting.
Item 12. Exhibits
(a) | (1) | Not applicable. |
(a) | (2) | Certification pursuant to Rule 30a-2(a) under the Investment Company Act of 1940 (17 CFR 270.30a-2(a)) is filed and attached hereto as Exhibit 99.CERT. |
(a) | (3) | Not applicable. |
(b) | | Certification pursuant to Rule 30a-2(b) under the Investment Company Act of 1940 (17 CFR 270.30a-2(b)) is furnished and attached hereto as Exhibit 99.906CERT. |
SIGNATURES
Pursuant to the requirements of the Securities Exchange Act of 1934 and the Investment Company Act of 1940, the registrant has duly caused this report to be signed on its behalf by the undersigned, thereunto duly authorized.
Variable Insurance Products Fund
By: | /s/ Kenneth B. Robins |
| Kenneth B. Robins |
| President and Treasurer |
| |
Date: | August 23, 2010 |
Pursuant to the requirements of the Securities Exchange Act of 1934 and the Investment Company Act of 1940, this report has been signed below by the following persons on behalf of the registrant and in the capacities and on the dates indicated.
By: | /s/ Kenneth B. Robins |
| Kenneth B. Robins |
| President and Treasurer |
| |
Date: | August 23, 2010 |
By: | /s/ Christine Reynolds |
| Christine Reynolds |
| Chief Financial Officer |
| |
Date: | August 23, 2010 |