UNITED STATES
SECURITIES AND EXCHANGE COMMISSION
Washington, D.C. 20549
FORM N-CSR
CERTIFIED SHAREHOLDER REPORT OF REGISTERED
MANAGEMENT INVESTMENT COMPANIES
Investment Company Act file number 811-3329
Variable Insurance Products Fund
(Exact name of registrant as specified in charter)
245 Summer St., Boston, MA 02210
(Address of principal executive offices) (Zip code)
Marc Bryant, Secretary
245 Summer St.
Boston, Massachusetts 02210
(Name and address of agent for service)
Registrant's telephone number, including area code:
617-563-7000
| |
Date of fiscal year end: | December 31 |
| |
Date of reporting period: | June 30, 2016 |
Item 1.
Reports to Stockholders
Fidelity® Variable Insurance Products: Equity-Income Portfolio
Semi-Annual Report June 30, 2016 |
 |
Contents
To view a fund's proxy voting guidelines and proxy voting record for the 12-month period ended June 30, visit http://www.fidelity.com/proxyvotingresults or visit the Securities and Exchange Commission's (SEC) web site at http://www.sec.gov.
You may also call 1-877-208-0098 to request a free copy of the proxy voting guidelines.
Fidelity® Variable Insurance Products are separate account options which are purchased through a variable insurance contract.
Standard & Poor's, S&P and S&P 500 are registered service marks of The McGraw-Hill Companies, Inc. and have been licensed for use by Fidelity Distributors Corporation.
Other third-party marks appearing herein are the property of their respective owners.
All other marks appearing herein are registered or unregistered trademarks or service marks of FMR LLC or an affiliated company. © 2016 FMR LLC. All rights reserved.
This report and the financial statements contained herein are submitted for the general information of the shareholders of the Fund. This report is not authorized for distribution to prospective investors in the Fund unless preceded or accompanied by an effective prospectus.
A fund files its complete schedule of portfolio holdings with the SEC for the first and third quarters of each fiscal year on Form N-Q. Forms N-Q are available on the SEC’s web site at http://www.sec.gov. A fund's Forms N-Q may be reviewed and copied at the SEC’s Public Reference Room in Washington, DC. Information regarding the operation of the SEC's Public Reference Room may be obtained by calling 1-800-SEC-0330.
For a complete list of a fund's portfolio holdings, view the most recent holdings listing, semiannual report, or annual report on Fidelity's web site at http://www.fidelity.com, http://www.institutional.fidelity.com, or http://www.401k.com, as applicable.
NOT FDIC INSURED •MAY LOSE VALUE •NO BANK GUARANTEE
Neither the Fund nor Fidelity Distributors Corporation is a bank.
Investment Summary (Unaudited)
Top Ten Stocks as of June 30, 2016
| | % of fund's net assets | % of fund's net assets 6 months ago |
| Chevron Corp. | 4.5 | 3.9 |
| Procter & Gamble Co.(a) | 3.9 | 3.5 |
| JPMorgan Chase & Co. | 3.4 | 3.4 |
| General Electric Co. | 3.0 | 4.2 |
| Johnson & Johnson | 2.9 | 5.7 |
| United Parcel Service, Inc. Class B | 2.7 | 2.4 |
| Cisco Systems, Inc. | 2.6 | 2.0 |
| Verizon Communications, Inc. | 2.3 | 2.0 |
| Exelon Corp. | 2.0 | 1.5 |
| Medtronic PLC | 1.9 | 1.4 |
| | 29.2 | |
(a) Security or a portion of the security is pledged as collateral for call options written.
Top Five Market Sectors as of June 30, 2016
| | % of fund's net assets | % of fund's net assets 6 months ago |
| Financials | 23.3 | 24.9 |
| Energy | 12.6 | 9.9 |
| Industrials | 12.1 | 12.1 |
| Information Technology | 11.2 | 11.4 |
| Health Care | 9.5 | 11.4 |
Asset Allocation (% of fund's net assets)
| As of June 30, 2016 *,** |
| | Stocks | 96.3% |
| | Bonds | 0.5% |
| | Short-Term Investments and Net Other Assets (Liabilities) | 3.2% |

* Foreign investments - 10.1%
** Written options - (0.1)%
| As of December 31, 2015*,** |
| | Stocks | 97.7% |
| | Bonds | 0.5% |
| | Short-Term Investments and Net Other Assets (Liabilities) | 1.7% |
| | Other Investments | 0.1% |

* Written options - (0.1)%
** Foreign investments - 9.0%
Investments June 30, 2016 (Unaudited)
Showing Percentage of Net Assets
| Common Stocks - 96.1% | | | |
| | | Shares | Value |
| CONSUMER DISCRETIONARY - 7.6% | | | |
| Automobiles - 1.4% | | | |
| Ford Motor Co. | | 1,870,900 | $23,517,213 |
| General Motors Co. | | 1,878,200 | 53,153,060 |
| | | | 76,670,273 |
| Hotels, Restaurants & Leisure - 0.7% | | | |
| Dunkin' Brands Group, Inc. | | 634,400 | 27,672,528 |
| Whitbread PLC | | 197,730 | 9,251,643 |
| | | | 36,924,171 |
| Household Durables - 0.8% | | | |
| M.D.C. Holdings, Inc. | | 676,900 | 16,475,746 |
| Tupperware Brands Corp. | | 412,900 | 23,238,012 |
| | | | 39,713,758 |
| Leisure Products - 1.2% | | | |
| Mattel, Inc. | | 1,082,700 | 33,877,683 |
| New Academy Holding Co. LLC unit (a)(b) | | 127,200 | 15,989,040 |
| Polaris Industries, Inc. (c) | | 162,200 | 13,261,472 |
| | | | 63,128,195 |
| Media - 1.2% | | | |
| Comcast Corp. Class A | | 830,643 | 54,149,617 |
| Time Warner, Inc. | | 165,000 | 12,134,100 |
| | | | 66,283,717 |
| Multiline Retail - 1.8% | | | |
| Kohl's Corp. (c) | | 439,275 | 16,657,308 |
| Macy's, Inc. | | 598,800 | 20,125,668 |
| Target Corp. | | 889,660 | 62,116,061 |
| | | | 98,899,037 |
| Specialty Retail - 0.5% | | | |
| Foot Locker, Inc. | | 211,000 | 11,575,460 |
| GNC Holdings, Inc. | | 442,456 | 10,747,256 |
| L Brands, Inc. | | 52,400 | 3,517,612 |
| Stage Stores, Inc. (c) | | 629,100 | 3,070,008 |
| | | | 28,910,336 |
|
| TOTAL CONSUMER DISCRETIONARY | | | 410,529,487 |
|
| CONSUMER STAPLES - 9.1% | | | |
| Beverages - 0.4% | | | |
| Molson Coors Brewing Co. Class B | | 59,700 | 6,037,461 |
| The Coca-Cola Co. | | 395,900 | 17,946,147 |
| | | | 23,983,608 |
| Food & Staples Retailing - 3.4% | | | |
| CVS Health Corp. | | 1,008,500 | 96,553,790 |
| Wal-Mart Stores, Inc. | | 515,178 | 37,618,298 |
| Walgreens Boots Alliance, Inc. | | 461,707 | 38,446,342 |
| Whole Foods Market, Inc. | | 314,400 | 10,067,088 |
| | | | 182,685,518 |
| Food Products - 1.2% | | | |
| B&G Foods, Inc. Class A | | 405,313 | 19,536,087 |
| Flowers Foods, Inc. | | 88,600 | 1,661,250 |
| Sanderson Farms, Inc. (c) | | 76,900 | 6,662,616 |
| The Hain Celestial Group, Inc. (d) | | 83,100 | 4,134,225 |
| The Hershey Co. | | 307,500 | 34,898,175 |
| | | | 66,892,353 |
| Household Products - 3.9% | | | |
| Procter & Gamble Co. (e) | | 2,457,919 | 208,112,002 |
| Personal Products - 0.2% | | | |
| Avon Products, Inc. | | 2,124,600 | 8,030,988 |
|
| TOTAL CONSUMER STAPLES | | | 489,704,469 |
|
| ENERGY - 12.5% | | | |
| Energy Equipment & Services - 1.1% | | | |
| Baker Hughes, Inc. | | 296,500 | 13,381,045 |
| Halliburton Co. | | 359,900 | 16,299,871 |
| National Oilwell Varco, Inc. | | 95,206 | 3,203,682 |
| Oceaneering International, Inc. | | 167,600 | 5,004,536 |
| Schlumberger Ltd. | | 261,900 | 20,711,052 |
| | | | 58,600,186 |
| Oil, Gas & Consumable Fuels - 11.4% | | | |
| Anadarko Petroleum Corp. | | 351,186 | 18,700,655 |
| Apache Corp. | | 712,768 | 39,679,795 |
| Avance Gas Holding Ltd. (c) | | 216,143 | 680,645 |
| BW LPG Ltd. | | 163,186 | 622,010 |
| Cameco Corp. (c) | | 318,700 | 3,500,409 |
| Chevron Corp. | | 2,319,180 | 243,119,634 |
| ConocoPhillips Co. | | 243,200 | 10,603,520 |
| CONSOL Energy, Inc. (c) | | 996,135 | 16,027,812 |
| Energy Transfer Equity LP | | 841,300 | 12,089,481 |
| Golar LNG Ltd. | | 176,700 | 2,738,850 |
| Imperial Oil Ltd. | | 120,300 | 3,806,544 |
| Kinder Morgan, Inc. | | 1,616,600 | 30,262,752 |
| Legacy Reserves LP | | 1,295,801 | 2,099,198 |
| MPLX LP | | 678,157 | 22,806,420 |
| Noble Energy, Inc. | | 117,400 | 4,211,138 |
| Suncor Energy, Inc. | | 2,021,100 | 56,067,359 |
| The Williams Companies, Inc. | | 3,317,149 | 71,749,933 |
| Williams Partners LP | | 2,182,856 | 75,614,132 |
| | | | 614,380,287 |
|
| TOTAL ENERGY | | | 672,980,473 |
|
| FINANCIALS - 23.2% | | | |
| Banks - 11.9% | | | |
| Bank of America Corp. | | 5,776,000 | 76,647,520 |
| Comerica, Inc. | | 734,748 | 30,220,185 |
| First Niagara Financial Group, Inc. | | 2,040,314 | 19,872,658 |
| FirstMerit Corp. | | 762,921 | 15,464,409 |
| Huntington Bancshares, Inc. | | 240,100 | 2,146,494 |
| JPMorgan Chase & Co. | | 2,981,764 | 185,286,815 |
| KeyCorp | | 1,762,400 | 19,474,520 |
| Lloyds Banking Group PLC | | 4,385,500 | 3,176,379 |
| M&T Bank Corp. | | 677,591 | 80,111,584 |
| Prosperity Bancshares, Inc. | | 74,300 | 3,788,557 |
| Regions Financial Corp. | | 3,772,700 | 32,105,677 |
| Standard Chartered PLC (United Kingdom) | | 1,026,935 | 7,791,332 |
| SunTrust Banks, Inc. | | 1,060,000 | 43,544,800 |
| U.S. Bancorp | | 1,260,738 | 50,845,564 |
| Wells Fargo & Co. | | 1,537,686 | 72,778,678 |
| | | | 643,255,172 |
| Capital Markets - 4.5% | | | |
| Apollo Global Management LLC Class A | | 195,900 | 2,967,885 |
| Apollo Investment Corp. | | 1,928,247 | 10,682,488 |
| Ares Capital Corp. (c) | | 803,095 | 11,403,949 |
| Ares Management LP | | 275,503 | 3,881,837 |
| KKR & Co. LP | | 4,564,021 | 56,320,019 |
| Morgan Stanley | | 838,975 | 21,796,571 |
| State Street Corp. | | 984,502 | 53,084,348 |
| The Blackstone Group LP | | 3,181,126 | 78,064,832 |
| TPG Specialty Lending, Inc. | | 247,431 | 4,109,829 |
| | | | 242,311,758 |
| Insurance - 4.1% | | | |
| Chubb Ltd. | | 693,971 | 90,708,949 |
| Marsh & McLennan Companies, Inc. | | 226,200 | 15,485,652 |
| MetLife, Inc. | | 1,984,870 | 79,057,372 |
| Prudential Financial, Inc. | | 466,462 | 33,277,399 |
| | | | 218,529,372 |
| Real Estate Investment Trusts - 2.6% | | | |
| American Capital Agency Corp. | | 489,748 | 9,706,805 |
| American Tower Corp. | | 66,600 | 7,566,426 |
| Annaly Capital Management, Inc. | | 941,909 | 10,426,933 |
| Cousins Properties, Inc. | | 917,700 | 9,544,080 |
| Crown Castle International Corp. | | 269,500 | 27,335,385 |
| Duke Realty LP | | 696,100 | 18,558,026 |
| First Potomac Realty Trust | | 1,163,557 | 10,704,724 |
| Piedmont Office Realty Trust, Inc. Class A | | 673,524 | 14,507,707 |
| Public Storage | | 39,600 | 10,121,364 |
| Sabra Health Care REIT, Inc. | | 180,800 | 3,730,808 |
| Two Harbors Investment Corp. | | 815,534 | 6,980,971 |
| Ventas, Inc. | | 163,990 | 11,941,752 |
| | | | 141,124,981 |
| Thrifts & Mortgage Finance - 0.1% | | | |
| Radian Group, Inc. | | 559,708 | 5,832,157 |
|
| TOTAL FINANCIALS | | | 1,251,053,440 |
|
| HEALTH CARE - 9.4% | | | |
| Biotechnology - 1.4% | | | |
| AbbVie, Inc. | | 447,700 | 27,717,107 |
| Amgen, Inc. | | 179,971 | 27,382,588 |
| Gilead Sciences, Inc. | | 246,300 | 20,546,346 |
| | | | 75,646,041 |
| Health Care Equipment & Supplies - 2.4% | | | |
| Dentsply Sirona, Inc. | | 201,000 | 12,470,040 |
| Medtronic PLC | | 1,163,152 | 100,926,699 |
| St. Jude Medical, Inc. | | 203,846 | 15,899,988 |
| | | | 129,296,727 |
| Health Care Providers & Services - 0.0% | | | |
| HealthSouth Corp. warrants 1/17/17 (d) | | 191 | 323 |
| Pharmaceuticals - 5.6% | | | |
| Astellas Pharma, Inc. | | 184,300 | 2,890,256 |
| GlaxoSmithKline PLC | | 2,510,100 | 53,904,424 |
| Johnson & Johnson | | 1,272,568 | 154,362,498 |
| Merck & Co., Inc. | | 525,300 | 30,262,533 |
| Pfizer, Inc. | | 645,212 | 22,717,915 |
| Sanofi SA | | 198,692 | 16,507,874 |
| Teva Pharmaceutical Industries Ltd. sponsored ADR | | 422,300 | 21,212,129 |
| | | | 301,857,629 |
|
| TOTAL HEALTH CARE | | | 506,800,720 |
|
| INDUSTRIALS - 12.1% | | | |
| Aerospace & Defense - 3.2% | | | |
| General Dynamics Corp. | | 213,500 | 29,727,740 |
| Raytheon Co. | | 238,200 | 32,383,290 |
| The Boeing Co. | | 298,400 | 38,753,208 |
| United Technologies Corp. | | 718,271 | 73,658,691 |
| | | | 174,522,929 |
| Air Freight & Logistics - 3.2% | | | |
| C.H. Robinson Worldwide, Inc. | | 97,028 | 7,204,329 |
| PostNL NV (d) | | 4,812,100 | 19,629,849 |
| United Parcel Service, Inc. Class B | | 1,378,937 | 148,539,094 |
| | | | 175,373,272 |
| Airlines - 0.2% | | | |
| Copa Holdings SA Class A | | 189,000 | 9,877,140 |
| Commercial Services & Supplies - 0.7% | | | |
| KAR Auction Services, Inc. | | 631,000 | 26,337,940 |
| Republic Services, Inc. | | 77,226 | 3,962,466 |
| Waste Connection, Inc. (Canada) | | 89,318 | 6,452,991 |
| | | | 36,753,397 |
| Construction & Engineering - 0.0% | | | |
| Koninklijke Boskalis Westminster NV | | 12,900 | 440,182 |
| Electrical Equipment - 1.4% | | | |
| Eaton Corp. PLC | | 561,700 | 33,550,341 |
| Emerson Electric Co. | | 810,803 | 42,291,484 |
| | | | 75,841,825 |
| Industrial Conglomerates - 3.0% | | | |
| General Electric Co. | | 5,141,147 | 161,843,308 |
| Machinery - 0.3% | | | |
| Allison Transmission Holdings, Inc. | | 175,800 | 4,962,834 |
| Cummins, Inc. | | 67,700 | 7,612,188 |
| Deere & Co. | | 34,000 | 2,755,360 |
| | | | 15,330,382 |
| Road & Rail - 0.1% | | | |
| Norfolk Southern Corp. | | 63,800 | 5,431,294 |
|
| TOTAL INDUSTRIALS | | | 655,413,729 |
|
| INFORMATION TECHNOLOGY - 11.0% | | | |
| Communications Equipment - 2.6% | | | |
| Cisco Systems, Inc. | | 4,922,631 | 141,230,283 |
| Electronic Equipment & Components - 0.3% | | | |
| TE Connectivity Ltd. | | 257,761 | 14,720,731 |
| Internet Software & Services - 0.3% | | | |
| Yahoo!, Inc. (d) | | 428,500 | 16,094,460 |
| IT Services - 2.2% | | | |
| First Data Corp. (f) | | 2,006,096 | 22,207,483 |
| First Data Corp. Class A (d) | | 252,300 | 2,792,961 |
| IBM Corp. | | 403,023 | 61,170,831 |
| Paychex, Inc. (e) | | 529,269 | 31,491,506 |
| | | | 117,662,781 |
| Semiconductors & Semiconductor Equipment - 2.7% | | | |
| Applied Materials, Inc. (e) | | 1,874,300 | 44,926,971 |
| Maxim Integrated Products, Inc. | | 668,400 | 23,855,196 |
| Qualcomm, Inc. | | 1,444,139 | 77,362,526 |
| | | | 146,144,693 |
| Software - 0.7% | | | |
| Microsoft Corp. | | 725,624 | 37,130,180 |
| SS&C Technologies Holdings, Inc. | | 87,200 | 2,448,576 |
| | | | 39,578,756 |
| Technology Hardware, Storage & Peripherals - 2.2% | | | |
| Apple, Inc. | | 409,500 | 39,148,200 |
| EMC Corp. | | 2,666,700 | 72,454,239 |
| Seagate Technology LLC | | 232,700 | 5,668,572 |
| | | | 117,271,011 |
|
| TOTAL INFORMATION TECHNOLOGY | | | 592,702,715 |
|
| MATERIALS - 1.8% | | | |
| Chemicals - 1.2% | | | |
| LyondellBasell Industries NV Class A | | 251,000 | 18,679,420 |
| Potash Corp. of Saskatchewan, Inc. | | 886,000 | 14,401,486 |
| Syngenta AG sponsored ADR | | 11,300 | 867,727 |
| The Dow Chemical Co. | | 626,700 | 31,153,257 |
| Tronox Ltd. Class A | | 451,800 | 1,992,438 |
| | | | 67,094,328 |
| Containers & Packaging - 0.6% | | | |
| Packaging Corp. of America | | 216,800 | 14,510,424 |
| WestRock Co. | | 446,400 | 17,351,568 |
| | | | 31,861,992 |
|
| TOTAL MATERIALS | | | 98,956,320 |
|
| TELECOMMUNICATION SERVICES - 4.1% | | | |
| Diversified Telecommunication Services - 4.0% | | | |
| AT&T, Inc. | | 2,157,693 | 93,233,915 |
| Verizon Communications, Inc. | | 2,198,559 | 122,767,535 |
| | | | 216,001,450 |
| Wireless Telecommunication Services - 0.1% | | | |
| KDDI Corp. | | 238,000 | 7,237,517 |
|
| TOTAL TELECOMMUNICATION SERVICES | | | 223,238,967 |
|
| UTILITIES - 5.3% | | | |
| Electric Utilities - 4.8% | | | |
| American Electric Power Co., Inc. | | 205,471 | 14,401,462 |
| Entergy Corp. | | 347,700 | 28,285,395 |
| Exelon Corp. | | 2,997,600 | 108,992,736 |
| FirstEnergy Corp. | | 146,000 | 5,096,860 |
| NextEra Energy, Inc. | | 22,683 | 2,957,863 |
| PPL Corp. | | 648,200 | 24,469,550 |
| Southern Co. (e) | | 1,238,277 | 66,408,796 |
| Xcel Energy, Inc. | | 220,400 | 9,869,512 |
| | | | 260,482,174 |
| Multi-Utilities - 0.5% | | | |
| CenterPoint Energy, Inc. | | 1,030,100 | 24,722,400 |
|
| TOTAL UTILITIES | | | 285,204,574 |
|
| TOTAL COMMON STOCKS | | | |
| (Cost $4,474,757,648) | | | 5,186,584,894 |
|
| Convertible Preferred Stocks - 0.2% | | | |
| HEALTH CARE - 0.1% | | | |
| Health Care Providers & Services - 0.0% | | | |
| AmSurg Corp. Series A-1, 5.25% | | 6,750 | 974,025 |
| Pharmaceuticals - 0.1% | | | |
| Allergan PLC 5.50% | | 3,140 | 2,617,567 |
| Teva Pharmaceutical Industries Ltd. 7% | | 1,310 | 1,092,907 |
| | | | 3,710,474 |
|
| TOTAL HEALTH CARE | | | 4,684,499 |
|
| TELECOMMUNICATION SERVICES - 0.0% | | | |
| Wireless Telecommunication Services - 0.0% | | | |
| T-Mobile U.S., Inc. Series A 5.50% | | 35,285 | 2,596,623 |
| UTILITIES - 0.1% | | | |
| Independent Power and Renewable Electricity Producers - 0.0% | | | |
| Dynegy, Inc. 5.375% | | 26,500 | 1,641,675 |
| Multi-Utilities - 0.1% | | | |
| CenterPoint Energy, Inc. 2.00% ZENS | | 41,700 | 2,176,219 |
|
| TOTAL UTILITIES | | | 3,817,894 |
|
| TOTAL CONVERTIBLE PREFERRED STOCKS | | | |
| (Cost $11,058,503) | | | 11,099,016 |
| | | Principal Amount | Value |
|
| Corporate Bonds - 0.5% | | | |
| Convertible Bonds - 0.3% | | | |
| ENERGY - 0.1% | | | |
| Oil, Gas & Consumable Fuels - 0.1% | | | |
| Amyris, Inc. 3% 2/27/17 | | 1,383,000 | 1,316,007 |
| Scorpio Tankers, Inc. 2.375% 7/1/19 (f) | | 7,280,000 | 5,487,300 |
| | | | 6,803,307 |
| INFORMATION TECHNOLOGY - 0.2% | | | |
| Communications Equipment - 0.1% | | | |
| InterDigital, Inc. 1.5% 3/1/20 | | 4,600,000 | 4,769,625 |
| Internet Software & Services - 0.1% | | | |
| Twitter, Inc. 1% 9/15/21 | | 3,220,000 | 2,865,800 |
| Semiconductors & Semiconductor Equipment - 0.0% | | | |
| NXP Semiconductors NV 1% 12/1/19 | | 2,320,000 | 2,521,550 |
| TOTAL INFORMATION TECHNOLOGY | | | 10,156,975 |
|
| TOTAL CONVERTIBLE BONDS | | | 16,960,282 |
|
| Nonconvertible Bonds - 0.2% | | | |
| CONSUMER DISCRETIONARY - 0.1% | | | |
| Media - 0.1% | | | |
| Altice SA 7.625% 2/15/25 (f) | | 2,720,000 | 2,655,400 |
| FINANCIALS - 0.1% | | | |
| Thrifts & Mortgage Finance - 0.1% | | | |
| Prime Securities Services Borrower LLC/Prime Finance, Inc. 9.25% 5/15/23 (f) | | 2,625,000 | 2,782,500 |
| HEALTH CARE - 0.0% | | | |
| Pharmaceuticals - 0.0% | | | |
| Valeant Pharmaceuticals International, Inc. 6.125% 4/15/25 (f) | | 2,155,000 | 1,729,388 |
| MATERIALS - 0.0% | | | |
| Metals & Mining - 0.0% | | | |
| Walter Energy, Inc. 8.5% 4/15/21 (g) | | 5,250,000 | 525 |
| UTILITIES - 0.0% | | | |
| Independent Power and Renewable Electricity Producers - 0.0% | | | |
| Dynegy, Inc. 7.375% 11/1/22 | | 1,810,000 | 1,746,650 |
|
| TOTAL NONCONVERTIBLE BONDS | | | 8,914,463 |
|
| TOTAL CORPORATE BONDS | | | |
| (Cost $32,031,493) | | | 25,874,745 |
| | | Shares | Value |
|
| Money Market Funds - 3.8% | | | |
| Fidelity Cash Central Fund, 0.43% (h) | | 162,095,069 | 162,095,069 |
| Fidelity Securities Lending Cash Central Fund, 0.46% (h)(i) | | 40,777,160 | 40,777,160 |
| TOTAL MONEY MARKET FUNDS | | | |
| (Cost $202,872,229) | | | 202,872,229 |
| TOTAL INVESTMENT PORTFOLIO - 100.6% | | | |
| (Cost $4,720,719,873) | | | 5,426,430,884 |
| NET OTHER ASSETS (LIABILITIES) - (0.6)% | | | (30,917,445) |
| NET ASSETS - 100% | | | $5,395,513,439 |
| Written Options | | | | |
| | Expiration Date/Exercise Price | Number of Contracts | Premium | Value |
| Call Options | | | | |
| Applied Materials, Inc. | 7/15/16 - $22.00 | 9,516 | $584,509 | $(1,917,474) |
| Paychex, Inc. | 9/16/16 - $55.00 | 2,524 | 195,025 | (1,198,900) |
| Procter & Gamble Co. | 7/15/16 - $85.00 | 7,751 | 170,518 | (457,309) |
| Southern Co. | 8/19/16 - $52.50 | 8,600 | 250,512 | (1,509,300) |
| TOTAL WRITTEN OPTIONS | | | $1,200,564 | $(5,082,983) |
Legend
(a) Investment is owned by an entity that is treated as a U.S. Corporation for tax purposes in which the Fund holds a percentage ownership.
(b) Restricted securities - Investment in securities not registered under the Securities Act of 1933 (excluding 144A issues). At the end of the period, the value of restricted securities (excluding 144A issues) amounted to $15,989,040 or 0.3% of net assets.
(c) Security or a portion of the security is on loan at period end.
(d) Non-income producing
(e) Security or a portion of the security is pledged as collateral for call options written. At period end, the value of securities pledged amounted to $149,577,169.
(f) Security exempt from registration under Rule 144A of the Securities Act of 1933. These securities may be resold in transactions exempt from registration, normally to qualified institutional buyers. At the end of the period, the value of these securities amounted to $34,862,071 or 0.6% of net assets.
(g) Non-income producing - Security is in default.
(h) Affiliated fund that is generally available only to investment companies and other accounts managed by Fidelity Investments. The rate quoted is the annualized seven-day yield of the fund at period end. A complete unaudited listing of the fund's holdings as of its most recent quarter end is available upon request. In addition, each Fidelity Central Fund's financial statements are available on the SEC's website or upon request.
(i) Investment made with cash collateral received from securities on loan.
Additional information on each restricted holding is as follows:
| Security | Acquisition Date | Acquisition Cost |
| New Academy Holding Co. LLC unit | 8/1/11 | $13,406,880 |
Affiliated Central Funds
Information regarding fiscal year to date income earned by the Fund from investments in Fidelity Central Funds is as follows:
| Fund | Income earned |
| Fidelity Cash Central Fund | $341,370 |
| Fidelity Securities Lending Cash Central Fund | 483,072 |
| Total | $824,442 |
Investment Valuation
The following is a summary of the inputs used, as of June 30, 2016, involving the Fund's assets and liabilities carried at fair value. The inputs or methodology used for valuing securities may not be an indication of the risk associated with investing in those securities. For more information on valuation inputs, and their aggregation into the levels used below, please refer to the Investment Valuation section in the accompanying Notes to Financial Statements.
| | Valuation Inputs at Reporting Date: |
| Description | Total | Level 1 | Level 2 | Level 3 |
| Investments in Securities: | | | | |
| Equities: | | | | |
| Consumer Discretionary | $410,529,487 | $385,288,804 | $9,251,643 | $15,989,040 |
| Consumer Staples | 489,704,469 | 489,704,469 | -- | -- |
| Energy | 672,980,473 | 671,677,818 | 1,302,655 | -- |
| Financials | 1,251,053,440 | 1,240,085,729 | 10,967,711 | -- |
| Health Care | 511,485,219 | 437,089,758 | 74,395,461 | -- |
| Industrials | 655,413,729 | 635,343,698 | 20,070,031 | -- |
| Information Technology | 592,702,715 | 592,702,715 | -- | -- |
| Materials | 98,956,320 | 98,956,320 | -- | -- |
| Telecommunication Services | 225,835,590 | 218,598,073 | 7,237,517 | -- |
| Utilities | 289,022,468 | 286,846,249 | 2,176,219 | -- |
| Corporate Bonds | 25,874,745 | -- | 25,874,745 | -- |
| Money Market Funds | 202,872,229 | 202,872,229 | -- | -- |
| Total Investments in Securities: | $5,426,430,884 | $5,259,165,862 | $151,275,982 | $15,989,040 |
| Derivative Instruments: | | | | |
| Liabilities | | | | |
| Written Options | $(5,082,983) | $(5,082,983) | $-- | $-- |
| Total Liabilities | $(5,082,983) | $(5,082,983) | $-- | $-- |
| Total Derivative Instruments: | $(5,082,983) | $(5,082,983) | $-- | $-- |
Value of Derivative Instruments
The following table is a summary of the Fund's value of derivative instruments by primary risk exposure as of June 30, 2016. For additional information on derivative instruments, please refer to the Derivative Instruments section in the accompanying Notes to Financial Statements.
| Primary Risk Exposure / Derivative Type | Value |
| | Asset | Liability |
| Equity Risk | | |
| Written Options(a) | $0 | $(5,082,983) |
| Total Equity Risk | 0 | (5,082,983) |
| Total Value of Derivatives | $0 | $(5,082,983) |
(a) Gross value is presented in the Statement of Assets and Liabilities in the written options, at value line-item.
Other Information
Distribution of investments by country or territory of incorporation, as a percentage of Total Net Assets, is as follows (Unaudited):
| United States of America | 89.9% |
| Ireland | 2.7% |
| Switzerland | 2.0% |
| Canada | 1.6% |
| United Kingdom | 1.4% |
| Others (Individually Less Than 1%) | 2.4% |
| | 100.0% |
See accompanying notes which are an integral part of the financial statements.
Financial Statements
Statement of Assets and Liabilities
| | | June 30, 2016 (Unaudited) |
| Assets | | |
Investment in securities, at value (including securities loaned of $40,280,900) — See accompanying schedule:
Unaffiliated issuers (cost $4,517,847,644) | $5,223,558,655 | |
| Fidelity Central Funds (cost $202,872,229) | 202,872,229 | |
| Total Investments (cost $4,720,719,873) | | $5,426,430,884 |
| Receivable for investments sold | | 11,601,001 |
| Receivable for fund shares sold | | 1,581,511 |
| Dividends receivable | | 7,698,600 |
| Interest receivable | | 276,913 |
| Distributions receivable from Fidelity Central Funds | | 117,595 |
| Other receivables | | 420,069 |
| Total assets | | 5,448,126,573 |
| Liabilities | | |
| Payable for fund shares redeemed | $3,589,834 | |
| Accrued management fee | 2,010,226 | |
| Distribution and service plan fees payable | 308,623 | |
| Written options, at value (premium received $1,200,564) | 5,082,983 | |
| Other affiliated payables | 414,234 | |
| Other payables and accrued expenses | 430,074 | |
| Collateral on securities loaned, at value | 40,777,160 | |
| Total liabilities | | 52,613,134 |
| Net Assets | | $5,395,513,439 |
| Net Assets consist of: | | |
| Paid in capital | | $4,616,137,568 |
| Undistributed net investment income | | 50,628,197 |
| Accumulated undistributed net realized gain (loss) on investments and foreign currency transactions | | 26,987,779 |
| Net unrealized appreciation (depreciation) on investments and assets and liabilities in foreign currencies | | 701,759,895 |
| Net Assets | | $5,395,513,439 |
| Initial Class: | | |
| Net Asset Value, offering price and redemption price per share ($3,361,138,632 ÷ 166,897,861 shares) | | $20.14 |
| Service Class: | | |
| Net Asset Value, offering price and redemption price per share ($308,254,190 ÷ 15,386,203 shares) | | $20.03 |
| Service Class 2: | | |
| Net Asset Value, offering price and redemption price per share ($1,361,222,293 ÷ 69,200,482 shares) | | $19.67 |
| Investor Class: | | |
| Net Asset Value, offering price and redemption price per share ($364,898,324 ÷ 18,208,182 shares) | | $20.04 |
See accompanying notes which are an integral part of the financial statements.
Statement of Operations
| | | Six months ended June 30, 2016 (Unaudited) |
| Investment Income | | |
| Dividends | | $80,496,151 |
| Interest | | 494,821 |
| Income from Fidelity Central Funds | | 824,442 |
| Total income | | 81,815,414 |
| Expenses | | |
| Management fee | $11,697,679 | |
| Transfer agent fees | 1,856,706 | |
| Distribution and service plan fees | 1,796,248 | |
| Accounting and security lending fees | 550,103 | |
| Custodian fees and expenses | 40,614 | |
| Independent trustees' fees and expenses | 11,623 | |
| Depreciation in deferred trustee compensation account | (56) | |
| Audit | 50,008 | |
| Legal | 4,612 | |
| Miscellaneous | 23,493 | |
| Total expenses before reductions | 16,031,030 | |
| Expense reductions | (91,099) | 15,939,931 |
| Net investment income (loss) | | 65,875,483 |
| Realized and Unrealized Gain (Loss) | | |
| Net realized gain (loss) on: | | |
| Investment securities: | | |
| Unaffiliated issuers | 19,148,384 | |
| Foreign currency transactions | 9,999 | |
| Written options | 5,818,419 | |
| Total net realized gain (loss) | | 24,976,802 |
Change in net unrealized appreciation (depreciation) on:
Investment securities | 201,162,622 | |
| Assets and liabilities in foreign currencies | (42,691) | |
| Written options | (4,520,685) | |
| Total change in net unrealized appreciation (depreciation) | | 196,599,246 |
| Net gain (loss) | | 221,576,048 |
| Net increase (decrease) in net assets resulting from operations | | $287,451,531 |
See accompanying notes which are an integral part of the financial statements.
Statement of Changes in Net Assets
| | Six months ended June 30, 2016 (Unaudited) | Year ended December 31, 2015 |
| Increase (Decrease) in Net Assets | | |
| Operations | | |
| Net investment income (loss) | $65,875,483 | $161,804,801 |
| Net realized gain (loss) | 24,976,802 | 386,055,726 |
| Change in net unrealized appreciation (depreciation) | 196,599,246 | (778,237,899) |
| Net increase (decrease) in net assets resulting from operations | 287,451,531 | (230,377,372) |
| Distributions to shareholders from net investment income | – | (173,549,033) |
| Distributions to shareholders from net realized gain | (326,837,561) | (562,610,777) |
| Total distributions | (326,837,561) | (736,159,810) |
| Share transactions - net increase (decrease) | 188,054,046 | (79,940,029) |
| Redemption fees | – | 3,144 |
| Total increase (decrease) in net assets | 148,668,016 | (1,046,474,067) |
| Net Assets | | |
| Beginning of period | 5,246,845,423 | 6,293,319,490 |
| End of period | $5,395,513,439 | $5,246,845,423 |
| Other Information | | |
| Undistributed net investment income end of period | $50,628,197 | $– |
| Distributions in excess of net investment income end of period | $– | $(15,247,286) |
See accompanying notes which are an integral part of the financial statements.
Financial Highlights — VIP Equity-Income Portfolio Initial Class
| | Six months ended (Unaudited) June 30, | Years ended December 31, | | | | |
| | 2016 | 2015 | 2014 | 2013 | 2012 | 2011 |
| Selected Per–Share Data | | | | | | |
| Net asset value, beginning of period | $20.46 | $24.30 | $23.29 | $19.94 | $18.69 | $19.02 |
| Income from Investment Operations | | | | | | |
| Net investment income (loss)A | .25 | .63 | .71B | .56 | .59 | .48 |
| Net realized and unrealized gain (loss) | .68 | (1.57)C | 1.35 | 4.96 | 2.59 | (.31) |
| Total from investment operations | .93 | (.94) | 2.06 | 5.52 | 3.18 | .17 |
| Distributions from net investment income | – | (.71) | (.71) | (.60) | (.63)D | (.50) |
| Distributions from net realized gain | (1.25) | (2.19) | (.34) | (1.57) | (1.30)D | – |
| Total distributions | (1.25) | (2.90) | (1.05) | (2.17) | (1.93) | (.50) |
| Redemption fees added to paid in capitalA | – | –E | –E | –E | –E | –E |
| Net asset value, end of period | $20.14 | $20.46 | $24.30 | $23.29 | $19.94 | $18.69 |
| Total ReturnF,G,H | 5.47% | (4.08)%C | 8.85% | 28.15% | 17.31% | .97% |
| Ratios to Average Net AssetsI,J | | | | | | |
| Expenses before reductions | .54%K | .54% | .54% | .55% | .55% | .56% |
| Expenses net of fee waivers, if any | .54%K | .54% | .54% | .54% | .55% | .55% |
| Expenses net of all reductions | .54%K | .53% | .54% | .54% | .54% | .54% |
| Net investment income (loss) | 2.60%K | 2.85% | 2.94%B | 2.43% | 2.94% | 2.48% |
| Supplemental Data | | | | | | |
| Net assets, end of period (000 omitted) | $3,361,139 | $3,238,580 | $3,817,228 | $3,947,728 | $3,461,083 | $3,345,762 |
| Portfolio turnover rateL | 33%K | 46% | 40% | 32% | 48% | 96% |
A Calculated based on average shares outstanding during the period.
B Net Investment income per share reflects a large, non-recurring dividend which amounted to $.08 per share. Excluding this non-recurring dividend, the ratio of net investment income (loss) to average net assets would have been 2.59%.
C Net realized and unrealized gain (loss) per share reflects proceeds received from litigation which amounted to $.02 per share. Excluding these litigation proceeds, the total return would have been (4.18)%.
D The amounts shown reflect certain reclassifications related to book to tax differences that were made in the year shown.
E Amount represents less than $.005 per share.
F Total returns for periods of less than one year are not annualized.
G Total returns do not reflect charges attributable to your insurance company's separate account. Inclusion of these charges would reduce the total returns shown.
H Total returns would have been lower if certain expenses had not been reduced during the applicable periods shown.
I Fees and expenses of any underlying Fidelity Central Funds are not included in the Fund's expense ratio. The Fund indirectly bears its proportionate share of the expenses of any underlying Fidelity Central Funds.
J Expense ratios reflect operating expenses of the class. Expenses before reductions do not reflect amounts reimbursed by the investment adviser or reductions from brokerage service arrangements or reductions from other expense offset arrangements and do not represent the amount paid by the class during periods when reimbursements or reductions occur. Expenses net of fee waivers reflect expenses after reimbursement by the investment adviser but prior to reductions from brokerage service arrangements or other expense offset arrangements. Expenses net of all reductions represent the net expenses paid by the class.
K Annualized
L Amount does not include the portfolio activity of any underlying Fidelity Central Funds.
See accompanying notes which are an integral part of the financial statements.
Financial Highlights — VIP Equity-Income Portfolio Service Class
| | Six months ended (Unaudited) June 30, | Years ended December 31, | | | | |
| | 2016 | 2015 | 2014 | 2013 | 2012 | 2011 |
| Selected Per–Share Data | | | | | | |
| Net asset value, beginning of period | $20.37 | $24.20 | $23.20 | $19.87 | $18.63 | $18.96 |
| Income from Investment Operations | | | | | | |
| Net investment income (loss)A | .24 | .61 | .69B | .53 | .57 | .46 |
| Net realized and unrealized gain (loss) | .67 | (1.56)C | 1.34 | 4.94 | 2.57 | (.31) |
| Total from investment operations | .91 | (.95) | 2.03 | 5.47 | 3.14 | .15 |
| Distributions from net investment income | – | (.69) | (.68) | (.57) | (.60)D | (.48) |
| Distributions from net realized gain | (1.25) | (2.19) | (.34) | (1.57) | (1.30)D | – |
| Total distributions | (1.25) | (2.88) | (1.03)E | (2.14) | (1.90) | (.48) |
| Redemption fees added to paid in capitalA | – | –F | –F | –F | –F | –F |
| Net asset value, end of period | $20.03 | $20.37 | $24.20 | $23.20 | $19.87 | $18.63 |
| Total ReturnG,H,I | 5.39% | (4.17)%C | 8.74% | 28.01% | 17.19% | .86% |
| Ratios to Average Net AssetsJ,K | | | | | | |
| Expenses before reductions | .64%L | .64% | .64% | .65% | .65% | .66% |
| Expenses net of fee waivers, if any | .64%L | .64% | .64% | .64% | .65% | .66% |
| Expenses net of all reductions | .64%L | .63% | .64% | .64% | .64% | .64% |
| Net investment income (loss) | 2.50%L | 2.75% | 2.84%B | 2.33% | 2.84% | 2.38% |
| Supplemental Data | | | | | | |
| Net assets, end of period (000 omitted) | $308,254 | $309,669 | $369,024 | $391,896 | $350,493 | $347,999 |
| Portfolio turnover rateM | 33%L | 46% | 40% | 32% | 48% | 96% |
A Calculated based on average shares outstanding during the period.
B Net Investment income per share reflects a large, non-recurring dividend which amounted to $.08 per share. Excluding this non-recurring dividend, the ratio of net investment income (loss) to average net assets would have been 2.49%.
C Net realized and unrealized gain (loss) per share reflects proceeds received from litigation which amounted to $.02 per share. Excluding these litigation proceeds, the total return would have been (4.27)%.
D The amounts shown reflect certain reclassifications related to book to tax differences that were made in the year shown.
E Total distributions of $1.03 per share is comprised of distributions from net investment income of $.684 and distributions from net realized gain of $.342 per share.
F Amount represents less than $.005 per share.
G Total returns for periods of less than one year are not annualized.
H Total returns do not reflect charges attributable to your insurance company's separate account. Inclusion of these charges would reduce the total returns shown.
I Total returns would have been lower if certain expenses had not been reduced during the applicable periods shown.
J Fees and expenses of any underlying Fidelity Central Funds are not included in the Fund's expense ratio. The Fund indirectly bears its proportionate share of the expenses of any underlying Fidelity Central Funds.
K Expense ratios reflect operating expenses of the class. Expenses before reductions do not reflect amounts reimbursed by the investment adviser or reductions from brokerage service arrangements or reductions from other expense offset arrangements and do not represent the amount paid by the class during periods when reimbursements or reductions occur. Expenses net of fee waivers reflect expenses after reimbursement by the investment adviser but prior to reductions from brokerage service arrangements or other expense offset arrangements. Expenses net of all reductions represent the net expenses paid by the class.
L Annualized
M Amount does not include the portfolio activity of any underlying Fidelity Central Funds.
See accompanying notes which are an integral part of the financial statements.
Financial Highlights — VIP Equity-Income Portfolio Service Class 2
| | Six months ended (Unaudited) June 30, | Years ended December 31, | | | | |
| | 2016 | 2015 | 2014 | 2013 | 2012 | 2011 |
| Selected Per–Share Data | | | | | | |
| Net asset value, beginning of period | $20.04 | $23.85 | $22.88 | $19.62 | $18.41 | $18.75 |
| Income from Investment Operations | | | | | | |
| Net investment income (loss)A | .22 | .57 | .64B | .49 | .53 | .42 |
| Net realized and unrealized gain (loss) | .66 | (1.54)C | 1.32 | 4.88 | 2.55 | (.31) |
| Total from investment operations | .88 | (.97) | 1.96 | 5.37 | 3.08 | .11 |
| Distributions from net investment income | – | (.65) | (.65) | (.54) | (.57)D | (.45) |
| Distributions from net realized gain | (1.25) | (2.19) | (.34) | (1.57) | (1.30)D | – |
| Total distributions | (1.25) | (2.84) | (.99) | (2.11) | (1.87) | (.45) |
| Redemption fees added to paid in capitalA | – | –E | –E | –E | –E | –E |
| Net asset value, end of period | $19.67 | $20.04 | $23.85 | $22.88 | $19.62 | $18.41 |
| Total ReturnF,G,H | 5.33% | (4.32)%C | 8.57% | 27.83% | 17.05% | .66% |
| Ratios to Average Net AssetsI,J | | | | | | |
| Expenses before reductions | .79%K | .79% | .79% | .80% | .80% | .81% |
| Expenses net of fee waivers, if any | .79%K | .79% | .79% | .79% | .80% | .81% |
| Expenses net of all reductions | .79%K | .78% | .79% | .79% | .79% | .80% |
| Net investment income (loss) | 2.35%K | 2.60% | 2.69%B | 2.18% | 2.69% | 2.23% |
| Supplemental Data | | | | | | |
| Net assets, end of period (000 omitted) | $1,361,222 | $1,348,912 | $1,702,854 | $1,755,769 | $1,560,856 | $1,457,230 |
| Portfolio turnover rateL | 33%K | 46% | 40% | 32% | 48% | 96% |
A Calculated based on average shares outstanding during the period.
B Net Investment income per share reflects a large, non-recurring dividend which amounted to $.08 per share. Excluding this non-recurring dividend, the ratio of net investment income (loss) to average net assets would have been 2.34%.
C Net realized and unrealized gain (loss) per share reflects proceeds received from litigation which amounted to $.02 per share. Excluding these litigation proceeds, the total return would have been (4.42)%.
D The amounts shown reflect certain reclassifications related to book to tax differences that were made in the year shown.
E Amount represents less than $.005 per share.
F Total returns for periods of less than one year are not annualized.
G Total returns do not reflect charges attributable to your insurance company's separate account. Inclusion of these charges would reduce the total returns shown.
H Total returns would have been lower if certain expenses had not been reduced during the applicable periods shown.
I Fees and expenses of any underlying Fidelity Central Funds are not included in the Fund's expense ratio. The Fund indirectly bears its proportionate share of the expenses of any underlying Fidelity Central Funds.
J Expense ratios reflect operating expenses of the class. Expenses before reductions do not reflect amounts reimbursed by the investment adviser or reductions from brokerage service arrangements or reductions from other expense offset arrangements and do not represent the amount paid by the class during periods when reimbursements or reductions occur. Expenses net of fee waivers reflect expenses after reimbursement by the investment adviser but prior to reductions from brokerage service arrangements or other expense offset arrangements. Expenses net of all reductions represent the net expenses paid by the class.
K Annualized
L Amount does not include the portfolio activity of any underlying Fidelity Central Funds.
See accompanying notes which are an integral part of the financial statements.
Financial Highlights — VIP Equity-Income Portfolio Investor Class
| | Six months ended (Unaudited) June 30, | Years ended December 31, | | | | |
| | 2016 | 2015 | 2014 | 2013 | 2012 | 2011 |
| Selected Per–Share Data | | | | | | |
| Net asset value, beginning of period | $20.37 | $24.21 | $23.21 | $19.89 | $18.64 | $18.97 |
| Income from Investment Operations | | | | | | |
| Net investment income (loss)A | .24 | .61 | .69B | .54 | .57 | .46 |
| Net realized and unrealized gain (loss) | .68 | (1.56)C | 1.34 | 4.93 | 2.59 | (.31) |
| Total from investment operations | .92 | (.95) | 2.03 | 5.47 | 3.16 | .15 |
| Distributions from net investment income | – | (.70) | (.69) | (.58) | (.61)D | (.48) |
| Distributions from net realized gain | (1.25) | (2.19) | (.34) | (1.57) | (1.30)D | – |
| Total distributions | (1.25) | (2.89) | (1.03) | (2.15) | (1.91) | (.48) |
| Redemption fees added to paid in capitalA | – | –E | –E | –E | –E | –E |
| Net asset value, end of period | $20.04 | $20.37 | $24.21 | $23.21 | $19.89 | $18.64 |
| Total ReturnF,G,H | 5.44% | (4.18)%C | 8.77% | 27.99% | 17.27% | .89% |
| Ratios to Average Net AssetsI,J | | | | | | |
| Expenses before reductions | .62%K | .62% | .62% | .63% | .64% | .64% |
| Expenses net of fee waivers, if any | .62%K | .62% | .62% | .62% | .64% | .64% |
| Expenses net of all reductions | .62%K | .61% | .62% | .62% | .63% | .63% |
| Net investment income (loss) | 2.52%K | 2.77% | 2.86%B | 2.35% | 2.85% | 2.39% |
| Supplemental Data | | | | | | |
| Net assets, end of period (000 omitted) | $364,898 | $349,685 | $388,773 | $351,139 | $220,311 | $178,499 |
| Portfolio turnover rateL | 33%K | 46% | 40% | 32% | 48% | 96% |
A Calculated based on average shares outstanding during the period.
B Net Investment income per share reflects a large, non-recurring dividend which amounted to $.08 per share. Excluding this non-recurring dividend, the ratio of net investment income (loss) to average net assets would have been 2.51%.
C Net realized and unrealized gain (loss) per share reflects proceeds received from litigation which amounted to $.02 per share. Excluding these litigation proceeds, the total return would have been (4.28)%.
D The amounts shown reflect certain reclassifications related to book to tax differences that were made in the year shown.
E Amount represents less than $.005 per share.
F Total returns for periods of less than one year are not annualized.
G Total returns do not reflect charges attributable to your insurance company's separate account. Inclusion of these charges would reduce the total returns shown.
H Total returns would have been lower if certain expenses had not been reduced during the applicable periods shown.
I Fees and expenses of any underlying Fidelity Central Funds are not included in the Fund's expense ratio. The Fund indirectly bears its proportionate share of the expenses of any underlying Fidelity Central Funds.
J Expense ratios reflect operating expenses of the class. Expenses before reductions do not reflect amounts reimbursed by the investment adviser or reductions from brokerage service arrangements or reductions from other expense offset arrangements and do not represent the amount paid by the class during periods when reimbursements or reductions occur. Expenses net of fee waivers reflect expenses after reimbursement by the investment adviser but prior to reductions from brokerage service arrangements or other expense offset arrangements. Expenses net of all reductions represent the net expenses paid by the class.
K Annualized
L Amount does not include the portfolio activity of any underlying Fidelity Central Funds.
See accompanying notes which are an integral part of the financial statements.
Notes to Financial Statements (Unaudited)
For the period ended June 30, 2016
1. Organization.
VIP Equity-Income Portfolio (the Fund) is a fund of Variable Insurance Products Fund (the Trust) and is authorized to issue an unlimited number of shares. The Trust is registered under the Investment Company Act of 1940, as amended (the 1940 Act), as an open-end management investment company organized as a Massachusetts business trust. Shares of the Fund may only be purchased by insurance companies for the purpose of funding variable annuity or variable life insurance contracts. The Fund offers the following classes of shares: Initial Class shares, Service Class shares, Service Class 2 shares and Investor Class shares. The Fund offered Service Class 2R shares during the period April 24, 2002 through April 30, 2015, and all outstanding shares were converted to Service Class 2 shares by April 30, 2015. All classes have equal rights and voting privileges, except for matters affecting a single class.
2. Investments in Fidelity Central Funds.
The Fund invests in Fidelity Central Funds, which are open-end investment companies generally available only to other investment companies and accounts managed by the investment adviser and its affiliates. The Fund's Schedule of Investments lists each of the Fidelity Central Funds held as of period end, if any, as an investment of the Fund, but does not include the underlying holdings of each Fidelity Central Fund. As an Investing Fund, the Fund indirectly bears its proportionate share of the expenses of the underlying Fidelity Central Funds.
The Money Market Central Funds seek preservation of capital and current income and are managed by Fidelity Investments Money Management, Inc. (FIMM), an affiliate of the investment adviser. Annualized expenses of the Money Market Central Funds as of their most recent shareholder report date are less than .005%.
A complete unaudited list of holdings for each Fidelity Central Fund is available upon request or at the Securities and Exchange Commission (the SEC) website at www.sec.gov. In addition, the financial statements of the Fidelity Central Funds are available on the SEC website or upon request.
3. Significant Accounting Policies.
The financial statements have been prepared in conformity with accounting principles generally accepted in the United States of America (GAAP), which require management to make certain estimates and assumptions at the date of the financial statements. Actual results could differ from those estimates. Subsequent events, if any, through the date that the financial statements were issued have been evaluated in the preparation of the financial statements. The following summarizes the significant accounting policies of the Fund:
Investment Valuation. Investments are valued as of 4:00 p.m. Eastern time on the last calendar day of the period. The Board of Trustees (the Board) has delegated the day to day responsibility for the valuation of the Fund's investments to the Fidelity Management & Research Company (FMR) Fair Value Committee (the Committee). In accordance with valuation policies and procedures approved by the Board, the Fund attempts to obtain prices from one or more third party pricing vendors or brokers to value its investments. When current market prices, quotations or currency exchange rates are not readily available or reliable, investments will be fair valued in good faith by the Committee, in accordance with procedures adopted by the Board. Factors used in determining fair value vary by investment type and may include market or investment specific events, changes in interest rates and credit quality. The frequency with which these procedures are used cannot be predicted and they may be utilized to a significant extent. The Committee oversees the Fund's valuation policies and procedures and reports to the Board on the Committee's activities and fair value determinations. The Board monitors the appropriateness of the procedures used in valuing the Fund's investments and ratifies the fair value determinations of the Committee.
The Fund categorizes the inputs to valuation techniques used to value its investments into a disclosure hierarchy consisting of three levels as shown below:
- Level 1 – quoted prices in active markets for identical investments
- Level 2 – other significant observable inputs (including quoted prices for similar investments, interest rates, prepayment speeds, etc.)
- Level 3 – unobservable inputs (including the Fund's own assumptions based on the best information available)
Valuation techniques used to value the Fund's investments by major category are as follows:
Equity securities, including restricted securities, for which market quotations are readily available, are valued at the last reported sale price or official closing price as reported by a third party pricing vendor on the primary market or exchange on which they are traded and are categorized as Level 1 in the hierarchy. In the event there were no sales during the day or closing prices are not available, securities are valued at the last quoted bid price or may be valued using the last available price and are generally categorized as Level 2 in the hierarchy. For foreign equity securities, when market or security specific events arise, comparisons to the valuation of American Depositary Receipts (ADRs), futures contracts, Exchange-Traded Funds (ETFs) and certain indexes as well as quoted prices for similar securities may be used and would be categorized as Level 2 in the hierarchy. Utilizing these techniques may result in transfers between Level 1 and Level 2. For equity securities, including restricted securities, where observable inputs are limited, assumptions about market activity and risk are used and these securities may be categorized as Level 3 in the hierarchy.
Debt securities, including restricted securities, are valued based on evaluated prices received from third party pricing vendors or from brokers who make markets in such securities. Corporate bonds are valued by pricing vendors who utilize matrix pricing which considers yield or price of bonds of comparable quality, coupon, maturity and type or by broker-supplied prices. When independent prices are unavailable or unreliable, debt securities may be valued utilizing pricing methodologies which consider similar factors that would be used by third party pricing vendors. Debt securities are generally categorized as Level 2 in the hierarchy but may be Level 3 depending on the circumstances.
Exchange-traded options are valued using the last sale price or, in the absence of a sale, the last offering price and are categorized as Level 1 in the hierarchy. Investments in open-end mutual funds, including the Fidelity Central Funds, are valued at their closing net asset value (NAV) each business day and are categorized as Level 1 in the hierarchy.
Changes in valuation techniques may result in transfers in or out of an assigned level within the disclosure hierarchy. The aggregate value of investments by input level as of June 30, 2016 is included at the end of the Fund's Schedule of Investments.
Foreign Currency. The Fund may use foreign currency contracts to facilitate transactions in foreign-denominated securities. Gains and losses from these transactions may arise from changes in the value of the foreign currency or if the counterparties do not perform under the contracts' terms.
Foreign-denominated assets, including investment securities, and liabilities are translated into U.S. dollars at the exchange rates at period end. Purchases and sales of investment securities, income and dividends received and expenses denominated in foreign currencies are translated into U.S. dollars at the exchange rate in effect on the transaction date.
The effects of exchange rate fluctuations on investments are included with the net realized and unrealized gain (loss) on investment securities. Other foreign currency transactions resulting in realized and unrealized gain (loss) are disclosed separately.
Investment Transactions and Income. For financial reporting purposes, the Fund's investment holdings and NAV include trades executed through the end of the last business day of the period. The NAV per share for processing shareholder transactions is calculated as of the close of business of the New York Stock Exchange (NYSE), normally 4:00 p.m. Eastern time and includes trades executed through the end of the prior business day. Gains and losses on securities sold are determined on the basis of identified cost and may include proceeds received from litigation. Dividend income is recorded on the ex-dividend date, except for certain dividends from foreign securities where the ex-dividend date may have passed, which are recorded as soon as the Fund is informed of the ex-dividend date. Non-cash dividends included in dividend income, if any, are recorded at the fair market value of the securities received. Income and capital gain distributions from Fidelity Central Funds, if any, are recorded on the ex-dividend date. Distributions received on securities that represent a return of capital or capital gain are recorded as a reduction of cost of investments and/or as a realized gain. Subsequent to ex-dividend date the Fund determines the components of these distributions, based upon receipt of tax filings or other correspondence relating to the underlying investment. Interest income is accrued as earned and includes coupon interest and amortization of premium and accretion of discount on debt securities as applicable. Investment income is recorded net of foreign taxes withheld where recovery of such taxes is uncertain. Debt obligations may be placed on non-accrual status and related interest income may be reduced by ceasing current accruals and writing off interest receivables when the collection of all or a portion of interest has become doubtful based on consistently applied procedures. A debt obligation is removed from non-accrual status when the issuer resumes interest payments or when collectability of interest is reasonably assured.
Class Allocations and Expenses. Investment income, realized and unrealized capital gains and losses, common expenses of the Fund, and certain fund-level expense reductions, if any, are allocated daily on a pro-rata basis to each class based on the relative net assets of each class to the total net assets of the Fund. Each class differs with respect to transfer agent and distribution and service plan fees incurred. Certain expense reductions may also differ by class. For the reporting period, the allocated portion of income and expenses to each class as a percent of its average net assets may vary due to the timing of recording these transactions in relation to fluctuating net assets of the classes. Expenses directly attributable to a fund are charged to that fund. Expenses attributable to more than one fund are allocated among the respective funds on the basis of relative net assets or other appropriate methods. Expense estimates are accrued in the period to which they relate and adjustments are made when actual amounts are known.
Deferred Trustee Compensation. Under a Deferred Compensation Plan (the Plan), independent Trustees may elect to defer receipt of a portion of their annual compensation. Deferred amounts are invested in a cross-section of Fidelity funds, are marked-to-market and remain in the Fund until distributed in accordance with the Plan. The investment of deferred amounts and the offsetting payable to the Trustees are included in the accompanying Statement of Assets and Liabilities.
Income Tax Information and Distributions to Shareholders. Each year, the Fund intends to qualify as a regulated investment company under Subchapter M of the Internal Revenue Code, including distributing substantially all of its taxable income and realized gains. As a result, no provision for U.S. Federal income taxes is required. The Fund files a U.S. federal tax return, in addition to state and local tax returns as required. The Fund's federal income tax returns are subject to examination by the Internal Revenue Service (IRS) for a period of three fiscal years after they are filed. State and local tax returns may be subject to examination for an additional fiscal year depending on the jurisdiction. Foreign taxes are provided for based on the Fund's understanding of the tax rules and rates that exist in the foreign markets in which it invests.
Distributions are declared and recorded on the ex-dividend date. Income dividends and capital gain distributions are declared separately for each class. Income and capital gain distributions are determined in accordance with income tax regulations, which may differ from GAAP.
Capital accounts within the financial statements are adjusted for permanent book-tax differences. These adjustments have no impact on net assets or the results of operations. Capital accounts are not adjusted for temporary book-tax differences which will reverse in a subsequent period.
Book-tax differences are primarily due to foreign currency transactions, equity-debt classifications, certain conversion ratio adjustments, contingent interest, market discount, options transactions, partnerships, deferred trustees compensation and losses deferred due to wash sales and excise tax regulations.
The federal tax cost of investment securities and unrealized appreciation (depreciation) as of period end were as follows:
| Gross unrealized appreciation | $1,122,747,576 |
| Gross unrealized depreciation | (432,954,885) |
| Net unrealized appreciation (depreciation) on securities | $689,792,691 |
| Tax Cost | $4,736,638,193 |
The Fund elected to defer to its next fiscal year approximately $11,083,764 of capital losses recognized during the period November 1, 2015 to December 31, 2015.
Restricted Securities. The Fund may invest in securities that are subject to legal or contractual restrictions on resale. These securities generally may be resold in transactions exempt from registration or to the public if the securities are registered. Disposal of these securities may involve time-consuming negotiations and expense, and prompt sale at an acceptable price may be difficult. Information regarding restricted securities is included at the end of the Fund's Schedule of Investments.
4. Derivative Instruments.
Risk Exposures and the Use of Derivative Instruments. The Fund's investment objective allows the Fund to enter into various types of derivative contracts, including options. Derivatives are investments whose value is primarily derived from underlying assets, indices or reference rates and may be transacted on an exchange or over-the-counter (OTC). Derivatives may involve a future commitment to buy or sell a specified asset based on specified terms, to exchange future cash flows at periodic intervals based on a notional principal amount, or for one party to make one or more payments upon the occurrence of specified events in exchange for periodic payments from the other party.
The Fund used derivatives to increase returns and to manage exposure to certain risks as defined below. The success of any strategy involving derivatives depends on analysis of numerous economic factors, and if the strategies for investment do not work as intended, the Fund may not achieve its objectives.
The Fund's use of derivatives increased or decreased its exposure to the following risk:
| Equity Risk | Equity risk relates to the fluctuations in the value of financial instruments as a result of changes in market prices (other than those arising from interest rate risk or foreign exchange risk), whether caused by factors specific to an individual investment, its issuer, or all factors affecting all instruments traded in a market or market segment.
|
The Fund is also exposed to additional risks from investing in derivatives, such as liquidity risk and counterparty credit risk. Liquidity risk is the risk that the Fund will be unable to close out the derivative in the open market in a timely manner. Counterparty credit risk is the risk that the counterparty will not be able to fulfill its obligation to the Fund. Counterparty credit risk related to exchange-traded options may be mitigated by the protection provided by the exchange on which they trade.
Investing in derivatives may involve greater risks than investing in the underlying assets directly and, to varying degrees, may involve risk of loss in excess of any initial investment and collateral received and amounts recognized in the Statement of Assets and Liabilities. In addition, there may be the risk that the change in value of the derivative contract does not correspond to the change in value of the underlying instrument.
Options. Options give the purchaser the right, but not the obligation, to buy (call) or sell (put) an underlying security or financial instrument at an agreed exercise or strike price between or on certain dates. Options obligate the seller (writer) to buy (put) or sell (call) an underlying instrument at the exercise or strike price or cash settle an underlying derivative instrument if the holder exercises the option on or before the expiration date.
The Fund used exchange-traded written covered call options to manage its exposure to the market. When the Fund writes a covered call option, the Fund holds the underlying instrument which must be delivered to the holder upon the exercise of the option.
Upon entering into a written options contract, the Fund will receive a premium. Premiums received are reflected as a liability on the Statement of Assets and Liabilities. Options are valued daily and any unrealized appreciation (depreciation) is reflected on the Statement of Assets and Liabilities. When a written option is exercised, the premium is added to the proceeds from the sale of the underlying instrument in determining the gain or loss realized on that investment. When an option is closed the Fund will realize a gain or loss depending on whether the proceeds or amount paid for the closing sale transaction are greater or less than the premium received. When an option expires, gains and losses are realized to the extent of premiums received. The net realized gain (loss) on closed and expired written options and the change in net unrealized appreciation (depreciation) on written options are reflected separately on the Statement of Operations.
Writing call options tends to decrease exposure to the underlying instrument and risk of loss is the change in value in excess of the premium received.
Any open options at period end are presented in the Schedule of Investments under the caption "Written Options".
During the period, the Fund recognized net realized gain (loss) of $5,818,419 and a change in net unrealized appreciation (depreciation) of $(4,520,685) related to its investment in written options. This amount is included in the Statement of Operations.
The following is a summary of the Fund's written options activity:
| | Number of Contracts | Amount of Premiums |
| Outstanding at beginning of period | 55,263 | $3,583,153 |
| Options Opened | 119,555 | 7,841,093 |
| Options Exercised | (64,377) | (4,069,572) |
| Options Closed | (14,800) | (794,493) |
| Options Expired | (67,250) | (5,359,617) |
| Outstanding at end of period | 28,391 | $1,200,564 |
5. Purchases and Sales of Investments.
Purchases and sales of securities, other than short-term securities, aggregated $843,967,764 and $980,302,240, respectively.
6. Fees and Other Transactions with Affiliates.
Management Fee. Fidelity Management & Research Company (the investment adviser) and its affiliates provide the Fund with investment management related services for which the Fund pays a monthly management fee. The management fee is the sum of an individual fund fee rate that is based on an annual rate of .20% of the Fund's average net assets and an annualized group fee rate that averaged .25% during the period. The group fee rate is based upon the average net assets of all the mutual funds advised by the investment adviser, including any mutual funds previously advised by the investment adviser that are currently advised by Fidelity SelectCo, LLC, an affiliate of the investment adviser. The group fee rate decreases as assets under management increase and increases as assets under management decrease. For the reporting period, the total annualized management fee rate was .45% of the Fund's average net assets.
Distribution and Service Plan Fees. In accordance with Rule 12b-1 of the 1940 Act, the Fund has adopted separate 12b-1 Plans for each Service Class of shares. Each Service Class pays Fidelity Distributors Corporation (FDC), an affiliate of the investment adviser, a service fee. For the period, the service fee is based on an annual rate of .10% of Service Class' average net assets and .25% of Service Class 2's average net assets.
For the period, total fees, all of which were re-allowed to insurance companies for the distribution of shares and providing shareholder support services, were as follows:
| Service Class | $150,062 |
| Service Class 2 | 1,646,186 |
| | $1,796,248 |
Transfer Agent Fees. Fidelity Investments Institutional Operations Company, Inc. (FIIOC), an affiliate of the investment adviser, is the Fund's transfer, dividend disbursing, and shareholder servicing agent. FIIOC receives an asset-based fee with respect to each class. Each class (with the exception of Investor Class) pays a fee for transfer agent services, typesetting, and printing and mailing of shareholder reports, excluding mailing of proxy statements, equal to an annual rate of .07% (.15% for Investor Class) of class-level average net assets. For the period, transfer agent fees for each class were as follows:
| Initial Class | $1,071,033 |
| Service Class | 99,041 |
| Service Class 2 | 434,593 |
| Investor Class | 252,039 |
| | $1,856,706 |
Accounting and Security Lending Fees. Fidelity Service Company, Inc. (FSC), an affiliate of the investment adviser, maintains the Fund's accounting records. The accounting fee is based on the level of average net assets for each month. Under a separate contract, FSC administers the security lending program. The security lending fee is based on the number and duration of lending transactions.
Brokerage Commissions. The Fund placed a portion of its portfolio transactions with brokerage firms which are affiliates of the investment adviser. Brokerage commissions are included in net realized gain (loss) and change in net unrealized appreciation (depreciation) in the Statement of Operations. The commissions paid to these affiliated firms were $19,025 for the period.
Interfund Trades. The Fund may purchase from or sell securities to other Fidelity Funds under procedures adopted by the Board. The procedures have been designed to ensure these interfund trades are executed in accordance with Rule 17a-7 of the 1940 Act. Interfund trades are included within the respective purchases and sales amounts shown in the Purchases and Sales of Investments note.
7. Committed Line of Credit.
The Fund participates with other funds managed by the investment adviser or an affiliate in a $4.25 billion credit facility (the "line of credit") to be utilized for temporary or emergency purposes to fund shareholder redemptions or for other short-term liquidity purposes. The Fund has agreed to pay commitment fees on its pro-rata portion of the line of credit, which amounted to $4,565 and is reflected in Miscellaneous expenses on the Statement of Operations. During the period, the Fund did not borrow on this line of credit.
8. Security Lending.
The Fund lends portfolio securities through a lending agent from time to time in order to earn additional income. For equity securities, a lending agent is used and may loan securities to certain qualified borrowers, including Fidelity Capital Markets (FCM), a broker-dealer affiliated with the Fund. On the settlement date of the loan, the Fund receives collateral (in the form of U.S. Treasury obligations, letters of credit and/or cash) against the loaned securities and maintains collateral in an amount not less than 100% of the market value of the loaned securities during the period of the loan. The market value of the loaned securities is determined at the close of business of the Fund and any additional required collateral is delivered to the Fund on the next business day. The Fund or borrower may terminate the loan at any time, and if the borrower defaults on its obligation to return the securities loaned because of insolvency or other reasons, the Fund may apply collateral received from the borrower against the obligation. The Fund may experience delays and costs in recovering the securities loaned. Any cash collateral received is invested in the Fidelity Securities Lending Cash Central Fund. The value of loaned securities and cash collateral at period end are disclosed on the Fund's Statement of Assets and Liabilities. At period end, there were no security loans outstanding with FCM. Security lending income represents the income earned on investing cash collateral, less rebates paid to borrowers and any lending agent fees associated with the loan, plus any premium payments received for lending certain types of securities. Security lending income is presented in the Statement of Operations as a component of income from Fidelity Central Funds. Total security lending income during the period amounted to $483,072, including $18,566 from securities loaned to FCM.
9. Expense Reductions.
Commissions paid to certain brokers with whom the investment adviser, or its affiliates, places trades on behalf of the Fund include an amount in addition to trade execution, which may be rebated back to the Fund to offset certain expenses. This amount totaled $72,190 for the period. In addition, through arrangements with the Fund's custodian, credits realized as a result of certain uninvested cash balances were used to reduce the Fund's expenses. During the period, these credits reduced the Fund's custody expenses by $77.
In addition, during the period the investment adviser reimbursed and/or waived a portion of fund-level operating expenses in the amount of $18,832.
10. Distributions to Shareholders.
Distributions to shareholders of each class were as follows:
| | Six months ended
June 30, 2016 | Year ended December 31, 2015 |
| From net investment income | | |
| Initial Class | $– | $109,149,565 |
| Service Class | – | 10,156,613 |
| Service Class 2 | – | 42,706,986 |
| Service Class 2R | – | 11,545 |
| Investor Class | – | 11,524,324 |
| Total | $– | $173,549,033 |
| From net realized gain | | |
| Initial Class | $203,491,917 | $339,608,604 |
| Service Class | 18,737,960 | 33,003,823 |
| Service Class 2 | 83,421,427 | 153,933,197 |
| Service Class 2R | – | 1,316,715 |
| Investor Class | 21,186,257 | 34,748,438 |
| Total | $326,837,561 | $562,610,777 |
11. Share Transactions.
Transactions for each class of shares were as follows:
| | Shares | Shares | Dollars | Dollars |
| | Six months ended
June 30, 2016 | Year ended December 31, 2015 | Six months ended
June 30, 2016 | Year ended December 31, 2015 |
| Initial Class | | | | |
| Shares sold | 8,110,049 | 2,942,434 | $153,785,185 | $64,636,128 |
| Reinvestment of distributions | 11,594,981 | 20,908,619 | 203,491,917 | 448,758,169 |
| Shares redeemed | (11,095,325) | (22,650,939) | (215,773,031) | (503,270,251) |
| Net increase (decrease) | 8,609,705 | 1,200,114 | $141,504,071 | $10,124,046 |
| Service Class | | | | |
| Shares sold | 270,386 | 583,466 | $5,228,636 | $12,999,462 |
| Reinvestment of distributions | 1,072,579 | 2,018,226 | 18,737,960 | 43,160,436 |
| Shares redeemed | (1,158,468) | (2,646,679) | (22,440,912) | (58,306,592) |
| Net increase (decrease) | 184,497 | (44,987) | $1,525,684 | $(2,146,694) |
| Service Class 2 | | | | |
| Shares sold | 2,814,262 | 4,829,943 | $53,454,263 | $104,917,377 |
| Reinvestment of distributions | 4,861,388 | 9,327,616 | 83,421,427 | 196,640,183 |
| Shares redeemed | (5,786,656) | (18,242,504) | (109,951,962) | (397,542,395) |
| Net increase (decrease) | 1,888,994 | (4,084,945) | $26,923,728 | $(95,984,835) |
| Service Class 2R | | | | |
| Shares sold | – | 44,755 | $– | $994,924 |
| Reinvestment of distributions | – | 61,837 | – | 1,328,260 |
| Shares redeemed | – | (758,460) | – | (16,752,939) |
| Net increase (decrease) | – | (651,868) | $– | $(14,429,755) |
| Investor Class | | | | |
| Shares sold | 1,033,667 | 1,061,340 | $20,135,694 | $23,323,259 |
| Reinvestment of distributions | 1,212,722 | 2,166,600 | 21,186,257 | 46,272,762 |
| Shares redeemed | (1,201,147) | (2,123,884) | (23,221,388) | (47,098,812) |
| Net increase (decrease) | 1,045,242 | 1,104,056 | $18,100,563 | $22,497,209 |
12. Other.
The Fund's organizational documents provide former and current trustees and officers with a limited indemnification against liabilities arising in connection with the performance of their duties to the Fund. In the normal course of business, the Fund may also enter into contracts that provide general indemnifications. The Fund's maximum exposure under these arrangements is unknown as this would be dependent on future claims that may be made against the Fund. The risk of material loss from such claims is considered remote.
At the end of the period, the investment adviser or its affiliates were the owners of record of 14% of the total outstanding shares of the Fund and one otherwise unaffiliated shareholder was the owner of record of 19% of the total outstanding shares of the Fund.
Shareholder Expense Example
As a shareholder of the Fund, you incur two types of costs: (1) transaction costs and (2) ongoing costs, including management fees, distribution and/or service (12b-1) fees and other Fund expenses. This Example is intended to help you understand your ongoing costs (in dollars) of investing in the Fund and to compare these costs with the ongoing costs of investing in other mutual funds.
The Example is based on an investment of $1,000 invested at the beginning of the period and held for the entire period (January 1, 2016 to June 30, 2016).
Actual Expenses
The first line of the accompanying table for each class of the Fund provides information about actual account values and actual expenses. You may use the information in this line, together with the amount you invested, to estimate the expenses that you paid over the period. Simply divide your account value by $1,000.00 (for example, an $8,600 account value divided by $1,000.00 = 8.6), then multiply the result by the number in the first line for a class of the Fund under the heading entitled "Expenses Paid During Period" to estimate the expenses you paid on your account during this period. The estimate of expenses does not include any fees or other expenses of any variable annuity or variable life insurance product. If they were, the estimate of expenses you paid during the period would be higher, and your ending account value would be lower. In addition, the Fund, as a shareholder in the underlying Fidelity Central Funds, will indirectly bear its pro-rata share of the fees and expenses incurred by the underlying Fidelity Central Funds. These fees and expenses are not included in the Fund's annualized expense ratio used to calculate the expense estimate in the table below.
Hypothetical Example for Comparison Purposes
The second line of the accompanying table for each class of the Fund provides information about hypothetical account values and hypothetical expenses based on a Class' actual expense ratio and an assumed rate of return of 5% per year before expenses, which is not the Class' actual return. The hypothetical account values and expenses may not be used to estimate the actual ending account balance or expenses you paid for the period. You may use this information to compare the ongoing costs of investing in the Fund and other funds. To do so, compare this 5% hypothetical example with the 5% hypothetical examples that appear in the shareholder reports of the other funds. The estimate of expenses does not include any fees or other expenses of any variable annuity or variable life insurance product. If they were, the estimate of expenses you paid during the period would be higher, and your ending account value would be lower. In addition, the Fund, as a shareholder in the underlying Fidelity Central Funds, will indirectly bear its pro-rata share of the fees and expenses incurred by the underlying Fidelity Central Funds. These fees and expenses are not included in the Fund's annualized expense ratio used to calculate the expense estimate in the table below.
Please note that the expenses shown in the table are meant to highlight your ongoing costs only and do not reflect any transaction costs. Therefore, the second line of the table is useful in comparing ongoing costs only, and will not help you determine the relative total costs of owning different funds. In addition, if these transactional costs were included, your costs would have been higher.
| | Annualized Expense Ratio-A | Beginning
Account Value
January 1, 2016 | Ending
Account Value
June 30, 2016 | Expenses Paid
During Period-B
January 1, 2016
to June 30, 2016 |
| Initial Class | .54% | | | |
| Actual | | $1,000.00 | $1,054.70 | $2.76 |
| Hypothetical-C | | $1,000.00 | $1,022.18 | $2.72 |
| Service Class | .64% | | | |
| Actual | | $1,000.00 | $1,053.90 | $3.27 |
| Hypothetical-C | | $1,000.00 | $1,021.68 | $3.22 |
| Service Class 2 | .79% | | | |
| Actual | | $1,000.00 | $1,053.30 | $4.03 |
| Hypothetical-C | | $1,000.00 | $1,020.93 | $3.97 |
| Investor Class | .62% | | | |
| Actual | | $1,000.00 | $1,054.40 | $3.17 |
| Hypothetical-C | | $1,000.00 | $1,021.78 | $3.12 |
A Annualized expense ratio reflects expenses net of applicable fee waivers.
B Expenses are equal to each Class' annualized expense ratio, multiplied by the average account value over the period, multiplied by 182/366 (to reflect the one-half year period).
C 5% return per year before expenses

VIPEI-SANN-0816
1.705693.118
Fidelity® Variable Insurance Products: Floating Rate High Income Portfolio
Semi-Annual Report June 30, 2016 |
|
Contents
To view a fund's proxy voting guidelines and proxy voting record for the 12-month period ended June 30, visit http://www.fidelity.com/proxyvotingresults or visit the Securities and Exchange Commission's (SEC) web site at http://www.sec.gov.
You may also call 1-877-208-0098 to request a free copy of the proxy voting guidelines.
Fidelity® Variable Insurance Products are separate account options which are purchased through a variable insurance contract.
Standard & Poor's, S&P and S&P 500 are registered service marks of The McGraw-Hill Companies, Inc. and have been licensed for use by Fidelity Distributors Corporation.
Other third-party marks appearing herein are the property of their respective owners.
All other marks appearing herein are registered or unregistered trademarks or service marks of FMR LLC or an affiliated company. © 2016 FMR LLC. All rights reserved.
This report and the financial statements contained herein are submitted for the general information of the shareholders of the Fund. This report is not authorized for distribution to prospective investors in the Fund unless preceded or accompanied by an effective prospectus.
A fund files its complete schedule of portfolio holdings with the SEC for the first and third quarters of each fiscal year on Form N-Q. Forms N-Q are available on the SEC’s web site at http://www.sec.gov. A fund's Forms N-Q may be reviewed and copied at the SEC’s Public Reference Room in Washington, DC. Information regarding the operation of the SEC's Public Reference Room may be obtained by calling 1-800-SEC-0330.
For a complete list of a fund's portfolio holdings, view the most recent holdings listing, semiannual report, or annual report on Fidelity's web site at http://www.fidelity.com, http://www.institutional.fidelity.com, or http://www.401k.com, as applicable.
NOT FDIC INSURED •MAY LOSE VALUE •NO BANK GUARANTEE
Neither the Fund nor Fidelity Distributors Corporation is a bank.
Investment Summary (Unaudited)
Top Five Holdings as of June 30, 2016
| (by issuer, excluding cash equivalents) | % of fund's net assets | % of fund's net assets 6 months ago |
| Albertson's LLC | 2.1 | 1.6 |
| Community Health Systems, Inc. | 1.5 | 1.6 |
| HCA Holdings, Inc. | 1.3 | 1.4 |
| Caesars Growth Properties Holdings, LLC | 1.2 | 1.2 |
| Laureate Education, Inc. | 1.2 | 1.1 |
| | 7.3 | |
Top Five Market Sectors as of June 30, 2016
| | % of fund's net assets | % of fund's net assets 6 months ago |
| Technology | 10.2 | 11.4 |
| Healthcare | 10.1 | 10.4 |
| Services | 8.2 | 6.1 |
| Containers | 6.2 | 6.1 |
| Gaming | 6.1 | 6.1 |
Quality Diversification (% of fund's net assets)
| As of June 30, 2016 |
| | BBB | 1.3% |
| | BB | 34.5% |
| | B | 49.4% |
| | CCC,CC,C | 5.1% |
| | Not Rated | 2.2% |
| | Short-Term Investments and Net Other Assets | 7.5% |

| As of December 31, 2015 |
| | BBB | 1.5% |
| | BB | 30.9% |
| | B | 49.8% |
| | CCC,CC,C | 4.4% |
| | D | 0.1% |
| | Not Rated | 1.5% |
| | Short-Term Investments and Net Other Assets | 11.8% |

We have used ratings from Moody's Investors Service, Inc. Where Moody's® ratings are not available, we have used S&P® ratings. All ratings are as of the date indicated and do not reflect subsequent changes.
Asset Allocation (% of fund's net assets)
| As of June 30, 2016* |
| | Bank Loan Obligations | 86.8% |
| | Nonconvertible Bonds | 5.7% |
| | Short-Term Investments and Net Other Assets (Liabilities) | 7.5% |

* Foreign investments - 8.8%
| As of December 31, 2015* |
| | Bank Loan Obligations | 83.8% |
| | Nonconvertible Bonds | 4.4% |
| | Short-Term Investments and Net Other Assets (Liabilities) | 11.8% |

* Foreign investments - 10.7%
Investments June 30, 2016 (Unaudited)
Showing Percentage of Net Assets
| Bank Loan Obligations - 86.8%(a) | | | |
| | | Principal Amount | Value |
| Aerospace - 1.1% | | | |
| Gemini HDPE LLC Tranche B, term loan 4.75% 8/7/21 (b) | | $491,258 | $485,118 |
| TransDigm, Inc.: | | | |
| Tranche D, term loan 3.75% 6/4/21 (b) | | 455,700 | 449,680 |
| Tranche E, term loan 3.75% 5/14/22 (b) | | 372,310 | 366,144 |
|
| TOTAL AEROSPACE | | | 1,300,942 |
|
| Automotive & Auto Parts - 0.5% | | | |
| North American Lifting Holdings, Inc.: | | | |
| Tranche 1LN, term loan 5.5% 11/27/20 (b) | | 239,029 | 179,272 |
| Tranche 2LN, term loan 10% 11/27/21 (b) | | 500,000 | 325,000 |
| The Gates Corp. Tranche B 1LN, term loan 4.25% 7/3/21 (b) | | 121,903 | 115,376 |
|
| TOTAL AUTOMOTIVE & AUTO PARTS | | | 619,648 |
|
| Broadcasting - 0.7% | | | |
| Clear Channel Communications, Inc. Tranche D, term loan 7.2103% 1/30/19 (b) | | 500,000 | 363,890 |
| ION Media Networks, Inc. Tranche B, term loan 4.75% 12/18/20 (b) | | 477,898 | 476,704 |
|
| TOTAL BROADCASTING | | | 840,594 |
|
| Building Materials - 1.3% | | | |
| Builders FirstSource, Inc. Tranche 1LN, term loan 6% 7/31/22 (b) | | 273,109 | 272,768 |
| GCP Applied Technologies, Inc. Tranche B, term loan 5.25% 2/3/22 (b) | | 124,688 | 124,843 |
| GYP Holdings III Corp. Tranche 1LN, term loan 4.75% 4/1/21 (b) | | 246,851 | 241,914 |
| Jeld-Wen, Inc. Tranche B, term loan 4.75% 7/1/22 (b) | | 124,063 | 123,597 |
| LBM Borrower LLC Tranche B 1LN, term loan 6.25% 8/20/22 (b) | | 248,125 | 242,542 |
| Leighton Services Decoration LLC Tranche B, term loan 5.5% 5/21/22 (b) | | 244,063 | 243,452 |
| Nortek, Inc. Tranche B, term loan 3.5% 10/30/20 (b) | | 247,486 | 245,011 |
|
| TOTAL BUILDING MATERIALS | | | 1,494,127 |
|
| Cable/Satellite TV - 3.4% | | | |
| Charter Communication Operating LLC Tranche I, term loan 3.5% 1/24/23 (b) | | 623,438 | 623,438 |
| Charter Communications Operating LLC Tranche E, term loan 3% 7/1/20 (b) | | 488,665 | 484,697 |
| CSC Holdings LLC Tranche B, term loan 5% 10/9/22 (b) | | 500,000 | 500,125 |
| Liberty Cablevision of Puerto Rico: | | | |
| Tranche 1LN, term loan 4.5% 1/7/22 (b) | | 250,000 | 243,750 |
| Tranche 2LN, term loan 7.75% 7/7/23 (b) | | 240,000 | 226,800 |
| Numericable LLC: | | | |
| Tranche B 6LN, term loan 4.75% 2/10/23 (b) | | 498,750 | 491,089 |
| Tranche B, term loan 5% 1/15/24 (b) | | 420,000 | 415,800 |
| Virgin Media Investment Holdings Ltd. Tranche B, term loan 3.6492% 6/30/23 (b) | | 504,991 | 492,194 |
| WideOpenWest Finance LLC Tranche B, term loan 4.5% 4/1/19 (b) | | 498,737 | 496,797 |
| Zayo Group LLC Tranche B 2LN, term loan 4.5% 5/6/21 (b) | | 72,108 | 72,018 |
|
| TOTAL CABLE/SATELLITE TV | | | 4,046,708 |
|
| Capital Goods - 0.5% | | | |
| Onex Wizard U.S. Acquisition, Inc. Tranche B, term loan 4.25% 3/13/22 (b) | | 439,747 | 435,763 |
| SRAM LLC. Tranche B, term loan 4.0075% 4/10/20 (b) | | 223,375 | 196,570 |
|
| TOTAL CAPITAL GOODS | | | 632,333 |
|
| Chemicals - 2.5% | | | |
| A. Schulman, Inc. Tranche B, term loan 4% 6/1/22 (b) | | 193,050 | 191,361 |
| Chromaflo Technologies Corp. Tranche B 1LN, term loan 4.5% 12/2/19 (b) | | 121,527 | 119,401 |
| Hilex Poly Co. LLC Tranche B 1LN, term loan 6% 12/5/21 (b) | | 493,629 | 493,629 |
| Kraton Polymers LLC Tranche B, term loan 6% 1/6/22 (b) | | 375,000 | 369,064 |
| MacDermid, Inc.: | | | |
| Tranche B 1LN, term loan 5.5% 6/7/20 (b) | | 99,487 | 98,058 |
| Tranche B 2LN, term loan 5.5% 6/7/20 (b) | | 246,250 | 242,711 |
| Tranche B 3LN, term loan 5.5% 6/7/20 (b) | | 124,063 | 122,264 |
| Orion Engineered Carbons GMBH Tranche B, term loan 4.75% 7/25/21 (b) | | 453,547 | 453,547 |
| PQ Corp. Tranche B, term loan 5.75% 11/4/22 (b) | | 200,000 | 199,800 |
| Royal Holdings, Inc.: | | | |
| Tranche B 1LN, term loan 4.5% 6/19/22 (b) | | 64,836 | 64,188 |
| Tranche B 2LN, term loan 8.5% 6/19/23 (b) | | 100,000 | 92,500 |
| Trinseo Materials Operating SCA/Trinseo Materials Finance, Inc. Tranche B 1LN, term loan 4.25% 11/5/21 (b) | | 168,300 | 167,617 |
| Tronox Pigments (Netherlands) B.V. Tranche B, term loan 4.5% 3/19/20 (b) | | 257,347 | 245,766 |
| Univar, Inc. Tranche B, term loan 4.25% 7/1/22 (b) | | 133,988 | 131,858 |
|
| TOTAL CHEMICALS | | | 2,991,764 |
|
| Consumer Products - 0.8% | | | |
| Hercules Achievement, Inc. Tranche B, term loan 5% 12/11/21 (b) | | 738,750 | 735,056 |
| Kate Spade & Co. Tranche B, term loan 4% 4/10/21 (b) | | 246,241 | 243,163 |
|
| TOTAL CONSUMER PRODUCTS | | | 978,219 |
|
| Containers - 4.8% | | | |
| Anchor Glass Container Corp. Tranche B, term loan 4.75% 7/1/22 (b) | | 464,159 | 462,131 |
| Ardagh Holdings U.S.A., Inc. Tranche B, term loan 4% 12/17/19 (b) | | 242,512 | 241,981 |
| Berlin Packaging, LLC: | | | |
| Tranche 2LN, term loan 7.75% 10/1/22 (b) | | 250,000 | 245,418 |
| Tranche B 1LN, term loan 4.5% 10/1/21 (b) | | 491,449 | 488,786 |
| Berry Plastics Corp.: | | | |
| Tranche G, term loan 3.5% 1/6/21 (b) | | 859,167 | 851,383 |
| Tranche H, term loan 3.75% 10/1/22 (b) | | 338,348 | 335,621 |
| Berry Plastics Group, Inc. term loan 3.5% 2/8/20 (b) | | 125,000 | 124,063 |
| BWAY Holding Co. Tranche B, term loan 5.5193% 8/14/20 (b) | | 786,894 | 782,960 |
| Charter NEX U.S. Holdings, Inc. Tranche B 1LN, term loan 5.25% 2/5/22 (b) | | 238,298 | 237,404 |
| Consolidated Container Co. Tranche 2LN, term loan 7.75% 1/3/20 (b) | | 750,000 | 670,628 |
| Hostess Brands LLC: | | | |
| Tranche B 1LN, term loan 4.5% 8/3/22 (b) | | 119,100 | 118,862 |
| Tranche B 2LN, term loan 8.5% 8/3/23 (b) | | 15,000 | 14,850 |
| Owens-Brockway Glass Container, Inc. Tranche B, term loan 3.5% 9/1/22 (b) | | 370,313 | 368,924 |
| Reynolds Consumer Products Holdings, Inc. Tranche B, term loan 4.5% 12/1/18 (b) | | 500,000 | 499,630 |
| Signode Packaging Systems, Inc. Tranche B, term loan 3.75% 5/1/21 (b) | | 127,656 | 126,326 |
| Tekni-Plex, Inc. Tranche 2LN, term loan 8.75% 6/1/23 (b) | | 125,000 | 116,563 |
|
| TOTAL CONTAINERS | | | 5,685,530 |
|
| Diversified Financial Services - 1.9% | | | |
| AlixPartners LLP Tranche B, term loan 4.5% 7/28/22 (b) | | 233,238 | 232,713 |
| Assuredpartners, Inc. Tranche B 1LN, term loan 5.75% 10/22/22 (b) | | 403,177 | 399,399 |
| Fly Funding II Sarl Tranche B, term loan 3.5% 8/9/19 (b) | | 230,263 | 228,633 |
| Flying Fortress Holdings, Inc. Tranche B, term loan 3.5% 4/30/20 (b) | | 500,000 | 498,595 |
| IBC Capital U.S. LLC Tranche B 1LN, term loan 4.75% 9/11/21 (b) | | 276,500 | 266,361 |
| Ocwen Loan Servicing, LLC Tranche B, term loan 5.5% 2/15/18 (b) | | 155,562 | 152,062 |
| TransUnion LLC Tranche B 2LN, term loan 3.5% 4/9/21 (b) | | 493,689 | 486,980 |
|
| TOTAL DIVERSIFIED FINANCIAL SERVICES | | | 2,264,743 |
|
| Energy - 3.0% | | | |
| Alon U.S.A. Partners LP term loan 9.25% 11/26/18 (b) | | 734,772 | 727,424 |
| Chelsea Petroleum Products I LLC Tranche B, term loan 5.25% 10/28/22 (b) | | 245,294 | 240,388 |
| Citgo Holding, Inc. Tranche B, term loan 9.5% 5/12/18 (b) | | 120,397 | 121,149 |
| CPI Acquisition, Inc. Tranche B, term loan 5.5% 8/17/22 (b) | | 154,598 | 150,218 |
| Crestwood Holdings Partners LLC Tranche B, term loan 9% 6/19/19 (b) | | 672,593 | 589,077 |
| Drillships Ocean Ventures, Inc. Tranche B, term loan 5.5% 7/25/21 (b) | | 468,424 | 277,930 |
| Empire Generating Co. LLC: | | | |
| Tranche B, term loan 5.25% 3/14/21 (b) | | 408,956 | 347,613 |
| Tranche C, term loan 5.25% 3/14/21 (b) | | 32,532 | 27,652 |
| Energy Transfer Equity LP Tranche C, term loan 4% 12/2/19 (b) | | 80,000 | 77,638 |
| ExGen Renewables I, LLC Tranche B term loan 5.25% 2/6/21 (b) | | 75,000 | 74,860 |
| Overseas Shipholding Group, Inc. Tranche B, term loan 5.25% 8/5/19 (b) | | 107,058 | 102,776 |
| Penn Products Terminals LLC Tranche B, term loan 4.75% 4/13/22 (b) | | 118,688 | 115,275 |
| Seadrill Operating LP Tranche B, term loan 4% 2/21/21 (b) | | 151,504 | 67,268 |
| Terra-Gen Finance Co. LLC Tranche B, term loan 5.25% 12/9/21 (b) | | 395,058 | 333,824 |
| TerraForm AP Acquisition Holdings LLC Tranche B, term loan 7% 6/26/22 (b) | | 350,666 | 317,353 |
|
| TOTAL ENERGY | | | 3,570,445 |
|
| Entertainment/Film - 0.5% | | | |
| AMC Entertainment, Inc. Tranche B, term loan 4% 12/15/22 (b) | | 248,750 | 248,573 |
| CDS U.S. Intermediate Holdings, Inc.: | | | |
| Tranche B 1LN, term loan 5% 7/8/22 (b) | | 133,987 | 130,261 |
| Tranche B 2LN, term loan 9.25% 7/8/23 (b) | | 50,000 | 45,000 |
| Regal Cinemas Corp. Tranche B, term loan 3.5% 4/1/22 (b) | | 109,175 | 108,953 |
|
| TOTAL ENTERTAINMENT/FILM | | | 532,787 |
|
| Environmental - 0.6% | | | |
| ADS Waste Holdings, Inc. Tranche B 2LN, term loan 3.75% 10/9/19 (b) | | 224,121 | 220,199 |
| The Brickman Group, Ltd. Tranche B 1LN, term loan 4% 12/18/20 (b) | | 247,468 | 242,905 |
| WTG Holdings III Corp. term loan 5.5% 1/15/21 (b) | | 194,513 | 193,540 |
|
| TOTAL ENVIRONMENTAL | | | 656,644 |
|
| Food & Drug Retail - 3.9% | | | |
| Albertson's LLC: | | | |
| Tranche B 1LN, term loan 4.75% 12/21/22 (b) | | 289,688 | 289,146 |
| Tranche B 4LN, term loan 4.5% 8/25/21 (b) | | 1,480,050 | 1,476,868 |
| Tranche B 6LN, term loan 4.75% 6/22/23 (b) | | 640,000 | 638,240 |
| Candy Intermediate Holdings, Inc. Tranche B 1LN, term loan 5.5% 6/15/23 (b) | | 250,000 | 249,375 |
| GOBP Holdings, Inc. Tranche B 1LN, term loan 5% 10/21/21 (b) | | 582,934 | 568,361 |
| Petco Holdings, Inc. Tranche B 1LN, term loan 5% 1/26/23 (b) | | 624,063 | 620,050 |
| Pizza Hut Holdings LLC Tranche B, term loan 3.1923% 6/16/23 (b) | | 325,000 | 325,000 |
| PRA Holdings, Inc. Tranche B, term loan 4.5% 9/23/20 (b) | | 389,024 | 388,829 |
|
| TOTAL FOOD & DRUG RETAIL | | | 4,555,869 |
|
| Food/Beverage/Tobacco - 2.3% | | | |
| AdvancePierre Foods, Inc. Tranche B 1LN, term loan 4.75% 6/2/23 (b) | | 225,000 | 224,062 |
| B&G Foods, Inc. Tranche B, term loan 3.75% 10/2/22 (b) | | 213,370 | 213,530 |
| Blue Ribbon LLC Tranche B 1LN, term loan 5% 11/13/21 (b) | | 401,841 | 401,339 |
| JBS U.S.A. LLC Tranche B, term loan 4% 10/30/22 (b) | | 248,750 | 247,974 |
| Keurig Green Mountain, Inc. Tranche B, term loan 5.25% 3/3/23 (b) | | 486,667 | 486,667 |
| Shearer's Foods, Inc.: | | | |
| Tranche 2LN, term loan 7.75% 6/30/22 (b) | | 255,000 | 229,500 |
| Tranche B 1LN, term loan 4.9375% 6/30/21 (b) | | 501,075 | 486,043 |
| U.S. Foods, Inc. Tranche B, term loan 4% 6/27/23 (b) | | 375,000 | 373,125 |
|
| TOTAL FOOD/BEVERAGE/TOBACCO | | | 2,662,240 |
|
| Gaming - 5.9% | | | |
| Affinity Gaming LLC Tranche B, term loan 5% 6/16/23 (b) | | 375,000 | 373,905 |
| American Casino & Entertainment Properties LLC Tranche B, term loan 4.75% 7/7/22 (b) | | 326,758 | 324,716 |
| Aristocrat International (Pty) Ltd. Tranche B, term loan 4.75% 10/20/21 (b) | | 469,231 | 469,484 |
| Caesars Entertainment Resort Properties LLC Tranche B 1LN, term loan 7% 10/11/20 (b) | | 534,612 | 510,019 |
| Caesars Growth Properties Holdings, LLC Tranche 1LN, term loan 6.25% 5/8/21 (b) | | 1,545,345 | 1,447,479 |
| CCM Merger, Inc. Tranche B, term loan 4.5% 8/8/21 (b) | | 209,490 | 209,228 |
| Eldorado Resorts, Inc. Tranche B, term loan 4.25% 7/23/22 (b) | | 217,800 | 218,072 |
| Golden Nugget, Inc. Tranche B, term loan: | | | |
| 5.5% 11/21/19 (b) | | 321,859 | 321,859 |
| 5.5% 11/21/19 (b) | | 137,940 | 137,940 |
| Graton Economic Development Authority Tranche B, term loan 4.7316% 9/1/22 (b) | | 355,026 | 355,469 |
| MGM Mirage, Inc. Tranche A, term loan 3.2103% 4/25/21 (b) | | 180,000 | 177,300 |
| Mohegan Tribal Gaming Authority Tranche B, term loan 5.5% 6/15/18 (b) | | 595,122 | 590,212 |
| Scientific Games Corp.: | | | |
| Tranche B 2LN, term loan 6% 10/1/21 (b) | | 246,250 | 242,556 |
| Tranche B, term loan 6% 10/18/20 (b) | | 1,102,717 | 1,088,018 |
| Station Casinos LLC Tranche B, term loan 3.75% 6/8/23 (b) | | 455,000 | 452,156 |
|
| TOTAL GAMING | | | 6,918,413 |
|
| Healthcare - 8.6% | | | |
| Alere, Inc. Tranche B, term loan 4.25% 6/18/22 (b) | | 152,230 | 151,342 |
| Alvogen Pharma U.S., Inc. Tranche B 1LN, term loan 6% 4/2/22 (b) | | 268,866 | 265,505 |
| AMAG Pharmaceuticals, Inc. Tranche B, term loan 4.75% 8/17/21 (b) | | 240,625 | 238,219 |
| American Renal Holdings, Inc. Tranche B 1LN, term loan 4.75% 8/20/19 (b) | | 249,337 | 248,714 |
| AmSurg Corp. Tranche B, term loan 3.5% 7/16/21 (b) | | 588,000 | 586,348 |
| Community Health Systems, Inc.: | | | |
| Tranche G, term loan 3.75% 12/31/19 (b) | | 381,298 | 370,241 |
| Tranche H, term loan 4% 1/27/21 (b) | | 1,351,201 | 1,314,976 |
| DaVita HealthCare Partners, Inc. Tranche B, term loan 3.5% 6/24/21 (b) | | 237,576 | 237,873 |
| DJO Finance LLC Tranche B 1LN, term loan 4.25% 6/7/20 (b) | | 248,748 | 236,726 |
| Drumm Investors LLC Tranche B, term loan 9.5% 5/4/18 (b) | | 171,905 | 167,320 |
| Envision Healthcare Corp. Tranche B 2LN, term loan 4.5% 10/28/22 (b) | | 248,750 | 248,501 |
| Gold Merger Co., Inc. Tranche B, term loan 6/16/23 (c) | | 85,000 | 84,761 |
| HCA Holdings, Inc. Tranche B 4LN, term loan 3.3809% 5/1/18 (b) | | 543,360 | 543,485 |
| HCR Healthcare LLC Tranche B, term loan 5% 4/6/18 (b) | | 263,631 | 213,541 |
| Hill-Rom Holdings, Inc. Tranche B, term loan 3.5% 9/8/22 (b) | | 341,719 | 341,719 |
| Horizon Pharmaceuticals, Inc. Tranche B, term loan 4.5% 5/7/21 (b) | | 317,110 | 309,182 |
| Jaguar Holding Co. II/Pharmaceutical Product Development LLC Tranche B, term loan 4.25% 8/18/22 (b) | | 247,190 | 244,656 |
| Kindred Healthcare, Inc. Tranche B, term loan 4.25% 4/9/21 (b) | | 374,047 | 361,890 |
| MPH Acquisition Holdings LLC Tranche B, term loan 5% 6/7/23 (b) | | 200,000 | 200,450 |
| NMSC Holdings, Inc. Tranche B 1LN, term loan 6% 4/19/23 (b) | | 135,468 | 135,468 |
| Onex Schumacher Finance LP Tranche B 1LN, term loan 5% 7/31/22 (b) | | 397,125 | 395,469 |
| Patheon, Inc. Tranche B, term loan 4.25% 3/11/21 (b) | | 613,116 | 594,342 |
| Precyse Acquisition Corp. Tranche B, term loan 6.5% 10/20/22 (b) | | 50,000 | 49,750 |
| U.S. Renal Care, Inc.: | | | |
| Tranche 2LN, term loan 9% 12/31/23 (b) | | 250,000 | 245,000 |
| Tranche B 1LN, term loan 5.25% 12/31/22 (b) | | 646,812 | 645,603 |
| Valeant Pharmaceuticals International, Inc.: | | | |
| Tranche A 3LN, term loan 3.72% 10/20/18 (b) | | 94,913 | 92,256 |
| Tranche BD 2LN, term loan 4.5% 2/13/19 (b) | | 727,353 | 706,216 |
| Tranche E, term loan 4.75% 8/5/20 (b) | | 606,127 | 587,755 |
| Vizient, Inc. Tranche B, term loan 6.25% 2/11/23 (b) | | 249,375 | 250,934 |
|
| TOTAL HEALTHCARE | | | 10,068,242 |
|
| Homebuilders/Real Estate - 2.6% | | | |
| Americold Realty Operating Partnership LP Tranche B, term loan 6.5% 12/1/22 (b) | | 160,000 | 160,600 |
| Communications Sales & Leasing, Inc. Tranche B, term loan 5% 10/24/22 (b) | | 373,120 | 368,456 |
| DTZ U.S. Borrower LLC: | | | |
| Tranche 2LN, term loan 9.25% 11/4/22 (b) | | 125,000 | 125,000 |
| Tranche B 1LN, term loan 4.25% 11/4/21 (b) | | 492,525 | 484,832 |
| iStar Financial, Inc. Tranche B, term loan 5.5% 7/1/20 (b) | | 125,000 | 124,844 |
| MGM Growth Properties Operating Partner LP Tranche B, term loan 4% 4/25/23 (b) | | 543,638 | 544,317 |
| NorthStar Asset Management LP Tranche B 1LN, term loan 4.625% 1/29/23 (b) | | 224,438 | 223,035 |
| Realogy Group LLC Tranche B, term loan 3.75% 3/5/20 (b) | | 977,444 | 975,000 |
|
| TOTAL HOMEBUILDERS/REAL ESTATE | | | 3,006,084 |
|
| Hotels - 0.9% | | | |
| Four Seasons Holdings, Inc.: | | | |
| Tranche 2LN, term loan 7.75% 12/27/20 (b) | | 375,000 | 373,361 |
| Tranche B 1LN, term loan 5.25% 6/27/20 (b) | | 498,375 | 494,224 |
| La Quinta Intermediate Holdings LLC Tranche B LN, term loan 3.75% 4/14/21 (b) | | 218,815 | 213,618 |
|
| TOTAL HOTELS | | | 1,081,203 |
|
| Insurance - 2.0% | | | |
| Alliant Holdings Intermediate LLC Tranche B, term loan 4.5% 8/14/22 (b) | | 401,572 | 395,147 |
| Asurion LLC: | | | |
| Tranche B 1LN, term loan 5% 5/24/19 (b) | | 279,374 | 277,686 |
| Tranche B 2LN, term loan 8.5% 3/3/21 (b) | | 235,000 | 225,600 |
| Tranche B 4LN, term loan 5% 8/4/22 (b) | | 779,827 | 767,934 |
| HUB International Ltd. Tranche B 1LN, term loan 4% 10/2/20 (b) | | 488,750 | 479,381 |
| VF Holdings Corp. Tranche B 1LN, term loan 4.75% 6/17/23 (b) | | 250,000 | 248,750 |
|
| TOTAL INSURANCE | | | 2,394,498 |
|
| Leisure - 0.7% | | | |
| 24 Hour Fitness Worldwide, Inc. Tranche B, term loan 4.75% 5/30/21 (b) | | 500,416 | 481,024 |
| LTF Merger Sub, Inc. Tranche B, term loan 4.25% 6/10/22 (b) | | 331,650 | 323,359 |
|
| TOTAL LEISURE | | | 804,383 |
|
| Metals/Mining - 1.4% | | | |
| American Rock Salt Co. LLC Tranche B 1LN, term loan 4.75% 5/20/21 (b) | | 690,900 | 645,128 |
| Doncasters Group, LLC Tranche B 1LN, term loan 4.5% 4/9/20 (b) | | 57,118 | 54,948 |
| Fortescue Metals Group Ltd. Tranche B, term loan 4.25% 6/30/19 (b) | | 294,087 | 280,853 |
| Murray Energy Corp.: | | | |
| Tranche B 1LN, term loan 7% 4/16/17 (b) | | 455,091 | 383,983 |
| Tranche B 2LN, term loan 7.5% 4/16/20 (b) | | 370,141 | 268,352 |
| Peabody Energy Corp. Tranche B, term loan 0% 9/24/20 (d) | | 124,046 | 52,357 |
| Walter Energy, Inc. Tranche B, term loan 0% 4/1/18 (d) | | 250,000 | 0 |
|
| TOTAL METALS/MINING | | | 1,685,621 |
|
| Paper - 0.4% | | | |
| Caraustar Industries, Inc. Tranche B, term loan 8% 5/1/19 (b) | | 321,798 | 320,913 |
| Xerium Technologies, Inc. Tranche B, term loan 6.25% 5/17/19 (b) | | 154,602 | 153,927 |
|
| TOTAL PAPER | | | 474,840 |
|
| Publishing/Printing - 2.9% | | | |
| Cengage Learning, Inc. Tranche B, term loan 5.25% 6/7/23 (b) | | 375,000 | 370,313 |
| Getty Images, Inc. Tranche B, term loan 4.75% 10/18/19 (b) | | 410,226 | 303,694 |
| Harland Clarke Holdings Corp. Tranche B 5LN, term loan 7% 12/31/19 (b) | | 115,000 | 111,263 |
| Houghton Mifflin Harcourt Publishing, Inc. Tranche B, term loan 4% 5/29/21 (b) | | 495,000 | 484,481 |
| JD Power & Associates Tranche B 1LN, term loan 6/9/23 (c) | | 80,000 | 79,750 |
| McGraw-Hill Global Education Holdings, LLC term loan 5% 5/4/22 (b) | | 695,000 | 693,089 |
| Merrill Communications LLC Tranche B, term loan 6.25% 6/1/22 (b) | | 407,668 | 367,920 |
| Proquest LLC Tranche B, term loan 5.75% 10/24/21 (b) | | 492,488 | 467,863 |
| Springer Science+Business Media Deutschland GmbH Tranche B 9LN, term loan 4.5% 8/14/20 (b) | | 493,130 | 473,405 |
|
| TOTAL PUBLISHING/PRINTING | | | 3,351,778 |
|
| Restaurants - 1.4% | | | |
| Burger King Worldwide, Inc. Tranche B, term loan 3.75% 12/12/21 (b) | | 751,334 | 750,019 |
| CEC Entertainment, Inc. Tranche B, term loan 4% 2/14/21 (b) | | 243,763 | 236,043 |
| Landry's Restaurants, Inc. Tranche B, term loan 4% 4/24/18 (b) | | 197,574 | 197,327 |
| Red Lobster Hospitality LLC Tranche B, term loan 6.25% 7/28/21 (b) | | 255,758 | 254,159 |
| TGI Friday's, Inc. Tranche B 1LN, term loan 5.25% 7/15/20 (b) | | 176,054 | 175,028 |
|
| TOTAL RESTAURANTS | | | 1,612,576 |
|
| Services - 8.0% | | | |
| Abacus Innovations Corp. Tranche B, term loan 6/9/23 (c) | | 250,000 | 249,583 |
| Acosta, Inc. Tranche B, term loan 4.25% 9/26/21 (b) | | 867,801 | 833,089 |
| Apollo Security Service Borrower LLC Tranche B, term loan 4.75% 5/2/22 (b) | | 700,000 | 700,875 |
| ARAMARK Corp. Tranche F, term loan 3.25% 2/24/21 (b) | | 488,750 | 488,291 |
| Brand Energy & Infrastructure Services, Inc. Tranche B, term loan 4.75% 11/26/20 (b) | | 296,797 | 288,264 |
| Cactus Wellhead LLC Tranche B, term loan 7% 7/31/20 (b) | | 244,025 | 157,396 |
| Coinmach Service Corp. Tranche B, term loan 4.25% 11/14/19 (b) | | 986,584 | 966,438 |
| Creative Artists Agency LLC Tranche B, term loan 5% 12/17/21 (b) | | 546,811 | 545,898 |
| GCA Services Group, Inc. Tranche B 1LN, term loan 5.75% 3/1/23 (b) | | 249,375 | 249,063 |
| KAR Auction Services, Inc. Tranche B 3LN, term loan 4.25% 3/9/23 (b) | | 194,512 | 194,917 |
| Karman Buyer Corp.: | | | |
| Tranche 1LN, term loan 4.25% 7/25/21 (b) | | 320,298 | 311,625 |
| Tranche 2LN, term loan 7.5% 7/25/22 (b) | | 125,000 | 115,781 |
| KC Mergersub, Inc.: | | | |
| Tranche 1LN, term loan 6% 8/13/22 (b) | | 372,188 | 367,844 |
| Tranche L 2LN, term loan 10.25% 8/13/23 (b) | | 100,000 | 96,000 |
| Laureate Education, Inc. Tranche B, term loan 5% 6/16/18 (b) | | 1,465,503 | 1,417,259 |
| Lineage Logistics Holdings, LLC. Tranche B, term loan 4.5% 4/7/21 (b) | | 489,975 | 463,026 |
| Nexeo Solutions LLC Tranche B, term loan 5.25% 6/9/23 (b) | | 85,000 | 84,858 |
| Nord Anglia Education Tranche B, term loan 5% 3/31/21 (b) | | 366,570 | 364,509 |
| Research Now Group, Inc. Tranche B 1LN, term loan 5.5% 3/18/21 (b) | | 88,875 | 86,653 |
| Science Applications International Corp. Tranche B, term loan 3.75% 5/4/22 (b) | | 233,432 | 233,287 |
| The ServiceMaster Co. Tranche B, term loan 4.25% 7/1/21 (b) | | 491,250 | 491,147 |
| Wash Multifamily Acquisition, Inc.: | | | |
| Tranche B 1LN, term loan 4.25% 5/14/22 (b) | | 420,749 | 414,089 |
| Tranche B 2LN, term loan 8% 5/14/23 (b) | | 40,000 | 39,150 |
| Western Digital Corp. Tranche B, term loan 6.25% 3/30/23 (b) | | 200,000 | 200,626 |
|
| TOTAL SERVICES | | | 9,359,668 |
|
| Steel - 0.3% | | | |
| JMC Steel Group, Inc. Tranche B, term loan 6% 6/14/21 (b) | | 375,000 | 374,374 |
| Super Retail - 4.7% | | | |
| Academy Ltd. Tranche B, term loan 5% 7/2/22 (b) | | 483,801 | 452,354 |
| Bass Pro Group LLC Tranche B, term loan 4% 6/5/20 (b) | | 372,173 | 365,430 |
| BJ's Wholesale Club, Inc. Tranche B 1LN, term loan 4.5% 9/26/19 (b) | | 478,250 | 472,956 |
| CNT Holdings III Corp. Tranche B 1LN, term loan 5.25% 1/22/23 (b) | | 249,375 | 248,647 |
| Davids Bridal, Inc. Tranche B, term loan 5.25% 10/11/19 (b) | | 247,586 | 220,661 |
| Dollar Tree, Inc. Tranche B 1LN, term loan 3.5% 7/6/22 (b) | | 171,503 | 171,253 |
| J. Crew Group, Inc. Tranche B, term loan 4% 3/5/21 (b) | | 307,983 | 209,718 |
| JC Penney Corp., Inc. Tranche B, term loan 5.25% 6/23/23 (b) | | 1,250,000 | 1,239,850 |
| Party City Holdings, Inc. Tranche B, term loan 4.25% 8/19/22 (b) | | 406,902 | 403,851 |
| PetSmart, Inc. Tranche B, term loan 4.25% 3/11/22 (b) | | 867,180 | 862,740 |
| Sears Holdings Corp. Tranche ABL, term loan 5.5% 6/30/18 (b) | | 857,373 | 815,216 |
| Sports Authority, Inc. Tranche B, term loan 7.5% 11/16/17 (b)(d) | | 328,771 | 77,261 |
|
| TOTAL SUPER RETAIL | | | 5,539,937 |
|
| Technology - 9.7% | | | |
| Avago Technologies Cayman Finance Ltd. Tranche B, term loan 4.25% 2/1/23 (b) | | 498,750 | 498,984 |
| Blue Coat Systems, Inc. Tranche B, term loan 4.5% 5/22/22 (b) | | 582,075 | 581,167 |
| BMC Software Finance, Inc. Tranche B, term loan 5% 9/10/20 (b) | | 399,650 | 353,523 |
| Ceridian HCM Holding, Inc. Tranche B 2LN, term loan 4.5% 9/15/20 (b) | | 365,276 | 352,491 |
| Computer Discount Warehouse (CDW) LLC, Tranche B, term loan 3.25% 4/29/20 (b) | | 479,805 | 479,138 |
| Datapipe, Inc. Tranche B 1LN, term loan 5.25% 3/15/19 (b) | | 489,997 | 484,485 |
| Dell International LLC: | | | |
| Tranche B 2LN, term loan 4% 4/29/20 (b) | | 865,931 | 863,091 |
| Tranche B, term loan 6/2/23 (c) | | 250,000 | 248,958 |
| Diebold, Inc. term loan 5.25% 5/6/23 (b) | | 55,000 | 54,702 |
| EIG Investors Corp. Tranche B 1LN, term loan 6% 2/9/23 (b) | | 353,216 | 330,257 |
| Epicor Software Corp. Tranche B, term loan 4.75% 6/1/22 (b) | | 371,250 | 364,174 |
| First Data Corp. Tranche B, term loan 4.2021% 7/10/22 (b) | | 500,000 | 495,000 |
| G.I. Peak Merger Sub Corp.: | | | |
| Tranche 2LN, term loan 8.25% 6/17/22 (b) | | 50,000 | 43,250 |
| Tranche B 1LN, term loan 5% 6/17/21 (b) | | 167,346 | 165,306 |
| Global Payments, Inc. Tranche B, term loan 3.9603% 4/22/23 (b) | | 235,000 | 235,999 |
| Infor U.S., Inc. Tranche B 5LN, term loan 3.75% 6/3/20 (b) | | 378,167 | 368,479 |
| Kronos, Inc.: | | | |
| Tranche 2LN, term loan 9.75% 4/30/20 (b) | | 499,447 | 501,530 |
| Tranche B 1LN, term loan 4.5% 10/30/19 (b) | | 812,812 | 809,967 |
| Lux FinCo U.S. SPV: | | | |
| Tranche 2LN, term loan 9.5% 10/16/23 (b) | | 125,000 | 118,750 |
| Tranche B 1LN, term loan 5% 10/16/22 (b) | | 253,725 | 251,822 |
| Micron Technology, Inc. Tranche B, term loan 6.64% 4/26/22 (b) | | 125,000 | 125,528 |
| Microsemi Corp. Tranche B, term loan 5.25% 1/15/23 (b) | | 108,779 | 108,440 |
| NXP BV Tranche B 2LN, term loan 3.75% 12/7/20 (b) | | 133,300 | 133,467 |
| ON Semiconductor Corp. Tranche B, term loan 5.25% 3/31/23 (b) | | 200,000 | 200,500 |
| Renaissance Learning, Inc.: | | | |
| Tranche 1LN, term loan 4.5% 4/9/21 (b) | | 610,029 | 594,015 |
| Tranche 2LN, term loan 8% 4/9/22 (b) | | 175,000 | 159,250 |
| Solarwinds Holdings, Inc. Tranche B, term loan 6.5% 2/5/23 (b) | | 250,000 | 248,125 |
| Solera LLC Tranche B, term loan 5.75% 3/3/23 (b) | | 249,688 | 249,271 |
| Sophia L.P. Tranche B, term loan 4.75% 9/30/22 (b) | | 545,999 | 538,492 |
| SS&C Technologies, Inc.: | | | |
| Tranche B 1LN, term loan 4% 7/8/22 (b) | | 208,641 | 208,424 |
| Tranche B 2LN, term loan 4% 7/8/22 (b) | | 28,549 | 28,519 |
| TTM Technologies, Inc. Tranche B 1LN, term loan 6% 5/31/21 (b) | | 664,892 | 658,244 |
| WEX, Inc. Tranche B, term loan 6/24/23 (c) | | 250,000 | 248,125 |
| WP Mustang Holdings, LLC. Tranche B 1LN, term loan 7% 5/29/21 (b) | | 311,478 | 310,179 |
|
| TOTAL TECHNOLOGY | | | 11,411,652 |
|
| Telecommunications - 4.1% | | | |
| Digicel International Finance Ltd. Tranche D 2LN, term loan 4.1309% 3/31/19 (b) | | 100,000 | 95,500 |
| FairPoint Communications, Inc. Tranche B, term loan 7.5% 2/14/19 (b) | | 245,558 | 244,586 |
| Integra Telecom Holdings, Inc.: | | | |
| term loan 9.75% 2/14/21 (b) | | 120,000 | 109,800 |
| Tranche B 1LN, term loan 5.25% 8/14/20 (b) | | 370,313 | 359,436 |
| Intelsat Jackson Holdings SA Tranche B 2LN, term loan 3.75% 6/30/19 (b) | | 1,250,000 | 1,136,563 |
| Level 3 Financing, Inc.: | | | |
| Tranche B 2LN, term loan 3.5% 5/31/22 (b) | | 250,000 | 248,875 |
| Tranche B 4LN, term loan 4% 1/15/20 (b) | | 500,000 | 499,220 |
| LTS Buyer LLC Tranche B 1LN, term loan 4% 4/11/20 (b) | | 859,838 | 849,632 |
| Mitel U.S. Holdings, Inc. Tranche B, term loan 5.5% 4/29/22 (b) | | 173,634 | 173,580 |
| Sable International Finance Ltd.: | | | |
| Tranche B 1LN, term loan 5.5% 12/31/22 (b) | | 68,750 | 68,478 |
| Tranche B 2LN, term loan 5.83% 12/31/22 (b) | | 56,250 | 56,027 |
| Securus Technologies Holdings, Inc.: | | | |
| Tranche 2LN, term loan 9% 4/30/21 (b) | | 250,000 | 222,500 |
| Tranche B 1LN, term loan 4.75% 4/30/20 (b) | | 488,695 | 460,903 |
| Telenet Financing USD LLC term loan 6/30/24 (c) | | 250,000 | 247,553 |
|
| TOTAL TELECOMMUNICATIONS | | | 4,772,653 |
|
| Textiles/Apparel - 0.3% | | | |
| Abb/Con-Cise Optical Group LLC Tranche B, term loan 6% 6/15/23 (b) | | 250,000 | 250,625 |
| Samsonite IP Holdings SARL Tranche B, term loan 4% 5/13/23 (b) | | 115,000 | 115,316 |
|
| TOTAL TEXTILES/APPAREL | | | 365,941 |
|
| Transportation Ex Air/Rail - 0.4% | | | |
| American Commercial Barge Line Tranche B 1LN, term loan 9.75% 11/12/20 (b) | | 148,125 | 136,275 |
| Navios Partners Finance (U.S.), Inc. Tranche B, term loan 5.25% 6/27/18 (b) | | 117,402 | 103,901 |
| YRC Worldwide, Inc. Tranche B, term loan 8% 2/13/19 (b) | | 192,281 | 172,572 |
|
| TOTAL TRANSPORTATION EX AIR/RAIL | | | 412,748 |
|
| Utilities - 4.7% | | | |
| Alinta Energy Finance Pty. Ltd. Tranche B, term loan: | | | |
| 6.375% 8/13/18 (b) | | 30,330 | 29,932 |
| 6.375% 8/13/19 (b) | | 456,309 | 450,322 |
| APLP Holdings LP Tranche B, term loan 6% 4/13/23 (b) | | 241,026 | 240,223 |
| Dynegy, Inc.: | | | |
| Tranche B 2LN, term loan 4% 4/23/20 (b) | | 248,718 | 243,744 |
| Tranche C, term loan 5% 6/22/23 (b) | | 500,000 | 490,940 |
| Energy Future Holdings Corp. Tranche 1LN, term loan 4.25% 12/19/16 (b) | | 115,000 | 114,713 |
| Essential Power LLC Tranche B, term loan 4.75% 8/8/19 (b) | | 605,557 | 596,474 |
| Green Energy Partners/Stonewall LLC Tranche B 1LN, term loan 6.5% 11/13/21 (b) | | 265,000 | 257,050 |
| Houston Fuel Oil Terminal Co. Tranche B, term loan 4.25% 8/19/21 (b) | | 626,061 | 602,584 |
| InterGen NV Tranche B, term loan 5.5% 6/13/20 (b) | | 734,848 | 654,015 |
| Longview Power LLC Tranche B, term loan 7% 4/13/21 (b) | | 247,500 | 215,325 |
| Moxie Patriot LLC Tranche B, term loan 6.75% 12/19/20 (b) | | 750,000 | 716,250 |
| Southcross Energy Partners LP Tranche B, term loan 5.25% 8/4/21 (b) | | 44,100 | 37,485 |
| Southcross Holdings Borrower LP Tranche B, term loan 9% 4/13/23 | | 18,358 | 15,421 |
| Tempus Public Foundation Generation Holdings LLC Tranche B, term loan 4.75% 12/31/17 (b) | | 485,409 | 461,139 |
| USIC Holdings, Inc. Tranche B, term loan 4% 7/10/20 (b) | | 235,930 | 231,212 |
| Veresen Midstream LP Tranche B, term loan 5.25% 3/31/22 (b) | | 177,750 | 171,529 |
|
| TOTAL UTILITIES | | | 5,528,358 |
|
| TOTAL BANK LOAN OBLIGATIONS | | | |
| (Cost $104,338,551) | | | 101,995,562 |
|
| Nonconvertible Bonds - 5.7% | | | |
| Banks & Thrifts - 0.2% | | | |
| Ally Financial, Inc. 3.25% 11/5/18 | | 250,000 | 249,688 |
| Containers - 1.4% | | | |
| Ardagh Packaging Finance PLC/Ardagh MP Holdings U.S.A., Inc.: | | | |
| 3.6525% 12/15/19 (b)(e) | | 1,000,000 | 1,003,750 |
| 3.8896% 5/15/21 (b)(e) | | 205,000 | 205,769 |
| Reynolds Group Issuer, Inc./Reynolds Group Issuer LLC/Reynolds Group Issuer (Luxembourg) SA: | | | |
| 4.2109% 7/15/21 (b)(e) | | 145,000 | 145,363 |
| 6.875% 2/15/21 | | 250,000 | 257,500 |
|
| TOTAL CONTAINERS | | | 1,612,382 |
|
| Diversified Financial Services - 0.4% | | | |
| AerCap Ireland Capital Ltd./AerCap Global Aviation Trust 4.625% 10/30/20 | | 320,000 | 331,760 |
| Prime Securities Services Borrower LLC/Prime Finance, Inc. 9.25% 5/15/23 (e) | | 100,000 | 106,000 |
|
| TOTAL DIVERSIFIED FINANCIAL SERVICES | | | 437,760 |
|
| Energy - 0.5% | | | |
| American Energy-Permian Basin LLC/AEPB Finance Corp. 7.1329% 8/1/19 (b)(e) | | 60,000 | 32,100 |
| Cheniere Corpus Christi Holdings LLC 7% 6/30/24 (e) | | 115,000 | 118,091 |
| Chesapeake Energy Corp. 8% 12/15/22 (e) | | 21,000 | 17,798 |
| Citgo Petroleum Corp. 6.25% 8/15/22 (e) | | 385,000 | 368,638 |
|
| TOTAL ENERGY | | | 536,627 |
|
| Gaming - 0.2% | | | |
| Paris Las Vegas Holding LLC/Harrah's Las Vegas LLC/Flamingo Las Vegas Holdings, Inc. 8% 10/1/20 | | 250,000 | 250,625 |
| Healthcare - 1.6% | | | |
| Community Health Systems, Inc. 5.125% 8/15/18 | | 125,000 | 126,798 |
| Endo Finance LLC/Endo Ltd./Endo Finco, Inc. 6% 7/15/23 (e) | | 200,000 | 175,000 |
| HCA Holdings, Inc.: | | | |
| 3.75% 3/15/19 | | 500,000 | 517,500 |
| 4.25% 10/15/19 | | 500,000 | 521,250 |
| RegionalCare Hospital Partners Holdings, Inc. 8.25% 5/1/23 (e) | | 105,000 | 107,625 |
| Tenet Healthcare Corp. 4.1525% 6/15/20 (b) | | 420,000 | 414,750 |
|
| TOTAL HEALTHCARE | | | 1,862,923 |
|
| Homebuilders/Real Estate - 0.1% | | | |
| Communications Sales & Leasing, Inc. 6% 4/15/23 (e) | | 100,000 | 101,750 |
| Publishing/Printing - 0.0% | | | |
| Cenveo Corp. 6% 8/1/19 (e) | | 40,000 | 33,200 |
| Services - 0.2% | | | |
| APX Group, Inc. 7.875% 12/1/22 (e) | | 275,000 | 277,063 |
| Super Retail - 0.1% | | | |
| JC Penney Corp., Inc. 5.875% 7/1/23 (e) | | 80,000 | 80,500 |
| Technology - 0.4% | | | |
| Diamond 1 Finance Corp./Diamond 2 Finance Corp.: | | | |
| 3.48% 6/1/19 (e) | | 78,000 | 79,904 |
| 4.42% 6/15/21 (e) | | 235,000 | 241,534 |
| NXP BV/NXP Funding LLC 4.125% 6/1/21 (e) | | 200,000 | 203,000 |
|
| TOTAL TECHNOLOGY | | | 524,438 |
|
| Telecommunications - 0.6% | | | |
| Altice Financing SA 7.5% 5/15/26 (e) | | 225,000 | 220,500 |
| FairPoint Communications, Inc. 8.75% 8/15/19 (e) | | 40,000 | 39,400 |
| Numericable Group SA 7.375% 5/1/26 (e) | | 485,000 | 479,544 |
|
| TOTAL TELECOMMUNICATIONS | | | 739,444 |
|
| Utilities - 0.0% | | | |
| The AES Corp. 3.6731% 6/1/19 (b) | | 15,000 | 14,963 |
| TOTAL NONCONVERTIBLE BONDS | | | |
| (Cost $6,733,056) | | | 6,721,363 |
| | | Shares | Value |
|
| Common Stocks - 0.0% | | | |
| Metals/Mining - 0.0% | | | |
| Warrior Met Coal LLC Class A (f) | | 121 | 9,680 |
| Utilities - 0.0% | | | |
| Southcross Holdings Borrower LP | | 21 | 15,572 |
| TOTAL COMMON STOCKS | | | |
| (Cost $249,563) | | | 25,252 |
|
| Money Market Funds - 10.5% | | | |
| Fidelity Cash Central Fund, 0.43% (g) | | | |
| (Cost $12,293,813) | | 12,293,813 | 12,293,813 |
| TOTAL INVESTMENT PORTFOLIO - 103.0% | | | |
| (Cost $123,614,983) | | | 121,035,990 |
| NET OTHER ASSETS (LIABILITIES) - (3.0)% | | | (3,580,749) |
| NET ASSETS - 100% | | | $117,455,241 |
Legend
(a) Remaining maturities of bank loan obligations may be less than the stated maturities shown as a result of contractual or optional prepayments by the borrower. Such prepayments cannot be predicted with certainty.
(b) Coupon rates for floating and adjustable rate securities reflect the rates in effect at period end.
(c) The coupon rate will be determined upon settlement of the loan after period end.
(d) Non-income producing - Security is in default.
(e) Security exempt from registration under Rule 144A of the Securities Act of 1933. These securities may be resold in transactions exempt from registration, normally to qualified institutional buyers. At the end of the period, the value of these securities amounted to $4,036,529 or 3.4% of net assets.
(f) Restricted securities - Investment in securities not registered under the Securities Act of 1933 (excluding 144A issues). At the end of the period, the value of restricted securities (excluding 144A issues) amounted to $9,680 or 0.0% of net assets.
(g) Affiliated fund that is generally available only to investment companies and other accounts managed by Fidelity Investments. The rate quoted is the annualized seven-day yield of the fund at period end. A complete unaudited listing of the fund's holdings as of its most recent quarter end is available upon request. In addition, each Fidelity Central Fund's financial statements are available on the SEC's website or upon request.
Additional information on each restricted holding is as follows:
| Security | Acquisition Date | Acquisition Cost |
| Warrior Met Coal LLC Class A | 9/17/14 | $232,500 |
Affiliated Central Funds
Information regarding fiscal year to date income earned by the Fund from investments in Fidelity Central Funds is as follows:
| Fund | Income earned |
| Fidelity Cash Central Fund | $21,713 |
| Total | $21,713 |
Investment Valuation
The following is a summary of the inputs used, as of June 30, 2016, involving the Fund's assets and liabilities carried at fair value. The inputs or methodology used for valuing securities may not be an indication of the risk associated with investing in those securities. For more information on valuation inputs, and their aggregation into the levels used below, please refer to the Investment Valuation section in the accompanying Notes to Financial Statements.
| | Valuation Inputs at Reporting Date: |
| Description | Total | Level 1 | Level 2 | Level 3 |
| Investments in Securities: | | | | |
| Equities: | | | | |
| Energy | $9,680 | $-- | $-- | $9,680 |
| Utilities | 15,572 | -- | -- | 15,572 |
| Bank Loan Obligations | 101,995,562 | -- | 101,884,641 | 110,921 |
| Corporate Bonds | 6,721,363 | -- | 6,721,363 | -- |
| Money Market Funds | 12,293,813 | 12,293,813 | -- | -- |
| Total Investments in Securities: | $121,035,990 | $12,293,813 | $108,606,004 | $136,173 |
See accompanying notes which are an integral part of the financial statements.
Financial Statements
Statement of Assets and Liabilities
| | | June 30, 2016 (Unaudited) |
| Assets | | |
Investment in securities, at value — See accompanying schedule:
Unaffiliated issuers (cost $111,321,170) | $108,742,177 | |
| Fidelity Central Funds (cost $12,293,813) | 12,293,813 | |
| Total Investments (cost $123,614,983) | | $121,035,990 |
| Cash | | 305,704 |
| Receivable for investments sold | | 803,834 |
| Interest receivable | | 697,470 |
| Distributions receivable from Fidelity Central Funds | | 5,080 |
| Total assets | | 122,848,078 |
| Liabilities | | |
| Payable for investments purchased | $5,157,874 | |
| Payable for fund shares redeemed | 125,978 | |
| Accrued management fee | 54,999 | |
| Other affiliated payables | 14,654 | |
| Other payables and accrued expenses | 39,332 | |
| Total liabilities | | 5,392,837 |
| Net Assets | | $117,455,241 |
| Net Assets consist of: | | |
| Paid in capital | | $121,135,354 |
| Undistributed net investment income | | 2,499,526 |
| Accumulated undistributed net realized gain (loss) on investments | | (3,600,646) |
| Net unrealized appreciation (depreciation) on investments | | (2,578,993) |
| Net Assets | | $117,455,241 |
| Initial Class: | | |
| Net Asset Value, offering price and redemption price per share ($6,326,971 ÷ 649,773 shares) | | $9.74 |
| Investor Class: | | |
| Net Asset Value, offering price and redemption price per share ($111,128,270 ÷ 11,413,495 shares) | | $9.74 |
See accompanying notes which are an integral part of the financial statements.
Statement of Operations
| | | Six months ended June 30, 2016 (Unaudited) |
| Investment Income | | |
| Interest | | $2,788,209 |
| Income from Fidelity Central Funds | | 21,713 |
| Total income | | 2,809,922 |
| Expenses | | |
| Management fee | $313,971 | |
| Transfer agent fees | 55,947 | |
| Accounting fees and expenses | 27,543 | |
| Custodian fees and expenses | 7,620 | |
| Independent trustees' fees and expenses | 246 | |
| Audit | 31,084 | |
| Legal | 1,889 | |
| Miscellaneous | 336 | |
| Total expenses before reductions | 438,636 | |
| Expense reductions | (264) | 438,372 |
| Net investment income (loss) | | 2,371,550 |
| Realized and Unrealized Gain (Loss) | | |
| Net realized gain (loss) on: | | |
| Investment securities: | | |
| Unaffiliated issuers | (1,589,854) | |
| Total net realized gain (loss) | | (1,589,854) |
| Change in net unrealized appreciation (depreciation) on investment securities | | 3,797,668 |
| Net gain (loss) | | 2,207,814 |
| Net increase (decrease) in net assets resulting from operations | | $4,579,364 |
See accompanying notes which are an integral part of the financial statements.
Statement of Changes in Net Assets
| | Six months ended June 30, 2016 (Unaudited) | Year ended December 31, 2015 |
| Increase (Decrease) in Net Assets | | |
| Operations | | |
| Net investment income (loss) | $2,371,550 | $4,543,809 |
| Net realized gain (loss) | (1,589,854) | (1,488,772) |
| Change in net unrealized appreciation (depreciation) | 3,797,668 | (3,685,640) |
| Net increase (decrease) in net assets resulting from operations | 4,579,364 | (630,603) |
| Distributions to shareholders from net investment income | – | (4,320,742) |
| Distributions to shareholders from tax return of capital | – | (278,899) |
| Total distributions | – | (4,599,641) |
| Share transactions - net increase (decrease) | (1,125,738) | 13,019,049 |
| Total increase (decrease) in net assets | 3,453,626 | 7,788,805 |
| Net Assets | | |
| Beginning of period | 114,001,615 | 106,212,810 |
| End of period | $117,455,241 | $114,001,615 |
| Other Information | | |
| Undistributed net investment income end of period | $2,499,526 | $127,976 |
See accompanying notes which are an integral part of the financial statements.
Financial Highlights — VIP Floating Rate High Income Portfolio Initial Class
| | Six months ended (Unaudited) June 30, | Years ended December 31, | |
| | 2016 | 2015 | 2014 A |
| Selected Per–Share Data | | | |
| Net asset value, beginning of period | $9.34 | $9.73 | $10.00 |
| Income from Investment Operations | | | |
| Net investment income (loss)B | .203 | .400 | .242 |
| Net realized and unrealized gain (loss) | .197 | (.408) | (.322) |
| Total from investment operations | .400 | (.008) | (.080) |
| Distributions from net investment income | – | (.359) | (.190) |
| Tax return of capital | – | (.023) | – |
| Total distributions | – | (.382) | (.190) |
| Net asset value, end of period | $9.74 | $9.34 | $9.73 |
| Total ReturnC,D,E | 4.28% | (.09)% | (.79)% |
| Ratios to Average Net AssetsF,G | | | |
| Expenses before reductions | .76%H | .76% | .84%H |
| Expenses net of fee waivers, if any | .76%H | .76% | .77%H |
| Expenses net of all reductions | .75%H | .76% | .77%H |
| Net investment income (loss) | 4.29%H | 4.03% | 3.31%H |
| Supplemental Data | | | |
| Net assets, end of period (000 omitted) | $6,327 | $7,326 | $10,912 |
| Portfolio turnover rateI | 47%H | 55% | 41%H |
A For the period April 9, 2014 (commencement of operations) to December 31, 2014.
B Calculated based on average shares outstanding during the period.
C Total returns for periods of less than one year are not annualized.
D Total returns do not reflect charges attributable to your insurance company's separate account. Inclusion of these charges would reduce the total returns shown.
E Total returns would have been lower if certain expenses had not been reduced during the applicable periods shown.
F Fees and expenses of any underlying Fidelity Central Funds are not included in the Fund's expense ratio. The Fund indirectly bears its proportionate share of the expenses of any underlying Fidelity Central Funds.
G Expense ratios reflect operating expenses of the class. Expenses before reductions do not reflect amounts reimbursed by the investment adviser or reductions from expense offset arrangements and do not represent the amount paid by the class during periods when reimbursements or reductions occur. Expense ratios before reductions for start-up periods may not be representative of longer-term operating periods. Expenses net of fee waivers reflect expenses after reimbursement by the investment adviser but prior to reductions from expense offset arrangements. Expenses net of all reductions represent the net expenses paid by the class.
H Annualized
I Amount does not include the portfolio activity of any underlying Fidelity Central Funds.
See accompanying notes which are an integral part of the financial statements.
Financial Highlights — VIP Floating Rate High Income Portfolio Investor Class
| | Six months ended (Unaudited) June 30, | Years ended December 31, | |
| | 2016 | 2015 | 2014 A |
| Selected Per–Share Data | | | |
| Net asset value, beginning of period | $9.34 | $9.73 | $10.00 |
| Income from Investment Operations | | | |
| Net investment income (loss)B | .201 | .394 | .238 |
| Net realized and unrealized gain (loss) | .199 | (.402) | (.322) |
| Total from investment operations | .400 | (.008) | (.084) |
| Distributions from net investment income | – | (.359) | (.186) |
| Tax return of capital | – | (.023) | – |
| Total distributions | – | (.382) | (.186) |
| Net asset value, end of period | $9.74 | $9.34 | $9.73 |
| Total ReturnC,D,E | 4.28% | (.09)% | (.83)% |
| Ratios to Average Net AssetsF,G | | | |
| Expenses before reductions | .79%H | .79% | .82%H |
| Expenses net of fee waivers, if any | .79%H | .79% | .80%H |
| Expenses net of all reductions | .79%H | .79% | .80%H |
| Net investment income (loss) | 4.26%H | 3.99% | 3.28%H |
| Supplemental Data | | | |
| Net assets, end of period (000 omitted) | $111,128 | $106,675 | $95,300 |
| Portfolio turnover rateI | 47%H | 55% | 41%H |
A For the period April 9, 2014 (commencement of operations) to December 31, 2014.
B Calculated based on average shares outstanding during the period.
C Total returns for periods of less than one year are not annualized.
D Total returns do not reflect charges attributable to your insurance company's separate account. Inclusion of these charges would reduce the total returns shown.
E Total returns would have been lower if certain expenses had not been reduced during the applicable periods shown.
F Fees and expenses of any underlying Fidelity Central Funds are not included in the Fund's expense ratio. The Fund indirectly bears its proportionate share of the expenses of any underlying Fidelity Central Funds.
G Expense ratios reflect operating expenses of the class. Expenses before reductions do not reflect amounts reimbursed by the investment adviser or reductions from expense offset arrangements and do not represent the amount paid by the class during periods when reimbursements or reductions occur. Expense ratios before reductions for start-up periods may not be representative of longer-term operating periods. Expenses net of fee waivers reflect expenses after reimbursement by the investment adviser but prior to reductions from expense offset arrangements. Expenses net of all reductions represent the net expenses paid by the class.
H Annualized
I Amount does not include the portfolio activity of any underlying Fidelity Central Funds.
See accompanying notes which are an integral part of the financial statements.
Notes to Financial Statements (Unaudited)
For the period ended June 30, 2016
1. Organization.
VIP Floating Rate High Income Portfolio (the Fund) is a fund of Variable Insurance Products Fund (the Trust) and is authorized to issue an unlimited number of shares. The Trust is registered under the Investment Company Act of 1940, as amended (the 1940 Act), as an open-end management investment company organized as a Massachusetts business trust. Shares of the Fund may only be purchased by insurance companies for the purpose of funding variable annuity or variable life insurance contracts. The Fund offers the following classes of shares: Initial Class shares and Investor Class shares. All classes have equal rights and voting privileges, except for matters affecting a single class.
2. Investments in Fidelity Central Funds.
The Fund invests in Fidelity Central Funds, which are open-end investment companies generally available only to other investment companies and accounts managed by the investment adviser and its affiliates. The Fund's Schedule of Investments lists each of the Fidelity Central Funds held as of period end, if any, as an investment of the Fund, but does not include the underlying holdings of each Fidelity Central Fund. As an Investing Fund, the Fund indirectly bears its proportionate share of the expenses of the underlying Fidelity Central Funds.
The Money Market Central Funds seek preservation of capital and current income and are managed by Fidelity Investments Money Management, Inc. (FIMM), an affiliate of the investment adviser. Annualized expenses of the Money Market Central Funds as of their most recent shareholder report date are less than .005%.
A complete unaudited list of holdings for each Fidelity Central Fund is available upon request or at the Securities and Exchange Commission (the SEC) website at www.sec.gov. In addition, the financial statements of the Fidelity Central Funds are available on the SEC website or upon request.
3. Significant Accounting Policies.
The financial statements have been prepared in conformity with accounting principles generally accepted in the United States of America (GAAP), which require management to make certain estimates and assumptions at the date of the financial statements. Actual results could differ from those estimates. Subsequent events, if any, through the date that the financial statements were issued have been evaluated in the preparation of the financial statements. The following summarizes the significant accounting policies of the Fund:
Investment Valuation. Investments are valued as of 4:00 p.m. Eastern time on the last calendar day of the period. The Board of Trustees (the Board) has delegated the day to day responsibility for the valuation of the Fund's investments to the Fidelity Management & Research Company (FMR) Fair Value Committee (the Committee). In accordance with valuation policies and procedures approved by the Board, the Fund attempts to obtain prices from one or more third party pricing vendors or brokers to value its investments. When current market prices, quotations or currency exchange rates are not readily available or reliable, investments will be fair valued in good faith by the Committee, in accordance with procedures adopted by the Board. Factors used in determining fair value vary by investment type and may include market or investment specific events, changes in interest rates and credit quality. The frequency with which these procedures are used cannot be predicted and they may be utilized to a significant extent. The Committee oversees the Fund's valuation policies and procedures and reports to the Board on the Committee's activities and fair value determinations. The Board monitors the appropriateness of the procedures used in valuing the Fund's investments and ratifies the fair value determinations of the Committee.
The Fund categorizes the inputs to valuation techniques used to value its investments into a disclosure hierarchy consisting of three levels as shown below:
- Level 1 – quoted prices in active markets for identical investments
- Level 2 – other significant observable inputs (including quoted prices for similar investments, interest rates, prepayment speeds, etc.)
- Level 3 – unobservable inputs (including the Fund's own assumptions based on the best information available)
Valuation techniques used to value the Fund's investments by major category are as follows:
Debt securities, including restricted securities, are valued based on evaluated prices received from third party pricing vendors or from brokers who make markets in such securities. Corporate bonds and bank loan obligations are valued by pricing vendors who utilize matrix pricing which considers yield or price of bonds of comparable quality, coupon, maturity and type or by broker-supplied prices. When independent prices are unavailable or unreliable, debt securities may be valued utilizing pricing methodologies which consider similar factors that would be used by third party pricing vendors. Debt securities are generally categorized as Level 2 in the hierarchy but may be Level 3 depending on the circumstances. The Fund invests a significant portion of its assets in below investment grade securities. The value of these securities can be more volatile due to changes in the credit quality of the issuer and is sensitive to changes in economic, market and regulatory conditions.
Equity securities, including restricted securities, for which market quotations are readily available, are valued at the last reported sale price or official closing price as reported by a third party pricing vendor on the primary market or exchange on which they are traded and are categorized as Level 1 in the hierarchy. In the event there were no sales during the day or closing prices are not available, securities are valued at the last quoted bid price or may be valued using the last available price and are generally categorized as Level 2 in the hierarchy. For equity securities, including restricted securities, where observable inputs are limited, assumptions about market activity and risk are used and these securities may be categorized as Level 3 in the hierarchy.
Investments in open-end mutual funds, including the Fidelity Central Funds, are valued at their closing net asset value (NAV) each business day and are categorized as Level 1 in the hierarchy.
Changes in valuation techniques may result in transfers in or out of an assigned level within the disclosure hierarchy. The aggregate value of investments by input level as of June 30, 2016 is included at the end of the Fund's Schedule of Investments.
Investment Transactions and Income. For financial reporting purposes, the Fund's investment holdings and NAV include trades executed through the end of the last business day of the period. The NAV per share for processing shareholder transactions is calculated as of the close of business of the New York Stock Exchange (NYSE), normally 4:00 p.m. Eastern time and includes trades executed through the end of the prior business day. Gains and losses on securities sold are determined on the basis of identified cost. Income and capital gain distributions from Fidelity Central Funds, if any, are recorded on the ex-dividend date. Interest income is accrued as earned and includes coupon interest and amortization of premium and accretion of discount on debt securities as applicable. Debt obligations may be placed on non-accrual status and related interest income may be reduced by ceasing current accruals and writing off interest receivables when the collection of all or a portion of interest has become doubtful based on consistently applied procedures. A debt obligation is removed from non-accrual status when the issuer resumes interest payments or when collectability of interest is reasonably assured.
Class Allocations and Expenses. Investment income, realized and unrealized capital gains and losses, common expenses of the Fund, and certain fund-level expense reductions, if any, are allocated daily on a pro-rata basis to each class based on the relative net assets of each class to the total net assets of the Fund. Each class differs with respect to transfer agent fees incurred. Certain expense reductions may also differ by class. For the reporting period, the allocated portion of income and expenses to each class as a percent of its average net assets may vary due to the timing of recording these transactions in relation to fluctuating net assets of the classes. Expenses directly attributable to a fund are charged to that fund. Expenses attributable to more than one fund are allocated among the respective funds on the basis of relative net assets or other appropriate methods. Expense estimates are accrued in the period to which they relate and adjustments are made when actual amounts are known.
Income Tax Information and Distributions to Shareholders. Each year, the Fund intends to qualify as a regulated investment company under Subchapter M of the Internal Revenue Code, including distributing substantially all of its taxable income and realized gains. As a result, no provision for U.S. Federal income taxes is required. The Fund files a U.S. federal tax return, in addition to state and local tax returns as required. The Fund's federal income tax returns are subject to examination by the Internal Revenue Service (IRS) for a period of three fiscal years after they are filed. State and local tax returns may be subject to examination for an additional fiscal year depending on the jurisdiction.
Distributions are declared and recorded on the ex-dividend date. Income dividends and capital gain distributions are declared separately for each class. Income and capital gain distributions are determined in accordance with income tax regulations, which may differ from GAAP.
Capital accounts within the financial statements are adjusted for permanent book-tax differences. These adjustments have no impact on net assets or the results of operations. Capital accounts are not adjusted for temporary book-tax differences which will reverse in a subsequent period.
Book-tax differences are primarily due to market discount, capital loss carryforwards, losses deferred due to wash sales and tax return of capital distribution.
The federal tax cost of investment securities and unrealized appreciation (depreciation) as of period end were as follows:
| Gross unrealized appreciation | $472,198 |
| Gross unrealized depreciation | (3,163,414) |
| Net unrealized appreciation (depreciation) on securities | $(2,691,216) |
| Tax cost | $123,727,206 |
Capital loss carryforwards are only available to offset future capital gains of the Fund to the extent provided by regulations and may be limited. Under the Regulated Investment Company Modernization Act of 2010 (the Act), the Fund is permitted to carry forward capital losses incurred in taxable years beginning after December 22, 2010 for an unlimited period and such capital losses are required to be used prior to any losses that expire. The capital loss carryforward information presented below, including any applicable limitation, is estimated as of prior fiscal period end and is subject to adjustment.
| Fiscal year of expiration | |
| No expiration | |
| Short-term | $(1,216,059) |
| Long-term | (780,269) |
| Total capital loss carryforward | $(1,996,328) |
Restricted Securities. The Fund may invest in securities that are subject to legal or contractual restrictions on resale. These securities generally may be resold in transactions exempt from registration or to the public if the securities are registered. Disposal of these securities may involve time-consuming negotiations and expense, and prompt sale at an acceptable price may be difficult. Information regarding restricted securities is included at the end of the Fund's Schedule of Investments.
Loans and Other Direct Debt Instruments. The Fund invests in direct debt instruments which are interests in amounts owed to lenders by corporate or other borrowers. These instruments may be in the form of loans, trade claims or other receivables and may include standby financing commitments such as revolving credit facilities that obligate the Fund to supply additional cash to the borrower on demand. Loans may be acquired through assignment or participation. The Fund did not have any unfunded loan commitments, which are contractual obligations for future funding, at period end.
4. Purchase and Sales of Investments.
Purchases and sales of securities (including principal repayments of bank loan obligations), other than short-term securities, aggregated $29,601,046 and $23,723,307, respectively.
5. Fees and Other Transactions with Affiliates.
Management Fee. Fidelity Management & Research Company (the investment adviser) and its affiliates provide the Fund with investment management related services for which the Fund pays a monthly management fee. The management fee is the sum of an individual fund fee rate that is based on an annual rate of .45% of the Fund's average net assets and an annualized group fee rate that averaged .11% during the period. The group fee rate is based upon the average net assets of all the mutual funds advised by the investment adviser, including any mutual funds previously advised by the investment adviser that are currently advised by Fidelity SelectCo, LLC, an affiliate of the investment adviser. The group fee rate decreases as assets under management increase and increases as assets under management decrease. For the reporting period, the total annualized management fee rate was .56% of the Fund's average net assets.
Transfer Agent Fees. Fidelity Investments Institutional Operations Company, Inc. (FIIOC), an affiliate of the investment adviser, is the Fund's transfer, dividend disbursing, and shareholder servicing agent. FIIOC receives an asset-based fee with respect to each class. Each class (with the exception of Investor Class) pays a fee for transfer agent services, typesetting, and printing and mailing of shareholder reports, excluding mailing of proxy statements, equal to an annual rate of .07% (.10% for Investor Class) of class-level average net assets. For the period, transfer agent fees for each class were as follows:
| Initial Class | $2,310 |
| Investor Class | 53,637 |
| | $55,947 |
Accounting Fees. Fidelity Service Company, Inc. (FSC), an affiliate of the investment adviser, maintains the Fund's accounting records. The fee is based on the level of average net assets for each month.
Interfund Trades. The Fund may purchase from or sell securities to other Fidelity Funds under procedures adopted by the Board. The procedures have been designed to ensure these interfund trades are executed in accordance with Rule 17a-7 of the 1940 Act. Interfund trades are included within the respective purchases and sales amounts shown in the Purchases and Sales of Investments note.
6. Committed Line of Credit.
The Fund participates with other funds managed by the investment adviser or an affiliate in a $4.25 billion credit facility (the "line of credit") to be utilized for temporary or emergency purposes to fund shareholder redemptions or for other short-term liquidity purposes. The Fund has agreed to pay commitment fees on its pro-rata portion of the line of credit, which amounted to $77 and is reflected in Miscellaneous expenses on the Statement of Operations. During the period, the Fund did not borrow on this line of credit.
7. Expense Reductions.
Through arrangements with the Fund's custodian, credits realized as a result of certain uninvested cash balances were used to reduce the Fund's expenses. During the period, these credits reduced the Fund's custody expenses by $28.
In addition, during the period the investment adviser reimbursed and/or waived a portion of fund-level operating expenses in the amount of $236.
8. Distributions to Shareholders.
Distributions to shareholders of each class were as follows:
| | Six months ended
June 30, 2016 | Year ended December 31, 2015 |
| From net investment income | | |
| Initial Class | $– | $296,942 |
| Investor Class | – | 4,023,800 |
| Total | $– | $4,320,742 |
| Tax Return of Capital | | |
| Initial Class | $– | $19,168 |
| Investor Class | – | 259,731 |
| Total | $– | $278,899 |
9. Share Transactions.
Transactions for each class of shares were as follows:
| | Shares | Shares | Dollars | Dollars |
| | Six months ended
June 30, 2016 | Year ended December 31, 2015 | Six months ended
June 30, 2016 | Year ended December 31, 2015 |
| Initial Class | | | | |
| Shares sold | 86,575 | 455,195 | $823,844 | $4,513,876 |
| Reinvestment of distributions | – | 33,773 | – | 316,118 |
| Shares redeemed | (221,521) | (825,496) | (2,105,099) | (8,145,575) |
| Net increase (decrease) | (134,946) | (336,528) | $(1,281,255) | $(3,315,581) |
| Investor Class | | | | |
| Shares sold | 1,381,983 | 5,810,167 | $13,259,447 | $57,815,256 |
| Reinvestment of distributions | – | 457,641 | – | 4,283,523 |
| Shares redeemed | (1,393,590) | (4,632,862) | (13,103,930) | (45,764,149) |
| Net increase (decrease) | (11,607) | 1,634,946 | $155,517 | $16,334,630 |
10. Other.
The Fund's organizational documents provide former and current trustees and officers with a limited indemnification against liabilities arising in connection with the performance of their duties to the Fund. In the normal course of business, the Fund may also enter into contracts that provide general indemnifications. The Fund's maximum exposure under these arrangements is unknown as this would be dependent on future claims that may be made against the Fund. The risk of material loss from such claims is considered remote.
At the end of the period, the investment adviser or its affiliates were the owners of record of 100% of the total outstanding shares of the Fund.
Shareholder Expense Example
As a shareholder of the Fund, you incur two types of costs: (1) transaction costs, and (2) ongoing costs including management fees and other Fund expenses. This Example is intended to help you understand your ongoing costs (in dollars) of investing in the Fund and to compare these costs with the ongoing costs of investing in other mutual funds.
The Example is based on an investment of $1,000 invested at the beginning of the period and held for the entire period (January 1, 2016 to June 30, 2016).
Actual Expenses
The first line of the accompanying table for each class of the Fund provides information about actual account values and actual expenses. You may use the information in this line, together with the amount you invested, to estimate the expenses that you paid over the period. Simply divide your account value by $1,000.00 (for example, an $8,600 account value divided by $1,000.00 = 8.6), then multiply the result by the number in the first line for a class of the Fund under the heading entitled "Expenses Paid During Period" to estimate the expenses you paid on your account during this period. The estimate of expenses does not include any fees or other expenses of any variable annuity or variable life insurance product. If they were, the estimate of expenses you paid during the period would be higher, and your ending account value would be lower. In addition, the Fund, as a shareholder in the underlying Fidelity Central Funds, will indirectly bear its pro-rata share of the fees and expenses incurred by the underlying Fidelity Central Funds. These fees and expenses are not included in the Fund's annualized expense ratio used to calculate the expense estimate in the table below.
Hypothetical Example for Comparison Purposes
The second line of the accompanying table for each class of the Fund provides information about hypothetical account values and hypothetical expenses based on a Class' actual expense ratio and an assumed rate of return of 5% per year before expenses, which is not the Class' actual return. The hypothetical account values and expenses may not be used to estimate the actual ending account balance or expenses you paid for the period. You may use this information to compare the ongoing costs of investing in the Fund and other funds. To do so, compare this 5% hypothetical example with the 5% hypothetical examples that appear in the shareholder reports of the other funds. The estimate of expenses does not include any fees or other expenses of any variable annuity or variable life insurance product. If they were, the estimate of expenses you paid during the period would be higher, and your ending account value would be lower. In addition, the Fund, as a shareholder in the underlying Fidelity Central Funds, will indirectly bear its pro-rata share of the fees and expenses incurred by the underlying Fidelity Central Funds. These fees and expenses are not included in the Fund's annualized expense ratio used to calculate the expense estimate in the table below.
Please note that the expenses shown in the table are meant to highlight your ongoing costs only and do not reflect any transaction costs. Therefore, the second line of the table is useful in comparing ongoing costs only, and will not help you determine the relative total costs of owning different funds.
| | Annualized Expense Ratio-A | Beginning
Account Value
January 1, 2016 | Ending
Account Value
June 30, 2016 | Expenses Paid
During Period-B
January 1, 2016
to June 30, 2016 |
| Initial Class | .76% | | | |
| Actual | | $1,000.00 | $1,042.80 | $3.86 |
| Hypothetical-C | | $1,000.00 | $1,021.08 | $3.82 |
| Investor Class | .79% | | | |
| Actual | | $1,000.00 | $1,042.80 | $4.01 |
| Hypothetical-C | | $1,000.00 | $1,020.93 | $3.97 |
A Annualized expense ratio reflects expenses net of applicable fee waivers.
B Expenses are equal to each Class' annualized expense ratio, multiplied by the average account value over the period, multiplied by 182/366 (to reflect the one-half year period).
C 5% return per year before expenses
VIPFHI-SANN-0816
1.9859332.102
Fidelity® Variable Insurance Products: Growth Portfolio
Semi-Annual Report June 30, 2016 |
|
Contents
To view a fund's proxy voting guidelines and proxy voting record for the 12-month period ended June 30, visit http://www.fidelity.com/proxyvotingresults or visit the Securities and Exchange Commission's (SEC) web site at http://www.sec.gov.
You may also call 1-877-208-0098 to request a free copy of the proxy voting guidelines.
Fidelity® Variable Insurance Products are separate account options which are purchased through a variable insurance contract.
Standard & Poor's, S&P and S&P 500 are registered service marks of The McGraw-Hill Companies, Inc. and have been licensed for use by Fidelity Distributors Corporation.
Other third-party marks appearing herein are the property of their respective owners.
All other marks appearing herein are registered or unregistered trademarks or service marks of FMR LLC or an affiliated company. © 2016 FMR LLC. All rights reserved.
This report and the financial statements contained herein are submitted for the general information of the shareholders of the Fund. This report is not authorized for distribution to prospective investors in the Fund unless preceded or accompanied by an effective prospectus.
A fund files its complete schedule of portfolio holdings with the SEC for the first and third quarters of each fiscal year on Form N-Q. Forms N-Q are available on the SEC’s web site at http://www.sec.gov. A fund's Forms N-Q may be reviewed and copied at the SEC’s Public Reference Room in Washington, DC. Information regarding the operation of the SEC's Public Reference Room may be obtained by calling 1-800-SEC-0330.
For a complete list of a fund's portfolio holdings, view the most recent holdings listing, semiannual report, or annual report on Fidelity's web site at http://www.fidelity.com, http://www.institutional.fidelity.com, or http://www.401k.com, as applicable.
NOT FDIC INSURED •MAY LOSE VALUE •NO BANK GUARANTEE
Neither the Fund nor Fidelity Distributors Corporation is a bank.
Investment Summary (Unaudited)
Top Ten Stocks as of June 30, 2016
| | % of fund's net assets | % of fund's net assets 6 months ago |
| Facebook, Inc. Class A | 12.7 | 11.5 |
| Alphabet, Inc. Class A | 7.8 | 7.2 |
| Gilead Sciences, Inc. | 3.3 | 4.2 |
| Amazon.com, Inc. | 3.2 | 2.8 |
| Salesforce.com, Inc. | 2.8 | 2.6 |
| Danaher Corp. | 2.6 | 2.2 |
| Home Depot, Inc. | 2.5 | 2.4 |
| Electronic Arts, Inc. | 2.3 | 1.9 |
| Alphabet, Inc. Class C | 2.1 | 1.1 |
| Starbucks Corp. | 2.0 | 2.5 |
| | 41.3 | |
Top Five Market Sectors as of June 30, 2016
| | % of fund's net assets | % of fund's net assets 6 months ago |
| Information Technology | 38.4 | 41.6 |
| Consumer Discretionary | 16.2 | 16.6 |
| Health Care | 13.2 | 16.5 |
| Industrials | 9.7 | 9.3 |
| Financials | 7.9 | 6.3 |
Asset Allocation (% of fund's net assets)
| As of June 30, 2016 * |
| | Stocks | 95.2% |
| | Short-Term Investments and Net Other Assets (Liabilities) | 4.8% |

* Foreign investments - 8.3%
| As of December 31, 2015 * |
| | Stocks | 93.7% |
| | Short-Term Investments and Net Other Assets (Liabilities) | 6.3% |

* Foreign investments - 15.6%
Investments June 30, 2016 (Unaudited)
Showing Percentage of Net Assets
| Common Stocks - 94.3% | | | |
| | | Shares | Value |
| CONSUMER DISCRETIONARY - 16.1% | | | |
| Automobiles - 1.9% | | | |
| Tesla Motors, Inc. (a) | | 406,100 | $86,206,908 |
| Diversified Consumer Services - 0.8% | | | |
| Bright Horizons Family Solutions, Inc. (a) | | 284,800 | 18,885,088 |
| Houghton Mifflin Harcourt Co. (a) | | 379,400 | 5,930,022 |
| Nord Anglia Education, Inc. (a) | | 420,668 | 8,892,922 |
| | | | 33,708,032 |
| Hotels, Restaurants & Leisure - 3.7% | | | |
| Buffalo Wild Wings, Inc. (a) | | 21,700 | 3,015,215 |
| Dave & Buster's Entertainment, Inc. (a) | | 463,932 | 21,707,378 |
| Domino's Pizza, Inc. | | 259,100 | 34,040,558 |
| Jubilant Foodworks Ltd. | | 89,939 | 1,518,900 |
| Popeyes Louisiana Kitchen, Inc. (a) | | 196,400 | 10,731,296 |
| Starbucks Corp. | | 1,586,346 | 90,612,084 |
| Wingstop, Inc. (b) | | 97,100 | 2,645,975 |
| | | | 164,271,406 |
| Household Durables - 0.6% | | | |
| Harman International Industries, Inc. | | 338,800 | 24,332,616 |
| Internet & Catalog Retail - 3.7% | | | |
| Amazon.com, Inc. (a) | | 199,000 | 142,408,380 |
| Liberty Interactive Corp. (Venture Group) Series A (a) | | 105,420 | 3,907,919 |
| Netflix, Inc. (a) | | 141,000 | 12,898,680 |
| NutriSystem, Inc. | | 209,300 | 5,307,848 |
| | | | 164,522,827 |
| Leisure Products - 0.0% | | | |
| NJOY, Inc. (a)(c) | | 243,618 | 9,818 |
| Media - 0.8% | | | |
| Charter Communications, Inc. Class A | | 103,100 | 23,572,784 |
| Sirius XM Holdings, Inc. (a) | | 2,726,500 | 10,769,675 |
| | | | 34,342,459 |
| Specialty Retail - 4.0% | | | |
| AutoZone, Inc. (a) | | 36,700 | 29,133,928 |
| Five Below, Inc. (a) | | 214,408 | 9,950,675 |
| Home Depot, Inc. | | 888,132 | 113,405,575 |
| Lowe's Companies, Inc. | | 261,100 | 20,671,287 |
| MarineMax, Inc. (a) | | 358,000 | 6,075,260 |
| | | | 179,236,725 |
| Textiles, Apparel & Luxury Goods - 0.6% | | | |
| Kate Spade & Co. (a) | | 1,394,300 | 28,736,523 |
|
| TOTAL CONSUMER DISCRETIONARY | | | 715,367,314 |
|
| CONSUMER STAPLES - 7.0% | | | |
| Beverages - 2.8% | | | |
| Constellation Brands, Inc. Class A (sub. vtg.) | | 119,200 | 19,715,680 |
| Kweichow Moutai Co. Ltd. | | 110,770 | 4,870,632 |
| Molson Coors Brewing Co. Class B | | 347,200 | 35,112,336 |
| The Coca-Cola Co. | | 1,437,538 | 65,163,598 |
| | | | 124,862,246 |
| Food & Staples Retailing - 0.9% | | | |
| CVS Health Corp. | | 278,700 | 26,682,738 |
| Whole Foods Market, Inc. | | 427,766 | 13,697,067 |
| | | | 40,379,805 |
| Household Products - 0.5% | | | |
| Procter & Gamble Co. | | 272,300 | 23,055,641 |
| Personal Products - 0.9% | | | |
| Avon Products, Inc. | | 726,400 | 2,745,792 |
| Estee Lauder Companies, Inc. Class A | | 244,500 | 22,254,390 |
| Herbalife Ltd. (a) | | 261,355 | 15,297,108 |
| | | | 40,297,290 |
| Tobacco - 1.9% | | | |
| Reynolds American, Inc. | | 1,573,300 | 84,848,069 |
|
| TOTAL CONSUMER STAPLES | | | 313,443,051 |
|
| ENERGY - 1.0% | | | |
| Oil, Gas & Consumable Fuels - 1.0% | | | |
| Anadarko Petroleum Corp. | | 674,400 | 35,911,800 |
| Golar LNG Ltd. (b) | | 447,017 | 6,928,764 |
| | | | 42,840,564 |
| FINANCIALS - 7.9% | | | |
| Banks - 1.0% | | | |
| First Republic Bank | | 517,700 | 36,233,823 |
| HDFC Bank Ltd. | | 117,289 | 2,376,926 |
| M&T Bank Corp. | | 43,400 | 5,131,182 |
| | | | 43,741,931 |
| Capital Markets - 1.4% | | | |
| BlackRock, Inc. Class A | | 71,606 | 24,527,203 |
| E*TRADE Financial Corp. (a) | | 1,450,993 | 34,083,826 |
| JMP Group, Inc. | | 240,100 | 1,303,743 |
| PJT Partners, Inc. (b) | | 37,346 | 858,958 |
| | | | 60,773,730 |
| Diversified Financial Services - 2.6% | | | |
| Berkshire Hathaway, Inc. Class B (a) | | 95,400 | 13,812,966 |
| CME Group, Inc. | | 536,497 | 52,254,808 |
| MSCI, Inc. Class A | | 323,100 | 24,917,472 |
| S&P Global, Inc. | | 228,613 | 24,521,030 |
| | | | 115,506,276 |
| Insurance - 0.4% | | | |
| Marsh & McLennan Companies, Inc. | | 299,700 | 20,517,462 |
| Real Estate Investment Trusts - 1.0% | | | |
| American Tower Corp. | | 388,900 | 44,182,929 |
| Real Estate Management & Development - 1.3% | | | |
| Realogy Holdings Corp. (a) | | 2,078,301 | 60,312,295 |
| Thrifts & Mortgage Finance - 0.2% | | | |
| Essent Group Ltd. (a) | | 392,000 | 8,549,520 |
|
| TOTAL FINANCIALS | | | 353,584,143 |
|
| HEALTH CARE - 13.2% | | | |
| Biotechnology - 8.5% | | | |
| Amgen, Inc. | | 299,300 | 45,538,495 |
| BioMarin Pharmaceutical, Inc. (a) | | 277,025 | 21,552,545 |
| Cytokinetics, Inc. (a) | | 97,090 | 921,384 |
| Cytokinetics, Inc. warrants 6/25/17 (a) | | 1,084,980 | 799,891 |
| Gilead Sciences, Inc. | | 1,777,990 | 148,319,926 |
| Insmed, Inc. (a) | | 1,318,402 | 12,999,444 |
| Medivation, Inc. (a) | | 1,070,700 | 64,563,210 |
| Regeneron Pharmaceuticals, Inc. (a) | | 72,400 | 25,284,252 |
| TESARO, Inc. (a) | | 114,900 | 9,657,345 |
| Vertex Pharmaceuticals, Inc. (a) | | 592,300 | 50,949,646 |
| | | | 380,586,138 |
| Health Care Equipment & Supplies - 2.7% | | | |
| Boston Scientific Corp. (a) | | 1,417,600 | 33,129,312 |
| Edwards Lifesciences Corp. (a) | | 178,900 | 17,841,697 |
| Intuitive Surgical, Inc. (a) | | 21,500 | 14,220,315 |
| Medtronic PLC | | 346,800 | 30,091,836 |
| Novadaq Technologies, Inc. (a) | | 983,500 | 9,677,640 |
| ResMed, Inc. | | 232,300 | 14,688,329 |
| | | | 119,649,129 |
| Health Care Providers & Services - 0.1% | | | |
| HealthEquity, Inc. (a) | | 48,900 | 1,485,827 |
| HealthSouth Corp. warrants 1/17/17 (a) | | 1,014 | 1,714 |
| VCA, Inc. (a) | | 41,200 | 2,785,532 |
| | | | 4,273,073 |
| Pharmaceuticals - 1.9% | | | |
| Astellas Pharma, Inc. | | 5,252,700 | 82,374,642 |
| Collegium Pharmaceutical, Inc. (a) | | 117,100 | 1,387,635 |
| | | | 83,762,277 |
|
| TOTAL HEALTH CARE | | | 588,270,617 |
|
| INDUSTRIALS - 9.7% | | | |
| Aerospace & Defense - 1.2% | | | |
| Honeywell International, Inc. | | 317,100 | 36,885,072 |
| TransDigm Group, Inc. (a) | | 56,096 | 14,791,954 |
| | | | 51,677,026 |
| Airlines - 0.7% | | | |
| Ryanair Holdings PLC sponsored ADR | | 449,067 | 31,228,119 |
| Building Products - 0.7% | | | |
| A.O. Smith Corp. | | 232,918 | 20,522,405 |
| Caesarstone Sdot-Yam Ltd. (a) | | 311,722 | 10,835,457 |
| | | | 31,357,862 |
| Commercial Services & Supplies - 0.7% | | | |
| KAR Auction Services, Inc. | | 776,300 | 32,402,762 |
| Electrical Equipment - 0.6% | | | |
| Acuity Brands, Inc. | | 89,000 | 22,068,440 |
| AMETEK, Inc. | | 103,500 | 4,784,805 |
| | | | 26,853,245 |
| Industrial Conglomerates - 3.1% | | | |
| Danaher Corp. | | 1,155,426 | 116,698,026 |
| Roper Technologies, Inc. | | 125,417 | 21,391,124 |
| | | | 138,089,150 |
| Machinery - 0.0% | | | |
| Rational AG | | 900 | 416,511 |
| Professional Services - 2.4% | | | |
| Equifax, Inc. | | 216,900 | 27,849,960 |
| Resources Connection, Inc. | | 381,955 | 5,645,295 |
| Robert Half International, Inc. | | 492,000 | 18,774,720 |
| TransUnion Holding Co., Inc. | | 145,500 | 4,865,520 |
| WageWorks, Inc. (a) | | 794,629 | 47,526,760 |
| | | | 104,662,255 |
| Road & Rail - 0.0% | | | |
| Swift Transporation Co. (a) | | 97,200 | 1,497,852 |
| Trading Companies & Distributors - 0.3% | | | |
| HD Supply Holdings, Inc. (a) | | 379,400 | 13,210,708 |
|
| TOTAL INDUSTRIALS | | | 431,395,490 |
|
| INFORMATION TECHNOLOGY - 37.6% | | | |
| Electronic Equipment & Components - 0.2% | | | |
| CDW Corp. | | 168,300 | 6,745,464 |
| Internet Software & Services - 23.8% | | | |
| Alibaba Group Holding Ltd. sponsored ADR (a) | | 310,300 | 24,678,159 |
| Alphabet, Inc.: | | | |
| Class A | | 493,998 | 347,542,413 |
| Class C (a) | | 134,362 | 92,991,940 |
| Facebook, Inc. Class A (a) | | 4,933,909 | 563,847,118 |
| GoDaddy, Inc. (a) | | 350,559 | 10,933,935 |
| Just Dial Ltd. | | 237,392 | 2,156,462 |
| JUST EAT Ltd. (a) | | 1,293,803 | 7,385,724 |
| Shopify, Inc. Class A (a) | | 68,700 | 2,113,212 |
| Stamps.com, Inc. (a) | | 79,859 | 6,981,274 |
| | | | 1,058,630,237 |
| IT Services - 2.5% | | | |
| Gartner, Inc. Class A (a) | | 116,000 | 11,299,560 |
| Global Payments, Inc. | | 518,100 | 36,981,978 |
| Visa, Inc. Class A | | 867,872 | 64,370,066 |
| | | | 112,651,604 |
| Semiconductors & Semiconductor Equipment - 0.8% | | | |
| Maxim Integrated Products, Inc. | | 470,387 | 16,788,112 |
| Monolithic Power Systems, Inc. | | 277,688 | 18,971,644 |
| | | | 35,759,756 |
| Software - 10.3% | | | |
| Activision Blizzard, Inc. | | 435,932 | 17,275,985 |
| Adobe Systems, Inc. (a) | | 612,600 | 58,680,954 |
| Computer Modelling Group Ltd. | | 926,000 | 7,411,154 |
| CyberArk Software Ltd. (a)(b) | | 154,100 | 7,487,719 |
| Electronic Arts, Inc. (a) | | 1,380,021 | 104,550,391 |
| Fleetmatics Group PLC (a) | | 216,000 | 9,359,280 |
| Intuit, Inc. | | 94,800 | 10,580,628 |
| Mobileye NV (a)(b) | | 1,892,492 | 87,319,581 |
| Red Hat, Inc. (a) | | 419,900 | 30,484,740 |
| Salesforce.com, Inc. (a) | | 1,590,862 | 126,330,351 |
| | | | 459,480,783 |
|
| TOTAL INFORMATION TECHNOLOGY | | | 1,673,267,844 |
|
| MATERIALS - 1.6% | | | |
| Chemicals - 1.5% | | | |
| Albemarle Corp. U.S. | | 839,000 | 66,541,090 |
| Metals & Mining - 0.1% | | | |
| Orocobre Ltd. (a) | | 681,866 | 2,448,877 |
|
| TOTAL MATERIALS | | | 68,989,967 |
|
| TELECOMMUNICATION SERVICES - 0.2% | | | |
| Diversified Telecommunication Services - 0.2% | | | |
| SBA Communications Corp. Class A (a) | | 91,500 | 9,876,510 |
| TOTAL COMMON STOCKS | | | |
| (Cost $3,027,224,937) | | | 4,197,035,500 |
|
| Convertible Preferred Stocks - 0.9% | | | |
| CONSUMER DISCRETIONARY - 0.1% | | | |
| Household Durables - 0.1% | | | |
| Blu Homes, Inc. Series A, 5.00% (a)(c) | | 1,049,416 | 4,281,617 |
| INFORMATION TECHNOLOGY - 0.8% | | | |
| Internet Software & Services - 0.7% | | | |
| Uber Technologies, Inc. Series D, 8.00% (a)(c) | | 636,240 | 31,030,842 |
| IT Services - 0.1% | | | |
| AppNexus, Inc. Series E (a)(c) | | 181,657 | 3,051,838 |
|
| TOTAL INFORMATION TECHNOLOGY | | | 34,082,680 |
|
| TOTAL CONVERTIBLE PREFERRED STOCKS | | | |
| (Cost $18,357,314) | | | 38,364,297 |
|
| Money Market Funds - 6.0% | | | |
| Fidelity Cash Central Fund, 0.43% (d) | | 199,313,761 | 199,313,761 |
| Fidelity Securities Lending Cash Central Fund, 0.46% (d)(e) | | 67,314,030 | 67,314,030 |
| TOTAL MONEY MARKET FUNDS | | | |
| (Cost $266,627,791) | | | 266,627,791 |
| TOTAL INVESTMENT PORTFOLIO - 101.2% | | | |
| (Cost $3,312,210,042) | | | 4,502,027,588 |
| NET OTHER ASSETS (LIABILITIES) - (1.2)% | | | (51,477,690) |
| NET ASSETS - 100% | | | $4,450,549,898 |
Legend
(a) Non-income producing
(b) Security or a portion of the security is on loan at period end.
(c) Restricted securities - Investment in securities not registered under the Securities Act of 1933 (excluding 144A issues). At the end of the period, the value of restricted securities (excluding 144A issues) amounted to $38,374,115 or 0.9% of net assets.
(d) Affiliated fund that is generally available only to investment companies and other accounts managed by Fidelity Investments. The rate quoted is the annualized seven-day yield of the fund at period end. A complete unaudited listing of the fund's holdings as of its most recent quarter end is available upon request. In addition, each Fidelity Central Fund's financial statements are available on the SEC's website or upon request.
(e) Investment made with cash collateral received from securities on loan.
Additional information on each restricted holding is as follows:
| Security | Acquisition Date | Acquisition Cost |
| AppNexus, Inc. Series E | 8/1/14 | $3,638,989 |
| Blu Homes, Inc. Series A, 5.00% | 6/21/13 | $4,848,302 |
| NJOY, Inc. | 9/11/13 | $1,968,433 |
| Uber Technologies, Inc. Series D, 8.00% | 6/6/14 | $9,870,023 |
Affiliated Central Funds
Information regarding fiscal year to date income earned by the Fund from investments in Fidelity Central Funds is as follows:
| Fund | Income earned |
| Fidelity Cash Central Fund | $405,632 |
| Fidelity Securities Lending Cash Central Fund | 397,712 |
| Total | $803,344 |
Investment Valuation
The following is a summary of the inputs used, as of June 30, 2016, involving the Fund's assets and liabilities carried at fair value. The inputs or methodology used for valuing securities may not be an indication of the risk associated with investing in those securities. For more information on valuation inputs, and their aggregation into the levels used below, please refer to the Investment Valuation section in the accompanying Notes to Financial Statements.
| | Valuation Inputs at Reporting Date: |
| Description | Total | Level 1 | Level 2 | Level 3 |
| Investments in Securities: | | | | |
| Equities: | | | | |
| Consumer Discretionary | $719,648,931 | $713,838,596 | $1,518,900 | $4,291,435 |
| Consumer Staples | 313,443,051 | 308,572,419 | 4,870,632 | -- |
| Energy | 42,840,564 | 42,840,564 | -- | -- |
| Financials | 353,584,143 | 351,207,217 | 2,376,926 | -- |
| Health Care | 588,270,617 | 505,096,084 | 83,174,533 | -- |
| Industrials | 431,395,490 | 430,978,979 | 416,511 | -- |
| Information Technology | 1,707,350,524 | 1,663,725,658 | 9,542,186 | 34,082,680 |
| Materials | 68,989,967 | 66,541,090 | 2,448,877 | -- |
| Telecommunication Services | 9,876,510 | 9,876,510 | -- | -- |
| Money Market Funds | 266,627,791 | 266,627,791 | -- | -- |
| Total Investments in Securities: | $4,502,027,588 | $4,359,304,908 | $104,348,565 | $38,374,115 |
See accompanying notes which are an integral part of the financial statements.
Financial Statements
Statement of Assets and Liabilities
| | | June 30, 2016 (Unaudited) |
| Assets | | |
Investment in securities, at value (including securities loaned of $70,871,828) — See accompanying schedule:
Unaffiliated issuers (cost $3,045,582,251) | $4,235,399,797 | |
| Fidelity Central Funds (cost $266,627,791) | 266,627,791 | |
| Total Investments (cost $3,312,210,042) | | $4,502,027,588 |
| Receivable for investments sold | | 36,431,582 |
| Receivable for fund shares sold | | 492,913 |
| Dividends receivable | | 2,195,110 |
| Distributions receivable from Fidelity Central Funds | | 132,012 |
| Other receivables | | 381,119 |
| Total assets | | 4,541,660,324 |
| Liabilities | | |
| Payable for investments purchased | $12,759,931 | |
| Payable for fund shares redeemed | 8,195,888 | |
| Accrued management fee | 2,049,062 | |
| Distribution and service plan fees payable | 222,498 | |
| Other affiliated payables | 357,892 | |
| Other payables and accrued expenses | 211,125 | |
| Collateral on securities loaned, at value | 67,314,030 | |
| Total liabilities | | 91,110,426 |
| Net Assets | | $4,450,549,898 |
| Net Assets consist of: | | |
| Paid in capital | | $3,352,483,405 |
| Undistributed net investment income | | 1,124,879 |
| Accumulated undistributed net realized gain (loss) on investments and foreign currency transactions | | (92,875,910) |
| Net unrealized appreciation (depreciation) on investments and assets and liabilities in foreign currencies | | 1,189,817,524 |
| Net Assets | | $4,450,549,898 |
| Initial Class: | | |
| Net Asset Value, offering price and redemption price per share ($2,802,041,400 ÷ 49,102,187 shares) | | $57.07 |
| Service Class: | | |
| Net Asset Value, offering price and redemption price per share ($488,621,380 ÷ 8,591,979 shares) | | $56.87 |
| Service Class 2: | | |
| Net Asset Value, offering price and redemption price per share ($862,890,027 ÷ 15,332,165 shares) | | $56.28 |
| Investor Class: | | |
| Net Asset Value, offering price and redemption price per share ($296,997,091 ÷ 5,224,397 shares) | | $56.85 |
See accompanying notes which are an integral part of the financial statements.
Statement of Operations
| | | Six months ended June 30, 2016 (Unaudited) |
| Investment Income | | |
| Dividends | | $16,151,744 |
| Income from Fidelity Central Funds | | 803,344 |
| Total income | | 16,955,088 |
| Expenses | | |
| Management fee | $12,203,714 | |
| Transfer agent fees | 1,584,154 | |
| Distribution and service plan fees | 1,317,079 | |
| Accounting and security lending fees | 535,481 | |
| Custodian fees and expenses | 57,013 | |
| Independent trustees' fees and expenses | 10,095 | |
| Depreciation in deferred trustee compensation account | (188) | |
| Audit | 40,192 | |
| Legal | 4,042 | |
| Miscellaneous | 19,568 | |
| Total expenses before reductions | 15,771,150 | |
| Expense reductions | (109,863) | 15,661,287 |
| Net investment income (loss) | | 1,293,801 |
| Realized and Unrealized Gain (Loss) | | |
| Net realized gain (loss) on: | | |
| Investment securities: | | |
| Unaffiliated issuers | (80,336,866) | |
| Foreign currency transactions | (2,138) | |
| Total net realized gain (loss) | | (80,339,004) |
Change in net unrealized appreciation (depreciation) on:
Investment securities | (77,397,473) | |
| Assets and liabilities in foreign currencies | (22) | |
| Total change in net unrealized appreciation (depreciation) | | (77,397,495) |
| Net gain (loss) | | (157,736,499) |
| Net increase (decrease) in net assets resulting from operations | | $(156,442,698) |
See accompanying notes which are an integral part of the financial statements.
Statement of Changes in Net Assets
| | Six months ended June 30, 2016 (Unaudited) | Year ended December 31, 2015 |
| Increase (Decrease) in Net Assets | | |
| Operations | | |
| Net investment income (loss) | $1,293,801 | $10,937,658 |
| Net realized gain (loss) | (80,339,004) | 435,701,581 |
| Change in net unrealized appreciation (depreciation) | (77,397,495) | (112,813,977) |
| Net increase (decrease) in net assets resulting from operations | (156,442,698) | 333,825,262 |
| Distributions to shareholders from net investment income | – | (9,674,651) |
| Distributions to shareholders from net realized gain | (440,759,902) | (149,807,636) |
| Total distributions | (440,759,902) | (159,482,287) |
| Share transactions - net increase (decrease) | 207,916,298 | (152,738,757) |
| Redemption fees | – | 9,639 |
| Total increase (decrease) in net assets | (389,286,302) | 21,613,857 |
| Net Assets | | |
| Beginning of period | 4,839,836,200 | 4,818,222,343 |
| End of period | $4,450,549,898 | $4,839,836,200 |
| Other Information | | |
| Undistributed net investment income end of period | $1,124,879 | $– |
| Distributions in excess of net investment income end of period | $– | $(168,922) |
See accompanying notes which are an integral part of the financial statements.
Financial Highlights — VIP Growth Portfolio Initial Class
| | Six months ended (Unaudited) June 30, | Years ended December 31, | | | | |
| | 2016 | 2015 | 2014 | 2013 | 2012 | 2011 |
| Selected Per–Share Data | | | | | | |
| Net asset value, beginning of period | $65.75 | $63.48 | $57.14 | $42.05 | $36.89 | $37.09 |
| Income from Investment Operations | | | | | | |
| Net investment income (loss)A | .03 | .19 | .20 | .14 | .26 | .14 |
| Net realized and unrealized gain (loss) | (2.65) | 4.24 | 6.26 | 15.13 | 5.16 | (.06) |
| Total from investment operations | (2.62) | 4.43 | 6.46 | 15.27 | 5.42 | .08 |
| Distributions from net investment income | – | (.17) | (.12) | (.15) | (.26) | (.15)B |
| Distributions from net realized gain | (6.06) | (1.98) | – | (.04) | – | (.12)B |
| Total distributions | (6.06) | (2.16)C | (.12) | (.18)D | (.26) | (.28)E |
| Redemption fees added to paid in capitalA | – | –F | –F | –F | –F | –F |
| Net asset value, end of period | $57.07 | $65.75 | $63.48 | $57.14 | $42.05 | $36.89 |
| Total ReturnG,H,I | (3.04)% | 7.17% | 11.30% | 36.34% | 14.69% | .20% |
| Ratios to Average Net AssetsJ,K | | | | | | |
| Expenses before reductions | .65%L | .64% | .65% | .66% | .66% | .66% |
| Expenses net of fee waivers, if any | .64%L | .64% | .65% | .65% | .66% | .66% |
| Expenses net of all reductions | .64%L | .64% | .64% | .65% | .65% | .66% |
| Net investment income (loss) | .12%L | .29% | .34% | .28% | .64% | .36% |
| Supplemental Data | | | | | | |
| Net assets, end of period (000 omitted) | $2,802,041 | $3,045,732 | $3,143,666 | $3,179,928 | $2,613,977 | $2,583,122 |
| Portfolio turnover rateM | 50%L | 63% | 46% | 74% | 68% | 71% |
A Calculated based on average shares outstanding during the period.
B The amounts shown reflect certain reclassifications related to book to tax differences that were made in the year shown.
C Total distributions of $2.16 per share is comprised of distributions from net investment income of $.171 and distributions from net realized gain of $1.984 per share.
D Total distributions of $.18 per share is comprised of distributions from net investment income of $.147 and distributions from net realized gain of $.035 per share.
E Total distributions of $.28 per share is comprised of distributions from net investment income of $.152 and distributions from net realized gain of $.123 per share.
F Amount represents less than $.005 per share.
G Total returns for periods of less than one year are not annualized.
H Total returns do not reflect charges attributable to your insurance company's separate account. Inclusion of these charges would reduce the total returns shown.
I Total returns would have been lower if certain expenses had not been reduced during the applicable periods shown.
J Fees and expenses of any underlying Fidelity Central Funds are not included in the Fund's expense ratio. The Fund indirectly bears its proportionate share of the expenses of any underlying Fidelity Central Funds.
K Expense ratios reflect operating expenses of the class. Expenses before reductions do not reflect amounts reimbursed by the investment adviser or reductions from brokerage service arrangements or reductions from other expense offset arrangements and do not represent the amount paid by the class during periods when reimbursements or reductions occur. Expenses net of fee waivers reflect expenses after reimbursement by the investment adviser but prior to reductions from brokerage service arrangements or other expense offset arrangements. Expenses net of all reductions represent the net expenses paid by the class.
L Annualized
M Amount does not include the portfolio activity of any underlying Fidelity Central Funds.
See accompanying notes which are an integral part of the financial statements.
Financial Highlights — VIP Growth Portfolio Service Class
| | Six months ended (Unaudited) June 30, | Years ended December 31, | | | | |
| | 2016 | 2015 | 2014 | 2013 | 2012 | 2011 |
| Selected Per–Share Data | | | | | | |
| Net asset value, beginning of period | $65.57 | $63.32 | $57.00 | $41.95 | $36.81 | $36.99 |
| Income from Investment Operations | | | | | | |
| Net investment income (loss)A | .01 | .12 | .14 | .09 | .22 | .10 |
| Net realized and unrealized gain (loss) | (2.65) | 4.22 | 6.24 | 15.09 | 5.13 | (.05) |
| Total from investment operations | (2.64) | 4.34 | 6.38 | 15.18 | 5.35 | .05 |
| Distributions from net investment income | – | (.11) | (.06) | (.10) | (.21) | (.11)B |
| Distributions from net realized gain | (6.06) | (1.98) | – | (.04) | – | (.12)B |
| Total distributions | (6.06) | (2.09) | (.06) | (.13)C | (.21) | (.23) |
| Redemption fees added to paid in capitalA | – | –D | –D | –D | –D | –D |
| Net asset value, end of period | $56.87 | $65.57 | $63.32 | $57.00 | $41.95 | $36.81 |
| Total ReturnE,F,G | (3.09)% | 7.05% | 11.19% | 36.20% | 14.54% | .14% |
| Ratios to Average Net AssetsH,I | | | | | | |
| Expenses before reductions | .75%J | .74% | .75% | .76% | .76% | .77% |
| Expenses net of fee waivers, if any | .74%J | .74% | .75% | .75% | .76% | .76% |
| Expenses net of all reductions | .74%J | .74% | .74% | .75% | .75% | .76% |
| Net investment income (loss) | .02%J | .19% | .24% | .18% | .54% | .26% |
| Supplemental Data | | | | | | |
| Net assets, end of period (000 omitted) | $488,621 | $527,178 | $521,455 | $491,959 | $395,589 | $395,217 |
| Portfolio turnover rateK | 50%J | 63% | 46% | 74% | 68% | 71% |
A Calculated based on average shares outstanding during the period.
B The amounts shown reflect certain reclassifications related to book to tax differences that were made in the year shown.
C Total distributions of $.13 per share is comprised of distributions from net investment income of $.097 and distributions from net realized gain of $.035 per share.
D Amount represents less than $.005 per share.
E Total returns for periods of less than one year are not annualized.
F Total returns do not reflect charges attributable to your insurance company's separate account. Inclusion of these charges would reduce the total returns shown.
G Total returns would have been lower if certain expenses had not been reduced during the applicable periods shown.
H Fees and expenses of any underlying Fidelity Central Funds are not included in the Fund's expense ratio. The Fund indirectly bears its proportionate share of the expenses of any underlying Fidelity Central Funds.
I Expense ratios reflect operating expenses of the class. Expenses before reductions do not reflect amounts reimbursed by the investment adviser or reductions from brokerage service arrangements or reductions from other expense offset arrangements and do not represent the amount paid by the class during periods when reimbursements or reductions occur. Expenses net of fee waivers reflect expenses after reimbursement by the investment adviser but prior to reductions from brokerage service arrangements or other expense offset arrangements. Expenses net of all reductions represent the net expenses paid by the class.
J Annualized
K Amount does not include the portfolio activity of any underlying Fidelity Central Funds.
See accompanying notes which are an integral part of the financial statements.
Financial Highlights — VIP Growth Portfolio Service Class 2
| | Six months ended (Unaudited) June 30, | Years ended December 31, | | | | |
| | 2016 | 2015 | 2014 | 2013 | 2012 | 2011 |
| Selected Per–Share Data | | | | | | |
| Net asset value, beginning of period | $65.01 | $62.80 | $56.57 | $41.64 | $36.53 | $36.72 |
| Income from Investment Operations | | | | | | |
| Net investment income (loss)A | (.04) | .02 | .05 | .01 | .16 | .04 |
| Net realized and unrealized gain (loss) | (2.63) | 4.20 | 6.18 | 14.98 | 5.10 | (.05) |
| Total from investment operations | (2.67) | 4.22 | 6.23 | 14.99 | 5.26 | (.01) |
| Distributions from net investment income | – | (.02) | – | (.02) | (.15) | (.06)B |
| Distributions from net realized gain | (6.06) | (1.98) | – | (.04) | – | (.12)B |
| Total distributions | (6.06) | (2.01)C | – | (.06) | (.15) | (.18) |
| Redemption fees added to paid in capitalA | – | –D | –D | –D | –D | –D |
| Net asset value, end of period | $56.28 | $65.01 | $62.80 | $56.57 | $41.64 | $36.53 |
| Total ReturnE,F,G | (3.17)% | 6.90% | 11.01% | 36.00% | 14.40% | (.03)% |
| Ratios to Average Net AssetsH,I | | | | | | |
| Expenses before reductions | .90%J | .89% | .90% | .91% | .91% | .92% |
| Expenses net of fee waivers, if any | .89%J | .89% | .90% | .90% | .91% | .91% |
| Expenses net of all reductions | .89%J | .89% | .89% | .90% | .90% | .91% |
| Net investment income (loss) | (.13)%J | .04% | .09% | .03% | .39% | .11% |
| Supplemental Data | | | | | | |
| Net assets, end of period (000 omitted) | $862,890 | $958,371 | $845,165 | $739,551 | $592,407 | $590,556 |
| Portfolio turnover rateK | 50%J | 63% | 46% | 74% | 68% | 71% |
A Calculated based on average shares outstanding during the period.
B The amounts shown reflect certain reclassifications related to book to tax differences that were made in the year shown.
C Total distributions of $2.01 per share is comprised of distributions from net investment income of $.021 and distributions from net realized gain of $1.984 per share.
D Amount represents less than $.005 per share.
E Total returns for periods of less than one year are not annualized.
F Total returns do not reflect charges attributable to your insurance company's separate account. Inclusion of these charges would reduce the total returns shown.
G Total returns would have been lower if certain expenses had not been reduced during the applicable periods shown.
H Fees and expenses of any underlying Fidelity Central Funds are not included in the Fund's expense ratio. The Fund indirectly bears its proportionate share of the expenses of any underlying Fidelity Central Funds.
I Expense ratios reflect operating expenses of the class. Expenses before reductions do not reflect amounts reimbursed by the investment adviser or reductions from brokerage service arrangements or reductions from other expense offset arrangements and do not represent the amount paid by the class during periods when reimbursements or reductions occur. Expenses net of fee waivers reflect expenses after reimbursement by the investment adviser but prior to reductions from brokerage service arrangements or other expense offset arrangements. Expenses net of all reductions represent the net expenses paid by the class.
J Annualized
K Amount does not include the portfolio activity of any underlying Fidelity Central Funds.
See accompanying notes which are an integral part of the financial statements.
Financial Highlights — VIP Growth Portfolio Investor Class
| | Six months ended (Unaudited) June 30, | Years ended December 31, | | | | |
| | 2016 | 2015 | 2014 | 2013 | 2012 | 2011 |
| Selected Per–Share Data | | | | | | |
| Net asset value, beginning of period | $65.55 | $63.30 | $56.99 | $41.95 | $36.81 | $37.00 |
| Income from Investment Operations | | | | | | |
| Net investment income (loss)A | .01 | .13 | .15 | .10 | .23 | .10 |
| Net realized and unrealized gain (loss) | (2.65) | 4.23 | 6.24 | 15.09 | 5.13 | (.05) |
| Total from investment operations | (2.64) | 4.36 | 6.39 | 15.19 | 5.36 | .05 |
| Distributions from net investment income | – | (.13) | (.08) | (.11) | (.22) | (.12)B |
| Distributions from net realized gain | (6.06) | (1.98) | – | (.04) | – | (.12)B |
| Total distributions | (6.06) | (2.11) | (.08) | (.15) | (.22) | (.24) |
| Redemption fees added to paid in capitalA | – | –C | –C | –C | –C | –C |
| Net asset value, end of period | $56.85 | $65.55 | $63.30 | $56.99 | $41.95 | $36.81 |
| Total ReturnD,E,F | (3.09)% | 7.09% | 11.20% | 36.22% | 14.58% | .14% |
| Ratios to Average Net AssetsG,H | | | | | | |
| Expenses before reductions | .73%I | .72% | .73% | .74% | .75% | .75% |
| Expenses net of fee waivers, if any | .73%I | .72% | .73% | .73% | .75% | .75% |
| Expenses net of all reductions | .72%I | .72% | .73% | .73% | .74% | .74% |
| Net investment income (loss) | .04%I | .21% | .25% | .20% | .55% | .27% |
| Supplemental Data | | | | | | |
| Net assets, end of period (000 omitted) | $296,997 | $308,555 | $269,599 | $214,067 | $143,005 | $126,551 |
| Portfolio turnover rateJ | 50%I | 63% | 46% | 74% | 68% | 71% |
A Calculated based on average shares outstanding during the period.
B The amounts shown reflect certain reclassifications related to book to tax differences that were made in the year shown.
C Amount represents less than $.005 per share.
D Total returns for periods of less than one year are not annualized.
E Total returns do not reflect charges attributable to your insurance company's separate account. Inclusion of these charges would reduce the total returns shown.
F Total returns would have been lower if certain expenses had not been reduced during the applicable periods shown.
G Fees and expenses of any underlying Fidelity Central Funds are not included in the Fund's expense ratio. The Fund indirectly bears its proportionate share of the expenses of any underlying Fidelity Central Funds.
H Expense ratios reflect operating expenses of the class. Expenses before reductions do not reflect amounts reimbursed by the investment adviser or reductions from brokerage service arrangements or reductions from other expense offset arrangements and do not represent the amount paid by the class during periods when reimbursements or reductions occur. Expenses net of fee waivers reflect expenses after reimbursement by the investment adviser but prior to reductions from brokerage service arrangements or other expense offset arrangements. Expenses net of all reductions represent the net expenses paid by the class.
I Annualized
J Amount does not include the portfolio activity of any underlying Fidelity Central Funds.
See accompanying notes which are an integral part of the financial statements.
Notes to Financial Statements (Unaudited)
For the period ended June 30, 2016
1. Organization.
VIP Growth Portfolio (the Fund) is a fund of Variable Insurance Products Fund (the Trust) and is authorized to issue an unlimited number of shares. The Trust is registered under the Investment Company Act of 1940, as amended (the 1940 Act), as an open-end management investment company organized as a Massachusetts business trust. Shares of the Fund may only be purchased by insurance companies for the purpose of funding variable annuity or variable life insurance contracts. The Fund offers the following classes of shares: Initial Class shares, Service Class shares, Service Class 2 shares and Investor Class shares. The Fund offered Service Class 2R shares during the period April 24, 2002 through April 30, 2015, and all outstanding shares were converted to Service Class 2 shares by April 30, 2015. All classes have equal rights and voting privileges, except for matters affecting a single class.
2. Investments in Fidelity Central Funds.
The Fund invests in Fidelity Central Funds, which are open-end investment companies generally available only to other investment companies and accounts managed by the investment adviser and its affiliates. The Fund's Schedule of Investments lists each of the Fidelity Central Funds held as of period end, if any, as an investment of the Fund, but does not include the underlying holdings of each Fidelity Central Fund. As an Investing Fund, the Fund indirectly bears its proportionate share of the expenses of the underlying Fidelity Central Funds.
The Money Market Central Funds seek preservation of capital and current income and are managed by Fidelity Investments Money Management, Inc. (FIMM), an affiliate of the investment adviser. Annualized expenses of the Money Market Central Funds as of their most recent shareholder report date are less than .005%.
A complete unaudited list of holdings for each Fidelity Central Fund is available upon request or at the Securities and Exchange Commission (the SEC) website at www.sec.gov. In addition, the financial statements of the Fidelity Central Funds are available on the SEC website or upon request.
3. Significant Accounting Policies.
The financial statements have been prepared in conformity with accounting principles generally accepted in the United States of America (GAAP), which require management to make certain estimates and assumptions at the date of the financial statements. Actual results could differ from those estimates. Subsequent events, if any, through the date that the financial statements were issued have been evaluated in the preparation of the financial statements. The following summarizes the significant accounting policies of the Fund:
Investment Valuation. Investments are valued as of 4:00 p.m. Eastern time on the last calendar day of the period. The Board of Trustees (the Board) has delegated the day to day responsibility for the valuation of the Fund's investments to the Fidelity Management & Research Company (FMR) Fair Value Committee (the Committee). In accordance with valuation policies and procedures approved by the Board, the Fund attempts to obtain prices from one or more third party pricing vendors or brokers to value its investments. When current market prices, quotations or currency exchange rates are not readily available or reliable, investments will be fair valued in good faith by the Committee, in accordance with procedures adopted by the Board. Factors used in determining fair value vary by investment type and may include market or investment specific events. The frequency with which these procedures are used cannot be predicted and they may be utilized to a significant extent. The Committee oversees the Fund's valuation policies and procedures and reports to the Board on the Committee's activities and fair value determinations. The Board monitors the appropriateness of the procedures used in valuing the Fund's investments and ratifies the fair value determinations of the Committee.
The Fund categorizes the inputs to valuation techniques used to value its investments into a disclosure hierarchy consisting of three levels as shown below:
- Level 1 – quoted prices in active markets for identical investments
- Level 2 – other significant observable inputs (including quoted prices for similar investments, interest rates, prepayment speeds, etc.)
- Level 3 – unobservable inputs (including the Fund's own assumptions based on the best information available)
Valuation techniques used to value the Fund's investments by major category are as follows:
Equity securities, including restricted securities, for which market quotations are readily available, are valued at the last reported sale price or official closing price as reported by a third party pricing vendor on the primary market or exchange on which they are traded and are categorized as Level 1 in the hierarchy. In the event there were no sales during the day or closing prices are not available, securities are valued at the last quoted bid price or may be valued using the last available price and are generally categorized as Level 2 in the hierarchy. For foreign equity securities, when market or security specific events arise, comparisons to the valuation of American Depositary Receipts (ADRs), futures contracts, Exchange-Traded Funds (ETFs) and certain indexes as well as quoted prices for similar securities may be used and would be categorized as Level 2 in the hierarchy. Utilizing these techniques may result in transfers between Level 1 and Level 2. For equity securities, including restricted securities, where observable inputs are limited, assumptions about market activity and risk are used and these securities may be categorized as Level 3 in the hierarchy.
Investments in open-end mutual funds, including the Fidelity Central Funds, are valued at their closing net asset value (NAV) each business day and are categorized as Level 1 in the hierarchy.
Changes in valuation techniques may result in transfers in or out of an assigned level within the disclosure hierarchy. The aggregate value of investments by input level as of June 30, 2016 is included at the end of the Fund's Schedule of Investments.
Foreign Currency. The Fund may use foreign currency contracts to facilitate transactions in foreign-denominated securities. Gains and losses from these transactions may arise from changes in the value of the foreign currency or if the counterparties do not perform under the contracts' terms.
Foreign-denominated assets, including investment securities, and liabilities are translated into U.S. dollars at the exchange rates at period end. Purchases and sales of investment securities, income and dividends received and expenses denominated in foreign currencies are translated into U.S. dollars at the exchange rate in effect on the transaction date.
The effects of exchange rate fluctuations on investments are included with the net realized and unrealized gain (loss) on investment securities. Other foreign currency transactions resulting in realized and unrealized gain (loss) are disclosed separately.
Investment Transactions and Income. For financial reporting purposes, the Fund's investment holdings and NAV include trades executed through the end of the last business day of the period. The NAV per share for processing shareholder transactions is calculated as of the close of business of the New York Stock Exchange (NYSE), normally 4:00 p.m. Eastern time and includes trades executed through the end of the prior business day. Gains and losses on securities sold are determined on the basis of identified cost and may include proceeds received from litigation. Dividend income is recorded on the ex-dividend date, except for certain dividends from foreign securities where the ex-dividend date may have passed, which are recorded as soon as the Fund is informed of the ex-dividend date. Non-cash dividends included in dividend income, if any, are recorded at the fair market value of the securities received. Income and capital gain distributions from Fidelity Central Funds, if any, are recorded on the ex-dividend date. Distributions received on securities that represent a return of capital or capital gain are recorded as a reduction of cost of investments and/or as a realized gain. Subsequent to ex-dividend date the Fund determines the components of these distributions, based upon receipt of tax filings or other correspondence relating to the underlying investment. Investment income is recorded net of foreign taxes withheld where recovery of such taxes is uncertain.
Class Allocations and Expenses. Investment income, realized and unrealized capital gains and losses, common expenses of the Fund, and certain fund-level expense reductions, if any, are allocated daily on a pro-rata basis to each class based on the relative net assets of each class to the total net assets of the Fund. Each class differs with respect to transfer agent and distribution and service plan fees incurred. Certain expense reductions may also differ by class. For the reporting period, the allocated portion of income and expenses to each class as a percent of its average net assets may vary due to the timing of recording these transactions in relation to fluctuating net assets of the classes. Expenses directly attributable to a fund are charged to that fund. Expenses attributable to more than one fund are allocated among the respective funds on the basis of relative net assets or other appropriate methods. Expense estimates are accrued in the period to which they relate and adjustments are made when actual amounts are known.
Deferred Trustee Compensation. Under a Deferred Compensation Plan (the Plan), independent Trustees may elect to defer receipt of a portion of their annual compensation. Deferred amounts are invested in a cross-section of Fidelity funds, are marked-to-market and remain in the Fund until distributed in accordance with the Plan. The investment of deferred amounts and the offsetting payable to the Trustees are included in the accompanying Statement of Assets and Liabilities.
Income Tax Information and Distributions to Shareholders. Each year, the Fund intends to qualify as a regulated investment company under Subchapter M of the Internal Revenue Code, including distributing substantially all of its taxable income and realized gains. As a result, no provision for U.S. Federal income taxes is required. The Fund files a U.S. federal tax return, in addition to state and local tax returns as required. The Fund's federal income tax returns are subject to examination by the Internal Revenue Service (IRS) for a period of three fiscal years after they are filed. State and local tax returns may be subject to examination for an additional fiscal year depending on the jurisdiction. Foreign taxes are provided for based on the Fund's understanding of the tax rules and rates that exist in the foreign markets in which it invests.
Distributions are declared and recorded on the ex-dividend date. Income dividends and capital gain distributions are declared separately for each class. Income and capital gain distributions are determined in accordance with income tax regulations, which may differ from GAAP.
Capital accounts within the financial statements are adjusted for permanent book-tax differences. These adjustments have no impact on net assets or the results of operations. Capital accounts are not adjusted for temporary book-tax differences which will reverse in a subsequent period.
Book-tax differences are primarily due to foreign currency transactions, deferred trustees compensation, partnerships and losses deferred due to wash sales.
The federal tax cost of investment securities and unrealized appreciation (depreciation) as of period end were as follows:
| Gross unrealized appreciation | $1,314,847,936 |
| Gross unrealized depreciation | (131,225,579) |
| Net unrealized appreciation (depreciation) on securities | $1,183,622,357 |
| Tax cost | $3,318,405,231 |
Restricted Securities. The Fund may invest in securities that are subject to legal or contractual restrictions on resale. These securities generally may be resold in transactions exempt from registration or to the public if the securities are registered. Disposal of these securities may involve time-consuming negotiations and expense, and prompt sale at an acceptable price may be difficult. Information regarding restricted securities is included at the end of the Fund's Schedule of Investments.
4. Purchases and Sales of Investments.
Purchases and sales of securities, other than short-term securities, aggregated $1,064,698,379 and $1,203,765,760, respectively.
5. Fees and Other Transactions with Affiliates.
Management Fee. Fidelity Management & Research Company (the investment adviser) and its affiliates provide the Fund with investment management related services for which the Fund pays a monthly management fee. The management fee is the sum of an individual fund fee rate that is based on an annual rate of .30% of the Fund's average net assets and an annualized group fee rate that averaged .25% during the period. The group fee rate is based upon the average net assets of all the mutual funds advised by the investment adviser, including any mutual funds previously advised by the investment adviser that are currently advised by Fidelity SelectCo, LLC, an affiliate of the investment adviser. The group fee rate decreases as assets under management increase and increases as assets under management decrease. For the reporting period, the total annualized management fee rate was .55% of the Fund's average net assets.
Distribution and Service Plan Fees. In accordance with Rule 12b-1 of the 1940 Act, the Fund has adopted separate 12b-1 Plans for each Service Class of shares. Each Service Class pays Fidelity Distributors Corporation (FDC), an affiliate of the investment adviser, a service fee. For the period, the service fee is based on an annual rate of .10% of Service Class' average net assets and .25% of Service Class 2's average net assets.
For the period, total fees, all of which were re-allowed to insurance companies for the distribution of shares and providing shareholder support services, were as follows:
| Service Class | $242,797 |
| Service Class 2 | 1,074,282 |
| | $1,317,079 |
Transfer Agent Fees. Fidelity Investments Institutional Operations Company, Inc. (FIIOC), an affiliate of the investment adviser, is the Fund's transfer, dividend disbursing, and shareholder servicing agent. FIIOC receives an asset-based fee with respect to each class. Each class (with the exception of Investor Class) pays a fee for transfer agent services, typesetting, and printing and mailing of shareholder reports, excluding mailing of proxy statements, equal to an annual rate of .07% (.15% for Investor Class) of class-level average net assets. For the period, transfer agent fees for each class, were as follows:
| Initial Class | $925,675 |
| Service Class | 160,246 |
| Service Class 2 | 283,610 |
| Investor Class | 214,623 |
| | $1,584,154 |
Accounting and Security Lending Fees. Fidelity Service Company, Inc. (FSC), an affiliate of the investment adviser, maintains the Fund's accounting records. The accounting fee is based on the level of average net assets for each month. Under a separate contract, FSC administers the security lending program. The security lending fee is based on the number and duration of lending transactions.
Brokerage Commissions. The Fund placed a portion of its portfolio transactions with brokerage firms which are affiliates of the investment adviser. Brokerage commissions are included in net realized gain (loss) and change in net unrealized appreciation (depreciation) in the Statement of Operations. The commissions paid to these affiliated firms were $18,261 for the period.
Interfund Trades. The Fund may purchase from or sell securities to other Fidelity Funds under procedures adopted by the Board. The procedures have been designed to ensure these interfund trades are executed in accordance with Rule 17a-7 of the 1940 Act. Interfund trades are included within the respective purchases and sales amounts shown in the Purchases and Sales of Investments note.
6. Committed Line of Credit.
The Fund participates with other funds managed by the investment adviser or an affiliate in a $4.25 billion credit facility (the "line of credit") to be utilized for temporary or emergency purposes to fund shareholder redemptions or for other short-term liquidity purposes. The Fund has agreed to pay commitment fees on its pro-rata portion of the line of credit, which amounted to $4,058 and is reflected in Miscellaneous expenses on the Statement of Operations. During the period, the Fund did not borrow on this line of credit.
7. Security Lending.
The Fund lends portfolio securities through a lending agent from time to time in order to earn additional income. For equity securities, a lending agent is used and may loan securities to certain qualified borrowers, including Fidelity Capital Markets (FCM), a broker-dealer affiliated with the Fund. On the settlement date of the loan, the Fund receives collateral (in the form of U.S. Treasury obligations, letters of credit and/or cash) against the loaned securities and maintains collateral in an amount not less than 100% of the market value of the loaned securities during the period of the loan. The market value of the loaned securities is determined at the close of business of the Fund and any additional required collateral is delivered to the Fund on the next business day. The Fund or borrower may terminate the loan at any time, and if the borrower defaults on its obligation to return the securities loaned because of insolvency or other reasons, the Fund may apply collateral received from the borrower against the obligation. The Fund may experience delays and costs in recovering the securities loaned. Any cash collateral received is invested in the Fidelity Securities Lending Cash Central Fund. The value of loaned securities and cash collateral at period end are disclosed on the Fund's Statement of Assets and Liabilities. The value of securities loaned to FCM at period end was $31,308,580. Security lending income represents the income earned on investing cash collateral, less rebates paid to borrowers, plus any premium payments received for lending certain types of securities. Security lending income is presented in the Statement of Operations as a component of income from Fidelity Central Funds. Total security lending income during the period amounted to $397,712, including $66,816 from securities loaned to FCM.
8. Expense Reductions.
Commissions paid to certain brokers with whom the investment adviser, or its affiliates, places trades on behalf of the Fund include an amount in addition to trade execution, which may be rebated back to the Fund to offset certain expenses. This amount totaled $92,427 for the period. In addition, through arrangements with the Fund's custodian, credits realized as a result of certain uninvested cash balances were used to reduce the Fund's expenses. During the period, these credits reduced the Fund's custody expenses by $111.
In addition, during the period the investment adviser reimbursed and/or waived a portion of fund-level operating expenses in the amount of $17,325.
9. Distributions to Shareholders.
Distributions to shareholders of each class were as follows:
| | Six months ended
June 30, 2016 | Year ended December 31, 2015 |
| From net investment income | | |
| Initial Class | $– | $7,934,061 |
| Service Class | – | 849,151 |
| Service Class 2 | – | 305,804 |
| Investor Class | – | 585,635 |
| Total | $– | $9,674,651 |
| From net realized gain | | |
| Initial Class | $278,171,056 | $97,164,090 |
| Service Class | 48,192,555 | 16,191,802 |
| Service Class 2 | 85,729,729 | 26,884,961 |
| Service Class 2R | – | 1,176,586 |
| Investor Class | 28,666,562 | 8,390,197 |
| Total | $440,759,902 | $149,807,636 |
10. Share Transactions.
Transactions for each class of shares were as follows:
| | Shares | Shares | Dollars | Dollars |
| | Six months ended
June 30, 2016 | Year ended December 31, 2015 | Six months ended
June 30, 2016 | Year ended December 31, 2015 |
| Initial Class | | | | |
| Shares sold | 664,453 | 1,537,295 | $37,553,685 | $99,048,414 |
| Reinvestment of distributions | 5,371,135 | 1,689,662 | 278,171,056 | 105,098,151 |
| Shares redeemed | (3,259,725) | (6,421,101) | (185,141,368) | (414,843,526) |
| Net increase (decrease) | 2,775,863 | (3,194,144) | $130,583,373 | $(210,696,961) |
| Service Class | | | | |
| Shares sold | 298,937 | 644,139 | $17,059,214 | $41,667,908 |
| Reinvestment of distributions | 933,422 | 274,936 | 48,192,555 | 17,040,953 |
| Shares redeemed | (679,955) | (1,114,617) | (38,706,990) | (71,657,612) |
| Net increase (decrease) | 552,404 | (195,542) | $26,544,779 | $(12,948,751) |
| Service Class 2 | | | | |
| Shares sold | 1,056,626 | 3,196,114 | $59,316,655 | $203,598,694 |
| Reinvestment of distributions | 1,676,701 | 443,005 | 85,729,722 | 27,190,765 |
| Shares redeemed | (2,143,304) | (2,354,140) | (120,705,785) | (149,858,061) |
| Net increase (decrease) | 590,023 | 1,284,979 | $24,340,592 | $80,931,398 |
| Service Class 2R | | | | |
| Shares sold | – | 23,176 | $– | $1,461,854 |
| Reinvestment of distributions | – | 19,285 | – | 1,176,586 |
| Shares redeemed | – | (655,812) | – | (41,405,549) |
| Net increase (decrease) | – | (613,351) | $– | $(38,767,109) |
| Investor Class | | | | |
| Shares sold | 352,922 | 765,618 | $20,057,874 | $49,281,957 |
| Reinvestment of distributions | 555,446 | 144,780 | 28,666,562 | 8,975,832 |
| Shares redeemed | (391,494) | (461,826) | (22,276,882) | (29,515,123) |
| Net increase (decrease) | 516,874 | 448,572 | $26,447,554 | $28,742,666 |
11. Other.
The Fund's organizational documents provide former and current trustees and officers with a limited indemnification against liabilities arising in connection with the performance of their duties to the Fund. In the normal course of business, the Fund may also enter into contracts that provide general indemnifications. The Fund's maximum exposure under these arrangements is unknown as this would be dependent on future claims that may be made against the Fund. The risk of material loss from such claims is considered remote.
At the end of the period, the investment advisor or its affiliates were the owners of record of 15% of the total outstanding shares of the Fund and one otherwise unaffiliated shareholder was the owner of record of 25% of the total outstanding shares of the Fund.
Shareholder Expense Example
As a shareholder of the Fund, you incur two types of costs: (1) transaction costs and (2) ongoing costs, including management fees, distribution and/or service (12b-1) fees and other Fund expenses. This Example is intended to help you understand your ongoing costs (in dollars) of investing in the Fund and to compare these costs with the ongoing costs of investing in other mutual funds.
The Example is based on an investment of $1,000 invested at the beginning of the period and held for the entire period (January 1, 2016 to June 30, 2016).
Actual Expenses
The first line of the accompanying table for each class of the Fund provides information about actual account values and actual expenses. You may use the information in this line, together with the amount you invested, to estimate the expenses that you paid over the period. Simply divide your account value by $1,000.00 (for example, an $8,600 account value divided by $1,000.00 = 8.6), then multiply the result by the number in the first line for a class of the Fund under the heading entitled "Expenses Paid During Period" to estimate the expenses you paid on your account during this period. The estimate of expenses does not include any fees or other expenses of any variable annuity or variable life insurance product. If they were, the estimate of expenses you paid during the period would be higher, and your ending account value would be lower. In addition, the Fund, as a shareholder in the underlying Fidelity Central Funds, will indirectly bear its pro-rata share of the fees and expenses incurred by the underlying Fidelity Central Funds. These fees and expenses are not included in the Fund's annualized expense ratio used to calculate the expense estimate in the table below.
Hypothetical Example for Comparison Purposes
The second line of the accompanying table for each class of the Fund provides information about hypothetical account values and hypothetical expenses based on a Class' actual expense ratio and an assumed rate of return of 5% per year before expenses, which is not the Class' actual return. The hypothetical account values and expenses may not be used to estimate the actual ending account balance or expenses you paid for the period. You may use this information to compare the ongoing costs of investing in the Fund and other funds. To do so, compare this 5% hypothetical example with the 5% hypothetical examples that appear in the shareholder reports of the other funds. The estimate of expenses does not include any fees or other expenses of any variable annuity or variable life insurance product. If they were, the estimate of expenses you paid during the period would be higher, and your ending account value would be lower. In addition, the Fund, as a shareholder in the underlying Fidelity Central Funds, will indirectly bear its pro-rata share of the fees and expenses incurred by the underlying Fidelity Central Funds. These fees and expenses are not included in the Fund's annualized expense ratio used to calculate the expense estimate in the table below.
Please note that the expenses shown in the table are meant to highlight your ongoing costs only and do not reflect any transaction costs. Therefore, the second line of the table is useful in comparing ongoing costs only, and will not help you determine the relative total costs of owning different funds. In addition, if these transactional costs were included, your costs would have been higher.
| | Annualized Expense Ratio-A | Beginning
Account Value
January 1, 2016 | Ending
Account Value
June 30, 2016 | Expenses Paid
During Period-B
January 1, 2016
to June 30, 2016 |
| Initial Class | .64% | | | |
| Actual | | $1,000.00 | $969.60 | $3.13 |
| Hypothetical-C | | $1,000.00 | $1,021.68 | $3.22 |
| Service Class | .74% | | | |
| Actual | | $1,000.00 | $969.10 | $3.62 |
| Hypothetical-C | | $1,000.00 | $1,021.18 | $3.72 |
| Service Class 2 | .89% | | | |
| Actual | | $1,000.00 | $968.30 | $4.36 |
| Hypothetical-C | | $1,000.00 | $1,020.44 | $4.47 |
| Investor Class | .73% | | | |
| Actual | | $1,000.00 | $969.10 | $3.57 |
| Hypothetical-C | | $1,000.00 | $1,021.23 | $3.67 |
A Annualized expense ratio reflects expenses net of applicable fee waivers.
B Expenses are equal to each Class' annualized expense ratio, multiplied by the average account value over the period, multiplied by 182/366 (to reflect the one-half year period).
C 5% return per year before expenses
VIPGRWT-SANN-0816
1.705692.118
Fidelity® Variable Insurance Products: High Income Portfolio
Semi-Annual Report June 30, 2016 |
|
Contents
To view a fund's proxy voting guidelines and proxy voting record for the 12-month period ended June 30, visit http://www.fidelity.com/proxyvotingresults or visit the Securities and Exchange Commission's (SEC) web site at http://www.sec.gov.
You may also call 1-877-208-0098 to request a free copy of the proxy voting guidelines.
Fidelity® Variable Insurance Products are separate account options which are purchased through a variable insurance contract.
Standard & Poor's, S&P and S&P 500 are registered service marks of The McGraw-Hill Companies, Inc. and have been licensed for use by Fidelity Distributors Corporation.
Other third-party marks appearing herein are the property of their respective owners.
All other marks appearing herein are registered or unregistered trademarks or service marks of FMR LLC or an affiliated company. © 2016 FMR LLC. All rights reserved.
This report and the financial statements contained herein are submitted for the general information of the shareholders of the Fund. This report is not authorized for distribution to prospective investors in the Fund unless preceded or accompanied by an effective prospectus.
A fund files its complete schedule of portfolio holdings with the SEC for the first and third quarters of each fiscal year on Form N-Q. Forms N-Q are available on the SEC’s web site at http://www.sec.gov. A fund's Forms N-Q may be reviewed and copied at the SEC’s Public Reference Room in Washington, DC. Information regarding the operation of the SEC's Public Reference Room may be obtained by calling 1-800-SEC-0330.
For a complete list of a fund's portfolio holdings, view the most recent holdings listing, semiannual report, or annual report on Fidelity's web site at http://www.fidelity.com, http://www.institutional.fidelity.com, or http://www.401k.com, as applicable.
NOT FDIC INSURED •MAY LOSE VALUE •NO BANK GUARANTEE
Neither the Fund nor Fidelity Distributors Corporation is a bank.
Investment Summary (Unaudited)
Top Five Holdings as of June 30, 2016
| (by issuer, excluding cash equivalents) | % of fund's net assets | % of fund's net assets 6 months ago |
| APX Group, Inc. | 2.8 | 2.2 |
| JC Penney Corp., Inc. | 2.2 | 1.8 |
| Lucent Technologies, Inc | 2.1 | 2.1 |
| Valeant Pharmaceuticals International, Inc. | 2.0 | 1.0 |
| Clear Channel Communications, Inc. | 1.9 | 2.0 |
| | 11.0 | |
Top Five Market Sectors as of June 30, 2016
| | % of fund's net assets | % of fund's net assets 6 months ago |
| Energy | 13.3 | 9.8 |
| Telecommunications | 11.2 | 12.7 |
| Banks & Thrifts | 7.0 | 6.7 |
| Technology | 7.0 | 6.2 |
| Healthcare | 6.8 | 5.5 |
Quality Diversification (% of fund's net assets)
| As of June 30, 2016 |
| | AAA,AA,A | 0.1% |
| | BBB | 1.0% |
| | BB | 39.2% |
| | B | 35.5% |
| | CCC,CC,C | 18.5% |
| | Not Rated | 0.2% |
| | Equities | 0.4% |
| | Short-Term Investments and Net Other Assets | 5.1% |

| As of December 31, 2015 |
| | AAA,AA,A | 0.1% |
| | BBB | 1.9% |
| | BB | 31.5% |
| | B | 42.6% |
| | CCC,CC,C | 16.4% |
| | Not Rated | 0.3% |
| | Short-Term Investments and Net Other Assets | 7.2% |

We have used ratings from Moody's Investors Service, Inc. Where Moody's® ratings are not available, we have used S&P® ratings. All ratings are as of the date indicated and do not reflect subsequent changes.
Asset Allocation (% of fund's net assets)
| As of June 30, 2016* |
| | Nonconvertible Bonds | 79.9% |
| | Convertible Bonds, Preferred Stocks | 0.4% |
| | Bank Loan Obligations | 7.3% |
| | Other Investments | 7.3% |
| | Short-Term Investments and Net Other Assets (Liabilities) | 5.1% |

* Foreign investments - 26.1%
| As of December 31, 2015* |
| | Nonconvertible Bonds | 74.9% |
| | Bank Loan Obligations | 9.5% |
| | Other Investments | 8.4% |
| | Short-Term Investments and Net Other Assets (Liabilities) | 7.2% |

* Foreign investments - 27.5%
Percentages shown as 0.0% may reflect amounts less than 0.05%.
Investments June 30, 2016 (Unaudited)
Showing Percentage of Net Assets
| Nonconvertible Bonds - 79.9% | | | |
| | | Principal Amount | Value |
| Aerospace - 0.1% | | | |
| TransDigm, Inc.: | | | |
| 6% 7/15/22 | | $405,000 | $407,098 |
| 6.375% 6/15/26 (a) | | 1,295,000 | 1,291,763 |
|
| TOTAL AEROSPACE | | | 1,698,861 |
|
| Air Transportation - 2.0% | | | |
| Air Canada 7.75% 4/15/21 (a) | | 895,000 | 928,563 |
| Air Canada Trust Series 2015-1 equipment trust certificate Class C, 5% 3/15/20 (a) | | 3,065,000 | 2,919,413 |
| Allegiant Travel Co. 5.5% 7/15/19 | | 2,335,000 | 2,387,538 |
| American Airlines Group, Inc. 4.625% 3/1/20 (a) | | 2,540,000 | 2,425,700 |
| American Airlines, Inc. pass-thru trust certificates 5.625% 1/15/21 (a) | | 423,762 | 435,416 |
| Continental Airlines, Inc.: | | | |
| pass-thru trust certificates 9.798% 4/1/21 | | 1,975,020 | 2,177,459 |
| 5.5% 4/29/22 | | 2,323,496 | 2,393,201 |
| 6.125% 4/29/18 | | 520,000 | 547,300 |
| 9.25% 5/10/17 | | 338,477 | 356,670 |
| Delta Air Lines, Inc. pass-thru trust certificates 8.021% 8/10/22 | | 1,176,007 | 1,346,528 |
| U.S. Airways pass-thru certificates: | | | |
| Series 2012-2C, 5.45% 6/3/18 | | 3,565,000 | 3,645,213 |
| Series 2013-1 Class B, 5.375% 5/15/23 | | 643,727 | 660,625 |
| United Air Lines, Inc. pass-thru trust certificates: | | | |
| Class B, 7.336% 7/2/19 | | 1,979,146 | 2,043,469 |
| 9.75% 1/15/17 | | 790,192 | 817,058 |
| United Continental Holdings, Inc. 6.375% 6/1/18 | | 300,000 | 312,750 |
|
| TOTAL AIR TRANSPORTATION | | | 23,396,903 |
|
| Automotive & Auto Parts - 0.9% | | | |
| American Tire Distributors, Inc. 10.25% 3/1/22 (a) | | 1,805,000 | 1,583,888 |
| Tenneco, Inc. 5% 7/15/26 | | 995,000 | 1,009,298 |
| The Goodyear Tire & Rubber Co. 5% 5/31/26 | | 2,950,000 | 3,005,313 |
| ZF North America Capital, Inc. 4.75% 4/29/25 (a) | | 4,665,000 | 4,726,205 |
|
| TOTAL AUTOMOTIVE & AUTO PARTS | | | 10,324,704 |
|
| Broadcasting - 1.7% | | | |
| AMC Networks, Inc. 5% 4/1/24 | | 1,680,000 | 1,662,990 |
| Clear Channel Communications, Inc.: | | | |
| 5.5% 12/15/16 | | 14,680,000 | 13,432,200 |
| 6.875% 6/15/18 | | 170,000 | 116,450 |
| 9% 12/15/19 | | 865,000 | 648,750 |
| 10% 1/15/18 | | 5,510,000 | 2,837,650 |
| Sirius XM Radio, Inc. 5.375% 7/15/26 (a) | | 1,355,000 | 1,344,838 |
|
| TOTAL BROADCASTING | | | 20,042,878 |
|
| Building Materials - 1.4% | | | |
| Beacon Roofing Supply, Inc. 6.375% 10/1/23 | | 830,000 | 869,425 |
| Building Materials Corp. of America: | | | |
| 5.375% 11/15/24 (a) | | 3,265,000 | 3,322,138 |
| 6% 10/15/25 (a) | | 2,605,000 | 2,722,225 |
| Building Materials Holding Corp. 9% 9/15/18 (a) | | 2,050,000 | 2,134,563 |
| CEMEX Finance LLC 6% 4/1/24 (a) | | 1,745,000 | 1,692,650 |
| CEMEX S.A.B. de CV 7.75% 4/16/26 (a) | | 2,030,000 | 2,129,673 |
| Standard Industries, Inc. 5.125% 2/15/21 (a) | | 2,735,000 | 2,810,213 |
| U.S. Concrete, Inc. 6.375% 6/1/24 (a) | | 665,000 | 665,000 |
|
| TOTAL BUILDING MATERIALS | | | 16,345,887 |
|
| Cable/Satellite TV - 3.9% | | | |
| Altice SA 7.75% 5/15/22 (a) | | 17,675,000 | 17,851,750 |
| Altice U.S. Finance SA 5.5% 5/15/26 (a) | | 2,945,000 | 2,945,000 |
| CCO Holdings LLC/CCO Holdings Capital Corp.: | | | |
| 5.125% 5/1/23 (a) | | 900,000 | 905,063 |
| 5.5% 5/1/26 (a) | | 3,635,000 | 3,689,525 |
| DISH DBS Corp. 7.75% 7/1/26 (a) | | 2,225,000 | 2,291,750 |
| RCN Telecom Services LLC/RCN Capital Corp. 8.5% 8/15/20 (a) | | 2,410,000 | 2,470,250 |
| Unitymedia Hessen GmbH & Co. KG/Unitymedia NRW GmbH 5% 1/15/25 (a) | | 1,685,000 | 1,651,300 |
| Virgin Media Secured Finance PLC 5.5% 8/15/26 (a) | | 3,180,000 | 3,092,550 |
| Wave Holdco LLC/Wave Holdco Corp. 9% 7/15/19 pay-in-kind (a)(b) | | 391,875 | 377,670 |
| WaveDivision Escrow LLC/WaveDivision Escrow Corp. 8.125% 9/1/20 (a) | | 7,920,000 | 8,236,800 |
| Ziggo Bond Finance BV 5.875% 1/15/25 (a) | | 1,810,000 | 1,746,650 |
|
| TOTAL CABLE/SATELLITE TV | | | 45,258,308 |
|
| Capital Goods - 0.4% | | | |
| General Cable Corp. 5.75% 10/1/22 (b) | | 905,000 | 832,600 |
| J.B. Poindexter & Co., Inc. 9% 4/1/22 (a) | | 3,830,000 | 3,983,200 |
|
| TOTAL CAPITAL GOODS | | | 4,815,800 |
|
| Chemicals - 0.5% | | | |
| Evolution Escrow Issuer LLC 7.5% 3/15/22 (a) | | 3,945,000 | 2,840,400 |
| Nufarm Australia Ltd. 6.375% 10/15/19 (a) | | 3,395,000 | 3,428,950 |
|
| TOTAL CHEMICALS | | | 6,269,350 |
|
| Consumer Products - 0.4% | | | |
| Edgewell Personal Care Co. 5.5% 6/15/25 (a) | | 5,000,000 | 4,975,000 |
| Containers - 2.0% | | | |
| Ardagh Finance Holdings SA 8.625% 6/15/19 pay-in-kind (a)(b) | | 3,927,396 | 3,952,556 |
| Ardagh Packaging Finance PLC/Ardagh MP Holdings U.S.A., Inc.: | | | |
| 3.8896% 5/15/21 (a)(b) | | 2,225,000 | 2,233,344 |
| 4.625% 5/15/23 (a) | | 3,685,000 | 3,629,725 |
| 7% 11/15/20 (a) | | 779,822 | 764,226 |
| Consolidated Container Co. LLC/Consolidated Container Capital, Inc. 10.125% 7/15/20 (a) | | 1,265,000 | 1,147,988 |
| Owens-Brockway Glass Container, Inc. 5.375% 1/15/25 (a) | | 5,000,000 | 4,962,500 |
| Reynolds Group Issuer, Inc./Reynolds Group Issuer LLC/Reynolds Group Issuer (Luxembourg) SA: | | | |
| 4.2109% 7/15/21 (a)(b) | | 1,470,000 | 1,473,675 |
| 5.125% 7/15/23 (a) | | 2,385,000 | 2,414,813 |
| 5.75% 10/15/20 | | 2,990,000 | 3,087,175 |
|
| TOTAL CONTAINERS | | | 23,666,002 |
|
| Diversified Financial Services - 3.2% | | | |
| AerCap Ireland Capital Ltd./AerCap Global Aviation Trust 3.95% 2/1/22 | | 2,895,000 | 2,895,000 |
| Aircastle Ltd. 5% 4/1/23 | | 750,000 | 762,150 |
| FLY Leasing Ltd. 6.375% 10/15/21 | | 2,890,000 | 2,803,300 |
| Icahn Enterprises LP/Icahn Enterprises Finance Corp.: | | | |
| 4.875% 3/15/19 | | 2,675,000 | 2,614,813 |
| 5.875% 2/1/22 | | 6,495,000 | 6,122,382 |
| 6% 8/1/20 | | 2,775,000 | 2,740,313 |
| ILFC E-Capital Trust I 3.98% 12/21/65 (a)(b) | | 4,595,000 | 3,607,075 |
| ILFC E-Capital Trust II 4.23% 12/21/65 (a)(b) | | 7,445,000 | 5,862,938 |
| Navient Corp.: | | | |
| 5% 10/26/20 | | 320,000 | 300,000 |
| 5.875% 3/25/21 | | 2,100,000 | 1,983,177 |
| 5.875% 10/25/24 | | 2,085,000 | 1,782,675 |
| SLM Corp.: | | | |
| 4.875% 6/17/19 | | 2,275,000 | 2,195,375 |
| 5.5% 1/25/23 | | 5,025,000 | 4,409,438 |
|
| TOTAL DIVERSIFIED FINANCIAL SERVICES | | | 38,078,636 |
|
| Diversified Media - 0.5% | | | |
| MDC Partners, Inc. 6.5% 5/1/24 (a) | | 3,485,000 | 3,458,863 |
| WMG Acquisition Corp. 6.75% 4/15/22 (a) | | 2,485,000 | 2,509,850 |
|
| TOTAL DIVERSIFIED MEDIA | | | 5,968,713 |
|
| Electric Utilities No Longer Use - 0.4% | | | |
| Calpine Corp. 5.25% 6/1/26 (a) | | 2,855,000 | 2,847,863 |
| The AES Corp. 6% 5/15/26 | | 2,260,000 | 2,308,025 |
|
| TOTAL ELECTRIC UTILITIES NO LONGER USE | | | 5,155,888 |
|
| Energy - 12.6% | | | |
| Antero Resources Corp.: | | | |
| 5.125% 12/1/22 | | 6,985,000 | 6,705,600 |
| 5.625% 6/1/23 (Reg. S) | | 2,500,000 | 2,425,000 |
| Antero Resources Finance Corp. 5.375% 11/1/21 | | 2,230,000 | 2,179,825 |
| Cheniere Corpus Christi Holdings LLC 7% 6/30/24 (a) | | 1,555,000 | 1,596,798 |
| Chesapeake Energy Corp. 8% 12/15/22 (a) | | 3,750,000 | 3,178,125 |
| Citgo Holding, Inc. 10.75% 2/15/20 (a) | | 1,260,000 | 1,266,300 |
| Citgo Petroleum Corp. 6.25% 8/15/22 (a) | | 2,970,000 | 2,843,775 |
| Concho Resources, Inc. 5.5% 4/1/23 | | 3,000,000 | 3,007,500 |
| CVR Refining LLC/Coffeyville Finance, Inc. 6.5% 11/1/22 | | 3,650,000 | 3,139,000 |
| Denbury Resources, Inc.: | | | |
| 4.625% 7/15/23 | | 2,630,000 | 1,696,350 |
| 6.375% 8/15/21 | | 2,550,000 | 1,759,500 |
| Endeavor Energy Resources LP/EER Finance, Inc. 7% 8/15/21 (a) | | 8,435,000 | 8,287,388 |
| Energy Transfer Equity LP 5.875% 1/15/24 | | 3,545,000 | 3,447,513 |
| EP Energy LLC/Everest Acquisition Finance, Inc.: | | | |
| 6.375% 6/15/23 | | 2,240,000 | 1,344,000 |
| 7.75% 9/1/22 | | 1,005,000 | 613,050 |
| 9.375% 5/1/20 | | 3,360,000 | 2,377,200 |
| Exterran Partners LP/EXLP Finance Corp. 6% 4/1/21 | | 6,300,000 | 5,638,500 |
| Forbes Energy Services Ltd. 9% 6/15/19 | | 7,795,000 | 3,351,850 |
| Forum Energy Technologies, Inc. 6.25% 10/1/21 | | 2,845,000 | 2,638,738 |
| Gibson Energy, Inc. 6.75% 7/15/21 (a) | | 3,635,000 | 3,616,825 |
| Halcon Resources Corp. 8.625% 2/1/20 (a) | | 2,855,000 | 2,692,608 |
| Hilcorp Energy I LP/Hilcorp Finance Co.: | | | |
| 5% 12/1/24 (a) | | 1,675,000 | 1,561,770 |
| 5.75% 10/1/25 (a) | | 1,995,000 | 1,905,225 |
| Hornbeck Offshore Services, Inc.: | | | |
| 5% 3/1/21 | | 235,000 | 139,238 |
| 5.875% 4/1/20 | | 1,260,000 | 796,950 |
| Northern Tier Energy LLC/Northern Tier Finance Corp. 7.125% 11/15/20 | | 2,525,000 | 2,569,188 |
| PBF Holding Co. LLC/PBF Finance Corp. 8.25% 2/15/20 | | 3,070,000 | 3,185,125 |
| PBF Logistics LP/PBF Logistics Finance, Inc. 6.875% 5/15/23 | | 3,495,000 | 3,425,100 |
| Rice Energy, Inc.: | | | |
| 6.25% 5/1/22 | | 9,440,000 | 9,369,200 |
| 7.25% 5/1/23 | | 6,675,000 | 6,775,125 |
| Sabine Pass Liquefaction LLC: | | | |
| 5.625% 2/1/21 (b) | | 7,595,000 | 7,670,950 |
| 5.625% 3/1/25 | | 5,695,000 | 5,662,823 |
| 5.75% 5/15/24 | | 2,095,000 | 2,079,288 |
| 5.875% 6/30/26 (a) | | 2,225,000 | 2,233,344 |
| 6.25% 3/15/22 | | 1,560,000 | 1,602,900 |
| SM Energy Co. 6.5% 11/15/21 | | 905,000 | 848,438 |
| Southwestern Energy Co. 4.05% 1/23/20 | | 1,715,000 | 1,684,988 |
| Sunoco LP/Sunoco Finance Corp.: | | | |
| 5.5% 8/1/20 (a) | | 2,675,000 | 2,641,563 |
| 6.25% 4/15/21 (a) | | 1,900,000 | 1,895,250 |
| Targa Resources Partners LP/Targa Resources Partners Finance Corp.: | | | |
| 5.25% 5/1/23 | | 400,000 | 378,000 |
| 6.75% 3/15/24 (a) | | 3,065,000 | 3,141,625 |
| Teine Energy Ltd. 6.875% 9/30/22 (a) | | 4,925,000 | 4,826,500 |
| Tesoro Logistics LP/Tesoro Logistics Finance Corp.: | | | |
| 5.5% 10/15/19 | | 135,000 | 141,075 |
| 5.875% 10/1/20 | | 155,000 | 159,263 |
| 6.125% 10/15/21 | | 995,000 | 1,029,825 |
| 6.25% 10/15/22 | | 1,535,000 | 1,600,238 |
| The Williams Companies, Inc.: | | | |
| 3.7% 1/15/23 | | 2,185,000 | 1,933,725 |
| 4.55% 6/24/24 | | 2,915,000 | 2,677,428 |
| Transocean, Inc.: | | | |
| 6.8% 3/15/38 | | 1,320,000 | 861,300 |
| 7.5% 4/15/31 | | 525,000 | 343,875 |
| Weatherford International Ltd.: | | | |
| 7.75% 6/15/21 | | 1,655,000 | 1,611,556 |
| 8.25% 6/15/23 | | 2,220,000 | 2,109,000 |
| Western Refining Logistics LP/WNRL Finance Co. 7.5% 2/15/23 | | 1,980,000 | 1,950,300 |
| Whiting Petroleum Corp. 6.5% 10/1/18 | | 925,000 | 888,000 |
| WPX Energy, Inc.: | | | |
| 5.25% 9/15/24 | | 1,890,000 | 1,663,200 |
| 6% 1/15/22 | | 1,440,000 | 1,339,200 |
| 7.5% 8/1/20 | | 1,545,000 | 1,542,095 |
|
| TOTAL ENERGY | | | 148,048,115 |
|
| Entertainment/Film - 0.1% | | | |
| New Cotai LLC/New Cotai Capital Corp. 10.625% 5/1/19 pay-in-kind (a)(b) | | 2,289,164 | 1,373,697 |
| Environmental - 0.5% | | | |
| LBC Tank Terminals Holding Netherlands BV 6.875% 5/15/23 (a) | | 6,380,000 | 6,156,700 |
| Food & Drug Retail - 0.7% | | | |
| Albertsons Companies LLC/Safeway, Inc./New Albertson's, Inc./Albertson's LLC 6.625% 6/15/24 (a) | | 1,300,000 | 1,342,250 |
| Tesco PLC 6.15% 11/15/37 (a) | | 5,395,000 | 5,025,227 |
| Tops Holding LLC/Tops Markets II Corp. 8% 6/15/22 (a) | | 2,005,000 | 1,764,400 |
|
| TOTAL FOOD & DRUG RETAIL | | | 8,131,877 |
|
| Food/Beverage/Tobacco - 4.1% | | | |
| ESAL GmbH 6.25% 2/5/23 (a) | | 16,225,000 | 16,022,188 |
| JBS Investments GmbH: | | | |
| 7.25% 4/3/24 (a) | | 1,350,000 | 1,390,500 |
| 7.75% 10/28/20 (a) | | 3,640,000 | 3,840,200 |
| JBS U.S.A. LLC/JBS U.S.A. Finance, Inc.: | | | |
| 5.875% 7/15/24 (a) | | 2,765,000 | 2,678,594 |
| 8.25% 2/1/20 (a) | | 3,830,000 | 3,964,050 |
| Minerva Luxembourg SA 7.75% 1/31/23 (a) | | 9,825,000 | 10,090,275 |
| U.S. Foods, Inc. 5.875% 6/15/24 (a) | | 1,375,000 | 1,409,375 |
| Vector Group Ltd.: | | | |
| 7.75% 2/15/21 (a) | | 900,000 | 937,125 |
| 7.75% 2/15/21 | | 7,035,000 | 7,325,194 |
|
| TOTAL FOOD/BEVERAGE/TOBACCO | | | 47,657,501 |
|
| Gaming - 2.9% | | | |
| GLP Capital LP/GLP Financing II, Inc.: | | | |
| 4.375% 4/15/21 | | 1,645,000 | 1,694,350 |
| 5.375% 4/15/26 | | 515,000 | 530,450 |
| MCE Finance Ltd. 5% 2/15/21 (a) | | 6,075,000 | 6,011,364 |
| Scientific Games Corp.: | | | |
| 6.625% 5/15/21 | | 13,500,000 | 8,032,500 |
| 7% 1/1/22 (a) | | 2,780,000 | 2,793,900 |
| 10% 12/1/22 | | 4,020,000 | 3,266,250 |
| Wynn Macau Ltd. 5.25% 10/15/21 (a) | | 12,515,000 | 12,174,592 |
|
| TOTAL GAMING | | | 34,503,406 |
|
| Healthcare - 6.5% | | | |
| AMAG Pharmaceuticals, Inc. 7.875% 9/1/23 (a) | | 835,000 | 747,325 |
| Centene Corp.: | | | |
| 4.75% 5/15/22 | | 2,950,000 | 3,009,000 |
| 5.625% 2/15/21 (a) | | 1,515,000 | 1,579,388 |
| 6.125% 2/15/24 (a) | | 835,000 | 887,709 |
| Community Health Systems, Inc.: | | | |
| 6.875% 2/1/22 | | 2,860,000 | 2,502,500 |
| 7.125% 7/15/20 | | 5,085,000 | 4,714,253 |
| Endo Finance LLC 5.875% 1/15/23 (a) | | 425,000 | 368,688 |
| HCA Holdings, Inc.: | | | |
| 5% 3/15/24 | | 2,105,000 | 2,178,675 |
| 5.25% 6/15/26 | | 6,445,000 | 6,690,716 |
| HealthSouth Corp.: | | | |
| 5.125% 3/15/23 | | 815,000 | 798,700 |
| 5.75% 9/15/25 | | 4,655,000 | 4,608,450 |
| Horizon Pharma PLC 6.625% 5/1/23 | | 2,260,000 | 2,101,800 |
| Kindred Healthcare, Inc.: | | | |
| 8% 1/15/20 | | 1,450,000 | 1,442,750 |
| 8.75% 1/15/23 | | 3,840,000 | 3,789,619 |
| Mallinckrodt International Finance SA/Mallinckrodt CB LLC 5.5% 4/15/25 (a) | | 610,000 | 544,193 |
| MPT Operating Partnership LP/MPT Finance Corp. 6.375% 3/1/24 | | 1,275,000 | 1,357,875 |
| RegionalCare Hospital Partners Holdings, Inc. 8.25% 5/1/23 (a) | | 1,155,000 | 1,183,875 |
| Teleflex, Inc. 4.875% 6/1/26 | | 940,000 | 949,400 |
| Tenet Healthcare Corp.: | | | |
| 5% 3/1/19 | | 2,265,000 | 2,191,388 |
| 6.75% 6/15/23 | | 3,440,000 | 3,293,800 |
| 8.125% 4/1/22 | | 4,985,000 | 5,108,628 |
| Universal Health Services, Inc. 4.75% 8/1/22 (a) | | 1,920,000 | 1,952,870 |
| Valeant Pharmaceuticals International, Inc.: | | | |
| 5.375% 3/15/20(a) | | 7,255,000 | 6,198,491 |
| 5.625% 12/1/21 (a) | | 1,925,000 | 1,588,125 |
| 5.875% 5/15/23 (a) | | 3,690,000 | 2,979,675 |
| 6.125% 4/15/25 (a) | | 2,220,000 | 1,781,550 |
| 6.75% 8/15/18 (a) | | 5,765,000 | 5,577,638 |
| VPI Escrow Corp. 6.375% 10/15/20 (a) | | 6,750,000 | 5,805,000 |
|
| TOTAL HEALTHCARE | | | 75,932,081 |
|
| Homebuilders/Real Estate - 1.9% | | | |
| Brookfield Residential Properties, Inc./Brookfield Residential U.S. Corp. 6.125% 7/1/22 (a) | | 15,000 | 14,175 |
| Brookfield Residential Properties, Inc. 6.375% 5/15/25 (a) | | 70,000 | 63,875 |
| CalAtlantic Group, Inc. 5.25% 6/1/26 | | 2,715,000 | 2,633,550 |
| Howard Hughes Corp. 6.875% 10/1/21 (a) | | 2,870,000 | 2,891,525 |
| M/I Homes, Inc. 6.75% 1/15/21 | | 2,925,000 | 2,910,375 |
| Meritage Homes Corp. 6% 6/1/25 | | 1,775,000 | 1,783,875 |
| Taylor Morrison Communities, Inc./Monarch Communities, Inc. 5.875% 4/15/23 (a) | | 1,395,000 | 1,401,975 |
| TRI Pointe Homes, Inc. 5.875% 6/15/24 | | 725,000 | 736,781 |
| VEREIT Operating Partnership LP: | | | |
| 4.125% 6/1/21 | | 1,035,000 | 1,079,629 |
| 4.875% 6/1/26 | | 1,035,000 | 1,060,875 |
| William Lyon Homes, Inc.: | | | |
| 5.75% 4/15/19 | | 2,370,000 | 2,322,600 |
| 7% 8/15/22 | | 4,863,000 | 4,814,370 |
|
| TOTAL HOMEBUILDERS/REAL ESTATE | | | 21,713,605 |
|
| Hotels - 0.2% | | | |
| ESH Hospitality, Inc. 5.25% 5/1/25 (a) | | 2,405,000 | 2,341,869 |
| Insurance - 0.4% | | | |
| Alliant Holdings Co.-Issuer, Inc./Wayne Merger Sub LLC 8.25% 8/1/23 (a) | | 4,405,000 | 4,349,938 |
| Leisure - 0.4% | | | |
| 24 Hour Holdings III LLC 8% 6/1/22 (a) | | 6,110,000 | 4,628,325 |
| Metals/Mining - 1.4% | | | |
| Freeport-McMoRan, Inc.: | | | |
| 3.55% 3/1/22 | | 4,175,000 | 3,674,000 |
| 3.875% 3/15/23 | | 3,090,000 | 2,703,750 |
| 4.55% 11/14/24 | | 1,910,000 | 1,671,250 |
| Lundin Mining Corp.: | | | |
| 7.5% 11/1/20 (a) | | 580,000 | 591,600 |
| 7.875% 11/1/22 (a) | | 2,810,000 | 2,873,225 |
| Signode Industrial Group Lux SA/Signode Industrial Group U.S., Inc. 6.375% 5/1/22 (a) | | 2,845,000 | 2,720,531 |
| Teck Resources Ltd.: | | | |
| 8% 6/1/21 (a) | | 860,000 | 885,800 |
| 8.5% 6/1/24 (a) | | 860,000 | 892,250 |
|
| TOTAL METALS/MINING | | | 16,012,406 |
|
| Paper - 0.1% | | | |
| Xerium Technologies, Inc. 8.875% 6/15/18 | | 1,570,000 | 1,546,450 |
| Publishing/Printing - 0.9% | | | |
| McGraw-Hill Global Education Holdings LLC/McGraw-Hill Global Education Finance 7.875% 5/15/24 (a) | | 1,025,000 | 1,060,875 |
| MHGE Parent LLC/MHGE Parent Finance, Inc. 8.5% 8/1/19 pay-in-kind (a)(b) | | 7,705,000 | 7,782,050 |
| R.R. Donnelley & Sons Co.: | | | |
| 6.5% 11/15/23 | | 1,550,000 | 1,441,500 |
| 7% 2/15/22 | | 585,000 | 573,300 |
|
| TOTAL PUBLISHING/PRINTING | | | 10,857,725 |
|
| Restaurants - 0.2% | | | |
| KFC Holding Co./Pizza Hut Holding LLC: | | | |
| 5% 6/1/24 (a) | | 1,050,000 | 1,068,375 |
| 5.25% 6/1/26 (a) | | 1,050,000 | 1,076,250 |
|
| TOTAL RESTAURANTS | | | 2,144,625 |
|
| Services - 4.3% | | | |
| Anna Merger Sub, Inc. 7.75% 10/1/22 (a) | | 2,000,000 | 1,755,000 |
| APX Group, Inc.: | | | |
| 6.375% 12/1/19 | | 18,720,000 | 18,532,800 |
| 7.875% 12/1/22 (a) | | 3,045,000 | 3,067,838 |
| 8.75% 12/1/20 | | 11,335,000 | 10,399,863 |
| Aramark Services, Inc.: | | | |
| 4.75% 6/1/26 (a) | | 1,475,000 | 1,445,500 |
| 5.125% 1/15/24 (a) | | 1,475,000 | 1,504,500 |
| Blueline Rent Finance Corp./Volvo 7% 2/1/19 (a) | | 1,200,000 | 1,032,000 |
| Brand Energy & Infrastructure Services, Inc. 8.5% 12/1/21 (a) | | 2,460,000 | 2,361,600 |
| Garda World Security Corp.: | | | |
| 7.25% 11/15/21 (a) | | 2,200,000 | 1,776,500 |
| 7.25% 11/15/21 (a) | | 3,715,000 | 2,999,863 |
| Hertz Corp. 6.25% 10/15/22 | | 890,000 | 916,700 |
| United Rentals North America, Inc.: | | | |
| 4.625% 7/15/23 | | 2,900,000 | 2,925,375 |
| 5.5% 7/15/25 | | 1,615,000 | 1,590,775 |
|
| TOTAL SERVICES | | | 50,308,314 |
|
| Steel - 0.4% | | | |
| Evraz, Inc. NA Canada 7.5% 11/15/19 (a) | | 1,740,000 | 1,696,500 |
| Steel Dynamics, Inc. 5.125% 10/1/21 | | 3,030,000 | 3,101,963 |
|
| TOTAL STEEL | | | 4,798,463 |
|
| Super Retail - 2.9% | | | |
| Argos Merger Sub, Inc. 7.125% 3/15/23 (a) | | 5,210,000 | 5,366,300 |
| JC Penney Corp., Inc.: | | | |
| 5.65% 6/1/20 | | 13,275,000 | 12,478,500 |
| 5.875% 7/1/23 (a) | | 850,000 | 855,313 |
| 7.4% 4/1/37 | | 9,190,000 | 7,352,000 |
| 8.125% 10/1/19 | | 1,470,000 | 1,520,994 |
| L Brands, Inc.: | | | |
| 6.75% 7/1/36 | | 2,230,000 | 2,228,595 |
| 6.875% 11/1/35 | | 1,490,000 | 1,508,625 |
| Netflix, Inc. 5.875% 2/15/25 | | 1,085,000 | 1,137,894 |
| Sally Holdings LLC 5.625% 12/1/25 | | 1,185,000 | 1,241,288 |
|
| TOTAL SUPER RETAIL | | | 33,689,509 |
|
| Technology - 6.2% | | | |
| Blue Coat Systems, Inc. 8.375% 6/1/23 (a) | | 3,500,000 | 3,955,000 |
| Brocade Communications Systems, Inc. 4.625% 1/15/23 | | 2,260,000 | 2,178,075 |
| Lucent Technologies, Inc.: | | | |
| 6.45% 3/15/29 | | 19,650,000 | 20,485,100 |
| 6.5% 1/15/28 | | 3,265,000 | 3,354,788 |
| Micron Technology, Inc.: | | | |
| 5.25% 8/1/23 (a) | | 1,695,000 | 1,444,988 |
| 5.25% 1/15/24 (a) | | 660,000 | 559,350 |
| 5.5% 2/1/25 | | 210,000 | 178,500 |
| 5.625% 1/15/26 (a) | | 2,650,000 | 2,206,125 |
| 5.875% 2/15/22 | | 350,000 | 329,000 |
| Microsemi Corp. 9.125% 4/15/23 (a) | | 1,000,000 | 1,100,000 |
| Nuance Communications, Inc.: | | | |
| 5.375% 8/15/20 (a) | | 675,000 | 686,813 |
| 6% 7/1/24 (a) | | 2,980,000 | 2,994,900 |
| NXP BV/NXP Funding LLC 4.625% 6/1/23 (a) | | 1,450,000 | 1,475,375 |
| Open Text Corp. 5.875% 6/1/26 (a) | | 3,940,000 | 3,964,625 |
| Qorvo, Inc.: | | | |
| 6.75% 12/1/23 (a) | | 4,270,000 | 4,440,800 |
| 7% 12/1/25 (a) | | 4,794,000 | 5,057,670 |
| Sensata Technologies BV 5% 10/1/25 (a) | | 2,470,000 | 2,480,843 |
| Sensata Technologies UK Financing Co. PLC 6.25% 2/15/26 (a) | | 2,080,000 | 2,152,800 |
| Solera LLC/Solera Finance, Inc. 10.5% 3/1/24 (a) | | 3,650,000 | 3,837,063 |
| WideOpenWest Finance LLC/WideOpenWest Capital Corp.: | | | |
| 10.25% 7/15/19 | | 6,135,000 | 6,349,725 |
| 13.375% 10/15/19 | | 2,835,000 | 3,012,188 |
|
| TOTAL TECHNOLOGY | | | 72,243,728 |
|
| Telecommunications - 10.9% | | | |
| Altice Financing SA: | | | |
| 6.5% 1/15/22 (a) | | 685,000 | 691,850 |
| 6.625% 2/15/23 (a) | | 2,595,000 | 2,547,953 |
| 7.5% 5/15/26 (a) | | 2,210,000 | 2,165,800 |
| Altice Finco SA: | | | |
| 7.625% 2/15/25 (a) | | 5,555,000 | 5,082,825 |
| 9.875% 12/15/20 (a) | | 2,985,000 | 3,184,622 |
| Columbus International, Inc. 7.375% 3/30/21(a) | | 13,805,000 | 14,578,080 |
| Digicel Group Ltd.: | | | |
| 6% 4/15/21 (a) | | 7,910,000 | 6,780,452 |
| 7% 2/15/20 (a) | | 295,000 | 272,875 |
| 7.125% 4/1/22 (a) | | 5,405,000 | 4,019,969 |
| 8.25% 9/30/20 (a) | | 6,105,000 | 5,097,675 |
| DigitalGlobe, Inc. 5.25% 2/1/21 (a) | | 8,905,000 | 8,281,650 |
| Level 3 Financing, Inc. 5.25% 3/15/26 (a) | | 2,750,000 | 2,695,000 |
| MetroPCS Wireless, Inc. 6.625% 11/15/20 | | 2,025,000 | 2,088,281 |
| Millicom International Cellular SA 6% 3/15/25 (a) | | 6,410,000 | 6,249,750 |
| Neptune Finco Corp.: | | | |
| 10.125% 1/15/23 (a) | | 3,775,000 | 4,228,000 |
| 10.875% 10/15/25 (a) | | 4,200,000 | 4,801,104 |
| Numericable Group SA 6% 5/15/22 (a) | | 4,540,000 | 4,415,150 |
| Sable International Finance Ltd. 6.875% 8/1/22 (a) | | 6,100,000 | 6,126,352 |
| Sprint Capital Corp.: | | | |
| 6.875% 11/15/28 | | 8,020,000 | 6,295,700 |
| 8.75% 3/15/32 | | 4,935,000 | 4,219,425 |
| Sprint Communications, Inc. 7% 3/1/20 (a) | | 2,860,000 | 2,994,391 |
| Sprint Corp.: | | | |
| 7.25% 9/15/21 | | 6,765,000 | 5,767,163 |
| 7.625% 2/15/25 | | 7,015,000 | 5,550,619 |
| 7.875% 9/15/23 | | 4,240,000 | 3,466,200 |
| T-Mobile U.S.A., Inc. 6.625% 4/1/23 | | 7,890,000 | 8,358,508 |
| Telecom Italia Capital SA 6% 9/30/34 | | 2,674,000 | 2,553,670 |
| Wind Acquisition Finance SA: | | | |
| 4.75% 7/15/20 (a) | | 1,880,000 | 1,842,400 |
| 7.375% 4/23/21 (a) | | 2,865,000 | 2,728,913 |
| Zayo Group LLC/Zayo Capital, Inc. 6.375% 5/15/25 | | 815,000 | 831,300 |
|
| TOTAL TELECOMMUNICATIONS | | | 127,915,677 |
|
| Transportation Ex Air/Rail - 0.4% | | | |
| Navios Maritime Acquisition Corp./Navios Acquisition Finance U.S., Inc. 8.125% 11/15/21 (a) | | 3,805,000 | 2,986,925 |
| Navios Maritime Holdings, Inc. 7.375% 1/15/22 (a) | | 4,000,000 | 1,780,000 |
|
| TOTAL TRANSPORTATION EX AIR/RAIL | | | 4,766,925 |
|
| Utilities - 4.5% | | | |
| Dolphin Subsidiary II, Inc. 7.25% 10/15/21 | | 9,550,000 | 9,168,000 |
| Dynegy, Inc.: | | | |
| 6.75% 11/1/19 | | 2,885,000 | 2,888,606 |
| 7.375% 11/1/22 | | 7,205,000 | 6,952,825 |
| 7.625% 11/1/24 | | 8,420,000 | 8,083,200 |
| Global Partners LP/GLP Finance Corp.: | | | |
| 6.25% 7/15/22 | | 1,876,000 | 1,561,770 |
| 7% 6/15/23 | | 4,250,000 | 3,548,750 |
| NSG Holdings II LLC/NSG Holdings, Inc. 7.75% 12/15/25 (a) | | 11,959,835 | 12,797,024 |
| PPL Energy Supply LLC 6.5% 6/1/25 | | 1,105,000 | 917,150 |
| RJS Power Holdings LLC 4.625% 7/15/19 (a) | | 6,165,000 | 5,425,200 |
| The AES Corp. 3.6731% 6/1/19 (b) | | 817,000 | 814,958 |
|
| TOTAL UTILITIES | | | 52,157,483 |
|
| TOTAL NONCONVERTIBLE BONDS | | | |
| (Cost $964,608,072) | | | 937,275,349 |
| | | Shares | Value |
|
| Common Stocks - 0.0% | | | |
| Healthcare - 0.0% | | | |
| HealthSouth Corp. warrants 1/17/17 (c) | | 1,922 | 3,248 |
| Telecommunications - 0.0% | | | |
| CUI Acquisition Corp. Class E, (c) | | 1 | 35,011 |
| TOTAL COMMON STOCKS | | | |
| (Cost $1,175,746) | | | 38,259 |
|
| Convertible Preferred Stocks - 0.4% | | | |
| Energy - 0.4% | | | |
| Southwestern Energy Co. Series B 6.25% | | | |
| (Cost $2,641,725) | | 149,000 | 4,484,900 |
| | | Principal Amount | Value |
|
| Bank Loan Obligations - 7.3% | | | |
| Aerospace - 0.1% | | | |
| TransDigm, Inc. Tranche D, term loan 3.75% 6/4/21 (b) | | 1,734,600 | 1,711,686 |
| Broadcasting - 0.4% | | | |
| Clear Channel Communications, Inc. Tranche D, term loan 7.2103% 1/30/19 (b) | | 6,570,000 | 4,781,515 |
| Building Materials - 0.7% | | | |
| Beacon Roofing Supply, Inc. Tranche B, term loan 4% 10/1/22 (b) | | 3,225,625 | 3,220,916 |
| GYP Holdings III Corp. Tranche 1LN, term loan 4.75% 4/1/21 (b) | | 2,340,339 | 2,293,532 |
| LBM Borrower LLC Tranche B 1LN, term loan 6.25% 8/20/22 (b) | | 3,319,913 | 3,245,214 |
|
| TOTAL BUILDING MATERIALS | | | 8,759,662 |
|
| Cable/Satellite TV - 0.4% | | | |
| Numericable LLC: | | | |
| Tranche B 6LN, term loan 4.75% 2/10/23 (b) | | 4,244,363 | 4,179,169 |
| Tranche B, term loan 5% 1/15/24 (b) | | 450,000 | 445,500 |
|
| TOTAL CABLE/SATELLITE TV | | | 4,624,669 |
|
| Containers - 0.3% | | | |
| Signode Packaging Systems, Inc. Tranche B, term loan 3.75% 5/1/21 (b) | | 3,993,407 | 3,951,796 |
| Diversified Financial Services - 0.2% | | | |
| IBC Capital U.S. LLC: | | | |
| Tranche 2LN, term loan 8% 9/11/22 (b) | | 1,575,000 | 1,378,125 |
| Tranche B 1LN, term loan 4.75% 9/11/21 (b) | | 395,000 | 380,515 |
|
| TOTAL DIVERSIFIED FINANCIAL SERVICES | | | 1,758,640 |
|
| Energy - 0.3% | | | |
| Crestwood Holdings Partners LLC Tranche B, term loan 9% 6/19/19 (b) | | 2,402,916 | 2,104,546 |
| Seadrill Operating LP Tranche B, term loan 4% 2/21/21 (b) | | 2,019,821 | 896,801 |
|
| TOTAL ENERGY | | | 3,001,347 |
|
| Food & Drug Retail - 0.1% | | | |
| Albertson's LLC Tranche B 6LN, term loan 4.75% 6/22/23 (b) | | 685,000 | 683,116 |
| Pizza Hut Holdings LLC Tranche B, term loan 3.1923% 6/16/23 (b) | | 345,000 | 345,000 |
|
| TOTAL FOOD & DRUG RETAIL | | | 1,028,116 |
|
| Gaming - 0.6% | | | |
| Caesars Growth Properties Holdings, LLC Tranche 1LN, term loan 6.25% 5/8/21 (b) | | 2,721,801 | 2,549,429 |
| Scientific Games Corp. Tranche B 2LN, term loan 6% 10/1/21 (b) | | 3,669,125 | 3,614,088 |
| Station Casinos LLC Tranche B, term loan 3.75% 6/8/23 (b) | | 485,000 | 481,969 |
|
| TOTAL GAMING | | | 6,645,486 |
|
| Healthcare - 0.3% | | | |
| Valeant Pharmaceuticals International, Inc.: | | | |
| Tranche A 3LN, term loan 3.72% 10/20/18 (b) | | 1,875,489 | 1,822,975 |
| Tranche BD 2LN, term loan 4.5% 2/13/19 (b) | | 2,322,679 | 2,255,182 |
|
| TOTAL HEALTHCARE | | | 4,078,157 |
|
| Leisure - 0.0% | | | |
| 24 Hour Fitness Worldwide, Inc. Tranche B, term loan 4.75% 5/30/21 (b) | | 318,500 | 306,158 |
| Publishing/Printing - 0.3% | | | |
| McGraw-Hill Global Education Holdings, LLC term loan 5% 5/4/22 (b) | | 620,000 | 618,295 |
| Springer Science+Business Media Deutschland GmbH Tranche B 9LN, term loan 4.5% 8/14/20 (b) | | 3,621,296 | 3,476,445 |
|
| TOTAL PUBLISHING/PRINTING | | | 4,094,740 |
|
| Services - 1.3% | | | |
| Acosta, Inc. Tranche B, term loan 4.25% 9/26/21 (b) | | 1,470,000 | 1,411,200 |
| Brand Energy & Infrastructure Services, Inc. Tranche B, term loan 4.75% 11/26/20 (b) | | 4,407,000 | 4,280,299 |
| Garda World Security Corp.: | | | |
| term loan 4.0039% 11/8/20 (b) | | 1,566,615 | 1,518,049 |
| Tranche DD, term loan 4.0039% 11/8/20 (b) | | 594,431 | 576,004 |
| Laureate Education, Inc. Tranche B, term loan 5% 6/16/18 (b) | | 4,811,626 | 4,653,227 |
| Lineage Logistics Holdings, LLC. Tranche B, term loan 4.5% 4/7/21 (b) | | 2,645,254 | 2,499,765 |
|
| TOTAL SERVICES | | | 14,938,544 |
|
| Super Retail - 0.4% | | | |
| JC Penney Corp., Inc. Tranche B, term loan 5.25% 6/23/23 (b) | | 2,785,000 | 2,762,386 |
| PetSmart, Inc. Tranche B, term loan 4.25% 3/11/22 (b) | | 1,566,045 | 1,558,027 |
|
| TOTAL SUPER RETAIL | | | 4,320,413 |
|
| Technology - 0.8% | | | |
| Blue Coat Systems, Inc. Tranche B, term loan 4.5% 5/22/22 (b) | | 2,711,375 | 2,707,145 |
| Epicor Software Corp. Tranche B, term loan 4.75% 6/1/22 (b) | | 2,089,173 | 2,049,353 |
| Kronos, Inc. Tranche 2LN, term loan 9.75% 4/30/20 (b) | | 2,314,453 | 2,324,104 |
| TTM Technologies, Inc. Tranche B 1LN, term loan 6% 5/31/21 (b) | | 1,855,152 | 1,836,601 |
|
| TOTAL TECHNOLOGY | | | 8,917,203 |
|
| Telecommunications - 0.3% | | | |
| LTS Buyer LLC Tranche B 1LN, term loan 4% 4/11/20 (b) | | 3,370,255 | 3,330,250 |
| Utilities - 0.8% | | | |
| Calpine Corp. Tranche B 6LN, term loan 4% 1/1/23 (b) | | 2,517,350 | 2,492,177 |
| Moxie Patriot LLC Tranche B, term loan 6.75% 12/19/20 (b) | | 5,650,000 | 5,395,750 |
| Tempus Public Foundation Generation Holdings LLC Tranche B, term loan 4.75% 12/31/17 (b) | | 1,253,538 | 1,190,862 |
|
| TOTAL UTILITIES | | | 9,078,789 |
|
| TOTAL BANK LOAN OBLIGATIONS | | | |
| (Cost $86,732,613) | | | 85,327,171 |
|
| Preferred Securities - 7.3% | | | |
| Banks & Thrifts - 7.0% | | | |
| BAC Capital Trust XIV 4% (b)(d) | | 1,165,000 | 873,549 |
| Bank of America Corp.: | | | |
| 6.1% (b)(d) | | 4,370,000 | 4,512,334 |
| 6.25% (b)(d) | | 1,550,000 | 1,605,243 |
| Barclays Bank PLC 7.625% 11/21/22 | | 15,315,000 | 16,612,873 |
| Barclays PLC: | | | |
| 6.625% (b)(d) | | 6,035,000 | 5,403,621 |
| 8.25% (b)(d) | | 2,900,000 | 2,845,036 |
| BNP Paribas SA 7.375% (a)(b)(d) | | 2,955,000 | 2,972,574 |
| Citigroup, Inc.: | | | |
| 5.875% (b)(d) | | 1,460,000 | 1,423,976 |
| 5.95% (b)(d) | | 1,775,000 | 1,769,088 |
| 6.125% (b)(d) | | 4,250,000 | 4,346,996 |
| 6.3% (b)(d) | | 6,770,000 | 6,789,946 |
| Credit Agricole SA: | | | |
| 6.625% (a)(b)(d) | | 12,405,000 | 11,275,403 |
| 7.875% (a)(b)(d) | | 2,125,000 | 2,033,013 |
| 8.125% (a)(b)(d) | | 1,755,000 | 1,746,103 |
| JPMorgan Chase & Co. 6% (b)(d) | | 2,890,000 | 3,023,345 |
| Lloyds Banking Group PLC 7.5% (b)(d) | | 4,110,000 | 4,020,876 |
| Royal Bank of Scotland Group PLC: | | | |
| 7.5% (b)(d) | | 4,220,000 | 3,862,160 |
| 8% (b)(d) | | 4,885,000 | 4,556,324 |
| Societe Generale 8% (a)(b)(d) | | 1,940,000 | 1,891,179 |
|
| TOTAL BANKS & THRIFTS | | | 81,563,639 |
|
| Diversified Financial Services - 0.3% | | | |
| American Express Co. 4.9% (b)(d) | | 4,290,000 | 4,164,005 |
| TOTAL PREFERRED SECURITIES | | | |
| (Cost $86,901,119) | | | 85,727,644 |
| | | Shares | Value |
|
| Money Market Funds - 1.3% | | | |
| Fidelity Cash Central Fund, 0.43% (e) | | | |
| (Cost $15,625,071) | | 15,625,071 | 15,625,071 |
| TOTAL INVESTMENT PORTFOLIO - 96.2% | | | |
| (Cost $1,157,684,346) | | | 1,128,478,394 |
| NET OTHER ASSETS (LIABILITIES) - 3.8% | | | 44,610,287 |
| NET ASSETS - 100% | | | $1,173,088,681 |
Legend
(a) Security exempt from registration under Rule 144A of the Securities Act of 1933. These securities may be resold in transactions exempt from registration, normally to qualified institutional buyers. At the end of the period, the value of these securities amounted to $506,891,718 or 43.2% of net assets.
(b) Coupon rates for floating and adjustable rate securities reflect the rates in effect at period end.
(c) Non-income producing
(d) Security is perpetual in nature with no stated maturity date.
(e) Affiliated fund that is generally available only to investment companies and other accounts managed by Fidelity Investments. The rate quoted is the annualized seven-day yield of the fund at period end. A complete unaudited listing of the fund's holdings as of its most recent quarter end is available upon request. In addition, each Fidelity Central Fund's financial statements are available on the SEC's website or upon request.
Affiliated Central Funds
Information regarding fiscal year to date income earned by the Fund from investments in Fidelity Central Funds is as follows:
| Fund | Income earned |
| Fidelity Cash Central Fund | $102,371 |
Investment Valuation
The following is a summary of the inputs used, as of June 30, 2016, involving the Fund's assets and liabilities carried at fair value. The inputs or methodology used for valuing securities may not be an indication of the risk associated with investing in those securities. For more information on valuation inputs, and their aggregation into the levels used below, please refer to the Investment Valuation section in the accompanying Notes to Financial Statements.
| | Valuation Inputs at Reporting Date: |
| Description | Total | Level 1 | Level 2 | Level 3 |
| Investments in Securities: | | | | |
| Equities: | | | | |
| Energy | $4,484,900 | $4,484,900 | $-- | $-- |
| Health Care | 3,248 | 3,248 | -- | -- |
| Telecommunication Services | 35,011 | -- | -- | 35,011 |
| Corporate Bonds | 937,275,349 | -- | 937,275,349 | -- |
| Bank Loan Obligations | 85,327,171 | -- | 85,327,171 | -- |
| Preferred Securities | 85,727,644 | -- | 85,727,644 | -- |
| Money Market Funds | 15,625,071 | 15,625,071 | -- | -- |
| Total Investments in Securities: | $1,128,478,394 | $20,113,219 | $1,108,330,164 | $35,011 |
Other Information
Distribution of investments by country or territory of incorporation, as a percentage of Total Net Assets, is as follows (Unaudited):
| United States of America | 73.9% |
| Luxembourg | 5.0% |
| Canada | 4.6% |
| United Kingdom | 4.0% |
| Cayman Islands | 2.1% |
| France | 2.1% |
| Austria | 1.8% |
| Bermuda | 1.6% |
| Ireland | 1.3% |
| Barbados | 1.2% |
| Netherlands | 1.0% |
| Others (Individually Less Than 1%) | 1.4% |
| | 100.0% |
See accompanying notes which are an integral part of the financial statements.
Financial Statements
Statement of Assets and Liabilities
| | | June 30, 2016 (Unaudited) |
| Assets | | |
Investment in securities, at value — See accompanying schedule:
Unaffiliated issuers (cost $1,142,059,275) | $1,112,853,323 | |
| Fidelity Central Funds (cost $15,625,071) | 15,625,071 | |
| Total Investments (cost $1,157,684,346) | | $1,128,478,394 |
| Cash | | 148,229 |
| Receivable for investments sold | | 29,184,286 |
| Receivable for fund shares sold | | 1,137,853 |
| Dividends receivable | | 116,406 |
| Interest receivable | | 18,198,207 |
| Distributions receivable from Fidelity Central Funds | | 14,917 |
| Other receivables | | 2,988 |
| Total assets | | 1,177,281,280 |
| Liabilities | | |
| Payable for investments purchased | $2,912,081 | |
| Payable for fund shares redeemed | 493,521 | |
| Accrued management fee | 565,912 | |
| Distribution and service plan fees payable | 52,134 | |
| Other affiliated payables | 117,044 | |
| Other payables and accrued expenses | 51,907 | |
| Total liabilities | | 4,192,599 |
| Net Assets | | $1,173,088,681 |
| Net Assets consist of: | | |
| Paid in capital | | $1,280,214,474 |
| Undistributed net investment income | | 39,597,249 |
| Accumulated undistributed net realized gain (loss) on investments | | (117,517,090) |
| Net unrealized appreciation (depreciation) on investments | | (29,205,952) |
| Net Assets | | $1,173,088,681 |
| Initial Class: | | |
| Net Asset Value, offering price and redemption price per share ($447,604,914 ÷ 84,711,948 shares) | | $5.28 |
| Service Class: | | |
| Net Asset Value, offering price and redemption price per share ($96,130,168 ÷ 18,323,925 shares) | | $5.25 |
| Service Class 2: | | |
| Net Asset Value, offering price and redemption price per share ($180,638,152 ÷ 35,320,547 shares) | | $5.11 |
| Investor Class: | | |
| Net Asset Value, offering price and redemption price per share ($448,715,447 ÷ 85,297,755 shares) | | $5.26 |
See accompanying notes which are an integral part of the financial statements.
Statement of Operations
| | | Six months ended June 30, 2016 (Unaudited) |
| Investment Income | | |
| Dividends | | $3,125,165 |
| Interest | | 37,385,095 |
| Income from Fidelity Central Funds | | 102,371 |
| Total income | | 40,612,631 |
| Expenses | | |
| Management fee | $3,185,952 | |
| Transfer agent fees | 457,188 | |
| Distribution and service plan fees | 285,032 | |
| Accounting fees and expenses | 199,496 | |
| Custodian fees and expenses | 7,242 | |
| Independent trustees' fees and expenses | 2,496 | |
| Audit | 50,635 | |
| Legal | 3,468 | |
| Miscellaneous | 4,976 | |
| Total expenses before reductions | 4,196,485 | |
| Expense reductions | (2,938) | 4,193,547 |
| Net investment income (loss) | | 36,419,084 |
| Realized and Unrealized Gain (Loss) | | |
| Net realized gain (loss) on: | | |
| Investment securities: | | |
| Unaffiliated issuers | (50,537,488) | |
| Total net realized gain (loss) | | (50,537,488) |
| Change in net unrealized appreciation (depreciation) on investment securities | | 91,050,323 |
| Net gain (loss) | | 40,512,835 |
| Net increase (decrease) in net assets resulting from operations | | $76,931,919 |
See accompanying notes which are an integral part of the financial statements.
Statement of Changes in Net Assets
| | Six months ended June 30, 2016 (Unaudited) | Year ended December 31, 2015 |
| Increase (Decrease) in Net Assets | | |
| Operations | | |
| Net investment income (loss) | $36,419,084 | $74,112,311 |
| Net realized gain (loss) | (50,537,488) | (34,846,782) |
| Change in net unrealized appreciation (depreciation) | 91,050,323 | (75,703,629) |
| Net increase (decrease) in net assets resulting from operations | 76,931,919 | (36,438,100) |
| Distributions to shareholders from net investment income | – | (74,758,068) |
| Distributions to shareholders from tax return of capital | – | (1,702,445) |
| Total distributions | – | (76,460,513) |
| Share transactions - net increase (decrease) | 25,687,882 | (71,055,257) |
| Redemption fees | – | 4,877 |
| Total increase (decrease) in net assets | 102,619,801 | (183,948,993) |
| Net Assets | | |
| Beginning of period | 1,070,468,880 | 1,254,417,873 |
| End of period | $1,173,088,681 | $1,070,468,880 |
| Other Information | | |
| Undistributed net investment income end of period | $39,597,249 | $3,178,165 |
See accompanying notes which are an integral part of the financial statements.
Financial Highlights — VIP High Income Portfolio Initial Class
| | Six months ended (Unaudited) June 30, | Years ended December 31, | | | | |
| | 2016 | 2015 | 2014 | 2013 | 2012 | 2011 |
| Selected Per–Share Data | | | | | | |
| Net asset value, beginning of period | $4.95 | $5.52 | $5.80 | $5.81 | $5.39 | $5.57 |
| Income from Investment Operations | | | | | | |
| Net investment income (loss)A | .164 | .333 | .317 | .330 | .361 | .391 |
| Net realized and unrealized gain (loss) | .166 | (.531) | (.251) | .014 | .405 | (.171) |
| Total from investment operations | .330 | (.198) | .066 | .344 | .766 | .220 |
| Distributions from net investment income | – | (.364) | (.347) | (.354) | (.346) | (.400) |
| Tax return of capital | – | (.008) | – | – | – | – |
| Total distributions | – | (.372) | (.347) | (.354) | (.346) | (.400) |
| Redemption fees added to paid in capitalA | – | –B | .001 | –B | –B | –B |
| Net asset value, end of period | $5.28 | $4.95 | $5.52 | $5.80 | $5.81 | $5.39 |
| Total ReturnC,D,E | 6.67% | (3.63)% | 1.16% | 5.95% | 14.23% | 4.03% |
| Ratios to Average Net AssetsF,G | | | | | | |
| Expenses before reductions | .68%H | .68% | .68% | .68% | .68% | .69% |
| Expenses net of fee waivers, if any | .68%H | .68% | .68% | .68% | .68% | .69% |
| Expenses net of all reductions | .68%H | .68% | .68% | .68% | .68% | .69% |
| Net investment income (loss) | 6.50%H | 5.94% | 5.31% | 5.55% | 6.22% | 6.85% |
| Supplemental Data | | | | | | |
| Net assets, end of period (000 omitted) | $447,605 | $437,798 | $493,390 | $587,376 | $606,506 | $561,514 |
| Portfolio turnover rateI | 71%H | 69% | 79% | 85% | 55% | 79% |
A Calculated based on average shares outstanding during the period.
B Amount represents less than $.0005 per share.
C Total returns for periods of less than one year are not annualized.
D Total returns do not reflect charges attributable to your insurance company's separate account. Inclusion of these charges would reduce the total returns shown.
E Total returns would have been lower if certain expenses had not been reduced during the applicable periods shown.
F Fees and expenses of any underlying Fidelity Central Funds are not included in the Fund's expense ratio. The Fund indirectly bears its proportionate share of the expenses of any underlying Fidelity Central Funds.
G Expense ratios reflect operating expenses of the class. Expenses before reductions do not reflect amounts reimbursed by the investment adviser or reductions from brokerage service arrangements or reductions from other expense offset arrangements and do not represent the amount paid by the class during periods when reimbursements or reductions occur. Expenses net of fee waivers reflect expenses after reimbursement by the investment adviser but prior to reductions from brokerage service arrangements or other expense offset arrangements. Expenses net of all reductions represent the net expenses paid by the class.
H Annualized
I Amount does not include the portfolio activity of any underlying Fidelity Central Funds.
See accompanying notes which are an integral part of the financial statements.
Financial Highlights — VIP High Income Portfolio Service Class
| | Six months ended (Unaudited) June 30, | Years ended December 31, | | | | |
| | 2016 | 2015 | 2014 | 2013 | 2012 | 2011 |
| Selected Per–Share Data | | | | | | |
| Net asset value, beginning of period | $4.92 | $5.49 | $5.77 | $5.78 | $5.36 | $5.54 |
| Income from Investment Operations | | | | | | |
| Net investment income (loss)A | .159 | .324 | .309 | .323 | .353 | .384 |
| Net realized and unrealized gain (loss) | .171 | (.528) | (.248) | .015 | .407 | (.171) |
| Total from investment operations | .330 | (.204) | .061 | .338 | .760 | .213 |
| Distributions from net investment income | – | (.358) | (.342) | (.348) | (.340) | (.393) |
| Tax return of capital | – | (.008) | – | – | – | – |
| Total distributions | – | (.366) | (.342) | (.348) | (.340) | (.393) |
| Redemption fees added to paid in capitalA | – | –B | .001 | –B | –B | –B |
| Net asset value, end of period | $5.25 | $4.92 | $5.49 | $5.77 | $5.78 | $5.36 |
| Total ReturnC,D,E | 6.71% | (3.76)% | 1.07% | 5.87% | 14.20% | 3.93% |
| Ratios to Average Net AssetsF,G | | | | | | |
| Expenses before reductions | .78%H | .78% | .78% | .78% | .78% | .79% |
| Expenses net of fee waivers, if any | .78%H | .78% | .78% | .77% | .78% | .79% |
| Expenses net of all reductions | .78%H | .77% | .78% | .77% | .78% | .79% |
| Net investment income (loss) | 6.40%H | 5.84% | 5.22% | 5.46% | 6.13% | 6.75% |
| Supplemental Data | | | | | | |
| Net assets, end of period (000 omitted) | $96,130 | $73,313 | $59,961 | $68,982 | $77,397 | $91,573 |
| Portfolio turnover rateI | 71%H | 69% | 79% | 85% | 55% | 79% |
A Calculated based on average shares outstanding during the period.
B Amount represents less than $.0005 per share.
C Total returns for periods of less than one year are not annualized.
D Total returns do not reflect charges attributable to your insurance company's separate account. Inclusion of these charges would reduce the total returns shown.
E Total returns would have been lower if certain expenses had not been reduced during the applicable periods shown.
F Fees and expenses of any underlying Fidelity Central Funds are not included in the Fund's expense ratio. The Fund indirectly bears its proportionate share of the expenses of any underlying Fidelity Central Funds.
G Expense ratios reflect operating expenses of the class. Expenses before reductions do not reflect amounts reimbursed by the investment adviser or reductions from brokerage service arrangements or reductions from other expense offset arrangements and do not represent the amount paid by the class during periods when reimbursements or reductions occur. Expenses net of fee waivers reflect expenses after reimbursement by the investment adviser but prior to reductions from brokerage service arrangements or other expense offset arrangements. Expenses net of all reductions represent the net expenses paid by the class.
H Annualized
I Amount does not include the portfolio activity of any underlying Fidelity Central Funds.
See accompanying notes which are an integral part of the financial statements.
Financial Highlights — VIP High Income Portfolio Service Class 2
| | Six months ended (Unaudited) June 30, | Years ended December 31, | | | | |
| | 2016 | 2015 | 2014 | 2013 | 2012 | 2011 |
| Selected Per–Share Data | | | | | | |
| Net asset value, beginning of period | $4.80 | $5.36 | $5.64 | $5.66 | $5.26 | $5.45 |
| Income from Investment Operations | | | | | | |
| Net investment income (loss)A | .152 | .309 | .294 | .307 | .338 | .368 |
| Net realized and unrealized gain (loss) | .158 | (.514) | (.244) | .014 | .396 | (.170) |
| Total from investment operations | .310 | (.205) | .050 | .321 | .734 | .198 |
| Distributions from net investment income | – | (.347) | (.331) | (.341) | (.334) | (.388) |
| Tax return of capital | – | (.008) | – | – | – | – |
| Total distributions | – | (.355) | (.331) | (.341) | (.334) | (.388) |
| Redemption fees added to paid in capitalA | – | –B | .001 | –B | –B | –B |
| Net asset value, end of period | $5.11 | $4.80 | $5.36 | $5.64 | $5.66 | $5.26 |
| Total ReturnC,D,E | 6.46% | (3.87)% | .90% | 5.70% | 13.97% | 3.72% |
| Ratios to Average Net AssetsF,G | | | | | | |
| Expenses before reductions | .93%H | .93% | .93% | .93% | .93% | .94% |
| Expenses net of fee waivers, if any | .93%H | .93% | .93% | .92% | .93% | .94% |
| Expenses net of all reductions | .93%H | .93% | .93% | .92% | .93% | .94% |
| Net investment income (loss) | 6.25%H | 5.68% | 5.06% | 5.31% | 5.98% | 6.60% |
| Supplemental Data | | | | | | |
| Net assets, end of period (000 omitted) | $180,638 | $160,639 | $190,873 | $280,444 | $281,065 | $220,333 |
| Portfolio turnover rateI | 71%H | 69% | 79% | 85% | 55% | 79% |
A Calculated based on average shares outstanding during the period.
B Amount represents less than $.0005 per share.
C Total returns for periods of less than one year are not annualized.
D Total returns do not reflect charges attributable to your insurance company's separate account. Inclusion of these charges would reduce the total returns shown.
E Total returns would have been lower if certain expenses had not been reduced during the applicable periods shown.
F Fees and expenses of any underlying Fidelity Central Funds are not included in the Fund's expense ratio. The Fund indirectly bears its proportionate share of the expenses of any underlying Fidelity Central Funds.
G Expense ratios reflect operating expenses of the class. Expenses before reductions do not reflect amounts reimbursed by the investment adviser or reductions from brokerage service arrangements or reductions from other expense offset arrangements and do not represent the amount paid by the class during periods when reimbursements or reductions occur. Expenses net of fee waivers reflect expenses after reimbursement by the investment adviser but prior to reductions from brokerage service arrangements or other expense offset arrangements. Expenses net of all reductions represent the net expenses paid by the class.
H Annualized
I Amount does not include the portfolio activity of any underlying Fidelity Central Funds.
See accompanying notes which are an integral part of the financial statements.
Financial Highlights — VIP High Income Portfolio Investor Class
| | Six months ended (Unaudited) June 30, | Years ended December 31, | | | | |
| | 2016 | 2015 | 2014 | 2013 | 2012 | 2011 |
| Selected Per–Share Data | | | | | | |
| Net asset value, beginning of period | $4.93 | $5.50 | $5.78 | $5.79 | $5.37 | $5.56 |
| Income from Investment Operations | | | | | | |
| Net investment income (loss)A | .162 | .329 | .314 | .327 | .358 | .388 |
| Net realized and unrealized gain (loss) | .168 | (.529) | (.250) | .016 | .407 | (.180) |
| Total from investment operations | .330 | (.200) | .064 | .343 | .765 | .208 |
| Distributions from net investment income | – | (.362) | (.345) | (.353) | (.345) | (.398) |
| Tax return of capital | – | (.008) | – | – | – | – |
| Total distributions | – | (.370) | (.345) | (.353) | (.345) | (.398) |
| Redemption fees added to paid in capitalA | – | –B | .001 | –B | –B | –B |
| Net asset value, end of period | $5.26 | $4.93 | $5.50 | $5.78 | $5.79 | $5.37 |
| Total ReturnC,D,E | 6.69% | (3.68)% | 1.12% | 5.95% | 14.26% | 3.82% |
| Ratios to Average Net AssetsF,G | | | | | | |
| Expenses before reductions | .71%H | .71% | .71% | .71% | .71% | .72% |
| Expenses net of fee waivers, if any | .71%H | .71% | .71% | .71% | .71% | .72% |
| Expenses net of all reductions | .71%H | .71% | .71% | .71% | .71% | .72% |
| Net investment income (loss) | 6.47%H | 5.90% | 5.28% | 5.52% | 6.20% | 6.82% |
| Supplemental Data | | | | | | |
| Net assets, end of period (000 omitted) | $448,715 | $398,719 | $448,590 | $499,630 | $438,772 | $284,370 |
| Portfolio turnover rateI | 71%H | 69% | 79% | 85% | 55% | 79% |
A Calculated based on average shares outstanding during the period.
B Amount represents less than $.0005 per share.
C Total returns for periods of less than one year are not annualized.
D Total returns do not reflect charges attributable to your insurance company's separate account. Inclusion of these charges would reduce the total returns shown.
E Total returns would have been lower if certain expenses had not been reduced during the applicable periods shown.
F Fees and expenses of any underlying Fidelity Central Funds are not included in the Fund's expense ratio. The Fund indirectly bears its proportionate share of the expenses of any underlying Fidelity Central Funds.
G Expense ratios reflect operating expenses of the class. Expenses before reductions do not reflect amounts reimbursed by the investment adviser or reductions from brokerage service arrangements or reductions from other expense offset arrangements and do not represent the amount paid by the class during periods when reimbursements or reductions occur. Expenses net of fee waivers reflect expenses after reimbursement by the investment adviser but prior to reductions from brokerage service arrangements or other expense offset arrangements. Expenses net of all reductions represent the net expenses paid by the class.
H Annualized
I Amount does not include the portfolio activity of any underlying Fidelity Central Funds.
See accompanying notes which are an integral part of the financial statements.
Notes to Financial Statements (Unaudited)
For the period ended June 30, 2016
1. Organization.
VIP High Income Portfolio (the Fund) is a fund of Variable Insurance Products Fund (the Trust) and is authorized to issue an unlimited number of shares. The Trust is registered under the Investment Company Act of 1940, as amended (the 1940 Act), as an open-end management investment company organized as a Massachusetts business trust. Shares of the Fund may only be purchased by insurance companies for the purpose of funding variable annuity or variable life insurance contracts. The Fund offers the following classes of shares: Initial Class shares, Service Class shares, Service Class 2 shares and Investor Class shares. The Fund offered Initial Class R shares, Service Class R shares and Service Class 2R shares during the period April 14, 2004 through April 30, 2015, and all outstanding shares were converted to Initial Class shares, Service Class shares and Service Class 2 shares, respectively, by April 30, 2015. All classes have equal rights and voting privileges, except for matters affecting a single class.
2. Investments in Fidelity Central Funds.
The Fund invests in Fidelity Central Funds, which are open-end investment companies generally available only to other investment companies and accounts managed by the investment adviser and its affiliates. The Fund's Schedule of Investments lists each of the Fidelity Central Funds held as of period end, if any, as an investment of the Fund, but does not include the underlying holdings of each Fidelity Central Fund. As an Investing Fund, the Fund indirectly bears its proportionate share of the expenses of the underlying Fidelity Central Funds.
The Money Market Central Funds seek preservation of capital and current income and are managed by Fidelity Investments Money Management, Inc. (FIMM), an affiliate of the investment adviser. Annualized expenses of the Money Market Central Funds as of their most recent shareholder report date are less than .005%.
A complete unaudited list of holdings for each Fidelity Central Fund is available upon request or at the Securities and Exchange Commission (the SEC) website at www.sec.gov. In addition, the financial statements of the Fidelity Central Funds are available on the SEC website or upon request.
3. Significant Accounting Policies.
The financial statements have been prepared in conformity with accounting principles generally accepted in the United States of America (GAAP), which require management to make certain estimates and assumptions at the date of the financial statements. Actual results could differ from those estimates. Subsequent events, if any, through the date that the financial statements were issued have been evaluated in the preparation of the financial statements. The following summarizes the significant accounting policies of the Fund:
Investment Valuation. Investments are valued as of 4:00 p.m. Eastern time on the last calendar day of the period. The Board of Trustees (the Board) has delegated the day to day responsibility for the valuation of the Fund's investments to the Fidelity Management & Research Company (FMR) Fair Value Committee (the Committee). In accordance with valuation policies and procedures approved by the Board, the Fund attempts to obtain prices from one or more third party pricing vendors or brokers to value its investments. When current market prices, quotations or currency exchange rates are not readily available or reliable, investments will be fair valued in good faith by the Committee, in accordance with procedures adopted by the Board. Factors used in determining fair value vary by investment type and may include market or investment specific events, changes in interest rates and credit quality. The frequency with which these procedures are used cannot be predicted and they may be utilized to a significant extent. The Committee oversees the Fund's valuation policies and procedures and reports to the Board on the Committee's activities and fair value determinations. The Board monitors the appropriateness of the procedures used in valuing the Fund's investments and ratifies the fair value determinations of the Committee.
The Fund categorizes the inputs to valuation techniques used to value its investments into a disclosure hierarchy consisting of three levels as shown below:
- Level 1 – quoted prices in active markets for identical investments
- Level 2 – other significant observable inputs (including quoted prices for similar investments, interest rates, prepayment speeds, etc.)
- Level 3 – unobservable inputs (including the Fund's own assumptions based on the best information available)
Valuation techniques used to value the Fund's investments by major category are as follows:
Debt securities, including restricted securities, are valued based on evaluated prices received from third party pricing vendors or from brokers who make markets in such securities. Corporate bonds, bank loan obligations and preferred securities. are valued by pricing vendors who utilize matrix pricing which considers yield or price of bonds of comparable quality, coupon, maturity and type or by broker-supplied prices. When independent prices are unavailable or unreliable, debt securities may be valued utilizing pricing methodologies which consider similar factors that would be used by third party pricing vendors. Debt securities are generally categorized as Level 2 in the hierarchy but may be Level 3 depending on the circumstances. The Fund invests a significant portion of its assets in below investment grade securities. The value of these securities can be more volatile due to changes in the credit quality of the issuer and is sensitive to changes in economic, market and regulatory conditions.
Equity securities, including restricted securities, for which market quotations are readily available, are valued at the last reported sale price or official closing price as reported by a third party pricing vendor on the primary market or exchange on which they are traded and are categorized as Level 1 in the hierarchy. In the event there were no sales during the day or closing prices are not available, securities are valued at the last quoted bid price or may be valued using the last available price and are generally categorized as Level 2 in the hierarchy. For equity securities, including restricted securities, where observable inputs are limited, assumptions about market activity and risk are used and these securities may be categorized as Level 3 in the hierarchy.
Investments in open-end mutual funds, including the Fidelity Central Funds, are valued at their closing net asset value (NAV) each business day and are categorized as Level 1 in the hierarchy.
Changes in valuation techniques may result in transfers in or out of an assigned level within the disclosure hierarchy. The aggregate value of investments by input level as of June 30, 2016 is included at the end of the Fund's Schedule of Investments.
Investment Transactions and Income. For financial reporting purposes, the Fund's investment holdings and NAV include trades executed through the end of the last business day of the period. The NAV per share for processing shareholder transactions is calculated as of the close of business of the New York Stock Exchange (NYSE), normally 4:00 p.m. Eastern time and includes trades executed through the end of the prior business day. Gains and losses on securities sold are determined on the basis of identified cost and may include proceeds received from litigation. Dividend income is recorded on the ex-dividend date, except for certain dividends from foreign securities where the ex-dividend date may have passed, which are recorded as soon as the Fund is informed of the ex-dividend date. Non-cash dividends included in dividend income, if any, are recorded at the fair market value of the securities received. Income and capital gain distributions from Fidelity Central Funds, if any, are recorded on the ex-dividend date. Interest income is accrued as earned and includes coupon interest and amortization of premium and accretion of discount on debt securities as applicable. Debt obligations may be placed on non-accrual status and related interest income may be reduced by ceasing current accruals and writing off interest receivables when the collection of all or a portion of interest has become doubtful based on consistently applied procedures. A debt obligation is removed from non-accrual status when the issuer resumes interest payments or when collectability of interest is reasonably assured.
Class Allocations and Expenses. Investment income, realized and unrealized capital gains and losses, common expenses of the Fund, and certain fund-level expense reductions, if any, are allocated daily on a pro-rata basis to each class based on the relative net assets of each class to the total net assets of the Fund. Each class differs with respect to transfer agent and distribution and service plan fees incurred. Certain expense reductions may also differ by class. For the reporting period, the allocated portion of income and expenses to each class as a percent of its average net assets may vary due to the timing of recording these transactions in relation to fluctuating net assets of the classes. Expenses directly attributable to a fund are charged to that fund. Expenses attributable to more than one fund are allocated among the respective funds on the basis of relative net assets or other appropriate methods. Expense estimates are accrued in the period to which they relate and adjustments are made when actual amounts are known.
Income Tax Information and Distributions to Shareholders. Each year, the Fund intends to qualify as a regulated investment company under Subchapter M of the Internal Revenue Code, including distributing substantially all of its taxable income and realized gains. As a result, no provision for U.S. Federal income taxes is required. The Fund files a U.S. federal tax return, in addition to state and local tax returns as required. The Fund's federal income tax returns are subject to examination by the Internal Revenue Service (IRS) for a period of three fiscal years after they are filed. State and local tax returns may be subject to examination for an additional fiscal year depending on the jurisdiction.
Distributions are declared and recorded on the ex-dividend date. Income dividends and capital gain distributions are declared separately for each class. Income and capital gain distributions are determined in accordance with income tax regulations, which may differ from GAAP.
Capital accounts within the financial statements are adjusted for permanent book-tax differences. These adjustments have no impact on net assets or the results of operations. Capital accounts are not adjusted for temporary book-tax differences which will reverse in a subsequent period.
Book-tax differences are primarily due to market discount, deferred trustees compensation, capital loss carryforwards and losses deferred due to wash sales.
The federal tax cost of investment securities and unrealized appreciation (depreciation) as of period end were as follows:
| Gross unrealized appreciation | $25,277,470 |
| Gross unrealized depreciation | (51,923,206) |
| Net unrealized appreciation (depreciation) on securities | $(26,645,736) |
| Tax cost | $1,155,124,130 |
Capital loss carryforwards are only available to offset future capital gains of the Fund to the extent provided by regulations and may be limited. Under the Regulated Investment Company Modernization Act of 2010 (the Act), the Fund is permitted to carry forward capital losses incurred in taxable years beginning after December 22, 2010 for an unlimited period and such capital losses are required to be used prior to any losses that expire. The capital loss carryforward information presented below, including any applicable limitation, is estimated as of prior fiscal period end and is subject to adjustment.
| Fiscal year of expiration | |
| 2017 | $(32,444,142) |
| No expiration | |
| Short-term | (18,773,155) |
| Long-term | (15,725,577) |
| Total no expiration | (34,498,732) |
| Total capital loss carryforward | $(66,942,874) |
Restricted Securities. The Fund may invest in securities that are subject to legal or contractual restrictions on resale. These securities generally may be resold in transactions exempt from registration or to the public if the securities are registered. Disposal of these securities may involve time-consuming negotiations and expense, and prompt sale at an acceptable price may be difficult. Information regarding restricted securities is included at the end of the Fund's Schedule of Investments.
Loans and Other Direct Debt Instruments. The Fund invests in direct debt instruments which are interests in amounts owed to lenders by corporate or other borrowers. These instruments may be in the form of loans, trade claims or other receivables and may include standby financing commitments such as revolving credit facilities that obligate the Fund to supply additional cash to the borrower on demand. Loans may be acquired through assignment or participation. The Fund did not have any unfunded loan commitments, which are contractual obligations for future funding, at period end.
4. Purchases and Sales of Investments.
Purchases and sales of securities, other than short-term securities, aggregated $452,706,674 and $375,061,447, respectively.
5. Fees and Other Transactions with Affiliates.
Management Fee. Fidelity Management & Research Company (the investment adviser) and its affiliates provide the Fund with investment management related services for which the Fund pays a monthly management fee. The management fee is the sum of an individual fund fee rate that is based on an annual rate of .45% of the Fund's average net assets and an annualized group fee rate that averaged .11% during the period. The group fee rate is based upon the average net assets of all the mutual funds advised by the investment adviser, including any mutual funds previously advised by the investment adviser that are currently advised by Fidelity SelectCo, LLC, an affiliate of the investment adviser. The group fee rate decreases as assets under management increase and increases as assets under management decrease. For the reporting period, the total annualized management fee rate was .56% of the Fund's average net assets.
Distribution and Service Plan Fees. In accordance with Rule 12b-1 of the 1940 Act, the Fund has adopted separate 12b-1 Plans for each Service Class of shares. Each Service Class pays Fidelity Distributors Corporation (FDC), an affiliate of the investment adviser, a service fee. For the period, the service fee is based on an annual rate of .10% of Service Class' average net assets and .25% of Service Class 2's average net assets.
For the period, total fees, all of which were re-allowed to insurance companies for the distribution of shares and providing shareholder support services, were as follows:
| Service Class | $45,354 |
| Service Class 2 | 239,678 |
| | $285,032 |
Transfer Agent Fees. Fidelity Investments Institutional Operations Company, Inc. (FIIOC), an affiliate of the investment adviser, is the Fund's transfer, dividend disbursing, and shareholder servicing agent. FIIOC receives an asset-based fee with respect to each class. Each class (with the exception of Investor Class) pays a fee for transfer agent services, typesetting, printing and mailing of shareholder reports, excluding mailing of proxy statements, equal to an annual rate of .07% ( .10% for Investor Class) of class-level average net assets. For the period, transfer agent fees for each class, including out of pocket expenses, were as follows:
| Initial Class | $148,501 |
| Service Class | 30,840 |
| Service Class 2 | 65,192 |
| Investor Class | 212,655 |
| | $457,188 |
Accounting Fees. Fidelity Service Company, Inc. (FSC), an affiliate of the investment adviser, maintains the Fund's accounting records. The fee is based on the level of average net assets for each month.
Interfund Trades. The Fund may purchase from or sell securities to other Fidelity Funds under procedures adopted by the Board. The procedures have been designed to ensure these interfund trades are executed in accordance with Rule 17a-7 of the 1940 Act. Interfund trades are included within the respective purchases and sales amounts shown in the Purchases and Sales of Investments note.
6. Committed Line of Credit.
The Fund participates with other funds managed by the investment adviser or an affiliate in a $4.25 billion credit facility (the "line of credit") to be utilized for temporary or emergency purposes to fund shareholder redemptions or for other short-term liquidity purposes. The Fund has agreed to pay commitment fees on its pro-rata portion of the line of credit, which amounted to $971 and is reflected in Miscellaneous expenses on the Statement of Operations. During the period, the Fund did not borrow on this line of credit.
7. Expense Reductions.
Through arrangements with the Fund's custodian, credits realized as a result of certain uninvested cash balances were used to reduce the Fund's expenses. During the period, these credits reduced the Fund's custody expenses by $687.
In addition, during the period the investment adviser reimbursed and/or waived a portion of fund-level operating expenses in the amount of $2,251.
8. Distributions to Shareholders.
Distributions to shareholders of each class were as follows:
| | Six months ended
June 30, 2016 | Year ended December 31, 2015 |
| From net investment income | | |
| Initial Class | $– | $30,271,360 |
| Service Class | – | 5,021,552 |
| Service Class 2 | – | 11,158,618 |
| Initial Class R | – | 66,398 |
| Service Class R | – | 141,656 |
| Service Class 2R | – | 16,973 |
| Investor Class | – | 28,081,511 |
| Total | $– | $74,758,068 |
| Tax Return of Capital | | |
| Initial Class | $– | $689,361 |
| Service Class | – | 114,354 |
| Service Class 2 | – | 254,112 |
| Initial Class R | – | 1,512 |
| Service Class R | – | 3,226 |
| Service Class 2R | – | 387 |
| Investor Class | – | 639,493 |
| Total | $– | $1,702,445 |
9. Share Transactions.
Transactions for each class of shares were as follows:
| | Shares | Shares | Dollars | Dollars |
| | Six months ended
June 30, 2016 | Year ended December 31, 2015 | Six months ended
June 30, 2016 | Year ended December 31, 2015 |
| Initial Class | | | | |
| Shares sold | 5,047,844 | 13,536,727 | $25,359,425 | $76,672,620 |
| Reinvestment of distributions | – | 6,201,148 | – | 30,960,721 |
| Shares redeemed | (8,706,206) | (20,735,059) | (43,981,413) | (116,078,980) |
| Net increase (decrease) | (3,658,362) | (997,184) | $(18,621,988) | $(8,445,639) |
| Service Class | | | | |
| Shares sold | 5,965,127 | 12,073,949 | $28,705,812 | $68,857,945 |
| Reinvestment of distributions | – | 1,036,172 | – | 5,135,906 |
| Shares redeemed | (2,537,392) | (9,143,701) | (12,838,952) | (51,198,724) |
| Net increase (decrease) | 3,427,735 | 3,966,420 | $15,866,860 | $22,795,127 |
| Service Class 2 | | | | |
| Shares sold | 17,275,448 | 36,910,424 | $81,783,101 | $200,274,021 |
| Reinvestment of distributions | – | 2,353,211 | – | 11,412,730 |
| Shares redeemed | (15,404,881) | (41,437,258) | (75,889,006) | (225,020,406) |
| Net increase (decrease) | 1,870,567 | (2,173,623) | $5,894,095 | $(13,333,655) |
| Initial Class R | | | | |
| Shares sold | – | 193,583 | $– | $1,076,984 |
| Reinvestment of distributions | – | 12,170 | – | 67,910 |
| Shares redeemed | – | (5,091,711) | – | (29,179,152) |
| Net increase (decrease) | – | (4,885,958) | $– | $(28,034,258) |
| Service Class R | | | | |
| Shares sold | – | 5,079,109 | $– | $27,805,540 |
| Reinvestment of distributions | – | 26,152 | – | 144,882 |
| Shares redeemed | – | (10,664,423) | – | (60,715,382) |
| Net increase (decrease) | – | (5,559,162) | $– | $(32,764,960) |
| Service Class 2R | | | | |
| Shares sold | – | 614,607 | $– | $3,317,430 |
| Reinvestment of distributions | – | 3,185 | – | 17,360 |
| Shares redeemed | – | (1,439,867) | – | (8,022,465) |
| Net increase (decrease) | – | (822,075) | $– | $(4,687,675) |
| Investor Class | | | | |
| Shares sold | 10,777,481 | 13,320,286 | $54,012,212 | $74,226,245 |
| Reinvestment of distributions | – | 5,775,386 | – | 28,721,004 |
| Shares redeemed | (6,296,786) | (19,855,536) | (31,463,297) | (109,531,446) |
| Net increase (decrease) | 4,480,695 | (759,864) | $22,548,915 | $(6,584,197) |
10. Other.
The Fund's organizational documents provide former and current trustees and officers with a limited indemnification against liabilities arising in connection with the performance of their duties to the Fund. In the normal course of business, the Fund may also enter into contracts that provide general indemnifications. The Fund's maximum exposure under these arrangements is unknown as this would be dependent on future claims that may be made against the Fund. The risk of material loss from such claims is considered remote.
At the end of the period, the investment adviser or its affiliates were the owners of record of 44% of the total outstanding shares of the Fund and one otherwise unaffiliated shareholder was the owner of record of 15% of the total outstanding shares of the Fund.
Shareholder Expense Example
As a shareholder of the Fund, you incur two types of costs: (1) transaction costs, and (2) ongoing costs, including management fees, distribution and/or service (12b-1) fees and other Fund expenses. This Example is intended to help you understand your ongoing costs (in dollars) of investing in the Fund and to compare these costs with the ongoing costs of investing in other mutual funds.
The Example is based on an investment of $1,000 invested at the beginning of the period and held for the entire period (January 1, 2016 to June 30, 2016).
Actual Expenses
The first line of the accompanying table for each class of the Fund provides information about actual account values and actual expenses. You may use the information in this line, together with the amount you invested, to estimate the expenses that you paid over the period. Simply divide your account value by $1,000.00 (for example, an $8,600 account value divided by $1,000.00 = 8.6), then multiply the result by the number in the first line for a class of the Fund under the heading entitled "Expenses Paid During Period" to estimate the expenses you paid on your account during this period. The estimate of expenses does not include any fees or other expenses of any variable annuity or variable life insurance product. If they were, the estimate of expenses you paid during the period would be higher, and your ending account value would be lower. In addition, the Fund, as a shareholder in the underlying Fidelity Central Funds, will indirectly bear its pro-rata share of the fees and expenses incurred by the underlying Fidelity Central Funds. These fees and expenses are not included in the Fund's annualized expense ratio used to calculate the expense estimate in the table below.
Hypothetical Example for Comparison Purposes
The second line of the accompanying table for each class of the Fund provides information about hypothetical account values and hypothetical expenses based on a Class' actual expense ratio and an assumed rate of return of 5% per year before expenses, which is not the Class' actual return. The hypothetical account values and expenses may not be used to estimate the actual ending account balance or expenses you paid for the period. You may use this information to compare the ongoing costs of investing in the Fund and other funds. To do so, compare this 5% hypothetical example with the 5% hypothetical examples that appear in the shareholder reports of the other funds. The estimate of expenses does not include any fees or other expenses of any variable annuity or variable life insurance product. If they were, the estimate of expenses you paid during the period would be higher, and your ending account value would be lower. In addition, the Fund, as a shareholder in the underlying Fidelity Central Funds, will indirectly bear its pro-rata share of the fees and expenses incurred by the underlying Fidelity Central Funds. These fees and expenses are not included in the Fund's annualized expense ratio used to calculate the expense estimate in the table below.
Please note that the expenses shown in the table are meant to highlight your ongoing costs only and do not reflect any transaction costs. Therefore, the second line of the table is useful in comparing ongoing costs only, and will not help you determine the relative total costs of owning different funds.
| | Annualized Expense Ratio-A | Beginning
Account Value
January 1, 2016 | Ending
Account Value
June 30, 2016 | Expenses Paid
During Period-B
January 1, 2016
to June 30, 2016 |
| Initial Class | .68% | | | |
| Actual | | $1,000.00 | $1,066.70 | $3.49 |
| Hypothetical-C | | $1,000.00 | $1,021.48 | $3.42 |
| Service Class | .78% | | | |
| Actual | | $1,000.00 | $1,067.10 | $4.01 |
| Hypothetical-C | | $1,000.00 | $1,020.98 | $3.92 |
| Service Class 2 | .93% | | | |
| Actual | | $1,000.00 | $1,064.60 | $4.77 |
| Hypothetical-C | | $1,000.00 | $1,020.24 | $4.67 |
| Investor Class | .71% | | | |
| Actual | | $1,000.00 | $1,066.90 | $3.65 |
| Hypothetical-C | | $1,000.00 | $1,021.33 | $3.57 |
A Annualized expense ratio reflects expenses net of applicable fee waivers.
B Expenses are equal to each Class' annualized expense ratio, multiplied by the average account value over the period, multiplied by 182/366 (to reflect the one-half year period).
C 5% return per year before expenses
VIPHI-SANN-0816
1.705694.118
Fidelity® Variable Insurance Products: Overseas Portfolio
Semi-Annual Report June 30, 2016 |
|
Contents
To view a fund's proxy voting guidelines and proxy voting record for the 12-month period ended June 30, visit http://www.fidelity.com/proxyvotingresults or visit the Securities and Exchange Commission's (SEC) web site at http://www.sec.gov.
You may also call 1-877-208-0098 to request a free copy of the proxy voting guidelines.
Fidelity® Variable Insurance Products are separate account options which are purchased through a variable insurance contract.
Standard & Poor's, S&P and S&P 500 are registered service marks of The McGraw-Hill Companies, Inc. and have been licensed for use by Fidelity Distributors Corporation.
Other third-party marks appearing herein are the property of their respective owners.
All other marks appearing herein are registered or unregistered trademarks or service marks of FMR LLC or an affiliated company. © 2016 FMR LLC. All rights reserved.
This report and the financial statements contained herein are submitted for the general information of the shareholders of the Fund. This report is not authorized for distribution to prospective investors in the Fund unless preceded or accompanied by an effective prospectus.
A fund files its complete schedule of portfolio holdings with the SEC for the first and third quarters of each fiscal year on Form N-Q. Forms N-Q are available on the SEC’s web site at http://www.sec.gov. A fund's Forms N-Q may be reviewed and copied at the SEC’s Public Reference Room in Washington, DC. Information regarding the operation of the SEC's Public Reference Room may be obtained by calling 1-800-SEC-0330.
For a complete list of a fund's portfolio holdings, view the most recent holdings listing, semiannual report, or annual report on Fidelity's web site at http://www.fidelity.com, http://www.institutional.fidelity.com, or http://www.401k.com, as applicable.
NOT FDIC INSURED •MAY LOSE VALUE •NO BANK GUARANTEE
Neither the Fund nor Fidelity Distributors Corporation is a bank.
Investment Summary (Unaudited)
Geographic Diversification (% of fund's net assets)
| As of June 30, 2016 |
| | Japan | 21.3% |
| | United States of America* | 15.2% |
| | United Kingdom | 13.9% |
| | France | 9.1% |
| | Germany | 6.2% |
| | Switzerland | 5.3% |
| | Cayman Islands | 3.4% |
| | Denmark | 2.5% |
| | Bailiwick of Jersey | 2.5% |
| | Other | 20.6% |
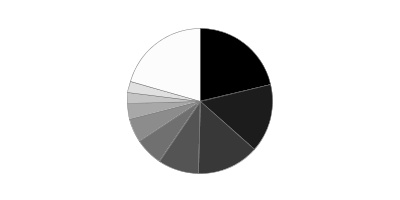
* Includes Short-Term investments and Net Other Assets (Liabilities).
Percentages are based on country or territory of incorporation and are adjusted for the effect of futures contracts, if applicable.
| As of December 31, 2015 |
| | United Kingdom | 21.3% |
| | Japan | 20.1% |
| | United States of America* | 10.1% |
| | France | 8.8% |
| | Switzerland | 6.1% |
| | Cayman Islands | 4.5% |
| | Germany | 4.1% |
| | Bailiwick of Jersey | 2.5% |
| | Italy | 2.3% |
| | Other | 20.2% |

* Includes Short-Term investments and Net Other Assets (Liabilities).
Percentages are based on country or territory of incorporation and are adjusted for the effect of futures contracts, if applicable.
Asset Allocation as of June 30, 2016
| | % of fund's net assets | % of fund's net assets 6 months ago |
| Stocks | 95.7 | 99.6 |
| Short-Term Investments and Net Other Assets (Liabilities) | 4.3 | 0.4 |
Top Ten Stocks as of June 30, 2016
| | % of fund's net assets | % of fund's net assets 6 months ago |
| Nestle SA (Switzerland, Food Products) | 2.6 | 2.3 |
| Norvo Nordisk A/S Series B (Denmark Pharmaceuticals) | 2.0 | 2.0 |
| Sanolfi SA (France, Pharmaceuticals) | 2.0 | 1.8 |
| Astellas Pharma, Inc. (Japan, Pharmaceuticals) | 1.8 | 1.5 |
| Naspers Ltd. Class N (South Africa, Media) | 1.7 | 1.5 |
| Wolseley PLC (Bailiwick of Jersey, Trading Companies & Distributors) | 1.7 | 1.7 |
| Welcia Holdings Co. Ltd. (Japan, Food & Staples Retailing) | 1.5 | 1.4 |
| Vodafone Group PLC (United Kingdom, Wireless Telecommunication Services) | 1.4 | 1.5 |
| NEXT Co. Ltd. (Japan, Media) | 1.4 | 1.8 |
| Diageo PLC (United Kingdom, Beverages) | 1.3 | 0.9 |
| | 17.4 | |
Market Sectors as of June 30, 2016
| | % of fund's net assets | % of fund's net assets 6 months ago |
| Consumer Discretionary | 24.0 | 28.0 |
| Information Technology | 16.3 | 14.6 |
| Health Care | 13.6 | 14.1 |
| Financials | 12.3 | 17.2 |
| Consumer Staples | 11.7 | 9.6 |
| Industrials | 6.6 | 6.1 |
| Energy | 4.7 | 3.9 |
| Materials | 3.4 | 2.7 |
| Telecommunication Services | 3.0 | 3.4 |
| Utilities | 0.1 | 0.0 |
Percentages shown as 0.0% may reflect amounts less than 0.05%.
Investments June 30, 2016 (Unaudited)
Showing Percentage of Net Assets
| Common Stocks - 94.6% | | | |
| | | Shares | Value |
| Australia - 1.8% | | | |
| AMP Ltd. | | 423,882 | $1,651,956 |
| BHP Billiton Ltd. | | 318,002 | 4,431,751 |
| Carsales.com Ltd. | | 1,336,269 | 12,380,234 |
| McMillan Shakespeare Ltd. | | 646,607 | 6,658,820 |
| Rio Tinto Ltd. | | 24,301 | 840,586 |
|
| TOTAL AUSTRALIA | | | 25,963,347 |
|
| Austria - 0.4% | | | |
| Wienerberger AG | | 401,900 | 5,631,830 |
| Bailiwick of Jersey - 2.5% | | | |
| Integrated Diagnostics Holdings PLC | | 221,000 | 878,188 |
| Shire PLC | | 157,900 | 9,758,617 |
| Wolseley PLC | | 479,191 | 24,814,251 |
|
| TOTAL BAILIWICK OF JERSEY | | | 35,451,056 |
|
| Belgium - 0.7% | | | |
| Ageas | | 66,760 | 2,320,529 |
| KBC Groep NV (a) | | 82,713 | 4,067,901 |
| UCB SA | | 52,200 | 3,919,561 |
|
| TOTAL BELGIUM | | | 10,307,991 |
|
| Bermuda - 0.1% | | | |
| Oriental Watch Holdings Ltd. | | 7,028,000 | 834,958 |
| Canada - 0.3% | | | |
| Entertainment One Ltd. | | 2,022,888 | 4,655,728 |
| Cayman Islands - 3.4% | | | |
| 58.com, Inc. ADR (a) | | 156,400 | 7,177,196 |
| Alibaba Group Holding Ltd. sponsored ADR (a) | | 161,500 | 12,844,095 |
| Autohome, Inc. ADR Class A (a) | | 89,000 | 1,789,790 |
| Bitauto Holdings Ltd. ADR (a) | | 42,600 | 1,148,496 |
| Fu Shou Yuan International Group Ltd. | | 2,405,000 | 1,703,347 |
| Goodbaby International Holdings Ltd. | | 1,589,000 | 733,770 |
| New Oriental Education & Technology Group, Inc. sponsored ADR | | 102,100 | 4,275,948 |
| Tencent Holdings Ltd. | | 823,700 | 18,895,409 |
|
| TOTAL CAYMAN ISLANDS | | | 48,568,051 |
|
| China - 0.3% | | | |
| TravelSky Technology Ltd. (H Shares) | | 1,954,000 | 3,777,515 |
| Denmark - 2.5% | | | |
| Danske Bank A/S | | 150,440 | 3,959,638 |
| Novo Nordisk A/S: | | | |
| Series B | | 89,625 | 4,826,566 |
| Series B sponsored ADR | | 448,700 | 24,131,086 |
| Scandinavian Tobacco Group A/S | | 205,820 | 3,373,352 |
|
| TOTAL DENMARK | | | 36,290,642 |
|
| France - 9.1% | | | |
| AXA SA | | 114,920 | 2,272,269 |
| AXA SA sponsored ADR | | 116,600 | 2,345,992 |
| BNP Paribas SA | | 181,503 | 7,959,910 |
| Compagnie de St. Gobain | | 129,000 | 4,889,822 |
| Havas SA | | 1,720,878 | 13,272,793 |
| Iliad SA | | 15,568 | 3,142,622 |
| Ipsen SA | | 101,200 | 6,200,614 |
| Orange SA (b) | | 397,500 | 6,463,552 |
| Pernod Ricard SA (b) | | 143,500 | 15,887,801 |
| Sanofi SA | | 201,643 | 16,753,051 |
| Sanofi SA sponsored ADR | | 290,122 | 12,141,606 |
| Societe Generale Series A | | 116,451 | 3,643,276 |
| Total SA (b) | | 359,761 | 17,252,708 |
| Ubisoft Entertainment SA (a) | | 165,143 | 6,016,314 |
| Vivendi SA | | 700,400 | 13,103,588 |
|
| TOTAL FRANCE | | | 131,345,918 |
|
| Germany - 5.1% | | | |
| adidas AG | | 78,800 | 11,311,681 |
| Allianz SE | | 32,185 | 4,591,430 |
| Axel Springer Verlag AG | | 131,100 | 6,883,231 |
| Bayer AG | | 56,778 | 5,702,493 |
| CTS Eventim AG | | 265,368 | 8,112,163 |
| Deutsche Boerse AG | | 75,400 | 6,194,469 |
| Deutsche Telekom AG | | 517,900 | 8,831,372 |
| E.ON AG | | 224,046 | 2,261,704 |
| SAP AG | | 93,068 | 6,989,888 |
| SAP AG sponsored ADR | | 95,500 | 7,164,410 |
| Scout24 Holding GmbH (a) | | 80,300 | 2,984,802 |
| Wirecard AG | | 66,100 | 2,911,435 |
|
| TOTAL GERMANY | | | 73,939,078 |
|
| Hong Kong - 0.4% | | | |
| Television Broadcasts Ltd. | | 1,688,600 | 5,796,062 |
| India - 0.4% | | | |
| Info Edge India Ltd. | | 415,996 | 5,104,697 |
| Just Dial Ltd. | | 65,509 | 595,082 |
|
| TOTAL INDIA | | | 5,699,779 |
|
| Ireland - 0.5% | | | |
| Paddy Power PLC (Ireland) | | 67,280 | 7,070,884 |
| Presbia PLC (a) | | 33,000 | 149,160 |
|
| TOTAL IRELAND | | | 7,220,044 |
|
| Isle of Man - 1.8% | | | |
| Gaming VC Holdings SA | | 1,868,300 | 14,029,219 |
| Playtech Ltd. | | 1,095,050 | 11,649,643 |
|
| TOTAL ISLE OF MAN | | | 25,678,862 |
|
| Italy - 2.1% | | | |
| DiaSorin S.p.A. | | 101,200 | 6,188,683 |
| Eni SpA | | 169,000 | 2,722,112 |
| Eni SpA sponsored ADR (b) | | 67,900 | 2,196,565 |
| Intesa Sanpaolo SpA | | 5,712,100 | 10,879,905 |
| Mediaset SpA | | 2,282,800 | 7,983,072 |
|
| TOTAL ITALY | | | 29,970,337 |
|
| Japan - 21.3% | | | |
| Arc Land Sakamoto Co. Ltd. | | 393,200 | 4,366,064 |
| Arcland Service Co. Ltd. | | 456,100 | 12,818,391 |
| Asante, Inc. | | 1,200 | 17,006 |
| Astellas Pharma, Inc. | | 1,644,700 | 25,792,749 |
| COLOPL, Inc. | | 384,400 | 7,646,123 |
| Daiwa Securities Group, Inc. | | 490,000 | 2,581,501 |
| Dentsu, Inc. | | 337,200 | 15,806,535 |
| East Japan Railway Co. | | 43,300 | 4,012,755 |
| Fuji Media Holdings, Inc. | | 161,900 | 1,820,397 |
| Fukuda Denshi Co. Ltd. | | 38,600 | 2,233,410 |
| Hoya Corp. | | 343,000 | 12,250,586 |
| Infomart Corp. (b) | | 105,400 | 965,165 |
| Japan Tobacco, Inc. | | 319,800 | 12,888,645 |
| Kakaku.com, Inc. | | 90,200 | 1,792,246 |
| Keyence Corp. | | 12,720 | 8,679,219 |
| Misumi Group, Inc. | | 952,800 | 17,202,533 |
| Mitsubishi UFJ Financial Group, Inc. | | 1,778,900 | 7,974,548 |
| MS&AD Insurance Group Holdings, Inc. | | 127,100 | 3,293,177 |
| Nakanishi, Inc. | | 42,600 | 1,254,086 |
| NEXT Co. Ltd. (b) | | 2,180,000 | 19,511,357 |
| Nintendo Co. Ltd. | | 45,700 | 6,567,054 |
| Olympus Corp. | | 300,700 | 11,228,619 |
| ORIX Corp. | | 1,140,600 | 14,759,896 |
| Rakuten, Inc. | | 1,449,400 | 15,730,827 |
| Recruit Holdings Co. Ltd. | | 428,800 | 15,665,830 |
| San-A Co. Ltd. | | 158,300 | 7,811,680 |
| SoftBank Corp. | | 99,100 | 5,604,311 |
| Sony Corp. | | 115,100 | 3,391,074 |
| Sony Corp. sponsored ADR | | 417,400 | 12,250,690 |
| Sumitomo Mitsui Financial Group, Inc. | | 181,600 | 5,243,711 |
| Sundrug Co. Ltd. | | 24,300 | 2,281,648 |
| Tokio Marine Holdings, Inc. | | 136,600 | 4,547,562 |
| Welcia Holdings Co. Ltd. (b) | | 353,700 | 22,361,740 |
| Zojirushi Thermos (b) | | 837,900 | 15,921,430 |
|
| TOTAL JAPAN | | | 306,272,565 |
|
| Korea (South) - 0.8% | | | |
| LG Household & Health Care Ltd. | | 3,868 | 3,775,203 |
| Medy-Tox, Inc. | | 10,925 | 4,129,698 |
| NAVER Corp. | | 5,630 | 3,485,924 |
|
| TOTAL KOREA (SOUTH) | | | 11,390,825 |
|
| Malta - 0.6% | | | |
| Kambi Group PLC (a)(b) | | 453,700 | 6,577,307 |
| Unibet Group PLC unit | | 174,413 | 1,602,286 |
|
| TOTAL MALTA | | | 8,179,593 |
|
| Mauritius - 0.1% | | | |
| MakeMyTrip Ltd. (a)(b) | | 129,300 | 1,921,398 |
| Netherlands - 1.6% | | | |
| AEGON NV | | 259,400 | 1,027,827 |
| Arcadis NV | | 283,300 | 4,251,251 |
| ASML Holding NV | | 23,311 | 2,312,684 |
| ING Groep NV (Certificaten Van Aandelen) | | 525,384 | 5,435,577 |
| Koninklijke Wessanen NV | | 1,003,600 | 10,561,804 |
|
| TOTAL NETHERLANDS | | | 23,589,143 |
|
| New Zealand - 1.7% | | | |
| EBOS Group Ltd. | | 225,407 | 2,632,988 |
| Ryman Healthcare Group Ltd. | | 561,021 | 3,737,309 |
| Trade Maine Group Ltd. | | 5,399,772 | 17,850,674 |
|
| TOTAL NEW ZEALAND | | | 24,220,971 |
|
| Norway - 1.6% | | | |
| Schibsted ASA: | | | |
| (A Shares) (b) | | 187,700 | 5,626,468 |
| (B Shares) | | 187,700 | 5,370,109 |
| Statoil ASA | | 106,200 | 1,834,973 |
| Statoil ASA sponsored ADR (b) | | 599,700 | 10,380,807 |
|
| TOTAL NORWAY | | | 23,212,357 |
|
| Philippines - 0.1% | | | |
| Melco Crown Philippines Resort (a) | | 21,149,500 | 1,709,669 |
| South Africa - 1.7% | | | |
| Naspers Ltd. Class N | | 163,100 | 24,904,567 |
| Spain - 1.7% | | | |
| Atresmedia Corporacion de Medios de Comunicacion SA | | 1,229,400 | 12,016,651 |
| Banco Bilbao Vizcaya Argentaria SA | | 576,993 | 3,305,855 |
| Banco Santander SA (Spain) | | 562,204 | 2,181,733 |
| Mediaset Espana Comunicacion SA | | 638,915 | 7,212,465 |
|
| TOTAL SPAIN | | | 24,716,704 |
|
| Sweden - 1.9% | | | |
| Getinge AB (B Shares) | | 238,200 | 4,917,878 |
| Nordea Bank AB | | 909,600 | 7,716,725 |
| Svenska Cellulosa AB (SCA) (B Shares) | | 382,100 | 12,277,128 |
| Swedbank AB (A Shares) | | 102,432 | 2,151,388 |
|
| TOTAL SWEDEN | | | 27,063,119 |
|
| Switzerland - 5.3% | | | |
| Credit Suisse Group AG | | 284,033 | 3,025,639 |
| Julius Baer Group Ltd. | | 55,980 | 2,253,101 |
| Nestle SA | | 486,746 | 37,712,265 |
| Roche Holding AG (participation certificate) | | 29,842 | 7,874,702 |
| Syngenta AG (Switzerland) | | 48,261 | 18,524,917 |
| UBS Group AG | | 591,162 | 7,670,678 |
|
| TOTAL SWITZERLAND | | | 77,061,302 |
|
| United Kingdom - 13.9% | | | |
| AstraZeneca PLC (United Kingdom) | | 169,819 | 10,152,378 |
| BHP Billiton PLC | | 339,952 | 4,302,752 |
| BP PLC | | 1,531,593 | 8,965,207 |
| Brammer PLC (b) | | 174,700 | 140,379 |
| Dechra Pharmaceuticals PLC | | 159,300 | 2,488,934 |
| Diageo PLC | | 682,048 | 19,053,463 |
| Dignity PLC | | 29,760 | 1,021,783 |
| GlaxoSmithKline PLC | | 301,500 | 6,474,716 |
| Howden Joinery Group PLC | | 3,168,300 | 16,272,597 |
| HSBC Holdings PLC: | | | |
| (United Kingdom) | | 1,550,020 | 9,603,231 |
| sponsored ADR | | 284,232 | 8,899,304 |
| Johnson Matthey PLC | | 84,053 | 3,152,595 |
| JUST EAT Ltd. (a) | | 600,162 | 3,426,048 |
| LivaNova PLC (a) | | 46,326 | 2,299,318 |
| Lloyds Banking Group PLC | | 15,301,344 | 11,082,627 |
| M&C Saatchi PLC | | 721,800 | 2,745,319 |
| Micro Focus International PLC | | 47,300 | 1,020,453 |
| Moneysupermarket.com Group PLC | | 667,200 | 2,417,316 |
| Rio Tinto PLC | | 168,115 | 5,222,752 |
| Royal Dutch Shell PLC: | | | |
| Class A (United Kingdom) | | 559,388 | 15,363,685 |
| Class B (United Kingdom) | | 351,684 | 9,716,531 |
| Shawbrook Group PLC (a) | | 1,328,700 | 3,023,309 |
| Softcat PLC | | 221,900 | 986,627 |
| SThree PLC | | 322,600 | 1,074,695 |
| SuperGroup PLC | | 372,115 | 6,296,901 |
| Ted Baker PLC | | 159,700 | 5,190,086 |
| Topps Tiles PLC | | 724,968 | 1,029,159 |
| Virgin Money Holdings Uk PLC | | 1,374,200 | 4,610,296 |
| Vodafone Group PLC | | 6,441,000 | 19,637,701 |
| Zoopla Property Group PLC | | 4,145,000 | 14,766,031 |
|
| TOTAL UNITED KINGDOM | | | 200,436,193 |
|
| United States of America - 10.9% | | | |
| Alphabet, Inc.: | | | |
| Class A | | 16,100 | 11,326,833 |
| Class C (a) | | 11,136 | 7,707,226 |
| BlackRock, Inc. Class A | | 27,900 | 9,556,587 |
| Boston Beer Co., Inc. Class A (a) | | 20,900 | 3,574,527 |
| Dave & Buster's Entertainment, Inc. (a) | | 61,125 | 2,860,039 |
| Dunkin' Brands Group, Inc. | | 83,500 | 3,642,270 |
| eBay, Inc. (a) | | 158,600 | 3,712,826 |
| Electronic Arts, Inc. (a) | | 68,600 | 5,197,136 |
| Facebook, Inc. Class A (a) | | 139,400 | 15,930,632 |
| Molson Coors Brewing Co. Class B | | 33,000 | 3,337,290 |
| Monsanto Co. | | 64,203 | 6,639,232 |
| Monster Beverage Corp. | | 37,600 | 6,042,696 |
| PayPal Holdings, Inc. (a) | | 242,400 | 8,850,024 |
| Priceline Group, Inc. (a) | | 15,060 | 18,801,055 |
| Sprouts Farmers Market LLC (a) | | 556,200 | 12,736,980 |
| Tiffany & Co., Inc. | | 56,200 | 3,407,968 |
| TripAdvisor, Inc. (a) | | 40,700 | 2,617,010 |
| Visa, Inc. Class A | | 252,800 | 18,750,176 |
| World Wrestling Entertainment, Inc. Class A (b) | | 317,800 | 5,850,698 |
| Zillow Group, Inc.: | | | |
| Class A (a)(b) | | 82,100 | 3,008,965 |
| Class C (a)(b) | | 115,800 | 4,201,224 |
|
| TOTAL UNITED STATES OF AMERICA | | | 157,751,394 |
|
| TOTAL COMMON STOCKS | | | |
| (Cost $1,275,980,892) | | | 1,363,560,998 |
|
| Nonconvertible Preferred Stocks - 1.1% | | | |
| Germany - 1.1% | | | |
| Sartorius AG (non-vtg.) | | 116,800 | 8,630,526 |
| Volkswagen AG | | 56,000 | 6,782,739 |
| TOTAL GERMANY | | | |
| (Cost $10,448,771) | | | 15,413,265 |
|
| Money Market Funds - 6.9% | | | |
| Fidelity Cash Central Fund, 0.43% (c) | | 50,346,824 | 50,346,824 |
| Fidelity Securities Lending Cash Central Fund, 0.46% (c)(d) | | 50,107,692 | 50,107,692 |
| TOTAL MONEY MARKET FUNDS | | | |
| (Cost $100,454,516) | | | 100,454,516 |
| TOTAL INVESTMENT PORTFOLIO - 102.6% | | | |
| (Cost $1,386,884,179) | | | 1,479,428,779 |
| NET OTHER ASSETS (LIABILITIES) - (2.6)% | | | (38,014,594) |
| NET ASSETS - 100% | | | $1,441,414,185 |
Categorizations in the Schedule of Investments are based on country or territory of incorporation.
Legend
(a) Non-income producing
(b) Security or a portion of the security is on loan at period end.
(c) Affiliated fund that is generally available only to investment companies and other accounts managed by Fidelity Investments. The rate quoted is the annualized seven-day yield of the fund at period end. A complete unaudited listing of the fund's holdings as of its most recent quarter end is available upon request. In addition, each Fidelity Central Fund's financial statements are available on the SEC's website or upon request.
(d) Investment made with cash collateral received from securities on loan.
Affiliated Central Funds
Information regarding fiscal year to date income earned by the Fund from investments in Fidelity Central Funds is as follows:
| Fund | Income earned |
| Fidelity Cash Central Fund | $42,322 |
| Fidelity Securities Lending Cash Central Fund | 824,127 |
| Total | $866,449 |
Investment Valuation
The following is a summary of the inputs used, as of June 30, 2016, involving the Fund's assets and liabilities carried at fair value. The inputs or methodology used for valuing securities may not be an indication of the risk associated with investing in those securities. For more information on valuation inputs, and their aggregation into the levels used below, please refer to the Investment Valuation section in the accompanying Notes to Financial Statements.
| | Valuation Inputs at Reporting Date: |
| Description | Total | Level 1 | Level 2 | Level 3 |
| Investments in Securities: | | | | |
| Equities: | | | | |
| Consumer Discretionary | $346,436,836 | $73,477,750 | $272,959,086 | $-- |
| Consumer Staples | 170,302,870 | 25,691,493 | 144,611,377 | -- |
| Energy | 68,432,588 | 12,577,372 | 55,855,216 | -- |
| Financials | 173,204,899 | 20,801,883 | 152,403,016 | -- |
| Health Care | 196,747,522 | 42,792,149 | 153,955,373 | -- |
| Industrials | 94,982,933 | -- | 94,982,933 | -- |
| Information Technology | 234,178,938 | 111,121,713 | 123,057,225 | -- |
| Materials | 48,746,415 | 6,639,232 | 42,107,183 | -- |
| Telecommunication Services | 43,679,558 | -- | 43,679,558 | -- |
| Utilities | 2,261,704 | -- | 2,261,704 | -- |
| Money Market Funds | 100,454,516 | 100,454,516 | -- | -- |
| Total Investments in Securities: | $1,479,428,779 | $393,556,108 | $1,085,872,671 | $-- |
The following is a summary of transfers between Level 1 and Level 2 for the period ended June 30, 2016. Transfers are assumed to have occurred at the beginning of the period, and are primarily attributable to the valuation techniques used for foreign equity securities, as discussed in the accompanying Notes to Financial Statements:
| Transfers | Total |
| Level 1 to Level 2 | $202,233,091 |
| Level 2 to Level 1 | $0 |
See accompanying notes which are an integral part of the financial statements.
Financial Statements
Statement of Assets and Liabilities
| | | June 30, 2016 (Unaudited) |
| Assets | | |
Investment in securities, at value (including securities loaned of $48,953,122) — See accompanying schedule:
Unaffiliated issuers (cost $1,286,429,663) | $1,378,974,263 | |
| Fidelity Central Funds (cost $100,454,516) | 100,454,516 | |
| Total Investments (cost $1,386,884,179) | | $1,479,428,779 |
| Receivable for investments sold | | 18,574,190 |
| Receivable for fund shares sold | | 1,631,334 |
| Dividends receivable | | 4,054,972 |
| Distributions receivable from Fidelity Central Funds | | 137,696 |
| Other receivables | | 164,089 |
| Total assets | | 1,503,991,060 |
| Liabilities | | |
| Payable to custodian bank | $2,291,844 | |
| Payable for investments purchased | 8,452,592 | |
| Payable for fund shares redeemed | 546,716 | |
| Accrued management fee | 829,639 | |
| Distribution and service plan fees payable | 77,759 | |
| Other affiliated payables | 158,537 | |
| Other payables and accrued expenses | 112,096 | |
| Collateral on securities loaned, at value | 50,107,692 | |
| Total liabilities | | 62,576,875 |
| Net Assets | | $1,441,414,185 |
| Net Assets consist of: | | |
| Paid in capital | | $1,486,115,680 |
| Undistributed net investment income | | 17,958,645 |
| Accumulated undistributed net realized gain (loss) on investments and foreign currency transactions | | (154,907,599) |
| Net unrealized appreciation (depreciation) on investments and assets and liabilities in foreign currencies | | 92,247,459 |
| Net Assets | | $1,441,414,185 |
| Initial Class: | | |
| Net Asset Value, offering price and redemption price per share ($707,383,235 ÷ 39,702,369 shares) | | $17.82 |
| Service Class: | | |
| Net Asset Value, offering price and redemption price per share ($121,801,401 ÷ 6,867,763 shares) | | $17.74 |
| Service Class 2: | | |
| Net Asset Value, offering price and redemption price per share ($312,661,230 ÷ 17,721,674 shares) | | $17.64 |
| Investor Class: | | |
| Net Asset Value, offering price and redemption price per share ($299,568,319 ÷ 16,872,409 shares) | | $17.75 |
See accompanying notes which are an integral part of the financial statements.
Statement of Operations
| | | Six months ended June 30, 2016 (Unaudited) |
| Investment Income | | |
| Dividends | | $26,630,059 |
| Income from Fidelity Central Funds | | 866,449 |
| Income before foreign taxes withheld | | 27,496,508 |
| Less foreign taxes withheld | | (2,440,471) |
| Total income | | 25,056,037 |
| Expenses | | |
| Management fee | $4,939,877 | |
| Transfer agent fees | 606,093 | |
| Distribution and service plan fees | 464,879 | |
| Accounting and security lending fees | 336,216 | |
| Custodian fees and expenses | 64,685 | |
| Independent trustees' fees and expenses | 3,298 | |
| Depreciation in deferred trustee compensation account | (61) | |
| Audit | 43,039 | |
| Legal | 1,299 | |
| Miscellaneous | 6,347 | |
| Total expenses before reductions | 6,465,672 | |
| Expense reductions | (51,883) | 6,413,789 |
| Net investment income (loss) | | 18,642,248 |
| Realized and Unrealized Gain (Loss) | | |
| Net realized gain (loss) on: | | |
| Investment securities: | | |
| Unaffiliated issuers | (4,092,477) | |
| Foreign currency transactions | 144,286 | |
| Total net realized gain (loss) | | (3,948,191) |
Change in net unrealized appreciation (depreciation) on:
Investment securities | (117,519,863) | |
| Assets and liabilities in foreign currencies | (108,945) | |
| Total change in net unrealized appreciation (depreciation) | | (117,628,808) |
| Net gain (loss) | | (121,576,999) |
| Net increase (decrease) in net assets resulting from operations | | $(102,934,751) |
See accompanying notes which are an integral part of the financial statements.
Statement of Changes in Net Assets
| | Six months ended June 30, 2016 (Unaudited) | Year ended December 31, 2015 |
| Increase (Decrease) in Net Assets | | |
| Operations | | |
| Net investment income (loss) | $18,642,248 | $22,548,726 |
| Net realized gain (loss) | (3,948,191) | 35,841,625 |
| Change in net unrealized appreciation (depreciation) | (117,628,808) | (1,443,891) |
| Net increase (decrease) in net assets resulting from operations | (102,934,751) | 56,946,460 |
| Distributions to shareholders from net investment income | – | (20,746,591) |
| Distributions to shareholders from net realized gain | – | (1,618,331) |
| Total distributions | – | (22,364,922) |
| Share transactions - net increase (decrease) | (14,011,514) | (66,061,658) |
| Redemption fees | – | 3,391 |
| Total increase (decrease) in net assets | (116,946,265) | (31,476,729) |
| Net Assets | | |
| Beginning of period | 1,558,360,450 | 1,589,837,179 |
| End of period | $1,441,414,185 | $1,558,360,450 |
| Other Information | | |
| Undistributed net investment income end of period | $17,958,645 | $– |
| Distributions in excess of net investment income end of period | $– | $(683,603) |
See accompanying notes which are an integral part of the financial statements.
Financial Highlights — VIP Overseas Portfolio Initial Class
| | Six months ended (Unaudited) June 30, | Years ended December 31, | | | | |
| | 2016 | 2015 | 2014 | 2013 | 2012 | 2011 |
| Selected Per–Share Data | | | | | | |
| Net asset value, beginning of period | $19.08 | $18.70 | $20.64 | $16.09 | $13.63 | $16.77 |
| Income from Investment Operations | | | | | | |
| Net investment income (loss)A | .24 | .29 | .32B | .25 | .29 | .26 |
| Net realized and unrealized gain (loss) | (1.50) | .38 | (1.98) | 4.63 | 2.53 | (3.14) |
| Total from investment operations | (1.26) | .67 | (1.66) | 4.88 | 2.82 | (2.88) |
| Distributions from net investment income | – | (.27) | (.27) | (.26) | (.30)C | (.23) |
| Distributions from net realized gain | – | (.02) | (.01) | (.07) | (.06)C | (.03) |
| Total distributions | – | (.29) | (.28) | (.33) | (.36) | (.26) |
| Redemption fees added to paid in capitalA | – | –D | –D | –D | –D | –D |
| Net asset value, end of period | $17.82 | $19.08 | $18.70 | $20.64 | $16.09 | $13.63 |
| Total ReturnE,F,G | (6.60)% | 3.62% | (8.08)% | 30.44% | 20.74% | (17.16)% |
| Ratios to Average Net AssetsH,I | | | | | | |
| Expenses before reductions | .80%J | .80% | .82% | .84% | .85% | .85% |
| Expenses net of fee waivers, if any | .80%J | .80% | .82% | .84% | .85% | .85% |
| Expenses net of all reductions | .79%J | .80% | .82% | .83% | .83% | .83% |
| Net investment income (loss) | 2.62%J | 1.46% | 1.62%B | 1.41% | 1.94% | 1.59% |
| Supplemental Data | | | | | | |
| Net assets, end of period (000 omitted) | $707,383 | $758,522 | $726,566 | $829,382 | $659,258 | $598,862 |
| Portfolio turnover rateK | 36%J | 29% | 39% | 34% | 41% | 45% |
A Calculated based on average shares outstanding during the period.
B Net Investment income per share reflects a large, non-recurring dividend which amounted to $.08 per share. Excluding this non-recurring dividend, the ratio of net investment income (loss) to average net assets would have been 1.24%.
C The amounts shown reflect certain reclassifications related to book to tax differences that were made in the year shown.
D Amount represents less than $.005 per share.
E Total returns for periods of less than one year are not annualized.
F Total returns do not reflect charges attributable to your insurance company's separate account. Inclusion of these charges would reduce the total returns shown.
G Total returns would have been lower if certain expenses had not been reduced during the applicable periods shown.
H Fees and expenses of any underlying Fidelity Central Funds are not included in the Fund's expense ratio. The Fund indirectly bears its proportionate share of the expenses of any underlying Fidelity Central Funds.
I Expense ratios reflect operating expenses of the class. Expenses before reductions do not reflect amounts reimbursed by the investment adviser or reductions from brokerage service arrangements or reductions from other expense offset arrangements and do not represent the amount paid by the class during periods when reimbursements or reductions occur. Expenses net of fee waivers reflect expenses after reimbursement by the investment adviser but prior to reductions from brokerage service arrangements or other expense offset arrangements. Expenses net of all reductions represent the net expenses paid by the class.
J Annualized
K Amount does not include the portfolio activity of any underlying Fidelity Central Funds.
See accompanying notes which are an integral part of the financial statements.
Financial Highlights — VIP Overseas Portfolio Service Class
| | Six months ended (Unaudited) June 30, | Years ended December 31, | | | | |
| | 2016 | 2015 | 2014 | 2013 | 2012 | 2011 |
| Selected Per–Share Data | | | | | | |
| Net asset value, beginning of period | $19.00 | $18.63 | $20.56 | $16.02 | $13.58 | $16.70 |
| Income from Investment Operations | | | | | | |
| Net investment income (loss)A | .23 | .27 | .30B | .24 | .28 | .24 |
| Net realized and unrealized gain (loss) | (1.49) | .37 | (1.97) | 4.61 | 2.50 | (3.12) |
| Total from investment operations | (1.26) | .64 | (1.67) | 4.85 | 2.78 | (2.88) |
| Distributions from net investment income | – | (.25) | (.25) | (.24) | (.29)C | (.21) |
| Distributions from net realized gain | – | (.02) | (.01) | (.07) | (.06)C | (.03) |
| Total distributions | – | (.27) | (.26) | (.31) | (.34)D | (.24) |
| Redemption fees added to paid in capitalA | – | –E | –E | –E | –E | –E |
| Net asset value, end of period | $17.74 | $19.00 | $18.63 | $20.56 | $16.02 | $13.58 |
| Total ReturnF,G,H | (6.63)% | 3.49% | (8.16)% | 30.38% | 20.54% | (17.23)% |
| Ratios to Average Net AssetsI,J | | | | | | |
| Expenses before reductions | .90%K | .90% | .92% | .94% | .95% | .95% |
| Expenses net of fee waivers, if any | .90%K | .90% | .92% | .94% | .95% | .95% |
| Expenses net of all reductions | .89%K | .90% | .92% | .93% | .93% | .93% |
| Net investment income (loss) | 2.52%K | 1.36% | 1.52%B | 1.31% | 1.84% | 1.49% |
| Supplemental Data | | | | | | |
| Net assets, end of period (000 omitted) | $121,801 | $138,766 | $100,058 | $118,920 | $110,468 | $108,921 |
| Portfolio turnover rateL | 36%K | 29% | 39% | 34% | 41% | 45% |
A Calculated based on average shares outstanding during the period.
B Net Investment income per share reflects a large, non-recurring dividend which amounted to $.07 per share. Excluding this non-recurring dividend, the ratio of net investment income (loss) to average net assets would have been 1.14%.
C The amounts shown reflect certain reclassifications related to book to tax differences that were made in the year shown.
D Total distributions of $.34 per share is comprised of distributions from net investment income of $.286 and distributions from net realized gain of $.059 per share.
E Amount represents less than $.005 per share.
F Total returns for periods of less than one year are not annualized.
G Total returns do not reflect charges attributable to your insurance company's separate account. Inclusion of these charges would reduce the total returns shown.
H Total returns would have been lower if certain expenses had not been reduced during the applicable periods shown.
I Fees and expenses of any underlying Fidelity Central Funds are not included in the Fund's expense ratio. The Fund indirectly bears its proportionate share of the expenses of any underlying Fidelity Central Funds.
J Expense ratios reflect operating expenses of the class. Expenses before reductions do not reflect amounts reimbursed by the investment adviser or reductions from brokerage service arrangements or reductions from other expense offset arrangements and do not represent the amount paid by the class during periods when reimbursements or reductions occur. Expenses net of fee waivers reflect expenses after reimbursement by the investment adviser but prior to reductions from brokerage service arrangements or other expense offset arrangements. Expenses net of all reductions represent the net expenses paid by the class.
K Annualized
L Amount does not include the portfolio activity of any underlying Fidelity Central Funds.
See accompanying notes which are an integral part of the financial statements.
Financial Highlights — VIP Overseas Portfolio Service Class 2
| | Six months ended (Unaudited) June 30, | Years ended December 31, | | | | |
| | 2016 | 2015 | 2014 | 2013 | 2012 | 2011 |
| Selected Per–Share Data | | | | | | |
| Net asset value, beginning of period | $18.92 | $18.55 | $20.47 | $15.95 | $13.52 | $16.62 |
| Income from Investment Operations | | | | | | |
| Net investment income (loss)A | .21 | .24 | .27B | .21 | .25 | .21 |
| Net realized and unrealized gain (loss) | (1.49) | .38 | (1.96) | 4.59 | 2.50 | (3.09) |
| Total from investment operations | (1.28) | .62 | (1.69) | 4.80 | 2.75 | (2.88) |
| Distributions from net investment income | – | (.23) | (.22) | (.21) | (.26)C | (.19) |
| Distributions from net realized gain | – | (.02) | (.01) | (.07) | (.06)C | (.03) |
| Total distributions | – | (.25) | (.23) | (.28) | (.32) | (.22) |
| Redemption fees added to paid in capitalA | – | –D | –D | –D | –D | –D |
| Net asset value, end of period | $17.64 | $18.92 | $18.55 | $20.47 | $15.95 | $13.52 |
| Total ReturnE,F,G | (6.77)% | 3.35% | (8.30)% | 30.17% | 20.38% | (17.34)% |
| Ratios to Average Net AssetsH,I | | | | | | |
| Expenses before reductions | 1.05%J | 1.05% | 1.07% | 1.09% | 1.10% | 1.10% |
| Expenses net of fee waivers, if any | 1.05%J | 1.05% | 1.07% | 1.09% | 1.10% | 1.10% |
| Expenses net of all reductions | 1.04%J | 1.05% | 1.07% | 1.08% | 1.08% | 1.08% |
| Net investment income (loss) | 2.37%J | 1.21% | 1.37%B | 1.16% | 1.69% | 1.34% |
| Supplemental Data | | | | | | |
| Net assets, end of period (000 omitted) | $312,661 | $345,818 | $266,860 | $316,863 | $349,364 | $342,206 |
| Portfolio turnover rateK | 36%J | 29% | 39% | 34% | 41% | 45% |
A Calculated based on average shares outstanding during the period.
B Net Investment income per share reflects a large, non-recurring dividend which amounted to $.07 per share. Excluding this non-recurring dividend, the ratio of net investment income (loss) to average net assets would have been .99%.
C The amounts shown reflect certain reclassifications related to book to tax differences that were made in the year shown.
D Amount represents less than $.005 per share.
E Total returns for periods of less than one year are not annualized.
F Total returns do not reflect charges attributable to your insurance company's separate account. Inclusion of these charges would reduce the total returns shown.
G Total returns would have been lower if certain expenses had not been reduced during the applicable periods shown.
H Fees and expenses of any underlying Fidelity Central Funds are not included in the Fund's expense ratio. The Fund indirectly bears its proportionate share of the expenses of any underlying Fidelity Central Funds.
I Expense ratios reflect operating expenses of the class. Expenses before reductions do not reflect amounts reimbursed by the investment adviser or reductions from brokerage service arrangements or reductions from other expense offset arrangements and do not represent the amount paid by the class during periods when reimbursements or reductions occur. Expenses net of fee waivers reflect expenses after reimbursement by the investment adviser but prior to reductions from brokerage service arrangements or other expense offset arrangements. Expenses net of all reductions represent the net expenses paid by the class.
J Annualized
K Amount does not include the portfolio activity of any underlying Fidelity Central Funds.
See accompanying notes which are an integral part of the financial statements.
Financial Highlights — VIP Overseas Portfolio Investor Class
| | Six months ended (Unaudited) June 30, | Years ended December 31, | | | | |
| June 30, | 2016 | 2015 | 2014 | 2013 | 2012 | 2011 |
| Selected Per–Share Data | | | | | | |
| Net asset value, beginning of period | $19.02 | $18.64 | $20.58 | $16.04 | $13.60 | $16.73 |
| Income from Investment Operations | | | | | | |
| Net investment income (loss)A | .23 | .27 | .30B | .24 | .28 | .24 |
| Net realized and unrealized gain (loss) | (1.50) | .39 | (1.98) | 4.62 | 2.51 | (3.12) |
| Total from investment operations | (1.27) | .66 | (1.68) | 4.86 | 2.79 | (2.88) |
| Distributions from net investment income | – | (.26) | (.26) | (.25) | (.29)C | (.22) |
| Distributions from net realized gain | – | (.02) | (.01) | (.07) | (.06)C | (.03) |
| Total distributions | – | (.28) | (.26)D | (.32) | (.35) | (.25) |
| Redemption fees added to paid in capitalA | – | –E | –E | –E | –E | –E |
| Net asset value, end of period | $17.75 | $19.02 | $18.64 | $20.58 | $16.04 | $13.60 |
| Total ReturnF,G,H | (6.68)% | 3.55% | (8.17)% | 30.40% | 20.54% | (17.22)% |
| Ratios to Average Net AssetsI,J | | | | | | |
| Expenses before reductions | .88%K | .88% | .90% | .92% | .93% | .93% |
| Expenses net of fee waivers, if any | .88%K | .88% | .90% | .92% | .93% | .93% |
| Expenses net of all reductions | .87%K | .88% | .90% | .91% | .92% | .91% |
| Net investment income (loss) | 2.54%K | 1.38% | 1.54%B | 1.33% | 1.85% | 1.51% |
| Supplemental Data | | | | | | |
| Net assets, end of period (000 omitted) | $299,568 | $315,254 | $279,760 | $294,173 | $175,442 | $152,810 |
| Portfolio turnover rateL | 36%K | 29% | 39% | 34% | 41% | 45% |
A Calculated based on average shares outstanding during the period.
B Net Investment income per share reflects a large, non-recurring dividend which amounted to $.07 per share. Excluding this non-recurring dividend, the ratio of net investment income (loss) to average net assets would have been 1.16%.
C The amounts shown reflect certain reclassifications related to book to tax differences that were made in the year shown.
D Total distributions of $.26 per share is comprised of distributions from net investment income of $.257 and distributions from net realized gain of $.005 per share.
E Amount represents less than $.005 per share.
F Total returns for periods of less than one year are not annualized.
G Total returns do not reflect charges attributable to your insurance company's separate account. Inclusion of these charges would reduce the total returns shown.
H Total returns would have been lower if certain expenses had not been reduced during the applicable periods shown.
I Fees and expenses of any underlying Fidelity Central Funds are not included in the Fund's expense ratio. The Fund indirectly bears its proportionate share of the expenses of any underlying Fidelity Central Funds.
J Expense ratios reflect operating expenses of the class. Expenses before reductions do not reflect amounts reimbursed by the investment adviser or reductions from brokerage service arrangements or reductions from other expense offset arrangements and do not represent the amount paid by the class during periods when reimbursements or reductions occur. Expenses net of fee waivers reflect expenses after reimbursement by the investment adviser but prior to reductions from brokerage service arrangements or other expense offset arrangements. Expenses net of all reductions represent the net expenses paid by the class.
K Annualized
L Amount does not include the portfolio activity of any underlying Fidelity Central Funds.
See accompanying notes which are an integral part of the financial statements.
Notes to Financial Statements (Unaudited)
For the period ended June 30, 2016
1. Organization.
VIP Overseas Portfolio (the Fund) is a fund of Variable Insurance Products Fund (the Trust) and is authorized to issue an unlimited number of shares. The Trust is registered under the Investment Company Act of 1940, as amended (the 1940 Act), as an open-end management investment company organized as a Massachusetts business trust. Shares of the Fund may only be purchased by insurance companies for the purpose of funding variable annuity or variable life insurance contracts. The Fund offers the following classes of shares: Initial Class shares, Service Class shares, Service Class 2 shares and Investor Class shares. The Fund offered Initial Class R shares, Service Class R shares and Service Class 2R shares during the period April 24, 2002 through April 30, 2015, and all outstanding shares were converted to Initial Class shares, Service Class shares and Service Class 2 shares, respectively, by April 30, 2015. All classes have equal rights and voting privileges, except for matters affecting a single class. The Fund's investments in emerging markets can be subject to social, economic, regulatory, and political uncertainties and can be extremely volatile.
2. Investments in Fidelity Central Funds.
The Fund invests in Fidelity Central Funds, which are open-end investment companies generally available only to other investment companies and accounts managed by the investment adviser and its affiliates. The Fund's Schedule of Investments lists each of the Fidelity Central Funds held as of period end, if any, as an investment of the Fund, but does not include the underlying holdings of each Fidelity Central Fund. As an Investing Fund, the Fund indirectly bears its proportionate share of the expenses of the underlying Fidelity Central Funds.
The Money Market Central Funds seek preservation of capital and current income and are managed by Fidelity Investments Money Management, Inc. (FIMM), an affiliate of the investment adviser. Annualized expenses of the Money Market Central Funds as of their most recent shareholder report date are less than .005%.
A complete unaudited list of holdings for each Fidelity Central Fund is available upon request or at the Securities and Exchange Commission (the SEC) website at www.sec.gov. In addition, the financial statements of the Fidelity Central Funds are available on the SEC website or upon request.
3. Significant Accounting Policies.
The financial statements have been prepared in conformity with accounting principles generally accepted in the United States of America (GAAP), which require management to make certain estimates and assumptions at the date of the financial statements. Actual results could differ from those estimates. Subsequent events, if any, through the date that the financial statements were issued have been evaluated in the preparation of the financial statements. The following summarizes the significant accounting policies of the Fund:
Investment Valuation. Investments are valued as of 4:00 p.m. Eastern time on the last calendar day of the period. The Board of Trustees (the Board) has delegated the day to day responsibility for the valuation of the Fund's investments to the Fidelity Management & Research Company (FMR) Fair Value Committee (the Committee). In accordance with valuation policies and procedures approved by the Board, the Fund attempts to obtain prices from one or more third party pricing vendors or brokers to value its investments. When current market prices, quotations or currency exchange rates are not readily available or reliable, investments will be fair valued in good faith by the Committee, in accordance with procedures adopted by the Board. Factors used in determining fair value vary by investment type and may include market or investment specific events. The frequency with which these procedures are used cannot be predicted and they may be utilized to a significant extent. The Committee oversees the Fund's valuation policies and procedures and reports to the Board on the Committee's activities and fair value determinations. The Board monitors the appropriateness of the procedures used in valuing the Fund's investments and ratifies the fair value determinations of the Committee.
The Fund categorizes the inputs to valuation techniques used to value its investments into a disclosure hierarchy consisting of three levels as shown below:
- Level 1 – quoted prices in active markets for identical investments
- Level 2 – other significant observable inputs (including quoted prices for similar investments, interest rates, prepayment speeds, etc.)
- Level 3 – unobservable inputs (including the Fund's own assumptions based on the best information available)
Valuation techniques used to value the Fund's investments by major category are as follows:
Equity securities, including restricted securities, for which market quotations are readily available, are valued at the last reported sale price or official closing price as reported by a third party pricing vendor on the primary market or exchange on which they are traded and are categorized as Level 1 in the hierarchy. In the event there were no sales during the day or closing prices are not available, securities are valued at the last quoted bid price or may be valued using the last available price and are generally categorized as Level 2 in the hierarchy. For foreign equity securities, when market or security specific events arise, comparisons to the American Depositary Receipts (ADRs), futures contracts, Exchange-Traded Funds (ETFs) and certain indexes as well as quoted prices for similar securities may be used and would be categorized as Level 2 in the hierarchy. Utilizing these techniques may result in transfers between Level 1 and Level 2. For equity securities, including restricted securities, where observable inputs are limited, assumptions about market activity and risk are used and these securities may be categorized as Level 3 in the hierarchy.
Investments in open-end mutual funds, including the Fidelity Central Funds, are valued at their closing net asset value (NAV) each business day and are categorized as Level 1 in the hierarchy.
Changes in valuation techniques may result in transfers in or out of an assigned level within the disclosure hierarchy. The aggregate value of investments by input level as of June 30, 2016, including information on transfers between Levels 1 and 2 is included at the end of the Fund's Schedule of Investments.
Foreign Currency. The Fund may use foreign currency contracts to facilitate transactions in foreign-denominated securities. Gains and losses from these transactions may arise from changes in the value of the foreign currency or if the counterparties do not perform under the contracts' terms.
Foreign-denominated assets, including investment securities, and liabilities are translated into U.S. dollars at the exchange rates at period end. Purchases and sales of investment securities, income and dividends received and expenses denominated in foreign currencies are translated into U.S. dollars at the exchange rate in effect on the transaction date.
The effects of exchange rate fluctuations on investments are included with the net realized and unrealized gain (loss) on investment securities. Other foreign currency transactions resulting in realized and unrealized gain (loss) are disclosed separately.
Investment Transactions and Income. For financial reporting purposes, the Fund's investment holdings and NAV include trades executed through the end of the last business day of the period. The NAV per share for processing shareholder transactions is calculated as of the close of business of the New York Stock Exchange (NYSE), normally 4:00 p.m. Eastern time and includes trades executed through the end of the prior business day. Gains and losses on securities sold are determined on the basis of identified cost and may include proceeds received from litigation. Dividend income is recorded on the ex-dividend date, except for certain dividends from foreign securities where the ex-dividend date may have passed, which are recorded as soon as the Fund is informed of the ex-dividend date. Non-cash dividends included in dividend income, if any, are recorded at the fair market value of the securities received. Income and capital gain distributions from Fidelity Central Funds, if any, are recorded on the ex-dividend date. Investment income is recorded net of foreign taxes withheld where recovery of such taxes is uncertain.
Class Allocations and Expenses. Investment income, realized and unrealized capital gains and losses, common expenses of the Fund, and certain fund-level expense reductions, if any, are allocated daily on a pro-rata basis to each class based on the relative net assets of each class to the total net assets of the Fund. Each class differs with respect to transfer agent and distribution and service plan fees incurred. Certain expense reductions may also differ by class. For the reporting period, the allocated portion of income and expenses to each class as a percent of its average net assets may vary due to the timing of recording these transactions in relation to fluctuating net assets of the classes. Expenses directly attributable to a fund are charged to that fund. Expenses attributable to more than one fund are allocated among the respective funds on the basis of relative net assets or other appropriate methods. Expense estimates are accrued in the period to which they relate and adjustments are made when actual amounts are known.
Deferred Trustee Compensation. Under a Deferred Compensation Plan (the Plan), independent Trustees may elect to defer receipt of a portion of their annual compensation. Deferred amounts are invested in a cross-section of Fidelity funds, are marked-to-market and remain in the Fund until distributed in accordance with the Plan. The investment of deferred amounts and the offsetting payable to the Trustees are included in the accompanying Statement of Assets and Liabilities.
Income Tax Information and Distributions to Shareholders. Each year, the Fund intends to qualify as a regulated investment company under Subchapter M of the Internal Revenue Code, including distributing substantially all of its taxable income and realized gains. As a result, no provision for U.S. Federal income taxes is required. The Fund files a U.S. federal tax return, in addition to state and local tax returns as required. The Fund's federal income tax returns are subject to examination by the Internal Revenue Service (IRS) for a period of three fiscal years after they are filed. State and local tax returns may be subject to examination for an additional fiscal year depending on the jurisdiction. Foreign taxes are provided for based on the Fund's understanding of the tax rules and rates that exist in the foreign markets in which it invests.
Distributions are declared and recorded on the ex-dividend date. Income dividends and capital gain distributions are declared separately for each class. Income and capital gain distributions are determined in accordance with income tax regulations, which may differ from GAAP.
Capital accounts within the financial statements are adjusted for permanent book-tax differences. These adjustments have no impact on net assets or the results of operations. Capital accounts are not adjusted for temporary book-tax differences which will reverse in a subsequent period.
Book-tax differences are primarily due to foreign currency transactions, passive foreign investment companies (PFIC), deferred trustees compensation, capital loss carryforwards and losses deferred due to wash sales and excise tax regulations.
The federal tax cost of investment securities and unrealized appreciation (depreciation) as of period end were as follows:
| Gross unrealized appreciation | $250,614,137 |
| Gross unrealized depreciation | (165,250,486) |
| Net unrealized appreciation (depreciation) on securities | $85,363,651 |
| Tax cost | $1,394,065,128 |
Capital loss carryforwards are only available to offset future capital gains of the Fund to the extent provided by regulations and may be limited. Under the Regulated Investment Company Modernization Act of 2010 (the Act), the Fund is permitted to carry forward capital losses incurred in taxable years beginning after December 22, 2010 for an unlimited period and such capital losses are required to be used prior to any losses that expire. The capital loss carryforward information presented below, including any applicable limitation, is estimated as of prior fiscal period end and is subject to adjustment.
| Fiscal year of expiration | |
| 2017 | $(126,377,448) |
The Fund elected to defer to its next fiscal year approximately $9,657,386 of capital losses recognized during the period November 1, 2015 to December 31, 2015. The Fund elected to defer to its next fiscal year $637,045 of ordinary losses recognized during the period November 1, 2015 to December 31, 2015.
4. Purchases and Sales of Investments.
Purchases and sales of securities, other than short-term securities, aggregated $263,079,454 and $314,014,554, respectively.
5. Fees and Other Transactions with Affiliates.
Management Fee. Fidelity Management & Research Company (the investment adviser) and its affiliates provide the Fund with investment management related services for which the Fund pays a monthly management fee. The management fee is the sum of an individual fund fee rate that is based on an annual rate of .424% of the Fund's average net assets and an annualized group fee rate that averaged .25% during the period. The group fee rate is based upon the average net assets of all the mutual funds advised by the investment adviser, including any mutual funds previously advised by the investment adviser that are currently advised by Fidelity SelectCo, LLC, an affiliate of the investment adviser. The group fee rate decreases as assets under management increase and increases as assets under management decrease. For the reporting period, the total annualized management fee rate was .67% of the Fund's average net assets.
Distribution and Service Plan Fees. In accordance with Rule 12b-1 of the 1940 Act, the Fund has adopted separate 12b-1 Plans for each Service Class of shares. Each Service Class pays Fidelity Distributors Corporation (FDC), an affiliate of the investment adviser, a service fee. For the period, the service fee is based on an annual rate of .10% of Service Class' average net assets and .25% of Service Class 2's average net assets.
For the period, total fees, all of which were re-allowed to insurance companies for the distribution of shares and providing shareholder support services, were as follows:
| Service Class | $63,646 |
| Service Class 2 | 401,233 |
| | $464,879 |
Transfer Agent Fees. Fidelity Investments Institutional Operations Company, Inc. (FIIOC), an affiliate of the investment adviser, is the Fund's transfer, dividend disbursing, and shareholder servicing agent. FIIOC receives an asset-based fee with respect to each class. Each class (with the exception of Investor Class) pays a fee for transfer agent services, typesetting and printing and mailing of shareholder reports, excluding mailing of proxy statements, equal to an annual rate of .07% (.15% for Investor Class) of class-level average net assets.
For the period, transfer agent fees for each class were as follows:
| Initial Class | $236,803 |
| Service Class | 42,006 |
| Service Class 2 | 105,926 |
| Investor Class | 221,358 |
| | $606,093 |
Accounting and Security Lending Fees. Fidelity Service Company, Inc. (FSC), an affiliate of the investment adviser, maintains the Fund's accounting records. The accounting fee is based on the level of average net assets for each month. Under a separate contract, FSC administers the security lending program. The security lending fee is based on the number and duration of lending transactions.
Brokerage Commissions. The Fund placed a portion of its portfolio transactions with brokerage firms which are affiliates of the investment adviser. Brokerage commissions are included in net realized gain (loss) and change in net unrealized appreciation (depreciation) in the Statement of Operations. The commissions paid to these affiliated firms were $239 for the period.
Interfund Trades. The Fund may purchase from or sell securities to other Fidelity Funds under procedures adopted by the Board. The procedures have been designed to ensure these interfund trades are executed in accordance with Rule 17a-7 of the 1940 Act. Interfund trades are included within the respective purchases and sales amounts shown in the Purchases and Sales of Investments note.
6. Committed Line of Credit.
The Fund participates with other funds managed by the investment adviser or an affiliate in a $4.25 billion credit facility (the "line of credit") to be utilized for temporary or emergency purposes to fund shareholder redemptions or for other short-term liquidity purposes. The Fund has agreed to pay commitment fees on its pro-rata portion of the line of credit, which amounted to $1,327 and is reflected in Miscellaneous expenses on the Statement of Operations. During the period, the Fund did not borrow on this line of credit.
7. Security Lending.
The Fund lends portfolio securities through a lending agent from time to time in order to earn additional income. For equity securities, a lending agent is used and may loan securities to certain qualified borrowers, including Fidelity Capital Markets (FCM), a broker-dealer affiliated with the Fund. On the settlement date of the loan, the Fund receives collateral (in the form of U.S. Treasury obligations, letters of credit and/or cash) against the loaned securities and maintains collateral in an amount not less than 100% of the market value of the loaned securities during the period of the loan. The market value of the loaned securities is determined at the close of business of the Fund and any additional required collateral is delivered to the Fund on the next business day. The Fund or borrower may terminate the loan at any time, and if the borrower defaults on its obligation to return the securities loaned because of insolvency or other reasons, the Fund may apply collateral received from the borrower against the obligation. The Fund may experience delays and costs in recovering the securities loaned. Any cash collateral received is invested in the Fidelity Securities Lending Cash Central Fund. The value of loaned securities and cash collateral at period end are disclosed on the Fund's Statement of Assets and Liabilities. The value of securities loaned to FCM at period end was $2,835,057. Security lending income represents the income earned on investing cash collateral, less rebates paid to borrowers and any lending agent fees associated with the loan, plus any premium payments received for lending certain types of securities. Security lending income is presented in the Statement of Operations as a component of income from Fidelity Central Funds. Total security lending income during the period amounted to $824,127, including $16,707 from securities loaned to FCM.
8. Expense Reductions.
Commissions paid to certain brokers with whom the investment adviser, or its affiliates, places trades on behalf of the Fund include an amount in addition to trade execution, which may be rebated back to the Fund to offset certain expenses. This amount totaled $46,171 for the period.
In addition, through arrangements with the Fund's custodian, credits realized as a result of certain uninvested cash balances were used to reduce the Fund's expenses. During the period, these credits reduced the Fund's custody expenses by $134.
In addition, during the period the investment adviser reimbursed and/or waived a portion of fund-level operating expenses in the amount of $5,578.
9. Distributions to Shareholders.
Distributions to shareholders of each class were as follows:
| | Six months ended
June 30, 2016 | Year ended December 31, 2015 |
| From net investment income | | |
| Initial Class | $– | $10,645,043 |
| Service Class | – | 1,840,695 |
| Service Class 2 | – | 4,088,796 |
| Investor Class | – | 4,172,057 |
| Total | $– | $20,746,591 |
| From net realized gain | | |
| Initial Class | $– | $785,612 |
| Service Class | – | 144,937 |
| Service Class 2 | – | 361,840 |
| Investor Class | – | 325,942 |
| Total | $– | $1,618,331 |
10. Share Transactions.
Transactions for each class of shares were as follows:
| | Shares | Shares | Dollars | Dollars |
| | Six months ended
June 30, 2016 | Year ended December 31, 2015 | Six months ended
June 30, 2016 | Year ended December 31, 2015 |
| Initial Class | | | | |
| Shares sold | 2,977,664 | 9,063,043 | $53,329,307 | $182,497,361 |
| Reinvestment of distributions | – | 613,233 | – | 11,430,655 |
| Shares redeemed | (3,030,532) | (8,771,356) | (54,782,381) | (174,181,200) |
| Net increase (decrease) | (52,868) | 904,920 | $(1,453,074) | $19,746,816 |
| Service Class | | | | |
| Shares sold | 168,880 | 2,965,603 | $3,025,201 | $60,107,210 |
| Reinvestment of distributions | – | 106,927 | – | 1,985,632 |
| Shares redeemed | (604,222) | (1,140,788) | (10,858,973) | (22,409,012) |
| Net increase (decrease) | (435,342) | 1,931,742 | $(7,833,772) | $39,683,830 |
| Service Class 2 | | | | |
| Shares sold | 806,643 | 6,660,917 | $14,359,368 | $133,919,046 |
| Reinvestment of distributions | – | 240,705 | – | 4,450,636 |
| Shares redeemed | (1,366,460) | (3,009,141) | (24,328,674) | (59,124,422) |
| Net increase (decrease) | (559,817) | 3,892,481 | $(9,969,306) | $79,245,260 |
| Initial Class R | | | | |
| Shares sold | – | 117,551 | $– | $2,308,647 |
| Shares redeemed | – | (4,732,077) | – | (96,399,349) |
| Net increase (decrease) | – | (4,614,526) | $– | $(94,090,702) |
| Service Class R | | | | |
| Shares sold | – | 43,058 | $– | $836,703 |
| Shares redeemed | – | (2,477,682) | – | (50,310,170) |
| Net increase (decrease) | – | (2,434,624) | $– | $(49,473,467) |
| Service Class 2R | | | | |
| Shares sold | – | 254,618 | $– | $4,813,983 |
| Shares redeemed | – | (4,899,430) | – | (98,164,277) |
| Net increase (decrease) | – | (4,644,812) | $– | $(93,350,294) |
| Investor Class | | | | |
| Shares sold | 1,575,052 | 3,717,774 | $28,200,156 | $74,571,611 |
| Reinvestment of distributions | – | 241,958 | – | 4,497,999 |
| Shares redeemed | (1,277,007) | (2,390,169) | (22,955,518) | (46,892,711) |
| Net increase (decrease) | 298,045 | 1,569,563 | $5,244,638 | $32,176,899 |
11. Other.
The Fund's organizational documents provide former and current trustees and officers with a limited indemnification against liabilities arising in connection with the performance of their duties to the Fund. In the normal course of business, the Fund may also enter into contracts that provide general indemnifications. The Fund's maximum exposure under these arrangements is unknown as this would be dependent on future claims that may be made against the Fund. The risk of material loss from such claims is considered remote.
At the end of the period, the investment adviser or its affiliates were the owners of record of 20% of the total outstanding shares of the Fund and one otherwise unaffiliated shareholder was the owner of record of 17% of the total outstanding shares of the Fund. Mutual funds managed by the investment adviser or its affiliates were the owners of record, in the aggregate, of approximately 22% of the total outstanding shares of the Fund.
Shareholder Expense Example
As a shareholder of a Fund, you incur two types of costs: (1) transaction costs, and (2) ongoing costs, including management fees and other Fund expenses. This Example is intended to help you understand your ongoing costs (in dollars) of investing in the Funds and to compare these costs with the ongoing costs of investing in other mutual funds.
The Example is based on an investment of $1,000 invested at the beginning of the period and held for the entire period (January 1, 2015 to June 30, 2015).
Actual Expenses
The first line of the accompanying table for each class of the Fund provides information about actual account values and actual expenses. You may use the information in this line, together with the amount you invested, to estimate the expenses that you paid over the period. Simply divide your account value by $1,000.00 (for example, an $8,600 account value divided by $1,000.00 = 8.6), then multiply the result by the number in the first line for a class of the Fund under the heading entitled "Expenses Paid During Period" to estimate the expenses you paid on your account during this period. The estimate of expenses does not include any fees or other expenses of any variable annuity or variable life insurance product. If they were, the estimate of expenses you paid during the period would be higher, and your ending account value would be lower. In addition, the Fund, as a shareholder in the underlying Fidelity Central Funds, will indirectly bear its pro-rata share of the fees and expenses incurred by the underlying Fidelity Central Funds. These fees and expenses are not included in the Fund's annualized expense ratio used to calculate the expense estimate in the table below.
Hypothetical Example for Comparison Purposes
The second line of the accompanying table for each class of the Fund provides information about hypothetical account values and hypothetical expenses based on a Class' actual expense ratio and an assumed rate of return of 5% per year before expenses, which is not the Class' actual return. The hypothetical account values and expenses may not be used to estimate the actual ending account balance or expenses you paid for the period. You may use this information to compare the ongoing costs of investing in the Fund and other funds. To do so, compare this 5% hypothetical example with the 5% hypothetical examples that appear in the shareholder reports of the other funds. The estimate of expenses does not include any fees or other expenses of any variable annuity or variable life insurance product. If they were, the estimate of expenses you paid during the period would be higher, and your ending account value would be lower. In addition, the Fund, as a shareholder in the underlying Fidelity Central Funds, will indirectly bear its pro-rata share of the fees and expenses incurred by the underlying Fidelity Central Funds. These fees and expenses are not included in the Fund's annualized expense ratio used to calculate the expense estimate in the table below.
Please note that the expenses shown in the table are meant to highlight your ongoing costs only and do not reflect any transaction costs. Therefore, the second line of the table is useful in comparing ongoing costs only, and will not help you determine the relative total costs of owning different funds. In addition, if these transactional costs were included, your costs would have been higher.
| | Annualized Expense Ratio-A | Beginning
Account Value
January 1, 2016 | Ending
Account Value
June 30, 2016 | Expenses Paid
During Period-B
January 1, 2016
to June 30, 2016 |
| Initial Class | .80% | | | |
| Actual | | $1,000.00 | $934.00 | $3.85 |
| Hypothetical-C | | $1,000.00 | $1,020.89 | $4.02 |
| Service Class | .90% | | | |
| Actual | | $1,000.00 | $933.70 | $4.33 |
| Hypothetical-C | | $1,000.00 | $1,020.39 | $4.52 |
| Service Class 2 | 1.05% | | | |
| Actual | | $1,000.00 | $932.30 | $5.04 |
| Hypothetical-C | | $1,000.00 | $1,019.64 | $5.27 |
| | | | | |
| | | | | |
| | | | | |
| | | | | |
| | | | | |
| | | | | |
| | | | | |
| | | | | |
| | | | | |
| Investor Class | .88% | | | |
| Actual | | $1,000.00 | $933.20 | $4.23 |
| Hypothetical-C | | $1,000.00 | $1,020.49 | $4.42 |
A Annualized expense ratio reflects expenses net of applicable fee waivers.
B Expenses are equal to each Class' annualized expense ratio, multiplied by the average account value over the period, multiplied by 182/366 (to reflect the one-half year period).
C 5% return per year before expenses
VIPOVRS-SANN-0816
1.705696.118
Fidelity® Variable Insurance Products: Value Portfolio
Semi-Annual Report June 30, 2016 |
|
Contents
To view a fund's proxy voting guidelines and proxy voting record for the 12-month period ended June 30, visit http://www.fidelity.com/proxyvotingresults or visit the Securities and Exchange Commission's (SEC) web site at http://www.sec.gov.
You may also call 1-877-208-0098 to request a free copy of the proxy voting guidelines.
Fidelity® Variable Insurance Products are separate account options which are purchased through a variable insurance contract.
Standard & Poor's, S&P and S&P 500 are registered service marks of The McGraw-Hill Companies, Inc. and have been licensed for use by Fidelity Distributors Corporation.
Other third-party marks appearing herein are the property of their respective owners.
All other marks appearing herein are registered or unregistered trademarks or service marks of FMR LLC or an affiliated company. © 2016 FMR LLC. All rights reserved.
This report and the financial statements contained herein are submitted for the general information of the shareholders of the Fund. This report is not authorized for distribution to prospective investors in the Fund unless preceded or accompanied by an effective prospectus.
A fund files its complete schedule of portfolio holdings with the SEC for the first and third quarters of each fiscal year on Form N-Q. Forms N-Q are available on the SEC’s web site at http://www.sec.gov. A fund's Forms N-Q may be reviewed and copied at the SEC’s Public Reference Room in Washington, DC. Information regarding the operation of the SEC's Public Reference Room may be obtained by calling 1-800-SEC-0330.
For a complete list of a fund's portfolio holdings, view the most recent holdings listing, semiannual report, or annual report on Fidelity's web site at http://www.fidelity.com, http://www.institutional.fidelity.com, or http://www.401k.com, as applicable.
NOT FDIC INSURED •MAY LOSE VALUE •NO BANK GUARANTEE
Neither the Fund nor Fidelity Distributors Corporation is a bank.
Investment Summary (Unaudited)
Top Ten Stocks as of June 30, 2016
| | % of fund's net assets | % of fund's net assets 6 months ago |
| Berkshire Hathaway, Inc. Class B | 3.1 | 3.0 |
| Chevron Corp. | 2.9 | 2.8 |
| Procter & Gamble Co. | 2.8 | 2.5 |
| JPMorgan Chase & Co. | 2.8 | 3.9 |
| Citigroup, Inc. | 2.1 | 2.6 |
| Qualcomm, Inc. | 1.8 | 1.6 |
| CVS Health Corp. | 1.7 | 0.0 |
| Chubb Ltd. | 1.7 | 2.1 |
| Walgreens Boots Alliance, Inc. | 1.6 | 1.1 |
| Sempra Energy | 1.6 | 1.1 |
| | 22.1 | |
Top Five Market Sectors as of June 30, 2016
| | % of fund's net assets | % of fund's net assets 6 months ago |
| Financials | 30.8 | 33.9 |
| Health Care | 12.1 | 10.6 |
| Energy | 11.2 | 10.9 |
| Information Technology | 9.9 | 9.0 |
| Industrials | 8.1 | 11.3 |
Asset Allocation (% of fund's net assets)
| As of June 30, 2016* |
| | Stocks | 99.1% |
| | Short-Term Investments and Net Other Assets (Liabilities) | 0.9% |

* Foreign investments - 20.2%
| As of December 31, 2015* |
| | Stocks | 99.6% |
| | Short-Term Investments and Net Other Assets (Liabilities) | 0.4% |

* Foreign investments - 22.2%
Percentages shown as 0.0% may reflect amounts less than 0.05%.
Investments June 30, 2016 (Unaudited)
Showing Percentage of Net Assets
| Common Stocks - 99.1% | | | |
| | | Shares | Value |
| CONSUMER DISCRETIONARY - 7.4% | | | |
| Auto Components - 0.9% | | | |
| Delphi Automotive PLC | | 47,000 | $2,942,200 |
| Diversified Consumer Services - 1.3% | | | |
| H&R Block, Inc. | | 40,412 | 929,476 |
| Houghton Mifflin Harcourt Co. (a) | | 209,200 | 3,269,796 |
| | | | 4,199,272 |
| Hotels, Restaurants & Leisure - 1.5% | | | |
| Extended Stay America, Inc. unit | | 155,600 | 2,326,220 |
| Wyndham Worldwide Corp. | | 37,600 | 2,678,248 |
| | | | 5,004,468 |
| Media - 3.7% | | | |
| Charter Communications, Inc. Class A | | 13,894 | 3,176,724 |
| Omnicom Group, Inc. | | 40,000 | 3,259,600 |
| Time Warner, Inc. | | 38,400 | 2,823,936 |
| Twenty-First Century Fox, Inc. Class A | | 101,900 | 2,756,395 |
| | | | 12,016,655 |
|
| TOTAL CONSUMER DISCRETIONARY | | | 24,162,595 |
|
| CONSUMER STAPLES - 7.7% | | | |
| Food & Staples Retailing - 4.0% | | | |
| CVS Health Corp. | | 57,700 | 5,524,198 |
| Safeway, Inc.: | | | |
| rights (a) | | 4,600 | 0 |
| rights (a) | | 4,600 | 828 |
| Walgreens Boots Alliance, Inc. | | 63,100 | 5,254,337 |
| Whole Foods Market, Inc. (b) | | 75,000 | 2,401,500 |
| | | | 13,180,863 |
| Food Products - 0.9% | | | |
| Darling International, Inc. (a) | | 200,700 | 2,990,430 |
| Household Products - 2.8% | | | |
| Procter & Gamble Co. | | 109,100 | 9,237,497 |
|
| TOTAL CONSUMER STAPLES | | | 25,408,790 |
|
| ENERGY - 11.2% | | | |
| Energy Equipment & Services - 2.4% | | | |
| Baker Hughes, Inc. | | 63,000 | 2,843,190 |
| Dril-Quip, Inc. (a) | | 60,800 | 3,552,544 |
| SBM Offshore NV | | 136,300 | 1,579,594 |
| | | | 7,975,328 |
| Oil, Gas & Consumable Fuels - 8.8% | | | |
| Anadarko Petroleum Corp. | | 30,800 | 1,640,100 |
| Apache Corp. | | 57,600 | 3,206,592 |
| Cheniere Energy, Inc. (a) | | 62,000 | 2,328,100 |
| Chevron Corp. | | 92,292 | 9,674,970 |
| ConocoPhillips Co. | | 94,200 | 4,107,120 |
| Lundin Petroleum AB (a) | | 189,000 | 3,444,170 |
| Suncor Energy, Inc. | | 109,000 | 3,023,770 |
| Teekay LNG Partners LP | | 128,000 | 1,440,000 |
| | | | 28,864,822 |
|
| TOTAL ENERGY | | | 36,840,150 |
|
| FINANCIALS - 30.8% | | | |
| Banks - 7.0% | | | |
| Barclays PLC sponsored ADR (b) | | 297,590 | 2,261,684 |
| Citigroup, Inc. | | 164,447 | 6,970,908 |
| JPMorgan Chase & Co. | | 146,116 | 9,079,648 |
| U.S. Bancorp | | 119,047 | 4,801,166 |
| | | | 23,113,406 |
| Capital Markets - 3.8% | | | |
| Ares Capital Corp. (b) | | 133,657 | 1,897,929 |
| BlackRock, Inc. Class A | | 10,768 | 3,688,363 |
| E*TRADE Financial Corp. (a) | | 58,221 | 1,367,611 |
| KKR & Co. LP | | 92,400 | 1,140,216 |
| Legg Mason, Inc. | | 96,500 | 2,845,785 |
| The Blackstone Group LP | | 65,500 | 1,607,370 |
| | | | 12,547,274 |
| Consumer Finance - 4.5% | | | |
| Capital One Financial Corp. | | 59,500 | 3,778,845 |
| Discover Financial Services | | 92,500 | 4,957,075 |
| OneMain Holdings, Inc. (a) | | 91,400 | 2,085,748 |
| Synchrony Financial | | 153,800 | 3,888,064 |
| | | | 14,709,732 |
| Diversified Financial Services - 3.1% | | | |
| Berkshire Hathaway, Inc. Class B (a) | | 70,300 | 10,178,738 |
| Insurance - 5.6% | | | |
| Allstate Corp. | | 44,100 | 3,084,795 |
| Brown & Brown, Inc. | | 89,900 | 3,368,553 |
| Chubb Ltd. | | 41,600 | 5,437,536 |
| FNF Group | | 73,100 | 2,741,250 |
| The Travelers Companies, Inc. | | 30,600 | 3,642,624 |
| | | | 18,274,758 |
| Real Estate Investment Trusts - 5.7% | | | |
| American Tower Corp. | | 29,700 | 3,374,217 |
| Equity Lifestyle Properties, Inc. | | 51,200 | 4,098,560 |
| Essex Property Trust, Inc. | | 15,000 | 3,421,350 |
| Extra Space Storage, Inc. | | 34,700 | 3,211,138 |
| Outfront Media, Inc. | | 194,500 | 4,701,065 |
| | | | 18,806,330 |
| Real Estate Management & Development - 1.1% | | | |
| Realogy Holdings Corp. (a) | | 127,500 | 3,700,050 |
|
| TOTAL FINANCIALS | | | 101,330,288 |
|
| HEALTH CARE - 12.1% | | | |
| Biotechnology - 2.1% | | | |
| Gilead Sciences, Inc. | | 47,500 | 3,962,450 |
| United Therapeutics Corp. (a) | | 27,600 | 2,923,392 |
| | | | 6,885,842 |
| Health Care Equipment & Supplies - 1.5% | | | |
| Medtronic PLC | | 57,600 | 4,997,952 |
| Health Care Providers & Services - 2.4% | | | |
| Laboratory Corp. of America Holdings (a) | | 35,300 | 4,598,531 |
| McKesson Corp. | | 18,200 | 3,397,030 |
| | | | 7,995,561 |
| Pharmaceuticals - 6.1% | | | |
| Endo International PLC (a) | | 189,700 | 2,957,423 |
| GlaxoSmithKline PLC sponsored ADR | | 87,000 | 3,770,580 |
| Jazz Pharmaceuticals PLC (a) | | 35,274 | 4,984,569 |
| Novartis AG sponsored ADR | | 33,000 | 2,722,830 |
| Sanofi SA sponsored ADR | | 50,500 | 2,113,425 |
| Teva Pharmaceutical Industries Ltd. sponsored ADR | | 69,400 | 3,485,962 |
| | | | 20,034,789 |
|
| TOTAL HEALTH CARE | | | 39,914,144 |
|
| INDUSTRIALS - 8.1% | | | |
| Aerospace & Defense - 2.0% | | | |
| Curtiss-Wright Corp. | | 19,800 | 1,668,150 |
| General Dynamics Corp. | | 23,600 | 3,286,064 |
| Rolls-Royce Group PLC | | 152,400 | 1,454,654 |
| | | | 6,408,868 |
| Construction & Engineering - 1.3% | | | |
| AECOM (a) | | 135,885 | 4,317,066 |
| Electrical Equipment - 2.0% | | | |
| Eaton Corp. PLC | | 74,400 | 4,443,912 |
| Regal Beloit Corp. | | 40,400 | 2,224,020 |
| | | | 6,667,932 |
| Machinery - 0.9% | | | |
| Allison Transmission Holdings, Inc. | | 20,723 | 585,010 |
| Deere & Co. | | 27,500 | 2,228,600 |
| | | | 2,813,610 |
| Road & Rail - 1.0% | | | |
| Herc Holdings, Inc. (a) | | 158,900 | 1,759,023 |
| Swift Transporation Co. (a) | | 106,900 | 1,647,329 |
| | | | 3,406,352 |
| Trading Companies & Distributors - 0.9% | | | |
| AerCap Holdings NV (a) | | 89,700 | 3,013,023 |
|
| TOTAL INDUSTRIALS | | | 26,626,851 |
|
| INFORMATION TECHNOLOGY - 9.9% | | | |
| Communications Equipment - 1.5% | | | |
| CommScope Holding Co., Inc. (a) | | 83,700 | 2,597,211 |
| Harris Corp. | | 27,700 | 2,311,288 |
| | | | 4,908,499 |
| Electronic Equipment & Components - 2.3% | | | |
| Flextronics International Ltd. (a) | | 127,100 | 1,499,780 |
| Jabil Circuit, Inc. | | 168,600 | 3,114,042 |
| TE Connectivity Ltd. | | 50,000 | 2,855,500 |
| | | | 7,469,322 |
| Internet Software & Services - 1.2% | | | |
| eBay, Inc. (a) | | 164,700 | 3,855,627 |
| IT Services - 1.0% | | | |
| Computer Sciences Corp. | | 64,600 | 3,207,390 |
| Semiconductors & Semiconductor Equipment - 3.2% | | | |
| Maxim Integrated Products, Inc. | | 58,200 | 2,077,158 |
| NXP Semiconductors NV (a) | | 33,900 | 2,655,726 |
| Qualcomm, Inc. | | 108,700 | 5,823,059 |
| | | | 10,555,943 |
| Technology Hardware, Storage & Peripherals - 0.7% | | | |
| EMC Corp. | | 93,500 | 2,540,395 |
|
| TOTAL INFORMATION TECHNOLOGY | | | 32,537,176 |
|
| MATERIALS - 5.3% | | | |
| Chemicals - 3.5% | | | |
| CF Industries Holdings, Inc. | | 111,300 | 2,682,330 |
| Eastman Chemical Co. | | 55,800 | 3,788,820 |
| The Dow Chemical Co. | | 99,400 | 4,941,174 |
| | | | 11,412,324 |
| Containers & Packaging - 0.9% | | | |
| Ball Corp. (b) | | 40,800 | 2,949,432 |
| Metals & Mining - 0.9% | | | |
| Compass Minerals International, Inc. | | 41,000 | 3,041,790 |
|
| TOTAL MATERIALS | | | 17,403,546 |
|
| TELECOMMUNICATION SERVICES - 1.5% | | | |
| Wireless Telecommunication Services - 1.5% | | | |
| Vodafone Group PLC sponsored ADR | | 155,400 | 4,800,306 |
| UTILITIES - 5.1% | | | |
| Electric Utilities - 3.5% | | | |
| American Electric Power Co., Inc. | | 58,200 | 4,079,238 |
| Edison International | | 51,307 | 3,985,015 |
| NextEra Energy, Inc. | | 26,300 | 3,429,520 |
| | | | 11,493,773 |
| Multi-Utilities - 1.6% | | | |
| Sempra Energy | | 45,500 | 5,187,910 |
|
| TOTAL UTILITIES | | | 16,681,683 |
|
| TOTAL COMMON STOCKS | | | |
| (Cost $318,275,784) | | | 325,705,529 |
|
| Nonconvertible Preferred Stocks - 0.0% | | | |
| INDUSTRIALS - 0.0% | | | |
| Aerospace & Defense - 0.0% | | | |
| Rolls-Royce Group PLC | | | |
| (Cost $16,909) | | 11,573,000 | 15,407 |
|
| Money Market Funds - 1.7% | | | |
| Fidelity Cash Central Fund, 0.43% (c) | | 35 | 35 |
| Fidelity Securities Lending Cash Central Fund, 0.46% (c)(d) | | 5,584,016 | 5,584,016 |
| TOTAL MONEY MARKET FUNDS | | | |
| (Cost $5,584,051) | | | 5,584,051 |
| TOTAL INVESTMENT PORTFOLIO - 100.8% | | | |
| (Cost $323,876,744) | | | 331,304,987 |
| NET OTHER ASSETS (LIABILITIES) - (0.8)% | | | (2,771,168) |
| NET ASSETS - 100% | | | $328,533,819 |
Legend
(a) Non-income producing
(b) Security or a portion of the security is on loan at period end.
(c) Affiliated fund that is generally available only to investment companies and other accounts managed by Fidelity Investments. The rate quoted is the annualized seven-day yield of the fund at period end. A complete unaudited listing of the fund's holdings as of its most recent quarter end is available upon request. In addition, each Fidelity Central Fund's financial statements are available on the SEC's website or upon request.
(d) Investment made with cash collateral received from securities on loan.
Affiliated Central Funds
Information regarding fiscal year to date income earned by the Fund from investments in Fidelity Central Funds is as follows:
| Fund | Income earned |
| Fidelity Cash Central Fund | $10,876 |
| Fidelity Securities Lending Cash Central Fund | 25,504 |
| Total | $36,380 |
Investment Valuation
The following is a summary of the inputs used, as of June 30, 2016, involving the Fund's assets and liabilities carried at fair value. The inputs or methodology used for valuing securities may not be an indication of the risk associated with investing in those securities. For more information on valuation inputs, and their aggregation into the levels used below, please refer to the Investment Valuation section in the accompanying Notes to Financial Statements.
| | Valuation Inputs at Reporting Date: |
| Description | Total | Level 1 | Level 2 | Level 3 |
| Investments in Securities: | | | | |
| Equities: | | | | |
| Consumer Discretionary | $24,162,595 | $24,162,595 | $-- | $-- |
| Consumer Staples | 25,408,790 | 25,407,962 | -- | 828 |
| Energy | 36,840,150 | 31,816,386 | 5,023,764 | -- |
| Financials | 101,330,288 | 101,330,288 | -- | -- |
| Health Care | 39,914,144 | 39,914,144 | -- | -- |
| Industrials | 26,642,258 | 25,187,604 | 1,454,654 | -- |
| Information Technology | 32,537,176 | 32,537,176 | -- | -- |
| Materials | 17,403,546 | 17,403,546 | -- | -- |
| Telecommunication Services | 4,800,306 | 4,800,306 | -- | -- |
| Utilities | 16,681,683 | 16,681,683 | -- | -- |
| Money Market Funds | 5,584,051 | 5,584,051 | -- | -- |
| Total Investments in Securities: | $331,304,987 | $324,825,741 | $6,478,418 | $828 |
Other Information
Distribution of investments by country or territory of incorporation, as a percentage of Total Net Assets, is as follows (Unaudited):
| United States of America | 79.8% |
| Ireland | 5.2% |
| United Kingdom | 3.9% |
| Switzerland | 3.4% |
| Netherlands | 2.2% |
| Israel | 1.1% |
| Sweden | 1.1% |
| Others (Individually Less Than 1%) | 3.3% |
| | 100.0% |
See accompanying notes which are an integral part of the financial statements.
Financial Statements
Statement of Assets and Liabilities
| | | June 30, 2016 (Unaudited) |
| Assets | | |
Investment in securities, at value (including securities loaned of $5,383,035) — See accompanying schedule:
Unaffiliated issuers (cost $318,292,693) | $325,720,936 | |
| Fidelity Central Funds (cost $5,584,051) | 5,584,051 | |
| Total Investments (cost $323,876,744) | | $331,304,987 |
| Cash | | 17 |
| Receivable for investments sold | | 8,168,613 |
| Receivable for fund shares sold | | 215,313 |
| Dividends receivable | | 552,999 |
| Distributions receivable from Fidelity Central Funds | | 5,777 |
| Other receivables | | 8,805 |
| Total assets | | 340,256,511 |
| Liabilities | | |
| Payable for investments purchased | $103,270 | |
| Payable for fund shares redeemed | 45,797 | |
| Accrued management fee | 151,475 | |
| Distribution and service plan fees payable | 1,756 | |
| Notes payable to affiliates | 5,767,000 | |
| Other affiliated payables | 42,070 | |
| Other payables and accrued expenses | 27,308 | |
| Collateral on securities loaned, at value | 5,584,016 | |
| Total liabilities | | 11,722,692 |
| Net Assets | | $328,533,819 |
| Net Assets consist of: | | |
| Paid in capital | | $321,044,839 |
| Undistributed net investment income | | 2,159,582 |
| Accumulated undistributed net realized gain (loss) on investments and foreign currency transactions | | (2,099,349) |
| Net unrealized appreciation (depreciation) on investments and assets and liabilities in foreign currencies | | 7,428,747 |
| Net Assets | | $328,533,819 |
| Initial Class: | | |
| Net Asset Value, offering price and redemption price per share ($129,081,313 ÷ 9,501,393 shares) | | $13.59 |
| Service Class: | | |
| Net Asset Value, offering price and redemption price per share ($409,687 ÷ 30,183 shares) | | $13.57 |
| Service Class 2: | | |
| Net Asset Value, offering price and redemption price per share ($8,347,800 ÷ 622,443 shares) | | $13.41 |
| Investor Class: | | |
| Net Asset Value, offering price and redemption price per share ($190,695,019 ÷ 14,061,181 shares) | | $13.56 |
See accompanying notes which are an integral part of the financial statements.
Statement of Operations
| | | Six months ended June 30, 2016 (Unaudited) |
| Investment Income | | |
| Dividends | | $3,271,216 |
| Income from Fidelity Central Funds | | 36,380 |
| Total income | | 3,307,596 |
| Expenses | | |
| Management fee | $846,939 | |
| Transfer agent fees | 172,124 | |
| Distribution and service plan fees | 10,442 | |
| Accounting and security lending fees | 60,786 | |
| Custodian fees and expenses | 5,985 | |
| Independent trustees' fees and expenses | 674 | |
| Audit | 41,440 | |
| Legal | 3,401 | |
| Interest | 240 | |
| Miscellaneous | 1,051 | |
| Total expenses before reductions | 1,143,082 | |
| Expense reductions | (3,851) | 1,139,231 |
| Net investment income (loss) | | 2,168,365 |
| Realized and Unrealized Gain (Loss) | | |
| Net realized gain (loss) on: | | |
| Investment securities: | | |
| Unaffiliated issuers | (1,076,182) | |
| Foreign currency transactions | (7,214) | |
| Total net realized gain (loss) | | (1,083,396) |
Change in net unrealized appreciation (depreciation) on:
Investment securities | 4,913,089 | |
| Assets and liabilities in foreign currencies | 966 | |
| Total change in net unrealized appreciation (depreciation) | | 4,914,055 |
| Net gain (loss) | | 3,830,659 |
| Net increase (decrease) in net assets resulting from operations | | $5,999,024 |
See accompanying notes which are an integral part of the financial statements.
Statement of Changes in Net Assets
| | Six months ended June 30, 2016 (Unaudited) | Year ended December 31, 2015 |
| Increase (Decrease) in Net Assets | | |
| Operations | | |
| Net investment income (loss) | $2,168,365 | $4,201,165 |
| Net realized gain (loss) | (1,083,396) | 30,069,901 |
| Change in net unrealized appreciation (depreciation) | 4,914,055 | (37,645,787) |
| Net increase (decrease) in net assets resulting from operations | 5,999,024 | (3,374,721) |
| Distributions to shareholders from net investment income | – | (4,173,016) |
| Distributions to shareholders from net realized gain | (992,885) | (46,078,638) |
| Total distributions | (992,885) | (50,251,654) |
| Share transactions - net increase (decrease) | 14,048,164 | 70,164,250 |
| Total increase (decrease) in net assets | 19,054,303 | 16,537,875 |
| Net Assets | | |
| Beginning of period | 309,479,516 | 292,941,641 |
| End of period | $328,533,819 | $309,479,516 |
| Other Information | | |
| Undistributed net investment income end of period | $2,159,582 | $– |
| Distributions in excess of net investment income end of period | $– | $(8,783) |
See accompanying notes which are an integral part of the financial statements.
Financial Highlights — VIP Value Portfolio Initial Class
| | Six months ended (Unaudited) June 30, | Years ended December 31, | | | | |
| | 2016 | 2015 | 2014 | 2013 | 2012 | 2011 |
| Selected Per–Share Data | | | | | | |
| Net asset value, beginning of period | $13.36 | $16.04 | $15.18 | $12.60 | $10.60 | $11.00 |
| Income from Investment Operations | | | | | | |
| Net investment income (loss)A | .10 | .21 | .24B | .19 | .20 | .12 |
| Net realized and unrealized gain (loss) | .17 | (.35) | 1.47 | 3.84 | 2.01 | (.40) |
| Total from investment operations | .27 | (.14) | 1.71 | 4.03 | 2.21 | (.28) |
| Distributions from net investment income | – | (.21) | (.22) | (.17) | (.21) | (.12) |
| Distributions from net realized gain | (.04) | (2.33) | (.63) | (1.27) | – | – |
| Total distributions | (.04) | (2.54) | (.85) | (1.45)C | (.21) | (.12) |
| Net asset value, end of period | $13.59 | $13.36 | $16.04 | $15.18 | $12.60 | $10.60 |
| Total ReturnD,E,F | 2.08% | (.75)% | 11.41% | 32.46% | 20.91% | (2.51)% |
| Ratios to Average Net AssetsG,H | | | | | | |
| Expenses before reductions | .69%I | .69% | .69% | .71% | .72% | .73% |
| Expenses net of fee waivers, if any | .69%I | .69% | .69% | .70% | .72% | .72% |
| Expenses net of all reductions | .69%I | .68% | .69% | .70% | .71% | .72% |
| Net investment income (loss) | 1.46%I | 1.35% | 1.54%B | 1.27% | 1.70% | 1.14% |
| Supplemental Data | | | | | | |
| Net assets, end of period (000 omitted) | $129,081 | $129,151 | $130,678 | $115,004 | $82,711 | $82,980 |
| Portfolio turnover rateJ | 72%I | 78%K | 53% | 96% | 106% | 79% |
A Calculated based on average shares outstanding during the period.
B Net Investment income per share reflects a large, non-recurring dividend which amounted to $.05 per share. Excluding this non-recurring dividend, the ratio of net investment income (loss) to average net assets would have been 1.22%.
C Total distributions of $1.45 per share is comprised of distributions from net investment income of $.172 and distributions from net realized gain of $1.274 per share.
D Total returns for periods of less than one year are not annualized.
E Total returns do not reflect charges attributable to your insurance company's separate account. Inclusion of these charges would reduce the total returns shown.
F Total returns would have been lower if certain expenses had not been reduced during the applicable periods shown.
G Fees and expenses of any underlying Fidelity Central Funds are not included in the Fund's expense ratio. The Fund indirectly bears its proportionate share of the expenses of any underlying Fidelity Central Funds.
H Expense ratios reflect operating expenses of the class. Expenses before reductions do not reflect amounts reimbursed by the investment adviser or reductions from brokerage service arrangements or reductions from other expense offset arrangements and do not represent the amount paid by the class during periods when reimbursements or reductions occur. Expenses net of fee waivers reflect expenses after reimbursement by the investment adviser but prior to reductions from brokerage service arrangements or other expense offset arrangements. Expenses net of all reductions represent the net expenses paid by the class.
I Annualized
J Amount does not include the portfolio activity of any underlying Fidelity Central Funds.
K The portfolio turnover rate does not include the assets acquired in the merger.
See accompanying notes which are an integral part of the financial statements.
Financial Highlights — VIP Value Portfolio Service Class
| | Six months ended (Unaudited) June 30, | Years ended December 31, | | | | |
| | 2016 | 2015 | 2014 | 2013 | 2012 | 2011 |
| Selected Per–Share Data | | | | | | |
| Net asset value, beginning of period | $13.36 | $16.04 | $15.18 | $12.60 | $10.60 | $10.99 |
| Income from Investment Operations | | | | | | |
| Net investment income (loss)A | .09 | .19 | .23B | .17 | .19 | .12 |
| Net realized and unrealized gain (loss) | .16 | (.34) | 1.47 | 3.84 | 2.01 | (.40) |
| Total from investment operations | .25 | (.15) | 1.70 | 4.01 | 2.20 | (.28) |
| Distributions from net investment income | – | (.20) | (.21) | (.15) | (.20) | (.11) |
| Distributions from net realized gain | (.04) | (2.33) | (.63) | (1.27) | – | – |
| Total distributions | (.04) | (2.53) | (.84) | (1.43)C | (.20) | (.11) |
| Net asset value, end of period | $13.57 | $13.36 | $16.04 | $15.18 | $12.60 | $10.60 |
| Total ReturnD,E,F | 1.93% | (.82)% | 11.31% | 32.29% | 20.80% | (2.55)% |
| Ratios to Average Net AssetsG,H | | | | | | |
| Expenses before reductions | .79%I | .78% | .79% | .80% | .81% | .81% |
| Expenses net of fee waivers, if any | .79%I | .78% | .79% | .80% | .81% | .81% |
| Expenses net of all reductions | .79%I | .78% | .79% | .79% | .80% | .81% |
| Net investment income (loss) | 1.36%I | 1.25% | 1.44%B | 1.18% | 1.61% | 1.05% |
| Supplemental Data | | | | | | |
| Net assets, end of period (000 omitted) | $410 | $520 | $230 | $214 | $211 | $194 |
| Portfolio turnover rateJ | 72%I | 78%K | 53% | 96% | 106% | 79% |
A Calculated based on average shares outstanding during the period.
B Net Investment income per share reflects a large, non-recurring dividend which amounted to $.05 per share. Excluding this non-recurring dividend, the ratio of net investment income (loss) to average net assets would have been 1.12%.
C Total distributions of $1.43 per share is comprised of distributions from net investment income of $.152 and distributions from net realized gain of $1.274 per share.
D Total returns for periods of less than one year are not annualized.
E Total returns do not reflect charges attributable to your insurance company's separate account. Inclusion of these charges would reduce the total returns shown.
F Total returns would have been lower if certain expenses had not been reduced during the applicable periods shown.
G Fees and expenses of any underlying Fidelity Central Funds are not included in the Fund's expense ratio. The Fund indirectly bears its proportionate share of the expenses of any underlying Fidelity Central Funds.
H Expense ratios reflect operating expenses of the class. Expenses before reductions do not reflect amounts reimbursed by the investment adviser or reductions from brokerage service arrangements or reductions from other expense offset arrangements and do not represent the amount paid by the class during periods when reimbursements or reductions occur. Expenses net of fee waivers reflect expenses after reimbursement by the investment adviser but prior to reductions from brokerage service arrangements or other expense offset arrangements. Expenses net of all reductions represent the net expenses paid by the class.
I Annualized
J Amount does not include the portfolio activity of any underlying Fidelity Central Funds.
K The portfolio turnover rate does not include the assets acquired in the merger.
See accompanying notes which are an integral part of the financial statements.
Financial Highlights — VIP Value Portfolio Service Class 2
| | Six months ended (Unaudited) June 30, | Years ended December 31, | | | | |
| | 2016 | 2015 | 2014 | 2013 | 2012 | 2011 |
| Selected Per–Share Data | | | | | | |
| Net asset value, beginning of period | $13.21 | $15.89 | $15.05 | $12.50 | $10.52 | $10.90 |
| Income from Investment Operations | | | | | | |
| Net investment income (loss)A | .08 | .17 | .20B | .15 | .17 | .10 |
| Net realized and unrealized gain (loss) | .16 | (.34) | 1.45 | 3.81 | 1.99 | (.39) |
| Total from investment operations | .24 | (.17) | 1.65 | 3.96 | 2.16 | (.29) |
| Distributions from net investment income | – | (.18) | (.18) | (.14) | (.18) | (.09) |
| Distributions from net realized gain | (.04) | (2.33) | (.63) | (1.27) | – | – |
| Total distributions | (.04) | (2.51) | (.81) | (1.41) | (.18) | (.09) |
| Net asset value, end of period | $13.41 | $13.21 | $15.89 | $15.05 | $12.50 | $10.52 |
| Total ReturnC,D,E | 1.88% | (.97)% | 11.11% | 32.18% | 20.55% | (2.68)% |
| Ratios to Average Net AssetsF,G | | | | | | |
| Expenses before reductions | .94%H | .93% | .94% | .96% | .98% | .98% |
| Expenses net of fee waivers, if any | .94%H | .93% | .94% | .96% | .98% | .97% |
| Expenses net of all reductions | .93%H | .93% | .94% | .95% | .97% | .97% |
| Net investment income (loss) | 1.21%H | 1.10% | 1.29%B | 1.01% | 1.45% | .89% |
| Supplemental Data | | | | | | |
| Net assets, end of period (000 omitted) | $8,348 | $9,026 | $7,945 | $5,831 | $3,736 | $3,202 |
| Portfolio turnover rateI | 72%H | 78%J | 53% | 96% | 106% | 79% |
A Calculated based on average shares outstanding during the period.
B Net Investment income per share reflects a large, non-recurring dividend which amounted to $.05 per share. Excluding this non-recurring dividend, the ratio of net investment income (loss) to average net assets would have been .97%.
C Total returns for periods of less than one year are not annualized.
D Total returns do not reflect charges attributable to your insurance company's separate account. Inclusion of these charges would reduce the total returns shown.
E Total returns would have been lower if certain expenses had not been reduced during the applicable periods shown.
F Fees and expenses of any underlying Fidelity Central Funds are not included in the Fund's expense ratio. The Fund indirectly bears its proportionate share of the expenses of any underlying Fidelity Central Funds.
G Expense ratios reflect operating expenses of the class. Expenses before reductions do not reflect amounts reimbursed by the investment adviser or reductions from brokerage service arrangements or reductions from other expense offset arrangements and do not represent the amount paid by the class during periods when reimbursements or reductions occur. Expenses net of fee waivers reflect expenses after reimbursement by the investment adviser but prior to reductions from brokerage service arrangements or other expense offset arrangements. Expenses net of all reductions represent the net expenses paid by the class.
H Annualized
I Amount does not include the portfolio activity of any underlying Fidelity Central Funds.
J The portfolio turnover rate does not include the assets acquired in the merger.
See accompanying notes which are an integral part of the financial statements.
Financial Highlights — VIP Value Portfolio Investor Class
| | Six months ended (Unaudited) June 30, | Years ended December 31, | | | | |
| | 2016 | 2015 | 2014 | 2013 | 2012 | 2011 |
| Selected Per–Share Data | | | | | | |
| Net asset value, beginning of period | $13.35 | $16.02 | $15.17 | $12.59 | $10.59 | $10.99 |
| Income from Investment Operations | | | | | | |
| Net investment income (loss)A | .09 | .19 | .23B | .18 | .19 | .12 |
| Net realized and unrealized gain (loss) | .16 | (.33) | 1.46 | 3.84 | 2.01 | (.41) |
| Total from investment operations | .25 | (.14) | 1.69 | 4.02 | 2.20 | (.29) |
| Distributions from net investment income | – | (.20) | (.21) | (.16) | (.20) | (.11) |
| Distributions from net realized gain | (.04) | (2.33) | (.63) | (1.27) | – | – |
| Total distributions | (.04) | (2.53) | (.84) | (1.44)C | (.20) | (.11) |
| Net asset value, end of period | $13.56 | $13.35 | $16.02 | $15.17 | $12.59 | $10.59 |
| Total ReturnD,E,F | 1.93% | (.76)% | 11.28% | 32.42% | 20.83% | (2.59)% |
| Ratios to Average Net AssetsG,H | | | | | | |
| Expenses before reductions | .77%I | .77% | .77% | .78% | .80% | .80% |
| Expenses net of fee waivers, if any | .77%I | .76% | .77% | .78% | .80% | .80% |
| Expenses net of all reductions | .77%I | .76% | .77% | .78% | .79% | .80% |
| Net investment income (loss) | 1.37%I | 1.27% | 1.46%B | 1.19% | 1.62% | 1.06% |
| Supplemental Data | | | | | | |
| Net assets, end of period (000 omitted) | $190,695 | $170,782 | $154,089 | $110,911 | $61,852 | $58,025 |
| Portfolio turnover rateJ | 72%I | 78%K | 53% | 96% | 106% | 79% |
A Calculated based on average shares outstanding during the period.
B Net Investment income per share reflects a large, non-recurring dividend which amounted to $.05 per share. Excluding this non-recurring dividend, the ratio of net investment income (loss) to average net assets would have been 1.14%.
C Total distributions of $1.44 per share is comprised of distributions from net investment income of $.163 and distributions from net realized gain of $1.274 per share.
D Total returns for periods of less than one year are not annualized.
E Total returns do not reflect charges attributable to your insurance company's separate account. Inclusion of these charges would reduce the total returns shown.
F Total returns would have been lower if certain expenses had not been reduced during the applicable periods shown.
G Fees and expenses of any underlying Fidelity Central Funds are not included in the Fund's expense ratio. The Fund indirectly bears its proportionate share of the expenses of any underlying Fidelity Central Funds.
H Expense ratios reflect operating expenses of the class. Expenses before reductions do not reflect amounts reimbursed by the investment adviser or reductions from brokerage service arrangements or reductions from other expense offset arrangements and do not represent the amount paid by the class during periods when reimbursements or reductions occur. Expenses net of fee waivers reflect expenses after reimbursement by the investment adviser but prior to reductions from brokerage service arrangements or other expense offset arrangements. Expenses net of all reductions represent the net expenses paid by the class.
I Annualized
J Amount does not include the portfolio activity of any underlying Fidelity Central Funds.
K The portfolio turnover rate does not include the assets acquired in the merger.
See accompanying notes which are an integral part of the financial statements.
Notes to Financial Statements (Unaudited)
For the period ended June 30, 2016
1. Organization.
VIP Value Portfolio (the Fund) is a fund of Variable Insurance Products Fund (the Trust) and is authorized to issue an unlimited number of shares. The Trust is registered under the Investment Company Act of 1940, as amended (the 1940 Act), as an open-end management investment company organized as a Massachusetts business trust. Shares of the Fund may only be purchased by insurance companies for the purpose of funding variable annuity or variable life insurance contracts. The Fund offers the following classes of shares: Initial Class shares, Service Class shares, Service Class 2 shares and Investor Class shares. All classes have equal rights and voting privileges, except for matters affecting a single class.
2. Investments in Fidelity Central Funds.
The Fund invests in Fidelity Central Funds, which are open-end investment companies generally available only to other investment companies and accounts managed by the investment adviser and its affiliates. The Fund's Schedule of Investments lists each of the Fidelity Central Funds held as of period end, if any, as an investment of the Fund, but does not include the underlying holdings of each Fidelity Central Fund. As an Investing Fund, the Fund indirectly bears its proportionate share of the expenses of the underlying Fidelity Central Funds.
The Money Market Central Funds seek preservation of capital and current income and are managed by Fidelity Investments Money Management, Inc. (FIMM), an affiliate of the investment adviser. Annualized expenses of the Money Market Central Funds as of their most recent shareholder report date are less than .005%.
A complete unaudited list of holdings for each Fidelity Central Fund is available upon request or at the Securities and Exchange Commission (the SEC) website at www.sec.gov. In addition, the financial statements of the Fidelity Central Funds are available on the SEC website or upon request.
3. Significant Accounting Policies.
The financial statements have been prepared in conformity with accounting principles generally accepted in the United States of America (GAAP), which require management to make certain estimates and assumptions at the date of the financial statements. Actual results could differ from those estimates. Subsequent events, if any, through the date that the financial statements were issued have been evaluated in the preparation of the financial statements. The following summarizes the significant accounting policies of the Fund:
Investment Valuation. Investments are valued as of 4:00 p.m. Eastern time on the last calendar day of the period. The Board of Trustees (the Board) has delegated the day to day responsibility for the valuation of the Fund's investments to the Fidelity Management & Research Company (FMR) Fair Value Committee (the Committee). In accordance with valuation policies and procedures approved by the Board, the Fund attempts to obtain prices from one or more third party pricing vendors or brokers to value its investments. When current market prices, quotations or currency exchange rates are not readily available or reliable, investments will be fair valued in good faith by the Committee, in accordance with procedures adopted by the Board. Factors used in determining fair value vary by investment type and may include market or investment specific events. The frequency with which these procedures are used cannot be predicted and they may be utilized to a significant extent. The Committee oversees the Fund's valuation policies and procedures and reports to the Board on the Committee's activities and fair value determinations. The Board monitors the appropriateness of the procedures used in valuing the Fund's investments and ratifies the fair value determinations of the Committee.
The Fund categorizes the inputs to valuation techniques used to value its investments into a disclosure hierarchy consisting of three levels as shown below:
- Level 1 – quoted prices in active markets for identical investments
- Level 2 – other significant observable inputs (including quoted prices for similar investments, interest rates, prepayment speeds, etc.)
- Level 3 – unobservable inputs (including the Fund's own assumptions based on the best information available)
Valuation techniques used to value the Fund's investments by major category are as follows:
Equity securities, including restricted securities, for which market quotations are readily available, are valued at the last reported sale price or official closing price as reported by a third party pricing vendor on the primary market or exchange on which they are traded and are categorized as Level 1 in the hierarchy. In the event there were no sales during the day or closing prices are not available, securities are valued at the last quoted bid price or may be valued using the last available price and are generally categorized as Level 2 in the hierarchy. For foreign equity securities, when market or security specific events arise, comparisons to the valuation of American Depositary Receipts (ADRs), futures contracts, Exchange-Traded Funds (ETFs) and certain indexes as well as quoted prices for similar securities may be used and would be categorized as Level 2 in the hierarchy. Utilizing these techniques may result in transfers between Level 1 and Level 2. For equity securities, including restricted securities, where observable inputs are limited, assumptions about market activity and risk are used and these securities may be categorized as Level 3 in the hierarchy.
Investments in open-end mutual funds, including the Fidelity Central Funds, are valued at their closing net asset value (NAV) each business day and are categorized as Level 1 in the hierarchy.
Changes in valuation techniques may result in transfers in or out of an assigned level within the disclosure hierarchy. The aggregate value of investments by input level as of June 30, 2016 is included at the end of the Fund's Schedule of Investments.
Foreign Currency. The Fund may use foreign currency contracts to facilitate transactions in foreign-denominated securities. Gains and losses from these transactions may arise from changes in the value of the foreign currency or if the counterparties do not perform under the contracts' terms.
Foreign-denominated assets, including investment securities, and liabilities are translated into U.S. dollars at the exchange rates at period end. Purchases and sales of investment securities, income and dividends received and expenses denominated in foreign currencies are translated into U.S. dollars at the exchange rate in effect on the transaction date.
The effects of exchange rate fluctuations on investments are included with the net realized and unrealized gain (loss) on investment securities. Other foreign currency transactions resulting in realized and unrealized gain (loss) are disclosed separately.
Investment Transactions and Income. For financial reporting purposes, the Fund's investment holdings and NAV include trades executed through the end of the last business day of the period. The NAV per share for processing shareholder transactions is calculated as of the close of business of the New York Stock Exchange (NYSE), normally 4:00 p.m. Eastern time and includes trades executed through the end of the prior business day. Gains and losses on securities sold are determined on the basis of identified cost and may include proceeds received from litigation. Dividend income is recorded on the ex-dividend date, except for certain dividends from foreign securities where the ex-dividend date may have passed, which are recorded as soon as the Fund is informed of the ex-dividend date. Non-cash dividends included in dividend income, if any, are recorded at the fair market value of the securities received. Income and capital gain distributions from Fidelity Central Funds, if any, are recorded on the ex-dividend date. Distributions received on securities that represent a return of capital or capital gain are recorded as a reduction of cost of investments and/or as a realized gain. Subsequent to ex-dividend date the Fund determines the components of these distributions, based upon receipt of tax filings or other correspondence relating to the underlying investment. Investment income is recorded net of foreign taxes withheld where recovery of such taxes is uncertain.
Class Allocations and Expenses. Investment income, realized and unrealized capital gains and losses, common expenses of the Fund, and certain fund-level expense reductions, if any, are allocated daily on a pro-rata basis to each class based on the relative net assets of each class to the total net assets of the Fund. Each class differs with respect to transfer agent and distribution and service plan fees incurred. Certain expense reductions may also differ by class. For the reporting period, the allocated portion of income and expenses to each class as a percent of its average net assets may vary due to the timing of recording these transactions in relation to fluctuating net assets of the classes. Expenses directly attributable to a fund are charged to that fund. Expenses attributable to more than one fund are allocated among the respective funds on the basis of relative net assets or other appropriate methods. Expense estimates are accrued in the period to which they relate and adjustments are made when actual amounts are known.
Income Tax Information and Distributions to Shareholders. Each year, the Fund intends to qualify as a regulated investment company under Subchapter M of the Internal Revenue Code, including distributing substantially all of its taxable income and realized gains. As a result, no provision for U.S. Federal income taxes is required. The Fund files a U.S. federal tax return, in addition to state and local tax returns as required. The Fund's federal income tax returns are subject to examination by the Internal Revenue Service (IRS) for a period of three fiscal years after they are filed. State and local tax returns may be subject to examination for an additional fiscal year depending on the jurisdiction. Foreign taxes are provided for based on the Fund's understanding of the tax rules and rates that exist in the foreign markets in which it invests.
Distributions are declared and recorded on the ex-dividend date. Income dividends and capital gain distributions are declared separately for each class. Income and capital gain distributions are determined in accordance with income tax regulations, which may differ from GAAP.
Capital accounts within the financial statements are adjusted for permanent book-tax differences. These adjustments have no impact on net assets or the results of operations. Capital accounts are not adjusted for temporary book-tax differences which will reverse in a subsequent period.
Book-tax differences are primarily due to foreign currency transactions, capital loss carryforwards, partnerships and losses deferred due to wash sales.
The federal tax cost of investment securities and unrealized appreciation (depreciation) as of period end were as follows:
| Gross unrealized appreciation | $ 31,743,156 |
| Gross unrealized depreciation | (24,573,444) |
| Net unrealized appreciation (depreciation) on securities | $7,169,712 |
| Tax cost | $324,135,275 |
Capital loss carryforwards are only available to offset future capital gains of the Fund to the extent provided by regulations and may be limited. Under the Regulated Investment Company Modernization Act of 2010 (the Act), the Fund is permitted to carry forward capital losses incurred in taxable years beginning after December 22, 2010 for an unlimited period and such capital losses are required to be used prior to any losses that expire. The capital loss carryforward information presented below, including any applicable limitation, is estimated as of fiscal period end and is subject to adjustment.
| Fiscal Year of expiration | |
| 2016 | $(803,334) |
The Fund acquired $14,116,912 of capital loss carryforwards from VIP Value Leaders Portfolio when it merged into the Fund in April 2015. The losses acquired that will be available to offset future capital gains of the Fund will be limited to approximately $803,334 per year. As a result, at least $12,761,149 of these losses will expire unused and is not included in the table above.
The Fund elected to defer to its next fiscal year $8,783 of ordinary losses recognized during the period November 1, 2015 to December 31, 2015.
4. Purchases and Sales of Investments.
Purchases and sales of securities, other than short-term securities, aggregated $125,466,584 and $111,496,419, respectively.
5. Fees and Other Transactions with Affiliates.
Management Fee. Fidelity Management & Research Company (the investment adviser) and its affiliates provide the Fund with investment management related services for which the Fund pays a monthly management fee. The management fee is the sum of an individual fund fee rate that is based on an annual rate of .30% of the Fund's average net assets and an annualized group fee rate that averaged .25% during the period. The group fee rate is based upon the average net assets of all the mutual funds advised by the investment adviser, including any mutual funds previously advised by the investment adviser that are currently advised by Fidelity SelectCo, LLC, an affiliate of the investment adviser. The group fee rate decreases as assets under management increase and increases as assets under management decrease. For the reporting period, the total annualized management fee rate was .55% of the Fund's average net assets.
Distribution and Service Plan Fees. In accordance with Rule 12b-1 of the 1940 Act, the Fund has adopted separate 12b-1 Plans for each Service Class of shares. Each Service Class pays Fidelity Distributors Corporation (FDC), an affiliate of the investment adviser, a service fee. For the period, the service fee is based on an annual rate of .10% of Service Class' average net assets and .25% of Service Class 2's average net assets.
For the period, total fees, all of which were re-allowed to insurance companies for the distribution of shares and providing shareholder support services, were as follows:
| Service Class | $232 |
| Service Class 2 | 10,210 |
| | $10,442 |
Transfer Agent Fees. Fidelity Investments Institutional Operations Company, Inc. (FIIOC), an affiliate of the investment adviser, is the Fund's transfer, dividend disbursing, and shareholder servicing agent. FIIOC receives an asset-based fee with respect to each class. Each class (with the exception of Investor Class) pays a fee for transfer agent services, typesetting, and printing and mailing of shareholder reports, excluding mailing of proxy statements, equal to an annual rate of .07% (.15% for Investor Class) of class-level average net assets. For the period, transfer agent fees for each class were as follows:
| Initial Class | $41,556 |
| Service Class | 153 |
| Service Class 2 | 2,695 |
| Investor Class | 127,720 |
| | $172,124 |
Accounting and Security Lending Fees. Fidelity Service Company, Inc. (FSC), an affiliate of the investment adviser, maintains the Fund's accounting records. The accounting fee is based on the level of average net assets for each month. Under a separate contract, FSC administers the security lending program. The security lending fee is based on the number and duration of lending transactions.
Brokerage Commissions. The Fund placed a portion of its portfolio transactions with brokerage firms which are affiliates of the investment adviser Brokerage commissions are included in net realized gain (loss) and change in net unrealized appreciation (depreciation) in the Statement of Operations. The commissions paid to these affiliated firms were $8,286 for the period.
Interfund Lending Program. Pursuant to an Exemptive Order issued by the SEC, the Fund, along with other registered investment companies having management contracts with Fidelity Management & Research Company (FMR) or other affiliated entities of FMR, may participate in an interfund lending program. This program provides an alternative credit facility allowing the funds to borrow from, or lend money to, other participating affiliated funds. Any open loans, including accrued interest, at period end are presented under the caption "Notes payable to affiliates" in the Fund's Statement of Assets and Liabilities. The Fund's activity in this program during the period for which loans were outstanding was as follows:
| Borrower or Lender | Average Loan Balance | Weighted Average Interest Rate | Interest Expense |
| Borrower | $6,892,000 | .63% | $240 |
Interfund Trades. The Fund may purchase from or sell securities to other Fidelity Funds under procedures adopted by the Board. The procedures have been designed to ensure these interfund trades are executed in accordance with Rule 17a-7 of the 1940 Act. Interfund trades are included within the respective purchases and sales amounts shown in the Purchases and Sales of Investments note.
Other. During the period, the investment adviser reimbursed the Fund for certain losses in the amount of $7,878.
6. Committed Line of Credit.
The Fund participates with other funds managed by the investment adviser or an affiliate in a $4.25 billion credit facility (the "line of credit") to be utilized for temporary or emergency purposes to fund shareholder redemptions or for other short-term liquidity purposes. The Fund has agreed to pay commitment fees on its pro-rata portion of the line of credit, which amounted to $270 and is reflected in Miscellaneous expenses on the Statement of Operations. During the period, the Fund did not borrow on this line of credit.
7. Security Lending.
The Fund lends portfolio securities through a lending agent from time to time in order to earn additional income. For equity securities, a lending agent is used and may loan securities to certain qualified borrowers, including Fidelity Capital Markets (FCM), a broker-dealer affiliated with the Fund. On the settlement date of the loan, the Fund receives collateral (in the form of U.S. Treasury obligations, letters of credit and/or cash) against the loaned securities and maintains collateral in an amount not less than 100% of the market value of the loaned securities during the period of the loan. The market value of the loaned securities is determined at the close of business of the Fund and any additional required collateral is delivered to the Fund on the next business day. The Fund or borrower may terminate the loan at any time, and if the borrower defaults on its obligation to return the securities loaned because of insolvency or other reasons, the Fund may apply collateral received from the borrower against the obligation. The Fund may experience delays and costs in recovering the securities loaned. Any cash collateral received is invested in the Fidelity Securities Lending Cash Central Fund. The value of loaned securities and cash collateral at period end are disclosed on the Fund's Statement of Assets and Liabilities. At period end, there were no security loans outstanding with FCM. Security lending income represents the income earned on investing cash collateral, less rebates paid to borrowers and any lending agent fees associated with the loan, plus any premium payments received for lending certain types of securities. Security lending income is presented in the Statement of Operations as a component of income from Fidelity Central Funds. Total security lending income during the period amounted to $25,504, including $1 from securities loaned to FCM.
8. Expense Reductions.
Commissions paid to certain brokers with whom the investment adviser, or its affiliates, places trades on behalf of the Fund include an amount in addition to trade execution, which may be rebated back to the Fund to offset certain expenses. This amount totaled $2,739 for the period.
In addition, during the period the investment adviser reimbursed and/or waived a portion of fund-level operating expenses in the amount of $1,112.
9. Distributions to Shareholders.
Distributions to shareholders of each class were as follows:
| | Six months ended
June 30, 2016 | Year ended December 31, 2015 |
| From net investment income | | |
| Initial Class | $– | $1,816,575 |
| Service Class | – | 7,794 |
| Service Class 2 | – | 107,382 |
| Investor Class | – | 2,241,265 |
| Total | $– | $4,173,016 |
| From net realized gain | | |
| Initial Class | $415,407 | $19,739,039 |
| Service Class | 1,673 | 67,825 |
| Service Class 2 | 26,723 | 1,216,600 |
| Investor Class | 549,082 | 25,055,174 |
| Total | $992,885 | $46,078,638 |
10. Share Transactions.
Transactions for each class of shares were as follows:
| | Shares | Shares | Dollars | Dollars |
| | Six months ended
June 30, 2016 | Year ended December 31, 2015 | Six months ended
June 30, 2016 | Year ended December 31, 2015 |
| Initial Class | | | | |
| Shares sold | 867,364 | 1,317,637 | $11,425,700 | $20,050,129 |
| Issued in exchange for shares of VIP Value Leaders Portfolio | – | 518,743 | – | 8,227,271 |
| Reinvestment of distributions | 34,134 | 1,563,434 | 415,407 | 21,555,614 |
| Shares redeemed | (1,063,491) | (1,884,898) | (14,037,230) | (28,893,738) |
| Net increase (decrease) | (161,993) | 1,514,916 | $(2,196,123) | $20,939,276 |
| Service Class | | | | |
| Shares sold | 3 | – | $42 | $– |
| Issued in exchange for shares of VIP Value Leaders Portfolio | – | 29,206 | – | 462,913 |
| Reinvestment of distributions | 138 | 5,626 | 1,673 | 75,619 |
| Shares redeemed | (8,888) | (10,249) | (117,877) | (148,625) |
| Net increase (decrease) | (8,747) | 24,583 | $(116,162) | $389,907 |
| Service Class 2 | | | | |
| Shares sold | 164,794 | 331,231 | $2,116,863 | $4,956,157 |
| Issued in exchange for shares of VIP Value Leaders Portfolio | – | 131,884 | – | 2,069,262 |
| Reinvestment of distributions | 2,223 | 98,130 | 26,723 | 1,323,982 |
| Shares redeemed | (227,802) | (378,095) | (2,921,138) | (5,759,103) |
| Net increase (decrease) | (60,785) | 183,150 | $(777,552) | $2,590,298 |
| Investor Class | | | | |
| Shares sold | 2,102,773 | 2,099,947 | $28,044,240 | $32,108,962 |
| Issued in exchange for shares of VIP Value Leaders Portfolio | – | 1,374,869 | – | 21,764,182 |
| Reinvestment of distributions | 45,192 | 1,987,488 | 549,082 | 27,296,439 |
| Shares redeemed | (882,243) | (2,286,249) | (11,455,321) | (34,924,814) |
| Net increase (decrease) | 1,265,722 | 3,176,055 | $17,138,001 | $46,244,769 |
11. Other.
The Fund's organizational documents provide former and current trustees and officers with a limited indemnification against liabilities arising in connection with the performance of their duties to the Fund. In the normal course of business, the Fund may also enter into contracts that provide general indemnifications. The Fund's maximum exposure under these arrangements is unknown as this would be dependent on future claims that may be made against the Fund. The risk of material loss from such claims is considered remote.
At the end of the period, the investment adviser or its affiliates were the owners of record of 53% of the total outstanding shares of the Fund. In addition, at the end of the period, VIP Freedom 2020 Portfolio was the owner of record of approximately 12% of the total outstanding shares of the Fund. Mutual funds managed by the investment adviser or its affiliates were the owners of record, in the aggregate, of approximately 43% of the total outstanding shares of the Fund.
12. Prior Fiscal Year Merger Information.
On April 24, 2015, the Fund acquired all of the assets and assumed all of the liabilities of VIP Value Leaders Portfolio ("Target Fund") pursuant to an Agreement and Plan of Reorganization approved by the Board of Trustees ("The Board"). The acquisition was accomplished by an exchange of shares of each class of the Fund for corresponding shares then outstanding of the Target Fund at their respective net asset value on the acquisition date. The reorganization provides shareholders of the Target Fund access to a larger portfolio with a similar investment objective and lower expenses. The reorganization qualified as a tax-free reorganization for federal income tax purposes with no gain or loss recognized to the funds or their shareholders. The Target Fund's net assets of $32,523,628, including securities of $32,509,381 and unrealized appreciation of $1,391,472 was combined with VIP Value Portfolio's net assets of $310,093,250 for total net assets after the acquisition of $342,616,878.
Pro forma results of operations of the combined entity for the entire period ended December 31, 2015, as though the acquisition had occurred as of the beginning of the year (rather than on the actual acquisition dates), are as follows:
| Net Investment income (loss) | $4,840,725 |
| Total net realized gain (loss) | 32,367,941 |
| Total change in net unrealized appreciation (depreciation) | (39,051,629) |
| Net increase (decrease) in net assets resulting from operations | $(1,842,963) |
Because the combined investment portfolios have been managed as a single portfolio since the acquisition was completed, it is not practicable to separate the amounts of revenue and earnings of the acquired fund that have been included in the Fund's accompanying Statement of Operations since April 24, 2015.
Shareholder Expense Example
As a shareholder of the Fund, you incur two types of costs: (1) transaction costs, and (2) ongoing costs, including management fees, distribution and/or service (12b-1) fees and other Fund expenses. This Example is intended to help you understand your ongoing costs (in dollars) of investing in the Fund and to compare these costs with the ongoing costs of investing in other mutual funds.
The Example is based on an investment of $1,000 invested at the beginning of the period and held for the entire period (January 1, 2016 to June 30, 2016).
Actual Expenses
The first line of the accompanying table for each class of the Fund provides information about actual account values and actual expenses. You may use the information in this line, together with the amount you invested, to estimate the expenses that you paid over the period. Simply divide your account value by $1,000.00 (for example, an $8,600 account value divided by $1,000.00 = 8.6), then multiply the result by the number in the first line for a class of the Fund under the heading entitled "Expenses Paid During Period" to estimate the expenses you paid on your account during this period. The estimate of expenses does not include any fees or other expenses of any variable annuity or variable life insurance product. If they were, the estimate of expenses you paid during the period would be higher, and your ending account value would be lower. In addition, the Fund, as a shareholder in the underlying Fidelity Central Funds, will indirectly bear its pro-rata share of the fees and expenses incurred by the underlying Fidelity Central Funds. These fees and expenses are not included in the Fund's annualized expense ratio used to calculate the expense estimate in the table below.
Hypothetical Example for Comparison Purposes
The second line of the accompanying table for each class of the Fund provides information about hypothetical account values and hypothetical expenses based on a Class' actual expense ratio and an assumed rate of return of 5% per year before expenses, which is not the Class' actual return. The hypothetical account values and expenses may not be used to estimate the actual ending account balance or expenses you paid for the period. You may use this information to compare the ongoing costs of investing in the Fund and other funds. To do so, compare this 5% hypothetical example with the 5% hypothetical examples that appear in the shareholder reports of the other funds. The estimate of expenses does not include any fees or other expenses of any variable annuity or variable life insurance product. If they were, the estimate of expenses you paid during the period would be higher, and your ending account value would be lower. In addition, the Fund, as a shareholder in the underlying Fidelity Central Funds, will indirectly bear its pro-rata share of the fees and expenses incurred by the underlying Fidelity Central Funds. These fees and expenses are not included in the Fund's annualized expense ratio used to calculate the expense estimate in the table below.
Please note that the expenses shown in the table are meant to highlight your ongoing costs only and do not reflect any transaction costs. Therefore, the second line of the table is useful in comparing ongoing costs only, and will not help you determine the relative total costs of owning different funds.
| | Annualized Expense Ratio-A | Beginning
Account Value
January 1, 2016 | Ending
Account Value
June 30, 2016 | Expenses Paid
During Period-B
January 1, 2016
to June 30, 2016 |
| Initial Class | .69% | | | |
| Actual | | $1,000.00 | $1,020.80 | $3.47 |
| Hypothetical-C | | $1,000.00 | $1,021.43 | $3.47 |
| Service Class | .79% | | | |
| Actual | | $1,000.00 | $1,019.30 | $3.97 |
| Hypothetical-C | | $1,000.00 | $1,020.93 | $3.97 |
| Service Class 2 | .94% | | | |
| Actual | | $1,000.00 | $1,018.80 | $4.72 |
| Hypothetical-C | | $1,000.00 | $1,020.19 | $4.72 |
| Investor Class | .77% | | | |
| Actual | | $1,000.00 | $1,019.30 | $3.87 |
| Hypothetical-C | | $1,000.00 | $1,021.03 | $3.87 |
A Annualized expense ratio reflects expenses net of applicable fee waivers.
B Expenses are equal to each Class' annualized expense ratio, multiplied by the average account value over the period, multiplied by 182/366 (to reflect the one-half year period).
C 5% return per year before expenses
VIPVAL-SANN-0816
1.761034.115
Item 2.
Code of Ethics
Not applicable.
Item 3.
Audit Committee Financial Expert
Not applicable.
Item 4.
Principal Accountant Fees and Services
Not applicable.
Item 5.
Audit Committee of Listed Registrants
Not applicable.
Item 6.
Investments
(a)
Not applicable.
(b)
Not applicable
Item 7.
Disclosure of Proxy Voting Policies and Procedures for Closed-End Management Investment Companies
Not applicable.
Item 8.
Portfolio Managers of Closed-End Management Investment Companies
Not applicable.
Item 9.
Purchase of Equity Securities by Closed-End Management Investment Company and Affiliated Purchasers
Not applicable.
Item 10.
Submission of Matters to a Vote of Security Holders
There were no material changes to the procedures by which shareholders may recommend nominees to the Variable Insurance Products Fund’s Board of Trustees.
Item 11.
Controls and Procedures
(a)(i) The President and Treasurer and the Chief Financial Officer have concluded that the Variable Insurance Products Fund’s (the “Trust”) disclosure controls and procedures (as defined in Rule 30a-3(c) under the Investment Company Act) provide reasonable assurances that material information relating to the Trust is made known to them by the appropriate persons, based on their evaluation of these controls and procedures as of a date within 90 days of the filing date of this report.
(a)(ii) There was no change in the Trust’s internal control over financial reporting (as defined in Rule 30a-3(d) under the Investment Company Act) that occurred during the second fiscal quarter of the period covered by this report that has materially affected, or is reasonably likely to materially affect, the Trust’s internal control over financial reporting.
Item 12.
Exhibits
| | |
(a) | (1) | Not applicable. |
(a) | (2) | Certification pursuant to Rule 30a-2(a) under the Investment Company Act of 1940 (17 CFR 270.30a-2(a)) is filed and attached hereto as Exhibit 99.CERT. |
(a) | (3) | Not applicable. |
(b) | | Certification pursuant to Rule 30a-2(b) under the Investment Company Act of 1940 (17 CFR 270.30a-2(b)) is furnished and attached hereto as Exhibit 99.906CERT. |
SIGNATURES
Pursuant to the requirements of the Securities Exchange Act of 1934 and the Investment Company Act of 1940, the registrant has duly caused this report to be signed on its behalf by the undersigned, thereunto duly authorized.
Variable Insurance Products Fund
| |
By: | /s/Stacie M. Smith |
| Stacie M. Smith |
| President and Treasurer |
| |
Date: | August 24, 2016 |
Pursuant to the requirements of the Securities Exchange Act of 1934 and the Investment Company Act of 1940, this report has been signed below by the following persons on behalf of the registrant and in the capacities and on the dates indicated.
| |
By: | /s/Stacie M. Smith |
| Stacie M. Smith |
| President and Treasurer |
| |
Date: | August 24, 2016 |
| |
By: | /s/Howard J. Galligan III |
| Howard J. Galligan III |
| Chief Financial Officer |
| |
Date: | August 24, 2016 |