Table of Contents
UNITED STATES
SECURITIES AND EXCHANGE COMMISSION
Washington, D.C. 20549
FORMN-CSR
CERTIFIED SHAREHOLDER REPORT OF REGISTERED
MANAGEMENT INVESTMENT COMPANIES
Investment Company Act File number:811-03334
Calvert Social Investment Fund
(Exact Name of Registrant as Specified in Charter)
1825 Connecticut Avenue NW, Suite 400, Washington, DC 20009
(Address of Principal Executive Offices)
Maureen A. Gemma
Two International Place, Boston, Massachusetts 02110
(Name and Address of Agent for Service)
(202)238-2200
(Registrant’s Telephone Number)
September 30
Date of Fiscal Year End
March 31, 2020
Date of Reporting Period
Table of Contents
| Item 1. | Report to Stockholders. |
Table of Contents


Table of Contents
Table of Contents
Table of Contents
| % Average Annual Total Returns1,2 | Class Inception Date | Performance Inception Date | Six Months | One Year | Five Years | Ten Years | ||
| Class A at NAV | 10/21/1982 | 10/21/1982 | (8.38)% | (1.85)% | 3.87% | 6.78% | ||
| Class A with 4.75% Maximum Sales Charge | — | — | (12.73) | (6.52) | 2.86 | 6.26 | ||
| Class C at NAV | 03/01/1994 | 10/21/1982 | (8.73) | (2.61) | 3.05 | 5.93 | ||
| Class C with 1% Maximum Sales Charge | — | — | (9.62) | (3.56) | 3.05 | 5.93 | ||
| Class I at NAV | 12/27/2004 | 10/21/1982 | (8.26) | (1.64) | 4.21 | 7.22 | ||
| Class R6 at NAV | 02/01/2019 | 10/21/1982 | (8.22) | (1.58) | 4.22 | 7.23 | ||
| ·· | ||||||||
| Russell 1000® Index | — | — | (13.01)% | (8.03)% | 6.21% | 10.38% | ||
| Bloomberg Barclays U.S. Aggregate Bond Index | — | — | 3.33 | 8.93 | 3.35 | 3.88 | ||
| Balanced Blended Benchmark | — | — | (6.45) | (1.03) | 5.34 | 8.01 | ||
| % Total Annual Operating Expense Ratios3 | Class A | Class C | Class I | Class R6 |
| Gross | 0.96% | 1.71% | 0.71% | 0.66% |
| Net | 0.93 | 1.68 | 0.68 | 0.64 |
Table of Contents

Table of Contents
| % Average Annual Total Returns1,2 | Class Inception Date | Performance Inception Date | Six Months | One Year | Five Years | Ten Years | ||
| Class A at NAV | 08/24/1987 | 08/24/1987 | (1.58)% | 3.23% | 2.36% | 3.41% | ||
| Class A with 3.75% Maximum Sales Charge | — | — | (5.27) | (0.66) | 1.58 | 3.02 | ||
| Class C at NAV | 06/01/1998 | 08/24/1987 | (1.93) | 2.40 | 1.50 | 2.57 | ||
| Class C with 1% Maximum Sales Charge | — | — | (2.90) | 1.40 | 1.50 | 2.57 | ||
| Class I at NAV | 03/31/2000 | 08/24/1987 | (1.48) | 3.43 | 2.69 | 3.89 | ||
| Class R6 at NAV | 10/03/2017 | 08/24/1987 | (1.38) | 3.50 | 2.72 | 3.90 | ||
| ·· | ||||||||
| Bloomberg Barclays U.S. Aggregate Bond Index | — | — | 3.33% | 8.93% | 3.35% | 3.88% | ||
| % Total Annual Operating Expense Ratios3 | Class A | Class C | Class I | Class R6 |
| Gross | 0.77% | 1.57% | 0.57% | 0.50% |
| Net | 0.73 | 1.53 | 0.53 | 0.46 |
Table of Contents
Table of Contents
| % Average Annual Total Returns1,2 | Class Inception Date | Performance Inception Date | Six Months | One Year | Five Years | Ten Years | ||
| Class A at NAV | 08/24/1987 | 08/24/1987 | (9.01)% | 0.67% | 9.99% | 11.60% | ||
| Class A with 4.75% Maximum Sales Charge | — | — | (13.34) | (4.10) | 8.93 | 11.06 | ||
| Class C at NAV | 03/01/1994 | 08/24/1987 | (9.36) | (0.10) | 9.16 | 10.77 | ||
| Class C with 1% Maximum Sales Charge | — | — | (10.22) | (1.05) | 9.16 | 10.77 | ||
| Class I at NAV | 11/01/1999 | 08/24/1987 | (8.90) | 0.91 | 10.37 | 12.09 | ||
| Class R6 at NAV | 10/03/2017 | 08/24/1987 | (8.86) | 0.99 | 10.39 | 12.10 | ||
| ·· | ||||||||
| Russell 1000® Growth Index | — | — | (4.98)% | 0.91% | 10.35% | 12.96% | ||
| % Total Annual Operating Expense Ratios3 | Class A | Class C | Class I | Class R6 |
| Gross | 1.00% | 1.75% | 0.75% | 0.68% |
| Net | 0.99 | 1.74 | 0.74 | 0.67 |
Table of Contents

| Top 10 Holdings (% of net assets)* | |
| Danaher Corp. | 4.8% |
| Thermo Fisher Scientific, Inc. | 4.8 |
| Microsoft Corp. | 4.8 |
| Alphabet, Inc., Class C | 4.6 |
| Visa, Inc., Class A | 4.6 |
| Dollar General Corp. | 3.9 |
| American Tower Corp. | 3.6 |
| Ecolab, Inc. | 3.6 |
| Linde PLC | 3.5 |
| Zoetis, Inc. | 3.5 |
| Total | 41.7% |
| * | Excludes cash and cash equivalents. |
Table of Contents
| 1 | Russell 1000® Index is an unmanaged index of 1,000 U.S. large-cap stocks. Russell 1000® Growth Index is an unmanaged index of U.S. large-cap growth stocks. Bloomberg Barclays U.S. Aggregate Bond Index is an unmanaged index of domestic investment-grade bonds, including corporate, government and mortgage-backed securities. The Balanced Blended Benchmark is an internally constructed benchmark which is comprised of a blend of 60% Russell 1000® Index and 40% Bloomberg Barclays U.S. Aggregate Bond Index, and is rebalanced monthly. Unless otherwise stated, index returns do not reflect the effect of any applicable sales charges, commissions, expenses, taxes or leverage, as applicable. It is not possible to invest directly in an index. |
| 2 | Total Returns at NAV do not include applicable sales charges. If sales charges were deducted, the returns would be lower. Total Returns shown with maximum sales charge reflect the stated maximum sales charge. Unless otherwise stated, performance does not reflect the deduction of taxes on Fund distributions or redemptions of Fund shares.Performance prior to the inception date of a class may be linked to the performance of an older class of the Fund. This linked performance is adjusted for any applicable sales charge, but is not adjusted for class expense differences. If adjusted for such differences, the performance would be different. The performance of Class R6 is linked to Class I. Performance presented in the Financial Highlights included in the financial statements is not linked.Calvert Research and Management became the investment adviser to each Fund on December 31, 2016. Performance reflected prior to such date is that of each Fund’s former investment adviser. |
| 3 | Source: Fund prospectus. Net expense ratios reflect a contractual expense reimbursement that continues through 1/31/21. Without the reimbursement, performance would have been lower. The expense ratios for the current reporting period can be found in the Financial Highlights section of this report. |
| Fund profiles subject to change due to active management. |
Table of Contents
| Beginning Account Value (10/1/19) | Ending Account Value (3/31/20) | Expenses Paid During Period* (10/1/19 – 3/31/20) | Annualized Expense Ratio | |
| Actual | ||||
| Class A | $1,000.00 | $916.20 | $4.46** | 0.93% |
| Class C | $1,000.00 | $912.70 | $8.03** | 1.68% |
| Class I | $1,000.00 | $917.40 | $3.26** | 0.68% |
| Class R6 | $1,000.00 | $917.80 | $3.07** | 0.64% |
| Hypothetical | ||||
| (5% return per year before expenses) | ||||
| Class A | $1,000.00 | $1,020.35 | $4.70** | 0.93% |
| Class C | $1,000.00 | $1,016.60 | $8.47** | 1.68% |
| Class I | $1,000.00 | $1,021.60 | $3.44** | 0.68% |
| Class R6 | $1,000.00 | $1,021.80 | $3.23** | 0.64% |
| * | Expenses are equal to the Fund's annualized expense ratio for the indicated Class, multiplied by the average account value over the period, multiplied by 183/366 (to reflect the one-half year period). The Example assumes that the $1,000 was invested at the net asset value per share determined at the close of business on September 30, 2019. |
| ** | Absent a waiver and/or reimbursement of expenses by an affiliate, expenses would be higher. |
Table of Contents
| Beginning Account Value (10/1/19) | Ending Account Value (3/31/20) | Expenses Paid During Period* (10/1/19 – 3/31/20) | Annualized Expense Ratio | |
| Actual | ||||
| Class A | $1,000.00 | $984.20 | $3.62** | 0.73% |
| Class C | $1,000.00 | $980.70 | $7.58** | 1.53% |
| Class I | $1,000.00 | $985.20 | $2.63** | 0.53% |
| Class R6 | $1,000.00 | $986.20 | $2.28** | 0.46% |
| Hypothetical | ||||
| (5% return per year before expenses) | ||||
| Class A | $1,000.00 | $1,021.35 | $3.69** | 0.73% |
| Class C | $1,000.00 | $1,017.35 | $7.72** | 1.53% |
| Class I | $1,000.00 | $1,022.35 | $2.68** | 0.53% |
| Class R6 | $1,000.00 | $1,022.70 | $2.33** | 0.46% |
| * | Expenses are equal to the Fund's annualized expense ratio for the indicated Class, multiplied by the average account value over the period, multiplied by 183/366 (to reflect the one-half year period). The Example assumes that the $1,000 was invested at the net asset value per share determined at the close of business on September 30, 2019. |
| ** | Absent a waiver and/or reimbursement of expenses by an affiliate, expenses would be higher. |
| Beginning Account Value (10/1/19) | Ending Account Value (3/31/20) | Expenses Paid During Period* (10/1/19 – 3/31/20) | Annualized Expense Ratio | |
| Actual | ||||
| Class A | $1,000.00 | $909.90 | $4.58 | 0.96% |
| Class C | $1,000.00 | $906.40 | $8.15 | 1.71% |
| Class I | $1,000.00 | $911.00 | $3.39 | 0.71% |
| Class R6 | $1,000.00 | $911.40 | $3.06 | 0.64% |
| Hypothetical | ||||
| (5% return per year before expenses) | ||||
| Class A | $1,000.00 | $1,020.20 | $4.85 | 0.96% |
| Class C | $1,000.00 | $1,016.45 | $8.62 | 1.71% |
| Class I | $1,000.00 | $1,021.45 | $3.59 | 0.71% |
| Class R6 | $1,000.00 | $1,021.80 | $3.23 | 0.64% |
| * | Expenses are equal to the Fund's annualized expense ratio for the indicated Class, multiplied by the average account value over the period, multiplied by 183/366 (to reflect the one-half year period). The Example assumes that the $1,000 was invested at the net asset value per share determined at the close of business on September 30, 2019. |
Table of Contents
| Asset-Backed Securities — 7.3% |
| Security | Principal Amount (000's omitted) | Value |
| Adams Outdoor Advertising, L.P., Series 2018-1, Class A, 4.81%, 11/15/48(1) | $ 454 | $ 457,853 |
| Avant Loans Funding Trust: | ||
| Series 2017-B, Class C, 4.99%, 11/15/23(1) | 855 | 853,578 |
| Series 2018-A, Class B, 3.95%, 12/15/22(1) | 575 | 478,341 |
| Series 2018-A, Class C, 4.79%, 5/15/24(1) | 150 | 135,210 |
| Series 2019-A, Class A, 3.48%, 7/15/22(1) | 232 | 226,171 |
| Series 2019-B, Class A, 2.72%, 10/15/26(1) | 767 | 747,066 |
| Avis Budget Rental Car Funding AESOP, LLC, Series 2015-1A, Class A, 2.50%, 7/20/21(1) | 468 | 467,333 |
| Coinstar Funding, LLC, Series 2017-1A, Class A2, 5.216%, 4/25/47(1) | 2,154 | 2,042,581 |
| Conn's Receivables Funding, LLC: | ||
| Series 2018-A, Class A, 3.25%, 1/15/23(1) | 68 | 66,260 |
| Series 2018-A, Class B, 4.65%, 1/15/23(1) | 30 | 28,951 |
| Series 2019-A, Class A, 3.40%, 10/16/23(1) | 410 | 398,818 |
| Series 2019-A, Class B, 4.36%, 10/16/23(1) | 520 | 493,286 |
| Series 2019-B, Class A, 2.66%, 6/17/24(1) | 1,355 | 1,285,839 |
| Series 2019-B, Class B, 3.62%, 6/17/24(1) | 295 | 244,628 |
| Consumer Loan Underlying Bond Credit Trust: | ||
| Series 2017-P2, Class B, 3.56%, 1/15/24(1) | 293 | 285,097 |
| Series 2019-P1, Class A, 2.94%, 7/15/26(1) | 245 | 236,512 |
| Series 2019-P2, Class A, 2.47%, 10/15/26(1) | 164 | 155,088 |
| Series 2020-P1, Class A, 2.26%, 3/15/28(1) | 898 | 862,968 |
| Credit Acceptance Auto Loan Trust: | ||
| Series 2017-1A, Class B, 3.04%, 12/15/25(1) | 395 | 394,588 |
| Series 2017-2A, Class A, 2.55%, 2/17/26(1) | 947 | 943,811 |
| DB Master Finance, LLC, Series 2017-1A, Class A2II, 4.03%, 11/20/47(1) | 166 | 156,178 |
| DRB Prime Student Loan Trust, Series 2016-B, Class A2, 2.89%, 6/25/40(1) | 215 | 217,391 |
| Driven Brands Funding, LLC: | ||
| Series 2015-1A, Class A2, 5.216%, 7/20/45(1) | 890 | 899,043 |
| Series 2016-1A, Class A2, 6.125%, 7/20/46(1) | 290 | 292,123 |
| Series 2018-1A, Class A2, 4.739%, 4/20/48(1) | 59 | 57,740 |
| Series 2019-2A, Class A2, 3.981%, 10/20/49(1) | 160 | 149,297 |
| Element Rail Leasing I, LLC: | ||
| Series 2014-1A, Class A1, 2.299%, 4/19/44(1) | 37 | 37,153 |
| Series 2014-1A, Class B1, 4.406%, 4/19/44(1) | 700 | 695,959 |
| Enterprise Fleet Financing, LLC, Series 2017-3, Class A2, 2.13%, 5/22/23(1) | 1,192 | 1,187,549 |
| ExteNet, LLC: | ||
| Series 2019-1A, Class A2, 3.204%, 7/26/49(1) | 805 | 746,703 |
| Series 2019-1A, Class B, 4.14%, 7/26/49(1) | 80 | 69,897 |
| FOCUS Brands Funding, LLC: | ||
| Series 2017-1A, Class A2I, 3.857%, 4/30/47(1) | 1,235 | 1,178,668 |
| Security | Principal Amount (000's omitted) | Value |
| FOCUS Brands Funding, LLC: (continued) | ||
| Series 2017-1A, Class A2II, 5.093%, 4/30/47(1) | $ 350 | $ 291,699 |
| Hardee's Funding, LLC, Series 2018-1A, Class A2I, 4.25%, 6/20/48(1) | 547 | 525,377 |
| InSite Issuer, LLC: | ||
| Series 2016-1A, Class A, 2.883%, 11/15/46(1) | 345 | 298,735 |
| Series 2016-1A, Class C, 6.414%, 11/15/46(1) | 50 | 42,619 |
| Jack in the Box Funding, LLC, Series 2019-1A, Class A2I, 3.982%, 8/25/49(1) | 658 | 608,947 |
| Lunar Aircraft, Ltd., Series 2020-1A, Class B, 4.335%, 2/15/45(1) | 250 | 162,352 |
| Marlette Funding Trust, Series 2018-3A, Class C, 4.63%, 9/15/28(1) | 150 | 125,928 |
| Mosaic Solar Loan Trust: | ||
| Series 2019-1A, Class A, 4.37%, 12/21/43(1) | 765 | 757,980 |
| Series 2019-2A, Class B, 3.28%, 9/20/40(1) | 1,910 | 1,645,419 |
| Series 2019-2A, Class C, 4.35%, 9/20/40(1) | 500 | 354,920 |
| OneMain Financial Issuance Trust: | ||
| Series 2016-1A, Class B, 4.57%, 2/20/29(1) | 460 | 453,761 |
| Series 2017-1A, Class A1, 2.37%, 9/14/32(1) | 717 | 705,815 |
| Oportun Funding IX, LLC, Series 2018-B, Class A, 3.91%, 7/8/24(1) | 2,486 | 2,342,462 |
| Oportun Funding VIII, LLC, Series 2018-A, Class A, 3.61%, 3/8/24(1) | 1,528 | 1,447,431 |
| OSCAR US Funding X, LLC, Series 2019-1A, Class A2, 3.10%, 4/11/22(1) | 257 | 259,073 |
| Planet Fitness Master Issuer, LLC: | ||
| Series 2018-1A, Class A2I, 4.262%, 9/5/48(1) | 1,074 | 1,024,939 |
| Series 2018-1A, Class A2II, 4.666%, 9/5/48(1) | 143 | 128,594 |
| Series 2019-1A, Class A2, 3.858%, 12/5/49(1) | 628 | 498,781 |
| Progress Residential Trust, Series 2015-SFR3, Class E, 5.66%, 11/12/32(1) | 195 | 193,219 |
| Prosper Marketplace Issuance Trust: | ||
| Series 2017-1A, Class C, 5.80%, 6/15/23(1) | 123 | 120,218 |
| Series 2018-2A, Class A, 3.35%, 10/15/24(1) | 149 | 147,876 |
| Series 2018-2A, Class B, 3.96%, 10/15/24(1) | 920 | 893,942 |
| RenewFund Receivables Trust, Series 2015-1, Class A, 3.51%, 4/15/25(1) | 87 | 85,935 |
| SBA Tower Trust, Series 2014-2A, Class C, 3.869%, 10/15/49(1) | 1,000 | 1,034,461 |
| SERVPRO Master Issuer, LLC, Series 2019-1A, Class A2, 3.882%, 10/25/49(1) | 2,598 | 2,449,962 |
| Small Business Lending Trust: | ||
| Series 2019-A, Class A, 2.85%, 7/15/26(1) | 603 | 591,737 |
| Series 2020-A, Class A, 2.62%, 12/15/26(1) | 536 | 523,032 |
| SolarCity LMC Series I, LLC, Series 2013-1, Class A, 4.80%, 11/20/38(1) | 534 | 494,923 |
| SolarCity LMC Series II, LLC, Series 2014-1, Class A, 4.59%, 4/20/44(1) | 460 | 439,463 |
Table of Contents
| Security | Principal Amount (000's omitted) | Value |
| SolarCity LMC Series III, LLC: | ||
| Series 2014-2, Class A, 4.02%, 7/20/44(1) | $ 1,501 | $ 1,410,841 |
| Series 2014-2, Class B, 5.44%, 7/20/44(1) | 1,707 | 1,578,212 |
| Sonic Capital, LLC, Series 2020-1A, Class A2I, 3.845%, 1/20/50(1) | 1,584 | 1,541,148 |
| SpringCastle Funding Asset-Backed Notes, Series 2019-AA, Class A, 3.20%, 5/27/36(1) | 1,416 | 1,334,553 |
| Springleaf Funding Trust: | ||
| Series 2016-AA, Class A, 2.90%, 11/15/29(1) | 257 | 254,640 |
| Series 2016-AA, Class B, 3.80%, 11/15/29(1) | 910 | 881,995 |
| Spruce ABS Trust, Series 2016-E1, Class A, 4.32%, 6/15/28(1) | 98 | 96,958 |
| Stack Infrastructure Issuer, LLC: | ||
| Series 2019-1A, Class A2, 4.54%, 2/25/44(1) | 5,045 | 5,068,023 |
| Series 2019-2A, Class A2, 3.08%, 10/25/44(1) | 405 | 385,107 |
| Sunnova Sol Issuer, LLC, Series 2020-1A, Class A, 3.35%, 2/1/55(1) | 255 | 189,189 |
| Sunrun Atlas Issuer, LLC, Series 2019-2, Class A, 3.61%, 2/1/55(1) | 497 | 437,293 |
| Sunrun Callisto Issuer, LLC, Series 2015-1A, Class B, 5.38%, 7/20/45(1) | 495 | 450,012 |
| TES, LLC, Series 2017-1A, Class A, 4.33%, 10/20/47(1) | 765 | 598,026 |
| Tesla Auto Lease Trust: | ||
| Series 2018-B, Class A, 3.71%, 8/20/21(1) | 1,296 | 1,303,507 |
| Series 2019-A, Class A1, 2.005%, 12/18/20(1) | 424 | 423,663 |
| Series 2019-A, Class A2, 2.13%, 4/20/22(1) | 387 | 388,562 |
| Series 2019-A, Class A3, 2.16%, 10/20/22(1) | 2,016 | 2,029,824 |
| Series 2019-A, Class A4, 2.20%, 11/21/22(1) | 395 | 388,296 |
| Series 2019-A, Class B, 2.41%, 12/20/22(1) | 145 | 140,553 |
| Thunderbolt Aircraft Lease, Ltd., Series 2017-A, Class C, 4.50%, 5/17/32(1) | 134 | 86,204 |
| United States Small Business Administration, Series 2017-20E, Class 1, 2.88%, 5/1/37 | 1,430 | 1,488,558 |
| Vantage Data Centers Issuer, LLC: | ||
| Series 2018-1A, Class A2, 4.072%, 2/16/43(1) | 687 | 685,649 |
| Series 2019-1A, Class A2, 3.188%, 7/15/44(1) | 1,526 | 1,476,746 |
| VB-S1 Issuer, LLC, Series 2016-1A, Class C, 3.065%, 6/15/46(1) | 770 | 764,323 |
| Willis Engine Structured Trust V: | ||
| Series 2020-A, Class B, 4.212%, 3/15/45(1) | 410 | 264,573 |
| Series 2020-A, Class C, 6.657%, 3/15/45(1) | 250 | 198,450 |
| Total Asset-Backed Securities (identified cost $62,156,771) | $59,006,185 |
| Collateralized Mortgage-Backed Obligations — 6.1% |
| Security | Principal Amount (000's omitted) | Value |
| Federal Home Loan Mortgage Corp. Multifamily Structured Pass Through Certificates: | ||
| Series KG02, Class A2, 2.412%, 8/25/29 | $ 3,315 | $ 3,737,491 |
| Series KW06, Class A2, 3.80%, 6/25/28(2) | 1,135 | 1,369,441 |
| Series W5FX, Class AFX, 3.092%, 4/25/28(2) | 412 | 467,121 |
| Federal Home Loan Mortgage Corp. Structured Agency Credit Risk Debt Notes: | ||
| Series 2015-HQ2, Class M3, 4.197%, (1 mo. USD LIBOR + 3.25%), 5/25/25(3) | 720 | 645,125 |
| Series 2015-HQA2, Class M2, 3.747%, (1 mo. USD LIBOR + 2.80%), 5/25/28(3) | 65 | 64,924 |
| Series 2017-DNA3, Class M2, 3.447%, (1 mo. USD LIBOR + 2.50%), 3/25/30(3) | 1,190 | 1,053,650 |
| Series 2017-HQA2, Class M2, 3.597%, (1 mo. USD LIBOR + 2.65%), 12/25/29(3) | 435 | 372,365 |
| Series 2018-DNA1, Class M1, 1.397%, (1 mo. USD LIBOR + 0.45%), 7/25/30(3) | 121 | 121,157 |
| Series 2018-DNA1, Class M2, 2.747%, (1 mo. USD LIBOR + 1.80%), 7/25/30(3) | 670 | 567,220 |
| Series 2018-DNA1, Class M2AT, 1.997%, (1 mo. USD LIBOR + 1.05%), 7/25/30(3) | 1,055 | 969,192 |
| Series 2018-HQA1, Class M2, 3.247%, (1 mo. USD LIBOR + 2.30%), 9/25/30(3) | 318 | 272,682 |
| Series 2019-DNA2, Class M2, 3.397%, (1 mo. USD LIBOR + 2.45%), 3/25/49(1)(3) | 209 | 178,130 |
| Series 2019-DNA3, Class M2, 2.997%, (1 mo. USD LIBOR + 2.05%), 7/25/49(1)(3) | 2,611 | 2,215,505 |
| Series 2019-DNA4, Class M1, 1.647%, (1 mo. USD LIBOR + 0.70%), 10/25/49(1)(3) | 250 | 246,668 |
| Series 2019-DNA4, Class M2, 2.897%, (1 mo. USD LIBOR + 1.95%), 10/25/49(1)(3) | 880 | 711,632 |
| Series 2019-HQA2, Class M2, 2.997%, (1 mo. USD LIBOR + 2.05%), 4/25/49(1)(3) | 755 | 634,306 |
| Series 2019-HQA3, Class M1, 1.697%, (1 mo. USD LIBOR + 0.75%), 9/25/49(1)(3) | 207 | 206,315 |
| Series 2019-HQA3, Class M2, 2.797%, (1 mo. USD LIBOR + 1.85%), 9/25/49(1)(3) | 180 | 147,540 |
| Series 2020-DNA1, Class M1, 1.647%, (1 mo. USD LIBOR + 0.70%), 1/25/50(1)(3) | 662 | 643,098 |
| Series 2020-DNA2, Class M1, 1.697%, (1 mo. USD LIBOR + 0.75%), 2/25/50(1)(3) | 1,235 | 1,146,745 |
| Series 2020-HQA1, Class M1, 1.697%, (1 mo. USD LIBOR + 0.75%), 1/25/50(1)(3) | 235 | 223,868 |
| Federal National Mortgage Association: | ||
| Series 2017-M2, Class A1, 2.894%, 2/25/27(2) | 240 | 246,849 |
| Series 2017-M13, Class A2, 3.033%, 9/25/27(2) | 1,350 | 1,536,270 |
| Series 2018-M4, Class A2, 3.147%, 3/25/28(2) | 1,572 | 1,744,441 |
| Series 2018-M8, Class A2, 3.436%, 6/25/28(2) | 989 | 1,155,448 |
| Series 2018-M13, Class A2, 3.82%, 9/25/30(2) | 3,600 | 4,234,481 |
| Series 2019-M1, Class A2, 3.673%, 9/25/28(2) | 1,700 | 1,974,394 |
| Series 2019-M9, Class A2, 2.937%, 4/25/29 | 660 | 727,020 |
Table of Contents
| Security | Principal Amount (000's omitted) | Value |
| Federal National Mortgage Association: (continued) | ||
| Series 2019-M22, Class A2, 2.522%, 8/25/29 | $ 7,125 | $ 7,757,837 |
| Series 2020-M1, Class A2, 2.444%, 9/25/29 | 2,322 | 2,484,695 |
| Federal National Mortgage Association Connecticut Avenue Securities: | ||
| Series 2013-C01, Class M2, 6.197%, (1 mo. USD LIBOR + 5.25%), 10/25/23(3) | 891 | 875,340 |
| Series 2014-C02, Class 1M2, 3.547%, (1 mo. USD LIBOR + 2.60%), 5/25/24(3) | 1,167 | 1,077,523 |
| Series 2014-C02, Class 2M2, 3.547%, (1 mo. USD LIBOR + 2.60%), 5/25/24(3) | 356 | 315,452 |
| Series 2014-C03, Class 1M2, 3.947%, (1 mo. USD LIBOR + 3.00%), 7/25/24(3) | 833 | 761,534 |
| Series 2014-C03, Class 2M2, 3.847%, (1 mo. USD LIBOR + 2.90%), 7/25/24(3) | 585 | 544,816 |
| Series 2014-C04, Class 1M2, 5.847%, (1 mo. USD LIBOR + 4.90%), 11/25/24(3) | 1,145 | 1,093,316 |
| Series 2016-C06, Class 1M2, 5.197%, (1 mo. USD LIBOR + 4.25%), 4/25/29(3) | 400 | 387,997 |
| Series 2017-C04, Class 2M1, 1.797%, (1 mo. USD LIBOR + 0.85%), 11/25/29(3) | 148 | 148,242 |
| Series 2017-C05, Class 1M2, 3.147%, (1 mo. USD LIBOR + 2.20%), 1/25/30(3) | 397 | 353,221 |
| Series 2017-C06, Class 1M2, 3.597%, (1 mo. USD LIBOR + 2.65%), 2/25/30(3) | 617 | 553,873 |
| Series 2018-C03, Class 1M1, 1.627%, (1 mo. USD LIBOR + 0.68%), 10/25/30(3) | 49 | 48,682 |
| Series 2018-C06, Class 1M2, 2.947%, (1 mo. USD LIBOR + 2.00%), 3/25/31(3) | 72 | 63,791 |
| Series 2018-R07, Class 1M2, 3.347%, (1 mo. USD LIBOR + 2.40%), 4/25/31(1)(3) | 957 | 848,442 |
| Series 2019-R01, Class 2M2, 3.397%, (1 mo. USD LIBOR + 2.45%), 7/25/31(1)(3) | 334 | 279,021 |
| Series 2019-R02, Class 1M2, 3.247%, (1 mo. USD LIBOR + 2.30%), 8/25/31(1)(3) | 270 | 234,320 |
| Series 2019-R03, Class 1M2, 3.097%, (1 mo. USD LIBOR + 2.15%), 9/25/31(1)(3) | 604 | 520,871 |
| Series 2019-R05, Class 1M2, 2.947%, (1 mo. USD LIBOR + 2.00%), 7/25/39(1)(3) | 559 | 483,116 |
| Series 2019-R06, Class 2M1, 1.697%, (1 mo. USD LIBOR + 0.75%), 9/25/39(1)(3) | 870 | 854,318 |
| Series 2020-R01, Class 1M1, 1.747%, (1 mo. USD LIBOR + 0.80%), 1/25/40(1)(3) | 788 | 762,771 |
| Federal National Mortgage Association Grantor Trust, Series 2017-T1, Class A, 2.898%, 6/25/27 | 549 | 589,711 |
| Toorak Mortgage Corp., Ltd.: | ||
| Series 2018-1, Class A1, 4.336% to 4/25/21, 8/25/21(1)(4) | 140 | 123,559 |
| Series 2020-1, Class A1, 2.734% to 1/25/23, 3/25/23(1)(4) | 480 | 479,482 |
| Total Collateralized Mortgage-Backed Obligations (identified cost $49,021,740) | $49,255,008 |
| Commercial Mortgage-Backed Securities — 1.8% |
| Security | Principal Amount (000's omitted) | Value |
| BAMLL Commercial Mortgage Securities Trust: | ||
| Series 2019-BPR, Class DNM, 3.843%, 11/5/32(1)(2) | $ 1,605 | $ 1,438,507 |
| Series 2019-BPR, Class ENM, 3.843%, 11/5/32(1)(2) | 680 | 557,170 |
| Series 2019-BPR, Class FNM, 3.843%, 11/5/32(1)(2) | 1,115 | 792,276 |
| BX Commercial Mortgage Trust: | ||
| Series 2019-XL, Class A, 1.625%, (1 mo. USD LIBOR + 0.92%), 10/15/36(1)(3) | 1,529 | 1,476,025 |
| Series 2019-XL, Class B, 1.785%, (1 mo. USD LIBOR + 1.08%), 10/15/36(1)(3) | 717 | 684,424 |
| Citigroup Commercial Mortgage Trust, Series 2017-MDRC, Class D, 2.955%, (1 mo. USD LIBOR + 2.25%), 7/15/30(1)(3) | 490 | 475,413 |
| Federal National Mortgage Association Multifamily Connecticut Avenue Securities Trust: | ||
| Series 2019-01, Class M10, 4.197%, (1 mo. USD LIBOR + 3.25%), 10/15/49(1)(3) | 25 | 17,785 |
| Series 2020-01, Class M10, 4.362%, (1 mo. USD LIBOR + 3.75%), 3/25/50(1)(3) | 750 | 594,628 |
| JPMorgan Chase Commercial Mortgage Securities Trust: | ||
| Series 2014-DSTY, Class A, 3.429%, 6/10/27(1) | �� 200 | 192,579 |
| Series 2014-DSTY, Class B, 3.771%, 6/10/27(1) | 550 | 486,231 |
| Series 2014-DSTY, Class C, 3.931%, 6/10/27(1)(2) | 225 | 180,199 |
| Morgan Stanley Capital I Trust: | ||
| Series 2017-CLS, Class A, 1.405%, (1 mo. USD LIBOR + 0.70%), 11/15/34(1)(3) | 1,045 | 1,001,361 |
| Series 2019-BPR, Class A, 2.105%, (1 mo. USD LIBOR + 1.40%), 5/15/36(1)(3) | 1,585 | 1,478,871 |
| Series 2019-BPR, Class B, 2.805%, (1 mo. USD LIBOR + 2.10%), 5/15/36(1)(3) | 475 | 419,909 |
| Series 2019-BPR, Class C, 3.755%, (1 mo. USD LIBOR + 3.05%), 5/15/36(1)(3) | 205 | 179,556 |
| Motel 6 Trust: | ||
| Series 2017-MTL6, Class B, 1.895%, (1 mo. USD LIBOR + 1.19%), 8/15/34(1)(3) | 136 | 121,451 |
| Series 2017-MTL6, Class C, 2.105%, (1 mo. USD LIBOR + 1.40%), 8/15/34(1)(3) | 1,376 | 1,197,449 |
| Series 2017-MTL6, Class D, 2.855%, (1 mo. USD LIBOR + 2.15%), 8/15/34(1)(3) | 333 | 296,529 |
| Series 2017-MTL6, Class E, 3.955%, (1 mo. USD LIBOR + 3.25%), 8/15/34(1)(3) | 99 | 80,356 |
| RETL Trust: | ||
| Series 2019-RVP, Class A, 1.855%, (1 mo. USD LIBOR + 1.15%), 3/15/36(1)(3) | 269 | 251,973 |
| Series 2019-RVP, Class B, 2.255%, (1 mo. USD LIBOR + 1.55%), 3/15/36(1)(3) | 1,920 | 1,713,411 |
| WFLD Mortgage Trust, Series 2014-MONT, Class C, 3.88%, 8/10/31(1)(2) | 850 | 776,481 |
| Total Commercial Mortgage-Backed Securities (identified cost $15,985,047) | $14,412,584 |
Table of Contents
| Common Stocks — 57.6% |
| Security | Shares | Value |
| Aerospace & Defense — 0.4% | ||
| Hexcel Corp. | 90,200 | $ 3,354,538 |
| $ 3,354,538 | ||
| Banks — 3.2% | ||
| Bank of America Corp. | 378,900 | $ 8,044,047 |
| JPMorgan Chase & Co. | 99,200 | 8,930,976 |
| KeyCorp | 243,800 | 2,528,206 |
| PNC Financial Services Group, Inc. (The) | 64,900 | 6,212,228 |
| $ 25,715,457 | ||
| Beverages — 2.8% | ||
| Coca-Cola Co. (The) | 216,100 | $9,562,425 |
| PepsiCo, Inc. | 108,496 | 13,030,369 |
| $22,592,794 | ||
| Capital Markets — 1.3% | ||
| Cboe Global Markets, Inc. | 56,700 | $5,060,475 |
| Tradeweb Markets, Inc., Class A | 138,966 | 5,842,131 |
| $10,902,606 | ||
| Commercial Services & Supplies — 0.8% | ||
| Waste Management, Inc. | 69,825 | $6,463,002 |
| $6,463,002 | ||
| Communications Equipment — 0.9% | ||
| Cisco Systems, Inc. | 180,700 | $7,103,317 |
| $7,103,317 | ||
| Consumer Finance — 0.6% | ||
| American Express Co. | 53,800 | $4,605,818 |
| $4,605,818 | ||
| Diversified Telecommunication Services — 1.3% | ||
| Verizon Communications, Inc. | 188,408 | $10,123,162 |
| $10,123,162 | ||
| Electrical Equipment — 1.7% | ||
| AMETEK, Inc. | 115,700 | $8,332,714 |
| Emerson Electric Co. | 119,600 | 5,698,940 |
| $14,031,654 | ||
| Entertainment — 1.0% | ||
| Electronic Arts, Inc.(5) | 81,100 | $8,123,787 |
| $8,123,787 | ||
| Security | Shares | Value |
| Equity Real Estate Investment Trusts (REITs) — 1.9% | ||
| American Tower Corp. | 41,700 | $ 9,080,175 |
| AvalonBay Communities, Inc. | 43,099 | 6,342,880 |
| $ 15,423,055 | ||
| Food Products — 1.5% | ||
| Mondelez International, Inc., Class A | 242,270 | $ 12,132,882 |
| $ 12,132,882 | ||
| Health Care Equipment & Supplies — 3.3% | ||
| Abbott Laboratories | 125,100 | $ 9,871,641 |
| Danaher Corp. | 81,400 | 11,266,574 |
| ICU Medical, Inc.(5) | 26,600 | 5,367,082 |
| $26,505,297 | ||
| Health Care Providers & Services — 1.2% | ||
| Anthem, Inc. | 44,300 | $10,057,872 |
| $10,057,872 | ||
| Independent Power and Renewable Electricity Producers — 0.6% | ||
| NextEra Energy Partners, L.P. | 112,700 | $4,846,100 |
| $4,846,100 | ||
| Insurance — 1.3% | ||
| First American Financial Corp. | 104,143 | $4,416,705 |
| Progressive Corp. (The) | 84,400 | 6,232,096 |
| $10,648,801 | ||
| Interactive Media & Services — 3.9% | ||
| Alphabet, Inc., Class C(5) | 22,412 | $26,060,898 |
| IAC/InterActiveCorp.(5) | 32,800 | 5,878,744 |
| $31,939,642 | ||
| Internet & Direct Marketing Retail — 3.3% | ||
| Amazon.com, Inc.(5) | 13,566 | $26,449,901 |
| $26,449,901 | ||
| IT Services — 5.1% | ||
| Cognizant Technology Solutions Corp., Class A | 143,614 | $6,673,742 |
| Fidelity National Information Services, Inc. | 77,700 | 9,451,428 |
| MasterCard, Inc., Class A | 19,700 | 4,758,732 |
| PayPal Holdings, Inc.(5) | 67,800 | 6,491,172 |
| Visa, Inc., Class A | 87,300 | 14,065,776 |
| $41,440,850 | ||
Table of Contents
| Security | Shares | Value |
| Life Sciences Tools & Services — 1.2% | ||
| Thermo Fisher Scientific, Inc. | 34,597 | $ 9,811,709 |
| $ 9,811,709 | ||
| Machinery — 1.3% | ||
| Ingersoll Rand, Inc.(5) | 199,500 | $ 4,947,600 |
| Stanley Black & Decker, Inc. | 56,100 | 5,610,000 |
| $ 10,557,600 | ||
| Metals & Mining — 0.9% | ||
| Steel Dynamics, Inc. | 305,400 | $ 6,883,716 |
| $6,883,716 | ||
| Multi-Utilities — 1.4% | ||
| CMS Energy Corp. | 105,173 | $6,178,914 |
| Sempra Energy | 48,215 | 5,447,813 |
| $11,626,727 | ||
| Pharmaceuticals — 3.4% | ||
| Bristol-Myers Squibb Co. | 145,100 | $8,087,874 |
| Catalent, Inc.(5) | 119,500 | 6,208,025 |
| Sanofi | 92,000 | 7,964,881 |
| Zoetis, Inc. | 41,600 | 4,895,904 |
| $27,156,684 | ||
| Road & Rail — 0.7% | ||
| Kansas City Southern | 43,700 | $5,557,766 |
| $5,557,766 | ||
| Semiconductors & Semiconductor Equipment — 1.6% | ||
| Taiwan Semiconductor Manufacturing Co., Ltd. ADR | 120,700 | $5,768,253 |
| Texas Instruments, Inc. | 71,096 | 7,104,623 |
| $12,872,876 | ||
| Software — 5.1% | ||
| Adobe, Inc.(5) | 19,724 | $6,276,966 |
| Intuit, Inc. | 16,167 | 3,718,410 |
| Microsoft Corp. | 200,251 | 31,581,585 |
| $41,576,961 | ||
| Specialty Retail — 2.8% | ||
| Home Depot, Inc. (The) | 54,100 | $10,101,011 |
| Lowe's Cos., Inc. | 77,133 | 6,637,295 |
| TJX Cos., Inc. (The) | 127,800 | 6,110,118 |
| $22,848,424 | ||
| Security | Shares | Value |
| Technology Hardware, Storage & Peripherals — 2.9% | ||
| Apple, Inc. | 92,352 | $ 23,484,190 |
| $ 23,484,190 | ||
| Venture Capital — 0.2% | ||
| CFBanc Corp.(5)(6)(7) | 27,000 | $ 256,766 |
| Consensus Orthopedics, Inc.(5)(6)(7) | 180,877 | 145 |
| Kickboard(5)(6)(7) | 169,932 | 2,229 |
| Learn Capital Venture Partners III, L.P.(5)(6)(7) | 995,790 | 1,190,432 |
| MACH Energy(5)(6)(7) | 20,536 | 1,425 |
| Neighborhood Bancorp, Class A(5)(6)(7) | 10,000 | 8,000 |
| $1,458,997 | ||
| Total Common Stocks (identified cost $440,409,956) | $466,296,185 | |
| Corporate Bonds — 16.0% |
| Security | Principal Amount (000's omitted) | Value |
| Basic Materials — 0.3% | ||
| Ecolab, Inc., 4.80%, 3/24/30 | USD 265 | $ 302,878 |
| LG Chem, Ltd.: | ||
| 3.25%, 10/15/24(1) | USD 1,250 | 1,296,775 |
| 3.625%, 4/15/29(1) | USD 575 | 568,386 |
| $ 2,168,039 | ||
| Communications — 1.1% | ||
| AT&T, Inc.: | ||
| 2.781%, (3 mo. USD LIBOR + 0.95%), 7/15/21(3) | USD 32 | $ 31,453 |
| 4.30%, 2/15/30 | USD 1,646 | 1,775,135 |
| 4.50%, 3/9/48 | USD 675 | 736,118 |
| 4.90%, 6/15/42 | USD 785 | 878,568 |
| Charter Communications Operating, LLC/Charter Communications Operating Capital, 4.80%, 3/1/50 | USD 1,955 | 2,046,759 |
| Comcast Corp., 4.70%, 10/15/48 | USD 350 | 454,443 |
| CommScope Technologies, LLC, 6.00%, 6/15/25(1) | USD 835 | 770,454 |
| CommScope, Inc., 8.25%, 3/1/27(1) | USD 100 | 96,945 |
| Crown Castle Towers, LLC, 3.663%, 5/15/45(1) | USD 450 | 451,412 |
| Discovery Communications, LLC, 5.20%, 9/20/47 | USD 1,416 | 1,453,593 |
| NBCUniversal Media, LLC, 4.45%, 1/15/43 | USD 405 | 516,197 |
| Sprint Corp., 7.25%, 9/15/21 | USD 160 | 165,786 |
| $9,376,863 | ||
Table of Contents
| Security | Principal Amount (000's omitted) | Value |
| Consumer, Cyclical — 1.9% | ||
| American Airlines Pass-Through Trust: | ||
| 4.40%, 3/22/25 | USD 792 | $ 671,654 |
| 5.25%, 7/15/25 | USD 1,054 | 1,062,054 |
| 5.60%, 7/15/20(1) | USD 766 | 767,927 |
| 5.625%, 1/15/21(1) | USD 155 | 154,316 |
| Azul Investments, LLP, 5.875%, 10/26/24(1)(8) | USD 445 | 248,646 |
| Ford Motor Credit Co., LLC: | ||
| 1.574%, (3 mo. USD LIBOR + 0.79%), 6/12/20(3) | USD 320 | 310,518 |
| 2.71%, (3 mo. USD LIBOR + 0.81%), 4/5/21(3) | USD 335 | 309,908 |
| 2.728%, (3 mo. USD LIBOR + 0.88%), 10/12/21(3) | USD 910 | 836,971 |
| 2.843%, (3 mo. USD LIBOR + 1.08%), 8/3/22(3) | USD 525 | 430,500 |
| 2.979%, 8/3/22 | USD 2,615 | 2,445,025 |
| 3.087%, 1/9/23 | USD 567 | 513,135 |
| 4.14%, 2/15/23 | USD 675 | 631,530 |
| Home Depot, Inc. (The), 2.70%, 4/15/30 | USD 483 | 492,876 |
| Latam Airlines Pass-Through Trust, 4.20%, 8/15/29 | USD 402 | 364,974 |
| Macy's Retail Holdings, Inc.: | ||
| 2.875%, 2/15/23(8) | USD 1,175 | 846,653 |
| 3.625%, 6/1/24 | USD 350 | 234,946 |
| MDC Holdings, Inc., 6.00%, 1/15/43 | USD 217 | 206,329 |
| Nordstrom, Inc.: | ||
| 4.375%, 4/1/30 | USD 1,127 | 907,208 |
| 5.00%, 1/15/44 | USD 964 | 677,853 |
| Tapestry, Inc., 4.125%, 7/15/27 | USD 1,361 | 1,162,959 |
| Target Corp., 2.25%, 4/15/25 | USD 677 | 687,797 |
| TJX Cos., Inc. (The): | ||
| 3.50%, 4/15/25 | USD 643 | 658,413 |
| 3.875%, 4/15/30 | USD 505 | 523,611 |
| $15,145,803 | ||
| Consumer, Non-cyclical — 1.5% | ||
| Ashtead Capital, Inc., 4.25%, 11/1/29(1) | USD 987 | $843,028 |
| Becton Dickinson and Co.: | ||
| 2.25%, (3 mo. USD LIBOR + 0.875%), 12/29/20(3) | USD 1,771 | 1,711,515 |
| 2.404%, 6/5/20 | USD 474 | 472,540 |
| 2.894%, 6/6/22 | USD 474 | 474,774 |
| Centene Corp.: | ||
| 3.375%, 2/15/30(1) | USD 1,112 | 1,038,330 |
| 4.25%, 12/15/27(1) | USD 473 | 476,524 |
| Security | Principal Amount (000's omitted) | Value |
| Consumer, Non-cyclical (continued) | ||
| Centene Corp.: (continued) | ||
| 4.625%, 12/15/29(1) | USD 74 | $ 74,781 |
| Conagra Brands, Inc.: | ||
| 2.378%, (3 mo. USD LIBOR + 0.50%), 10/9/20(3) | USD 155 | 152,965 |
| 2.552%, (3 mo. USD LIBOR + 0.75%), 10/22/20(3) | USD 28 | 27,706 |
| Conservation Fund (The), Green Bonds, 3.474%, 12/15/29 | USD 655 | 733,192 |
| CVS Health Corp.: | ||
| 1.719%, (3 mo. USD LIBOR + 0.72%), 3/9/21(3) | USD 88 | 86,203 |
| 2.625%, 8/15/24 | USD 255 | 256,280 |
| 3.00%, 8/15/26 | USD 1,400 | 1,397,774 |
| 3.75%, 4/1/30 | USD 89 | 92,275 |
| 4.30%, 3/25/28 | USD 1,131 | 1,203,502 |
| CVS Pass-Through Trust, 6.036%, 12/10/28 | USD 720 | 781,575 |
| Grupo Bimbo SAB de CV, 4.00%, 9/6/49(1) | USD 300 | 253,258 |
| Massachusetts Institute of Technology, 3.959%, 7/1/38 | USD 300 | 332,671 |
| Pfizer, Inc., 2.625%, 4/1/30 | USD 540 | 567,376 |
| Sysco Corp.: | ||
| 2.40%, 2/15/30 | USD 600 | 496,084 |
| 5.65%, 4/1/25 | USD 362 | 377,330 |
| $11,849,683 | ||
| Energy — 0.6% | ||
| National Oilwell Varco, Inc., 3.60%, 12/1/29 | USD 3,475 | $2,611,928 |
| Oceaneering International, Inc., 4.65%, 11/15/24 | USD 126 | 51,345 |
| TerraForm Power Operating, LLC: | ||
| 4.75%, 1/15/30(1) | USD 692 | 675,081 |
| 5.00%, 1/31/28(1) | USD 1,696 | 1,786,482 |
| $5,124,836 | ||
| Financial — 6.7% | ||
| Aflac, Inc., 3.60%, 4/1/30 | USD 1,004 | $1,018,437 |
| AG Issuer, LLC, 6.25%, 3/1/28(1) | USD 1,075 | 911,062 |
| Alliance Data Systems Corp., 4.75%, 12/15/24(1) | USD 850 | 652,375 |
| Ameriprise Financial, Inc., 3.00%, 4/2/25 | USD 625 | 622,356 |
| ANZ New Zealand International, Ltd., 2.20%, 7/17/20(1) | USD 542 | 541,803 |
| Australia & New Zealand Banking Group, Ltd., 2.95% to 7/22/25, 7/22/30(1)(9) | USD 1,308 | 1,242,079 |
| Banco BTG Pactual SA, 4.50%, 1/10/25(1) | USD 200 | 176,000 |
| Banco Santander SA, 2.773%, (3 mo. USD LIBOR + 1.09%), 2/23/23(3) | USD 305 | 289,060 |
Table of Contents
| Security | Principal Amount (000's omitted) | Value |
| Financial (continued) | ||
| Bank of America Corp.: | ||
| 2.186%, (3 mo. USD LIBOR + 0.38%), 1/23/22(3) | USD 953 | $ 915,046 |
| 2.456% to 10/22/24, 10/22/25(9) | USD 1,512 | 1,527,412 |
| 2.999%, (3 mo. USD LIBOR + 1.18%), 10/21/22(3) | USD 236 | 228,030 |
| 3.499% to 5/17/21, 5/17/22(9) | USD 1,489 | 1,507,161 |
| 3.55% to 3/5/23, 3/5/24(9) | USD 1,365 | 1,416,921 |
| 3.593% to 7/21/27, 7/21/28(9) | USD 1,400 | 1,435,626 |
| 3.824% to 1/20/27, 1/20/28(9) | USD 2,110 | 2,193,082 |
| 3.974% to 2/7/29, 2/7/30(9) | USD 695 | 751,860 |
| Bank of America NA, 3.335% to 1/25/22, 1/25/23(9) | USD 2,056 | 2,056,220 |
| Bank of Montreal, 2.05%, 11/1/22 | USD 1,898 | 1,901,043 |
| Bank of Nova Scotia (The), 2.375%, 1/18/23 | USD 1,362 | 1,372,119 |
| BBVA Bancomer SA, 5.125% to 1/18/28, 1/18/33(1)(9) | USD 200 | 167,115 |
| Capital One Financial Corp.: | ||
| 2.22%, (3 mo. USD LIBOR + 0.45%), 10/30/20(3) | USD 235 | 231,428 |
| 2.49%, (3 mo. USD LIBOR + 0.72%), 1/30/23(3) | USD 630 | 589,075 |
| 3.30%, 10/30/24 | USD 419 | 413,480 |
| 4.20%, 10/29/25 | USD 575 | 574,109 |
| Capital One NA, 2.65%, 8/8/22 | USD 610 | 604,870 |
| Citigroup, Inc.: | ||
| 2.069%, (3 mo. USD LIBOR + 1.07%), 12/8/21(3) | USD 300 | 295,141 |
| 2.75%, 4/25/22 | USD 730 | 734,354 |
| 2.976% to 11/5/29, 11/5/30(9) | USD 948 | 941,237 |
| 3.142% to 1/24/22, 1/24/23(9) | USD 776 | 786,372 |
| 3.887% to 1/10/27, 1/10/28(9) | USD 1,910 | 1,970,178 |
| Citizens Bank NA, 2.55%, 5/13/21 | USD 400 | 399,684 |
| Citizens Financial Group, Inc., 2.375%, 7/28/21 | USD 355 | 357,993 |
| Commonwealth Bank of Australia: | ||
| 2.50%, 9/18/22(1) | USD 550 | 546,000 |
| 3.61% to 9/12/29, 9/12/34(1)(9) | USD 487 | 442,384 |
| Digital Realty Trust, L.P.: | ||
| 3.95%, 7/1/22 | USD 750 | 768,373 |
| 4.75%, 10/1/25 | USD 525 | 548,722 |
| Discover Bank: | ||
| 2.70%, 2/6/30 | USD 399 | 348,181 |
| 4.682% to 8/9/23, 8/9/28(9) | USD 1,460 | 1,487,776 |
| Discover Financial Services, 3.95%, 11/6/24 | USD 300 | 305,847 |
| EPR Properties, 3.75%, 8/15/29 | USD 1,000 | 750,139 |
| Goldman Sachs Group, Inc. (The), 2.905% to 7/24/22, 7/24/23(9) | USD 975 | 980,956 |
| Security | Principal Amount (000's omitted) | Value |
| Financial (continued) | ||
| HAT Holdings I, LLC/HAT Holdings II, LLC, 5.25%, 7/15/24(1) | USD 260 | $ 251,226 |
| Iron Mountain, Inc., 4.375%, 6/1/21(1) | USD 33 | 32,893 |
| JPMorgan Chase & Co.: | ||
| 2.739% to 10/15/29, 10/15/30(9) | USD 485 | 488,050 |
| 3.797% to 7/23/23, 7/23/24(9) | USD 1,465 | 1,535,422 |
| Lloyds Banking Group PLC, 2.438% to 2/5/25, 2/5/26(9) | USD 860 | 813,868 |
| Marsh & McLennan Cos., Inc., 2.575%, (3 mo. USD LIBOR + 1.20%), 12/29/21(3) | USD 379 | 379,351 |
| Morgan Stanley: | ||
| 0.71%, (SOFR + 0.70%), 1/20/23(3) | USD 2,321 | 2,167,293 |
| 0.84%, (SOFR + 0.83%), 6/10/22(3) | USD 477 | 455,431 |
| 3.201%, (3 mo. USD LIBOR + 1.40%), 10/24/23(3) | USD 550 | 534,154 |
| 4.00%, 7/23/25 | USD 725 | 777,415 |
| National Australia Bank, Ltd., 3.625%, 6/20/23 | USD 575 | 586,337 |
| Nationwide Building Society, 3.96% to 7/18/29, 7/18/30(1)(8)(9) | USD 677 | 685,850 |
| Newmark Group, Inc., 6.125%, 11/15/23 | USD 97 | 98,834 |
| PNC Financial Services Group, Inc. (The), 2.20%, 11/1/24 | USD 5,700 | 5,916,038 |
| Radian Group, Inc., 4.875%, 3/15/27 | USD 250 | 248,386 |
| Raymond James Financial, Inc., 4.65%, 4/1/30 | USD 53 | 55,539 |
| SBA Tower Trust: | ||
| 2.877%, 7/15/46(1) | USD 600 | 598,682 |
| 3.722%, 4/9/48(1) | USD 1,100 | 1,118,203 |
| SITE Centers Corp., 3.625%, 2/1/25 | USD 517 | 524,588 |
| State Street Corp., 3.152% to 3/30/30, 3/30/31(1)(9) | USD 56 | 57,577 |
| Synovus Bank/Columbus GA, 2.289% to 2/10/22, 2/10/23(9) | USD 1,529 | 1,507,992 |
| Synovus Financial Corp.: | ||
| 3.125%, 11/1/22 | USD 311 | 313,406 |
| 5.90% to 2/7/24, 2/7/29(9) | USD 71 | 66,568 |
| $54,214,209 | ||
| Government - Multinational — 0.6% | ||
| Asian Development Bank, 3.125%, 9/26/28 | USD 1,160 | $1,363,379 |
| International Bank for Reconstruction & Development: | ||
| 3.125%, 11/20/25 | USD 2,600 | 2,937,628 |
| 7.45%, 8/20/21 | IDR2,200,000 | 136,269 |
| International Finance Corp., 7.50%, 5/9/22 | BRL 1,315 | 267,129 |
| $4,704,405 | ||
Table of Contents
| Security | Principal Amount (000's omitted) | Value |
| Industrial — 1.4% | ||
| Cargo Aircraft Management, Inc., 4.75%, 2/1/28(1) | USD 102 | $ 95,370 |
| Ellaktor Value PLC, 6.375%, 12/15/24(1) | EUR 130 | 100,366 |
| FedEx Corp., 4.55%, 4/1/46 | USD 550 | 524,855 |
| Jabil, Inc.: | ||
| 3.60%, 1/15/30 | USD 1,536 | 1,374,414 |
| 3.95%, 1/12/28 | USD 1,131 | 1,088,880 |
| 4.70%, 9/15/22 | USD 1,239 | 1,236,702 |
| 5.625%, 12/15/20 | USD 150 | 149,802 |
| JSL Europe SA, 7.75%, 7/26/24(1) | USD 200 | 145,509 |
| nVent Finance S.a.r.l., 4.55%, 4/15/28 | USD 1,965 | 2,196,708 |
| Owens Corning: | ||
| 3.95%, 8/15/29 | USD 2,007 | 1,907,593 |
| 4.30%, 7/15/47 | USD 268 | 230,233 |
| SMBC Aviation Capital Finance DAC, 2.65%, 7/15/21(1) | USD 540 | 535,652 |
| United Parcel Service, Inc., 3.90%, 4/1/25 | USD 171 | 185,502 |
| Valmont Industries, Inc.: | ||
| 5.00%, 10/1/44 | USD 110 | 105,209 |
| 5.25%, 10/1/54 | USD 675 | 669,662 |
| Westinghouse Air Brake Technologies Corp., 2.041%, (3 mo. USD LIBOR + 1.30%), 9/15/21(3) | USD 1,037 | 1,006,857 |
| $11,553,314 | ||
| Other Revenue — 0.2% | ||
| BlueHub Loan Fund, Inc., 3.099%, 1/1/30 | USD 1,625 | $1,760,198 |
| $1,760,198 | ||
| Technology — 0.6% | ||
| Dell International, LLC/EMC Corp., 5.875%, 6/15/21(1) | USD 185 | $185,000 |
| DXC Technology Co., 4.75%, 4/15/27 | USD 597 | 600,604 |
| EMC Corp., 2.65%, 6/1/20 | USD 6 | 5,988 |
| Hewlett Packard Enterprise Co.: | ||
| 1.464%, (3 mo. USD LIBOR + 0.68%), 3/12/21(3) | USD 516 | 499,326 |
| 2.62%, (3 mo. USD LIBOR + 0.72%), 10/5/21(3) | USD 590 | 555,725 |
| Microsoft Corp., 2.40%, 8/8/26 | USD 575 | 609,475 |
| NXP BV/NXP Funding, LLC, 4.625%, 6/1/23(1) | USD 840 | 865,632 |
| Seagate HDD Cayman: | ||
| 4.875%, 3/1/24 | USD 480 | 479,269 |
| 5.75%, 12/1/34 | USD 390 | 362,481 |
| Western Digital Corp., 4.75%, 2/15/26 | USD 621 | 633,575 |
| $4,797,075 | ||
| Security | Principal Amount (000's omitted) | Value |
| Utilities — 1.1% | ||
| American Water Capital Corp., 2.95%, 9/1/27 | USD 750 | $ 745,823 |
| Avangrid, Inc.: | ||
| 3.15%, 12/1/24 | USD 1,956 | 1,949,467 |
| 3.80%, 6/1/29 | USD 1,635 | 1,677,332 |
| Consolidated Edison Co. of New York, Inc.: | ||
| 3.35%, 4/1/30 | USD 429 | 443,409 |
| 4.45%, 6/15/20 | USD 300 | 301,028 |
| Enel Finance International NV, 2.65%, 9/10/24(1) | USD 1,256 | 1,201,414 |
| Engie Energia Chile SA, 3.40%, 1/28/30(1)(8) | USD 200 | 171,900 |
| MidAmerican Energy Co.: | ||
| 3.15%, 4/15/50 | USD 500 | 509,397 |
| 4.25%, 7/15/49 | USD 735 | 865,356 |
| NextEra Energy Operating Partners, L.P., 4.25%, 9/15/24(1) | USD 798 | 783,042 |
| Public Service Co. of Colorado, 3.70%, 6/15/28 | USD 548 | 581,687 |
| $9,229,855 | ||
| Total Corporate Bonds (identified cost $132,987,987) | $129,924,280 | |
| Floating Rate Loans(10) — 0.8% |
| Security | Principal Amount (000's omitted) | Value |
| Building and Development — 0.1% | ||
| Cushman & Wakefield U.S. Borrower, LLC, Term Loan, 3.739%, (1 mo. USD LIBOR + 2.75%), 8/21/25 | $ 592 | $ 533,250 |
| $ 533,250 | ||
| Cable and Satellite Television — 0.1% | ||
| Ziggo Financing Partnership, Term Loan, 3.205%, (1 mo. USD LIBOR + 2.50%), 4/30/28 | $ 475 | $ 443,531 |
| $ 443,531 | ||
| Cosmetics/Toiletries — 0.0%(11) | ||
| Prestige Brands, Inc., Term Loan, 2.989%, (1 mo. USD LIBOR + 2.00%), 1/26/24 | $ 115 | $ 107,495 |
| $ 107,495 | ||
| Drugs — 0.1% | ||
| Jaguar Holding Company II, Term Loan, 3.50%, (1 mo. USD LIBOR + 2.50%, Floor 1.00%), 8/18/22 | $ 901 | $868,791 |
| $868,791 | ||
Table of Contents
| Security | Principal Amount (000's omitted) | Value |
| Electronics/Electrical — 0.3% | ||
| Epicor Software Corporation, Term Loan, 4.25%, (1 mo. USD LIBOR + 3.25%, Floor 1.00%), 6/1/22 | $ 627 | $ 581,274 |
| Go Daddy Operating Company, LLC, Term Loan, 2.739%, (1 mo. USD LIBOR + 1.75%), 2/15/24 | 119 | 114,026 |
| Hyland Software, Inc., Term Loan, 4.239%, (1 mo. USD LIBOR + 3.25%), 7/1/24 | 597 | 557,669 |
| Infor (US), Inc., Term Loan, 3.75%, (1 mo. USD LIBOR + 2.75%, Floor 1.00%), 2/1/22 | 895 | 868,132 |
| MA FinanceCo., LLC, Term Loan, 3.489%, (1 mo. USD LIBOR + 2.50%), 6/21/24 | 37 | 33,813 |
| Seattle Spinco, Inc., Term Loan, 3.489%, (1 mo. USD LIBOR + 2.50%), 6/21/24 | 250 | 228,346 |
| SolarWinds Holdings, Inc., Term Loan, 3.739%, (1 mo. USD LIBOR + 2.75%), 2/5/24 | 198 | 184,244 |
| $ 2,567,504 | ||
| Equipment Leasing — 0.0%(11) | ||
| Avolon TLB Borrower 1 (US), LLC, Term Loan, 2.523%, (1 mo. USD LIBOR + 1.75%), 1/15/25 | $ 305 | $275,142 |
| $275,142 | ||
| Health Care — 0.0%(11) | ||
| Change Healthcare Holdings, LLC, Term Loan, 3.50%, (1 mo. USD LIBOR + 2.50%, Floor 1.00%), 3/1/24 | $ 400 | $369,109 |
| $369,109 | ||
| Industrial Equipment — 0.0%(11) | ||
| Rexnord, LLC, Term Loan, 2.679%, (1 mo. USD LIBOR + 1.75%), 8/21/24 | $ 102 | $94,199 |
| $94,199 | ||
| Insurance — 0.1% | ||
| Asurion, LLC, Term Loan, 3.989%, (1 mo. USD LIBOR + 3.00%), 11/3/23 | $ 467 | $451,172 |
| $451,172 | ||
| Leisure Goods/Activities/Movies — 0.0%(11) | ||
| Bombardier Recreational Products, Inc., Term Loan, 2.989%, (1 mo. USD LIBOR + 2.00%), 5/24/27 | $ 168 | $141,850 |
| $141,850 | ||
| Lodging and Casinos — 0.0%(11) | ||
| ESH Hospitality, Inc., Term Loan, 2.989%, (1 mo. USD LIBOR + 2.00%), 9/18/26 | $ 97 | $85,125 |
| $85,125 | ||
| Security | Principal Amount (000's omitted) | Value |
| Telecommunications — 0.1% | ||
| CenturyLink, Inc., Term Loan, 3.239%, (1 mo. USD LIBOR + 2.25%), 3/15/27 | $ 299 | $ 278,115 |
| Level 3 Financing, Inc., Term Loan, 2.739%, (1 mo. USD LIBOR + 1.75%), 3/1/27 | 176 | 165,763 |
| $ 443,878 | ||
| Total Floating Rate Loans (identified cost $6,818,250) | $ 6,381,046 | |
| High Social Impact Investments — 0.4% |
| Security | Principal Amount (000's omitted) | Value |
| Calvert Impact Capital, Inc., Community Investment Notes, 1.50%, 12/15/20(7)(12) | $ 2,616 | $ 2,520,849 |
| ImpactAssets, Inc., Global Sustainable Agriculture Notes, 3.48%, 11/3/20(7)(13) | 393 | 385,140 |
| ImpactAssets, Inc., Microfinance Plus Notes, 1.20%, 11/3/20(7)(13) | 506 | 491,958 |
| Total High Social Impact Investments (identified cost $3,514,531) | $ 3,397,947 |
| Preferred Stocks — 0.2% |
| Security | Shares | Value |
| Oil, Gas & Consumable Fuels — 0.0%(11) | ||
| NuStar Energy, L.P., Series B, 7.625% to 6/15/22(9) | 28,581 | $ 277,236 |
| $ 277,236 | ||
| Real Estate Management & Development — 0.1% | ||
| Brookfield Property Partners, L.P.: | ||
| Series A, 5.75% | 34,000 | $ 476,000 |
| Series A2, 6.375% | 28,000 | 446,320 |
| $ 922,320 | ||
| Venture Capital — 0.1% | ||
| Consensus Orthopedics, Inc.: | ||
| Series A-1(5)(6)(7) | 420,683 | $4,510 |
| Series B(5)(6)(7) | 348,940 | 3,545 |
| Series C(5)(6)(7) | 601,710 | 6,691 |
| Kickboard: | ||
| Series A(5)(6)(7) | 1,155,503 | 183,124 |
| Series A2(5)(6)(7) | 404,973 | 70,401 |
| LearnZillion, Inc.: | ||
| Series A(5)(6)(7) | 169,492 | 4,857 |
| Series A-1(5)(6)(7) | 108,678 | 3,115 |
Table of Contents
| Security | Shares | Value |
| Venture Capital (continued) | ||
| Lumni, Inc., Series B(5)(6)(7) | 17,265 | $ 99,424 |
| MACH Energy: | ||
| Series A(5)(6)(7) | 27,977 | 2,823 |
| Series B(5)(6)(7) | 26,575 | 2,996 |
| Wind Harvest Co., Inc.(5)(6)(7) | 8,696 | — |
| $ 381,486 | ||
| Total Preferred Stocks (identified cost $3,079,889) | $ 1,581,042 | |
| Rights — 0.1% |
| Security | Shares | Value |
| Pharmaceuticals — 0.1% | ||
| Bristol-Myers Squibb Co. CVR, Exp. 3/31/21(5) | 245,700 | $ 933,660 |
| Total Rights (identified cost $520,948) | $ 933,660 | |
| Sovereign Government Bonds — 0.1% |
| Security | Principal Amount (000's omitted) | Value |
| Nacional Financiera SNC, 3.375%, 11/5/20(1) | $ 560 | $ 549,686 |
| Total Sovereign Government Bonds (identified cost $559,873) | $ 549,686 |
| Taxable Municipal Obligations — 1.8% |
| Security | Principal Amount (000's omitted) | Value |
| General Obligations — 0.5% | ||
| Los Angeles Unified School District, CA, 5.75%, 7/1/34(14) | $ 800 | $ 1,029,240 |
| Massachusetts, Green Bonds, 3.277%, 6/1/46 | 880 | 900,020 |
| New York City, NY, 5.206%, 10/1/31(14) | 1,275 | 1,495,842 |
| San Francisco City and County, CA, (Social Bonds - Affordable Housing, 2016), 3.921%, 6/15/39 | 630 | 670,024 |
| $ 4,095,126 | ||
| Special Tax Revenue — 0.7% | ||
| California Health Facilities Financing Authority, (No Place Like Home Program): | ||
| 2.361%, 6/1/26 | $ 935 | $ 934,317 |
| 2.484%, 6/1/27 | 665 | 665,545 |
| 2.534%, 6/1/28 | 830 | 828,299 |
| 2.584%, 6/1/29 | 455 | 452,134 |
| Security | Principal Amount (000's omitted) | Value |
| Special Tax Revenue (continued) | ||
| 2.984%, 6/1/33 | $ 520 | $ 522,678 |
| Connecticut, Special Tax Revenue, 5.459%, 11/1/30(14) | 400 | 490,488 |
| New York City Transitional Finance Authority, NY, Future Tax Secured Revenue Bonds, 5.767%, 8/1/36(14) | 1,000 | 1,271,220 |
| $ 5,164,681 | ||
| Water and Sewer — 0.6% | ||
| District of Columbia Water & Sewer Authority, Green Bonds, 4.814%, 10/1/2114 | $ 270 | $ 351,419 |
| Narragansett Bay Commission, RI, Wastewater System Revenue, Green Bonds: | ||
| 2.094%, 9/1/30 | 430 | 417,104 |
| 2.184%, 9/1/31 | 345 | 333,125 |
| 2.264%, 9/1/32 | 305 | 294,337 |
| 2.344%, 9/1/33 | 335 | 323,583 |
| San Francisco City and County Public Utilities Commission, CA, Water Revenue, Green Bonds, 3.303%, 11/1/39 | 3,420 | 3,204,267 |
| $4,923,835 | ||
| Total Taxable Municipal Obligations (identified cost $14,040,617) | $14,183,642 | |
| U.S. Government Agencies and Instrumentalities — 0.6% |
| Security | Principal Amount (000's omitted) | Value |
| U.S. Department of Housing and Urban Development: | ||
| 2.547%, 8/1/22 | $ 305 | $ 320,366 |
| 2.618%, 8/1/23 | 153 | 164,198 |
| 2.668%, 8/1/24 | 534 | 578,357 |
| 2.738%, 8/1/25 | 534 | 596,589 |
| 3.435%, 8/1/34 | 530 | 626,600 |
| 3.485%, 8/1/35 | 295 | 349,022 |
| 3.585%, 8/1/37 | 547 | 639,114 |
| U.S. International Development Finance Corp.: | ||
| 3.22%, 9/15/29 | 819 | 907,351 |
| 3.52%, 9/20/32 | 846 | 969,141 |
| Total U.S. Government Agencies and Instrumentalities (identified cost $4,701,922) | $5,150,738 |
Table of Contents
| U.S. Government Agency Mortgage-Backed Securities — 4.5% |
| Security | Principal Amount (000's omitted) | Value |
| Federal National Mortgage Association: | ||
| 30-Year, 2.50%, TBA(15) | $ 8,520 | $ 8,833,099 |
| 30-Year, 3.00%, TBA(15) | 16,385 | 17,184,792 |
| 30-Year, 3.50%, TBA(15) | 3,245 | 3,432,694 |
| Pool #AN1879, 2.65%, with maturity at 6/1/26 | 608 | 658,125 |
| Pool #AN1909, 2.68%, with maturity at 7/1/26 | 650 | 703,234 |
| Pool #BM3990, 4.00%, with maturity at 3/1/48 | 1,621 | 1,733,342 |
| Pool #BM5673, 3.50%, with maturity at 11/1/48 | 811 | 859,093 |
| Pool #MA3149, 4.00%, with maturity at 10/1/47 | 2,755 | 2,946,403 |
| Total U.S. Government Agency Mortgage-Backed Securities (identified cost $35,778,987) | $36,350,782 | |
| U.S. Treasury Obligations — 3.8% |
| Security | Principal Amount (000's omitted) | Value |
| U.S. Treasury Bonds: | ||
| 2.375%, 11/15/49 | $ 275 | $ 343,460 |
| 2.875%, 5/15/49 | 815 | 1,113,207 |
| 3.125%, 5/15/48 | 1,425 | 2,020,939 |
| U.S. Treasury Inflation-Protected Notes: | ||
| 0.625%, 4/15/23(16) | 2,014 | 2,030,109 |
| 0.75%, 7/15/28(16) | 11,727 | 12,558,032 |
| U.S. Treasury Notes: | ||
| 1.125%, 2/28/22 | 8,050 | 8,188,045 |
| 1.625%, 12/31/21 | 950 | 973,323 |
| 1.75%, 7/31/21 | 3,440 | 3,511,958 |
| Total U.S. Treasury Obligations (identified cost $28,945,301) | $30,739,073 |
| Venture Capital Debt Obligations — 0.0%(11) |
| Security | Principal Amount (000's omitted) | Value |
| Kickboard Bridge Note, 8.00%, 4/6/20(6)(7) | $ 41 | $ 26,310 |
| Total Venture Capital Debt Obligations (identified cost $41,000) | $ 26,310 |
| Venture Capital Limited Partnership Interests — 0.0%(11) |
| Security | Value | |
| Commons Capital, L.P.(5)(6)(7) | $ 22,036 | |
| First Analysis Private Equity Fund IV, L.P.(5)(6)(7) | 238,118 | |
| GEEMF Partners, L.P.(5)(6)(7)(12) | 13,453 | |
| Global Environment Emerging Markets Fund, L.P.(5)(6)(7) | 36,262 | |
| Solstice Capital, L.P.(5)(6)(7) | 24,460 | |
| Total Venture Capital Limited Partnership Interests (identified cost $132,194) | $ 334,329 |
| Short-Term Investments — 0.1% |
| Security | Shares | Value |
| State Street Navigator Securities Lending Government Money Market Portfolio, 0.24%(17) | 1,183,348 | $ 1,183,348 |
| Total Short-Term Investments (identified cost $1,183,348) | $ 1,183,348 | |
| Total Investments — 101.2% (identified cost $799,878,361) | $819,705,845 | |
| Other Assets, Less Liabilities — (1.2)% | $ (9,921,218) | |
| Net Assets — 100.0% | $809,784,627 |
| The percentage shown for each investment category in the Schedule of Investments is based on net assets. | ||
| (1) | Security is exempt from registration under Rule 144A of the Securities Act of 1933. These securities may be sold in transactions exempt from registration, normally to qualified institutional buyers. Total market value of Rule 144A securities amounts to $104,429,083, which represents 12.9% of the net assets of the Fund as of March 31, 2020. | |
| (2) | Weighted average fixed-rate coupon that changes/updates monthly. Rate shown is the rate at March 31, 2020. | |
| (3) | Variable rate security. The stated interest rate represents the rate in effect at March 31, 2020. | |
| (4) | Step coupon security. The interest rate disclosed is that which is in effect on March 31, 2020. | |
| (5) | Non-income producing security. | |
| (6) | For fair value measurement disclosure purposes, security is categorized as Level 3 (see Note 1A). | |
| (7) | Restricted security. Total market value of restricted securities amounts to $5,599,069, which represents 0.7% of the net assets of the Fund as of March 31, 2020. | |
| (8) | All or a portion of this security was on loan at March 31, 2020. The aggregate market value of securities on loan at March 31, 2020 was $1,142,271. | |
| (9) | Security converts to variable rate after the indicated fixed-rate coupon period. | |
Table of Contents
| (10) | Remaining maturities of floating rate loans may be less than the stated maturities shown as a result of contractual or optional prepayments by the borrower. Such prepayments cannot be predicted with certainty. Floating rate loans generally pay interest at rates which are periodically re-determined at a spread above the London Interbank Offered Rate (“LIBOR”) or other short-term rates. The rate shown is the rate in effect at March 31, 2020. Floating rate loans are generally considered restrictive in that the Fund is ordinarily contractually obligated to receive consent from the Agent Bank and/or borrower prior to disposition of a floating rate loan. |
| (11) | Amount is less than 0.05%. |
| (12) | Affiliated company (see Note 8). |
| (13) | Notes carry an interest rate that varies by period and is contingent on the performance of the underlying portfolio of loans to borrowers. The coupon rate shown represents the rate in effect at March 31, 2020. |
| (14) | Build America Bond. Represents taxable municipal obligation issued pursuant to the American Recovery and Reinvestment Act of 2009 or other legislation providing for the issuance of taxable municipal debt on which the issuer receives federal support. |
| (15) | TBA (To Be Announced) securities are purchased on a forward commitment basis with an approximate principal amount and no definite maturity date. The actual principal amount and maturity date are determined upon settlement when the specific mortgage pools are assigned. |
| (16) | Inflation-linked security whose principal is adjusted for inflation based on changes in the U.S. Consumer Price Index. Interest is calculated based on the inflation-adjusted principal. |
| (17) | Represents investment of cash collateral received in connection with securities lending. |
| Currency Purchased | Currency Sold | Counterparty | Settlement Date | Unrealized Appreciation | Unrealized (Depreciation) | ||
| USD | 145,212 | EUR | 132,700 | State Street Bank and Trust Company | 5/29/20 | $ — | $(1,465) |
| $ — | $(1,465) | ||||||
| Description | Number of Contracts | Position | Expiration Date | Notional Amount | Value/ Unrealized Appreciation (Depreciation) |
| Interest Rate Futures | |||||
| U.S. 2-Year Treasury Note | 29 | Long | 6/30/20 | $6,391,102 | $91,256 |
| U.S. Ultra-Long Treasury Bond | 105 | Long | 6/19/20 | 23,296,875 | 2,034,173 |
| U.S. 5-Year Treasury Note | (49) | Short | 6/30/20 | (6,142,609) | (186,514) |
| U.S. Long Treasury Bond | (21) | Short | 6/19/20 | (3,760,313) | (260,242) |
| U.S. Ultra 10-Year Treasury Note | (210) | Short | 6/19/20 | (32,766,563) | (1,627,919) |
| U.S. Ultra-Long Treasury Bond | (1) | Short | 6/19/20 | (221,875) | (17,288) |
| $33,466 |
| Description | Acquisition Dates | Cost |
| Calvert Impact Capital, Inc., Community Investment Notes, 1.50%, 12/15/20 | 12/13/19 | $2,615,531 |
| CFBanc Corp., Common Stock | 3/14/03 | 270,000 |
| Commons Capital, L.P. | 2/15/01-12/27/11 | 132,194 |
| Consensus Orthopedics, Inc., Common Stock | 2/10/06 | 504,331 |
| Consensus Orthopedics, Inc., Series A-1, Preferred | 8/19/05 | 4,331 |
| Consensus Orthopedics, Inc., Series B, Preferred | 2/10/06 | 139,576 |
| Consensus Orthopedics, Inc., Series C, Preferred | 2/10/06 | 120,342 |
| First Analysis Private Equity Fund IV, L.P. | 2/25/02-7/6/11 | — |
| GEEMF Partners, L.P. | 2/28/97 | — |
Table of Contents
| Description | Acquisition Dates | Cost |
| Global Environment Emerging Markets Fund, L.P. | 1/14/94-12/1/95 | $ — |
| ImpactAssets, Inc., Global Sustainable Agriculture Notes, 3.48%, 11/3/20 | 11/13/15 | 393,000 |
| ImpactAssets, Inc., Microfinance Plus Notes, 1.20%, 11/3/20 | 11/13/15 | 506,000 |
| Kickboard, Common Stock | 5/23/13 | — |
| Kickboard, Series A, Preferred | 2/12/13 | 285,328 |
| Kickboard, Series A2, Preferred | 6/19/14 | 100,000 |
| Kickboard Bridge Note, 8.00%, 4/6/20 | 9/16/15 | 41,000 |
| Learn Capital Venture Partners III, L.P., Common Stock | 8/30/16-12/17/19 | 995,790 |
| LearnZillion, Inc., Series A, Preferred | 3/27/12 | — |
| LearnZillion, Inc., Series A-1, Preferred | 4/23/13 | 15,182 |
| Lumni, Inc., Series B, Preferred | 8/8/13 | 116,367 |
| MACH Energy, Common Stock | 10/31/08 | — |
| MACH Energy, Series A, Preferred | 5/31/02 | — |
| MACH Energy, Series B, Preferred | 12/20/05 | — |
| Neighborhood Bancorp, Class A, Common Stock | 6/25/97 | 100,000 |
| Solstice Capital, L.P. | 6/26/01-6/17/08 | — |
| Wind Harvest Co., Inc., Preferred | 5/16/94 | 100,000 |
| Abbreviations: | |
| ADR | – American Depositary Receipt |
| CVR | – Contingent Value Rights |
| LIBOR | – London Interbank Offered Rate |
| SOFR | – Secured Overnight Financing Rate |
| TBA | – To Be Announced |
| Currency Abbreviations: | |
| BRL | – Brazilian Real |
| EUR | – Euro |
| IDR | – Indonesian Rupiah |
| USD | – United States Dollar |
Table of Contents
| Asset-Backed Securities — 17.6% |
| Security | Principal Amount (000's omitted) | Value |
| Adams Outdoor Advertising, L.P., Series 2018-1, Class A, 4.81%, 11/15/48(1) | $ 1,632 | $ 1,644,334 |
| Avant Loans Funding Trust: | ||
| Series 2017-B, Class C, 4.99%, 11/15/23(1) | 5,162 | 5,154,830 |
| Series 2018-A, Class B, 3.95%, 12/15/22(1) | 2,835 | 2,359,767 |
| Series 2019-A, Class A, 3.48%, 7/15/22(1) | 734 | 714,493 |
| Series 2019-B, Class A, 2.72%, 10/15/26(1) | 3,899 | 3,798,590 |
| Avis Budget Rental Car Funding AESOP, LLC, Series 2015-1A, Class A, 2.50%, 7/20/21(1) | 2,687 | 2,682,838 |
| Coinstar Funding, LLC, Series 2017-1A, Class A2, 5.216%, 4/25/47(1) | 9,535 | 9,041,763 |
| Conn's Receivables Funding, LLC: | ||
| Series 2018-A, Class A, 3.25%, 1/15/23(1) | 263 | 257,279 |
| Series 2019-A, Class A, 3.40%, 10/16/23(1) | 599 | 582,813 |
| Series 2019-B, Class A, 2.66%, 6/17/24(1) | 8,011 | 7,601,673 |
| Consumer Loan Underlying Bond Credit Trust: | ||
| Series 2018-P3, Class A, 3.82%, 1/15/26(1) | 2,200 | 2,140,101 |
| Series 2019-P1, Class A, 2.94%, 7/15/26(1) | 1,095 | 1,058,806 |
| Series 2019-P2, Class A, 2.47%, 10/15/26(1) | 5,548 | 5,235,688 |
| Series 2020-P1, Class A, 2.26%, 3/15/28(1) | 4,616 | 4,434,825 |
| Credit Acceptance Auto Loan Trust: | ||
| Series 2017-1A, Class B, 3.04%, 12/15/25(1) | 2,290 | 2,289,448 |
| Series 2017-2A, Class A, 2.55%, 2/17/26(1) | 5,104 | 5,086,193 |
| Series 2017-3A, Class A, 2.65%, 6/15/26(1) | 889 | 884,932 |
| DB Master Finance, LLC, Series 2017-1A, Class A2II, 4.03%, 11/20/47(1) | 674 | 633,899 |
| DRB Prime Student Loan Trust, Series 2016-B, Class A2, 2.89%, 6/25/40(1) | 674 | 683,229 |
| Driven Brands Funding, LLC: | ||
| Series 2015-1A, Class A2, 5.216%, 7/20/45(1) | 3,370 | 3,402,831 |
| Series 2018-1A, Class A2, 4.739%, 4/20/48(1) | 5,526 | 5,412,172 |
| Element Rail Leasing I, LLC: | ||
| Series 2014-1A, Class A1, 2.299%, 4/19/44(1) | 137 | 136,229 |
| Series 2014-1A, Class B1, 4.406%, 4/19/44(1) | 2,200 | 2,187,300 |
| Enterprise Fleet Financing, LLC: | ||
| Series 2017-1, Class A2, 2.13%, 7/20/22(1) | 134 | 133,958 |
| Series 2017-3, Class A2, 2.13%, 5/22/23(1) | 6,551 | 6,524,801 |
| ExteNet, LLC, Series 2019-1A, Class A2, 3.204%, 7/26/49(1) | 4,625 | 4,290,064 |
| FOCUS Brands Funding, LLC: | ||
| Series 2017-1A, Class A2I, 3.857%, 4/30/47(1) | 5,752 | 5,489,622 |
| Series 2017-1A, Class A2II, 5.093%, 4/30/47(1) | 1,211 | 1,008,792 |
| Hardee's Funding, LLC, Series 2018-1A, Class A2I, 4.25%, 6/20/48(1) | 3,300 | 3,171,192 |
| Hertz Fleet Lease Funding, L.P., Series 2017-1, Class A2, 2.13%, 4/10/31(1) | 1,627 | 1,625,220 |
| Security | Principal Amount (000's omitted) | Value |
| InSite Issuer, LLC, Series 2016-1A, Class A, 2.883%, 11/15/46(1) | $ 1,985 | $ 1,718,809 |
| Jack in the Box Funding, LLC, Series 2019-1A, Class A2I, 3.982%, 8/25/49(1) | 3,287 | 3,040,124 |
| Lunar Aircraft, Ltd.: | ||
| Series 2020-1A, Class B, 4.335%, 2/15/45(1) | 1,850 | 1,201,409 |
| Series 2020-1A, Class C, 6.413%, 2/15/45(1) | 605 | 372,108 |
| Mosaic Solar Loan Trust: | ||
| Series 2019-1A, Class A, 4.37%, 12/21/43(1) | 3,751 | 3,715,589 |
| Series 2019-2A, Class B, 3.28%, 9/20/40(1) | 13,360 | 11,509,319 |
| Series 2019-2A, Class C, 4.35%, 9/20/40(1) | 1,495 | 1,061,209 |
| Mosaic Solar Loans LLC, Series 2017-1A, Class A, 4.45%, 6/20/42(1) | 221 | 218,199 |
| OneMain Financial Issuance Trust, Series 2017-1A, Class A1, 2.37%, 9/14/32(1) | 4,449 | 4,377,017 |
| Oportun Funding IX, LLC, Series 2018-B, Class A, 3.91%, 7/8/24(1) | 12,777 | 12,039,273 |
| Oportun Funding VIII, LLC: | ||
| Series 2018-A, Class A, 3.61%, 3/8/24(1) | 9,016 | 8,540,598 |
| Series 2018-A, Class B, 4.45%, 3/8/24(1) | 8,135 | 7,726,350 |
| OSCAR US Funding X, LLC, Series 2019-1A, Class A2, 3.10%, 4/11/22(1) | 2,604 | 2,620,850 |
| Planet Fitness Master Issuer, LLC: | ||
| Series 2018-1A, Class A2I, 4.262%, 9/5/48(1) | 8,180 | 7,809,282 |
| Series 2019-1A, Class A2, 3.858%, 12/5/49(1) | 3,157 | 2,505,779 |
| Prosper Marketplace Issuance Trust: | ||
| Series 2018-1A, Class B, 3.90%, 6/17/24(1) | 66 | 66,109 |
| Series 2018-2A, Class A, 3.35%, 10/15/24(1) | 828 | 823,443 |
| RenewFund Receivables Trust, Series 2015-1, Class A, 3.51%, 4/15/25(1) | 326 | 322,257 |
| SBA Tower Trust, Series 2014-2A, Class C, 3.869%, 10/15/49(1) | 3,300 | 3,413,721 |
| SERVPRO Master Issuer, LLC, Series 2019-1A, Class A2, 3.882%, 10/25/49(1) | 13,306 | 12,545,120 |
| Small Business Lending Trust: | ||
| Series 2019-A, Class A, 2.85%, 7/15/26(1) | 2,779 | 2,728,006 |
| Series 2020-A, Class A, 2.62%, 12/15/26(1) | 3,570 | 3,484,736 |
| SolarCity LMC Series I, LLC, Series 2013-1, Class A, 4.80%, 11/20/38(1) | 2,138 | 1,979,691 |
| SolarCity LMC Series III, LLC: | ||
| Series 2014-2, Class A, 4.02%, 7/20/44(1) | 12,064 | 11,343,446 |
| Series 2014-2, Class B, 5.44%, 7/20/44(1) | 5,547 | 5,129,189 |
| Sonic Capital, LLC, Series 2020-1A, Class A2I, 3.845%, 1/20/50(1) | 7,591 | 7,386,816 |
| SpringCastle Funding Asset-Backed Notes, Series 2019-AA, Class A, 3.20%, 5/27/36(1) | 6,399 | 6,031,439 |
| Springleaf Funding Trust, Series 2016-AA, Class A, 2.90%, 11/15/29(1) | 2,312 | 2,293,065 |
Table of Contents
| Security | Principal Amount (000's omitted) | Value |
| Spruce ABS Trust, Series 2016-E1, Class A, 4.32%, 6/15/28(1) | $ 371 | $ 365,718 |
| Stack Infrastructure Issuer, LLC: | ||
| Series 2019-1A, Class A2, 4.54%, 2/25/44(1) | 27,118 | 27,243,107 |
| Series 2019-2A, Class A2, 3.08%, 10/25/44(1) | 2,210 | 2,101,447 |
| Sunnova Sol Issuer, LLC, Series 2020-1A, Class A, 3.35%, 2/1/55(1) | 1,475 | 1,094,329 |
| Sunrun Atlas Issuer, LLC, Series 2019-2, Class A, 3.61%, 2/1/55(1) | 2,932 | 2,580,029 |
| TES, LLC, Series 2017-1A, Class A, 4.33%, 10/20/47(1) | 3,801 | 2,971,960 |
| Tesla Auto Lease Trust: | ||
| Series 2018-B, Class A, 3.71%, 8/20/21(1) | 6,164 | 6,200,466 |
| Series 2018-B, Class C, 4.36%, 10/20/21(1) | 3,075 | 3,019,738 |
| Series 2019-A, Class A1, 2.005%, 12/18/20(1) | 2,521 | 2,520,027 |
| Series 2019-A, Class A2, 2.13%, 4/20/22(1) | 2,278 | 2,287,194 |
| Series 2019-A, Class A3, 2.16%, 10/20/22(1) | 11,727 | 11,807,412 |
| Series 2019-A, Class A4, 2.20%, 11/21/22(1) | 2,355 | 2,315,034 |
| United States Small Business Administration, Series 2017-20E, Class 1, 2.88%, 5/1/37 | 5,099 | 5,309,020 |
| Vantage Data Centers Issuer, LLC: | ||
| Series 2018-1A, Class A2, 4.072%, 2/16/43(1) | 5,124 | 5,111,113 |
| Series 2018-2A, Class A2, 4.196%, 11/16/43(1) | 2,171 | 2,172,496 |
| Series 2019-1A, Class A2, 3.188%, 7/15/44(1) | 5,955 | 5,762,675 |
| VB-S1 Issuer, LLC, Series 2016-1A, Class C, 3.065%, 6/15/46(1) | 4,025 | 3,995,328 |
| Willis Engine Structured Trust V: | ||
| Series 2020-A, Class B, 4.212%, 3/15/45(1) | 2,420 | 1,561,626 |
| Series 2020-A, Class C, 6.657%, 3/15/45(1) | 1,155 | 916,839 |
| Total Asset-Backed Securities (identified cost $321,588,430) | $305,006,193 |
| Collateralized Mortgage-Backed Obligations — 14.7% |
| Security | Principal Amount (000's omitted) | Value |
| Federal Home Loan Mortgage Corp. Multifamily Structured Pass Through Certificates: | ||
| Series KG02, Class A2, 2.412%, 8/25/29 | $ 19,890 | $ 22,424,947 |
| Series KW06, Class A2, 3.80%, 6/25/28(2) | 5,335 | 6,436,976 |
| Series W5FX, Class AFX, 3.092%, 4/25/28(2) | 1,896 | 2,146,868 |
| Federal Home Loan Mortgage Corp. Structured Agency Credit Risk Debt Notes: | ||
| Series 2015-HQA2, Class M2, 3.747%, (1 mo. USD LIBOR + 2.80%), 5/25/28(3) | 347 | 346,262 |
| Series 2017-DNA3, Class M2, 3.447%, (1 mo. USD LIBOR + 2.50%), 3/25/30(3) | 7,670 | 6,791,175 |
| Security | Principal Amount (000's omitted) | Value |
| Federal Home Loan Mortgage Corp. Structured Agency Credit Risk Debt Notes: (continued) | ||
| Series 2017-HQA2, Class M2, 3.597%, (1 mo. USD LIBOR + 2.65%), 12/25/29(3) | $ 1,565 | $ 1,339,659 |
| Series 2018-DNA1, Class M1, 1.397%, (1 mo. USD LIBOR + 0.45%), 7/25/30(3) | 387 | 387,464 |
| Series 2018-DNA1, Class M2, 2.747%, (1 mo. USD LIBOR + 1.80%), 7/25/30(3) | 2,055 | 1,739,758 |
| Series 2018-DNA1, Class M2AT, 1.997%, (1 mo. USD LIBOR + 1.05%), 7/25/30(3) | 5,150 | 4,731,128 |
| Series 2019-DNA3, Class M2, 2.997%, (1 mo. USD LIBOR + 2.05%), 7/25/49(1)(3) | 11,667 | 9,900,939 |
| Series 2019-DNA4, Class M1, 1.647%, (1 mo. USD LIBOR + 0.70%), 10/25/49(1)(3) | 1,507 | 1,484,376 |
| Series 2019-DNA4, Class M2, 2.897%, (1 mo. USD LIBOR + 1.95%), 10/25/49(1)(3) | 4,190 | 3,388,341 |
| Series 2019-HQA2, Class M1, 1.647%, (1 mo. USD LIBOR + 0.70%), 4/25/49(1)(3) | 190 | 190,543 |
| Series 2019-HQA2, Class M2, 2.997%, (1 mo. USD LIBOR + 2.05%), 4/25/49(1)(3) | 3,565 | 2,995,099 |
| Series 2019-HQA3, Class M1, 1.697%, (1 mo. USD LIBOR + 0.75%), 9/25/49(1)(3) | 394 | 392,839 |
| Series 2019-HQA3, Class M2, 2.797%, (1 mo. USD LIBOR + 1.85%), 9/25/49(1)(3) | 865 | 709,011 |
| Series 2020-DNA1, Class M1, 1.647%, (1 mo. USD LIBOR + 0.70%), 1/25/50(1)(3) | 3,805 | 3,696,355 |
| Series 2020-DNA2, Class M1, 1.697%, (1 mo. USD LIBOR + 0.75%), 2/25/50(1)(3) | 7,150 | 6,639,051 |
| Series 2020-HQA1, Class M1, 1.697%, (1 mo. USD LIBOR + 0.75%), 1/25/50(1)(3) | 1,355 | 1,290,815 |
| Federal National Mortgage Association: | ||
| Series 2017-M2, Class A1, 2.894%, 2/25/27(2) | 1,066 | 1,097,106 |
| Series 2017-M13, Class A2, 3.033%, 9/25/27(2) | 5,500 | 6,258,876 |
| Series 2018-M4, Class A2, 3.147%, 3/25/28(2) | 8,448 | 9,374,703 |
| Series 2018-M8, Class A2, 3.436%, 6/25/28(2) | 4,628 | 5,406,165 |
| Series 2018-M13, Class A2, 3.82%, 9/25/30(2) | 17,300 | 20,349,032 |
| Series 2019-M1, Class A2, 3.673%, 9/25/28(2) | 13,360 | 15,516,414 |
| Series 2019-M9, Class A2, 2.937%, 4/25/29 | 3,713 | 4,089,797 |
| Series 2019-M22, Class A2, 2.522%, 8/25/29 | 43,030 | 46,851,890 |
| Series 2020-M1, Class A2, 2.444%, 9/25/29 | 13,443 | 14,384,907 |
| Federal National Mortgage Association Connecticut Avenue Securities: | ||
| Series 2013-C01, Class M2, 6.197%, (1 mo. USD LIBOR + 5.25%), 10/25/23(3) | 3,789 | 3,720,196 |
| Series 2014-C02, Class 1M2, 3.547%, (1 mo. USD LIBOR + 2.60%), 5/25/24(3) | 4,421 | 4,081,526 |
| Series 2014-C02, Class 2M2, 3.547%, (1 mo. USD LIBOR + 2.60%), 5/25/24(3) | 1,630 | 1,445,345 |
| Series 2014-C03, Class 1M2, 3.947%, (1 mo. USD LIBOR + 3.00%), 7/25/24(3) | 5,976 | 5,464,189 |
| Series 2014-C03, Class 2M2, 3.847%, (1 mo. USD LIBOR + 2.90%), 7/25/24(3) | 2,521 | 2,346,898 |
| Series 2014-C04, Class 1M2, 5.847%, (1 mo. USD LIBOR + 4.90%), 11/25/24(3) | 11,166 | 10,657,941 |
Table of Contents
| Security | Principal Amount (000's omitted) | Value |
| Federal National Mortgage Association Connecticut Avenue Securities: (continued) | ||
| Series 2016-C06, Class 1M2, 5.197%, (1 mo. USD LIBOR + 4.25%), 4/25/29(3) | $ 1,600 | $ 1,551,988 |
| Series 2017-C04, Class 2M1, 1.797%, (1 mo. USD LIBOR + 0.85%), 11/25/29(3) | 797 | 800,506 |
| Series 2017-C06, Class 1M2, 3.597%, (1 mo. USD LIBOR + 2.65%), 2/25/30(3) | 2,411 | 2,163,970 |
| Series 2018-C03, Class 1M1, 1.627%, (1 mo. USD LIBOR + 0.68%), 10/25/30(3) | 218 | 217,695 |
| Series 2018-R07, Class 1M2, 3.347%, (1 mo. USD LIBOR + 2.40%), 4/25/31(1)(3) | 4,406 | 3,905,009 |
| Series 2019-R03, Class 1M2, 3.097%, (1 mo. USD LIBOR + 2.15%), 9/25/31(1)(3) | 2,865 | 2,472,132 |
| Series 2019-R05, Class 1M2, 2.947%, (1 mo. USD LIBOR + 2.00%), 7/25/39(1)(3) | 2,501 | 2,160,528 |
| Series 2019-R06, Class 2M1, 1.697%, (1 mo. USD LIBOR + 0.75%), 9/25/39(1)(3) | 5,587 | 5,483,241 |
| Series 2020-R01, Class 1M1, 1.747%, (1 mo. USD LIBOR + 0.80%), 1/25/40(1)(3) | 4,762 | 4,611,124 |
| Federal National Mortgage Association Grantor Trust, Series 2017-T1, Class A, 2.898%, 6/25/27 | 1,956 | 2,101,517 |
| Toorak Mortgage Corp., Ltd., Series 2020-1, Class A1, 2.734% to 1/25/23, 3/25/23(1)(4) | 2,220 | 2,217,603 |
| Total Collateralized Mortgage-Backed Obligations (identified cost $252,621,979) | $255,761,904 |
| Commercial Mortgage-Backed Securities — 3.5% |
| Security | Principal Amount (000's omitted) | Value |
| BAMLL Commercial Mortgage Securities Trust: | ||
| Series 2019-BPR, Class DNM, 3.843%, 11/5/32(1)(2) | $ 9,685 | $ 8,680,337 |
| Series 2019-BPR, Class FNM, 3.843%, 11/5/32(1)(2) | 4,805 | 3,414,249 |
| BX Commercial Mortgage Trust: | ||
| Series 2019-XL, Class A, 1.625%, (1 mo. USD LIBOR + 0.92%), 10/15/36(1)(3) | 9,296 | 8,976,075 |
| Series 2019-XL, Class B, 1.785%, (1 mo. USD LIBOR + 1.08%), 10/15/36(1)(3) | 3,024 | 2,888,268 |
| Federal National Mortgage Association Multifamily Connecticut Avenue Securities Trust, Series 2020-01, Class M10, 4.362%, (1 mo. USD LIBOR + 3.75%), 3/25/50(1)(3) | 3,855 | 3,056,387 |
| JPMorgan Chase Commercial Mortgage Securities Trust: | ||
| Series 2014-DSTY, Class B, 3.771%, 6/10/27(1) | 2,335 | 2,064,271 |
| Series 2014-DSTY, Class C, 3.931%, 6/10/27(1)(2) | 385 | 308,341 |
| Morgan Stanley Capital I Trust: | ||
| Series 2017-CLS, Class A, 1.405%, (1 mo. USD LIBOR + 0.70%), 11/15/34(1)(3) | 4,425 | 4,240,211 |
| Security | Principal Amount (000's omitted) | Value |
| Morgan Stanley Capital I Trust: (continued) | ||
| Series 2019-BPR, Class A, 2.105%, (1 mo. USD LIBOR + 1.40%), 5/15/36(1)(3) | $ 9,890 | $ 9,227,784 |
| Motel 6 Trust: | ||
| Series 2017-MTL6, Class C, 2.105%, (1 mo. USD LIBOR + 1.40%), 8/15/34(1)(3) | 5,789 | 5,037,663 |
| Series 2017-MTL6, Class D, 2.855%, (1 mo. USD LIBOR + 2.15%), 8/15/34(1)(3) | 907 | 807,415 |
| RETL Trust: | ||
| Series 2019-RVP, Class A, 1.855%, (1 mo. USD LIBOR + 1.15%), 3/15/36(1)(3) | 1,509 | 1,411,050 |
| Series 2019-RVP, Class B, 2.255%, (1 mo. USD LIBOR + 1.55%), 3/15/36(1)(3) | 8,685 | 7,750,510 |
| WFLD Mortgage Trust: | ||
| Series 2014-MONT, Class B, 3.88%, 8/10/31(1)(2) | 1,000 | 946,906 |
| Series 2014-MONT, Class C, 3.88%, 8/10/31(1)(2) | 2,700 | 2,466,468 |
| Total Commercial Mortgage-Backed Securities (identified cost $67,554,443) | $61,275,935 |
| Corporate Bonds — 43.4% |
| Security | Principal Amount (000's omitted) | Value |
| Basic Materials — 0.7% | ||
| Ecolab, Inc., 4.80%, 3/24/30 | $ 1,594 | $ 1,821,840 |
| LG Chem, Ltd.: | ||
| 3.25%, 10/15/24(1) | 6,400 | 6,639,488 |
| 3.625%, 4/15/29(1) | 3,325 | 3,286,753 |
| $ 11,748,081 | ||
| Communications — 3.4% | ||
| AT&T, Inc.: | ||
| 4.30%, 2/15/30 | $ 5,457 | $ 5,885,122 |
| 4.50%, 3/9/48 | 4,957 | 5,405,830 |
| 4.90%, 6/15/42 | 3,000 | 3,357,585 |
| 5.35%, 12/15/43 | 3,750 | 4,477,396 |
| Charter Communications Operating, LLC/Charter Communications Operating Capital, 4.80%, 3/1/50 | 8,570 | 8,972,236 |
| Comcast Corp.: | ||
| 2.349%, (3 mo. USD LIBOR + 0.44%), 10/1/21(3) | 4,400 | 4,303,971 |
| 4.70%, 10/15/48 | 3,180 | 4,128,943 |
| CommScope Technologies, LLC, 6.00%, 6/15/25(1) | 4,003 | 3,693,568 |
| Crown Castle Towers, LLC, 3.663%, 5/15/45(1) | 2,100 | 2,106,591 |
| Discovery Communications, LLC, 5.20%, 9/20/47 | 9,090 | 9,331,326 |
| NBCUniversal Media, LLC, 4.45%, 1/15/43 | 1,500 | 1,911,841 |
| Verizon Communications, Inc., 3.875%, 2/8/29 | 5,457 | 6,121,809 |
| $59,696,218 | ||
Table of Contents
| Security | Principal Amount (000's omitted) | Value |
| Consumer, Cyclical — 4.4% | ||
| American Airlines Pass-Through Trust: | ||
| 4.40%, 3/22/25 | $ 5,349 | $ 4,536,248 |
| 5.25%, 7/15/25 | 2,406 | 2,424,689 |
| 5.60%, 7/15/20(1) | 214 | 214,705 |
| 5.625%, 1/15/21(1) | 703 | 699,081 |
| Azul Investments, LLP, 5.875%, 10/26/24(1) | 1,490 | 832,545 |
| Best Buy Co., Inc., 4.45%, 10/1/28 | 3,196 | 3,286,782 |
| Ford Motor Credit Co., LLC: | ||
| 2.71%, (3 mo. USD LIBOR + 0.81%), 4/5/21(3) | 1,460 | 1,350,645 |
| 2.728%, (3 mo. USD LIBOR + 0.88%), 10/12/21(3) | 5,522 | 5,078,849 |
| 2.843%, (3 mo. USD LIBOR + 1.08%), 8/3/22(3) | 6,600 | 5,412,000 |
| 2.979%, 8/3/22 | 13,035 | 12,187,725 |
| 3.087%, 1/9/23 | 2,205 | 1,995,525 |
| 4.14%, 2/15/23 | 1,770 | 1,656,012 |
| Home Depot, Inc. (The), 2.70%, 4/15/30 | 2,866 | 2,924,601 |
| Latam Airlines Pass-Through Trust, 4.20%, 8/15/29 | 1,511 | 1,372,999 |
| Macy's Retail Holdings, Inc.: | ||
| 2.875%, 2/15/23 | 6,787 | 4,890,412 |
| 4.375%, 9/1/23 | 2,221 | 1,547,589 |
| Nordstrom, Inc.: | ||
| 4.375%, 4/1/30 | 5,866 | 4,721,989 |
| 5.00%, 1/15/44 | 5,689 | 4,000,314 |
| Tapestry, Inc., 4.125%, 7/15/27 | 8,546 | 7,302,462 |
| Target Corp., 2.25%, 4/15/25 | 4,002 | 4,065,825 |
| TJX Cos., Inc. (The): | ||
| 3.50%, 4/15/25 | 3,160 | 3,235,747 |
| 3.875%, 4/15/30 | 2,441 | 2,530,960 |
| $76,267,704 | ||
| Consumer, Non-cyclical — 4.0% | ||
| Ashtead Capital, Inc., 4.25%, 11/1/29(1) | $ 5,174 | $4,419,280 |
| Becton Dickinson and Co.: | ||
| 2.25%, (3 mo. USD LIBOR + 0.875%), 12/29/20(3) | 11,961 | 11,559,250 |
| 2.404%, 6/5/20 | 1,667 | 1,661,866 |
| 2.894%, 6/6/22 | 1,667 | 1,669,720 |
| Centene Corp.: | ||
| 3.375%, 2/15/30(1) | 5,735 | 5,355,056 |
| 4.25%, 12/15/27(1) | 2,443 | 2,461,200 |
| Conagra Brands, Inc., 2.552%, (3 mo. USD LIBOR + 0.75%), 10/22/20(3) | 490 | 484,858 |
| Conservation Fund (The), Green Bonds, 3.474%, 12/15/29 | 3,965 | 4,438,332 |
| CVS Health Corp.: | ||
| 2.625%, 8/15/24 | 1,508 | 1,515,568 |
| 3.00%, 8/15/26 | 8,284 | 8,270,828 |
| Security | Principal Amount (000's omitted) | Value |
| Consumer, Non-cyclical (continued) | ||
| CVS Health Corp.: (continued) | ||
| 4.30%, 3/25/28 | $ 7,696 | $ 8,189,344 |
| CVS Pass-Through Trust, 6.036%, 12/10/28 | 1,661 | 1,803,635 |
| Grupo Bimbo SAB de CV: | ||
| 4.00%, 9/6/49(1) | 500 | 422,098 |
| 4.50%, 1/25/22(1) | 3,000 | 3,020,255 |
| Kaiser Foundation Hospitals, 3.15%, 5/1/27(5) | 4,091 | 4,219,028 |
| Massachusetts Institute of Technology, 3.959%, 7/1/38 | 875 | 970,291 |
| Pfizer, Inc., 2.625%, 4/1/30 | 3,177 | 3,338,064 |
| President and Fellows of Harvard College, 3.619%, 10/1/37 | 1,000 | 1,079,455 |
| Sysco Corp.: | ||
| 2.40%, 2/15/30 | 3,637 | 3,007,098 |
| 5.65%, 4/1/25 | 1,921 | 2,002,350 |
| $69,887,576 | ||
| Energy — 1.5% | ||
| National Oilwell Varco, Inc., 3.60%, 12/1/29 | $ 18,329 | $13,776,701 |
| TerraForm Power Operating, LLC: | ||
| 4.75%, 1/15/30(1) | 3,260 | 3,180,293 |
| 5.00%, 1/31/28(1) | 8,737 | 9,203,119 |
| $26,160,113 | ||
| Financial — 18.4% | ||
| Aflac, Inc., 3.60%, 4/1/30 | $ 5,258 | $5,333,606 |
| AG Issuer, LLC, 6.25%, 3/1/28(1) | 4,750 | 4,025,625 |
| Alliance Data Systems Corp., 4.75%, 12/15/24(1) | 3,899 | 2,992,483 |
| Ameriprise Financial, Inc., 3.00%, 4/2/25 | 3,218 | 3,204,388 |
| ANZ New Zealand International, Ltd., 2.20%, 7/17/20(1) | 2,032 | 2,031,263 |
| Australia & New Zealand Banking Group, Ltd., 2.95% to 7/22/25, 7/22/30(1)(6) | 6,352 | 6,031,868 |
| Bank of America Corp.: | ||
| 2.456% to 10/22/24, 10/22/25(6) | 9,093 | 9,185,686 |
| 2.999%, (3 mo. USD LIBOR + 1.18%), 10/21/22(3) | 2,155 | 2,082,225 |
| 3.419% to 12/20/27, 12/20/28(6) | 5,369 | 5,554,879 |
| 3.499% to 5/17/21, 5/17/22(6) | 6,741 | 6,823,216 |
| 3.55% to 3/5/23, 3/5/24(6) | 8,200 | 8,511,906 |
| 3.593% to 7/21/27, 7/21/28(6) | 6,450 | 6,614,132 |
| 3.824% to 1/20/27, 1/20/28(6) | 11,000 | 11,433,129 |
| 3.974% to 2/7/29, 2/7/30(6) | 1,960 | 2,120,355 |
| Bank of America NA, 3.335% to 1/25/22, 1/25/23(6) | 11,436 | 11,437,223 |
| Bank of Montreal, 2.05%, 11/1/22 | 11,317 | 11,335,144 |
| Bank of Nova Scotia (The), 2.375%, 1/18/23 | 7,809 | 7,867,014 |
Table of Contents
| Security | Principal Amount (000's omitted) | Value |
| Financial (continued) | ||
| Capital One Financial Corp.: | ||
| 2.22%, (3 mo. USD LIBOR + 0.45%), 10/30/20(3) | $ 1,925 | $ 1,895,742 |
| 2.50%, 5/12/20 | 3,097 | 3,095,738 |
| 3.30%, 10/30/24 | 4,779 | 4,716,040 |
| 4.20%, 10/29/25 | 2,100 | 2,096,746 |
| Capital One NA, 2.65%, 8/8/22 | 2,305 | 2,285,614 |
| Citigroup, Inc.: | ||
| 2.65%, 10/26/20 | 3,435 | 3,446,691 |
| 2.75%, 4/25/22 | 2,600 | 2,615,509 |
| 2.976% to 11/5/29, 11/5/30(6) | 5,823 | 5,781,461 |
| 3.142% to 1/24/22, 1/24/23(6) | 3,330 | 3,374,508 |
| 3.887% to 1/10/27, 1/10/28(6) | 16,815 | 17,344,788 |
| Citizens Bank NA, 2.55%, 5/13/21 | 1,400 | 1,398,893 |
| Citizens Financial Group, Inc.: | ||
| 2.375%, 7/28/21 | 1,475 | 1,487,437 |
| 4.15%, 9/28/22(1) | 702 | 719,619 |
| Commonwealth Bank of Australia: | ||
| 2.50%, 9/18/22(1) | 2,120 | 2,104,581 |
| 3.61% to 9/12/29, 9/12/34(1)(6) | 2,947 | 2,677,013 |
| Digital Realty Trust, L.P.: | ||
| 3.95%, 7/1/22 | 3,100 | 3,175,941 |
| 4.75%, 10/1/25 | 2,035 | 2,126,949 |
| Discover Bank: | ||
| 2.70%, 2/6/30 | 2,285 | 1,993,971 |
| 3.45%, 7/27/26 | 1,750 | 1,715,012 |
| 4.682% to 8/9/23, 8/9/28(6) | 9,580 | 9,762,260 |
| Discover Financial Services, 3.95%, 11/6/24 | 1,500 | 1,529,236 |
| EPR Properties, 3.75%, 8/15/29 | 7,750 | 5,813,580 |
| Goldman Sachs Group, Inc. (The): | ||
| 2.905% to 7/24/22, 7/24/23(6) | 3,656 | 3,678,334 |
| 2.908% to 6/5/22, 6/5/23(6) | 7,700 | 7,727,513 |
| HAT Holdings I, LLC/HAT Holdings II, LLC, 5.25%, 7/15/24(1) | 1,568 | 1,515,088 |
| JPMorgan Chase & Co.: | ||
| 2.739% to 10/15/29, 10/15/30(6) | 4,603 | 4,631,944 |
| 3.797% to 7/23/23, 7/23/24(6) | 6,500 | 6,812,455 |
| KKR Group Finance Co. VI, LLC, 3.75%, 7/1/29(1)(5) | 6,840 | 6,841,665 |
| Lloyds Banking Group PLC, 2.438% to 2/5/25, 2/5/26(6) | 5,017 | 4,747,879 |
| Marsh & McLennan Cos., Inc., 2.575%, (3 mo. USD LIBOR + 1.20%), 12/29/21(3) | 1,779 | 1,780,646 |
| Morgan Stanley: | ||
| 0.71%, (SOFR + 0.70%), 1/20/23(3) | 13,439 | 12,549,012 |
| 3.201%, (3 mo. USD LIBOR + 1.40%), 10/24/23(3) | 2,190 | 2,126,903 |
| 4.00%, 7/23/25 | 5,700 | 6,112,089 |
| 4.875%, 11/1/22 | 2,075 | 2,181,450 |
| Security | Principal Amount (000's omitted) | Value |
| Financial (continued) | ||
| National Australia Bank, Ltd., 3.625%, 6/20/23 | $ 2,650 | $ 2,702,249 |
| Nationwide Building Society, 3.96% to 7/18/29, 7/18/30(1)(6) | 3,845 | 3,895,262 |
| PNC Bank NA, 2.70%, 11/1/22 | 5,000 | 5,069,781 |
| PNC Financial Services Group, Inc. (The), 2.20%, 11/1/24 | 34,340 | 35,641,534 |
| Regions Financial Corp., 2.75%, 8/14/22 | 1,198 | 1,186,089 |
| SBA Tower Trust: | ||
| 2.877%, 7/15/46(1) | 2,500 | 2,494,511 |
| 3.722%, 4/9/48(1) | 4,150 | 4,218,673 |
| SITE Centers Corp., 3.625%, 2/1/25 | 4,767 | 4,836,963 |
| Synovus Bank/Columbus GA, 2.289% to 2/10/22, 2/10/23(6) | 9,250 | 9,122,907 |
| Synovus Financial Corp., 3.125%, 11/1/22 | 1,267 | 1,276,800 |
| $318,891,218 | ||
| Government - Multinational — 1.2% | ||
| Asian Development Bank, 3.125%, 9/26/28 | $ 5,500 | $6,464,297 |
| International Bank for Reconstruction & Development, 3.125%, 11/20/25 | 12,050 | 13,614,777 |
| $20,079,074 | ||
| Industrial — 3.7% | ||
| FedEx Corp., 4.55%, 4/1/46 | $ 5,335 | $5,091,099 |
| Jabil, Inc.: | ||
| 3.60%, 1/15/30 | 6,161 | 5,512,866 |
| 3.95%, 1/12/28 | 7,131 | 6,865,434 |
| 4.70%, 9/15/22 | 6,613 | 6,600,736 |
| nVent Finance S.a.r.l., 4.55%, 4/15/28 | 10,846 | 12,124,933 |
| Owens Corning, 3.95%, 8/15/29 | 11,701 | 11,121,448 |
| SMBC Aviation Capital Finance DAC: | ||
| 2.65%, 7/15/21(1) | 2,040 | 2,023,574 |
| 3.00%, 7/15/22(1) | 1,750 | 1,764,888 |
| 3.55%, 4/15/24(1) | 3,200 | 3,421,720 |
| United Parcel Service, Inc., 3.90%, 4/1/25 | 1,043 | 1,131,451 |
| Valmont Industries, Inc., 5.25%, 10/1/54 | 3,846 | 3,815,583 |
| Westinghouse Air Brake Technologies Corp., 2.041%, (3 mo. USD LIBOR + 1.30%), 9/15/21(3) | 4,566 | 4,433,279 |
| $63,907,011 | ||
| Other Revenue — 0.6% | ||
| BlueHub Loan Fund, Inc., 3.099%, 1/1/30 | $ 9,400 | $10,182,071 |
| $10,182,071 | ||
| Technology — 2.7% | ||
| Apple, Inc., 3.00%, 6/20/27 | $ 5,686 | $6,165,639 |
Table of Contents
| Security | Principal Amount (000's omitted) | Value |
| Technology (continued) | ||
| Broadridge Financial Solutions, Inc., 3.95%, 9/1/20 | $ 1,645 | $ 1,650,859 |
| Dell International, LLC/EMC Corp., 4.42%, 6/15/21(1) | 9,570 | 9,675,884 |
| DXC Technology Co.: | ||
| 4.25%, 4/15/24(5) | 879 | 910,797 |
| 4.75%, 4/15/27 | 4,231 | 4,256,538 |
| Hewlett Packard Enterprise Co.: | ||
| 1.464%, (3 mo. USD LIBOR + 0.68%), 3/12/21(3) | 3,026 | 2,928,218 |
| 2.62%, (3 mo. USD LIBOR + 0.72%), 10/5/21(3) | 3,449 | 3,248,634 |
| Microsoft Corp., 4.45%, 11/3/45 | 3,050 | 4,026,850 |
| NXP BV/NXP Funding, LLC: | ||
| 4.625%, 6/15/22(1) | 2,565 | 2,655,357 |
| 4.625%, 6/1/23(1) | 3,900 | 4,019,007 |
| Seagate HDD Cayman: | ||
| 4.875%, 3/1/24 | 2,145 | 2,141,732 |
| 5.75%, 12/1/34 | 2,275 | 2,114,473 |
| Western Digital Corp., 4.75%, 2/15/26 | 3,913 | 3,992,238 |
| $47,786,226 | ||
| Utilities — 2.8% | ||
| American Water Capital Corp., 2.95%, 9/1/27 | $ 3,590 | $3,570,006 |
| Avangrid, Inc.: | ||
| 3.15%, 12/1/24 | 10,620 | 10,584,528 |
| 3.80%, 6/1/29 | 7,100 | 7,283,828 |
| Consolidated Edison Co. of New York, Inc.: | ||
| 3.35%, 4/1/30 | 2,571 | 2,657,354 |
| 4.45%, 6/15/20 | 1,675 | 1,680,741 |
| Enel Finance International NV, 2.65%, 9/10/24(1) | 7,485 | 7,159,700 |
| MidAmerican Energy Co.: | ||
| 3.15%, 4/15/50 | 2,990 | 3,046,194 |
| 4.25%, 7/15/49 | 4,815 | 5,668,967 |
| NextEra Energy Operating Partners, L.P., 4.25%, 9/15/24(1) | 3,561 | 3,494,249 |
| Public Service Co. of Colorado, 3.70%, 6/15/28 | 2,581 | 2,739,660 |
| $47,885,227 | ||
| Total Corporate Bonds (identified cost $764,810,574) | $752,490,519 | |
| Floating Rate Loans(7) — 2.2% |
| Security | Principal Amount (000's omitted) | Value |
| Building and Development — 0.1% | ||
| Cushman & Wakefield U.S. Borrower, LLC, Term Loan, 3.739%, (1 mo. USD LIBOR + 2.75%), 8/21/25 | $ 2,617 | $ 2,355,188 |
| $ 2,355,188 | ||
| Cable and Satellite Television — 0.1% | ||
| Ziggo Financing Partnership, Term Loan, 3.205%, (1 mo. USD LIBOR + 2.50%), 4/30/28 | $ 2,100 | $ 1,960,875 |
| $ 1,960,875 | ||
| Cosmetics/Toiletries — 0.0%(8) | ||
| Prestige Brands, Inc., Term Loan, 2.989%, (1 mo. USD LIBOR + 2.00%), 1/26/24 | $ 546 | $ 512,668 |
| $ 512,668 | ||
| Drugs — 0.2% | ||
| Jaguar Holding Company II, Term Loan, 3.50%, (1 mo. USD LIBOR + 2.50%, Floor 1.00%), 8/18/22 | $ 3,898 | $3,758,467 |
| $3,758,467 | ||
| Electronics/Electrical — 1.0% | ||
| Epicor Software Corporation, Term Loan, 4.25%, (1 mo. USD LIBOR + 3.25%, Floor 1.00%), 6/1/22 | $ 5,650 | $5,240,690 |
| Go Daddy Operating Company, LLC, Term Loan, 2.739%, (1 mo. USD LIBOR + 1.75%), 2/15/24 | 572 | 548,750 |
| Hyland Software, Inc., Term Loan, 4.239%, (1 mo. USD LIBOR + 3.25%), 7/1/24 | 5,343 | 4,991,141 |
| Infor (US), Inc., Term Loan, 3.75%, (1 mo. USD LIBOR + 2.75%, Floor 1.00%), 2/1/22 | 3,890 | 3,771,395 |
| MA FinanceCo., LLC, Term Loan, 3.489%, (1 mo. USD LIBOR + 2.50%), 6/21/24 | 164 | 149,340 |
| Seattle Spinco, Inc., Term Loan, 3.489%, (1 mo. USD LIBOR + 2.50%), 6/21/24 | 1,106 | 1,008,527 |
| SolarWinds Holdings, Inc., Term Loan, 3.739%, (1 mo. USD LIBOR + 2.75%), 2/5/24 | 909 | 847,522 |
| $16,557,365 | ||
| Equipment Leasing — 0.1% | ||
| Avolon TLB Borrower 1 (US), LLC, Term Loan, 2.523%, (1 mo. USD LIBOR + 1.75%), 1/15/25 | $ 1,329 | $1,198,608 |
| $1,198,608 | ||
| Health Care — 0.1% | ||
| Change Healthcare Holdings, LLC, Term Loan, 3.50%, (1 mo. USD LIBOR + 2.50%, Floor 1.00%), 3/1/24 | $ 1,750 | $1,615,721 |
| $1,615,721 | ||
Table of Contents
| Security | Principal Amount (000's omitted) | Value |
| Industrial Equipment — 0.0%(8) | ||
| Rexnord, LLC, Term Loan, 2.679%, (1 mo. USD LIBOR + 1.75%), 8/21/24 | $ 485 | $ 449,258 |
| $ 449,258 | ||
| Insurance — 0.2% | ||
| Asurion, LLC, Term Loan, 3.989%, (1 mo. USD LIBOR + 3.00%), 11/3/23 | $ 4,158 | $ 4,012,546 |
| $ 4,012,546 | ||
| Leisure Goods/Activities/Movies — 0.1% | ||
| Bombardier Recreational Products, Inc., Term Loan, 2.989%, (1 mo. USD LIBOR + 2.00%), 5/24/27 | $ 798 | $ 674,621 |
| $ 674,621 | ||
| Lodging and Casinos — 0.0%(8) | ||
| ESH Hospitality, Inc., Term Loan, 2.989%, (1 mo. USD LIBOR + 2.00%), 9/18/26 | $ 474 | $414,444 |
| $414,444 | ||
| Telecommunications — 0.3% | ||
| CenturyLink, Inc., Term Loan, 3.239%, (1 mo. USD LIBOR + 2.25%), 3/15/27 | $ 2,618 | $2,433,510 |
| Level 3 Financing, Inc., Term Loan, 2.739%, (1 mo. USD LIBOR + 1.75%), 3/1/27 | 811 | 766,252 |
| Sprint Communications, Inc., Term Loan, 3.50%, (1 mo. USD LIBOR + 2.50%), 2/2/24 | 1,857 | 1,849,545 |
| $5,049,307 | ||
| Total Floating Rate Loans (identified cost $41,050,913) | $38,559,068 | |
| High Social Impact Investments — 0.4% |
| Security | Principal Amount (000's omitted) | Value |
| Calvert Impact Capital, Inc., Community Investment Notes, 1.50%, 12/15/20(9)(10) | $ 5,292 | $ 5,100,422 |
| ImpactAssets, Inc., Global Sustainable Agriculture Notes, 3.48%, 11/3/20(10)(11) | 490 | 480,200 |
| ImpactAssets, Inc., Microfinance Plus Notes, 1.20%, 11/3/20(10)(11) | 631 | 613,490 |
| Total High Social Impact Investments (identified cost $6,412,992) | $ 6,194,112 |
| Preferred Stocks — 0.3% |
| Security | Shares | Value |
| Oil, Gas & Consumable Fuels — 0.0%(8) | ||
| NuStar Energy, L.P., Series B, 7.625% to 6/15/22(6) | 96,673 | $ 937,728 |
| $ 937,728 | ||
| Real Estate Management & Development — 0.3% | ||
| Brookfield Property Partners, L.P.: | ||
| Series A, 5.75% | 100,000 | $ 1,400,000 |
| Series A2, 6.375% | 211,400 | 3,369,716 |
| $ 4,769,716 | ||
| Total Preferred Stocks (identified cost $10,040,227) | $ 5,707,444 | |
| Sovereign Government Bonds — 0.2% |
| Security | Principal Amount (000's omitted) | Value |
| Nacional Financiera SNC, 3.375%, 11/5/20(1) | $ 3,450 | $ 3,386,460 |
| Total Sovereign Government Bonds (identified cost $3,449,217) | $ 3,386,460 |
| Taxable Municipal Obligations — 4.3% |
| Security | Principal Amount (000's omitted) | Value |
| General Obligations — 0.8% | ||
| Commonwealth of Massachusetts, 5.456%, 12/1/39(12) | $ 750 | $ 921,803 |
| Los Angeles Unified School District, CA, 5.75%, 7/1/34(12) | 3,750 | 4,824,562 |
| Massachusetts, Green Bonds, 3.277%, 6/1/46 | 3,975 | 4,065,431 |
| New York City, NY, 5.206%, 10/1/31(12) | 1,030 | 1,208,406 |
| San Francisco City and County, CA, (Social Bonds - Affordable Housing, 2016), 3.921%, 6/15/39 | 3,085 | 3,280,990 |
| $ 14,301,192 | ||
| Special Tax Revenue — 1.9% | ||
| California Health Facilities Financing Authority, (No Place Like Home Program): | ||
| 2.361%, 6/1/26 | $ 5,565 | $5,560,938 |
| 2.484%, 6/1/27 | 3,980 | 3,983,264 |
| 2.534%, 6/1/28 | 4,980 | 4,969,791 |
| 2.584%, 6/1/29 | 2,715 | 2,697,895 |
| 2.984%, 6/1/33 | 3,060 | 3,075,759 |
| 3.034%, 6/1/34 | 2,195 | 2,205,821 |
Table of Contents
| Security | Principal Amount (000's omitted) | Value |
| Special Tax Revenue (continued) | ||
| Connecticut, Special Tax Revenue, 5.459%, 11/1/30(12) | $ 3,800 | $ 4,659,636 |
| New York City Transitional Finance Authority, NY, Future Tax Secured Revenue Bonds, 5.767%, 8/1/36(12) | 3,540 | 4,500,119 |
| $ 31,653,223 | ||
| Water and Sewer — 1.6% | ||
| District of Columbia Water & Sewer Authority, Green Bonds, 4.814%, 10/1/2114 | $ 1,170 | $ 1,522,814 |
| Narragansett Bay Commission, RI, Wastewater System Revenue, Green Bonds: | ||
| 2.094%, 9/1/30 | 2,495 | 2,420,175 |
| 2.184%, 9/1/31 | 1,985 | 1,916,676 |
| 2.264%, 9/1/32 | 1,780 | 1,717,771 |
| 2.344%, 9/1/33 | 1,945 | 1,878,714 |
| San Francisco City and County Public Utilities Commission, CA, Water Revenue, Green Bonds, 3.303%, 11/1/39 | 19,705 | 18,462,009 |
| $27,918,159 | ||
| Total Taxable Municipal Obligations (identified cost $73,337,514) | $73,872,574 | |
| U.S. Government Agencies and Instrumentalities — 1.9% |
| Security | Principal Amount (000's omitted) | Value |
| U.S. Department of Housing and Urban Development: | ||
| 2.547%, 8/1/22 | $ 1,558 | $ 1,636,490 |
| 2.618%, 8/1/23 | 778 | 834,939 |
| 2.668%, 8/1/24 | 2,726 | 2,952,438 |
| 2.738%, 8/1/25 | 2,726 | 3,045,511 |
| 3.435%, 8/1/34 | 3,060 | 3,617,731 |
| 3.485%, 8/1/35 | 1,720 | 2,034,979 |
| 3.535%, 8/1/36 | 929 | 1,084,186 |
| 3.585%, 8/1/37 | 3,170 | 3,703,824 |
| 3.635%, 8/1/38 | 657 | 768,342 |
| U.S. International Development Finance Corp.: | ||
| 1.79%, 10/15/29 | 1,812 | 1,899,757 |
| 2.36%, 10/15/29 | 1,500 | 1,601,785 |
| 3.22%, 9/15/29 | 2,593 | 2,873,277 |
| 3.52%, 9/20/32 | 5,814 | 6,657,219 |
| Total U.S. Government Agencies and Instrumentalities (identified cost $30,010,170) | $32,710,478 |
| U.S. Government Agency Mortgage-Backed Securities — 11.7% |
| Security | Principal Amount (000's omitted) | Value |
| Federal National Mortgage Association: | ||
| 30-Year, 2.50%, TBA(13) | $ 45,550 | $ 47,223,905 |
| 30-Year, 3.00%, TBA(13) | 93,225 | 97,775,540 |
| 30-Year, 3.50%, TBA(13) | 18,455 | 19,522,455 |
| Pool #AN1879, 2.65%, with maturity at 6/1/26 | 2,807 | 3,037,502 |
| Pool #AN1909, 2.68%, with maturity at 7/1/26 | 3,000 | 3,245,697 |
| Pool #BM3990, 4.00%, with maturity at 3/1/48 | 9,314 | 9,961,632 |
| Pool #BM5673, 3.50%, with maturity at 11/1/48 | 4,698 | 4,974,848 |
| Pool #MA3149, 4.00%, with maturity at 10/1/47 | 15,931 | 17,039,222 |
| Total U.S. Government Agency Mortgage-Backed Securities (identified cost $199,646,499) | $202,780,801 | |
| U.S. Treasury Obligations — 7.3% |
| Security | Principal Amount (000's omitted) | Value |
| U.S. Treasury Bonds: | ||
| 2.25%, 8/15/49(5) | $ 17,265 | $ 21,010,696 |
| 2.375%, 11/15/49(5) | 16,850 | 21,044,728 |
| 2.875%, 5/15/49 | 9,180 | 12,538,948 |
| U.S. Treasury Inflation-Protected Notes: | ||
| 0.625%, 4/15/23(14) | 8,567 | 8,633,196 |
| 0.75%, 7/15/28(14) | 58,547 | 62,696,622 |
| Total U.S. Treasury Obligations (identified cost $113,018,009) | $ 125,924,190 |
| Short-Term Investments — 2.1% |
| Security | Shares | Value |
| State Street Navigator Securities Lending Government Money Market Portfolio, 0.24%(15) | 35,756,319 | $ 35,756,319 |
| Total Short-Term Investments (identified cost $35,756,319) | $ 35,756,319 | |
| Total Investments — 109.6% (identified cost $1,919,297,286) | $1,899,425,997 | |
| Other Assets, Less Liabilities — (9.6)% | $ (166,190,911) | |
| Net Assets — 100.0% | $1,733,235,086 |
Table of Contents
| The percentage shown for each investment category in the Schedule of Investments is based on net assets. | ||
| (1) | Security is exempt from registration under Rule 144A of the Securities Act of 1933. These securities may be sold in transactions exempt from registration, normally to qualified institutional buyers. Total market value of Rule 144A securities amounts to $535,192,636, which represents 30.9% of the net assets of the Fund as of March 31, 2020. | |
| (2) | Weighted average fixed-rate coupon that changes/updates monthly. Rate shown is the rate at March 31, 2020. | |
| (3) | Variable rate security. The stated interest rate represents the rate in effect at March 31, 2020. | |
| (4) | Step coupon security. The interest rate disclosed is that which is in effect on March 31, 2020. | |
| (5) | All or a portion of this security was on loan at March 31, 2020. The aggregate market value of securities on loan at March 31, 2020 was $35,393,416. | |
| (6) | Security converts to variable rate after the indicated fixed-rate coupon period. | |
| (7) | Remaining maturities of floating rate loans may be less than the stated maturities shown as a result of contractual or optional prepayments by the borrower. Such prepayments cannot be predicted with certainty. Floating rate loans generally pay interest at rates which are periodically re-determined at a spread above the London Interbank Offered Rate (“LIBOR”) or other short-term rates. The rate shown is the rate in effect at March 31, 2020. Floating rate loans are generally considered restrictive in that the Fund is ordinarily contractually obligated to receive consent from the Agent Bank and/or borrower prior to disposition of a floating rate loan. | |
| (8) | Amount is less than 0.05%. |
| (9) | Affiliated company (see Note 8). |
| (10) | Restricted security. Total market value of restricted securities amounts to $6,194,112, which represents 0.4% of the net assets of the Fund as of March 31, 2020. |
| (11) | Notes carry an interest rate that varies by period and is contingent on the performance of the underlying portfolio of loans to borrowers. The coupon rate shown represents the rate in effect at March 31, 2020. |
| (12) | Build America Bond. Represents taxable municipal obligation issued pursuant to the American Recovery and Reinvestment Act of 2009 or other legislation providing for the issuance of taxable municipal debt on which the issuer receives federal support. |
| (13) | TBA (To Be Announced) securities are purchased on a forward commitment basis with an approximate principal amount and no definite maturity date. The actual principal amount and maturity date are determined upon settlement when the specific mortgage pools are assigned. |
| (14) | Inflation-linked security whose principal is adjusted for inflation based on changes in the U.S. Consumer Price Index. Interest is calculated based on the inflation-adjusted principal. |
| (15) | Represents investment of cash collateral received in connection with securities lending. |
| Description | Number of Contracts | Position | Expiration Date | Notional Amount | Value/ Unrealized Appreciation (Depreciation) |
| Interest Rate Futures | |||||
| U.S. 2-Year Treasury Note | 639 | Long | 6/30/20 | $140,824,617 | $1,651,865 |
| U.S. Ultra-Long Treasury Bond | 399 | Long | 6/19/20 | 88,528,125 | 7,729,859 |
| U.S. 5-Year Treasury Note | (267) | Short | 6/30/20 | (33,470,953) | (1,016,311) |
| U.S. Long Treasury Bond | (102) | Short | 6/19/20 | (18,264,375) | (1,264,035) |
| U.S. Ultra 10-Year Treasury Note | (1,189) | Short | 6/19/20 | (185,521,157) | (8,913,687) |
| $(1,812,309) |
| Description | Acquisition Dates | Cost |
| Calvert Impact Capital, Inc., Community Investment Notes, 1.50%, 12/15/20 | 12/13/19 | $5,291,992 |
| ImpactAssets, Inc., Global Sustainable Agriculture Notes, 3.48%, 11/3/20 | 11/13/15 | 490,000 |
| ImpactAssets, Inc., Microfinance Plus Notes, 1.20%, 11/3/20 | 11/13/15 | 631,000 |
Table of Contents
| Abbreviations: | |
| LIBOR | – London Interbank Offered Rate |
| SOFR | – Secured Overnight Financing Rate |
| TBA | – To Be Announced |
| Currency Abbreviations: | |
| USD | – United States Dollar |
Table of Contents
| Common Stocks — 96.0% |
| Security | Shares | Value |
| Beverages — 1.3% | ||
| PepsiCo, Inc. | 383,491 | $ 46,057,269 |
| $ 46,057,269 | ||
| Capital Markets — 4.8% | ||
| Charles Schwab Corp. (The) | 928,428 | $ 31,213,749 |
| Intercontinental Exchange, Inc. | 1,526,520 | 123,266,490 |
| S&P Global, Inc. | 76,522 | 18,751,716 |
| $ 173,231,955 | ||
| Chemicals — 7.1% | ||
| Ecolab, Inc. | 831,296 | $129,540,856 |
| Linde PLC | 723,073 | 125,091,629 |
| $254,632,485 | ||
| Electronic Equipment, Instruments & Components — 2.9% | ||
| Amphenol Corp., Class A | 1,084,054 | $79,005,855 |
| TE Connectivity, Ltd. | 379,021 | 23,870,743 |
| $102,876,598 | ||
| Entertainment — 1.7% | ||
| Electronic Arts, Inc.(1) | 371,894 | $37,252,622 |
| Walt Disney Co. (The) | 262,295 | 25,337,697 |
| $62,590,319 | ||
| Equity Real Estate Investment Trusts (REITs) — 5.2% | ||
| American Tower Corp. | 598,719 | $130,371,062 |
| Crown Castle International Corp. | 381,431 | 55,078,637 |
| $185,449,699 | ||
| Food Products — 1.2% | ||
| Mondelez International, Inc., Class A | 861,422 | $43,140,014 |
| $43,140,014 | ||
| Health Care Equipment & Supplies — 4.8% | ||
| Danaher Corp. | 1,238,876 | $171,472,827 |
| $171,472,827 | ||
| Health Care Providers & Services — 1.3% | ||
| Laboratory Corp. of America Holdings(1) | 363,677 | $45,965,136 |
| $45,965,136 | ||
| Hotels, Restaurants & Leisure — 1.5% | ||
| Starbucks Corp. | 816,553 | $53,680,194 |
| $53,680,194 | ||
| Security | Shares | Value |
| Industrial Conglomerates — 0.9% | ||
| 3M Co. | 231,278 | $ 31,571,760 |
| $ 31,571,760 | ||
| Insurance — 2.9% | ||
| Aon PLC | 203,547 | $ 33,593,397 |
| Marsh & McLennan Cos., Inc. | 808,349 | 69,889,854 |
| $ 103,483,251 | ||
| Interactive Media & Services — 4.6% | ||
| Alphabet, Inc., Class C(1) | 142,809 | $ 166,059,733 |
| $166,059,733 | ||
| IT Services — 14.8% | ||
| Accenture PLC, Class A | 211,832 | $34,583,692 |
| Fidelity National Information Services, Inc. | 690,797 | 84,028,547 |
| Fiserv, Inc.(1) | 1,057,148 | 100,418,488 |
| Gartner, Inc.(1) | 277,440 | 27,624,701 |
| MasterCard, Inc., Class A | 491,851 | 118,811,528 |
| Visa, Inc., Class A | 1,016,364 | 163,756,568 |
| $529,223,524 | ||
| Life Sciences Tools & Services — 5.8% | ||
| QIAGEN NV(1) | 861,422 | $35,835,155 |
| Thermo Fisher Scientific, Inc. | 601,667 | 170,632,761 |
| $206,467,916 | ||
| Machinery — 4.0% | ||
| IDEX Corp. | 451,107 | $62,302,388 |
| Xylem, Inc. | 1,234,081 | 80,375,695 |
| $142,678,083 | ||
| Multiline Retail — 3.9% | ||
| Dollar General Corp. | 920,167 | $138,954,419 |
| $138,954,419 | ||
| Personal Products — 1.6% | ||
| Estee Lauder Cos., Inc. (The), Class A | 352,088 | $56,101,702 |
| $56,101,702 | ||
| Pharmaceuticals — 3.5% | ||
| Zoetis, Inc. | 1,059,666 | $124,712,092 |
| $124,712,092 | ||
| Professional Services — 5.3% | ||
| IHS Markit, Ltd. | 1,204,739 | $72,284,340 |
Table of Contents
| Security | Shares | Value |
| Professional Services (continued) | ||
| Verisk Analytics, Inc. | 840,054 | $ 117,086,727 |
| $ 189,371,067 | ||
| Semiconductors & Semiconductor Equipment — 1.0% | ||
| Texas Instruments, Inc. | 366,195 | $ 36,593,866 |
| $ 36,593,866 | ||
| Software — 9.8% | ||
| Check Point Software Technologies, Ltd.(1) | 927,558 | $ 93,256,681 |
| Intuit, Inc. | 375,381 | 86,337,630 |
| Microsoft Corp. | 1,079,594 | 170,262,770 |
| $349,857,081 | ||
| Specialty Retail — 4.8% | ||
| Lowe's Cos., Inc. | 1,004,775 | $86,460,889 |
| O'Reilly Automotive, Inc.(1) | 112,437 | 33,849,159 |
| TJX Cos., Inc. (The) | 1,061,968 | 50,772,690 |
| $171,082,738 | ||
| Textiles, Apparel & Luxury Goods — 1.3% | ||
| NIKE, Inc., Class B | 559,576 | $46,299,318 |
| $46,299,318 | ||
| Venture Capital — 0.0%(2) | ||
| 20/20 Gene Systems, Inc.(1)(3)(4) | 73,397 | $65,764 |
| Digital Directions International, Inc.(1)(3)(4) | 354,389 | 53,867 |
| Ivy Capital (Proprietary) Ltd.(1)(3)(4) | 950,000 | 186,967 |
| Napo Pharmaceuticals, Inc.(1)(3)(4) | 294,196 | — |
| $306,598 | ||
| Total Common Stocks (identified cost $2,639,610,234) | $3,431,859,644 | |
| High Social Impact Investments — 0.4% |
| Security | Principal Amount (000's omitted) | Value |
| Calvert Impact Capital, Inc., Community Investment Notes, 1.50%, 12/15/20(4)(5) | $ 11,181 | $ 10,775,994 |
| ImpactAssets, Inc., Global Sustainable Agriculture Notes, 3.48%, 11/3/20(4)(6) | 1,445 | 1,416,100 |
| ImpactAssets, Inc., Microfinance Plus Notes, 1.20%, 11/3/20(4)(6) | 1,855 | 1,803,524 |
| Total High Social Impact Investments (identified cost $14,480,737) | $ 13,995,618 |
| Preferred Stocks — 0.0%(2) |
| Security | Shares | Value |
| Venture Capital — 0.0%(2) | ||
| Entouch: | ||
| Series C(1)(3)(4) | 2,628,278 | $ 162,533 |
| Series C-1(1)(3)(4) | 1,023,444 | 198,794 |
| PresenceLearning, Inc.: | ||
| Series A(1)(3)(4) | 600,000 | 345,600 |
| Series A-2(1)(3)(4) | 195,285 | 114,046 |
| Series B(1)(3)(4) | 399,719 | 259,018 |
| Sword Diagnostics(1)(3)(4) | 1,264,108 | — |
| Total Preferred Stocks (identified cost $1,638,703) | $1,079,991 | |
| Venture Capital Debt Obligations — 0.0%(2) |
| Security | Principal Amount (000's omitted) | Value |
| SEAF Global SME Facility, 9.00%, 1/1/21(3)(4) | $ 2,076 | $ 416,045 |
| Total Venture Capital Debt Obligations (identified cost $2,075,575) | $ 416,045 |
| Venture Capital Limited Partnership Interests — 0.4% |
| Security | Value | |
| Accion Frontier Inclusion Fund L.P.(1)(3)(4) | $ 985,947 | |
| Adobe Capital Social Mezzanine I L.P.(1)(3)(4) | 306,839 | |
| Africa Renewable Energy Fund L.P.(1)(3)(4) | 891,286 | |
| Arborview Capital Partners L.P.(1)(3)(4) | 774,593 | |
| Blackstone Clean Technology Partners L.P.(1)(3)(4) | 23,603 | |
| Bridges Ventures US Sustainable Growth Fund L.P.(1)(3)(4) | 537,792 | |
| China Environment Fund III L.P.(1)(3)(4) | 156,387 | |
| Coastal Ventures III L.P.(1)(3)(4) | 138,100 | |
| Core Innovations Capital I L.P.(1)(3)(4) | 3,483,775 | |
| Cross Culture Ventures I L.P.(1)(3)(4) | 408,586 | |
| DBL Equity Fund - BAEF Il L.P.(1)(3)(4) | 778,660 | |
| DBL Partners III L.P.(1)(3)(4) | 721,299 | |
| First Analysis Private Equity Fund V L.P.(1)(3)(4) | 985,615 | |
| Ignia Fund I L.P.(1)(3)(4) | 306,553 | |
| Impact Ventures II L.P.(1)(3)(4) | 183,571 | |
| LeapFrog Financial Inclusion Fund(1)(3)(4) | 122,874 | |
| New Markets Education Partners L.P.(1)(3)(4) | 197,095 | |
| New Markets Venture Partners II L.P.(1)(3)(4) | 90,816 | |
| Owl Ventures L.P.(1)(3)(4) | 571,117 | |
| Renewable Energy Asia Fund L.P.(1)(3)(4) | 1,271,444 | |
| SEAF India International Growth Fund L.P.(1)(3)(4) | 550 | |
| SJF Ventures II L.P., Preferred(1)(3)(4) | 476,392 |
Table of Contents
| Security | Value | |
| SJF Ventures III L.P.(1)(3)(4) | $ 848,677 | |
| Westly Capital Partners Fund II L.P.(1)(3)(4) | 468,267 | |
| Total Venture Capital Limited Partnership Interests (identified cost $12,763,556) | $ 14,729,838 | |
| Total Investments — 96.8% (identified cost $2,670,568,805) | $3,462,081,136 | |
| Other Assets, Less Liabilities — 3.2% | $ 113,918,829 | |
| Net Assets — 100.0% | $3,575,999,965 |
| The percentage shown for each investment category in the Schedule of Investments is based on net assets. | ||
| (1) | Non-income producing security. | |
| (2) | Amount is less than 0.05%. | |
| (3) | For fair value measurement disclosure purposes, security is categorized as Level 3 (see Note 1A). | |
| (4) | Restricted security. Total market value of restricted securities amounts to $30,528,090, which represents 0.9% of the net assets of the Fund as of March 31, 2020. | |
| (5) | Affiliated company (see Note 8). | |
| (6) | Notes carry an interest rate that varies by period and is contingent on the performance of the underlying portfolio of loans to borrowers. The coupon rate shown represents the rate in effect at March 31, 2020. | |
| Description | Acquisition Dates | Cost |
| 20/20 Gene Systems, Inc. | 8/1/08-8/27/13 | $166,889 |
| Accion Frontier Inclusion Fund L.P. | 11/12/15-1/14/20 | 752,914 |
| Adobe Capital Social Mezzanine I L.P. | 2/8/13-1/10/20 | 312,257 |
| Africa Renewable Energy Fund L.P. | 4/17/14-5/22/19 | 986,582 |
| Arborview Capital Partners L.P. | 11/13/12-1/27/20 | 602,373 |
| Blackstone Clean Technology Partners L.P. | 7/29/10-6/25/15 | 436,786 |
| Bridges Ventures US Sustainable Growth Fund L.P. | 6/18/16-3/20/20 | 651,350 |
| Calvert Impact Capital, Inc., Community Investment Notes, 1.50%, 12/15/20 | 12/13/19 | 11,180,737 |
| China Environment Fund III L.P. | 1/24/08-4/19/13 | 688,450 |
| Coastal Ventures III L.P. | 7/30/12-1/9/19 | 125,067 |
| Core Innovations Capital I L.P. | 1/6/11-6/30/17 | 314,217 |
| Cross Culture Ventures I L.P. | 2/24/16-3/5/20 | 392,925 |
| DBL Equity Fund - BAEF Il L.P. | 3/30/11-8/2/16 | 697,586 |
| DBL Partners III L.P. | 1/16/15-1/17/20 | 779,547 |
| Digital Directions International, Inc. | 7/2/08-7/15/09 | 683,778 |
| Entouch, Series C, Preferred | 2/3/16 | 350,000 |
| Entouch, Series C-1, Preferred | 10/11/17-11/5/19 | 136,289 |
| First Analysis Private Equity Fund V L.P. | 6/7/13-6/13/18 | 607,470 |
| Ignia Fund I L.P. | 1/28/10-12/9/16 | 989,801 |
| Impact Ventures II L.P. | 9/8/10-2/5/18 | 838,672 |
| ImpactAssets, Inc., Global Sustainable Agriculture Notes, 3.48%, 11/3/20 | 11/13/15 | 1,445,000 |
| ImpactAssets, Inc., Microfinance Plus Notes, 1.20%, 11/3/20 | 11/13/15 | 1,855,000 |
| Ivy Capital (Proprietary) Ltd. | 9/12/12-5/14/14 | 557,372 |
| LeapFrog Financial Inclusion Fund | 1/20/10-1/23/19 | 7,317 |
| Napo Pharmaceuticals, Inc. | 2/21/07-9/23/09 | 419,720 |
| New Markets Education Partners L.P. | 9/27/11-7/11/19 | 6,302 |
| New Markets Venture Partners II L.P. | 7/21/08-5/3/16 | — |
| Owl Ventures L.P. | 7/10/14-3/20/20 | 304,628 |
| PresenceLearning, Inc., Series A, Preferred | 9/29/11 | 300,000 |
| PresenceLearning, Inc., Series A-2, Preferred | 5/2/12 | 134,942 |
| PresenceLearning, Inc., Series B, Preferred | 4/4/13 | 285,000 |
| Renewable Energy Asia Fund L.P. | 9/29/10-1/5/17 | 1,753,943 |
| SEAF Global SME Facility , 9.00%, 1/1/21 | 6/28/13-1/8/19 | 2,075,575 |
Table of Contents
| Description | Acquisition Dates | Cost |
| SEAF India International Growth Fund L.P. | 3/22/05-5/24/10 | $210,391 |
| SJF Ventures II L.P., Preferred | 2/14/06-11/20/12 | — |
| SJF Ventures III L.P. | 2/6/12-7/14/17 | 537,341 |
| Sword Diagnostics, Preferred | 12/26/06-11/9/10 | 432,472 |
| Westly Capital Partners Fund II L.P. | 12/27/11-12/18/18 | 767,637 |
Table of Contents
| March 31, 2020 | |||
| Balanced Fund | Bond Fund | Equity Fund | |
| Assets | |||
| Investments in securities of unaffiliated issuers, at value (identified cost $797,262,830, $1,914,005,294 and $2,659,388,068, respectively) - including $1,142,271, $35,393,416 and $0, respectively, of securities on loan | $817,171,543 | $1,894,325,575 | $3,451,305,142 |
| Investments in securities of affiliated issuers, at value (identified cost $2,615,531, $5,291,992 and $11,180,737, respectively) | 2,534,302 | 5,100,422 | 10,775,994 |
| Cash | 26,346,976 | 42,135,573 | 118,398,471 |
| Cash denominated in foreign currency, at value (cost $0, $0 and $49,267, respectively) | — | — | 50,076 |
| Receivable for investments sold | 8,678,133 | — | 2,424,075 |
| Receivable for capital shares sold | 1,106,076 | 4,381,271 | 28,294,336 |
| Dividends and interest receivable | 2,109,629 | 9,273,159 | 1,602,113 |
| Interest receivable - affiliated | 11,443 | 23,152 | 48,916 |
| Securities lending income receivable | 6,104 | 2,645 | 3,896 |
| Receivable from affiliate | 50,935 | 149,255 | — |
| Deposits at broker for futures contracts | 932,782 | 1,874,918 | — |
| Trustees' deferred compensation plan | 413,458 | 622,191 | 1,367,351 |
| Other assets | — | — | 210,000 |
| Total assets | $859,361,381 | $1,957,888,161 | $3,614,480,370 |
| Liabilities | |||
| Payable for variation margin on open futures contracts | $232,030 | $725,965 | $— |
| Payable for open forward foreign currency exchange contracts | 1,465 | — | — |
| Payable for investments purchased | 14,570,928 | 17,495,938 | 15,935,670 |
| Payable for when-issued/delayed delivery/forward commitment securities | 29,075,816 | 162,421,968 | — |
| Payable for capital shares redeemed | 3,143,490 | 5,861,836 | 17,834,656 |
| Distributions payable | — | 428,932 | — |
| Deposits for securities loaned | 1,183,348 | 35,756,319 | — |
| Payable to affiliates: | |||
| Investment advisory fee | 282,733 | 451,896 | 1,396,110 |
| Administrative fee | 84,825 | 183,487 | 365,444 |
| Distribution and service fees | 166,974 | 64,979 | 398,389 |
| Sub-transfer agency fee | 13,230 | 6,978 | 25,652 |
| Trustees' deferred compensation plan | 413,458 | 622,191 | 1,367,351 |
| Accrued expenses | 408,457 | 632,586 | 1,157,133 |
| Total liabilities | $49,576,754 | $224,653,075 | $38,480,405 |
| Commitments and contingent liabilities (Note 10) | |||
| Net Assets | $809,784,627 | $1,733,235,086 | $3,575,999,965 |
| Sources of Net Assets | |||
| Paid-in capital | $802,831,996 | $1,738,068,640 | $2,716,559,420 |
| Distributable earnings (Accumulated loss) | 6,952,631 | (4,833,554) | 859,440,545 |
| Total | $809,784,627 | $1,733,235,086 | $3,575,999,965 |
| Class A Shares | |||
| Net Assets | $566,112,472 | $298,303,588 | $1,409,424,866 |
| Shares Outstanding | 18,547,734 | 18,562,574 | 29,567,048 |
| Net Asset Value and Redemption Price Per Share (net assets ÷ shares of beneficial interest outstanding) | $30.52 | $16.07 | $47.67 |
| Maximum Offering Price Per Share (100 ÷ 95.25, 96.25 and 95.25, respectively, of net asset value per share) | $32.04 | $16.70 | $50.05 |
Table of Contents
| March 31, 2020 | |||
| Balanced Fund | Bond Fund | Equity Fund | |
| Class C Shares | |||
| Net Assets | $55,802,734 | $15,947,396 | $104,125,588 |
| Shares Outstanding | 1,893,352 | 999,270 | 4,079,844 |
| Net Asset Value and Offering Price Per Share* (net assets ÷ shares of beneficial interest outstanding) | $29.47 | $15.96 | $25.52 |
| Class I Shares | |||
| Net Assets | $185,253,099 | $1,162,226,265 | $1,938,361,220 |
| Shares Outstanding | 5,946,020 | 72,184,246 | 34,760,515 |
| Net Asset Value, Offering Price and Redemption Price Per Share (net assets ÷ shares of beneficial interest outstanding) | $31.16 | $16.10 | $55.76 |
| Class R6 Shares | |||
| Net Assets | $2,616,322 | $256,757,837 | $124,088,291 |
| Shares Outstanding | 83,995 | 15,959,047 | 2,229,789 |
| Net Asset Value, Offering Price and Redemption Price Per Share (net assets ÷ shares of beneficial interest outstanding) | $31.15 | $16.09 | $55.65 |
| On sales of $50,000 or more, the offering price of Class A shares is reduced. | |
| * | Redemption price per share is equal to the net asset value less any applicable contingent deferred sales charge. |
Table of Contents
| Six Months Ended March 31, 2020 | |||
| Balanced Fund | Bond Fund | Equity Fund | |
| Investment Income | |||
| Dividend income (net of foreign taxes withheld of $28,944, $0 and $0, respectively) | $4,074,940 | $66,539 | $17,439,928 |
| Interest and other income - unaffiliated issuers (net of foreign taxes withheld of $47, $0 and $0, respectively) | 5,343,569 | 26,958,697 | 632,846 |
| Interest income - affiliated issuers | 23,887 | 37,990 | 80,515 |
| Securities lending income, net | 7,876 | 10,049 | 15,907 |
| Total investment income | $9,450,272 | $27,073,275 | $18,169,196 |
| Expenses | |||
| Investment advisory fee | $1,721,815 | $2,615,020 | $8,433,447 |
| Administrative fee | 517,189 | 1,061,388 | 2,218,703 |
| Distribution and service fees: | |||
| Class A | 758,883 | 299,621 | 2,043,482 |
| Class C | 295,031 | 80,219 | 547,402 |
| Trustees' fees and expenses | 24,252 | 51,557 | 103,389 |
| Custodian fees | 2,213 | 2,196 | 42,065 |
| Transfer agency fees and expenses | 411,426 | 703,599 | 1,569,394 |
| Accounting fees | 186,581 | 204,126 | 314,926 |
| Professional fees | 42,855 | 55,838 | 131,562 |
| Registration fees | 44,595 | 105,371 | 124,855 |
| Reports to shareholders | 20,746 | 49,843 | 68,490 |
| Miscellaneous | 46,405 | 68,210 | 131,423 |
| Total expenses | $4,071,991 | $5,296,988 | $15,729,138 |
| Waiver and/or reimbursement of expenses by affiliate | $(50,935) | $(292,824) | $— |
| Reimbursement of expenses - other | (11,968) | (23,979) | (51,959) |
| Net expenses | $4,009,088 | $4,980,185 | $15,677,179 |
| Net investment income | $5,441,184 | $22,093,090 | $2,492,017 |
| Realized and Unrealized Gain (Loss) | |||
| Net realized gain (loss): | |||
| Investment securities - unaffiliated issuers | $(7,770,006) | $17,657,423 | $67,238,517 |
| Futures contracts | (113,008) | 225,652 | — |
| Foreign currency transactions | 3,678 | — | (284) |
| Net realized gain (loss) | $(7,879,336) | $17,883,075 | $67,238,233 |
| Change in unrealized appreciation (depreciation): | |||
| Investment securities - unaffiliated issuers | $(75,382,520) | $(68,887,582) | $(439,517,708) |
| Investment securities - affiliated issuers | (75,653) | (164,658) | (347,432) |
| Futures contracts | 193,593 | (567,336) | — |
| Foreign currency | (4,730) | — | 2,068 |
| Forward foreign currency exchange contracts | (1,465) | — | — |
| Net change in unrealized appreciation (depreciation) | $(75,270,775) | $(69,619,576) | $(439,863,072) |
| Net realized and unrealized loss | $(83,150,111) | $(51,736,501) | $(372,624,839) |
| Net decrease in net assets from operations | $(77,708,927) | $(29,643,411) | $(370,132,822) |
Table of Contents
| Six Months Ended March 31, 2020 (Unaudited) | |||
| Balanced Fund | Bond Fund | Equity Fund | |
| Increase (Decrease) in Net Assets | |||
| From operations: | |||
| Net investment income | $5,441,184 | $22,093,090 | $2,492,017 |
| Net realized gain (loss) | (7,879,336) | 17,883,075 | 67,238,233 |
| Net change in unrealized appreciation (depreciation) | (75,270,775) | (69,619,576) | (439,863,072) |
| Net decrease in net assets from operations | $(77,708,927) | $(29,643,411) | $(370,132,822) |
| Distributions to shareholders: | |||
| Class A | $(17,972,444) | $(6,194,849) | $(47,595,453) |
| Class C | (1,475,658) | (268,964) | (5,455,264) |
| Class I | (4,529,577) | (25,638,571) | (47,850,884) |
| Class R6 | (27,504) | (5,659,483) | (2,373,530) |
| Total distributions to shareholders | $(24,005,183) | $(37,761,867) | $(103,275,131) |
| Capital share transactions: | |||
| Class A | $17,345,007 | $18,631,586 | $(1,271,178) |
| Class C | 8,972,972 | 1,213,952 | 20,507,781 |
| Class I | 67,453,499 | 63,367,922 | 650,936,978 |
| Class R6 | 2,730,568 | 14,161,160 | 82,194,766 |
| Net increase in net assets from capital share transactions | $96,502,046 | $97,374,620 | $752,368,347 |
| Net increase (decrease) in net assets | $(5,212,064) | $29,969,342 | $278,960,394 |
| Net Assets | |||
| At beginning of period | $814,996,691 | $1,703,265,744 | $3,297,039,571 |
| At end of period | $809,784,627 | $1,733,235,086 | $3,575,999,965 |
Table of Contents
| Year Ended September 30, 2019 | |||
| Balanced Fund | Bond Fund | Equity Fund | |
| Increase (Decrease) in Net Assets | |||
| From operations: | |||
| Net investment income | $10,112,336 | $37,505,177 | $4,995,350 |
| Net realized gain | 24,517,532 | 19,407,218 | 134,353,183 |
| Net change in unrealized appreciation (depreciation) | 28,412,480 | 67,925,554 | 332,597,082 |
| Net increase in net assets from operations | $63,042,348 | $124,837,949 | $471,945,615 |
| Distributions to shareholders: | |||
| Class A | $(26,688,009) | $(7,079,822) | $(95,599,648) |
| Class C | (2,389,091) | (308,552) | (18,603,392) |
| Class I | (5,151,367) | (26,215,685) | (66,358,860) |
| Class R6 | (939)(1) | (4,396,773) | (73,704) |
| Total distributions to shareholders | $(34,229,406) | $(38,000,832) | $(180,635,604) |
| Capital share transactions: | |||
| Class A | $25,713,763 | $22,867,177 | $145,467,718 |
| Class C | (7,680,231) | (7,541,275) | (49,676,109) |
| Class I | 35,917,958 | 391,521,360 | 443,897,317 |
| Class R6 | 228,488(1) | 109,689,269 | 54,462,701 |
| Net increase in net assets from capital share transactions | $54,179,978 | $516,536,531 | $594,151,627 |
| Net increase in net assets | $82,992,920 | $603,373,648 | $885,461,638 |
| Net Assets | |||
| At beginning of year | $732,003,771 | $1,099,892,096 | $2,411,577,933 |
| At end of year | $814,996,691 | $1,703,265,744 | $3,297,039,571 |
| (1) | For the period from the commencement of operations, February 1, 2019, to September 30, 2019. |
Table of Contents
| Balanced Fund — Class A | ||||||
| Six Months Ended March 31, 2020 (Unaudited) | Year Ended September 30, | |||||
| 2019 | 2018 | 2017 | 2016 | 2015 | ||
| Net asset value — Beginning of period | $34.28 | $33.14 | $32.59 | $30.82 | $31.90 | $33.06 |
| Income (Loss) From Operations | ||||||
| Net investment income(1) | $0.22 | $0.44 | $0.43 | $0.47 | $0.51(2) | $0.43 |
| Net realized and unrealized gain (loss) | (3.00) | 2.24 | 2.68 | 2.11 | 2.14(3) | (0.81) |
| Total income (loss) from operations | $(2.78) | $2.68 | $3.11 | $2.58 | $2.65 | $(0.38) |
| Less Distributions | ||||||
| From net investment income | $(0.22) | $(0.44) | $(0.44) | $(0.46) | $(0.50) | $(0.41) |
| From net realized gain | (0.76) | (1.10) | (2.12) | (0.35) | (3.23) | (0.37) |
| Total distributions | $(0.98) | $(1.54) | $(2.56) | $(0.81) | $(3.73) | $(0.78) |
| Net asset value — End of period | $30.52 | $34.28 | $33.14 | $32.59 | $30.82 | $31.90 |
| Total Return(4) | (8.38)%(5) | 8.56% | 10.01% | 8.51% | 8.93%(3) | (1.27)% |
| Ratios/Supplemental Data | ||||||
| Net assets, end of period (000’s omitted) | $566,112 | $619,744 | $571,452 | $549,517 | $592,625 | $569,368 |
| Ratios (as a percentage of average daily net assets):(6) | ||||||
| Total expenses | 0.94%(7) | 0.96% | 0.96% | 0.99% | 1.05% | 1.13% |
| Net expenses | 0.93%(7) | 0.93% | 0.94% | 0.99% | 1.02% | 1.13% |
| Net investment income | 1.27%(7) | 1.37% | 1.33% | 1.48% | 1.67%(2) | 1.25% |
| Portfolio Turnover | 49%(5)(8) | 69%(8) | 76% | 128% | 146% | 99% |
| (1) | Computed using average shares outstanding. |
| (2) | Amount includes a non-recurring refund for overbilling of prior years' custody out-of-pocket fees. This amounted to $0.007 per share and 0.02% of average net assets. |
| (3) | Total return includes voluntary reimbursement by the adviser for realized investment losses relating to two trading errors which amounted to $0.01 per share. Excluding such payment, the total return would have been 8.90%. |
| (4) | Returns are historical and are calculated by determining the percentage change in net asset value with all distributions reinvested and do not reflect the effect of sales charges, if any. |
| (5) | Not annualized. |
| (6) | Total expenses do not reflect amounts reimbursed and/or waived by the adviser and certain of its affiliates, if applicable. Net expenses are net of all reductions and represent the net expenses paid by the Fund. |
| (7) | Annualized. |
| (8) | Includes the effect of To-Be-Announced (TBA) transactions. |
Table of Contents
| Balanced Fund — Class C | ||||||
| Six Months Ended March 31, 2020 (Unaudited) | Year Ended September 30, | |||||
| 2019 | 2018 | 2017 | 2016 | 2015 | ||
| Net asset value — Beginning of period | $33.14 | $32.09 | $31.63 | $29.95 | $31.11 | $32.30 |
| Income (Loss) From Operations | ||||||
| Net investment income(1) | $0.08 | $0.20 | $0.18 | $0.20 | $0.25(2) | $0.15 |
| Net realized and unrealized gain (loss) | (2.89) | 2.15 | 2.61 | 2.06 | 2.08(3) | (0.78) |
| Total income (loss) from operations | $(2.81) | $2.35 | $2.79 | $2.26 | $2.33 | $(0.63) |
| Less Distributions | ||||||
| From net investment income | $(0.10) | $(0.20) | $(0.21) | $(0.23) | $(0.26) | $(0.19) |
| From net realized gain | (0.76) | (1.10) | (2.12) | (0.35) | (3.23) | (0.37) |
| Total distributions | $(0.86) | $(1.30) | $(2.33) | $(0.58) | $(3.49) | $(0.56) |
| Net asset value — End of period | $29.47 | $33.14 | $32.09 | $31.63 | $29.95 | $31.11 |
| Total Return(4) | (8.73)%(5) | 7.77% | 9.14% | 7.66% | 8.05%(3) | (2.08)% |
| Ratios/Supplemental Data | ||||||
| Net assets, end of period (000’s omitted) | $55,803 | $54,062 | $60,674 | $61,205 | $59,242 | $55,180 |
| Ratios (as a percentage of average daily net assets):(6) | ||||||
| Total expenses | 1.70%(7) | 1.71% | 1.71% | 1.80% | 1.86% | 1.92% |
| Net expenses | 1.68%(7) | 1.68% | 1.69% | 1.80% | 1.84% | 1.92% |
| Net investment income | 0.51%(7) | 0.63% | 0.58% | 0.67% | 0.85%(2) | 0.47% |
| Portfolio Turnover | 49%(5)(8) | 69%(8) | 76% | 128% | 146% | 99% |
| (1) | Computed using average shares outstanding. |
| (2) | Amount includes a non-recurring refund for overbilling of prior years' custody out-of-pocket fees. This amounted to $0.007 per share and 0.02% of average net assets. |
| (3) | Total return includes voluntary reimbursement by the adviser for realized investment losses relating to two trading errors which amounted to $0.01 per share. Excluding such payment, the total return would have been 8.02%. |
| (4) | Returns are historical and are calculated by determining the percentage change in net asset value with all distributions reinvested and do not reflect the effect of sales charges, if any. |
| (5) | Not annualized. |
| (6) | Total expenses do not reflect amounts reimbursed and/or waived by the adviser and certain of its affiliates, if applicable. Net expenses are net of all reductions and represent the net expenses paid by the Fund. |
| (7) | Annualized. |
| (8) | Includes the effect of To-Be-Announced (TBA) transactions. |
Table of Contents
| Balanced Fund — Class I | ||||||
| Six Months Ended March 31, 2020 (Unaudited) | Year Ended September 30, | |||||
| 2019 | 2018 | 2017 | 2016 | 2015 | ||
| Net asset value — Beginning of period | $34.97 | $33.77 | $33.14 | $31.32 | $32.36 | $33.53 |
| Income (Loss) From Operations | ||||||
| Net investment income(1) | $0.27 | $0.54 | $0.55 | $0.58 | $0.63(2) | $0.59 |
| Net realized and unrealized gain (loss) | (3.06) | 2.28 | 2.72 | 2.18 | 2.17(3) | (0.82) |
| Total income (loss) from operations | $(2.79) | $2.82 | $3.27 | $2.76 | $2.80 | $(0.23) |
| Less Distributions | ||||||
| From net investment income | $(0.26) | $(0.52) | $(0.52) | $(0.59) | $(0.61) | $(0.57) |
| From net realized gain | (0.76) | (1.10) | (2.12) | (0.35) | (3.23) | (0.37) |
| Total distributions | $(1.02) | $(1.62) | $(2.64) | $(0.94) | $(3.84) | $(0.94) |
| Net asset value — End of period | $31.16 | $34.97 | $33.77 | $33.14 | $31.32 | $32.36 |
| Total Return(4) | (8.26)%(5) | 8.87% | 10.33% | 8.94% | 9.32%(3) | (0.86)% |
| Ratios/Supplemental Data | ||||||
| Net assets, end of period (000’s omitted) | $185,253 | $140,961 | $99,878 | $48,780 | $15,554 | $13,894 |
| Ratios (as a percentage of average daily net assets):(6) | ||||||
| Total expenses | 0.69%(7) | 0.71% | 0.72% | 0.67% | 0.76% | 0.64% |
| Net expenses | 0.68%(7) | 0.66% | 0.62% | 0.62% | 0.65% | 0.64% |
| Net investment income | 1.51%(7) | 1.64% | 1.66% | 1.80% | 2.04%(2) | 1.70% |
| Portfolio Turnover | 49%(5)(8) | 69%(8) | 76% | 128% | 146% | 99% |
| (1) | Computed using average shares outstanding. |
| (2) | Amount includes a non-recurring refund for overbilling of prior years' custody out-of-pocket fees. This amounted to $0.007 per share and 0.02% of average net assets. |
| (3) | Total return includes voluntary reimbursement by the adviser for realized investment losses relating to two trading errors which amounted to $0.01 per share. Excluding such payment, the total return would have been 9.28%. |
| (4) | Returns are historical and are calculated by determining the percentage change in net asset value with all distributions reinvested and do not reflect the effect of sales charges, if any. |
| (5) | Not annualized. |
| (6) | Total expenses do not reflect amounts reimbursed and/or waived by the adviser and certain of its affiliates, if applicable. Net expenses are net of all reductions and represent the net expenses paid by the Fund. |
| (7) | Annualized. |
| (8) | Includes the effect of To-Be-Announced (TBA) transactions. |
Table of Contents
| Balanced Fund — Class R6 | ||
| Six Months Ended March 31, 2020 (Unaudited) | Period Ended September 30, 2019(1) | |
| Net asset value — Beginning of period | $34.98 | $31.46 |
| Income (Loss) From Operations | ||
| Net investment income(2) | $0.27 | $0.36 |
| Net realized and unrealized gain (loss) | (3.06) | 3.55 |
| Total income (loss) from operations | $(2.79) | $3.91 |
| Less Distributions | ||
| From net investment income | $(0.28) | $(0.39) |
| From net realized gain | (0.76) | — |
| Total distributions | $(1.04) | $(0.39) |
| Net asset value — End of period | $31.15 | $34.98 |
| Total Return(3)(4) | (8.22)% | 12.44% |
| Ratios/Supplemental Data | ||
| Net assets, end of period (000’s omitted) | $2,616 | $230 |
| Ratios (as a percentage of average daily net assets):(5) | ||
| Total expenses(6) | 0.66% | 0.66% |
| Net expenses(6) | 0.64% | 0.64% |
| Net investment income(6) | 1.56% | 1.58% |
| Portfolio Turnover | 49%(4)(7) | 69%(7)(8) |
| (1) | From February 1, 2019 inception. |
| (2) | Computed using average shares outstanding. |
| (3) | Returns are historical and are calculated by determining the percentage change in net asset value with all distributions reinvested and do not reflect the effect of sales charges, if any. |
| (4) | Not annualized. |
| (5) | Total expenses do not reflect amounts reimbursed and/or waived by the adviser and certain of its affiliates, if applicable. Net expenses are net of all reductions and represent the net expenses paid by the Fund. |
| (6) | Annualized. |
| (7) | Includes the effect of To-Be-Announced (TBA) transactions. |
| (8) | For the year ended September 30, 2019. |
Table of Contents
| Bond Fund — Class A | ||||||
| Six Months Ended March 31, 2020 (Unaudited) | Year Ended September 30, | |||||
| 2019 | 2018 | 2017 | 2016 | 2015 | ||
| Net asset value — Beginning of period | $16.67 | $15.69 | $16.14 | $16.36 | $15.83 | $15.92 |
| Income (Loss) From Operations | ||||||
| Net investment income(1) | $0.19 | $0.42 | $0.37 | $0.37 | $0.40(2) | $0.38 |
| Net realized and unrealized gain (loss) | (0.45) | 0.99 | (0.45) | (0.18) | 0.53 | (0.09) |
| Total income (loss) from operations | $(0.26) | $1.41 | $(0.08) | $0.19 | $0.93 | $0.29 |
| Less Distributions | ||||||
| From net investment income | $(0.19) | $(0.43) | $(0.37) | $(0.36) | $(0.40) | $(0.38) |
| From net realized gain | (0.15) | — | — | (0.05) | — | — |
| Total distributions | $(0.34) | $(0.43) | $(0.37) | $(0.41) | $(0.40) | $(0.38) |
| Net asset value — End of period | $16.07 | $16.67 | $15.69 | $16.14 | $16.36 | $15.83 |
| Total Return(3) | (1.58)%(4) | 9.10% | (0.48)% | 1.21% | 5.96% | 1.79% |
| Ratios/Supplemental Data | ||||||
| Net assets, end of period (000’s omitted) | $298,304 | $290,893 | $251,714 | $281,490 | $395,957 | $395,194 |
| Ratios (as a percentage of average daily net assets):(5) | ||||||
| Total expenses | 0.76%(6) | 0.78% | 0.83% | 0.89% | 0.94% | 1.07% |
| Net expenses | 0.73%(6) | 0.75% | 0.83% | 0.89% | 0.91% | 1.07% |
| Net investment income | 2.33%(6) | 2.59% | 2.32% | 2.29% | 2.49%(2) | 2.35% |
| Portfolio Turnover | 72%(4)(7) | 75%(7) | 83% | 99% | 154% | 241% |
| (1) | Computed using average shares outstanding. |
| (2) | Amount includes a non-recurring refund for overbilling of prior years' custody out-of-pocket fees. This amounted to less than $0.005 per share and less than 0.005% of average net assets. |
| (3) | Returns are historical and are calculated by determining the percentage change in net asset value with all distributions reinvested and do not reflect the effect of sales charges, if any. |
| (4) | Not annualized. |
| (5) | Total expenses do not reflect amounts reimbursed and/or waived by the adviser and certain of its affiliates, if applicable. Net expenses are net of all reductions and represent the net expenses paid by the Fund. |
| (6) | Annualized. |
| (7) | Includes the effect of To-Be-Announced (TBA) transactions. |
Table of Contents
| Bond Fund — Class C | ||||||
| Six Months Ended March 31, 2020 (Unaudited) | Year Ended September 30, | |||||
| 2019 | 2018 | 2017 | 2016 | 2015 | ||
| Net asset value — Beginning of period | $16.55 | $15.58 | $16.03 | $16.26 | $15.73 | $15.82 |
| Income (Loss) From Operations | ||||||
| Net investment income(1) | $0.13 | $0.28 | $0.24 | $0.22 | $0.25(2) | $0.24 |
| Net realized and unrealized gain (loss) | (0.44) | 0.98 | (0.44) | (0.18) | 0.54 | (0.09) |
| Total income (loss) from operations | $(0.31) | $1.26 | $(0.20) | $0.04 | $0.79 | $0.15 |
| Less Distributions | ||||||
| From net investment income | $(0.13) | $(0.29) | $(0.25) | $(0.22) | $(0.26) | $(0.24) |
| From net realized gain | (0.15) | — | — | (0.05) | — | — |
| Total distributions | $(0.28) | $(0.29) | $(0.25) | $(0.27) | $(0.26) | $(0.24) |
| Net asset value — End of period | $15.96 | $16.55 | $15.58 | $16.03 | $16.26 | $15.73 |
| Total Return(3) | (1.93)%(4) | 8.19% | (1.25)% | 0.27% | 5.05% | 0.95% |
| Ratios/Supplemental Data | ||||||
| Net assets, end of period (000’s omitted) | $15,947 | $15,343 | $21,939 | $26,631 | $32,349 | $32,626 |
| Ratios (as a percentage of average daily net assets):(5) | ||||||
| Total expenses | 1.56%(6) | 1.59% | 1.63% | 1.78% | 1.84% | 1.91% |
| Net expenses | 1.53%(6) | 1.56% | 1.63% | 1.78% | 1.81% | 1.91% |
| Net investment income | 1.53%(6) | 1.79% | 1.52% | 1.40% | 1.59%(2) | 1.51% |
| Portfolio Turnover | 72%(4)(7) | 75%(7) | 83% | 99% | 154% | 241% |
| (1) | Computed using average shares outstanding. |
| (2) | Amount includes a non-recurring refund for overbilling of prior years' custody out-of-pocket fees. This amounted to less than $0.005 per share and less than 0.005% of average net assets. |
| (3) | Returns are historical and are calculated by determining the percentage change in net asset value with all distributions reinvested and do not reflect the effect of sales charges, if any. |
| (4) | Not annualized. |
| (5) | Total expenses do not reflect amounts reimbursed and/or waived by the adviser and certain of its affiliates, if applicable. Net expenses are net of all reductions and represent the net expenses paid by the Fund. |
| (6) | Annualized. |
| (7) | Includes the effect of To-Be-Announced (TBA) transactions. |
Table of Contents
| Bond Fund — Class I | ||||||
| Six Months Ended March 31, 2020 (Unaudited) | Year Ended September 30, | |||||
| 2019 | 2018 | 2017 | 2016 | 2015 | ||
| Net asset value — Beginning of period | $16.70 | $15.72 | $16.15 | $16.38 | $15.85 | $15.94 |
| Income (Loss) From Operations | ||||||
| Net investment income(1) | $0.21 | $0.45 | $0.42 | $0.42 | $0.46(2) | $0.47 |
| Net realized and unrealized gain (loss) | (0.45) | 0.99 | (0.45) | (0.17) | 0.53 | (0.09) |
| Total income (loss) from operations | $(0.24) | $1.44 | $(0.03) | $0.25 | $0.99 | $0.38 |
| Less Distributions | ||||||
| From net investment income | $(0.21) | $(0.46) | $(0.40) | $(0.43) | $(0.46) | $(0.47) |
| From net realized gain | (0.15) | — | — | (0.05) | — | — |
| Total distributions | $(0.36) | $(0.46) | $(0.40) | $(0.48) | $(0.46) | $(0.47) |
| Net asset value — End of period | $16.10 | $16.70 | $15.72 | $16.15 | $16.38 | $15.85 |
| Total Return(3) | (1.48)%(4) | 9.30% | (0.15)% | 1.54% | 6.35% | 2.36% |
| Ratios/Supplemental Data | ||||||
| Net assets, end of period (000’s omitted) | $1,162,226 | $1,144,805 | $629,822 | $500,510 | $355,017 | $328,690 |
| Ratios (as a percentage of average daily net assets):(5) | ||||||
| Total expenses | 0.57%(6) | 0.58% | 0.63% | 0.54% | 0.54% | 0.51% |
| Net expenses | 0.53%(6) | 0.53% | 0.53% | 0.52% | 0.53% | 0.51% |
| Net investment income | 2.53%(6) | 2.81% | 2.64% | 2.64% | 2.86%(2) | 2.91% |
| Portfolio Turnover | 72%(4)(7) | 75%(7) | 83% | 99% | 154% | 241% |
| (1) | Computed using average shares outstanding. |
| (2) | Amount includes a non-recurring refund for overbilling of prior years' custody out-of-pocket fees. This amounted to less than $0.005 per share and less than 0.005% of average net assets. |
| (3) | Returns are historical and are calculated by determining the percentage change in net asset value with all distributions reinvested and do not reflect the effect of sales charges, if any. |
| (4) | Not annualized. |
| (5) | Total expenses do not reflect amounts reimbursed and/or waived by the adviser and certain of its affiliates, if applicable. Net expenses are net of all reductions and represent the net expenses paid by the Fund. |
| (6) | Annualized. |
| (7) | Includes the effect of To-Be-Announced (TBA) transactions. |
Table of Contents
| Bond Fund — Class R6 | |||
| Six Months Ended March 31, 2020 (Unaudited) | Year Ended September 30, 2019 | Period Ended September 30, 2018(1) | |
| Net asset value — Beginning of period | $16.69 | $15.71 | $16.17 |
| Income (Loss) From Operations | |||
| Net investment income(2) | $0.22 | $0.46 | $0.42 |
| Net realized and unrealized gain (loss) | (0.45) | 0.99 | (0.46) |
| Total income (loss) from operations | $(0.23) | $1.45 | $(0.04) |
| Less Distributions | |||
| From net investment income | $(0.22) | $(0.47) | $(0.42) |
| From net realized gain | (0.15) | — | — |
| Total distributions | $(0.37) | $(0.47) | $(0.42) |
| Net asset value — End of period | $16.09 | $16.69 | $15.71 |
| Total Return(3) | (1.38)%(4) | 9.31% | (0.27)%(4) |
| Ratios/Supplemental Data | |||
| Net assets, end of period (000’s omitted) | $256,758 | $252,225 | $133,417 |
| Ratios (as a percentage of average daily net assets):(5) | |||
| Total expenses | 0.49%(6) | 0.51% | 0.56%(6) |
| Net expenses | 0.46%(6) | 0.48% | 0.53%(6) |
| Net investment income | 2.60%(6) | 2.84% | 2.64%(6) |
| Portfolio Turnover | 72%(4)(7) | 75%(7) | 83%(8) |
| (1) | From October 3, 2017 inception. |
| (2) | Computed using average shares outstanding. |
| (3) | Returns are historical and are calculated by determining the percentage change in net asset value with all distributions reinvested and do not reflect the effect of sales charges, if any. |
| (4) | Not annualized. |
| (5) | Total expenses do not reflect amounts reimbursed and/or waived by the adviser and certain of its affiliates, if applicable. Net expenses are net of all reductions and represent the net expenses paid by the Fund. |
| (6) | Annualized. |
| (7) | Includes the effect of To-Be-Announced (TBA) transactions. |
| (8) | For the year ended September 30, 2018. |
Table of Contents
| Equity Fund — Class A | ||||||
| Six Months Ended March 31, 2020 (Unaudited) | Year Ended September 30, | |||||
| 2019 | 2018 | 2017 | 2016 | 2015 | ||
| Net asset value — Beginning of period | $53.94 | $49.18 | $43.31 | $41.38 | $47.79 | $50.33 |
| Income (Loss) From Operations | ||||||
| Net investment income(1) | $0.01 | $0.05 | $0.04 | $0.06 | $0.11(2) | $0.10 |
| Net realized and unrealized gain (loss) | (4.69) | 8.36 | 9.31 | 6.03 | 3.74 | 2.20 |
| Total income (loss) from operations | $(4.68) | $8.41 | $9.35 | $6.09 | $3.85 | $2.30 |
| Less Distributions | ||||||
| From net investment income | $(0.02) | $(0.01) | $(0.05) | $(0.06) | $(0.13) | $(0.02) |
| From net realized gain | (1.57) | (3.64) | (3.43) | (4.10) | (10.13) | (4.82) |
| Total distributions | $(1.59) | $(3.65) | $(3.48) | $(4.16) | $(10.26) | $(4.84) |
| Net asset value — End of period | $47.67 | $53.94 | $49.18 | $43.31 | $41.38 | $47.79 |
| Total Return(3) | (9.01)%(4) | 18.72% | 22.66% | 16.39% | 8.57% | 4.57% |
| Ratios/Supplemental Data | ||||||
| Net assets, end of period (000’s omitted) | $1,409,425 | $1,598,391 | $1,291,870 | $1,220,685 | $1,385,988 | $1,328,913 |
| Ratios (as a percentage of average daily net assets):(5) | ||||||
| Total expenses | 0.96%(6) | 1.00% | 1.01% | 1.06% | 1.10% | 1.13% |
| Net expenses | 0.96%(6) | 0.99% | 1.01% | 1.06% | 1.08% | 1.12% |
| Net investment income | 0.02%(6) | 0.11% | 0.08% | 0.16% | 0.27%(2) | 0.19% |
| Portfolio Turnover | 7%(4) | 13% | 18% | 29% | 44% | 37% |
| (1) | Computed using average shares outstanding. |
| (2) | Amount includes a non-recurring refund for overbilling of prior years' custody out-of-pocket fees. This amounted to less than $0.005 per share and less than 0.005% of average net assets. |
| (3) | Returns are historical and are calculated by determining the percentage change in net asset value with all distributions reinvested and do not reflect the effect of sales charges, if any. |
| (4) | Not annualized. |
| (5) | Total expenses do not reflect amounts reimbursed and/or waived by the adviser and certain of its affiliates, if applicable. Net expenses are net of all reductions and represent the net expenses paid by the Fund. |
| (6) | Annualized. |
Table of Contents
| Equity Fund — Class C | ||||||
| Six Months Ended March 31, 2020 (Unaudited) | Year Ended September 30, | |||||
| 2019 | 2018 | 2017 | 2016 | 2015 | ||
| Net asset value — Beginning of period | $29.67 | $28.80 | $26.84 | $27.35 | $34.98 | $38.31 |
| Income (Loss) From Operations | ||||||
| Net investment loss(1) | $(0.11) | $(0.17) | $(0.18) | $(0.15) | $(0.14)(2) | $(0.20) |
| Net realized and unrealized gain (loss) | (2.50) | 4.57 | 5.57 | 3.74 | 2.67 | 1.69 |
| Total income (loss) from operations | $(2.61) | $4.40 | $5.39 | $3.59 | $2.53 | $1.49 |
| Less Distributions | ||||||
| From net investment income | $— | $— | $— | $— | $(0.03) | $— |
| From net realized gain | (1.54) | (3.53) | (3.43) | (4.10) | (10.13) | (4.82) |
| Total distributions | $(1.54) | $(3.53) | $(3.43) | $(4.10) | $(10.16) | $(4.82) |
| Net asset value — End of period | $25.52 | $29.67 | $28.80 | $26.84 | $27.35 | $34.98 |
| Total Return(3) | (9.36)%(4) | 17.82% | 21.75% | 15.48% | 7.73% | 3.82% |
| Ratios/Supplemental Data | ||||||
| Net assets, end of period (000’s omitted) | $104,126 | $100,276 | $155,419 | $152,561 | $178,719 | $169,649 |
| Ratios (as a percentage of average daily net assets):(5) | ||||||
| Total expenses | 1.71%(6) | 1.75% | 1.76% | 1.83% | 1.87% | 1.87% |
| Net expenses | 1.71%(6) | 1.75% | 1.76% | 1.83% | 1.85% | 1.86% |
| Net investment loss | (0.73)%(6) | (0.64)% | (0.67)% | (0.60)% | (0.50)%(2) | (0.54)% |
| Portfolio Turnover | 7%(4) | 13% | 18% | 29% | 44% | 37% |
| (1) | Computed using average shares outstanding. |
| (2) | Amount includes a non-recurring refund for overbilling of prior years' custody out-of-pocket fees. This amounted to less than $0.005 per share and less than 0.005% of average net assets. |
| (3) | Returns are historical and are calculated by determining the percentage change in net asset value with all distributions reinvested and do not reflect the effect of sales charges, if any. |
| (4) | Not annualized. |
| (5) | Total expenses do not reflect amounts reimbursed and/or waived by the adviser and certain of its affiliates, if applicable. Net expenses are net of all reductions and represent the net expenses paid by the Fund. |
| (6) | Annualized. |
Table of Contents
| Equity Fund — Class I | ||||||
| Six Months Ended March 31, 2020 (Unaudited) | Year Ended September 30, | |||||
| 2019 | 2018 | 2017 | 2016 | 2015 | ||
| Net asset value — Beginning of period | $62.89 | $56.68 | $49.44 | $46.68 | $52.65 | $54.90 |
| Income (Loss) From Operations | ||||||
| Net investment income(1) | $0.09 | $0.21 | $0.20 | $0.25 | $0.32(2) | $0.38 |
| Net realized and unrealized gain (loss) | (5.50) | 9.76 | 10.69 | 6.88 | 4.14 | 2.38 |
| Total income (loss) from operations | $(5.41) | $9.97 | $10.89 | $7.13 | $4.46 | $2.76 |
| Less Distributions | ||||||
| From net investment income | $(0.15) | $(0.12) | $(0.22) | $(0.27) | $(0.30) | $(0.19) |
| From net realized gain | (1.57) | (3.64) | (3.43) | (4.10) | (10.13) | (4.82) |
| Total distributions | $(1.72) | $(3.76) | $(3.65) | $(4.37) | $(10.43) | $(5.01) |
| Net asset value — End of period | $55.76 | $62.89 | $56.68 | $49.44 | $46.68 | $52.65 |
| Total Return(3) | (8.90)%(4) | 19.05% | 23.06% | 16.85% | 9.01% | 5.06% |
| Ratios/Supplemental Data | ||||||
| Net assets, end of period (000’s omitted) | $1,938,361 | $1,540,337 | $963,446 | $550,055 | $472,583 | $567,954 |
| Ratios (as a percentage of average daily net assets):(5) | ||||||
| Total expenses | 0.71%(6) | 0.75% | 0.76% | 0.69% | 0.69% | 0.64% |
| Net expenses | 0.71%(6) | 0.72% | 0.70% | 0.67% | 0.67% | 0.63% |
| Net investment income | 0.27%(6) | 0.37% | 0.38% | 0.54% | 0.68%(2) | 0.69% |
| Portfolio Turnover | 7%(4) | 13% | 18% | 29% | 44% | 37% |
| (1) | Computed using average shares outstanding. |
| (2) | Amount includes a non-recurring refund for overbilling of prior years' custody out-of-pocket fees. This amounted to less than $0.005 per share and less than 0.005% of average net assets. |
| (3) | Returns are historical and are calculated by determining the percentage change in net asset value with all distributions reinvested and do not reflect the effect of sales charges, if any. |
| (4) | Not annualized. |
| (5) | Total expenses do not reflect amounts reimbursed and/or waived by the adviser and certain of its affiliates, if applicable. Net expenses are net of all reductions and represent the net expenses paid by the Fund. |
| (6) | Annualized. |
Table of Contents
| Equity Fund — Class R6 | |||
| Six Months Ended March 31, 2020 (Unaudited) | Year Ended September 30, 2019 | Period Ended September 30, 2018(1) | |
| Net asset value — Beginning of period | $62.80 | $56.65 | $49.74 |
| Income (Loss) From Operations | |||
| Net investment income(2) | $0.11 | $0.23 | $0.17 |
| Net realized and unrealized gain (loss) | (5.48) | 9.74 | 10.42 |
| Total income (loss) from operations | $(5.37) | $9.97 | $10.59 |
| Less Distributions | |||
| From net investment income | $(0.21) | $(0.18) | $(0.25) |
| From net realized gain | (1.57) | (3.64) | (3.43) |
| Total distributions | $(1.78) | $(3.82) | $(3.68) |
| Net asset value — End of period | $55.65 | $62.80 | $56.65 |
| Total Return(3) | (8.86)%(4) | 19.12% | 22.30%(4) |
| Ratios/Supplemental Data | |||
| Net assets, end of period (000’s omitted) | $124,088 | $58,035 | $843 |
| Ratios (as a percentage of average daily net assets):(5) | |||
| Total expenses | 0.64%(6) | 0.68% | 0.68%(6) |
| Net expenses | 0.64%(6) | 0.67% | 0.68%(6) |
| Net investment income | 0.35%(6) | 0.37% | 0.31%(6) |
| Portfolio Turnover | 7%(4) | 13% | 18%(7) |
| (1) | From October 3, 2017 inception. |
| (2) | Computed using average shares outstanding. |
| (3) | Returns are historical and are calculated by determining the percentage change in net asset value with all distributions reinvested and do not reflect the effect of sales charges, if any. |
| (4) | Not annualized. |
| (5) | Total expenses do not reflect amounts reimbursed and/or waived by the adviser and certain of its affiliates, if applicable. Net expenses are net of all reductions and represent the net expenses paid by the Fund. |
| (6) | Annualized. |
| (7) | For the year ended September 30, 2018. |
Table of Contents
Table of Contents
| Asset Description | Level 1 | Level 2 | Level 3(1) | Total |
| Asset-Backed Securities | $— | $59,006,185 | $— | $59,006,185 |
| Collateralized Mortgage-Backed Obligations | — | 49,255,008 | — | 49,255,008 |
| Commercial Mortgage-Backed Securities | — | 14,412,584 | — | 14,412,584 |
| Common Stocks | 456,872,307(2) | — | — | 456,872,307 |
| Common Stocks - Health Care | — | 7,964,881(3) | — | 7,964,881 |
| Common Stocks - Venture Capital | — | — | 1,458,997 | 1,458,997 |
| Corporate Bonds | — | 129,924,280 | — | 129,924,280 |
| Floating Rate Loans | — | 6,381,046 | — | 6,381,046 |
| High Social Impact Investments | — | 3,397,947 | — | 3,397,947 |
| Preferred Stocks | 1,199,556 | — | — | 1,199,556 |
| Preferred Stocks - Venture Capital | — | — | 381,486 | 381,486 |
| Rights | 933,660 | — | — | 933,660 |
| Sovereign Government Bonds | — | 549,686 | — | 549,686 |
| Taxable Municipal Obligations | — | 14,183,642 | — | 14,183,642 |
| U.S. Government Agencies and Instrumentalities | — | 5,150,738 | — | 5,150,738 |
| U.S. Government Agency Mortgage-Backed Securities | — | 36,350,782 | — | 36,350,782 |
| U.S. Treasury Obligations | — | 30,739,073 | — | 30,739,073 |
| Venture Capital Debt Obligations | — | — | 26,310 | 26,310 |
| Venture Capital Limited Partnership Interests | — | — | 334,329 | 334,329 |
Table of Contents
| Asset Description | Level 1 | Level 2 | Level 3(1) | Total |
| Short-Term Investments | $1,183,348 | $ — | $ — | $1,183,348 |
| Total Investments | $460,188,871 | $357,315,852 | $2,201,122 | $819,705,845 |
| Futures Contracts | $2,125,429 | $ — | $ — | $2,125,429 |
| Total | $462,314,300 | $357,315,852 | $2,201,122 | $821,831,274 |
| Liability Description | ||||
| Forward Foreign Currency Exchange Contracts | $ — | $(1,465) | $ — | $(1,465) |
| Futures Contracts | (2,091,963) | — | — | (2,091,963) |
| Total | $(2,091,963) | $(1,465) | $ — | $(2,093,428) |
| (1) | None of the unobservable inputs for Level 3 assets, individually or collectively, had a material impact on the Fund. |
| (2) | The level classification by major category of investments is the same as the category presentation in the Schedule of Investments. |
| (3) | Includes foreign equity securities whose values were adjusted to reflect market trading of comparable securities or other correlated instruments that occurred after the close of trading in their applicable foreign markets. |
| Asset Description | Level 1 | Level 2 | Level 3 | Total |
| Asset-Backed Securities | $— | $305,006,193 | $— | $305,006,193 |
| Collateralized Mortgage-Backed Obligations | — | 255,761,904 | — | 255,761,904 |
| Commercial Mortgage-Backed Securities | — | 61,275,935 | — | 61,275,935 |
| Corporate Bonds | — | 752,490,519 | — | 752,490,519 |
| Floating Rate Loans | — | 38,559,068 | — | 38,559,068 |
| High Social Impact Investments | — | 6,194,112 | — | 6,194,112 |
| Preferred Stocks | 5,707,444 | — | — | 5,707,444 |
| Sovereign Government Bonds | — | 3,386,460 | — | 3,386,460 |
| Taxable Municipal Obligations | — | 73,872,574 | — | 73,872,574 |
| U.S. Government Agencies and Instrumentalities | — | 32,710,478 | — | 32,710,478 |
| U.S. Government Agency Mortgage-Backed Securities | — | 202,780,801 | — | 202,780,801 |
| U.S. Treasury Obligations | — | 125,924,190 | — | 125,924,190 |
| Short-Term Investments | 35,756,319 | — | — | 35,756,319 |
| Total Investments | $41,463,763 | $1,857,962,234 | $ — | $1,899,425,997 |
| Futures Contracts | $9,381,724 | $ — | $ — | $9,381,724 |
| Total | $50,845,487 | $1,857,962,234 | $ — | $1,908,807,721 |
| Liability Description | ||||
| Futures Contracts | $(11,194,033) | $ — | $ — | $(11,194,033) |
| Total | $(11,194,033) | $ — | $ — | $(11,194,033) |
Table of Contents
| Asset Description | Level 1 | Level 2 | Level 3(1) | Total |
| Common Stocks | $3,431,553,046(2) | $— | $— | $3,431,553,046 |
| Common Stocks - Venture Capital | — | — | 306,598 | 306,598 |
| High Social Impact Investments | — | 13,995,618 | — | 13,995,618 |
| Preferred Stocks - Venture Capital | — | — | 1,079,991 | 1,079,991 |
| Venture Capital Debt Obligations | — | — | 416,045 | 416,045 |
| Venture Capital Limited Partnership Interests | — | — | 14,729,838 | 14,729,838 |
| Total Investments | $3,431,553,046 | $13,995,618 | $16,532,472 | $3,462,081,136 |
| (1) | None of the unobservable inputs for Level 3 assets, individually or collectively, had a material impact on the Fund. |
| (2) | The level classification by major category of investments is the same as the category presentation in the Schedule of Investments. Venture capital is not included in this category. |
Table of Contents
Table of Contents
| Balanced | |
| Up to and including $500 Million | 0.410% |
| Over $500 Million up to and including $1 Billion | 0.385% |
| Over $1 Billion | 0.350% |
| Bond | |
| Up to and including $1 Billion | 0.300% |
| Over $1 Billion | 0.290% |
| Equity | |
| Up to and including $2 Billion | 0.500% |
| Over $2 Billion up to and including $3 Billion | 0.425% |
| Over $3 Billion | 0.375% |
| Class A | Class C | Class I | Class R6 | |
| Balanced | 0.93% | 1.68% | 0.68% | 0.64% |
| Bond | 0.73% | 1.53% | 0.53% | 0.46% |
| Equity | 0.99% | 1.74% | 0.74% | 0.67% |
Table of Contents
| Balanced | Bond | Equity | |
| Class A Plan | 0% up to $30 million, 0.25% over $30 million | 0.20% | 0.25% |
Table of Contents
| Balanced | Bond | Equity | |
| Purchases | |||
| U.S. Government and Agency Securities | $181,463,395 | $1,053,860,952 | $— |
| Non-U.S. Government and Agency Securities | 339,183,050 | 603,720,544 | 913,714,243 |
| Total Purchases | $520,646,445 | $1,657,581,496 | $913,714,243 |
| Sales | |||
| U.S. Government and Agency Securities | $150,495,684 | $935,710,891 | $— |
| Non-U.S. Government and Agency Securities | 263,523,625 | 382,687,686 | 228,674,858 |
| Total Sales | $414,019,309 | $1,318,398,577 | $228,674,858 |
| Balanced | Bond | Equity | |
| Aggregate cost | $805,093,379 | $1,919,370,889 | $2,670,628,161 |
| Gross unrealized appreciation | $59,762,400 | $63,687,859 | $851,891,581 |
| Gross unrealized depreciation | (45,117,933) | (85,445,060) | (60,438,606) |
| Net unrealized appreciation (depreciation) | $14,644,467 | $(21,757,201) | $791,452,975 |
Table of Contents
| Risk | Derivative | Statements of Assets and Liabilities Caption | Assets | Liabilities |
| Foreign exchange | Forward foreign currency exchange contracts | Receivable/Payable for open forward foreign currency exchange contracts | $— | $(1,465) |
| Interest rate | Futures contracts | Distributable earnings | 2,125,429(1) | (2,091,963)(1) |
| Total | $2,125,429 | $(2,093,428) | ||
| Derivatives not subject to master netting agreement | $2,125,429 | $(2,091,963) | ||
| Total Derivatives subject to master netting agreement | $ — | $(1,465) | ||
| (1) | Only the current day's variation margin is reported within the Statements of Assets and Liabilities as Receivable or Payable for variation margin on open futures contracts, as applicable. |
| Risk | Derivative | Statements of Assets and Liabilities Caption | Assets | Liabilities |
| Interest rate | Futures contracts | Accumulated loss | $9,381,724(1) | $(11,194,033)(1) |
| (1) | Only the current day's variation margin is reported within the Statements of Assets and Liabilities as Receivable or Payable for variation margin on open futures contracts, as applicable. |
Table of Contents
| Counterparty | Derivative Liabilities Subject to Master Netting Agreement | Derivatives Available for Offset | Non-cash Collateral Pledged(a) | Cash Collateral Pledged(a) | Net Amount of Derivative Liabilities(b) |
| State Street Bank and Trust Company | $(1,465) | $ — | $ — | $ — | $(1,465) |
| (a) | In some instances, the total collateral received and/or pledged may be more than the amount shown due to overcollateralization. |
| (b) | Net amount represents the net amount payable to the counterparty in the event of default. |
| Statements of Operations Caption | Foreign exchange | Interest rate | Total |
| Net realized gain (loss): | |||
| Investment securities - unaffiliated issuers(1) | $ — | $1,225 | $1,225 |
| Futures contracts | — | (113,008) | (113,008) |
| Total | $ — | $(111,783) | $(111,783) |
| Change in unrealized appreciation (depreciation): | |||
| Forward foreign currency exchange contracts | $(1,465) | $— | $(1,465) |
| Futures contracts | — | 193,593 | 193,593 |
| Total | $(1,465) | $193,593 | $192,128 |
| (1) | Relates to purchased options. |
| Statements of Operations Caption | |
| Net realized gain (loss): | |
| Futures contracts | $225,652 |
| Total | $225,652 |
| Change in unrealized appreciation (depreciation): | |
| Futures contracts | $(567,336) |
| Total | $(567,336) |
Table of Contents
| Balanced | Bond | |
| Futures contracts — long | $38,976,000 | $199,888,000 |
| Futures contracts — short | $38,492,000 | $145,360,000 |
| Forward foreign currency exchange contracts* | $59,000 | $ — |
| * | The average notional amount for forward foreign currency exchange contracts is based on the absolute value of notional amounts of currency purchased and currency sold. |
| Balanced | Bond | |
| Securities on Loan | $1,152,537 | $35,583,855 |
| Collateral Received: | ||
| Cash | 1,183,348 | 35,756,319 |
| U.S. government and/or agencies securities | — | 941,775 |
| Total Collateral Received | $1,183,348 | $36,698,094 |
| Balanced | Remaining Contractual Maturity of the Transactions | ||||
| Overnight and Continuous | <30 days | 30 to 90 days | >90 days | Total | |
| Securities Lending Transactions | |||||
| Corporate Bonds | $1,183,348 | $ — | $ — | $ — | $1,183,348 |
Table of Contents
| Bond | Remaining Contractual Maturity of the Transactions | ||||
| Overnight and Continuous | <30 days | 30 to 90 days | >90 days | Total | |
| Securities Lending Transactions | |||||
| Corporate Bonds | $9,360,655 | $ — | $ — | $ — | $9,360,655 |
| U.S. Treasury Obligations | 26,395,664 | — | — | — | 26,395,664 |
| Total | $35,756,319 | $ — | $ — | $ — | $35,756,319 |
Table of Contents
| Name of issuer | Value, beginning of period | Purchases | Sales proceeds | Net realized gain (loss) | Change in unrealized appreciation (depreciation) | Value, end of period | Interest income | Capital gain distributions received | Principal amount, end of period |
| High Social Impact Investments | |||||||||
| Calvert Impact Capital, Inc., Community Investment Notes, 1.50%, 12/15/19(1) | $4,244,095 | $ — | $(4,266,666) | $ — | $22,571 | $ — | $12,444 | $ — | $— |
| Calvert Impact Capital, Inc., Community Investment Notes, 1.50%, 12/15/20(1) | — | 2,615,531 | — | — | (94,682) | 2,520,849 | 11,443 | — | 2,615,531 |
| Venture Capital Limited Partnership Interests | |||||||||
| GEEMF Partners, L.P.(1)(2)(3) | 16,995 | — | — | — | (3,542) | 13,453 | — | — | — |
| Totals | $ — | $(75,653) | $2,534,302 | $23,887 | $ — |
| (1) | Restricted security. |
| (2) | For fair value measurement disclosure purposes, security is categorized as Level 3. |
| (3) | Non-income producing security. |
| Name of issuer | Value, beginning of period | Purchases | Sales proceeds | Net realized gain (loss) | Change in unrealized appreciation (depreciation) | Value, end of period | Interest income | Capital gain distributions received | Principal amount, end of period |
| High Social Impact Investments | |||||||||
| Calvert Impact Capital, Inc., Community Investment Notes, 1.50%, 12/15/19(1) | $5,060,480 | $ — | $(5,087,392) | $ — | $26,912 | $ — | $14,838 | $ — | $— |
| Calvert Impact Capital, Inc., Community Investment Notes, 1.50%, 12/15/20(1) | — | 5,291,992 | — | — | (191,570) | 5,100,422 | 23,152 | — | 5,291,992 |
| Totals | $ — | $(164,658) | $5,100,422 | $37,990 | $ — |
| (1) | Restricted security. |
Table of Contents
| Name of issuer | Value, beginning of period | Purchases | Sales proceeds | Net realized gain (loss) | Change in unrealized appreciation (depreciation) | Value, end of period | Interest income | Capital gain distributions received | Principal amount, end of period |
| High Social Impact Investments | |||||||||
| Calvert Impact Capital, Inc., Community Investment Notes, 1.50%, 12/15/19(1) | $10,776,566 | $ — | $(10,833,877) | $ — | $57,311 | $ — | $31,599 | $ — | $— |
| Calvert Impact Capital, Inc., Community Investment Notes, 1.50%, 12/15/20(1) | — | 11,180,737 | — | — | (404,743) | 10,775,994 | 48,916 | — | 11,180,737 |
| Totals | $ — | $(347,432) | $10,775,994 | $80,515 | $ — |
| (1) | Restricted security. |
| Six Months Ended March 31, 2020 (Unaudited) | Year Ended September 30, 2019(1) | ||||
| Shares | Amount | Shares | Amount | ||
| Class A | |||||
| Shares sold | 1,262,276 | $43,646,285 | 1,865,904 | $60,147,297 | |
| Reinvestment of distributions | 504,513 | 17,111,893 | 814,777 | 25,453,894 | |
| Shares redeemed | (1,317,152) | (44,087,078) | (2,154,847) | (69,467,552) | |
| Converted from Class C | 20,078 | 673,907 | 311,077 | 9,580,124 | |
| Net increase | 469,715 | $17,345,007 | 836,911 | $25,713,763 | |
| Class C | |||||
| Shares sold | 414,393 | $13,870,982 | 355,676 | $11,047,013 | |
| Reinvestment of distributions | 40,307 | 1,327,669 | 74,007 | 2,218,170 | |
| Shares redeemed | (171,887) | (5,551,772) | (367,152) | (11,365,290) | |
| Converted to Class A | (20,816) | (673,907) | (321,943) | (9,580,124) | |
| Net increase (decrease) | 261,997 | $8,972,972 | (259,412) | $(7,680,231) | |
Table of Contents
| Six Months Ended March 31, 2020 (Unaudited) | Year Ended September 30, 2019(1) | ||||
| Shares | Amount | Shares | Amount | ||
| Class I | |||||
| Shares sold | 2,266,897 | $79,439,570 | 1,642,045 | $54,737,017 | |
| Reinvestment of distributions | 122,265 | 4,200,771 | 151,627 | 4,849,789 | |
| Shares redeemed | (473,477) | (16,186,842) | (720,682) | (23,668,848) | |
| Net increase | 1,915,685 | $67,453,499 | 1,072,990 | $35,917,958 | |
| Class R6 | |||||
| Shares sold | 86,385 | $3,021,988 | 6,583 | $228,286 | |
| Reinvestment of distributions | 821 | 27,504 | 27 | 939 | |
| Shares redeemed | (9,800) | (318,924) | (21) | (737) | |
| Net increase | 77,406 | $2,730,568 | 6,589 | $228,488 | |
| (1) | For Class R6, for the period from the commencement of operations, February 1, 2019, to September 30, 2019. |
| Six Months Ended March 31, 2020 (Unaudited) | Year Ended September 30, 2019 | ||||
| Shares | Amount | Shares | Amount | ||
| Class A | |||||
| Shares sold | 2,599,815 | $43,015,235 | 5,276,946 | $84,824,770 | |
| Reinvestment of distributions | 350,522 | 5,802,989 | 402,903 | 6,487,626 | |
| Shares redeemed | (1,872,476) | (30,717,499) | (4,620,300) | (74,031,503) | |
| Converted from Class C | 32,331 | 530,861 | 352,472 | 5,586,284 | |
| Net increase | 1,110,192 | $18,631,586 | 1,412,021 | $22,867,177 | |
| Class C | |||||
| Shares sold | 183,946 | $3,027,954 | 167,759 | $2,686,003 | |
| Reinvestment of distributions | 14,640 | 240,530 | 17,161 | 273,126 | |
| Shares redeemed | (93,626) | (1,523,671) | (310,875) | (4,914,120) | |
| Converted to Class A | (32,563) | (530,861) | (355,133) | (5,586,284) | |
| Net increase (decrease) | 72,397 | $1,213,952 | (481,088) | $(7,541,275) | |
| Class I | |||||
| Shares sold | 15,521,627 | $258,029,243 | 43,020,418 | $690,624,502 | |
| Reinvestment of distributions | 1,494,188 | 24,786,347 | 1,452,017 | 23,497,972 | |
| Shares redeemed | (13,384,340) | (219,447,668) | (19,995,464) | (322,601,114) | |
| Net increase | 3,631,475 | $63,367,922 | 24,476,971 | $391,521,360 | |
Table of Contents
| Six Months Ended March 31, 2020 (Unaudited) | Year Ended September 30, 2019 | ||||
| Shares | Amount | Shares | Amount | ||
| Class R6 | |||||
| Shares sold | 4,556,149 | $75,665,267 | 13,695,226 | $222,608,619 | |
| Reinvestment of distributions | 173,175 | 2,870,910 | 211,903 | 3,412,318 | |
| Shares redeemed | (3,886,872) | (64,375,017) | (7,283,233) | (116,331,668) | |
| Net increase | 842,452 | $14,161,160 | 6,623,896 | $109,689,269 | |
| Six Months Ended March 31, 2020 (Unaudited) | Year Ended September 30, 2019 | ||||
| Shares | Amount | Shares | Amount | ||
| Class A | |||||
| Shares sold | 3,392,292 | $183,223,996 | 6,520,124 | $317,815,646 | |
| Reinvestment of distributions | 839,598 | 44,893,534 | 2,005,932 | 88,943,024 | |
| Shares redeemed | (4,375,809) | (233,635,473) | (6,446,073) | (317,884,466) | |
| Converted from Class C | 79,328 | 4,246,765 | 1,283,886 | 56,593,514 | |
| Net increase (decrease) | (64,591) | $(1,271,178) | 3,363,869 | $145,467,718 | |
| Class C | |||||
| Shares sold | 1,014,595 | $29,500,907 | 747,684 | $20,389,255 | |
| Reinvestment of distributions | 163,447 | 4,690,930 | 695,257 | 17,068,549 | |
| Shares redeemed | (330,976) | (9,437,291) | (1,137,627) | (30,540,399) | |
| Converted to Class A | (146,867) | (4,246,765) | (2,322,116) | (56,593,514) | |
| Net increase (decrease) | 700,199 | $20,507,781 | (2,016,802) | $(49,676,109) | |
| Class I | |||||
| Shares sold | 17,138,234 | $1,072,283,394 | 13,952,047 | $812,619,838 | |
| Reinvestment of distributions | 649,405 | 40,581,339 | 1,020,585 | 52,651,989 | |
| Shares redeemed | (7,520,070) | (461,927,755) | (7,476,858) | (421,374,510) | |
| Net increase | 10,267,569 | $650,936,978 | 7,495,774 | $443,897,317 | |
| Class R6 | |||||
| Shares sold | 1,503,473 | $94,309,882 | 946,201 | $56,727,582 | |
| Reinvestment of distributions | 17,576 | 1,095,871 | 1,431 | 73,704 | |
| Shares redeemed | (215,399) | (13,210,987) | (38,368) | (2,338,585) | |
| Net increase | 1,305,650 | $82,194,766 | 909,264 | $54,462,701 | |
Table of Contents
| Name of Investment | Unfunded Commitment |
| First Analysis Private Equity Fund IV, L.P. | $60,000 |
| Learn Capital Venture Partners III, L.P. | 4,210 |
| Total | $64,210 |
| Name of Investment | Unfunded Commitment |
| Accion Frontier Inclusion Fund L.P. | $187,972 |
| Adobe Capital Social Mezzanine I L.P. | 33,728 |
| Africa Renewable Energy Fund L.P. | 8,437 |
| Arborview Capital Partners L.P. | 37,760 |
| Blackstone Clean Technology Partners L.P. | 3,170 |
| Bridges Ventures US Sustainable Growth Fund L.P. | 111,683 |
| China Environment Fund III L.P. | 1,205 |
| Core Innovations Capital I L.P. | 51,766 |
| Cross Culture Ventures I L.P. | 72,586 |
| DBL Partners III L.P. | 220,243 |
| First Analysis Private Equity Fund V L.P. | 18,302 |
| Impact Ventures II L.P. | 9,632 |
| Leapfrog Financial Inclusion Fund | 78,436 |
| New Markets Education Partners L.P. | 64,500 |
| New Markets Venture Partners II L.P. | 25,000 |
| Owl Ventures L.P. | 20,000 |
| Westly Capital Partners Fund II L.P. | 103,909 |
| Total | $1,048,329 |
Table of Contents
Table of Contents
Table of Contents
Table of Contents
Table of Contents
Table of Contents
Table of Contents
Table of Contents
Table of Contents
Table of Contents
| Officers |
| Hope L. Brown Chief Compliance Officer |
| Maureen A. Gemma Vice President, Secretary and Chief Legal Officer |
| James F. Kirchner Treasurer |
| Trustees |
| Alice Gresham Bullock Chairperson |
| Richard L. Baird, Jr. |
| Cari M. Dominguez |
| John G. Guffey, Jr. |
| Miles D. Harper, III |
| Joy V. Jones |
| John H. Streur* |
| Anthony A. Williams |
| *Interested Trustee and President |
Table of Contents
| • | At the time of opening an account, Eaton Vance generally requires you to provide us with certain information such as name, address, social security number, tax status, account numbers, and account balances. This information is necessary for us to both open an account for you and to allow us to satisfy legal requirements such as applicable anti-money laundering reviews and know-your-customer requirements. |
| • | On an ongoing basis, in the normal course of servicing your account, Eaton Vance may share your information with unaffiliated third parties that perform various services for Eaton Vance and/or your account. These third parties include transfer agents, custodians, broker/dealers and our professional advisers, including auditors, accountants, and legal counsel. Eaton Vance may additionally share your personal information with our affiliates. |
| • | We believe our Privacy Program is reasonably designed to protect the confidentiality of your personal information and to prevent unauthorized access to that information. |
| • | We reserve the right to change our Privacy Program at any time upon proper notification to you. You may want to review our Privacy Program periodically for changes by accessing the link on our homepage: www.eatonvance.com. |
Table of Contents
Table of Contents
Table of Contents
Table of Contents

Table of Contents


Table of Contents
Table of Contents
Table of Contents
| % Average Annual Total Returns1,2 | Class Inception Date | Performance Inception Date | Six Months | One Year | Five Years | Ten Years |
| Class A at NAV | 04/29/2005 | 04/29/2005 | (5.76)% | (1.47)% | 2.82% | 5.21% |
| Class A with 4.75% Maximum Sales Charge | — | — | (10.26) | (6.12) | 1.83 | 4.70 |
| Class C at NAV | 04/29/2005 | 04/29/2005 | (6.14) | (2.25) | 2.01 | 4.24 |
| Class C with 1% Maximum Sales Charge | — | — | (7.05) | (3.19) | 2.01 | 4.24 |
| Class I at NAV | 05/20/2016 | 04/29/2005 | (5.63) | (1.22) | 3.08 | 5.34 |
| ·· | ||||||
| Bloomberg Barclays U.S. Aggregate Bond Index | — | — | 3.33% | 8.93% | 3.35% | 3.88% |
| Conservative Allocation Blended Benchmark | — | — | (2.98) | 1.97 | 3.82 | 5.52 |
| % Total Annual Operating Expense Ratios3 | Class A | Class C | Class I |
| 1.06% | 1.81% | 0.81% |
Table of Contents
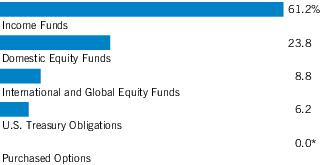
| Top 10 Holdings (% of net assets) | |
| Calvert Bond Fund, Class R6 | 31.6% |
| Calvert US Large-Cap Core Responsible Index Fund, Class R6 | 9.9 |
| Calvert Ultra-Short Duration Income Fund, Class R6 | 8.8 |
| Calvert Flexible Bond Fund (formerly, Calvert Absolute Return Bond Fund), Class R6 | 8.3 |
| Calvert Floating-Rate Advantage Fund, Class R6 | 7.5 |
| Calvert US Large-Cap Value Responsible Index Fund, Class I | 6.6 |
| Calvert US Large-Cap Growth Responsible Index Fund, Class I | 3.5 |
| Calvert Short Duration Income Fund, Class R6 | 3.1 |
| Calvert International Equity Fund, Class R6 | 3.0 |
| U.S. Treasury Inflation-Protected Bonds, 0.875%, 1/15/29 | 2.8 |
| Total | 85.1% |
Table of Contents
| % Average Annual Total Returns1,2 | Class Inception Date | Performance Inception Date | Six Months | One Year | Five Years | Ten Years |
| Class A at NAV | 04/29/2005 | 04/29/2005 | (9.35)% | (5.55)% | 3.14% | 6.09% |
| Class A with 4.75% Maximum Sales Charge | — | — | (13.65) | (10.06) | 2.14 | 5.58 |
| Class C at NAV | 04/29/2005 | 04/29/2005 | (9.71) | (6.24) | 2.37 | 5.31 |
| Class C with 1% Maximum Sales Charge | — | — | (10.58) | (7.14) | 2.37 | 5.31 |
| Class I at NAV | 05/20/2016 | 04/29/2005 | (9.28) | (5.31) | 3.39 | 6.22 |
| ·· | ||||||
| Russell 3000® Index | — | — | (13.70)% | (9.13)% | 5.76% | 10.14% |
| Moderate Allocation Blended Benchmark | — | — | (8.44) | (4.20) | 3.90 | 6.61 |
| % Total Annual Operating Expense Ratios3 | Class A | Class C | Class I |
| 0.95% | 1.70% | 0.70% |
Table of Contents

| Top 10 Holdings (% of net assets) | |
| Calvert US Large-Cap Core Responsible Index Fund, Class R6 | 19.2% |
| Calvert US Large-Cap Value Responsible Index Fund, Class I | 10.8 |
| Calvert Bond Fund, Class R6 | 10.1 |
| Calvert Ultra-Short Duration Income Fund, Class R6 | 6.9 |
| Calvert Flexible Bond Fund (formerly, Calvert Absolute Return Bond Fund), Class R6 | 6.5 |
| Calvert US Large-Cap Growth Responsible Index Fund, Class I | 5.5 |
| Calvert International Equity Fund, Class R6 | 5.4 |
| Calvert International Opportunities Fund, Class R6 | 5.1 |
| Calvert Floating-Rate Advantage Fund, Class R6 | 5.1 |
| Calvert Short Duration Income Fund, Class R6 | 3.3 |
| Total | 77.9% |
Table of Contents
| % Average Annual Total Returns1,2 | Class Inception Date | Performance Inception Date | Six Months | One Year | Five Years | Ten Years |
| Class A at NAV | 06/30/2005 | 06/30/2005 | (13.34)% | (9.66)% | 3.11% | 6.81% |
| Class A with 4.75% Maximum Sales Charge | — | — | (17.47) | (13.93) | 2.11 | 6.29 |
| Class C at NAV | 06/30/2005 | 06/30/2005 | (13.62) | (10.30) | 2.29 | 5.74 |
| Class C with 1% Maximum Sales Charge | — | — | (14.46) | (11.16) | 2.29 | 5.74 |
| Class I at NAV | 05/20/2016 | 06/30/2005 | (13.23) | (9.43) | 3.36 | 6.94 |
| ·· | ||||||
| Russell 3000® Index | — | — | (13.70)% | (9.13)% | 5.76% | 10.14% |
| Growth Allocation Blended Benchmark | — | — | (13.03) | (9.49) | 3.72 | 7.23 |
| % Total Annual Operating Expense Ratios3 | Class A | Class C | Class I |
| Gross | 1.00% | 1.75% | 0.75% |
| Net | 0.91 | 1.66 | 0.66 |
Table of Contents
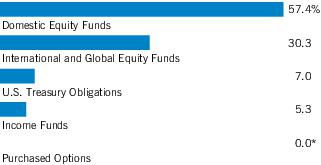
| Top 10 Holdings (% of net assets) | |
| Calvert US Large-Cap Core Responsible Index Fund, Class R6 | 23.8% |
| Calvert US Large-Cap Value Responsible Index Fund, Class I | 15.4 |
| Calvert International Equity Fund, Class R6 | 9.6 |
| Calvert International Opportunities Fund, Class R6 | 8.5 |
| Calvert US Large-Cap Growth Responsible Index Fund, Class I | 7.6 |
| Calvert Emerging Markets Equity Fund, Class R6 | 5.7 |
| Calvert Equity Fund, Class R6 | 4.3 |
| Calvert Small-Cap Fund, Class R6 | 3.4 |
| Calvert International Responsible Index Fund, Class R6 | 3.4 |
| Calvert Emerging Markets Advancement Fund, Class I | 3.3 |
| Total | 85.0% |
Table of Contents
| 1 | Bloomberg Barclays U.S. Aggregate Bond Index is an unmanaged index of domestic investment-grade bonds, including corporate, government and mortgage-backed securities. Russell 3000® Index is an unmanaged index of the 3,000 largest U.S. stocks. MSCI ACWI ex USA Investable Market Index is an unmanaged free-float-adjusted market-capitalization-weighted index designed to measure the equity market performance of developed and emerging markets, excluding the United States, with comprehensive coverage of securities in those markets. MSCI indexes are net of foreign withholding taxes. Source: MSCI. MSCI data may not be reproduced or used for any other purpose. MSCI provides no warranties, has not prepared or approved this report, and has no liability hereunder. The Conservative Allocation Blended Benchmark is an internally constructed benchmark which is comprised of a blend of 25% Russell 3000® Index, 10% MSCI ACWI ex USA Investable Market Index and 65% Bloomberg Barclays U.S. Aggregate Bond Index, and is rebalanced monthly. The Moderate Allocation Blended Benchmark is an internally constructed benchmark which is comprised of a blend of 45% Russell 3000® Index, 20% MSCI ACWI ex USA Investable Market Index and 35% Bloomberg Barclays U.S. Aggregate Bond Index, and is rebalanced monthly. The Growth Allocation Blended Benchmark is an internally constructed benchmark which is comprised of a blend of 60% Russell 3000® Index, 30% MSCI ACWI ex USA Investable Market Index and 10% Bloomberg Barclays U.S. Aggregate Bond Index, and is rebalanced monthly. Unless otherwise stated, index returns do not reflect the effect of any applicable sales charges, commissions, expenses, taxes or leverage, as applicable. It is not possible to invest directly in an index. |
| 2 | Total Returns at NAV do not include applicable sales charges. If sales charges were deducted, the returns would be lower. Total Returns shown with maximum sales charge reflect the stated maximum sales charge. Unless otherwise stated, performance does not reflect the deduction of taxes on Fund distributions or redemptions of Fund shares.Performance prior to the inception date of a class may be linked to the performance of an older class of the Fund. This linked performance is adjusted for any applicable sales charge, but is not adjusted for class expense differences. If adjusted for such differences, the performance would be different. The performance of Class I is linked to Class A. Performance presented in the Financial Highlights included in the financial statements is not linked.Calvert Research and Management became the investment adviser to each Fund on December 31, 2016. Performance reflected prior to such date is that of each Fund’s former investment adviser. |
| 3 | Source: Fund prospectus. Net expense ratios reflect a contractual expense reimbursement for Calvert Growth Allocation Fund that continues through 1/31/21. Without the reimbursement, performance would have been lower. The expense ratios for the current reporting period can be found in the Financial Highlights section of this report. |
| Fund profiles subject to change due to active management. |
Table of Contents
| Beginning Account Value (10/1/19) | Ending Account Value (3/31/20) | Expenses Paid During Period* (10/1/19 – 3/31/20) | Annualized Expense Ratio | |
| Actual | ||||
| Class A | $1,000.00 | $942.40 | $1.99 | 0.41% |
| Class C | $1,000.00 | $938.60 | $5.62 | 1.16% |
| Class I | $1,000.00 | $943.70 | $0.78 | 0.16% |
| Hypothetical | ||||
| (5% return per year before expenses) | ||||
| Class A | $1,000.00 | $1,022.95 | $2.07 | 0.41% |
| Class C | $1,000.00 | $1,019.20 | $5.86 | 1.16% |
| Class I | $1,000.00 | $1,024.20 | $0.81 | 0.16% |
| * | Expenses are equal to the Fund's annualized expense ratio for the indicated Class, multiplied by the average account value over the period, multiplied by 183/366 (to reflect the one-half year period). The Example assumes that the $1,000 was invested at the net asset value per share determined at the close of business on September 30, 2019. Expenses do not include fees and expenses incurred indirectly from investment in underlying affiliated and/or unaffiliated funds. |
Table of Contents
| Beginning Account Value (10/1/19) | Ending Account Value (3/31/20) | Expenses Paid During Period* (10/1/19 – 3/31/20) | Annualized Expense Ratio | |
| Actual | ||||
| Class A | $1,000.00 | $906.50 | $1.95 | 0.41% |
| Class C | $1,000.00 | $902.90 | $5.52 | 1.16% |
| Class I | $1,000.00 | $907.20 | $0.76 | 0.16% |
| Hypothetical | ||||
| (5% return per year before expenses) | ||||
| Class A | $1,000.00 | $1,022.95 | $2.07 | 0.41% |
| Class C | $1,000.00 | $1,019.20 | $5.86 | 1.16% |
| Class I | $1,000.00 | $1,024.20 | $0.81 | 0.16% |
| * | Expenses are equal to the Fund's annualized expense ratio for the indicated Class, multiplied by the average account value over the period, multiplied by 183/366 (to reflect the one-half year period). The Example assumes that the $1,000 was invested at the net asset value per share determined at the close of business on September 30, 2019. Expenses do not include fees and expenses incurred indirectly from investment in underlying affiliated and/or unaffiliated funds. |
| Beginning Account Value (10/1/19) | Ending Account Value (3/31/20) | Expenses Paid During Period* (10/1/19 – 3/31/20) | Annualized Expense Ratio | |
| Actual | ||||
| Class A | $1,000.00 | $866.60 | $2.01** | 0.43% |
| Class C | $1,000.00 | $863.80 | $5.50** | 1.18% |
| Class I | $1,000.00 | $867.70 | $0.84** | 0.18% |
| Hypothetical | ||||
| (5% return per year before expenses) | ||||
| Class A | $1,000.00 | $1,022.85 | $2.17** | 0.43% |
| Class C | $1,000.00 | $1,019.10 | $5.96** | 1.18% |
| Class I | $1,000.00 | $1,024.10 | $0.91** | 0.18% |
| * | Expenses are equal to the Fund's annualized expense ratio for the indicated Class, multiplied by the average account value over the period, multiplied by 183/366 (to reflect the one-half year period). The Example assumes that the $1,000 was invested at the net asset value per share determined at the close of business on September 30, 2019. Expenses do not include fees and expenses incurred indirectly from investment in underlying affiliated and/or unaffiliated funds. |
| ** | Absent a waiver and/or reimbursement of expenses by an affiliate, expenses would be higher. |
Table of Contents
| Mutual Funds(1) — 94.0% |
| Security | Shares | Value |
| Equity Funds — 32.6% | ||
| Calvert Impact Fund, Inc.: | ||
| Calvert Small-Cap Fund, Class R6 | 80,555 | $ 1,726,299 |
| Calvert Responsible Index Series, Inc.: | ||
| Calvert International Responsible Index Fund, Class R6 | 93,562 | 1,813,233 |
| Calvert US Large-Cap Core Responsible Index Fund, Class R6 | 915,280 | 20,584,649 |
| Calvert US Large-Cap Growth Responsible Index Fund, Class I | 256,481 | 7,201,980 |
| Calvert US Large-Cap Value Responsible Index Fund, Class I | 745,907 | 13,784,362 |
| Calvert US Mid-Cap Core Responsible Index Fund, Class I | 40,672 | 876,482 |
| Calvert Social Investment Fund: | ||
| Calvert Equity Fund, Class R6 | 73,531 | 4,091,978 |
| Calvert World Values Fund, Inc.: | ||
| Calvert Emerging Markets Advancement Fund, Class I | 264,816 | 2,240,347 |
| Calvert Emerging Markets Equity Fund, Class R6 | 253,269 | 3,454,591 |
| Calvert International Equity Fund, Class R6 | 357,517 | 6,217,222 |
| Calvert International Opportunities Fund, Class R6 | 360,251 | 4,726,490 |
| Calvert Mid-Cap Fund, Class I | 42,038 | 1,344,369 |
| $68,062,002 | ||
| Income Funds — 61.4% | ||
| Calvert Management Series: | ||
| Calvert Flexible Bond Fund (formerly, Calvert Absolute Return Bond Fund), Class R6 | 1,274,700 | $17,348,667 |
| Calvert Floating-Rate Advantage Fund, Class R6 | 1,848,231 | 15,654,519 |
| Calvert Social Investment Fund: | ||
| Calvert Bond Fund, Class R6 | 4,099,360 | 65,958,695 |
| The Calvert Fund: | ||
| Calvert High Yield Bond Fund, Class I | 176,098 | 4,219,321 |
| Calvert Short Duration Income Fund, Class R6 | 416,245 | 6,435,142 |
| Calvert Ultra-Short Duration Income Fund, Class R6 | 1,931,064 | 18,364,420 |
| $127,980,764 | ||
| Total Mutual Funds (identified cost $205,967,512) | $196,042,766 | |
| U.S. Treasury Obligations — 6.2% | ||
| Security | Principal Amount (000's omitted) | Value |
| U.S. Treasury Inflation-Protected Bonds: | ||
| 0.625%, 4/15/23(2) | $ 3,368 | $ 3,393,631 |
| 0.750%, 2/15/45(2) | 3,194 | 3,654,559 |
| Security | Principal Amount (000's omitted) | Value |
| U.S. Treasury Inflation-Protected Bonds: (continued) | ||
| 0.875%, 1/15/29(2)(3) | $ 5,438 | $ 5,915,833 |
| Total U.S. Treasury Obligations (identified cost $12,063,437) | $ 12,964,023 | |
| Total Purchased Call Options — 0.0%(4) (identified cost $41,791) | $ 980 | |
| Total Investments — 100.2% (identified cost $218,072,740) | $209,007,769 | |
| Total Written Put Options — (0.2)% (premiums received $45,329) | $ (399,560) | |
| Other Assets, Less Liabilities — (0.0)%(4) | $ (111,950) | |
| Net Assets — 100.0% | $208,496,259 |
| The percentage shown for each investment category in the Schedule of Investments is based on net assets. | ||
| (1) | Affiliated fund. | |
| (2) | Inflation-linked security whose principal is adjusted for inflation based on changes in the U.S. Consumer Price Index. Interest is calculated based on the inflation-adjusted principal. | |
| (3) | Security (or a portion thereof) has been pledged to cover margin requirements on open futures contracts. | |
| (4) | Amount is less than 0.05% or (0.05)%, as applicable. | |
| Description | Number of Contracts | Notional Amount | Exercise Price | Expiration Date | Value |
| S&P 500 Index | 8 | $2,067,672 | $3,375 | 4/17/20 | $80 |
| S&P 500 Index | 8 | 2,067,672 | 3,275 | 5/15/20 | 900 |
| Total | $980 |
Table of Contents
| Description | Number of Contracts | Notional Amount | Exercise Price | Expiration Date | Value |
| S&P 500 Index | (8) | $(2,067,672) | $2,900 | 4/17/20 | $(262,760) |
| S&P 500 Index | (8) | (2,067,672) | 2,600 | 5/15/20 | (136,800) |
| Total | $(399,560) |
| (1) | Amount is less than 0.05%. |
| Description | Number of Contracts | Position | Expiration Date | Notional Amount | Value/ Unrealized Appreciation (Depreciation) |
| Equity Futures | |||||
| E-mini S&P 500 Index | 4 | Long | 6/19/20 | $513,940 | $507 |
| Interest Rate Futures | |||||
| U.S. 2-Year Treasury Note | 186 | Long | 6/30/20 | 40,991,203 | 555,965 |
| U.S. 5-Year Treasury Note | 73 | Long | 6/30/20 | 9,151,234 | 267,402 |
| U.S. Ultra 10-Year Treasury Note | 38 | Long | 6/19/20 | 5,929,188 | 308,386 |
| U.S. Ultra-Long Treasury Bond | 7 | Long | 6/19/20 | 1,553,125 | 134,565 |
| $1,266,825 |
Table of Contents
| Mutual Funds(1) — 94.1% |
| Security | Shares | Value |
| Equity Funds — 60.2% | ||
| Calvert Impact Fund, Inc.: | ||
| Calvert Small-Cap Fund, Class R6 | 245,832 | $ 5,268,179 |
| Calvert Responsible Index Series, Inc.: | ||
| Calvert International Responsible Index Fund, Class R6 | 316,688 | 6,137,410 |
| Calvert US Large-Cap Core Responsible Index Fund, Class R6 | 2,515,664 | 56,577,281 |
| Calvert US Large-Cap Growth Responsible Index Fund, Class I | 578,552 | 16,245,750 |
| Calvert US Large-Cap Value Responsible Index Fund, Class I | 1,718,345 | 31,755,016 |
| Calvert US Mid-Cap Core Responsible Index Fund, Class I | 120,572 | 2,598,318 |
| Calvert Social Investment Fund: | ||
| Calvert Equity Fund, Class R6 | 165,898 | 9,232,192 |
| Calvert World Values Fund, Inc.: | ||
| Calvert Emerging Markets Advancement Fund, Class I | 801,770 | 6,782,976 |
| Calvert Emerging Markets Equity Fund, Class R6 | 679,533 | 9,268,835 |
| Calvert International Equity Fund, Class R6 | 909,918 | 15,823,480 |
| Calvert International Opportunities Fund, Class R6 | 1,155,224 | 15,156,537 |
| Calvert Mid-Cap Fund, Class I | 84,306 | 2,696,105 |
| $177,542,079 | ||
| Income Funds — 33.9% | ||
| Calvert Management Series: | ||
| Calvert Flexible Bond Fund (formerly, Calvert Absolute Return Bond Fund), Class R6 | 1,409,811 | $19,187,524 |
| Calvert Floating-Rate Advantage Fund, Class R6 | 1,778,757 | 15,066,074 |
| Calvert Social Investment Fund: | ||
| Calvert Bond Fund, Class R6 | 1,849,217 | 29,753,899 |
| The Calvert Fund: | ||
| Calvert High Yield Bond Fund, Class I | 246,520 | 5,906,618 |
| Calvert Short Duration Income Fund, Class R6 | 626,028 | 9,678,391 |
| Calvert Ultra-Short Duration Income Fund, Class R6 | 2,134,309 | 20,297,279 |
| $99,889,785 | ||
| Total Mutual Funds (identified cost $293,852,083) | $277,431,864 | |
| U.S. Treasury Obligations — 6.1% | ||
| Security | Principal Amount (000's omitted) | Value |
| U.S. Treasury Inflation-Protected Bonds: | ||
| 0.625%, 4/15/23(2) | $ 4,566 | $ 4,601,232 |
| 0.750%, 2/15/45(2) | 5,033 | 5,758,813 |
| Security | Principal Amount (000's omitted) | Value |
| U.S. Treasury Inflation-Protected Bonds: (continued) | ||
| 0.875%, 1/15/29(2)(3) | $ 6,951 | $ 7,560,355 |
| Total U.S. Treasury Obligations (identified cost $16,611,754) | $ 17,920,400 | |
| Total Purchased Call Options — 0.0%(4) (identified cost $62,686) | $ 1,470 | |
| Total Investments — 100.2% (identified cost $310,526,523) | $295,353,734 | |
| Total Written Put Options — (0.2)% (premiums received $67,994) | $ (599,340) | |
| Other Assets, Less Liabilities — (0.0)%(4) | $ (21,137) | |
| Net Assets — 100.0% | $294,733,257 |
| The percentage shown for each investment category in the Schedule of Investments is based on net assets. | ||
| (1) | Affiliated company. | |
| (2) | Inflation-linked security whose principal is adjusted for inflation based on changes in the U.S. Consumer Price Index. Interest is calculated based on the inflation-adjusted principal. | |
| (3) | Security (or a portion thereof) has been pledged to cover margin requirements on open futures contracts. | |
| (4) | Amount is less than 0.05% or (0.05)%, as applicable. | |
| Description | Number of Contracts | Notional Amount | Exercise Price | Expiration Date | Value |
| S&P 500 Index | 12 | $3,101,508 | $3,375 | 4/17/20 | $120 |
| S&P 500 Index | 12 | 3,101,508 | 3,275 | 5/15/20 | 1,350 |
| Total | $1,470 |
Table of Contents
| Description | Number of Contracts | Notional Amount | Exercise Price | Expiration Date | Value |
| S&P 500 Index | (12) | $(3,101,508) | $2,900 | 4/17/20 | $(394,140) |
| S&P 500 Index | (12) | (3,101,508) | 2,600 | 5/15/20 | (205,200) |
| Total | $(599,340) |
| (1) | Amount is less than 0.05%. |
| Description | Number of Contracts | Position | Expiration Date | Notional Amount | Value/ Unrealized Appreciation (Depreciation) |
| Equity Futures | |||||
| E-mini S&P 500 Index | 3 | Long | 6/19/20 | $385,455 | $381 |
| Interest Rate Futures | |||||
| U.S. 2-Year Treasury Note | 246 | Long | 6/30/20 | 54,214,172 | 735,308 |
| U.S. Ultra 10-Year Treasury Note | 25 | Long | 6/19/20 | 3,900,781 | 202,885 |
| U.S. Ultra-Long Treasury Bond | (17) | Short | 6/19/20 | (3,771,875) | (323,571) |
| $615,003 |
Table of Contents
| Mutual Funds(1) — 93.3% |
| Security | Shares | Value |
| Equity Funds — 88.0% | ||
| Calvert Impact Fund, Inc.: | ||
| Calvert Small-Cap Fund, Class R6 | 231,667 | $ 4,964,613 |
| Calvert Responsible Index Series, Inc.: | ||
| Calvert International Responsible Index Fund, Class R6 | 253,089 | 4,904,870 |
| Calvert US Large-Cap Core Responsible Index Fund, Class R6 | 1,533,533 | 34,489,147 |
| Calvert US Large-Cap Growth Responsible Index Fund, Class I | 390,337 | 10,960,665 |
| Calvert US Large-Cap Value Responsible Index Fund, Class I | 1,206,588 | 22,297,750 |
| Calvert US Mid-Cap Core Responsible Index Fund, Class I | 92,980 | 2,003,723 |
| Calvert Social Investment Fund: | ||
| Calvert Equity Fund, Class R6 | 111,945 | 6,229,756 |
| Calvert World Values Fund, Inc.: | ||
| Calvert Emerging Markets Advancement Fund, Class I | 564,589 | 4,776,425 |
| Calvert Emerging Markets Equity Fund, Class R6 | 603,591 | 8,232,984 |
| Calvert International Equity Fund, Class R6 | 795,351 | 13,831,162 |
| Calvert International Opportunities Fund, Class R6 | 935,068 | 12,268,085 |
| Calvert Mid-Cap Fund, Class I | 74,655 | 2,387,459 |
| $127,346,639 | ||
| Income Funds — 5.3% | ||
| Calvert Management Series: | ||
| Calvert Floating-Rate Advantage Fund, Class R6 | 536,760 | $4,546,359 |
| The Calvert Fund: | ||
| Calvert High Yield Bond Fund, Class I | 121,416 | 2,909,133 |
| Calvert Ultra-Short Duration Income Fund, Class R6 | 24,070 | 228,903 |
| $7,684,395 | ||
| Total Mutual Funds (identified cost $145,493,721) | $135,031,034 | |
| U.S. Treasury Obligations — 7.0% | ||
| Security | Principal Amount (000's omitted) | Value |
| U.S. Treasury Inflation-Protected Bonds: | ||
| 0.250%, 2/15/50(2) | $ 3,110 | $ 3,211,261 |
| 0.750%, 2/15/45(2) | 2,538 | 2,903,846 |
| Security | Principal Amount (000's omitted) | Value |
| U.S. Treasury Inflation-Protected Bonds: (continued) | ||
| 0.875%, 1/15/29(2)(3) | $ 3,658 | $ 3,979,076 |
| Total U.S. Treasury Obligations (identified cost $9,369,806) | $ 10,094,183 | |
| Total Purchased Call Options — 0.0%(4) (identified cost $52,238) | $ 1,225 | |
| Total Investments — 100.3% (identified cost $154,915,765) | $145,126,442 | |
| Total Written Put Options — (0.3)% (premiums received $56,662) | $ (499,450) | |
| Other Assets, Less Liabilities — 0.0%(4) | $ 132,201 | |
| Net Assets — 100.0% | $144,759,193 |
| The percentage shown for each investment category in the Schedule of Investments is based on net assets. | ||
| (1) | Affiliated company. | |
| (2) | Inflation-linked security whose principal is adjusted for inflation based on changes in the U.S. Consumer Price Index. Interest is calculated based on the inflation-adjusted principal. | |
| (3) | Security (or a portion thereof) has been pledged to cover margin requirements on open futures contracts. | |
| (4) | Amount is less than 0.05%. | |
| Description | Number of Contracts | Notional Amount | Exercise Price | Expiration Date | Value |
| S&P 500 Index | 10 | $2,584,590 | $3,375 | 4/17/20 | $100 |
| S&P 500 Index | 10 | 2,584,590 | 3,275 | 5/15/20 | 1,125 |
| Total | $1,225 |
Table of Contents
| Description | Number of Contracts | Notional Amount | Exercise Price | Expiration Date | Value |
| S&P 500 Index | (10) | $(2,584,590) | $2,900 | 4/17/20 | $(328,450) |
| S&P 500 Index | (10) | (2,584,590) | 2,600 | 5/15/20 | (171,000) |
| Total | $(499,450) |
| (1) | Amount is less than 0.05%. |
| Description | Number of Contracts | Position | Expiration Date | Notional Amount | Value/ Unrealized Appreciation (Depreciation) |
| Equity Futures | |||||
| E-mini S&P 500 Index | 59 | Long | 6/19/20 | $7,580,615 | $686,105 |
| Interest Rate Futures | |||||
| U.S. 2-Year Treasury Note | 105 | Long | 6/30/20 | 23,140,195 | 313,851 |
| U.S. 5-Year Treasury Note | (55) | Short | 6/30/20 | (6,894,765) | (201,389) |
| U.S. Ultra-Long Treasury Bond | (45) | Short | 6/19/20 | (9,984,375) | (718,005) |
| $80,562 |
Table of Contents
| March 31, 2020 | |||
| Conservative Allocation Fund | Moderate Allocation Fund | Growth Allocation Fund | |
| Assets | |||
| Investments in securities of unaffiliated issuers, at value (identified cost $12,105,228, $16,674,440 and $9,422,044, respectively) | $12,965,003 | $17,921,870 | $10,095,408 |
| Investments in securities of affiliated issuers, at value (identified cost $205,967,512, $293,852,083 and $145,493,721, respectively) | 196,042,766 | 277,431,864 | 135,031,034 |
| Receivable for variation margin on open futures contracts | — | 39,723 | 31,892 |
| Receivable for investments sold | — | 1,124,143 | 913,502 |
| Receivable for capital shares sold | 782,828 | 430,406 | 220,727 |
| Interest receivable | 22,813 | 30,813 | 10,160 |
| Dividends receivable - affiliated | 326,295 | 259,464 | 20,202 |
| Receivable from affiliate | — | — | 7,040 |
| Trustees' deferred compensation plan | 115,951 | 170,536 | 90,163 |
| Due from affiliate | — | — | 136,347 |
| Total assets | $210,255,656 | $297,408,819 | $146,556,475 |
| Liabilities | |||
| Payable for variation margin on open futures contracts | $43,949 | $— | $— |
| Written options outstanding, at value (premiums received $45,329, $67,994 and $56,662, respectively) | 399,560 | 599,340 | 499,450 |
| Payable for investments purchased | 798,227 | 259,454 | 20,186 |
| Payable for capital shares redeemed | 273,598 | 1,483,256 | 1,068,804 |
| Payable to affiliates: | |||
| Distribution and service fees | 57,154 | 76,594 | 37,945 |
| Sub-transfer agency fee | 2,472 | 5,253 | 4,510 |
| Trustees' deferred compensation plan | 115,951 | 170,536 | 90,163 |
| Other | 4,088 | — | — |
| Accrued expenses | 64,398 | 81,129 | 76,224 |
| Total liabilities | $1,759,397 | $2,675,562 | $1,797,282 |
| Net Assets | $208,496,259 | $294,733,257 | $144,759,193 |
| Sources of Net Assets | |||
| Paid-in capital | $214,597,433 | $306,962,664 | $154,688,184 |
| Accumulated loss | (6,101,174) | (12,229,407) | (9,928,991) |
| Total | $208,496,259 | $294,733,257 | $144,759,193 |
| Class A Shares | |||
| Net Assets | $153,194,975 | $219,553,570 | $119,921,126 |
| Shares Outstanding | 9,577,049 | 12,919,317 | 7,029,792 |
| Net Asset Value and Redemption Price Per Share (net assets ÷ shares of beneficial interest outstanding) | $16.00 | $16.99 | $17.06 |
| Maximum Offering Price Per Share (100 ÷ 95.25 of net asset value per share) | $16.80 | $17.84 | $17.91 |
| Class C Shares | |||
| Net Assets | $27,270,316 | $31,714,041 | $13,229,733 |
| Shares Outstanding | 1,725,830 | 1,969,112 | 918,604 |
| Net Asset Value and Offering Price Per Share* (net assets ÷ shares of beneficial interest outstanding) | $15.80 | $16.11 | $14.40 |
Table of Contents
| March 31, 2020 | |||
| Conservative Allocation Fund | Moderate Allocation Fund | Growth Allocation Fund | |
| Class I Shares | |||
| Net Assets | $28,030,968 | $43,465,646 | $11,608,334 |
| Shares Outstanding | 1,751,374 | 2,555,582 | 677,796 |
| Net Asset Value, Offering Price and Redemption Price Per Share (net assets ÷ shares of beneficial interest outstanding) | $16.01 | $17.01 | $17.13 |
| On sales of $50,000 or more, the offering price of Class A shares is reduced. | |
| * | Redemption price per share is equal to the net asset value less any applicable contingent deferred sales charge. |
Table of Contents
| Six Months Ended March 31, 2020 | |||
| Conservative Allocation Fund | Moderate Allocation Fund | Growth Allocation Fund | |
| Investment Income | |||
| Dividend income - affiliated issuers | $2,815,470 | $4,025,153 | $1,930,732 |
| Interest income | 117,740 | 162,731 | 52,624 |
| Total investment income | $2,933,210 | $4,187,884 | $1,983,356 |
| Expenses | |||
| Distribution and service fees: | |||
| Class A | $206,022 | $316,536 | $177,618 |
| Class C | 149,832 | 185,988 | 78,220 |
| Trustees' fees and expenses | 6,315 | 9,269 | 4,615 |
| Custodian fees | 916 | 984 | 816 |
| Transfer agency fees and expenses | 100,684 | 169,444 | 117,191 |
| Accounting fees | 14,893 | 18,618 | 10,251 |
| Professional fees | 20,090 | 23,720 | 18,955 |
| Registration fees | 30,711 | 30,541 | 29,666 |
| Reports to shareholders | 2,852 | 11,108 | 4,494 |
| Miscellaneous | 9,491 | 13,605 | 9,811 |
| Total expenses | $541,806 | $779,813 | $451,637 |
| Waiver and/or reimbursement of expenses by affiliate | $— | $— | $(39,514) |
| Reimbursement of expenses - other | (3,099) | (4,737) | (2,428) |
| Net expenses | $538,707 | $775,076 | $409,695 |
| Net investment income | $2,394,503 | $3,412,808 | $1,573,661 |
| Realized and Unrealized Gain (Loss) | |||
| Net realized gain (loss): | |||
| Investment securities - unaffiliated issuers | $33,785 | $47,396 | $151,472 |
| Investment securities - affiliated issuers | 748,498 | 2,349,154 | 628,000 |
| Futures contracts | 463,481 | (214,324) | (646,387) |
| Capital gains distributions received from affiliated issuers | 1,025,721 | 1,248,635 | 707,217 |
| Net realized gain | $2,271,485 | $3,430,861 | $840,302 |
| Change in unrealized appreciation (depreciation): | |||
| Investment securities - unaffiliated issuers | $339,994 | $498,654 | $341,404 |
| Investment securities - affiliated issuers | (19,577,726) | (38,725,557) | (25,043,445) |
| Futures contracts | 1,525,890 | 748,928 | (20,173) |
| Written options | (354,231) | (531,346) | (442,788) |
| Foreign currency | 1,918 | 4,645 | 5,446 |
| Net change in unrealized appreciation (depreciation) | $(18,064,155) | $(38,004,676) | $(25,159,556) |
| Net realized and unrealized loss | $(15,792,670) | $(34,573,815) | $(24,319,254) |
| Net decrease in net assets from operations | $(13,398,167) | $(31,161,007) | $(22,745,593) |
Table of Contents
| Six Months Ended March 31, 2020 (Unaudited) | |||
| Conservative Allocation Fund | Moderate Allocation Fund | Growth Allocation Fund | |
| Increase (Decrease) in Net Assets | |||
| From operations: | |||
| Net investment income | $2,394,503 | $3,412,808 | $1,573,661 |
| Net realized gain | 2,271,485 | 3,430,861 | 840,302 |
| Net change in unrealized appreciation (depreciation) | (18,064,155) | (38,004,676) | (25,159,556) |
| Net decrease in net assets from operations | $(13,398,167) | $(31,161,007) | $(22,745,593) |
| Distributions to shareholders: | |||
| Class A | $(5,538,737) | $(9,890,517) | $(5,097,556) |
| Class C | (893,102) | (1,410,487) | (552,431) |
| Class I | (1,029,962) | (1,866,810) | (476,281) |
| Total distributions to shareholders | $(7,461,801) | $(13,167,814) | $(6,126,268) |
| Capital share transactions: | |||
| Class A | $9,225,347 | $5,382,892 | $7,344,775 |
| Class C | 215,427 | (30,372) | 671,679 |
| Class I | 2,611,774 | 7,214,687 | 2,087,384 |
| Net increase in net assets from capital share transactions | $12,052,548 | $12,567,207 | $10,103,838 |
| Net decrease in net assets | $(8,807,420) | $(31,761,614) | $(18,768,023) |
| Net Assets | |||
| At beginning of period | $217,303,679 | $326,494,871 | $163,527,216 |
| At end of period | $208,496,259 | $294,733,257 | $144,759,193 |
Table of Contents
| Year Ended September 30, 2019 | |||
| Conservative Allocation Fund | Moderate Allocation Fund | Growth Allocation Fund | |
| Increase (Decrease) in Net Assets | |||
| From operations: | |||
| Net investment income | $4,164,998 | $4,912,035 | $1,546,244 |
| Net realized gain | 7,016,867 | 13,347,057 | 6,686,553 |
| Net change in unrealized appreciation (depreciation) | 1,391,157 | (4,673,623) | (4,221,920) |
| Net increase in net assets from operations | $12,573,022 | $13,585,469 | $4,010,877 |
| Distributions to shareholders: | |||
| Class A | $(6,238,683) | $(11,972,228) | $(6,918,489) |
| Class C | (1,176,903) | (2,132,802) | (1,055,466) |
| Class I | (1,019,445) | (1,685,209) | (582,950) |
| Total distributions to shareholders | $(8,435,031) | $(15,790,239) | $(8,556,905) |
| Capital share transactions: | |||
| Class A | $5,782,398 | $17,481,020 | $9,857,932 |
| Class C | (4,452,570) | (8,052,463) | (3,170,414) |
| Class I | 8,150,298 | 13,099,745 | 95,095 |
| Net increase in net assets from capital share transactions | $9,480,126 | $22,528,302 | $6,782,613 |
| Net increase in net assets | $13,618,117 | $20,323,532 | $2,236,585 |
| Net Assets | |||
| At beginning of year | $203,685,562 | $306,171,339 | $161,290,631 |
| At end of year | $217,303,679 | $326,494,871 | $163,527,216 |
Table of Contents
| Conservative Allocation Fund — Class A | ||||||
| Six Months Ended March 31, 2020 (Unaudited) | Year Ended September 30, | |||||
| 2019 | 2018 | 2017 | 2016 | 2015 | ||
| Net asset value — Beginning of period | $17.57 | $17.25 | $17.25 | $16.48 | $16.59 | $17.22 |
| Income (Loss) From Operations | ||||||
| Net investment income(1) | $0.19 | $0.37 | $0.33 | $0.30 | $0.31 | $0.30 |
| Net realized and unrealized gain (loss) | (1.16) | 0.70 | 0.36 | 0.96 | 0.55 | 0.05 |
| Total income (loss) from operations | $(0.97) | $1.07 | $0.69 | $1.26 | $0.86 | $0.35 |
| Less Distributions | ||||||
| From net investment income | $(0.22) | $(0.41) | $(0.42) | $(0.33) | $(0.30) | $(0.29) |
| From net realized gain | (0.38) | (0.34) | (0.27) | (0.16) | (0.67) | (0.69) |
| Total distributions | $(0.60) | $(0.75) | $(0.69) | $(0.49) | $(0.97) | $(0.98) |
| Net asset value — End of period | $16.00 | $17.57 | $17.25 | $17.25 | $16.48 | $16.59 |
| Total Return(2) | (5.76)%(3) | 6.57% | 4.08% | 7.84% | 5.42% | 2.01% |
| Ratios/Supplemental Data | ||||||
| Net assets, end of period (000’s omitted) | $153,195 | $159,188 | $150,237 | $138,512 | $131,576 | $112,881 |
| Ratios (as a percentage of average daily net assets):(4) | ||||||
| Total expenses(5) | 0.41%(6) | 0.44% | 0.44% | 0.51% | 0.67% | 0.69% |
| Net expenses(5) | 0.41%(6) | 0.44% | 0.44% | 0.44% | 0.44% | 0.44% |
| Net investment income | 2.20%(6) | 2.18% | 1.93% | 1.77% | 1.90% | 1.76% |
| Portfolio Turnover | 20%(3) | 85% | 94% | 46% | 61% | 8% |
| (1) | Computed using average shares outstanding. |
| (2) | Returns are historical and are calculated by determining the percentage change in net asset value with all distributions reinvested and do not reflect the effect of sales charges, if any. |
| (3) | Not annualized. |
| (4) | Total expenses do not reflect amounts reimbursed and/or waived by the adviser and certain of its affiliates, if applicable. Net expenses are net of all reductions and represent the net expenses paid by the Fund. |
| (5) | Amounts do not include the expenses of the Underlying Funds and/or unaffiliated funds. |
| (6) | Annualized. |
Table of Contents
| Conservative Allocation Fund — Class C | ||||||
| Six Months Ended March 31, 2020 (Unaudited) | Year Ended September 30, | |||||
| 2019 | 2018 | 2017 | 2016 | 2015 | ||
| Net asset value — Beginning of period | $17.36 | $17.05 | $17.06 | $16.28 | $16.40 | $17.06 |
| Income (Loss) From Operations | ||||||
| Net investment income(1) | $0.13 | $0.25 | $0.20 | $0.17 | $0.17 | $0.13 |
| Net realized and unrealized gain (loss) | (1.16) | 0.68 | 0.36 | 0.96 | 0.55 | 0.06 |
| Total income (loss) from operations | $(1.03) | $0.93 | $0.56 | $1.13 | $0.72 | $0.19 |
| Less Distributions | ||||||
| From net investment income | $(0.15) | $(0.28) | $(0.30) | $(0.19) | $(0.17) | $(0.16) |
| From net realized gain | (0.38) | (0.34) | (0.27) | (0.16) | (0.67) | (0.69) |
| Total distributions | $(0.53) | $(0.62) | $(0.57) | $(0.35) | $(0.84) | $(0.85) |
| Net asset value — End of period | $15.80 | $17.36 | $17.05 | $17.06 | $16.28 | $16.40 |
| Total Return(2) | (6.14)%(3) | 5.77% | 3.30% | 7.04% | 4.57% | 1.03% |
| Ratios/Supplemental Data | ||||||
| Net assets, end of period (000’s omitted) | $27,270 | $29,828 | $33,843 | $33,661 | $34,334 | $29,932 |
| Ratios (as a percentage of average daily net assets):(4) | ||||||
| Total expenses(5) | 1.16%(6) | 1.19% | 1.19% | 1.30% | 1.46% | 1.44% |
| Net expenses(5) | 1.16%(6) | 1.19% | 1.19% | 1.19% | 1.27% | 1.44% |
| Net investment income | 1.46%(6) | 1.47% | 1.17% | 1.03% | 1.07% | 0.76% |
| Portfolio Turnover | 20%(3) | 85% | 94% | 46% | 61% | 8% |
| (1) | Computed using average shares outstanding. |
| (2) | Returns are historical and are calculated by determining the percentage change in net asset value with all distributions reinvested and do not reflect the effect of sales charges, if any. |
| (3) | Not annualized. |
| (4) | Total expenses do not reflect amounts reimbursed and/or waived by the adviser and certain of its affiliates, if applicable. Net expenses are net of all reductions and represent the net expenses paid by the Fund. |
| (5) | Amounts do not include the expenses of the Underlying Funds and/or unaffiliated funds. |
| (6) | Annualized. |
Table of Contents
| Conservative Allocation Fund — Class I | |||||
| Six Months Ended March 31, 2020 (Unaudited) | Year Ended September 30, | Period Ended September 30, 2016(1) | |||
| 2019 | 2018 | 2017 | |||
| Net asset value — Beginning of period | $17.58 | $17.25 | $17.23 | $16.48 | $16.07 |
| Income (Loss) From Operations | |||||
| Net investment income(2) | $0.22 | $0.42 | $0.41 | $0.40 | $0.11 |
| Net realized and unrealized gain (loss) | (1.17) | 0.70 | 0.34 | 0.91 | 0.43 |
| Total income (loss) from operations | $(0.95) | $1.12 | $0.75 | $1.31 | $0.54 |
| Less Distributions | |||||
| From net investment income | $(0.24) | $(0.45) | $(0.46) | $(0.40) | $(0.13) |
| From net realized gain | (0.38) | (0.34) | (0.27) | (0.16) | — |
| Total distributions | $(0.62) | $(0.79) | $(0.73) | $(0.56) | $(0.13) |
| Net asset value — End of period | $16.01 | $17.58 | $17.25 | $17.23 | $16.48 |
| Total Return(3) | (5.63)%(4) | 6.89% | 4.40% | 8.22% | 3.40%(4) |
| Ratios/Supplemental Data | |||||
| Net assets, end of period (000’s omitted) | $28,031 | $28,288 | $19,605 | $3,052 | $1,034 |
| Ratios (as a percentage of average daily net assets):(5) | |||||
| Total expenses(6) | 0.16%(7) | 0.19% | 0.19% | 1.43% | 0.97%(7) |
| Net expenses(6) | 0.16%(7) | 0.16% | 0.09% | 0.09% | 0.09%(7) |
| Net investment income | 2.46%(7) | 2.44% | 2.36% | 2.37% | 1.93%(7) |
| Portfolio Turnover | 20%(4) | 85% | 94% | 46% | 61%(8) |
| (1) | From May 20, 2016 inception. |
| (2) | Computed using average shares outstanding. |
| (3) | Returns are historical and are calculated by determining the percentage change in net asset value with all distributions reinvested and do not reflect the effect of sales charges, if any. |
| (4) | Not annualized. |
| (5) | Total expenses do not reflect amounts reimbursed and/or waived by the adviser and certain of its affiliates, if applicable. Net expenses are net of all reductions and represent the net expenses paid by the Fund. |
| (6) | Amounts do not include the expenses of the Underlying Funds and/or unaffiliated funds. |
| (7) | Annualized. |
| (8) | For the year ended September 30, 2016. |
Table of Contents
| Moderate Allocation Fund — Class A | ||||||
| Six Months Ended March 31, 2020 (Unaudited) | Year Ended September 30, | |||||
| 2019 | 2018 | 2017 | 2016 | 2015 | ||
| Net asset value — Beginning of period | $19.49 | $19.77 | $19.32 | $17.86 | $18.84 | $19.80 |
| Income (Loss) From Operations | ||||||
| Net investment income(1) | $0.20 | $0.31 | $0.29 | $0.28 | $0.25 | $0.23 |
| Net realized and unrealized gain (loss) | (1.93) | 0.43 | 1.15 | 1.93 | 1.00 | (0.04) |
| Total income (loss) from operations | $(1.73) | $0.74 | $1.44 | $2.21 | $1.25 | $0.19 |
| Less Distributions | ||||||
| From net investment income | $(0.21) | $(0.40) | $(0.47) | $(0.28) | $(0.24) | $(0.21) |
| From net realized gain | (0.56) | (0.62) | (0.52) | (0.47) | (1.99) | (0.94) |
| Total distributions | $(0.77) | $(1.02) | $(0.99) | $(0.75) | $(2.23) | $(1.15) |
| Net asset value — End of period | $16.99 | $19.49 | $19.77 | $19.32 | $17.86 | $18.84 |
| Total Return(2) | (9.35)%(3) | 4.44% | 7.62% | 12.86% | 7.16% | 0.86% |
| Ratios/Supplemental Data | ||||||
| Net assets, end of period (000’s omitted) | $219,554 | $247,372 | $231,146 | $213,343 | $203,907 | $189,372 |
| Ratios (as a percentage of average daily net assets):(4) | ||||||
| Total expenses(5) | 0.41%(6) | 0.42% | 0.43% | 0.50% | 0.73% | 0.67% |
| Net expenses(5) | 0.41%(6) | 0.42% | 0.43% | 0.44% | 0.56% | 0.67% |
| Net investment income | 2.08%(6) | 1.65% | 1.47% | 1.52% | 1.43% | 1.14% |
| Portfolio Turnover | 20%(3) | 89% | 73% | 45% | 61% | 8% |
| (1) | Computed using average shares outstanding. |
| (2) | Returns are historical and are calculated by determining the percentage change in net asset value with all distributions reinvested and do not reflect the effect of sales charges, if any. |
| (3) | Not annualized. |
| (4) | Total expenses do not reflect amounts reimbursed and/or waived by the adviser and certain of its affiliates, if applicable. Net expenses are net of all reductions and represent the net expenses paid by the Fund. |
| (5) | Amounts do not include the expenses of the Underlying Funds and/or unaffiliated funds. |
| (6) | Annualized. |
Table of Contents
| Moderate Allocation Fund — Class C | ||||||
| Six Months Ended March 31, 2020 (Unaudited) | Year Ended September 30, | |||||
| 2019 | 2018 | 2017 | 2016 | 2015 | ||
| Net asset value — Beginning of period | $18.52 | $18.84 | $18.37 | $17.11 | $18.16 | $19.19 |
| Income (Loss) From Operations | ||||||
| Net investment income(1) | $0.12 | $0.19 | $0.13 | $0.14 | $0.11 | $0.07 |
| Net realized and unrealized gain (loss) | (1.82) | 0.38 | 1.10 | 1.84 | 0.97 | (0.02) |
| Total income (loss) from operations | $(1.70) | $0.57 | $1.23 | $1.98 | $1.08 | $0.05 |
| Less Distributions | ||||||
| From net investment income | $(0.15) | $(0.27) | $(0.24) | $(0.25) | $(0.14) | $(0.14) |
| From net realized gain | (0.56) | (0.62) | (0.52) | (0.47) | (1.99) | (0.94) |
| Total distributions | $(0.71) | $(0.89) | $(0.76) | $(0.72) | $(2.13) | $(1.08) |
| Net asset value — End of period | $16.11 | $18.52 | $18.84 | $18.37 | $17.11 | $18.16 |
| Total Return(2) | (9.71)%(3) | 3.68% | 6.83% | 12.02% | 6.37% | 0.09% |
| Ratios/Supplemental Data | ||||||
| Net assets, end of period (000’s omitted) | $31,714 | $36,679 | $45,880 | $42,529 | $42,695 | $40,560 |
| Ratios (as a percentage of average daily net assets):(4) | ||||||
| Total expenses(5) | 1.16%(6) | 1.17% | 1.18% | 1.29% | 1.51% | 1.42% |
| Net expenses(5) | 1.16%(6) | 1.17% | 1.18% | 1.19% | 1.32% | 1.42% |
| Net investment income | 1.33%(6) | 1.04% | 0.72% | 0.77% | 0.68% | 0.37% |
| Portfolio Turnover | 20%(3) | 89% | 73% | 45% | 61% | 8% |
| (1) | Computed using average shares outstanding. |
| (2) | Returns are historical and are calculated by determining the percentage change in net asset value with all distributions reinvested and do not reflect the effect of sales charges, if any. |
| (3) | Not annualized. |
| (4) | Total expenses do not reflect amounts reimbursed and/or waived by the adviser and certain of its affiliates, if applicable. Net expenses are net of all reductions and represent the net expenses paid by the Fund. |
| (5) | Amounts do not include the expenses of the Underlying Funds and/or unaffiliated funds. |
| (6) | Annualized. |
Table of Contents
| Moderate Allocation Fund — Class I | |||||
| Six Months Ended March 31, 2020 (Unaudited) | Year Ended September 30, | Period Ended September 30, 2016(1) | |||
| 2019 | 2018 | 2017 | |||
| Net asset value — Beginning of period | $19.51 | $19.79 | $19.36 | $17.85 | $17.10 |
| Income (Loss) From Operations | |||||
| Net investment income(2) | $0.23 | $0.35 | $0.33 | $0.26 | $0.07 |
| Net realized and unrealized gain (loss) | (1.93) | 0.44 | 1.19 | 2.02 | 0.76 |
| Total income (loss) from operations | $(1.70) | $0.79 | $1.52 | $2.28 | $0.83 |
| Less Distributions | |||||
| From net investment income | $(0.24) | $(0.45) | $(0.57) | $(0.30) | $(0.08) |
| From net realized gain | (0.56) | (0.62) | (0.52) | (0.47) | — |
| Total distributions | $(0.80) | $(1.07) | $(1.09) | $(0.77) | $(0.08) |
| Net asset value — End of period | $17.01 | $19.51 | $19.79 | $19.36 | $17.85 |
| Total Return(3) | (9.28)%(4) | 4.69% | 8.04% | 13.26% | 4.86%(4) |
| Ratios/Supplemental Data | |||||
| Net assets, end of period (000’s omitted) | $43,466 | $42,444 | $29,145 | $9,124 | $1,049 |
| Ratios (as a percentage of average daily net assets):(5) | |||||
| Total expenses(6) | 0.16%(7) | 0.17% | 0.17% | 0.55% | 0.54%(7) |
| Net expenses(6) | 0.16%(7) | 0.14% | 0.09% | 0.09% | 0.09%(7) |
| Net investment income | 2.32%(7) | 1.83% | 1.70% | 1.43% | 1.06%(7) |
| Portfolio Turnover | 20%(4) | 89% | 73% | 45% | 61%(8) |
| (1) | From May 20, 2016 inception. |
| (2) | Computed using average shares outstanding. |
| (3) | Returns are historical and are calculated by determining the percentage change in net asset value with all distributions reinvested and do not reflect the effect of sales charges, if any. |
| (4) | Not annualized. |
| (5) | Total expenses do not reflect amounts reimbursed and/or waived by the adviser and certain of its affiliates, if applicable. Net expenses are net of all reductions and represent the net expenses paid by the Fund. |
| (6) | Amounts do not include the expenses of the Underlying Funds and/or unaffiliated funds. |
| (7) | Annualized. |
| (8) | For the year ended September 30, 2016. |
Table of Contents
| Growth Allocation Fund — Class A | ||||||
| Six Months Ended March 31, 2020 (Unaudited) | Year Ended September 30, | |||||
| 2019 | 2018 | 2017 | 2016 | 2015 | ||
| Net asset value — Beginning of period | $20.38 | $21.16 | $20.27 | $18.12 | $19.32 | $20.68 |
| Income (Loss) From Operations | ||||||
| Net investment income(1) | $0.20 | $0.20 | $0.22 | $0.23 | $0.19 | $0.21 |
| Net realized and unrealized gain (loss) | (2.76) | 0.15 | 1.79 | 2.82 | 1.25 | (0.08) |
| Total income (loss) from operations | $(2.56) | $0.35 | $2.01 | $3.05 | $1.44 | $0.13 |
| Less Distributions | ||||||
| From net investment income | $(0.20) | $(0.36) | $(0.44) | $(0.23) | $(0.15) | $(0.21) |
| From net realized gain | (0.56) | (0.77) | (0.68) | (0.67) | (2.49) | (1.28) |
| Total distributions | $(0.76) | $(1.13) | $(1.12) | $(0.90) | $(2.64) | $(1.49) |
| Net asset value — End of period | $17.06 | $20.38 | $21.16 | $20.27 | $18.12 | $19.32 |
| Total Return(2) | (13.34)%(3) | 2.56% | 10.19% | 17.59% | 8.03% | 0.41% |
| Ratios/Supplemental Data | ||||||
| Net assets, end of period (000’s omitted) | $119,921 | $136,474 | $129,981 | $116,680 | $103,539 | $93,928 |
| Ratios (as a percentage of average daily net assets):(4) | ||||||
| Total expenses(5) | 0.48%(6) | 0.52% | 0.52% | 0.60% | 0.78% | 0.77% |
| Net expenses(5) | 0.43%(6) | 0.43% | 0.43% | 0.43% | 0.43% | 0.43% |
| Net investment income | 1.90%(6) | 1.04% | 1.07% | 1.24% | 1.10% | 1.04% |
| Portfolio Turnover | 26%(3) | 92% | 64% | 55% | 62% | 10% |
| (1) | Computed using average shares outstanding. |
| (2) | Returns are historical and are calculated by determining the percentage change in net asset value with all distributions reinvested and do not reflect the effect of sales charges, if any. |
| (3) | Not annualized. |
| (4) | Total expenses do not reflect amounts reimbursed and/or waived by the adviser and certain of its affiliates, if applicable. Net expenses are net of all reductions and represent the net expenses paid by the Fund. |
| (5) | Amounts do not include the expenses of the Underlying Funds and/or unaffiliated funds. |
| (6) | Annualized. |
Table of Contents
| Growth Allocation Fund — Class C | ||||||
| Six Months Ended March 31, 2020 (Unaudited) | Year Ended September 30, | |||||
| 2019 | 2018 | 2017 | 2016 | 2015 | ||
| Net asset value — Beginning of period | $17.26 | $18.10 | $17.50 | $15.85 | $17.21 | $18.71 |
| Income (Loss) From Operations | ||||||
| Net investment income (loss)(1) | $0.10 | $0.08 | $0.06 | $0.08 | $0.03 | $(0.01) |
| Net realized and unrealized gain (loss) | (2.33) | 0.08 | 1.53 | 2.45 | 1.10 | (0.07) |
| Total income (loss) from operations | $(2.23) | $0.16 | $1.59 | $2.53 | $1.13 | $(0.08) |
| Less Distributions | ||||||
| From net investment income | $(0.07) | $(0.23) | $(0.31) | $(0.21) | $— | $(0.14) |
| From net realized gain | (0.56) | (0.77) | (0.68) | (0.67) | (2.49) | (1.28) |
| Total distributions | $(0.63) | $(1.00) | $(0.99) | $(0.88) | $(2.49) | $(1.42) |
| Net asset value — End of period | $14.40 | $17.26 | $18.10 | $17.50 | $15.85 | $17.21 |
| Total Return(2) | (13.62)%(3) | 1.80% | 9.39% | 16.72% | 7.06% | (0.72)% |
| Ratios/Supplemental Data | ||||||
| Net assets, end of period (000’s omitted) | $13,230 | $15,189 | $19,372 | $18,045 | $17,578 | $16,400 |
| Ratios (as a percentage of average daily net assets):(4) | ||||||
| Total expenses(5) | 1.23%(6) | 1.27% | 1.27% | 1.42% | 1.60% | 1.55% |
| Net expenses(5) | 1.18%(6) | 1.18% | 1.18% | 1.18% | 1.31% | 1.55% |
| Net investment income (loss) | 1.15%(6) | 0.48% | 0.33% | 0.52% | 0.20% | (0.05)% |
| Portfolio Turnover | 26%(3) | 92% | 64% | 55% | 62% | 10% |
| (1) | Computed using average shares outstanding. |
| (2) | Returns are historical and are calculated by determining the percentage change in net asset value with all distributions reinvested and do not reflect the effect of sales charges, if any. |
| (3) | Not annualized. |
| (4) | Total expenses do not reflect amounts reimbursed and/or waived by the adviser and certain of its affiliates, if applicable. Net expenses are net of all reductions and represent the net expenses paid by the Fund. |
| (5) | Amounts do not include the expenses of the Underlying Funds and/or unaffiliated funds. |
| (6) | Annualized. |
Table of Contents
| Growth Allocation Fund — Class I | |||||
| Six Months Ended March 31, 2020 (Unaudited) | Year Ended September 30, | Period Ended September 30, 2016(1) | |||
| 2019 | 2018 | 2017 | |||
| Net asset value — Beginning of period | $20.48 | $21.26 | $20.35 | $18.14 | $17.17 |
| Income (Loss) From Operations | |||||
| Net investment income(2) | $0.22 | $0.24 | $0.25 | $0.36 | $0.01 |
| Net realized and unrealized gain (loss) | (2.76) | 0.16 | 1.84 | 2.77 | 0.96 |
| Total income (loss) from operations | $(2.54) | $0.40 | $2.09 | $3.13 | $0.97 |
| Less Distributions | |||||
| From net investment income | $(0.25) | $(0.41) | $(0.50) | $(0.25) | $— |
| From net realized gain | (0.56) | (0.77) | (0.68) | (0.67) | — |
| Total distributions | $(0.81) | $(1.18) | $(1.18) | $(0.92) | $— |
| Net asset value — End of period | $17.13 | $20.48 | $21.26 | $20.35 | $18.14 |
| Total Return(3) | (13.23)%(4) | 2.84% | 10.57% | 18.02% | 5.65%(4) |
| Ratios/Supplemental Data | |||||
| Net assets, end of period (000’s omitted) | $11,608 | $11,864 | $11,938 | $1,790 | $1,056 |
| Ratios (as a percentage of average daily net assets):(5) | |||||
| Total expenses(6) | 0.23%(7) | 0.27% | 0.26% | 1.76% | 0.57%(7) |
| Net expenses(6) | 0.18%(7) | 0.15% | 0.08% | 0.08% | 0.08%(7) |
| Net investment income | 2.10%(7) | 1.23% | 1.20% | 1.91% | 0.19%(7) |
| Portfolio Turnover | 26%(4) | 92% | 64% | 55% | 62%(8) |
| (1) | From May 20, 2016 inception. |
| (2) | Computed using average shares outstanding. |
| (3) | Returns are historical and are calculated by determining the percentage change in net asset value with all distributions reinvested and do not reflect the effect of sales charges, if any. |
| (4) | Not annualized. |
| (5) | Total expenses do not reflect amounts reimbursed and/or waived by the adviser and certain of its affiliates, if applicable. Net expenses are net of all reductions and represent the net expenses paid by the Fund. |
| (6) | Amounts do not include the expenses of the Underlying Funds and/or unaffiliated funds. |
| (7) | Annualized. |
| (8) | For the year ended September 30, 2016. |
Table of Contents
Table of Contents
| Asset Description | Level 1 | Level 2 | Level 3 | Total |
| Mutual Funds | $196,042,766 | $— | $— | $196,042,766 |
| U.S. Treasury Obligations | — | 12,964,023 | — | 12,964,023 |
| Purchased Options | 980 | — | — | 980 |
| Total Investments | $196,043,746 | $12,964,023 | $ — | $209,007,769 |
| Futures Contracts | $1,266,825 | $ — | $ — | $1,266,825 |
| Total | $197,310,571 | $12,964,023 | $ — | $210,274,594 |
| Liability Description | ||||
| Written Options | $(399,560) | $ — | $ — | $(399,560) |
| Total | $(399,560) | $ — | $ — | $(399,560) |
| Asset Description | Level 1 | Level 2 | Level 3 | Total |
| Mutual Funds | $277,431,864 | $— | $— | $277,431,864 |
| U.S. Treasury Obligations | — | 17,920,400 | — | 17,920,400 |
| Purchased Options | 1,470 | — | — | 1,470 |
| Total Investments | $277,433,334 | $17,920,400 | $ — | $295,353,734 |
| Futures Contracts | $938,574 | $ — | $ — | $938,574 |
| Total | $278,371,908 | $17,920,400 | $ — | $296,292,308 |
| Liability Description | ||||
| Futures Contracts | $(323,571) | $ — | $ — | $(323,571) |
| Written Options | (599,340) | — | — | (599,340) |
| Total | $(922,911) | $ — | $ — | $(922,911) |
Table of Contents
| Asset Description | Level 1 | Level 2 | Level 3 | Total |
| Mutual Funds | $135,031,034 | $— | $— | $135,031,034 |
| U.S. Treasury Obligations | — | 10,094,183 | — | 10,094,183 |
| Purchased Options | 1,225 | — | — | 1,225 |
| Total Investments | $135,032,259 | $10,094,183 | $ — | $145,126,442 |
| Futures Contracts | $999,956 | $ — | $ — | $999,956 |
| Total | $136,032,215 | $10,094,183 | $ — | $146,126,398 |
| Liability Description | ||||
| Futures Contracts | $(919,394) | $ — | $ — | $(919,394) |
| Written Options | (499,450) | — | — | (499,450) |
| Total | $(1,418,844) | $ — | $ — | $(1,418,844) |
Table of Contents
Table of Contents
| Conservative | Moderate | Growth | |
| Purchases | |||
| U.S. Government and Agency Securities | $— | $— | $3,106,014 |
| Non-U.S. Government and Agency Securities | 54,270,924 | 70,584,037 | 45,658,878 |
| Total Purchases | $54,270,924 | $70,584,037 | $48,764,892 |
| Sales | |||
| U.S. Government and Agency Securities | $3,872,060 | $6,131,518 | $1,497,476 |
| Non-U.S. Government and Agency Securities | 40,376,733 | 60,074,804 | 41,811,543 |
| Total Sales | $44,248,793 | $66,206,322 | $43,309,019 |
Table of Contents
| Conservative | Moderate | Growth | |
| Aggregate cost | $218,322,077 | $311,077,741 | $155,205,543 |
| Gross unrealized appreciation | $4,174,860 | $6,299,979 | $3,955,137 |
| Gross unrealized depreciation | (12,621,903) | (22,008,323) | (14,453,126) |
| Net unrealized depreciation | $(8,447,043) | $(15,708,344) | $(10,497,989) |
| Risk | Derivative | Statements of Assets and Liabilities Caption | Assets | Liabilities |
| Equity price | Futures contracts | Accumulated loss | $507(1) | $ — |
| Equity price | Purchased options | Investments in securities of unaffiliated issuers, at value | 980 | — |
| Equity price | Written options | Written options outstanding, at value | — | (399,560) |
| Interest rate | Futures contracts | Accumulated loss | 1,266,318(1) | — |
| Total | $1,267,805 | $(399,560) |
| (1) | Only the current day's variation margin is reported within the Statements of Assets and Liabilities as Receivable or Payable for variation margin on open futures contracts, as applicable. |
| Risk | Derivative | Statements of Assets and Liabilities Caption | Assets | Liabilities |
| Equity price | Futures contracts | Accumulated loss | $381(1) | $ — |
| Equity price | Purchased options | Investments in securities of unaffiliated issuers, at value | 1,470 | — |
| Equity price | Written options | Written options outstanding, at value | — | (599,340) |
| Interest rate | Futures contracts | Accumulated loss | 938,193(1) | (323,571)(1) |
| Total | $940,044 | $(922,911) |
| (1) | Only the current day's variation margin is reported within the Statements of Assets and Liabilities as Receivable or Payable for variation margin on open futures contracts, as applicable. |
Table of Contents
| Risk | Derivative | Statements of Assets and Liabilities Caption | Assets | Liabilities |
| Equity price | Futures contracts | Accumulated loss | $686,105(1) | $ — |
| Equity price | Purchased options | Investments in securities of unaffiliated issuers, at value | 1,225 | — |
| Equity price | Written options | Written options outstanding, at value | — | (499,450) |
| Interest rate | Futures contracts | Accumulated loss | 313,851(1) | (919,394)(1) |
| Total | $1,001,181 | $(1,418,844) |
| (1) | Only the current day's variation margin is reported within the Statements of Assets and Liabilities as Receivable or Payable for variation margin on open futures contracts, as applicable. |
| Statements of Operations Caption | Equity price | Interest rate | Total |
| Net realized gain (loss): | |||
| Investment securities - unaffiliated issuers(1) | $(5,828) | $— | $(5,828) |
| Futures contracts | (6,175) | 469,656 | 463,481 |
| Total | $(12,003) | $469,656 | $457,653 |
| Change in unrealized appreciation (depreciation): | |||
| Investment securities - unaffiliated issuers(1) | $(40,811) | $— | $(40,811) |
| Futures contracts | 507 | 1,525,383 | 1,525,890 |
| Written options | (354,231) | — | (354,231) |
| Total | $(394,535) | $1,525,383 | $1,130,848 |
| (1) | Relates to purchased options. |
| Statements of Operations Caption | Equity price | Interest rate | Total |
| Net realized gain (loss): | |||
| Investment securities - unaffiliated issuers(1) | $(15,298) | $— | $(15,298) |
| Futures contracts | (18,471) | (195,853) | (214,324) |
| Total | $(33,769) | $(195,853) | $(229,622) |
| Change in unrealized appreciation (depreciation): | |||
| Investment securities - unaffiliated issuers(1) | $(61,216) | $— | $(61,216) |
| Futures contracts | 381 | 748,547 | 748,928 |
| Written options | (531,346) | — | (531,346) |
| Total | $(592,181) | $748,547 | $156,366 |
| (1) | Relates to purchased options. |
Table of Contents
| Statements of Operations Caption | Equity price | Interest rate | Total |
| Net realized gain (loss): | |||
| Investment securities - unaffiliated issuers(1) | $(22,583) | $— | $(22,583) |
| Futures contracts | (343,162) | (303,225) | (646,387) |
| Total | $(365,745) | $(303,225) | $(668,970) |
| Change in unrealized appreciation (depreciation): | |||
| Investment securities - unaffiliated issuers(1) | $(51,013) | $— | $(51,013) |
| Futures contracts | 686,105 | (706,278) | (20,173) |
| Written options | (442,788) | — | (442,788) |
| Total | $192,304 | $(706,278) | $(513,974) |
| (1) | Relates to purchased options. |
| Conservative | Moderate | Growth | |
| Futures contracts — long | $59,806,000 | $58,094,000 | $26,536,000 |
| Futures contracts — short | $— | $2,582,000 | $12,309,000 |
| Purchased options | 33 | 82 | 116 |
| Written options | (5) | (7) | (6) |
Table of Contents
| Name of Calvert Fund | Value, beginning of period | Purchases | Sales proceeds | Net realized gain (loss) | Change in unrealized appreciation (depreciation) | Value, end of period | Dividend income | Capital gain distributions received | Shares, end of period |
| Bond Fund, Class R6 | $65,755,067 | $2,647,983 | $ — | $ — | $(2,444,355) | $65,958,695 | $879,165 | $600,861 | 4,099,360 |
| Emerging Markets Advancement Fund, Class I | — | 2,817,685 | — | — | (577,338) | 2,240,347 | — | 8,435 | 264,816 |
| Emerging Markets Equity Fund, Class R6 | 5,944,697 | 388,984 | (2,369,250) | 66,252 | (576,092) | 3,454,591 | 38,984 | — | 253,269 |
| Equity Fund, Class R6 | — | 4,584,619 | — | — | (492,641) | 4,091,978 | 14,722 | 111,897 | 73,531 |
| Flexible Bond Fund, Class R6 | 18,508,464 | 659,332 | — | — | (1,819,129) | 17,348,667 | 295,332 | — | 1,274,700 |
| Floating-Rate Advantage Fund, Class R6 | 14,706,589 | 2,693,318 | — | — | (1,745,388) | 15,654,519 | 353,336 | — | 1,848,231 |
| High Yield Bond Fund, Class I | — | 3,920,255 | — | — | 299,066 | 4,219,321 | 4,255 | — | 176,098 |
| International Equity Fund, Class R6 | 6,077,200 | 924,870 | — | — | (784,848) | 6,217,222 | 94,870 | — | 357,517 |
| International Opportunities Fund, Class R6 | 6,600,283 | 99,861 | (1,081,000) | 78,221 | (970,875) | 4,726,490 | 99,861 | — | 360,251 |
| International Responsible Index Fund, Class R6 | 2,255,256 | 39,514 | (137,000) | 7,095 | (351,632) | 1,813,233 | 39,514 | — | 93,562 |
| Mid-Cap Fund, Class I | 1,626,757 | 106,681 | — | — | (389,069) | 1,344,369 | 3,614 | 73,067 | 42,038 |
| Short Duration Income Fund, Class R6 | 6,518,473 | 240,816 | — | — | (324,147) | 6,435,142 | 91,817 | — | 416,245 |
| Small-Cap Fund, Class R6 | 3,311,467 | 47,430 | (1,194,000) | 58,820 | (497,418) | 1,726,299 | 8,291 | 39,139 | 80,555 |
| Ultra-Short Duration Income Fund, Class R6 | 22,011,207 | 25,406,958 | (27,732,483) | (539,488) | (781,774) | 18,364,420 | 281,413 | — | 1,931,064 |
| US Large-Cap Core Responsible Index Fund, Class R6 | 25,452,806 | 4,261,836 | (6,710,000) | 747,724 | (3,167,717) | 20,584,649 | 252,836 | — | 915,280 |
Table of Contents
| Name of Calvert Fund | Value, beginning of period | Purchases | Sales proceeds | Net realized gain (loss) | Change in unrealized appreciation (depreciation) | Value, end of period | Dividend income | Capital gain distributions received | Shares, end of period |
| US Large-Cap Growth Responsible Index Fund, Class I | $8,651,072 | $134,055 | $(1,152,000) | $329,837 | $(760,984) | $7,201,980 | $60,370 | $73,685 | 256,481 |
| US Large-Cap Value Responsible Index Fund, Class I | 12,478,256 | 5,275,505 | — | — | (3,969,399) | 13,784,362 | 286,521 | 107,984 | 745,907 |
| US Mid-Cap Core Responsible Index Fund, Class I | 1,080,209 | 21,222 | (1,000) | 37 | (223,986) | 876,482 | 10,569 | 10,653 | 40,672 |
| Totals | $748,498 | $(19,577,726) | $196,042,766 | $2,815,470 | $1,025,721 |
| Name of Calvert Fund | Value, beginning of period | Purchases | Sales proceeds | Net realized gain (loss) | Change in unrealized appreciation (depreciation) | Value, end of period | Dividend income | Capital gain distributions received | Shares, end of period |
| Bond Fund, Class R6 | $37,077,389 | $686,587 | $(6,874,000) | $150,556 | $(1,286,633) | $29,753,899 | $415,560 | $271,048 | 1,849,217 |
| Emerging Markets Advancement Fund, Class I | — | 8,532,200 | — | — | (1,749,224) | 6,782,976 | — | 25,397 | 801,770 |
| Emerging Markets Equity Fund, Class R6 | 17,187,042 | 1,064,662 | (7,737,803) | 253,964 | (1,499,030) | 9,268,835 | 110,662 | — | 679,533 |
| Equity Fund, Class R6 | — | 10,343,674 | — | — | (1,111,482) | 9,232,192 | 33,215 | 252,459 | 165,898 |
| Flexible Bond Fund, Class R6 | 20,551,473 | 647,889 | — | — | (2,011,838) | 19,187,524 | 326,889 | — | 1,409,811 |
| Floating-Rate Advantage Fund, Class R6 | 13,162,164 | 3,343,227 | — | — | (1,439,317) | 15,066,074 | 316,245 | — | 1,778,757 |
| High Yield Bond Fund, Class I | — | 5,487,956 | — | — | 418,662 | 5,906,618 | 5,957 | — | 246,520 |
| International Equity Fund, Class R6 | 15,591,660 | 2,222,455 | — | — | (1,990,635) | 15,823,480 | 241,455 | — | 909,918 |
Table of Contents
| Name of Calvert Fund | Value, beginning of period | Purchases | Sales proceeds | Net realized gain (loss) | Change in unrealized appreciation (depreciation) | Value, end of period | Dividend income | Capital gain distributions received | Shares, end of period |
| International Opportunities Fund, Class R6 | $19,715,738 | $300,407 | $(1,838,000) | $118,218 | $(3,139,826) | $15,156,537 | $300,407 | $ — | 1,155,224 |
| International Responsible Index Fund, Class R6 | 7,511,725 | 133,746 | (336,000) | 17,400 | (1,189,461) | 6,137,410 | 133,746 | — | 316,688 |
| Mid-Cap Fund, Class I | 3,274,531 | 201,784 | — | — | (780,210) | 2,696,105 | 7,249 | 146,535 | 84,306 |
| Short Duration Income Fund, Class R6 | 9,073,724 | 1,091,953 | — | — | (487,286) | 9,678,391 | 135,953 | — | 626,028 |
| Small-Cap Fund, Class R6 | 8,136,866 | 256,927 | (1,704,000) | 81,734 | (1,503,348) | 5,268,179 | 20,789 | 98,138 | 245,832 |
| Ultra-Short Duration Income Fund, Class R6 | 26,826,055 | 22,921,941 | (27,790,212) | (656,826) | (1,003,679) | 20,297,279 | 349,457 | — | 2,134,309 |
| US Large-Cap Core Responsible Index Fund, Class R6 | 67,897,893 | 4,145,566 | (8,410,790) | 910,759 | (7,966,147) | 56,577,281 | 791,565 | — | 2,515,664 |
| US Large-Cap Growth Responsible Index Fund, Class I | 21,272,431 | 302,393 | (4,413,000) | 1,279,764 | (2,195,838) | 16,245,750 | 136,179 | 166,214 | 578,552 |
| US Large-Cap Value Responsible Index Fund, Class I | 31,947,872 | 8,820,821 | — | — | (9,013,677) | 31,755,016 | 660,058 | 248,761 | 1,718,345 |
| US Mid-Cap Core Responsible Index Fund, Class I | 4,072,471 | 79,850 | (971,000) | 193,585 | (776,588) | 2,598,318 | 39,767 | 40,083 | 120,572 |
| Totals | $2,349,154 | $(38,725,557) | $277,431,864 | $4,025,153 | $1,248,635 |
Table of Contents
| Name of Calvert Fund | Value, beginning of period | Purchases | Sales proceeds | Net realized gain (loss) | Change in unrealized appreciation (depreciation) | Value, end of period | Dividend income | Capital gain distributions received | Shares, end of period |
| Bond Fund, Class R6 | $4,516,834 | $692,414 | $(5,190,402) | $192,408 | $(211,254) | $ — | $11,576 | $ — | — |
| Emerging Markets Advancement Fund, Class I | — | 5,977,079 | — | — | (1,200,654) | 4,776,425 | — | 21,425 | 564,589 |
| Emerging Markets Equity Fund, Class R6 | 13,839,097 | 1,456,218 | (5,814,459) | 137,445 | (1,385,317) | 8,232,984 | 92,218 | — | 603,591 |
| Equity Fund, Class R6 | — | 6,979,769 | — | — | (750,013) | 6,229,756 | 22,413 | 170,356 | 111,945 |
| Floating-Rate Advantage Fund, Class R6 | 3,283,653 | 1,549,458 | — | — | (286,752) | 4,546,359 | 80,462 | — | 536,760 |
| High Yield Bond Fund, Class I | — | 2,702,934 | — | — | 206,199 | 2,909,133 | 2,933 | — | 121,416 |
| International Equity Fund, Class R6 | 13,922,830 | 1,632,054 | — | — | (1,723,722) | 13,831,162 | 211,053 | — | 795,351 |
| International Opportunities Fund, Class R6 | 15,549,091 | 240,690 | (1,044,000) | 71,244 | (2,548,940) | 12,268,085 | 240,690 | — | 935,068 |
| International Responsible Index Fund, Class R6 | 5,747,021 | 106,887 | — | — | (949,038) | 4,904,870 | 106,887 | — | 253,089 |
| Mid-Cap Fund, Class I | 2,860,367 | 218,179 | — | — | (691,087) | 2,387,459 | 6,419 | 129,760 | 74,655 |
| Short Duration Income Fund, Class R6 | 7,435 | 18 | (7,450) | (2) | (1) | — | 21 | — | — |
| Small-Cap Fund, Class R6 | 6,087,303 | 286,290 | — | — | (1,408,980) | 4,964,613 | 15,783 | 74,507 | 231,667 |
| Ultra-Short Duration Income Fund, Class R6 | — | 4,102,476 | (3,728,197) | (133,990) | (11,386) | 228,903 | 13,492 | — | 24,070 |
| US Large-Cap Core Responsible Index Fund, Class R6 | 51,833,203 | 11,585,724 | (22,723,036) | (462,264) | (5,744,480) | 34,489,147 | 547,265 | — | 1,533,533 |
| US Large-Cap Growth Responsible Index Fund, Class I | 14,668,535 | 204,018 | (3,304,000) | 823,159 | (1,431,047) | 10,960,665 | 91,877 | 112,141 | 390,337 |
Table of Contents
| Name of Calvert Fund | Value, beginning of period | Purchases | Sales proceeds | Net realized gain (loss) | Change in unrealized appreciation (depreciation) | Value, end of period | Dividend income | Capital gain distributions received | Shares, end of period |
| US Large-Cap Value Responsible Index Fund, Class I | $20,845,592 | $7,846,156 | $ — | $ — | $(6,393,998) | $22,297,750 | $463,481 | $174,675 | 1,206,588 |
| US Mid-Cap Core Responsible Index Fund, Class I | 2,438,184 | 78,514 | — | — | (512,975) | 2,003,723 | 24,162 | 24,353 | 92,980 |
| Totals | $628,000 | $(25,043,445) | $135,031,034 | $1,930,732 | $707,217 |
| Six Months Ended March 31, 2020 (Unaudited) | Year Ended September 30, 2019 | ||||
| Shares | Amount | Shares | Amount | ||
| Class A | |||||
| Shares sold | 1,304,776 | $22,648,062 | 2,330,709 | $39,792,979 | |
| Reinvestment of distributions | 299,104 | 5,218,368 | 363,931 | 5,887,096 | |
| Shares redeemed | (1,124,266) | (19,258,555) | (2,551,692) | (43,328,222) | |
| Converted from Class C | 36,347 | 617,472 | 206,350 | 3,430,545 | |
| Net increase | 515,961 | $9,225,347 | 349,298 | $5,782,398 | |
| Class C | |||||
| Shares sold | 173,354 | $2,994,506 | 311,021 | $5,212,563 | |
| Reinvestment of distributions | 48,550 | 841,780 | 69,316 | 1,095,859 | |
| Shares redeemed | (177,612) | (3,003,387) | (438,366) | (7,330,447) | |
| Converted to Class A | (36,834) | (617,472) | (209,031) | (3,430,545) | |
| Net increase (decrease) | 7,458 | $215,427 | (267,060) | $(4,452,570) | |
| Class I | |||||
| Shares sold | 325,371 | $5,704,011 | 874,666 | $14,901,899 | |
| Reinvestment of distributions | 59,114 | 1,029,962 | 62,564 | 1,017,615 | |
| Shares redeemed | (242,334) | (4,122,199) | (464,661) | (7,769,216) | |
| Net increase | 142,151 | $2,611,774 | 472,569 | $8,150,298 | |
Table of Contents
| Six Months Ended March 31, 2020 (Unaudited) | Year Ended September 30, 2019 | ||||
| Shares | Amount | Shares | Amount | ||
| Class A | |||||
| Shares sold | 641,109 | $12,510,052 | 1,877,334 | $35,308,247 | |
| Reinvestment of distributions | 478,341 | 9,485,122 | 671,564 | 11,604,554 | |
| Shares redeemed | (929,896) | (17,382,974) | (1,981,080) | (37,276,794) | |
| Converted from Class C | 40,562 | 770,692 | 432,322 | 7,845,013 | |
| Net increase | 230,116 | $5,382,892 | 1,000,140 | $17,481,020 | |
| Class C | |||||
| Shares sold | 122,920 | $2,288,341 | 275,995 | $4,896,010 | |
| Reinvestment of distributions | 71,498 | 1,352,019 | 125,901 | 2,044,774 | |
| Shares redeemed | (163,113) | (2,900,040) | (400,993) | (7,148,234) | |
| Converted to Class A | (42,802) | (770,692) | (455,014) | (7,845,013) | |
| Net decrease | (11,497) | $(30,372) | (454,111) | $(8,052,463) | |
| Class I | |||||
| Shares sold | 544,884 | $10,262,180 | 1,062,974 | $20,062,004 | |
| Reinvestment of distributions | 93,157 | 1,843,116 | 94,949 | 1,654,149 | |
| Shares redeemed | (257,854) | (4,890,609) | (455,538) | (8,616,408) | |
| Net increase | 380,187 | $7,214,687 | 702,385 | $13,099,745 | |
| Six Months Ended March 31, 2020 (Unaudited) | Year Ended September 30, 2019 | ||||
| Shares | Amount | Shares | Amount | ||
| Class A | |||||
| Shares sold | 534,213 | $10,859,907 | 918,358 | $18,029,054 | |
| Reinvestment of distributions | 227,334 | 4,889,956 | 386,141 | 6,684,103 | |
| Shares redeemed | (443,531) | (8,717,527) | (886,539) | (17,378,513) | |
| Converted from Class C | 15,540 | 312,439 | 135,009 | 2,523,288 | |
| Net increase | 333,556 | $7,344,775 | 552,969 | $9,857,932 | |
| Class C | |||||
| Shares sold | 85,313 | $1,429,658 | 143,311 | $2,397,390 | |
| Reinvestment of distributions | 29,672 | 539,742 | 70,530 | 1,039,612 | |
| Shares redeemed | (57,981) | (985,282) | (245,643) | (4,084,128) | |
| Converted to Class A | (18,381) | (312,439) | (158,621) | (2,523,288) | |
| Net increase (decrease) | 38,623 | $671,679 | (190,423) | $(3,170,414) | |
Table of Contents
| Six Months Ended March 31, 2020 (Unaudited) | Year Ended September 30, 2019 | ||||
| Shares | Amount | Shares | Amount | ||
| Class I | |||||
| Shares sold | 195,158 | $3,964,125 | 260,304 | $5,023,142 | |
| Reinvestment of distributions | 22,011 | 474,992 | 32,112 | 557,467 | |
| Shares redeemed | (118,712) | (2,351,733) | (274,691) | (5,485,514) | |
| Net increase | 98,457 | $2,087,384 | 17,725 | $95,095 | |
Table of Contents
Table of Contents
Table of Contents
Table of Contents
Table of Contents
Table of Contents
Table of Contents
Table of Contents
Table of Contents
Table of Contents
| Officers |
| Hope L. Brown Chief Compliance Officer |
| Maureen A. Gemma Vice President, Secretary and Chief Legal Officer |
| James F. Kirchner Treasurer |
| Trustees |
| Alice Gresham Bullock Chairperson |
| Richard L. Baird, Jr. |
| Cari M. Dominguez |
| John G. Guffey, Jr. |
| Miles D. Harper, III |
| Joy V. Jones |
| John H. Streur* |
| Anthony A. Williams |
| *Interested Trustee and President |
Table of Contents
| • | At the time of opening an account, Eaton Vance generally requires you to provide us with certain information such as name, address, social security number, tax status, account numbers, and account balances. This information is necessary for us to both open an account for you and to allow us to satisfy legal requirements such as applicable anti-money laundering reviews and know-your-customer requirements. |
| • | On an ongoing basis, in the normal course of servicing your account, Eaton Vance may share your information with unaffiliated third parties that perform various services for Eaton Vance and/or your account. These third parties include transfer agents, custodians, broker/dealers and our professional advisers, including auditors, accountants, and legal counsel. Eaton Vance may additionally share your personal information with our affiliates. |
| • | We believe our Privacy Program is reasonably designed to protect the confidentiality of your personal information and to prevent unauthorized access to that information. |
| • | We reserve the right to change our Privacy Program at any time upon proper notification to you. You may want to review our Privacy Program periodically for changes by accessing the link on our homepage: www.eatonvance.com. |
Table of Contents
Table of Contents

Table of Contents
| Item 2. | Code of Ethics. |
Not required in this filing.
| Item 3. | Audit Committee Financial Expert. |
Not required in this filing.
| Item 4. | Principal Accountant Fees and Services. |
Not required in this filing.
| Item 5. | Audit Committee of Listed Registrants. |
Not applicable.
| Item 6. | Schedule of Investments. |
Please see schedule of investments contained in the Report to Shareholders included under Item 1 of this FormN-CSR.
| Item 7. | Disclosure of Proxy Voting Policies and Procedures forClosed-End Management Investment Companies. |
Not applicable.
| Item 8. | Portfolio Managers ofClosed-End Management Investment Companies. |
Not applicable.
| Item 9. | Purchases of Equity Securities byClosed-End Management Investment Company and Affiliated Purchasers. |
Not applicable.
| Item 10. | Submission of Matters to a Vote of Security Holders. |
No material changes.
| Item 11. | Controls and Procedures. |
(a) The registrant’s principal executive and principal financial officers have concluded that the registrant’s disclosure controls and procedures (as defined in Rule 30a-3(c) under the Investment Company Act of 1940 Act, as amended (the “1940 Act”) are effective, based on the evaluation of these controls and procedures required by Rule30a-3(b) under the 1940 Act and Rules13a-15(b) or15d-15(b) under the Securities Exchange Act of 1934 (“Exchange Act”), as of a date within 90 days of the filing date of this report.
Table of Contents
(b) There was no change in the registrant’s internal control over financial reporting (as defined in Rule30a-3(d) under the 1940 Act) that occurred during the period covered by this report that has materially affected, or is reasonably likely to materially affect, the registrant’s internal control over financial reporting.
| Item 12. | Disclosure of Securities Lending Activities forClosed-End Management Investment Companies |
Not applicable.
| Item 13. | Exhibits. |
| (a)(1) | Registrant’s Code of Ethics - Not applicable (please see Item 2) | |
| (a)(2)(i) | President’s Section 302 certification. | |
| (a)(2)(ii) | Treasurer’s Section 302 certification. | |
| (b) | Combined Section 906 certification. | |
Table of Contents
Signatures
Pursuant to the requirements of the Securities Exchange Act of 1934 and the Investment Company Act of 1940, the registrant has duly caused this report to be signed on its behalf by the undersigned, thereunto duly authorized.
| Calvert Social Investment Fund | ||
| By: | /s/ John H. Streur | |
| John H. Streur | ||
| President | ||
| Date: | May 26, 2020 | |
Pursuant to the requirements of the Securities Exchange Act of 1934 and the Investment Company Act of 1940, this report has been signed below by the following persons on behalf of the registrant and in the capacities and on the dates indicated.
| By: | /s/ John H. Streur | |
| John H. Streur | ||
| President | ||
| Date: | May 26, 2020 | |
| By: | /s/ James F. Kirchner | |
| James F. Kirchner | ||
| Treasurer | ||
| Date: | May 26, 2020 | |