UNITED STATES SECURITIES AND EXCHANGE COMMISSION
Washington, D.C. 20549
FORM N-CSR
- - - - - - - - - - -
CERTIFIED SHAREHOLDER REPORT OF REGISTERED
MANAGEMENT INVESTMENT COMPANIES
Investment Company Act file number: 811-03343
- - - - - - - - - - -
Sit Large Cap Growth Fund, Inc.
(Exact name of registrant as specified in charter)
3300 IDS Center
80 South Eighth Street
Minneapolis, MN 55402
(Address of principal executive offices)
Paul E. Rasmussen, VP Treasurer
Sit Mutual Funds, Inc.
3300 IDS Center
80 South Eighth Street
Minneapolis, MN 55402
(Name and address of agent for service)
Copy to:
Mike Radmer, Esq.
Dorsey & Whitney
Suite 1500
50 South Sixth Street
Minneapolis, MN 55402-1498
Registrant’s telephone number, including area code:
(612) 332-3223
Date of fiscal year end: June 30, 2015
Date of reporting period: June 30, 2015
Item 1: Reports to Stockholders
|
Sit Mutual Funds STOCK FUNDS ANNUAL REPORT TABLE OF CONTENTS |
This document must be preceded or accompanied by a Prospectus.
CHAIRMAN’S LETTER (Unaudited)
August 5, 2015
Dear Fellow Shareholders:
Global equity markets overcame some significant challenges and generally climbed higher over the past twelve months. While growth in the U.S. and other major developed markets remains on track, emerging markets have become a more significant source of risk to global growth.
Despite another weak first quarter in the U.S., with only modest growth in Gross Domestic Product (GDP), most current indicators point to a rebound in the second quarter of 2015. Specifically, consumer spending (which accounts for over two-thirds of GDP) appears to have moved higher from a soft first quarter, and nonfarm payrolls continue to grow at a healthy 200,000+ monthly clip. Job growth has been relatively resilient in light of the weak trends in energy, mining and manufacturing, which have been negatively impacted by weak commodity prices and the stronger U.S. dollar. Auto sales continue to be quite strong and, encouragingly, housing-related data have been particularly robust following a relatively tepid 2014. In summary, we continue to believe that the U.S. economy is growing at a moderate two to three percent pace.
U.S. inflation, as measured by the headline Consumer Price Index (CPI), remains well-controlled and in a tight range. The key factors suppressing inflation are still in place, and we do not anticipate a change in trend. Commodity prices continue to be quite low; the stronger dollar is dampening import prices; and there is little evidence that wage inflation is accelerating in a meaningful way. To be sure, all of these factors must be closely monitored, given the potential impact that an uptick in inflation will have on Federal Reserve policy. We believe that the Federal Reserve is likely to raise interest rates later this year or early next year, but a “traditional” tightening cycle (i.e., with multiple successive rate increases) is not likely, given moderate economic growth and a lack of inflationary pressure.
Outside the U.S., many European economies have improved in recent months due to the combined impact of a weaker currency, lower energy prices, and an accommodative monetary policy. Even beleaguered economies, such as Spain, have rebounded, despite very high unemployment. For the euro area overall, we have raised our economic projections based on improving employment trends, modest wage growth, increases in consumer spending, and some signs that bank lending is picking up.
While we remain cautious on the long-term prospects for Japan given structural headwinds (i.e. elevated government debt, aging population), the near-term picture looks relatively stable, as both consumption and investment spending are rising. Exports have helped, as well, due to the weak currency. However, exports to China represent a key risk to the country and for the global economy overall. Growth has been steadily decelerating and the recent significant stock market correction is an incremental cause for concern. Policymakers, how-
ever, have taken dramatic measures to stabilize the market and we expect continued easing of monetary policies, which should help stabilize growth. This bears watching, as growth is imperative given China’s elevated debt levels and the major impact an interruption in growth could have on the rest of the world, particularly other emerging markets.
Equity Strategy
While we believe equity prices can grind higher in the months ahead, numerous cross-currents are likely to result in increasing volatility as we proceed through the remainder of 2015.
Valuation and earnings trends will likely serve to constrain stock market upside. Valuations for the overall market are “fair” in our view, with price-to-earnings ratios at the upper end of historical ranges. That said, we believe elevated valuations are justified, given the low current inflation environment. We think that further market gains must be driven by increases in corporate profits. Earnings growth for the market overall (e.g., the S&P 500®) has come to a standstill, as the combination of a strong U.S. dollar and a dramatic decline in energy sector earnings has impacted results. The drag from these factors will likely be helped by easier comparisons in the months ahead. However, with corporate profit margins at peak levels, we believe a low- to mid-single earnings growth rate is a reasonable expectation.
All of this points to a challenging investment environment, but we clearly see opportunities. We continue to position our equity portfolios in diversified, high quality companies that are able to generate growth in a sluggish economic environment. In addition, we favor companies with strong balance sheets and cash flow generation and management teams that consistently return capital back to shareholders in the form of share repurchases and dividends. In terms of sectors, we have become more cautious on the energy and producer manufacturing sectors, given their dependence on emerging markets and vulnerability to a stronger U.S. dollar. We have incrementally increased exposure to the consumer discretionary sector, as solid labor markets, somewhat higher wages and falling energy costs provide a sound backdrop for U.S. consumers. Across all portfolios, healthcare remains a key area of focus for a number of reasons. First, the combination of steady employment gains and the Affordable Care Act has increased the insured population, leading to higher medical utilization in many areas. Second, we believe the pace of innovation and pipeline productivity has increased in recent years, given broad-based product introductions across therapeutic and device manufacturers. Third, the sector is being driven by the aging population all over the world.
In international and global portfolios, we remain overweight Europe, with an emphasis on exporting companies benefiting from the weak euro, and have added some exposure to
| | |
| | |
2 | | SIT MUTUAL FUNDS ANNUAL REPORT |
companies benefiting from improvements in consumer spending within the region. While the recent Greek debt negotiations have weighed on near-term performance, we believe that sentiment will shift more positively as the European Central Bank remains very accommodative, mainly through its quantitative easing program, for quite some time. While Japanese stocks have performed well in recent months, we are underweight the region given our longer term concerns over structural challenges facing the country. We continue to have significant exposure to China based on our long-term view that growth there is still quite strong relative to the rest of the world. Regardless of the economic region, we remain focused on well-managed, high quality growth companies.
With best wishes,

Roger J. Sit
Chairman, President, CEO and Global CIO
OBJECTIVE & STRATEGY
The dual objectives of the Sit Balanced Fund are to seek long-term growth of capital consistent with the preservation of principal and to provide regular income. It pursues its objectives by investing in a diversified portfolio of stocks and bonds. The Fund may emphasize either equity securities or fixed-income securities, or hold equal amounts of each, dependent upon the Adviser’s analysis of market, financial and economic conditions.
The Fund’s permissible investment allocation is: 35-65% in equity securities and 35-65% in fixed-income securities. At all times at least 25% of the fixed-income assets will be invested in fixed-income senior securities.
The Sit Balanced Fund’s twelve-month return was +6.86%. The S&P 500® Index return was +7.42% over the period, while the Barclays Aggregate Bond Index gained +1.86%. The Lipper Balanced Fund Index advanced +3.11% over the period.
Stocks and bonds moved modestly higher over the past twelve months, as investors continue to await a potential change in Federal Reserve policy. The equity portion outperformed the S&P 500® Index over the past twelve months, due to strong stock selection and an overweighted position in the outperforming health technology sector. In addition, the Fund benefitted from underweighting both the energy minerals and utilities sectors, which lagged over the period. Negative stock selection in the producer manufacturing and consumer non-durables detracted from results. Looking ahead, we continue to believe that high quality companies with stable earnings growth, strong cash flow generation, and minimal debt levels will outperform the overall stock market, as economic growth remains sluggish and investors seek firms with financial flexibility to return capital, through either share repurchases or increased dividends.
For the twelve months ending 6/30/15, the fixed income portion of the Fund considerably outperformed the Barclays Aggregate Bond Index, primarily due to its attractive income advantage. The Fund’s yield curve positioning also helped the return. Positions in longer duration U.S. Treasury securities contributed positively to performance, as longer maturity yields declined over the twelve-month period. Looking forward, we expect the yield curve to resume flattening as short yields rise in anticipation of the Fed raising its fed funds rate target later this year. We expect longer maturity yields to decline in the short- to medium-term as the market believes that the Fed’s actions will prevent inflation from becoming a problem. We continue to position the portfolio along the yield curve to take advantage of its expected flattening, while maintaining a significant yield advantage relative to the benchmark.
HYPOTHETICAL GROWTH OF $10,000
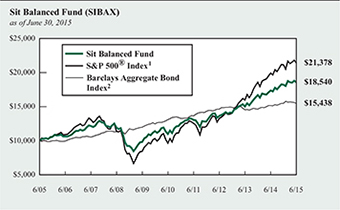
The chart above illustrates the total value of a hypothetical $10,000 investment in the Fund over the past 10 years as compared to the performance of the S&P 500® Index and the Barclays Aggregate Bond Index. Past performance does not guarantee future results. Returns include the reinvestment of distributions. The chart does not reflect the deduction of taxes that a shareholder would pay on Fund distributions or the redemption of Fund shares.
1 S&P 500® Index is an unmanaged capitalization-weighted index that measures the performance of 500 widely held common stocks of large-cap companies. It is not possible to invest directly in an index. This is the primary index for the equity portion of the Fund.
2 Barclays Aggregate Bond Index is an unmanaged market value-weighted index which measures the performance of investment grade debt securities with maturities of at least one year. This is the primary index for the fixed income portion of the Fund.
As of June 30th, the asset allocation of the Fund was 63% equities, 34% fixed income, and 3% cash and equivalents.
Roger J. Sit
Bryce A. Doty
John M. Bernstein
Portfolio Managers
| | |
Information on this page is unaudited. |
4 | | SIT MUTUAL FUNDS ANNUAL REPORT |
COMPARATIVE RATES OF RETURNS
as of June 30, 2015
| | | | | | | | | | |
| | | Sit
Balanced
Fund | | | S&P 500®
Index 1 | | | Barclays
Aggregate
Bond
Index 2 |
One Year | | | 6.86 | % | | | 7.42 | % | | 1.86% |
Five Year | | | 11.03 | | | | 17.34 | | | 3.35 |
Ten Year | | | 6.37 | | | | 7.89 | | | 4.44 |
Since Inception (12/31/93) | | | 6.96 | | | | 9.26 | | | 5.61 |
Performance figures are historical and do not guarantee future results. Investment returns and principal value will vary, and you may have a gain or loss when you sell shares. Current performance may be lower or higher than the performance data quoted. Contact the Fund for performance data current to the most recent month-end. Returns include changes in share price as well as reinvestment of all dividends and capital gains. Returns do not reflect the deduction of taxes that a shareholder would pay on Fund distributions or the redemption of Fund shares. Management fees and administrative expenses are included in the Fund’s performance. Returns for periods greater than one year are compounded average annual rates of return.
1 S&P 500® Index is an unmanaged capitalization-weighted index that measures the performance of 500 widely held common stocks of large-cap companies. It is not possible to invest directly in an index.
2 Barclays Aggregate Bond Index is an unmanaged market value-weighted index which measures the performance of investment grade debt securities with maturities of at least one year.
PORTFOLIO SUMMARY
| | |
Net Asset Value 6/30/15: | | $ 21.54 Per Share |
Net Asset Value 6/30/14: | | $21.01 Per Share |
Total Net Assets: | | $23.0 Million |
TOP HOLDINGS
Top Equity Holdings:
1. Apple, Inc.
2. Medtronic, PLC
3. Visa, Inc.
4. CVS Health Corp.
5. PepsiCo, Inc.
Top Fixed Income Holdings:
1. U.S. Treasury Strips, 4.22%, 2/15/36
2. GNMA, 4.50%, 6/15/40
3. FNMA, 7.50%, 5/25/42
4. U.S. Treasury Strips, 4.56%, 2/15/26
5. FNMA, 7.00%, 5/25/31
Based on total net assets as of June 30, 2015. Subject to change.
FUND DIVERSIFICATION
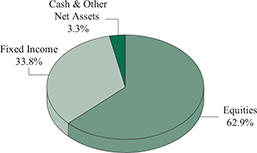
Based on total net assets as of June 30, 2015. Subject to change.
| | |
Information on this page is unaudited. | | |
JUNE 30, 2015 | | 5 |
SCHEDULE OF INVESTMENTS
June 30, 2015
Sit Balanced Fund
| | | | | | |
Quantity | | Name of Issuer | | Fair Value ($) | |
| |
Common Stocks - 62.9% | | | | |
Commercial Services - 1.3% | | | | |
1,400 | | Equifax, Inc. | | | 135,926 | |
2,900 | | Robert Half International, Inc. | | | 160,950 | |
| | | | | | |
| | | | | 296,876 | |
| | | | | | |
Communications - 1.3% | | | | |
1,150 | | SBA Communications Corp. * | | | 132,216 | |
3,750 | | Verizon Communications, Inc. | | | 174,788 | |
| | | | | | |
| | | | | 307,004 | |
| | | | | | |
Consumer Durables - 1.2% | | | | |
1,025 | | Polaris Industries, Inc. | | | 151,813 | |
785 | | Whirlpool Corp. | | | 135,844 | |
| | | | | | |
| | | | | 287,657 | |
| | | | | | |
Consumer Non-Durables - 3.7% | | | | |
875 | | Michael Kors Holdings, Ltd. * | | | 36,829 | |
1,825 | | NIKE, Inc. | | | 197,136 | |
3,425 | | PepsiCo, Inc. | | | 319,690 | |
1,150 | | Philip Morris International, Inc. | | | 92,196 | |
2,500 | | Procter & Gamble Co. | | | 195,600 | |
| | | | | | |
| | | | | 841,451 | |
| | | | | | |
Consumer Services - 5.3% | | | | |
150 | | Chipotle Mexican Grill, Inc. * | | | 90,748 | |
4,750 | | H&R Block, Inc. | | | 140,838 | |
5,300 | | Starbucks Corp. | | | 284,160 | |
2,000 | | Time Warner, Inc. | | | 174,820 | |
4,300 | | Twenty-First Century Fox, Inc. | | | 139,944 | |
5,700 | | Visa, Inc. | | | 382,755 | |
| | | | | | |
| | | | | 1,213,265 | |
| | | | | | |
Electronic Technology - 6.1% | | | | |
3,575 | | Apple, Inc. | | | 448,394 | |
9,750 | | Applied Materials, Inc. | | | 187,395 | |
1,975 | | Avago Technologies, Ltd. | | | 262,537 | |
5,000 | | Ciena Corp. * | | | 118,400 | |
7,300 | | Intel Corp. | | | 222,030 | |
1,275 | | Skyworks Solutions, Inc. | | | 132,728 | |
700 | | Xilinx, Inc. | | | 30,911 | |
| | | | | | |
| | | | | 1,402,395 | |
| | | | | | |
Energy Minerals - 3.2% | | | | |
1,575 | | Chevron Corp. | | | 151,940 | |
2,250 | | Continental Resources, Inc. * | | | 95,378 | |
850 | | EOG Resources, Inc. | | | 74,418 | |
1,450 | | Gulfport Energy Corp. * | | | 58,362 | |
3,500 | | Marathon Petroleum Corp. | | | 183,085 | |
2,300 | | Occidental Petroleum Corp. | | | 178,871 | |
| | | | | | |
| | | | | 742,054 | |
| | | | | | |
| | | | | | |
Quantity | | Name of Issuer | | Fair Value ($) | |
| |
Finance - 6.2% | | | | |
900 | | ACE, Ltd. | | | 91,512 | |
1,850 | | Ameriprise Financial, Inc. | | | 231,120 | |
2,175 | | Discover Financial Services | | | 125,324 | |
925 | | Goldman Sachs Group, Inc. | | | 193,131 | |
4,275 | | JPMorgan Chase & Co. | | | 289,674 | |
1,600 | | Marsh & McLennan Cos., Inc. | | | 90,720 | |
1,350 | | Prudential Financial, Inc. | | | 118,152 | |
2,350 | | US Bancorp | | | 101,990 | |
3,150 | | Wells Fargo & Co. | | | 177,156 | |
| | | | | | |
| | | | | 1,418,779 | |
| | | | | | |
Health Services - 2.8% | | | | |
1,305 | | Express Scripts Holding Co. * | | | 116,067 | |
400 | | Humana, Inc. | | | 76,512 | |
875 | | McKesson Corp. | | | 196,709 | |
2,025 | | UnitedHealth Group, Inc. | | | 247,050 | |
| | | | | | |
| | | | | 636,338 | |
| | | | | | |
Health Technology - 9.3% | | | | |
2,550 | | AbbVie, Inc. | | | 171,334 | |
425 | | Alexion Pharmaceuticals, Inc. * | | | 76,827 | |
750 | | Allergan, PLC * | | | 227,595 | |
1,750 | | Celgene Corp. * | | | 202,536 | |
2,700 | | Gilead Sciences, Inc. | | | 316,116 | |
1,650 | | Johnson & Johnson | | | 160,809 | |
5,899 | | Medtronic, PLC | | | 437,116 | |
1,050 | | Mylan NV * | | | 71,253 | |
125 | | Regeneron Pharmaceuticals, Inc. * | | | 63,766 | |
2,050 | | St. Jude Medical, Inc. | | | 149,794 | |
1,000 | | Thermo Fisher Scientific, Inc. | | | 129,760 | |
1,150 | | Zimmer Holdings, Inc. | | | 125,613 | |
| | | | | | |
| | | | | 2,132,519 | |
| | | | | | |
Industrial Services - 0.6% | | | | |
1,600 | | Schlumberger, Ltd. | | | 137,904 | |
| | | | | | |
Process Industries - 1.8% | | | | |
2,450 | | Ecolab, Inc. | | | 277,022 | |
1,225 | | International Paper Co. | | | 58,298 | |
600 | | Praxair, Inc. | | | 71,730 | |
| | | | | | |
| | | | | 407,050 | |
| | | | | | |
Producer Manufacturing - 4.8% | | | | |
675 | | 3M Co. | | | 104,152 | |
875 | | Caterpillar, Inc. | | | 74,218 | |
2,000 | | Danaher Corp. | | | 171,180 | |
1,250 | | Delphi Automotive, PLC | | | 106,362 | |
725 | | General Dynamics Corp. | | | 102,725 | |
2,150 | | Honeywell International, Inc. | | | 219,236 | |
950 | | Illinois Tool Works, Inc. | | | 87,200 | |
| | |
See accompanying notes to financial statements. | | |
6 | | SIT MUTUAL FUNDS ANNUAL REPORT |
| | | | | | |
Quantity /Principal
Amount ($) | | Name of Issuer | | Fair Value ($) | |
| | |
1,500 | | Raytheon Co. | | | 143,520 | |
950 | | United Technologies Corp. | | | 105,383 | |
| | | | | | |
| | |
| | | | | 1,113,976 | |
| | | | | | |
Retail Trade - 5.2% | | | | |
3,200 | | CVS Health Corp. | | | 335,616 | |
1,700 | | Dick’s Sporting Goods, Inc. | | | 88,009 | |
2,800 | | Home Depot, Inc. | | | 311,164 | |
900 | | Macy’s, Inc. | | | 60,723 | |
1,200 | | Target Corp. | | | 97,956 | |
2,900 | | TJX Cos., Inc. | | | 191,893 | |
1,675 | | Wal-Mart Stores, Inc. | | | 118,808 | |
| | | | | | |
| | |
| | | | | 1,204,169 | |
| | | | | | |
Technology Services - 7.5% | | | | |
1,550 | | Accenture, PLC | | | 150,009 | |
3,300 | | Adobe Systems, Inc. * | | | 267,333 | |
1,250 | | ANSYS, Inc. * | | | 114,050 | |
2,500 | | Cognizant Technology Solutions Corp. * | | | 152,725 | |
1,875 | | Facebook, Inc. * | | | 160,809 | |
325 | | Google, Inc. - Class A* | | | 175,513 | |
255 | | Google, Inc. - Class C* | | | 132,730 | |
5,975 | | Microsoft Corp. | | | 263,796 | |
3,250 | | Oracle Corp. | | | 130,975 | |
155 | | priceline.com, Inc. * | | | 178,462 | |
| | | | | | |
| | |
| | | | | 1,726,402 | |
| | | | | | |
Transportation - 2.6% | | | | |
3,300 | | Delta Air Lines, Inc. | | | 135,564 | |
550 | | FedEx Corp. | | | 93,720 | |
1,050 | | Ryder System, Inc. | | | 91,738 | |
1,750 | | Union Pacific Corp. | | | 166,898 | |
1,050 | | United Parcel Service, Inc. | | | 101,755 | |
| | | | | | |
| | |
| | | | | 589,675 | |
| | | | | | |
Total Common Stocks (cost: $10,672,600) | | | 14,457,514 | |
| | | | | | |
Bonds - 31.5% | | | | |
Asset-Backed Securities - 2.0% | | | | |
5,989 | | Bayview Financial Acquisition Trust,
2006-D 1A2, 5.66%, 12/28/36 14 | | | 5,973 | |
41,527 | | Centex Home Equity,
2004-D AF4, 4.68%, 6/25/32 14 | | | 42,425 | |
16,529 | | Citifinancial Mortgage Securities, Inc.,
2004-1 AF3, 3.77%, 4/25/34 14 | | | 16,758 | |
32,105 | | Conseco Finance,
2001-D M1, 1.54%, 11/15/32 1 | | | 31,079 | |
74,989 | | Credit Suisse First Boston Mortgage Corp.,
2005-AGE1 M3, 0.83%, 2/25/32 1 | | | 72,410 | |
| | | | | | |
Principal
Amount ($) | | Name of Issuer | | Fair Value ($) | |
| | |
27,280 | | Green Tree Financial Corp.,
1997-7 A6, 6.76%, 7/15/28 | | | 28,009 | |
45,566 | | HouseHold Home Equity Loan Trust,
2007-2 A4, 0.49%, 7/20/36 1 | | | 44,982 | |
10,204 | | Irwin Home Equity Corp.,
2005-1 M1, 5.42%, 6/25/35 14 | | | 10,307 | |
24,792 | | New Century Home Equity Loan Trust,
2005-A A4W, 4.82%, 8/25/35 14 | | | 25,720 | |
22,309 | | RAAC Series,
2005-SP2 1M1, 0.70%, 5/25/44 1 | | | 22,140 | |
26,312 | | Residential Asset Mortgage Products, Inc.,
2005-RZ3 A3, 0.58%, 9/25/35 1 | | | 26,183 | |
7,953 | | Residential Funding Mortgage Securities II, Inc.,
2003-HI2 A6, 5.26%, 7/25/28 14 | | | 8,036 | |
101,056 | | Vanderbilt Acquisition Loan Trust Series,
2002-1 B2, 8.47%, 5/7/32 1 | | | 113,652 | |
| | | | | | |
| | |
| | | | | 447,674 | |
| | | | | | |
Collateralized Mortgage Obligations - 5.4% | | | | |
| | Fannie Mae: | | | | |
61,023 | | 2004-T1 1A1, 6.00%, 1/25/44 | | | 69,086 | |
19,016 | | 2009-30 AG, 6.50%, 5/25/39 | | | 20,750 | |
8,977 | | 2013-28 WD, 6.50%, 5/25/42 | | | 10,259 | |
34,366 | | 2004-W9 2A1, 6.50%, 2/25/44 | | | 38,803 | |
133,840 | | 2012-68 GW, 7.00%, 5/25/31 | | | 161,748 | |
7,882 | | 2010-108 AP, 7.00%, 9/25/40 | | | 8,922 | |
15,772 | | 2004-T3, 1A3, 7.00%, 2/25/44 | | | 18,014 | |
149,613 | | 2013-28 WE, 7.50%, 5/25/42 | | | 175,479 | |
| | Freddie Mac: | | | | |
60,974 | | 4293 BA, 5.33%, 10/15/47 1 | | | 66,668 | |
54,662 | | 2122 ZE, 6.00%, 2/15/29 | | | 59,897 | |
39,520 | | 2283 K, 6.50%, 12/15/23 | | | 43,972 | |
39,392 | | T-59 1A1, 6.50%, 10/25/43 | | | 45,263 | |
17,319 | | 3946 KW, 7.00%, 11/15/29 | | | 18,771 | |
59,301 | | 3704 CT, 7.00%, 12/15/36 | | | 69,652 | |
35,585 | | 2238 PZ, 7.50%, 6/15/30 | | | 41,126 | |
| | Government National Mortgage Association: | | | | |
82,571 | | 2014-69 W, 7.28%, 11/20/34 1 | | | 98,285 | |
50,025 | | 2005-74 HA, 7.50%, 9/16/35 | | | 56,624 | |
113,116 | | RFMSI Series Trust, | | | | |
| | 2003-S12 M1, 5.98%, 12/25/32 1 | | | 119,786 | |
| | Sequoia Mortgage Trust: | | | | |
40,141 | | 2013-3 A2, 2.50%, 3/25/43 1 | | | 37,393 | |
25,414 | | 2012-4 A2, 3.00%, 9/25/42 1 | | | 24,652 | |
36,223 | | Vendee Mortgage Trust, | | | | |
| | 2008-1 B, 7.71%, 3/15/25 1 | | | 41,861 | |
| | | | | | |
| | |
| | | | | 1,227,011 | |
| | | | | | |
| | |
See accompanying notes to financial statements. | | |
JUNE 30, 2015 | | 7 |
SCHEDULE OF INVESTMENTS
June 30, 2015
Sit Balanced Fund (Continued)
| | | | | | |
Principal
Amount ($) | | Name of Issuer | | Fair Value ($) | |
| |
Corporate Bonds - 10.7% | | | | |
37,072 | | Aircraft Certificate Owner Trust 2003, 7.00%, 9/20/22 4 | | | 39,667 | |
61,635 | | America West Airlines 2000-1 Trust, 8.06%, 7/2/20 | | | 69,340 | |
25,000 | | American Airlines 2015-1 Class A Trust, 3.38%, 5/1/27 | | | 24,688 | |
100,000 | | Assured Guaranty US Holdings, Inc., 7.00%, 6/1/34 | | | 109,139 | |
70,000 | | Boeing Co., 8.75%, 9/15/31 | | | 104,850 | |
100,000 | | Bottling Group, LLC, 5.13%, 1/15/19 | | | 110,839 | |
23,304 | | Burlington Northern and Santa Fe Railway Co. 2001-1 Trust, 6.73%, 7/15/22 | | | 26,527 | |
50,000 | | Caterpillar Financial Services Corp., 7.15%, 2/15/19 | | | 58,866 | |
50,000 | | CNA Financial Corp., 7.35%, 11/15/19 | | | 59,101 | |
25,000 | | Coca-Cola Femsa SAB de CV, 2.38%, 11/26/18 | | | 25,352 | |
25,000 | | ConocoPhillips, 5.90%, 10/15/32 | | | 28,864 | |
37,139 | | Continental Airlines 2000-1 Class A-1 Trust, 8.05%, 11/1/20 | | | 42,105 | |
50,000 | | Danaher Corp., 5.40%, 3/1/19 | | | 55,810 | |
45,384 | | Delta Air Lines 2007-1 Class A Trust, 6.82%, 8/10/22 | | | 52,078 | |
63,046 | | Doric Nimrod Air Alpha 2012-1 Class A Trust, 5.13%, 11/30/22 4 | | | 66,673 | |
60,768 | | Doric Nimrod Air Alpha 2013-1 Trust, 5.25%, 5/30/23 4 | | | 64,414 | |
50,000 | | DTE Gas, Co., 5.00%, 10/1/19 | | | 55,788 | |
50,000 | | Google, Inc., 3.63%, 5/19/21 | | | 53,570 | |
50,000 | | Hiland Partners LP / Hiland Partners Finance Corp., 5.50%, 5/15/22 4 | | | 51,999 | |
150,000 | | INVISTA Finance, LLC, 4.25%, 10/15/19 4 | | | 147,750 | |
50,000 | | Kansas City Power & Light Co.,
7.15%, 4/1/19 | | | 58,979 | |
25,000 | | Liberty Mutual Insurance Co.,
7.88%, 10/15/26 4 | | | 30,239 | |
50,000 | | LyondellBasell Industries NV,
4.63%, 2/26/55 | | | 44,032 | |
65,000 | | Manufacturers & Traders Trust Co. (Subordinated), 5.63%, 12/1/21 1 | | | 67,038 | |
100,000 | | Microsoft Corp., 5.20%, 6/1/39 | | | 112,017 | |
75,000 | | Moody’s Corp., 2.75%, 7/15/19 | | | 75,639 | |
40,000 | | Northern States Power Co.,
7.13%, 7/1/25 | | | 51,369 | |
25,000 | | Northern Trust Co. (Subordinated),
6.50%, 8/15/18 | | | 28,564 | |
52,984 | | Northwest Airlines 2007-1 A Trust,
7.03%, 11/1/19 | | | 59,475 | |
57,242 | | Procter & Gamble ESOP,
9.36%, 1/1/21 | | | 69,573 | |
50,000 | | Progressive Corp. (Subordinated),
6.70%, 6/15/37 1 | | | 52,125 | |
50,000 | | Security Benefit Life Insurance Co. (Subordinated), 7.45%, 10/1/33 4 | | | 60,974 | |
50,000 | | State Street Corp., 7.35%, 6/15/26 | | | 65,253 | |
50,000 | | Tosco Corp., 8.13%, 2/15/30 | | | 69,503 | |
50,000 | | United Parcel Service, Inc.,
2.45%, 10/1/22 | | | 48,249 | |
50,000 | | United Technologies Corp.,
6.13%, 2/1/19 | | | 57,128 | |
| | | | | | |
Principal
Amount ($) | | Name of Issuer | | Fair Value ($) | |
| | |
41,915 | | US Airways 2001-1C Trust (Subordinated), 7.35%, 3/20/22 | | | 46,790 | |
2,000 | | Verizon Communications,
5.90%, 2/15/54 | | | 52,440 | |
41,130 | | Virgin Australia 2013-1A Trust,
5.00%, 10/23/23 4 | | | 42,878 | |
50,000 | | Wells Fargo & Co., 4.60%, 4/1/21 | | | 54,774 | |
50,000 | | XTO Energy, Inc., 6.75%, 8/1/37 | | | 69,724 | |
| | | | | | |
| | | | | 2,464,183 | |
| | | | | | |
| |
Federal Home Loan Mortgage Corporation - 2.0% | | | | |
48,877 | | 2.50%, 4/1/27 | | | 49,930 | |
27,647 | | 3.00%, 5/1/27 | | | 28,255 | |
13,176 | | 6.00%, 10/1/21 | | | 14,084 | |
74,310 | | 6.00%, 4/1/39 | | | 84,601 | |
73,137 | | 6.50%, 2/1/22 | | | 80,128 | |
73,031 | | 7.00%, 4/1/31 | | | 85,071 | |
34,278 | | 7.00%, 7/1/32 | | | 37,720 | |
6,806 | | 7.00%, 5/1/34 | | | 7,873 | |
30,696 | | 7.00%, 11/1/37 | | | 35,571 | |
8,400 | | 7.00%, 1/1/39 | | | 9,648 | |
16,785 | | 7.50%, 11/1/36 | | | 20,076 | |
391 | | 8.00%, 9/1/15 | | | 393 | |
6,187 | | 8.38%, 5/17/20 | | | 6,570 | |
| | | | | | |
| | | | | 459,920 | |
| | | | | | |
| |
Federal National Mortgage Association - 2.7% | | | | |
23,402 | | 5.50%, 2/1/18 | | | 24,407 | |
75,000 | | 6.17%, 11/1/43 | | | 85,699 | |
17,935 | | 6.50%, 5/1/36 | | | 20,597 | |
136,750 | | 6.50%, 8/1/37 | | | 158,629 | |
80,564 | | 6.50%, 3/1/40 | | | 92,520 | |
32,334 | | 7.00%, 1/1/32 | | | 37,370 | |
13,689 | | 7.00%, 12/1/32 | | | 16,403 | |
28,292 | | 7.00%, 3/1/33 | | | 33,124 | |
19,688 | | 7.00%, 12/1/36 | | | 23,953 | |
6,570 | | 7.00%, 11/1/38 | | | 7,648 | |
15,207 | | 7.50%, 4/1/33 | | | 18,974 | |
14,889 | | 7.50%, 11/1/33 | | | 17,652 | |
21,956 | | 7.50%, 1/1/34 | | | 26,872 | |
7,315 | | 7.50%, 4/1/38 | | | 8,936 | |
32,659 | | 8.00%, 2/1/31 | | | 40,007 | |
7,586 | | 8.45%, 7/15/26 | | | 8,757 | |
| | | | | | |
| | | | | 621,548 | |
| | | | | | |
| |
Government National Mortgage Association - 2.3% | | | | |
238,040 | | 4.50%, 6/15/40 | | | 261,485 | |
88,587 | | 6.00%, 4/15/29 | | | 102,004 | |
23,181 | | 7.00%, 12/15/24 | | | 25,802 | |
| | |
See accompanying notes to financial statements. | | |
8 | | SIT MUTUAL FUNDS ANNUAL REPORT |
| | | | | | |
Principal
Amount ($) | | Name of Issuer | | Fair Value ($) | |
| | |
34,877 | | 7.00%, 9/20/38 | | | 40,746 | |
32,176 | | 8.00%, 7/15/24 | | | 36,394 | |
67,921 | | 8.38%, 3/15/31 | | | 70,795 | |
| | | | | | |
| | | | | 537,226 | |
| | | | | | |
Taxable Municipal Securities - 3.4% | | | | |
100,000 | | City of Austin, TX., Electric Utility Rev.,
2.08%, 11/15/19 | | | 99,792 | |
85,000 | | County of St. Clair IL, 5.40%, 12/30/28 | | | 89,373 | |
75,000 | | Denver Health & Hospital Authority,
2.95%, 12/1/18 | | | 75,746 | |
100,000 | | Glendale Community Dev. Authority,
2.40%, 10/1/19 | | | 100,239 | |
50,000 | | Macomb Interceptor Drain Drainage District, 5.50%, 5/1/30 | | | 51,361 | |
100,000 | | Mississippi Home Corp.,
3.05%, 12/1/34 | | | 100,061 | |
89,000 | | Multistate Liquidating Trust No.
1, 3.11%, 12/15/28 4,17 | | | 86,599 | |
40,000 | | New Hampshire Housing Finance Authority, 4.00%, 7/1/35 | | | 41,837 | |
50,000 | | State of Texas, 4.12%, 4/1/25 | | | 53,708 | |
75,000 | | Texas St. Pub. Fin. Auth. Charter Sch. Fin., 8.75%, 8/15/27 | | | 82,761 | |
| | | | | | |
| | | | | 781,477 | |
| | | | | | |
U.S. Government / Federal Agency Securities - 3.0% | | | | |
100,000 | | U.S. Treasury Note, 0.06%, 1/31/16 1 | | | 99,999 | |
| | U.S. Treasury Strips: | | | | |
200,000 | | 3.33%, 5/15/44 6 | | | 78,289 | |
625,000 | | 4.22%, 2/15/36 6 | | | 339,019 | |
225,000 | | 4.56%, 2/15/26 6 | | | 171,500 | |
| | | | | | |
| | | | | 688,807 | |
| | | | | | |
| |
Total Bonds
(cost: $7,228,959) | | | 7,227,846 | |
| | | | | | |
| | | | | | |
Quantity | | Name of Issuer | | Fair Value ($) | |
|
Investment Companies - 2.3% | |
5,700 | | BlackRock Enhanced Government Fund | | | 77,121 | |
15,800 | | BlackRock Income Trust | | | 99,856 | |
8,400 | | Duff & Phelps Utility and Corporate Bond Trust | | | 78,708 | |
5,300 | | Federated Enhanced Treasury Income Fund | | | 70,013 | |
26,500 | | MFS Intermediate Income Trust | | | 122,430 | |
15,652 | | Putnam Premier Income Trust | | | 79,825 | |
| | | | | | |
Total Investment Companies
(cost: $546,126) | | | 527,953 | |
| | | | | | |
Total Investments in Securities - 96.7%
(cost: $18,447,685) | | | 22,213,313 | |
Other Assets and Liabilities, net - 3.3% | | | 756,397 | |
| | | | | | |
Total Net Assets - 100.0% | | | $22,969,710 | |
| | | | | | |
| * | Non-income producing security. |
| 1 | Variable rate security. Rate disclosed is as of June 30, 2015. |
| 4 | 144A Restricted Security. The total value of such securities as of June 30, 2015 was $591,193 and represented 2.6% of net assets. These securities have been determined to be liquid by the Adviser in accordance with guidelines established by the Board of Directors. |
| 6 | Zero coupon or convertible capital appreciation bond, for which the rate disclosed is either the effective yield on purchase date or the coupon rate to be paid upon conversion to coupon paying, respectively. |
| 14 | Step Coupon: A bond that pays an initial coupon rate for the first period and then a higher coupon rate for the following periods. Rate disclosed is as of June 30, 2015. |
| 17 | Security that is either an absolute and unconditional obligation of the United States Government or is collateralized by securities, loans, or leases guaranteed by the U.S. Government or its agencies or instrumentalities. |
Numeric footnotes not disclosed are not applicable to this Schedule of Investments.
PLC — Public Limited Company
| | |
See accompanying notes to financial statements. | | |
JUNE 30, 2015 | | 9 |
SCHEDULE OF INVESTMENTS
June 30, 2015
Sit Balanced Fund (Continued)
A summary of the levels for the Fund’s investments as of June 30, 2015 is as follows (see Note 2 - significant accounting policies in the notes to financial statements):
| | | | | | | | | | | | | | |
| | | Investment in Securities | |
| | | Level 1
Quoted
Price ($) | | | Level 2
Other significant
observable inputs ($) | | | Level 3 Significant
unobservable inputs ($) | | Total ($) | |
Common Stocks ** | | | 14,457,514 | | | | — | | | — | | | 14,457,514 | |
Asset-Backed Securities | | | — | | | | 447,674 | | | — | | | 447,674 | |
Collateralized Mortgage Obligations | | | — | | | | 1,227,011 | | | — | | | 1,227,011 | |
Corporate Bonds | | | — | | | | 2,464,183 | | | — | | | 2,464,183 | |
Federal Home Loan Mortgage Corporation | | | — | | | | 459,920 | | | — | | | 459,920 | |
Federal National Mortgage Association | | | — | | | | 621,548 | | | — | | | 621,548 | |
Government National Mortgage Association | | | — | | | | 537,226 | | | — | | | 537,226 | |
Taxable Municipal Securities | | | — | | | | 781,477 | | | — | | | 781,477 | |
U.S. Government / Federal Agency Securities | | | — | | | | 688,807 | | | — | | | 688,807 | |
Investment Companies | | | 527,953 | | | | — | | | — | | | 527,953 | |
| | | | |
Total: | | | 14,985,467 | | | | 7,227,846 | | | — | | | 22,213,313 | |
| ** | For equity securities categorized in a single level, refer to the Schedule of Investments for further breakdown. |
For the reporting period, there were no transfers between levels 1, 2 and 3.
| | |
See accompanying notes to financial statements. | | |
10 | | SIT MUTUAL FUNDS ANNUAL REPORT |
[This page intentionally left blank.]
|
|
| |
Sit Dividend Growth Fund - Class I and Class S |
OBJECTIVE & STRATEGY
The objective of the Sit Dividend Growth Fund is to provide current income that exceeds the dividend yield of the S&P 500® Index and that grows over a period of years. Secondarily, the Fund seeks long-term capital appreciation.
The Fund seeks to achieve its objectives by investing, under normal market conditions, at least 80% of its net assets in dividend-paying common stocks. The Fund may invest the balance of its assets in preferred stocks, convertible bonds, and U.S. Treasury securities.
The Sit Dividend Growth Fund Class I posted a +6.39% return over the last twelve months, compared to the +7.42% return for the S&P 500® Index. The Fund’s gross dividend yield (before deduction of Fund expenses) is 2.50% compared to the 2.08% yield of the S&P 500® Index.
U.S. equities gained further ground over the past twelve months despite a decidedly clouded economic picture, both in the U.S. and in many regions around the world. While there has been some concern that dividend-paying stocks may lag the broader market if the Federal Reserve begins to finally raise rates, there are some important considerations to keep in mind. First, and foremost, we do not believe rates will rise significantly given the slow pace of economic growth and benign inflationary pressures, both here and abroad. Second, as we often point out, we expect all companies within the Fund to grow dividends on a consistent basis, providing a natural hedge if interest rates and inflation move higher over time. Third, any significant increase in interest rates could result in a sharp rise in volatility and a market correction. We note that the Fund has historically proven relatively defensive in periods of market turmoil.
While the Fund remains well-diversified among sectors, there have been some significant changes in allocation compared to this time last year. Both the energy minerals and industrial services sectors have been reduced, reflecting our view that energy prices will take some time to recover. Conversely, the combination of low energy prices and steady job gains is good news for consumers, which has led us to increase the weighting in the retail trade sector.
Relative to the Index, Fund performance was negatively impacted by stock selection in the health technology and finance sectors. Underperformers in the health technology sector included Johnson & Johnson and Merck, while closed-end funds Kayne Anderson and Tortoise Energy detracted from finance sector returns. On the positive side, strong stock selection in the energy minerals, utilities, commercial services and electronic technology sectors helped relative
HYPOTHETICAL GROWTH OF $10,000
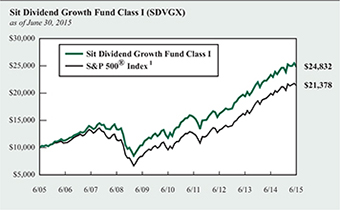
The chart above illustrates the total value of a hypothetical $10,000 investment in the Fund over the past 10 years as compared to the performance of the S&P 500® Index. Past performance does not guarantee future results. Returns include the reinvestment of distributions. The chart does not reflect the deduction of taxes that a shareholder would pay on Fund distributions or the redemption of Fund shares.
1 S&P 500® Index is an unmanaged capitalization-weighted index that measures the performance of 500 widely held common stocks of large-cap companies. It is not possible to invest directly in an index. This is the Fund’s primary index.
returns. Top performers in these sectors included Marathon Petroleum, Kinder Morgan, WEC Energy Group, Equifax, Moody’s Corp. and Avago Technologies.
Our research effort remains on high quality companies that can deliver consistent earnings growth and return excess capital, primarily through dividends.
Roger J. Sit
Kent L. Johnson
Michael J. Stellmacher
Portfolio Managers
| | |
Information on this page is unaudited. |
12 | | SIT MUTUAL FUNDS ANNUAL REPORT |
COMPARATIVE RATES OF RETURNS
as of June 30, 2015
| | | | | | | | | | | | |
| | | Sit Dividend
Growth Fund | | | | |
| | | Class I | | | Class S | | | S&P 500®
Index 1 | |
| | | |
One Year | | | 6.39% | | | | 6.13% | | | | 7.42% | |
Five Year | | | 16.08 | | | | 15.80 | | | | 17.34 | |
Ten Year | | | 9.52 | | | | n/a | | | | 7.89 | |
Since Inception - Class I (12/31/03) | | | 9.47 | | | | n/a | | | | 7.71 | |
Since Inception - Class S (3/31/06) | | | n/a | | | | 8.61 | | | | 7.42 | |
Performance figures are historical and do not guarantee future results. Investment returns and principal value will vary, and you may have a gain or loss when you sell shares. Current performance may be lower or higher than the performance data quoted. Contact the Fund for performance data current to the most recent month-end. Returns include changes in share price as well as reinvestment of all dividends and capital gains. Returns do not reflect the deduction of the 2% redemption fee imposed if shares are redeemed or exchanged within 30 calendar days from their date of purchase. If imposed, the fee would reduce the performance quoted. Returns do not reflect the deduction of taxes that a shareholder would pay on Fund distributions or the redemption of Fund shares. Management fees and administrative expenses are included in the Fund’s performance. Returns for periods greater than one year are compounded average annual rates of return.
1 S&P 500® Index is an unmanaged capitalization-weighted index that measures the performance of 500 widely held common stocks of large-cap companies. It is not possible to invest directly in an index.
PORTFOLIO SUMMARY
| | |
Class I: | | |
Net Asset Value 6/30/15: | | $17.40 Per Share |
Net Asset Value 6/30/14: | | $18.69 Per Share |
Total Net Assets: | | $955.5 Million |
Class S: | | |
Net Asset Value 6/30/15: | | $17.34 Per Share |
Net Asset Value 6/30/14: | | $18.63 Per Share |
Total Net Assets: | | $83.0 Million |
| |
Weighted Average Market Cap: | | $98.3 Billion |
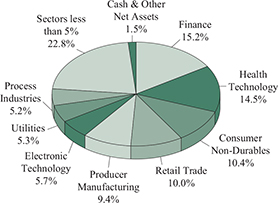
TOP 10 HOLDINGS
1. Medtronic, PLC
2. Home Depot, Inc.
3. Microsoft Corp.
4. Apple, Inc.
5. Honeywell International, Inc.
6. JPMorgan Chase & Co.
7. PepsiCo, Inc.
8. Verizon Communications, Inc.
9. Intel Corp.
10. Becton Dickson and Co.
Based on total net assets as of June 30, 2015. Subject to change.
FUND DIVERSIFICATION
Based on total net assets as of June 30, 2015. Subject to change.
| | |
Information on this page is unaudited. | | |
JUNE 30, 2015 | | 13 |
SCHEDULE OF INVESTMENTS
June 30, 2015
Sit Dividend Growth Fund
| | | | | | |
Quantity | | Name of Issuer | | Fair Value ($) | |
| |
Common Stocks - 98.5% | | | | |
Commercial Services - 1.9% | | | | |
51,425 | | Equifax, Inc. | | | 4,992,853 | |
67,375 | | Moody’s Corp. | | | 7,273,805 | |
160,525 | | Nielsen Holdings NV | | | 7,186,704 | |
| | | | | | |
| | | | | 19,453,362 | |
| | | | | | |
Communications - 2.8% | | | | |
205,450 | | BCE, Inc. | | | 8,731,625 | |
448,950 | | Verizon Communications, Inc. | | | 20,925,560 | |
| | | | | | |
| | | | | 29,657,185 | |
| | | | | | |
Consumer Durables - 2.7% | | | | |
66,425 | | Genuine Parts Co. | | | 5,947,030 | |
79,825 | | Snap-On, Inc. | | | 12,712,131 | |
54,650 | | Whirlpool Corp. | | | 9,457,182 | |
| | | | | | |
| | | | | 28,116,343 | |
| | | | | | |
Consumer Non-Durables - 6.1% | | | | |
80,225 | | JM Smucker Co./The | | | 8,697,192 | |
135,625 | | Kimberly-Clark Corp. | | | 14,372,181 | |
248,650 | | PepsiCo, Inc. | | | 23,208,991 | |
214,000 | | Procter & Gamble Co. | | | 16,743,360 | |
| | | | | | |
| | | | | 63,021,724 | |
| | | | | | |
Consumer Services - 4.2% | | | | |
364,200 | | H&R Block, Inc. | | | 10,798,530 | |
195,050 | | Starbucks Corp. | | | 10,457,606 | |
178,950 | | Time Warner, Inc. | | | 15,642,020 | |
96,800 | | Visa, Inc. | | | 6,500,120 | |
| | | | | | |
| | | | | 43,398,276 | |
| | | | | | |
Electronic Technology - 8.3% | | | | |
202,650 | | Apple, Inc. | | | 25,417,376 | |
759,375 | | Applied Materials, Inc. | | | 14,595,188 | |
130,200 | | Avago Technologies, Ltd. | | | 17,307,486 | |
626,400 | | Intel Corp. | | | 19,051,956 | |
43,500 | | Skyworks Solutions, Inc. | | | 4,528,350 | |
112,525 | | Xilinx, Inc. | | | 4,969,104 | |
| | | | | | |
| | | | | 85,869,460 | |
| | | | | | |
Energy Minerals - 3.8% | | | | |
188,775 | | Devon Energy Corp. | | | 11,230,225 | |
150,675 | | Marathon Petroleum Corp. | | | 7,881,809 | |
157,325 | | Occidental Petroleum Corp. | | | 12,235,165 | |
312,250 | | Suncor Energy, Inc. | | | 8,593,120 | |
| | | | | | |
| | | | | 39,940,319 | |
| | | | | | |
| | | | | | |
Quantity | | Name of Issuer | | Fair Value ($) | |
| |
Finance - 15.2% | | | | |
50,975 | | ACE, Ltd. | | | 5,183,138 | |
106,975 | | Ameriprise Financial, Inc. | | | 13,364,387 | |
96,900 | | Arthur J Gallagher & Co. | | | 4,583,370 | |
47,500 | | Avalonbay Communities, Inc. | | | 7,593,825 | |
246,775 | | Brixmor Property Group, Inc. | | | 5,707,906 | |
134,625 | | Discover Financial Services | | | 7,757,092 | |
47,475 | | Goldman Sachs Group, Inc. | | | 9,912,305 | |
237,675 | | Hartford Financial Services Group, Inc. | | | 9,880,150 | |
311,225 | | Invesco, Ltd. | | | 11,667,825 | |
345,725 | | JPMorgan Chase & Co. | | | 23,426,326 | |
136,150 | | Macquarie Infrastructure Co., LLC | | | 11,250,074 | |
108,200 | | Marsh & McLennan Cos., Inc. | | | 6,134,940 | |
262,050 | | PacWest Bancorp | | | 12,253,458 | |
114,800 | | PNC Financial Services Group, Inc. | | | 10,980,620 | |
115,975 | | Prudential Financial, Inc. | | | 10,150,132 | |
41,275 | | T Rowe Price Group, Inc. | | | 3,208,307 | |
112,175 | | Validus Holdings, Ltd. | | | 4,934,578 | |
| | | | | | |
| | | | | 157,988,433 | |
| | | | | | |
Health Services - 3.1% | | | | |
181,600 | | Cardinal Health, Inc. | | | 15,190,840 | |
135,975 | | UnitedHealth Group, Inc. | | | 16,588,950 | |
| | | | | | |
| | | | | 31,779,790 | |
| | | | | | |
Health Technology - 15.7% | | | | |
235,825 | | Abbott Laboratories | | | 11,574,291 | |
209,750 | | AbbVie, Inc. | | | 14,093,102 | |
131,775 | | Becton Dickinson and Co. | | | 18,665,929 | |
103,175 | | Gilead Sciences, Inc. | | | 12,079,729 | |
180,600 | | Johnson & Johnson | | | 17,601,276 | |
439,375 | | Medtronic, PLC | | | 32,557,688 | |
222,275 | | Merck & Co., Inc. | | | 12,654,116 | |
554,400 | | Pfizer, Inc. | | | 18,589,032 | |
160,500 | | St. Jude Medical, Inc. | | | 11,727,735 | |
116,900 | | Teva Pharmaceutical Industries, Ltd., ADR | | | 6,908,790 | |
64,175 | | Zimmer Holdings, Inc. | | | 7,009,835 | |
| | | | | | |
| | | | | 163,461,523 | |
| | | | | | |
Process Industries - 3.9% | | | | |
77,350 | | Agrium, Inc. | | | 8,195,232 | |
151,900 | | Archer-Daniels-Midland Co. | | | 7,324,618 | |
247,125 | | International Paper Co. | | | 11,760,679 | |
61,200 | | LyondellBasell Industries NV | | | 6,335,424 | |
43,000 | | Praxair, Inc. | | | 5,140,650 | |
30,075 | | Scotts Miracle-Gro Co. | | | 1,780,741 | |
| | | | | | |
| | | | | 40,537,344 | |
| | | | | | |
| | |
See accompanying notes to financial statements. | | |
14 | | SIT MUTUAL FUNDS ANNUAL REPORT |
| | | | | | |
Quantity | | Name of Issuer | | Fair Value ($) | |
| |
Producer Manufacturing - 8.4% | | | | |
61,400 | | 3M Co. | | | 9,474,020 | |
91,525 | | Delphi Automotive, PLC | | | 7,787,862 | |
74,000 | | General Dynamics Corp. | | | 10,485,060 | |
235,800 | | Honeywell International, Inc. | | | 24,044,526 | |
86,375 | | Illinois Tool Works, Inc. | | | 7,928,361 | |
57,950 | | Lockheed Martin Corp. | | | 10,772,905 | |
100,400 | | Raytheon Co. | | | 9,606,272 | |
200,625 | | Tyco International, PLC | | | 7,720,050 | |
| | | | | | |
| | | | | 87,819,056 | |
| | | | | | |
| |
Retail Trade - 9.2% | | | | |
167,100 | | CVS Health Corp. | | | 17,525,448 | |
242,725 | | Home Depot, Inc. | | | 26,974,029 | |
191,196 | | Macy’s, Inc. | | | 12,899,994 | |
180,025 | | Target Corp. | | | 14,695,441 | |
159,575 | | TJX Cos., Inc. | | | 10,559,078 | |
175,300 | | Wal-Mart Stores, Inc. | | | 12,434,029 | |
| | | | | | |
| | | | | 95,088,019 | |
| | | | | | |
| |
Technology Services - 4.9% | | | | |
79,875 | | Accenture, PLC | | | 7,730,302 | |
89,450 | | Automatic Data Processing, Inc. | | | 7,176,574 | |
576,175 | | Microsoft Corp. | | | 25,438,126 | |
255,025 | | Oracle Corp. | | | 10,277,508 | |
| | | | | | |
| | | | | 50,622,510 | |
| | | | | | |
| |
Transportation - 3.7% | | | | |
128,950 | | Delta Air Lines, Inc. | | | 5,297,266 | |
149,200 | | Ryder System, Inc. | | | 13,035,604 | |
81,575 | | Union Pacific Corp. | | | 7,779,808 | |
123,750 | | United Parcel Service, Inc. | | | 11,992,612 | |
| | | | | | |
| | | | | 38,105,290 | |
| | | | | | |
| | | | | | |
Quantity | | Name of Issuer | | Fair Value ($) | |
| |
Utilities - 4.6% | | | | |
470,400 | | CenterPoint Energy, Inc. | | | 8,951,712 | |
200,825 | | Kinder Morgan, Inc. | | | 7,709,672 | |
191,048 | | Laclede Group, Inc. | | | 9,945,960 | |
141,675 | | NextEra Energy, Inc. | | | 13,888,400 | |
157,500 | | WEC Energy Group, Inc. | | | 7,082,775 | |
| | | | | | |
| | | | | 47,578,519 | |
| | | | | | |
| |
Total Common Stocks
(cost: $873,543,175) | | | 1,022,437,153 | |
| | | | | | |
| |
Investment Companies - 1.1% | | | | |
147,800 | | Kayne Anderson MLP Investment Co. | | | 4,535,982 | |
200,400 | | Tortoise Energy Infrastructure Corp. | | | 7,396,764 | |
| | | | | | |
| |
Total Investment Companies
(cost: $13,151,597) | | | 11,932,746 | |
| | | | | | |
| |
Total Investments in Securities - 99.6%
(cost: $886,694,772) | | | 1,034,369,899 | |
| |
Other Assets and Liabilities, net - 0.4% | | | 4,049,301 | |
| | | | | | |
| |
Total Net Assets - 100.0% | | $ | 1,038,419,200 | |
| | | | | | |
Numeric footnotes not disclosed are not applicable to this Schedule of Investments.
ADR — American Depositary Receipt
LLC — Limited Liability Company
MLP — Master Limited Partnership
PLC — Public Limited Company
A summary of the levels for the Fund’s investments as of June 30, 2015 is as follows (see Note 2 - significant accounting policies in the notes to financial statements):
| | | | | | | | | | | | |
| | | Investment in Securities | |
| | | Level 1
Quoted Price ($) | | | Level 2
Other significant
observable inputs ($) | | Level 3 Significant
unobservable inputs ($) | | Total ($) | |
Common Stocks ** | | | 1,022,437,153 | | | — | | — | | | 1,022,437,153 | |
Investment Companies | | | 11,932,746 | | | — | | — | | | 11,932,746 | |
| | | | |
Total: | | | 1,034,369,899 | | | — | | — | | | 1,034,369,899 | |
| ** | For equity securities categorized in a single level, refer to the Schedule of Investments for further breakdown. |
For the reporting period, there were no transfers between levels 1, 2 and 3.
| | |
See accompanying notes to financial statements. | | |
JUNE 30, 2015 | | 15 |
|
|
| |
Sit Global Dividend Growth Fund - Class I and Class S |
OBJECTIVE & STRATEGY
The objective of the Sit Global Dividend Growth Fund is to provide current income that exceeds the dividend yield of the MSCI World Index and that grows over a period of years. Secondarily, the Fund seeks long-term capital appreciation.
The Fund seeks to achieve its objectives by investing, under normal market conditions, at least 80% of its net assets in dividend-paying common stocks issued by U.S. and foreign companies. The Fund may invest the balance of its assets in preferred stocks, convertible bonds, and U.S. Treasury securities.
Global equity markets delivered modest returns over the twelve month period ended June 30, 2015. The U.S. equity markets appreciated in the mid-single digits while international markets were down in the mid-single digits. The Sit Global Dividend Growth Fund Class I appreciated +2.19% outperforming the MSCI World Index, which appreciated +1.43%. The Fund’s gross dividend yield (before deduction of Fund expenses) is 2.80% compared to the 2.38% yield of the MSCI World Index. Within the Index, the information technology, health care and consumer discretionary sectors had the strongest returns while the energy and material sectors were down double digits. Regionally, North America was the sole country with positive performance. The weakest region was Europe.
Contributing most favorably to relative performance in the last twelve months were the Fund’s holdings in the energy sector. The underweight position, positive currency effect and good stock selection all contributed. The materials and consumer discretionary sectors also contributed nicely due to good stock selection and currency effect. Conversely, the Fund was negatively impacted by the holdings in the industrial, health care, and utilities sectors.
Geographically, the United Kingdom and Singapore were the top contributing countries due to strong stock selection. France had the largest negative impact due to stock selection followed by Switzerland due to negative stock selection and the overweight position.
Global equities gained further ground over the past twelve months despite a decidedly clouded economic picture, both in the U.S. and in many regions around the world. Fears of a Greek debt default or potential exit from the Euro Area weighed heavily on returns across Europe in June. While Greece will remain a headline risk we believe a highly accommodative monetary policy, solid export demand driven by continued currency weakness, and ongoing upward earnings revisions driven by improving demand, operating leverage, and deployment of excess cash for acquisitions and share repurchases will support stock prices. We remain overweight Europe, with holdings weighted towards companies that have exposure outside of Europe and are beneficiaries of the weak euro; possess secular or niche growth drivers; and/or address domestic markets where there is meaningful pent-up demand. Given the European overweight, the Fund is modestly underweight in the U.S. and meaningfully underweight in Japan as we remain skeptical of the durability of the current recovery.
HYPOTHETICAL GROWTH OF $10,000
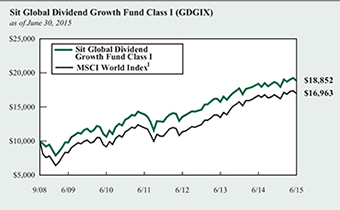
The chart above illustrates the total value of a hypothetical $10,000 investment in the Fund over the past 10 years (or for the life of the Fund if shorter) as compared to the performance of the MSCI World Index. Past performance does not guarantee future results. Returns include the reinvestment of distributions. The chart does not reflect the deduction of taxes that a shareholder would pay on Fund distributions or the redemption of Fund shares.
1 The MSCI World Index is a free float-adjusted market capitalization weighted index that is designed to measure the equity market performance of developed markets. It is not possible to invest directly in an index. This is the Fund’s primary index.
While there has been some concern that dividend paying stocks may lag the broader market if the U.S. Federal Reserve begins to finally raise rates, there are some important considerations to keep in mind. First, and foremost, we do not believe rates will rise significantly given the pace of economic growth and benign inflationary pressures, both in the U.S. and abroad. Second, as we often point out, we expect all companies within the Fund to grow dividends on a consistent basis, providing a natural hedge if interest rates and inflation move higher over time. Third, any significant increase in interest rates could result in a sharp rise in volatility and a market correction. We note that the Fund has historically proven relatively defensive in periods of market turmoil.
Roger J. Sit Raymond E. Sit Tasha M. Murdoff
Kent L. Johnson Michael J. Stellmacher
Portfolio Managers
| | |
Information on this page is unaudited. |
16 | | SIT MUTUAL FUNDS ANNUAL REPORT |
COMPARATIVE RATES OF RETURNS
as of June 30, 2015
| | | | | | | | | | | | |
| | | Sit Global Dividend Growth Fund | | | MSCI
World Index 1 | |
| | Class I | | | Class S | | |
One Year | | | 2.19% | | | | 2.00% | | | | 1.43% | |
Five Year | | | 12.08 | | | | 11.81 | | | | 13.10 | |
Since Inception (9/30/08) | | | 9.84 | | | | 9.57 | | | | 8.14 | |
Performance figures are historical and do not guarantee future results. Investment returns and principal value will vary, and you may have a gain or loss when you sell shares. Current performance may be lower or higher than the performance data quoted. Contact the Fund for performance data current to the most recent month-end. Returns include changes in share price as well as reinvestment of all dividends and capital gains. Returns do not reflect the deduction of the 2% redemption fee imposed if shares are redeemed or exchanged within 30 calendar days from their date of purchase. If imposed, the fee would reduce the performance quoted. Returns do not reflect the deduction of taxes that a shareholder would pay on Fund distributions or the redemption of Fund shares. Management fees and administrative expenses are included in the Fund’s performance. Returns for periods greater than one year are compounded average annual rates of return.
1 The MSCI World Index is a free float-adjusted market capitalization weighted index that is designed to measure the equity market performance of developed markets. It is not possible to invest directly in an index.
PORTFOLIO SUMMARY
| | |
| Class I: | | |
Net Asset Value 6/30/15: | | $ 14.80 Per Share |
Net Asset Value 6/30/14: | | $ 15.74 Per Share |
Total Net Assets: | | $ 21.4 Million |
| Class S: | | |
Net Asset Value 6/30/15: | | $ 14.78 Per Share |
Net Asset Value 6/30/14: | | $ 15.72 Per Share |
Total Net Assets: | | $ 3.5 Million |
| |
Weighted Average Market Cap: | | $ 108.7 Billion |
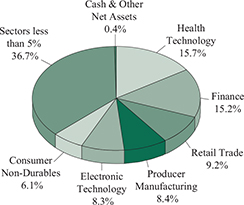
TOP 10 HOLDINGS
1. Medtronic, PLC
2. Roche Holding AG
3. Seven & I Holdings Co., Ltd.
4. BCE, Inc.
5. Apple, Inc.
6. Nestle SA
7. Verizon Communications, Inc.
8. Barclays, PLC
9. Diageo, PLC, ADR
10. Cardinal Health, Inc.
Based on total net assets as of June 30, 2015. Subject to change.
FUND DIVERSIFICATION
Based on total net assets as of June 30, 2015. Subject to change.
| | |
Information on this page is unaudited. | | |
JUNE 30, 2015 | | 17 |
SCHEDULE OF INVESTMENTS
June 30, 2015
Sit Global Dividend Growth Fund
| | | | | | |
Quantity | | Name of Issuer | | Fair Value ($) | |
| |
Common Stocks - 97.6% | | | | |
Africa/Middle East - 1.0% | | | | |
Israel - 1.0% | | | | |
4,300 | | Teva Pharmaceutical Industries, Ltd., ADR | | | 254,130 | |
| | | | | | |
Asia - 5.3% | | | | |
China/Hong Kong - 1.1% | | | | |
5,950 | | HSBC Holdings, PLC, ADR | | | 266,620 | |
| | | | | | |
Japan - 2.7% | | | | |
15,700 | | Seven & I Holdings Co., Ltd. | | | 673,932 | |
| | | | | | |
Singapore - 1.5% | | | | |
2,800 | | Avago Technologies, Ltd. | | | 372,204 | |
| | | | | | |
Europe - 34.2% | | | | |
Belgium - 1.8% | | | | |
3,600 | | Anheuser-Busch InBev NV, ADR | | | 434,412 | |
| | | | | | |
France - 4.8% | | | | |
3,915 | | BNP Paribas SA | | | 237,573 | |
25,700 | | GDF Suez | | | 478,493 | |
2,750 | | Schlumberger, Ltd. | | | 237,022 | |
3,500 | | Schneider Electric SE | | | 242,337 | |
| | | | | | |
| | | | | 1,195,425 | |
| | | | | | |
Germany - 1.8% | | | | |
4,300 | | Siemens AG | | | 435,039 | |
| | | | | | |
Ireland - 4.4% | | | | |
2,575 | | Accenture, PLC | | | 249,208 | |
11,524 | | Medtronic, PLC | | | 853,928 | |
| | | | | | |
| | | | | 1,103,136 | |
| | | | | | |
Italy - 0.7% | | | | |
6,050 | | Azimut Holding SpA | | | 177,096 | |
| | | | | | |
Netherlands - 2.6% | | | | |
18,650 | | ING Groep NV, ADR | | | 309,217 | |
3,125 | | LyondellBasell Industries NV | | | 323,500 | |
| | | | | | |
| | | | | 632,717 | |
| | | | | | |
Spain - 1.2% | | | | |
45,200 | | Iberdrola SA | | | 305,171 | |
| | | | | | |
Switzerland - 9.2% | | | | |
2,500 | | ACE, Ltd. | | | 254,200 | |
3,945 | | Adecco SA | | | 320,166 | |
7,550 | | Nestle SA | | | 544,737 | |
2,885 | | Roche Holding AG | | | 808,929 | |
1,200 | | Zurich Insurance Group AG | | | 365,316 | |
| | | | | | |
| | | | | 2,293,348 | |
| | | | | | |
United Kingdom - 7.7% | | | | |
123,975 | | Barclays, PLC | | | 508,128 | |
7,875 | | Burberry Group, PLC | | | 194,279 | |
3,650 | | Delphi Automotive, PLC | | | 310,578 | |
| | | | | | |
Quantity | | Name of Issuer | | Fair Value ($) | |
| | |
4,250 | | Diageo, PLC, ADR | | | 493,170 | |
68,065 | | DS Smith, PLC | | | 412,756 | |
| | | | | | |
| | | | | 1,918,911 | |
| | | | | | |
North America - 57.1% | | | | |
Bermuda - 0.6% | | | | |
4,000 | | Invesco, Ltd. | �� | | 149,960 | |
| | | | | | |
Canada - 5.0% | | | | |
3,600 | | Agrium, Inc. | | | 381,420 | |
14,375 | | BCE, Inc. | | | 610,938 | |
8,900 | | Suncor Energy, Inc. | | | 244,928 | |
| | | | | | |
| | | | | 1,237,286 | |
| | | | | | |
United States - 51.5% | | | | |
1,550 | | 3M Co. | | | 239,165 | |
6,300 | | AbbVie, Inc. | | | 423,297 | |
1,425 | | Ameriprise Financial, Inc. | | | 178,025 | |
4,400 | | Apple, Inc. | | | 551,870 | |
9,400 | | Applied Materials, Inc. | | | 180,668 | |
5,300 | | Arthur J Gallagher & Co. | | | 250,690 | |
2,150 | | Automatic Data Processing, Inc. | | | 172,494 | |
5,850 | | Cardinal Health, Inc. | | | 489,352 | |
16,200 | | CenterPoint Energy, Inc. | | | 308,286 | |
2,600 | | Chevron Corp. | | | 250,822 | |
2,550 | | CVS Health Corp. | | | 267,444 | |
4,375 | | Discover Financial Services | | | 252,088 | |
1,775 | | General Dynamics Corp. | | | 251,500 | |
2,225 | | Gilead Sciences, Inc. | | | 260,503 | |
3,925 | | Home Depot, Inc. | | | 436,185 | |
4,300 | | Honeywell International, Inc. | | | 438,471 | |
10,200 | | Intel Corp. | | | 310,233 | |
3,600 | | International Paper Co. | | | 171,324 | |
3,250 | | Johnson & Johnson | | | 316,745 | |
6,650 | | JPMorgan Chase & Co. | | | 450,604 | |
3,125 | | Kimberly-Clark Corp. | | | 331,156 | |
6,050 | | Kinder Morgan, Inc. | | | 232,260 | |
2,275 | | Lockheed Martin Corp. | | | 422,922 | |
5,350 | | Macy’s, Inc. | | | 360,964 | |
3,550 | | Marathon Petroleum Corp. | | | 185,700 | |
10,950 | | Microsoft Corp. | | | 483,442 | |
4,975 | | Occidental Petroleum Corp. | | | 386,906 | |
4,700 | | PepsiCo, Inc. | | | 438,698 | |
12,875 | | Pfizer, Inc. | | | 431,699 | |
4,250 | | Procter & Gamble Co. | | | 332,520 | |
4,125 | | Prudential Financial, Inc. | | | 361,020 | |
1,125 | | Snap-On, Inc. | | | 179,156 | |
3,400 | | St. Jude Medical, Inc. | | | 248,438 | |
4,800 | | Starbucks Corp. | | | 257,352 | |
2,400 | | Time Warner, Inc. | | | 209,784 | |
2,950 | | TJX Cos., Inc. | | | 195,202 | |
3,800 | | Union Pacific Corp. | | | 362,406 | |
| | |
See accompanying notes to financial statements. | | |
18 | | SIT MUTUAL FUNDS ANNUAL REPORT |
| | | | | | |
Quantity | | Name of Issuer | | Fair Value ($) | |
| | |
3,200 | | United Parcel Service, Inc. | | | 310,112 | |
11,200 | | Verizon Communications, Inc. | | | 522,032 | |
5,250 | | Wal-Mart Stores, Inc. | | | 372,382 | |
| | | | | | |
| | | | | 12,823,917 | |
| | | | | | |
Total Common Stocks
(cost: $22,755,366) | | | 24,273,304 | |
| | | | | | |
Investment Companies - 0.9% | | | | |
7,775 | | Kayne Anderson MLP Investment Co. | | | 238,615 | |
| | | | | | |
(cost: $254,808) | | | | |
| |
Total Investments in Securities - 98.5% | | | | |
(cost: $23,010,174) | | | 24,511,919 | |
| |
Other Assets and Liabilities, net - 1.5% | | | 363,615 | |
| | | | | | |
| |
Total Net Assets - 100.0% | | | $24,875,534 | |
| | | | | | |
Numeric footnotes not disclosed are not applicable to this Schedule of Investments
ADR — American Depositary Receipt
MLP — Master Limited Partnership
PLC — Public Limited Company
| | |
See accompanying notes to financial statements. | | |
JUNE 30, 2015 | | 19 |
SCHEDULE OF INVESTMENTS
June 30, 2015
Sit Global Dividend Growth Fund (Continued)
A summary of the levels for the Fund’s investments as of June 30, 2015 is as follows (see Note 2 - significant accounting policies in the notes to financial statements):
| | | | | | | | | | | | | | |
| | | Investment in Securities | |
| | | Level 1 Quoted Price ($) | | | Level 2
Other significant
observable inputs ($) | | | Level 3 Significant
unobservable inputs ($) | | Total ($) | |
Common Stocks | | | | | | | | | | | | | | |
Belgium | | | 434,412 | | | | — | | | — | | | 434,412 | |
Bermuda | | | 149,960 | | | | — | | | — | | | 149,960 | |
Canada | | | 1,237,286 | | | | — | | | — | | | 1,237,286 | |
China/Hong Kong | | | 266,620 | | | | — | | | — | | | 266,620 | |
France | | | 237,022 | | | | 958,403 | | | — | | | 1,195,425 | |
Germany | | | — | | | | 435,039 | | | — | | | 435,039 | |
Ireland | | | 1,103,136 | | | | — | | | — | | | 1,103,136 | |
Israel | | | 254,130 | | | | — | | | — | | | 254,130 | |
Italy | | | — | | | | 177,096 | | | — | | | 177,096 | |
Japan | | | — | | | | 673,932 | | | — | | | 673,932 | |
Netherlands | | | 632,717 | | | | — | | | — | | | 632,717 | |
Singapore | | | 372,204 | | | | — | | | — | | | 372,204 | |
Spain | | | — | | | | 305,171 | | | — | | | 305,171 | |
Switzerland | | | 254,200 | | | | 2,039,148 | | | — | | | 2,293,348 | |
United Kingdom | | | 803,748 | | | | 1,115,163 | | | — | | | 1,918,911 | |
United States | | | 12,823,917 | | | | — | | | — | | | 12,823,917 | |
Investment Companies | | | 238,615 | | | | — | | | — | | | 238,615 | |
| | | | |
Total: | | | 18,807,967 | | | | 5,703,952 | | | — | | | 24,511,919 | |
The Fund adjusts the closing price of foreign equity securities by applying a systematic process for events occurring after the close of the foreign exchanges. At each reporting period, this process is applied for all foreign securities and therefore all foreign securities are classified as level 2. There are no transfers between level 1 and level 2 between reporting periods as a result of applying this process. Level 1 securities of foreign issuers are primarily American Depositary Receipts (ADRs), Public Limited Companies (PLCs) or Global Depositary Receipts (GDRs). There were no transfers into or out of level 3 during the reporting period.
| | |
See accompanying notes to financial statements. | | |
20 | | SIT MUTUAL FUNDS ANNUAL REPORT |
[This page intentionally left blank.]
|
|
| |
Sit Large Cap Growth Fund |
OBJECTIVE & STRATEGY
The objective of the Sit Large Cap Growth Fund is to maximize long-term capital appreciation. The Fund pursues this objective by investing at least 80% of its net assets in the common stocks of domestic growth companies with capitalizations of $5 billion or more at the time of purchase.
The Sit Large Cap Growth Fund’s one-year return was +10.62%, compared to the +10.56% return for the Russell 1000® Growth Index. The S&P 500® Index return for the period was +7.42%.
U.S. stocks overcame some significant headwinds, including a stall in corporate earnings growth and signs of a less accommodative Federal Reserve, to post solid gains over the past year. While we believe stock prices can grind higher from here, investors must be prepared for an increase in volatility over the next several quarters as fears over higher interest rates in the U.S. and concerns over economic growth in emerging markets have potential to rattle global markets. We strongly believe, however, that the environment for high quality, large capitalization growth companies is very attractive on a relative basis. From a sector standpoint, we continue to believe that the two most heavily weighted sectors within the Fund, technology services and health technology, are particularly attractive, as valuations are reasonable given the secular growth in these areas. Conversely, the portfolio has minimal exposure to commodities (including energy) and other highly cyclical industries that are overly dependent on robust economic activity to drive earnings growth.
Relative to the Russell 1000® Growth Index, performance over the past year was positively impacted by stock selection in the consumer services, finance and health services sectors, as well as by an overweight position in the health technology sector, which performed very strongly during the period. Key contributors in these sectors included Starbucks Corp., Visa, Goldman Sachs, JPMorgan Chase, UnitedHealth Group, HCA Holdings, Gilead Sciences, Allergan and Regeneron Pharmaceuticals. Conversely, negative stock selection and overweighted positions in the underperforming producer manufacturing and technology services sector detracted from performance over the past twelve months. Laggards in these sectors included Trinity Industries, Eaton Corp., Google and Priceline Group.
HYPOTHETICAL GROWTH OF $10,000
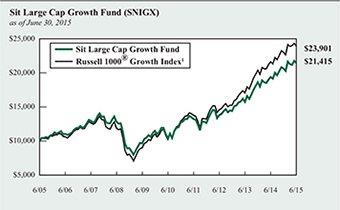
The chart above illustrates the total value of a hypothetical $10,000 investment in the Fund over the past 10 years as compared to the performance of the Russell 1000® Growth Index. Past performance does not guarantee future results. Returns include the reinvestment of distributions. The chart does not reflect the deduction of taxes that a shareholder would pay on Fund distributions or the redemption of Fund shares.
1 Russell 1000® Growth Index is an unmanaged index that measures the performance of those Russell 1000 Index companies with higher price-to-book ratios and higher forecasted growth values. It is not possible to invest directly in an index. This is the Fund’s primary index.
We continue to be optimistic on the outlook for companies held in the Fund, and appreciate shareholders’ continued interest.
Roger J. Sit
Ronald D. Sit
Michael J. Stellmacher
Portfolio Managers
| | |
Information on this page is unaudited. |
22 | | SIT MUTUAL FUNDS ANNUAL REPORT |
COMPARATIVE RATES OF RETURNS
as of June 30, 2015
| | | | | | | | | | | | |
| | | Sit Large
Cap Growth
Fund | | | Russell
1000®
Growth
Index 1 | | | Russell
1000®
Index 2 | |
| | | |
One Year | | | 10.62 | % | | | 10.56 | % | | | 7.37 | % |
Five Year | | | 15.56 | | | | 18.59 | | | | 17.58 | |
Ten Year | | | 7.91 | | | | 9.10 | | | | 8.13 | |
Since Inception 3 | | | 10.04 | | | | 11.11 | | | | 11.86 | |
(9/2/82) | | | | | | | | | | | | |
Performance figures are historical and do not guarantee future results. Investment returns and principal value will vary, and you may have a gain or loss when you sell shares. Current performance may be lower or higher than the performance data quoted. Contact the Fund for performance data current to the most recent month-end. Returns include changes in share price as well as reinvestment of all dividends and capital gains. Returns do not reflect the deduction of the 2% redemption fee imposed if shares are redeemed or exchanged within 30 calendar days from their date of purchase. If imposed, the fee would reduce the performance quoted. Returns do not reflect the deduction of taxes that a shareholder would pay on Fund distributions or the redemption of Fund shares. Management fees and administrative expenses are included in the Fund’s performance. Returns for periods greater than one year are compounded average annual rates of return.
1 Russell 1000® Growth Index is an unmanaged index that measures the performance of those Russell 1000 Index companies with higher price-to-book ratios and higher forecasted growth values. It is not possible to invest directly in an index.
2 Russell 1000® Index is an unmanaged index that measures the performance of approximately 1,000 of the largest U.S. companies by market capitalization.
3 On 6/6/93, the Fund’s investment objective changed to allow for a portfolio of 100% stocks. Prior to that time, the portfolio was required to contain no more than 80% stocks.
PORTFOLIO SUMMARY
| | |
Net Asset Value 6/30/15: | | $ 47.21 Per Share |
Net Asset Value 6/30/14: | | $ 52.51 Per Share |
Total Net Assets: | | $ 144.8 Million |
Weighted Average Market Cap: | | $ 129.8 Billion |
TOP 10 HOLDINGS
1. Apple, Inc.
2. Google, Inc.
3. Medtronic, PLC
4. Gilead Sciences, Inc.
5. Visa, Inc.
6. Home Depot
7. CVS Health Corp.
8. Microsoft Corp.
9. PepsiCo, Inc.
10. Allergan, PLC
Based on total net assets as of June 30, 2015. Subject to change.
FUND DIVERSIFICATION
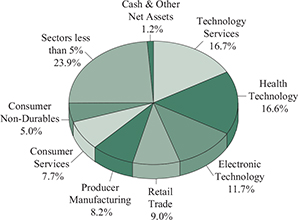
Based on total net assets as of June 30, 2015. Subject to change.
| | |
Information on this page is unaudited. | | |
JUNE 30, 2015 | | 23 |
SCHEDULE OF INVESTMENTS
June 30, 2015
Sit Large Cap Growth Fund
| | | | | | |
Quantity | | Name of Issuer | | Fair Value ($) | |
| |
Common Stocks - 98.8% | | | | |
Commercial Services - 2.2% | | | | |
16,800 | | Equifax, Inc. | | | 1,631,112 | |
26,600 | | Robert Half International, Inc. | | | 1,476,300 | |
| | | | | | |
| | | | | 3,107,412 | |
| | | | | | |
Communications - 2.6% | | | | |
11,500 | | SBA Communications Corp. * | | | 1,322,155 | |
53,400 | | Verizon Communications, Inc. | | | 2,488,974 | |
| | | | | | |
| | | | | 3,811,129 | |
| | | | | | |
Consumer Durables - 1.5% | | | | |
8,500 | | Polaris Industries, Inc. | | | 1,258,935 | |
5,500 | | Whirlpool Corp. | | | 951,775 | |
| | | | | | |
| | | | | 2,210,710 | |
| | | | | | |
Consumer Non-Durables - 5.0% | | | | |
19,800 | | NIKE, Inc. | | | 2,138,796 | |
33,600 | | PepsiCo, Inc. | | | 3,136,224 | |
24,800 | | Procter & Gamble Co. | | | 1,940,352 | |
| | | | | | |
| | | | | 7,215,372 | |
| | | | | | |
Consumer Services - 7.7% | | | | |
1,050 | | Chipotle Mexican Grill, Inc. * | | | 635,240 | |
34,500 | | H&R Block, Inc. | | | 1,022,925 | |
53,000 | | Starbucks Corp. | | | 2,841,595 | |
19,075 | | Time Warner, Inc. | | | 1,667,346 | |
41,700 | | Twenty-First Century Fox, Inc. | | | 1,357,126 | |
53,700 | | Visa, Inc. | | | 3,605,955 | |
| | | | | | |
| | | | | 11,130,187 | |
| | | | | | |
Electronic Technology - 11.7% | | | | |
63,975 | | Apple, Inc. | | | 8,024,064 | |
91,900 | | Applied Materials, Inc. | | | 1,766,318 | |
19,600 | | Avago Technologies, Ltd. | | | 2,605,428 | |
57,500 | | Ciena Corp. * | | | 1,361,600 | |
59,300 | | Intel Corp. | | | 1,803,610 | |
7,900 | | Skyworks Solutions, Inc. | | | 822,390 | |
10,900 | | Xilinx, Inc. | | | 481,344 | |
| | | | | | |
| | | | | 16,864,754 | |
| | | | | | |
Energy Minerals - 2.7% | | | | |
16,500 | | Continental Resources, Inc. * | | | 699,435 | |
8,100 | | EOG Resources, Inc. | | | 709,155 | |
12,000 | | Gulfport Energy Corp. * | | | 483,000 | |
22,860 | | Marathon Petroleum Corp. | | | 1,195,807 | |
11,200 | | Occidental Petroleum Corp. | | | 871,024 | |
| | | | | | |
| | | | | 3,958,421 | |
| | | | | | |
| | | | | | |
Quantity | | Name of Issuer | | Fair Value ($) | |
| |
Finance - 3.2% | | | | |
6,700 | | Goldman Sachs Group, Inc. | | | 1,398,893 | |
25,300 | | JPMorgan Chase & Co. | | | 1,714,328 | |
11,300 | | Marsh & McLennan Cos., Inc. | | | 640,710 | |
10,400 | | T Rowe Price Group, Inc. | | | 808,392 | |
| | | | | | |
| | | | | 4,562,323 | |
| | | | | | |
Health Services - 4.2% | | | | |
15,100 | | Express Scripts Holding Co. * | | | 1,342,994 | |
3,800 | | Humana, Inc. | | | 726,864 | |
9,600 | | McKesson Corp. | | | 2,158,176 | |
15,100 | | UnitedHealth Group, Inc. | | | 1,842,200 | |
| | | | | | |
| | | | | 6,070,234 | |
| | | | | | |
Health Technology - 16.6% | | | | |
25,900 | | AbbVie, Inc. | | | 1,740,221 | |
7,400 | | Alexion Pharmaceuticals, Inc. * | | | 1,337,698 | |
9,600 | | Allergan, PLC * | | | 2,913,313 | |
19,050 | | Celgene Corp. * | | | 2,204,752 | |
35,500 | | Gilead Sciences, Inc. | | | 4,156,340 | |
14,900 | | Johnson & Johnson | | | 1,452,154 | |
57,900 | | Medtronic, PLC | | | 4,290,390 | |
13,800 | | Mylan NV * | | | 936,468 | |
1,575 | | Regeneron Pharmaceuticals, Inc. * | | | 803,455 | |
19,900 | | St. Jude Medical, Inc. | | | 1,454,093 | |
10,400 | | Thermo Fisher Scientific, Inc. | | | 1,349,504 | |
12,975 | | Zimmer Holdings, Inc. | | | 1,417,259 | |
| | | | | | |
| | | | | 24,055,647 | |
| | | | | | |
Industrial Services - 0.9% | | | | |
15,400 | | Schlumberger, Ltd. | | | 1,327,326 | |
| | | | | | |
Process Industries - 2.4% | | | | |
24,400 | | Ecolab, Inc. | | | 2,758,908 | |
6,300 | | Praxair, Inc. | | | 753,165 | |
| | | | | | |
| | | | | 3,512,073 | |
| | | | | | |
Producer Manufacturing - 8.2% | | | | |
9,900 | | 3M Co. | | | 1,527,570 | |
4,800 | | Caterpillar, Inc. | | | 407,135 | |
23,200 | | Danaher Corp. | | | 1,985,688 | |
13,700 | | Delphi Automotive, PLC | | | 1,165,733 | |
6,900 | | General Dynamics Corp. | | | 977,661 | |
21,075 | | Honeywell International, Inc. | | | 2,149,018 | |
12,900 | | Illinois Tool Works, Inc. | | | 1,184,091 | |
14,800 | | Raytheon Co. | | | 1,416,064 | |
9,800 | | United Technologies Corp. | | | 1,087,114 | |
| | | | | | |
| | | | | 11,900,074 | |
| | | | | | |
| | |
See accompanying notes to financial statements. | | |
24 | | SIT MUTUAL FUNDS ANNUAL REPORT |
| | | | | | |
Quantity | | Name of Issuer | | Fair Value ($) | |
| |
Retail Trade - 9.0% | | | | |
33,200 | | CVS Health Corp. | | | 3,482,016 | |
14,900 | | Dick’s Sporting Goods, Inc. | | | 771,373 | |
31,700 | | Home Depot, Inc. | | | 3,522,821 | |
13,600 | | Macy’s, Inc. | | | 917,592 | |
15,300 | | Target Corp. | | | 1,248,939 | |
30,000 | | TJX Cos., Inc. | | | 1,985,100 | |
16,400 | | Wal-Mart Stores, Inc. | | | 1,163,252 | |
| | | | | | |
| | | | | 13,091,093 | |
| | | | | | |
Technology Services - 16.7% | | | | |
21,400 | | Accenture, PLC | | | 2,071,092 | |
35,600 | | Adobe Systems, Inc. * | | | 2,883,956 | |
12,200 | | ANSYS, Inc. * | | | 1,113,128 | |
33,000 | | Cognizant Technology Solutions Corp. * | | | 2,015,970 | |
28,400 | | Facebook, Inc. * | | | 2,435,726 | |
5,050 | | Google, Inc.-Class A * | | | 2,727,202 | |
5,966 | | Google, Inc.-Class C * | | | 3,105,363 | |
78,500 | | Microsoft Corp. | | | 3,465,775 | |
54,100 | | Oracle Corp. | | | 2,180,230 | |
1,925 | | priceline.com, Inc. * | | | 2,216,387 | |
| | | | | | |
| | | | | 24,214,829 | |
| | | | | | |
| | | | | | |
Quantity | | Name of Issuer | | Fair Value ($) | |
| |
Transportation - 4.2% | | | | |
32,600 | | Delta Air Lines, Inc. | | | 1,339,208 | |
4,600 | | FedEx Corp. | | | 783,840 | |
12,100 | | Ryder System, Inc. | | | 1,057,177 | |
19,900 | | Union Pacific Corp. | | | 1,897,863 | |
10,000 | | United Parcel Service, Inc. | | | 969,100 | |
| | | | | | |
| | | | | 6,047,188 | |
| | | | | | |
| |
Total Common Stocks
(cost: $95,481,705) | | | 143,078,772 | |
| | | | | | |
Total Investments in Securities - 98.8%
(cost: $95,481,705) | | | 143,078,772 | |
| |
Other Assets and Liabilities, net - 1.2% | | | 1,728,090 | |
| | | | | | |
| |
Total Net Assets - 100.0% | | $ | 144,806,862 | |
| | | | | | |
| * | Non-income producing security. |
Numeric footnotes not disclosed are not applicable to this Schedule of Investments.
PLC — Public Limited Company
A summary of the levels for the Fund’s investments as of June 30, 2015 is as follows (see Note 2 - significant accounting policies in the notes to financial statements):
| | | | | | | | | | | | |
| | | Investment in Securities | |
| | | Level 1
Quoted
Price ($) | | | Level 2
Other significant
observable inputs ($) | | Level 3 Significant unobservable inputs ($) | | Total ($) | |
Common Stocks ** | | | 143,078,772 | | | — | | — | | | 143,078,772 | |
| | | | |
Total: | | | 143,078,772 | | | — | | — | | | 143,078,772 | |
| ** | For equity securities categorized in a single level, refer to the Schedule of Investments for further breakdown. |
For the reporting period, there were no transfers between levels 1, 2 and 3.
| | |
See accompanying notes to financial statements. | | |
JUNE 30, 2015 | | 25 |
OBJECTIVE & STRATEGY
The objective of the Sit Mid Cap Growth Fund is to maximize long-term capital appreciation. The Fund pursues this objective by investing at least 80% of its net assets in common stocks that, at the time of purchase, have market capitalizations that fall within the range of companies included in the Russell Midcap® Growth Index during the most recent 12-month period. The Russell Midcap® Growth Index ranged from approximately $201 million to $38.0 billion during the 12-month period ended June 30, 2015.
The Sit Mid Cap Growth Fund’s twelve-month return was +9.52%, compared to +9.45% for the Russell Midcap® Growth Index. The Russell Midcap® Index advanced +6.63% during the period.
Mid Cap Growth stocks overcame some volatility along the way to post strong gains over the past year. While this volatility may not go away anytime soon, our research staff remains focused on identifying nimble, high quality companies that can post solid earnings growth, even in an uneven economic backdrop. In addition, we foresee a continuation of the strong mergers and acquisition environment, so, accordingly, we expect many small- and mid-sized firms to be targets for larger companies looking to acquire growth amid a sluggish economy. In terms of sectors, the health care and technology sectors remain a key focus within the Fund and, compared to this time last year, each of these sectors is now more heavily weighted. This reflects our view that companies in these sectors have growth attributes not available in many other areas of the market. The most significant weighting decreases over the past year occurred in producer manufacturing and industrial services sectors (together down over 7% from 6/30/14). Many companies in these sectors were vulnerable to the stronger U.S. dollar and lower capital expenditures by the energy sector in the face of lower commodity prices, and we do not foresee a fundamental change in the near future.
The Fund’s relative performance to the Russell Midcap® Growth Index over the past year was aided by strong stock selection in the electronic technology, consumer services and energy minerals sectors. The most notable individual stocks in these sectors included Skyworks Solutions (+123% one-year return), Avago Technologies (+87%), AMC Networks (+33%), and Marathon Petroleum (+37%). The Fund’s one-year relative performance was negatively impacted by stock selection in the consumer non-durables, process industries and producer manufacturing sectors. Laggards in these sectors included Iconix Brand Group, Michael Kors Holdings, FMC Corp., Trinity
HYPOTHETICAL GROWTH OF $10,000
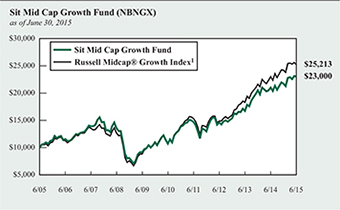
The chart above illustrates the total value of a hypothetical $10,000 investment in the Fund over the past 10 years as compared to the performance of the Russell Midcap® Growth Index. Past performance does not guarantee future results. Returns include the reinvestment of distributions. The chart does not reflect the deduction of taxes that a shareholder would pay on Fund distributions or the redemption of Fund shares.
1 Russell Midcap® Growth Index is an unmanaged index that measures the performance of those Russell Midcap Index companies with higher price-to-book ratios and higher forecasted growth values. It is not possible to invest directly in an index. This is the Fund’s primary index.
Industries and Trimble Navigation. Our research effort is highly focused on companies with strong, experienced management teams, sound balance sheets, and sustainable earnings growth potential. We strongly believe that this focus will reward our shareholders over time.
Roger J. Sit
Kent L. Johnson
Robert W. Sit
Portfolio Managers
| | |
Information on this page is unaudited. |
26 | | SIT MUTUAL FUNDS ANNUAL REPORT |
COMPARATIVE RATES OF RETURNS
as of June 30, 2015
| | | | | | |
| | | Sit Mid Cap
Growth Fund | | Russell
Midcap®
Growth
Index 1 | | Russell
Midcap®
Index 2 |
| | | |
One Year | | 9.52% | | 9.45% | | 6.63% |
Five Year | | 16.55 | | 18.69 | | 18.23 |
Ten Year | | 8.69 | | 9.69 | | 9.40 |
Since Inception | | 12.04 | | n/a | | n/a |
(9/2/82) | | | | | | |
Performance figures are historical and do not guarantee future results. Investment returns and principal value will vary, and you may have a gain or loss when you sell shares. Current performance may be lower or higher than the performance data quoted. Contact the Fund for performance data current to the most recent month-end. Returns include changes in share price as well as reinvestment of all dividends and capital gains and all fee waivers. Without the fee waivers total return and yield figures would have been lower. Returns do not reflect the deduction of the 2% redemption fee imposed if shares are redeemed or exchanged within 30 calendar days from their date of purchase. If imposed, the fee would reduce the performance quoted. Returns do not reflect the deduction of taxes that a shareholder would pay on Fund distributions or the redemption of Fund shares. Management fees and administrative expenses are included in the Fund’s performance. Returns for periods greater than one year are compounded average annual rates of return.
1 Russell Midcap® Growth Index is an unmanaged index that measures the performance of those Russell Midcap Index companies with higher price-to-book ratios and higher forecasted growth values. It is not possible to invest directly in an index.
2 Russell Midcap® Index is an unmanaged index that measures the performance of approximately 800 of the smallest companies in the Russell 1000® Index.
PORTFOLIO SUMMARY
| | |
Net Asset Value 06/30/15: | | $ 20.22 Per Share |
Net Asset Value 6/30/14: | | $ 21.08 Per Share |
Total Net Assets: | | $ 171.9 Million |
Weighted Average Market Cap: | | $ 19.6 Billion |
TOP 10 HOLDINGS
1. Skyworks Solutions, Inc.
2. Allergan, PLC
3. Avago Technologies, Ltd.
4. Acadia Healthcare Co., Inc.
5. TJX Cos., Inc.
6. Ecolab, Inc.
7. Ultimate Software Group, Inc.
8. Snap-On, Inc.
9. Macy’s, Inc.
10. Ulta Salon Cosmetics & Fragrance, Inc.
Based on total net assets as of June 30, 2015. Subject to change.
FUND DIVERSIFICATION
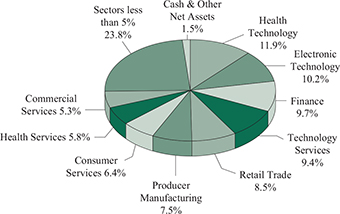
Based on total net assets as of June 30, 2015. Subject to change.
| | |
Information on this page is unaudited. | | |
JUNE 30, 2015 | | 27 |
SCHEDULE OF INVESTMENTS
June 30, 2015
Sit Mid Cap Growth Fund
| | | | | | |
Quantity | | Name of Issuer | | Fair Value ($) | |
|
Common Stocks - 98.5% | |
Commercial Services - 5.3% | | | | |
55,300 | | Cardtronics, Inc. * | | | 2,048,865 | |
19,900 | | Equifax, Inc. | | | 1,932,091 | |
17,900 | | Moody’s Corp. | | | 1,932,484 | |
29,500 | | Robert Half International, Inc. | | | 1,637,250 | |
13,000 | | Towers Watson & Co. | | | 1,635,400 | |
| | | | | | |
| | |
| | | | | 9,186,090 | |
| | | | | | |
Communications - 1.2% | | | | |
18,300 | | SBA Communications Corp. * | | | 2,103,951 | |
| | | | | | |
Consumer Durables - 4.0% | | | | |
15,300 | | Carlisle Cos., Inc. | | | 1,531,836 | |
14,900 | | Polaris Industries, Inc. | | | 2,206,839 | |
19,600 | | Snap-On, Inc. | | | 3,121,300 | |
| | | | | | |
| | |
| | | | | 6,859,975 | |
| | | | | | |
Consumer Non-Durables - 3.8% | | | | |
48,900 | | Coca-Cola Enterprises, Inc. | | | 2,124,216 | |
27,200 | | G-III Apparel Group, Ltd. * | | | 1,913,520 | |
77,000 | | Iconix Brand Group, Inc. * | | | 1,922,690 | |
12,700 | | Michael Kors Holdings, Ltd. * | | | 534,543 | |
| | | | | | |
| | |
| | | | | 6,494,969 | |
| | | | | | |
Consumer Services - 6.4% | | | | |
21,400 | | AMC Networks, Inc. * | | | 1,751,590 | |
4,000 | | Chipotle Mexican Grill, Inc. * | | | 2,419,960 | |
32,900 | | Dunkin’ Brands Group, Inc. | | | 1,809,500 | |
38,300 | | H&R Block, Inc. | | | 1,135,595 | |
37,700 | | Lions Gate Entertainment Corp. | | | 1,396,785 | |
33,832 | | Marriott International, Inc. | | | 2,516,762 | |
| | | | | | |
| | |
| | | | | 11,030,192 | |
| | | | | | |
Electronic Technology - 10.2% | | | | |
113,600 | | Applied Materials, Inc. | | | 2,183,392 | |
17,400 | | Arista Networks, Inc. * | | | 1,422,276 | |
27,900 | | Avago Technologies, Ltd. | | | 3,708,747 | |
87,400 | | Ciena Corp. * | | | 2,069,632 | |
7,200 | | F5 Networks, Inc. * | | | 866,520 | |
51,400 | | Skyworks Solutions, Inc. | | | 5,350,740 | |
11,300 | | Synaptics, Inc. * | | | 980,106 | |
21,400 | | Xilinx, Inc. | | | 945,024 | |
| | | | | | |
| | |
| | | | | 17,526,437 | |
| | | | | | |
Energy Minerals - 2.8% | | | | |
23,800 | | Continental Resources, Inc. * | | | 1,008,882 | |
41,800 | | Gulfport Energy Corp. * | | | 1,682,450 | |
39,010 | | Marathon Petroleum Corp. | | | 2,040,613 | |
| | | | | | |
| | |
| | | | | 4,731,945 | |
| | | | | | |
Finance - 9.7% | | | | |
8,300 | | Affiliated Managers Group, Inc. * | | | 1,814,380 | |
20,700 | | Ameriprise Financial, Inc. | | | 2,586,051 | |
37,000 | | Arthur J Gallagher & Co. | | | 1,750,100 | |
| | | | | | |
Quantity | | Name of Issuer | | Fair Value ($) | |
| | |
23,100 | | Discover Financial Services | | | 1,331,022 | |
27,800 | | First Republic Bank | | | 1,752,234 | |
6,700 | | Intercontinentalexchange Group, Inc. | | | 1,498,187 | |
15,900 | | Lazard, Ltd. | | | 894,216 | |
22,800 | | PacWest Bancorp | | | 1,066,128 | |
14,600 | | Signature Bank/New York NY * | | | 2,137,294 | |
24,500 | | T Rowe Price Group, Inc. | | | 1,904,385 | |
| | | | | | |
| | |
| | | | | 16,733,997 | |
| | | | | | |
Health Services - 5.8% | | | | |
47,300 | | Acadia Healthcare Co., Inc. * | | | 3,705,009 | |
18,800 | | Amsurg Corp. * | | | 1,315,060 | |
23,400 | | Express Scripts Holding Co. * | | | 2,081,196 | |
13,600 | | Stericycle, Inc. * | | | 1,821,176 | |
15,200 | | Team Health Holdings, Inc. * | | | 993,016 | |
| | | | | | |
| | |
| | | | | 9,915,457 | |
| | | | | | |
Health Technology - 11.9% | | | | |
12,000 | | Alexion Pharmaceuticals, Inc. * | | | 2,169,240 | |
12,200 | | Align Technology, Inc. * | | | 765,062 | |
14,535 | | Allergan, PLC * | | | 4,410,791 | |
18,200 | | Celgene Corp. * | | | 2,106,377 | |
9,300 | | Incyte Corp. * | | | 969,153 | |
9,600 | | Jazz Pharmaceuticals, PLC * | | | 1,690,272 | |
17,500 | | Mylan NV * | | | 1,187,550 | |
23,300 | | St. Jude Medical, Inc. | | | 1,702,531 | |
19,650 | | Thermo Fisher Scientific, Inc. | | | 2,549,784 | |
13,300 | | Vertex Pharmaceuticals, Inc. * | | | 1,642,284 | |
11,675 | | Zimmer Holdings, Inc. | | | 1,275,260 | |
| | | | | | |
| | |
| | | | | 20,468,304 | |
| | | | | | |
Industrial Services - 2.5% | | | | |
20,900 | | Jacobs Engineering Group, Inc. * | | | 848,958 | |
12,600 | | Oceaneering International, Inc. | | | 587,034 | |
58,900 | | Waste Connections, Inc. | | | 2,775,368 | |
| | | | | | |
| | |
| | | | | 4,211,360 | |
| | | | | | |
Non-Energy Minerals - 0.8% | | | | |
19,100 | | Eagle Materials, Inc. | | | 1,457,903 | |
| | | | | | |
Process Industries - 4.8% | | | | |
7,900 | | Airgas, Inc. | | | 835,662 | |
31,200 | | Ecolab, Inc. | | | 3,527,784 | |
29,600 | | FMC Corp. | | | 1,555,480 | |
18,800 | | International Paper Co. | | | 894,692 | |
25,300 | | Scotts Miracle-Gro Co. | | | 1,498,013 | |
| | | | | | |
| | |
| | | | | 8,311,631 | |
| | | | | | |
Producer Manufacturing - 7.5% | | | | |
24,000 | | AMETEK, Inc. | | | 1,314,720 | |
18,400 | | Delphi Automotive, PLC | | | 1,565,656 | |
21,300 | | Ingersoll-Rand, PLC | | | 1,436,046 | |
25,700 | | ITT Corp. | | | 1,075,288 | |
17,000 | | Mobileye NV * | | | 903,890 | |
23,500 | | Orbital ATK, Inc. | | | 1,723,960 | |
| | |
See accompanying notes to financial statements. | | |
28 | | SIT MUTUAL FUNDS ANNUAL REPORT |
| | | | | | |
Quantity | | Name of Issuer | | Fair Value ($) | |
| | |
7,200 | | Parker-Hannifin Corp. | | | 837,576 | |
14,200 | | Rockwell Collins, Inc. | | | 1,311,370 | |
49,100 | | Tyco International, PLC | | | 1,889,368 | |
3,300 | | WW Grainger, Inc. | | | 780,945 | |
| | | | | | |
| | |
| | | | | 12,838,819 | |
| | | | | | |
| |
Retail Trade - 8.5% | | | | |
49,400 | | Dick’s Sporting Goods, Inc. | | | 2,557,438 | |
12,900 | | DSW, Inc. | | | 430,473 | |
34,600 | | Finish Line, Inc. | | | 962,572 | |
43,900 | | Macy’s, Inc. | | | 2,961,933 | |
17,100 | | Nordstrom, Inc. | | | 1,273,950 | |
55,300 | | TJX Cos., Inc. | | | 3,659,201 | |
18,300 | | Ulta Salon Cosmetics & Fragrance, Inc. * | | | 2,826,435 | |
| | | | | | |
| | |
| | | | | 14,672,002 | |
| | | | | | |
| |
Technology Services - 9.4% | | | | |
25,100 | | ANSYS, Inc. * | | | 2,290,124 | |
48,205 | | Aspen Technology, Inc. * | | | 2,195,738 | |
13,100 | | Autodesk, Inc. * | | | 655,982 | |
36,400 | | Cognizant Technology Solutions Corp. * | | | 2,223,676 | |
24,800 | | Dealertrack Technologies, Inc. * | | | 1,557,192 | |
24,000 | | Euronet Worldwide, Inc. * | | | 1,480,800 | |
2,150 | | priceline.com, Inc. * | | | 2,475,446 | |
19,400 | | Ultimate Software Group, Inc. * | | | 3,188,196 | |
| | | | | | |
| | |
| | | | | 16,067,154 | |
| | | | | | |
| | | | | | |
Quantity | | Name of Issuer | | Fair Value ($) | |
| |
Transportation - 3.2% | | | | |
36,900 | | Alaska Air Group, Inc. | | | 2,377,467 | |
22,200 | | Ryder System, Inc. | | | 1,939,614 | |
49,000 | | Swift Transportation Co. * | | | 1,110,830 | |
| | | | | | |
| | |
| | | | | 5,427,911 | |
| | | | | | |
| |
Utilities - 0.7% | | | | |
27,800 | | WEC Energy Group, Inc. | | | 1,250,166 | |
| | | | | | |
Total Common Stocks
(cost: $104,715,232) | | | 169,288,263 | |
| | | | | | |
Total Investments in Securities - 98.5%
(cost: $104,715,232) | | | 169,288,263 | |
Other Assets and Liabilities, net - 1.5% | | | 2,565,374 | |
| | | | | | |
| |
Total Net Assets - 100.0% | | $ | 171,853,637 | |
| | | | | | |
| * | Non-income producing security. |
Numeric footnotes not disclosed are not applicable to this Schedule of Investments.
PLC — Public Limited Company
A summary of the levels for the Fund’s investments as of June 30, 2015 is as follows (see Note 2 - significant accounting policies in the notes to financial statements):
| | | | | | | | | | | | |
| | | Investment in Securities | |
| | | Level 1
Quoted
Price ($) | | | Level 2
Other significant
observable inputs ($) | | Level 3 Significant
unobservable inputs ($) | | Total ($) | |
Common Stocks ** | | | 169,288,263 | | | — | | — | | | 169,288,263 | |
| | | | |
Total: | | | 169,288,263 | | | — | | — | | | 169,288,263 | |
| ** | For equity securities categorized in a single level, refer to the Schedule of Investments for further breakdown. |
For the reporting period, there were no transfers between levels 1, 2 and 3.
| | |
See accompanying notes to financial statements. | | |
JUNE 30, 2015 | | 29 |
|
|
| |
Sit Small Cap Dividend Growth Fund Class I and Class S |
OBJECTIVE & STRATEGY
The objective of the Sit Small Cap Dividend Growth Fund is to provide current income that exceeds the Fund’s benchmark index and that grows over a period of years. Secondarily the Fund seeks long-term capital appreciation. The Fund seeks to achieve its objectives by investing, under normal market conditions, at least 80% of its net assets in small cap dividend-paying common stocks that have market capitalizations at the time of purchase of up to $3.0 billion, or up to the market capitalization of the largest company included in the Russell 2000® Index measured at the end of the previous twelve months ($11.8 billion as of June 30, 2015). The Fund may invest the balance of its assets in preferred stocks, convertible bonds, U.S. Treasury securities (including Treasury bills, notes and bonds), closed-end investment companies, and master limited partnerships.
The Sit Small Cap Dividend Growth Fund Class I posted a -0.40% return over the three months since its inception date of 3/31/15, compared to the +0.42% return for the Russell 2000® Index. The Fund’s gross dividend yield (before deduction of Fund expenses) is 2.33% compared to the 1.31% yield of the Russell 2000® Index.
Despite some volatility within the quarter, the Fund’s inaugural quarter was a relatively quiet one, as we established the portfolio based on the fundamental disciplines intended within the strategy and outlined in the prospectus for our investors. Specifically, the Fund invests in growth-oriented companies that pay dividends that we expect to grow over time. In fact, over the past twelve months, we estimate that 84% of the Fund’s current holdings have increased their dividend, compared to just 30% for the Russell 2000® Index. We believe our research staff has identified many well-managed companies with consistent and durable business models that can weather various macroeconomic environments, including the current slow growth backdrop. An investment focus on consistency and financial strength, in our view, should lead to portfolio turnover that is well below other small cap funds and, importantly, take advantage of the compounding of earnings and dividends over time. Many studies have shown that dividend payers have outperformed non-dividend payers over the long run, at least partially due to this compounding effect, and with lower volatility. The Fund was based on this premise and we believe, to this point, that there has not been enough focus in applying this strategy to small cap investing. Therefore, we see an attractive opportunity for investors in the Fund over the long term.
Due to the focus on dividends, the sector structure of the Fund is significantly different than many other small cap funds, including the Sit Small Cap Growth Fund. Notably, there is a significant underweight in health care and technology stocks, as dividends are not prevalent in these sectors. While time will tell if returns are negatively impacted by this sector structure, it should be noted that these
HYPOTHETICAL GROWTH OF $10,000
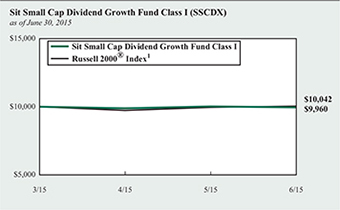
The chart above illustrates the total value of a hypothetical $10,000 investment in the Fund over the past 10 years as compared to the performance of the Russell 2000® Index. Past performance does not guarantee future results. Returns include the reinvestment of distributions. The chart does not reflect the deduction of taxes that a shareholder would pay on Fund distributions or the redemption of Fund shares.
1 Russell 2000® Index is an unmanaged index that measures the performance of the 2,000 smallest companies in the Russell 3000® Index, an index consisting of the 3,000 largest U.S. companies based on market capitalization. It is not possible to invest directly in an index. This is the Fund’s primary index.
sectors are considerably more volatile than the market overall. Finance is the most heavily weighted sector in the Fund, followed by producer manufacturing, consumer services and process industries.
As noted, we strongly believe in the merits of this strategy and we believe an attractive portfolio has been constructed based on the Fund’s objectives. We appreciate investors’ interest in the Fund.
| | | | |
Roger J. Sit Kent L. Johnson Portfolio Managers | | Michael T. Manns Robert W. Sit | | |
| | |
Information on this page is unaudited. |
30 | | SIT MUTUAL FUNDS ANNUAL REPORT |
COMPARATIVE RATES OF RETURNS
as of June 30, 2015
| | | | | | | | | | | | | | | |
| | | Sit Small Cap
Dividend
Growth Fund | | Russell
2000®
Index 1 |
| | | Class I | | Class S | |
| | | |
Since Inception (3/31/15) | | | | -0.40 | % | | | | -0.40 | % | | | | 0.42 | % |
Performance figures are historical and do not guarantee future results. Investment returns and principal value will vary, and you may have a gain or loss when you sell shares. Current performance may be lower or higher than the performance data quoted. Contact the Fund for performance data current to the most recent month-end. Returns include changes in share price as well as reinvestment of all dividends and capital gains. Returns do not reflect the deduction of the 2% redemption fee imposed if shares are redeemed or exchanged within 30 calendar days from their date of purchase. If imposed, the fee would reduce the performance quoted. Returns do not reflect the deduction of taxes that a shareholder would pay on Fund distributions or the redemption of Fund shares. Management fees and administrative expenses are included in the Fund’s performance. Returns for periods greater than one year are compounded average annual rates of return.
1 Russell 2000® Index is an unmanaged index that measures the performance of the 2,000 smallest companies in the Russell 3000® Index, an index consisting of the 3,000 largest U.S. companies based on market capitalization. It is not possible to directly invest in an index.
PORTFOLIO SUMMARY
| | |
Class I: | | |
Net Asset Value 6/30/15: | | $9.96 Per Share |
Net Asset Value 3/31/15 2: | | $10.00 Per Share |
Total Net Assets: | | $3.7 Million |
Class S: | | |
Net Asset Value 6/30/15: | | $9.96 Per Share |
Net Asset Value 3/31/15 2: | | $10.00 Per Share |
Total Net Assets: | | $2.2 Million |
| |
Weighted Average Market Cap: | | $4.1 Billion |
| 2 | Inception date of the Fund. |
TOP 10 HOLDINGS
1. Snap-On, Inc.
2. STERIS Corp.
3. Alaska Air Group, Inc.
4. Ryder System, Inc.
5. Physicians Realty Trust
6. East West Bancorp, Inc.
7. Dunkin’ Brands Group, Inc.
8. PacWest Bancorp
9. Brinker International, Inc.
10. Thor Industries, Inc.
Based on total net assets as of June 30, 2015. Subject to change.
FUND DIVERSIFICATION
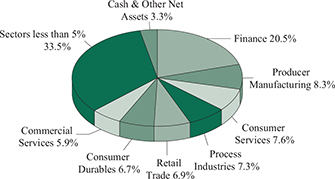
Based on total net assets as of June 30, 2015. Subject to change.
| | |
Information on this page is unaudited. | | |
JUNE 30, 2015 | | 31 |
SCHEDULE OF INVESTMENTS
June 30, 2015
Sit Small Cap Dividend Growth Fund
| | | | | | |
Quantity | | Name of Issuer | | Fair Value ($) | |
|
Common Stocks - 95.8% | |
Commercial Services - 5.9% | | | | |
2,800 | | Booz Allen Hamilton Holding Corp. | | | 70,672 | |
1,175 | | Deluxe Corp. | | | 72,850 | |
675 | | Dun & Bradstreet Corp. | | | 82,350 | |
1,150 | | Robert Half International, Inc. | | | 63,825 | |
3,350 | | RR Donnelley & Sons Co. | | | 58,390 | |
| | | | | | |
| | | | | 348,087 | |
| | | | | | |
Consumer Durables - 6.7% | | | | |
835 | | Carlisle Cos, Inc. | | | 83,600 | |
660 | | Snap-On, Inc. | | | 105,105 | |
1,575 | | Thor Industries, Inc. | | | 88,641 | |
1,000 | | Toro Co. | | | 67,780 | |
825 | | Tupperware Brands Corp. | | | 53,246 | |
| | | | | | |
| | | | | 398,372 | |
| | | | | | |
Consumer Non-Durables - 3.2% | | | | |
300 | | Carter’s, Inc. | | | 31,890 | |
1,400 | | Fresh Del Monte Produce, Inc. | | | 54,124 | |
1,400 | | Pinnacle Foods, Inc. | | | 63,756 | |
625 | | Sensient Technologies Corp. | | | 42,712 | |
| | | | | | |
| | | | | 192,482 | |
| | | | | | |
Consumer Services - 7.6% | | | | |
1,550 | | Brinker International, Inc. | | | 89,358 | |
1,325 | | Capella Education Co. | | | 71,113 | |
1,800 | | Cinemark Holdings, Inc. | | | 72,306 | |
1,650 | | Dunkin’ Brands Group, Inc. | | | 90,750 | |
1,300 | | Lions Gate Entertainment Corp. | | | 48,165 | |
1,700 | | Service Corp. International/US | | | 50,031 | |
1,300 | | Time, Inc. | | | 29,913 | |
| | | | | | |
| | | | | 451,636 | |
| | | | | | |
Electronic Technology - 3.8% | | | | |
2,100 | | MKS Instruments, Inc. | | | 79,674 | |
1,675 | | Monolithic Power Systems, Inc. | | | 84,939 | |
1,300 | | Power Integrations, Inc. | | | 58,734 | |
| | | | | | |
| | | | | 223,347 | |
| | | | | | |
Energy Minerals - 2.1% | | | | |
1,450 | | Vermilion Energy, Inc. | | | 62,626 | |
1,450 | | Western Refining, Inc. | | | 63,249 | |
| | | | | | |
| | | | | 125,875 | |
| | | | | | |
Finance - 20.5% | | | | |
1,825 | | Arthur J Gallagher & Co. | | | 86,322 | |
3,175 | | BlackRock Capital Investment Corp. | | | 29,020 | |
2,300 | | Brixmor Property Group, Inc. | | | 53,199 | |
2,600 | | Columbia Banking System, Inc. | | | 84,604 | |
2,050 | | East West Bancorp, Inc. | | | 91,881 | |
| | | | | | |
Quantity | | Name of Issuer | | Fair Value ($) | |
| | |
1,350 | | Equity LifeStyle Properties, Inc. | | | 70,983 | |
1,100 | | Evercore Partners, Inc. | | | 59,356 | |
2,700 | | Farmland Partners, Inc. | | | 32,130 | |
400 | | Home Properties, Inc. | | | 29,220 | |
1,750 | | Horace Mann Educators Corp. | | | 63,665 | |
3,150 | | Janus Capital Group, Inc. | | | 53,928 | |
925 | | Lazard, Ltd. | | | 52,022 | |
650 | | Macquarie Infrastructure Co., LLC | | | 53,710 | |
4,925 | | Old National Bancorp | | | 71,216 | |
1,925 | | PacWest Bancorp | | | 90,013 | |
6,075 | | Physicians Realty Trust | | | 93,312 | |
3,850 | | Provident Financial Services, Inc. | | | 73,112 | |
3,925 | | Umpqua Holdings Corp. | | | 70,611 | |
1,375 | | Validus Holdings, Ltd. | | | 60,486 | |
| | | | | | |
| | | | | 1,218,790 | |
| | | | | | |
Health Services - 3.1% | | | | |
1,975 | | Healthcare Services Group, Inc. | | | 65,274 | |
1,600 | | Healthsouth Corp. | | | 73,696 | |
465 | | Omnicare, Inc. | | | 43,826 | |
| | | | | | |
| | | | | 182,796 | |
| | | | | | |
Health Technology - 4.4% | | | | |
1,300 | | PerkinElmer, Inc. | | | 68,432 | |
1,625 | | STERIS Corp. | | | 104,715 | |
650 | | Teleflex, Inc. | | | 88,042 | |
| | | | | | |
| | | | | 261,189 | |
| | | | | | |
Industrial Services - 2.3% | | | | |
500 | | Helmerich & Payne, Inc. | | | 35,210 | |
625 | | Oceaneering International, Inc. | | | 29,119 | |
1,525 | | Waste Connections, Inc. | | | 71,858 | |
| | | | | | |
| | | | | 136,187 | |
| | | | | | |
Non-Energy Minerals - 2.0% | | | | |
1,750 | | Commercial Metals Co. | | | 28,139 | |
1,525 | | Potlatch Corp. | | | 53,863 | |
1,175 | | US Silica Holdings, Inc. | | | 34,498 | |
| | | | | | |
| | | | | 116,500 | |
| | | | | | |
Process Industries - 7.3% | | | | |
1,200 | | A. Schulman, Inc. | | | 52,464 | |
1,125 | | Avery Dennison Corp. | | | 68,558 | |
1,875 | | Huntsman Corp. | | | 41,381 | |
525 | | Ingredion, Inc. | | | 41,900 | |
800 | | Innophos Holdings, Inc. | | | 42,112 | |
975 | | Neenah Paper, Inc. | | | 57,486 | |
2,350 | | Orion Engineered Carbons SA | | | 43,381 | |
1,450 | | Scotts Miracle-Gro Co. | | | 85,854 | |
| | | | | | |
| | | | | 433,136 | |
| | | | | | |
| | |
See accompanying notes to financial statements. | | |
32 | | SIT MUTUAL FUNDS ANNUAL REPORT |
| | | | | | |
Quantity | | Name of Issuer | | Fair Value ($) | |
| |
Producer Manufacturing - 8.3% | | | | |
1,100 | | Applied Industrial Technologies, Inc. | | | 43,615 | |
600 | | CLARCOR, Inc. | | | 37,344 | |
650 | | Graco, Inc. | | | 46,170 | |
675 | | Greenbrier Cos, Inc. | | | 31,624 | |
775 | | Harris Corp. | | | 59,605 | |
525 | | Hubbell, Inc. | | | 56,847 | |
1,075 | | ITT Corp. | | | 44,978 | |
1,200 | | Lincoln Electric Holdings, Inc. | | | 73,068 | |
975 | | Orbital ATK, Inc. | | | 71,526 | |
250 | | Watsco, Inc. | | | 30,935 | |
| | | | | | |
| | | | | 495,712 | |
| | | | | | |
Retail Trade - 6.9% | | | | |
1,375 | | Big Lots, Inc. | | | 61,861 | |
700 | | Casey’s General Stores, Inc. | | | 67,018 | |
900 | | Dick’s Sporting Goods, Inc. | | | 46,593 | |
2,175 | | DSW, Inc. | | | 72,580 | |
1,750 | | Finish Line, Inc. | | | 48,685 | |
1,050 | | Foot Locker, Inc. | | | 70,360 | |
650 | | Men’s Wearhouse, Inc. | | | 41,646 | |
| | | | | | |
| | | | | 408,743 | |
| | | | | | |
Technology Services - 3.4% | | | | |
1,200 | | Broadridge Financial Solutions, Inc. | | | 60,012 | |
640 | | DST Systems, Inc. | | | 80,627 | |
1,425 | | Solera Holdings, Inc. | | | 63,498 | |
| | | | | | |
| | | | | 204,137 | |
| | | | | | |
| | | | | | |
Quantity | | Name of Issuer | | Fair Value ($) | |
| |
Transportation - 4.5% | | | | |
1,525 | | Alaska Air Group, Inc. | | | 98,256 | |
950 | | Golar LNG, Ltd. | | | 44,460 | |
1,150 | | Knight Transportation, Inc. | | | 30,751 | |
1,075 | | Ryder System, Inc. | | | 93,923 | |
| | | | | | |
| | | | | 267,390 | |
| | | | | | |
Utilities - 3.8% | | | | |
2,500 | | Covanta Holding Corp. | | | 52,975 | |
2,025 | | ITC Holdings Corp. | | | 65,164 | |
1,500 | | Laclede Group, Inc. | | | 78,090 | |
325 | | Targa Resources Corp. | | | 28,996 | |
| | | | | | |
| | | | | 225,225 | |
| | | | | | |
| |
Total Common Stocks
(cost: $5,726,531) | | | 5,689,604 | |
| | | | | | |
|
Investment Companies - 0.9% | |
1,450 | | Tortoise Energy Infrastructure Corp. | | | 53,520 | |
| | | | | | |
| |
(cost: $61,586) | | | | |
| |
Total Investments in Securities - 96.7%
(cost: $5,788,117) | | | 5,743,124 | |
| |
Other Assets and Liabilities, net - 3.3% | | | 195,063 | |
| | | | | | |
| |
Total Net Assets - 100.0% | | | $5,938,187 | |
| | | | | | |
Numeric footnotes not disclosed are not applicable to this Schedule of Investments.
A summary of the levels for the Fund’s investments as of June 30, 2015 is as follows (see Note 2 - significant accounting policies in the notes to financial statements):
| | | | | | | | | | | | |
| | | Investment in Securities | |
| | | Level 1
Quoted
Price ($) | | | Level 2
Other significant
observable inputs ($) | | Level 3 Significant
unobservable inputs ($) | | Total ($) | |
Common Stocks ** | | | 5,689,604 | | | — | | — | | | 5,689,604 | |
Investment Companies | | | 53,520 | | | — | | — | | | 53,520 | |
| | | | |
Total: | | | 5,743,124 | | | — | | — | | | 5,743,124 | |
| ** | For equity securities categorized in a single level, refer to the Schedule of Investments for further breakdown. |
For the reporting period, there were no transfers between levels 1, 2 and 3.
| | |
See accompanying notes to financial statements. | | |
JUNE 30, 2015 | | 33 |
|
|
| |
Sit Small Cap Growth Fund |
OBJECTIVE & STRATEGY
The objective of the Sit Small Cap Growth Fund is to maximize long-term capital appreciation. The Fund seeks to achieve its objective by investing, under normal market conditions, at least 80% of its net assets in common stocks of companies with market capitalizations at the time of purchase of up to $3.0 billion, or up to the market capitalization of the largest company included in the Russell 2000® Index measured at the end of the previous twelve months ($11.8 billion as of June 30, 2015).
The Adviser invests in a diversified group of growing small companies it believes exhibit the potential for superior growth. The Adviser believes that a company’s earnings growth is the primary determinant of its potential long-term return and evaluates a company’s potential for above average long-term earnings and revenue growth.
The Sit Small Cap Growth Fund return was +10.38% over the past twelve months. This compares to the return of +12.34% for the Russell 2000® Growth Index and the +6.49% gain for the Russell 2000® Index.
Small stocks, once again, turned in a solid year of performance, despite many cross-currents that impacted performance among sectors and industries. Healthcare equities (mostly biotechnology companies) were far and away the market leaders, while energy stocks lagged materially. Given the myriad of factors (e.g., China, Greece, rising U.S. interest rates) that may influence markets in the months ahead, we would not be surprised to see continued volatility within sectors and for the market overall. We continue to believe that a diversified portfolio of quality growth companies is appropriate in this slow growth environment. Quality, as we define it, refers to companies with visible earnings growth prospects, strong balance sheets, free cash flow generation, and proven management teams. While the healthcare and technology sectors are the most heavily weighted within the Fund, we also have significant weightings in finance, producer manufacturing and consumer durables.
The Fund’s underperformance relative to the Russell 2000® Growth Index could almost entirely be attributed to negative stock selection and an underweighted position in the health technology sector. While we did have a few laggards within the sector (i.e., Cardiovascular Systems, BioDelivery Sciences and Tekmira Pharmaceuticals Corp.), we estimate the Fund’s sector return was still a strong +25% for the year. However, this lagged the Index sector return of +39%, as many biotechnology stocks turned in exceptional performance. While we continue to have a significant position in the sector, we also sense an element of speculation and, therefore, remain disciplined in evaluating opportunities. On the positive side, relative performance was positive in the electronic technology, retail trade, energy minerals, process industries and consumer durables sectors. In terms of individual
HYPOTHETICAL GROWTH OF $10,000
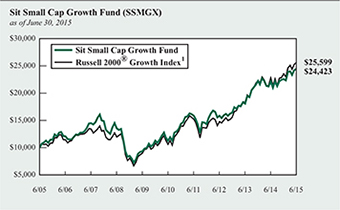
The chart above illustrates the total value of a hypothetical $10,000 investment in the Fund over the past 10 years as compared to the performance of the Russell 2000® Growth Index. Past performance does not guarantee future results. Returns include the reinvestment of distributions. The chart does not reflect the deduction of taxes that a shareholder would pay on Fund distributions or the redemption of Fund shares.
1 Russell 2000® Growth Index is an unmanaged index that measures the performance of those Russell 2000 Index companies with higher price-to-book ratios and higher forecasted growth values. It is not possible to invest directly in an index. This is the Fund’s primary index.
stocks, standout performers in these sectors included Skyworks Solutions, Amberella, Ulta Salon, Casey’s General Stores, Western Refining and Snap-on.
Our research focus remains on identifying small cap companies with secular growth prospects trading at attractive valuations. We continue to appreciate shareholders’ support of the Fund.
| | |
| Roger J. Sit | | Michael J. Stellmacher |
| Kent L. Johnson | | Robert W. Sit |
| Portfolio Managers | | |
| | |
Information on this page is unaudited. |
34 | | SIT MUTUAL FUNDS ANNUAL REPORT |
COMPARATIVE RATES OF RETURNS
as of June 30, 2015
| | | | | | | | | | | | |
| | | Sit
Small Cap
Growth
Fund | | | Russell 2000®
Growth Index 1 | | | Russell
2000®
Index 2 | |
| | | |
One Year | | | 10.38 | % | | | 12.34 | % | | | 6.49 | % |
Five Year | | | 16.69 | | | | 19.33 | | | | 17.08 | |
Ten Year | | | 9.34 | | | | 9.86 | | | | 8.40 | |
Since Inception (7/1/94) | | | 11.12 | | | | 8.29 | | | | 9.63 | |
Performance figures are historical and do not guarantee future results. Investment returns and principal value will vary, and you may have a gain or loss when you sell shares. Current performance may be lower or higher than the performance data quoted. Contact the Fund for performance data current to the most recent month-end. Returns include changes in share price as well as reinvestment of all dividends and capital gains. Returns do not reflect the deduction of the 2% redemption fee imposed if shares are redeemed or exchanged within 30 calendar days from their date of purchase. If imposed, the fee would reduce the performance quoted. Returns do not reflect the deduction of taxes that a shareholder would pay on Fund distributions or the redemption of Fund shares. Management fees and administrative expenses are included in the Fund’s performance. Returns for periods greater than one year are compounded average annual rates of return.
1 Russell 2000® Growth Index is an unmanaged index that measures the performance of those Russell 2000 Index companies with higher price-to-book ratios and higher forecasted growth values. It is not possible to invest directly in an index.
2 Russell 2000® Index is an unmanaged index that measures the performance of the 2,000 smallest companies in the Russell 3000® Index, an index consisting of the 3,000 largest U.S. companies based on market capitalization.
PORTFOLIO SUMMARY
| | |
Net Asset Value 6/30/15: | | $ 60.10 Per Share |
Net Asset Value 6/30/14: | | $61.38 Per Share |
Total Net Assets: | | $103.8 Million |
Weighted Average Market Cap: | | $7.3 Billion |
TOP 10 HOLDINGS
1. Skyworks Solutions, Inc.
2. Ultimate Software Group, Inc.
3. Acadia Healthcare Co., Inc.
4. Synaptics, Inc.
5. Snap-On, Inc.
6. First Republic Bank/CA
7. Celgene Corp.
8. Dealertrack Technologies, Inc.
9. Signature Bank/New York NY
10. Affiliated Managers Group, Inc.
Based on total net assets as of June 30, 2015. Subject to change.
FUND DIVERSIFICATION
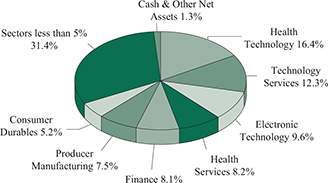
Based on total net assets as of June 30, 2015. Subject to change.
| | |
Information on this page is unaudited. |
JUNE 30, 2015 | | 35 |
SCHEDULE OF INVESTMENTS
June 30, 2015
Sit Small Cap Growth Fund
| | | | | | |
| Quantity | | Name of Issuer | | Fair Value ($) | |
| |
Common Stocks - 98.7% | | | | |
Commercial Services - 3.5% | | | | |
31,500 | | AMN Healthcare Services, Inc. * | | | 995,085 | |
30,200 | | Cardtronics, Inc. * | | | 1,118,910 | |
39,400 | | On Assignment, Inc. * | | | 1,547,632 | |
| | | | | | |
| | | | | 3,661,627 | |
| | | | | | |
Communications - 1.2% | | | | |
10,750 | | SBA Communications Corp. * | | | 1,235,928 | |
| | | | | | |
Consumer Durables - 5.2% | | | | |
28,800 | | Century Communities, Inc. * | | | 579,744 | |
9,800 | | Polaris Industries, Inc. | | | 1,451,478 | |
13,300 | | Snap-On, Inc. | | | 2,118,025 | |
20,300 | | Take-Two Interactive Software, Inc. * | | | 559,671 | |
12,800 | | Tenneco, Inc. * | | | 735,232 | |
| | | | | | |
| | | | | 5,444,150 | |
| | | | | | |
Consumer Non-Durables - 3.5% | | | | |
23,180 | | G-III Apparel Group, Ltd. * | | | 1,630,713 | |
44,600 | | Iconix Brand Group, Inc. * | | | 1,113,662 | |
7,600 | | Skechers U.S.A., Inc. * | | | 834,404 | |
| | | | | | |
| | | | | 3,578,779 | |
| | | | | | |
Consumer Services - 3.6% | | | | |
7,800 | | Buffalo Wild Wings, Inc. * | | | 1,222,182 | |
11,000 | | Capella Education Co. | | | 590,370 | |
18,900 | | Dunkin’ Brands Group, Inc. | | | 1,039,500 | |
22,400 | | Lions Gate Entertainment Corp. | | | 829,920 | |
| | | | | | |
| | | | | 3,681,972 | |
| | | | | | |
Electronic Technology - 9.6% | | | | |
8,600 | | Ambarella, Inc. * | | | 883,134 | |
10,300 | | Arista Networks, Inc. * | | | 841,922 | |
62,100 | | Ciena Corp. * | | | 1,470,528 | |
4,300 | | F5 Networks, Inc. * | | | 517,505 | |
33,900 | | Invensense, Inc. * | | | 511,890 | |
4,000 | | Qorvo, Inc. * | | | 321,080 | |
31,400 | | Skyworks Solutions, Inc. | | | 3,268,740 | |
24,600 | | Synaptics, Inc. * | | | 2,133,681 | |
| | | | | | |
| | | | | 9,948,480 | |
| | | | | | |
Energy Minerals - 2.6% | | | | |
14,800 | | Carrizo Oil & Gas, Inc. * | | | 728,752 | |
26,600 | | Gulfport Energy Corp. * | | | 1,070,650 | |
21,600 | | Western Refining, Inc. | | | 942,192 | |
| | | | | | |
| | | | | 2,741,594 | |
| | | | | | |
Finance - 8.1% | | | | |
8,100 | | Affiliated Managers Group, Inc. * | | | 1,770,660 | |
31,000 | | First Republic Bank/CA | | | 1,953,930 | |
13,600 | | PacWest Bancorp | | | 635,936 | |
43,100 | | Physicians Realty Trust | | | 662,016 | |
| | | | | | |
| Quantity | | Name of Issuer | | Fair Value ($) | |
| | |
12,200 | | Signature Bank/New York NY * | | | 1,785,958 | |
14,750 | | Stifel Financial Corp. * | | | 851,665 | |
17,800 | | Validus Holdings, Ltd. | | | 783,022 | |
| | | | | | |
| | | | | 8,443,187 | |
| | | | | | |
Health Services - 8.2% | | | | |
27,500 | | Acadia Healthcare Co., Inc. * | | | 2,154,075 | |
20,600 | | Advisory Board Co. * | | | 1,126,202 | |
12,200 | | Air Methods Corp. * | | | 504,348 | |
11,000 | | Amsurg Corp. * | | | 769,450 | |
3,800 | | Athenahealth, Inc. * | | | 435,404 | |
41,900 | | Healthcare Services Group, Inc. | | | 1,384,795 | |
9,700 | | Stericycle, Inc. * | | | 1,298,927 | |
13,000 | | Team Health Holdings, Inc. * | | | 849,290 | |
| | | | | | |
| | | | | 8,522,491 | |
| | | | | | |
Health Technology - 16.4% | | | | |
9,100 | | Alexion Pharmaceuticals, Inc. * | | | 1,645,007 | |
13,400 | | Align Technology, Inc. * | | | 840,314 | |
73,600 | | BioCryst Pharmaceuticals, Inc. * | | | 1,098,848 | |
65,800 | | BioDelivery Sciences International, Inc. * | | | 523,768 | |
5,400 | | Bio-Techne Corp. | | | 531,738 | |
58,800 | | Cardiovascular Systems, Inc. * | | | 1,555,260 | |
16,600 | | Celgene Corp. * | | | 1,921,201 | |
39,000 | | Celldex Therapeutics, Inc. * | | | 983,580 | |
3,700 | | Clovis Oncology, Inc. * | | | 325,156 | |
50,100 | | Halozyme Therapeutics, Inc. * | | | 1,131,258 | |
10,475 | | HeartWare International, Inc. * | | | 761,428 | |
23,800 | | Isis Pharmaceuticals, Inc. * | | | 1,369,690 | |
25,100 | | K2M Group Holdings, Inc. * | | | 602,902 | |
17,100 | | PerkinElmer, Inc. | | | 900,144 | |
3,100 | | Puma Biotechnology, Inc. * | | | 361,925 | |
16,600 | | Sangamo BioSciences, Inc. * | | | 184,093 | |
17,900 | | STERIS Corp. | | | 1,153,476 | |
59,300 | | Tandem Diabetes Care, Inc. * | | | 642,812 | |
43,300 | | Tekmira Pharmaceuticals Corp. * | | | 513,538 | |
| | | | | | |
| | | | | 17,046,138 | |
| | | | | | |
Industrial Services - 3.7% | | | | |
22,900 | | EMCOR Group, Inc. | | | 1,093,933 | |
51,770 | | Tutor Perini Corp. * | | | 1,117,197 | |
35,100 | | Waste Connections, Inc. | | | 1,653,912 | |
| | | | | | |
| | | | | 3,865,042 | |
| | | | | | |
Non-Energy Minerals - 0.8% | | | | |
11,200 | | Eagle Materials, Inc. | | | 854,896 | |
| | | | | | |
Process Industries - 1.5% | | | | |
11,500 | | CF Industries Holdings, Inc. | | | 739,220 | |
13,200 | | Scotts Miracle-Gro Co. | | | 781,572 | |
| | | | | | |
| | | | | 1,520,792 | |
| | | | | | |
| | |
See accompanying notes to financial statements. | | |
36 | | SIT MUTUAL FUNDS ANNUAL REPORT |
| | | | | | |
Quantity | | Name of Issuer | | Fair Value ($) | |
| |
Producer Manufacturing - 7.5% | | | | |
14,400 | | AMETEK, Inc. | | | 788,832 | |
12,500 | | CLARCOR, Inc. | | | 778,000 | |
12,500 | | Crane Co. | | | 734,125 | |
10,800 | | Greenbrier Cos, Inc. | | | 505,980 | |
9,900 | | IDEX Corp. | | | 777,942 | |
25,300 | | ITT Corp. | | | 1,058,552 | |
8,300 | | Lincoln Electric Holdings, Inc. | | | 505,387 | |
14,000 | | Orbital ATK, Inc. | | | 1,027,040 | |
8,700 | | Proto Labs, Inc. * | | | 587,076 | |
10,600 | | Wabtec Corp. | | | 998,944 | |
| | | | | | |
| | | | | 7,761,878 | |
| | | | | | |
Retail Trade - 4.8% | | | | |
8,300 | | Casey’s General Stores, Inc. | | | 794,642 | |
25,400 | | Dick’s Sporting Goods, Inc. | | | 1,314,958 | |
23,300 | | DSW, Inc. | | | 777,521 | |
28,100 | | Finish Line, Inc. | | | 781,742 | |
8,200 | | Ulta Salon Cosmetics & Fragrance, Inc. * | | | 1,266,490 | |
| | | | | | |
| | | | | 4,935,353 | |
| | | | | | |
Technology Services - 12.3% | | | | |
13,100 | | ANSYS, Inc. * | | | 1,195,244 | |
28,000 | | Aspen Technology, Inc. * | | | 1,275,400 | |
18,300 | | comScore, Inc. * | | | 974,658 | |
30,100 | | Dealertrack Technologies, Inc. * | | | 1,889,979 | |
8,000 | | DST Systems, Inc. | | | 1,007,840 | |
14,300 | | Euronet Worldwide, Inc. * | | | 882,310 | |
350 | | GoDaddy, Inc. * | | | 9,866 | |
27,000 | | Manhattan Associates, Inc. * | | | 1,610,550 | |
18,500 | | Solera Holdings, Inc. | | | 824,360 | |
| | | | | | |
Quantity | | Name of Issuer | | Fair Value ($) | |
20,000 | | Synchronoss Technologies, Inc. * | | | 914,600 | |
13,500 | | Ultimate Software Group, Inc. * | | | 2,218,590 | |
| | | | | | |
| | | | | 12,803,397 | |
| | | | | | |
Transportation - 4.7% | | | | |
21,400 | | Alaska Air Group, Inc. | | | 1,378,802 | |
34,600 | | Knight Transportation, Inc. | | | 925,204 | |
16,900 | | Ryder System, Inc. | | | 1,476,553 | |
47,500 | | Swift Transportation Co. * | | | 1,076,825 | |
| | | | | | |
| | | | | 4,857,384 | |
| | | | | | |
Utilities - 1.5% | | | | |
22,400 | | GasLog, Ltd. | | | 446,880 | |
18,900 | | ITC Holdings Corp. | | | 608,202 | |
10,100 | | Laclede Group, Inc. | | | 525,806 | |
| | | | | | |
| | | | | 1,580,888 | |
| | | | | | |
| |
Total Common Stocks (cost: $68,589,516) | | | 102,483,976 | |
| | | | | | |
| |
Total Investments in Securities - 98.7% (cost: $68,589,516) | | | 102,483,976 | |
Other Assets and Liabilities, net - 1.3% | | | 1,331,859 | |
| | | | | | |
| |
Total Net Assets - 100.0% | | $ | 103,815,835 | |
| | | | | | |
| * | Non-income producing security. |
Numeric footnotes not disclosed are not applicable to this Schedule of Investments.
A summary of the levels for the Fund’s investments as of June 30, 2015 is as follows (see Note 2 - significant accounting policies in the notes to financial statements):
| | | | | | | | | | | | |
| | | Investment in Securities | |
| | | Level 1
Quoted
Price ($) | | | Level 2
Other significant
observable inputs ($) | | Level 3 Significant
unobservable inputs ($) | | Total ($) | |
Common Stocks ** | | | 102,483,976 | | | — | | — | | | 102,483,976 | |
Total: | | | 102,483,976 | | | — | | — | | | 102,483,976 | |
| ** | For equity securities categorized in a single level, refer to the Schedule of Investments for further breakdown. |
For the reporting period, there were no transfers between levels 1, 2 and 3.
| | |
See accompanying notes to financial statements. | | |
JUNE 30, 2015 | | 37 |
|
|
| |
Sit International Growth Fund |
OBJECTIVE & STRATEGY
The objective of the Sit International Growth Fund is long-term growth. The Fund seeks to achieve its objective by investing at least 90% of its net assets in common stocks of growth companies domiciled outside the United States. In selecting investments for the Fund, the Adviser begins by selecting countries or regions in which to invest by considering several factors affecting the economy and equity market of foreign countries and regions. After the country and regional allocations are determined, the Adviser seeks industries and sectors that it believes have earnings growth prospects that are greater than the average. Within the selected industries and sectors, the Adviser invests in foreign growth-oriented companies it believes exhibit the potential for superior growth.
For the twelve months ended June 30, 2015, the Sit International Growth Fund generated a total return of -1.35% versus the MSCI EAFE Growth Index at -1.33%. Favorable stock selection, allocation, and currency effect within the information technology, materials, and consumer staples sectors more than offset the negative impact of an overweight position in energy and unfavorable stock selection in financials and utilities. On a regional basis, stock selection and a positive currency effect in the United Kingdom continued to contribute the most to relative performance while stock selection and a meaningful underweight position in Japan has weighed on results for the last twelve months.
Fears of a Greek debt default or potential exit from the euro area weighed heavily on returns across Europe in June. While Greece will remain a headline risk we believe there will be a number of positive factors elsewhere in the euro area to help drive stock performance in the second half including (1) a highly accommodative monetary policy, (2) solid export demand driven by continued currency weakness, and (3) ongoing upward earnings revisions driven by improving demand, operating leverage, and deployment of excess cash for acquisitions and share repurchases.
We remain overweight Europe, with holdings weighted towards companies that have exposure outside of Europe and are beneficiaries of the weak euro; possess secular or niche growth drivers; and/or address domestic markets where there is meaningful pent-up demand. However, as/if we get more confirmation that the euro area economic recovery will become self-sustaining – that is, a recovery driven primarily by domestic fixed investment and consumer spending – we will likely shift the emphasis of our holdings towards more cyclical, domestic demand-oriented stocks.
Although Japanese equities have performed well so far this year given optimism around the economic recovery underway and increased demand from domestic pensions, we continue to underweight Japan. Not only do we remain skeptical of the durability of the current recovery, we remain conscious of the significant structural challenges (elevated debt levels, recurring fiscal deficits, and an aging population) and view valuations as middling. We would need to see meaningful progress on structural reforms to become more constructive on Japanese equities.
HYPOTHETICAL GROWTH OF $10,000
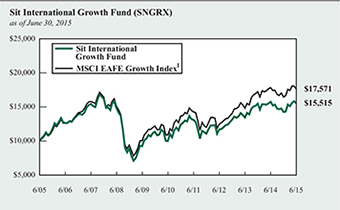
The chart above illustrates the total value of a hypothetical $10,000 investment in the Fund over the past 10 years as compared to the performance of the MSCI EAFE Growth Index. Past performance does not guarantee future results. Returns include the reinvestment of distributions. The chart does not reflect the deduction of taxes that a shareholder would pay on Fund distributions or the redemption of Fund shares.
1 MSCI EAFE Growth Index (Europe, Australasia, Far East) is an unmanaged free float-adjusted market capitalization index that measures the equity market performance of growth oriented developed market stocks within Europe, Australasia and the Far East. It is not possible to invest directly in an index. This is the Fund’s primary index.
Outside of Japan, we continue to underweight Australian equities, as slow economic growth is likely to persist as the economy becomes less resources-driven and more consumer-focused. China’s economic growth has slowed, resulting in less demand for raw materials from Australia, and thus lower economic growth for Australia. Our strategy remains largely unchanged in China with investments emphasizing companies listed in Hong Kong or the United States. China is still growing fast relative to other major economies, but growth is slowing. The focus in China is on companies with exposure to faster growing segments of the economy, as well as the beneficiaries of reform.
Roger J. Sit Tasha M. Murdoff
Portfolio Managers
| | |
Information on this page is unaudited. |
38 | | SIT MUTUAL FUNDS ANNUAL REPORT |
COMPARATIVE RATES OF RETURNS
as of June 30, 2015
| | | | | | | | | | | | | | | |
| | | Sit International Growth Fund | | MSCI EAFE Growth Index 1 | | MSCI EAFE Index 2 |
One Year | | | | -1.35 | % | | | | -1.33 | % | | | | -4.22 | % |
Five Year | | | | 9.24 | | | | | 10.09 | | | | | 9.54 | |
Ten Year | | | | 4.49 | | | | | 5.80 | | | | | 5.12 | |
Since Inception | | | | 4.18 | | | | | 4.31 | | | | | 5.48 | |
(11/1/91) | | | | | | | | | | | | | | | |
Performance figures are historical and do not guarantee future results. Investment returns and principal value will vary, and you may have a gain or loss when you sell shares. Current performance may be lower or higher than the performance data quoted. Contact the Fund for performance data current to the most recent month-end. Returns include changes in share price as well as reinvestment of all dividends and capital gains and all fee waivers. Without the fee waivers total return and yield figures would have been lower. Returns do not reflect the deduction of the 2% redemption fee imposed if shares are redeemed or exchanged within 30 calendar days from their date of purchase. If imposed, the fee would reduce the performance quoted. Returns do not reflect the deduction of taxes that a shareholder would pay on Fund distributions or the redemption of Fund shares. Management fees and administrative expenses are included in the Fund’s performance. Returns for periods greater than one year are compounded average annual rates of return.
1 MSCI EAFE Growth Index (Europe, Australasia, Far East) is an unmanaged free float-adjusted market capitalization index that measures the equity market performance of growth oriented developed market stocks within Europe, Australasia and the Far East. It is not possible to invest directly in an index.
2 MSCI EAFE Index (Europe, Australasia, Far East) is an unmanaged free float-adjusted market capitalization index that measures the equity market performance of developed markets, excluding the US & Canada.
FUND DIVERSIFICATION - BY REGION
| | | | | | | | | | |
| | | Sit Int’l | | MSCI EAFE |
| | | Growth Fund | | Growth Index |
Europe | | | | 66.8 | % | | | | 66.1 | % |
Asia | | | | 25.4 | % | | | | 33.4 | % |
North America | | | | 5.2 | % | | | | — | |
Africa/Middle East | | | | 0.9 | % | | | | 0.5 | % |
Cash & Other Net Assets | | | | 1.7 | % | | | | — | |
Based on total net assets as of June 30, 2015. Subject to change.
PORTFOLIO SUMMARY
| | |
Net Asset Value 6/30/15: | | $16.92 Per Share |
Net Asset Value 6/30/14: | | $17.44 Per Share |
Total Net Assets: | | $22.5 Million |
Weighted Average Market Cap: | | $61.9 Billion |
TOP 10 HOLDINGS
1. Nestle SA
2. Medtronic, PLC
3. Diageo, PLC, ADR
4. DS Smith, PLC
5. Novartis AG
6. Siemens AG
7. British American Tobacco, PLC
8. Seven & I Holdings Co., Ltd.
9. ING Groep NV
10. Barclays, PLC
Based on total net assets as of June 30, 2015. Subject to change.
FUND DIVERSIFICATION
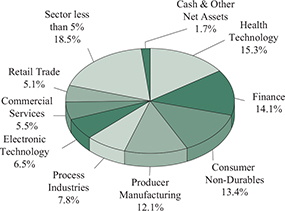
Based on total net assets as of June 30, 2015. Subject to change.
| | |
Information on this page is unaudited. | | |
JUNE 30, 2015 | | 39 |
SCHEDULE OF INVESTMENTS
June 30, 2015
Sit International Growth Fund
| | | | | | |
Quantity | | Name of Issuer | | Fair Value ($) | |
| |
Common Stocks - 97.3% | | | | |
Africa/Middle East - 0.9% | | | | |
Israel - 0.9% | | | | |
3,650 | | Teva Pharmaceutical Industries, Ltd., ADR | | | 215,715 | |
| | | | | | |
Asia - 24.4% | | | | |
Australia - 1.2% | | | | |
4,100 | | CSL, Ltd. | | | 273,333 | |
| | | | | | |
China/Hong Kong - 7.2% | | | | |
35,200 | | AIA Group, Ltd. | | | 230,161 | |
2,500 | | Alibaba Group Holding, Ltd., ADR * | | | 205,676 | |
15,732 | | Cheung Kong Property Holdings, Ltd. * | | | 130,498 | |
15,732 | | CK Hutchison Holdings, Ltd. | | | 231,292 | |
7,700 | | Hong Kong Exchanges & Clearing, Ltd. | | | 271,306 | |
6,175 | | HSBC Holdings, PLC, ADR | | | 276,702 | |
13,900 | | Tencent Holdings, Ltd. | | | 277,952 | |
| | | | | | |
| | | | | 1,623,587 | |
| | | | | | |
Japan - 14.5% | | | | |
14,000 | | Ajinomoto Co., Inc. | | | 302,754 | |
13,100 | | Asics Corp. | | | 338,415 | |
22,400 | | Astellas Pharma, Inc. | | | 319,107 | |
24,900 | | Daicel Corp. | | | 319,522 | |
18,300 | | Inpex Corp. | | | 207,722 | |
5,400 | | Makita Corp. | | | 292,458 | |
11,100 | | Seven & I Holdings Co., Ltd. | | | 476,475 | |
700 | | SMC Corp. | | | 210,643 | |
5,700 | | Sumitomo Mitsui Financial Group, Inc. | | | 253,759 | |
8,700 | | Suzuki Motor Corp. | | | 293,620 | |
9,900 | | Terumo Corp. | | | 237,404 | |
| | | | | | |
| | | | | 3,251,879 | |
| | | | | | |
Singapore - 1.5% | | | | |
2,525 | | Avago Technologies, Ltd. | | | 335,648 | |
| | | | | | |
Europe - 66.8% | | | | |
Belgium - 1.7% | | | | |
3,225 | | Anheuser-Busch InBev NV, ADR | | | 389,161 | |
| | | | | | |
Denmark - 2.9% | | | | |
15,700 | | Gn Store Nord A/S | | | 323,989 | |
6,070 | | Novo Nordisk A/S | | | 333,091 | |
| | | | | | |
| | | | | 657,080 | |
| | | | | | |
France - 9.7% | | | | |
6,160 | | BNP Paribas SA | | | 373,806 | |
3,035 | | Dassault Systemes SA | | | 220,324 | |
750 | | Eurofins Scientific SE | | | 228,342 | |
16,800 | | GDF Suez | | | 312,789 | |
2,610 | | Ingenico | | | 307,064 | |
4,000 | | Safran SA | | | 271,838 | |
3,000 | | Schlumberger, Ltd. | | | 258,570 | |
3,100 | | Schneider Electric SE | | | 214,641 | |
| | | | | | |
| | | | | 2,187,374 | |
| | | | | | |
| | | | | | |
Quantity | | Name of Issuer | | Fair Value ($) | |
| |
Germany - 6.6% | | | | |
5,475 | | GEA Group AG | | | 244,257 | |
1,735 | | Linde AG | | | 328,807 | |
5,500 | | Norma Group SE | | | 278,098 | |
425 | | Rational AG | | | 156,097 | |
4,800 | | Siemens AG | | | 485,624 | |
| | | | | | |
| | | | | 1,492,883 | |
| | | | | | |
Ireland - 3.5% | | | | |
775 | | Allergan, PLC * | | | 235,182 | |
7,550 | | Medtronic, PLC | | | 559,455 | |
| | | | | | |
| | | | | 794,637 | |
| | | | | | |
Italy - 1.0% | | | | |
7,475 | | Azimut Holding SpA | | | 218,807 | |
| | | | | | |
Netherlands - 6.0% | | | | |
2,075 | | ASML Holding NV | | | 216,070 | |
2,050 | | Galapagos NV * | | | 104,662 | |
28,260 | | ING Groep NV | | | 469,269 | |
2,750 | | LyondellBasell Industries NV | | | 284,680 | |
4,950 | | Mobileye NV * | | | 263,192 | |
| | | | | | |
| | | | | 1,337,873 | |
| | | | | | |
Spain - 2.8% | | | | |
43,800 | | Iberdrola SA | | | 295,718 | |
10,000 | | Inditex SA | | | 326,174 | |
| | | | | | |
| | | | | 621,892 | |
| | | | | | |
Switzerland - 9.7% | | | | |
3,665 | | Adecco SA | | | 297,442 | |
9,245 | | Nestle SA | | | 667,033 | |
4,975 | | Novartis AG | | | 489,343 | |
1,560 | | Roche Holding AG | | | 437,411 | |
925 | | Zurich Insurance Group AG | | | 281,597 | |
| | | | | | |
| | | | | 2,172,826 | |
| | | | | | |
United Kingdom - 22.9% | | | | |
13,200 | | Ashtead Group, PLC | | | 227,498 | |
3,025 | | ASOS, PLC * | | | 184,368 | |
18,600 | | Babcock International Group, PLC | | | 315,128 | |
109,700 | | Barclays, PLC | | | 449,619 | |
5,400 | | Bellway, PLC | | | 201,143 | |
8,980 | | British American Tobacco, PLC | | | 483,503 | |
11,275 | | Burberry Group, PLC | | | 278,157 | |
4,000 | | Delphi Automotive, PLC | | | 340,360 | |
4,775 | | Diageo, PLC, ADR | | | 554,092 | |
81,270 | | DS Smith, PLC | | | 492,833 | |
25,400 | | Essentra, PLC | | | 396,111 | |
50,015 | | Just Eat, PLC * | | | 319,587 | |
3,120 | | Reckitt Benckiser Group, PLC | | | 269,049 | |
| | |
See accompanying notes to financial statements. | | |
40 | | SIT MUTUAL FUNDS ANNUAL REPORT |
| | | | | | |
Quantity | | Name of Issuer | | Fair Value ($) | |
| | |
4,500 | | Royal Dutch Shell, PLC, ADR - Class A | | | 256,545 | |
2,700 | | Royal Dutch Shell, PLC, ADR - Class B | | | 154,845 | |
2,830 | | Shire, PLC | | | 227,388 | |
| | | | | | |
| | | | | 5,150,226 | |
| | | | | | |
North America - 5.2% | | | | |
Canada - 4.2% | | | | |
3,175 | | Agrium, Inc. | | | 336,391 | |
10,125 | | BCE, Inc. | | | 430,312 | |
6,000 | | Suncor Energy, Inc. | | | 165,119 | |
| | | | | | |
| | | | | 931,822 | |
| | | | | | |
United States - 1.0% | | | | |
3,800 | | Euronet Worldwide, Inc. * | | | 234,459 | |
| | | | | | |
| |
Total Common Stocks (cost: $19,546,796) | | | 21,889,202 | |
| | | | | | |
| |
Investment Companies - 1.0% | | | | |
7,300 | | iShares MSCI India ETF | | | 221,263 | |
| | | | | | |
(cost: $218,794) | | | | |
| |
Total Investments in Securities - 98.3% (cost: $19,765,590) | | | 22,110,465 | |
| |
Other Assets and Liabilities, net - 1.7% | | | 374,897 | |
| | | | | | |
| |
Total Net Assets - 100.0% | | | $22,485,362 | |
| | | | | | |
| * | Non-income producing security. |
Numeric footnotes not disclosed are not applicable to this Schedule of Investments.
ADR — American Depositary Receipt
PLC — Public Limited Company
| | |
See accompanying notes to financial statements. | | |
JUNE 30, 2015 | | 41 |
SCHEDULE OF INVESTMENTS
June 30, 2015
Sit International Growth Fund (Continued)
A summary of the levels for the Fund’s investments as of June 30, 2015 is as follows (see Note 2 - significant accounting policies in the notes to financial statements):
| | | | | | | | | | | | | | |
| | | Investment in Securities | |
| | | Level 1 Quoted Price ($) | | | Level 2 Other significant observable inputs ($) | | | Level 3 Significant unobservable inputs ($) | | Total ($) | |
Common Stocks | | | | | | | | | | | | | | |
Australia | | | — | | | | 273,333 | | | — | | | 273,333 | |
Belgium | | | 389,161 | | | | — | | | — | | | 389,161 | |
Canada | | | 931,822 | | | | — | | | — | | | 931,822 | |
China/Hong Kong | | | 482,378 | | | | 1,141,209 | | | — | | | 1,623,587 | |
Denmark | | | — | | | | 657,080 | | | — | | | 657,080 | |
France | | | 258,570 | | | | 1,928,804 | | | — | | | 2,187,374 | |
Germany | | | — | | | | 1,492,883 | | | — | | | 1,492,883 | |
Ireland | | | 794,637 | | | | — | | | — | | | 794,637 | |
Israel | | | 215,715 | | | | — | | | — | | | 215,715 | |
Italy | | | — | | | | 218,807 | | | — | | | 218,807 | |
Japan | | | — | | | | 3,251,879 | | | — | | | 3,251,879 | |
Netherlands | | | 763,942 | | | | 573,931 | | | — | | | 1,337,873 | |
Singapore | | | 335,648 | | | | — | | | — | | | 335,648 | |
Spain | | | — | | | | 621,892 | | | — | | | 621,892 | |
Switzerland | | | — | | | | 2,172,826 | | | — | | | 2,172,826 | |
United Kingdom | | | 1,305,842 | | | | 3,844,384 | | | — | | | 5,150,226 | |
United States | | | 234,459 | | | | — | | | — | | | 234,459 | |
Investment Companies | | | 221,263 | | | | — | | | — | | | 221,263 | |
| | | | |
Total: | | | 5,933,437 | | | | 16,177,028 | | | — | | | 22,110,465 | |
The Fund adjusts the closing price of foreign equity securities by applying a systematic process for events occurring after the close of the foreign exchanges. At each reporting period, this process is applied for all foreign securities and therefore all foreign securities are classified as level 2. There are no transfers between level 1 and level 2 between reporting periods as a result of applying this process. Level 1 securities of foreign issuers are primarily American Depositary Receipts (ADRs), Public Limited Companies (PLCs) or Global Depositary Receipts (GDRs). There were no transfers into or out of level 3 during the reporting period.
| | |
See accompanying notes to financial statements. | | |
42 | | SIT MUTUAL FUNDS ANNUAL REPORT |
[This page intentionally left blank.]
|
|
| |
Sit Developing Markets Growth Fund |
OBJECTIVE & STRATEGY
The objective of the Sit Developing Markets Growth Fund is to seek maximize long-term capital appreciation. The Fund seeks to achieve its objective by investing at least 80% of its net assets in common stocks of companies domiciled or operating in a developing market. In selecting investments for the Fund, the Adviser begins by selecting countries or regions in which to invest by considering several factors affecting the economy and equity market of foreign countries and regions. After the country and regional allocations are determined, the Adviser seeks industries and sectors that appear to have strong earnings growth prospects. Within the selected industries and sectors, the Adviser invests in foreign growth-oriented companies it believes exhibit the potential for superior growth.
The Sit Developing Markets Growth Fund depreciated -7.64% for the twelve-month period ended June 30, 2015, marginally underperforming the MSCI Emerging Markets Index’s -7.47%. Emerging markets’ performance was dampened by the continued slow-down in China’s economy, weaker global economic growth, and economic uncertainty in Greece. Though China’s growth is slowing to around +7.0% in 2015 from +7.5% in 2014, it appears to be stabilizing, as the easing policies that started in November 2014 are finally taking hold in the economy and continue to be the main driver of global economic growth. India’s economy is forecast to increase +7.5% this year, led by consumption, reform of tax policies, and progress on infrastructure projects.
The Asia Pacific ex-Japan region contributed negative relative underperformance, due to the overweight in China stocks. Exposure to Australia and Brazil also negatively impacted relative performance. Positive stock selection in Israel, South Korea, and Mexico and the underweight in Russia added to relative outperformance.
The software & services (Tencent Holdings) and media (CJ CGV and Naspers) sectors helped contribute to relative outperformance due to positive stock selection and the overweight positions. Good stock selection in the technology hardware (Nice Systems and Hon Hai Precision) industry also helped relative performance. Healthcare (Qualicorp), food & staples retailing (Pao de Acucar), capital goods (Embraer), and Energy (Sasol and China Oilfield Services) had the most negative impact on relative underperformance due to poor stock selection. The underweight position in Energy modestly offset the negative stock selection.
In China, our strategy remains unchanged from prior quarters, with a focus on consumers, banks, insurance, and utilities. China is committed to its reforms, such as capital account liberalization with the Shanghai-Hong Kong Connect and budget plans to make local borrowing more accountable. We also like India, on prospects for stronger economic growth from a better monsoon season, low oil prices, and the prospects of the Reserve Bank of India cutting interest rates.
In Latin America, stronger economic growth has yet to occur. Mexico’s GDP growth has been slower than expected due to lower oil prices, weaker domestic demand, and subpar economic recovery in
HYPOTHETICAL GROWTH OF $10,000
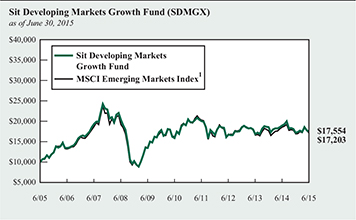
The chart above illustrates the total value of a hypothetical $10,000 investment in the Fund over the past 10 years as compared to the performance of the MSCI Emerging Markets Index. Past performance does not guarantee future results. Returns include the reinvestment of distributions. The chart does not reflect the deduction of taxes that a shareholder would pay on Fund distributions or the redemption of Fund shares.
1 MSCI Emerging Markets Index is an unmanaged free float-adjusted market capitalization index that measures equity market performance of emerging markets. It is not possible to invest directly in an index. This is the Fund’s primary index.
the United States. But Mexico’s energy reform program, which commences with an upcoming oil tender, should result in industrial development and further domestic spending. In contrast, Brazil’s economic outlook remains dismal, with 2015 GDP growth to be negative, high inflation, high interest rates, and escalating unemployment. In Mexico, we like consumer stocks. Our Brazil holdings are in defensive names, focusing on consumer staples, and global exporters.
The Fund continues a conservative investment strategy, comprising high quality companies with strong, experienced management teams, leading market positions, healthy balance sheets, good cash flow generation, and sustainable earnings and revenue growth.
Roger J. Sit
Raymond E. Sit
Portfolio Managers
| | |
Information on this page is unaudited. |
44 | | SIT MUTUAL FUNDS ANNUAL REPORT |
COMPARATIVE RATES OF RETURN
as of June 30, 2015
| | | | | | | | | | | | |
| | | Sit
Developing
Markets
Growth
Fund | | | MSCI
Emerging
Markets
Index 1 | | | MSCI
Emerging
Markets
Growth
Index 2 | |
| | | |
One Year | | | -7.64% | | | | -7.47% | | | | -4.42% | |
Five Year | | | 1.97 | | | | 1.16 | | | | 3.15 | |
Ten Year | | | 5.79 | | | | 5.57 | | | | 6.02 | |
Since Inception (7/1/94) | | | 4.06 | | | | 3.42 | | | | n/a | |
Performance figures are historical and do not guarantee future results. Investment returns and principal value will vary, and you may have a gain or loss when you sell shares. Current performance may be lower or higher than the performance data quoted. Contact the Fund for performance data current to the most recent month-end. Returns include changes in share price as well as reinvestment of all dividends and capital gains. Returns do not reflect the deduction of the 2% redemption fee imposed if shares are redeemed or exchanged within 30 calendar days from their date of purchase. If imposed, the fee would reduce the performance quoted. Returns do not reflect the deduction of taxes that a shareholder would pay on Fund distributions or the redemption of Fund shares. Management fees and administrative expenses are included in the Fund’s performance. Returns for periods greater than one year are compounded average annual rates of return.
1 MSCI Emerging Markets Index is an unmanaged free float-adjusted market capitalization index that measures equity market performance of emerging markets. It is not possible to invest directly in an index.
2 MSCI Emerging Markets Growth Index is an unmanaged free float-adjusted market capitalization index that measures equity market performance of growth oriented emerging market stocks.
FUND DIVERSIFICATION - BY REGION
| | | | | | | | |
| | | Sit
Developing
Markets
Growth
Fund | | | MSCI
Emerging
Markets
Index | |
| | |
Asia | | | 69.5% | | | | 68.0% | |
Latin America | | | 15.6% | | | | 14.8% | |
Africa/Middle East | | | 11.7% | | | | 9.5% | |
Europe | | | 1.2% | | | | 7.7% | |
Cash & Other Net Assets | | | 2.0% | | | | — | |
Based on total net assets as of June 30, 2015. Subject to change.
PORTFOLIO SUMMARY
| | |
Net Asset Value 6/30/15: | | $ 14.77 Per Share |
Net Asset Value 6/30/14: | | $17.48 Per Share |
Total Net Assets: | | $9.2 Million |
Weighted Average Market Cap: | | $49.6 Billion |
TOP 10 HOLDINGS
1. Tencent Holdings, Ltd.
2. Naspers, Ltd.
3. Samsung Electronics Co., Ltd.
4. Shinhan Financial Group Co., Ltd.
5. Ambev SA, ADR
6. China Life Insurance Co., Ltd., ADR
7. Embraer SA, ADR
8. ICICI Bank, Ltd., ADR
9. Taiwan Semiconductor Co.
10. China Construction Bank Corp.
Based on total net assets as of June 30, 2015. Subject to change.
FUND DIVERSIFICATION
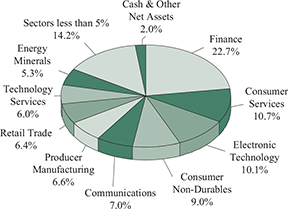
Based on total net assets as of June 30, 2015. Subject to change.
| | |
Information on this page is unaudited. | | |
JUNE 30, 2015 | | 45 |
SCHEDULE OF INVESTMENTS
June 30, 2015
Sit Developing Markets Growth Fund
| | | | | | |
Quantity | | Name of Issuer | | Fair Value ($) | |
|
Common Stocks - 95.9% | |
Africa/Middle East - 11.7% | | | | |
| |
Israel - 1.9% | | | | |
2,800 | | NICE Systems, Ltd., ADR | | | 178,052 | |
| | | | | | |
| |
South Africa - 9.8% | | | | |
6,410 | | Bidvest Group, Ltd. | | | 162,194 | |
9,850 | | MTN Group, Ltd. | | | 185,024 | |
2,530 | | Naspers, Ltd. | | | 393,426 | |
4,300 | | Sasol, Ltd., ADR | | | 159,358 | |
| | | | | | |
| | |
| | | | | 900,002 | |
| | | | | | |
|
Asia - 67.4% | |
China/Hong Kong - 32.1% | | | | |
15,000 | | AIA Group, Ltd. | | | 98,080 | |
1,700 | | Alibaba Group Holding, Ltd., ADR * | | | 139,859 | |
1,600 | | Bitauto Holdings, Ltd., ADR * | | | 81,679 | |
261,000 | | China Construction Bank Corp. | | | 238,073 | |
14,325 | | China Life Insurance Co., Ltd., ADR | | | 311,712 | |
36,000 | | China Mengniu Dairy Co., Ltd. | | | 179,500 | |
3,525 | | China Mobile, Ltd., ADR | | | 225,917 | |
70,000 | | China Oilfield Services, Ltd. | | | 111,319 | |
143,000 | | China ZhengTong Auto Services, Ltd. | | | 92,986 | |
1,325 | | CNOOC, Ltd., ADR | | | 188,044 | |
28,000 | | ENN Energy Holdings, Ltd. | | | 168,374 | |
20,000 | | Hengan International Group Co., Ltd. | | | 237,402 | |
3,900 | | JD.com, Inc., ADR * | | | 132,989 | |
52,000 | | PetroChina Co., Ltd. | | | 57,912 | |
725 | | PetroChina Co., Ltd., ADR | | | 80,337 | |
3,900 | | TAL Education Group, ADR * | | | 137,670 | |
23,500 | | Tencent Holdings, Ltd. | | | 469,919 | |
| | | | | | |
| | |
| | | | | 2,951,772 | |
| | | | | | |
| |
India - 5.5% | | | | |
28,800 | | ICICI Bank, Ltd., ADR | | | 300,096 | |
6,000 | | Tata Motors, Ltd., ADR | | | 206,836 | |
| | | | | | |
| | |
| | | | | 506,932 | |
| | | | | | |
| |
Indonesia - 2.0% | | | | |
355,000 | | Astra International Tbk PT | | | 187,907 | |
| | | | | | |
| |
Malaysia - 0.9% | | | | |
5,100 | | British American Tobacco Malaysia | | | 83,727 | |
| | | | | | |
| |
Singapore - 1.7% | | | | |
10,000 | | DBS Group Holdings, Ltd. | | | 153,437 | |
| | | | | | |
| | | | | | |
Quantity | | Name of Issuer | | Fair Value ($) | |
|
South Korea - 12.8% | |
5,885 | | Cheil Worldwide, Inc. * | | | 91,103 | |
1,630 | | CJ CGV Co., Ltd. | | | 186,797 | |
485 | | E-Mart Co., Ltd. | | | 100,398 | |
4,787 | | Industrial Bank of Korea | | | 61,927 | |
1,100 | | POSCO, ADR | | | 53,999 | |
300 | | Samsung Electronics Co., Ltd. | | | 340,376 | |
9,100 | | Shinhan Financial Group Co., Ltd. | | | 338,720 | |
| | | | | | |
| | |
| | | | | 1,173,320 | |
| | | | | | |
| |
Taiwan - 6.0% | | | | |
82,086 | | Cathay Financial Holding Co., Ltd. | | | 143,318 | |
24,830 | | Hon Hai Precision Industry Co., Ltd., GDR | | | 169,837 | |
52,482 | | Taiwan Semiconductor Co. | | | 238,721 | |
| | | | | | |
| | |
| | | | | 551,876 | |
| | | | | | |
| |
Thailand - 3.7% | | | | |
24,100 | | Advanced Info Service PCL | | | 170,780 | |
31,800 | | Bangkok Bank PCL | | | 167,729 | |
| | | | | | |
| | |
| | | | | 338,509 | |
| | | | | | |
| |
Turkey - 2.7% | | | | |
6,400 | | BIM Birlesik Magazalar A/S | | | 114,623 | |
15,700 | | Tav Havalimanlari Holding A/S | | | 133,286 | |
| | | | | | |
| | |
| | | | | 247,909 | |
| | | | | | |
|
Europe - 1.2% | |
Netherlands - 1.2% | | | | |
2,000 | | Mobileye NV * | | | 106,339 | |
| | | | | | |
|
Latin America - 15.6% | |
Brazil - 12.1% | | | | |
53,700 | | Ambev SA, ADR | | | 327,570 | |
16,321 | | Banco Bradesco SA | | | 149,607 | |
4,300 | | Cia Brasileira de Distribuicao Grupo Pao de Acucar, ADR | | | 101,781 | |
10,250 | | Embraer SA, ADR | | | 310,472 | |
25,600 | | Qualicorp SA | | | 161,302 | |
4,150 | | Telefonica Brasil SA, ADR | | | 57,810 | |
| | | | | | |
| | |
| | | | | 1,108,542 | |
| | | | | | |
| |
Chile - 1.3% | | | | |
5,950 | | Banco Santander Chile, ADR | | | 120,493 | |
| | | | | | |
| |
Mexico - 1.1% | | | | |
2,600 | | Grupo Televisa SA, ADR | | | 100,931 | |
| | | | | | |
| | |
See accompanying notes to financial statements. | | |
46 | | SIT MUTUAL FUNDS ANNUAL REPORT |
| | | | | | |
Quantity | | Name of Issuer | | Fair Value ($) | |
| |
Peru - 1.1% | | | | |
3,400 | | Southern Copper Corp. | | | 99,997 | |
| | | | | | |
Total Common Stocks
(cost: $7,057,653) | | | 8,809,745 | |
| | | | | | |
| |
Investment Companies - 2.1% | | | | |
6,400 | | iShares MSCI India ETF | | | 193,984 | |
| | | | | | |
(cost: $189,526) | | | | |
Total Investments in Securities - 98.0%
(cost: $7,247,179) | | | 9,003,729 | |
Other Assets and Liabilities, net - 2.0% | | | 188,362 | |
| | | | | | |
| |
Total Net Assets - 100.0% | | $ | 9,192,091 | |
| | | | | | |
| * | Non-income producing security. |
ADR — American Depositary Receipt
GDR — Global Depositary Receipt
Numeric footnotes not disclosed are not applicable to this Schedule of Investments.
| | |
See accompanying notes to financial statements. | | |
JUNE 30, 2015 | | 47 |
SCHEDULE OF INVESTMENTS
June 30, 2015
Sit Developing Markets Growth Fund (Continued)
A summary of the levels for the Fund’s investments as of June 30, 2015 is as follows (see Note 2 - significant accounting policies in the notes to financial statements):
| | | | | | | | | | | | | | | | | | | | |
| | | Investment in Securities |
| | | Level 1
Quoted
Price ($) | | Level 2
Other significant
observable inputs ($) | | Level 3 Significant
unobservable inputs ($) | | Total ($) |
Common Stocks | | | | | | | | | | | | | | | | | | | | |
Brazil | | | | 1,108,542 | | | | | — | | | | | — | | | | | 1,108,542 | |
Chile | | | | 120,493 | | | | | — | | | | | — | | | | | 120,493 | |
China/Hong Kong | | | | 1,298,207 | | | | | 1,653,565 | | | | | — | | | | | 2,951,772 | |
India | | | | 506,932 | | | | | — | | | | | — | | | | | 506,932 | |
Indonesia | | | | — | | | | | 187,907 | | | | | — | | | | | 187,907 | |
Israel | | | | 178,052 | | | | | — | | | | | — | | | | | 178,052 | |
Malaysia | | | | — | | | | | 83,727 | | | | | — | | | | | 83,727 | |
Mexico | | | | 100,931 | | | | | — | | | | | — | | | | | 100,931 | |
Netherlands | | | | 106,339 | | | | | — | | | | | — | | | | | 106,339 | |
Peru | | | | 99,997 | | | | | — | | | | | — | | | | | 99,997 | |
Singapore | | | | — | | | | | 153,437 | | | | | — | | | | | 153,437 | |
South Africa | | | | 159,358 | | | | | 740,644 | | | | | — | | | | | 900,002 | |
South Korea | | | | 53,999 | | | | | 1,119,321 | | | | | — | | | | | 1,173,320 | |
Taiwan | | | | 169,837 | | | | | 382,039 | | | | | — | | | | | 551,876 | |
Thailand | | | | — | | | | | 338,509 | | | | | — | | | | | 338,509 | |
Turkey | | | | — | | | | | 247,909 | | | | | — | | | | | 247,909 | |
Investment Companies | | | | 193,984 | | | | | — | | | | | — | | | | | 193,984 | |
| | | | |
Total: | | | | 4,096,671 | | | | | 4,907,058 | | | | | — | | | | | 9,003,729 | |
The Fund adjusts the closing price of foreign equity securities by applying a systematic process for events occurring after the close of the foreign exchanges. At each reporting period, this process is applied for all foreign securities and therefore all foreign securities are classified as level 2. There are no transfers between level 1 and level 2 between reporting periods as a result of applying this process. Level 1 securities of foreign issuers are primarily American Depositary Receipts (ADRs), Public Limited Companies (PLCs) or Global Depositary Receipts (GDRs). There were no transfers into or out of level 3 during the reporting period.
| | |
See accompanying notes to financial statements. | | |
48 | | SIT MUTUAL FUNDS ANNUAL REPORT |
[This page intentionally left blank.]
STATEMENTS OF ASSETS AND LIABILITIES
June 30, 2015
| | | | | | | | | | | | |
| | | |
| | | Sit
Balanced
Fund | | | Sit
Dividend
Growth
Fund | | | Sit
Global
Dividend
Growth
Fund | |
ASSETS | | | | | | | | | | | | |
Investments in securities, at identified cost | | | $18,447,685 | | | | $886,694,772 | | | | $23,010,174 | |
| | | | | | | | | | | | |
| | | |
Investments in securities, at fair value - see accompanying schedule for detail | | | $22,213,313 | | | | $1,034,369,899 | | | | $24,511,919 | |
Cash in bank on demand deposit | | | 986,263 | | | | 894,997 | | | | 234,354 | |
Accrued interest and dividends receivable. | | | 66,535 | | | | 1,421,705 | | | | 67,994 | |
Receivable for investment securities sold | | | 256,167 | | | | 21,419,189 | | | | 294,205 | |
Receivable for Fund shares sold | | | 33,083 | | | | 1,325,104 | | | | — | |
| | | | | | | | | | | | |
| | | |
Total assets | | | 23,555,361 | | | | 1,059,430,894 | | | | 25,108,472 | |
| | | | | | | | | | | | |
| | | |
LIABILITIES | | | | | | | | | | | | |
Payable for investment securities purchased | | | 479,280 | | | | 16,770,244 | | | | 206,052 | |
Payable for Fund shares redeemed | | | 87,385 | | | | 3,343,984 | | | | — | |
Cash portion of dividends payable to shareholders | | | — | | | | 1,872 | | | | — | |
Accrued investment management fees and advisory fees | | | 18,986 | | | | 877,724 | | | | 26,144 | |
Accrued 12b-1 fees (Class S) | | | — | | | | 17,870 | | | | 742 | |
| | | | | | | | | | | | |
| | | |
Total liabilities | | | 585,651 | | | | 21,011,694 | | | | 232,938 | |
| | | | | | | | | | | | |
| | | |
Net assets applicable to outstanding capital stock | | | $22,969,710 | | | | $1,038,419,200 | | | | $24,875,534 | |
| | | | | | | | | | | | |
Net assets consist of: | | | | | | | | | | | | |
Capital (par value and paid-in surplus) | | | $18,528,266 | | | | $793,283,190 | | | | $21,415,409 | |
Undistributed (distributions in excess of) net investment income | | | 68,466 | | | | 4,131,185 | | | | 128,141 | |
Accumulated net realized gain (loss) from security transactions and foreign currency transactions | | | 607,350 | | | | 93,329,698 | | | | 1,831,296 | |
Unrealized appreciation (depreciation) on investments and foreign currency transactions | | | 3,765,628 | | | | 147,675,127 | | | | 1,500,688 | |
| | | | | | | | | | | | |
| | | $22,969,710 | | | | $1,038,419,200 | | | | $24,875,534 | |
| | | | | | | | | | | | |
| | | |
Outstanding shares: | | | | | | | | | | | | |
Common Shares (Class I) * | | | 1,066,242 | | | | 54,912,420 | | | | 1,447,886 | |
| | | | | | | | | | | | |
Common Shares (Class S) * | | | — | | | | 4,784,642 | | | | 233,532 | |
| | | | | | | | | | | | |
| | | |
Net assets applicable to outstanding shares: | | | | | | | | | | | | |
Common Shares (Class I) * | | | $22,969,710 | | | | $955,460,494 | | | | $21,424,455 | |
| | | | | | | | | | | | |
Common Shares (Class S) * | | | — | | | | 82,958,706 | | | | 3,451,079 | |
| | | | | | | | | | | | |
| | | |
Net asset value per share of outstanding capital stock: | | | | | | | | | | | | |
Common Shares (Class I) * | | | $21.54 | | | | $17.40 | | | | $14.80 | |
| | | | | | | | | | | | |
Common Shares (Class S) * | | | — | | | | $17.34 | | | | $14.78 | |
| | | | | | | | | | | | |
| * | Dividend Growth, Global Dividend Growth and Small Cap Dividend Growth Funds offer multiple share classes (I and S). All other Funds offer a single share class. |
| | |
See accompanying notes to financial statements. | | |
50 | | SIT MUTUAL FUNDS ANNUAL REPORT |
| | | | | | | | | | | | | | | | | | | | | | |
| | | | | |
Sit
Large Cap
Growth
Fund | | | Sit
Mid Cap
Growth
Fund | | | Sit
Small Cap
Dividend
Growth
Fund | | | Sit
Small Cap
Growth
Fund | | | Sit
International
Growth
Fund | | | Sit
Developing
Markets
Growth
Fund | |
| | | | | | | | | | | | | | | | | | | | | | | |
| | $95,481,705 | | | | $104,715,232 | | | | $5,788,117 | | | | $68,589,516 | | | | $19,765,590 | | | | $7,247,179 | |
| | | | | | | | | | | | | | | | | | | | | | |
| | | | | |
| | $143,078,772 | | | | $169,288,263 | | | | $5,743,124 | | | | $102,483,976 | | | | $22,110,465 | | | | $9,003,729 | |
| | 1,773,721 | | | | 2,295,864 | | | | 196,123 | | | | 1,145,434 | | | | 216,823 | | | | 178,748 | |
| | 105,206 | | | | 68,941 | | | | 7,607 | | | | 16,569 | | | | 110,019 | | | | 44,374 | |
| | 1,004,076 | | | | 1,927,919 | | | | 28,743 | | | | 862,385 | | | | 185,098 | | | | — | |
| | 5,900 | | | | 6,557 | | | | — | | | | 5,460 | | | | 3,450 | | | | 4,402 | |
| | | | | | | | | | | | | | | | | | | | | | |
| | | | | |
| | 145,967,675 | | | | 173,587,544 | | | | 5,975,597 | | | | 104,513,824 | | | | 22,625,855 | | | | 9,231,253 | |
| | | | | | | | | | | | | | | | | | | | | | |
| | | | | |
| | | | | | | | | | | | | | | | | | | | | | | |
| | 869,090 | | | | 1,500,037 | | | | 30,856 | | | | 560,802 | | | | 112,160 | | | | 23,983 | |
| | 169,576 | | | | 54,277 | | | | — | | | | 7,793 | | | | 106 | | | | — | |
| | — | | | | — | | | | — | | | | — | | | | — | | | | — | |
| | 122,147 | | | | 179,593 | | | | 6,091 | | | | 129,394 | | | | 28,227 | | | | 15,179 | |
| | — | | | | — | | | | 463 | | | | — | | | | — | | | | — | |
| | | | | | | | | | | | | | | | | | | | | | |
| | | | | |
| | 1,160,813 | | | | 1,733,907 | | | | 37,410 | | | | 697,989 | | | | 140,493 | | | | 39,162 | |
| | | | | | | | | | | | | | | | | | | | | | |
| | | | | |
| | $144,806,862 | | | | $171,853,637 | | | | $5,938,187 | | | | $103,815,835 | | | | $22,485,362 | | | | $9,192,091 | |
| | | | | | | | | | | | | | | | | | | | | | |
| | | | | | | | | | | | | | | | | | | | | | | |
| | $70,899,476 | | | | $86,631,497 | | | | $5,963,015 | | | | $61,014,265 | | | | $18,963,702 | | | | $7,293,935 | |
| | 376,240 | | | | — | | | | 12,183 | | | | — | | | | 120,934 | | | | 11,294 | |
|
25,934,079 |
| | | 20,649,109 | | | | 7,982 | | | | 8,907,110 | | | | 1,059,932 | | | | 130,343 | |
|
47,597,067 |
| | | 64,573,031 | | | | (44,993 | ) | | | 33,894,460 | | | | 2,340,794 | | | | 1,756,519 | |
| | | | | | | | | | | | | | | | | | | | | | |
| | $144,806,862 | | | | $171,853,637 | | | | $5,938,187 | | | | $103,815,835 | | | | $22,485,362 | | | | $9,192,091 | |
| | | | | | | | | | | | | | | | | | | | | | |
| | | | | | | | | | | | | | | | | | | | | | | |
| | 3,067,477 | | | | 8,499,983 | | | | 372,170 | | | | 1,727,307 | | | | 1,328,658 | | | | 622,379 | |
| | | | | | | | | | | | | | | | | | | | | | |
| | — | | | | — | | | | 223,936 | | | | — | | | | — | | | | — | |
| | | | | | | | | | | | | | | | | | | | | | |
| | | | | |
| | | | | | | | | | | | | | | | | | | | | | | |
| | $144,806,862 | | | | $171,853,637 | | | | $3,708,201 | | | | $103,815,835 | | | | $22,485,362 | | | | $9,192,091 | |
| | | | | | | | | | | | | | | | | | | | | | |
| | — | | | | — | | | | 2,229,986 | | | | — | | | | — | | | | — | |
| | | | | | | | | | | | | | | | | | | | | | |
| | | | | |
| | | | | | | | | | | | | | | | | | | | | | | |
| | $47.21 | | | | $20.22 | | | | $9.96 | | | | $60.10 | | | | $16.92 | | | | $14.77 | |
| | | | | | | | | | | | | | | | | | | | | | |
| | — | | | | — | | | | $9.96 | | | | — | | | | — | | | | — | |
| | | | | | | | | | | | | | | | | | | | | | |
STATEMENTS OF OPERATIONS
Year or Period Ended June 30, 2015
| | | | | | | | | | | | |
| | | Sit
Balanced
Fund | | | Sit
Dividend
Growth
Fund | | | Sit
Global
Dividend
Growth
Fund | |
Investment income: | | | | | | | | | | | | |
Income: | | | | | | | | | | | | |
Dividends* | | | $192,168 | | | | $26,209,216 | | | | $680,665 | |
Interest | | | 200,380 | | | | — | | | | — | |
| | | | | | | | | | | | |
Total income. | | | 392,548 | | | | 26,209,216 | | | | 680,665 | |
| | | | | | | | | | | | |
| | | |
Expenses (note 4): | | | | | | | | | | | | |
Investment management and advisory service fee | | | 180,507 | | | | 10,971,980 | | | | 330,164 | |
12b-1 fees (Class S) | | | — | | | | 233,194 | | | | 11,298 | |
| | | | | | | | | | | | |
Total expenses | | | 180,507 | | | | 11,205,174 | | | | 341,462 | |
| | | | | | | | | | | | |
| | | |
Net investment income (loss) | | | 212,041 | | | | 15,004,042 | | | | 339,203 | |
| | | | | | | | | | | | |
| | | |
Realized and unrealized gain (loss): | | | | | | | | | | | | |
Net realized gain (loss) on investments | | | 973,568 | | | | 129,746,541 | | | | 2,508,227 | |
Net realized gain (loss) on foreign currency transactions | | | — | | | | — | | | | (1,605 | ) |
| | | |
Net change in unrealized appreciation (depreciation) on investments and foreign currency transactions | | | (163,103 | ) | | | (74,833,461 | ) | | | (2,265,234 | ) |
| | | | | | | | | | | | |
| | | |
Net gain (loss) | | | 810,465 | | | | 54,913,080 | | | | 241,388 | |
| | | | | | | | | | | | |
| | | |
Net increase (decrease) in net assets resulting from operations | | | $1,022,506 | | | | $69,917,122 | | | | $580,591 | |
| | | | | | | | | | | | |
| | | | | | | | | | | | |
| | | |
* Foreign taxes withheld on dividends received | | | $64 | | | | $130,416 | | | | $30,675 | |
| 1 | The Fund commenced investment operations on March 31, 2015. |
| | |
See accompanying notes to financial statements. | | |
52 | | SIT MUTUAL FUNDS ANNUAL REPORT |
| | | | | | | | | | | | | | | | | | | | | | |
Sit
Large Cap
Growth
Fund | | | Sit
Mid Cap
Growth
Fund | | | Sit
Small Cap
Dividend
Growth
Fund 1 | | | Sit
Small Cap
Growth
Fund | | | Sit
International
Growth
Fund | | | Sit
Developing
Markets
Growth
Fund | |
| | | | | | | | | | | | | | | | | | | | | | |
| | | | | | | | | | | | | | | | | | | | | | |
| | $2,409,947 | | | | $1,677,005 | | | | $30,095 | | | | $684,756 | | | | $459,891 | | | | $216,318 | |
| | — | | | | — | | | | — | | | | — | | | | — | | | | — | |
| | | | | | | | | | | | | | | | | | | | | | |
| | 2,409,947 | | | | 1,677,005 | | | | 30,095 | | | | 684,756 | | | | 459,891 | | | | 216,318 | |
| | | | | | | | | | | | | | | | | | | | | | |
| | | | | | | | | | | | | | | | | | | | | | |
| | | | | |
| | 1,715,263 | | | | 2,200,032 | | | | 16,863 | | | | 1,490,702 | | | | 335,802 | | | | 200,197 | |
| | — | | | | — | | | | 1,364 | | | | — | | | | — | | | | — | |
| | | | | | | | | | | | | | | | | | | | | | |
| | 1,715,263 | | | | 2,200,032 | | | | 18,227 | | | | 1,490,702 | | | | 335,802 | | | | 200,197 | |
| | | | | | | | | | | | | | | | | | | | | | |
| | | | | |
| | 694,684 | | | | (523,027 | ) | | | 11,868 | | | | (805,946 | ) | | | 124,089 | | | | 16,121 | |
| | | | | | | | | | | | | | | | | | | | | | |
| | | | | | | | | | | | | | | | | | | | | | |
| | | | | |
| | 35,475,388 | | | | 24,906,408 | | | | 6,933 | | | | 11,269,192 | | | | 2,278,256 | | | | 271,033 | |
| | — | | | | — | | | | — | | | | — | | | | (3,155 | ) | | | (4,827 | ) |
| | | | | |
|
(17,898,539) |
| | | (8,333,973 | ) | | | (44,993 | ) | | | (555,722 | ) | | | (2,780,503 | ) | | | (1,106,491 | ) |
| | | | | | | | | | | | | | | | | | | | | | |
| | | | | |
| | 17,576,849 | | | | 16,572,435 | | | | (38,060 | ) | | | 10,713,470 | | | | (505,402 | ) | | | (840,285 | ) |
| | | | | | | | | | | | | | | | | | | | | | |
| | | | | |
| | $18,271,533 | | | | $16,049,408 | | | | ($26,192 | ) | | | $9,907,524 | | | | ($381,313 | ) | | | ($824,164 | ) |
| | | | | | | | | | | | | | | | | | | | | | |
| | | | | | | | | | | | | | | | | | | | | | |
| | | | | |
| | — | | | | $5,484 | | | | $181 | | | | $1,772 | | | | $40,170 | | | | $27,834 | |
STATEMENTS OF CHANGES IN NET ASSETS
| | | | | | | | | | | | | | | | |
| | | Sit Balanced Fund | | | Sit Dividend Growth Fund | |
| | | Year Ended
June 30,
2015 | | | Year Ended
June 30,
2014 | | | Year Ended
June 30,
2015 | | | Year Ended
June 30,
2014 | |
Operations: | | | | | | | | | | | | | | | | |
Net investment income (loss) | | | $212,041 | | | | $200,254 | | | | $15,004,042 | | | | $16,078,913 | |
Net realized gain (loss) on investments and foreign currency transactions | | | 973,568 | | | | 788,842 | | | | 129,746,541 | | | | 120,808,574 | |
Net change in unrealized appreciation (depreciation) on investments and foreign currency transactions | | | (163,103 | ) | | | 1,132,195 | | | | (74,833,461 | ) | | | 64,724,930 | |
| | | | | | | | | | | | | | | | |
Net increase in net assets resulting from operations | | | 1,022,506 | | | | 2,121,291 | | | | 69,917,122 | | | | 201,612,417 | |
| | | | | | | | | | | | | | | | |
| | | | |
Distributions from: | | | | | | | | | | | | | | | | |
Net investment income | | | | | | | | | | | | | | | | |
Common shares (Class I) | | | (199,000 | ) | | | (190,000 | ) | | | (13,464,793 | ) | | | (14,116,740 | ) |
Common shares (Class S) | | | — | | | | — | | | | (1,026,207 | ) | | | (1,647,273 | ) |
Net realized gains on investments | | | | | | | | | | | | | | | | |
Common shares (Class I) | | | (480,078 | ) | | | — | | | | (119,694,644 | ) | | | (34,547,857 | ) |
Common shares (Class S) | | | — | | | | — | | | | (10,548,178 | ) | | | (5,368,982 | ) |
| | | | | | | | | | | | | | | | |
Total distributions | | | (679,078 | ) | | | (190,000 | ) | | | (144,733,822 | ) | | | (55,680,852 | ) |
| | | | | | | | | | | | | | | | |
| | | | |
Capital share transactions: | | | | | | | | | | | | | | | | |
Proceeds from shares sold | | | | | | | | | | | | | | | | |
Common shares (Class I) | | | 8,320,812 | | | | 1,552,785 | | | | 208,800,590 | | | | 215,015,927 | |
Common shares (Class S) | | | — | | | | — | | | | 9,777,088 | | | | 24,916,784 | |
Reinvested distributions | | | | | | | | | | | | | | | | |
Common shares (Class I) | | | 675,273 | | | | 188,535 | | | | 46,959,946 | | | | 17,771,240 | |
Common shares (Class S) | | | — | | | | — | | | | 11,489,762 | | | | 6,951,326 | |
Payments for shares redeemed | | | | | | | | | | | | | | | | |
Common shares (Class I) | | | (2,014,901 | ) | | | (1,519,254 | ) | | | (248,581,657 | ) | | | (266,221,111 | ) |
Common shares (Class S) | | | — | | | | — | | | | (35,749,398 | ) | | | (78,648,123 | ) |
| | | | | | | | | | | | | | | | |
Increase (decrease) in net assets from capital transactions. | | | 6,981,184 | | | | 222,066 | | | | (7,303,669 | ) | | | (80,213,957 | ) |
| | | | | | | | | | | | | | | | |
Total increase (decrease) in net assets | | | 7,324,612 | | | | 2,153,357 | | | | (82,120,369 | ) | | | 65,717,608 | |
| | | | |
Net assets: | | | | | | | | | | | | | | | | |
Beginning of period | | | 15,645,098 | | | | 13,491,741 | | | | 1,120,539,569 | | | | 1,054,821,961 | |
| | | | | | | | | | | | | | | | |
End of period * | | | $22,969,710 | | | | $15,645,098 | | | | $1,038,419,200 | | | | $1,120,539,569 | |
| | | | | | | | | | | | | | | | |
| | | | |
Capital transactions in shares: | | | | | | | | | | | | | | | | |
Sold | | | | | | | | | | | | | | | | |
Common shares (Class I) | | | 383,633 | | | | 79,403 | | | | 11,517,705 | | | | 12,312,665 | |
Common shares (Class S) | | | — | | | | — | | | | 541,368 | | | | 1,452,954 | |
Reinvested distributions | | | | | | | | | | | | | | | | |
Common shares (Class I) | | | 31,872 | | | | 9,775 | | | | 2,703,144 | | | | 1,033,969 | |
Common shares (Class S) | | | — | | | | — | | | | 663,435 | | | | 405,516 | |
Redeemed | | | | | | | | | | | | | | | | |
Common shares (Class I) | | | (93,881 | ) | | | (77,091 | ) | | | (13,738,327 | ) | | | (15,216,805 | ) |
Common shares (Class S) | | | — | | | | — | | | | (1,973,196 | ) | | | (4,559,813 | ) |
| | | | | | | | | | | | | | | | |
Net increase (decrease) | | | 321,624 | | | | 12,087 | | | | (285,871 | ) | | | (4,571,514 | ) |
| | | | | | | | | | | | | | | | |
* includes undistributed (distributions in excess) net investment income (loss) | | | $68,466 | | | | $55,722 | | | | $4,131,185 | | | | $3,646,772 | |
| | |
See accompanying notes to financial statements. | | |
54 | | SIT MUTUAL FUNDS ANNUAL REPORT |
| | | | | | | | | | | | | | | | | | | | | | |
| Sit Global Dividend Growth Fund | | | Sit Large Cap Growth Fund | | | Sit Mid Cap Growth Fund | |
Year Ended
June 30,
2015 | | | Year Ended
June 30,
2014 | | | Year Ended
June 30,
2015 | | | Year Ended
June 30,
2014 | | | Year Ended
June 30,
2015 | | | Year Ended
June 30,
2014 | |
| | | | | | | | | | | | | | | | | | | | | | |
| | $339,203 | | | | $335,668 | | | | $694,684 | | | | $1,121,113 | | | | ($523,027 | ) | | | ($636,119 | ) |
|
2,506,622 |
| | | 1,363,966 | | | | 35,475,388 | | | | 31,100,027 | | | | 24,906,408 | | | | 19,973,360 | |
|
(2,265,234 |
) | | | 1,616,209 | | | | (17,898,539 | ) | | | 8,823,262 | | | | (8,333,973 | ) | | | 18,652,542 | |
| | | | | | | | | | | | | | | | | | | | | | |
| | 580,591 | | | | 3,315,843 | | | | 18,271,533 | | | | 41,044,402 | | | | 16,049,408 | | | | 37,989,783 | |
| | | | | | | | | | | | | | | | | | | | | | |
| | | | | |
| | | | | | | | | | | | | | | | | | | | | | |
| | | | | | | | | | | | | | | | | | | | | | |
| | (284,505 | ) | | | (263,794 | ) | | | (774,000 | ) | | | (1,460,025 | ) | | | — | | | | — | |
| | (45,495 | ) | | | (43,211 | ) | | | — | | | | — | | | | — | | | | — | |
| | | | | | | | | | | | | | | | | | | | | | |
| | (1,500,249 | ) | | | (736,258 | ) | | | (33,093,221 | ) | | | (19,160,085 | ) | | | (22,297,244 | ) | | | (8,937,914 | ) |
| | (245,468 | ) | | | (153,131 | ) | | | — | | | | — | | | | — | | | | — | |
| | | | | | | | | | | | | | | | | | | | | | |
| | (2,075,717 | ) | | | (1,196,394 | ) | | | (33,867,221 | ) | | | (20,620,110 | ) | | | (22,297,244 | ) | | | (8,937,914 | ) |
| | | | | | | | | | | | | | | | | | | | | | |
| | | | | |
| | | | | | | | | | | | | | | | | | | | | | |
| | | | | | | | | | | | | | | | | | | | | | |
| | 5,533,002 | | | | 5,465,390 | | | | 4,283,270 | | | | 5,430,647 | | | | 1,271,258 | | | | 2,174,926 | |
| | 3,019,026 | | | | 1,326,440 | | | | — | | | | — | | | | — | | | | — | |
| | | | | | | | | | | | | | | | | | | | | | |
| | 1,784,612 | | | | 999,990 | | | | 33,300,492 | | | | 20,300,124 | | | | 21,501,154 | | | | 8,666,217 | |
| | 290,963 | | | | 196,343 | | | | — | | | | — | | | | — | | | | — | |
| | | | | | | | | | | | | | | | | | | | | | |
| | (6,024,442 | ) | | | (1,000,114 | ) | | | (65,755,175 | ) | | | (53,865,750 | ) | | | (24,946,507 | ) | | | (11,746,192 | ) |
| | (3,022,827 | ) | | | (1,770,346 | ) | | | — | | | | — | | | | — | | | | — | |
| | | | | | | | | | | | | | | | | | | | | | |
| | 1,580,334 | | | | 5,217,703 | | | | (28,171,413 | ) | | | (28,134,979 | ) | | | (2,174,095 | ) | | | (905,049 | ) |
| | | | | | | | | | | | | | | | | | | | | | |
| | 85,208 | | | | 7,337,152 | | | | (43,767,101 | ) | | | (7,710,687 | ) | | | (8,421,931 | ) | | | 28,146,820 | |
| | | | | |
| | | | | | | | | | | | | | | | | | | | | | |
| | 24,790,326 | | | | 17,453,174 | | | | 188,573,963 | | | | 196,284,650 | | | | 180,275,568 | | | | 152,128,748 | |
| | | | | | | | | | | | | | | | | | | | | | |
| | $24,875,534 | | | | $24,790,326 | | | | $144,806,862 | | | | $188,573,963 | | | | $171,853,637 | | | | $180,275,568 | |
| | | | | | | | | | | | | | | | | | | | | | |
| | | | | |
| | | | | | | | | | | | | | | | | | | | | | |
| | | | | | | | | | | | | | | | | | | | | | |
| | 369,646 | | | | 366,646 | | | | 89,968 | | | | 107,350 | | | | 63,009 | | | | 108,717 | |
| | 202,447 | | | | 87,386 | | | | — | | | | — | | | | — | | | | — | |
| | | | | | | | | | | | | | | | | | | | | | |
| | 121,436 | | | | 67,695 | | | | 727,721 | | | | 412,688 | | | | 1,124,537 | | | | 433,962 | |
| | 19,811 | | | | 13,301 | | | | — | | | | — | | | | — | | | | — | |
| | | | | | | | | | | | | | | | | | | | | | |
| | (407,026 | ) | | | (65,214 | ) | | | (1,341,390 | ) | | | (1,058,721 | ) | | | (1,237,944 | ) | | | (592,470 | ) |
| | (200,120 | ) | | | (117,825 | ) | | | — | | | | — | | | | — | | | | — | |
| | | | | | | | | | | | | | | | | | | | | | |
| | 106,194 | | | | 351,989 | | | | (523,701 | ) | | | (538,683 | ) | | | (50,398 | ) | | | (49,791 | ) |
| | | | | | | | | | | | | | | | | | | | | | |
| | | | | | | | | | | | | | | | | | | | | | |
| | $128,141 | | | | $120,563 | | | | $376,240 | | | | $455,556 | | | | — | | | | — | |
STATEMENTS OF CHANGES IN NET ASSETS (Continued)
| | | | | | | | | | | | |
| | | Sit Small Cap
Dividend Growth Fund | | | Sit Small Cap Growth Fund | |
| | | Three Months Ended
June 30,
2015 1 | | | Year Ended
June 30,
2015 | | | Year Ended
June 30,
2014 | |
Operations: | | | | | | | | | | | | |
Net investment income (loss) | | | $11,868 | | | | ($805,946 | ) | | | ($909,126 | ) |
Net realized gain (loss) on investments and foreign currency transactions | | | 6,933 | | | | 11,269,192 | | | | 10,433,876 | |
Net change in unrealized appreciation (depreciation) of investments and foreign currency transactions | | | (44,993 | ) | | | (555,722 | ) | | | 9,402,621 | |
| | | | | | | | | | | | |
Net increase (decrease) in net assets resulting from operations | | | (26,192 | ) | | | 9,907,524 | | | | 18,927,371 | |
| | | | | | | | | | | | |
| | | |
Distributions from: | | | | | | | | | | | | |
Net investment income | | | | | | | | | | | | |
Common shares (Class I) | | | — | | | | — | | | | — | |
Net realized gains on investments | | | | | | | | | | | | |
Common shares (Class I) | | | — | | | | (11,167,852 | ) | | | — | |
| | | | | | | | | | | | |
Total distributions | | | — | | | | (11,167,852 | ) | | | — | |
| | | | | | | | | | | | |
| | | |
Capital share transactions: | | | | | | | | | | | | |
Proceeds from shares sold | | | | | | | | | | | | |
Common shares (Class I) | | | 3,724,971 | | | | 3,040,540 | | | | 4,035,232 | |
Common shares (Class S) | | | 2,364,633 | | | | — | | | | — | |
Reinvested distributions | | | | | | | | | | | | |
Common shares (Class I) | | | — | | | | 10,988,324 | | | | — | |
Payments for shares redeemed | | | | | | | | | | | | |
Common shares (Class I) | | | — | | | | (8,462,484 | ) | | | (8,245,564 | ) |
Common shares (Class S) | | | (125,225 | ) | | | — | | | | — | |
| | | | | | | | | | | | |
Increase (decrease) in net assets from capital transactions | | | 5,964,379 | | | | 5,566,380 | | | | (4,210,332 | ) |
| | | | | | | | | | | | |
Total increase (decrease) in net assets | | | 5,938,187 | | | | 4,306,052 | | | | 14,717,039 | |
| | | |
Net assets: | | | | | | | | | | | | |
Beginning of period | | | — | | | | 99,509,783 | | | | 84,792,744 | |
| | | | | | | | | | | | |
End of period* | | | $5,938,187 | | | | $103,815,835 | | | | $99,509,783 | |
| | | | | | | | | | | | |
| | | |
Capital transactions in shares: | | | | | | | | | | | | |
Sold | | | | | | | | | | | | |
Common shares (Class I) | | | 372,170 | | | | 52,307 | | | | 70,531 | |
Common shares (Class S) | | | 236,449 | | | | — | | | | — | |
Reinvested distributions | | | | | | | | | | | | |
Common shares (Class I) | | | — | | | | 198,095 | | | | — | |
Redeemed | | | | | | | | | | | | |
Common shares (Class I) | | | — | | | | (144,334 | ) | | | (142,415 | ) |
Common shares (Class S) | | | (12,513 | ) | | | — | | | | — | |
| | | | | | | | | | | | |
Net increase (decrease) | | | 596,106 | | | | 106,068 | | | | (71,884 | ) |
| | | | | | | | | | | | |
*includes undistributed (distributions in excess) net investment income (loss) | | | $12,183 | | | | — | | | | — | |
| 1 | The Fund commenced investment operations on March 31, 2015. |
| | |
See accompanying notes to financial statements. | | |
56 | | SIT MUTUAL FUNDS ANNUAL REPORT |
| | | | | | | | | | | | | | |
Sit International Growth Fund | | | Sit Developing Markets Growth Fund | |
Year Ended
June 30,
2015 | | | Year Ended
June 30,
2014 | | | Year Ended
June 30,
2015 | | | Year Ended
June 30,
2014 | |
| | | | | | | | | | | | | | |
| | $124,089 | | | | $391,390 | | | | $16,121 | | | | ($7,675 | ) |
| | 2,275,101 | | | | 1,834,049 | | | | 266,206 | | | | 654,087 | |
|
(2,780,503) |
| | | 1,342,866 | | | | (1,106,491 | ) | | | 641,337 | |
| | | | | | | | | | | | | | |
| | (381,313) | | | | 3,568,305 | | | | (824,164 | ) | | | 1,287,749 | |
| | | | | | | | | | | | | | |
| | | |
| | | | | | | | | | | | | | |
| | | | | | | | | | | | | | |
| | (354,576) | | | | (231,001 | ) | | | — | | | | (16,575 | ) |
| | | | | | | | | | | | | | |
| | — | | | | — | | | | (795,509 | ) | | | (596,525 | ) |
| | | | | | | | | | | | | | |
| | (354,576) | | | | (231,001 | ) | | | (795,509 | ) | | | (613,100 | ) |
| | | | | | | | | | | | | | |
| | | |
| | | | | | | | | | | | | | |
| | | | | | | | | | | | | | |
| | 585,445 | | | | 1,784,889 | | | | 248,461 | | | | 876,017 | |
| | — | | | | — | | | | — | | | | — | |
| | | | | | | | | | | | | | |
| | 352,967 | | | | 229,662 | | | | 781,882 | | | | 602,798 | |
| | | | | | | | | | | | | | |
| | (1,844,577) | | | | (2,114,470 | ) | | | (1,026,294 | ) | | | (1,961,000 | ) |
| | — | | | | — | | | | — | | | | — | |
| | | | | | | | | | | | | | |
| | (906,165) | | | | (99,919 | ) | | | 4,049 | | | | (482,185 | ) |
| | | | | | | | | | | | | | |
| | (1,642,054) | | | | 3,237,385 | | | | (1,615,624 | ) | | | 192,464 | |
| | | |
| | | | | | | | | | | | | | |
| | 24,127,416 | | | | 20,890,031 | | | | 10,807,715 | | | | 10,615,251 | |
| | | | | | | | | | | | | | |
| | $22,485,362 | | | | $24,127,416 | | | | $9,192,091 | | | | $10,807,715 | |
| | | | | | | | | | | | | | |
| | | |
| | | | | | | | | | | | | | |
| | | | | | | | | | | | | | |
| | 35,057 | | | | 108,905 | | | | 14,969 | | | | 50,956 | |
| | — | | | | — | | | | — | | | | — | |
| | | | | | | | | | | | | | |
| | 22,396 | | | | 13,868 | | | | 54,601 | | | | 35,859 | |
| | | | | | | | | | | | | | |
| | (112,589) | | | | (127,374 | ) | | | (65,574 | ) | | | (115,884 | ) |
| | — | | | | — | | | | — | | | | — | |
| | | | | | | | | | | | | | |
| | (55,136) | | | | (4,601 | ) | | | 3,996 | | | | (29,069 | ) |
| | | | | | | | | | | | | | |
| | | | | | | | | | | | | | |
| | $120,934 | | | | $354,576 | | | | $11,294 | | | | — | |
FINANCIAL HIGHLIGHTS
Per share income and capital changes for a share outstanding throughout the period. See accompanying notes to financial statements.
Sit Balanced Fund
| | | | | | | | | | | | | | | | | | | | |
| |
| | | Years Ended June 30, | |
| | | 2015 | | | 2014 | | | 2013 | | | 2012 | | | 2011 | |
| |
Net Asset Value: | | | | | | | | | | | | | | | | | | | | |
Beginning of period. | | | $21.01 | | | | $18.42 | | | | $16.97 | | | | $16.47 | | | | $14.18 | |
| | | | |
Operations: | | | | | | | | | | | | | | | | | | | | |
Net investment income 1 | | | 0.25 | | | | 0.27 | | | | 0.27 | | | | 0.29 | | | | 0.27 | |
Net realized and unrealized gains | | | 1.16 | | | | 2.58 | | | | 1.46 | | | | 0.46 | | | | 2.32 | |
| | | | |
Total from operations | | | 1.41 | | | | 2.85 | | | | 1.73 | | | | 0.75 | | | | 2.59 | |
| | | | |
Distributions to Shareholders: | | | | | | | | | | | | | | | | | | | | |
From net investment income | | | (0.24 | ) | | | (0.26 | ) | | | (0.28 | ) | | | (0.25 | ) | | | (0.30 | ) |
From net realized gains | | | (0.64 | ) | | | — | | | | — | | | | — | | | | — | |
| | | | |
Total distributions | | | (0.88 | ) | | | (0.26 | ) | | | (0.28 | ) | | | (0.25 | ) | | | (0.30 | ) |
| | | | |
Net Asset Value: | | | | | | | | | | | | | | | | | | | | |
End of period | | | $21.54 | | | | $21.01 | | | | $18.42 | | | | $16.97 | | | | $16.47 | |
| | | | |
Total investment return 2 | | | 6.86% | | | | 15.58% | | | | 10.26% | | | | 4.61% | | | | 18.46% | |
| | | | |
Net assets at end of period (000’s omitted) | | | $22,970 | | | | $15,645 | | | | $13,492 | | | | $11,821 | | | | $11,150 | |
| | | | | |
Ratios: 3 | | | | | | | | | | | | | | | | | | | | |
Expenses | | | 1.00% | | | | 1.00% | | | | 1.00% | | | | 1.00% | | | | 1.00% | |
Net investment income | | | 1.17% | | | | 1.36% | | | | 1.52% | | | | 1.75% | | | | 1.75% | |
| | | | | |
Portfolio turnover rate (excluding short-term securities) | | | 47.49% | | | | 54.52% | | | | 30.86% | | | | 47.01% | | | | 40.84% | |
| 1 | The net investment income per share is based on average shares outstanding for the period. |
| 2 | Total investment return is based on the change in net asset value of a share during the period (not annualized) and assumes reinvestment of distributions at net asset value. |
| 3 | Ratios are annualized for periods less than one year. In addition to fees and expenses which the Fund bears directly, the Fund indirectly bears a pro rata share of the fees and expenses of the acquired funds in which it invests. Such indirect expenses are not included in the above reported expense ratios. |
| | |
| | |
58 | | SIT MUTUAL FUNDS ANNUAL REPORT |
FINANCIAL HIGHLIGHTS
Per share income and capital changes for a share outstanding throughout the period. See accompanying notes to financial statements.
Sit Dividend Growth Fund
| | | | | | | | | | | | | | | | | | | | |
| |
| Class I | | Years Ended June 30, | |
| | | 2015 | | | 2014 | | | 2013 | | | 2012 | | | 2011 | |
| |
Net Asset Value: | | | | | | | | | | | | | | | | | | | | |
Beginning of period | | | $18.69 | | | | $16.35 | | | | $14.10 | | | | $13.91 | | | | $10.64 | |
| | | | |
Operations: | | | | | | | | | | | | | | | | | | | | |
Net investment income 1 | | | 0.25 | | | | 0.26 | | | | 0.27 | | | | 0.24 | | | | 0.21 | |
Net realized and unrealized gains. | | | 0.92 | | | | 2.96 | | | | 2.46 | | | | 0.26 | | | | 3.23 | |
| | | | |
Total from operations | | | 1.17 | | | | 3.22 | | | | 2.73 | | | | 0.50 | | | | 3.44 | |
| | | | |
Redemption fees 2 | | | — | | | | — | | | | — | | | | — | | | | — | |
| | | | |
Distributions to Shareholders: | | | | | | | | | | | | | | | | | | | | |
From net investment income | | | (0.25 | ) | | | (0.25 | ) | | | (0.26 | ) | | | (0.21 | ) | | | (0.17 | ) |
From net realized gains | | | (2.21 | ) | | | (0.63 | ) | | | (0.22 | ) | | | (0.10 | ) | | | — | |
| | | | |
Total distributions | | | (2.46 | ) | | | (0.88 | ) | | | (0.48 | ) | | | (0.31 | ) | | | (0.17 | ) |
| | | | |
Net Asset Value: | | | | | | | | | | | | | | | | | | | | |
End of period | | | $17.40 | | | | $18.69 | | | | $16.35 | | | | $14.10 | | | | $13.91 | |
| | | | |
Total investment return 3 | | | 6.39% | | | | 20.26% | | | | 19.77% | | | | 3.76% | | | | 32.58% | |
| | | | |
Net assets at end of period (000’s omitted) | | | $955,460 | | | | $1,017,106 | | | | $920,324 | | | | $619,667 | | | | $328,057 | |
| | | | | |
Ratios: 4 | | | | | | | | | | | | | | | | | | | | |
Expenses | | | 1.00% | | | | 1.00% | | | | 1.00% | | | | 1.00% | | | | 1.00% | |
Net investment income | | | 1.39% | | | | 1.50% | | | | 1.78% | | | | 1.79% | | | | 1.59% | |
| | | | | |
Portfolio turnover rate (excluding short-term securities) | | | 57.69% | | | | 44.36% | | | | 26.58% | | | | 26.84% | | | | 14.67% | |
| | | | | | | | | | | | | | | | | | | | |
| |
| Class S | | Years Ended June 30, | |
| | | 2015 | | | 2014 | | | 2013 | | | 2012 | | | 2011 | |
| |
Net Asset Value: | | | | | | | | | | | | | | | | | | | | |
Beginning of period. | | | $18.63 | | | | $16.29 | | | | $14.06 | | | | $13.87 | | | | $10.61 | |
| | | | |
Operations: | | | | | | | | | | | | | | | | | | | | |
Net investment income 1 | | | 0.21 | | | | 0.22 | | | | 0.23 | | | | 0.21 | | | | 0.17 | |
Net realized and unrealized gains | | | 0.91 | | | | 2.96 | | | | 2.44 | | | | 0.26 | | | | 3.23 | |
| | | | |
Total from operations | | | 1.12 | | | | 3.18 | | | | 2.67 | | | | 0.47 | | | | 3.40 | |
| | | | |
Redemption fees 2 | | | — | | | | — | | | | — | | | | — | | | | — | |
| | | | |
Distributions to Shareholders: | | | | | | | | | | | | | | | | | | | | |
From net investment income | | | (0.20 | ) | | | (0.21 | ) | | | (0.22 | ) | | | (0.18 | ) | | | (0.14 | ) |
From net realized gains | | | (2.21 | ) | | | (0.63 | ) | | | (0.22 | ) | | | (0.10 | ) | | | — | |
| | | | |
Total distributions | | | (2.41 | ) | | | (0.84 | ) | | | (0.44 | ) | | | (0.28 | ) | | | (0.14 | ) |
| | | | |
Net Asset Value: | | | | | | | | | | | | | | | | | | | | |
End of period | | | $17.34 | | | | $18.63 | | | | $16.29 | | | | $14.06 | | | | $13.87 | |
| | | | |
Total investment return 3 | | | 6.13% | | | | 20.02% | | | | 19.39% | | | | 3.53% | | | | 32.27% | |
| | | | |
Net assets at end of period (000’s omitted) | | | $82,959 | | | | $103,433 | | | | $134,498 | | | | $100,878 | | | | $56,280 | |
| | | | | |
Ratios: 4 | | | | | | | | | | | | | | | | | | | | |
Expenses | | | 1.25% | | | | 1.25% | | | | 1.25% | | | | 1.25% | | | | 1.25% | |
Net investment income | | | 1.14% | | | | 1.25% | | | | 1.53% | | | | 1.54% | | | | 1.34% | |
| | | | | |
Portfolio turnover rate (excluding short-term securities) | | | 57.69% | | | | 44.36% | | | | 26.58% | | | | 26.84% | | | | 14.67% | |
| 1 | The net investment income per share is based on average shares outstanding for the period. |
| 2 | Amount represents less than $0.01 per share. |
| 3 | Total investment return is based on the change in net asset value of a share during the period (not annualized) and assumes reinvestment of distributions at net asset value. |
| 4 | Ratios are annualized for periods less than one year. In addition to fees and expenses which the Fund bears directly, the Fund indirectly bears a pro rata share of the fees and expenses of the acquired funds in which it invests. Such indirect expenses are not included in the above reported expense ratios. |
FINANCIAL HIGHLIGHTS
Per share income and capital changes for a share outstanding throughout the period. See accompanying notes to financial statements.
Sit Global Dividend Growth Fund
| | | | | | | | | | | | | | | | | | | | |
| |
| Class I | | Years Ended June 30, | |
| | | 2015 | | | 2014 | | | 2013 | | | 2012 | | | 2011 | |
| |
Net Asset Value: | | | | | | | | | | | | | | | | | | | | |
Beginning of period | | | $15.74 | | | | $14.27 | | | | $12.55 | | | | $13.26 | | | | $10.41 | |
| | | | |
Operations: | | | | | | | | | | | | | | | | | | | | |
Net investment income 1 | | | 0.20 | | | | 0.23 | | | | 0.25 | | | | 0.24 | | | | 0.20 | |
Net realized and unrealized gains (losses) | | | 0.13 | | | | 2.09 | | | | 1.78 | | | | (0.58 | ) | | | 2.95 | |
| | | | |
Total from operations | | | 0.33 | | | | 2.32 | | | | 2.03 | | | | (0.34 | ) | | | 3.15 | |
| | | | |
Redemption fees | | | — | | | | — | 2 | | | — | 2 | | | — | | | | — | |
| | | | |
Distributions to Shareholders: | | | | | | | | | | | | | | | | | | | | |
From net investment income | | | (0.20 | ) | | | (0.22 | ) | | | (0.23 | ) | | | (0.22 | ) | | | (0.17 | ) |
From net realized gains | | | (1.07 | ) | | | (0.63 | ) | | | (0.08 | ) | | | (0.15 | ) | | | (0.13 | ) |
| | | | |
Total distributions | | | (1.27 | ) | | | (0.85 | ) | | | (0.31 | ) | | | (0.37 | ) | | | (0.30 | ) |
| | | | |
Net Asset Value: | | | | | | | | | | | | | | | | | | | | |
End of period | | | $14.80 | | | | $15.74 | | | | $14.27 | | | | $12.55 | | | | $13.26 | |
| | | | |
Total investment return 3 | | | 2.19% | | | | 16.76% | | | | 16.36% | | | | (2.44% | ) | | | 30.55% | |
| | | | |
Net assets at end of period (000’s omitted) | | | $21,424 | | | | $21,467 | | | | $14,196 | | | | $10,421 | | | | $7,834 | |
Ratios: 4 | | | | | | | | | | | | | | | | | | | | |
Expenses | | | 1.25% | | | | 1.25% | | | | 1.25% | | | | 1.25% | | | | 1.25% | |
Net investment income | | | 1.33% | | | | 1.55% | | | | 1.81% | | | | 1.97% | | | | 1.57% | |
Portfolio turnover rate (excluding short-term securities) | | | 75.06% | | | | 48.68% | | | | 26.15% | | | | 26.65% | | | | 21.84% | |
| | | | | | | | | | | | | | | | | | | | |
| |
| Class S | | Years Ended June 30, | |
| | | 2015 | | | 2014 | | | 2013 | | | 2012 | | | 2011 | |
| |
Net Asset Value: | | | | | | | | | | | | | | | | | | | | |
Beginning of period | | | $15.72 | | | | $14.25 | | | | $12.54 | | | | $13.24 | | | | $10.40 | |
| | | | |
Operations: | | | | | | | | | | | | | | | | | | | | |
Net investment income 1 | | | 0.16 | | | | 0.20 | | | | 0.21 | | | | 0.21 | | | | 0.16 | |
Net realized and unrealized gains (losses) | | | 0.13 | | | | 2.09 | | | | 1.78 | | | | (0.57 | ) | | | 2.95 | |
| | | | |
Total from operations | | | 0.29 | | | | 2.29 | | | | 1.99 | | | | (0.36 | ) | | | 3.11 | |
| | | | |
Redemption fees | | | — | | | | — | 2 | | | — | | | | — | | | | — | |
| | | | |
Distributions to Shareholders: | | | | | | | | | | | | | | | | | | | | |
From net investment income | | | (0.16 | ) | | | (0.19 | ) | | | (0.20 | ) | | | (0.19 | ) | | | (0.14 | ) |
From net realized gains | | | (1.07 | ) | | | (0.63 | ) | | | (0.08 | ) | | | (0.15 | ) | | | (0.13 | ) |
| | | | |
Total distributions | | | (1.23 | ) | | | (0.82 | ) | | | (0.28 | ) | | | (0.34 | ) | | | (0.27 | ) |
| | | | |
Net Asset Value: | | | | | | | | | | | | | | | | | | | | |
End of period | | | $14.78 | | | | $15.72 | | | | $14.25 | | | | $12.54 | | | | $13.24 | |
| | | | |
Total investment return 3 | | | 2.00% | | | | 16.49% | | | | 16.01% | | | | (2.60% | ) | | | 30.17% | |
| | | | |
Net assets at end of period (000’s omitted) | | | $3,451 | | | | $3,323 | | | | $3,257 | | | | $2,608 | | | | $1,444 | |
| | | | | |
Ratios: 4 | | | | | | | | | | | | | | | | | | | | |
Expenses | | | 1.50% | | | | 1.50% | | | | 1.50% | | | | 1.50% | | | | 1.50% | |
Net investment income | | | 1.08% | | | | 1.30% | | | | 1.56% | | | | 1.72% | | | | 1.32% | |
| | | | | |
Portfolio turnover rate (excluding short-term securities) | | | 75.06% | | | | 48.68% | | | | 26.15% | | | | 26.65% | | | | 21.84% | |
| 1 | The net investment income per share is based on average shares outstanding for the period. |
| 2 | Amount represents less than $0.01 per share. |
| 3 | Total investment return is based on the change in net asset value of a share during the period (not annualized) and assumes reinvestment of distributions at net asset value. |
| 4 | Ratios are annualized for periods less than one year. In addition to fees and expenses which the Fund bears directly, the Fund indirectly bears a pro rata share of the fees and expenses of the acquired funds in which it invests. Such indirect expenses are not included in the above reported expense ratios. |
| | |
| | |
60 | | SIT MUTUAL FUNDS ANNUAL REPORT |
FINANCIAL HIGHLIGHTS
Per share income and capital changes for a share outstanding throughout the period. See accompanying notes to financial statements.
Sit Large Cap Growth Fund
| | | | | | | | | | | | | | | | | | | | |
| |
| | | Years Ended June 30, | |
| | | 2015 | | | 2014 | | | 2013 | | | 2012 | | | 2011 | |
| |
Net Asset Value: | | | | | | | | | | | | | | | | | | | | |
Beginning of period. | | | $52.51 | | | | $47.53 | | | | $45.53 | | | | $43.96 | | | | $34.75 | |
| | | | |
Operations: | | | | | | | | | | | | | | | | | | | | |
Net investment income 1 | | | 0.20 | | | | 0.29 | | | | 0.43 | | | | 0.26 | | | | 0.22 | |
Net realized and unrealized gains | | | 5.04 | | | | 10.23 | | | | 5.69 | | | | 1.63 | | | | 9.21 | |
| | | | |
Total from operations | | | 5.24 | | | | 10.52 | | | | 6.12 | | | | 1.89 | | | | 9.43 | |
| | | | |
Redemption fees 2 | | | — | | | | — | | | | — | | | | — | | | | — | |
| | | | |
Distributions to Shareholders: | | | | | | | | | | | | | | | | | | | | |
From net investment income | | | (0.24 | ) | | | (0.39 | ) | | | (0.46 | ) | | | (0.32 | ) | | | (0.22 | ) |
From net realized gains | | | (10.30 | ) | | | (5.15 | ) | | | (3.66 | ) | | | — | | | | — | |
| | | | |
Total distributions | | | (10.54 | ) | | | (5.54 | ) | | | (4.12 | ) | | | (0.32 | ) | | | (0.22 | ) |
| | | | |
Net Asset Value: | | | | | | | | | | | | | | | | | | | | |
End of period | | | $47.21 | | | | $52.51 | | | | $47.53 | | | | $45.53 | | | | $43.96 | |
| | | | |
Total investment return 3 | | | 10.62% | | | | 22.92% | | | | 14.18% | | | | 4.39% | | | | 27.18% | |
| | | | |
Net assets at end of period (000’s omitted) | | | $144,807 | | | | $188,574 | | | | $196,285 | | | | $254,256 | | | | $365,045 | |
| | | | | |
Ratios: 4 | | | | | | | | | | | | | | | | | | | | |
Expenses | | | 1.00% | | | | 1.00% | | | | 1.00% | | | | 1.00% | | | | 1.00% | |
Net investment income | | | 0.41% | | | | 0.57% | | | | 0.92% | | | | 0.61% | | | | 0.54% | |
| | | | | |
Portfolio turnover rate (excluding short-term securities) | | | 24.04% | | | | 27.34% | | | | 13.42% | | | | 15.06% | | | | 25.36% | |
| 1 | The net investment income per share is based on average shares outstanding for the period. |
| 2 | Amount represents less than $0.01 per share. |
| 3 | Total investment return is based on the change in net asset value of a share during the period (not annualized) and assumes reinvestment of distributions at net asset value. |
| 4 | Ratios are annualized for periods less than one year. In addition to fees and expenses which the Fund bears directly, the Fund indirectly bears a pro rata share of the fees and expenses of the acquired funds in which it invests. Such indirect expenses are not included in the above reported expense ratios. |
FINANCIAL HIGHLIGHTS
Per share income and capital changes for a share outstanding throughout the period. See accompanying notes to financial statements.
Sit Mid Cap Growth Fund
| | | | | | | | | | | | | | | | | | | | |
| |
| | | Years Ended June 30, | |
| | | 2015 | | | 2014 | | | 2013 | | | 2012 | | | 2011 | |
| |
Net Asset Value: | | | | | | | | | | | | | | | | | | | | |
Beginning of period. | | | $21.08 | | | | $17.69 | | | | $15.77 | | | | $15.88 | | | | $11.57 | |
| | | | |
Operations: | | | | | | | | | | | | | | | | | | | | |
Net investment loss 1 | | | (0.06 | ) | | | (0.07 | ) | | | (0.03 | ) | | | (0.05 | ) | | | (0.06 | ) |
Net realized and unrealized gains (losses) | | | 1.91 | | | | 4.54 | | | | 2.32 | | | | (0.06 | ) | | | 4.37 | |
| | | | |
Total from operations | | | 1.85 | | | | 4.47 | | | | 2.29 | | | | (0.11 | ) | | | 4.31 | |
| | | | |
Capital share proceeds | | | — | | | | — | | | | — | | | | — | | | | — | 2,3 |
| | | | |
Redemption fees 2 | | | — | | | | — | | | | — | | | | — | | | | — | |
| | | | |
Distributions to Shareholders: | | | | | | | | | | | | | | | | | | | | |
From net realized gains | | | (2.71 | ) | | | (1.08 | ) | | | (0.37 | ) | | | — | | | | — | |
| | | | |
Net Asset Value: | | | | | | | | | | | | | | | | | | | | |
End of period | | | $20.22 | | | | $21.08 | | | | $17.69 | | | | $15.77 | | | | $15.88 | |
| | | | |
Total investment return 4 | | | 9.52% | | | | 25.58% | | | | 14.70% | | | | (0.69% | ) | | | 37.25%5 | |
| | | | |
Net assets at end of period (000’s omitted) | | | $171,854 | | | | $180,276 | | | | $152,129 | | | | $144,601 | | | | $165,288 | |
| | | | | |
Ratios: 6, 7 | | | | | | | | | | | | | | | | | | | | |
Expenses (without waiver) | | | 1.25% | | | | 1.25% | | | | 1.25% | | | | 1.25% | | | | 1.25% | |
Expenses (with waiver) | | | 1.25% | | | | 1.25% | | | | 1.25% | | | | 1.25% | | | | 1.20% | |
Net investment loss (without waiver) | | | (0.30% | ) | | | (0.37% | ) | | | (0.17% | ) | | | (0.33% | ) | | | (0.49% | ) |
Net investment loss (with waiver) | | | (0.30% | ) | | | (0.37% | ) | | | (0.17% | ) | | | (0.33% | ) | | | (0.44% | ) |
| | | | | |
Portfolio turnover rate (excluding short-term securities) | | | 23.39% | | | | 27.65% | | | | 16.91% | | | | 16.23% | | | | 26.98% | |
| 1 | The net investment income (loss) per share is based on average shares outstanding for the period. |
| 2 | Amount represents less than $0.01 per share. |
| 3 | The Fund accounted for proceeds during the year from market timing settlements. |
| 4 | Total investment return is based on the change in net asset value of a share during the period (not annualized) and assumes reinvestment of distributions at net asset value. |
| 5 | Impact on total return from capital share proceeds was less than 0.01%. |
| 6 | Ratios are annualized for periods less than one year. In addition to fees and expenses which the Fund bears directly, the Fund indirectly bears a pro rata share of the fees and expenses of the acquired funds in which it invests. Such indirect expenses are not included in the above reported expense ratios. |
| 7 | Total Fund expenses are calculated at 1.25% of average daily net assets. The investment adviser voluntarily limited expenses to 1.15% of average daily net assets through December 31, 2010 at which time the agreement was terminated. |
| | |
| | |
62 | | SIT MUTUAL FUNDS ANNUAL REPORT |
FINANCIAL HIGHLIGHTS
Per share income and capital changes for a share outstanding throughout the period. See accompanying notes to financial statements.
Sit Small Cap Dividend Growth Fund
| | |
|
| | | Three |
| Class I | | Months Ended |
| | | June 30, 2015 * |
|
Net Asset Value: | | |
Beginning of period | | $10.00 |
| | |
Operations: | | |
Net investment income 1 | | 0.02 |
Net realized and unrealized losses | | (0.06) |
| | |
Total from operations | | (0.04) |
| | |
Net Asset Value: | | |
End of period | | $9.96 |
| | |
Total investment return 2 | | (0.40%) |
| | |
Net assets at end of period (000’s omitted) | | $3,708 |
| |
Ratios: 3 | | |
Expenses | | 1.25% |
Net investment income | | 0.98% |
| |
Portfolio turnover rate (excluding short-term securities) | | 2.63%4 |
|
|
| | | Three |
| Class S | | Months Ended |
| | | June 30, 2015 * |
|
Net Asset Value: | | |
Beginning of period | | $10.00 |
| | |
Operations: | | |
Net investment income 1 | | 0.02 |
Net realized and unrealized losses | | (0.06) |
| | |
Total from operations. | | (0.04) |
| | |
Net Asset Value: | | |
End of period | | $9.96 |
| | |
Total investment return 2 | | (0.40%) |
| | |
Net assets at end of period (000’s omitted) | | $2,230 |
| |
Ratios: 3 | | |
Expenses | | 1.50% |
Net investment income | | 0.73% |
| |
Portfolio turnover rate (excluding short-term securities) | | 2.63%4 |
| * | The Fund commenced investment operations on March 31, 2015. |
| 1 | The net investment income per share is based on average shares outstanding for the period. |
| 2 | Total investment return is based on the change in net asset value of a share during the period (not annualized) and assumes reinvestment of distributions at net asset value. |
| 3 | Ratios are annualized for periods less than one year. In addition to fees and expenses which the Fund bears directly, the Fund indirectly bears a pro rata share of the fees and expenses of the acquired funds in which it invests. Such indirect expenses are not included in the above reported expense ratios. |
FINANCIAL HIGHLIGHTS
Per share income and capital changes for a share outstanding throughout the period. See accompanying notes to financial statements.
Sit Small Cap Growth Fund
| | | | | | | | | | | | | | | | | | | | |
| |
| | | Years Ended June 30, | |
| | | 2015 | | | 2014 | | | 2013 | | | 2012 | | | 2011 | |
| |
Net Asset Value: | | | | | | | | | | | | | | | | | | | | |
Beginning of period | | | $61.38 | | | | $50.08 | | | | $43.90 | | | | $43.86 | | | | $31.32 | |
| | | | |
Operations: | | | | | | | | | | | | | | | | | | | | |
Net investment loss 1 | | | (0.48 | ) | | | (0.55 | ) | | | (0.30 | ) | | | (0.34 | ) | | | (0.36 | ) |
Net realized and unrealized gains | | | 6.26 | | | | 11.85 | | | | 6.48 | | | | 0.38 | | | | 12.89 | |
| | | | |
Total from operations | | | 5.78 | | | | 11.30 | | | | 6.18 | | | | 0.04 | | | | 12.53 | |
| | | | |
Capital share proceeds | | | — | | | | — | | | | — | | | | — | | | | 0.01 | 2 |
| | | | |
Redemption fees 3 | | | — | | | | — | | | | — | | | | — | | | | — | |
| | | | |
Distributions to Shareholders: | | | | | | | | | | | | | | | | | | | | |
From net realized gains | | | (7.06 | ) | | | — | | | | — | | | | — | | | | — | |
| | | | |
Net Asset Value: | | | | | | | | | | | | | | | | | | | | |
End of period | | | $60.10 | | | | $61.38 | | | | $50.08 | | | | $43.90 | | | | $43.86 | |
| | | | |
Total investment return 4 | | | 10.38% | | | | 22.56% | | | | 14.08% | | | | 0.09% | | | | 40.04%5 | |
| | | | |
Net assets at end of period (000’s omitted) | | | $103,816 | | | | $99,510 | | | | $84,793 | | | | $78,202 | | | | $94,744 | |
| | | | | |
Ratios: 6 | | | | | | | | | | | | | | | | | | | | |
Expenses | | | 1.50% | | | | 1.50% | | | | 1.50% | | | | 1.50% | | | | 1.50% | |
Net investment loss | | | (0.81% | ) | | | (0.94% | ) | | | (0.64% | ) | | | (0.82% | ) | | | (0.91% | ) |
Portfolio turnover rate (excluding short-term securities) | | | 31.07% | | | | 33.38% | | | | 28.36% | | | | 22.32% | | | | 30.33% | |
| 1 | The net investment income (loss) per share is based on average shares outstanding for the period. |
| 2 | The Fund accounted for proceeds during the year from market timing settlements. |
| 3 | Amount represents less than $0.01 per share. |
| 4 | Total investment return is based on the change in net asset value of a share during the period (not annualized) and assumes reinvestment of distributions at net asset value. |
| 5 | Impact on total return from capital share proceeds was 0.03%. |
| 6 | Ratios are annualized for periods less than one year. In addition to fees and expenses which the Fund bears directly, the Fund indirectly bears a pro rata share of the fees and expenses of the acquired funds in which it invests. Such indirect expenses are not included in the above reported expense ratios. |
| | |
| | |
64 | | SIT MUTUAL FUNDS ANNUAL REPORT |
FINANCIAL HIGHLIGHTS
Per share income and capital changes for a share outstanding throughout the period. See accompanying notes to financial statements.
Sit International Growth Fund
| | | | | | | | | | | | | | | | | | | | |
| |
| | | Years Ended June 30, | |
| | | 2015 | | | 2014 | | | 2013 | | | 2012 | | | 2011 | |
| |
Net Asset Value: | | | | | | | | | | | | | | | | | | | | |
Beginning of period | | | $17.44 | | | | $15.05 | | | | $13.29 | | | | $15.16 | | | | $11.67 | |
| | | | |
Operations: | | | | | | | | | | | | | | | | | | | | |
Net investment income 1 | | | 0.09 | | | | 0.28 | | | | 0.20 | | | | 0.22 | | | | 0.16 | |
Net realized and unrealized gains (losses) | | | (0.34 | ) | | | 2.28 | | | | 1.80 | | | | (1.86 | ) | | | 3.39 | |
| | | | |
Total from operations | | | (0.25 | ) | | | 2.56 | | | | 2.00 | | | | (1.64 | ) | | | 3.55 | |
| | | | |
Capital share proceeds | | | — | | | | — | | | | — | | | | — | | | | 0.07 | 2 |
| | | | |
Redemption fees | | | — | | | | — | | | | — | | | | — | 3 | | | — | 3 |
| | | | |
Distributions to Shareholders: | | | | | | | | | | | | | | | | | | | | |
From net investment income | | | (0.27 | ) | | | (0.17 | ) | | | (0.24 | ) | | | (0.23 | ) | | | (0.13 | ) |
| | | | |
Net Asset Value: | | | | | | | | | | | | | | | | | | | | |
End of period | | | $16.92 | | | | $17.44 | | | | $15.05 | | | | $13.29 | | | | $15.16 | |
| | | | |
Total investment return 4 | | | (1.35% | ) | | | 17.06% | | | | 15.06% | | | | (10.69% | ) | | | 31.08%5 | |
| | | | |
Net assets at end of period (000’s omitted) | | | $22,485 | | | | $24,127 | | | | $20,890 | | | | $19,296 | | | | $24,823 | |
| | | | | |
Ratios: 6, 7 | | | | | | | | | | | | | | | | | | | | |
Expenses (without waiver) | | | 1.50% | | | | 1.50% | | | | 1.50% | | | | 1.50% | | | | 1.61% | |
Expenses (with waiver) | | | 1.50% | | | | 1.50% | | | | 1.50% | | | | 1.50% | | | | 1.50% | |
Net investment income (without waiver) | | | 0.55% | | | | 1.69% | | | | 1.39% | | | | 1.62% | | | | 1.01% | |
Net investment income (with waiver) | | | 0.55% | | | | 1.69% | | | | 1.39% | | | | 1.62% | | | | 1.12% | |
| | | | | |
Portfolio turnover rate (excluding short-term securities) | | | 56.97% | | | | 46.91% | | | | 27.93% | | | | 27.82% | | | | 35.95% | |
| 1 | The net investment income per share is based on average shares outstanding for the period. |
| 2 | The Fund accounted for proceeds during the year from market timing settlements. |
| 3 | Amount represents less than $0.01 per share. |
| 4 | Total investment return is based on the change in net asset value of a share during the period (not annualized) and assumes reinvestment of distributions at net asset value. |
| 5 | Impact on total return from capital share proceeds was 0.60% for the year ended June 30, 2011. |
| 6 | Ratios are annualized for periods less than one year. In addition to fees and expenses which the Fund bears directly, the Fund indirectly bears a pro rata share of the fees and expenses of the acquired funds in which it invests. Such indirect expenses are not included in the above reported expense ratios. |
| 7 | Effective November 1, 2010, total Fund expenses are limited to 1.50% of average daily net assets. Prior to this date, expenses were calculated at a higher rate, and the investment adviser voluntarily absorbed expenses that were otherwise payable by the Fund. |
FINANCIAL HIGHLIGHTS
Per share income and capital changes for a share outstanding throughout the period. See accompanying notes to financial statements.
Sit Developing Markets Growth Fund
| | | | | | | | | | | | | | | | | | | | |
| |
| | | Years Ended June 30, | |
| | | 2015 | | | 2014 | | | 2013 | | | 2012 | | | 2011 | |
| |
Net Asset Value: | | | | | | | | | | | | | | | | | | | | |
Beginning of period | | | $17.48 | | | | $16.40 | | | | $17.70 | | | | $23.24 | | | | $19.00 | |
| | | | |
Operations: | | | | | | | | | | | | | | | | | | | | |
Net investment income (loss) 1 | | | 0.03 | | | | (0.01 | ) | | | 0.04 | | | | 0.06 | | | | 0.03 | |
Net realized and unrealized gains (losses) | | | (1.41 | ) | | | 2.07 | | | | 0.14 | | | | (3.89 | ) | | | 4.90 | |
| | | | |
Total from operations | | | (1.38 | ) | | | 2.06 | | | | 0.18 | | | | (3.83 | ) | | | 4.93 | |
| | | | |
Redemption fees | | | — | | | | — | | | | — | | | | — | 2 | | | — | |
| | | | |
Distributions to Shareholders: | | | | | | | | | | | | | | | | | | | | |
From net investment income | | | — | | | | (0.03 | ) | | | (0.06 | ) | | | (0.06 | ) | | | (0.02 | ) |
From net realized gains | | | (1.33 | ) | | | (0.95 | ) | | | (1.42 | ) | | | (1.65 | ) | | | (0.67 | ) |
| | | | |
Total distributions | | | (1.33 | ) | | | (0.98 | ) | | | (1.48 | ) | | | (1.71 | ) | | | (0.69 | ) |
| | | | |
Net Asset Value: | | | | | | | | | | | | | | | | | | | | |
End of period | | | $14.77 | | | | $17.48 | | | | $16.40 | | | | $17.70 | | | | $23.24 | |
| | | | |
Total investment return 3 | | | (7.64% | ) | | | 12.79% | | | | 0.36% | | | | (16.29% | ) | | | 25.95% | |
| | | | |
Net assets at end of period (000’s omitted) | | | $9,192 | | | | $10,808 | | | | $10,615 | | | | $11,634 | | | | $15,420 | |
| | | | | |
Ratios: 4 | | | | | | | | | | | | | | | | | | | | |
Expenses | | | 2.00% | | | | 2.00% | | | | 2.00% | | | | 2.00% | | | | 2.00% | |
Net investment income (loss) | | | 0.16% | | | | (0.07% | ) | | | 0.24% | | | | 0.29% | | | | 0.15% | |
| | | | | |
Portfolio turnover rate (excluding short-term securities) | | | 21.51% | | | | 21.45% | | | | 15.48% | | | | 22.56% | | | | 19.14% | |
| 1 | The net investment income (loss) per share is based on average shares outstanding for the period. |
| 2 | Amount represents less than $0.01 per share. |
| 3 | Total investment return is based on the change in net asset value of a share during the period (not annualized) and assumes reinvestment of distributions at net asset value. |
| 4 | Ratios are annualized for periods less than one year. In addition to fees and expenses which the Fund bears directly, the Fund indirectly bears a pro rata share of the fees and expenses of the acquired funds in which it invests. Such indirect expenses are not included in the above reported expense ratios. |
| | |
| | |
66 | | SIT MUTUAL FUNDS ANNUAL REPORT |
NOTES TO FINANCIAL STATEMENTS
Year or Period Ended June 30, 2015
Sit Mutual Funds are no-load funds, and are registered under the Investment Company Act of 1940 (as amended) as diversified, open-end management investment companies, or series thereof. The Sit Balanced, Sit Dividend Growth, Sit Global Dividend Growth, Sit Small Cap Dividend Growth, Sit Small Cap Growth, Sit International Growth, and Sit Developing Markets Growth are series funds of Sit Mutual Funds, Inc.
This report covers the equity funds of the Sit Mutual Funds (the Funds). Each fund has 10 billion authorized shares of capital stock with a par value of $0.001. The investment objective for each Fund is as follows:
| | |
| Fund | | Investment Objective |
Balanced | | Long-term growth consistent with the preservation of principal and to provide regular income. |
Dividend Growth | | Provide current income that exceeds the dividend yield of the S&P 500® Index and that grows over a period of years. Secondarily, maximize long-term capital appreciation. |
Global Dividend Growth | | Provide current income that exceeds the dividend yield of the MSCI World Index that grows over a period of years. Secondarily, maximize long-term capital appreciation. |
Large Cap Growth Fund | | Maximize long-term capital appreciation. |
Mid Cap Growth Fund | | Maximize long-term capital appreciation. |
Small Cap Dividend Growth | | Provide current income that exceeds the yield of the Russell 2000® Index and that grows over a period of years. Secondarily, maximize long-term capital appreciation. |
Small Cap Growth | | Maximize long-term capital appreciation. |
International Growth | | Maximize long-term growth. |
Developing Markets Growth | | Maximize long-term capital appreciation. |
The Dividend Growth, Global Dividend Growth and Small Cap Dividend Growth Funds offer Class I and Class S shares. Both classes of shares have identical voting, dividend, and liquidation rights. The distribution fee differs among classes, the Class S shares have a 0.25% distribution fee, whereas Class I has no distribution fee. Income, expenses (other than class specific expenses) and realized and unrealized gains or losses on investments are allocated to each class of shares based upon its relative net assets.
| (2) | Significant Accounting Policies |
The Funds are investment companies and follow accounting and reporting guidance under Financial Accounting Standards Board (“FASB”) Accounting Standards Codification (“ASC”) Topic 946, “Financial Services-Investment Companies”. The following is a summary of significant accounting policies consistently followed by the Funds in the preparation of their financial statements in conformity with U.S. generally accepted accounting principles (“GAAP”).
Investments in Securities
Investments in securities traded on national or international securities exchanges are valued at the last reported sales price prior to the time when assets are valued. Securities traded on the over-the-counter market are valued at the last reported sales price or if the last sales price is not available at the last reported bid price. The sale and bid prices or prices deemed best to reflect fair value quoted by dealers who make markets in these securities are obtained from independent pricing services. Consistent with the Funds’ valuation policies and procedures, debt securities maturing in more than 60 days are priced by an independent pricing service. The pricing service may use models that price securities based on current yields and relative security characteristics, such as coupon rate, maturity date, issuer credit quality, and prepayment speeds as applicable. When market quotations are not readily available, or when the Adviser becomes aware that a significant event impacting the value of a security or group of securities has occurred after the closing of the exchange on which the security or securities principally trade, but before the calculation of the daily net asset value, securities are valued at fair value as determined in good faith using procedures established by the Board of Directors. The procedures consider, among others, the following factors to determine a security’s fair value: the nature and pricing history (if any) of the security; whether any
NOTES TO FINANCIAL STATEMENTS
Year or Period Ended June 30, 2015 (Continued)
dealer quotations for the security are available; and possible valuation methodologies that could be used to determine the fair value of the security. Debt securities of sufficient credit quality maturing in less than 60 days when acquired, or which subsequently are within 60 days of maturity, are valued at amortized cost, which approximates fair value.
Security transactions are accounted for on the date the securities are purchased or sold. Securities gains and losses are calculated on the identified-cost basis. Dividend income is recorded on the ex-dividend date or upon the receipt of ex-dividend notification in the case of certain foreign securities. Interest, including level-yield amortization of long-term bond premium and discount, is recorded on the accrual basis.
Fair Value Measurements
The inputs and valuation techniques used to measure fair value of the Funds’ net assets are summarized into three levels as described in the hierarchy below:
• Level 1 – quoted prices in active markets for identical securities. An active market for the security is a market in which transactions occur with sufficient frequency and volume to provide pricing information on an ongoing basis. A quoted price in an active market provides the most reliable evidence of fair value.
• Level 2 – debt securities are valued based on evaluated prices received from independent pricing services or from dealers who make markets in such securities. For corporate bonds, U.S. government and government agency obligations, and municipal securities the pricing services utilize matrix pricing which considers yield or price of bonds of comparable quality, coupon, maturity, and type as well as dealer supplied prices. For asset-backed securities and mortgage-backed securities, the pricing services utilize matrix pricing which considers prepayment speed assumptions, attributes of the collateral, yield or price of bonds of comparable quality, coupon, maturity, and type as well as dealer supplied prices. For foreign equities, the pricing services adjust closing prices by applying a systematic process for events occurring after the close of the foreign exchange by utilizing such inputs as Depositary Receipts, quoted prices for similar securities, exchange rates, and certain indexes. All of these inputs are derived principally from or corroborated by observable market data. An adjustment to any observable input that is significant to the fair value may render the measurement a Level 3 measurement.
• Level 3 – significant unobservable inputs, including the Adviser’s own assumptions in determining the fair value of investments.
The inputs or methodology used for valuing securities are not necessarily an indication of the risk associated with investing in those securities.
A summary of the levels for the Funds’ investments as of June 30, 2015 is included with the Funds’ schedule of investments.
Foreign Currency Translations and Forward Foreign Currency Contracts
The fair value of securities and other assets and liabilities denominated in foreign currencies for Global Dividend Growth, International Growth and Developing Markets Growth Funds are translated daily into U.S. dollars at the closing rate of exchange (approximately 4:00 p.m. E.S.T). Purchases and sales of securities, income and expenses are translated at the exchange rate on the transaction date. Dividend and interest income includes currency exchange gains (losses) realized between the accrual and payment dates on such income. Exchange gains (losses) may also be realized between the trade and settlement dates on security and forward contract transactions. For securities denominated in foreign currencies, the effect of changes in foreign exchange rates on realized and unrealized gains or losses is reflected as a component of such gains or losses.
The Global Dividend Growth, International Growth and Developing Markets Growth Funds may enter into forward foreign currency exchange contracts generally for operational purposes, but the Adviser may occasionally utilize contracts to protect against adverse exchange rate fluctuation. Any gains (losses) generated by these contracts are disclosed separately on the statement of operations. The net U.S. dollar value of foreign currency underlying all contractual commitments held by the Funds and the resulting unrealized appreciation or depreciation is determined using foreign currency exchange rates from an independent pricing service. The Funds are subject to the credit risk that the other party will not complete the obligations of the contract.
| | |
| | |
68 | | SIT MUTUAL FUNDS ANNUAL REPORT |
Federal Taxes
The Funds’ policy is to comply with the requirements of the Internal Revenue Code applicable to regulated investment companies and to distribute all of their taxable income to shareholders. Therefore, no income tax provision is required. Also, in order to avoid the payment of any federal excise taxes, the Funds will distribute substantially all of their net investment income and net realized gains on a calendar year basis.
Management has analyzed the Funds’ tax positions taken in federal tax returns for all open tax years and has concluded that as of June 30, 2015, no provision for income tax would be required in the Funds’ financial statements. The Funds’ federal and state income and federal excise returns for the 2012, 2013 and 2014 tax years for which the applicable statutes of limitations have not expired remain subject to examination by the Internal Revenue Service and state departments of revenue.
At June 30, 2015, the gross unrealized appreciation (depreciation) on investments and cost of securities on a tax basis for federal income tax purposes were as follows:
| | | | | | | | | | | | | | | | |
| | | | | | | | | Net Unrealized | | | Cost of | |
| | | Unrealized | | | Unrealized | | | Appreciation | | | Securities on a | |
| | | Appreciation | | | Depreciation | | | (Depreciation) | | | Tax Basis | |
Balanced | | | $4,058,921 | | | | ($302,994 | ) | | | $3,755,927 | | | | $18,457,386 | |
Dividend Growth | | | 162,383,006 | | | | (17,109,654 | ) | | | 145,273,352 | | | | 889,096,547 | |
Global Dividend Growth | | | 2,484,195 | | | | (1,025,914 | ) | | | 1,458,281 | | | | 23,053,638 | |
Large Cap Growth | | | 49,108,429 | | | | (1,546,110 | ) | | | 47,562,319 | | | | 95,516,453 | |
Mid Cap Growth | | | 66,666,804 | | | | (2,097,892 | ) | | | 64,568,912 | | | | 104,719,351 | |
Small Cap Dividend Growth | | | 175,544 | | | | (220,150 | ) | | | (44,606 | ) | | | 5,787,730 | |
Small Cap Growth | | | 36,080,124 | | | | (2,188,669 | ) | | | 33,891,455 | | | | 68,592,521 | |
International Growth | | | 3,929,062 | | | | (1,718,844 | ) | | | 2,210,218 | | | | 19,900,247 | |
Developing Markets Growth | | | 2,424,028 | | | | (667,497 | ) | | | 1,756,531 | | | | 7,247,198 | |
Net investment income and net realized gains differ for financial statement and tax purposes because of losses deferred due to “wash sale” transactions. A “wash sale” occurs when a Fund sells a security that it has acquired within a period beginning thirty days before and ending thirty days after the date of sale (a sixty one day period). The character of distributions made during the year from net investment income or net realized gains may also differ from its ultimate characterization for tax purposes. Also, due to the timing of dividend distributions, the fiscal year in which amounts are distributed may differ from the year that the income or realized gains (losses) were recorded by the Funds. The tax character of distributions paid during the fiscal years ended June 30, 2015 and 2014 were as follows:
Year Ended June 30, 2015:
| | | | | | | | | | | | | | | |
| | | | | Long Term | | |
| | | Ordinary Income | | Capital Gain | | Total |
Balanced | | | | $226,644 | | | | | $452,434 | | | | | $679,078 | |
Dividend Growth (Class I) | | | | 19,006,449 | | | | | 114,151,521 | | | | | 133,157,970 | |
Dividend Growth (Class S) | | | | 1,514,587 | | | | | 10,059,686 | | | | | 11,574,273 | |
Global Dividend Growth (Class I) | | | | 315,934 | | | | | 1,468,820 | | | | | 1,784,754 | |
Global Dividend Growth (Class S) | | | | 50,637 | | | | | 240,326 | | | | | 290,963 | |
Large Cap Growth | | | | 1,318,355 | | | | | 32,548,866 | | | | | 33,867,221 | |
Mid Cap Growth | | | | — | | | | | 22,297,244 | | | | | 22,297,244 | |
Small Cap Dividend Growth (Class I) | | | | — | | | | | — | | | | | — | |
Small Cap Dividend Growth (Class S) | | | | — | | | | | — | | | | | — | |
Small Cap Growth | | | | — | | | | | 11,167,852 | | | | | 11,167,852 | |
International Growth | | | | 354,576 | | | | | — | | | | | 354,576 | |
Developing Markets Growth | | | | — | | | | | 795,509 | | | | | 795,509 | |
NOTES TO FINANCIAL STATEMENTS
Year or Period Ended June 30, 2015 (Continued)
Year Ended June 30, 2014:
| | | | | | | | | | | | | | | |
| | | Ordinary Income | | Long Term
Capital Gain | | Total |
Balanced | | | | $190,000 | | | | | — | | | | | $190,000 | |
Dividend Growth (Class I) | | | | 17,289,602 | | | | | $31,374,733 | | | | | 48,664,335 | |
Dividend Growth (Class S) | | | | 2,140,368 | | | | | 4,875,856 | | | | | 7,016,224 | |
Global Dividend Growth (Class I) | | | | 263,794 | | | | | 736,258 | | | | | 1,000,052 | |
Global Dividend Growth (Class S) | | | | 43,211 | | | | | 153,131 | | | | | 196,342 | |
Large Cap Growth | | | | 1,617,540 | | | | | 19,002,570 | | | | | 20,620,110 | |
Mid Cap Growth | | | | — | | | | | 8,937,914 | | | | | 8,937,914 | |
Small Cap Growth | | | | — | | | | | — | | | | | — | |
International Growth | | | | 231,001 | | | | | — | | | | | 231,001 | |
Developing Markets Growth | | | | 16,575 | | | | | 596,525 | | | | | 613,100 | |
As of June 30, 2015, the components of distributable earnings on a tax basis were as follows:
| | | | | | | | | | | | | | | |
| | | Undistributed | | | | Unrealized |
| | | Ordinary | | Accumulated | | Appreciation |
| | | Income | | Gain (Loss) | | (Depreciation) |
Balanced | | | | $137,851 | | | | | $547,666 | | | | | $3,755,927 | |
Dividend Growth | | | | 9,585,429 | | | | | 90,279,101 | | | | | 145,273,352 | |
Global Dividend Growth | | | | 242,187 | | | | | 1,760,714 | | | | | 1,457,224 | |
Large Cap Growth | | | | 1,487,352 | | | | | 24,857,715 | | | | | 47,562,319 | |
Mid Cap Growth | | | | — | | | | | 20,653,228 | | | | | 64,568,912 | |
Small Cap Dividend Growth | | | | 19,116 | | | | | 662 | | | | | (44,606 | ) |
Small Cap Growth | | | | — | | | | | 8,910,115 | | | | | 33,891,455 | |
International Growth | | | | 120,934 | | | | | 1,194,589 | | | | | 2,206,137 | |
Developing Markets Growth | | | | 11,294 | | | | | 130,362 | | | | | 1,756,500 | |
On the statement of assets and liabilities, as a result of permanent book-to-tax differences, reclassification adjustments were made to the following capital accounts:
| | | | | | | | | | | | | | | |
| | | Undistributed | | Accumulated | | |
| | | Net Investment | | Net Realized | | Additional |
| | | Income | | Gain (Loss) | | Paid-in Capital |
Balanced | | | | ($297 | ) | | | | $297 | | | | | — | |
Dividend Growth | | | | (28,629 | ) | | | | 28,629 | | | | | — | |
Global Dividend Growth | | | | (1,625 | ) | | | | 1,625 | | | | | — | |
Mid Cap Growth | | | | 523,027 | | | | | (445,171 | ) | | | | ($77,856 | ) |
Small Cap Dividend Growth | | | | 315 | | | | | 1,049 | | | | | (1,364 | ) |
Small Cap Growth | | | | 805,946 | | | | | — | | | | | (805,946 | ) |
International Growth | | | | (3,155 | ) | | | | 3,155 | | | | | — | |
Developing Markets Growth | | | | (4,827 | ) | | | | 4,827 | | | | | — | |
These differences were primarily attributable to return of capital dividends received, 988 reclassifications, non-deductible net operating losses and capital loss carryovers expiring.
| | |
| | |
70 | | SIT MUTUAL FUNDS ANNUAL REPORT |
Net capital loss carryovers and late year losses, if any, as of June 30, 2015, are available to offset future realized capital gains and thereby reduce future capital gains distributions. Under the Regulated Investment Company Modernization Act of 2010 (“Act”), the Funds’ are permitted to carry forward capital losses incurred in taxable years beginning after December 22, 2010 for an unlimited period. Any losses incurred during those future taxable years will be required to be utilized prior to any losses incurred in pre-enactment taxable years. Additionally, post-enactment capital losses that are carried forward will retain their character as either short-term or long-term capital losses, and will not be considered exclusively short-term as under previous law. The Funds’ first fiscal year end subject to the Modernization Act was June 30, 2012.
For the year ended June 30, 2015, the Funds’ utilized pre-enactment capital losses and expired capital losses as follows:
| | | | | | |
| | | Utilized | | Expiring In | | Expired |
International Growth | | $1,081,060 | | 2018 | | — |
Distributions
Distributions to shareholders are recorded as of the close of business on the record date. Such distributions are payable in cash or reinvested in additional shares of the Funds’ capital stock. Distributions from net investment income, if any, are declared and paid quarterly for the Balanced, Dividend Growth, Global Dividend Growth and Small Cap Dividend Growth Funds and declared and paid annually for Developing Markets Growth, Small Cap Growth, International Growth, Mid Cap Growth, and Large Cap Growth Funds. Distributions from net realized gains, if any, will be made annually for each of the Funds.
Concentration of Investments
The Developing Markets Growth Fund may concentrate investments in countries with limited or developing capital markets which may involve greater risks than investments in more developed markets and the prices of such investments may be volatile. The consequences of political, social or economic changes in these markets may have disruptive effects on the market prices of the Fund’s investments and the income it generates, as well as the Fund’s ability to repatriate such amounts.
Use of Estimates
The preparation of financial statements in conformity with U.S. generally accepted accounting principles requires management to make certain estimates and assumptions that affect the reported amounts of assets and liabilities and disclosure of contingent assets and liabilities at the date of the financial statements and the reported results for the respective periods. Actual results could differ from those estimates.
Guarantees and Indemnifications
Under each Fund’s organizational documents, its officers and directors are indemnified against certain liability arising out of the performance of their duties to each Fund. In addition, certain of each Fund’s contracts with its service providers contain general indemnification clauses. Each Fund’s maximum exposure under these arrangements is unknown since the amount of any future claims that may be made against each Fund cannot be determined and each Fund has no historical basis for predicting the likelihood of any such claims.
NOTES TO FINANCIAL STATEMENTS
Year or Period Ended June 30, 2015 (Continued)
| (3) | Investment Security Transactions |
The cost of purchases and proceeds from sales and maturities of investment securities, other than short-term securities, for the year ended June 30, 2015, were as follows:
| | | | | | | | | | |
| | | Purchases | | Proceeds | |
| | | | |
| | | U.S. Government | | Other | | U.S. Government | | Other | |
Balanced | | $2,754,731 | | $11,653,148 | | $1,740,291 | | | $6,594,737 | |
Dividend Growth | | — | | 625,157,743 | | — | | | 756,432,484 | |
Global Dividend Growth | | — | | 19,370,784 | | — | | | 19,524,288 | |
Large Cap Growth | | — | | 40,522,707 | | — | | | 101,964,410 | |
Mid Cap Growth | | — | | 40,491,860 | | — | | | 65,157,861 | |
Small Cap Dividend Growth | | — | | 5,885,081 | | — | | | 103,897 | |
Small Cap Growth | | — | | 30,493,757 | | — | | | 36,278,376 | |
International Growth | | — | | 12,578,007 | | — | | | 13,703,382 | |
Developing Markets Growth | | — | | 2,121,740 | | — | | | 2,900,466 | |
| (4) | Affiliated Fees and Transactions |
Investment Adviser
The Funds each have entered into an investment management agreement with Sit Investment Associates, Inc. (SIA), under which SIA manages the Funds’ assets and provides research, statistical and advisory services, and pays related office rental, executive expenses and executive salaries. The current fee for investment management and advisory services is based on the average daily net assets of the Funds at the annual rate of:
| | | | | | | | |
Balanced | | | 1.00 | % | | | | |
Dividend Growth Fund Class I and Class S | | | 1.00 | % | | | | |
Global Dividend Growth Fund Class I and Class S | | | 1.25 | % | | | | |
Large Cap Growth | | | 1.00 | % | | | | |
Mid Cap Growth | | | 1.25 | % | | | | |
Small Cap Dividend Growth Class I and Class S | | | 1.25 | % | | | | |
Small Cap Growth | | | 1.50 | % | | | | |
International Growth | | | 1.50 | % | | | | |
Developing Markets Growth | | | 2.00 | % | | | | |
SIA is obligated to pay all of the Funds’ expenses (excluding extraordinary expenses, stock transfer taxes, interest, brokerage commissions, 12b-1 fees and other transaction charges relating to investing activities).
In addition to the annual management fees, the Class S shares of Global Dividend Growth, Dividend Growth and Small Cap Dividend Growth Funds also have a 0.25% annual distribution (12b-1) fee, which is used to pay for distribution fees related to the sale and distribution of its shares.
| | |
| | |
72 | | SIT MUTUAL FUNDS ANNUAL REPORT |
Transactions with affiliates
The investment adviser, affiliates of the investment adviser, directors and officers of the Funds as a whole owned the following shares as of June 30, 2015:
| | | | | | | | | | | | |
| | | | | | % Shares |
| | | Shares | | | Outstanding |
Balanced | | | 234,840 | | | | 22.0 | | | | | |
Dividend Growth | | | 995,355 | | | | 1.7 | | | | | |
Global Dividend Growth | | | 660,992 | | | | 39.3 | | | | | |
Large Cap Growth | | | 449,123 | | | | 14.6 | | | | | |
Mid Cap Growth | | | 3,351,462 | | | | 39.4 | | | | | |
Small Cap Dividend Growth | | | 494,407 | �� | | | 82.9 | | | | | |
Small Cap Growth | | | 856,108 | | | | 49.6 | | | | | |
International Growth | | | 747,791 | | | | 56.3 | | | | | |
Developing Markets Growth | | | 254,520 | | | | 40.9 | | | | | |
| (5) | Capital Share Activity |
Short-Term Trading (Redemption) Fees
The Funds (except Balanced) charge a redemption fee equal to 2.00% of the proceeds on shares held for less than 30 calendar days. The fee is retained by the Fund for the benefit of its long-term shareholders and accounted for as an addition to paid in capital. For the year ended June 30, 2015, the Funds received the following redemption fees:
| | | | | | | | | | |
| | | Class I | | | Class S | | | |
Dividend Growth | | | $961 | | | | $2,643 | | | |
Large Cap Growth | | | 915 | | | | — | | | |
Mid Cap Growth | | | 2 | | | | — | | | |
Small Cap Growth | | | 195 | | | | — | | | |
Management has evaluated the impact of all subsequent events on the Funds through the date the financial statements were issued, and has determined that there were no subsequent events that would require disclosure in or adjustments to the financial statements.
REPORT OF INDEPENDENT REGISTERED PUBLIC ACCOUNTING FIRM
The Board of Directors and Shareholders:
Sit Mutual Funds, Inc.
Sit Large Cap Growth Fund, Inc.
Sit Mid Cap Growth Fund, Inc.
We have audited the accompanying statements of assets and liabilities of Sit Balanced Fund, Sit Dividend Growth Fund, Sit Global Dividend Growth Fund, Sit Small Cap Dividend Growth Fund, Sit Small Cap Growth Fund, Sit International Growth Fund, Sit Developing Markets Growth Fund (each a series of Sit Mutual Funds, Inc.), Sit Large Cap Growth Fund, Inc., and Sit Mid Cap Growth Fund, Inc. (collectively, the Funds), including the schedules of investments, as of June 30, 2015, and the related statements of operations for the year then ended (period from March 31, 2015, commencement of operations, to June 30, 2015 for Sit Small Cap Dividend Growth Fund), the statements of changes in net assets for each of the years in the two-year period then ended (period from March 31, 2015 to June 30, 2015 for Sit Small Cap Dividend Growth Fund), and the financial highlights for each of the years in the five-year period then ended (period from March 31, 2015 to June 30, 2015 for Sit Small Cap Dividend Growth Fund). These financial statements and financial highlights are the responsibility of the Funds’ management. Our responsibility is to express an opinion on these financial statements and financial highlights based on our audits.
We conducted our audits in accordance with the standards of the Public Company Accounting Oversight Board (United States). Those standards require that we plan and perform the audits to obtain reasonable assurance about whether the financial statements and financial highlights are free of material misstatement. An audit includes examining, on a test basis, evidence supporting the amounts and disclosures in the financial statements. Our procedures included confirmation of securities owned as of June 30, 2015, by correspondence with custodians and brokers or by performing other appropriate auditing procedures. An audit also includes assessing the accounting principles used and significant estimates made by management, as well as evaluating the overall financial statement presentation. We believe that our audits provide a reasonable basis for our opinion.
In our opinion, the financial statements and financial highlights referred to above present fairly, in all material respects, the financial position of Sit Balanced Fund, Sit Dividend Growth Fund, Sit Global Dividend Growth Fund, Sit Small Cap Divided Growth Fund, Sit Small Cap Growth Fund, Sit International Growth Fund, Sit Developing Markets Growth Fund, Sit Large Cap Growth Fund, and Sit Mid Cap Growth Fund as of June 30, 2015, and the results of their operations, the changes in their net assets, and the financial highlights for the periods stated in the first paragraph above, in conformity with U.S. generally accepted accounting principles.
KPMG LLP
Minneapolis, Minnesota
August 19, 2015
| | |
| | |
74 | | SIT MUTUAL FUNDS ANNUAL REPORT |
EXPENSE EXAMPLE (Unaudited)
As a shareholder of the Funds, you incur two types of costs: (1) transaction costs, including redemption fees and (2) ongoing costs, including management fees; and other Fund expenses. This Example is intended to help you understand your ongoing costs (in dollars) of investing in the Funds and to compare these costs with the ongoing costs of investing in other mutual funds.
The Example is based on an investment of $1,000 invested at the beginning of the period and held for the entire period January 1, 2015 to June 30, 2015.
Actual Expenses
The first line of the following table provides information about actual account values and actual expenses. You may use the information in this line, together with the amount you invested, to estimate the expenses that you paid over the period. Simply divide your account value by $1,000 (for example, an $8,600 account value divided by $1,000 = 8.6), then multiply the result by the number in the first line under the heading entitled “Expenses Paid During Period” to estimate the expenses you paid on your account during this period.
Hypothetical Example for Comparison Purposes
The second line of the table provides information about hypothetical account values and hypothetical expenses based on the Fund’s actual expense ratio and an assumed rate of return of 5% per year before expenses, which is not the Fund’s actual return. The hypothetical account values and expenses may not be used to estimate the actual ending account balance or expenses you paid for the period. You may use this information to compare the ongoing costs of investing in the Fund and other funds. To do so, compare this 5% hypothetical example with the 5% hypothetical examples that appear in the shareholder reports of the other funds.
Please note that the expenses shown in the table are meant to highlight your ongoing costs only and do not reflect any transactional costs, such as redemption fees. Therefore, the second line of the table is useful in comparing ongoing costs only, and will not help you determine the relative total costs of owning different funds. In addition, if these transactional costs (redemption fees) were included, your costs would have been higher.
| | | | | | | | | | | | | | | |
| Fund | | Beginning
Account Value
(1/1/15) | | Ending
Account
Value
(6/30/15) | | Expenses
Paid During
Period
(1/1/15-
6/30/15) |
Balanced Fund* |
| | | | | | | | | | | | | | |
Actual | | | | $1,000 | | | | | $1,019.60 | | | $5.01 |
Hypothetical | | | | $1,000 | | | | | $1,019.84 | | | $5.01 |
| | | | | | | | | | | | | | | |
| | | | | | | | | | | | | | |
Dividend Growth Fund* |
| | | | | | | | | | | | | | |
Actual | | | | | | | | | | | | |
Class I | | | | $1,000 | | | | | $1,007.60 | | | $4.98 |
Class S | | | | $1,000 | | | | | $1,006.40 | | | $6.22 |
Hypothetical | | | | | | | | | | | | |
Class I | | | | $1,000 | | | | | $1,019.84 | | | $5.01 |
Class S | | | | $1,000 | | | | | $1,018.60 | | | $6.26 |
| | | | | | | | | | | | | | | |
| | | | | | | | | | | | | | |
Global Dividend Growth Fund* |
| | | | | | | | | | | | | | |
Actual | | | | | | | | | | | | |
Class I | | | | $1,000 | | | | | $1,021.00 | | | $6.26 |
Class S | | | | $1,000 | | | | | $1,019.80 | | | $7.51 |
Hypothetical | | | | | | | | | | | | |
Class I | | | | $1,000 | | | | | $1,018.60 | | | $6.26 |
Class S | | | | $1,000 | | | | | $1,017.36 | | | $7.50 |
| | | | | | | | | | | | | | | |
| | | | | | | | | | | | | | |
Large Cap Growth Fund* |
| | | | | | | | | | | | | | |
Actual | | | | $1,000 | | | | | $1,037.40 | | | $5.05 |
Hypothetical | | | | $1,000 | | | | | $1,019.84 | | | $5.01 |
| | | | | | | | | | | | | | | |
| | | | | | | | | | | | | | |
Mid Cap Growth Fund* |
| | | | | | | | | | | | | | |
Actual | | | | $1,000 | | | | | $1,059.20 | | | $6.38 |
Hypothetical | | | | $1,000 | | | | | $1,018.60 | | | $6.26 |
| | | | | | | | | | | | | | | |
| | | | | | | | | | | | | | |
Small Cap Dividend Growth Fund** |
| | | | | | | | | | | | | | |
Actual | | | | | | | | | | | | |
Class I | | | | $1,000 | | | | | $996.00 | | | $3.11 |
Class S | | | | $1,000 | | | | | $996.00 | | | $3.73 |
Hypothetical | | | | | | | | | | | | |
Class I | | | | $1,000 | | | | | $1,018.60 | | | $3.15 |
Class S | | | | $1,000 | | | | | $1,017.36 | | | $3.77 |
| | | | | | | | | | | | | | | |
| | | | | | | | | | | | | | |
Small Cap Growth Fund* |
| | | | | | | | | | | | | | |
Actual | | | | $1,000 | | | | | $1,083.50 | | | $7.75 |
Hypothetical | | | | $1,000 | | | | | $1,017.36 | | | $7.50 |
| | | | | | | | | | | | | | | |
| | | | | | | | | | | | | | |
International Growth Fund* |
| | | | | | | | | | | | | | |
Actual | | | | $1,000 | | | | | $1,090.20 | | | $7.77 |
Hypothetical | | | | $1,000 | | | | | $1,017.36 | | | $7.50 |
EXPENSE EXAMPLE (Unaudited) (Continued)
| | | | | | | | | | |
| Fund | | Beginning
Account
Value
(1/1/15) | | | Ending
Account
Value
(6/30/15) | | | Expenses
Paid During
Period
(1/1/15-
6/30/15) |
Developing Markets Growth Fund* |
Actual | | | $1,000 | | | | $1,022.10 | | | $10.03 |
Hypothetical | | | $1,000 | | | | $1,014.88 | | | $9.99 |
*Expenses are equal to the Fund’s annualized expense ratio of 1.00%, for the Balanced, Dividend Growth, Class I and Large Cap Growth Funds; 1.25% for Dividend Growth Fund, Class S, Global Dividend Growth, Class I, and Mid Cap Growth Funds; 1.50% for Global Dividend Growth, Class S, Small Cap Growth and International Growth Funds; and 2.00% for Developing Markets Growth Fund, multiplied by the average account value over the period, multiplied by 181/365 (to reflect the one-half year period.)
**Expenses are equal to the Small Cap Dividend Growth Fund’s annual expense ratio of 1.25% for Class I and 1.50% for Class S, multiplied by the average account value over the period, multiplied by 91/365 (to reflect the one-quarter year period.)
| | |
| | |
76 | | SIT MUTUAL FUNDS ANNUAL REPORT |
FEDERAL TAX INFORMATION (Unaudited)
Sit Equity Funds
For corporate shareholders, the percentage of investment income (dividend income and short-term gains, if any), for each of the Funds that qualify for the Dividends Received Deductions for the period of July 1, 2014 to June 30, 2015 is as follows:
| | | | | | |
| Fund | | Percentage |
Balanced Fund | | | 58.9 | % | | |
Dividend Growth Fund | | | 100.0 | | | |
Global Dividend Growth Fund | | | 83.3 | | | |
Large Cap Growth Fund | | | 100.0 | | | |
Mid Cap Growth Fund | | | — | | | |
Small Cap Dividend Growth Fund | | | — | | | |
Small Cap Growth Fund | | | — | | | |
International Growth Fund | | | 24.9 | | | |
Developing Markets Growth Fund | | | — | | | |
For the year ended June 30, 2015, certain dividends paid by the Funds may be subject to a maximum tax rate of 15%, as provided by the Jobs and Growth Tax Relief Reconciliation Act of 2003. Of the distributions made by the following Funds, the corresponding percentages represent the amount of each distribution which may qualify for the 15% dividend income tax rate.
| | | | | | |
| Fund | | Percentage |
Balanced Fund | | | 63.7 | % | | |
Dividend Growth Fund | | | 100.0 | | | |
Global Dividend Growth Fund | | | 100.0 | | | |
Large Cap Growth Fund | | | 100.0 | | | |
Mid Cap Growth Fund | | | — | | | |
Small Cap Dividend Growth Fund | | | — | | | |
Small Cap Growth Fund | | | — | | | |
International Growth Fund | | | 100.0 | | | |
Developing Markets Growth Fund | | | — | | | |
The following Funds designated the listed amounts as long-term capital gain dividends during the year ended June 30, 2015. Distributable long-term gains are based on net realized long term gains determined on a tax basis and may differ from such amounts for financial reporting purposes.
| | | | |
| Fund | | Amount | |
Balanced Fund | | | $886,962 | |
Dividend Growth Fund | | | 124,684,096 | |
Global Dividend Growth Fund | | | 2,427,917 | |
Large Cap Growth Fund | | | 34,027,697 | |
Mid Cap Growth Fund | | | 24,465,356 | |
Small Cap Dividend Growth Fund | | | 662 | |
Small Cap Growth Fund | | | 11,269,192 | |
International Growth Fund | | | 1,194,589 | |
Developing Markets Growth Fund | | | 795,509 | |
INFORMATION ABOUT DIRECTORS AND OFFICERS (Unaudited)
The Sit Mutual Funds are a family of no-load mutual funds. The Stock Funds described in this Annual Report are the Sit Mid Cap Growth Fund, Sit Large Cap Growth Fund, Sit International Growth Fund, Sit Balanced Fund, Sit Developing Markets Growth Fund, Sit Small Cap Growth Fund, Sit Dividend Growth Fund, Sit Global Dividend Growth Fund, and the Sit Small Cap Dividend Growth Fund (the “Funds” or individually, a “Fund”). The bond funds within the Sit Mutual Fund family are described in a separate Bond Funds’ Annual Report. The Sit Mid Cap Growth Fund and Sit Large Cap Growth Fund, and the corporate issuer of the Sit International Growth Fund, Sit Balanced Fund, Sit Developing Markets Growth Fund, Sit Small Cap Growth Fund, Sit Dividend Growth Fund, Sit Global Dividend Growth Fund, and Sit Small Cap Dividend Growth Fund have a Board of Directors and officers. Pursuant to Minnesota law, the Boards of Directors are responsible for the management of the Funds and the establishment of the Funds’ policies. The officers of the Funds manage the day-to-day operation of the Funds. Information pertaining to the directors and officers of the Funds is set forth below. The business address, unless otherwise noted below, is that of the Funds’ investment adviser – 3300 IDS Center, 80 South Eighth Street, Minneapolis, Minnesota 55402. The Boards have a separate Audit Committee. The Stock Funds’ SAI has additional information about the Funds’ directors and is available without charge upon request by calling the Sit Funds at 800-332-5580.
| | | | | | | | |
Name, Age, and Position with Funds | | Term of Office (1) and Length of Time Served | | Principal Occupations During
Past Five Years | | Number of Funds
Overseen in
Fund Complex | | Other Directorships
Held by Director (3) |
INTERESTED DIRECTORS: |
Roger J. Sit (2) Age: 53 Chairman and President | | Chairman since 10/08; Officer since 1998. | | Chairman, President, CEO and Global CIO of Sit Investment Associates, Inc. (the “Adviser”); Chairman and CEO of Sit Investment Fixed Income Advisors, Inc. (“SF”); Chairman of SIA Securities Corp. (the “Distributor”). | | 13 | | TCF Financial Corporation. |
INDEPENDENT DIRECTORS: |
Edward M. Giles Age: 79 Director | | Director since 2012 or the Fund’s inception, if later. | | Senior Vice President of Peter B. Cannell & Co., July 2011 to present; Managing Member of GME Capital, 2005 to 2011; Advisory Director of Sit Investment Associates, Inc. January 2008 to December 2011. | | 13 | | None. |
Sidney L. Jones Age: 81 Director | | Director since 1988 to 1989 and since 1993 or the Fund’s inception if later. | | Lecturer, Washington Campus Consortium of 17 Universities. | | 13 | | None. |
Bruce C. Lueck Age: 74 Director | | Director since 2004 or the Fund’s inception, if later. | | Consultant for Zephyr Management, L.P. (investment management) and committee member of several investment funds and foundations. | | 13 | | None. |
Donald W. Phillips Age: 67 Director | | Director of the International Fund since 1993, and since 1990 or the Fund’s inception, if later for all other Funds. | | Chairman and CEO of WP Global Partners Inc., July 2005 to present; Partner of Ranieri Partners, 2007 to present. | | 13 | | None. |
Barry N. Winslow Age: 67 Director | | Director since 2010 or the Fund’s inception, if later. | | Vice-Chairman of TCF Financial Corporation, July 2008 to July 2014. | | 13 | | TCF Financial Corporation. |
| | |
| | |
78 | | SIT MUTUAL FUNDS ANNUAL REPORT |
| | | | | | | | |
Name, Age, and Position with Funds | | Term of Office (1) and Length of Time Served | | Principal Occupations During Past Five Years | | Number of Funds
Overseen in Fund Complex | | Other Directorships Held by Director (3) |
OFFICERS: | | | | | | | | |
Mark H. Book Age: 52 Vice President – Investments of Balanced Fund only | | Officer since 2002; Re-Elected by the Boards annually. | | Vice President and Portfolio Manager of SF. | | N/A | | N/A |
Kelly K. Boston Age: 46 Assistant Secretary & Assistant Treasurer | | Officer since 2000; Re-Elected by the Boards annually. | | Staff Attorney of the Adviser; Secretary of the Distributor. | | N/A | | N/A |
Bryce A. Doty Age: 48 Vice President - Investments of Balanced Fund only. | | Officer since 1996; Re-Elected by the Boards annually. | | Senior Vice President and Senior Portfolio Manager of SF. | | N/A | | N/A |
Kent L. Johnson Age: 49 Vice President - Investments | | Officer since 2003; Re-Elected by the Boards annually. | | Senior Vice President - Research and Investment Management of the Adviser. | | N/A | | N/A |
Michael J. Radmer 50 S. 6th Street Minneapolis, MN 55402 Age: 70 Secretary | | Officer since 1984; Re-Elected by the Boards annually. | | Partner of the Funds’ general counsel, Dorsey & Whitney, LLP. | | N/A | | N/A |
Paul E. Rasmussen Age: 54 Vice President, Treasurer & Chief Compliance Officer | | Officer since 1994; Re-Elected by the Boards annually. | | Vice President, Secretary, Controller and Chief Compliance Officer of the Adviser; Vice President, Secretary, and Chief Compliance Officer of SF; President and Treasurer of the Distributor. | | N/A | | N/A |
Carla J. Rose Age: 49 Vice President, Assistant Secretary & Assistant Treasurer | | Officer since 2000; Re-Elected by the Boards annually. | | Vice President, Administration & Deputy Controller of the Adviser; Vice President, Controller, Treasurer & Assistant Secretary of SF; Vice President and Assistant Secretary of the Distributor. | | N/A | | N/A |
Robert W. Sit Age: 46 Vice President - Investments | | Officer since 1997; Re-Elected by the Boards annually. | | Vice President - Research and Investment Management of the Adviser. | | N/A | | N/A |
Ronald D. Sit Age: 55 Vice President - Investments | | Officer since 1985; Re-Elected by the Boards annually. | | Vice President - Research and Investment Management of the Adviser. | | N/A | | N/A |
| 1 | Each Director serves until their resignation, removal or the next meeting of the shareholders at which election of directors is an agenda item and his successor is duly elected and shall qualify. |
| 2 | Directors who are deemed to be “interested persons” of the Funds as that term is defined by the Investment Company Act of 1940. Mr. Sit is considered an “interested person” because he is a an officer of Sit Investment Associates, Inc., the Fund’s investment adviser. |
| 3 | Includes only directorships of companies required to report under the Securities Exchange Act of 1934 (i.e., public companies) or other investment companies registered under the 1940 Act. |
ADDITIONAL INFORMATION (Unaudited)
PROXY VOTING
Each fund follows certain policies and procedures for voting proxies for securities held in each portfolio. A description of the Funds’ proxy voting policies and procedures is available without charge upon request by calling the Funds at 1-800-332-5580.
Information regarding how each Fund voted proxies relating to its portfolio securities during the most recent twelve-month period ended June 30 is available without charge upon request by calling the Funds at 1-800-332-5580, and is available on the U.S. Securities and Exchange Commission’s website at www.sec.gov.
AVAILABILITY OF QUARTERLY PORTFOLIO SCHEDULES
The Funds’ file their complete schedules of portfolio holdings with the U.S. Securities and Exchange Commission (SEC) for the first and third quarters of each fiscal year on Form N-Q. The Funds’ Form N-Qs are available without charge upon request by calling the Funds at 1-800-332-5580 and are available on the SEC’s website at www.sec.gov. In addition, the Funds’ Form N-Qs may be reviewed and copied at the SEC’s Public Reference Room in Washington, DC. Information on the operation of the Public Reference Room may be obtained by calling 1-202-551-8090.
| | |
| | |
80 | | SIT MUTUAL FUNDS ANNUAL REPORT |
Item 2: Code of Ethics.
The registrant has adopted a code of ethics that applies to the registrant’s principal executive officer, principal financial officer, principal accounting officer, and persons performing similar functions. The registrant has not made any amendment to its code of ethics during the period covered by this report which must be described herein pursuant to Item 2. The registrant has not granted any waivers from any provisions of the code of ethics during the period covered by this report.
A copy of the registrant’s code of ethics is available without charge upon request by calling the registrant at 612-332-3223 or 1-800-332-5580, or by mail at Sit Mutual Funds, 3300 IDS Center, 80 South Eighth Street, Minneapolis, MN 55402.
Item 3: Audit Committee Financial Expert.
The registrant’s Board of Directors has determined that Mr. Edward M. Giles, Mr. Sidney L. Jones, Mr. Bruce C. Lueck,,Mr. Donald W. Phillips, and Mr. Barry N. Winslow are audit committee financial experts serving on its audit committee. Mr. Giles, Mr. Jones, Mr. Lueck, Mr. Phillips, and Mr. Winslow are independent for purposes of this item.
Item 4: Principal Accountant Fees and Services.
(a) – (d) Aggregate fees billed to the registrant for the last two fiscal years for professional services rendered by the registrant’s principal accountant were as follows:
| | | | | | | | | | | | | | | | |
| | | Audit
Fees (a) | | | Audit
Related
Fees (b) | | | Tax
Fees (c) | | | Other
Fees (d) | |
Fiscal year ended June 30, 2015 | | | 21,400 | | | | 0 | | | | 4,675 | | | | 0 | |
Fiscal year ended June 30, 2014 | | | 20,800 | | | | 0 | | | | 4,425 | | | | 0 | |
Audit fees include amounts related to the audit of the registrant’s annual financial statements and services normally provided by the accountant in connection with statutory and regulatory filings. Audit-related fees include amounts reasonably related to the performance of the audit of the registrant’s financial statements, and/or are traditionally performed by the auditor. Tax fees include amounts related to tax compliance, tax planning, and tax advice. Other Fees include services provided to review the Fund’s order processing and trading procedures.
(e) (1) The Audit Committee is required to pre-approve audit and non-audit services performed for the registrant by the independent auditor in order to assure that the provision of such services does not impair the auditor’s independence. The audit committee also is required to pre-approve certain non-audit services performed by the registrant’s independent auditor for the registrant’s investment adviser and certain of the adviser’s affiliates if the services relate directly to the operations and financial reporting of the registrant. Services to be provided by the auditor must receive general pre-approval or specific pre-approval by the audit committee. Any proposed services exceeding pre-approved cost levels will require separate pre-approval by the audit committee.
The audit committee may delegate pre-approval authority to the audit committee chairman. The chairman shall report any pre-approval decisions to the audit committee at its next scheduled meeting. The audit committee does not delegate its responsibility to pre-approve services performed by the independent auditor to management.
(2) No services included in (b) – (d) were approved pursuant to paragraph (c)(7)(i)(C) of Rule 2-01 of Regulation S-X.
(f) Not applicable.
(g) The aggregate fees billed for the most recent fiscal year and the preceding fiscal year by the registrant’s principal accountant for non-audit services rendered to the registrant, its investment adviser, and any entity controlling, controlled by, or under common control with the investment adviser that provides ongoing services to the registrant were $0 and $0, respectively.
(h) The registrant’s audit committee has determined that the provision of non-audit services rendered to the registrant’s investment adviser, and any entity controlling, controlled by, or under common control with the investment adviser that provides ongoing services to the registrant, that were not pre-approved pursuant to paragraph (c)(7)(ii) of Rule 2-01 of Regulation S-X is considered compatible with maintaining the principal accountant’s independence.
Item 5: Audit Committee of Listed Registrants.
Not applicable to open-end investment companies.
Item 6: Schedule of Investments.
The schedule of investments is included as part of the report to shareholders filed under Item 1 of this Form.
Item 7: Disclosure of Proxy Voting Policies and Procedures for Closed-End Management Investment Companies.
Not applicable to open-end investment companies.
Item 8: Portfolio Managers of Closed-End Management Investments Companies.
Not applicable to open-end investment companies.
Item 9: Purchases of Equity Securities by Closed-End Management Investment Company and Affiliated Purchasers.
Not applicable to open-end investment companies.
Item 10. Submission of Matters to a vote of Security Holders.
There have been no material changes to the procedures by which shareholders may recommend nominees to the registrant’s board of directors.
Item 11: Controls and Procedures -
(a) Based on their evaluation of the Registrant’s Disclosure Controls and Procedures as of a date within 90 days of the Filing Date, the Registrant’s Chairman and Treasurer have determined that the Disclosure Controls and Procedures (as defined in Rule 30a-2(c) under the Act) are designed to ensure that information required to be disclosed by the Registrant is recorded, processed, summarized and reported by the filing Date, and that information required to be disclosed in the report is communicated to the Registrant’s management, as appropriate, to allow timely decisions regarding required disclosure.
(b) There were no significant changes in the Registrant’s internal controls or in other factors that could significantly affect these controls subsequent to the date of their evaluation, and there were no corrective actions with regard to significant deficiencies and material weaknesses.
Item 12: Exhibits:
(a) The following exhibits are attached to this Form N-CSR:
(2) A separate certification for each principal executive and principal financial officer of the registrant as required by Rule 30a-2(a) under the Act (17 CFR 270.30a-2) (certification required by Section 302 of the Sarbanes-Oxley Act of 2002).
(b) Certification required by Rule 30a-2(b) under the Act (certification required by Section 906 of the Sarbanes-Oxley Act of 2002).
SIGNATURES
Pursuant to the requirements of the Securities Exchange Act of 1934 and the Investment Company Act of 1940, the registrant has duly caused this report to be signed on its behalf by the undersigned, thereunto duly authorized.
Sit Large Cap Growth Fund, Inc.
| | | | |
By (Signature and Title)* | | | | /s/ Paul E. Rasmussen |
| | | | Paul E. Rasmussen |
| | | | Vice President, Treasurer |
Date August 28, 2015
Pursuant to the requirements of the Securities Exchange Act of 1934 and the Investment Company Act of 1940, this report has been signed below by the following persons on behalf of the registrant and in the capacities and on the dates indicated.
| | | | |
By (Signature and Title) | | | | /s/ Paul E. Rasmussen |
| | | | Paul E. Rasmussen |
| | | | Vice President, Treasurer |
Date August 28, 2015
| | | | |
By (Signature and Title) | | | | /s/ Roger J. Sit |
| | | | Roger J. Sit |
| | | | Chairman |
Date August 28, 2015