SECURITIES AND EXCHANGE COMMISSION
Washington, D.C. 20549
FORM 10-K
(Mark One)
| x | ANNUAL REPORT PURSUANT TO SECTION 13 OR 15(d) OF THE SECURITIES EXCHANGE ACT OF 1934 |
For the fiscal year ended July 31, 2005
OR
| ¨ | TRANSITION REPORT PURSUANT TO SECTION 13 OR 15(d) OF THE SECURITIES EXCHANGE ACT OF 1934 |
For the transition period from to
Commission File No. 000-10761
LTX Corporation
(Exact name of registrant as specified in its charter)
| | |
| MASSACHUSETTS | | 04-2594045 |
(State or other jurisdiction of Incorporation or organization) | | (I.R.S. Employer Identification No.) |
50 Rosemont Road
Westwood, Massachusetts 02090
(781) 461-1000
(Address, including zip code, and telephone number, including area code, of registrant’s principal executive offices)
Securities registered pursuant to Section 12(b) of the Act:
| | |
Title of each class
| | Name of each exchange on which registered
|
| None | | None |
Securities registered pursuant to Section 12(g) of the Act:
Common Stock, par value $0.05 per share
Indicate by check mark whether the registrant (1) has filed all reports required to be filed by Section 13 or 15(d) of the Securities Exchange Act of 1934 during the preceding 12 months (or for such shorter period that the registrant was required to file such reports) and (2) has been subject to such filing requirements for the past 90 days. Yes x No ¨
Indicate by check mark if disclosure of delinquent filers pursuant to Item 405 of Regulation S-K is not contained herein, and will not be contained, to the best of registrant’s knowledge, in definitive proxy or information statements incorporated by reference in Part III of this Form 10-K or any amendment to this Form 10-K. x
Indicate by check mark whether the registrant is an accelerated filer (as defined in Exchange Act Rule 12b-2). Yes x No ¨
Indicate by check mark whether the registrant is a shell company (as defined in Rule 12b-2 of the Exchange Act.): Yes ¨ No x
The aggregate market value of the Common Stock held by non-affiliates of the registrant on January 31, 2005 was $354,950,551.
Number of shares outstanding of each of the issuer’s classes of Common Stock as of September 29, 2005:
Common Stock, Par Value $0.05 Per Share, 61,536,392 shares.
DOCUMENTS INCORPORATED BY REFERENCE
Portions of the Registrant’s Proxy Statement in connection with its 2005 Annual Meeting of Stockholders to be held on November 10, 2005 are incorporated by reference into Part III of this Form 10-K Report. The Compensation Committee Report, Stock Performance Graph and Audit Committee Report of the Registrant’s Proxy Statement are expressly not incorporated herein by reference.
LTX CORPORATION
INDEX
PART I
Item 1. Business
Introduction
LTX Corporation (“LTX” or the “Company”) designs, manufactures, markets and services semiconductor test solutions. Semiconductor designers and manufacturers worldwide, such as Analog Devices, ASE, Infineon Technologies, National Semiconductor, Philips Semiconductor, STMicroelectronics and Texas Instruments, use semiconductor test equipment to test devices at two different stages during the manufacturing process. These devices are incorporated in a wide range of products, including mobile internet equipment such as wireless access points and interfaces, broadband access products such as cable modems and DSL modems, personal communication products such as cell phones and personal digital assistants, consumer products such as televisions, videogame systems, digital cameras and automobile electronics, and for power management in portable and automotive electronics. We provide test systems, global applications consulting, repair services and operational support to over 100 customers in more than 15 countries. For additional information relating to foreign revenues, refer to Note 9 to the Company’s Consolidated Financial Statements.
We offer our customers the LTX Fusion® platform, which combines our enVision software with our Fusion HFi, Fusion HF, Fusion CX, Fusion DX or Fusion EX configurations. Fusion was the first of a new class of test systems designed to test system-on-a-chip, or SOC, devices in a single test step. With Fusion, we believe we have the leading test system capable of testing a broad range of analog, digital, and mixed signal (a combination of digital and analog) and SOC devices, on a single platform.
LTX focuses its marketing and sales on integrated device manufacturers (IDMs), subcontractors, which perform manufacturing services for the semiconductor industry, foundries, which provide wafer manufacturing capability, and fabless companies, which design integrated circuits but have no manufacturing capability.
LTX Corporation was incorporated in Massachusetts in 1976. Our executive offices are located at 50 Rosemont Road, Westwood, Massachusetts 02090 and our telephone number is 781-461-1000. The terms “LTX” and the “Company” refer to LTX Corporation and its wholly owned subsidiaries unless the context otherwise specified. The Company makes its annual reports on Form 10-K, quarterly reports on Form 10-Q, current reports on Form 8-K and all amendments to those reports available, free of charge, in the Investor Relations section of the Company’s website atwww.ltx.com as soon as reasonably practicable after such material is electronically filed with, or furnished to, the Securities and Exchange Commission.
Industry Overview
The testing of devices is a critical step during the semiconductor production process. Typically, semiconductor companies test each device at two different stages during the manufacturing process to ensure its functional and electrical performance prior to shipment to the device user. These companies use semiconductor testing equipment to first test a device after it has been fabricated but before it has been packaged to eliminate non-functioning parts. Then, after the functioning devices are packaged, they are tested again to determine if they fully meet performance specifications. Testing is an important step in the manufacturing process because it allows devices to be fabricated at both maximum density and performance—a key to the competitiveness of semiconductor manufacturers. Shown below is a schematic depiction of the major steps in the semiconductor fabrication and test process.

Three primary factors ultimately drive demand for semiconductor test equipment:
| | • | | increases in unit production of semiconductor devices; |
1
| | • | | increases in the complexity and performance level of devices used in electronic products; and |
| | • | | the emergence of next generation device technologies. |
In recent years, increases in unit production resulted primarily from the proliferation of the personal computer and growth of the telecommunications industry. We expect that future unit production growth will be augmented by the mobile internet, broadband network access, the increased use of digital signal processing (DSP) devices, and power management applications. These increases in unit production in turn lead to a corresponding increase in the need for test equipment.
Furthermore, demand is increasing worldwide for smaller, more highly integrated electronic products. This has led to ever higher performance and more complex semiconductor devices, which, in turn, results in a corresponding increase in the demand for equally sophisticated test equipment.
Finally, the introduction and adoption of a new generation of end-user products requires the development of next generation device technologies. For example, access to information is migrating from the stand-alone desktop computer, which might be physically linked to a local network, to the seamless, virtual network of the internet, which is accessible from anywhere by a variety of new portable electronic communication products. A critical enabling technology for this network and multimedia convergence is SOC. SOC provides the benefits of lower cost, smaller size and higher performance by combining advanced digital, analog and embedded memory technologies on a single device. These discrete technologies were, until recently, available only on several separate semiconductor devices, each performing a specific function. By integrating these functions on a single device, SOC enables lower cost, smaller size, higher performance, and lower power consumption.
The increases in unit production of devices, the increase in complexity of those devices, and, ultimately, the emergence of new semiconductor device technology have mandated changes in the design, architecture and complexity of such test equipment. Semiconductor device manufacturers must still be able to test the increasing volume and complexity of devices in a reliable, cost-effective, efficient and flexible manner. However, the increased pace of technological change, together with the large capital investments required to achieve economies of scale, are changing the nature and urgency of the challenges faced by device designers and manufacturers.
Designers and manufacturers historically have not been able to use their test floors at peak efficiency because they had to use several separate digital and mixed signal testers to perform all of their required testing. This increases their costs of ownership due to increased training requirements, greater floor space, decreased utilization and slower throughput. Furthermore, manufacturers cannot fully test new SOC designs because their current testing equipment does not include a sufficiently broad range of mixed signal instrumentation. Manufacturers are subject to further increased testing costs if their testing equipment lacks the flexibility and capacity to run parallel tests on multiple devices at one time, or multi-site testing. These problems are exacerbated when volume production of devices increases.
Fusion, the LTX Solution
Our solution is the Fusion test platform. Fusion tests new generations of highly-integrated mixed signal devices, advanced digital devices and SOC devices, which incorporate these technologies. The testing requirements of digital and mixed signal devices are essentially a subset of the testing requirements of SOC devices. The test requirements of all of these semiconductor devices are well within the range of Fusion’s capability. The Fusion single test platform allows our customers to use a single integrated hardware and software system to test all of these devices, rather than the multiple test systems typically required. By using a single testing platform, our customers are able to optimize their asset utilization, thereby increasing their manufacturing flexibility and lowering the overall cost of their testing processes.
Fusion is a unique solution to this test challenge because it provides all of the following:
A single test platform. Historically, device manufacturers used several narrowly focused testers to test their devices, each designed to test only digital, only memory, or only mixed signal devices, leading to productivity loss as device output mix changed. Our Fusion test platform combines our test hardware with our enVison software to provide a flexible, scalable test environment. Fusion integrates the testing of mixed signal, digital and embedded memory functions into a single platform to provide better test performance and lower the cost of ownership for our customers by raising the utilization rates of their test floors. Not only have our customers selected Fusion as part of their SOC strategy, but they are also purchasing Fusion for capacity expansion on all their devices, eliminating the need for separate digital and mixed signal testers.
Scalable performance. Semiconductor devices, depending upon their application, require different levels of instrument performance for testing. For example, complex SOC devices require the advanced digital testing performance, including embedded memory testing, found in traditional high-end VLSI testers, whereas consumer-oriented digital and mixed signal devices typically have less stringent digital test requirements. The Fusion scalable, single platform offers different levels of test capability and tester infrastructure support at different price points, providing our customers with the ability to match test performance exactly to their needs.
2
Multi-site test capability. Multi-site testing, the parallel testing of more than one device (of the same type) on one testing machine at a given time, lowers the overall cost of testing devices by increasing the throughput of each testing machine. We designed Fusion to make multi-site testing easier for the test designer. Earlier generations of testing equipment required test engineers to spend significant amounts of time writing specific software programs to run tests in parallel. Our enVision software allows test engineers to expand single-site testing programs into multi-site testing programs with ease. Fusion’s hardware can be configured with a sufficient number of instruments to perform multi-site testing even on highly complex SOC devices. These features allow our customers to take advantage of the increased throughput offered by multi-site testing without sacrificing their ability to introduce new products to market quickly.
A full range of mixed signal instrumentation. Testing different types of SOC input/output interfaces requires radio frequency (RF), digital signal processing (DSP), power management, time measurement, and other instruments. Fusion provides customers with the broad range of mixed signal instrumentation necessary to test these devices to the customer’s desired specifications. Mixed signal test expertise is in short supply in the industry and one of our strengths in SOC testing is the depth of our mixed signal intellectual property, based on our heritage as a pioneer in this field.
Easy-to-use software for test program development. Our enVision software provides the customer’s test engineer with an expandable library of prepackaged, reusable test program modules and debugging tools, all accessible through an easy-to-use graphical user interface. In most other testers, test engineers can reuse test code only by cutting and pasting lines of program code. enVision encapsulates test techniques into software objects that are added to the library for reuse in subsequent test programs. The test engineer can use these software objects when designing new test programs simply by dragging them with a mouse into the program flow. The ease-of-use of our software accelerates our customers’ development process, which allows them to introduce their semiconductor devices to market more rapidly.
The LTX Business Strategy
LTX’s objective is to be the leading supplier of semiconductor test equipment. Key elements of our strategy include:
Extend our technological lead in single platform testing. We believe that a single test platform solution offers our customers the greatest flexibility in managing the utilization of their test assets, thereby decreasing the cost of test. We intend to continue to focus our resources on a single integrated hardware and software test platform solution by developing options and configurations that will extend Fusion’s reach to address cost-effectively the testing of semiconductor devices across a wider spectrum of performance and complexity. Rather than diluting our resources with a multiple platform strategy, we believe our resources will provide a higher return on investment by focusing on a single test platform for advanced digital, mixed signal, and SOC devices.
Concentrate our sales, applications consulting, and service efforts on key accounts. We recognize that large, diversified semiconductor device manufacturers, commonly referred to as IDMs, large offshore test and assembly companies and certain fabless semiconductor device designers purchase most of the world’s test equipment, and that the level of support we are able to provide to them has a direct impact on future business. We believe that focusing our sales and support resources on these key semiconductor companies is the most efficient way to maximize revenue. Therefore, we have organized our selling, field service, and field applications organizations around these key companies, and located these resources close to their facilities. This has helped us to increase our responsiveness to customers’ needs and develop collaborative relationships that help guide us in developing future applications and system options.
Further improve the flexibility of our business model. In order to focus our resources on the development of Fusion, improve our responsiveness to customer needs, reduce fixed costs and working capital requirements, and manage the cyclicality of our industry more effectively, we have implemented a more flexible business model. With the completion of the transition of our assembly, system integration and testing operations to Jabil Circuit, substantially all of our manufacturing functions have been outsourced to third parties. We augment our focused internal development resources through our Open Platform Program, which was designed to facilitate third party development of instrumentation for our Fusion platform using supported hardware and software interfaces to our Fusion hardware and enVision operating system. We engage contract employees to address periods of peak demand. Through our strategic alliances, we have implemented additional international distribution and sub-contracted repair and support functions. We intend to continue to identify and implement programs which enhance our ability to meet customers’ needs while reducing fixed costs.
3
Fusion Overview
Fusion offers a unique solution for testing the full spectrum of non-memory devices, consisting of SOC, mixed signal, and digital devices. The Fusion test platform provides customers with highly reliable test performance and cost-efficiency in their efforts to accelerate their time-to-market for SOC, mixed signal, and digital devices. The Fusion test platform combines our test station hardware with our enVision software and is available in Fusion HFi, Fusion HF, Fusion CX, Fusion DX and Fusion EX configurations. These configurations depend primarily on the digital complexity of the device to be tested.
enVision
Our enVision software helps customers design device test programs faster and more efficiently by providing a customer’s test engineer with an expandable library of prepackaged, reusable test program modules and debugging tools, all accessible through an easy-to-use graphical user interface. In other testers, test engineers can reuse test code only by cutting and pasting lines of program code. enVision software circumvents much of this laborious process by encapsulating test techniques into software objects that are added to the library for reuse in subsequent test programs. The test engineer can use these software objects when designing new test programs simply by inserting them into the program flow.
Fusion HFi
Our Fusion HFi is one of the most advanced testers available. The Fusion HFi and HF (the predecessor to the HFi) feature up to 1,024 digital pins, mixed signal and RF test instruments, and power management test technology. Before the advent of Fusion HF, semiconductor manufacturers required several narrowly focused testers, designed to test only digital, with or without embedded memory, or only mixed signal devices, but not all three. Since the Fusion HFi scalable, single platform can efficiently test complex devices ranging from mixed signal to digital to SOC, it eliminates the need for mutually exclusive testers. The Fusion HFi test system offers the broadest range of leading-edge test capability in a single platform, including advanced mixed signal, high-speed digital, digital signal processing, RF wireless, embedded memory, power management, and time measurement. This range of instrumentation on a single platform allows semiconductor manufacturers to optimize their asset utilization, thereby increasing their manufacturing flexibility and lowering the overall cost of their testing processes. Fusion’s modular, open architecture has been designed so that it can keep pace with today’s rapid changes in test technology. As new generations of devices require more advanced test capabilities, customers can easily upgrade their Fusion testers to accommodate these requirements. Our Open Platform Program encourages third party development of instrumentation for Fusion to augment our internal development, thereby increasing flexibility and scalability.
Fusion CX, DX and EX
Fusion CX is a high-performance, lower cost Fusion system targeted primarily towards the testing of high-volume mixed signal devices. The mixed signal device technologies tested by Fusion CX are often the precursor to mixed signal technologies that will be incorporated into next generation SOC designs. Because Fusion CX uses the same enVision development software as Fusion HFi, customers are able to upgrade their test capability to Fusion HFi as the complexity of their next generation SOC devices require. Fusion CX features up to 128 digital pins, mixed signal and RF test instruments, and power management test technology. Typical device types tested on Fusion CX include radio frequency/wireless such as 802.11, power management and automotive devices.
Fusion DX extends the reach of Fusion to the desktop, offering complete ATE capabilities and the flexibility to be deployed at any point from design to production. Fusion DX can be integrated into other production equipment, including test systems, probers or handlers without use of additional floor space, and offers a wide range of capabilities, including full-featured digital and a broad line of mixed signal instruments.
Fusion EX offers four times the instrument channels as Fusion CX, enabling a wider range of system configurations Fusion EX uses existing Fusion platform instruments to address the testing needs of advanced consumer digital and baseband communications devices. These instruments contain a smaller number of instrument channels in each card, which allows for small configuration increments. This, combined with Fusion’s universal slot design, produces system configurations with a more efficient cost of ownership than competitive platforms.
Service
Our worldwide service organization is capable of performing installations and all necessary maintenance of test systems sold by us, including routine servicing of components manufactured by third parties. We provide various parts and labor warranties on test systems or options designed and manufactured by us, and warranties on components that have been purchased from other manufacturers and incorporated into our test systems. We also provide training on the maintenance and operation of test systems we sell. Service revenue totaled $31.5 million, or 23.4% of net sales, in fiscal 2005, $38.5 million, or 15.0% of net sales, in fiscal 2004, $32.1 million, or 26.8% of net sales, in fiscal 2003.
4
We offer a wide range of service contracts, which gives our customers the flexibility to select the maintenance program best suited to their needs. Customers may purchase service contracts which extend maintenance beyond the initial warranty provided. Many customers enter into annual or multiple-year service contracts over the life of the equipment. The pricing of contracts is based upon the level of service provided to the customer and the time period of the service contract. We believe that service revenues should be less affected by the cyclical nature of the semiconductor industry than sales of test equipment. We maintain service centers around the world, both directly and through strategic alliances with companies that are located in Singapore, Japan, Korea and California.
Engineering and Product Development
The test equipment market is characterized by rapid technological change and new product introductions, as well as advancing industry standards. Our competitive position will depend upon our ability to successfully enhance the Fusion platform and develop new instrumentation, and to introduce these new products on a timely and cost-effective basis. We devote a significant portion of personnel and financial resources to the continued development of our single platform SOC capabilities, including embedded memory, digital and mixed signal core competencies. We also seek to maintain close relationships with our customers in order to be responsive to their product development and production needs. Our expenditures for engineering and product development were $66.3 million, $67.7 million, and $66.1 million, during fiscal 2005, 2004, and 2003, respectively.
Our engineering strategy is to focus on development of the Fusion single scalable test platform. We believe that our single-platform strategy is a more cost effective method of focusing research and design efforts, because we are able to avoid dilution of our development efforts across multiple product platforms. We also intend to develop our future test systems in an evolutionary manner so that they may be progressively upgraded. Together with our strategic alliances and our Open Platform Program, this approach preserves our customers’ substantial investments in our pre-existing test systems and programs, and, in general, helps us maintain market acceptance for our test systems. We work closely with our customers to define new product features and to identify emerging applications for our products.
Sales and Distribution
We sell our products primarily through a worldwide direct sales organization. Our sales organization is structured around key accounts, with a sales force of 34 people. We use a small number of independent sales representatives and distributors in certain other regions of the world.
Our sales to customers outside the United States are primarily denominated in United States dollars. Sales outside North America were 69%, 66%, and 57%, of total net sales in fiscal 2005, 2004, and 2003, respectively. See Note 9 to the Company’s Consolidated Financial Statements for additional information relating to foreign revenues.
Customers
Our customers include many of the world’s leading semiconductor device manufacturers. In fiscal years 2005, 2004 and 2003, Texas Instruments accounted for 47%, 58%, and 58% of net sales, respectively. Customers that have ordered Fusion products include the following:
| | | | |
Amkor | | Giga Solutions | | Qlogic |
austriamicrosystems | | Infineon Technologies | | Renesas |
Analog Devices | | KYEC | | Samsung |
ASAT | | Maxim Integrated Devices | | Silicon Laboratories |
ASE | | Melexis | | STATS |
Delphi | | National Semiconductor | | STMicroelectronics |
Freescale | | Nordic Semiconductor | | Texas Instruments |
Gennum | | Philips Semiconductor | | UTAC |
| | | | | Vitesse Semiconductor |
Because a relatively small number of semiconductor companies purchase most of the world’s semiconductor test equipment and we have concentrated our sales and support efforts on such key customers, we believe that sales to a limited number of customers will continue to account for a high percentage of net sales for the foreseeable future.
Manufacturing and Supply
We have completed the transition of our final assembly, system integration and testing operations of our Fusion HF, HFi, CX, DX and EX to Jabil Circuit. We outsource certain components and subassemblies to contract manufacturers. We use standard
5
components and prefabricated parts manufactured to our specifications. These components and subassemblies are used to produce testers in configurations specified by our customers. Most of the components for our products are available from a number of different suppliers; however, certain components are purchased from a single supplier or a limited group of suppliers. Although we believe that all single source components currently are available in adequate amounts, we cannot be certain that shortages will not develop in the future. We are dependent on a semiconductor device manufacturer, Maxtech Components, who is a sole source supplier of custom components for our products. We have no written supply agreements with this sole source supplier and purchase our custom components through individual purchase orders. We continuously evaluate sources for our custom components. We cannot assure you that such alternative sources will be qualified or available to us.
Our facilities in Westwood, Massachusetts and San Jose, California perform research and development activities, which include assembly, system integration and testing for prototypes.
Competition
Many other domestic and foreign companies participate in the markets for each of our products and the industry is highly competitive. We compete principally on the basis of performance, cost of test, reliability, customer service, applications support, price and ability to deliver our products on a timely basis. Our competitors in the market for test systems include Advantest, Agilent Technologies, Credence Systems, and Teradyne. These companies have a substantially larger share of our addressable market than we do and most of our other major competitors have greater financial and other resources than we do. Certain of these competitors have a larger installed base of equipment than we do. Each of our major competitors are suppliers of other types of automatic test equipment and also supply products to other markets. We expect our competitors to enhance their current products and they could introduce new products with comparable or better price and performance. In addition, new competitors, including semiconductor manufacturers themselves, may offer new technologies, which may in turn reduce the value of our product lines.
Backlog
At July 31, 2005, our backlog of unfilled orders for all products and services was $78.0 million, compared with $85.7 million at July 31, 2004. Historically, test systems generally ship within twelve months of receipt of a customer’s purchase order. While backlog is calculated on the basis of firm orders, orders may be subject to cancellation or delay by the customer with limited or no penalty. Our backlog at any particular date, therefore, is not necessarily indicative of actual sales which may be generated for any succeeding period. Historically, our backlog levels have fluctuated based upon the ordering patterns of our customers and changes in our manufacturing capacity.
Proprietary Rights
The development of our products is largely based on proprietary information. We rely upon a combination of contract provisions, copyright, trademark and trade secret laws to protect our proprietary rights in products. We also have a policy of seeking U.S. patents on technology considered of particular strategic importance. The earliest expiration date of any of our patents is March 2, 2010. Our other patents have later expiration dates and relate to various technologies, including technology relating to the Fusion system and pin electronics. Although we believe that the copyrights, trademarks and patents we own are of value, we believe that they will not determine our success, which depends principally upon our engineering applications, manufacturing, marketing and service skills. However, we intend to protect our rights when, in our view, these rights are infringed upon.
The use of patents to protect hardware and software has increased in the test equipment industry. We have at times been notified of claims that we may be infringing patents issued to others. Although there are no pending actions against us regarding any patents, no assurance can be given that infringement claims by third parties will not negatively impact our business and results of operations. As to any claims asserted against us, we may seek or be required to obtain a license under the third party’s intellectual property rights. There can be no assurance, however, that a license will be available under reasonable terms or at all. In addition, we could decide to resort to litigation to challenge such claims or a third party could resort to litigation to enforce such claims. Such litigation could be expensive and time consuming and could negatively impact our business and results of operations.
Employees
At July 31, 2005, we employed 473 employees and 26 temporary workers. None of our employees are represented by a labor union, and we have experienced no work stoppages. Many of our employees are highly skilled, and we believe our future success will depend in large part on our ability to attract and retain these employees. We consider relations with our employees to be good.
Environmental Affairs
Our manufacturing facilities are subject to numerous laws and regulations designed to protect the environment. We do not anticipate that compliance with these laws and regulations will have a material effect on our capital expenditures, earnings or competitive position.
6
Item 2. Properties
All of our facilities are leased. We have achieved worldwide ISO 9001:2000 certification at our facilities. We maintain our headquarters in Westwood, Massachusetts, where corporate administration, sales and customer support, research and development are located in a 167,500 square foot facility under a lease, which expires in 2009. We also maintain an additional facility in a 71,000 square foot building in San Jose, California. Our lease of this facility expires in 2007. We also lease sales and customer support offices at various locations in the United States totaling approximately 21,000 square feet. We have a total of five leased properties in the United States, four in Asia and six in Europe.
As part of the acquisition of StepTech, Inc., we assumed leases on manufacturing and development facilities totaling 18,000 square feet in Hopkinton, Massachusetts. One facility of 6,000 square feet expired in March 2004, leaving a total of 12,000 square feet remaining under the assumed StepTech leases. The entire 12,000 square feet is vacant as of July 31, 2005.
Our European headquarters is located in Woking, United Kingdom and our Asian headquarters is located in Singapore. We also maintain sales and support offices at other locations in Europe and in Asia. Office space leased in Asia and Europe totals approximately 81,000 square feet.
We believe that our existing facilities are adequate to meet our current and foreseeable future requirements.
Item 3. Legal Proceedings
We have no material pending legal proceedings.
Item 4. Submission of Matters to a Vote of Security Holders
There were no matters submitted to a vote of stockholders during the fourth quarter of fiscal 2005.
7
PART II
Item 5. Market for Registrant’s Common Equity, Related Stock Holder Matters and Issuer Purchases of Equity Securities
Our common stock is quoted on the Nasdaq National Market under the symbol “LTXX”. The following table shows the high and low closing sale prices per share of our common stock, as reported on the Nasdaq National Market, for the periods indicated:
| | | | | | |
Period
| | High
| | Low
|
Fiscal Year Ended July 31, 2005 | | | | | | |
First Quarter | | $ | 7.97 | | $ | 4.99 |
Second Quarter | | | 8.09 | | | 5.47 |
Third Quarter | | | 6.66 | | | 3.53 |
Fourth Quarter | | | 6.01 | | | 3.81 |
Fiscal Year Ended July 31, 2004 | | | | | | |
First Quarter | | $ | 15.89 | | $ | 8.86 |
Second Quarter | | | 19.83 | | | 13.74 |
Third Quarter | | | 17.26 | | | 10.97 |
Fourth Quarter | | | 11.67 | | | 7.49 |
We have never declared or paid any dividends on our common stock. We currently intend to retain future earnings to fund the development and growth of our business and, therefore, we do not anticipate paying any cash dividends in the foreseeable future. In addition, our credit agreement with a bank contains certain covenants that prohibit us from paying cash dividends.
As of September 1, 2005, we had approximately 944 stockholders of record of our common stock.
Compensation Plans
The following table shows information relating to the Company’s compensation plans as of July 31, 2005:
| | | | | | | | |
| | | Equity Compensation Plan Information
| |
Plan Category
| | Number of securities
to be issued upon
exercise of
outstanding options,
warrants and rights
| | Weighted average
exercise price of
outstanding options,
warrants and rights
| | Number of securities remaining
available for future issuance
under equity compensation
plans (excluding securities in
first column)
| |
Equity compensation plans approved by security holders | | 10,657,434 | | $ | 10.46 | | 3,968,086 | * |
Equity compensation plans not approved by security holders | | 0 | | | 0 | | 0 | |
| | |
| |
|
| |
|
|
Total | | 10,657,434 | | $ | 10.46 | | 3,968,086 | * |
| | |
| |
|
| |
|
|
| * | Includes 761,654 shares available for issuance under an employee stock purchase plan which is intended to qualify as such under Section 423 of the Internal Revenue Code. |
This table excludes an aggregate of 65,571 shares issuable upon exercise of outstanding options assumed by the Company in connection with the StepTech acquisition. The weighted average exercise price of the excluded options is $0.8730.
8
Item 6. Selected Financial Data
The following table contains our selected consolidated financial data and is qualified by the more detailed consolidated financial statements and notes thereto included elsewhere in this report. The selected consolidated financial data for and as of the end of each of the five fiscal years in the period ended July 31, 2005 are derived from our audited consolidated financial statements.
| | | | | | | | | | | | | | | | | | | | |
| | | Fiscal Years ended July 31,
| |
| | | 2005
| | | 2004
| | | 2003
| | | 2002
| | | 2001
| |
| | | (in thousands, except per share data and statistics) | |
Consolidated Statement of Operations Data: | | | | | | | | | | | | | | | | | | | | |
Net sales | | $ | 134,531 | | | $ | 255,801 | | | $ | 119,449 | | | $ | 121,273 | | | $ | 330,030 | |
Cost of sales | | | 90,806 | | | | 154,672 | | | | 97,368 | | | | 96,006 | | | | 177,034 | |
Inventory related provision (b) | | | 47,457 | | | | — | | | | 48,483 | | | | 42,200 | | | | 12,800 | |
Engineering and product development expenses | | | 66,302 | | | | 67,655 | | | | 66,088 | | | | 71,102 | | | | 65,987 | |
Selling, general and administrative expenses | | | 29,366 | | | | 28,037 | | | | 27,321 | | | | 28,337 | | | | 37,029 | |
In-process research and development (c) | | | — | | | | — | | | | 16,100 | | | | — | | | | — | |
Reorganization costs (b) | | | 31,726 | | | | — | | | | 6,696 | | | | — | | | | 1,200 | |
| | |
|
|
| |
|
|
| |
|
|
| |
|
|
| |
|
|
|
Income (loss) from operations | | | (131,126 | ) | | | 5,437 | | | | (142,607 | ) | | | (116,372 | ) | | | 35,980 | |
Other (expense) income | | | (1,600 | ) | | | (3,476 | ) | | | (2,461 | ) | | | 215 | | | | 7,894 | |
Provision (benefit) for income taxes | | | — | | | | — | | | | — | | | | 33,723 | | | | 13,163 | |
| | |
|
|
| |
|
|
| |
|
|
| |
|
|
| |
|
|
|
Net income (loss) before cumulative effect of change in accounting principle | | | (132,726 | ) | | | 1,961 | | | | (145,068 | ) | | | (149,880 | ) | | | 30,711 | |
Cumulative effect of change in accounting principle, net of applicable tax (a) | | | — | | | | — | | | | — | | | | — | | | | 9,566 | |
| | |
|
|
| |
|
|
| |
|
|
| |
|
|
| |
|
|
|
Net income (loss) | | $ | (132,726 | ) | | $ | 1,961 | | | $ | (145,068 | ) | | $ | (149,880 | ) | | $ | 21,145 | |
| | |
|
|
| |
|
|
| |
|
|
| |
|
|
| |
|
|
|
Net income (loss) per share: | | | | | | | | | | | | | | | | | | | | |
Basic | | $ | (2.17 | ) | | $ | 0.04 | | | $ | (2.92 | ) | | $ | (3.08 | ) | | $ | 0.44 | |
Diluted | | $ | (2.17 | ) | | $ | 0.03 | | | $ | (2.92 | ) | | $ | (3.08 | ) | | $ | 0.43 | |
Weighted-average common shares used in computing net income (loss) per shares: | | | | | | | | | | | | | | | | | | | | |
Basic | | | 61,144 | | | | 55,927 | | | | 49,614 | | | | 48,693 | | | | 47,782 | |
Diluted | | | 61,144 | | | | 58,057 | | | | 49,614 | | | | 48,693 | | | | 49,634 | |
Consolidated Balance Sheet Data: | | | | | | | | | | | | | | | | | | | | |
Working capital | | $ | 183,013 | | | $ | 292,906 | | | $ | 155,905 | | | $ | 285,418 | | | $ | 260,580 | |
Property and equipment, net | | | 47,135 | | | | 71,329 | | | | 73,443 | | | | 76,171 | | | | 66,739 | |
Total assets | | | 316,392 | | | | 459,564 | | | | 324,896 | | | | 463,989 | | | | 483,039 | |
Total debt | | | 148,293 | | | | 150,321 | | | | 170,785 | | | | 168,222 | | | | 24,177 | |
Stockholders’ equity | | | 102,848 | | | | 234,254 | | | | 99,088 | | | | 225,533 | | | | 369,269 | |
Other Information (unaudited): | | | | | | | | | | | | | | | | | | | | |
Current ratio | | | 3.78 | | | | 4.89 | | | | 3.06 | | | | 4.27 | | | | 3.42 | |
Asset turnover | | | .43 | | | | 0.56 | | | | 0.37 | | | | 0.26 | | | | 0.68 | |
Debt as a percentage of total capitalization | | | 59.0 | % | | | 39.1 | % | | | 63.3 | % | | | 42.7 | % | | | 6.1 | % |
Additions to property and equipment (net) | | $ | 11,616 | | | $ | 17,496 | | | $ | 17,506 | | | $ | 26,460 | | | $ | 47,333 | |
Depreciation and amortization | | | 18,494 | | | | 18,699 | | | | 16,896 | | | | 17,025 | | | | 14,139 | |
| (a) | Effective August 1, 2000, the Company adopted Staff Accounting Bulletin No. 101, “Revenue Recognition in Financial Statements” (“SAB 101”), as amended. The Company has no proforma data for fiscal years prior to 2001 as the amounts are not readily determinable based on the nature of the revenue adjustments required by SAB 101. |
| (b) | See Note 11 to the Consolidated Financial Statements. |
| (c) | See Note 2 to the Consolidated Financial Statements. |
9
Item 7. Management’s Discussion and Analysis of Financial Condition and Results of Operations
The following discussion should be read together with the Consolidated Financial Statements and Notes thereto appearing elsewhere in this annual report on Form 10-K. This report contains forward-looking statements that involve risks and uncertainties. Actual results may differ materially from those indicated in such forward-looking statements. See “Business Risks”.
Overview
We design, manufacture, market and service semiconductor test solutions worldwide to leading companies in the semiconductor industry. Our Fusion semiconductor test equipment can test a broad range of analog, digital, mixed signal (a combination of analog and digital) and system-on-a-chip, or SOC, semiconductor devices, all on a single test platform.
LTX focuses its marketing and sales on integrated device manufacturers (IDMs), subcontractors, which perform manufacturing services for the semiconductor industry, foundries, which provide wafer manufacturing capability, and fabless companies, which design integrated circuits but have no manufacturing capability.
Industry Conditions and Outlook
We sell capital equipment and services to companies that design, manufacture, assemble or test semiconductor devices. The semiconductor industry is highly cyclical, causing in turn a cyclical impact on our financial results. As a capital equipment provider, our revenue is driven by the capital expenditure budgets and spending patterns of our customers, who often delay or accelerate purchases in reaction to variations in their business. The level of capital expenditures by these semiconductor companies depends on the current and anticipated market demand for semiconductor devices and the products that incorporate them. Therefore, demand for our semiconductor test equipment is dependent on growth in the semiconductor industry. In particular, three primary characteristics of the semiconductor industry drive the demand for semiconductor test equipment:
| | • | | increases in unit production of semiconductor devices; |
| | • | | increases in the complexity of semiconductor devices used in electronic products; and |
| | • | | the emergence of next generation device technologies, such as SOC. |
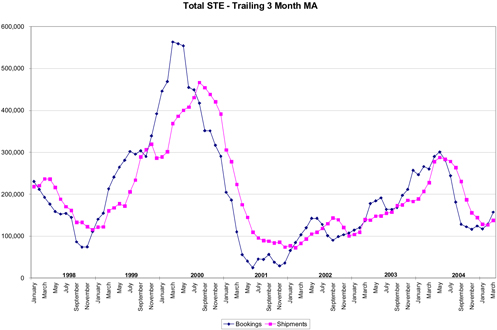
The semiconductor industry is highly cyclical, causing in turn a cyclical impact on our financial results. Our operating results were negatively impacted by a severe industry-wide slowdown in the semiconductor industry, which began to affect the semiconductor test industry in fiscal 2001 and continued through our fiscal year ended July 31, 2003. However the industry entered a period of growth during our fiscal year ended July 31, 2004 and the Company’s quarterly revenues increased sequentially each quarter during the fiscal year 2004. The period of growth was short and we experienced a sharp decline in orders in the first quarter of fiscal year 2005, which continued into our second fiscal quarter. Although the Company experienced improved order levels in our third and fourth fiscal quarters, it is unclear whether we are entering into another period of growth. The following graph shows the cyclicality in semiconductor test equipment orders and shipments from fiscal 1997 through March 2005 (using the three month moving average), as calculated by SEMI, an industry trade organization:
10
Consistent with our business strategy, we have continued to invest significant amounts in engineering and product development to develop and enhance our Fusion platform during industry slowdowns. In fiscal 2005, engineering and product development expense was $66.3 million, or 49.3% of net sales, as compared to $67.7 million, or 26.4% of net sales, in fiscal 2004. Our engineering and development expense decreased sequentially on a quarterly basis during fiscal 2005 as second generation Fusion product development projects were completed. Engineering and development expense for the first quarter of fiscal 2005 was $17.7 million compared to $14.3 million in our fourth fiscal quarter. The decrease in quarterly expenditure was a result of completion of second generation Fusion product development projects for Fusion HFi, CX and EX. We believe that our competitive advantage in the semiconductor test industry is primarily driven by the ability of our Fusion platform to meet or exceed the highest technical specifications required for the testing of the most advanced semiconductor devices in a cost-efficient manner. We believe this will continue to differentiate the Fusion platform from the product offerings of our competitors.
In addition, over the past several years, we have increasingly transitioned the manufacture of certain components and subassemblies to contract manufacturers, thereby reducing our fixed manufacturing costs associated with direct labor and overhead. In fiscal 2002, we completed the transition of our final assembly, system integration and testing operations for Fusion HF to Jabil Circuit. In fiscal 2004, we completed the transition of our Fusion HFi, CX and DX manufacturing to Jabil Circuit and in fiscal 2005 we added Fusion EX, which has further reduced our fixed manufacturing costs. We believe that transforming product manufacturing costs into variable costs will in the future allow us to improve our performance during cyclical downturns while preserving our historic gross margins during cyclical upturns.
During fiscal year 2005, we also took several additional cost reduction measures to further mitigate the adverse effect of cyclical downturns on our profitability. Our total worldwide headcount was reduced from 635 employees and 55 temporary workers at the end of fiscal 2004 to 473 employees and 26 temporary workers at the end of fiscal 2005. In addition, we continued to maintain other cost reduction measures, such as the strict oversight and reduction in discretionary travel and other variable overhead expenses. We believe that these reductions in operating costs have reduced our costs while preserving our ability to fund critical product research and development efforts and continue to provide our customers with the levels of responsiveness and service they require.
We are also exposed to the risks associated with the volatility of the U.S. and global economies. The lack of visibility regarding whether or when there will be a sustained recovery in the sale of electronic goods and information technology equipment, and uncertainty regarding the magnitude of the recovery, underscores the need for caution in predicting growth in the semiconductor test equipment industry in general and in our revenues and profits specifically. Slow or negative growth in the domestic economy may continue to materially and adversely affect our business, financial condition and results of operations for the foreseeable future. The Company’s results of operations would be further adversely affected if we were to experience lower than anticipated order levels, cancellations of orders in backlog, extended customer delivery requirements or pricing pressure as a result of this slowdown. At lower levels of revenue, there is a higher likelihood that these types of changes in our customers’ requirements would adversely affect our results of operations because in any particular quarter a limited number of transactions accounts for an even greater portion of sales for the quarter.
11
Critical Accounting Policies and the Use of Estimates
The preparation of financial statements in conformity with generally accepted accounting principles requires management to make estimates and assumptions that affect the reported amount of assets, liabilities, revenues and expenses, and related disclosure of contingent assets and liabilities. We based these estimates and assumptions on historical experience, and evaluate them on an on-going basis to ensure they remain reasonable under current conditions. Actual results could differ from those estimates. We believe that our most critical accounting policies upon which our financial condition depends on and which involve the most complex and subjective decisions or assessments are as follows: revenue recognition, inventory reserve, income taxes, warranty, goodwill and other intangibles, in process research and development, impairment of long-lived assets and allowances for doubtful accounts.
Revenue Recognition
The Company’s revenue recognition policy is described in Note 2, Summary of Significant Accounting Policies, contained in the Notes to Consolidated Financial Statements included in this report. We monitor the credit worthiness of our key customers and do not record revenue on sales if collection is not reasonably assured. Most of these conditions are subjective and actual results could vary from the estimated outcome, requiring future revisions to income from operations. In the future, if acceptance provisions significantly change, the timing of the revenue recognition could be affected.
Inventory Reserve
We sell capital equipment to companies that design, manufacture, assemble, and test semiconductor devices. We are exposed to a number of economic and industry factors that could result in portions of our inventory becoming either obsolete or in excess of anticipated usage. These factors include, but are not limited to, changes in our customers’ capital expenditures, technological changes in our markets, our ability to meet changing customer requirements, competitive pressures in products and prices, and the availability of key components from our suppliers. Our policy is to establish inventory reserves when conditions exist that suggest our inventory may be in excess of anticipated demand or is obsolete based upon our assumptions about future demand for our products or market conditions. We regularly evaluate the ability to realize the value of our inventory based on a combination of factors including the following: historical usage rates, forecasted sales or usage, estimated product end of life dates, estimated current and future market values and new product introductions. Purchasing and alternative usage options are also explored to mitigate inventory exposure. When recorded, our reserves are intended to reduce the carrying value of our inventory to its net realizable value. Pursuant to SAB Topic 5-BB, inventory reserves establish a new cost basis for inventory. Such reserves are not reversed until the related inventory is sold or otherwise disposed of. For the twelve months ended July 31, 2005, we recorded $1.4 million of gain from sales of previously reserved items. This gain was recorded in the quarters ended January 31, 2005 and July 31, 2005 in the amounts of $0.5 million and $0.9 million respectively. There were no sales of previously reserved items in fiscal 2004 and 2003. As of July 31, 2005, our inventory of $41.2 million is stated net of inventory reserves of $99.6 million and consists of second generation Fusion products and engineering materials. Of the $26.1 million comprising the raw materials inventory, $4.1 million consists of “last time buy” custom components for Fusion HFi and $22.0 million consists of raw materials for Fusion HFi and CX, which the Company believes will be consumed over the next 24 months. If actual demand for our products deteriorates or market conditions are less favorable than those that we project, additional inventory reserves may be required.
Income Taxes
In accordance with Statement of Financial Accounting Standards No. 109, “Accounting for Income Taxes”, (“SFAS No. 109”) the Company recognizes deferred income taxes based on the expected future tax consequences of differences between the financial statement basis and the tax bases of assets and liabilities, calculated using enacted tax rates for the year in which the differences are expected to be reflected in the tax return. Valuation allowances are established when necessary to reduce deferred taxes to the amount expected to be realized.
The Company has deferred tax assets resulting from tax credit carryforwards, net operating losses and other deductible temporary differences, which will reduce taxable income in future periods. SFAS No. 109 requires that a valuation allowance be established when it is “more likely than not” that all or a portion of deferred tax assets will not be realized. A review of all available positive and negative evidence needs to be considered, including a company’s performance, the market environment in which the Company operates, length of carryback and carryforward periods, existing sales backlog and future sales projections. Where there are cumulative losses in recent years, SFAS No. 109 creates a strong presumption that a valuation allowance is needed. This presumption can be overcome in very limited circumstances. As a result of our cumulative loss position in recent years and the increased uncertainty relative to the timing of profitability in future periods, we continue to maintain a valuation allowance for our entire net deferred tax assets. The valuation allowance for deferred tax assets increased from $168.7 million at July 31, 2004, to $240.6 million at July 31, 2005. We expect to record a full valuation allowance on future tax benefits until we can sustain an appropriate level of profitability. Until such time, we would not expect to recognize any significant tax benefits in our future results of operations. We will continue to monitor the recoverability of our deferred tax asset on a periodic basis.
12
Warranty
The Company provides standard warranty coverage on its systems, providing labor and parts necessary to repair the systems during the warranty period. The Company accounts for the estimated warranty cost as a charge to cost of sales when the revenue is recognized. The estimated warranty cost is based on historical product performance and field expenses. The Company uses actual service hours and parts expense per system and applies the actual labor and overhead rates to estimate the warranty charge. The actual product performance and/or field expense profiles may differ, and in those cases the Company adjusts warranty accruals accordingly.
Goodwill and Other Intangibles
The Company has adopted the provisions of SFAS No. 142, “Goodwill and Other Intangible Assets”, which requires that goodwill and intangible assets with indefinite useful lives no longer be amortized. Intangible assets with a definite useful life are amortized over their estimated useful life. Assets recorded in these categories are tested for impairment at least annually or when a change in circumstances may result in future impairment. Intangible assets are recorded at historical cost. Intangible assets acquired in an acquisition, including research and development, are recorded using the purchase method of accounting. Assets acquired in an acquisition are recorded at their estimated fair values at the date of acquisition. If the carrying value of the asset is in excess of the present value of the expected future cash flows, the carrying value is written down to fair value in the period identified.
In-Process Research and Development
The purchase price recorded for acquisitions is allocated to the assets acquired and the liabilities assumed based on fair values at the date of acquisition. The estimated excess of purchase price over the fair value of the net tangible assets is allocated to identifiable intangible assets. The income approach is used to determine the fair value of In-Process Research and Development (IPR&D).
Under the income approach, the fair value reflects the present value of the projected earnings that will be generated by the in-process projects if successfully completed. The income approach focuses on the income producing capability of the acquired in-process projects and best represents the present value of the future economic benefits expected to be derived from these projects. The IPR&D projects must also meet the following criteria: qualify as research and development; no alternative future use; high degree of uncertainty about the future benefits; and, project is in research and development stage and not completed.
Impairment of Long-Lived Assets
On an ongoing basis, we review the value and period of amortization or depreciation of long-lived assets. Included in long-lived assets is machinery, equipment, spare parts used for service, office furniture, office equipment and leasehold improvements. During the review, we reevaluate the significant assumptions used in determining the original cost of long-lived assets. Although the assumptions may vary from transaction to transaction, they generally include revenue growth, operating results, cash flows and other indicators of value. We then determine whether there has been a permanent impairment of the value of long-lived assets based upon events or circumstances that have occurred since acquisition. The extent of the impairment amount recognized is based upon a determination of the fair value of the impaired asset.
Allowance for Doubtful Accounts
A majority of our trade receivables are derived from sales to large multinational semiconductor manufacturers throughout the world. In order to monitor potential credit losses, we perform ongoing credit evaluations of our customers’ financial condition. An allowance for doubtful accounts is maintained for potential credit losses based upon assessment of the expected collectibility of all accounts receivable. The allowance for doubtful accounts is reviewed periodically to assess the adequacy of the allowances. In any circumstances in which we are aware of a customer’s inability to meet its financial obligations, we take a certain percentage of the accounts receivable balance as an allowance, which is based on the age of the receivables, the circumstances surrounding the customer’s financial situation and our historical experience. If circumstances change, and the financial condition of our customers were adversely affected resulting in their inability to meet their financial obligations to us, we may need to record additional allowances.
13
Results of Operations
The following table sets forth for the periods indicated statements of operations data.
| | | | | | | | | | | | |
| | | Year Ended July 31,
| |
| | | 2005
| | | 2004
| | | 2003
| |
| | | (in thousands, except per share data) | |
Net sales | | $ | 134,531 | | | $ | 255,801 | | | $ | 119,449 | |
Cost of sales | | | 90,806 | | | | 154,672 | | | | 97,368 | |
Inventory related provision | | | 47,457 | | | | — | | | | 48,483 | |
| | |
|
|
| |
|
|
| |
|
|
|
Gross profit (loss) | | | (3,732 | ) | | | 101,129 | | | | (26,402 | ) |
Engineering and product development expenses | | | 66,302 | | | | 67,655 | | | | 66,088 | |
Selling, general and administrative expenses | | | 29,366 | | | | 28,037 | | | | 27,321 | |
In-process research and development | | | — | | | | — | | | | 16,100 | |
Reorganization costs | | | 31,726 | | | | — | | | | 6,696 | |
| | |
|
|
| |
|
|
| |
|
|
|
Income (loss) from operations | | | (131,126 | ) | | | 5,437 | | | | (142,607 | ) |
Interest expense | | | (6,832 | ) | | | (6,626 | ) | | | (6,747 | ) |
Investment income | | | 5,232 | | | | 3,150 | | | | 4,286 | |
| | |
|
|
| |
|
|
| |
|
|
|
Net income (loss) | | $ | (132,726 | ) | | $ | 1,961 | | | $ | (145,068 | ) |
| | |
|
|
| |
|
|
| |
|
|
|
Net income (loss) per share: | | | | | | | | | | | | |
Basic | | $ | (2.17 | ) | | $ | 0.04 | | | $ | (2.92 | ) |
Diluted | | $ | (2.17 | ) | | $ | 0.03 | | | $ | (2.92 | ) |
The following table sets forth for the periods indicated the principal items included in the Consolidated Statements of Operations as percentages of total net sales.
| | | | | | | | | |
| | | Percentage of Net Sales
Year Ended July 31,
| |
| | | 2005
| | | 2004
| | | 2003
| |
Net sales | | 100.0 | % | | 100.0 | % | | 100.0 | % |
Cost of sales | | 67.5 | | | 60.5 | | | 81.5 | |
Inventory related provision | | 35.3 | | | — | | | 40.6 | |
| | |
|
| |
|
| |
|
|
Gross profit (loss) | | (2.8 | ) | | 39.5 | | | (22.1 | ) |
Engineering and product development expenses | | 49.3 | | | 26.4 | | | 55.3 | |
Selling, general and administrative expenses | �� | 21.8 | | | 11.0 | | | 22.9 | |
In-process research and development | | — | | | — | | | 13.5 | |
Reorganization costs | | 23.6 | | | — | | | 5.6 | |
| | |
|
| |
|
| |
|
|
Income (loss) from operations | | (97.5 | ) | | 2.1 | | | (119.4 | ) |
Interest expense | | (5.1 | ) | | (2.5 | ) | | (5.6 | ) |
Investment income | | 3.9 | | | 1.2 | | | 3.6 | |
| | |
|
| |
|
| |
|
|
Net income (loss) | | (98.7 | )% | | 0.8 | % | | (121.4 | )% |
| | |
|
| |
|
| |
|
|
Fiscal 2005 Compared to Fiscal 2004
Net Sales. Net sales consist of both semiconductor test equipment and related hardware and software support and maintenance services, net of returns and allowances. Net sales were $134.5 million in fiscal 2005 and $255.8 million in fiscal 2004. The decrease in net sales year over year is primarily a result of sluggish demand for semiconductors resulting in reduced demand for semiconductor test equipment. In the first quarter of fiscal 2005, our major customers reduced their forecasts for capital equipment purchases, which resulted in a sudden and substantial drop in revenues and orders for the Company, which continued into our second quarter of fiscal 2005. The Company experienced a modest increase in orders in its third quarter, followed by a slight increase in orders in the fourth fiscal quarter. As a result of increasing orders, our revenue increased 52% in the fourth quarter from the previous quarter. The impact to the Company of any industry slowdown is exacerbated by the fact that the semiconductor industry is highly concentrated, and a small number of device manufacturers and contract assemblers account for a substantial portion of the purchases of semiconductor test equipment, including the Company’s equipment. Sales to our ten largest customers accounted for 77.2% and 87.5% of revenues for
14
the twelve months ended July 31, 2005 and July 31, 2004, respectively. Reduced sales from any one of our largest customers could have a significant effect on our sales. Sales from new products, Fusion CX, DX, EX and Fusion HFi, totaled $83.6 million, or 81.1% of product revenue in fiscal year 2005, and $107.0 million, or 49.2% of product revenue, in fiscal year 2004. Service revenue, consisting of sales of replacement and spare parts and labor charges, totaled $31.5 million, or 23.4% of net sales, in fiscal 2005 and $38.5 million, or 15.0% of net sales, in fiscal 2004. The decrease in service revenue is directly attributable to customer adjustments to their level of service needed to support their equipment utilization run rates. Geographically, sales to customers outside the United States were $93.3 million, or 69.3% of net sales, in fiscal 2005 and $168.9 million, or 66.0% of net sales, in fiscal 2004.
Cost of Sales. Cost of sales consists of material, outsourced manufacturing costs, labor, depreciation and associated overhead. Cost of sales decreased by $63.9 million to $90.8 million in fiscal 2005 from $154.7 million in fiscal 2004. As a percentage of net sales, cost of sales was 67.5% of net sales in fiscal 2005 as compared to 60.5% of net sales in fiscal 2004. Cost of sales as a percentage of net sales increased 7.0% year over year in fiscal 2005 primarily as a result decreased sales volume, as the fixed cost components of our cost of sales did not decrease on a prorata basis with our decrease in net sales.
Inventory Related Provision.In the first quarter of fiscal 2005, our major customers reduced their forecasts for capital equipment purchases, which resulted in a sudden and substantial drop in revenues and orders for the Company. These conditions continued into our second quarter of fiscal 2005. As a result of the shorter than expected upturn in business conditions and the completion of the Company’s transition to its second generation Fusion, we deemed it appropriate to make an adjustment to our inventory valuation and recorded a $47.5 million excess and obsolete inventory provision, primarily related to our Fusion HF product line, in the quarter ended October 31, 2004. Inventory reserves establish a new cost basis for inventory and such reserves are not reversed until the related inventory is sold or otherwise disposed. For the twelve months ended July 31, 2005, we recorded $1.4 million of gain from sales of previously reserved items. This gain was recorded in the quarters ended January 31, 2005 and July 31, 2005 in the amounts of $0.5 million and $0.9 million, respectively. There were no sales of previously reserved items in fiscal 2004 and 2003. As of July 31, 2005, our inventory of $41.2 million is stated net of inventory reserves of $99.6 million and consists of second generation Fusion products and engineering materials. Of the $26.1 million comprising the raw materials inventory, $4.1 million consists of “last time buy” custom components for Fusion HFi and $22.0 million consists of raw materials for Fusion HFi and CX, which the Company believes will be consumed over the next 24 months. If actual demand for our products deteriorates or market conditions are less favorable than those that we project, additional inventory reserves may be required.
Engineering and Product Development Expenses. Engineering and product development expenses were $66.3 million, or 49.3% of net sales, in fiscal 2005 as compared to $67.7 million, or 26.4% of net sales, in fiscal 2004. The $1.4 million decrease in engineering and product development expenses in 2005 from 2004 was a result of our annual cost savings of $4.9 million due to the workforce reductions, offset by wage increases of $1.7 million implemented on August 1, 2004, increased engineering development expense of $1.1 million to support second generation Fusion products and additional depreciation expense of $0.7 million. Our engineering and development expense decreased sequentially on a quarterly basis during fiscal 2005 as second generation Fusion product development projects were completed. For the first quarter of fiscal 2005, our engineering and development expense was $17.7 million compared to $14.3 million in our fourth quarter. The decrease in quarterly expenditure was a result of completion of second generation Fusion product development projects for Fusion HFi, CX and EX.
Selling, General and Administrative Expenses. Selling, general and administrative expenses were $29.4 million, or 21.8% of net sales, in fiscal 2005 as compared to $28.0 million, or 11.0% of net sales, in fiscal 2004. The increase in selling, general and administrative expenses was a result of a wage increase implemented on August 1, 2004, Sarbanes-Oxley Section 404 consulting expenses, legal expenses incurred as a result of an anonymous “whistleblower” allegation relating to the Company’s third quarter financial results and strategic corporate initiatives. Offsetting this increase were two reversals of accruals in fiscal 2005 relating to legal issues of $0.7 million and a favorable settlement of a liability associated with the settlement of a software license audit of $0.6 million that was recorded as part of the acquisition of StepTech, Inc. Additionally, a $1.7 million gain was included in selling, general and administrative expenses as a result of the repurchase by the Company of $61.7 million of outstanding principal of the 4.25% Convertible Subordinated Notes for a purchase price of $60.0 million. Partially offsetting this gain was an amortization expense of $0.4 million relating to the repurchase of the notes.
Our cost reduction actions in fiscal 2005 have lowered our quarterly selling, general and administrative expenses. Selling, general and administrative expenses averaged $6.7 million per quarter for the last two quarters of fiscal 2005 as compared to $8.0 million per quarter in the first half of fiscal 2005.
Reorganization Costs.The Company recorded a reorganization charge in the quarter ended October 31, 2004 of $3.1 million, of which $1.5 million consisted of severance costs relating to a worldwide workforce reduction and $1.6 million related to consolidation of the Company’s facilities in the United Kingdom. The $1.6 million reorganization charge related to the consolidation of the Company’s facilities in the United Kingdom consisted of future lease obligations net of any rental income. As previously disclosed in a current report on Form 8-K filed on September 20, 2004, the workforce reduction undertaken during the quarter eliminated 74 positions, or approximately 11% of the Company’s worldwide workforce. As a result of these actions, the Company will
15
realize an annual savings in operating expenses of approximately $8.0 million, which has been offset by approximately $2.0 million as a result of the removal of the salary and wage freeze imposed since 2001. The net effect of the cost reduction actions and the removal of the salary and wage freeze is an annual savings of approximately $6.0 million in operating expenses. During the twelve months of fiscal year 2005, the Company’s cash expenditures related to the charges were approximately $2.1 million. At July 31, 2005, the remaining reserve was approximately $1.0 million and relates to the consolidation of the Company’s facilities in the United Kingdom. There are no remaining severance costs from this workforce reduction to be paid during fiscal year 2006. Cash payments for the United Kingdom lease will be approximately $0.6 million in fiscal 2006.
During the quarter ended April 30, 2005, the Company recorded a reorganization charge of $28.6 million as a result of a significant corporate-wide restructuring undertaken to more effectively align the Company’s resources with our current business strategy. Of the $28.6 million, approximately $4.0 million related to headcount reduction and approximately $24.6 million related to fixed asset impairment and facilities consolidation.
The $4.0 million charge was taken as a result of a worldwide workforce reduction of approximately 25% on February 15, 2005, which eliminated 153 positions. On February 18, 2005, the Company filed a Form 8-K describing these actions. The workforce reduction resulted in cash expenditures, consisting principally of severance and employee benefit payments, of $3.3 million during the Company’s 2005 fiscal year and the Company expects to expend approximately $0.7 million, the remaining reserve at July 31, 2005, during the first half of the 2006 fiscal year. The Company expects to realize an annual savings in operating expense of approximately $13.0 million as a result of this reduction.
The $24.6 million reorganization charge relating to fixed asset impairment and facilities consolidation was undertaken as a result of an asset impairment review. This review was triggered by the workforce reduction and business unit reorganization. Of the $24.6 million impairment charge, $18.1 million was related to fixed asset equipment, $4.6 million related to future lease obligations on equipment that will no longer be used and $1.9 million related to facilities consolidation. The equipment, which has or will be disposed of over the next three to six months, consists primarily of older technology having little or no resale value. The Company expects to realize an annual savings of $8.5 million to depreciation expense and $1.9 million to operating expense as a result of this reorganization.
Interest Expense. Interest expense for fiscal year 2005 was $6.8 million as compared to $6.6 million for fiscal year 2004, and consists primarily of interest expense for the balance of the 4.25% Convertible Subordinated Notes and interest expense of 6.25% (the lender’s variable prime rate) as of July 31, 2005 on the $60.0 million long-term loan with a commercial lender.
Investment Income. Investment income was $5.2 million for fiscal 2005 as compared to $3.2 million for fiscal 2004. The increase in investment income is due to rising interest rates in fiscal 2005 as compared to fiscal 2004, partially offset by a lower average cash balance during the year.
Income Tax. The Company recorded no income tax benefit for fiscal year 2005 due to the increase in the valuation allowance to fully reserve net operating loss and other carryforwards, and net deferred tax assets. No provision was recorded in 2004 due to the utilization of net operating loss carryforwards to offset taxable income. Due to our cumulative loss position, management concluded that it was appropriate to continue to maintain a full valuation allowance for the Company’s net operating loss and other carryforwards, and net deferred tax assets. The Company will continue to record a 100% valuation allowance until it is more likely than not we will utilize the net operating loss and other carryforwards, and deferred tax asset. The gross deferred tax asset is valued at $240.6 million as of July 31, 2005 with a 100% valuation allowance.
Fiscal 2004 Compared to Fiscal 2003
Net Sales. Net sales consist of both semiconductor test equipment and related hardware and software support and maintenance services, net of returns and allowances. Net sales were $255.8 million in fiscal 2004 and $119.4 million in fiscal 2003. The increase in net sales is primarily a result of increasing demand for semiconductor test equipment as economic conditions in general and semiconductor industries in particular improved for fiscal 2004. The increase in net sales is also attributed to expanding business with new and existing customers, across a diverse range of end products and SOC applications. Sales from new products, Fusion CX and Fusion HFi, totaled $107.0 million in fiscal year 2004 and $14.2 million in fiscal year 2003. Service revenue, consisting of sales of replacement and spare parts and labor charges, totaled $38.5 million, or 15.0% of net sales, in fiscal 2004 and $32.1 million, or 26.8% of net sales, in fiscal 2003. Geographically, sales to customers outside the United States were $168.9 million, or 66% of net sales, in fiscal 2004 and $67.8 million, or 57% of net sales, in fiscal 2003.
Cost of Sales. Cost of sales consists of material, outsource manufacturing costs, labor, depreciation and associated overhead. Cost of sales increased by $57.3 million to $154.7 million in fiscal 2004 from $97.4 million in fiscal 2003. As a percentage of net sales, cost of sales was 60.5% of net sales in fiscal 2004 as compared to 81.5% in fiscal 2003. Cost of sales as a percentage of net sales decreased 21.0% year over year in fiscal 2004 primarily as a result of increased sales volume, as the fixed cost components of our cost of sales did not increase commensurate with our increase in net sales, as well as increased sales of Fusion HFi and Fusion CX, which have higher gross margin than Fusion HF.
16
Engineering and Product Development Expenses. Engineering and product development expenses were $67.7 million, or 26.4% of net sales, in fiscal 2004 as compared to $66.1 million, or 55.3% of net sales, in fiscal 2003. The $1.6 million increase in engineering and product development expenses in 2004 from 2003 was principally a result of an increase of $1.0 million in our applications development staffing levels to support market penetration programs and a $0.6 million increase in non-recurring engineering expenses for next generation digital pin development. We continue to maintain a significant investment in product development expenses to support new product features and emerging applications.
Selling, General and Administrative Expenses. Selling, general and administrative expenses were $28.0 million, or 11.0% of net sales, in fiscal 2004 as compared to $27.3 million, or 22.9% of net sales, in fiscal 2003. The decrease in selling, general and administrative expenses as percentage of net sales was a result of increased sales volume.
In-Process Research and Development. In October 2000, we acquired 19% of the outstanding common stock of StepTech, Inc. On June 10, 2003, we acquired the remaining 81% of the outstanding shares of StepTech for a net cash payment of $6.5 million and 2,283,750 shares of LTX common stock, of which 288,125 shares were contingent upon certain milestones being met. In addition, all outstanding stock options to purchase shares of StepTech stock were converted into options to purchase 263,112 shares of LTX stock and options to purchase 300,000 shares of LTX stock with an exercise price equal to the fair market value of LTX stock on the date of grant were also issued. The acquisition was accounted for under the provisions of SFAS No. 141, “Business Combinations”. SFAS No. 141 requires that all business combinations be accounted for under the purchase method. The Company’s Consolidated Financial Statements include the operating results of StepTech from the date of acquisition. The purchase price recorded for the StepTech acquisition has been allocated to the assets acquired and the liabilities assumed based on their fair value at the date of acquisition. The estimated excess of purchase price over the fair value of the net tangible assets was allocated to identifiable intangible assets. We recorded an in-process research and development (IPR&D) charge of $16.1 million in the fourth quarter of fiscal 2003.
Interest Expense. Interest expense for fiscal year 2004 was $6.6 million as compared to $6.7 million for fiscal year 2003 and consists primarily of accruing interest expense for the balance of the 4.25% Convertible Subordinated Notes.
Investment Income. Investment income was $3.2 million for fiscal 2004 as compared to $4.3 million for fiscal 2003. The decrease in investment income is due to declining interest rates in fiscal 2004 as compared to fiscal 2003.
Income Tax. The Company recorded no income tax provision for fiscal year 2004 due to the utilization of net operating loss carryforwards to offset taxable income. As a result of a review undertaken at July 31, 2004 and our cumulative loss position at that date, management concluded that it was appropriate to maintain a full valuation allowance for the Company’s net operating and other loss carryforwards, and net deferred tax assets. The Company recorded a $2.0 million pretax profit for fiscal year 2004. The income tax expense associated with this profit was offset by use of a portion of the Company’s net operating loss carryforwards.
Liquidity and Capital Resources
At July 31, 2005, we had $177.5 million in cash and cash equivalents and marketable securities and working capital of $183.0 million as compared to $244.7 million in cash and cash equivalents and marketable securities and working capital of $292.9 million at July 31, 2004. The decrease in the cash and cash equivalents was due to cash used by operations of $55.5 million, primarily due to the net loss for the year and cash used for capital expenditures of $11.6 million to support second generation Fusion products and related options. The total decrease in cash and cash equivalents and marketable securities for the year was $67.2 million.
Accounts receivable from trade customers, net of allowances, was $19.8 million at July 31, 2005, as compared to $33.0 million at July 31, 2004. The principal reasons for the $13.2 million decrease in accounts receivable are decreased sales revenue and increased collections efforts on the part of the Company. Sales for the quarter ended July 31, 2005 were $38.9 million as compared to $80.4 million for the quarter ended July 31, 2004. The allowance for sales returns and doubtful accounts decreased to $1.9 million, or 8.8% of gross trade accounts receivable, at July 31, 2005 from $2.0 million, or 5.8% of gross trade accounts receivable, at July 31, 2004.
Accounts receivable from other sources decreased $6.0 million to $5.5 million at July 31, 2005, as compared to $11.5 million at July 31, 2004. The decrease was attributed to the decrease in the sale of component inventory at cost to our outsource suppliers. The Company sells raw materials and component inventory at cost to its outsource contract manufacturers. The Company does not recognize revenue from these sales. Terms of sale are typically net 30 days, with no recourse provisions to the buyer. Although the majority of the Company’s raw materials and components are procured by our outsource suppliers (principally Jabil Circuit), we continue to carry on our balance sheet certain custom components and inventory that are in excess of our 90 day production requirements. These components are sold to our outsource partners at cost when needed for current production.
17
Net inventory decreased by $28.0 million to $41.2 million at July 31, 2005 as compared to $69.2 million at July 31, 2004. The decrease was primarily the result of an inventory related provision of $47.5 million recorded in our first quarter ended October 31, 2004. Offsetting the charge of $47.5 million to the excess reserve was an increase in inventories to support Fusion HFi, CX, DX and EX, and second generation Fusion options of $19.5 million. Of the $19.5 million, $1.8 million consisted of deposits previously made to suppliers of critical components to ensure delivery and $17.7 million consisted of new inventory purchases. Approximately $18.7 million of the $19.5 million increase in inventory was a result of the sudden and substantial drop in revenue in the first quarter of fiscal 2005 compared to revenue in the fourth quarter of fiscal year 2004. The Company expects to consume this excess Fusion inventory within the next 24 months.
Capital expenditures totaled $11.6 million in fiscal 2005 as compared to $17.5 million in fiscal 2004. Capital spending in fiscal 2005 was 9.5% of sales revenue compared to 6.8% in fiscal 2004. Capital expenditures include the purchase of additional capital equipment to support increased applications development and spare parts and equipment to support Fusion HFi, CX, DX and EX.
For fiscal years 2005 and 2004, we had no new capital lease financing transactions. We had no new material operating lease financing transactions in fiscal years 2005 and 2004.
On June 3, 2005, the Company closed a $60.0 million term loan with a commercial lender. The loan has a five year term, with interest only payable in the first year. Interest is at the lender’s variable prime rate and is payable monthly. The loan is secured by all assets of the Company located in the United States. The proceeds from the loan were used to finance repurchases of the 4.25% Convertible Subordinated Notes and other working capital purposes. During the quarter ended July 31, 2005, the Company repurchased $61.7 million principal amount of the notes for $60.0 million. The gain of $1.7 million was recorded as other income in selling, general and administrative expense. As of July 31, 2005, the outstanding principal of the term loan is $60.0 million. Principal is payable as follows: (i) twelve monthly installments of $0.6 million, commencing June 1, 2006 and ending on May 1, 2007; (ii) twelve monthly installments of $1.2 million, commencing on June 1, 2007 and ending on May 1, 2008, (iii) twelve monthly installments of $1.5 million, commencing on June 1, 2008 and ending on May 1, 2009, and (iv) twelve monthly installments of $1.7 million, commencing on June 1, 2009 and ending on May 1, 2010. The Company has a covenant in its loan agreement that requires it to maintain minimum cash and cash equivalents and marketable securities balances with the lender of no less than the aggregate of the outstanding term loan plus $30.0 million. However, in the event the Company’s cash and cash equivalents and marketable securities are less than this amount, the impact to the Company is the imposition of additional bank fees. The additional fees would not have a material impact on the Company’s financial position or results of operations.
The Company has a second credit facility with another lender for a revolving credit line of $20.0 million. This facility is secured by cash and bears interest (at our option) at either: (i) the greater of the federal funds rate plus 0.5% or the bank’s prime rate, in each case, minus 1.0% or (ii) LIBOR plus 0.4%. This facility expired on July 23, 2005 and was extended to October 20, 2005. No amounts were outstanding under this credit facility at July 31, 2005.
In January 2004, the Company filed a shelf registration statement on Form S-3 to register up to $250.0 million of common stock, debt securities and warrants. On February 19, 2004, an offering was closed pursuant to the registration statement relating to the sale of 8,050,000 shares of common stock at $16.50 per share. The offering included 1,050,000 shares sold as a result of the exercise, in full, by the underwriters of their option to purchase additional shares of common stock. Gross proceeds from the stock offering totaled approximately $132.8 million. Proceeds to LTX, net of $6.3 million in underwriters’ commissions and discounts and other expenses, totaled approximately $126.5 million.
In August 2001, we received net proceeds of $145.2 million from a private placement of 4.25% Convertible Subordinated Notes due 2006. The private placement was effected through a Rule 144A offering to qualified institutional buyers. Interest on the notes is payable on February 15 and August 15 of each year, commencing February 15, 2002. The notes are convertible into shares of our common stock at any time prior to the close of business on August 15, 2006, unless previously redeemed, at a conversion price of $29.04 per share, subject to certain adjustments. Prior to August 19, 2004, we may redeem any of the notes at a certain redemption price, plus accrued interest, if the closing price of the common stock has exceeded 150% of the conversion price for at least 20 trading days in any consecutive 30-day trading period and certain other conditions are satisfied. On or after August 19, 2004, we may redeem any of the notes at designated redemption prices, plus accrued interest. The notes are unsecured and subordinated in right of payment in full to all existing and future senior indebtedness of the Company. Expenses associated with the offering of approximately $4.8 million are being amortized using the straight-line method of depreciation, which approximates the effective interest method, over the term of the notes. During the fourth fiscal quarter of 2005, the Company repurchased $61.7 million of the outstanding principal balance of the notes for a purchase price of $60.0 million. The expense amortization recorded in the fourth quarter of fiscal 2005 as a result of the repurchase of the notes was $0.4 million. As of July 31, 2005, the outstanding principal balance was $88.3 million, which is due on August 15, 2006.
The Company operates in a highly cyclical industry and we may experience, with relatively short notice, significant fluctuations in demand for our products. This could result in a material effect on our liquidity position. To mitigate the risk, we have completed a
18
substantial and lengthy process of converting our manufacturing process to an outsource model. As such, we believe we can react to a downturn or a significant upturn much faster than in the past. We believe that our balances of cash and cash equivalents, cash flows expected to be generated by future operating activities, our access to capital markets for competitively priced instruments and funds available under our credit facilities will be sufficient to meet our cash requirements over the next twelve to twenty-four months, which includes the payment or restructuring of the outstanding principal of the notes discussed in the preceding paragraph.
The following summarizes LTX’s contractual obligations, net of sub-lease revenues, at July 31, 2005 and the effect such obligations are expected to have on its liquidity and cash flow in the future periods:
| | | | | | | | | | | | |
| | | Total
| | 2006
| | 2007 – 2008
| | 2009 – 2010
|
Financial Obligations | | | | | | | | | | | | |
Convertible Subordinated Notes | | $ | 93,915 | | $ | 3,752 | | $ | 90,163 | | $ | — |
Term Loan | | | 72,474 | | | 4,380 | | | 30,318 | | | 37,776 |
Operating Leases | | | 23,416 | | | 10,251 | | | 10,639 | | | 2,526 |
| | |
|
| |
|
| |
|
| |
|
|
Total Financial Obligations | | $ | 189,805 | | $ | 18,383 | | $ | 131,120 | | $ | 40,302 |
Recent Accounting Pronouncements
On December 16, 2004, the Financial Accounting Standards Board (“FASB”) issued Statement No. 123 (revised 2004), “Share Based Payment” (“SFAS No. 123R”), which is a revision of Statement No. 123, “Accounting for Stock-Based Compensation” (“SFAS No. 123”). SFAS No. 123R supersedes APB Opinion No. 25, “Accounting for Stock Issued to Employees” and amends Statement No. 95, “Statement of Cash Flows”. Under SFAS No. 123R, companies must calculate and record in the income statement the cost of equity instruments, such as stock options, awarded to employees for services received; pro forma disclosure is no longer permitted. The cost of the equity instruments is to be measured based on the fair value of the instruments on the date they are granted and is required to be recognized over the period during which the employees are required to provide services in exchange for the equity instruments. The statement is effective for the Company on August 1, 2005.
SFAS No. 123R provides two alternatives for adoption: (1) a “modified prospective” method in which compensation cost is recognized for all awards granted subsequent to the effective date of this statement as well as for the unvested portion of awards outstanding as of the effective date; or (2) a “modified retrospective” method which follows the approach in the “modified prospective” method, but also permits entities to restate prior periods to record compensation cost calculated under SFAS No. 123 for the pro forma disclosure. We plan to adopt SFAS No. 123R using the modified prospective method. Since we currently account for stock options granted to employees and shares issued under our employee stock purchase plans in accordance with the intrinsic value method permitted under APB Opinion No. 25, no compensation expense is recognized in the Consolidated Statement of Operations for the years ended July 31, 2005, 2004 and 2003. The adoption of SFAS No. 123R is expected to have a significant impact on our results of operations. The impact of adopting SFAS No. 123R cannot be accurately estimated at this time, as it will depend on the market value and the amount of share based awards granted in future periods. SFAS No. 123R also requires that tax benefits received in excess of compensation cost be reclassified from operating cash flows to financing cash flows in the Consolidated Statement of Cash Flows. This change in classification could reduce net operating cash flows and increase net financing cash flows in the periods after adoption.
On June 7, 2005, the Board of Directors, upon recommendation of the Board’s Compensation Committee, approved the accelerated vesting of certain unvested and “out-of-the-money” stock options held by employees, executive officers and non-employee directors with exercise prices greater than $7.50 per share. The closing sale price of LTX’s common stock on the Nasdaq National Market on June 7, 2005 was $5.20. As a result of this vesting acceleration, which became effective on June 7, 2005, options to purchase approximately 2.3 million shares of LTX’s common stock that would otherwise have vested at various times within the next four years became fully vested. The decision to accelerate these unvested options was made primarily to reduce compensation expense that might be recorded in future periods following our adoption of SFAS No. 123R beginning with our next fiscal year, which starts on August 1, 2005. Accelerating the vesting of these stock options will reduce the Company’s aggregate compensation expense in future periods by a total of approximately $10.4 million, before taxes, based upon value calculations using the Black-Scholes methodology (approximately $6.2 million in fiscal year 2006, $4.1 million in fiscal year 2007, and $0.1 million in fiscal year 2008).
In November 2004, the FASB issued Statement of Financial Accounting Standards No. 151, “Inventory Costs, an amendment of ARB No. 43, Chapter 4” (“SFAS 151”). SFAS 151 modifies the accounting for abnormal inventory costs, and the manner in which companies allocate fixed overhead expenses to inventory. SFAS 151 is effective for inventory costs incurred during annual periods beginning after June 15, 2005. LTX does not expect SFAS 151 to have a material impact on its financial positions and results of operations.
19
BUSINESS RISKS
This report includes or incorporates forward-looking statements that involve substantial risks and uncertainties and fall within the meaning of Section 27A of the Securities Act of 1933 and Section 21E of the Securities Exchange Act of 1934. You can identify these forward-looking statements by our use of the words “believes,” “anticipates,” “plans,” “expects,” “may,” “will,” “would,” “intends,” “estimates,” and similar expressions, whether in the negative or affirmative. We cannot guarantee that we actually will achieve these plans, intentions or expectations. Actual results or events could differ materially from the plans, intentions and expectations disclosed in the forward-looking statements we make. We have included important factors in the cautionary statements, particularly under the heading “Business Risks,” that we believe could cause our actual results to differ materially from the forward-looking statements that we make. We do not assume any obligation to update any forward-looking statement we make.
Our sole market is the highly cyclical semiconductor industry, which causes a cyclical impact on our financial results.
We sell capital equipment to companies that design, manufacture, assemble, and test semiconductor devices. The semiconductor industry is highly cyclical, causing in turn a cyclical impact on our financial results. Our recent operating results have been negatively impacted by an industry-wide slowdown in the semiconductor industry which began to impact us in the first quarter of fiscal 2005. Any failure to expand in cycle upturns to meet customer demand and delivery requirements or contract in cycle downturns at a pace consistent with cycles in the industry could have an adverse effect on our business.
Any significant downturn in the markets for our customers’ semiconductor devices or in general economic conditions would likely result in a reduction in demand for our products and would hurt our business. Downturns in the semiconductor test equipment industry have been characterized by diminished product demand, excess production capacity, accelerated erosion of selling prices and excessive inventory levels. We believe the markets for newer generations of devices, including system-on-a-chip (“SOC”), will also experience similar characteristics. Our market is also characterized by rapid technological change and changes in customer demand. In the past, we have experienced delays in commitments, delays in collecting accounts receivable and significant declines in demand for our products during these downturns, and we cannot be certain that we will be able to maintain or exceed our current level of sales.
Any significant downturn in the markets for our customers’ semiconductor devices or in general economic conditions would likely result in a reduction in demand for our products and would hurt our business. From the third quarter of fiscal 2001 through the end of the first quarter of fiscal 2004, our revenue and operating results were negatively impacted by a sudden and severe downturn in the semiconductor industry. Downturns in the semiconductor test equipment industry have been characterized by diminished product demand, excess production capacity, accelerated erosion of selling prices and excessive inventory levels. We believe the markets for newer generations of devices, including system-on-a-chip (“SOC”), will also experience similar characteristics. Our market is also characterized by rapid technological change and changes in customer demand. In the past, we have experienced delays in commitments, delays in collecting accounts receivable and significant declines in demand for our products during these downturns, and we cannot be certain that we will be able to maintain or exceed our current level of sales.
Additionally, as a capital equipment provider, our revenue is driven by the capital expenditure budgets and spending patterns of our customers who often delay or accelerate purchases in reaction to variations in their businesses. Because a high proportion of our costs are fixed, we are limited in our ability to reduce expenses and inventory purchases quickly in response to decreases in orders and revenues. In a contraction, we may not be able to reduce our significant fixed costs, such as continued investment in research and development and capital equipment requirements and materials purchases from our suppliers.
The market for semiconductor test equipment is highly concentrated, and we have limited opportunities to sell our products.
The semiconductor industry is highly concentrated, and a small number of semiconductor device manufacturers and contract assemblers account for a substantial portion of the purchases of semiconductor test equipment generally, including our test equipment. Sales to Texas Instruments accounted for 47% of our net sales in fiscal 2005 and 58% of our net sales in fiscal 2004. Sales to our ten largest customers accounted for 77.2% of revenues in fiscal year 2005 and 87.5% in fiscal year 2004. Our customers may cancel orders with few or no penalties. If a major customer reduces orders for any reason, our revenues, operating results, and financial condition will be hurt.
Our ability to increase our sales will depend in part upon our ability to obtain orders from new customers. Semiconductor manufacturers select a particular vendor’s test system for testing the manufacturer’s new generations of devices and make substantial investments to develop related test program software and interfaces. Once a manufacturer has selected one test system vendor for a generation of devices, that manufacturer is more likely to purchase test systems from that vendor for that generation of devices, and, possibly, subsequent generations of devices as well. Therefore, the opportunities to obtain orders from new customers may be limited.
20
Our sales and operating results have fluctuated significantly from period to period, including from one quarter to another, and they may continue to do so.
Our quarterly and annual operating results are affected by a wide variety of factors that could adversely affect sales or profitability or lead to significant variability in our operating results or our stock price. This may be caused by a combination of factors, including the following:
| | • | | sales of a limited number of test systems account for a substantial portion of our net sales in any particular fiscal quarter, and a small number of transactions could therefore have a significant impact; |
| | • | | order cancellations by customers; |
| | • | | lower gross margins in any particular period due to changes in: |
| | • | the configurations of test systems sold, |
| | • | the customers to whom we sell these systems, or |
| | • | | a long sales cycle, due to the high selling price of our test systems, the significant investment made by our customers, and the time required to incorporate our systems into our customers’ design or manufacturing process; and |
| | • | | changes in the timing of product orders due to: |
| | • | unexpected delays in the introduction of products by our customers, |
| | • | shorter than expected lifecycles of our customers’ semiconductor devices, |
| | • | uncertain market acceptance of products developed by our customers, or |
| | • | our own research and development. |
We cannot predict the impact of these and other factors on our sales and operating results in any future period. Results of operations in any period, therefore, should not be considered indicative of the results to be expected for any future period. Because of this difficulty in predicting future performance, our operating results may fall below expectations of securities analysts or investors in some future quarter or quarters. Our failure to meet these expectations would likely adversely affect the market price of our common stock.
A substantial amount of the shipments of our test systems for a particular quarter occur late in the quarter. Our shipment pattern exposes us to significant risks in the event of problems during the complex process of final integration, test and acceptance prior to shipment. If we were to experience problems of this type late in our quarter, shipments could be delayed and our operating results could fall below expectations.
We depend on Jabil Circuit to produce and test our family of Fusion products, and any failures or other problems at or with Jabil could cause us to lose customers and revenues.
We have selected Jabil Circuit, Inc. to manufacture our Fusion test systems. If for any reason Jabil cannot provide us with these products and services in a timely fashion, or at all, whether due to labor shortage, slow down or stoppage, deteriorating financial or business conditions or any other reason, we would not be able to sell or ship our Fusion family of products to our customers. All of the products Jabil tests and assembles for us are assembled in one facility in Massachusetts. If this facility were to become unable to meet our production requirements, transitioning assembly to an alternative Jabil facility could result it production delays of several weeks or more. We have no written supply agreement with Jabil. We also may be unable to engage alternative production and testing services on a timely basis or upon terms favorable to us, if at all. This relationship with Jabil may not result in a reduction of our fixed expenses.
We also may be unable to engage alternative production and testing services on a timely basis or upon terms favorable to us, if at all. If we are required for any reason to seek a new manufacturer of our test systems, an alternate manufacturer may not be available and, in any event, transitioning to a new manufacturer would require a significant lead time of six months or more and would involve substantial expense and disruption of our business. Our test systems are highly sophisticated and complex capital equipment, with many custom components, and require specific technical know-how and expertise. These factors could make it more difficult for us to find a new manufacturer of our test systems if our relationship with Jabil is terminated for any reason, which would cause us to lose revenues and customers.
21
Future acquisitions may be difficult to integrate, disrupt our business, dilute stockholder value or divert management attention.
We have in the past, and may in the future, seek to acquire or invest in additional complementary businesses, products, technologies or engineers. For example, in June 2003, we completed our acquisition of StepTech, Inc. We may have to issue debt or equity securities to pay for future acquisitions, which could be dilutive to then current stockholders. We have also incurred and may continue to incur certain liabilities or other expenses in connection with acquisitions, which could continue to materially adversely affect our business, financial condition and results of operations.
Mergers and acquisitions of high-technology companies are inherently risky, and no assurance can be given that future acquisitions will be successful and will not materially adversely affect our business, operating results or financial condition. Our past and future acquisitions may involve many risks, including:
| | • | | difficulties in managing our growth following acquisitions; |
| | • | | difficulties in the integration of the acquired personnel, operations, technologies, products and systems of the acquired companies; |
| | • | | uncertainties concerning the intellectual property rights we purport to acquire; |
| | • | | unanticipated costs or liabilities associated with the acquisitions; |
| | • | | diversion of managements’ attention from other business concerns; |
| | • | | adverse effects on our existing business relationships with our or our acquired companies’ customers; |
| | • | | potential difficulties in completing projects associated with purchased in process research and development; and |
| | • | | inability to retain employees of acquired companies. |
Any of the events described in the foregoing paragraphs could have an adverse effect on our business, financial condition and results of operations and could cause the price of our common stock to decline.
Our dependence on subcontractors and sole source suppliers may prevent us from delivering an acceptable product on a timely basis.
We rely on subcontractors to manufacture Fusion and many of the components and subassemblies for our products, and we rely on sole source suppliers for certain components. We may be required to qualify new or additional subcontractors and suppliers due to capacity constraints, competitive or quality concerns or other risks that may arise, including a result of a change in control of, or deterioration in the financial condition of, a supplier or subcontractor. The process of qualifying subcontractors and suppliers is a lengthy process. Our reliance on subcontractors gives us less control over the manufacturing process and exposes us to significant risks, especially inadequate capacity, late delivery, substandard quality, and high costs. In addition, the manufacture of certain of these components and subassemblies is an extremely complex process. If a supplier became unable to provide parts in the volumes needed or at an acceptable price, we would have to identify and qualify acceptable replacements from alternative sources of supply, or manufacture such components internally. The failure to qualify acceptable replacements quickly would delay the manufacturing & delivery of our products, which could cause us to lose revenues and customers.
We are dependent on a semiconductor device manufacturer, Maxtech Components as a sole source supplier of components manufactured in accordance with our proprietary design and specifications. We have no written supply agreement with this sole source supplier and purchase our custom components through individual purchase orders.
We may not be able to deliver custom hardware options and software applications to satisfy specific customer needs in a timely manner.
We must develop and deliver customized hardware and software to meet our customers’ specific test requirements. Our test equipment may fail to meet our customers’ technical or cost requirements and may be replaced by competitive equipment or an alternative technology solution. Our inability to provide a test system that meets requested performance criteria when required by a device manufacturer would severely damage our reputation with that customer. This loss of reputation may make it substantially more difficult for us to sell test systems to that manufacturer for a number of years. We have, in the past, experienced delays in introducing some of our products and enhancements.
22
Our dependence on international sales and non-U.S. suppliers involves significant risk.
International sales have constituted a significant portion of our revenues in recent years, and we expect that this composition will continue. International sales accounted for 69% of our revenues for fiscal year 2005 and 66% of our revenues for fiscal year 2004. In addition, we rely on non-U.S. suppliers for several components of the equipment we sell. As a result, a major part of our revenues and the ability to manufacture our products are subject to the risks associated with international commerce. A reduction in revenues or a disruption or increase in the cost of our manufacturing materials could hurt our operating results. These international relationships make us particularly sensitive to changes in the countries from which we derive sales and obtain supplies. International sales and our relationships with suppliers may be hurt by many factors, including:
| | • | | changes in law or policy resulting in burdensome government controls, tariffs, restrictions, embargoes or export license requirements; |
| | • | | political and economic instability in our target international markets; |
| | • | | longer payment cycles common in foreign markets; |
| | • | | difficulties of staffing and managing our international operations; |
| | • | | less favorable foreign intellectual property laws making it harder to protect our technology from appropriation by competitors; and |
| | • | | difficulties collecting our accounts receivable because of the distance and different legal rules. |
In the past, we have incurred expenses to meet new regulatory requirements in Europe, experienced periodic difficulties in obtaining timely payment from non-U.S. customers, and been affected by the recession in several Asian countries. Our foreign sales are typically invoiced and collected in U.S. dollars. A strengthening in the dollar relative to the currencies of those countries where we do business would increase the prices of our products as stated in those currencies and could hurt our sales in those countries. Significant fluctuations in the exchange rates between the U.S. dollar and foreign currencies could cause us to lower our prices and thus reduce our profitability. These fluctuations could also cause prospective customers to push out or delay orders because of the increased relative cost of our products. In the past, there have been significant fluctuations in the exchange rates between the dollar and the currencies of countries in which we do business. While we have not entered into significant foreign currency hedging arrangements, we may do so in the future. If we do enter into foreign currency hedging arrangements, they may not be effective.
Our market is highly competitive, and we have limited resources to compete.
The test equipment industry is highly competitive in all areas of the world. Many other domestic and foreign companies participate in the markets for each of our products, and the industry is highly competitive. Our competitors in the market for semiconductor test equipment include Advantest, Agilent Technologies, Credence Systems, and Teradyne. These major competitors have substantially greater financial resources and more extensive engineering, manufacturing, marketing, and customer support capabilities.
We expect our competitors to enhance their current products and to introduce new products with comparable or better price and performance. The introduction of competing products could hurt sales of our current and future products. In addition, new competitors, including semiconductor manufacturers themselves, may offer new testing technologies, which may in turn reduce the value of our product lines. Increased competition could lead to intensified price-based competition, which would hurt our business and results of operations. Unless we are able to invest significant financial resources in developing products and maintaining customer support centers worldwide, we may not be able to compete effectively.
Development of our products requires significant lead-time, and we may fail to correctly anticipate the technical needs of our customers.
Our customers make decisions regarding purchases of our test equipment while their devices are still in development. Our test systems are used by our customers to develop, test and manufacture their new devices. We therefore must anticipate industry trends and develop products in advance of the commercialization of our customers’ devices, requiring us to make significant capital investments to develop new test equipment for our customers well before their devices are introduced. If our customers fail to introduce their devices in a timely manner or the market does not accept their devices, we may not recover our capital investment through sales in significant volume. In addition, even if we are able to successfully develop enhancements or new generations of our products, these enhancements or new generations of products may not generate revenue in excess of the costs of development, and they may be quickly rendered obsolete by changing customer preferences or the introduction of products embodying new technologies or features by our competitors. Furthermore, if we were to make announcements of product delays, or if our competitors were to make announcements of new test systems, these announcements could cause our customers to defer or forego purchases of our existing test systems, which would also hurt our business.
23
Our success depends on attracting and retaining key personnel.
Our success will depend substantially upon the continued service of our executive officers and key personnel, none of whom are bound by an employment or non-competition agreement. Our success will depend on our ability to attract and retain highly qualified managers and technical, engineering, marketing, sales and support personnel. Competition for such specialized personnel is intense, and it may become more difficult for us to hire or retain them. Our volatile business cycles only aggravate this problem. Our layoffs in any industry downturn could make it more difficult for us to hire or retain qualified personnel. Our business, financial condition and results of operations could be materially adversely affected by the loss of any of our key employees, by the failure of any key employee to perform in his or her current positions, or by our inability to attract and retain skilled employees.
We may not be able to protect our intellectual property rights.
Our success depends in part on our ability to obtain intellectual property rights and licenses and to preserve other intellectual property rights covering our products and development and testing tools. To that end, we have obtained certain domestic patents and may continue to seek patents on our inventions when appropriate. We have also obtained certain trademark registrations. To date, we have not sought patent protection in any countries other than the United States, which may impair our ability to protect our intellectual property in foreign jurisdictions. The process of seeking intellectual property protection can be time consuming and expensive. We cannot ensure that:
| | • | | patents will issue from currently pending or future applications; |
| | • | | our existing patents or any new patents will be sufficient in scope or strength to provide meaningful protection or any commercial advantage to us; |
| | • | | foreign intellectual property laws will protect our intellectual property rights; or |
| | • | | others will not independently develop similar products, duplicate our products or design around our technology. |
If we do not successfully enforce our intellectual property rights, our competitive position could suffer, which could harm our operating results. We also rely on trade secrets, proprietary know-how and confidentiality provisions in agreements with employees and consultants to protect our intellectual property. Other parties may not comply with the terms of their agreements with us, and we may not be able to adequately enforce our rights against these people.
Third parties may claim we are infringing their intellectual property, and we could suffer significant litigation costs, licensing expenses or be prevented from selling our products.
Intellectual property rights are uncertain and involve complex legal and factual questions. We may be unknowingly infringing on the intellectual property rights of others and may be liable for that infringement, which could result in significant liability for us. If we do infringe the intellectual property rights of others, we could be forced to either seek a license to intellectual property rights of others or alter our products so that they no longer infringe the intellectual property rights of others. A license could be very expensive to obtain or may not be available at all. Similarly, changing our products or processes to avoid infringing the rights of others may be costly or impractical.
We are responsible for any patent litigation costs. If we were to become involved in a dispute regarding intellectual property, whether ours or that of another company, we may have to participate in legal proceedings. These types of proceedings may be costly and time consuming for us, even if we eventually prevail. If we do not prevail, we might be forced to pay significant damages, obtain licenses, modify our products or processes, stop making products or stop using processes.
Our stock price is volatile.
In the twelve-month period ending on July 31, 2005, our stock price ranged from a low of $3.53 to a high of $8.09. The price of our common stock has been and likely will continue to be subject to wide fluctuations in response to a number of events and factors, such as:
| | • | | quarterly variations in operating results; |
| | • | | variances of our quarterly results of operations from securities analyst estimates; |
| | • | | changes in financial estimates and recommendations by securities analysts; |
24
| | • | | announcements of technological innovations, new products, or strategic alliances; and |
| | • | | news reports relating to trends in our markets. |
In addition, the stock market in general, and the market prices for semiconductor-related companies in particular, have experienced significant price and volume fluctuations that often have been unrelated to the operating performance of the companies affected by these fluctuations. These broad market fluctuations may adversely affect the market price of our common stock, regardless of our operating performance.
We have substantial indebtedness.
We have $88.3 million principal amount of 4.25% Convertible Subordinated Notes (the “Notes”) due 2006, as well as $60.0 million in principal outstanding under a commercial loan. We may incur substantial additional indebtedness in the future. The level of indebtedness, among other things, could
| | • | | make it difficult for us to make payments on our debt and other obligations; |
| | • | | make it difficult for us to obtain any necessary future financing for working capital, capital expenditures, debt service requirements or other purposes; |
| | • | | require the dedication of a substantial portion of any cash flow from operations to service for indebtedness, thereby reducing the amount of cash flow available for other purposes, including capital expenditures; |
| | • | | limit our flexibility in planning for, or reacting to changes in, its business and the industries in which we compete; |
| | • | | place us at a possible competitive disadvantage with respect to less leveraged competitors and competitors that have better access to capital resource; and |
| | • | | make us more vulnerable in the event of a further downturn in our business. |
There can be no assurance that we will be able to meet our debt service obligations, including our obligations under the Notes.
We may not be able to satisfy a change in control offer.
The indenture governing the Notes contains provisions that apply to a change in control of LTX. If someone triggers a fundamental change as defined in the indenture, we may be required to offer to purchase the Notes with cash. If we have to make that offer, we cannot be sure that we will have enough funds to pay for all the Notes that the holders could tender.
We may not be able to pay our debt and other obligations.
If our cash flow is inadequate to meet our obligations, we could face substantial liquidity problems. In particular, our Notes mature in August 2006. One of our credit facilities will expire in October 2005, if not renewed by us and the issuing bank. If we are unable to generate sufficient cash flow or otherwise obtain funds necessary to make required payment of our Notes, or certain or our other obligations, we would be in default under the terms thereof, which could permit the holders of those obligations to accelerate their maturity and also could cause default under future indebtedness we may incur. Any such default could have material adverse effect on our business, prospects, financial position and operating results. In addition, we may not be able to repay amounts due in respect of our Notes if payment of those obligations were to be accelerated following the occurrence of any other event of default as defined in the instruments creating those obligations. Moreover, we may not have sufficient funds or be able to arrange for financing to pay the principal amount of our Notes at their maturity.
We may need additional financing, which could be difficult to obtain.
We expect that our existing cash and marketable securities, and borrowings from available bank financings, will be sufficient to meet our cash requirements to fund operations and expected capital expenditures for the foreseeable future. In the event, we may need to raise additional funds, we cannot be certain that we will be able to obtain such additional financing on favorable terms if at all. Further, if we issue additional equity securities, stockholders may experience additional dilution or the new equity securities may have rights, preferences or privileges senior to those of existing holders of common stock. Future financings may place restrictions on how we operate our business. If we cannot raise funds on acceptable terms, if and when needed, we may not be able to develop or enhance our products and services, take advantage of future opportunities, grow our business or respond to competitive pressures, which could seriously harm our business.
25
Item 7A. Quantitative and Qualitative Disclosures About Market Risk
Financial instruments that potentially subject us to concentrations of credit-risk consist principally of investments in cash equivalents, short-term investments and trade receivables. We place our investments with high-quality financial institutions, limit the amount of credit exposure to any one institution and have established investment guidelines relative to diversification and maturities designed to maintain safety and liquidity.
Our primary exposures to market risks include fluctuations in interest rates on our short-term and long-term debt of approximately $148.3 million as of July 31, 2005, and in foreign currency exchange rates. We are subject to interest rate risk on our short-term and long-term borrowings under our credit and loan facilities. Our short-term and long-term bank debt bears interest at prime. Long-term debt interest rates are fixed for the term of the Notes.
Foreign Currency Exchange Risk
Operating in international markets involves exposure to movements in currency exchange rates. Currency exchange rate movements typically also reflect economic growth, inflation, interest rates, government actions and other factors. We transact business in various foreign currencies and, accordingly, we are subject to exposure from adverse movements in foreign currency exchange rates. As currency exchange rates fluctuate, translation of the statements of operations of our international businesses into U.S. dollars may affect year-over-year comparability and could cause us to adjust our financing and operating strategies. To date, the effect of changes in foreign currency exchange rates on revenues and operating expenses have not been material. Substantially all of our revenues are invoiced and collected in U.S. dollars. Our trade receivables result primarily from sales to semiconductor manufacturers located in North America, Japan, the Pacific Rim and Europe. In fiscal 2005, our revenues derived from sales outside the United States constituted 69% of our total revenues. Accounts receivable in currencies other than U.S. dollars comprise 2.6% of the outstanding accounts receivable trade balance at July 31, 2005. Receivables are from major corporations or are supported by letters of credit. We maintain reserves for potential credit losses and such losses have been immaterial. Accounts payable in currencies other than U.S. dollars comprise 5.6% of the outstanding accounts payable balance at July 31, 2005.
Based on a hypothetical 10% adverse movement in foreign currency exchange rates, the potential losses in future earnings, fair value of risk-sensitive financial instruments, and cash flows are immaterial, although the actual effects may differ materially from the hypothetical analysis.
Interest Rate Risk
The Company’s Convertible Subordinated Notes bear interest at a fixed rate of 4.25%, and therefore changes in interest rates do not impact the Company’s interest expense on this debt. However, the Company’s term loan bears interest at the lender’s variable prime rate. The Company may also, from time to time, have other outstanding short-term and long-term borrowings with variable interest rates. The Company expects that a 1% change in interest rates would affect the Company’s interest expense by $0.6 million per year.
26
Item 8. Financial Statements and Supplementary Data
LTX CORPORATION
CONSOLIDATED BALANCE SHEETS
(In thousands, except share data)
| | | | | | | | |
| | | July 31,
| |
| | | 2005
| | | 2004
| |
| ASSETS | | | | | | | | |
Current assets: | | | | | | | | |
Cash and cash equivalents | | $ | 55,269 | | | $ | 95,112 | |
Marketable securities | | | 122,205 | | | | 149,601 | |
Accounts receivable—trade, net of allowances of $1,906 and $2,016, respectively | | | 19,776 | | | | 32,961 | |
Accounts receivable—other | | | 5,497 | | | | 11,494 | |
Inventories | | | 41,181 | | | | 69,220 | |
Prepaid expense | | | 4,942 | | | | 9,828 | |
| | |
|
|
| |
|
|
|
Total current assets | | | 248,870 | | | | 368,216 | |
Property and equipment, net | | | 47,135 | | | | 71,329 | |
Goodwill and other intangible assets | | | 16,162 | | | | 15,763 | |
Other assets | | | 4,225 | | | | 4,256 | |
| | |
|
|
| |
|
|
|
Total assets | | $ | 316,392 | | | $ | 459,564 | |
| | |
|
|
| |
|
|
|
| LIABILITIES AND STOCKHOLDERS’ EQUITY | | | | | | | | |
Current liabilities: | | | | | | | | |
Current portion of long-term debt | | $ | 606 | | | $ | 321 | |
Accounts payable | | | 27,934 | | | | 37,438 | |
Deferred revenues and customer advances | | | 2,712 | | | | 3,520 | |
Deferred gain on leased equipment | | | 2,215 | | | | 6,852 | |
Other accrued expenses | | | 32,390 | | | | 27,179 | |
| | |
|
|
| |
|
|
|
Total current liabilities | | | 65,857 | | | | 75,310 | |
| | |
Long-term debt, less current portion | | | 147,687 | | | | 150,000 | |
| | |
Stockholders’ equity: | | | | | | | | |
Common stock, $0.05 par value: | | | | | | | | |
100,000,000 shares authorized; 61,531,881 and 60,903,163 shares issued and outstanding, respectively | | | 3,077 | | | | 3,045 | |
Additional paid-in capital | | | 558,192 | | | | 555,447 | |
Unrealized loss on marketable securities | | | (1,563 | ) | | | (106 | ) |
Accumulated deficit | | | (456,858 | ) | | | (324,132 | ) |
| | |
|
|
| |
|
|
|
Total stockholders’ equity | | | 102,848 | | | | 234,254 | |
| | |
|
|
| |
|
|
|
Total liabilities and stockholders’ equity | | $ | 316,392 | | | $ | 459,564 | |
| | |
|
|
| |
|
|
|
The accompanying notes are an integral part of these consolidated financial statements.
27
LTX CORPORATION
CONSOLIDATED STATEMENTS OF OPERATIONS AND COMPREHENSIVE INCOME
(In thousands, except per share data)
| | | | | | | | | | | | |
| | | Year ended July 31,
| |
| | | 2005
| | | 2004
| | | 2003
| |
Net product sales | | $ | 103,026 | | | $ | 217,310 | | | $ | 87,346 | |
Net service sales | | | 31,505 | | | | 38,491 | | | | 32,103 | |
| | |
|
|
| |
|
|
| |
|
|
|
Net sales | | | 134,531 | | | | 255,801 | | | | 119,449 | |
Cost of sales | | | 90,806 | | | | 154,672 | | | | 97,368 | |
Inventory related provision | | | 47,457 | | | | — | | | | 48,483 | |
| | |
|
|
| |
|
|
| |
|
|
|
Gross profit (loss) | | | (3,732 | ) | | | 101,129 | | | | (26,402 | ) |
Engineering and product development expenses | | | 66,302 | | | | 67,655 | | | | 66,088 | |
Selling, general and administrative expenses | | | 29,366 | | | | 28,037 | | | | 27,321 | |
In-process research and development | | | — | | | | — | | | | 16,100 | |
Reorganization costs | | | 31,726 | | | | — | | | | 6,696 | |
| | |
|
|
| |
|
|
| |
|
|
|
Income (loss) from operations | | | (131,126 | ) | | | 5,437 | | | | (142,607 | ) |
| | | | | | | | | | | | | |
Other income (expense): | | | | | | | | | | | | |
Interest expense | | | (6,832 | ) | | | (6,626 | ) | | | (6,747 | ) |
Investment income | | | 5,232 | | | | 3,150 | | | | 4,286 | |
| | |
|
|
| |
|
|
| |
|
|
|
Net income (loss) | | $ | (132,726 | ) | | $ | 1,961 | | | $ | (145,068 | ) |
| | |
|
|
| |
|
|
| |
|
|
|
Net income (loss) per share: | | | | | | | | | | | | |
Basic | | $ | (2.17 | ) | | $ | 0.04 | | | $ | (2.92 | ) |
| | |
|
|
| |
|
|
| |
|
|
|
Diluted | | $ | (2.17 | ) | | $ | 0.03 | | | $ | (2.92 | ) |
| | |
|
|
| |
|
|
| |
|
|
|
Weighted-average common shares used in computing net income (loss) per share: | | | | | | | | | | | | |
Basic | | | 61,144 | | | | 55,927 | | | | 49,614 | |
| | |
|
|
| |
|
|
| |
|
|
|
Diluted | | | 61,144 | | | | 58,057 | | | | 49,614 | |
| | |
|
|
| |
|
|
| |
|
|
|
Comprehensive income: | | | | | | | | | | | | |
Net income (loss) | | $ | (132,726 | ) | | $ | 1,961 | | | $ | (145,068 | ) |
Unrealized loss on marketable securities | | | (1,457 | ) | | | (857 | ) | | | (140 | ) |
| | |
|
|
| |
|
|
| |
|
|
|
Comprehensive income (loss) | | $ | (134,183 | ) | | $ | 1,104 | | | $ | (145,208 | ) |
| | |
|
|
| |
|
|
| |
|
|
|
The accompanying notes are an integral part of these consolidated financial statements.
28
LTX CORPORATION
CONSOLIDATED STATEMENTS OF STOCKHOLDERS’ EQUITY
(In thousands, except share data)
| | | | | | | | | | | | | | | | | | | | | |
| | | For the Three Years Ended July 31, 2005
| |
| | | Common Stock
| | | Additional
Paid-In
Capital
| | Unrealized
Gain (Loss) On
Marketable
Securities
| | | Accumulated Deficit
| | | Total
Stockholders’
Equity
| |
| | | Shares
| | Amount
| | | | | |
Balance at July 31, 2002 | | 49,184,962 | | $ | 2,599 | | | $ | 403,068 | | $ | 891 | | | $ | (181,025 | ) | | $ | 225,533 | |
Exercise of stock options | | 153,474 | | | 7 | | | | 316 | | | — | | | | — | | | | 323 | |
Acquisition of StepTech, Inc. | | 1,995,625 | | | 100 | | | | 17,003 | | | — | | | | — | | | | 17,103 | |
Issuance of shares under employees’ stock purchase plan and other | | 299,737 | | | 15 | | | | 1,322 | | | — | | | | — | | | | 1,337 | |
Unrealized loss on marketable securities | | — | | | — | | | | — | | | (140 | ) | | | — | | | | (140 | ) |
Net loss | | — | | | — | | | | — | | | — | | | | (145,068 | ) | | | (145,068 | ) |
| | |
| |
|
|
| |
|
| |
|
|
| |
|
|
| |
|
|
|
Balance at July 31, 2003 | | 51,633,798 | | | 2,721 | | | | 421,709 | | | 751 | | | | (326,093 | ) | | | 99,088 | |
Exercise of stock options | | 797,482 | | | 40 | | | | 4,324 | | | — | | | | — | | | | 4,364 | |
StepTech escrow share release | | 144,062 | | | 7 | | | | 1,092 | | | — | | | | — | | | | 1,099 | |
Issuance of shares under employees’ stock purchase plan and other | | 277,821 | | | (126 | ) | | | 2,200 | | | — | | | | — | | | | 2,074 | |
Unrealized loss on marketable securities | | — | | | — | | | | — | | | (857 | ) | | | — | | | | (857 | ) |
Public offering of common stock | | 8,050,000 | | | 403 | | | | 126,122 | | | — | | | | — | | | | 126,525 | |
Net income | | — | | | — | | | | — | | | — | | | | 1,961 | | | | 1,961 | |
| | |
| |
|
|
| |
|
| |
|
|
| |
|
|
| |
|
|
|
Balance at July 31, 2004 | | 60,903,163 | | | 3,045 | | | | 555,447 | | | (106 | ) | | | (324,132 | ) | | | 234,254 | |
Exercise of stock options | | 196,169 | | | 11 | | | | 264 | | | | | | | | | | | 275 | |
StepTech escrow share release | | 144,063 | | | 7 | | | | 1,092 | | | — | | | | — | | | | 1,099 | |
Issuance of shares under employees’ stock purchase plan and other | | 288,486 | | | 14 | | | | 1,389 | | | — | | | | — | | | | 1,403 | |
Unrealized loss on marketable securities | | — | | | — | | | | — | | | (1,457 | ) | | | — | | | | (1,457 | ) |
Net loss | | — | | | — | | | | — | | | — | | | | (132,726 | ) | | | (132,726 | ) |
| | |
| |
|
|
| |
|
| |
|
|
| |
|
|
| |
|
|
|
Balance at July 31, 2005 | | 61,531,881 | | $ | 3,077 | | | $ | 558,192 | | $ | (1,563 | ) | | $ | (456,858 | ) | | $ | 102,848 | |
| | |
| |
|
|
| |
|
| |
|
|
| |
|
|
| |
|
|
|
The accompanying notes are an integral part of these consolidated financial statements.
29
LTX CORPORATION
CONSOLIDATED STATEMENTS OF CASH FLOWS
(In thousands)
| | | | | | | | | | | | |
| | | Year ended July 31,
| |
| | | 2005
| | | 2004
| | | 2003
| |
Cash Flows from Operating Activities: | | | | | | | | | | | | |
Net income (loss) | | $ | (132,726 | ) | | $ | 1,961 | | | $ | (145,068 | ) |
Add (deduct) non-cash items: | | | | | | | | | | | | |
Depreciation and amortization | | | 18,494 | | | | 18,699 | | | | 16,896 | |
In-process research and development charge | | | — | | | | — | | | | 16,100 | |
Asset impairment | | | 18,058 | | | | — | | | | — | |
Charge for inventory related provision | | | 47,457 | | | | — | | | | 48,483 | |
Other | | | (1,493 | ) | | | 645 | | | | 1,221 | |
(Increase) decrease in: | | | | | | | | | | | | |
Accounts receivable | | | 19,286 | | | | (27,095 | ) | | | 12,316 | |
Inventories | | | (19,354 | ) | | | (2,389 | ) | | | (19,694 | ) |
Prepaid expenses | | | 4,905 | | | | 1,276 | | | | 19,705 | |
Other assets | | | (337 | ) | | | 893 | | | | 485 | |
Increase (decrease) in: | | | | | | | | | | | | |
Accounts payable | | | (9,570 | ) | | | 23,816 | | | | (10,566 | ) |
Accrued expenses | | | 5,237 | | | | 663 | | | | (4,871 | ) |
Deferred revenues and customer advances | | | (5,436 | ) | | | (4,738 | ) | | | (4,844 | ) |
| | |
|
|
| |
|
|
| |
|
|
|
Net cash (used in) provided by operating activities | | | (55,479 | ) | | | 13,731 | | | | (69,837 | ) |
| | | |
Cash Flows from Investing Activities: | | | | | | | | | | | | |
Acquisition investment, net of cash acquired | | | — | | | | — | | | | (6,533 | ) |
Expenditures for property and equipment | | | (11,616 | ) | | | (17,496 | ) | | | (17,506 | ) |
Purchases of marketable securities | | | (112,890 | ) | | | (240,414 | ) | | | (117,706 | ) |
Proceeds from sale of marketable securities | | | 138,830 | | | | 153,372 | | | | 126,981 | |
| | |
|
|
| |
|
|
| |
|
|
|
Net cash provided by (used in) investing activities | | | 14,324 | | | | (104,538 | ) | | | (14,764 | ) |
| | | |
Cash Flows from Financing Activities: | | | | | | | | | | | | |
Proceeds from stock plans: | | | | | | | | | | | | |
Employees’ stock purchase plan | | | 1,403 | | | | 2,086 | | | | 1,356 | |
Exercise of stock options | | | 275 | | | | 4,364 | | | | 323 | |
Proceeds from equity offering, net | | | — | | | | 126,525 | | | | — | |
(Payment) advances of short-term debt | | | (217 | ) | | | (19,459 | ) | | | 4,589 | |
Proceeds from term loan | | | 60,000 | | | | — | | | | — | |
Proceeds from lease financing | | | — | | | | — | | | | 9,184 | |
Payments of long-term debt | | | (60,057 | ) | | | (1,022 | ) | | | (2,026 | ) |
| | |
|
|
| |
|
|
| |
|
|
|
Net cash provided by financing activities | | | 1,404 | | | | 112,494 | | | | 13,426 | |
Effect of exchange rate changes on cash | | | (92 | ) | | | 258 | | | | (125 | ) |
| | |
|
|
| |
|
|
| |
|
|
|
Net (decrease) increase in cash and cash equivalents | | | (39,843 | ) | | | 21,945 | | | | (71,300 | ) |
Cash and cash equivalents at beginning of year | | | 95,112 | | | | 73,167 | | | | 144,467 | |
| | |
|
|
| |
|
|
| |
|
|
|
Cash and cash equivalents at end of year | | $ | 55,269 | | | $ | 95,112 | | | $ | 73,167 | |
| | |
|
|
| |
|
|
| |
|
|
|
Supplemental Disclosures of Cash Flow Information: | | | | | | | | | | | | |
Cash paid during the year for interest | | $ | 7,431 | | | $ | 3,748 | | | $ | 9,699 | |
| | |
|
|
| |
|
|
| |
|
|
|
The accompanying notes are an integral part of these consolidated financial statements.
30
LTX CORPORATION
NOTES TO CONSOLIDATED FINANCIAL STATEMENTS
1. THE COMPANY
LTX Corporation (“LTX” or the “Company”) designs, manufactures, and markets automatic semiconductor test equipment. Semiconductor designers and manufacturers worldwide use semiconductor test equipment to test devices at different stages during the manufacturing process. These devices are incorporated in a wide range of products, including mobile internet equipment such as wireless access points and interfaces, broadband access products such as cable modems and DSL modems, personal communication products such as cell phones and personal digital assistants, consumer products such as televisions, videogame systems, digital cameras and automobile electronics, and for power management in portable and automotive electronics. The Company also sells hardware and software support and maintenance services for its test systems. The Company is headquartered, and has development and manufacturing facilities, in Westwood, Massachusetts, a development facility in San Jose, California, and worldwide sales and service facilities to support its customer base.
2. SUMMARY OF SIGNIFICANT ACCOUNTING POLICIES
Basis of Presentation
The consolidated financial statements include the accounts of the Company and its wholly owned domestic subsidiaries and wholly owned foreign subsidiaries. All significant intercompany transactions and balances have been eliminated in consolidation. Certain reclassifications have been made to previously reported financial data to conform to the 2005 presentation.
Preparation of Financial Statements and Use of Estimates
The accompanying financial statements have been prepared by the Company, and reflect all adjustments, which, in the opinion of management, are necessary for fair statement of the results. The preparation of financial statements in conformity with generally accepted accounting principles requires management to make estimates and assumptions that affect the reported amounts of assets and liabilities and disclosures of contingent assets and liabilities as of the date of the financial statements and the reported amounts of income and expenses during the reporting periods.
Foreign Currency Translation
The financial statements of the Company’s foreign subsidiaries are translated in accordance with Statement of Financial Accounting Standards (“SFAS”) No. 52, “Foreign Currency Translation”. The Company’s functional currency is the U.S. dollar. Accordingly, the Company’s foreign subsidiaries translate monetary assets and liabilities at year-end exchange rates while non-monetary items are translated at historical rates. Income and expense accounts are translated at the average rates in effect during the year, except for sales, cost of sales and depreciation, which are primarily translated at historical rates. Net realized gains or losses resulting from foreign currency remeasurement and transaction gains or losses were a gain of $17,000 and $234,000 and loss of $143,000 in fiscal 2005, 2004 and 2003, respectively. Transaction gains and losses are included in the consolidated results of operations.
Revenue Recognition
The Company recognizes revenue based on guidance provided in SEC Staff Accounting Bulletin No. 101 (SAB 101), “Revenue Recognition in Financial Statements” and SAB 104, “Revenue Recognition”. In December 2003, the SEC issued SAB 104, “Revenue Recognition”, which codifies, revises and rescinds certain sections of SAB 101. The Company recognizes revenue when persuasive evidence of an arrangement exists, delivery has occurred or services have been rendered, the seller’s price is fixed or determinable and collectibility is reasonably assured.
Revenue related to equipment sales is recognized when: (a) we have a written sales agreement; (b) delivery has occurred or services rendered; (c) the price is fixed or determinable; (d) collectibility is reasonably assured; (e) the product delivered is proven technology with historically demonstrated acceptance; and (f) there is no unique customer acceptance provision or payment tied to acceptance or an undelivered element significant to the functionality of the system. Generally, payment terms are net 30 days from shipment. Certain sales include payment terms tied to customer acceptance. If a portion of the payment is linked to product acceptance, which is 20% or less, the revenue is deferred on only the percentage holdback until payment is received or written evidence of acceptance is delivered to the Company. If the portion of the holdback is greater than 20%, the full value of the equipment is deferred until payment is received or written evidence of acceptance is delivered to the Company. When sales to a customer involve multiple elements, revenue is recognized on the delivered element provided that (1) the undelivered element is a proven technology, (2) there is a history of acceptance on the product with the customer, (3) the undelivered element is not essential to the customer’s
31
LTX CORPORATION
NOTES TO CONSOLIDATED FINANCIAL STATEMENTS (Continued)
application, (4) the delivered item(s) has value to the customer on a stand-alone basis, (5) objective and reliable evidence of the fair value of the undelivered item(s) exists, (6) if the arrangement included a general right of return relative to the delivered item(s),delivery or performance of the undelivered item(s) is considered probable and substantially in the control of the Company, and (7) if objective and reliable evidence of fair value exists for all units of accounting in the arrangement, the arrangement consideration is allocated based on the relative fair values of each unit of accounting. If the fair value of a delivered item is unknown, but the fair value of undelivered items are known, the residual method is used for allocating arrangement consideration. Revenue related to spare parts is recognized on shipment. Revenue related to maintenance and service contracts is recognized ratably over the duration of the contracts.
Allowance for Doubtful Accounts
An allowance for doubtful accounts is maintained for potential credit losses based upon assessment of the expected collectibility of all accounts receivable. The allowance for doubtful accounts is reviewed periodically to assess the adequacy of the allowances. In any circumstances in which we are aware of a customer’s inability to meet its financial obligations, we take a certain percentage of the accounts receivable balance as an allowance, which is based on the age of the receivables, the circumstances surrounding the customer’s financial situation and our historical experience. If circumstances change, and the financial condition of our customers were adversely affected resulting in their inability to meet their financial obligations to us, we may need to record additional allowances.
Engineering and Product Development Costs
The Company expenses all engineering, research and development costs as incurred. Expenses subject to capitalization in accordance with the SFAS No. 86, “Accounting for the Costs of Computer Software To Be Sold, Leased or Otherwise Marketed”, relating to certain software development costs, were insignificant.
Shipping and Handling Costs
Shipping and handling costs are included in cost of sales in the consolidated statements of operations. Shipping and handling costs were $0.8 million, $1.7 million, and $1.1 million for fiscal years July 31, 2005, 2004, and 2003, respectively. These costs, when included in the sales price charged for products, are recognized in net sales.
Income Taxes
In accordance with SFAS No. 109, “Accounting for Income Taxes”, the Company recognizes deferred income taxes based on the expected future tax consequences of differences between the financial statement bases and the tax bases of assets and liabilities, calculated using enacted tax rates in effect for the year in which the differences are expected to be reflected in the tax return. Research and development tax credits are recognized for financial reporting purposes to the extent that they can be used to reduce the tax provision.
Accounting for Stock-Based Compensation
The Company, as permitted by SFAS No. 123, “Accounting for Stock-Based Compensation”, as amended by SFAS No. 148 “Accounting for Stock-Based Compensation Transition and Disclosure”, has elected to continue to apply the provisions of APB Opinion No. 25, “Accounting for Stock Issued to Employees”, and related interpretations in accounting for its employee stock option and stock purchase plans. No stock-based employee compensation is reflected in net income (loss), as all options granted under those plans had an exercise price equal to the market value of the underlying common stock on the date of grant.
32
LTX CORPORATION
NOTES TO CONSOLIDATED FINANCIAL STATEMENTS (Continued)
The following table illustrates the effect on net income (loss) and net income (loss) per share if the Company had applied the fair value recognition provision of SFAS No. 123 to stock-based employee compensation:
| | | | | | | | | | | | |
| | | Year ended July 31,
| |
| | | 2005
| | | 2004
| | | 2003
| |
| | | (in thousands except per share) | |
Net income (loss): | | | | | | | | | | | | |
As reported | | $ | (132,726 | ) | | $ | 1,961 | | | $ | (145,068 | ) |
Deduct: Total stock-based employee compensation expense determined under fair value based method for all awards, net of related tax effects | | | 26,090 | | | | 17,640 | | | | 12,904 | |
| | |
|
|
| |
|
|
| |
|
|
|
Pro forma | | $ | (158,816 | ) | | $ | (15,679 | ) | | $ | (157,972 | ) |
| | |
|
|
| |
|
|
| |
|
|
|
Net income (loss) per share: | | | | | | | | | | | | |
Basic | | | | | | | | | | | | |
As reported | | $ | (2.17 | ) | | $ | 0.04 | | | $ | (2.92 | ) |
Pro forma | | | (2.60 | ) | | | (0.28 | ) | | | (3.18 | ) |
Diluted | | | | | | | | | | | | |
As reported | | | (2.17 | ) | | | 0.03 | | | | (2.92 | ) |
Pro forma | | | (2.60 | ) | | | (0.28 | ) | | | (3.18 | ) |
The fair value of each option grant is estimated on the grant date using the Black-Scholes option-pricing model with the following weighted average assumptions:
| | | | | | | | | |
| | | Year ended July 31,
| |
| | | 2005
| | | 2004
| | | 2003
| |
Volatility | | 80 | % | | 87 | % | | 88 | % |
Dividend yield | | 0 | % | | 0 | % | | 0 | % |
Risk-free interest rate | | 4.11 | % | | 4.78 | % | | 4.43 | % |
Expected life of options | | 7.18 years | | | 8.83 years | | | 8.31 years | |
The Black-Scholes option valuation model was developed for use in estimating the fair value of traded options that have no vesting restrictions and are fully transferable. In addition, option-pricing models require the input of highly subjective assumptions. Because the Company’s employee stock options have characteristics significantly different from those of traded options, and because changes in the subjective input assumptions can materially affect the fair value estimate, in management’s opinion, the existing models do not necessarily provide a reliable single measure of the fair value of its employee stock options.
Product Warranty Costs
Our products are sold with warranty provisions that require us to remedy deficiencies in quality or performance of our products over a specified period of time at no cost to our customers. Our policy is to establish warranty reserves at levels that represent our estimate of the costs that will be incurred to fulfill those warranty requirements at the time that revenue is recognized.
The following table shows the change in the product warranty liability, as required by FASB Interpretation No. (FIN) 45, “Guarantor’s Accounting and Disclosure Requirements for Guarantees, Including Indirect Guarantees of Indebtedness of Others”, for the fiscal years ended July 31, 2005 and 2004:
| | | | | | | | |
Product Warranty Activity
| | (in thousands)
| |
| | 2005
| | | 2004
| |
Balance at beginning of period | | $ | 4,394 | | | $ | 1,935 | |
Warranty expenditures for current period | | | (6,186 | ) | | | (6,933 | ) |
Changes in liability related to pre-existing warranties | | | 74 | | | | 375 | |
Provision for warranty costs in the period | | | 4,261 | | | | 9,017 | |
| | |
|
|
| |
|
|
|
Balance at end of period | | $ | 2,543 | | | $ | 4,394 | |
| | |
|
|
| |
|
|
|
33
LTX CORPORATION
NOTES TO CONSOLIDATED FINANCIAL STATEMENTS (Continued)
Comprehensive Income
Comprehensive income is comprised of two components, net income and other comprehensive income. Other comprehensive income consists of unrealized gains and losses on the Company’s marketable securities.
Net Income (Loss) per Share
Basic net income (loss) per common share is computed by dividing net income (loss) available to common stockholders by the weighted average number of common shares outstanding for the period. Diluted income (loss) per common share reflects the maximum dilution that would have resulted from the assumed exercise and share repurchase related to dilutive stock options and is computed by dividing net income (loss) by the weighted average number of common shares and all dilutive securities outstanding.
A reconciliation between basic and diluted earnings (loss) per share is as follows:
| | | | | | | | | | | |
| | | Fiscal Year Ended July 31,
| |
| | | 2005
| | | 2004
| | 2003
| |
| | | (in thousands, except per share data) | |
Net income (loss) | | $ | (132,726 | ) | | $ | 1,961 | | $ | (145,068 | ) |
Basic EPS | | | | | | | | | | | |
Basic common shares | | | 61,144 | | | | 55,927 | | | 49,614 | |
Basic EPS | | $ | (2.17 | ) | | $ | 0.04 | | $ | (2.92 | ) |
Diluted EPS | | | | | | | | | | | |
Basic common shares | | | 61,144 | | | | 55,927 | | | 49,614 | |
Plus: impact of stock options and warrants | | | — | | | | 2,130 | | | — | |
| | |
|
|
| |
|
| |
|
|
|
Diluted common shares | | | 61,144 | | | | 58,057 | | | 49,614 | |
Diluted EPS | | $ | (2.17 | ) | | $ | 0.03 | | $ | (2.92 | ) |
Options to purchase 8,077,136, 4,224,203, and 4,242,703 shares of common stock were outstanding at July 31, 2005, 2004, and 2003, respectively, but were not included in the calculation of diluted shares because the effect of including the options would have been anti-dilutive.
Cash and Cash Equivalents and Marketable Securities
The Company considers all highly liquid investments that are readily convertible to cash and that have original maturity dates of three months or less to be cash equivalents. Cash and cash equivalents consist primarily of repurchase agreements and commercial paper. Marketable securities consist primarily of debt securities that are classified as available-for-sale, in accordance with the SFAS No. 115, “Accounting for Certain Investments in Debt and Equity Securities”. Securities available for sale include corporate and governmental obligations with various contractual maturity dates some of which are greater than one year. The Company considers the securities to be liquid and convertible to cash within 30 days. The Company has the ability and intent, if necessary, to liquidate any security that the Company holds to fund operations over the next twelve months and as such has classified these securities as short-term. Governmental obligations include U.S. Government, State, Municipal and Federal Agency securities.
The market value and maturities of the Company’s marketable securities are as follows:
| | | |
| | | Total Amount
|
| | | (in thousands) |
July 31, 2005 | | | |
Due in less than one year | | $ | 30,401 |
Due in 1 to 3 years | | | 33,171 |
Due in 3 to 5 years | | | 25,965 |
Due in 5 to 10 years | | | 12,746 |
Due in greater than 10 years | | | 19,922 |
| | |
|
|
Total | | $ | 122,205 |
| | |
|
|
34
LTX CORPORATION
NOTES TO CONSOLIDATED FINANCIAL STATEMENTS (Continued)
The market value and amortized cost of marketable securities are as follows:
| | | | | | |
| | | Market
Value
| | Amortized
Cost
|
| | | (in thousands) |
July 31, 2005 | | | | | | |
Corporate | | $ | 100,833 | | $ | 101,356 |
Government | | | 21,372 | | | 21,370 |
| | |
|
| |
|
|
| | | $ | 122,205 | | $ | 122,726 |
| | |
|
| |
|
|
July 31, 2004 | | | | | | |
Corporate | | $ | 134,216 | | $ | 133,422 |
Government | | | 15,385 | | | 15,368 |
| | |
|
| |
|
|
| | | $ | 149,601 | | $ | 148,790 |
| | |
|
| |
|
|
Gross unrealized losses were $1.5 million in fiscal 2005 and $0.9 million in fiscal 2004. The realized profits, losses and interest are included in the investment income in the Statements of Operations. Unrealized gains and losses are reflected as a separate component of comprehensive income and are included in Stockholders’ Equity. The gross unrealized losses were primarily a result of rising interest rates. The Company evaluates its portfolio for impairment based on certain factors including, credit quality, structure of the security and the ability to hold the security to maturity.
The following interest income and realized gains and losses from sales of marketable securities is as follows:
| | | | | | | | | |
| | | Fiscal Year Ended July 31,
|
| | | 2005
| | 2004
| | 2003
|
| | | (in thousands) |
Interest income | | $ | 4,807 | | $ | 2,534 | | $ | 2,811 |
Realized gain from sales of available-for-sale securities | | | — | | | 262 | | | 409 |
| | |
|
| |
|
| |
|
|
| | | $ | 4,807 | | $ | 2,796 | | $ | 3,220 |
| | |
|
| |
|
| |
|
|
At July 31, 2005, marketable securities of approximately $1.0 million were restricted from withdrawal. These assets served as collateral supporting letters of credit issued to a financial institution for leasing equipment.
Fair Value of Financial Instruments
SFAS No. 107, “Disclosures About Fair Value of Financial Instruments”, requires that disclosure be made of estimates of the fair value of financial instruments. The carrying amounts of certain of the Company’s financial instruments, including cash equivalents, accounts receivable, accounts payable and other accrued liabilities approximate fair value due to their short maturities. In accordance with SFAS No. 115, marketable securities classified as available for sale are all debt securities and are recorded at fair value based upon quoted market prices. The fair value of the Company’s notes payable and long-term liabilities is estimated based on quoted market prices for the same or similar issues or on current rates offered to the Company for debt of the same remaining maturities. At July 31, 2005, the carrying value of $606,000 for the current portion of long-term debt approximates fair value.
As of July 31, 2005, the estimated fair value of the Company’s convertible subordinated notes was approximately $87.1 million compared to the carrying value of $88.3 million. The estimated fair value of the convertible subordinated notes is based on the quoted market price of the notes on July 31, 2005. The book value of the term loan approximates fair value.
Concentration of Credit Risk
Revenue from our top four customers accounted for 61%, 73%, and 71% of total revenues in fiscal 2005, 2004, and 2003, respectively. Accounts receivable from these customers amounted to approximately $11.6 million and $18.2 million at July 31, 2005 and 2004, respectively. Sales to customers outside the United States were $93.3 million, or 69% of net sales in fiscal 2005, $168.9 million, or 66% of net sales in fiscal 2004, $67.8 million, or 57% of net sales, in fiscal 2003.
Financial instruments, which potentially subject the Company to concentrations of credit risk, are cash equivalents, marketable securities and accounts receivable. All of the Company’s cash equivalents and marketable securities are maintained by major financial
35
LTX CORPORATION
NOTES TO CONSOLIDATED FINANCIAL STATEMENTS (Continued)
institutions. Concentration of credit risk with respect to accounts receivable is limited to certain customers to whom the Company makes substantial sales. To reduce risk, the Company routinely assesses the financial strength of its customers. The Company does not require collateral, although the Company will obtain a letter of credit on sales to certain foreign customers. Write-offs related to accounts receivable have been within management’s expectations.
Inventories
Inventories are stated at the lower of cost or market, determined on the first-in, first-out (“FIFO”) method, and include materials, labor and manufacturing overhead. The components of inventories are as follows:
| | | | | | |
| | | As of July 31,
|
| | | 2005
| | 2004
|
| | | (in thousands) |
Raw materials | | $ | 26,101 | | $ | 28,088 |
Work-in-process | | | 4,668 | | | 11,787 |
Finished goods | | | 10,412 | | | 29,345 |
| | |
|
| |
|
|
| | | $ | 41,181 | | $ | 69,220 |
| | |
|
| |
|
|
Our policy is to establish inventory reserves when conditions exist that suggest our inventory may be in excess of anticipated demand or is obsolete based upon our assumptions about future demand for our products or market conditions. We regularly evaluate the ability to realize the value of our inventory based on a combination of factors including the following: forecasted sales or usage, estimated product end of life dates, estimated current and future market value and new product introductions. Purchasing and alternative usage options are also explored to mitigate inventory exposure. When recorded, our reserves are intended to reduce the carrying value of our inventory to its net realizable value. As of July 31, 2005 and 2004, our inventory is stated net of inventory reserves of $99.6 million and $78.9 million, respectively. If actual demand for our products deteriorates or market conditions are less favorable than those that we project, additional inventory reserves may be required. Such reserves are not reversed until the related inventory is sold or otherwise disposed of. During fiscal year 2005, the Company utilized $29.6 million of reserves related to the disposal of previously reserved items.
In the first quarter of fiscal 2005, the Company’s major customers reduced their forecasts for capital equipment purchases, which resulted in a sudden and substantial drop in revenues and orders for the Company. These conditions continued into its second quarter of fiscal 2005. As a result of the shorter than expected upturn in business conditions, and the completion of the Company’s transition to its second generation Fusion, the Company deemed it appropriate to make an adjustment to the inventory valuation and recorded a $47.5 million excess and obsolete inventory provision, primarily related to the Fusion HF product line, in fiscal 2005. Inventory reserves establish a new cost basis for inventory and such reserves are not reversed until the related inventory is sold or otherwise disposed. For the twelve months ended July 31, 2005, the Company recorded $1.4 million of gain from sales of previously reserved items. As of July 31, 2005, the inventory of $41.2 million is stated net of inventory reserves of $99.6 million and consists of second generation Fusion products and engineering materials. Of the $26.1 million comprising the raw materials inventory, $4.1 million consists of “last time buy” custom components for Fusion HFi and $22.0 million consists of raw materials for Fusion HFi and CX, which the Company believes will be consumed over the next 24 months. If actual demand for the Company’s products deteriorates or market conditions are less favorable than those that are projected, additional inventory reserves may be required.
Prepaid Expense
Certain amounts in the prepaid expense balance relate to inventory capacity purchases and payments for projects not completed. The amount of prepaid expense that relates to cash deposits with suppliers against inventory commitments totaled $0.2 million as of July 31, 2005 and $2.0 million as of July 31, 2004. The inventory related to the July 31, 2004 deposits were delivered to the Company during fiscal 2005. There are no other cash commitments to prepay inventory purchases as of July 31, 2005. There were no prepayments outstanding for engineering projects not completed as of July 31, 2005.
Property and Equipment
Property and equipment is recorded at cost. The Company provides for depreciation and amortization on the straight-line method. Charges are made to operating expenses in amounts that are sufficient to amortize the cost of the assets over their estimated useful lives. Machinery, equipment and internal manufactured systems include spare parts used for service and LTX test systems used for testing components, engineering and applications development. Internally manufactured equipment is recorded at cost and
36
LTX CORPORATION
NOTES TO CONSOLIDATED FINANCIAL STATEMENTS (Continued)
depreciated over 3 to 7 years. Repairs and maintenance costs that do not extend the lives of property and equipment are expensed as incurred. Property and equipment are summarized as follows:
| | | | | | | | | | |
| | | As of July 31,
| | | Depreciable Life in
Years
|
| | | 2005
| | | 2004
| | |
| | | (in thousands) | | | |
Machinery, equipment and internal manufactured systems | | $ | 129,140 | | | $ | 161,922 | | | 3-7 |
Office furniture and equipment | | | 5,677 | | | | 7,634 | | | 3-7 |
Leasehold improvements | | | 6,321 | | | | 11,876 | | | 10 or term of lease |
| | |
|
|
| |
|
|
| | |
| | | | 141,138 | | | | 181,432 | | | |
Accumulated depreciation and amortization | | | (94,003 | ) | | | (110,103 | ) | | |
| | |
|
|
| |
|
|
| | |
| | | $ | 47,135 | | | $ | 71,329 | | | |
| | |
|
|
| |
|
|
| | |
Impairment of Long-Lived Assets Other Than Goodwill
On an on-going basis, management reviews the value and period of amortization or depreciation of long-lived assets. In accordance with SFAS No. 144, “Accounting for Impairment or Disposal of Long-Lived Assets”, the Company reviews whether impairment losses exist on long-lived assets when indicators of impairment are present. During this review, the Company reevaluates the significant assumptions used in determining the original cost of long-lived assets. Although the assumptions may vary, they generally include revenue growth, operating results, cash flows and other indicators of value. Management then determines whether there has been a permanent impairment of the value of long-lived assets based upon events or circumstances that have occurred since acquisition. The extent of the impairment amount recognized is based upon a determination of the impaired asset’s fair value.
Goodwill and Other Intangibles
The Company has adopted the provisions of Statement No. 142, “Goodwill and Other Intangible Assets”, which requires that goodwill and intangible assets with indefinite useful lives are not amortized. Intangible assets with a definitive useful life are amortized over their estimated useful life. Assets recorded in these categories are tested for impairment at least annually or when a change in circumstances may result in future impairment. Intangible assets are recorded at historical cost. Intangible assets acquired in an acquisition, including purchased research and development, are recorded under the purchase method of accounting. Assets acquired in an acquisition are recorded at their estimated fair values at the date of acquisition. Management uses a discounted cash flow analysis which requires that certain assumptions and estimates be made regarding industry economic factors and future profitability of the acquired business to assess the need for an impairment charge. If the carrying value of the asset is in excess of the present value of the expected future cash flows, the carrying value is written down to fair value in the period identified.
Goodwill totaling $14.8 million and $13.7 million at July 31, 2005 and July 31, 2004, respectively, represents the excess of acquisition costs over the estimated fair value of the net assets acquired from StepTech, Inc. (“StepTech”) on June 10, 2003. The change in goodwill during fiscal 2005 was due to the payment to certain of the StepTech stockholders of contingent purchase price, in the form of shares of the Company’s common stock, based on the achievement of certain milestones.
Other intangible assets consisted of core technology and amounted to the following at:
| | | | | | | | | | | |
Core Technology (In thousands)
| | Gross Intangible
| | Accumulated
Amortization
| | Net
Intangible Asset
| | Estimated Useful Life
|
July 31, 2005 | | $ | 2,800 | | $ | 1,400 | | $ | 1,400 | | 4 years |
July 31, 2004 | | $ | 2,800 | | $ | 700 | | $ | 2,100 | | 4 years |
Amortization expense for each of the years ended July 31, 2005 and 2004 was $700,000. The estimated aggregate amortization expense for each of the two succeeding years is $700,000.
In-Process Research and Development
The income approach is used to determine the fair value of in-process research and development (IPR&D). Under the income approach, the fair value reflects the present value of the projected earnings that will be generated by the in-process projects if successfully completed. The income approach focuses on the income producing capability of the acquired in-process projects and best represents the present value of the future economic benefits expected to be derived from these projects. The IPR&D projects must also meet the following criteria: qualify as research and development; no alternative future use; high degree of uncertainty about the future benefits; and, project is in research and development stage and not completed.
37
LTX CORPORATION
NOTES TO CONSOLIDATED FINANCIAL STATEMENTS (Continued)
In October 2000, we acquired 19% of the outstanding common stock of StepTech, Inc. On June 10, 2003, we acquired the remaining 81% of the outstanding shares of StepTech for a net cash payment of $6.5 million and 2,283,750 shares of LTX common stock, of which 288,125 shares were contingent upon certain milestones being met. In addition, all outstanding stock options to purchase shares of StepTech stock were converted into options to purchase 263,112 shares of LTX stock and options to purchase 300,000 shares of LTX stock with an exercise price equal to the fair market value of LTX stock on the date of grant were also issued. The acquisition was accounted for under the provisions of SFAS No. 141, “Business Combinations”. SFAS No. 141 requires that all business combinations be accounted for under the purchase method. The Company’s Consolidated Financial Statements include the operating results of StepTech from the date of acquisition. The purchase price recorded for the StepTech acquisition has been allocated to the assets acquired and the liabilities assumed based on their fair value at the date of acquisition. The estimated excess of purchase price over the fair value of the net tangible assets was allocated to identifiable intangible assets. We recorded an in-process research and development (IPR&D) charge of $16.1 million in the fourth quarter of fiscal 2003.
Deferred Gain on Leased Equipment
The Company has entered into certain equipment sale/leaseback transactions to finance the cost of new test equipment. The cash proceeds from these leases were based on the fair market value of the equipment and these leases qualify as operating leases in accordance with SFAS No. 13. Cash proceeds received in excess of the cost of the equipment are recorded as deferred gain in accordance with SFAS Nos. 13 and 28 and amortized over the life of the lease.
Recent Accounting Pronouncements
On December 16, 2004, the Financial Accounting Standards Board (“FASB”) issued SFAS No. 123 (revised 2004), “Share Based Payment” (“SFAS No. 123R”), which is a revision of SFAS No. 123, “Accounting for Stock-Based Compensation” (“SFAS No. 123”). SFAS No. 123R supersedes APB Opinion No. 25, “Accounting for Stock Issued to Employees” and amends Statement No. 95, “Statement of Cash Flows”. Under SFAS No. 123R, companies must calculate and record in the statement of operations the cost of equity instruments, such as stock options, awarded to employees for services received; pro forma disclosure is no longer permitted. The cost of the equity instruments is to be measured based on the fair value of the instruments on the date they are granted and is required to be recognized over the period during which the employees are required to provide services in exchange for the equity instruments. The statement is effective on August 1, 2005 for the Company.
SFAS No. 123R provides two alternatives for adoption: (1) a “modified prospective” method in which compensation cost is recognized for all awards granted subsequent to the effective date of this statement as well as for the unvested portion of awards outstanding as of the effective date; or (2) a “modified retrospective” method which follows the approach in the “modified prospective” method, but also permits entities to restate prior periods to record compensation cost calculated under SFAS No. 123 for the pro forma disclosure. We plan to adopt SFAS No. 123R using the modified prospective method. Since we currently account for stock options granted to employees and shares issued under our employee stock purchase plans in accordance with the intrinsic value method permitted under APB Opinion No. 25, no compensation expense is recognized. The adoption of SFAS No. 123R is expected to have a significant impact on our results of operations. The impact of adopting SFAS No. 123R cannot be accurately estimated at this time, as it will depend on the market value and the amount of share based awards granted in future periods. SFAS No. 123R also requires that tax benefits received in excess of compensation cost be reclassified from operating cash flows to financing cash flows in the Consolidated Statement of Cash Flows. This change in classification could reduce net operating cash flows and increase net financing cash flows in the periods after adoption.
In November 2004, the FASB issued SFAS No. 151, “Inventory Costs, an amendment of ARB No. 43, Chapter 4” (“SFAS 151”). SFAS 151 modifies the accounting for abnormal inventory costs, and the manner in which companies allocate fixed overhead expenses to inventory. SFAS 151 is effective for inventory costs incurred during annual periods beginning after June 15, 2005. LTX does not expect SFAS 151 to have a material impact on its financial positions and results of operations.
3. BUSINESS COMBINATIONS
In October 2000, the Company made an equity investment by acquiring 19% of the outstanding common stock of StepTech, Inc. The Company also entered into a development agreement at that time that provided LTX with test technology to broaden the reach of Fusion’s single platform, scalable architecture into the high volume, commodity semiconductor market. StepTech was a privately held company that specialized in the design and manufacture of cost effective test instrument solutions and software encompassing key growth areas such as wireless and mixed signal semiconductor testing.
38
LTX CORPORATION
NOTES TO CONSOLIDATED FINANCIAL STATEMENTS (Continued)
On June 10, 2003, the Company acquired the remaining 81% of the outstanding shares of StepTech for a net cash outlay of $6.5 million and 2,283,750 shares of LTX common stock of which 288,125 shares are contingent upon certain milestones being met. In addition, all outstanding stock options to purchase shares of StepTech stock were automatically converted into options to purchase 263,112 shares of LTX stock. Proforma results have not been presented as the results of StepTech’s operations were not material to the Company’s results of operations prior to the date of acquisition.
The purchase price recorded for this acquisition was allocated to the assets acquired and the liabilities assumed based on their fair values at the date of acquisition. The estimated excess of purchase price over the fair value of the net tangible assets is allocated to identifiable intangible assets as valued by an independent appraiser using information provided by management.
The allocation of the purchase price is presented below in $ millions:
| | | |
Working Capital and Equipment | | $ | 6.2 |
Goodwill | | $ | 12.0 |
Core Technology | | $ | 2.8 |
In-Process Research and Development | | $ | 16.1 |
| | |
|
|
Total Purchase Valuation | | $ | 37.1 |
| | |
|
|
Of the 2,283,750 shares issued to purchase StepTech, 288,125 shares are contingent upon certain milestones being met. On December 31, 2003, 144,062 of escrow shares were released and the Company recorded $1.1 million of additional goodwill as certain milestones were achieved. The remaining 144,063 contingent shares were released on June 20, 2005 and the Company recorded an additional $1.1 million of goodwill as the remaining milestones were achieved, in accordance with SFAS No. 141.
In determining the valuation of the purchased core technology, the independent appraisal used the income approach. Core technology is being amortized over its useful life of four years on a straight-line basis.
4. OTHER ACCRUED EXPENSES
Other accrued expenses consisted of the following at July 31, 2005 and July 31, 2004:
| | | | | | |
| | | (in thousands) |
| | | 2005
| | 2004
|
Accrued compensation | | $ | 6,843 | | $ | 7,715 |
Accrued income and local taxes | | | 5,362 | | | 5,889 |
Warranty reserve | | | 2,543 | | | 4,394 |
Ando reserve | | | 603 | | | 1,587 |
Accrued restructuring | | | 9,999 | | | — |
Other accrued expenses | | | 7,040 | | | 7,594 |
| | |
|
| |
|
|
| | | $ | 32,390 | | $ | 27,179 |
| | |
|
| |
|
|
5. LONG-TERM DEBT
Long-term debt consists of the following:
| | | | | | | | |
| | | As of July 31,
| |
| | | (in thousands) | |
| | | 2005
| | | 2004
| |
Convertible subordinated notes | | $ | 88,287 | | | $ | 150,000 | |
Five year bank term loan | | | 60,000 | | | | — | |
Lease purchase obligations, net of deferred interest | | | 6 | | | | 321 | |
| | |
|
|
| |
|
|
|
| | | | 148,293 | | | | 150,321 | |
Less: current portion | | | (606 | ) | | | (321 | ) |
| | |
|
|
| |
|
|
|
| | | $ | 147,687 | | | $ | 150,000 | |
| | |
|
|
| |
|
|
|
On August 8, 2001, the Company received net proceeds of $145.2 million from a private placement of $150 million, 4.25% Convertible Subordinated Notes (“the Notes”) due 2006. The private placement was effected through a Rule 144A offering to
39
LTX CORPORATION
NOTES TO CONSOLIDATED FINANCIAL STATEMENTS (Continued)
qualified institutional buyers. Interest on the Notes is payable on February 15 and August 15 of each year, commencing February 15, 2002. The Notes are convertible into shares of our common stock at any time prior to the close of business on August 15, 2006, unless previously redeemed, at a conversion price of $29.04 per share, subject to certain adjustments. Prior to August 19, 2004, the Company may redeem any of the Notes at a certain redemption price, plus accrued interest, if the closing price of the common stock has exceeded 150% of the conversion price for at least 20 trading days in any consecutive 30-day trading period and certain other conditions are satisfied. On or after August 19, 2004, the Company may redeem any of the Notes at designated redemption prices, plus accrued interest. The Notes are unsecured and subordinated in right of payment in full to all existing and future senior indebtedness of the Company. Expenses associated with the offering of approximately $4.8 million are being amortized using the straight-line method, which approximates the effective interest method, over the term of the Notes. The stated interest rate is 4.25% and the effective rate is 4.39% due to the amortization of capitalized costs associated with the offering. During the fourth fiscal quarter of 2005, the Company repurchased $61.7 million of the outstanding principal balance. As of July 31, 2005 the outstanding principal balance was $88.3 million which is due on August 15, 2006.
On June 3, 2005, the Company closed a $60.0 million term loan with a lender. The loan has a five year term, with interest only payable in the first year. Interest is at the lender’s variable prime rate and the loan is secured by all assets of the Company located in the United States. The proceeds from this loan were used to finance repurchases of the 4.25% Convertible Subordinated Notes and other working capital purposes. During the quarter ended July 31, 2005, the Company repurchased $61.7 million principal amount of the convertible subordinated notes. As of July 31, 2005 the outstanding loan amount is $60.0 million of which $0.6 million is classified as current portion of long-term debt that will be repaid in fiscal 2006. The $60.0 million will be paid in 48 payments as follows: (i) twelve monthly installments of $0.6 million, commencing June 1, 2006 and ending on May 1, 2007; (ii) twelve monthly installments of $1.2 million, commencing on June 1, 2007 and ending on May 1, 2008, (iii) twelve monthly installments of $1.5 million, commencing on June 1, 2008 and ending on May 1, 2009; and, (iv) twelve monthly installments of $1.7 million, commencing on June 1, 2009 and ending on May 1, 2010. The Company has a covenant in its loan agreement that requires it to maintain minimum cash and cash equivalents and marketable securities balances with the lender of no less than the aggregate of the outstanding term loan plus $30.0 million. However, in the event the Company’s cash and cash equivalents and marketable securities are less than this amount, the impact to the Company is the imposition of additional bank fees. The additional fees would not have a material impact on the Company’s financial position or results of operations.
The Company has a second credit facility with another lender for a revolving credit line of $20.0 million. This facility is secured by cash and bears interest (at our option) at either: (i) the greater of the federal funds rate plus 0.5% or the bank’s prime rate, in each case, minus 1.0% or (ii) LIBOR plus 0.4%. This facility expired on July 23, 2005 and was extended to October 20, 2005. No amounts were outstanding under this credit facility at July 31, 2005 or 2004. At July 31, 2005, this line supported letters of credit which totaled $0.1 million to a financial institution for leasing equipment.
Lease purchase obligations of $0 and $321,000 at July 31, 2005 and July 31, 2004, respectively, represent capital leases of equipment.
6. INCOME TAXES
Reconciliation of the U.S. federal statutory rate to the Company’s effective tax rate are as follows:
| | | | | | | | | |
| | | Year ended July 31,
| |
| | | 2005
| | | 2004
| | | 2003
| |
U.S. Federal statutory rate | | (35.0 | )% | | 35.0 | % | | (35.0 | )% |
Change in valuation allowance/utilization of net operating loss carryforwards | | 35.0 | | | (35.0 | ) | | 35.0 | |
| | |
|
| |
|
| |
|
|
Effective tax rate | | 0.0 | % | | 0.0 | % | | 0.0 | % |
| | |
|
| |
|
| |
|
|
40
LTX CORPORATION
NOTES TO CONSOLIDATED FINANCIAL STATEMENTS (Continued)
The temporary differences and carryforwards that created the deferred tax assets and (liabilities) as of July 31, 2005, and 2004 are as follows:
| | | | | | | | |
| | | As of July 31,
| |
| | | 2005
| | | 2004
| |
| | | (in thousands) | |
Deferred tax assets: | | | | | | | | |
Net operating loss and tax credit carryforwards | | $ | 157,853 | | | $ | 94,250 | |
Tax credits | | | 30,242 | | | | 30,917 | |
Inventory valuation reserves | | | 39,858 | | | | 31,550 | |
Deferred revenue | | | 1,057 | | | | 2,741 | |
Other | | | 11,638 | | | | 9,212 | |
| | |
|
|
| |
|
|
|
Total deferred tax assets, net | | | 240,648 | | | | 168,670 | |
Valuation allowance | | | (240,648 | ) | | | (168,670 | ) |
| | |
|
|
| |
|
|
|
Net deferred tax assets | | $ | — | | | $ | — | |
| | |
|
|
| |
|
|
|
Compliance with SFAS No. 109 requires the Company to periodically evaluate the necessity of establishing or increasing a valuation allowance for deferred tax assets depending on whether it is more likely than not that a related benefit will be realized in future periods. Because of the cumulative loss position of the Company and the uncertainty of profitability in future periods, the Company maintains a valuation allowance for 100% of net deferred tax assets.
As of July 31, 2005, the Company had federal net operating loss carryforwards of $390,724,000, which expire in 2019 to 2025, and tax credit carryforwards of $20,838,000, which expire from 2005 to 2024. State tax credits and carryforwards of $9,404,000 at July 31, 2005 expire from 2005 to 2019. The Company also has foreign net operating loss carryforwards of $950,000 in the United Kingdom and $2,500,000 in Japan.
In accordance with SFAS No. 109 and SFAS No. 5,Accounting For Contingencies,we established reserves for tax contingencies that reflect our best estimate of the transactions and deductions that we may be unable to sustain or that we would be willing to concede as part of a broader tax settlement. We are currently undergoing routine tax examinations by various state and foreign jurisdictions. Tax authorities periodically challenge certain transactions and deductions we reported on our income tax returns. We do not expect the outcome of these examinations, either individually or in the aggregate, to have a material adverse effect on our financial position, results from operations or cash flows; however, if the anticipated outcomes any of such matters change, there could be such a material effect on the Company’s financial position or operations in future periods.
On October 22, 2004, the American Jobs Creation Act of 2004 (the “Act”) was signed into law. The Act contains a one-time foreign dividend repatriation provision, which provides for a special deduction with respect to certain qualifying dividends from foreign subsidiaries for a limited period. The deduction is subject to a number of limitations and uncertainty remains as to the interpretation of numerous provisions in the Act. However, the Company believes that it has the information necessary to make an informed decision on the impact of the Act on its repatriation plans and has determined that it does not have any foreign earnings to repatriate under the foreign dividend repatriation provisions of the Act.
7. STOCKHOLDERS’ EQUITY
Public Offering
In January 2004, the Company filed a shelf registration statement on Form S-3 to register up to $250.0 million of common stock, debt securities and warrants. On February 19, 2004, an offering was closed pursuant to the registration statement relating to the sale of 8,050,000 shares of common stock at $16.50 per share. The offering included 1,050,000 shares sold as a result of the exercise, in full, by the underwriters of their option to purchase additional shares of common stock. Gross proceeds from the stock offering totaled approximately $132.8 million. Proceeds to LTX, net of $6.3 million in underwriters’ commissions and discounts and other expenses, totaled approximately $126.5 million.
41
LTX CORPORATION
NOTES TO CONSOLIDATED FINANCIAL STATEMENTS (Continued)
Rights Agreement
The Company has a Rights Agreement whereby each common stock shareholder has one common share purchase right for each share of common stock held. The rights will become exercisable only if a person or group acquires 15% or more of the Company’s common stock or announces a tender offer that would result in ownership of 15% or more of the common stock. Initially, each right will entitle a stockholder to buy one share of common stock of the Company at a purchase price of $45.00 per share, subject to significant adjustment depending on the occurrence thereafter of certain events. Before any person or group has acquired 15% or more of the common stock of the Company, the rights are redeemable by the Board of Directors at $0.001 per right. The rights expire on April 30, 2009 unless redeemed by the Company prior to that date.
Reserved Unissued Shares
At July 31, 2005, the Company had reserved 14,691,091 unissued shares of its common stock for possible issuance under stock-based compensation plans and the Company’s Employee Stock Purchase Plan. In addition, at July 31, 2005, the Company has reserved 3,040,186 shares of its common stock for issuance relating to the Company’s 4.25% Convertible Subordinated Notes.
8. EMPLOYEE BENEFIT PLANS
Stock Option Plans
The Company has five active stock option plans: the 2004 Stock Plan (“2004 Plan), the 2001 Stock Plan (“2001 Plan”), the 1999 Stock Plan (“1999 Plan”), the 1995 LTX (Europe) Ltd. Approved Stock Option Plan (“U.K. Plan”) and, in addition, the Company assumed the StepTech, Inc. Stock Option Plan (the “STI 2000 Plan”) as part of its acquisition of StepTech. The STI 2000 Plan, 2004 Plan, 2001 Plan, 1999 Plan, and the U.K. Plan provide for the granting of options to employees to purchase shares of common stock at not less than 100% of the fair market value at the date of grant. The 2004 Plan, 2001 Plan and 1999 Plan also provide for the granting of options to an employee, director or consultant of the Company or its subsidiaries to purchase shares of common stock at prices to be determined by the Board of Directors. Options under the plans are exercisable over vesting periods, which typically have been three to four years from the date of grant. In fiscal 2005, the Company granted 533,750 options tied to certain performance milestones which management believes will be achieved no later than fiscal year 2008. At July 31, 2005, 5,750 shares were subject to future grant under the 2001 Plan, 3,185,375 shares were subject to future grant under the 2004 Plan and 15,307 shares were subject to future grant under the U.K. Plan.
Stock Option Activity
| | | | | | | | | | | | | | | | | | |
| | | 2005
| | 2004
| | 2003
|
| | | Number of
Shares
| | | Weighted
Average
Exercise
Price
| | Number of
Shares
| | | Weighted
Average
Exercise
Price
| | Number of
Shares
| | | Weighted
Average
Exercise
Price
|
Options outstanding, beginning of year | | 9,035,317 | | | $ | 11.46 | | 8,170,946 | | | $ | 10.36 | | 6,557,742 | | | $ | 12.00 |
Granted | | 2,151,225 | | | | 5.75 | | 1,722,750 | | | | 13.51 | | 1,865,667 | | | | 6.11 |
Exercised | | (78,285 | ) | | | 3.13 | | (797,482 | ) | | | 5.10 | | (153,474 | ) | | | 2.10 |
Forfeited | | (385,252 | ) | | | 10.24 | | (60,897 | ) | | | 9.51 | | (98,989 | ) | | | 13.51 |
| | |
|
| | | | |
|
| | | | |
|
| | | |
Options outstanding, end of year | | 10,723,005 | | | | 10.40 | | 9,035,317 | | | | 11.43 | | 8,170,946 | | | | 10.37 |
| | |
|
| | | | |
|
| | | | |
|
| | | |
Options exercisable | | 8,600,755 | | | | 11.69 | | 4,604,552 | | | | 11.81 | | 3,892,491 | | | | 10.71 |
| | |
|
| | | | |
|
| | | | |
|
| | | |
Options available for grant | | 3,206,432 | | | | | | 991,432 | | | | | | 2,663,104 | | | | |
| | |
|
| | | | |
|
| | | | |
|
| | | |
Weighted average fair value of options granted during year | | | | | $ | 3.51 | | | | | $ | 11.70 | | | | | $ | 4.61 |
42
LTX CORPORATION
NOTES TO CONSOLIDATED FINANCIAL STATEMENTS (Continued)
As of July 31, 2005, the status of the Company’s outstanding and exercisable options is as follows:
| | | | | | | | | | | | |
Options Outstanding
| | Options Exercisable
|
Range of Exercise Price ($)
| | Number
Outstanding
| | Weighted
Average
Remaining
Contractual Life
| | Weighted
Average
Exercise Price ($)
| | Number
Exercisable
| | Weighted
Average
Exercise Price ($)
|
0.00—4.63 | | 1,057,867 | | 6.5 | | $ | 3.50 | | 589,717 | | $ | 3.11 |
4.64—9.25 | | 4,087,435 | | 7.1 | | $ | 6.77 | | 2,433,335 | | $ | 7.63 |
9.26—13.88 | | 4,103,550 | | 6.1 | | $ | 12.73 | | 4,103,550 | | $ | 12.73 |
13.89—18.50 | | 1,035,203 | | 4.6 | | $ | 15.37 | | 1,035,203 | | $ | 15.37 |
18.51—23.13 | | 272,250 | | 5.3 | | $ | 21.14 | | 272,250 | | $ | 21.14 |
23.14—27.75 | | 27,000 | | 4.4 | | $ | 26.15 | | 27,000 | | $ | 26.15 |
27.76—32.38 | | 9,250 | | 1.9 | | $ | 28.34 | | 9,250 | | $ | 28.34 |
32.39—37.00 | | 33,250 | | 3.4 | | $ | 33.63 | | 33,250 | | $ | 33.63 |
37.01—41.63 | | 37,500 | | 4.6 | | $ | 37.75 | | 37,500 | | $ | 37.75 |
41.64—46.25 | | 59,700 | | 1.4 | | $ | 46.25 | | 59,700 | | $ | 46.25 |
| | |
| | | | | | |
| | | |
| | | 10,723,005 | | 6.3 | | $ | 10.40 | | 8,600,755 | | $ | 11.69 |
| | |
| | | | | | |
| | | |
On June 7, 2005, the Board of Directors, upon recommendation of the Board’s Compensation Committee, approved the accelerated vesting of certain unvested and “out-of-the-money” stock options held by employees, executive officers and non-employee directors with exercise prices greater than $7.50 per share. The closing sale price of LTX’s common stock on the Nasdaq National Market on June 7, 2005 was $5.20. As a result of this vesting acceleration, which became effective on June 7, 2005, options to purchase approximately 2.3 million shares of LTX’s common stock that would otherwise have vested at various times within the next four years became fully vested.
The decision to accelerate these unvested options was made primarily to reduce compensation expense that might be recorded in future periods following our adoption of SFAS No. 123R beginning with our next fiscal year, which starts on August 1, 2005. Accelerating the vesting of these stock options will reduce the Company’s aggregate compensation expense in future periods by a total of approximately $10.4 million, before taxes, based upon value calculations using the Black-Scholes methodology (approximately $6.2 million in fiscal year 2006, $4.1 million in fiscal year 2007, and $0.1 million in fiscal year 2008).
Employees’ Stock Purchase Plan
The Company instituted an employee stock purchase plan in 1993 (“1993 ESPP”). Under the 1993 ESPP, eligible employees may contribute up to 15% of their annual compensation for the purchase of common stock of the Company, subject to an annual limit of $25,000. The price paid for the common stock is equal to 85% of the lower of the fair market value of LTX’s common stock on the first business day or the last business day of a six-month offering period. The 1993 ESPP limits the number of shares that can be issued over the term of the plan to 3,000,000 shares. In December 2003, the 1993 ESPP expired and at the annual meeting on December 10, 2003 the shareholders approved a new employee stock purchase plan (“2004 ESPP”). The 2004 ESPP provides the same provisions as the 1993 ESPP and allows for the issuance of 1,200,000 shares of common stock to eligible employees. In September 2005, the Company amended the 2004 ESPP to provide that the price paid for the common stock is equal to 85% of the fair market value of LTX’s common stock on the first business day of a six month offering period. In fiscal years 2005, 2004, and 2003, shares issued under these employee stock purchase plans were 288,486, 277,821 and 299,737, respectively.
Other Compensation Plans
The Company has established a Profit Sharing Bonus Plan, wherein a percentage of pretax profits are distributed semi-annually to all employees. Under the Profit Sharing Bonus Plan, the Company distributed to all eligible employees approximately $0, $396,000, and $0, for fiscal years 2005, 2004, and 2003, respectively.
The Company has a 401(k) Growth and Investment Program (“401(k) Plan”). Eligible employees may make voluntary contributions to the 401(k) Plan through a salary reduction contract up to the statutory limit or 20% of their annual compensation. The Company matches employees’ voluntary contributions, up to certain prescribed limits. Company contributions vest at a rate of 20% per year. The Company suspended the match as of June of fiscal year 2001. The Company match will be reinstated beginning August 2005.
43
LTX CORPORATION
NOTES TO CONSOLIDATED FINANCIAL STATEMENTS (Continued)
9. INDUSTRY AND GEOGRAPHIC SEGMENT INFORMATION
The Company operates predominantly in one industry segment: the design, manufacture and marketing of automated test equipment for the semiconductor industry that is used to test system-on-a-chip, digital, analog and mixed signal integrated circuits.
In fiscal years 2005, 2004, and 2003, Texas Instruments accounted for 47%, 58%, and 58%, of net sales, respectively. Sales to the top ten customers were 77%, 88%, and 83%, of net sales in fiscal 2005, 2004, and 2003, respectively.
The Company’s operations by geographic segment for the three years ended July 31, 2005 are summarized as follows:
| | | | | | | | | |
| | | Year ended July 31,
|
| | | 2005
| | 2004
| | 2003
|
| | | (in thousands) |
Sales to unaffiliated customers: | | | | | | | | | |
United States | | $ | 41,253 | | $ | 86,907 | | $ | 51,614 |
Taiwan | | | 11,815 | | | 17,832 | | | 9,900 |
Japan | | | 5,978 | | | 6,380 | | | 3,685 |
Singapore | | | 53,706 | | | 115,698 | | | 37,897 |
All other countries | | | 21,779 | | | 28,984 | | | 16,353 |
| | |
|
| |
|
| |
|
|
Total sales to unaffiliated customers | | $ | 134,531 | | $ | 255,801 | | $ | 119,449 |
| | |
|
| |
|
| |
|
|
Long-lived assets (property and equipment): | | | | | | | | | |
United States | | $ | 43,395 | | $ | 62,685 | | $ | 52,800 |
Taiwan | | | 670 | | | 1,502 | | | 3,247 |
Japan | | | 22 | | | 19 | | | 20 |
Singapore | | | 1,996 | | | 4,410 | | | 10,645 |
All other countries | | | 1,052 | | | 2,713 | | | 6,731 |
| | |
|
| |
|
| |
|
|
Total long-lived assets | | $ | 47,135 | | $ | 71,329 | | $ | 73,443 |
| | |
|
| |
|
| |
|
|
Transfer prices on products sold to foreign subsidiaries are intended to produce profit margins that correspond to the subsidiary’s sales and support efforts. Sales to customers in North America are 100% within the United States.
10. COMMITMENTS AND LEGAL MATTERS
The Company has operating lease commitments for certain facilities and equipment and capital lease commitments for certain equipment that expire at various dates through 2010. Minimum lease payments under noncancelable leases at July 31, 2005, are as follows:
| | | | | | | | | |
Year ended July 31,
| | Real
Estate
| | Equipment
| | Total
Operating
Leases
|
| | | (in thousands) |
2006 | | $ | 4,799 | | $ | 5,452 | | $ | 10,251 |
2007 | | | 4,362 | | | 2,810 | | | 7,172 |
2008 | | | 2,785 | | | 682 | | | 3,467 |
2009 | | | 2,190 | | | 14 | | | 2,204 |
2010 | | | 321 | | | 1 | | | 322 |
| | |
|
| |
|
| |
|
|
Total minimum lease payments | | $ | 14,457 | | $ | 8,959 | | $ | 23,416 |
| | |
|
| |
|
| |
|
|
Total rental expense for fiscal 2005, 2004, and 2003 was $9,261,863, $14,084,063, and $15,412,970, respectively.
44
LTX CORPORATION
NOTES TO CONSOLIDATED FINANCIAL STATEMENTS (Continued)
The Company is, from time to time, subject to legal proceedings, claims and investigations that arise in the ordinary course of business. There are no such matters that the Company believes are material with respect to its business, financial position or results of operations.
11. REORGANIZATION CHARGES AND INVENTORY PROVISIONS
In calendar 2001, the Company was faced with a sudden drop in demand as a result of the beginning phases of an industry-wide slowdown, which has continued through and into our fiscal year 2005. Continued sluggish worldwide macro-economic conditions, combined with world events such as the war in Iraq and the SARS epidemic, led to depressed conditions for a longer period than past industry cycles and earlier projections.
The major variables impacting inventory usage are the demand for current products, overall industry conditions, key sale initiatives underway and the impact that our new product introductions (Fusion HFi and Fusion CX) have on current product demand. The longer the duration of the depressed industry conditions, the greater the chance for impairment of the Company’s current products due to market and product transitions. Fusion HFi was formally introduced in the third quarter of fiscal year 2003. The HFi is a higher performance machine with significant added capability and reduced maintenance cost. As a result of continued depressed industry conditions and growing market acceptance of Fusion HFi, in the fourth quarter of fiscal 2003, the Company recorded an inventory related provision of $48.5 million to reduce inventory (primarily related to older products) to its estimated net realizable value.
Reorganization costs were $6.7 million in fiscal 2003. In August 2002, we reduced our workforce by 94 employees due to adverse business conditions. In November 2002, we further reduced our workforce by 195 employees and contractors. The combination of these two actions account for $5.6 million of the $6.7 million charge for the fiscal year ended July 31, 2003. The majority of the severance costs of the August 2002 and November 2002 workforce reductions were paid by April 30, 2003, although some costs were paid through August 2003.
In July 2003, the Company further reduced headcount by 7 employees and recorded a $0.3 million reorganization severance charge and an $0.8 million asset impairment charge for certain manufacturing related leasehold improvements in our Westwood facility. These assets were deemed to be impaired as a result of outsourcing the remaining elements of the Company’s final test and integration process to a third party. During the second quarter of fiscal 2004, we completed the reorganization program that we had initiated in July 2003.
The Company recorded a reorganization charge in the quarter ended October 31, 2004 of $3.1 million, of which $1.5 million consisted of severance costs relating to a worldwide workforce reduction and $1.6 million related to consolidation of the Company’s facilities in the United Kingdom. The $1.6 million reorganization charge related to the consolidation of the Company’s facilities in the United Kingdom consisted of future lease obligations net of any rental income. In the first quarter of fiscal 2005, the Company’s major customers reduced their forecasts for capital equipment purchases, which resulted in a sudden and substantial drop in revenues and orders for the Company. These conditions continued into the second quarter of fiscal 2005. As a result of the shorter than expected upturn in business conditions, and the completion of the Company’s transition to its second generation Fusion, the Company deemed it appropriate to make an adjustment to its inventory and recorded a $47.5 million excess and obsolete inventory provision, primarily related to Fusion HF, in the quarter ended October 31, 2004.
During the quarter ended April 30, 2005, the Company recorded a reorganization charge of $28.6 million as a result of a significant corporate-wide restructuring undertaken to more effectively align the Company’s resources with our current business strategy. Of the $28.6 million, approximately $4.0 million related to headcount reduction and approximately $24.6 million related to fixed asset impairment and facilities consolidation.
The $24.6 million reorganization charge relating to fixed asset impairment and facilities consolidation was undertaken as a result of an asset impairment review. This review was triggered by the workforce reduction and business unit reorganization. Of the $24.6 million impairment charge, $18.1million was related to fixed asset equipment, $4.6 million related to future lease obligations on equipment that will no longer be used and $1.9 million related to facilities consolidation. The equipment, which has or will be disposed of over the next three to six months, consists primarily of older technology having little or no resale value.
45
LTX CORPORATION
NOTES TO CONSOLIDATED FINANCIAL STATEMENTS (Continued)
The following table sets forth the Company’s restructuring activity for the fiscal years ended 2005, 2004 and 2003:
| | | | | | | | | | | | | | | | | | | | |
| | | Severance
Costs
| | | Equipment
leases
| | | Facility
leases
| | | Asset
impairment
| | | Total
| |
| | | (in thousands) | |
Balance July 31, 2002 | | $ | 0.2 | | | $ | — | | | $ | — | | | $ | — | | | $ | 0.2 | |
Additions to expense | | | 6.7 | | | | — | | | | — | | | | 0.8 | | | | 7.5 | |
Non-cash utilization | | | | | | | — | | | | — | | | | (0.8 | ) | | | (0.8 | ) |
Cash paid | | | (6.5 | ) | | | — | | | | — | | | | — | | | | (6.5 | ) |
| | |
|
|
| |
|
|
| |
|
|
| |
|
|
| |
|
|
|
Balance July 31, 2003 | | $ | 0.4 | | | $ | — | | | $ | — | | | $ | — | | | $ | 0.4 | |
| | |
|
|
| |
|
|
| |
|
|
| |
|
|
| |
|
|
|
Additions to expense | | | — | | | | — | | | | — | | | | — | | | | — | |
Non-cash utilization | | | — | | | | — | | | | — | | | | — | | | | — | |
Cash paid | | | (0.4 | ) | | | — | | | | — | | | | — | | | | (0.4 | ) |
| | |
|
|
| |
|
|
| |
|
|
| |
|
|
| |
|
|
|
Balance July 31, 2004 | | $ | — | | | $ | — | | | $ | — | | | $ | — | | | $ | — | |
| | |
|
|
| |
|
|
| |
|
|
| |
|
|
| |
|
|
|
Additions to expense | | | 5.5 | | | | 4.6 | | | | 3.5 | | | | 18.1 | | | | 31.7 | |
Elimination of deferred gain | | | — | | | | 2.8 | | | | — | | | | — | | | | 2.8 | |
Non-cash utilization | | | — | | | | — | | | | — | | | | (18.1 | ) | | | (18.1 | ) |
Cash paid | | | (4.8 | ) | | | (0.8 | ) | | | (0.8 | ) | | | — | | | | (6.4 | ) |
| | |
|
|
| |
|
|
| |
|
|
| |
|
|
| |
|
|
|
Balance July 31, 2005 | | $ | 0.7 | | | $ | 6.6 | | | $ | 2.7 | | | $ | — | | | $ | 10.0 | |
| | |
|
|
| |
|
|
| |
|
|
| |
|
|
| |
|
|
|
46
LTX CORPORATION
NOTES TO CONSOLIDATED FINANCIAL STATEMENTS (Continued)
12. QUARTERLY RESULTS OF OPERATIONS (unaudited)
| | | | | | | | | | | | | | | | |
| | | Year Ended July 31, 2005
| |
| | | First
Quarter (1)
| | | Second
Quarter
| | | Third
Quarter (2)
| | | Fourth
Quarter
| |
| | | (In thousands, except per share data) | |
Net sales | | $ | 43,033 | | | $ | 27,036 | | | $ | 25,534 | | | $ | 38,928 | |
Gross profit | | | (32,658 | ) | | | 7,153 | | | | 6,839 | | | | 14,934 | |
Net income (loss) | | | (61,673 | ) | | | (19,183 | ) | | | (45,656 | ) | | | (6,214 | ) |
Net income (loss) per share: | | | | | | | | | | | | | | | | |
Basic | | $ | (1.01 | ) | | $ | (0.31 | ) | | $ | (0.75 | ) | | $ | (0.10 | ) |
Diluted | | $ | (1.01 | ) | | $ | (0.31 | ) | | $ | (0.75 | ) | | $ | (0.10 | ) |
| | | | |
Accounting for Stock-Based Compensation: | | | | | | | | | | | | | | | | |
| | | | |
Net income (loss) | | | | | | | | | | | | | | | | |
As reported | | | (61,673 | ) | | | (19,183 | ) | | | (45,656 | ) | | | (6,214 | ) |
Deduct: Total stock based employee compensations expense determined under fair value based method for all awards, net of related tax effects | | | 3,546 | | | | 3,900 | | | | 3,983 | | | | 14,661 | |
| | |
|
|
| |
|
|
| |
|
|
| |
|
|
|
Proforma net income (loss) | | | (65,219 | ) | | | (23,083 | ) | | | (49,639 | ) | | | (20,875 | ) |
| | | | |
Net income (loss) per share: | | | | | | | | | | | | | | | | |
Basic | | | | | | | | | | | | | | | | |
As Reported | | | (1.01 | ) | | | (0.31 | ) | | | (0.75 | ) | | | (0.10 | ) |
Proforma | | | (1.07 | ) | | | (0.38 | ) | | | (0.81 | ) | | | (0.34 | ) |
| | | | |
Diluted | | | | | | | | | | | | | | | | |
As Reported | | | (1.01 | ) | | | (0.31 | ) | | | (0.75 | ) | | | (0.10 | ) |
Proforma | | | (1.07 | ) | | | (0.38 | ) | | | (0.81 | ) | | | (0.34 | ) |
| | | | |
Volatility | | | 88 | % | | | 87 | % | | | 58 | % | | | 88 | % |
Dividend Yield | | | 0 | % | | | 0 | % | | | 0 | % | | | 0 | % |
Risk-free interest rate | | | 4.20 | % | | | 4.28 | % | | | 3.74 | % | | | 4.29 | % |
Expected life of options | | | 8.68 yrs | | | | 8.78 yrs | | | | 2.73 yrs | | | | 8.45 yrs | |
| (1) | Includes reorganization costs of $3.1 million and an inventory charge of $47.5 million. |
| (2) | Includes reorganization costs of $4.0 million and a fixed asset impairment charge of $24.6 million. |
47
LTX CORPORATION
NOTES TO CONSOLIDATED FINANCIAL STATEMENTS (Continued)
| | | | | | | | | | | | | | | | |
| | | Year Ended July 31, 2004
| |
| | | First
Quarter
| | | Second
Quarter
| | | Third
Quarter
| | | Fourth
Quarter
| |
| | | (In thousands, except per share data) | |
Net sales | | $ | 46,619 | | | $ | 58,415 | | | $ | 70,333 | | | $ | 80,434 | |
Gross profit | | | 14,096 | | | | 23,088 | | | | 29,228 | | | | 34,717 | |
Net income (loss) | | | (9,806 | ) | | | (1,435 | ) | | | 4,306 | | | | 8,896 | |
| | | | |
Accounting for Stock-Based Compensation: | | | | | | | | | | | | | | | | |
| | | | |
Net income (loss) | | | | | | | | | | | | | | | | |
As reported | | $ | (0.19 | ) | | $ | (0.03 | ) | | $ | 0.07 | | | $ | 0.15 | |
Deduct: Total stock based employee compensations expense determined under fair value based method for all awards, net of related tax effects | | $ | (0.19 | ) | | $ | (0.03 | ) | | $ | 0.07 | | | $ | 0.14 | |
| | | | |
Net income (loss) | | | (9,806 | ) | | | (1,435 | ) | | | 4,306 | | | | 8,896 | |
Compensation Expense | | | 4,335 | | | | 4,404 | | | | 4,435 | | | | 4,466 | |
| | |
|
|
| |
|
|
| |
|
|
| |
|
|
|
Proforma net income (loss) | | | (14,141 | ) | | | (5,839 | ) | | | (129 | ) | | | 4,430 | |
| | | | |
Net income (loss) per share: | | | | | | | | | | | | | | | | |
Basic | | | | | | | | | | | | | | | | |
As Reported | | | (0.19 | ) | | | (0.03 | ) | | | 0.07 | | | | 0.15 | |
Proforma | | | (0.27 | ) | | | (0.11 | ) | | | (0.00 | ) | | | 0.07 | |
| | | | |
Diluted | | | | | | | | | | | | | | | | |
As Reported | | | (0.19 | ) | | | (0.03 | ) | | | 0.07 | | | | 0.14 | |
Proforma | | | (0.27 | ) | | | (0.11 | ) | | | (0.00 | ) | | | 0.07 | |
| | | | |
Volatility | | | 88 | % | | | 87 | % | | | 87 | % | | | 87 | % |
Dividend Yield | | | 0 | % | | | 0 | % | | | 0 | % | | | 0 | % |
Risk-free interest rate | | | 4.33 | % | | | 4.34 | % | | | 4.73 | % | | | 4.78 | % |
Expected life of options | | | 9.11 yrs | | | | 8.90 yrs | | | | 8.86 yrs | | | | 8.83 yrs | |
The fair value of each option grant is estimated on the grant date using the Black-Scholes option-pricing model with the above weighted average assumption. The Company has presented the quarterly effect on net income (loss) and net income (loss) per share if the Company had applied the fair value recognition provision of SFAS No. 123 to stock-based employee compensation. The amounts included above for the first, second and third quarters differ from the amounts previously reported.
48
Report of Independent Registered Public Accounting Firm
The Board of Directors and Stockholders of LTX Corporation
We have audited the accompanying consolidated balance sheets of LTX Corporation (the “Company”) as of July 31, 2005 and 2004, and the related consolidated statements of operations and comprehensive income, stockholders’ equity, and cash flows for each of the three years in the period ended July 31, 2005. Our audits also included the financial statement schedule listed in the index at Item 15(a). These financial statements are the responsibility of the Company’s management. Our responsibility is to express an opinion on these financial statements and schedule based on our audits.
We conducted our audits in accordance with the standards of the Public Company Accounting Oversight Board (United States). Those standards require that we plan and perform the audit to obtain reasonable assurance about whether the financial statements are free of material misstatement. An audit includes examining, on a test basis, evidence supporting the amounts and disclosures in the financial statements. An audit also includes assessing the accounting principles used and significant estimates made by management, as well as evaluating the overall financial statement presentation. We believe that our audits provide a reasonable basis for our opinion.
In our opinion, the consolidated financial statements referred to above present fairly, in all material respects, the consolidated financial position of LTX Corporation at July 31, 2005 and 2004, and the consolidated results of its operations and its cash flows for each of the three years in the period ended July 31, 2005, in conformity with U.S. generally accepted accounting principles. Also, in our opinion, the related financial statement schedule, when considered in relation to the basic financial statements taken as a whole, presents fairly in all material respects the information set forth therein.
We also have audited, in accordance with the standards of the Public Company Accounting Oversight Board (United States), the effectiveness of LTX Corporation’s internal control over financial reporting as of July 31, 2005, based on criteria established in Internal Control-Integrated Framework issued by the Committee of Sponsoring Organizations of the Treadway Commission and our report dated October 7, 2005 expressed an unqualified opinion thereon.
Boston, Massachusetts
October 7, 2005
49
Item 9. Changes in and Disagreements with Accountants on Accounting and Financial Disclosure
There has been no change of accountants nor any disagreements with accountants on any matter of accounting principles or practices or financial disclosure required to be reported under this Item.
Item 9A. Controls and Procedures
Evaluation of Disclosure Controls and Procedures
The Company’s management, with the participation of the Company’s Chief Executive Officer and Chief Financial Officer, evaluated the effectiveness of the Company’s disclosure controls and procedures as of July 31, 2005. The term “disclosure controls and procedures,” as defined in Rules 13a-15(e) and 15d-15(e) under the Exchange Act, means controls and other procedures of a company that are designed to ensure that information required to be disclosed by a company in the reports that it files or submits under the Exchange Act is recorded, processed, summarized and reported, within the time period specified in the SEC’s rules and forms. Disclosure controls and procedures include, without limitation, controls and procedures designed to ensure that information required to be disclosed by a company in the reports that it files or submits under the Exchange Act is accumulated and communicated to the company’s management, including its principal executive and principal financial officers, as appropriate to allow timely decisions regarding required disclosure. Management recognizes that any controls and procedures, no matter how well designed and operated, can provide only reasonable assurance of achieving their objectives and management necessarily applies its judgment in evaluating the cost-benefit relationship of possible controls and procedures. Based on the evaluation of the Company’s disclosure controls and procedures as of July 31, 2005, the Company’s Chief Executive Officer and Chief Financial Officer concluded that, as of such date, the Company’s disclosure controls and procedures were effective at the reasonable assurance levels.
Management’s report on the Company’s internal control over financial reporting (as defined in Rules 13a-15(f) and 15d-15(f) under the Exchange Act) and the independent registered public accounting firm’s related audit report are included in this Item 9.
Management’s Annual Report on Internal Control Over Financial Reporting
The management of the Company is responsible for establishing and maintaining adequate internal control over financial reporting for the Company. Internal control over financial reporting is defined in Rule 13a-15(f) or 15d-15(f) promulgated under the Securities Exchange Act of 1934 as a process designed by, or under the supervision of, the Company’s principal executive and principal financial officers and effected by the Company’s board of directors, management and other personnel, to provide reasonable assurance regarding the reliability of financial reporting and the preparation of financial statements for external purposes in accordance with generally accepted accounting principles and includes those policies and procedures that:
| | • | | Pertain to the maintenance of records that in reasonable detail accurately and fairly reflect the transactions and dispositions of the assets of the Company; |
| | • | | Provide reasonable assurance that transactions are recorded as necessary to permit preparation of financial statements in accordance with generally accepted accounting principles, and that receipts and expenditures of the Company are being made only in accordance with authorizations of management and directors of the Company; and |
| | • | | Provide reasonable assurance regarding prevention or timely detection of unauthorized acquisition, use or disposition of the Company’s assets that could have a material effect on the financial statements. |
Because of its inherent limitations, internal control over financial reporting may not prevent or detect misstatements. Projections of any evaluation of effectiveness to future periods are subject to the risk that controls may become inadequate because of changes in conditions, or that the degree of compliance with the policies or procedures may deteriorate.
The Company’s management assessed the effectiveness of the Company’s internal control over financial reporting as of July 31, 2005. In making this assessment, the Company’s management used the criteria set forth by the Committee of Sponsoring Organizations of the Treadway Commission (COSO) in Internal Control-Integrated Framework.
Based on our assessment, management concluded that, as of July 31, 2005, the Company’s internal control over financial reporting is effective based on those criteria.
The Company’s independent registered public accounting firm has issued a report on our assessment of the Company’s internal control over financial reporting. This report appears below.
50
Attestation Report of the Independent Registered Public Accounting Firm
Report of Independent Registered Public Accounting Firm
The Board of Directors and Stockholders of LTX Corporation
We have audited management’s assessment, included in the accompanying Management’s Annual Report on Internal Control Over Financial Reporting, that LTX Corporation maintained effective internal control over financial reporting as of July 31, 2005, based on criteria established in Internal Control—Integrated Framework issued by the Committee of Sponsoring Organizations of the Treadway Commission (the COSO criteria). LTX Corporation’s management is responsible for maintaining effective internal control over financial reporting and for its assessment of the effectiveness of internal control over financial reporting. Our responsibility is to express an opinion on management’s assessment and an opinion on the effectiveness of the company’s internal control over financial reporting based on our audit.
We conducted our audit in accordance with the standards of the Public Company Accounting Oversight Board (United States). Those standards require that we plan and perform the audit to obtain reasonable assurance about whether effective internal control over financial reporting was maintained in all material respects. Our audit included obtaining an understanding of internal control over financial reporting, evaluating management’s assessment, testing and evaluating the design and operating effectiveness of internal control, and performing such other procedures as we considered necessary in the circumstances. We believe that our audit provides a reasonable basis for our opinion.
A company’s internal control over financial reporting is a process designed to provide reasonable assurance regarding the reliability of financial reporting and the preparation of financial statements for external purposes in accordance with generally accepted accounting principles. A company’s internal control over financial reporting includes those policies and procedures that (1) pertain to the maintenance of records that, in reasonable detail, accurately and fairly reflect the transactions and dispositions of the assets of the company; (2) provide reasonable assurance that transactions are recorded as necessary to permit preparation of financial statements in accordance with generally accepted accounting principles, and that receipts and expenditures of the company are being made only in accordance with authorizations of management and directors of the Company; and (3) provide reasonable assurance regarding prevention or timely detection of unauthorized acquisition, use, or disposition of the company’s assets that could have a material effect on the financial statements.
Because of its inherent limitations, internal control over financial reporting may not prevent or detect misstatements. Also, projections of any evaluation of effectiveness to future periods are subject to the risk that controls may become inadequate because of changes in conditions, or that the degree of compliance with the policies or procedures may deteriorate.
In our opinion, management’s assessment that LTX Corporation maintained effective internal control over financial reporting as of July 31, 2005, is fairly stated, in all material respects, based on the COSO criteria. Also, in our opinion, LTX Corporation maintained, in all material respects, effective internal control over financial reporting as of July 31, 2005, based on the COSO criteria.
We also have audited, in accordance with the standards of the Public Company Accounting Oversight Board (United States), the consolidated balance sheets of LTX Corporation as of July 31, 2005 and 2004, and the related consolidated statements of operations and comprehensive income, stockholders’ equity, and cash flows for each of the three years in the period ended July 31, 2005 of LTX Corporation and our report dated October 7, 2005 expressed an unqualified opinion thereon.
Ernst & Young LLP
Boston, Massachusetts
October 7, 2005
Changes in Internal Controls
During the fourth quarter, the Company made modifications to its documentation and review process over complex multiple element sales transactions, specifically in the requirement of obtaining hard copy evidence of a sales transaction prior to the close of the fiscal period. Additionally, the Company has enhanced its revenue recognition checklist and initiated a revenue recognition training process requiring all sales personnel to attend a semi-annual training session focused on the principles of revenue recognition. These actions were implemented in order to address the Company’s determination, which was previously disclosed in the Company’s Quarterly Report on Form 10-Q for the period ended April 30, 2005, that the Company needed to modify its documentation and review process over unusual and complex sales transactions. No other change in the Company’s internal control over financial reporting occurred during the fiscal quarter ended July 31, 2005 that has materially affected, or is reasonably likely to materially affect, the Company’s internal control over financial reporting.
51
PART III
Items 10-14. Directors and Executive Officers of the Registrant,Executive Compensation,Security Ownership of Certain Beneficial Owners and Management and Related Stockholder Matters,Certain Relationships and Related Transactions andPrincipal Accountant Fees and Services
Information required under these Items is included in the Proxy Statement for the Annual Meeting of Stockholders to be held on November 10, 2005, under the headings “Certain Stockholders,” “Election of Directors,” “Compensation of Executives and Officers,” “Compensation Plans,” “Section 16(a) Beneficial Ownership Reporting Compliance,” and “Information Concerning Auditors,” which information is incorporated herein by reference. Such Proxy Statement shall be filed with the Securities and Exchange Commission not later than 120 days after the end of the Company’s fiscal year, July 31, 2005.
PART IV
Item 15. Exhibits and Financial Statement Schedules
(A) 1. Financial Statements
The following consolidated financial statements of the Company for the fiscal year ended July 31, 2005, are included in Item 8, herein.
Report of Ernst & Young LLP Independent Registered Public Accounting Firm
Consolidated Balance Sheets—July 31, 2005 and 2004
Consolidated Statements of Operations and Comprehensive Income for the years ended July 31, 2005, 2004, and 2003
Consolidated Statements of Stockholders’ Equity for the years ended July 31, 2005, 2004, and 2003
Consolidated Statements of Cash Flows for the years ended July 31, 2005, 2004, and 2003
Notes to the Consolidated Financial Statements
(A) 2. Financial Statement Schedules
Consolidated financial statement Schedule II for the Company is included in Item 15(c). All other schedules for which provision is made in the applicable security regulation of the Securities and Exchange Commission are not required under the related instructions or are inapplicable and therefore have been omitted.
(A) 3. Exhibits
Certain of the exhibits listed hereunder have previously been filed with the Commission as exhibits to the Company’s Registration Statement No. 2-75470 on Form S-1 filed December 23, 1981, as amended (the 1981 Registration Statement); to the Company’s Registration Statement No. 2-94218 on Form S-1 filed November 8, 1984, as amended (the 1984 Registration Statement); to the Company’s Registration Statement No. 33-35401 on Form S-4 filed June 26, 1990, as amended (the 1990 Registration Statement No. 1); to the Company’s Registration Statement No. 33-39610 on Form S-3 filed June 10, 1991, as amended (the 1991 Registration Statement No. 1); to the Company’s Amendment No. 1 to Registration Statement No. 33-62125 on Form S-3 filed September 11, 1995 (the 1995 Registration Statement No. 1); to the Company’s Registration No. 333-106163 on Form S-8 filed June 16, 2003 (the “2003 S-8”); to the Company’s Registration No. 333-11814 on Form S-8 filed January 9, 2004 (the “2004 S-8”); to the Company’s Registration Statement No. 333-121379 on Form S-8 filed on December 12, 2004 (the “December 2004 S-8”); to the Company’s Form 8A/A filed September 30, 1993 amending the Company’s Registration Statement on Form 8-A filed November 24, 1982 (the 1993 8A/A); to the Company’s Current Reports on Form 8-K filed May 11, 1989 and April 3, 2002; the Company’s Annual Reports on Form 10-K for one of the years ended July 31, 2003, 2002, 2001, 1998, 1997, 1996, 1995, 1994, 1993, 1992, 1991, 1990, 1989, 1988, 1987, 1986, 1985, 1984 and 1983; or the Company’s Quarterly Reports on 10-Q for one of the quarters ended October 31, 1997, January 31, 1998, April 30, 1998, January 31, October 31, 1999 and January 31, 2000, April 30, 2001, January 31, 2002, January 31, 2003, January 31, 2004, October 31, 2004 (the “10/31/04 10Q”) and April 30, 2005 (the “04/30/05 10Q”) and are hereby incorporated by reference. The location of each document so incorporated by reference is noted parenthetically.
52
(A) Listing of Exhibits
| | |
| 3.1 | | —Articles of Organization, as amended. (Exhibit 3.1 to the 1995 Registration Statement No. 1) |
| |
| 3.2 | | —By-laws, as amended. (Exhibit 3(B) to the Quarterly Report on Form 10-Q for the quarter ended October 31, 1997) |
| |
| 4.1 | | —Rights Agreement. (Exhibit I of the Registrant’s Current Report on Form 8-K, filed May 3, 1999), Amendment to Rights Agreement (Exhibit 4.1 to the Current Report on Form 8-K, filed February 14, 2003) and Amendment No. 2 to Rights Agreement (Exhibit 4.1 to the Current Report on Form 8-K, filed January 27, 2004) |
| |
| 4.2 | | —Indenture dated as of August 8, 2001 between LTX Corporation and State Street Bank & Trust Company as Trustee (Exhibit 4(D) to the 2001 Annual Report on Form 10-K) |
| |
| 4.3 | | —Registration Rights Agreement dated as of August 8, 2001 among LTX Corporation, Morgan Stanley & Co., Incorporated, Deutsche Banc Alex Brown and Needham & Company, Inc. (Exhibit 4(E) to the 2001 Annual Report on Form 10-K) |
| |
| 10.1+ | | —1990 Stock Option Plan. (Exhibit 10(B) to the Quarterly Report on Form 10-Q for the quarter ended January 31, 1998) |
| |
| 10.2+ | | —2004 Employee Stock Purchase Plan. (Exhibit 10(D) to the 2004 S-8) |
| |
| 10.3+ | | —1983 Non-Qualified Stock Option Plan (Exhibit 10(E) to the 1983 Annual Report on Form 10-K) |
| |
| 10.4 | | —LTX Corporation 401(k) Adoption Agreement, Retirement Plan and Trust Agreement (Exhibit 10(F) to the 2002 Annual Report of Form 10-K) |
| |
| 10.5 | | —Lease dated as of February 27, 1985 relating to land and building at McCandless Park, San Jose, California. (Exhibit 10(K) to the 1985 Annual Report on Form 10-K) and Seventh Amendment to Lease dated September 25, 2002 |
| |
| 10.6 | | —Lease dated as of November 26, 1980 relating to Company’s facility at 50 Rosemont Road, Westwood, Massachusetts, and Amendment dated as of April 29, 1982, and Third Amendment and Restatement of Lease dated April 29, 1982. (Exhibit 10(M) to the 1993 Annual Report on Form 10-K) and Fourth Amendment to Lease dated as of September 1, 1999 (Exhibit 10(M)(i) to the Quarterly Report on Form 10-Q for the quarter ended January 31, 2000) |
| |
| 10.7 | | —Termination Agreement dated as of December 20, 2001 relating to Company’s facility at 5 Rosemont Avenue, Westwood, Massachusetts (Exhibit 10(M)(ii) to the Quarterly Report on Form 10-Q for the quarter ended January 31, 2002) |
| |
| 10.8+ | | —Summary of Executive Bonus Plan |
| |
| 10.9 | | —Loan and Security Agreement dated as of May 31, 2005 between LTX Corporation and Silicon Valley Bank (Exhibit 10.9 to the 04/30/05 10Q) |
| |
| 10.10+ | | —Form of Change of Control Agreement entered into with certain executive officers (Exhibit 10(Y) to the Quarterly Report on Form 10-Q for the quarter ended January 31, 1998) |
| |
| 10.11 | | —1999 Stock Plan (Exhibit 10(CC) to the Quarterly Report on Form 10-Q for the quarter ended October 31, 1999) |
| |
| 10.12 | | —Credit Agreement dated as of April 30, 2001 between LTX Corporation and Citizens Bank of Massachusetts (Exhibit 10(EE) to the Quarterly Report on Form 10-Q for the quarter ended April 30, 2001) and Amendment 5 to Credit Agreement |
| |
| 10.13+ | | —2001 Stock Plan (Exhibit 10(FF) to the Quarterly Report on Form 10-Q for the quarter ended January 31, 2003) |
| |
| 10.14+ | | —Deferred Compensation Plan effective as of December 1, 2001 (Exhibit 10(GG) to the Quarterly Report on Form 10-Q for the quarter ended January 31, 2002) |
| |
| 10.15 | | —STI 2000 Stock Option Plan (Exhibit 4 to the 2003 S-8) |
| |
| 10.16+ | | —2004 Stock Plan (Exhibit 10.15+ to the 10/31/04 10Q) |
| |
| 10.17+ | | —Form of Nonstatutory Stock Agreement for Non-Employee Directors (Exhibit 10.16 to the 10/31/04 10Q) |
| |
| 10.18+ | | —Form of Incentive Stock Option Agreement for Employees (Exhibit 10.17 to the 10/31/04 10Q) |
| |
| 16.1 | | —Letter dated April 3, 2002 from Arthur Andersen LLP (Exhibit 16 to the Current Report on Form 8-K filed April 3, 2002) |
| |
| 21 | | —Subsidiaries of Registrant |
| |
| 23.1 | | —Consent of Ernst & Young LLP |
| |
| 31.1 | | —Rule 13a-14(a) Certification of Roger W. Blethen, CEO |
| |
| 31.2 | | —Rule 13a-14(a) Certification of Mark J. Gallenberger, CFO |
| |
| 32 | | —Section 1350 Certification of CEO and CFO |
| + | This exhibit is a compensatory plan or arrangement in which executive officers or directors of the Company participate. |
53
Pursuant to Item 601 of Regulation S-K, certain instruments with respect to long-term debt not exceeding 10% of the total assets of the Company and its subsidiaries on a consolidated basis are not filed herewith. The Company hereby agrees to furnish to the Commission a copy of each such instrument upon request.
Item 15(b). Exhibits
Exhibit 21—Subsidiaries of Registrant
| | | | | |
Company
| | | | | |
LTX (Europe) Limited | | United Kingdom | | 100 | % |
LTX International Inc., Domestic International Sales Corporation (DISC) | | Delaware | | 100 | % |
LTX (Deutschland) GmBH | | West Germany | | 100 | % |
LTX France S.A. | | France | | 100 | % |
LTX Test Systems Corporation | | Delaware | | 100 | % |
LTX (Italia) S.r. | | Italy | | 100 | % |
LTX (Foreign Sales Corporation) B.V. | | The Netherlands | | 100 | % |
LTX Asia International, Inc. | | Delaware | | 100 | % |
LTX Israel Limited | | Israel | | 100 | % |
LTX (Malaysia) SDN.BHD | | Malaysia | | 100 | % |
LTX LLC | | Delaware | | 100 | % |
The subsidiaries listed are all included in the consolidated financial statements of the Company.
Item 15(c)
SCHEDULE II
LTX CORPORATION
VALUATION AND QUALIFYING ACCOUNTS
For Years Ended July 31, 2005, 2004 and 2003
(in thousands)
| | | | | | | | | | | | | |
Description
| | Balance at
beginning
of period
| | Charged
to expense
| | Deductions
| | | Balance
at end
of period
|
Reserve for sales returns, allowances and doubtful accounts | | | | | | | | | | | | | |
July 31, 2005 | | $ | 2,016 | | $ | 0 | | $ | (110 | )(2) | | $ | 1,906 |
July 31, 2004 | | $ | 3,518 | | $ | 0 | | $ | (1,502 | )(1) | | $ | 2,016 |
July 31, 2003 | | $ | 3,579 | | $ | 230 | | $ | (291 | )(2) | | $ | 3,518 |
Reserve for other accounts receivable | | | | | | | | | | | | | |
July 31, 2005 | | $ | 0 | | $ | 0 | | $ | 0 | | | $ | 0 |
July 31, 2004 | | $ | 0 | | $ | 0 | | $ | 0 | | | $ | 0 |
July 31, 2003 | | $ | 0 | | $ | 0 | | $ | 0 | | | $ | 0 |
| (1) | Includes $1.5 million of adjustments in the allowance for sales return and doubtful accounts. See Liquidity and Capital Resources, Item 7. Management’s Discussion and Analysis of Financial Condition and Results of Operations. |
| (2) | Represents amounts written off. |
54
SIGNATURES
Pursuant to the requirements of Section 13 or 15(d) of the Securities Exchange Act of 1934, the registrant has duly caused this report to be signed on its behalf by the undersigned, thereunto duly authorized.
| | |
| LTX CORPORATION |
| |
| By: | | /s/ ROGER W. BLETHEN
|
| | | Roger W. Blethen Chairman of the Board and Chief Executive Officer |
October 7, 2005
Pursuant to the requirements of the Securities and Exchange Act of 1934, this report has been signed below by the following persons on behalf of the registrant and in the capacities and on the dates indicated.
| | | | |
/s/ ROGER W. BLETHEN
Roger W. Blethen | | Chairman of the Board and Chief Executive Officer (Principal Executive Officer) | | October 7, 2005 |
| | |
/s/ MARK J. GALLENBERGER
Mark J. Gallenberger | | Vice President, Chief Financial Officer and Treasurer (Principal Financial Officer) | | October 7, 2005 |
| | |
/s/ DANIEL V. WALLACE
Daniel V. Wallace | | Controller, (Principal Accounting Officer) | | October 7, 2005 |
| | |
/s/ MARK S. AIN
Mark S. Ain | | Director | | October 7, 2005 |
| | |
/s/ ROBERT J. BOEHLKE
Robert J. Boehlke | | Director | | October 7, 2005 |
| | |
Richard S. Hill | | Director | | October 7, 2005 |
| | |
| | |
/s/ STEPHEN M. JENNINGS
Stephen M. Jennings | | Director | | October 7, 2005 |
| | |
/s/ ROGER J. MAGGS
Roger J. Maggs | | Director | | October 7, 2005 |
| | |
/s/ ROBERT E. MOORE
Robert E. Moore | | Director | | October 7, 2005 |
| | |
/s/ SAMUEL RUBINOVITZ
Samuel Rubinovitz | | Director | | October 7, 2005 |
55