UNITED STATES
SECURITIES AND EXCHANGE COMMISSION
Washington, D.C. 20549
FORM 10-Q
(Mark One)
| x | QUARTERLY REPORT PURSUANT TO SECTION 13 OR 15(d) OF THE SECURITIES EXCHANGE ACT OF 1934 |
For the quarterly period ended October 31, 2007
OR
| ¨ | TRANSITION REPORT PURSUANT TO SECTION 13 OR 15(d) OF THE SECURITIES EXCHANGE ACT OF 1934 |
For the transition period from to
Commission file number: 000-10761
LTX CORPORATION
(Exact name of registrant as specified in its charter)
| | |
| Massachusetts | | 04-2594045 |
(State or other jurisdiction of incorporation or organization) | | (I.R.S. Employer Identification No.) |
| | |
825 University Avenue, Norwood, Massachusetts | | 02062 |
| (Address of principal executive offices) | | (Zip Code) |
(781) 461-1000
(Registrant’s telephone number, including area code)
[None]
(Former name, former address and former fiscal year, if changed since last report)
Indicate by check mark whether the registrant: (1) has filed all reports required to be filed by Section 13 or 15(d) of the Securities Exchange Act of 1934 during the preceding 12 months (or for such shorter period that the registrant was required to file such reports), and (2) has been subject to such filing requirements for the past 90 days. Yes x No ¨
Indicate by check mark whether the registrant is a large accelerated filer, an accelerated filer, or a non-accelerated filer. See definition of “accelerated filer and large accelerated filer” in Rule 12b-2 of the Exchange Act.
Large accelerated filer ¨ Accelerated filer x Non-accelerated filer ¨
Indicate by check mark whether the registrant is a shell company (as defined in Rule 12b-2 of the Exchange Act). Yes ¨ No x
Indicate the number of shares outstanding of each of the issuer’s classes of common stock, as of the latest practicable date.
| | |
Class | | Outstanding at November 26, 2007 |
Common Stock, $0.05 par value per share | | 62,491,360 shares |
LTX CORPORATION
Index
2
LTX CORPORATION
CONSOLIDATED BALANCE SHEETS
(In thousands)
| | | | | | | | |
| | | October 31, 2007 | | | July 31, 2007 | |
| | | (Unaudited) | | | | |
ASSETS | | | | | | | | |
Current assets: | | | | | | | | |
Cash and cash equivalents | | $ | 32,156 | | | $ | 63,302 | |
Marketable securities | | | 29,498 | | | | 35,236 | |
Accounts receivable—trade, net of allowances | | | 27,113 | | | | 22,479 | |
Accounts receivable—other | | | 1,507 | | | | 1,475 | |
Inventories | | | 25,856 | | | | 27,102 | |
Prepaid expenses and other current assets | | | 4,015 | | | | 3,783 | |
| | | | | | | | |
Total current assets | | | 120,145 | | | | 153,377 | |
Property and equipment, net | | | 32,721 | | | | 32,483 | |
Goodwill | | | 14,762 | | | | 14,762 | |
Other assets | | | 521 | | | | 500 | |
| | | | | | | | |
Total assets | | $ | 168,149 | | | $ | 201,122 | |
| | | | | | | | |
| | |
LIABILITIES AND STOCKHOLDERS’ EQUITY | | | | | | | | |
Current liabilities: | | | | | | | | |
Current portion of long-term debt | | $ | 3,001 | | | $ | 29,322 | |
Accounts payable | | | 14,641 | | | | 15,334 | |
Deferred revenues and customer advances | | | 1,779 | | | | 1,838 | |
Other accrued expenses | | | 13,193 | | | | 19,605 | |
| | | | | | | | |
Total current liabilities | | | 32,614 | | | | 66,098 | |
Long-term debt, less current portion | | | 17,000 | | | | 17,900 | |
Other long-term liabilities | | | 4,465 | | | | 4,016 | |
Stockholders’ equity: | | | | | | | | |
Common stock | | | 3,125 | | | | 3,123 | |
Additional paid-in capital | | | 569,906 | | | | 568,966 | |
Accumulated other comprehensive loss | | | (596 | ) | | | (840 | ) |
Accumulated deficit | | | (458,365 | ) | | | (458,141 | ) |
| | | | | | | | |
Total stockholders’ equity | | | 114,070 | | | | 113,108 | |
| | | | | | | | |
Total liabilities and stockholders’ equity | | $ | 168,149 | | | $ | 201,122 | |
| | | | | | | | |
See accompanying Notes to Consolidated Financial Statements
3
LTX CORPORATION
CONSOLIDATED STATEMENTS OF OPERATIONS AND COMPREHENSIVE INCOME (LOSS)
(Unaudited)
(In thousands, except per share data)
| | | | | | | | |
| | | Three Months Ended October 31, | |
| | | 2007 | | | 2006 | |
Net product sales | | $ | 22,881 | | | $ | 42,042 | |
Net service sales | | | 6,754 | | | | 7,798 | |
| | | | | | | | |
Net sales | | | 29,635 | | | | 49,840 | |
Cost of sales (includes stock-based compensation expense of $26 for Q1 FY08; $22 for Q1 FY07) | | | 15,179 | | | | 24,704 | |
| | | | | | | | |
Gross profit | | | 14,456 | | | | 25,136 | |
Engineering and product development expenses (includes stock-based compensation expense of $280 for Q1 FY08; $228 for Q1 FY07) | | | 11,636 | | | | 12,933 | |
Selling, general and administrative expenses (includes stock-based compensation expense of $666 for Q1 FY08; $691 for Q1 FY07) | | | 6,511 | | | | 7,065 | |
| | | | | | | | |
Income (loss) from operations | | | (3,691 | ) | | | 5,138 | |
Other income (expense): | | | | | | | | |
Interest expense | | | (473 | ) | | | (1,932 | ) |
Investment income | | | 689 | | | | 1,384 | |
| | | | | | | | |
Income (loss) before provision (benefit) for taxes | | | (3,475 | ) | | | 4,590 | |
| | |
(Benefit) for income taxes | | | (3,251 | ) | | | — | |
| | | | | | | | |
Net income (loss) | | $ | (224 | ) | | $ | 4,590 | |
Net income (loss) per share: | | | | | | | | |
Basic | | $ | 0.00 | | | $ | 0.07 | |
Diluted | | | 0.00 | | | $ | 0.07 | |
Weighted-average common shares used in computing net income (loss) per share: | | | | | | | | |
Basic | | | 62,469 | | | | 62,019 | |
Diluted | | | 62,469 | | | | 62,445 | |
Comprehensive income (loss): | | | | | | | | |
Net income (loss) | | $ | (224 | ) | | $ | 4,590 | |
Unrealized gain (loss) on marketable securities | | | 234 | | | | 557 | |
Pension liability gain/(loss) | | | 10 | | | | (7 | ) |
| | | | | | | | |
Comprehensive income (loss) | | $ | 20 | | | $ | 5,140 | |
| | | | | | | | |
See accompanying Notes to Consolidated Financial Statements
4
LTX CORPORATION
CONSOLIDATED STATEMENTS OF CASH FLOWS
(Unaudited)
(In thousands)
| | | | | | | | |
| | | Three Months Ended October 31, | |
| | | 2007 | | | 2006 | |
CASH FLOWS FROM OPERATING ACTIVITIES: | | | | | | | | |
Net income (loss) | | $ | (224 | ) | | $ | 4,590 | |
Add (deduct) non-cash items: | | | | | | | | |
Stock-based compensation | | | 972 | | | | 941 | |
Depreciation and amortization | | | 3,078 | | | | 3,434 | |
Benefit for income taxes | | | (3,251 | ) | | | — | |
Other | | | 40 | | | | 109 | |
Changes in operating assets and liabilities: | | | | | | | | |
Accounts receivable | | | (4,639 | ) | | | 7,868 | |
Inventories | | | 1,262 | | | | 487 | |
Prepaid expenses | | | (164 | ) | | | (109 | ) |
Other assets | | | (23 | ) | | | (111 | ) |
Accounts payable | | | (710 | ) | | | 1,067 | |
Accrued expenses | | | (2,753 | ) | | | (5,959 | ) |
Deferred revenues and customer advances | | | (142 | ) | | | (1,390 | ) |
| | | | | | | | |
Net cash provided by (used in) operating activities | | | (6,554 | ) | | | 10,927 | |
CASH FLOWS FROM INVESTING ACTIVITIES: | | | | | | | | |
Proceeds from sale of marketable securities | | | 5,986 | | | | 22,501 | |
Purchases of property and equipment | | | (3,360 | ) | | | (3,334 | ) |
| | | | | | | | |
Net cash provided by investing activities | | | 2,626 | | | | 19,167 | |
CASH FLOWS FROM FINANCING ACTIVITIES: | | | | | | | | |
Exercise of stock options and vesting of RSUs | | | (70 | ) | | | 200 | |
Payments of short-term notes payable, net | | | (27,221 | ) | | | (63,467 | ) |
| | | | | | | | |
Net cash used in financing activities | | | (27,291 | ) | | | (63,267 | ) |
Effect of exchange rate changes on cash | | | 73 | | | | 176 | |
| | | | | | | | |
Net decrease in cash and cash equivalents | | | (31,146 | ) | | | (32,997 | ) |
Cash and cash equivalents at beginning of period | | | 63,302 | | | | 106,445 | |
| | | | | | | | |
Cash and cash equivalents at end of period | | $ | 32,156 | | | $ | 73,448 | |
| | | | | | | | |
SUPPLEMENTAL DISCLOSURES OF CASH FLOW INFORMATION: | | | | | | | | |
Cash paid during the period for interest | | $ | 2,226 | | | $ | 3,453 | |
| | | | | | | | |
See accompanying Notes to Consolidated Financial Statements
5
LTX CORPORATION
NOTES TO CONSOLIDATED FINANCIAL STATEMENTS
(Unaudited)
1. THE COMPANY
LTX Corporation (“LTX” or the “Company”) designs, manufactures, and markets automatic semiconductor test equipment. Semiconductor designers and manufacturers worldwide use semiconductor test equipment to test devices at different stages during the manufacturing process. These devices are incorporated in a wide range of products, including mobile internet equipment such as wireless access points and interfaces, broadband access products such as cable modems and DSL modems, personal communication products such as cell phones and personal digital assistants, consumer products such as televisions, videogame systems, digital cameras and automobile electronics, and for power management in portable and automotive electronics. The Company also sells hardware and systems support and maintenance services for its test systems. The Company is headquartered, and has development and manufacturing facilities, in Norwood, Massachusetts, a development facility in Milpitas, California, and worldwide sales and service facilities to support its customer base.
2. SUMMARY OF SIGNIFICANT ACCOUNTING POLICIES
Basis of Presentation
The accompanying unaudited consolidated financial statements have been prepared in accordance with the instructions to Form 10-Q and, accordingly, these footnotes condense or omit information and disclosures which substantially duplicate information provided in our latest audited financial statements. These financial statements should be read in conjunction with the financial statements and notes included in our Annual Report on Form 10-K for the year ended July 31, 2007. In the opinion of our management, these financial statements reflect all adjustments, including normal recurring accruals, necessary for a fair presentation of the results for the interim periods presented. The operating results for the three months ended October 31, 2007 are not necessarily indicative of future trends or our results of operations for the entire year.
Revenue Recognition
The Company recognizes revenue based on guidance provided in SEC Staff Accounting Bulletin No. 104, (“SAB 104”), “Revenue Recognition” and EITF No. 00-21 “Revenue Arrangements with Multiple Deliverables”. The Company recognizes revenue when persuasive evidence of an arrangement exists, delivery has occurred or services have been rendered, the seller’s price is fixed or determinable and collectibility is reasonably assured.
Revenue related to equipment sales is recognized when: (a) we have a written sales agreement; (b) delivery has occurred; (c) the price is fixed or determinable; (d) collectibility is reasonably assured; (e) the product delivered is standard product with historically demonstrated acceptance; and (f) there is no unique customer acceptance provision or payment tied to acceptance or an undelivered element significant to the functionality of the system. Generally, payment terms are time based after product shipment. Certain sales include payment terms tied to customer acceptance. If a portion of the payment is linked to product acceptance, which is 20% or less, the revenue is deferred on only the percentage holdback until payment is received or written evidence of acceptance is delivered to the Company. If the portion of the holdback is greater than 20%, the full value of the equipment is deferred until payment is received or written evidence of acceptance is delivered to the Company. When sales to a customer involve multiple elements, revenue is recognized on the delivered element provided that (1) the undelivered element is a proven technology, (2) there is a history of acceptance on the product with the customer, (3) the undelivered element is not essential to the customer’s application, (4) the delivered item(s) has value to the customer on a stand-alone basis, (5) objective and reliable evidence of the fair value of the undelivered item(s) exists, (6) if the arrangement included a general right of return relative to the delivered item(s), delivery or performance of the undelivered item(s) is considered probable and substantially in the control of the Company, and (7) if objective and reliable evidence of fair value exists for all units of accounting in the arrangement, the arrangement consideration is allocated based on the relative fair values of each unit of accounting. If the fair value of a delivered item is unknown, but the fair value of undelivered items are known, the residual method is used for allocating arrangement consideration which requires discounts in the sales value of the entire arrangement to be recognized in connection with the sale of the delivered items only. Revenue related to spare parts is recognized on shipment. Revenue related to maintenance and service contracts is recognized ratably over the duration of the contracts.
Engineering and Product Development Costs
The Company expenses all engineering, research and development costs as incurred. Expenses subject to capitalization in accordance with the Statement of Financial Accounting Standards (SFAS) No. 86, “Accounting for the Costs of Computer Software To Be Sold, Leased or Otherwise Marketed”, relating to certain software development costs, were insignificant.
6
Shipping and Handling Costs
Shipping and handling costs are included in cost of sales in the consolidated statements of operations. These costs, when included in the sales price charged for products, are recognized in net sales. Shipping and handling costs were insignificant for the three months ended October 31, 2007 and 2006.
Income Taxes
In July, 2006 the Financial Accounting Standards Board (“FASB”) issued Financial Accounting Standards Interpretation No. 48,Accounting for Uncertainty in Income Taxes(“FIN 48”). FIN 48 clarifies the accounting for uncertainty in income taxes recognized in an enterprise’s financial statements in accordance with Statement of Accounting Standards No. 109,Accounting for Income Taxes. The interpretation prescribes a recognition threshold and measurement methodology for the financial statement recognition and measurement of a tax position taken or expected to be taken in a tax return. The interpretation also provides guidance on de-recognition, classification, interest and penalties, accounting in interim periods, disclosures and transitions. The Company adopted FIN 48 on August 1, 2007. The adoption of FIN48 did not impact the consolidated financial results of operations or cash flow.
The Company and its subsidiaries file income tax returns in the U.S. federal jurisdiction, and various state and foreign jurisdictions. Foreign and United States jurisdictions are subject to income tax examinations by tax authorities for all years dating back approximately two to six years from October 31, 2007.
There were no adjustments to the Company’s accumulated deficit as a result of the implementation of FIN 48. At August 1, 2007, the Company had unrecognized tax benefits of approximately $4.3 million, which were included in other accrued liabilities. All of the Company’s deferred tax assets have a full valuation allowance recorded against them as their realization does not meet the “more likely than not” criteria under SFAS No. 109 based on the Company’s current financial status.
Subsequent to adopting FIN 48, the Company reduced its liability for uncertain tax positions by $3.3 million, as the statute of limitation on a previously identified position expired during the first quarter. This event was reported as a discrete item in the first quarter, and the $3.3 million benefit was recorded in the Company’s provision for income taxes. No other provision for income taxes was recorded in the first quarter. The Company also does not anticipate that any of the remaining uncertain tax positions will be significantly increased or decreased over the next 12 month period.
In addition, the Company recently conducted a study of the net operating loss (NOL) carry forwards and research and development (R&D) credit carry forwards to determine whether such amounts are limited under IRC Sec. 382. As of July 31, 2007, the Company has undergone no changes in ownership as described in IRC Sec. 382 in any of the NOL or R&D credit carry forward years. The Company will continue to monitor its ownership to determine if future IRC Sec. 382 limitation events occur.
The Company recognizes interest and penalties related to uncertain tax positions in income tax expense. As of August 1, 2007, the Company had accrued $786,000 of interest or penalties related to uncertain tax positions. Of this amount, $486,000 of accrued interest and penalties was de-recognized in the first quarter, as the statute of limitation on the underlying uncertain tax position expired.
Accounting for Stock-Based Compensation
The Company has five stock option plans: the 2004 Stock Plan (“2004 Plan”), the 2001 Stock Plan (“2001 Plan”), the 1999 Stock Plan (“1999 Plan”), the 1995 LTX (Europe) Ltd. Approved Stock Option Plan (“U.K. Plan”) and, in addition, the Company assumed the StepTech, Inc. Stock Option Plan (the “STI 2000 Plan”) as part of its acquisition of StepTech. The Company can only grant options from the 2004 Plan. Under the terms of the 2004 Plan, any unused shares of Common Stock as a result of termination, surrender, cancellation or forfeiture of options from the 2001 Plan and the 1999 Plan will be available for grant of equity awards under the 2004 Plan. The 2004 Plan provides for the granting of options to employees to purchase shares of common stock at not less than 100% of the fair market value at the date of grant. The 2004 Plan also provides for the granting of options to an employee, director or consultant of the Company or its subsidiaries to purchase shares of common stock at prices to be determined by the Board of Directors and also allows both restricted stock awards and stock awards. Options under this plan are exercisable over vesting periods, which typically have been three to four years from the date of grant. The general term of our stock options is ten years. The Company’s policy of issuing shares is to either buy
7
shares in the open market or issue new shares. The Company’s general practice has been to issue new shares. In fiscal 2005, the Company granted 533,750 options tied to certain performance milestones. As of October 31, 2007, 100% of these options have vested as they have met the performance milestones. During the quarter ended January 31, 2006, the Company granted 983,600 restricted stock units (“RSUs”). Of the 983,600 RSUs, vesting for 742,600 is tied to certain profit break-even milestones for executives. The first milestone was achieved May 16, 2006, resulting in 185,650 shares vesting on May 16, 2006. The remaining executive RSUs vest annually over three years on May 16 of each year starting on May 16, 2007. The remaining 241,000 RSUs are service vested for key employees over a four year period, including 60,250 shares that vested on May 16, 2006, when the Company achieved a profit break-even milestone. The remaining shares vest annually over three years on May 16 of each year starting on May 16, 2007. During the quarter ended October 31, 2006, the Company granted 973,000 RSUs. Of the 973,000 RSUs, vesting for 721,000 is tied to certain profit milestones for executives. As of October 31, 2007, none of the performance milestones have been met. The remaining 252,000 RSUs are service vested for key employees and are earned over a four year period. For the quarter ended January 31, 2007, 62,300 RSUs were granted to directors to vest over three years, and 5,000 RSUs were granted to employees to vest over four years. For the quarter ended April 30, 2007, 15,000 RSUs were granted to employees to vest over four years. During the quarter ended October 31, 2007, the Company granted 925,000 RSUs that will vest over a four year period beginning on September 19, 2008. Of the 925,000 RSUs granted during the quarter ended October 31, 2007, 645,000 were granted to executives.
Effective August 1, 2005, the Company adopted Statement of Financial Accounting Standard No. 123 (revised 2004), “Share-Based Payment” (SFAS No. 123R). Under SFAS No. 123R, the Company is required to recognize, as expense, the estimated fair value of all share-based payments to employees. In accordance with this standard, the Company has elected to recognize the compensation cost of all service based awards on a straight-line basis over the vesting period of the award. Performance based awards are recognized ratably for each vesting tranche. For the three months ended October 31, 2007 and 2006, the Company recorded expense of approximately $1.0 million and $0.9 million, respectively, in connection with its share-based payment awards. As of October 31, 2007, there is approximately $8.4 million of unrecognized compensation expense related to share-based payments to employees that will be recognized over the next 16 quarters.
The following is a summary of activities for the Company’s Stock Option Plans for the three months ended October 31, 2007:
Stock Option Activity
| | | | | | |
| | | Number of Shares | | | Weighted Average Exercise Price |
Options outstanding, beginning of period | | 8,205,197 | | | $ | 10.11 |
Granted | | — | | | | — |
Exercised | | (10,586 | ) | | | 1.03 |
Forfeited | | (39,803 | ) | | | 7.84 |
| | | | | | |
Options outstanding, end of period | | 8,154,808 | | | | 10.13 |
| | | | | | |
Options exercisable | | 7,845,902 | | | | 10.34 |
| | | | | | |
Options available for grant | | 2,338,724 | | | | — |
| | | | | | |
Weighted average fair value of options granted during period | | — | | | $ | 0.0 |
| | | | | | |
Options available for grant include both restricted stock awards and stock awards.
As of October 31, 2007, the status of the Company’s outstanding and exercisable options is as follows:
| | | | | | | | | | | | |
| | | | | Options Outstanding | | | | Exercisable |
Range of Exercise Price | | Number Outstanding | | Weighted Average Remaining Contractual Life | | Weighted Average Exercise Price | | Number Exercisable | | Weighted Average Exercise Price |
$ 0.01 – 4.63 | | 851,827 | | 5.3 | | $ | 3.61 | | 741,988 | | $ | 3.58 |
4.64 – 9.25 | | 3,133,053 | | 4.8 | | | 6.84 | | 2,933,986 | | | 6.93 |
9.26 – 13.88 | | 3,196,975 | | 4.3 | | | 12.76 | | 3,196,975 | | | 12.76 |
13.89 – 18.50 | | 680,953 | | 3.2 | | | 15.40 | | 680,953 | | | 15.40 |
18.51 – 23.13 | | 244,000 | | 3.3 | | | 21.09 | | 244,000 | | | 21.09 |
23.14 – 27.75 | | 16,000 | | 4.4 | | | 26.20 | | 16,000 | | | 26.20 |
27.76 – 32.38 | | 1,000 | | 3.6 | | | 28.34 | | 1,000 | | | 28.34 |
32.39 – 37.00 | | 15,500 | | 2.6 | | | 33.63 | | 15,500 | | | 33.63 |
41.63 – 46.25 | | 15,500 | | 2.4 | | | 46.25 | | 15,500 | | | 46.25 |
| | | | | | | | | | | | |
| | 8,154,808 | | 4.3 | | $ | 10.13 | | 7,845,902 | | $ | 10.34 |
| | | | | | | | | | | | |
8
RSU Activity
| | | | | | |
| | | Three Months Ended October 31, 2007 |
| | | Number of
Shares | | | Weighted Average Grant-Date Fair Value |
RSUs outstanding, beginning of period | | 1,527,335 | | | $ | 4.77 |
Granted | | 925,000 | | | | 3.90 |
Exercised | | (58,750 | ) | | | 4.84 |
Forfeited | | (12,500 | ) | | | 4.93 |
| | | | | | |
RSUs outstanding, end of period | | 2,381,085 | | | $ | 4.43 |
| | | | | | |
Product Warranty Costs
The Company’s products are sold with warranty provisions that require us to remedy deficiencies in quality or performance of our products over a specified period of time at no cost to our customers. The Company’s policy is to establish warranty reserves at levels that represent our estimate of the costs that will be incurred to fulfill those warranty requirements at the time that revenue is recognized.
The following table shows the change in the product warranty liability, as required by FASB Interpretation No. (FIN) 45, “Guarantor’s Accounting and Disclosure Requirements for Guarantees, Including Indirect Guarantees of Indebtedness of Others”, for the three months ended October 31, 2007 and 2006:
| | | | | | | | |
| | | Three Months Ended October 31, | |
Product Warranty Activity | | 2007 | | | 2006 | |
| | | (in thousands) | |
| | | | |
Balance at beginning of period | | $ | 1,819 | | | $ | 3,543 | |
Warranty expenditures for current period | | | (612 | ) | | | (853 | ) |
Changes in liability related to pre-existing warranties | | | — | | | | (47 | ) |
Provision for warranty costs in the period | | | 370 | | | | 771 | |
| | | | | | | | |
Balance at end of period | | $ | 1,577 | | | $ | 3,414 | |
| | | | | | | | |
Comprehensive Income (Loss)
Comprehensive income (loss) is comprised of two components, net income (loss) and other comprehensive income (loss). Other comprehensive income (loss) consists of unrealized gains and losses on the Company’s marketable securities and the effects of the pension liability gain or loss.
Net Income (Loss) per Share
Basic net income (loss) per share is computed by dividing net income (loss) available to common stockholders by the weighted average number of common shares outstanding for the period. Diluted net income (loss) per share reflects the maximum dilution that would have resulted from the assumed exercise and share repurchase related to dilutive stock options and is computed by dividing net income (loss) by the weighted average number of common shares and the dilutive effect of all securities outstanding.
Reconciliation between basic and diluted earnings per share is as follows:
9
| | | | | | | |
| | | Three Months Ended October 31, |
| | | 2007 | | | 2006 |
| | | (in thousands, except
per share data) |
Net income (loss) | | $ | (224 | ) | | $ | 4,590 |
Basic EPS | | | | | | | |
Basic common shares | | | 62,469 | | | | 62,019 |
Basic EPS | | $ | 0.00 | | | $ | 0.07 |
Diluted EPS | | | | | | | |
Basic common shares | | | 62,469 | | | | 62,019 |
Plus: impact of options and restricted stock units | | | — | | | | 426 |
| | | | | | | |
Diluted common shares | | | 62,469 | | | | 62,445 |
Diluted EPS | | $ | 0.00 | | | $ | 0.07 |
At October 31, 2007 and 2006, options to purchase 7,864,507 shares and 7,138,162 shares of common stock, respectively, were not included in the calculation of diluted net income (loss) per share because their inclusion would have been anti-dilutive. These options could be dilutive in the future. The calculation of diluted net income (loss) per share also excludes 653,000 and 721,000 RSUs at October 31, 2007 and 2006, respectively, in accordance with the contingently issuable shares guidance of SFAS No. 128, “Earnings Per Share”.
Cash and Cash Equivalents and Marketable Securities
The Company considers all highly liquid investments that are readily convertible to cash and that have original maturity dates of three months or less to be cash equivalents. Cash and cash equivalents consist primarily of repurchase agreements and commercial paper. Marketable securities consist primarily of debt securities that are classified as available-for-sale, in accordance with the SFAS No. 115, “Accounting for Certain Investments in Debt and Equity Securities”. Securities available for sale include corporate and governmental obligations with various contractual maturity dates some of which are greater than one year. The Company considers the securities to be liquid and convertible to cash within 30 days. The Company has the ability and intent, if necessary, to liquidate any security that the Company holds to fund operations over the next twelve months and as such has classified these securities as short-term. Governmental obligations include U.S. Government, State, Municipal and Federal Agency securities.
Gross unrealized gains and losses for the three months ended October 31, 2007 and October 31, 2006 were not significant. The realized profits, losses and interest are included in investment income in the Statements of Operations. Unrealized gains and losses are reflected as a separate component of comprehensive income (loss) and are included in Stockholders’ Equity. The Company analyzes its securities portfolio for impairment on a quarterly basis or upon occurrence of a significant change in circumstances. There were no impairment losses recorded for the three months ended October 31, 2007 and October 31, 2006.
At October 31, 2007, there was no cash restricted from withdrawal.
Inventories
Inventories are stated at the lower of cost or market, determined on the first-in, first-out method, and include materials, labor and manufacturing overhead. Inventories consisted of the following at:
| | | | | | |
| | | October 31, 2007 | | July 31, 2007 |
| | | (in thousands) |
Purchased components and parts | | $ | 14,177 | | $ | 20,317 |
Units-in-progress | | | 3,244 | | | 529 |
Finished units | | | 8,434 | | | 6,256 |
| | | | | | |
| | $ | 25,855 | | $ | 27,102 |
| | | | | | |
The Company establishes inventory reserves when conditions exist that indicate inventory may be in excess of anticipated demand or is obsolete based upon assumptions about future demand for the Company’s products or market conditions. The Company regularly evaluates the ability to realize the value of inventory based on a combination of factors including the following: forecasted sales or usage, estimated product end of life dates, estimated current and future market value and new product introductions. Purchasing and usage alternatives are also explored to mitigate inventory exposure.
10
When recorded, reserves are intended to reduce the carrying value of inventory to its net realizable value. As of October 31, 2007 and July 31, 2007, inventory is stated net of inventory reserves of $38.5 million and $41.4 million, respectively. If actual demand for products deteriorates or market conditions are less favorable than projected, additional inventory reserves may be required. Such reserves are not reversed until the related inventory is sold or otherwise disposed of. The Company recognized sales of previously written off inventory of $1.2 million for the three months ended October 31, 2007 and $2.0 million for the three months ended October 31, 2006. The $1.2 million and $2.0 million recorded for the three months ended October 31, 2007 and 2006, respectively, represents the gross cash received from the customer. The net incremental gross margin and net income effect for these transactions of $0.1 million and $0.5 million for the three months ended October 31, 2007 and 2006, did not have a significant impact on normal operating margins and the results of operations.
Property and Equipment
Property and equipment is recorded at cost. The Company provides for depreciation and amortization on the straight-line method. Charges are made to operating expenses in amounts that are sufficient to amortize the cost of the assets over their estimated useful lives. Machinery, equipment and internally manufactured systems include spare parts used for service and LTX test systems used for testing components, engineering and applications development. Internally manufactured equipment is recorded at cost and depreciated over 3 to 7 years. Repairs and maintenance costs that do not extend the lives of property and equipment are expensed as incurred. Property and equipment are summarized as follows:
| | | | | | | | | | |
| | | October 31, 2007 | | | July 31, 2007 | | | Depreciable Life In Years |
| | | (in thousands) | | | |
Machinery, equipment and internal manufactured systems | | $ | 99,495 | | | $ | 98,827 | | | 3-7 |
Office furniture and equipment | | | 3,062 | | | | 3,035 | | | 3-7 |
Leasehold improvements | | | 8,585 | | | | 8,659 | | | 10 or term of lease |
| | | | | | | | | | |
| | | 111,142 | | | | 110,521 | | | |
Less Accumulated depreciation and amortization | | | (78,421 | ) | | | (78,038 | ) | | |
| | | | | | | | | | |
| | $ | 32,721 | | | $ | 32,483 | | | |
| | | | | | | | | | |
Impairment of Long-Lived Assets Other Than Goodwill
On an on-going basis, management reviews the value and period of amortization or depreciation of long-lived assets. In accordance with SFAS No.144, “Accounting for Impairment or Disposal of Long-Lived Assets”, the Company reviews whether impairment losses exist on long-lived assets when indicators of impairment are present. During this review, the Company reevaluates the significant assumptions used in determining the original cost of long-lived assets. Although the assumptions may vary, they generally include revenue growth, operating results, cash flows and other indicators of value. Management then determines whether there has been a permanent impairment of the value of long-lived assets based upon events or circumstances that have occurred since acquisition. The extent of the impairment amount recognized is based upon a determination of the impaired asset’s fair value. There were no significant impairment losses for the three months ended October 31, 2007 and October 31, 2006.
Goodwill and Other Intangibles
The Company follows the provisions of Statement No. 142, “Goodwill and Other Intangible Assets”, which requires that goodwill and intangible assets with indefinite useful lives are not amortized. Intangible assets with a definitive useful life are amortized over their estimated useful life. Assets recorded in these categories are tested for impairment at least annually or when a change in circumstances may result in future impairment. Intangible assets are recorded at historical cost. Intangible assets acquired in an acquisition, including purchased research and development, are recorded under the purchase method of accounting. Assets acquired in an acquisition are recorded at their estimated fair values at the date of acquisition. Management uses a discounted cash flow analysis to test goodwill, at least annually or when indicators of impairment exist, which requires that certain assumptions and estimates be made regarding industry economic factors and future profitability of the acquired business to assess the need for an impairment charge. If the carrying value of the Company’s net asset is in excess of the present value of the expected future cash flows, the carrying value of goodwill is written down to fair value in the period identified.
Goodwill totaling $14.8 million at October 31, 2007 and July 31, 2007, represents the excess of acquisition costs over the estimated fair value of the net assets acquired from StepTech, Inc. (“StepTech”) on June 10, 2003. Since the Company operates as a single reporting unit under SFAS No. 142, goodwill is measured annually based on the Company’s enterprise value, or more frequently if indicators of impairment develop.
11
3. SEGMENT REPORTING
The Company operates predominantly in one industry segment: the design, manufacture and marketing of automatic test equipment for the semiconductor industry that is used to test system-on-a-chip, digital, analog and mixed signal integrated circuits.
The Company’s net sales by geographic area for the three months ended October 31, 2007 and 2006, along with the long-lived assets at October 31, 2007 and July 31, 2007, are summarized as follows:
| | | | | | |
| | | Three Months Ended
October 31, |
| | | 2007 | | 2006 |
| | | (in thousands) |
Net Sales: | | | | | | |
United States | | $ | 16,313 | | $ | 18,883 |
Taiwan | | | 1,314 | | | 1,604 |
Japan | | | 1,212 | | | 2,027 |
Singapore | | | 2,287 | | | 8,251 |
Philippines | | | 2,030 | | | 9,300 |
All other countries | | | 6,479 | | | 9,775 |
| | | | | | |
Total Net Sales | | $ | 29,635 | | $ | 49,840 |
| | | | | | |
| | | | | | |
| | | October 31, 2007 | | July 31, 2007 |
| | | (in thousands) |
Long-lived Assets: | | | | | | |
United States | | $ | 43,842 | | $ | 43,881 |
Taiwan | | | 56 | | | 65 |
Japan | | | 213 | | | 232 |
Singapore | | | 1,814 | | | 1,845 |
All other countries | | | 1,558 | | | 1,222 |
| | | | | | |
Total Long-lived Assets | | $ | 47,483 | | $ | 47,245 |
| | | | | | |
Transfer prices on products sold to foreign subsidiaries are intended to produce profit margins that correspond to the subsidiary’s sales and support efforts.
4. REORGANIZATION CHARGES AND INVENTORY PROVISIONS
There were no significant reorganization charges recorded for the quarters ended October 31, 2007 and October 31, 2006 and for the prior year twelve months ended July 31, 2007.
The Company initiated and completed several reorganization actions and inventory provisions during the fiscal year ended July 31, 2006.
The following table sets forth the Company’s reorganization accrual activity for fiscal 2007 and the three months ended October 31, 2007:
| | | | | | | | | | | | | | | | | | | |
| | | Severance Costs | | | Equipment leases | | | Facility leases | | | Asset impairment | | Total | |
| | | (in millions) | |
Balance July 31, 2006 | | $ | 2.1 | | | $ | 4.1 | | | $ | 1.8 | | | $ | — | | $ | 8.0 | |
Additions to expense | | | (0.4 | ) | | | — | | | | — | | | | — | | | (0.4 | ) |
Elimination of deferred gain | | | — | | | | (1.6 | ) | | | — | | | | — | | | (1.6 | ) |
Non-cash utilization | | | (0.4 | ) | | | — | | | | 0.2 | | | | — | | | (0.2 | ) |
Cash paid | | | (0.7 | ) | | | (1.7 | ) | | | (1.0 | ) | | | — | | | (3.4 | ) |
| | | | | | | | | | | | | | | | | | | |
Balance July 31, 2007 | | | 0.6 | | | | 0.8 | | | | 1.0 | | | | — | | | 2.4 | |
Additions to expense | | | — | | | | — | | | | — | | | | — | | | — | |
Elimination of deferred gain | | | — | | | | — | | | | — | | | | — | | | — | |
Non-cash utilization | | | — | | | | — | | | | — | | | | — | | | — | |
Cash paid | | | — | | | | (0.8 | ) | | | (0.1 | ) | | | — | | | (0.9 | ) |
| | | | | | | | | | | | | | | | | | | |
Balance October 31, 2007 | | | 0.6 | | | | — . | | | | 0.9 | | | | — | | | 1.5 | |
| | | | | | | | | | | | | | | | | | | |
12
5. CONTINGENCIES AND GUARANTEES
In the ordinary course of business, we agree from time to time to indemnify certain customers against certain third party claims for property damage, bodily injury, personal injury or intellectual property infringement arising from the operation or use of the Company’s products. Also, from time to time in agreements with suppliers, licensors and other business partners, we agree to indemnify these partners against certain liabilities arising out of the sale or use of the Company’s products. The maximum potential amount of future payments we could be required to make under these indemnification obligations is theoretically unlimited; however, we have general and umbrella insurance policies that enable the Company to recover a portion of any amounts paid and many of our agreements contain a limit on the maximum amount, as well as limits on the types of damages recoverable. Based on our experience with such indemnification claims, we believe the estimated fair value of these obligations is minimal. Accordingly, we have no liabilities recorded for these agreements as of October 31, 2007 or July 31, 2007.
Subject to certain limitations, LTX indemnifies its current and former officers and directors for certain events or occurrences. Although the maximum potential amount of future payments LTX could be required to make under these agreements is theoretically unlimited, as there were no known or pending claims, we have not accrued a liability for these agreements as of October 31, 2007 or July 31, 2007.
The Company has operating lease commitments for certain facilities and equipment and capital lease commitments for certain equipment. Minimum lease payments under noncancelable leases at October 31, 2007, are as follows:
Lease Commitments:
| | | |
Year ending July 31, | | (in thousands) Amount |
2008 | | $ | 1,926 |
2009 - 2010 | | | 3,799 |
2011 - 2012 | | | 2,748 |
Thereafter | | | 3,782 |
| | | |
Total minimum lease payments | | $ | 12,255 |
| | | |
Other accrued expenses consisted of the following at October 31, 2007 and July 31, 2007:
| | | | | | |
Other Accrued Expenses: | | | | | | |
| | | (in thousands) |
| | | October 31,
2007 | | July 31,
2007 |
Accrued compensation | | $ | 4,621 | | $ | 4,823 |
Accrued income and local taxes | | | 2,318 | | | 5,596 |
Warranty reserve | | | 1,577 | | | 1,819 |
Accrued restructuring | | | 1,476 | | | 2,223 |
Accrued interest | | | 527 | | | 2,280 |
Other accrued expenses | | | 2,674 | | | 2,864 |
| | | | | | |
| | $ | 13,193 | | $ | 19,605 |
| | | | | | |
6. LONG TERM DEBT
Long-term debt consists of the following:
| | | | | | | | |
| | | , | |
| | | (in thousands) | |
| | | October 31, 2007 | | | July 31, 2007 | |
Convertible subordinated notes | | $ | — | | | $ | 27,220 | |
Bank term loan | | $ | 20,000 | | | | 20,000 | |
Lease purchase obligations, net of deferred interest | | $ | 1 | | | | 2 | |
| | | | | | | | |
| | $ | 20,001 | | | | 47,222 | |
Less: current portion | | $ | (3,001 | ) | | | (29,322 | ) |
| | | | | | | | |
| | $ | 17,000 | | | $ | 17,900 | |
| | | | | | | | |
13
On August 8, 2001, the Company received net proceeds of $145.2 million from a private placement of $150 million, 4.25% Convertible Subordinated Notes (“the Notes”) due 2006. The private placement was effected through a Rule 144A offering to qualified institutional buyers. Interest on the Notes is payable on February 15 and August 15 of each year, commencing February 15, 2002. The Notes are convertible into shares of the Company’s common stock at any time prior to the close of business on August 15, 2006, unless previously redeemed, at a conversion price of $29.04 per share, subject to certain adjustments. Prior to August 19, 2004, the Company could have redeemed any of the Notes at a certain redemption price, plus accrued interest, if the closing price of the common stock exceeded 150% of the conversion price for at least 20 trading days in any consecutive 30-day trading period and certain other conditions are satisfied. On or after August 19, 2004, the Company could have redeemed any of the Notes at designated redemption prices, plus accrued interest. The Notes were unsecured and subordinated in right of payment in full to all existing and future senior indebtedness of the Company. Expenses associated with the offering of approximately $4.8 million were being amortized using the straight-line method, which approximates the effective interest method, over the term of the Notes. The stated interest rate was 4.25% and the effective rate is 4.39% due to the amortization of capitalized costs associated with the offering. During the fourth fiscal quarter of 2005, the Company repurchased $61.7 million of the outstanding principal balance. On November 14, 2005, the Company refinanced this debt by exchanging $27.2 million in aggregate principal amount of existing notes plus all accrued and unpaid interest on the outstanding notes for an equal principal amount of new notes due August 2007 with an interest rate of 4.25%. The principal balance of these notes of $27.2 million was paid in full on August 15, 2007.
On June 3, 2005, the Company closed a $60.0 million term loan with a commercial lender (the “2005 Loan Agreement”). The loan had a five year term. Interest was at the lender’s variable prime rate and was payable monthly. The Company entered into a new Loan and Security Agreement (the “2006 Loan Agreement”), dated as of December 7, 2006, with Silicon Valley Bank (“SVB”) to modify the existing $60.0 million term loan. Under the terms of the 2006 Loan Agreement, LTX borrowed $20.0 million under a term loan at an interest rate of prime minus 1.25% with interest-only payable during the first 12 months. The loan is secured by all assets of the Company located in the United States. Principal of this term loan is repayable over four years as follows:
| | • | | months 13 to 24: $300,000.00 per month |
| | • | | months 25 to 36: $600,000.00 per month |
| | • | | months 37 to 48: $766,666.67 per month |
The financing arrangement under the 2006 Loan Agreement also provides LTX with a $30.0 million revolving credit facility. No amount was outstanding under the revolving credit facility as of July 31, 2007.
In connection with the 2006 Loan Agreement, LTX has terminated the 2005 Loan Agreement and has repaid all outstanding amounts under the 2005 Loan Agreement. The net effect of this transaction reduced existing cash on hand by approximately $36.0 million in the quarter ended January 31, 2007.
The Company had a second credit facility with another lender for a revolving credit line of $5.0 million. This facility was secured by cash and marketable securities. The line expired on October 31, 2007 and was not renewed.
7. RECENTLY ISSUED ACCOUNTING STANDARDS
In June 2006, the FASB issued FASB Interpretation No. 48 (“FIN No. 48”), “Accounting for Uncertainty in Income Taxes—an Interpretation of FASB Statement No. 109”, which clarifies the accounting for uncertainty in income taxes recognized in accordance with SFAS No. 109, “Accounting for Income Taxes”. FIN No. 48 clarifies the application of SFAS No. 109 by defining criteria that an individual tax position must meet for any part of the benefit of that position to be recognized in the financial statements. Additionally, FIN No. 48 provides guidance on the measurement, de-recognition,
14
classification and disclosure of tax positions along with the accounting for the related interest and penalties. The provisions of FIN No. 48 are effective for the fiscal years beginning after December 15, 2006, with the cumulative effect of the change in accounting principle recorded as an adjustment to opening retained earnings. The Company has adopted FIN No. 48 for the Company’s fiscal year beginning August 1, 2007. The adoption of FIN No. 48 did not have an impact on its Consolidated Financial Statements.
In September 2006, the FASB issued SFAS No. 157, “Fair Value Measurements” (“SFAS No. 157”). SFAS No. 157 provides guidance for using fair value to measure assets and liabilities. The standard also responds to investors’ requests for more information about (1) the extent to which companies measure assets and liabilities at fair value, (2) the information used to measure fair value, and (3) the effect that fair-value measurements have on earnings. SFAS No. 157 will apply whenever another standard requires (or permits) assets or liabilities to be measured at fair value. The standard does not expand the use of fair value to any new circumstances. SFAS No. 157 is effective for financial statements issued for fiscal years beginning after November 15, 2007. The Company will adopt this requirement for the fiscal year beginning August 1, 2008. The Company is currently evaluating the potential impact that the adoption of SFAS No. 157 will have on its financial statements.
In February 2007, the FASB issued Statement of Financial Accounting Standard No. 159, “The Fair Value Option for Financial Assets and Financial Liabilities” (“SFAS No. 159”). SFAS No. 159 provides companies with an option to report selected financial assets and liabilities at fair value. The standard’s objective is to reduce both complexity in accounting for financial instruments and the volatility in earnings caused by measuring related assets and liabilities differently. This Statement is effective as of the beginning of an entity’s first fiscal year beginning after November 15, 2007. Early adoption is permitted as of the beginning of the previous fiscal year provided that the entity makes that choice in the first 120 days of that fiscal year and also elects to apply the provisions of SFAS No. 157. The Company will adopt this requirement for the fiscal year beginning August 1, 2008. The Company is currently evaluating the potential impact that the adoption of SFAS No. 159 will have on its financial statements.
| Item 2. | MANAGEMENT’S DISCUSSION AND ANALYSIS OF FINANCIAL CONDITION AND RESULTS OF OPERATIONS |
Industry Conditions and Outlook
We sell capital equipment and services to companies that design, manufacture, assemble or test semiconductor devices. The semiconductor industry is highly cyclical, causing in turn a cyclical impact on the Company’s financial results. As a capital equipment provider, revenue is driven by the capital expenditure budgets and spending patterns of our customers, who often delay or accelerate purchases in reaction to variations in their business. The level of capital expenditures by these semiconductor companies depends on the current and anticipated market demand for semiconductor devices and the products that incorporate them. Therefore, demand for our semiconductor test equipment is dependent on growth in the semiconductor industry. In particular, three primary characteristics of the semiconductor industry drive the demand for semiconductor test equipment:
| | • | | increases in unit production of semiconductor devices; |
| | • | | increases in the complexity of semiconductor devices used in electronic products; and |
| | • | | the emergence of next generation device technologies, such as system in package (“SIP”). |
15
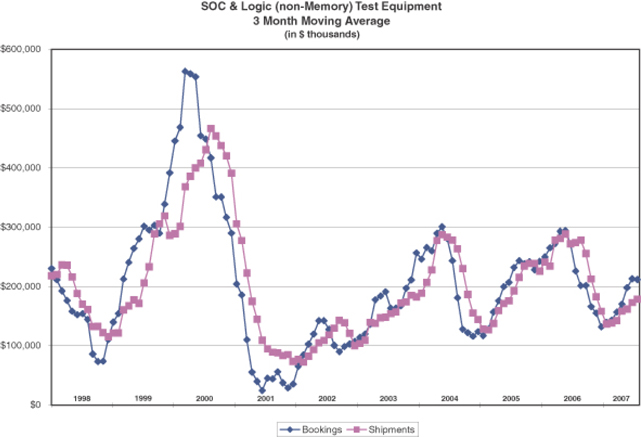
The following graph shows the cyclicality in semiconductor test equipment orders and shipments from fiscal 1997 through fiscal 2007 (using the three month moving average), as calculated by SEMI, an industry trade organization:
Consistent with the Company’s business strategy, we have continued to invest significant amounts in engineering and product development to develop and enhance our Fusion platform during industry slowdowns. For fiscal 2007, engineering and product development expense was $50.0 million, or 33.9% of net sales, as compared to $53.8 million, or 24.9% of net sales, in fiscal 2006. Engineering and development expense decreased sequentially on a quarterly basis during fiscal 2006 and 2007 and has remained at a targeted level of approximately $12.0 million per quarter for the last four quarters. Engineering and development expense for the first quarter of fiscal 2008 was $11.6 million as compared to $12.0 million in the Company’s fourth quarter of fiscal 2007. We believe that our competitive advantage in the semiconductor test industry is primarily driven by the ability of our Fusion platform to meet or exceed the technical specifications required for the testing of advanced semiconductor devices in a cost-efficient manner. Current investment in engineering and product development is focused on enhancements to and additions to the Company’s product offerings with new options and instruments designed for specific market segments. We believe this will continue to differentiate the Fusion platform from the product offerings of our competitors.
In addition, over the past several years, the Company has increasingly transitioned the manufacture of certain components and subassemblies to contract manufacturers, thereby reducing fixed manufacturing costs associated with direct labor and overhead. In fiscal 2002, the Company completed the transition of our final assembly, system integration and testing operations for Fusion HF to Jabil Circuit. In fiscal 2004, we completed the transition of our Fusion HFi, CX and DX manufacturing to Jabil Circuit. In fiscal 2005, we added Fusion EX, in fiscal 2006, we added Fusion MX and in fiscal 2007, we added Fusion LX. This strategy has further reduced our fixed manufacturing costs. We believe that transforming product manufacturing costs into variable costs will in the future allow us to improve our performance during cyclical downturns while preserving our historic gross margins during cyclical upturns.
During fiscal years 2005 and 2006, we took several additional cost reduction measures to further mitigate the adverse effect of cyclical downturns on our profitability. Our total worldwide headcount was reduced from 635 employees and 55 temporary workers at the end of fiscal 2004 to 436 employees and 18 temporary workers at the end of fiscal 2007. In addition, we continued to maintain other cost reduction measures, such as the strict oversight and reduction in discretionary travel and other variable overhead expenses. We believe that these reductions in operating costs have reduced our costs while preserving our ability to fund critical product research and development efforts and continue to provide our customers with the levels of responsiveness and service they require.
16
We are also exposed to the risks associated with the volatility of the U.S. and global economies. The lack of visibility regarding whether or when there will be sustained growth periods for the sale of electronic goods and information technology equipment, and uncertainty regarding the amount of sales, underscores the need for caution in predicting growth in the semiconductor test equipment industry in general and in our revenues and profits specifically. Slow or negative growth in the domestic economy may continue to materially and adversely affect our business, financial condition and results of operations for the foreseeable future. The Company’s results of operations would be further adversely affected if we were to experience lower than anticipated order levels, cancellations of orders in backlog, extended customer delivery requirements or pricing pressure as a result of a slowdown. At lower levels of revenue, there is a higher likelihood that these types of changes in our customers’ requirements would adversely affect our results of operations because in any particular quarter a limited number of transactions accounts for an even greater portion of sales for the quarter.
Critical Accounting Policies and the Use of Estimates
The preparation of financial statements in conformity with U.S. generally accepted accounting principles requires management to make estimates and assumptions that affect the reported amount of assets, liabilities, revenues and expenses, and related disclosure of contingent assets and liabilities. We base these estimates and assumptions on historical experience, and evaluate them on an on-going basis to ensure they remain reasonable under current conditions. Actual results could differ from those estimates. We discuss the development and selection of the critical accounting estimates with the audit committee of our board of directors on a quarterly basis, and the audit committee has reviewed the Company’s critical accounting estimates as described in Item 7, “Management’s Discussion and Analysis of Financial Condition and Results of Operations” in the Company’s Annual Report on Form 10-K for the fiscal year ended July 31, 2007. For the three months ended October 31, 2007, there have been no changes to these critical accounting policies except with respect to the adoption of FIN 48 as discussed below.
In July, 2006 the Financial Accounting Standards Board (“FASB”) issued Financial Accounting Standards Interpretation No. 48,Accounting for Uncertainty in Income Taxes(“FIN 48”). FIN 48 clarifies the accounting for uncertainty in income taxes recognized in an enterprise’s financial statements in accordance with Statement of Accounting Standards No. 109,Accounting for Income Taxes. The interpretation prescribes a recognition threshold and measurement methodology for the financial statement recognition and measurement of a tax position taken or expected to be taken in a tax return. The interpretation also provides guidance on de-recognition, classification, interest and penalties, accounting in interim periods, disclosures and transitions. The Company adopted FIN 48 on August 1, 2007. The adoption of FIN48 did not impact the consolidated financial results of operations or cash flow.
Results of Operations
The following table sets forth for the periods indicated the principal items included in the Consolidated Statement of Operations as percentages of net sales.
| | | | | | |
| | | Three Months
Ended
October 31, | |
| | | 2007 | | | 2006 | |
Net sales | | 100.0 | % | | 100.0 | % |
Cost of sales | | 51.2 | | | 49.6 | |
| | | | | | |
Gross profit | | 48.8 | | | 50.4 | |
Engineering and product development expenses | | 39.3 | | | 25.9 | |
Selling, general and administrative expenses | | 22.0 | | | 14.2 | |
| | | | | | |
Income (loss) from operations | | (12.5 | ) | | 10.3 | |
Other income (expense): | | | | | | |
Interest expense | | (1.6 | ) | | (3.9 | ) |
Investment income | | 2.3 | | | 2.8 | |
| | | | | | |
Net income (loss) before provision (benefit) for taxes | | (11.8 | ) | | 9.2 | |
Provision (benefit) from taxes | | 11.0 | | | — | |
| | | | | | |
Income (loss) | | (0.8 | %) | | 9.2 | % |
| | | | | | |
17
The discussion below contains certain forward-looking statements relating to, among other things, estimates of economic and industry conditions, sales trends, expense levels and capital expenditures. Actual results may vary from those contained in such forward-looking statements. See “Business Risks” below.
Three Months Ended October 31, 2007 Compared to the Three Months Ended October 31, 2006.
Net sales. Net sales consist of both semiconductor test equipment and related hardware and system support and maintenance services, net of returns and allowances. Net sales for the three months ended October 31, 2007 decreased 40.5% to $29.6 million as compared to $49.8 million in the same quarter of the prior year. Net sales decreased quarter over quarter, by 1.6% or $.5 million from fourth quarter of fiscal year 2007 sales of $30.1 million. The decrease in net sales from fourth quarter fiscal 2007 and the $20.2 million or 40.5% decrease in net sales for the three months ended October 31, 2007 compared to the three months ended October 31, 2006, is due to an overall industry wide slowdown which began during the fourth quarter of fiscal year 2006, continuing throughout fiscal 2007 and into our first quarter of fiscal 2008.
Service revenue, included in net sales, accounted for $6.8 million, or 22.8% of net sales, and $7.8 million, or 15.6% of net sales, for the three months ended October 31, 2007 and 2006, respectively. The decrease in service revenue is primarily a result of the increased adoption of our newer X-Series products which carry a higher degree of reliability and lower service cost than the Company’s legacy products.
Geographically, sales to customers outside of the United States were 45.0% and 62.1% of net sales for the three months ended October 31, 2007 and October 31, 2006, respectively. The decrease in sales to customers outside the United States was a result of the overall industry wide slowdown impacting the majority of the Company’s customer base. A significant portion of the Company’s products are shipped to IDM’s whose test and assembly operations are performed in Asia and to Asian subcontractors. Both of these areas were negatively impacted by the overall industry wide economic conditions.
Gross Profit Margin. The gross profit margin was $14.5 million or 48.8% of net sales in the three months ended October 31, 2007, as compared to $25.1 million or 50.4% of net sales in the same quarter of the prior year. The decrease in the gross profit margin for the three months ended October 31, 2007 as compared to October 31, 2006 was primarily a result of the fixed cost component of our cost of sales not decreasing in the same proportion as the decrease in net sales.
The Company reviews excess and obsolete inventory when conditions exist that suggest our inventory may be in excess of anticipated demand or is obsolete based upon our assumptions about future demand for our products or market conditions. We also evaluate our excess and obsolete inventory on a quarterly basis identifying and addressing significant events that might have an impact on inventories and related reserves. The major variables impacting inventory usage are the demand for current products, overall industry conditions, key sales initiatives and the impact that our new product introductions have on current product demand. There were $1.2 million and $2.0 million in sales of previously written off inventory for the three months ended October 31, 2007 and 2006, respectively. The $1.2 and the $2.0 million recorded for the three months ended October 31, 2007 and October 31, 2006 respectively, represents the gross cash received from the customer. The net incremental gross margin and net income effect for these transactions of $0.1 million and $0.5 million for the three months ended October 31, 2007 and October 31, 2006 respectively, did not have a significant impact on normal operating margins and the results.
Engineering and Product Development Expenses. Engineering and product development expenses were $11.6 million, or 39.1% of net sales, in the three months ended October 31, 2007, as compared to $12.9 million, or 25.9% of net sales, in the same quarter of the prior year. The decrease in engineering and product development expenses for the three months ended October 31, 2007 as compared to the three months ended October 31, 2006 is principally a result of completion of second generation Fusion product development projects for Fusion HFi, CX and EX. Additionally, we have been able to leverage and re-use X-Series engineering development initiatives across a broader range of applications than in the past with our Fusion HF and HFi products. This has resulted in more efficient use of engineering resources and lower costs.
Selling, General and Administrative Expenses. Selling, general and administrative expenses were $6.5 million, or 22.0% of net sales, in the three months ended October 31, 2007, as compared to $7.1 million, or 14.2% of net sales, in the same quarter of the prior year. The decrease is primarily driven by lower variable expenses related to profitability.
Interest Expense.Interest expense was $0.5 million for the three months ended October 31, 2007 as compared to $1.9 million for the three months ended October 31, 2006. Interest expense for the three months ended October 31, 2007 relates to $20.0 million bank debt which bears an interest rate of prime rate minus 1.25%. The decrease in interest expense is primarily a result of the decrease in our convertible subordinated notes balance of $27.2 million which were paid in full on August 15, 2007.
18
Investment Income.Investment income was $0.7 million for the three months ended October 31, 2007, as compared to $1.4 million for the three months ended October 31, 2006. The decrease was a due to lower cash balances resulting from the cash utilized to payoff the Company’s subordinated convertible debt and the paydown of the Company’s outstanding bank debt.
Income Tax.The Company recorded a one time tax benefit of $3.3 million for the three months ended October 31, 2007 related to the de-recognition of a liability related to an uncertain tax position. The uncertain tax position related to potential dual taxation of a gain recorded in fiscal 2002 as part of the settlement with Ando Electric Co. The statute of limitations expired on the potential tax exposure on September 14, 2007, triggering the reversal of the reserve and non-cash benefit recorded in the current period.
For the three months ended October 31, 2007 and 2006, the Company recorded no income tax provision due to the uncertainty related to utilization of net operating loss carryforwards. As a result of a review undertaken at October 31, 2007 and 2006 and our cumulative loss position at those dates, management concluded that it was appropriate to maintain a full valuation allowance for its operating loss carryforwards and its other net deferred tax assets.
Net Income (Loss).Net loss was ($0.2) million, or ($0.00) per diluted share, in the three months ended October 31, 2007, as compared to net income of $4.6 million, or $0.07 per diluted share, in the same quarter of the prior year. The $4.8 million decrease in net income (loss) was principally due to the $20.2 million decrease net sales which was partially offset by the one time $3.3 million income tax benefit.
Liquidity and Capital Resources
As of October 31, 2007, the Company had $61.7 million in cash and cash equivalents and marketable securities and net working capital of $87.5 million, as compared to $98.5 million of cash and cash equivalents and marketable securities and $87.3 million of net working capital at July 31, 2007. The decrease in the cash and cash equivalents and marketable securities was due primarily to the $29.3 million principal and interest payment related to the 4.25% Convertible Subordinated Notes due in August 2007, and an approximate $4.6 million increase in accounts receivable.
Accounts receivable from trade customers, net of allowances, was $27.1 million at October 31, 2007, as compared to $22.5 million at July 31, 2007. The principal reason for the $4.6 million increase in accounts receivable is a result of $4.0 million of delays in certain customer payments that were expected to be collected in October that were collected in early November. The allowance for sales returns and doubtful accounts was $1.3 million, or 6.9% of gross trade accounts receivable, at October 31, 2007 and $1.3 million, or 5.3% of gross trade accounts receivable at July 31, 2007.
Accounts receivable from other sources, principally amounts due from vendors, was unchanged from the July 31, 2007 balance of $1.5 million at $1.5 million at October 31, 2007.
Net inventories decreased by $1.2 million to $25.9 million at October 31, 2007 as compared to $27.1 million at July 31, 2007 as the Company continues to consume or provide for slow moving but active inventory.
Prepaid expense and other current assets increased by $0.2 million to $4.0 million at October 31, 2007 as compared to $3.8 million at July 31, 2007.
Capital expenditures totaled $3.4 million for the three months ended October 31, 2007, as compared to $3.3 million for the three months ended October 31, 2006. Expenditures for the quarter ended October 31, 2007 included $1.7 million of leasehold improvements related to the move to a new facility in Milpitas, California. The Company expects approximately $1.0 million in annual cash savings from this move effective November 1, 2007.
On June 3, 2005, the Company closed a $60.0 million term loan with a commercial lender (the “2005 Loan Agreement”). The loan had a five year term. Interest was at the lender’s variable prime rate and was payable monthly. The Company entered into a new Loan and Security Agreement (the “2006 Loan Agreement”), dated as of December 7, 2006, with Silicon Valley Bank (“SVB”) to modify the existing $60.0 million term loan. Under the terms of the 2006 Loan Agreement, LTX borrowed $20.0 million under a term loan at an interest rate of prime minus 1.25% with interest-only payable during the first 12 months. The loan is secured by all assets of the Company located in the United States. Principal of this term loan is repayable over four years as follows:
| | • | | months 13 to 24: $300,000.00 per month (first payment due January 1, 2008) |
| | • | | months 25 to 36: $600,000.00 per month |
| | • | | months 37 to 48: $766,666.67 per month |
19
The financing arrangement under the 2006 Loan Agreement also provides LTX with a $30.0 million revolving credit facility. No amount was outstanding under the revolving credit facility as of October 31 and July 31, 2007.
In connection with the 2006 Loan Agreement, LTX has terminated the 2005 Loan Agreement and has repaid all outstanding amounts under the 2005 Loan Agreement. The net effect of this transaction reduced existing cash on hand by approximately $36.0 million in the quarter ended January 31, 2007.
The Company had a second credit facility with another lender for a revolving credit line of $5.0 million. This facility was secured by cash and marketable securities. This line of credit was used to secure obligations of operating leases and existing stand-by letters of credit. The facility expired and was not renewed on October 31, 2007.
In August 2001, we received net proceeds of $145.2 million from a private placement of 4.25% Convertible Subordinated Notes due August, 2006. Interest on the 4.25% Convertible Subordinated Notes were payable on February 15 and August 15 of each year, commencing February 15, 2002. The notes were convertible into shares of our common stock at any time prior to the close of business on August 15, 2006, unless previously redeemed, at a conversion price of $29.04 per share, subject to certain adjustments. The notes are unsecured and subordinated in right of payment in full to all existing and future senior indebtedness of the Company. Expenses associated with the offering of approximately $4.8 million were being amortized using the straight-line method, which approximates the effective interest method, over the term of the notes. During the fourth fiscal quarter of 2005, the Company repurchased $61.7 million of the outstanding principal balance of the notes for a purchase price of $60.0 million. On November 14, 2005, the Company exchanged $27.2 million in aggregate principal amount of the notes plus all accrued and unpaid interest thereon for an equal principal amount of newly issued 4.25% Convertible Senior Notes (the “New Notes”) due August 2007. On August 8, 2006, the Company utilized existing cash on hand to pay the remaining outstanding balance of the $61.1 million of 4.25% Convertible Subordinated Notes. The Company paid the remaining $27.2 million outstanding principal of New Notes, together with accrued interest of $2.1 million, on August 15, 2007 with existing cash balances. As of August 15, 2007, there are no outstanding notes.
The Company has a non-qualified deferred compensation arrangement for a select group of management or highly compensated employees. The Company has two plans that have been discontinued with respect to new deferrals: (i) the LTX Corporation Deferred Compensation Plan that was adopted effective December 1, 2001, (referred to herein as the “Frozen Plan”) and (ii) a newer plan that complies with the requirements of Code Section 409A and related Treasury guidance and that governs all amounts deferred on or after January 1, 2005 (referred to herein as the “New Plan”). The Frozen Plan’s accumulated balances were distributed in a lump sum payment of approximately $2.3 million in January 2007, with the proceeds from the cash surrender value of the insurance policy used to fund this plan, and the New Plan’s accumulated balances of approximately $1.0 million will be paid out in a lump sum in January 2008 with proceeds from the cash surrender value of the insurance policy used to fund this plan. The proceeds and related liability associated with these plans are reported as other assets, and other accrued expenses, respectively.
The Company has a defined benefit pension plan for its operation in the United Kingdom. The plan was constituted in October 1981 to provide defined benefit pension and lump sum benefits, payable on retirement, for employees of LTX(Europe) Limited, (“UK”). The plan has 71 participants of which 2 remain as active employee members and 69 are non-active former employees but for whom benefits are preserved. The plan has been closed to all new members since December 31, 2000. Annually, the Company obtains an actuarial valuation of the pension plan. The plan was under-funded as of July 31, 2007 by $3.9 million. The Company has recorded this liability as other long-term liabilities of $3.6 million and other accrued expenses of $0.3 million on the consolidated balance sheet as of July 31, 2007. Cash payments are projected to be approximately $0.3 million in fiscal 2008 and actual cash payments were $0.4 million in fiscal 2007.
The Company operates in a highly cyclical industry and we may experience, with relatively short notice, significant fluctuations in demand for our products. This could result in a material effect on our liquidity position. To mitigate the risk, we have completed a substantial and lengthy process of converting our manufacturing process to an outsource model. In addition, we continue to maintain other cost reduction measures, such as the strict oversight of discretionary travel and other variable overhead expenses. We believe that these reductions in operating costs have reduced our costs while preserving our ability to fund critical product research and development efforts and continue to provide our customers with the levels of responsiveness and service they require. As such, we believe we can react to a downturn or a significant upturn much faster than in the past. We believe that our balances of cash and cash equivalents and marketable securities, cash flows expected to be generated by future operating activities, our access to capital markets for competitively priced instruments and funds available under our credit facilities will be sufficient to meet our cash requirements over the next twelve to twenty-four months, which includes the payment of the outstanding principal installments of the 2006 Loan Agreement discussed above.
20
Commitments and Contingencies
Our major outstanding contractual obligations are related to our bank term loan, facilities, leases, inventory purchase commitments and other operating leases.
The aggregate outstanding amount of the contractual obligations is $50.4 million as of October 31, 2007. These obligations and commitments represent maximum payments based on current operating forecasts. Certain of the commitments could be reduced if changes to our operating forecasts occur in the future.
The following summarizes LTX’s contractual obligations, net of sub-lease revenue, at October 31, 2007 and the effect such obligations are expected to have on our liquidity and cash flow in the future periods:
| | | | | | | | | | | | | | | |
| | | Payments Due by Period (in thousands) |
Financial Obligations | | Total | | Remainder of 2008 | | 2009–2010 | | 2011–2012 | | Thereafter |
Term loan (including interest) | | $ | 22,714 | | $ | 3,055 | | $ | 15,762 | | $ | 3,897 | | $ | — |
Inventory commitments | | | 11,219 | | | 11,219 | | | — | | | — | | | — |
Operating leases | | | 12,255 | | | 1,926 | | | 3,799 | | | 2,748 | | | 3,782 |
Long-term liabilities, pensions and severance | | | 4,206 | | | 647 | | | 682 | | | 682 | | | 2,195 |
| | | | | | | | | | | | | | | |
Total contractual obligations | | $ | 50,394 | | $ | 16,847 | | $ | 20,243 | | $ | 7,327 | | $ | 5,977 |
| | | | | | | | | | | | | | | |
In addition to the financial obligations above, the Company has recorded $1.0 million liability for uncertain tax positions as of October 31, 2007.
BUSINESS RISKS
This report includes or incorporates forward-looking statements that involve substantial risks and uncertainties and fall within the meaning of Section 27A of the Securities Act of 1933 and Section 21E of the Securities Exchange Act of 1934. You can identify these forward-looking statements by our use of the words “believes,” “anticipates,” “plans,” “expects,” “may,” “will,” “would,” “intends,” “estimates,” and similar expressions, whether in the negative or affirmative. We cannot guarantee that we actually will achieve these plans, intentions or expectations. Actual results or events could differ materially from the plans, intentions and expectations disclosed in the forward-looking statements we make. We have included important factors in the cautionary statements, particularly under the heading “Business Risks,” that we believe could cause our actual results to differ materially from the forward-looking statements that we make. We do not assume any obligation to update any forward-looking statement we make.
Our sole market is the highly cyclical semiconductor industry, which causes a cyclical impact on our financial results.
We sell capital equipment to companies that design, manufacture, assemble, and test semiconductor devices. The semiconductor industry is highly cyclical, causing in turn a cyclical impact on our financial results. In fiscal 2006, the industry entered a growth period that was reflected in our improving operating results during fiscal 2006. However, our incoming product orders in the fourth quarter decreased from the third quarter’s levels and continued to decrease in the first two quarters of fiscal 2007. The timing and level of industry recovery is uncertain at this time as we begin our fiscal 2008. Any failure to expand in cycle upturns to meet customer demand and delivery requirements or contract in cycle downturns at a pace consistent with cycles in the industry could have an adverse effect on our business.
Any significant downturn in the markets for our customers’ semiconductor devices or in general economic conditions would likely result in a reduction in demand for our products and would hurt our business. From the fourth quarter of fiscal 2006 through the end of fiscal 2007 and into our first fiscal quarter of 2008, our revenue and operating results were negatively impacted by a downturn in the semiconductor industry. Downturns in the semiconductor test equipment industry have been characterized by diminished product demand, excess production capacity, accelerated erosion of selling prices and excessive inventory levels. We believe the markets for newer generations of devices, including system in package (“SIP”), will also experience similar characteristics. Our market is also characterized by rapid technological change and changes in customer demand. In the past, we have experienced delays in commitments, delays in collecting accounts receivable and significant declines in demand for our products during these downturns, and we cannot be certain that we will be able to maintain or exceed our current level of sales.
Additionally, as a capital equipment provider, our revenue is driven by the capital expenditure budgets and spending patterns of our customers who often delay or accelerate purchases in reaction to variations in their businesses. Because a high portion of our costs are fixed, we are limited in our ability to reduce expenses and inventory purchases quickly in response to decreases in orders and revenues. In a contraction, we may not be able to reduce our significant fixed costs, such as continued investment in research and development and capital equipment requirements and materials purchases from our suppliers.
21
The market for semiconductor test equipment is highly concentrated, and we have limited opportunities to sell our products.
The semiconductor industry is highly concentrated, and a small number of semiconductor device manufacturers and contract assemblers account for a substantial portion of the purchases of semiconductor test equipment generally, including our test equipment. Sales to Texas Instruments accounted for 38% of our net sales in fiscal 2007 and 56% of our net sales in fiscal 2006. Sales to our ten largest customers accounted for 84.6% in the three months ended October 31, 2007 and 87.0 % in the three months ended October 31, 2006. Our customers may cancel orders with few or no penalties. If a major customer reduces orders for any reason, our revenues, operating results, and financial condition will be affected.
Our ability to increase our sales will depend in part upon our ability to obtain orders from new customers. Semiconductor manufacturers select a particular vendor’s test system for testing the manufacturer’s new generations of devices and make substantial investments to develop related test program software and interfaces. Once a manufacturer has selected one test system vendor for a generation of devices, that manufacturer is more likely to purchase test systems from that vendor for that generation of devices, and, possibly, subsequent generations of devices as well. Therefore, the opportunities to obtain orders from new customers may be limited.
Our sales and operating results have fluctuated significantly from period to period, including from one quarter to another, and they may continue to do so.
Our quarterly and annual operating results are affected by a wide variety of factors that could adversely affect sales or profitability or lead to significant variability in our operating results or our stock price. This may be caused by a combination of factors, including the following:
| | • | | sales of a limited number of test systems account for a substantial portion of our net sales in any particular fiscal quarter, and a small number of transactions could therefore have a significant impact; |
| | • | | order cancellations by customers; |
| | • | | lower gross margins in any particular period due to changes in: |
| | • | | the configurations of test systems sold, |
| | • | | the customers to whom we sell these systems, or |
| | • | | a long sales cycle, due to the high selling price of our test systems, the significant investment made by our customers, and the time required to incorporate our systems into our customers’ design or manufacturing process; and |
| | • | | changes in the timing of product orders due to: |
| | • | | unexpected delays in the introduction of products by our customers, |
| | • | | shorter than expected lifecycles of our customers’ semiconductor devices, |
| | • | | uncertain market acceptance of products developed by our customers, or |
| | • | | our own research and development. |
We cannot predict the impact of these and other factors on our sales and operating results in any future period. Results of operations in any period, therefore, should not be considered indicative of the results to be expected for any future period. Because of this difficulty in predicting future performance, our operating results may fall below expectations of securities analysts or investors in some future quarter or quarters. Our failure to meet these expectations would likely adversely affect the market price of our common stock.
A substantial amount of the shipments of our test systems for a particular quarter occur late in the quarter. Our shipment pattern exposes us to significant risks in the event of problems during the complex process of final integration, test and acceptance prior to shipment. If we were to experience problems of this type late in our quarter, shipments could be delayed and our operating results could fall below expectations.
22
We depend on Jabil Circuit to produce and test our family of Fusion products, and any failures or other problems at or with Jabil could cause us to lose customers and revenues.
We have selected Jabil Circuit, Inc. to manufacture our Fusion test systems. If for any reason Jabil cannot provide us with these products and services in a timely fashion, or at all, whether due to labor shortage, slow down or stoppage, deteriorating financial or business conditions or any other reason, we would not be able to sell or ship our Fusion family of products to our customers. All of the products Jabil tests and assembles for us are assembled in one facility in Massachusetts. If this facility were to become unable to meet our production requirements, transitioning assembly to an alternative Jabil facility could result it production delays of several weeks or more. We have recently announced plans to transition manufacturing of all X-Series products from the facility in Massachusetts to Jabil’s Penang, Malyasia facility. If the transition to Jabil’s Malyasia facility is not successfully completed, or if Jabil Malaysia is unable to meet our production requirements, there would be production delays and we would not be able to ship products to our customers. We have no written supply agreement with Jabil. We also may be unable to engage alternative production and testing services on a timely basis or upon terms favorable to us, if at all.
We also may be unable to engage alternative production and testing services on a timely basis or upon terms favorable to us, if at all. If we are required for any reason to seek a new manufacturer of our test systems, an alternate manufacturer may not be available and, in any event, transitioning to a new manufacturer would require a significant lead time of six months or more and would involve substantial expense and disruption of our business. Our test systems are highly sophisticated and complex capital equipment, with many custom components, and require specific technical know-how and expertise. These factors could make it more difficult for us to find a new manufacturer of our test systems if our relationship with Jabil is terminated for any reason, which would cause us to lose revenues and customers.
Our dependence on subcontractors and sole source suppliers may prevent us from delivering an acceptable product on a timely basis.
We rely on subcontractors to manufacture Fusion and many of the components and subassemblies for our products, and we rely on sole source suppliers for certain components. We may be required to qualify new or additional subcontractors and suppliers due to capacity constraints, competitive or quality concerns or other risks that may arise, including a result of a change in control of, or deterioration in the financial condition of, a supplier or subcontractor. The process of qualifying subcontractors and suppliers is a lengthy process. Our reliance on subcontractors gives us less control over the manufacturing process and exposes us to significant risks, especially inadequate capacity, late delivery, substandard quality, and high costs. In addition, the manufacture of certain of these components and subassemblies is an extremely complex process. If a supplier became unable to provide parts in the volumes needed or at an acceptable price, we would have to identify and qualify acceptable replacements from alternative sources of supply, or manufacture such components internally. The failure to qualify acceptable replacements quickly would delay the manufacturing & delivery of our products, which could cause us to lose revenues and customers.
We are dependent on a semiconductor device manufacturer, Maxtek Components as a sole source supplier of components manufactured in accordance with our proprietary design and specifications. We have no written supply agreement with this sole source supplier and purchase our custom components through individual purchase orders.
Compliance with current and future environmental regulations may be costly and disruptive to our operations.
We may be subject to environmental and other regulations due to our production and marketing of products in certain states and countries. We are in the process of planning for and evaluating the impact of a directive to reduce the amount of hazardous materials in certain electronic components such as printed circuit boards. The directive is known as Directive 2002/95/EC of the European Parliament and of the Council of 27 January 2003 on the restriction of the use of certain hazardous substances in electrical and electronic equipment. “RoHS” is short for restriction of hazardous substances. The RoHS Directive banned the placing on the EU market of new electrical and electronic equipment containing more than agreed levels of lead, cadmium, mercury, hexavalent chromium, polybrominated biphenyl (PBB) and polybrominated diphenyl ether (PBDE), except where exemptions apply, from 1 July 2006. Manufacturers are required to ensure that their products, including their constituent materials and components, do not contain more than the minimum levels of the six restricted materials in order to be allowed to export goods into the Single Market (i.e. of the European Community’s 25 Member States). We are uncertain as to the impact of compliance on future costs and supply of materials used to manufacture our equipment. Any interruption in supply due to the unavailability of lead free products could have a significant impact on the manufacturing and delivery of our products. If a supplier became unable to provide parts in the volumes needed or at an acceptable price, we would have to identify and qualify acceptable replacements from alternative sources of supply or manufacture such components internally. The failure to qualify acceptable replacements quickly would delay the manufacturing and delivery of our products, which could cause us to lose revenues and customers.
23
Future acquisitions may be difficult to integrate, disrupt our business, dilute stockholder value or divert management attention.
We have in the past, and may in the future, seek to acquire or invest in additional complementary businesses, products, technologies or engineers. For example, in June 2003, we completed our acquisition of StepTech, Inc. We may have to issue debt or equity securities to pay for future acquisitions, which could be dilutive to then current stockholders. We have also incurred and may continue to incur certain liabilities or other expenses in connection with acquisitions, which could continue to materially adversely affect our business, financial condition and results of operations.
Mergers and acquisitions of high-technology companies are inherently risky, and no assurance can be given that future acquisitions will be successful and will not materially adversely affect our business, operating results or financial condition. Our past and future acquisitions may involve many risks, including:
| | • | | difficulties in managing our growth following acquisitions; |
| | • | | difficulties in the integration of the acquired personnel, operations, technologies, products and systems of the acquired companies; |
| | • | | uncertainties concerning the intellectual property rights we purport to acquire; |
| | • | | unanticipated costs or liabilities associated with the acquisitions; |
| | • | | diversion of managements’ attention from other business concerns; |
| | • | | adverse effects on our existing business relationships with our or our acquired companies’ customers; |
| | • | | potential difficulties in completing projects associated with purchased in process research and development; and |
| | • | | inability to retain employees of acquired companies. |
Any of the events described in the foregoing paragraphs could have an adverse effect on our business, financial condition and results of operations and could cause the price of our common stock to decline.
We may not be able to deliver custom hardware options and system applications to satisfy specific customer needs in a timely manner.
We must develop and deliver customized hardware and system applications to meet our customers’ specific test requirements. Our test equipment may fail to meet our customers’ technical or cost requirements and may be replaced by competitive equipment or an alternative technology solution. Our inability to provide a test system that meets requested performance criteria when required by a device manufacturer would severely damage our reputation with that customer. This loss of reputation may make it substantially more difficult for us to sell test systems to that manufacturer for a number of years. We have, in the past, experienced delays in introducing some of our products and enhancements.
Our dependence on international sales and non-U.S. suppliers involves significant risk.
International sales have constituted a significant portion of our revenues in recent years, and we expect that this composition will continue. International sales accounted for 45% of our revenues for the three months ended October 31, 2007 and 62% of our revenues for the three months ended October 31, 2006. In addition, we rely on non-U.S. suppliers for several components of the equipment we sell. As a result, a major part of our revenues and the ability to manufacture our products are subject to the risks associated with international commerce. A reduction in revenues or a disruption or increase in the cost of our manufacturing materials could hurt our operating results. These international relationships make us particularly sensitive to changes in the countries from which we derive sales and obtain supplies. Our recently announced plans to transition our outsource manufacturing to Penang, Malaysia increases our exposure to these types of international risks. International sales and our relationships with suppliers may be hurt by many factors, including:
| | • | | changes in law or policy resulting in burdensome government controls, tariffs, restrictions, embargoes or export license requirements; |
| | • | | political and economic instability in our target international markets; |
| | • | | longer payment cycles common in foreign markets; |
| | • | | difficulties of staffing and managing our international operations; |
| | • | | less favorable foreign intellectual property laws making it harder to protect our technology from appropriation by competitors; and |
| | • | | difficulties collecting our accounts receivable because of the distance and different legal rules. |
24
In the past, we have incurred expenses to meet new regulatory requirements in Europe, experienced periodic difficulties in obtaining timely payment from non-U.S. customers, and been affected by economic conditions in several Asian countries. Our foreign sales are typically invoiced and collected in U.S. dollars. A strengthening in the dollar relative to the currencies of those countries where we do business would increase the prices of our products as stated in those currencies and could hurt our sales in those countries. Significant fluctuations in the exchange rates between the U.S. dollar and foreign currencies could cause us to lower our prices and thus reduce our profitability. These fluctuations could also cause prospective customers to push out or delay orders because of the increased relative cost of our products. In the past, there have been significant fluctuations in the exchange rates between the dollar and the currencies of countries in which we do business. While we have not entered into significant foreign currency hedging arrangements, we may do so in the future. If we do enter into foreign currency hedging arrangements, they may not be effective.
Our market is highly competitive, and we have limited resources to compete.
The test equipment industry is highly competitive in all areas of the world. Many other domestic and foreign companies participate in the markets for each of our products, and the industry is highly competitive. Our competitors in the market for semiconductor test equipment include Advantest, Credence Systems, Eagle Test Systems, Teradyne and Verigy. Certain of these major competitors have substantially greater financial resources and more extensive engineering, manufacturing, marketing, and customer support capabilities.
We expect our competitors to enhance their current products and to introduce new products with comparable or better price and performance. The introduction of competing products could hurt sales of our current and future products. In addition, new competitors, including semiconductor manufacturers themselves, may offer new testing technologies, which may in turn reduce the value of our product lines. Increased competition could lead to intensified price-based competition, which would hurt our business and results of operations. Unless we are able to invest significant financial resources in developing products and maintaining customer support centers worldwide, we may not be able to compete effectively.
Development of our products requires significant lead-time, and we may fail to correctly anticipate the technical needs of our customers.
Our customers make decisions regarding purchases of our test equipment while their devices are still in development. Our test systems are used by our customers to develop, test and manufacture their new devices. We therefore must anticipate industry trends and develop products in advance of the commercialization of our customers’ devices, requiring us to make significant capital investments to develop new test equipment for our customers well before their devices are introduced. If our customers fail to introduce their devices in a timely manner or the market does not accept their devices, we may not recover our capital investment through sales in significant volume. In addition, even if we are able to successfully develop enhancements or new generations of our products, these enhancements or new generations of products may not generate revenue in excess of the costs of development, and they may be quickly rendered obsolete by changing customer preferences or the introduction of products embodying new technologies or features by our competitors. Furthermore, if we were to make announcements of product delays, or if our competitors were to make announcements of new test systems, these announcements could cause our customers to defer or forego purchases of our existing test systems, which would also hurt our business.
Our success depends on attracting and retaining key personnel.
Our success will depend substantially upon the continued service of our executive officers and key personnel, none of whom are bound by an employment or non-competition agreement. Our success will depend on our ability to attract and retain highly qualified managers and technical, engineering, marketing, sales and support personnel. Competition for such specialized personnel is intense, and it may become more difficult for us to hire or retain them. Our volatile business cycles only aggravate this problem. Layoffs in any industry downturn could make it more difficult for us to hire or retain qualified personnel. Our business, financial condition and results of operations could be materially adversely affected by the loss of any of our key employees, by the failure of any key employee to perform in his or her current positions, or by our inability to attract and retain skilled employees.
We may not be able to protect our intellectual property rights.
Our success depends in part on our ability to obtain intellectual property rights and licenses and to preserve other intellectual property rights covering our products and development and testing tools. To that end, we have obtained certain domestic patents and may continue to seek patents on our inventions when appropriate. We have also obtained certain trademark registrations. To date, we have not sought patent protection in any countries other than the United States, which may impair our ability to protect our intellectual property in foreign jurisdictions. The process of seeking intellectual property protection can be time consuming and expensive. We cannot ensure that:
| | • | | patents will issue from currently pending or future applications; |
25
| | • | | our existing patents or any new patents will be sufficient in scope or strength to provide meaningful protection or any commercial advantage to us; |
| | • | | foreign intellectual property laws will protect our intellectual property rights; or |
| | • | | others will not independently develop similar products, duplicate our products or design around our technology. |
If we do not successfully enforce our intellectual property rights, our competitive position could suffer, which could harm our operating results. We also rely on trade secrets, proprietary know-how and confidentiality provisions in agreements with employees and consultants to protect our intellectual property. Other parties may not comply with the terms of their agreements with us, and we may not be able to adequately enforce our rights against these people.
Third parties may claim we are infringing their intellectual property, and we could suffer significant litigation costs, licensing expenses or be prevented from selling our products.
Intellectual property rights are uncertain and involve complex legal and factual questions. We may be unknowingly infringing on the intellectual property rights of others and may be liable for that infringement, which could result in significant liability for us. If we do infringe the intellectual property rights of others, we could be forced to either seek a license to intellectual property rights of others or alter our products so that they no longer infringe the intellectual property rights of others. A license could be very expensive to obtain or may not be available at all. Similarly, changing our products or processes to avoid infringing the rights of others may be costly or impractical.
We are responsible for any patent litigation costs. If we were to become involved in a dispute regarding intellectual property, whether ours or that of another company, we may have to participate in legal proceedings. These types of proceedings may be costly and time consuming for us, even if we eventually prevail. If we do not prevail, we might be forced to pay significant damages, obtain licenses, modify our products or processes, stop making products or stop using processes.
Our stock price is volatile.
In the twelve-month period ending on October 31, 2007, our stock price ranged from a low of $3.26 to a high of $6.72. The price of our common stock has been and likely will continue to be subject to wide fluctuations in response to a number of events and factors, such as:
| | • | | quarterly variations in operating results; |
| | • | | variances of our quarterly results of operations from securities analyst estimates; |
| | • | | changes in financial estimates and recommendations by securities analysts; |
| | • | | announcements of technological innovations, new products, or strategic alliances; and |
| | • | | news reports relating to trends in our markets. |
In addition, the stock market in general, and the market prices for semiconductor-related companies in particular, have experienced significant price and volume fluctuations that often have been unrelated to the operating performance of the companies affected by these fluctuations. These broad market fluctuations may adversely affect the market price of our common stock, regardless of our operating performance.
We have substantial indebtedness.
We had $27.2 million principal amount of 4.25% Convertible Subordinated Notes (the “Notes”) due August 15, 2007 (which was paid in full on August 15, 2007), as well as $20.0 million in principal outstanding under a commercial loan. We may incur substantial additional indebtedness in the future. The level of indebtedness, among other things, could
| | • | | make it difficult for us to make payments on our debt and other obligations; |
| | • | | make it difficult for us to obtain any necessary future financing for working capital, capital expenditures, debt service requirements or other purposes; |
| | • | | require the dedication of a substantial portion of any cash flow from operations to service for indebtedness, thereby reducing the amount of cash flow available for other purposes, including capital expenditures; |
| | • | | limit our flexibility in planning for, or reacting to changes in, our business and the industries in which we compete; |
| | • | | place us at a possible competitive disadvantage with respect to less leveraged competitors and competitors that have better access to capital resources; and |
| | • | | make us more vulnerable in the event of a further downturn in our business. |
26
There can be no assurance that we will be able to meet our debt service obligations.
We may not be able to pay our debt and other obligations.
If our cash flow is inadequate to meet our obligations, we could face substantial liquidity problems. The $27.2 million principal amount of 4.25% Convertible Subordinated Notes due August 2007 was paid on August 15, 2007, reducing our cash and cash equivalents. In addition, we have monthly principal and interest payments through May 2010 related to our $20.0 million term loan. If we are unable to generate sufficient cash flow or otherwise obtain funds necessary to make required payment on the term loan, or certain of our other obligations, we would be in default under the terms thereof, which could permit the holders of those obligations to accelerate their maturity and also could cause default under future indebtedness we may incur. Any such default could have material adverse effect on our business, prospects, financial position and operating results. In addition, we may not be able to repay amounts due in respect of our obligations, if payment of those obligations were to be accelerated following the occurrence of any other event of default as defined in the instruments creating those obligations.
We may need additional financing, which could be difficult to obtain.
We expect that our existing cash and marketable securities, and borrowings from available bank financings, will be sufficient to meet our cash requirements to fund operations and expected capital expenditures for the foreseeable future. In the event we need to raise additional funds, we cannot be certain that we will be able to obtain such additional financing on favorable terms, if at all. Further, if we issue additional equity securities, stockholders may experience additional dilution or the new equity securities may have rights, preferences or privileges senior to those of existing holders of common stock. Future financings may place restrictions on how we operate our business. If we cannot raise funds on acceptable terms, if and when needed, we may not be able to develop or enhance our products and services, take advantage of future opportunities, grow our business or respond to competitive pressures, which could seriously harm our business.
| Item 3. | Quantitative and Qualitative Disclosures About Market Risk |
There has been no material change in the Company’s Market Risk exposure since the filing of the 2007 Annual Report on Form 10-K.
| Item 4. | Controls and Procedures |
Evaluation of Disclosure Controls and Procedures. Based on the evaluation by management, with the participation of the Chief Executive Officer and Chief Financial Officer, of our disclosure controls and procedures (as defined in Exchange Act Rules 13a-15(e) and 15d-15(e)) as of the end of the period covered by this quarterly report on Form 10-Q, the Company’s Chief Executive Officer and Chief Financial Officer have concluded that the Company’s disclosure controls and procedures (1) were designed to ensure that material information relating to the Company, including its consolidated subsidiaries, was made known to them by others within those entities, particularly during the period in which this report was being prepared and (2) effective, in that they provide reasonable assurance that information required to be disclosed by the Company in the reports that it files or submits under the Exchange Act, including information regarding its consolidated subsidiaries, is recorded, processed, summarized and reported within the time periods specified by the SEC.
Changes in Internal Controls. No change in the Company’s internal control over financial reporting (as defined in Rules 13a-15(f) and 15d-15(f) under the Exchange Act) occurred during the fiscal quarter ended October 31, 2007 that has materially affected or is reasonably likely to materially affect, the Company’s internal control over financial reporting.
Limitations on the Effectiveness of Controls
The Company’s management, including the Chief Executive Officer and Chief Financial Officer, does not expect that the Company’s disclosure controls and procedures or the Company’s internal controls can prevent all error and all fraud. A control system, no matter how well conceived and operated, can provide only reasonable, not absolute, assurance that the objectives of the control system are met. Further, the design of a control system must reflect the fact that there are resource constraints, and the benefits of controls must be considered relative to their costs. The inherent limitations in all control systems include the realities that judgments in decision-making can be faulty and that breakdowns can occur because of simple error or mistake. Additionally, controls can be circumvented by the individual acts of some persons or by collusion of two or more people. Because of the inherent limitations in a cost-effective control system, misstatements due to error or fraud may occur and not be detected.
27
PART II—OTHER INFORMATION
(a) On December 5, 2007, the Board of Directors of the Company approved amendments to Sections 5.1 and 5.2 of Article V of the Company’s bylaws. The amendments to Article V provide for the issuance and transfer of either certificated or uncertificated shares, allowing the Company to comply with rules promulgated by The NASDAQ Stock Market LLC requiring NASDAQ-listed issuers to be eligible for a direct registration program, such as the one administered by The Depository Trust Company, by January 1, 2008. The amendment to the bylaws is filed as Exhibit 3.2 hereto and is incorporated herein by reference.
(b) On December 5, 2007 the Board of Directors approved an amendment to the vesting schedule of performance-based restricted stock units awards (“ RSUs”) granted to the executive officers on September 13, 2006 and disclosed in a Form 8-K filed on September 14, 2006. These RSUs will only vest if the Company achieves positive operating income for two consecutive fiscal quarters above 3% of net sales for both quarters and if operating income averages at least 5% of net sales for the two quarters (the “Profitability Metric”). The amendment to the RSUs approved on December 5, 2007 provides that the award vests as to 40% of the RSUs upon announcement that the Profitability Metric has been achieved. The award vests as to an additional 20% for each subsequent two quarter period in which the Profitability Metric is achieved. Thus far, no portion of these RSUs has vested.
| Item 6. | Exhibits and Reports on Form 8-K |
| | (i) | Exhibit 3.2 By-laws, as amended. |
| | (ii) | Exhibit 31.1 and 31.2 Rule 13a-14(a)/15d-14(a) Certifications |
| | (iii) | Exhibit 32 Section 1350 Certifications |
| | (i) | On August 30, 2007, the Company furnished a current report on Form 8-K under Item 2.02 (Results of Operations and Financial Condition) describing and furnishing the press release announcing its earnings for the fiscal quarter and year ended July 31, 2007, which press release included its consolidated financial statements for the period. |
| | (ii) | On September 19, 2007, the Company furnished a current report on Form 8-K under Item 5.02 (Departure of Directors or Certain Officers; Election of Directors; Appointment of Certain Officers; Compensatory Arrangements of Certain Officers) to disclose the award of restricted stock units to executive officers. |
28
SIGNATURE
Pursuant to the requirements of the Securities Exchange Act of 1934, the registrant has duly caused this report to be signed on its behalf by the undersigned thereunto duly authorized.
| | | | |
| | LTX Corporation |
| | |
| Date: December 10, 2007 | | By: | | /s/ MARK J. GALLENBERGER |
| | | | Mark J. Gallenberger |
| | | | Chief Financial Officer and Treasurer |
| | | | (Principal Financial Officer) |
29