Exhibit XV
Table of Contents
| 3 | Highlights |
| | | |
| 3 | Key figures and ratios |
| | | |
| 4 | President and CEO's comments |
| | | |
| 5 | Operating and financial review |
| | | |
| 5 | | Total comprehensive income |
| | | |
| 8 | | Financial position |
| | | |
| 11 | Financial statements |
| | | |
| 11 | | Statement of comprehensive income |
| | | |
| 12 | | Statement of financial position |
| | | |
| 14 | | Statement of changes in equity |
| | | |
| 15 | | Cash flow statement |
| 17 | Notes to the interim financial statements |
| | | |
| 17 | | Note 1 - Net interest income |
| | | |
| 17 | | Note 2 - Net profit on financial operations |
| | | |
| 18 | | Note 3 - Expected credit loss |
| | | |
| 18 | | Note 4 - Net loan losses |
| | | |
| 19 | | Note 5 - Loans outstanding |
| | | |
| 19 | | Note 6 - Debts evidenced by certificates |
| | | |
| 19 | | Note 7 - Basis of preparation |
| | | |
| 19 | Ratio definitions |
2 | Interim Management Statement
Highlights
During the first months of 2020, prior to COVID 19 outbreak, NIB’s financial and operating performance has been according to plan. This means a lower net interest income compared to last year, mainly due to the continued low yield environment.
With the recent and rapid development of the COVID 19 outbreak, the financial markets have experienced significant market movements. These market movements have resulted in unrealised losses on financial instruments NIB holds to hedge its interest rate risks and in its liquidity portfolio of EUR 130 million. As the Bank intends to hold the related financial instruments to maturity, the valuation losses will reverse as the instruments will settle at par.
During the three month period ending 31 March 2020, a total of EUR 1,717 million in new loans were agreed and EUR 946 million were disbursed compared to EUR 605 million and EUR 547 million respectively in 2019. The increase in lending activity compared to the corresponding period in 2019 is due to NIB's response to the COVID 19 crisis.
After the outbreak of Covid 19, the Bank has adjusted the macro-economic scenarios used to calculate the expected credit loss (“ECL”) provision and as a result the ECL provision has increased by EUR 24 million compared to 31 December 2019.
Key figures and ratios| In millions of euro unless otherwise specified | Jan-Mar 2020* | Jan-Mar 2019* | Jan-Dec 2019 |
| Net interest income | 49 | 54 | 212 |
| Loss/profit before net loan losses | -91 | 51 | 183 |
| Net loss/profit | -113 | 54 | 182 |
| | | | |
| Loans disbursed | 946 | 547 | 2,676 |
| Loans agreed | 1,717 | 605 | 3,316 |
| Mandate fulfilment ** | 100 % | 100 % | 98 % |
| | | | |
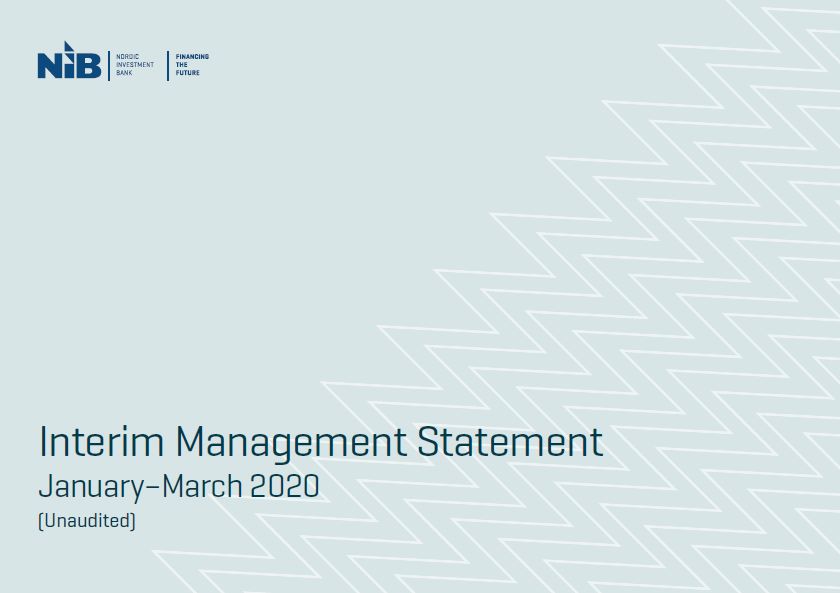
| Lending outstanding | 18,643 | 18,750 | 18,931 |
| Total assets | 34,252 | 31,235 | 32,653 |
| New debt issues | 1,666 | 1,416 | 4,909 |
| Debts evidenced by certificates | 27,079 | 25,240 | 26,674 |
| Total equity | 3,607 | 3,635 | 3,735 |
| | | | |
| Equity/total assets *** | 10.5 % | 11.6 % | 11.4 % |
| Profit/average equity *** | n.a | 6.0 % | 5.0 % |
| Cost/income *** | n.a | 17.4 % | 21.9 % |
| Number of employees at period end | 229 | 225 | 229 |
* Unaudited figures, to be read in conjunction with NIB's 2019 audited financial statements
** See page 9 for mandate fulfilment explanation
*** See page 19 for ratio definitions
3 | Interim Management Statement
President & CEO's comments January–March 2020
When we published our results for 2019, we expected that 2020 would be business as usual: that the Bank would continue to promote sustainable growth, driven by the increasing demand for public and private investments in sustainable development. We were expecting to disburse slightly over EUR 3 billion this year.
However, due to the outbreak of the corona pandemic, we have revised our plans significantly. It is obvious that, in addition to serious health consequences around the world, the COVID-19 pandemic will cause a sharp decline in economic activity and threaten growth and employment. This also affects the Nordic and Baltic countries.
So, what steps has NIB taken thus far?
We have activated our contingency plan in order to protect our staff and to ensure business continuity. This guarantees that NIB will be able to continue to make payments and settlements also in crisis situations. As part of these measures, the Bank has been split up and is working from different locations. Most of our staff are working from home.
In late March, the Nordic-Baltic Ministers, who are Governors of NIB, invited the Bank to take swift action to help alleviate the effects from the coronavirus crisis. As an immediate response, we will substantially increase our lending. Our loans will be made available to member countries and sustainable businesses that are facing short-term liquidity problems due to the crisis. We stand ready to extend loans to financial intermediaries for on-lending to small and medium-sized companies as well as to provide direct financing to larger businesses. As part of these measures, we have extended loans to the Baltic states.
In order to fund this increased activity, NIB issued its first, EUR 1 billion NIB Response Bond. The proceeds of the bond will be used to finance projects that alleviate the social and economic consequences of the COVID-19 pandemic in our member countries.
NIB's mission is twofold: to finance projects that improve productivity and benefit the environment in its member countries. We will continue to do that. It is of utmost importance that long-term challenges, such as climate change, will not be forgotten in this crisis.
As was pointed out by the Ministers of our owner countries, we also have a supportive role in economic crises. We are a well-functioning funding tool, and our financial position is strong. We will implement the lending increase in the context of the Bank’s risk management framework, sound banking practices and our triple-A rating (AAA/Aaa).
The coronavirus outbreak has affected financial markets, which have been experiencing significant volatility. These movements have resulted in unrealised losses on financial instruments NIB is holding to hedge its interest rate risks and in its liquidity portfolio of EUR 130 million. The Bank intends to hold the related financial instruments to maturity, and as they will settle, there will be no long-term adverse impact. Due to the negative market sentiment, the Bank has also increased its expected loss provision by EUR 24 million, and as a result of the above, NIB recorded net losses of EUR 113 million. During the period, EUR 1,717 million of loans were agreed and EUR 946 million were disbursed.
At this juncture, it is not possible to predict the full business and economic impact of the pandemic on NIB and its customers. However, the Bank is well capitalised and positioned to support its member countries during these difficult times.
Henrik Normann, President & CEO
4 | Interim Management Statement
Operating and financial review
Total comprehensive income
January–March 2020 compared to January–March 2019
NET PROFIT
The net loss for the period January–March 2020 amounted to EUR 112.7 million, down from a net profit of EUR 53.6 million in the same period last year. Total operating income decreased from EUR 61.7 million to a loss of EUR 78.2 million due to unrealised valuation losses described below. Total operating expenses increased by EUR 1.7 million to EUR 12.4 million. The Bank has increased the expected credit loss provision resulting in net loan losses of EUR 22.1 million.
NET INTEREST INCOME
Net interest income for the period amounted to EUR 49 .0 million (January–March 2019:
EUR 53.6 million). Net interest income on lending activities was similar to the corresponding period in 2019, however the interest income on treasury activities decreased by EUR 4.4 million due to the low yield environment.
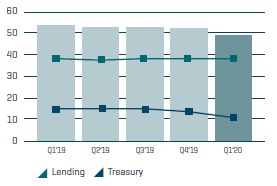
NET FEE AND COMMISSION INCOME
Net fee and commission income for the period January–March 2020 was EUR 1.5 million, compared to EUR 1.3 million in 2019, due to the higher volume of loans agreed and disbursed in the three month period under review.
NET PROFIT/LOSS FOR THE PERIOD EUR m
| | NET INTEREST INCOME EUR m
| | NET FEE AND COMMISSION INCOME EUR m
|
5 | Interim Management Statement
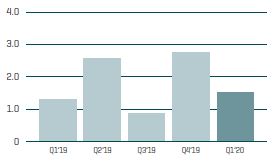
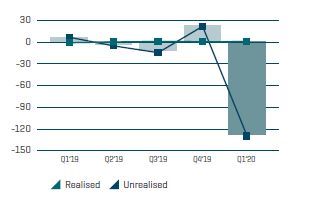
NET LOSS/PROFIT ON FINANCIAL OPERATIONS
With the recent and rapid development of the COVID 19 outbreak, the financial markets have experienced significant market movements. These market movements have resulted in unrealised losses on financial instruments NIB holds to hedge its interest rate risks and in its liquidity portfolio. The net loss on financial operations for the period January–March 2020 amounted to EUR 128.2 million compared to a net profit of EUR 6.7 million in the same period last year. The result includes realised profits of EUR 1.4 million and unrealised losses of EUR 129.6 million compared to realised losses of EUR 0.7 million and unrealised profit of EUR 7.4 million in 2019.
The unrealised valuation loss on interest rate hedges arises mainly from the widening of the interest rate spreads that are embedded in the Bank’s funding and lending transactions. When the Bank raises funds with fixed rates or offers borrowers fixed rate loans, it hedges the resulting interest rate risk using swaps, in which the fixed rate is swapped to the short-term money market floating rates referred to as the IBORS (e.g. LIBOR, EURIBOR, STIBOR, NIBOR etc.). In keeping with what NIB believes is industry best practice, the valuation of these swaps is based on a risk free discounting rate called OIS (Overnight Interest rate Swap). The widening spread between the risk free rates (the OIS rates) and the relevant IBORs applicable to each such swap creates the unrealised valuation loss. It should be noted that as the Bank intends to hold these transactions to maturity, such that they are not sold for a price based on their market value but instead perform until the contracts end, these losses would not be realised as the transactions will settle at par.
The unrealised valuation loss on assets in the Bank’s liquidity portfolio arises from widening credit spreads. The Bank maintains a large liquidity portfolio, which it invests in high quality bonds. When credit
spreads widen, this results in negative valuations on the bonds. In periods with financial turbulence such as that currently, being experienced all credit spreads tend to rise, which also affects NIB’s high quality bonds. As the Bank intends to hold the bonds to maturity, such that they are not sold based on the current market value, the valuation losses will reverse, as the bonds will settle at par.
TOTAL OPERATING EXPENSES
Total operating expenses were EUR 1.7 million higher than for the corresponding period in 2019 due increases in depreciation and personnel costs. The increase in depreciation is related to the commencement of depreciation of the Bank's new treasury IT system and also on recently renovated premises during the second half of 2019. The increase in personnal costs is mainly due to higher headcount and the annual inflation related pay adjustments.
NET LOAN LOSSES
After the outbreak of COVID 19, the global operating environment rapidly deteriorate and as a result, the Bank has adjusted the macro-economic scenarios used to calculate the expected credit loss (“ECL”) provision. The change in outlook is the main driver behind the increase in the ECL provision from EUR 122.3 million at 31 December 2019 to EUR 146.7 million at 31 March 2020. It is likely that there will be some deterioration in the credit quality of the loan portfolio however, no significant changes have been observed to date. This provision covers both loans outstanding and treasury assets held at amortised cost.
NET PROFIT/LOSS ON FINANCIAL OPERATIONS EUR m
| | TOTAL OPERATING EXPENSES EUR m
| | NET LOAN LOSSES EUR m
|
6 | Interim Management Statement
There were no new non-performing loans during the period and no realised losses. The loss recognised in the income statement for net loan losses of EUR 22.1 million relates to recoveries on non- performing loans of EUR 0.1 million and EUR 22.2 million related to the change in ECL on performing loans.
OTHER COMPREHENSIVE INCOME
The Bank separates the foreign currency basis spread from financial instruments used in fair value hedge accounting, and this separated amount is recorded in “Other comprehensive income” (OCI) which amounted to a loss of EUR 15.4 million for the period (January–March 2019: Profit EUR 3.4 million). The loss recorded is due to the widening of the Cross Currency Basis spreads, which negatively affect the valuation of basis swaps used to convert funding currencies into lending currencies.
The resulting total comprehensive loss for the period amounted to EUR 128.1 million, compared to a profit of EUR 57.0 million in 2019.
7 | Interim Management Statement
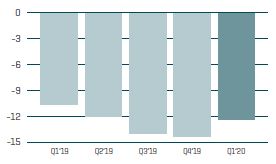
LENDING OUTSTANDING
Total lending outstanding amounted to EUR 18,643 million, comprising loans outstanding of EUR 18,527 million and Lending Green Bonds ("LGB") recorded in debt securities of EUR 116 million. Demand for NIB’s long-term financing remains strong and has increased due to the COVID 19 crisis. The total disbursements during the period amounted to EUR 946 million, which is EUR 399 million higher than for the same period in 2019. Total prepayments amounted to EUR 120 million compared to EUR 588 million in the same period of 2019.
Total lending outstanding, excluding exchange rate and valuation effects, increased from EUR 18,931 million at 31 December 2019 to EUR 19,360 million. The book value amounted to EUR 18,643 million due to significant foreign exchange movements and fair valuations/hedge accounting effects of EUR 766 million and EUR 50 million, respectively.
DEVELOPMENT OF LENDING OUTSTANDING DURING 2020
EUR m
* Fair valuation of lending green bonds and hedging accounting.
8 | Interim Management Statement
LENDING HIGHLIGHTS
in EUR millions, unless otherwise specified | Jan-Mar* 2020 | 2019 | 2018 | 2017 | 2016 |
| Loans agreed excluding green bond investments | 1,717 | 3,185 | 4,269 | 3,665 | 4,221 |
| Green bond investments | - | 131 | 61 | 147 | 143 |
| Total disbursements | 946 | 2,676 | 4,047 | 3,147 | 3,373 |
| Total loans disbursed by business area: | | | | | |
| Energy and water | 138 | 454 | 840 | 737 | 1,154 |
| Infrastructure, transport and telecom | 245 | 1,079 | 1,192 | 818 | 791 |
| Industries and services | 476 | 781 | 1,339 | 932 | 836 |
| Financial institutions and SMEs | 87 | 362 | 675 | 660 | 593 |
| Number of loans agreements in period | 16 | 55 | 58 | 55 | 58 |
| Number of green bond investments in period | - | 9 | 3 | 9 | 8 |
| Lending outstanding | 18,643 | 18,931 | 19,065 | 17,232 | 16,640 |
| Member countries | 17,840 | 18,055 | 17,960 | 15,867 | 14,831 |
| Non-member countries | 947 | 996 | 1,222 | 1,504 | 1,948 |
| Loan impairment provision | -143 | -119 | -117 | -139 | -139 |
* Unaudited figures, to be read in conjunction with NIB's 2019 audited financial statements
MISSION FULFILMENT
Projects financed by NIB contribute to the Bank’s mission of improving productivity and the environment in the Nordic–Baltic countries. Before approval is given in each individual case, all eligible projects are evaluated and rated against the criteria developed based on the Bank’s mission. In response to the COVID 19 pandemic, NIB has started to provide “response loans” to alleviate the economic and social consequences of the crisis. These “response loans” are tracked separately and are excluded from the standard mandate-rating framework. In the three-month period that ended on 31 March 2020, mandate rated projects achieving a “good” or “excellent” mandate rating accounted for 100% of the total amount of loans agreed exceeding the target level of 90%.
9 | Interim Management Statement
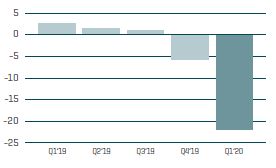
FUNDING
By the end of March, the Bank had raised EUR 1.7 billion (January–March 2019: EUR 1.4 billion) in new funding.
As called upon by its Nordic and Baltic owner countries, NIB loans will be made available to member countries and sustainable businesses that are facing economic consequences due to the COVID 19 pandemic. In order to support the Bank's COVID 19 response the 2020 funding plan will be increased accordingly.
Consequently, on 31 March, the Bank issued a three-year, EUR 1 billion NIB Response bond which was met with strong support from investors with a final orderbook in excess of EUR 3.2 billion, representing the largest-ever orderbook for a EUR benchmark from NIB. NIB Response Bonds will finance eligible projects that aim to alleviate the social and economic impact of the pandemic in its member countries and will support their recovery process.
On 2 April 2020, the Nordic Investment Bank issued a SEK 4 billion NIB Response Bond, due April 2023. The SEK 4 billion issue is NIB’s largest-ever transaction denominated in Swedish krona and the books closed in excess of SEK 5.2 billon
DEBT DEVELOPMENT DURING 2020
EUR m
10 | Interim Management Statement
Financial statements
Statement of comprehensive income
| In thousands of euro | NOTE | Jan-Mar 2020* | Jan-Mar 2019* | Jan-Dec 2019 |
| Interest income from financial assets measured at amortised cost | | 73,929 | 79,627 | 315,241 |
| Interest income from financial assets measured at fair value | | 7,111 | 5,799 | 25,768 |
| Interest expense | | -32,079 | -31,826 | -129,280 |
| Net interest income | (1) | 48,961 | 53,600 | 211,729 |
| | | | | |
| Commission income and fees received | | 2,036 | 2,051 | 9,462 |
| Commission expense and fees paid | | -525 | -706 | -1,859 |
| Net fee and commission income | | 1,511 | 1,345 | 7,603 |
| | | | | |
| Net loss/profit on financial operations | (2) | -128,226 | 6,665 | 14,272 |
| Foreign exchange gains and losses | | -398 | 109 | 111 |
| Total operating income | | -78,152 | 61,719 | 233,715 |
| | | | | |
| Expenses | | | | |
| General administrative expenses | | | | |
| Personnel expenses | | -8,335 | -7,648 | -30,496 |
| Other administrative expenses | | -2,465 | -2,442 | -13,872 |
| Depreciation | | -1,612 | -649 | -6,841 |
| Total operating expenses | | -12,412 | -10,738 | -51,209 |
| | | | | |
| Loss/profit before loan losses |
| -90,564 | 50,981 | 182,506 |
| Net loan losses | (3) (4) | -22,146 | 2,636 | -524 |
| Net loss/profit for the period | | -112,711 | 53,617 | 181,982 |
| | | | | |
| Other comprehensive income | | | | |
| Items that will not be reclassified to income statement | | | | |
| Fair value hedges | | | | |
| Valuation of cross currency basis spread | | -15,357 | 3,432 | 15,786 |
| Total other comprehensive income | | -15,357 | 3,432 | 15,786 |
| | | | | |
| Total comprehensive loss/income | | -128,068 | 57,049 | 197,768 |
* Unaudited figures, to be read in conjunction with NIB's 2019 audited financial statements
The accompanying notes are an integral part of these financial statements.
11 | Interim Management Statement
Statement of financial position
| In thousands of euro | NOTE | 31 Mar 2020* | 31 Mar 2019* | 31 Dec 2019 |
| ASSETS | | | | |
| Cash and cash equivalents | | 3,524,523 | 4,546,409 | 1,428,432 |
| | | | | |
| Placements with credit institutions | | 1,338,043 | 9,021 | 3,588,987 |
| Debt securities | | 7,466,958 | 6,227,611 | 7,079,053 |
| Other | | 7,603 | 15,746 | 7,585 |
| Financial placements, total | | 8,812,604 | 6,252,377 | 10,675,625 |
| Loans outstanding | (5) | 18,527,397 | 18,750,390 | 18,798,979 |
| Intangible assets | | 11,453 | 14,210 | 11,753 |
| Tangible assets, property and equipment | | 37,679 | 31,532 | 35,899 |
| | | | | |
| Derivatives | | 2,105,650 | 1,387,899 | 1,423,391 |
| Other assets | | 1,016,048 | 12,170 | 4,175 |
| Other assets, total | | 3,121,699 | 1,400,070 | 1,427,566 |
| Accrued interest and fees receivable | | 216,257 | 239,680 | 274,826 |
| TOTAL ASSETS | | 34,251,612 | 31,234,668 | 32,653,078 |
* Unaudited figures, to be read in conjunction with NIB's 2019 audited financial statements
The accompanying notes are an integral part of these financial statements.
12 | Interim Management Statement
| In thousands of euro | NOTE | 31 Mar 2020* | 31 Mar 2019* | 31 Dec 2019 |
| LIABILITIES AND EQUITY | | | | |
| Liabilities | | | | |
| Short-term amounts owed to credit institutions | | 1,416,558 | 778,718 | 956,732 |
| Long-term amounts owed to credit institutions | | 8,435 | 9,486 | 8,435 |
| Owed to credit institutions, total | | 1,424,993 | 788,204 | 965,166 |
| Repurchase agreements | | 10,265 | - | - |
| Debts evidenced by certificates | (6) | 27,079,458 | 25,240,264 | 26,673,647 |
| | | | | |
| Derivatives | | 1,083,337 | 1,317,284 | 1,042,227 |
| Other liabilities | | 878,433 | 66,789 | 14,911 |
| Other liabilities, total | | 1,961,769 | 1,384,073 | 1,057,138 |
| Accrued interest and fees payable | | 167,873 | 187,523 | 221,805 |
| Total liabilities | | 30,644,358 | 27,600,065 | 28,917,756 |
| | | | | |
| Equity | | 3,607,255 | 3,634,603 | 3,735,323 |
| | | | | |
| TOTAL LIABILITIES AND EQUITY | | 34,251,612 | 31,234,668 | 32,653,078 |
* Unaudited figures, to be read in conjunction with NIB's 2019 audited financial statements
The accompanying notes are an integral part of these financial statements.
13 | Interim Management Statement
Statement of changes in equity
In thousands of euro | PAID-IN CAPITAL | STATUTORY RESERVE | GENERAL CREDIT RISK FUND | SPECIAL CREDIT RISK FUND PIL | PROFIT AVAILABLE FOR APPROPRIATION | HEDGING RESERVE | TOTAL |
| EQUITY AT 31 DECEMBER 2018 | 418,602 | 686,325 | 1,869,553 | 426,941 | 173,009 | 3,124 | 3,577,554 |
| Profit for the period | - | - | - | - | 53,617 | - | 53,617 |
| Other comprehensive income | - | - | - | - | - | 3,432 | 3,432 |
| Total comprehensive income | 0 | 0 | 0 | 0 | 53,617 | 3,432 | 57,049 |
| EQUITY AT 31 MARCH 2019 | 418,602 | 686,325 | 1,869,553 | 426,941 | 226,626 | 6,556 | 3,634,603 |
| Profit for the period | - | - | - | - | 128,365 | - | 128,365 |
| Other comprehensive income | - | - | - | - | - | 12,354 | 12,354 |
| Total comprehensive income | 0 | 0 | 0 | 0 | 128,365 | 12,354 | 140,719 |
Transactions with owners in their capacity as owners
| | | | | | | |
| Appropriation of profit | - | - | 133,009 | - | -133,009 | - | 0 |
| Dividends | - | - | | - | -40,000 | - | -40,000 |
| EQUITY AT 31 DECEMBER 2019 | 418,602 | 686,325 | 2,002,562 | 426,941 | 181,982 | 18,910 | 3,735,323 |
| Loss for the period | - | - | - | - | -112,711 | - | -112,711 |
| Other comprehensive income | - | - | - | - | - | -15,357 | -15,357 |
| Total comprehensiveloss | 0 | 0 | 0 | 0 | -112,711 | -15,357 | -128,068 |
| EQUITY AT 31 MARCH 2020 | 418,602 | 686,325 | 2,002,562 | 426,941 | 69,271 | 3,553 | 3,607,255 |
| | | | | | | |
The accompanying notes are an integral part of these financial statements.
14 | Interim Management Statement
| In thousands of euro | Jan-Mar 2020* | Jan-Mar 2019* | Jan-Dec 2019 |
| Cash flows from operating activities | | |
| Net loss/profit for the period | -112,711 | 53,617 | 181,982 |
| | | |
| Adjustments: | | |
| Unrealised gains/losses of financial assets held at fair value | 72,439 | 428 | 3,226 |
| ECL non-lending activities | 185 | 42 | 50 |
| Depreciation and write-down in value of tangible and intangible assets | 1,612 | 649 | 6,841 |
| Change in accrued interest and fees (assets) | 58,521 | 54,741 | 19,631 |
| Change in accrued interest and fees (liabilities) | -53,934 | -49,105 | -14,830 |
| Net loan losses (ECL lending activities) | 22,146 | -2,636 | 524 |
| Adjustment to hedge accounting | 55,739 | -6,465 | -9,243 |
| Other adjustments to the period´s profit | 2,947 | -1,112 | -3,826 |
| Adjustments, total | 159,656 | -3,457 | 2,373 |
| Lending | | |
| Disbursements of loans | -946,367 | -546,956 | -2,545,287 |
| Repayments of loans | 495,867 | 1,001,878 | 2,814,863 |
| Transfers of lending green bonds to debt securities | - | - | 48,149 |
| Capitalisations, redenominations, index adjustments, etc. | -37 | 643 | -9,271 |
| Lending, total | -450,538 | 455,565 | 308,454 |
| | | |
| Cash flows from operating activities, total | -403,592 | 505,725 | 492,809 |
Cash flows from investing activities | | |
| Placements and debt securities | | |
| Purchase of debt securities | -723,112 | -538,330 | -2,246,940 |
| Transfers of lending green bonds to debt securities | - | - | -48,149 |
| Sold and/or matured debt securities | 547,324 | 805,507 | 1,708,959 |
| Placements with credit institutions | 2,251,110 | - | -3,580,102 |
| Other financial placements | - | 15 | 7,910 |
| Placements and debt securities, total | 2,075,322 | 267,192 | -4,158,321 |
* Unaudited figures, to be read in conjunction with NIB's 2019 audited financial statements
The accompanying notes are an integral part of these financial statements.
15 | Interim Management Statement
| In thousands of euro | Jan-Mar 2020* | Jan-Mar 2019* | Jan-Dec 2019 |
| Other items | | |
| Acquisition of intangible assets | -653 | -717 | -2,941 |
| Acquisition of tangible assets | -2,439 | -1,210 | -7,192 |
| Change in other assets | -3,599 | -7,703 | 293 |
| Other items, total | -6,691 | -9,630 | -9,839 |
| | | |
| Cash flows from investing activities, total | 2,068,631 | 257,563 | -4,168,161 |
| | | |
| Cash flows from financing activities | | |
| Debts evidenced by certificates | | |
| Issues of new debt | 658,983 | 1,415,746 | 4,908,757 |
| Redemptions | -1,012,420 | -2,517,701 | -4,588,630 |
| Debts evidenced by certificates, total | -353,438 | -1,101,955 | 320,127 |
| | | |
| Other items | | |
| Long-term placements from credit institutions | - | - | -1,051 |
| Change in swap receivables excluding fair value changes | -398,943 | -161,723 | -136,802 |
| Change in swap payables excluding fair value changes | 100,497 | -297,274 | -493,868 |
| Change in other liabilities | 499,374 | 51,957 | -1,549 |
| Dividend paid | - | - | -40,000 |
| Other items, total | 200,929 | -407,040 | -673,270 |
| | | |
| Cash flows from financing activities, total | -152,509 | -1,508,995 | -353,143 |
| | | |
| CHANGE IN CASH AND CASH EQUIVALENTS, NET | 1,512,529 | -745,705 | -4,028,495 |
| | | |
| Opening balance for cash and cash equivalents, net | 471,700 | 4,182,512 | 4,182,512 |
| Exchange rate adjustments | 113,471 | 330,887 | 317,683 |
| Closing balance for cash and cash equivalents, net | 2,097,700 | 3,767,691 | 471,700 |
| | | |
| Additional information to the statement of cash flows | | |
| Interest income received | 139,609 | 140,167 | 360,603 |
| Interest expense paid | -86,011 | -80,931 | -144,104 |
* Unaudited figures, to be read in conjunction with NIB's 2019 audited financial statements
The accompanying notes are an integral part of these financial statements. The cash flow statement has been prepared using the indirect method and cash flow items cannot be directly concluded from the statements of financial positions.
16 | Interim Management Statement
Notes to the interim financial statements
Note 1: Net interest income
In thousands of euro | Jan-Mar 2020 | | Jan-Dec 2019 |
| Cash and cash equivalents | -2,980 | -2,682 | -2,725 |
| Placements with credit institutions | -3,576 | 0 | -12,872 |
| Debt securities | 15,250 | 14,622
| 60,757 |
| Loans outstanding | 72,319 | 73,459 | 295,726 |
| Other interest income | 27 | 27 | 123
|
| Total, interest income | 81,040 | 85,426
| 341,009 |
| Of which, interest income from financial assets measured at amortised cost | 73,929 | 79,627
| 315,241
|
| Short-term amounts owed to credit institutions | 1,248 | 509
| 3,199 |
| Long-term amounts owed to credit institutions | 12 | 13
| 50
|
| Short-term repurchase agreements | 2 | - | -
|
| Debts evidenced by certificates | -131,541 | -140,999 | -558,100 |
| Swap contracts and other interest expenses, net | 98,199 | 108,651 | 425,572 |
| Total, interest expense | -32,079 | -31,826
| -129,280 |
| Of which, interest expense from financial liabilities measured at amortised cost | -61,346 | -91,283
| -312,116 |
| Net interest income | 48,961 | 53,600
| 211,729 |
Note 2: Net loss/profit on
financial operations
In thousands of euro | Jan-Mar 2020 | | Jan-Dec 2019 |
| Financial instruments held at fair value, realised gains and losses | 1,370 | -630
| 2,715 |
| Financial instruments held at fair value, unrealised gains and losses | -73,893 | 961 | 2,240 |
| Financial instruments held at amortised cost, realised gains and losses | 36 | -130
| 73 |
| Adjustment to hedge accounting, unrealised gains and losses of fair value hedges | -55,739 | 6,465
| 9,243 |
| Net loss/profit on financial operations | -128,226 | 6,665
| 14,272 |
17 | Interim Management Statement |
Note 3: Expected credit loss
| In thousands of euro | STAGE 1 | STAGE 2 | STAGE 3 | TOTAL |
| Balance at 31 December 2018 | | | | |
| Transfer to Stage 1 | | | | |
| Transfer to Stage 2 | | | | |
| | | | |
New assets originated or disbursed | | | | 1,325 |
Amortisations and repayments | | | | |
Impact of remeasurment on existing assets | | -636 | | -1,560 |
Foreign exchange adjustments and other changes | | | | |
Net change income statement | | | | |
| | | | | |
| | | | |
| 4,235 | | | |
Transfer to Stage 2 | -264 | 264 | - | 0 |
| 0 | 0 | - | 0 |
| New assets originated or disbursed | 5,967 | 2365 | - | 8,332 |
| Amortisations and repayments | -3,745 | -3,252 | | -6,997 |
| Impact of remeasurment on existing assets | -4,191 | 6,467 | -484 | 1,792 |
| Foreign exchange adjustments and other changes | - | - | -2 | -2 |
| Net change income statement | 2,003 | 1,609 | -486 | 3,126 |
| | | | | |
| Balance at 31 December 2019 | 28,575 | 13,682 | 80,031 | 122,287 |
| Transfer to Stage 1 | - | - | - | 0 |
| Transfer to Stage 2 | -2,770 | 2,770 | - | 0 |
| Transfer to Stage 3 | - | - | - | 0 |
| New assets originated or disbursed | 2,294 | 80 | - | 2,374 |
| Amortisations and repayments | -751 | -339 | - | -1,090 |
| Impact of remeasurment on existing assets | 8,584 | 12,610 | -146 | 21,047 |
| Foreign exchange adjustments and other changes | - | - | 2,043 | 2,043 |
| Net change income statement | 7,357 | 15,121 | 1,896 | 24,374 |
| | |
| Balance at 31 March 2020 | 35,932 | 28,803 | 81,927 | 146,662 |
| ECL - STATEMENT OF FINANCIAL POSITION | | | |
| In thousands of euro | 31 Mar 2020 | 31 Mar 2019 | 31 Dec 2019 |
| Loans outstanding | 143,064 | 116,138
| 119,165 |
| Other receivables | 1,885 | 1,838
| 1,838 |
| Commitments (recorded in other liabilities) | 1,237 | 863 | 994 |
| Financial placements | 476 | 323
| 291 |
| Total | 146,662 | 119,161
| 122,287 |
| ECL - STATEMENT OF COMPREHENSIVE INCOME | | | |
| In thousands of euro | Jan-Mar 2020 | Apr-Dec 2019
| Jan-Mar 2019 |
| Net result on financial operations | -185 | 32
| -43 |
| Net loan losses (Note 4) | -22,146 | -3,160
| 2,636 |
| Foreign exchange gains and losses | -2,043 | 2
| -1,591 |
| Total recognised in income statement | -24,374 | -3,126
| 1,002 |
| In thousands of euro | Jan-Mar 2020 | Jan-Mar 2019
| Jan-Dec 2019 |
| Change in expected credit loss on performing loans | -22,293 | 1,466
| -2,179 |
| Change in expected credit loss on non-performing loans | 146 | 1,170
| 1,655 |
| Decrease of provisions to cover realised loan losses | - | -
| - |
| Realised loan losses | - | - | - |
| Net loan losses | -22,146 | 2,636 | -524 |
There were no realised losses for the periods Jan-Mar 2020, Jan-Mar 2019 or Jan-Dec 2019.
18 | Interim Management Statement |
Note 5: Lending outstanding
| In thousands of euro | Jan-Mar 2020 | Apr-Dec 2019 | Jan-Mar 2019 |
| Opening Balance | 18,931,294 | 18,750,390 | 19,065,056 |
| Disbursements | 946,367 | 2,129,131 | 546,956 |
| Amortisations | -375,867 | -1,225,408 | -328,078 |
| Prepayments | -120,000 | -587,577 | -673,800 |
| Changes in expected credit losses | -21,903 | -3,029 | 2,568 |
| Foreign exchange movements | -766,448 | -92,912 | 100,489 |
| Fair value adjustments | -8,363 | -3,207 | 355 |
| Hedge accounting adjustments | 58,555 | 13,606 | 37,486 |
| Other | -155 | -49,699 | -643 |
| Closing balance | 18,643,480 | 18,931,294 | 18,750,390 |
Lending outstanding at 31 March 2020, comprises loans outstanding of EUR 18,527,397 thousand and lending green bonds of EUR 116,083 thousand recorded in Debt securities.
Note 6: Debts evidenced by certificates
| In thousands of euro | Jan-Mar 2020 | Apr-Dec 2019 | Jan-Mar 2019 |
| Opening Balance | 26,673,647 | 25,240,264 | 25,651,370 |
| New debt issues | 1,665,913 | 3,493,011 | 1,415,746 |
| Amortisations | -872,750 | -2,136,547 | -2,103,102 |
| Calls and buy backs | -140,562 | -105,495 | -414,147 |
| Foreign exchange movements | -751,396 | -113,937 | 454,354 |
| Fair value adjustments | 24,037 | 1,801 | - |
| Hedge accounting adjustments | 479,679 | 291,614 | 236,495 |
| Other | 891 | 2,936 | -452 |
| Closing balance | 27,079,458 | 26,673,647 | 25,240,264 |
Note 7: Basis of preparation
This interim management statement is not presented in accordance with IAS 34 “Interim Financial Reporting”, as this statement excludes a number of disclosures. The accounting policies and methods of computation are the same as described in Note 1 of NIB’s Financial Report 2019.
This report was approved by Executive Committee on 8th April 2020
| | Total equity at reporting date |
| Total assets at reporting date |
| Profit/average equity = | Annualised profit for the period |
| Average equity for the period |
| Cost/income = | Total operating expenses for the period |
| Total operating income for the period |
19 | Interim Management Statement |