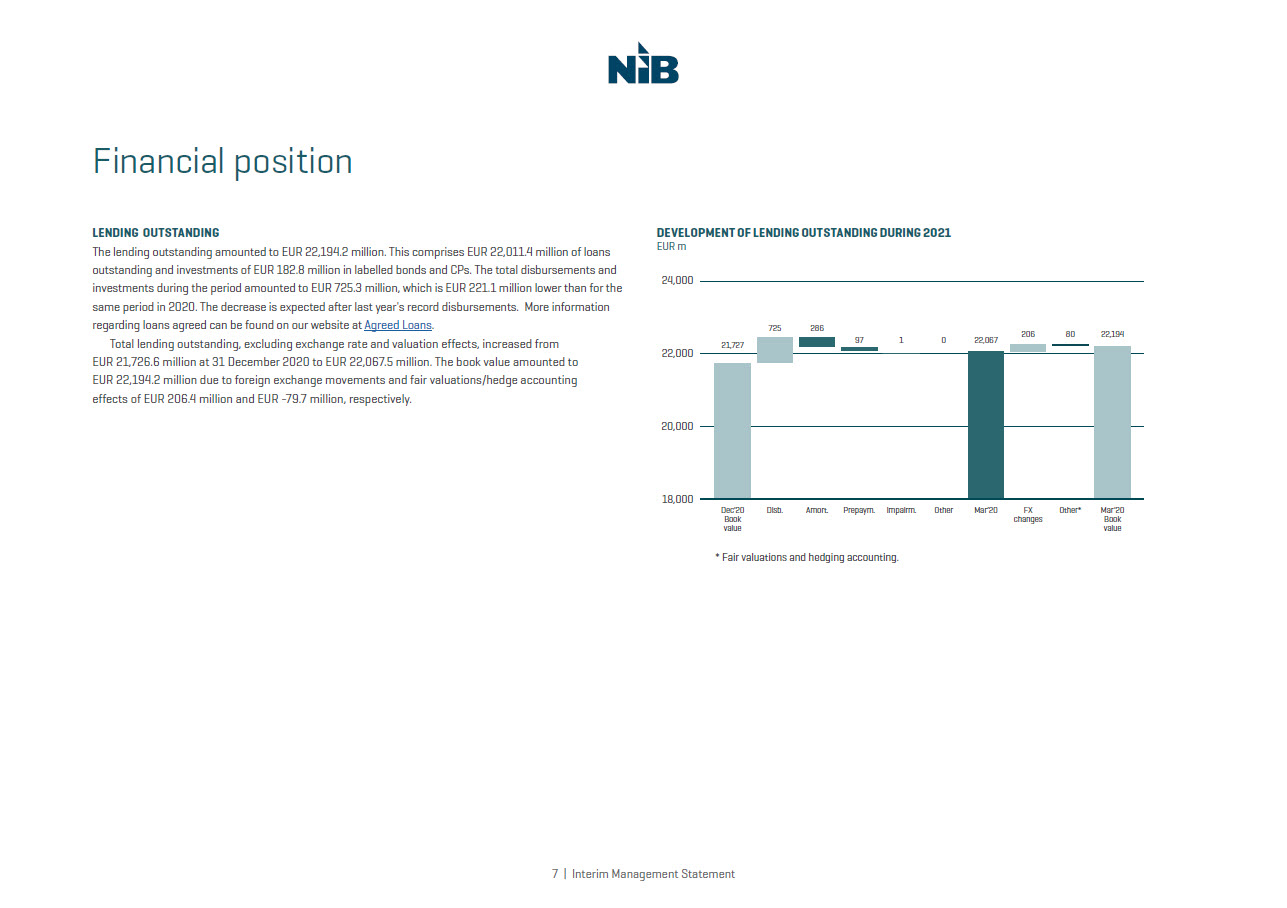
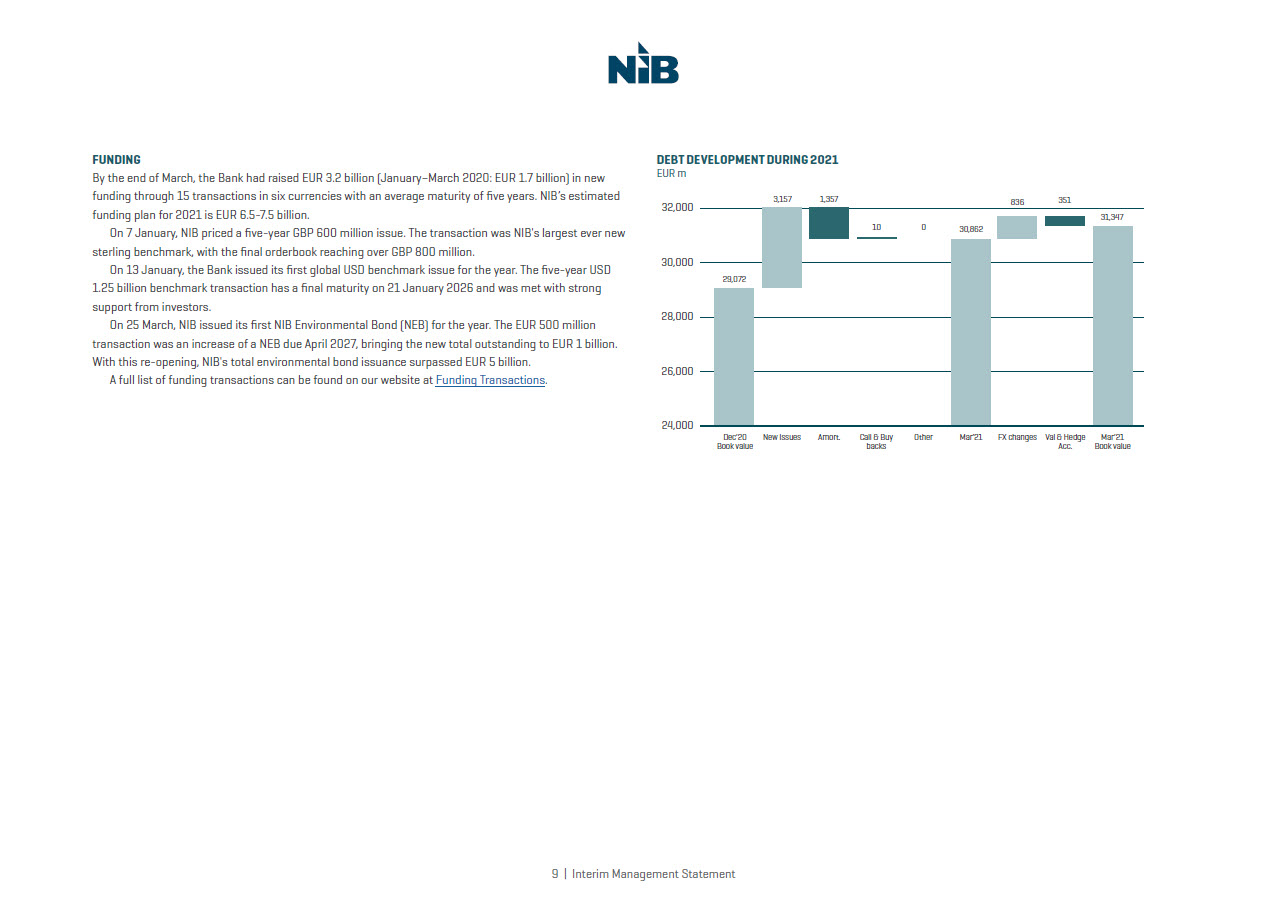
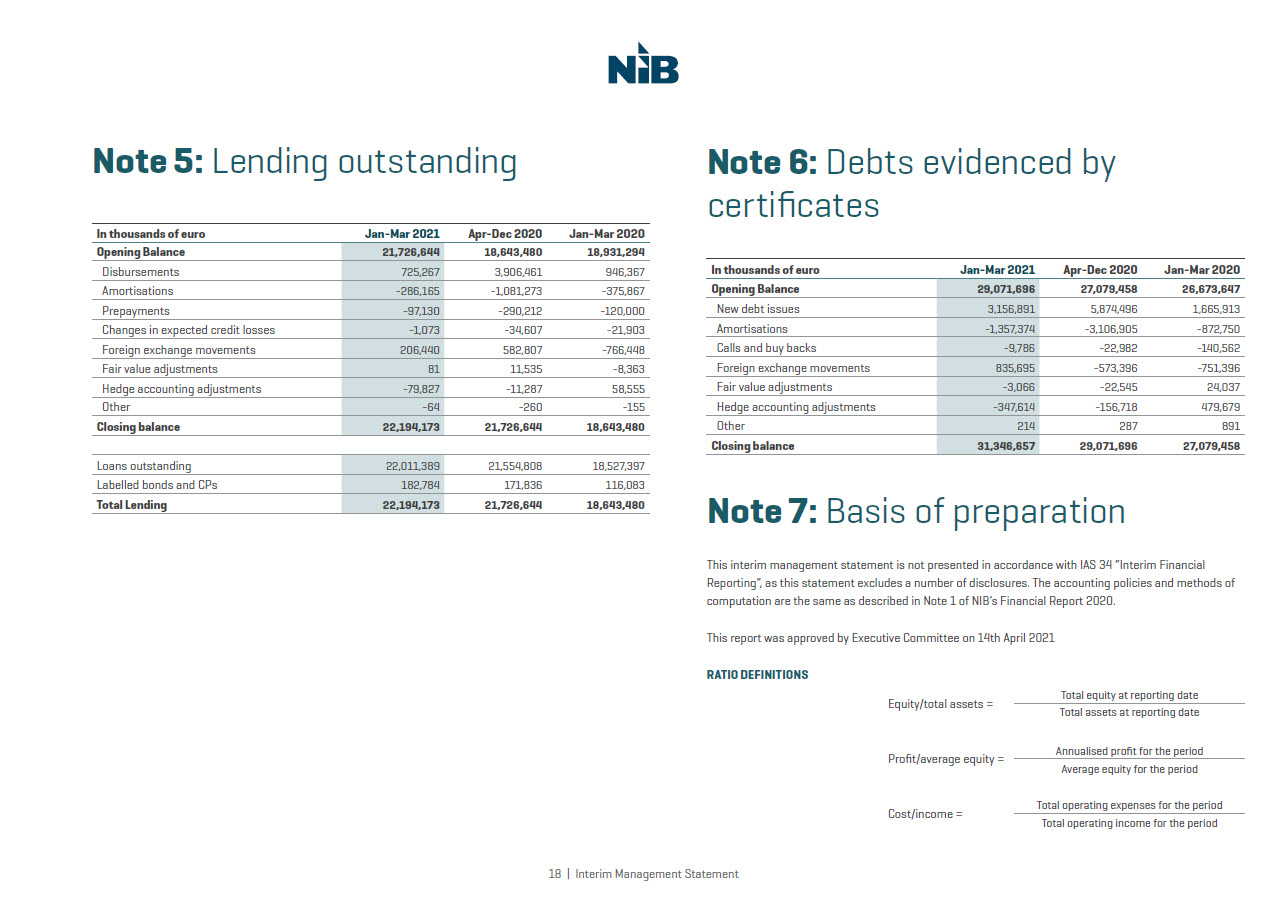
Note 5: Lending outstanding 18 In thousands of euro Jan-Mar 2021 Apr-Dec 2020 Jan-Mar 2020 Opening Balance 21,726,644 18,643,480 18,931,294 Disbursements 725,267 3,906,461 946,367 Amortisations -286,165 -1,081,273 -375,867 Prepayments -97,130 -290,212 -120,000 Changes in expected credit losses -1,073 -34,607 -21,903 Foreign exchange movements 206,440 582,807 -766,448 Fair value adjustments 81 11,535 -8,363 Hedge accounting adjustments -79,827 -11,287 58,555 Other -64 -260 -155 Closing balance 22,194,173 21,726,644 18,643,480 Loans outstanding 22,011,389 21,554,808 18,527,397 Labelled bonds and CPs 182,784 171,836 116,083 Total Lending 22,194,173 21,726,644 18,643,480 In thousands of euro Jan-Mar 2021 Apr-Dec 2020 Jan-Mar 2020 Opening Balance 29,071,696 27,079,458 26,673,647 New debt issues 3,156,891 5,874,496 1,665,913 Amortisations -1,357,374 -3,106,905 -872,750 Calls and buy backs -9,786 -22,982 -140,562 Foreign exchange movements 835,695 -573,396 -751,396 Fair value adjustments -3,066 -22,545 24,037 Hedge accounting adjustments -347,614 -156,718 479,679 Other 214 287 891 Closing balance 31,346,657 29,071,696 27,079,458 Note 6: Debts evidenced by certificates Note 7: Basis of preparationThis interim management statement is not presented in accordance with IAS 34 “Interim Financial Reporting”, as this statement excludes a number of disclosures. The accounting policies and methods of computation are the same as described in Note 1 of NIB’s Financial Report 2020.This report was approved by Executive Committee on 14th April 2021RATIO DEFINITIONS Equity/total assets = Total equity at reporting date Total assets at reporting date Profit/average equity = Annualised profit for the period Average equity for the period Cost/income = Total operating expenses for the period Total operating income for the period