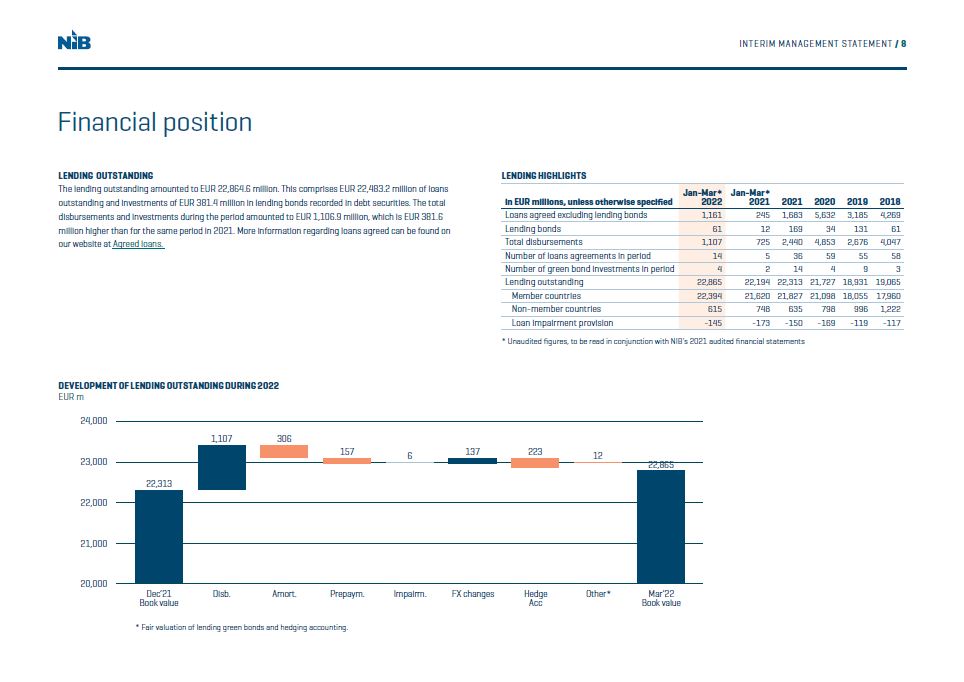
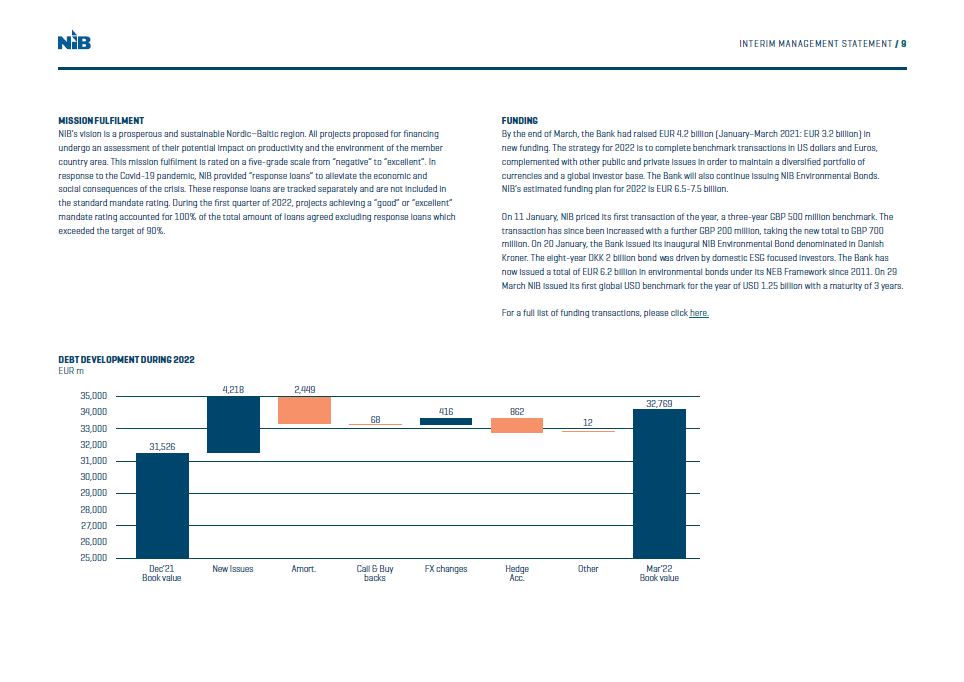
Note 5: Lending outstanding In thousands of euro Jan-Mar 2022 Jan-Mar 2021 Jan-Dec 2021 Opening Balance 22,312,579 21,726,644 21,726,644 Disbursements 1,106,878 725,267 2,439,727 Amortisations -306,304 -286,165 -1,534,556 Prepayments -157,014 -97,130 -440,962 Changes in expected credit losses 6,446 -1,073 25,148 Foreign exchange movements 136,855 206,440 248,567 Fair value adjustments -11,121 81 -1,477 Hedge accounting adjustments -223,209 -79,827 -149,188 Other -463 -64 -1,324 Closing balance 22,864,645 22,194,173 22,312,579 Loans outstanding 22,483,205 22,011,389 21,975,146 Lending bonds 381,440 182,784 337,433 Total Lending 22,864,645 22,194,173 22,312,579 In thousands of euro Jan-Mar 2022 Jan-Mar 2021 Jan-Dec 2021 Opening Balance 31,525,985 29,071,696 29,071,696 New debt issues 4,217,531 3,156,891 7,027,535 Amortisations -2,449,151 -1,357,374 -4,763,800 Calls and buy backs -68,493 -9,786 -299,348 Foreign exchange movements 416,168 835,695 1,222,213 Fair value adjustments -13,371 -3,066 -7,951 Hedge accounting adjustments -861,639 -347,614 -720,310 Other 1,499 214 -4,050 Closing balance 32,768,529 31,346,657 31,525,985 Note 6: Debts evidenced by certificates Note 7: Basis of preparation This interim management statement is not presented in accordance with IAS 34 “Interim Financial Reporting”, as this statement excludes a number of disclosures. The accounting policies and methods of computation are the same as described in Note 1 of NIB’s Financial Report 2021. This report was approved by Executive Committee on 22th April 2022 RATIO DEFINITIONS Equity/total assets = Total equity at reporting date Total assets at reporting date Net Profit/average equity = Annualised profit for the period Average equity for the period Cost/income = Total operating expenses for the period Total operating income for the period INTERIM MANAGEMENT STATEMENT / 18