Exhibit IX
Report of the Board of Directors 2014
Summary
| ¡ | | Despite a subdued investment climate, NIB’s lending activities developed positively. |
| ¡ | | The sum total of new loan agreements increased to EUR 2.4 billion, compared to EUR 1.8 billion during 2013. |
| ¡ | | 94% of loans received good or excellent ratings in terms of improving the competitiveness and environment in the region. |
| ¡ | | During 2014, NIB raised EUR 3.4 billion in new funding. |
| ¡ | | NIB launched its inaugural benchmark Environmental Bond. |
| ¡ | | The profit for the year 2014 was EUR 210 million (2013: EUR 217 million). |
| ¡ | | The Board reviewed NIB’s strategy. |
| ¡ | | The Board conducted a self-evaluation survey. |
Operating environment
Global economic performance was uneven in 2014. While the US and UK economies continued to gain strength, the bulk of continental Europe stagnated. Anticipation of increasingly divergent monetary policy also led to currency swings, with the US currency appreciating broadly and steadily.
From mid-2014 onward, the price of crude oil started to fall substantially, with important yet varying repercussions across the globe. While a lower price for oil is positive for net importers and consumers, its volatility is costly: it disrupts long-term investment, and currently comes within the context of increased geopolitical turmoil, as well as worsening prospects in Russia.
The knock-on effect on the open Nordic–Baltic region has been reflected in weak economic growth, estimated at only 1.5% overall for 2014. Some of the region’s individual economies fared better, but key regions and sectors stagnated while much of the growth was supported by consumers and residential investment rather than exports or business investment.
Lending activities
Against the background of the operating environment in 2014, NIB’s lending activities continued to develop very positively. The Bank signed 45 loan agreements with an aggregate total of EUR 2,389 million. Close to half of these loans are to new borrowers. This broadens the Bank’s client base and reduces concentration in the loan portfolio. Lending developments in terms of business sectors are displayed in the table below.
Disbursements of loans increased to EUR 2,274 million, compared to EUR 1,922 million during 2013. The largest sector was industries and services, with a substantial part of NIB’s financing provided for research and development. The public sector in the member countries was also a major recipient of loans.
Liquidity remained ample in the financial markets, with increasing amounts of capital being made available in the Nordic–Baltic region and with continued low investment levels. This also affected NIB’s loan portfolio, resulting in larger-than-average early redemptions of loans. Moreover, prepayments in some cases occurred as a consequence of the Bank protecting its creditor’s rights and in connection with renewal of engagements.
1
Lending
| | | | | | | | |
[In EUR million unless otherwise specified] | | 2014 | | | 2013 | |
Loans agreed according to area: | | | | | | | | |
Energy and environment | | | 630 | | | | 302 | |
Infrastructure and telecom | | | 557 | | | | 474 | |
Industries and services | | | 926 | | | | 805 | |
Financial institutions and SMEs | | | 277 | | | | 230 | |
Loans agreed, total | | | 2,389 | | | | 1,810 | |
Member countries | | | 2,327 | | | | 1,760 | |
Non-member countries | | | 62 | | | | 50 | |
Loans disbursed, total | | | 2,274 | | | | 1,922 | |
Member countries | | | 2,181 | | | | 1,670 | |
Non-member countries | | | 93 | | | | 251 | |
Number of loan agreements, total | | | 45 | | | | 43 | |
Member countries | | | 43 | | | | 42 | |
Non-member countries | | | 2 | | | | 1 | |
Loans outstanding and guarantees | | | 15,156 | | | | 14,667 | |
Member countries | | | 12,705 | | | | 12,035 | |
Non-member countries | | | 2,506 | | | | 2,669 | |
Collective impairments | | | -55 | | | | -37 | |
Repayments and prepayments | | | 2,005 | | | | 1,819 | |
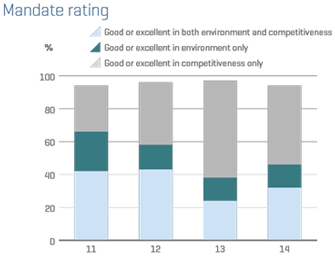
NIB finances investment projects that improve the competitiveness and environment of the Nordic–Baltic countries. NIB strives to ensure that all its lending adds value to what the market provides. One way of doing this is by offering flexible long-term lending and technical expertise. All projects are rated from the perspective of fulfilling this mission. In 2014, the proportion of loans achieving a “good” or “excellent” mandate rating was 94%.
Projects generating a high competitiveness impact are identified in both the private and public sectors. Innovation is a key catalyst for productivity and long-term growth in the region. In 2014, NIB provided financing to numerous of its corporate clients’ R&D programmes. In the public sector, the focus was on supporting investments in infrastructure, including public transport, roads, transmission lines, healthcare development and education facilities.
In order to reach out to smaller counterparties, NIB provided financing through financial intermediaries. These loan programmes are an important method for NIB to strengthen the capacity of such companies to invest, grow and create jobs.
NIB defines loans to projects with significant direct or indirect positive environmental impacts as environmental loans, regardless of the industrial sector in which they occur. In 2014, a total volume of EUR 1,096 million was agreed for projects with an environmental mandate rating of “good” or “excellent”, which is equivalent to 46% of the total agreed volume.
Many projects were related to climate change mitigation, particularly by supporting the member countries in their advances along the path towards having resource-efficient, low-carbon economies by investing in renewable energy generation or improving energy efficiency. One industrial R&D project had a targeted focus on environmental technology in the field of energy efficiency. NIB estimates that the loans agreed in 2014 are helping to reduce CO2 emissions by 260,000 tonnes annually, prorated to NIB’s share of the financing. The percentage of NIB’s total lending allocated to renewable energy projects and energy efficiency projects amounted to 19% and 15%.
Loans were approved for combined heat and power plants fuelled by biomass and for wind power projects. NIB-financed energy projects will add 1.77 TWh annually to renewable energy generation. Financing was also provided for one investment in wastewater treatment. Furthermore, the Bank’s environmental lending encompassed projects increasing the resource efficiency of transport systems (i.e. rail and public transport infrastructure projects in Finland, Sweden, Lithuania and Latvia).
2
Treasury activities
During 2014, NIB raised EUR 3.4 billion in new funding through 35 funding transactions. At year-end, outstanding debt totalled EUR 19.4 billion in 17 currencies. The largest transaction in 2014 was the five-year, USD 1 billion global benchmark transaction, which was issued in April.
Treasury activities
| | | | | | | | | | | | |
[In EUR million] | | 2014 | | | 2013 | | | 2012 | |
New debt Issues | | | 3,361 | | | | 4,080 | | | | 4,355 | |
Debts evidenced by certificates at year-end | | | 19,446 | | | | 18,421 | | | | 20,332 | |
Number of borrowing transactions | | | 35 | | | | 42 | | | | 28 | |
Number of borrowing currencies | | | 10 | | | | 12 | | | | 8 | |
NIB launched its inaugural benchmark Environmental Bond in 2014. The seven-year, USD 500 million transaction was issued in September. The bond was mainly bought by investors following socially responsible investment principles. The proceeds of the transaction have been used to finance distinct eligible projects with a positive impact on the environment.
NIB’s investor distribution continued to be global and well diversified. Investors from Europe made up 48% of the total investor base in 2014, while investors based in Asia bought 27% of NIB’s new issuance, investors from the Australia/New Zealand region contributed a share of 12%, and investors from the Americas accounted for 10%.
The Bank’s liquidity remained strong during 2014. In September, the Board of Directors approved the policy towards managing liquidity. The Liquidity Policy defines the Bank’s objectives for managing liquidity risk, and sets conditions for the calculation of the minimum size of the liquidity buffer and the funding needed to support it. The size is based on stress testing and quantified so that the Bank is able to fulfil all its payment obligations falling due during the coming 12 months without obtaining new funding. At the end of 2014, the liquidity buffer amounts to EUR 7,899 million, including received collateral (both cash and securities), which the Bank receives from swap counterparties to mitigate counterparty risk. Of the liquidity buffer, 20%, or EUR 1,612 million, is held as cash in short-term money market instruments. The remaining 80%, or EUR 6,287 million, is held in securities with longer maturities.
3
Risk management
The Bank’s overall risk position remained solid in 2014, based on sustained high asset quality and a sound capitalisation level. Despite continued weakness in the economic environment and some counterparties facing difficulties, the overall quality of the loan portfolio remained high.
In total, 83% of the lending exposure was in investment-grade categories (risk classes 1–10), which was unchanged compared to year-end 2013. The exposure in the weakest risk classes (17–20) declined slightly to 1% (2013: 1.2%).
The Bank maintains a well-balanced loan portfolio, taking its mission into consideration. There were no material changes in the geographical and sectoral distribution of the loan portfolio in 2014. At year-end, the member countries accounted for 82% (2013: 79%) of the total lending exposure, followed by 7% for Central and Eastern Europe, and 6% for Asia.
As in the previous year, the credit quality of the Treasury portfolio was strong, with close to 100% of the exposure in investment-grade categories (risk classes 1–10). Of the Treasury exposure, 35% was within the member countries, compared to 32% the year before. The geographical distribution of the Treasury portfolio continued to be weighted towards Germany, accounting for 26% of the total exposure (2013: 29%).
The Bank has strengthened its risk management in line with evolving market standards. During 2014, the Bank improved its measurement and monitoring of liquidity, market, and counterparty credit risk and launched a project to enhance the framework for estimating loss-given-default. Furthermore, the implementation of a single platform for the credit process was finalised, improving efficiency and system support for credit risk management.
Compliance
The Board of Directors has regularly been updated on the progress of and follow-up on actions resulting from investigations conducted by the Bank’s Committee on Fighting Corruption and the Office of the Chief Compliance Officer. This includes sanctioning contractors as well as referring allegations of corruption to national investigative authorities for criminal investigation. As part of the Bank’s credit process, the Board of Directors has also been informed about the management’s assessments of corruption risks relating to projects considered for financing by the Bank.
During 2014, the Bank’s Non-Compliant Jurisdiction Policy (NCJ) entered into force. The policy emphasises the need to include information in Board documents about ownership structures, especially concerning entities registered in countries determined by NIB as non-compliant or only partially compliant with NCJ.
Financial results
Despite a very demanding environment with low interest rates and modest economic growth, NIB’s profit for 2014 amounted to EUR 210 million (2013: EUR 217 million).
The net interest income was EUR 239 million (2013: EUR 244 million). Net interest income from lending operations remained broadly stable, reflecting consistent volumes and margins, but was lower for treasury operations.
The profit on financial operations increased. The contribution of financial operations to the Bank’s profit was EUR 26 million (2013: EUR 20 million). These gains on financial operations are the result of actively managing portfolios, and resulted from the volatility of the markets and the fair value movements.
Loan impairment charges remained low and amounted to EUR 21 million. The impairment charge level corresponds to 14 (2013: 10) basis points of total loans outstanding. During 2014, there was one realised loss.
NIB’s Statutes provide that the member countries guarantee loans granted under the environmental investment loan facility (MIL). Since a loss was incurred on an MIL loan extended to finance a project in eastern Ukraine, the Board called on the guarantees.
Total assets at the end of the year were EUR 25 billion (2013: EUR 23 billion). Outstanding lending amounted to EUR 15 billion (2013: EUR 15 billion). NIB maintained a strong balance sheet and a robust capital position.
4
Administrative expenses for the year amounted to EUR 41 million (2013: EUR 39 million). The increase was mainly due to the cost of compliance and regulation.
The results were achieved with a staff of 188 (2013: 185).
Key figures
| | | | | | | | | | | | |
[in EUR million] | | 2014 | | | 2013 | | | 2012 | |
Net interest income | | | 239 | | | | 244 | | | | 252 | |
Profit/loss on financial operations | | | 26 | | | | 20 | | | | 43 | |
Loan impairments | | | 21 | | | | 15 | | | | 56 | |
Profit/loss | | | 210 | | | | 217 | | | | 209 | |
Equity | | | 2,986 | | | | 2,831 | | | | 2,666 | |
Total assets | | | 24,870 | | | | 23,490 | | | | 25,983 | |
Solvency ratio (equity/total assets %) | | | 12.0% | | | | 12.1% | | | | 10.3% | |
Cost/income ratio | | | 15.1% | | | | 14.3% | | | | 12.5% | |
Dividend
The Board of Directors proposes to the Board of Governors that EUR 55 million be paid as dividends to the Bank’s member countries for the year 2014.
Board evaluation
Good governance and efficient administration are the determining criteria for the success of any institution. The Board conducted a self-evaluation survey in order to develop its own way of working. All Board members replied to a written survey conducted by an external consultancy. The Board discussed the results of the survey in several meetings and decided to make several changes to its working practices.
Strategy review
On top of the Bank’s regular activities, the Board of Directors and the Management reviewed NIB’s strategy in 2014. The work was organised in the form of seminars and interactive working sessions in connection with formal meetings.
The Board has discussed NIB’s mission and success factors, the mandate rating framework (in particular the competitiveness mandate), additionality, the Bank’s capital and liquidity, new lending options and the risk implications of these. Ex-post assessment of the mandate fulfilment of projects will be introduced as a result of discussions on the mandate rating framework.
The Board is expected to conclude this process during the first half of 2015.
Chairmanship
The Chairmanship of the Board rotates among the member countries every two years. Rolandas Kriščiūnas (LIT) ended his two-year term on 1 June 2014, when Pentti Pikkarainen (FI) took over the Chairmanship.
5
Outlook for 2015
Overall real economic growth in the Nordic–Baltic region is not expected to exceed 1.5%–2.0% over the coming year. Inflation and interest rates in Europe are forecast to remain abnormally low for an extended period. As a consequence, NIB expects its profit and the level of disbursements to be somewhat lower in 2015.
Nonetheless, the need for investments that align naturally with NIB’s mission–in infrastructure, energy, transportation and logistics, and corporate R&D–remains high for the foreseeable future. In the most developed economies of the region, renewal needs are abundant. In the other parts of the region, large investments are still needed to support and accelerate the ongoing economic convergence.
Consistent with policy goals and reflected by tighter regulation and supervision, the risk appetite of commercial banks is low. In this context, the private-sector credit cycle is lagging behind–rather than leading–the economic cycle.
Local corporate bond markets have been active, but their robustness and liquidity remain largely untested. The NIB funding advantage has, on the other hand, been resilient. As a follow-up to the strategy review, NIB is expected to further enhance its relevance to its customers in the Nordic-Baltic region and beyond.
6
Proposal by the Board of Directors to the Board of Governors
The Board of Directors’ proposal with regards to the financial results for the year 2014 takes into account the need to keep its ratio of equity to total risk weighted assets at a secure level, which is a prerequisite for maintaining the Bank’s high creditworthiness.
In accordance with section 11 of the Statutes of the Bank, the profit for 2014 of EUR 210,211,265.10 is to be allocated as follows:
| | ¡ | | EUR 155,211,265.10 is transferred to the General Credit Risk Fund as a part of equity; |
| | ¡ | | no transfer is made to the Special Credit Risk Fund for Project Investment Loans; |
| | ¡ | | no transfer is made to the Statutory reserve. The Statutory Reserve amounts to EUR 686,325,305.70 or 11.2 % of the Bank’s authorized capital stock; and |
| | ¡ | | EUR 55,000,000.00 is made available for distribution as dividends to the Bank’s member countries. |
More information can be found in the statement of comprehensive income, statement of financial position, changes is equity and cash flow statement, as well as the notes to the financial statements.
| | | | |
| Helsinki, 5 March 2015 | | | | |
| | |
| Pentti Pikkarainen | | Kaspars Āboliņš | | Sven Hegelund |
| | |
| Silje Gamstøbakk | | Algimantas Rimkūnas | | Jesper Olesen |
| | |
| Þorsteinn Þorsteinsson | | Henrik Normann | | Madis Üürike |
| | President & CEO | | |
7
Statement of comprehensive income
1 January – 31 December
| | | | | | | | | | | | |
EUR 1,000 | | Note | | | 2014 | | | 2013 | |
Interest income | | | | | | | 382,760 | | | | 404,179 | |
Interest expense | | | | | | | -143,652 | | | | -159,975 | |
Net interest income | | | (1), (2), (22) | | | | 239,108 | | | | 244,204 | |
| | | |
Commission income and fees received | | | (3) | | | | 9,326 | | | | 10,199 | |
Commission expense and fees paid | | | | | | | -2,092 | | | | -2,454 | |
Net profit/loss on financial operations | | | (4) | | | | 25,684 | | | | 19,840 | |
Foreign exchange gains and losses | | | | | | | 187 | | | | -384 | |
Operating income | | | | | | | 272,211 | | | | 271,404 | |
| | | |
Expenses | | | | | | | | | | | | |
| | | |
General administrative expenses | | | (5), (22) | | | | 37,386 | | | | 35,217 | |
Depreciation | | | (9), (10) | | | | 3,709 | | | | 3,592 | |
Impairment of loans | | | (6), (8) | | | | 20,905 | | | | 15,385 | |
Total expenses | | | | | | | 62,000 | | | | 54,194 | |
| | | | | | | | | | | | |
PROFIT/LOSS FOR THE YEAR | | | | | | | 210,211 | | | | 217,210 | |
| | | |
| | | | | | | | | | | | |
Total comprehensive income | | | | 210,211 | | | | 217,210 | |
The Nordic Investment Bank’s accounts are kept in euro.
8
Statement of financial position at 31 December
| | | | | | | | | | | | | | | | |
EUR 1,000 | | | | | Note | | | 2014 | | | 2013 | |
ASSETS | | | | | | | (1), (18), (19), (20), (21) | | | | | | | | | |
Cash and cash equivalents | | | | | | | (17), (23) | | | | 1,639,139 | | | | 1,757,616 | |
Financial placements | | | | | | | (17) | | | | | | | | | |
Placements with credit institutions | | | | | | | | | | | 6,571 | | | | 5,741 | |
Debt securities | | | | | | | (7) | | | | 5,489,623 | | | | 5,343,419 | |
Other | | | | | | | | | | | 22,190 | | | | 24,247 | |
| | | | | | | | | | | | 5,518,384 | | | | 5,373,407 | |
Loans outstanding | | | | | | | (8), (17) | | | | 15,156,486 | | | | 14,666,747 | |
Intangible assets | | | | | | | (9) | | | | 5,217 | | | | 5,111 | |
Tangible assets, property and equipment | | | | | | | (9) | | | | 28,324 | | | | 29,640 | |
Other assets | | | | | | | (11), (17) | | | | | | | | | |
Derivatives | | | | | | | | | | | 2,198,003 | | | | 1,308,990 | |
Other assets | | | | | | | (22) | | | | 19,259 | | | | 30,279 | |
| | | | | | | | | | | | 2,217,262 | | | | 1,339,269 | |
Accrued interest and fees receivable | | | | | | | | | | | 305,590 | | | | 318,151 | |
TOTAL ASSETS | | | | | | | | | | | 24,870,400 | | | | 23,489,941 | |
| | | | |
LIABILITIES AND EQUITY | | | | | | | (1), (18), (19), (20), (21) | | | | | | | | | |
Liabilities | | | | | | | | | | | | | | | | |
Amounts owed to credit institutions | | | | | | | (17), (22) | | | | | | | | | |
Short-term amounts owed to credit institutions | | | | | | | (16), (23) | | | | 872,010 | | | | 372,402 | |
Long-term amounts owed to credit institutions | | | | | | | | | | | - | | | | - | |
| | | | | | | | | | | | 872,010 | | | | 372,402 | |
Debts evidenced by certificates | | | | | | | (12), (17) | | | | | | | | | |
Debt securities issued | | | | | | | | | | | 19,369,052 | | | | 18,346,651 | |
Other debt | | | | | | | | | | | 76,597 | | | | 73,906 | |
| | | | | | | | | | | | 19,445,649 | | | | 18,420,557 | |
Other liabilities | | | | | | | (13), (17) | | | | | | | | | |
Derivatives | | | | | | | | | | | 1,329,097 | | | | 1,615,146 | |
Other liabilities | | | | | | | | | | | 6,760 | | | | 8,094 | |
| | | | | | | | | | | | 1,335,857 | | | | 1,623,240 | |
Accrued interest and fees payable | | | | | | | | | | | 230,786 | | | | 242,855 | |
Total liabilities | | | | | | | | | | | 21,884,302 | | | | 20,659,054 | |
Equity | | | | | | | | | | | | | | | | |
Authorised and subscribed capital | | | 6,141,903 | | | | | | | | | | | | | |
of which callable capital | | | -5,723,302 | | | | | | | | | | | | | |
Paid-in capital | | | 418,602 | | | | (14) | | | | 418,602 | | | | 418,602 | |
Reserve funds | | | | | | | (15) | | | | | | | | | |
Statutory Reserve | | | | | | | | | | | 686,325 | | | | 686,325 | |
General Credit Risk Fund | | | | | | | | | | | 1,275,041 | | | | 1,112,831 | |
Special Credit Risk Fund PIL | | | | | | | | | | | 395,919 | | | | 395,919 | |
Profit/loss for the year | | | | | | | | | | | 210,211 | | | | 217,210 | |
Total equity | | | | | | | | | | | 2,986,099 | | | | 2,830,887 | |
TOTAL LIABILITIES AND EQUITY | | | | | | | | | | | 24,870,400 | | | | 23,489,941 | |
Collateral and commitments | | | | | | | (16) | | | | | | | | | |
The Nordic Investment Bank’s accounts are kept in euro.
9
Changes in equity
| | | | | | | | | | | | | | | | | | | | | | | | | | | | | | | | | | | | |
| EUR 1,000 | | Paid-in
capital | | | Statutory
Reserve | | | General
Credit
Risk
Fund | | | Special
Credit
Risk
Fund
PIL | | | Payments
to the
Bank’s
Statutory
Reserve
and
credit
risk
funds | | | Appropriation
to dividend
payment | | | Other value
adjustments | | | Profit/Loss
for the year | | | Total | |
EQUITY AT 31 DECEMBER 2012 | | | 418,602 | | | | 686,325 | | | | 955,625 | | | | 395,919 | | | | 0 | | | | 0 | | | | 0 | | | | 209,205 | | | | 2,665,677 | |
Appropriations between reserve funds | | | | | | | | | | | 157,205 | | | | | | | | | | | | 52,000 | | | | | | | | -209,205 | | | | 0 | |
Paid-in capital | | | | | | | | | | | | | | | | | | | | | | | | | | | | | | | | | | | 0 | |
Called-in authorised and subscribed capital | | | | | | | | | | | | | | | | | | | | | | | | | | | | | | | | | | | 0 | |
Payments to the Bank’s Statutory Reserve and credit risk funds, receivable | | | | | | | | | | | | | | | | | | | | | | | | | | | | | | | | | | | 0 | |
Dividend payment | | | | | | | | | | | | | | | | | | | | | | | -52,000 | | | | | | | | | | | | -52,000 | |
Comprehensive income for the year | | | | | | | | | | | | | | | | | | | | | | | | | | | | | | | 217,210 | | | | 217,210 | |
EQUITY AT 31 DECEMBER 2013 | | | 418,602 | | | | 686,325 | | | | 1,112,831 | | | | 395,919 | | | | 0 | | | | 0 | | | | 0 | | | | 217,210 | | | | 2,830,887 | |
Appropriations between reserve funds | | | | | | | | | | | 162,210 | | | | | | | | | | | | 55,000 | | | | | | | | -217,210 | | | | 0 | |
Paid-in capital | | | | | | | | | | | | | | | | | | | | | | | | | | | | | | | | | | | 0 | |
Called-in authorised and subscribed capital | | | | | | | | | | | | | | | | | | | | | | | | | | | | | | | | | | | 0 | |
Payments to the Bank’s Statutory Reserve and credit risk funds, receivable | | | | | | | | | | | | | | | | | | | | | | | | | | | | | | | | | | | 0 | |
Dividend payment | | | | | | | | | | | | | | | | | | | | | | | -55,000 | | | | | | | | | | | | -55,000 | |
Comprehensive Income for the year | | | | | | | | | | | | | | | | | | | | | | | | | | | | | | | 210,211 | | | | 210,211 | |
EQUITY AT 31 DECEMBER 2014 | | | 418,602 | | | | 686,325 | | | | 1,275,041 | | | | 395,919 | | | | 0 | | | | 0 | | | | 0 | | | | 210,211 | | | | 2,986,099 | |
| | | | | | | | |
Proposed appropriation of the year’s profit/loss | | 2014 | | | 2013 | |
Appropriation to Statutory Reserve | | | - | | | | - | |
Appropriations to credit risk reserve funds | | | | | | | | |
General Credit Risk Fund | | | 155,211 | | | | 162,210 | |
Special Credit Risk Fund PIL | | | - | | | | - | |
Appropriation to dividend payment | | | 55,000 | | | | 55,000 | |
Profit/loss for the year | | | 210,211 | | | | 217,210 | |
The Nordic Investment Bank’s accounts are kept in euro.
10
Cash flow statement 1 January – 31 December
| | | | | | | | | | |
EUR 1,000 | | Note | | Jan-Dec 2014 | | | Jan-Dec 2013 | |
| Cash flows from operating activities | | | | | | | | |
Profit/loss from operating activities | | | | | 210,211 | | | | 217,210 | |
Adjustments: | | | | | | | | | | |
Unrealised gains/losses of financial assets held at fair value | | | | | -27,631 | | | | -13,500 | |
Depreciation and write-down in value of tangible and intangible assets | | | | | 3,709 | | | | 3,592 | |
Change in accrued interest and fees (assets) | | | | | 12,491 | | | | 33,724 | |
Change in accrued interest and fees (liabilities) | | | | | -12,069 | | | | -21,584 | |
Impairment of loans | | | | | 20,905 | | | | 15,385 | |
Adjustment to hedge accounting | | | | | 1,019 | | | | -2,294 | |
Other adjustments to the year’s profit | | | | | -641 | | | | -1,820 | |
Adjustments, total | | | | | -2,217 | | | | 13,503 | |
| | | |
Lending | | | | | | | | | | |
Disbursements of loans | | | | | -2,273,619 | | | | -1,921,755 | |
Repayments of loans | | | | | 2,005,001 | | | | 1,818,766 | |
Capitalisations, redenominations, index adjustments, etc. | | | | | -69 | | | | -686 | |
Exchange rate adjustments | | | | | -84,071 | | | | 414,332 | |
Lending, total | | | | | -352,758 | | | | 310,656 | |
| | | |
Cash flows from operating activities, total | | | | | -144,763 | | | | 541,369 | |
| | | |
Cash flows from investing activities | | | | | | | | | | |
Placements and debt securities | | | | | | | | | | |
Purchase of debt securities | | | | | -2,555,763 | | | | -2,437,468 | |
Sold and matured debt securities | | | | | 2,489,721 | | | | 2,310,584 | |
Placements with credit institutions | | | | | -830 | | | | -1,550 | |
Other financial placements | | | | | 1,663 | | | | 1,222 | |
Exchange rate adjustments, etc. | | | | | -36,599 | | | | 27,783 | |
Placements and debt securities, total | | | | | -101,808 | | | | -99,429 | |
| | | |
Other items | | | | | -1,637 | | | | -2,440 | |
Acquisition of intangible assets | | | | |
Acquisition of tangible assets | | | | | -861 | | | | -1,602 | |
Change in other assets | | | | | 16,570 | | | | 172 | |
Other items, total | | | | | 14,072 | | | | -3,870 | |
| | | |
Cash flows from investing activities, total | | | | | -87,736 | | | | -103,300 | |
11
| | | | | | | | | | | | |
| | | | | | | | | | | | |
Cash flows from financing activities Debts evidenced by certificates | | | | | | | | | | | | |
Issues of new debt | | | | | | | 3,360,777 | | | | 4,079,958 | |
Redemptions | | | | | | | -4,031,164 | | | | -3,776,926 | |
Exchange rate adjustments | | | | | | | 1,272,741 | | | | -1,608,276 | |
Debts evidenced by certificates, total | | | | | | | 602,354 | | | | -1,305,244 | |
| | | | |
Other items | | | | | | | | | | | | |
Long-term placements from credit institutions | | | | | | | - | | | | -15,222 | |
Change in swap receivables | | | | | | | -653,925 | | | | 638,041 | |
Change in swap payables | | | | | | | -277,680 | | | | 459,022 | |
Change in other liabilities | | | | | | | -1,334 | | | | -1,304 | |
Dividend paid | | | | | | | -55,000 | | | | -52,000 | |
Paid-in capital and reserves | | | | | | | - | | | | - | |
Other items, total | | | | | | | -987,939 | | | | 1,028,537 | |
| | | | |
Cash flows from financing activities, total | | | | | | | -385,585 | | | | -276,706 | |
| | | | |
CHANGE IN CASH AND CASH EQUIVALENTS, NET | | (23) | | | | | -618,084 | | | | 161,363 | |
| | | | |
Opening balance for cash and cash equivalents, net | | | | | | | 1,385,213 | | | | 1,223,851 | |
Closing balance for cash and cash equivalents, net | | | | | | | 767,129 | | | | 1,385,213 | |
| | | | |
Additional information to the statement of cash flows | | | | | | | | | | | | |
Interest income received | | | | | | | 395,321 | | | | 437,903 | |
Interest expense paid | | | | | | | -155,722 | | | | -181,559 | |
The cash flow statement has been prepared using the indirect method and cash flow items cannot be directly concluded from the statements of financial positions.
12
Notes to the financial statements
ACCOUNTING POLICIES
General operating principles
The operations of the Nordic Investment Bank (hereinafter called “the Bank” or “NIB”) are governed by an agreement (hereinafter called “the Agreement”) between the governments of Denmark, Estonia, Finland, Iceland, Latvia, Lithuania, Norway and Sweden (hereinafter called “the member countries”), and the Statutes adopted in conjunction with the Agreement. NIB is an international financial institution that operates in accordance with sound banking principles. NIB finances private and public projects which have high priority for the member countries and borrowers. NIB finances projects both within and outside the member countries, and offers its clients long-term loans and guarantees on competitive market terms.
NIB acquires the funds to finance its lending by borrowing on international capital markets.
The authorised capital stock of the Bank is subscribed by the member countries. Any increase or decrease in the authorised capital stock shall be decided by the Board of Governors, upon a proposal of the Board of Directors of the Bank.
In the member countries, the Bank has the legal status of an international legal person, with full legal capacity, and is exempt from payment restrictions and credit policy measures. The Agreement concerning NIB contains provisions regarding immunities and privileges accorded to the Bank, e.g. the exemption of the Bank’s assets and income from taxation.
The headquarters of the Bank are located at Fabianinkatu 34 in Helsinki, Finland.
Significant accounting policies
Basis for preparing the financial statements
The Bank’s financial statements have been prepared in accordance with International Financial Reporting Standards (IFRS) issued by the International Accounting Standards Board (IASB). The Bank’s accounts are kept in euro. With the exceptions noted below, they are based on historical cost.
Significant accounting judgements and estimates
As part of the process of preparing the financial statements in conformity with IFRS, the Bank’s management is required to make certain judgements, estimates and assumptions that may affect the Bank’s profits, its financial position and other information presented in the Annual Report. These estimates are based on available information and the judgements made by the Bank’s management. Actual outcomes may deviate from the assessments made, and such deviations may at times be substantial.
The Bank uses various valuation models and techniques to estimate the fair values of assets and liabilities. There are significant uncertainties related to these estimates, in particular when they involve modelling complex financial instruments, such as derivative instruments used for hedging activities related to both borrowing and lending. The estimates are highly dependent on market data, such as the level of interest rates, currency rates and other factors. The uncertainties related to these estimates are reflected mainly in the statement of financial position. NIB undertakes continuous development in order to improve the basis for fair value estimates, with regard to both modelling and market data. Changes in estimates resulting from refinements in assumptions and methodologies are reflected in the period in which the enhancements are first applied.
Judgements and estimates are also associated with impairment testing of loans and claims.
13
Foreign currency translation
Monetary assets and liabilities denominated in foreign currencies are recognised in the accounts at the exchange rate prevailing on the closing date. Non-monetary assets and liabilities are recognised in the accounts at the euro rate prevailing on the transaction date. Income and expenses recognised in currencies other than the euro are converted on a daily basis to the euro, in accordance with the euro exchange rate prevailing on that day.
Realised and unrealised exchange rate gains and losses are recognised in the statement of comprehensive income.
The Bank uses the official exchange rates published for the euro by the European Central Bank. See Note 24.
Recognition and derecognition of financial instruments
Financial instruments are recognised in the statement of financial position on a settlement date basis, except for derivative instruments, which are recognised on a trade date basis.
A financial asset is derecognised when the contractual rights to the cash flows from the financial asset expire.
A financial liability is removed from the statement of financial position when the obligation specified in the contract is discharged, cancelled or expires.
Basis for classification and measurement
The financial statements have been prepared on the historical cost basis, except for the following material items in the statement of financial position.
Following the early adoption of IFRS 9 in 2011, the Bank classifies its financial assets into the following categories: those measured at amortised cost, and those measured at fair value. This classification depends on both the contractual characteristics of the assets and the business model adopted for their management.
Financial assets at amortised cost
An investment is classified at “amortised cost” only if both of the following criteria are met: the objective of the Bank’s business model is to hold the assets in order to collect the contractual cash flows, and the contractual terms of the financial assets must give rise on specified dates to cash flows that are only payments of principal and interest on the principal amount outstanding.
Financial assets at fair value
If either of the two criteria above is not met, the asset cannot be classified in the amortised cost category and must be classified at fair value.
Recognised financial assets and financial liabilities designated as hedged items in qualifying fair value hedge relationships are adjusted for changes in fair value attributable to the risk being hedged.
Determination of fair value
The fair value of financial instruments, including derivative instruments that are traded in a liquid market, is the bid or offered closing price on the balance sheet date. Many of NIB’s financial instruments are not traded in a liquid market, such as the Bank’s borrowing transactions with embedded derivative instruments. These are measured at fair value using different valuation models and techniques. This process involves determining future expected cash flows, which can then be discounted to the balance sheet date. The estimation of future cash flows for these instruments is subject to assumptions on market data, and in some cases, in particular where options are involved, even on the behaviour of the Bank’s counterparties. The fair value estimate may therefore be subject to variations and may not be realisable in the market. Under different market assumptions, the values could also differ substantially.
14
The Bank measures fair values using the following fair value hierarchy that reflects the significance of the inputs used in making the measurements:
Level 1: Quoted market prices (unadjusted) in an active market for identical instruments.
Level 2: Valuation techniques based on observable inputs, either directly (i.e. as prices) or indirectly (i.e. derived from prices). This category includes instruments valued using: quoted market prices in active markets for similar instruments, quoted prices for identical or similar instruments in markets that are considered less than active, or other valuation techniques where all significant inputs are directly or indirectly observable from market data.
Level 3: Valuation techniques using significant unobservable inputs. This category includes all instruments where the valuation technique includes inputs not based on observable data and where the unobservable inputs have a significant effect on the instrument’s valuation. This category includes instruments that are valued based on quoted prices for similar instruments where significant unobservable adjustments or assumptions are required to reflect differences between the instruments.
See Note 17 for further details.
Cash and cash equivalents
Cash and cash equivalents comprise monetary assets and placements with original maturities of six months or less, calculated from the date the acquisition and placements were made.
Cash and cash equivalents in the cash flow statement refers to the net amount of monetary assets, placements and liabilities with original maturities of six months or less, calculated from the time the transaction was entered into.
Financial placements
Items recognised as financial placements in the statement of financial position include placements with credit institutions and placements in debt securities, for example, bonds and other debt certificates, as well as certain placements in instruments with equity features. The placements are initially recognised on the settlement date. Their subsequent accounting treatment depends on both the Bank’s business model for managing the placements and their contractual cash flow characteristics.
Reclassifications
Following the amendment to IAS 39 issued in October 2008, permitting the reclassification of financial assets in certain restricted circumstances, the Bank decided to reclassify EUR 715 million of its trading portfolio assets into the held-to-maturity portfolio. This amendment has been applied retrospectively to commence on 1 September 2008. The reclassification has resulted in the cessation of fair value accounting for those assets previously designated as held for trading. The fair values of the assets at the date of reclassification became their new amortised cost, and those assets will subsequently be accounted for on that measurement basis. The reclassified cost will be amortised over the instrument’s expected remaining lifetime through interest income using the effective interest method. See Note 7.
Lending
The Bank may grant loans and provide guarantees under its Ordinary Lending or under special lending facilities. The special lending facilities, which carry member country guarantees, consist of Project Investment Loans (PIL) and Environmental Investment Loans (MIL).
Ordinary Lending includes loans and guarantees within and outside the member countries. The Bank’s Ordinary Lending ceiling corresponds to 250% of its authorised capital and accumulated general reserves and amounts to EUR 20,646 million following the allocations of the year’s profit in accordance with the Board of Directors’ proposal.
15
Project Investment Loans are granted for financing creditworthy projects in the emerging markets of Africa, Asia, Europe and Eurasia, Latin America and the Middle East. The Bank’s Statutes permit loans to be granted and guarantees to be issued under the PIL facility up to an amount corresponding to EUR 4,000 million. The member countries guarantee the PIL loans up to a total amount of EUR 1,800 million. The Bank, however, will assume 100% of any losses incurred under an individual PIL loan, up to the amount available at any given time in the Special Credit Risk Fund for PIL. Only thereafter would the Bank be able to call the member countries’ guarantees according to the following principle: the member countries guarantee 90% of each loan under the PIL facility up to a total amount of EUR 1,800 million. Payment under the member countries’ guarantees would take place at the request of the Board of Directors, as provided for under an agreement between the Bank and each individual member country.
The Bank is authorised to grant special Environmental Investment Loans originally up to the amount of EUR 300 million, for the financing of environmental projects in the areas adjacent to the member countries. The Bank’s member countries guarantee 100% of the MIL facility. For further information about the MIL facility as of 31 December 2014, see Distribution of loans outstanding and guarantees by various types of security in Note 8.
The Bank’s lending transactions are recognised in the statement of financial position at the time the funds are transferred to the borrower. Loans are recognised initially at historical cost, which corresponds to the fair value of the transferred funds, including transaction costs. Loans outstanding are carried at amortised cost. If the loans are hedged against changes in fair value by using derivative instruments, they are recognised in the statement of financial position at fair value, with value changes recognised in the statement of comprehensive income. Changes in fair value are mainly caused by changes in market interest rates.
Impairment of loans and receivables
Impairment of individually assessed loans
The Bank reviews its problem loans and receivables on each reporting date to assess whether an allowance for impairment should be recorded in the statement of comprehensive income. In particular, the judgement of the management is required in estimating the amount and timing of future cash flows when determining the level of allowance required. Such estimates are based on assumptions about a number of factors, and actual results may differ, resulting in future changes to the allowance.
Receivables are carried at their estimated recoverable amount. Where the collectability of identified loans is in doubt, specific impairment losses are recognised in the statement of comprehensive income. Impairment is defined as the difference between the carrying value of the asset and the net present value of expected future cash flows, determined using the instrument’s original effective interest rate, where applicable. If the carrying amount of the loan is higher than the net present value of the estimated future cash flows, including the fair value of the collaterals, the loan is impaired.
For issued guarantees, the impairment is recognised when it is both probable that the guarantee will need to be settled and the settlement amount can be reliably estimated.
In the event that payments in respect of an ordinary loan are more than 90 days overdue, all of the borrower’s loans are deemed to be non-performing, and consequently the need for impairment is assessed and recognised.
In the event that payments in respect of a PIL loan to a government or guaranteed by a government are more than 180 days overdue, all of the borrower’s loans are deemed to be non-performing.
Whenever payments in respect of a PIL loan that is not to a government or guaranteed by a government are more than 90 days overdue, all of the borrower’s loans are deemed to be non-performing. Impairment losses are then recognised in respect of the part of the outstanding loan principal, interest, and fees that correspond to the Bank’s own risk for this loan facility at any given point in time.
Whenever payments in respect of a MIL loan that is not to a government or guaranteed by a government are more than 90 days overdue, or payments in respect of a MIL loan to a government or guaranteed by a government are more than 180 days overdue, all of the borrower’s loans are deemed to be non-performing. Due to the Bank’s member countries’ guarantees, no impairment losses are recognised for MIL loans.
16
Impairment of collectively assessed loans
Loans that are not individually impaired will be transferred to a group of loans with similar risk characteristics for a collective impairment test.
The Bank assesses the need to make a collective impairment test on exposures which, although not specifically identified as requiring a specific allowance, have a greater risk of default than when originally granted. This collective impairment test is based on any deterioration in the internal rating of the groups of loans or investments from the time they were granted or acquired. These internal ratings take into consideration factors such as any deterioration in counterparty risk, the value of collaterals or securities received, and the outlook for the sector, as well as identified structural weaknesses or deterioration in cash flows.
The process includes management’s judgement based on the current macroeconomic environment and the current view of the expected economic outlook. In the Bank’s view, the assumptions and estimates made represent an appropriate level of conservatism and are reflective of the predicted economic conditions, the Bank’s portfolio characteristics and their correlation with losses incurred based on historical loss experience. The impairment remains related to the group of loans until the losses have been identified on an individual basis.
Intangible assets
Intangible assets mainly consist of investments in software, software licences and ongoing investments in new ICT systems. The investments are carried at historical cost, and are amortised over the assessed useful life of the assets, which is estimated to be between three and five years. The amortisations are made on a straight-line basis.
Tangible assets
Tangible assets in the statement of financial position include land, buildings, office equipment, and other tangible assets owned by the Bank. The assets are recognised at historical cost, less any accumulated depreciation based on their assessed useful life. No depreciations are made for land. The Bank’s office building in Helsinki is depreciated on a straight-line basis over a 40-year period. The Bank’s other buildings are depreciated over a 30-year period. The depreciation period for office equipment and other tangible assets is determined by assessing the individual item. The depreciation period is usually three to five years. The depreciations are calculated on a straight-line basis.
Write-downs and impairment of intangible and tangible assets
The Bank’s assets are reviewed annually for impairment. If there is any objective evidence of impairment, the impairment loss is determined based on the recoverable amount of the assets.
Derivative instruments and hedge accounting
The Bank’s derivative instruments are recognised on a trade-date basis at fair value in the statement of financial position as “Other assets” or “Other liabilities”.
During the time the Bank holds a derivative instrument, any changes in the fair value of such an instrument are recognised in the statement of comprehensive income, or directly in “Equity” as part of the item “Other value adjustments”, depending on the purpose for which the instruments were acquired. The value changes of derivative instruments that were not acquired for hedging purposes are recognised in the statement of comprehensive income. The accounting treatment for derivative instruments that were acquired for hedging purposes depends on whether the hedging operation was in respect of cash flow or fair value.
17
At the time the IAS 39 standard concerning hedge accounting was adopted, the Bank had a portfolio of floating rate assets which had been converted to fixed rates using derivative contracts (swaps). This portfolio was designated as a cash flow hedge, but this specific type of hedging is no longer used for new transactions. In general, the Bank does not have an ongoing programme for entering into cash flow hedging, although it may choose to do so at any time.
When hedging future cash flows, the change in fair value of the effective portion of the hedging instrument is recognised directly in “Equity” as part of the item “Other value adjustments” until the maturity of the instrument. At maturity, the amount accumulated in “Equity” is included in the statement of comprehensive income in the same period or periods during which the hedged item affects the statement of comprehensive income.
In order to protect NIB from market risks that arise as an inherent part of its borrowing and lending activities, the Bank enters into swap transactions. The net effect of the swap hedging is to convert the borrowing and lending transactions to floating rates. This hedging activity is an integral part of the Bank’s business process and is a fair value hedge.
When hedging the fair value of a financial asset or liability, the derivative instrument’s change in fair value is recognised in the statement of comprehensive income together with the hedged item’s change in fair value in “Net profit on financial operations”.
Sometimes a derivative may be a component of a hybrid financial instrument that includes both the derivative and a host contract. Such embedded derivative instruments are part of a structured financing transaction that is hedged against changes in fair value by means of matching swap contracts. In such cases, both the hedged borrowing transaction and the hedging derivative instrument are recognised at fair value with changes in fair value in the statement of comprehensive income.
The hedge accounting is based on a clearly documented relationship between the item hedged and the hedging instrument. When there is a high (negative) correlation between the hedging instrument on the one hand and the value change of the hedged item or the cash flows generated by the hedged item on the other, the hedge is regarded as effective. The hedging relationship is documented at the time the hedge transaction is entered into, and the effectiveness of the hedge is continually assessed.
Borrowing
The Bank’s borrowing transactions are recognised in the statement of financial position at the time the funds are transferred to the Bank. The borrowing transactions are recognised initially at a cost that comprises the fair value of the funds transferred, less transaction costs. The Bank uses derivative instruments to hedge the fair value of virtually all its borrowing transactions. In these instances, the borrowing transaction is subsequently recognised in the statement of financial position at fair value, with any changes in value recognised in the statement of comprehensive income.
Securities delivered under repurchase agreements are not derecognised from the statement of financial position. Cash received under repurchase agreements is recognised in the statement of financial position as “Amounts owed to credit institutions”.
Equity
As of 31 December 2014, the Bank’s authorised and subscribed capital is EUR 6,141.9 million, of which the paid-in portion is EUR 418.6 million. Payment of the subscribed, non-paid-in portion of the authorised capital, i.e. the callable capital, will take place at the request of the Bank’s Board of Directors to the extent that the Board deems it necessary for the fulfilment of the Bank’s debt obligations.
The Bank’s reserves have been built up by means of appropriations from the profits of previous accounting periods, and consist of the Statutory Reserve, as well as the General Credit Risk Fund and the Special Credit Risk Fund for PIL.
The Bank’s profits, after allocation to appropriate credit risk funds, are transferred to the Statutory Reserve until it amounts to 10% of NIB’s subscribed authorised capital. Thereafter, the Board of Governors, upon a proposal by the Bank’s Board of Directors, decides upon the allocation of the profits between the reserve fund and dividends on the subscribed capital.
The General Credit Risk Fund is designed to cover unidentified exceptional risks in the Bank’s operations. Allocations to the Special Credit Risk Fund for PIL are made primarily to cover the Bank’s own risk in respect of credit losses on PIL loans.
18
Interest
The Bank’s net interest income includes accrued interest on loans, debt securities, placements and accruals of the premium or discount value of financial instruments. Net interest income also includes interest expenses on debts, swap fees and borrowing costs.
Fees and commissions
Fees collected when disbursing loans are recognised as income at the time of the disbursement, which means that fees and commissions are recognised as income at the same time as the costs are incurred. Commitment fees are charged on loans that are agreed but not yet disbursed, and are accrued in the statement of comprehensive income over the commitment period.
Annually recurrent costs arising as a result of the Bank’s borrowing, investment and payment transactions are recognised under the item “Commission expense and fees paid”.
Financial transactions
The Bank recognises in “Net profit on financial operations” both realised and unrealised gains and losses on debt securities and other financial instruments. Adjustments for hedge accounting are included.
Administrative expenses
The Bank provides services to its related parties, the Nordic Development Fund (NDF) and the Nordic Environment Finance Corporation (NEFCO). Payments received by the Bank for providing services at cost to these organisations are recognised as a reduction in the Bank’s administrative expenses. NIB receives a host country reimbursement from the Finnish Government equal to the tax withheld from the salaries of NIB’s employees. This payment reduces the Bank’s administrative expenses, as shown in Note 5.
Leasing agreements
Leasing agreements are classified as operating leases if the rewards and risks incident to ownership of the leased asset, in all major respects, lie with the lessor. Lease payments under operating leases are recognised on a straight-line basis over the lease term. The Bank’s rental agreements are classified as operating leases.
Employee pensions and insurance
The Bank is responsible for arranging pension security for its employees. In accordance with the Host Country Agreement between the Bank and the Finnish Government and as part of the Bank’s pension arrangements, the Bank has decided to apply the Finnish state pension system. Contributions to this pension system, which are paid into the Finnish State Pension Fund, are calculated as a percentage of salaries. The Finnish Ministry of Finance determines the basis for the contributions and establishes the actual percentage of the contributions according to a proposal from the local government pensions institution Keva. See Note 5.
NIB also provides its permanent employees with a supplementary pension insurance scheme arranged by a private pension insurance company. This is group pension insurance based on a defined contribution plan. The Bank’s pension liability is completely covered.
In addition to the applicable local social security systems, NIB has taken out, for example, comprehensive accident, life, medical and disability insurance policies for its employees in the form of group insurance.
19
Segment information
Segment information and currency distribution in the notes are presented in nominal amounts. The adjustment to hedge accounting is presented as a separate item (except for Note 1, the primary reporting segment).
Reclassifications
In addition to the reclassifications under financial placements, some other minor reclassifications have been made. The comparative figures have been adjusted accordingly.
International financial reporting standards and interpretations
New and amended standards applied in the financial year 2014
Since 1 January 2014, NIB has applied the following new and amended standards that have come into effect. These had no significant impact on the financial statements for the financial year 2014.
| | ¡ | | Amendments to IAS 32 Financial Instruments: Presentation (effective for financial years beginning on or after 1 January 2014): The amendments provide clarifications on the application of presentation requirements for offsetting financial assets and financial liabilities on the statement of financial position and give more related application guidance. The amendments had no significant impact on NIB’s financial statements. |
| | ¡ | | Amendments to IAS 36 Impairment of Assets (effective for financial years beginning on or after 1 January 2014): The objective of the amendments is to clarify that the scope of the disclosures of information about the recoverable amount of assets, where that amount is based on fair value less costs of disposal, is limited to impaired assets. The amended standard had no significant impact on NIB’s financial statements. |
| | ¡ | | Amendments to IAS 39 Financial Instruments: Recognition and Measurement (effective for financial years beginning on or after 1 January 2014): The amendments made to IAS 39 provide an exception to the requirement to discontinue hedge accounting in certain circumstances where a derivative, which has been designated as a hedging instrument, is novated from one counterparty to a central counterparty as a consequence of laws or regulations. The amendments had no impact on NIB’s financial statements. |
Adoption of new and amended standards and interpretations applicable in future financial years
NIB has not yet adopted the following new and amended standards and interpretations already issued by the IASB. NIB will adopt them as of the effective date or, if the date is other than the first day of the financial year, from the beginning of the subsequent financial year.
| | ¡ | | Amendment to IAS 1 Presentation of Financial Statements: Disclosure Initiative (effective for financial years beginning on or after 1 January 2016). The amendments are designed to encourage companies to apply judgement in determining what information to disclose in the financial statements. For example, the amendments clarify the application of the materiality concept and judgement when determining where and in what order information is presented in the financial disclosures. The interpretation has no significant impact on NIB’s financial statements. |
| | ¡ | | New IFRS 9 Financial Instruments (effective for financial years beginning on or after 1 January 2018): IFRS 9 replaces the existing guidance in IAS 39 Financial Instruments: Recognition and Measurement. IFRS 9 includes revised guidance on the classification and measurement of financial instruments, including a new expected credit loss model for calculating impairment on financial assets, and the new general hedge accounting requirements. It also carries forward the guidance on recognition and derecognition of financial instruments from IAS 39. NIB is assessing the impact of IFRS 9. |
| | ¡ | | Amendments to IAS 16 Property, Plant and Equipment and IAS 38 Intangible Assets — Clarification of Acceptable Methods of Depreciation and Amortisation (effective for financial years beginning on or after 1 January 2016): The amendments clarify IAS 16 and IAS 38 in that the revenue-based method cannot be used to depreciate property, plant and equipment and may only be used in limited circumstances to amortise intangible assets. The amendments will have no impact on NIB’s financial statements. |
20
| | ¡ | | Annual Improvements to IFRSs (2011-2013 cycle and 2010-2012 cycle, December 2013) (effective for financial years beginning on or after 1 July 2014): The annual improvements process provides a mechanism for minor and non-urgent amendments to IFRSs to be grouped together and issued in one annual package. These amendments cover in total four (2011-2013 cycle) and seven (2010-2012 cycle) standards. Their impacts vary standard by standard but are not significant. |
| | ¡ | | Annual Improvements to IFRSs, (2012-2014 cycle) (effective for financial years beginning on or after 1 January 2016): The annual improvements process provides a mechanism for minor and non-urgent amendments to IFRSs to be grouped together and issued in one package annually. These amendments cover four standards. Their impacts vary standard by standard but are not significant. |
21
RISK MANAGEMENT
The Bank assumes a conservative approach to risk-taking. Its constituent documents require that loans be granted in accordance with sound banking principles, that adequate security be obtained for the loans and that the Bank protect itself against the risk of exchange rate losses. The Bank’s risk tolerance is defined by a set of policies, guidelines and limits taking into account the objective of maintaining strong credit quality, stable earnings and a level of capital and liquidity required to maintain the Bank’s AAA/Aaa rating.
The main risks—credit risk, market risk, liquidity risk and operational risk— are managed carefully with risk management closely integrated into the Bank’s business processes. As an international financial institution, the Bank is not subject to national or international banking regulations. However, the Bank’s risk management systems and processes are reviewed on an ongoing basis and adapted to changing conditions with the aim of complying in substance with what the Bank identifies as the relevant market standards and best practices, including the recommendations of the Basel Committee on Banking Supervision.
Key risk responsibilities
The Board of Directors lays down the general framework for the Bank’s risk management by approving its financial policies and guidelines, including maximum limits for exposure to the main types of risk. Credit approval is primarily the responsibility of the Board of Directors. The Board annually grants authorisation to the Bank to raise funds in the capital markets based on its estimated funding requirements.
The President is responsible for managing the risk profile of the Bank within the framework set by the Board of Directors, and for ensuring that the Bank’s aggregate risk is consistent with its financial resources. The Board of Directors has delegated some credit approval authority to the President for execution in the Credit Committee.
The following committees assist and advise the President:
The Executive Committee consists of the President and senior officers, whose appointment to the committee has been confirmed by the Board of Directors. The committee is the forum for addressing policy and management issues, including following up the financial results, business plan and strategy of the Bank. The committee meets approximately twice a month.
The Credit Committee consists of the President and senior officers appointed by the Board of Directors. The committee is responsible for preparing and making decisions on credit matters related to lending operations and for decisions on treasury counterparties. Among other things, the committee reviews all credit proposals before they are submitted to the Board of Directors for approval. The committee usually meets weekly.
The Finance Committee consists of the President, the Head of Treasury and the Head of Risk and Finance. The committee is responsible for preparing and making decisions on matters related to treasury operations. The committee makes recommendations, and where appropriate, decisions in the area of market, counterparty and liquidity risk exposure. It also monitors the Bank’s borrowing activities and has oversight of treasury risk reporting to the Board of Directors. The committee usually meets monthly.
The Asset and Liability Committee (ALCO) consists of the members of the Executive Committee and the Chief Risk Officer. Together with the Executive Committee, it has overall responsibility for the Bank’s risk management. ALCO’s duties include monitoring the Bank’s balance sheet development and capital adequacy, setting targets and limits for risk to be managed at the bank level, reviewing liquidity risk management and funding structure, as well as monitoring performance against the agreed risk appetite. The committee meets approximately six times a year.
The ICT Council assists and advises the President in information and communications technology matters, and functions as a steering committee for ICT development projects. The President, however, makes his decisions on ICT matters in the Executive Committee. The ICT Council consists of the Head of ICT and of other senior staff members.
The Bank has established a segregation of duties between units that enter into business transactions with customers or otherwise expose the Bank to risk, and units in charge of risk assessment, risk measurement and control. The business units, Lending and Treasury, are responsible for the day-to-day management of all risks assumed through their operations and for ensuring that an adequate return is achieved for the risks taken. These duties are carried out in accordance with guidelines, instructions and limits set for their respective activities.
22
Risk and Finance, Credit and Analysis, Legal and Compliance and Internal Audit are independent from the departments carrying out the Bank’s business activities.
The Risk Management unit within Risk and Finance has overall responsibility for measuring, monitoring and reporting on risks across risk types and organisational units. The unit is responsible for the Bank’s risk models and tools and the day-to-day monitoring of market, liquidity and operational risks. The assessment of risk related to new instruments is carried out in the New Product and Structure Committee chaired by a representative from Risk and Finance. The Head of Risk and Finance reports to the President.
Credit and Analysis is responsible for assessing and monitoring credit risk in the Bank’s lending and treasury operations and for overseeing that credit proposals are in compliance with established limits and policies. The unit also manages transactions requiring particular attention due to restructuring work-out and recovery processing. The Head of Credit and Analysis reports to the President.
The Legal department carries the responsibility for minimising and mitigating legal risks in the Bank’s activities. The General Counsel reports to the President.
The Compliance function assists the Bank in identifying, assessing, monitoring and reporting on compliance risks in matters relating to the institution, its operations and the personal conduct of staff members. The Chief Compliance Officer reports to the President, with full and unlimited access to the Chairman of the Board of Directors and the Chairman of the Control Committee.
Internal Audit provides an independent evaluation of the controls, risk management and governance processes. The Head of Internal Audit reports to the Board of Directors and the Control Committee.
The Control Committee is the Bank’s supervisory body. It ensures that the operations of the Bank are conducted in accordance with the Statutes. The committee is responsible for the audit of the Bank and submits its annual audit report to the Board of Governors.
Credit risk
Credit risk is the Bank’s main financial risk. Credit risk is the risk that the Bank’s borrowers and other counterparties fail to fulfil their contractual obligations and that any collateral held does not cover the Bank’s claims. Following from NIB’s mandate and financial structure, most of the credit risk stems from lending operations. The Bank is also exposed to credit risk in its treasury activities, where credit risk derives from the financial assets, such as fixed-income securities and interbank deposits, that the Bank uses for investing its liquidity, and from derivative instruments used for managing currency and interest rate risks and other market risks related to structured funding transactions.
Credit risk management
Credit risk policies and guidelines
The Bank’s credit policy sets the basic criteria for acceptable credit risk in lending operations. The policy defines the minimum credit quality levels for borrowers and guarantors and risk areas that require special attention. The credit enhancement policy requires that the Bank’s position in a transaction should rank at least equal to that of other senior lenders. The credit enhancement guidelines specify the types of security and contractual undertakings that the Bank deems acceptable to mitigate credit risk. Through a set of key clauses for the loan documentation, the Bank strives to ensure that it will receive early warning if the credit quality of a borrower deteriorates or if an event occurs that could have an adverse effect on a borrower’s ability to repay the loan.
For counterparties in the Bank’s treasury operations conservative eligibility criteria apply. Eligible counterparties are predominantly banks, financial institutions, governments and agencies with high credit ratings from the leading international credit rating agencies.
The Bank’s portfolio policy aims to ensure adequate diversification of credit risk across counterparties, countries and industry sectors.
23
Credit risk assessment
Credit and Analysis independently assesses the creditworthiness of borrowers and treasury counterparties. The assessment is qualitative and quantitative and based on internal rating methodologies supported by scoring models. The assessment results in a risk rating denoting the probability of default of the counterparty.
The credit enhancement in a transaction is assessed separately and a loss-given-default (LGD) is determined for the transaction as an estimate of the portion of the Bank’s claim that would not be recoverable if the counterparty defaults. The combination of the probability of default of the counterparty and the LGD quantifies the expected loss for the transaction. The Bank applies a rating scale ranging from 1 to 20, with class 1 representing the lowest probability of default and expected loss. In addition, the rating scale includes a class D for non-performing transactions or transactions for which specific impairment provisions have been made. The rating scale is mapped to the ratings of Standard & Poor’s and Moody’s such that classes 1 to 10 correspond to the external rating equivalent of the investment grade AAA to BBB- and Aaa to Baa3, respectively.
Credit risk limits
The primary source of credit risk is the individual counterparty, and the secondary source is the potential default correlation of groups of counterparties and sectors. Exposure limits are set at both counterparty and portfolio levels. Counterparty limits are determined based on the probability of default and expected loss. To prevent excessive concentrations, the Bank applies portfolio- level limits for large counterparty exposure, as well as for sector and country exposures. The Bank has not set limits for the aggregate lending exposure in its member countries. Lending in non-member countries is subject to country limits that are reviewed on a regular basis. Country limits also apply to the exposure in the Bank’s treasury operations.
The limits are scaled to the Bank’s equity, the counterparty’s equity, the size of the total credit exposure and the Bank’s economic capital. As a general principle, the Bank limits the maximum amount granted as loan or guarantee for a single project to 50% of the total project cost.
Credit risk monitoring
The Bank actively monitors the creditworthiness of the counterparties in its lending and treasury operations. The monitoring frequency is determined based on criteria including the ratings and the size and type of exposure. All counterparties undergo an annual review whereby any change in the risk profile is assessed and the risk rating affirmed or adjusted. In general, intensified follow-up applies to counterparties with internal ratings below the level eligible for new exposure or other defined levels. When serious deterioration of a counterparty’s debt repayment capacity and/or financial standing is identified, the counterparty is transferred to the watch list and placed under close monitoring with regular reporting to the Board of Directors.
Compliance with existing limits is monitored regularly, for treasury counterparties limit compliance is monitored on a daily basis.
Portfolio-level measurement and monitoring of credit risk is carried out within the Bank’s economic capital framework. Economic capital is the Bank’s estimate of the capital required to cover unexpected losses deriving from credit risk, market risk and operational risk. As the Bank is not subject to regulatory capital requirements, the economic capital is used for internal monitoring to ensure that the Bank has sufficient capital to fulfil its commitments. The portfolio approach provides a more comprehensive assessment of the Bank’s aggregate credit risk as it captures the impact of concentration and diversification in the Bank’s operations. A report on the Bank’s economic capital and risk profile is submitted to the Board of Directors every four months. The report includes an analysis of the capital required, the aggregate credit risk exposure, credit risk concentrations, changes in the risk profile and exposure against portfolio risk limits with any breaches of limits explained.
24
Derivatives
To fulfil its mission of providing long-term financing to eligible projects in the member countries, the Bank strives to obtain funding at the most favourable terms in the international capital markets. The Bank uses derivatives as part of its funding strategy in order to match the interest rate and currency characteristics of the funds raised with those of loans granted and to reduce funding costs. In liquidity management, derivatives are used to mitigate foreign exchange rate and interest rate risk. Derivative transactions take place under normal counterparty limits.
As a rule, NIB enters into International Swaps and Derivatives Association (ISDA) contracts with counterparties to which the Bank has derivative exposure. This allows the netting of the obligations arising under all of the derivative contracts covered by the ISDA agreement in case of insolvency and, thus, results in one single net claim on, or payable to, the counterparty. Netting is applied for the measurement of the Bank’s credit exposure only in cases when it is deemed to be legally enforceable in the relevant jurisdiction and against a counterparty. At year-end 2014, netting reduced the exposure by EUR 748 million from a gross total market value of EUR 2,376 million to EUR 1,628 million (year-end 2013: EUR 1,480 million and EUR 651 million, respectively).
The credit risk on swaps is further mitigated through credit support agreements with the Bank’s major swap counterparties. Under these agreements, swap exposures exceeding agreed thresholds are collateralised by cash or high-quality government securities. Both the swap portfolio with individual counterparties and the collateral received are regularly monitored and valued, with a subsequent call for additional collateral or release. At year-end 2014, the Bank held EUR 1,452 million (2013: EUR 601 million) in gross collateral received, of which EUR 818 million (2013: EUR 283 million) was in cash and EUR 634 million (2013: EUR 318 million) in securities (See Note 16, Collateral and Commitments).
Credit risk reserves, impairment methodology
The Bank maintains two credit risk funds within its equity, in addition to the Statutory Reserve. The General Credit Risk Fund is available to cover unexpected losses arising from the Bank’s lending and other business activities. At year-end 2014 the fund amounted to EUR 1,275 million before allocation of the profit for the year. The Statutes require that the Bank maintains the Special Credit Risk Fund for the Project Investment Loan (PIL) facility to cover the Bank’s own risk on such loans before resorting to the member countries’ guarantees that support the facility. At year-end 2014, the fund amounted to EUR 396 million.
At least every four months, the Bank reviews the possible need for impairment provisions on weak exposures. The assessment is carried out both at the level of the individual counterparty and collectively for groups of counterparties. At the counterparty level, a specific impairment provision is recognised if there is objective evidence that the counterparty’s capacity to fulfil its obligations has deteriorated to the extent that full repayment is unlikely, taking into consideration any collateral received. Collective impairment provisions are determined on a portfolio basis for exposures with similar credit risk characteristics as reflected in their risk ratings. The process includes the management’s judgement based on the current macroeconomic environment and the current view of the expected economic outlook. In the Bank’s view, the assumptions and estimates made represent an appropriate level of conservatism and are reflective of the predicted economic conditions, the Bank’s portfolio characteristics and their correlation with losses incurred based on historical loss experience. In the assessment of sovereign exposures, the Bank takes into account its preferred creditor status. The Bank’s principles for impairment provisioning are described in more detail in the section Significant accounting policies.
Credit risk exposure
Tables 1 to 3 below provide an overview of the Bank’s aggregate credit risk exposure at year-end 2014 distributed according to expected loss (EL) before collective impairment. Aggregate credit exposure comprises lending and treasury exposure. Lending exposure includes loans outstanding and loans agreed but not yet disbursed, without taking into account any collateral or other credit enhancement. Regarding the treasury exposure, capital market investments are included at nominal value, while derivatives are included at market value net of collateral held when credit support agreements are in place, and at market value with an add-on for potential future exposure when not under a credit support agreement. The exposure to collateralised placements is calculated as a fixed percentage of the market value of the collateral held.
25
TABLE 1. Credit risk exposure by internal rating based on expected loss (EL) (in EUR million)
| | | | | | | | | | | | | | | | | | | | | | | | | | |
| | | | | 31 Dec 2014 | | | 31 Dec 2013 | |
| Risk | | S&P | | | | | | | | | | | | | | | | | | |
class (EL) | | equivalent | | Lending | | | Treasury | | | Total | | | Lending | | | Treasury | | | Total | |
| 1-2 | | AAA/AA+ | | | 3,076 | | | | 3,806 | | | | 6,881 | | | | 2,417 | | | | 3,577 | | | | 5,994 | |
| 3–4 | | AA/AA- | | | 588 | | | | 1,714 | | | | 2,303 | | | | 831 | | | | 1,605 | | | | 2,436 | |
| 5–6 | | A+/A | | | 930 | | | | 1,019 | | | | 1,949 | | | | 1,307 | | | | 853 | | | | 2,160 | |
| 7–8 | | A-/BBB+ | | | 4,661 | | | | 44 | | | | 4,705 | | | | 4,398 | | | | 86 | | | | 4,484 | |
| 9–10 | | BBB/BBB- | | | 4,185 | | | | 23 | | | | 4,208 | | | | 4,099 | | | | 24 | | | | 4,123 | |
| 11–12 | | BB+/BB | | | 1,793 | | | | 0 | | | | 1,793 | | | | 1,899 | | | | 42 | | | | 1,941 | |
| 13–14 | | BB/BB- | | | 672 | | | | 0 | | | | 672 | | | | 606 | | | | 0 | | | | 606 | |
| 15–16 | | BB-/B+ | | | 30 | | | | 0 | | | | 30 | | | | 7 | | | | 20 | | | | 27 | |
| 17–18 | | B/B- | | | 142 | | | | 0 | | | | 142 | | | | 160 | | | | 0 | | | | 160 | |
| 19–20 | | B-/CCC | | | 22 | | | | 0 | | | | 22 | | | | 24 | | | | 0 | | | | 24 | |
| D | | | | | 59 | | | | 8 | | | | 67 | | | | 66 | | | | 8 | | | | 74 | |
TOTAL | | | | | 16,158 | | | | 6,613 | | | | 22,771 | | | | 15,813 | | | | 6,216 | | | | 22,029 | |
Class D | | | | | | | | | | | | | | | | | | | | | | | | | | |
| Gross | | | | | 186 | | | | 83 | | | | 269 | | | | 186 | | | | 83 | | | | 269 | |
| Impairment | | | | | 126 | | | | 75 | | | | 202 | | | | 120 | | | | 75 | | | | 195 | |
Net | | | | | 59 | | | | 8 | | | | 67 | | | | 66 | | | | 8 | | | | 74 | |
Overall, the quality of the Bank’s aggregate credit exposure remained sound and stable in 2014. Lending exposure increased by 2% and treasury exposure by 6%. At year-end 2014, 83% (2013: 83%) of lending exposure and practically 100% (2013: 99%) of treasury exposure was in risk classes 1-10, corresponding to investment-grade quality. Lending exposure in the best risk classes (EL 1-2) increased as a result of new lending and improved credit quality of some of the existing exposure. The exposure in the weakest risk classes (EL 17-20) was slightly reduced mainly due to a downgrading of one customer into class D.
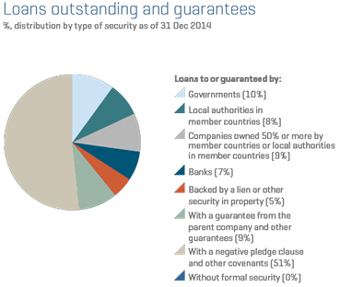
The distribution of the Bank’s portfolio of outstanding loans and guarantee commitments by type of credit enhancement at year-end 2014 was largely unchanged compared to the previous year. Further information is presented in Note 8.
26
TABLE 2. Geographical distribution of the credit risk exposure (in EUR million)
The geographical distribution of the aggregate credit risk exposure is shown in the table below. The distribution is based on the risk-owner’s country of domicile. “Risk-owner” refers to the entity ultimately responsible for the Bank’s claim. As such, if a guarantee is provided for the Bank’s loan, the guarantor may be considered the risk-owner if the guarantee meets certain conditions.
| | | | | | | | | | | | | | | | | | | | | | | | | | | | | | | | | | |
| | | 31 Dec 2014 | | | | | 31 Dec 2013 | |
| Country/Region | | | | | | | | | | | | | | | | | | | | | | | | | | | | |
| | Lending | | | | | Treasury | | | | | Total | | | | | Lending | | | | | Treasury | | | | | Total | |
| Denmark | | | 1,604 | | | | | | 314 | | | | | | 1,918 | | | | | | 1,524 | | | | | | 337 | | | | | | 1,861 | |
| Estonia | | | 238 | | | | | | 0 | | | | | | 238 | | | | | | 232 | | | | | | 0 | | | | | | 232 | |
| Finland | | | 3,380 | | | | | | 926 | | | | | | 4,306 | | | | | | 3,280 | | | | | | 695 | | | | | | 3,975 | |
| Iceland | | | 498 | | | | | | 3 | | | | | | 501 | | | | | | 471 | | | | | | 4 | | | | | | 475 | |
| Latvia | | | 339 | | | | | | 0 | | | | | | 339 | | | | | | 369 | | | | | | 0 | | | | | | 369 | |
| Lithuania | | | 548 | | | | | | 20 | | | | | | 568 | | | | | | 346 | | | | | | 20 | | | | | | 366 | |
| Norway | | | 2,818 | | | | | | 355 | | | | | | 3,173 | | | | | | 2,451 | | | | | | 323 | | | | | | 2,774 | |
| Sweden | | | 3,903 | | | | | | 691 | | | | | | 4,593 | | | | | | 3,904 | | | | | | 607 | | | | | | 4,511 | |
| Africa and Middle East | | | 240 | | | | | | 0 | | | | | | 240 | | | | | | 252 | | | | | | 0 | | | | | | 252 | |
| Americas | | | 265 | | | | | | 416 | | | | | | 681 | | | | | | 293 | | | | | | 253 | | | | | | 546 | |
| Asia-Pacific | | | 958 | | | | | | 50 | | | | | | 1,008 | | | | | | 1,147 | | | | | | 86 | | | | | | 1,233 | |
| Europe | | | 1,117 | | | | | | 3,332 | | | | | | 4,449 | | | | | | 1,339 | | | | | | 3,701 | | | | | | 5,040 | |
| Multilaterals | | | 252 | | | | | | 506 | | | | | | 758 | | | | | | 206 | | | | | | 190 | | | | | | 396 | |
TOTAL | | | 16,158 | | | | | | 6,613 | | | | | | 22,771 | | | | | | 15,813 | | | | | | 6,216 | | | | | | 22,029 | |
In the context of the Bank’s mission, the credit risk exposure continued to be fairly well balanced in terms of geographical distribution, with no significant change over the year. At year-end 2014, the member countries accounted for 82% of the Bank’s lending exposure (2013: 80%). The largest lending exposures outside the member countries were in Poland, China, Russia, India and Brazil. In aggregate the Bank’s exposure in Russia, Ukraine and Belarus amounted to EUR 402 million, of which EUR 77 million was agreed, not disbursed loans.
The treasury exposure was concentrated in the member countries with 35% (2013: 32%), and the rest of Europe with 50% (2013: 60%), dominated by Germany, the Netherlands and France. Multilateral institutions accounted for an increased share of the treasury exposure in 2014.
27
TABLE 3. Credit risk exposure by industry sector (in EUR million)
The distribution by sector of the credit risk exposure is based on the industry sector of the risk-owner. These sectors are different from the four business areas into which the Bank has organised its lending operations.
| | | | | | | | | | | | | | | | | | | | | | | | | | | | | | | | | | |
| | | 31 Dec 2014 | | | | | 31 Dec 2013 | |
Industry sector | | Lending | | | | | Treasury | | | | | Total | | | | | Lending | | | | | Treasury | | | | | Total | |
| Oil & gas | | | 371 | | | | | | 0 | | | | | | 371 | | | | | | 461 | | | | | | 0 | | | | | | 461 | |
| Materials | | | 1,271 | | | | | | 0 | | | | | | 1,271 | | | | | | 1,417 | | | | | | 0 | | | | | | 1,417 | |
| Industrials | | | 3,297 | | | | | | 0 | | | | | | 3,297 | | | | | | 3,209 | | | | | | 0 | | | | | | 3,209 | |
| Consumer discretionary | | | 443 | | | | | | 0 | | | | | | 443 | | | | | | 481 | | | | | | 0 | | | | | | 481 | |
| Consumer staples | | | 1,213 | | | | | | 0 | | | | | | 1,213 | | | | | | 1,127 | | | | | | 0 | | | | | | 1,127 | |
| Health care | | | 522 | | | | | | 0 | | | | | | 522 | | | | | | 396 | | | | | | 0 | | | | | | 396 | |
| Financials | | | 1,322 | | | | | | 3,398 | | | | | | 4,720 | | | | | | 1,278 | | | | | | 4,670 | | | | | | 5,948 | |
| Information technology | | | 162 | | | | | | 0 | | | | | | 162 | | | | | | 163 | | | | | | 0 | | | | | | 163 | |
| Telecommunication services | | | 466 | | | | | | 0 | | | | | | 466 | | | | | | 565 | | | | | | 0 | | | | | | 565 | |
| Utilities | | | 3,635 | | | | | | 0 | | | | | | 3,635 | | | | | | 3,491 | | | | | | 0 | | | | | | 3,491 | |
| Public sector | | | 3,458 | | | | | | 3,215 | | | | | | 6,673 | | | | | | 3,225 | | | | | | 1,546 | | | | | | 4,771 | |
TOTAL | | | 16,158 | | | | | | 6,613 | | | | | | 22,771 | | | | | | 15,813 | | | | | | 6,216 | | | | | | 22,029 | |
The distribution of the lending exposure by industry sector remained stable in 2014 compared to the previous year, with the public sector, utilities and industrials accounting for 64% (2013: 63%) of the total exposure. The shift in the treasury exposure towards the public sector primarily follows from a reclassification in connection with the Bank’s update of its industry sector classification in 2014. The development also reflects the increased exposure to multilateral institutions.
The Bank has defined limits for maximum exposure to single industry sectors both in relation to its economic capital requirement and to its total credit risk exposure. At year-end 2014, the Bank was in compliance with these limits.
TABLE 4. Largest counterparty exposures (% of total credit risk exposure)
A counterparty exposure is defined as the consolidated group exposure, i.e. individual counterparties that are linked to one another by ownership or other group affiliation are considered as one counterparty.
| | | | | | | | | | | | |
| | | | | 31 Dec 2014 | | | | | 31 Dec 2013 | |
| Top 5 | | | | | 9% | | | | | | 10% | |
| Top 10 | | | | | 16% | | | | | | 16% | |
| Top 20 | | | | | 26% | | | | | | 27% | |
The Bank’s limits for large single counterparty exposures and for the aggregate of such large exposures are scaled to its economic capital and equity. Any deviations from the set limits must be approved by the Board of Directors. At year-end 2014, the Bank was in compliance with the limits for large exposures.
Market risk
Market risk includes, among others, the risk that losses are incurred as a result of movements in foreign exchange rates, interest rates and credit spreads. NIB’s exposure to foreign exchange rate risk occurs when translating assets and liabilities denominated in foreign currencies into the Bank’s statutory currency, the euro. The Bank funds its operations by borrowing in the international capital markets and often provides loans in currencies other than those borrowed. The funds borrowed often have interest rate structures differing from those applied in the loans provided to the Bank’s customers. Moreover, risks arise from differences in the maturity profile of assets and liabilities. Refinancing risk occurs when long-term assets are financed with short-term liabilities, and reinvestment risk when short-term assets are financed with long-term liabilities. The Bank is exposed to credit spread risk relating to the securities held in its treasury portfolios. Credit spread risk arises from changes in the value of debt instruments due to a perceived change in the credit quality of the issuers or underlying assets.
28
Market risk management
The Bank’s market risk management is concentrated in Treasury, which provides Lending with funds that match the structure of the loans granted. Treasury uses derivatives to mitigate exposure to interest rate risk and foreign exchange rate risk resulting from mismatches between lending and the underlying borrowing. Any residual risk is kept to a minimum under limits set by the Board of Directors. The limits are low compared with the Bank’s capital and they are reviewed annually. Exposure to foreign exchange rate and interest rate risk, as well as credit spread risk, is measured and monitored daily to ensure compliance with authorised limits. The Board of Directors is informed of the Bank’s market risks at each regular board meeting.
Foreign exchange rate risk
The Statutes require that the Bank shall, to the extent practicable, protect itself against the risk of exchange rate losses. Exchange rate risk is measured on the basis of net open positions in each currency. Limits restricting overnight positions have been set to the equivalent of EUR 1 million for all currencies except USD, for which the limit is EUR 4 million. Furthermore, exposure to currencies other than USD and the Nordic currencies may not, in aggregate, exceed the equivalent of EUR 4 million, representing approximately 0.13% of the Bank’s equity.
The Bank does not hedge future net interest income in foreign currency. Loans are provided primarily in euro, US dollars and Nordic currencies. There is a possibility that interest income in currencies other than the euro may cause some fluctuation in the Bank’s future net income in euro terms. However, at present the Bank expects that any such potential fluctuations in future cash flows from its current portfolio would be minor in relation to its total assets and equity.
Interest rate risk
Interest rate risk is measured as basis point values (BPV) estimating the sensitivity of the Bank’s positions to a 0.01% parallel increase in the level of interest rates. The limits have been set to cover all interest rate sensitive cash flows. Most of the Bank’s interest rate risk derives from positions in the portfolio of liquid assets.
A gross limit equivalent to EUR 1.5 million covering all currencies restricts BPV interest rate risk to approximately 0.05% of the Bank’s equity. In addition, individual BPV limits have been set for interest rate risk in EUR, USD, GBP and the Nordic currencies, whereas a combined limit applies for all other currencies. At 31 December 2014, the gross exposure was EUR 0.99 million (2013: EUR 0.97 million). This means that an immediate parallel increase of 1% in interest rates would reduce the market value of the Bank’s portfolio of liquid assets by approximately EUR 99 million.
As a supplementary indicator of interest rate risk, the Bank estimates the worst-case effect of a 0.1% change in interest rates on its net interest income over the lifetime of interest-bearing assets and liabilities due to mismatches in terms of re-pricing periods and volumes. This is managed through a limit of EUR 34 million, corresponding to approximately 1.1% of the Bank’s equity. At year-end 2014, the exposure amounted to EUR 11.8 million (2013: EUR 12.4 million).
Value-at-Risk
Total market risk, incorporating both foreign exchange rate risk and interest rate risk, is measured with a Value-at-Risk (VaR) model. VaR indicates the potential loss (in terms of market value) that may arise from the Bank’s current positions due to movements in market rates over a specified period and for a given confidence level. The Bank applies a 95% confidence level and a holding period of one day.
The main contributor to the Bank’s market risk is the portfolio of euro-denominated assets corresponding to the size of the Bank’s capital. At year-end 2014, the VaR of this portfolio was EUR 1.6 million (2013: EUR 2.9 million). The average VaR over the year was EUR 2.7 million (2013: EUR 4.9 million), while the lowest and highest values were EUR 1.5 million and EUR 4.2 million, respectively (2013: EUR 2.6 million and EUR 10.5 million).
29
Credit spread risk
The Bank manages the exposure to credit spread movements by calculating the sensitivity of the positions to a 0.01% change in credit spreads. The limit for credit spread risk has been set at EUR 2,275 thousand or approximately 0.08% of the Bank’s equity.
As of 31 December 2014, the Bank’s exposure to credit spread risk was EUR 1.78 million (2013: EUR 1.65 million). This means that an increase of all debt-instrument-specific credit spreads by 1% as of that date would have reduced the value of the securities portfolio by approximately EUR 178 million.
Liquidity risk
Liquidity risk is defined as the risk of incurring losses due to an inability to meet payment obligations in a timely manner when they become due. The Bank categorises liquidity risk into funding liquidity risk, which occurs when payment obligations cannot be fulfilled because of an inability to obtain new funding, and market liquidity risk, which occurs when the Bank is unable to sell or transform assets in the liquidity buffer into cash without significant losses.
Liquidity risk management
The Bank’s business model gives rise to liquidity risk mainly through maturity mismatches between assets (loans and treasury investments) and liabilities (borrowing and equity). A revised liquidity policy was approved by the Board of Directors in 2014. The policy is regularly reviewed to ensure that it is aligned with the Bank’s business plan, economic and financial position and any significant changes affecting the Bank. The Board of Directors receives regular reports on the liquidity and funding situation of the Bank.
The key metric applied for managing liquidity risk is the survival horizon, which measures how long the Bank is able to fulfil its payment obligations in a severe stress scenario. The target survival horizon is twelve months, which means that the Bank is able to meet its payment obligations and continue its business operations without disruption for the coming twelve months under stressed conditions. The minimum requirement is that the survival horizon must at all times exceed nine months. The stress scenario includes, among others, the assumption of payment disruptions in the loan portfolio, no access to market funding, early termination of all callable funding transactions and severe decline of asset value in the liquidity buffer. At year-end 2014, the survival horizon was 456 days.
In addition, the Bank requires that the liquidity position should be strong enough to secure the highest possible issuer credit rating by S&P and Moody’s and fulfil the liquidity coverage ratio (LCR) and net stable funding ratio (NSFR) requirements as specified in the Capital Requirements Regulation of the European Union.
The Bank’s liquidity buffer comprises unencumbered cash, deposits and securities mainly denominated in EUR, USD and the Nordic currencies. In order to ensure that the market value and liquidity of the buffer is preserved during adverse market conditions, the Bank has set strict rules for the composition of the buffer. As such, the buffer must include a minimum level of High Quality Liquid Assets as defined in the EU capital requirement regulation and a minimum level of assets in the internal rating categories corresponding to at least AA- by S&P and Aa3 by Moody’s. Furthermore, the buffer must comprise a certain level of assets eligible as repo collateral in central banks. At present, the Bank does not have direct access to central bank repo facilities.
The maturity profile of the liquidity buffer is structured to fulfil the Bank’s requirement that the expected net cash outflow during the next three months must be covered by maturing investments in the liquidity buffer.
30
TABLE 5. Composition of the liquidity buffer as of 31 December 2014
| | | | | | | | |
| | | 31 Dec 2014 | |
| | | EUR million | | | % | |
| Cash and cash equivalents | | | 516 | | | | 7% | |
| Securities issued or guaranteed by sovereigns, public sector entities and supranational institutions | | | 3,383 | | | | 43% | |
| Covered bonds | | | 1,714 | | | | 22% | |
| Securities issued by financial institutions, excluding covered bonds | | | 955 | | | | 12% | |
| Securities received as collateral | | | 1,330 | | | | 17% | |
| TOTAL | | | 7,899 | | | | 100% | |
In order to manage funding liquidity risk, the Bank strives to diversify its borrowing in terms of currencies, maturities, instruments and investor types. Through regular benchmark issues, the Bank aims to secure broad market access. The annual funding plan is based on the projected twelve-month liquidity requirement and the projected size of the liquidity buffer. The funding plan is regularly adjusted to reflect changes in the liquidity requirement.
The following graph shows the maturity profile of liquid assets and the annual scheduled payments on loans outstanding compared to payments on the Bank’s funding. Payments on loans outstanding are shown until the contractual maturity of the loans. Repayment of funding is shown until the first possible early repayment date, and taking into account the cash flow from associated swaps. Short-term amounts owed to credit institutions predominantly comprise cash collateral received from swap counterparties.
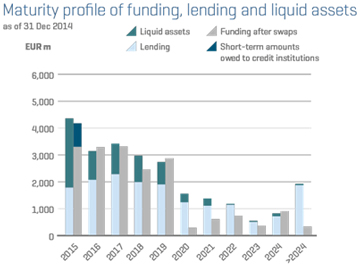
A breakdown of the Bank’s financial assets and liabilities by maturity at year-end 2014 is presented in Note 18.
The Bank has a contingency plan in place which defines the actions to be taken should the Bank encounter a liquidity shortfall in an emergency situation. The President decides on the activation of the contingency plan and subsequently informs the Board of Directors.
31
Operational risk
The Bank defines operational risk as the risk of direct or indirect losses or damaged reputation due to failure attributable to technology, employees, processes, procedures or physical arrangements, including external events and legal risks.
Operational risk management
The Bank’s status as an international organisation with immunities and privileges granted to the Bank and its personnel, and the fact that the Bank is neither bound by nor under the supervision of any national laws as such, results in a specific need to address potential risks by adopting an extensive set of guidelines, regulations, rules and instructions governing the activities of the Bank and its staff. The Bank’s operational risk management policy is set by the Board of Directors. The policy is complemented by an operational risk management framework comprising the guiding principles for the identification, assessment, monitoring and control of the operational risks that the Bank faces or may face.
NIB’s operational risk management focuses on proactive measures in order to ensure business continuity, the accuracy of information used internally and reported externally, the expertise and integrity of the Bank’s personnel and its adherence to established rules and procedures, as well as on security arrangements to protect the physical and ICT infrastructure of the Bank.
The day-to-day management of operational risk is performed across the organisation and is primarily the responsibility of each function. Emphasis is put on training the Bank’s personnel in risk awareness. In the risk and control self-assessment (RCSA) process, risks are identified and their impact assessed by the various functions for their respective fields of expertise. Focus is placed on identifying key risks and assessing the quality of risk detection and risk mitigation in order to ensure compliance with the Bank’s policies and guidelines. Operational risks are also identified through analysis of results obtained from the Bank’s incident reporting system. Key observations are reported to the management. The Bank strives to continuously build expertise in operational risk management concepts and tools.
32
(1) SEGMENT INFORMATION
Operating segments
The Bank determines and presents operating segments based on the information that is provided internally to the management. Segment results that are reported to the management include items directly attributable to that segment as well as other items allocated on a reasonable basis.
In its segment reporting, NIB divides its operations into two major segments: lending and treasury operations. Treasury operations consist of asset and liability management and portfolio management.
| | | | | | | | | | | | | | | | | | | | | | | | | | | | | | | | | | | | | | | | |
| | | Lending | | | Asset and
liability
manage- ment | | | Portfolio
management | | | Treasury
Total | | | Total | | | Lending | | | Asset and
liability
manage- ment | | | Portfolio
management | | | Treasury
Total | | | Total | |
(Amounts in EUR 1,000) | | | 2014 | | | | 2014 | | | | 2014 | | | | 2014 | | | | 2014 | | | | 2013 | | | | 2013 | | | | 2013 | | | | 2013 | | | | 2013 | |
Net interest income | | | 140,188 | | | | 28,123 | | | | 70,796 | | | | 98,920 | | | | 239,108 | | | | 136,301 | | | | 29,296 | | | | 78,606 | | | | 107,903 | | | | 244,204 | |
Commission income and fees received | | | 8,805 | | | | 106 | | | | 414 | | | | 520 | | | | 9,325 | | | | 9,101 | | | | 727 | | | | 370 | | | | 1,097 | | | | 10,199 | |
Commission expense and fees paid | | | -376 | | | | -701 | | | | -1,015 | | | | -1,716 | | | | -2,092 | | | | -535 | | | | -883 | | | | -1,036 | | | | -1,919 | | | | -2,454 | |
Net profit on financial operations | | | -379 | | | | -703 | | | | 26,766 | | | | 26,062 | | | | 25,684 | | | | 3,422 | | | | -603 | | | | 17,021 | | | | 16,418 | | | | 19,840 | |
Foreign exchange gains and losses | | | - | | | | 187 | | | | - | | | | 187 | | | | 187 | | | | - | | | | -384 | | | | - | | | | -384 | | | | -384 | |
Administrative expenses | | | -32,016 | | | | -2,027 | | | | -3,343 | | | | -5,369 | | | | -37,386 | | | | -30,279 | | | | -1,807 | | | | -3,131 | | | | -4,938 | | | | -35,217 | |
Depreciation | | | -2,422 | | | | -901 | | | | -386 | | | | -1,287 | | | | -3,709 | | | | -2,345 | | | | -873 | | | | -374 | | | | -1,247 | | | | -3,592 | |
Impairment of loans | | | -20,905 | | | | - | | | | - | | | | - | | | | -20,905 | | | | -15,385 | | | | - | | | | - | | | | - | | | | -15,385 | |
Profit/loss for the year | | | 92,895 | | | | 24,084 | | | | 93,232 | | | | 117,316 | | | | 210,211 | | | | 100,280 | | | | 25,473 | | | | 91,457 | | | | 116,930 | | | | 217,210 | |
Assets | | | 15,209,726 | | | | 6,772,439 | | | | 2,888,236 | | | | 9,660,675 | | | | 24,870,400 | | | | 14,720,857 | | | | 5,938,197 | | | | 2,830,887 | | | | 8,769,084 | | | | 23,489,941 | |
Liabilities and equity | | | 15,209,726 | | | | 6,772,439 | | | | 2,888,236 | | | | 9,660,675 | | | | 24,870,400 | | | | 14,720,857 | | | | 5,938,197 | | | | 2,830,887 | | | | 8,769,084 | | | | 23,489,941 | |
Due to rounding, the total of individual items may differ from the reported sum.
33
Geographical segments
The table below is based on the region where the borrowers reside, according to the domicile of the borrower’s group headquarters.
| | | | | | | | |
| (Amounts in EUR 1,000) | | 2014 Net interest
income | | | 2013 Net interest
income | |
| Member countries | | | | | | | | |
| Denmark | | | 13,286 | | | | 14,450 | |
| Estonia | | | 1,576 | | | | 1,412 | |
| Finland | | | 30,138 | | | | 26,997 | |
| Iceland | | | 4,855 | | | | 4,742 | |
| Latvia | | | 3,660 | | | | 3,820 | |
| Lithuania | | | 3,861 | | | | 2,534 | |
| Norway | | | 18,601 | | | | 16,844 | |
| Sweden | | | 32,258 | | | | 32,347 | |
| Total, member countries | | | 108,235 | | | | 103,148 | |
| | |
| Non-member countries | | | | | | | | |
| Africa | | | 1,859 | | | | 2,010 | |
| Asia | | | 11,007 | | | | 11,746 | |
| Europe and Eurasia | | | 13,330 | | | | 13,665 | |
| Latin America | | | 5,015 | | | | 4,985 | |
| Middle East | | | 743 | | | | 747 | |
| Total, non-member countries | | | 31,954 | | | | 33,153 | |
Total, net interest income from lending | | | 140,188 | | | | 136,301 | |
34
(2) INTEREST INCOME AND INTEREST EXPENSE
| | | | | | | | |
(Amounts in EUR 1,000) | | 2014 | | | 2013 | |
Interest income | | | | | | | | |
| Cash and cash equivalents | | | 4,448 | | | | 4,913 | |
| Debt securities | | | 90,897 | | | | 95,543 | |
| Loans outstanding | | | 286,167 | | | | 303,185 | |
| Other interest income | | | 1,248 | | | | 538 | |
Total, interest income1 Interest expense | | | 382,760 | | | | 404,179 | |
| Short-term amounts owed to credit institutions | | | -491 | | | | 185 | |
| Long-term amounts owed to credit institutions | | | - | | | | 3 | |
| Debts evidenced by certificates | | | 657,227 | | | | 717,089 | |
| Swap contracts and other interest expenses, net | | | -513,084 | | | | -557,301 | |
Total, interest expense2 | | | 143,652 | | | | 159,975 | |
| 1 | Including interest income from financial assets recognised at amortised cost EUR 347,084 (369,412) thousand. | |
| 2 | Including interest expense from financial liabilities recognised at amortised cost EUR 128,294 (142,965) thousand. | |
35
(3) COMMISSION INCOME AND FEES RECEIVED
| | | | | | | | |
(Amounts in EUR 1,000) | | 2014 | | | 2013 | |
| Commitment fees | | | 1,911 | | | | 2,906 | |
| Loan disbursement fees | | | 6,267 | | | | 5,543 | |
| Guarantee commissions | | | - | | | | - | |
| Premiums on prepayments of loans | | | 733 | | | | 1,379 | |
| Commissions on lending of securities | | | 414 | | | | 370 | |
Total, commission income and fees received | | | 9,326 | | | | 10,199 | |
36
(4) NET PROFIT/LOSS ON FINANCIAL OPERATIONS
Net profit/loss on financial operations included in profit or loss for the period in the table below is presented in the statement of comprehensive income as follows:
| | | | | | | | |
(Amounts in EUR 1,000) | | 2014 | | | 2013 | |
Bonds held at fair value, realised gains and losses | | | 7,942 | | | | 3,123 | |
Floating-rate notes held at fair value, realised gains and losses | | | -3,525 | | | | 3,297 | |
Derivatives held at fair value, realised gains and losses | | | -5,361 | | | | -2,757 | |
Other financial placements held at fair value, realised gains and losses | | | 15 | | | | 13 | |
Financial instruments held at fair value, realised gains and losses, total | | | -929 | | | | 3,676 | |
Bonds held at fair value, unrealised gains and losses 1 | | | 23,938 | | | | -15,114 | |
Floating-rate notes held at fair value, unrealised gains and losses 3 | | | 24,423 | | | | 11,281 | |
Derivatives held at fair value, unrealised gains and losses 2 | | | -19,965 | | | | 11,813 | |
Commercial paper held at fair value, unrealised gains and losses 1 | | | 12 | | | | -125 | |
Other financial placements held at fair value, unrealised gains and losses 4 | | | -1,433 | | | | 3,409 | |
| Financial instruments held at fair value, unrealised gains and losses, total | | | 26,974 | | | | 11,265 | |
Bonds held at amortised cost, realised gains and losses 5 | | | 431 | | | | 4,684 | |
Floating-rate notes held at amortised cost, realised gains and losses 5 | | | -645 | | | | -3,363 | |
| Financial instruments held at amortised cost, realised gains and losses, total | | | -214 | | | | 1,321 | |
Adjustment in fair value of hedged loans 2 | | | 157,777 | | | | -138,482 | |
Adjustment in fair value of derivatives hedging loans 2 | | | -158,531 | | | | 138,138 | |
Adjustment in fair value of hedged debts evidenced by certificates 2 | | | -422,739 | | | | 606,330 | |
Adjustment in fair value of derivatives hedging debts evidenced by certificates 2 | | | 422,474 | | | | -603,692 | |
| Adjustment to hedge accounting, unrealised gains and losses of fair value hedges, total | | | -1,019 | | | | 2,294 | |
Repurchase of NIB bonds, other items | | | 871 | | | | 1,284 | |
| Total, net profit/loss on financial operations | | | 25,684 | | | | 19,840 | |
| 1 | Fair value is determined according to market quotes for identical instruments (Level 1). | |
| 2 | Fair value adjustment is determined using valuation techniques with observable market inputs (Level 2). | |
| 3 | The fair value adjustments are mainly determined using market quotes for identical instruments (Level 1). The fair value measurements of treasury claims have been determined using valuation techniques with unobservable market inputs (Level 3). | |
| 4 | Fair value is determined using valuation techniques with unobservable market inputs (Level 3). | |
| 5 | These sales were made as these financial assets no longer met NIB’s investment policy. | |
37
(5) GENERAL ADMINISTRATIVE EXPENSES
| | | | | | | | |
(Amounts in EUR 1,000) | | 2014 | | | 2013 | |
Staff costs | | | 27,369 | | | | 25,617 | |
Wages and salaries | | | 22,204 | | | | 20,771 | |
Social security costs | | | 518 | | | | 457 | |
Other staff costs | | | 4,647 | | | | 4,389 | |
Pension premiums in accordance with the Finnish state pension system | | | 5,895 | | | | 5,425 | |
Other pension premiums | | | 1,796 | | | | 1,459 | |
Office premises costs | | | 1,161 | | | | 1,279 | |
ICT service charges | | | 3,238 | | | | 2,714 | |
Other general administrative expenses | | | 6,996 | | | | 7,444 | |
Cost coverage, NDF and NEFCO | | | -1,057 | | | | -986 | |
Cost coverage, rental income and other administrative income | | | -444 | | | | -699 | |
Total | | | 44,956 | | | | 42,255 | |
| | |
Host country reimbursement according to agreement with the Finnish Government | | | -7,570 | | | | -7,038 | |
Net | | | 37,386 | | | | 35,217 | |
| | |
Remuneration to the auditors | | | | | | | | |
Audit fee 1 | | | 119 | | | | 103 | |
Other audit-related service fees | | | 78 | | | | 1 | |
Total remuneration | | | 197 | | | | 104 | |
| 1 | The cost of issuing comfort letters and certificates in relation to the borrowing operations of the Bank is included in the audit fee. | |
Number of employees in permanent positions 1
| | | | | | | | |
| | | 2014 | | | 2013 | |
Average number of employees | | | 186 | | | | 183 | |
Average age of employees | | | 46 | | | | 46 | |
Average period (years) of employment | | | 11 | | | | 11 | |
| | |
Distribution by gender as of 31 Dec 2014 1 | | | | | | | | |
All employees | | | 188 | | | | 185 | |
Female | | | 82 | | | | 82 | |
Male | | | 106 | | | | 103 | |
Executive Committee (including the President) | | | | | | | | |
Female | | | 1 | | | | 1 | |
Male | | | 5 | | | | 6 | |
Professional staff | | | | | | | | |
Female | | | 60 | | | | 60 | |
Male | | | 92 | | | | 88 | |
Clerical staff | | | | | | | | |
Female | | | 21 | | | | 21 | |
Male | | | 9 | | | | 9 | |
| 1 | The figures comprise staff in permanent positions including the President. | |
38
Compensation for the Board of Directors, the Control Committee, the President and the Executive Committee
Compensation for the Board of Directors (BoD) and the Control Committee (CC) is set by the Board of Governors (BoG). The compensation consists of fixed annual remuneration and an attendee allowance. The members of the BoD and the CC are also entitled to reimbursement of travel and accommodation expenses and a daily allowance in accordance with the Bank’s travel policy.
The BoD decides on the appointment and remuneration of the President. As a rule, the President is appointed on a fixed-term contract for five years at a time, but the existing contract can also be prolonged for a shorter period. The President decides upon the employment of the Executive Committee (ExCo) members. The members of the ExCo are normally employed for an indefinite period of time. The period of notice is six months. The President is authorised by the BoD to make decisions regarding compensation within the scope of the Staff Policy, Staff Regulations and the Financial Plan. The remuneration package for the members of the ExCo includes a fixed base salary and customary taxable benefits, which are in principle the same for all staff at the managerial level. In addition to this remuneration package, the members of the ExCo enjoy other benefits common to all staff (e.g. health care, supplementary group pension, insurance coverage and staff loans). The Bank can pay performance premiums of up to three months’ salary for excellent and extraordinary performance. The maximum cost for the Bank of performance premiums is a total of 3% of the estimated salary costs.
Compensation for the BoD, the CC, the President and the ExCo is presented in the table below:
| | | | | | | | |
| (Amounts in EUR) | | 2014 Compensation/ Taxable income | | | 2013 Compensation/ Taxable income | |
Board of Directors | | | | | | | | |
Chairman | | | | | | | | |
annual remuneration | | | 13,258 | | | | 13,258 | |
attendee allowance | | | 1,720 | | | | 1,505 | |
Other Directors and Alternates (15 persons) | | | | | | | | |
annual remuneration | | | 76,244 | | | | 76,242 | |
attendee allowance | | | 13,968 | | | | 13,536 | |
Control Committee | | | | | | | | |
Chairman | | | | | | | | |
annual remuneration | | | 3,646 1 | | | | 4,375 | |
attendee allowance | | | 430 | | | | 430 | |
Other members (9 persons) | | | | | | | | |
annual remuneration | | | 15,305 | | | | 16,272 | |
attendee allowance | | | 3,312 | | | | 3,456 | |
President | | | 661,7802 | | | | 600,763 | |
Members of the Executive Committee (6 persons) 3 | | | 2,389,4254 | | | | 2,047,238 | |
| 1 | No chairman 1 Nov - 31 Dec 2014 | |
| 2 | Includes performance premium for 2013 | |
| 3 | 5 persons as of 1 Oct 2014 | |
| 4 | Includes additional costs due to organisational changes | |
39
Pension obligations
NIB is responsible for arranging pension security for its employees. The current pension arrangement consists of pensions based on the Finnish state pension system (VaEL Pension) as the basis for the pension benefits. The VaEL Pension is calculated on the basis of the employee’s annual pensionable income and the applicable age-linked pension accrual rate. The employer’s pension contribution in 2014 was 18.78% of the pensionable income. The employee’s pension contribution was either 5.55% or 7.05%, depending on the employee’s age. NIB pays this contribution for the permanent staff and it is taxed as a benefit for the employee.
In addition to the VaEL Pension, the Bank has taken out a supplementary group pension insurance policy for all its permanently employed staff, including the President. This pension insurance is based on the principle of a defined contribution. The insurance premium, 6.5%, is calculated on the basis of the employee’s taxable income and paid until the age of 63.
The employer’s pension contribution regarding the President amounted to EUR 208,419 of which EUR 37,481 comprised supplementary pension premiums. The corresponding figures for the ExCo members were EUR 774,706 and EUR 225,293.
Staff loans
Staff loans can be granted to permanently employed staff members who have been employed by the Bank for a period of at least one year. The staff loans are granted by a commercial bank, subject to a recommendation from NIB.
At present, the maximum loan amount is EUR 200,000. The employee pays interest on the loan in accordance with the official base rate established by the Ministry of Finance in Finland (0.5% in July–December 2014). The same interest rates, terms and conditions are applicable to all the employees of the Bank, including the President and the ExCo members.
As of 31 December 2014, there were no (-) outstanding staff loans to the President or the ExCo members.
Additional benefits for expatriates
Professional staff (including Executive Committee members) who move to Finland for the sole purpose of taking up employment at the Bank are entitled to certain expatriate benefits, such as an expatriate allowance and a spouse/family allowance. In addition, NIB assists the expatriate e.g. in finding accommodation, usually by renting a house or a flat in its own name. The staff member reimburses the Bank a part of the rent, which is equal to at least the taxable value of the accommodation benefit established annually by the Finnish National Board of Taxes.
Rental agreement
NIB owns its headquarters office building in Helsinki. The building’s total area is 18,500 m2. The Bank rents office space totalling 2,028 m2 adjacent to its main office building. A total of 2,402 m2 is rented to external parties. Furthermore, in 2014 the Bank rented office space totalling 162 m2 in Beijing and Moscow.
40
(6) IMPAIRMENT OF LOANS
| | | | | | | | |
(Amounts in EUR 1,000) | | 2014 | | | 2013 | |
Credit losses from loans | | | 70 | | | | - | |
Credit losses on receivables from defaulted lending counterparties | | | - | | | | 19,988 | |
Allowances for impairment net change, individually assessed | | | 2,171 | | | | 18,034 | |
Allowances for impairment net change, collectively assessed | | | 18,665 | | | | -3,210 | |
Reversals of previously recorded allowances for credit losses | | | - | | | | -19,428 | |
Impairment of loans and other assets | | | 20,905 | | | | 15,385 | |
See also Note 8.
41
(7) FINANCIAL PLACEMENTS
The debt securities were issued by the following counterparties:
| | | | |
(Amounts in EUR million) | | 2014 | | 2013 |
Governments | | 1,343 | | 1,395 |
Public institutions | | 1,527 | | 1,215 |
Other | | 2,619 | | 2,733 |
| Total, debt securities | | 5,490 | | 5,343 |
The distribution of the Bank’s debt security portfolios was as follows:
| | | | | | | | | | | | |
| | | Book value | | | Fair value | | |
| (Amounts in EUR million) | | 2014 | | 2013 | | | 2014 | | 2013 | | |
Held at fair value | | 2,889 | | | 2,752 | | | 2,889 | | 2,752 | | |
Held at amortised cost | | 2,601 | | | 2,592 | | | 2,768 | | 2,703 | | |
| Total, debt securities | | 5,490 | | | 5,343 | | | 5,656 | | 5,454 | | |
Of these debt securities, EUR 4,047 (3,775) million is at fixed interest rates and EUR 1,443 (1,569) million at floating interest rates.
Reclassified securities
The Bank reclassified financial assets out of the held-for-trading portfolio to the held-to-maturity portfolio during 2008 because these assets are no longer held for the purpose of being sold in the near term. At the same time, assets recognised among cash and cash equivalents became financial placements and are not included in net liquidity. All the reclassifications took place at the fair value at the date of reclassification. The reclassified cost will be amortised over the instrument’s expected remaining lifetime through interest income using the effective interest method.
| | | | | | | | | | |
| (Amounts in EUR million) | | Book value | | | Fair value | | | Unrecognised
adjustments
to fair value |
| 2014 | | | 96 | | | | 98 | | | 2 |
| 2013 | | | 169 | | | | 164 | | | -4 |
| 2012 | | | 297 | | | | 275 | | | -22 |
| 2011 | | | 409 | | | | 370 | | | -39 |
| 2010 | | | 505 | | | | 483 | | | -22 |
| 2009 | | | 606 | | | | 585 | | | -21 |
| 2008 | | | 684 | | | | 630 | | | -54 |
| 1 Sep 2008 | | | 762 | | | | 715 | | | -47 |
| | | | | | | | | | | | |
(Amounts in EUR million) | | Recognised interest income
due to reclassification | | | Change in unrecognised
adjustment to fair value | | | Impact on profit if the
reclassification had not been
implemented | | |
| 2014 | | | -0.7 | | | | 6.2 | | | 5.5 | | |
2013 | | | -1.4 | | | | 17.4 | | | 16.1 | | |
2012 | | | -6.1 | | | | 17.4 | | | 11.3 | | |
2011 | | | -7.3 | | | | -17.7 | | | -25.0 | | |
2010 | | | -8.6 | | | | -0.2 | | | -8.7 | | |
2009 | | | -8.6 | | | | 32.6 | | | 24.0 | | |
2008 | | | -1.5 | | | | -7.3 | | | -8.8 | | |
42
(8) LOANS OUTSTANDING AND GUARANTEE COMMITMENTS
Loans outstanding were distributed as follows over the Bank’s three loan facilities:
| | | | |
(Amounts in EUR million) | | 2014 | | 2013 |
Ordinary Loans | | | | |
Investment loans in the member countries | | 12,403 | | 11,848 |
Investment loans in other countries | | 519 | | 511 |
Regional loans in the Nordic countries | | 3 | | 3 |
Adjustment to hedge accounting | | 378 | | 226 |
| Total | | 13,303 | | 12,587 |
| | |
Project Investment Loans (PIL) | | | | |
Africa | | 188 | | 195 |
Asia | | 828 | | 957 |
Europe and Eurasia | | 369 | | 411 |
Latin America | | 389 | | 398 |
Middle East | | 52 | | 57 |
Adjustment to hedge accounting | | 22 | | 16 |
| Total | | 1,848 | | 2,034 |
| | |
| Environmental Investment Loans (MIL) | | 61 | | 83 |
| | |
Collective impairment | | -55 | | -37 |
| Total, loans outstanding | | 15,156 | | 14,667 |
The figure for loans outstanding, EUR 15,156 (14,667) million, includes medium-term notes (MTN) of EUR 735 (966) million. These are held at amortised cost unless they form part of a qualifying hedging relationship with a derivative. In a hedge accounting relationship, the MTNs are recognised at fair value.
Loans outstanding at floating interest rates amounted to EUR 12,310 (12,181) million, while those at fixed interest rates amounted to EUR 2,502 (2,281) million. There were no guarantee commitments (-) under Ordinary Lending as of 31 December 2014.
The Bank views forbearance to be modification of loan agreements when the counterparty is considered to be unable to meet the terms and conditions of the contract due to financial difficulties. Modification of the terms and conditions of the contract may include, for example, reduction of the interest rate, principal or accrued interest, or rescheduling of the payment dates of principal and/or interest, and has an actual effect on the future cash flows. Loan forbearance is granted on a selective basis and purposefully to avoid counterparty default in favour of the Bank’s collection opportunities. The Bank’s watch-listed counterparties’ loans have been scrutinized for forbearance, and a procedure for recognition of future forbearance occurrences is being developed. Counterparties under forbearance activities are moved to the watch list, and are subject to the impairment policies of the Bank. As of 31 December 2014, a total of EUR 120.8 (125.6) million of Ordinary Loans and EUR 96.5 (9.1) million of Project Investment Loans from the Bank’s loans outstanding before impairments is affected by forbearance, and respectively after impairments EUR 120.8 (125.6) million of Ordinary Loans, and EUR 44.8 (1.2) million of Project Investment Loans. The loans affected by forbearance amounted to interest income of EUR 9.6 million in 2014. See also “Credit risk monitoring” under Risk Management.
As of December 2014, there was one (one) non-performing MIL loan totalling EUR 13.4 million. See also “Impairment of loans and receivables” under Accounting policies.
A total of EUR 181.7 (156.6) million has been deducted from the Bank’s loans outstanding and from lending claims in “other assets”. Specific allowances for impairment amounted to EUR 126.2 million and collectively assessed allowances amounted to EUR 55.5 million. During 2014, no (-) lending transactions were converted into claims under “other assets”. The following changes in allowances for impairment and effects of foreign currency movements are recognised in the statement of comprehensive income under “impairment of loans” and “foreign exchange gains and losses”.
43
Specific and collective allowances for impairment
| | | | |
(Amounts in EUR million) | | 2014 | | 2013 |
Balance at 1 January | | 156.6 | | 158.3 |
Allowances for impairment, individually assessed | | 14.2 | | 44.0 |
Allowances for impairment, collectively assessed | | 18.7 | | -3.2 |
Reversals of previously recorded allowances for impairment | | -7.7 | | -42.5 |
| Balance at 31 December | | 181.7 | | 156.6 |
See also Note 6.
The distribution of allowances for impairment was as follows:
| | | | |
(Amounts in EUR million) | | 2014 | | 2013 |
| Distribution by loan facility | | | | |
Ordinary Loans | | - | | 2.2 |
Project Investment Loans (PIL) | | 51.7 | | 44.3 |
| Allowances for impairment, loans outstanding | | 51.7 | | 46.5 |
| Collective impairment | | 55.5 | | 36.8 |
| Impairment losses on defaulted loan customers, other assets | | 74.5 | | 73.3 |
| Total | | 181.7 | | 156.6 |
| | | | |
(Amounts in EUR million) | | 2014 | | 2013 |
| Distribution by NIB business areas | | | | |
Energy & Environment | | 3.8 | | 4.4 |
Financial Institutions & SMEs | | - | | - |
Industries and Services | | - | | 5.6 |
Infrastructure, Transportation and Telecom | | 47.9 | | 36.5 |
| Allowances for impairment, loans outstanding | | 51.7 | | 46.5 |
| Collective impairment | | 55.5 | | 36.8 |
| Impairment losses on defaulted loan customers, other assets | | 74.5 | | 73.3 |
| Total | | 181.7 | | 156.6 |
44
As of 31 December 2014, loans agreed but not yet disbursed amounted to the following:
| | | | | | |
(Amounts in EUR million) | | 2014 | | 2013 | | |
Loans agreed but not yet disbursed | | | | | | |
Ordinary Loans | | 1,005 | | 955 | | |
Project Investment Loans | | 284 | | 390 | | |
Environmental Investment Loans | | 27 | | 29 | | |
| Total, loans agreed but not yet disbursed | | 1,316 | | 1,374 | | |
The amounts set forth above for loans agreed but not yet disbursed include loans in considerable amounts where certain conditions, primarily interest rate conditions, may not yet have been finally approved.
Distribution according to NIB business areas
| | | | | | | | | | |
| (Amounts in EUR million) | | | | 2014 Share, in % | | | | 2013 Share, in % | | |
Loans outstanding as of 31 December | | | | | | | | | | |
Energy & Environment | | 4,529 | | 31% | | 4,318 | | 30% | | |
Financial Institutions & SMEs | | 2,016 | | 14% | | 1,784 | | 12% | | |
Industries and Services | | 5,149 | | 35% | | 5,528 | | 38% | | |
Infrastructure, Transportation and Telecom | | 3,119 | | 21% | | 2,832 | | 20% | | |
| Collective impairment | | -55 | | | | -37 | | | | |
Adjustments to hedge accounting | | 399 | | | | 242 | | | | |
| Total | | 15,156 | | 100% | | 14,667 | | 100% | | |
| | | | | |
| Loans disbursed | | | | | | | | | | |
Energy & Environment | | 756 | | 33% | | 382 | | 20% | | |
Financial Institutions & SMEs | | 137 | | 6% | | 275 | | 14% | | |
Industries and Services | | 827 | | 36% | | 889 | | 46% | | |
Infrastructure, Transportation and Telecom | | 554 | | 24% | | 376 | | 20% | | |
| Total | | 2,274 | | 100% | | 1,922 | | 100% | | |
Currency distribution of loans outstanding
| | | | | | | | | | | | | | | | | | | | | | | | |
| | | Ordinary loans | | | PIL loans | | | Total 1 | | |
(Nominal amounts in EUR million) | | 2014 | | | 2013 | | | 2014 | | | 2013 | | | 2014 | | | 2013 | | |
Currency | | | | | | | | | | | | | | | | | | | | | | | | |
Nordic currencies | | | 4,139 | | | | 3,864 | | | | 65 | | | | 69 | | | | 4,204 | | | 3,933 | | |
EUR | | | 7,200 | | | | 7,044 | | | | 591 | | | | 683 | | | | 7,828 | | | 7,773 | | |
USD | | | 1,424 | | | | 1,350 | | | | 1,097 | | | | 1,189 | | | | 2,544 | | | 2,574 | | |
Other currencies | | | 162 | | | | 104 | | | | 74 | | | | 77 | | | | 237 | | | 183 | | |
Total | | | 12,925 | | | | 12,362 | | | | 1,826 | | | | 2,018 | | | | 14,812 | | | 14,462 | | |
Adjustment to hedge accounting | | | 378 | | | | 226 | | | | 22 | | | | 16 | | | | 399 | | | 242 | | |
Collective impairment | | | | | | | | | | | | | | | | | | | -55 | | | -37 | | |
Total, loans outstanding | | | 13,303 | | | | 12,587 | | | | 1,848 | | | | 2,034 | | | | 15,156 | | | 14,667 | | |
| 1 | The total amount also includes EUR 61 [83] million in Environmental Investment Loans [MIL] | |
45
Distribution of loans outstanding and guarantees by various types of security
The following table shows loans outstanding, including guarantee commitments, distributed by type of security:
| | | | | | | | |
(Amounts in EUR million) | | Amount | | 2014 Share, in % | | Amount | | 2013 Share, in % |
Loans to or guaranteed by governments | | | | |
Loans to or guaranteed by member countries | | 346 | | | | 377 | | |
Loans to or guaranteed by other countries | | 1,202 | | | | 1,258 | | |
Loans to or guaranteed by governments, total | | 1,548 | | 10.5% | | 1,635 | | 11.3% |
| | | | | | | | |
Loans to or guaranteed by local authorities in member countries | | 1,192 | | 8.1% | | 929 | | 6.4% |
Loans to or guaranteed by companies owned 50% or more
by member countries or local authorities in member countries | | 1,349 | | 9.1% | | 1,123 | | 7.8% |
Loans to or guaranteed by banks | | 1,063 | | 7.2% | | 1,142 | | 7.9% |
Loans backed by a lien or other security in property | | 773 | | 5.2% | | 658 | | 4.6% |
Loans with a guarantee from the parent company and other guarantees | | 1,337 | | 9.1% | | 1,289 | | 8.9% |
Loans with a negative pledge clause and other covenants | | 7,547 | | 51.1% | | 7,685 | | 53.3% |
Loans without formal security | | 3 | | 0.0% | | 1 | | 0.0% |
Collective impairment | | -55 | | | | -37 | | |
Total | | 14,757 | | 100.0% | | 14,425 | | 100.0% |
Adjustment to hedge accounting | | 399 | | | | 242 | | |
Total, loans outstanding | | 15,156 | | | | 14,667 | | |
According to NIB’s Statutes, the member countries shall cover the Bank’s losses arising from failure of payment in connection with PIL loans up to the following amounts:
| | | | | | | | |
| (Amounts in EUR 1,000) | | 2014 Amount of
guarantee | | 2014 Share, in % | | 2013 Amount of
guarantee | | 2013 Share, in % |
Member country | | | | |
Denmark | | 377,821 | | 21.0% | | 377,821 | | 21.0% |
Estonia | | 13,139 | | 0.7% | | 13,139 | | 0.7% |
Finland | | 344,860 | | 19.2% | | 344,860 | | 19.2% |
Iceland | | 15,586 | | 0.9% | | 15,586 | | 0.9% |
Latvia | | 19,058 | | 1.1% | | 19,058 | | 1.1% |
Lithuania | | 29,472 | | 1.6% | | 29,472 | | 1.6% |
Norway | | 329,309 | | 18.3% | | 329,309 | | 18.3% |
Sweden | | 670,755 | | 37.3% | | 670,755 | | 37.3% |
Total | | 1,800,000 | | 100.0% | | 1,800,000 | | 100.0% |
46
According to NIB’s Statutes, the member countries shall cover 100% of the Bank’s losses arising from failure of payment in connection with MIL loans. The MIL loan facility has a statutory ceiling of EUR 300 million. Following the Board of Directors’ decision to call for payments under the MIL guarantees due to non-payment of one MIL loan, all member countries have made guarantee payments to the Bank.
The member countries’ total guarantee liabilities under the MIL facility are as follows after the guarantee payments as of 2 July 2014:
| | | | | | | | | | |
| (Amounts in EUR 1,000) | | 2014 Amount of
guarantee | | 2014 Share, in % | | 2013 Amount of
guarantee | | 2013 Share, in % | | |
Member country | | | | | | |
Denmark | | 65,573 | | 23.4% | | 70,113 | | 23.4% | | |
Estonia | | 2,048 | | 0.7% | | 2,190 | | 0.7% | | |
Finland | | 48,051 | | 17.1% | | 51,377 | | 17.1% | | |
Iceland | | 2,981 | | 1.1% | | 3,187 | | 1.1% | | |
Latvia | | 2,971 | | 1.1% | | 3,176 | | 1.1% | | |
Lithuania | | 4,594 | | 1.6% | | 4,912 | | 1.6% | | |
Norway | | 57,354 | | 20.4% | | 61,324 | | 20.4% | | |
Sweden | | 97,005 | | 34.6% | | 103,720 | | 34.6% | | |
Total | | 280,577 | | 100.0% | | 300,000 | | 100.0% | | |
47
(9) INTANGIBLE ASSETS, TANGIBLE ASSETS (PROPERTY AND EQUIPMENT)
The Bank’s intangible assets amounted to EUR 5.2 (5.1) million.
| | | | |
| (Amounts in EUR 1,000) | | Computer software
development costs, total 2014 | | Computer software
development costs, total 2013 |
Intangible assets | | | | |
Acquisition value at the beginning of the year | | 24,939 | | 22,499 |
Acquisitions during the year | | 1,637 | | 2,440 |
Sales/disposals during the year | | - | | - |
Acquisition value at the end of the year | | 26,576 | | 24,939 |
| | |
Accumulated amortisation at the beginning of the year | | 19,828 | | 18,053 |
Amortisation according to plan for the year | | 1,531 | | 1,775 |
Accumulated amortisation on sales/disposals during the year | | - | | - |
Accumulated amortisation at the end the of the year | | 21,359 | | 19,828 |
Net book value | | 5,217 | | 5,111 |
As of 31 December 2014, the historical cost of buildings and land was recognised in the statement of financial position (net of depreciation on the buildings in accordance with the depreciation plan) at EUR 23.0 (23.7) million.
The value of office equipment and other tangible assets is recognised at EUR 5.3 (6.0) million.
2014
| | | | | | | | |
| (Amounts in EUR 1,000) | | Buildings | | Office equipment and
other tangible assets | | Total | | |
Tangible assets | | | | | | | | |
Acquisition value at the beginning of the year | | 33,769 | | 19,356 | | 53,126 | | |
Acquisitions during the year | | - | | 918 | | 918 | | |
Sales/disposals during the year | | - | | -257 | | -257 | | |
Acquisition value at the end of the year | | 33,769 | | 20,017 | | 53,786 | | |
| | | | |
Accumulated depreciation at the beginning of the year | | 10,097 | | 13,388 | | 23,486 | | |
Depreciation according to plan for the year | | 673 | | 1,504 | | 2,178 | | |
Accumulated depreciation on sales/disposals during the year | | - | | -201 | | -201 | | |
Accumulated depreciation at the end of the year | | 10,771 | | 14,692 | | 25,462 | | |
Net book value | | 22,999 | | 5,325 | | 28,324 | | |
On each closing date, the Bank’s assets are assessed to determine whether there is any indication of an asset’s impairment. As of 31 December 2014, there were no indications of impairment of the intangible or tangible assets.
48
2013
| | | | | | | | | | | | |
| (Amounts in EUR 1,000) | | Buildings | | | Office equipment and
other tangible assets | | | Total | |
Tangible assets | | | | | | | | | | | | |
Acquisition value at the beginning of the year | | | 33,769 | | | | 17,908 | | | | 51,677 | |
Acquisitions during the year | | | - | | | | 1,635 | | | | 1,635 | |
Sales/disposals during the year | | | - | | | | -187 | | | | -187 | |
Acquisition value at the end of the year | | | 33,769 | | | | 19,356 | | | | 53,126 | |
| | | |
Accumulated depreciation at the beginning of the year | | | 9,424 | | | | 12,398 | | | | 21,822 | |
Depreciation according to plan for the year | | | 673 | | | | 1,144 | | | | 1,817 | |
Accumulated depreciation on sales/disposals during the year | | | - | | | | -154 | | | | -154 | |
Accumulated depreciation at the end of the year | | | 10,097 | | | | 13,388 | | | | 23,486 | |
Net book value | | | 23,672 | | | | 5,968 | | | | 29,640 | |
49
(10) DEPRECIATION
| | | | | | | | |
| (Amounts in EUR 1,000) | | 2014 | | | 2013 | |
Intangible assets | | | 1,531 | | | | 1,775 | |
Tangible assets | | | 2,178 | | | | 1,817 | |
Buildings | | | 673 | | | | 673 | |
Office equipment | | | 1,504 | | | | 1,144 | |
Total | | | 3,709 | | | | 3,592 | |
50
(11) OTHER ASSETS
Derivatives are included in “Other assets”.
| | | | | | |
| (Amounts in EUR million) | | 2014 | | | 2013 |
Interest rate swaps 1 | | | 15,763 | | | 14,275 |
Currency swaps 2 | | | 18,677 | | | 18,133 |
| Total, nominal amount | | | 34,440 | | | 32,409 |
Netting of nominal amount per derivative | | | -32,970 | | | -31,592 |
Derivative receivables, net | | | 1,470 | | | 816 |
Adjustment to hedge accounting and changes in fair value of non-hedging derivatives | | | 728 | | | 493 |
Derivative instruments | | | 2,198 | | | 1,309 |
Receivables from defaulted counterparties | | | 8 | | | 8 |
Other | | | 12 | | | 22 |
Total | | | 2,217 | | | 1,339 |
1 Interest rate swaps at floating interest rates EUR 6,323 (4,867) million and fixed interest rates EUR 9,440 (9,408) million.
2 Currency swaps at floating interest rates EUR 11,480 (11,341) million and fixed interest rates EUR 7,197 (6,792) million.
Derivatives are carried at fair value in the statement of financial position net per contract. Thus, swap contracts with a positive net fair value are recognised in the statement of financial position under “Other assets”, while swap contracts with a negative net fair value are recognised under “Other liabilities”.
Derivative instruments net exposure after collaterals
| | | | | | |
| (Amounts in EUR million) | | 2014 | | | 2013 |
Derivative instruments in financial position | | | 2,198 | | | 1,309 |
Netting by counterparty | | | -799 | | | -745 |
Derivative instruments net per counterparty | | | 1,399 | | | 564 |
Accrued interest net per counterparty | | | 109 | | | 52 |
Net exposure before collaterals | | | 1,508 | | | 616 |
Collateral received | | | -1,382 | | | -542 |
Net exposure | | | 125 | | | 75 |
See also Risk Management, Credit Risk, Derivatives.
51
(12) DEBTS EVIDENCED BY CERTIFICATES AND SWAPS
At year-end, the Bank’s borrowings evidenced by certificates were distributed between the currencies shown in the table below. The table also demonstrates the distribution of borrowings by currency on an after-swap nominal basis.
| | | | | | | | | | | | | | | | | | | | | | | | |
| | | Borrowing | | | Swap contracts
payable/receivable | | | Net currency | |
| (Amounts in EUR million) | | 2014 | | | 2013 | | | 2014 | | | 2013 | | | 2014 | | | 2013 | |
Currency | | | | | | | | | | | | | | | | | | | | | | | | |
USD | | | 8,078 | | | | 7,025 | | | | -4,054 | | | | -3,830 | | | | 4,024 | | | | 3,194 | |
AUD | | | 2,637 | | | | 2,396 | | | | -2,637 | | | | -2,396 | | | | 0 | | | | 0 | |
NZD | | | 1,603 | | | | 1,097 | | | | -1,603 | | | | -1,097 | | | | 0 | | | | 0 | |
GBP | | | 1,516 | | | | 1,548 | | | | -1,516 | | | | -1,548 | | | | 0 | | | | 0 | |
JPY | | | 735 | | | | 1,222 | | | | -722 | | | | -1,205 | | | | 13 | | | | 16 | |
EUR | | | 723 | | | | 1,457 | | | | 8,550 | | | | 9,369 | | | | 9,273 | | | | 10,825 | |
Nordic currencies | | | 1,761 | | | | 1,488 | | | | 2,878 | | | | 2,791 | | | | 4,639 | | | | 4,279 | |
Other currencies | | | 1,597 | | | | 1,815 | | | | -1,373 | | | | -1,648 | | | | 224 | | | | 167 | |
Total | | | 18,650 | | | | 18,048 | | | | -477 | | | | 435 | | | | 18,173 | | | | 18,482 | |
| | | | | | |
| Adjustment to hedge accounting and changes in fair value of non-hedging derivatives | | | 796 | | | | 373 | | | | -392 | | | | -128 | | | | 404 | | | | 244 | |
Total, borrowing outstanding | | | 19,446 | | | | 18,421 | | | | -869 | | | | 306 | | | | 18,577 | | | | 18,727 | |
The table set forth above includes the following medium-term note (MTN) programmes: 156 (196) borrowing transactions in the equivalent amount of EUR 6,671 (7,851) million entered into under the Bank’s euro MTN programme; 10 (9) borrowing transactions in the equivalent amount of EUR 7,824 (6,579) million under the Bank’s US MTN programmes; and 38 (27) borrowing transactions in the equivalent amount of EUR 4,174 (3,331) million under the Bank’s Australian MTN programme. There were no borrowing transactions outstanding under the Bank’s Swedish MTN programme during the years 2014 and 2013. The Bank has established a EUR 2,000 million commercial paper programme in Europe.
Of debt securities issued, the amount of EUR 2,001 (1,831) million is at floating interest rates, while EUR 16,587 (16,151) million is at fixed interest rates. Of the other borrowing transactions, the amount of EUR 10 (13) million is at floating interest rates, while EUR 52 (52) million is at fixed interest rates.
52
(13) OTHER LIABILITIES
Derivatives are included in “Other liabilities”.
| | | | |
| (Amounts in EUR million) | | 2014 | | 2013 |
| Interest rate swaps 1 | | 15,747 | | 14,253 |
| Currency swaps 2 | | 18,182 | | 18,577 |
| Total, nominal amount | | 33,930 | | 32,831 |
| Netting of nominal amount per derivative | | -32,937 | | -31,580 |
| Derivative payables, net | | 993 | | 1,251 |
| Adjustment to hedge accounting and changes in fair value of non-hedging derivatives | | 336 | | 364 |
| Derivative instruments | | 1,329 | | 1,615 |
| Other | | 7 | | 8 |
| Total | | 1,336 | | 1,623 |
1 Interest rate swaps at floating interest rates EUR 11,909 (10,882) million and fixed interest rates EUR 3,838 (3,372) million.
2 Currency swaps at floating interest rates EUR 18,065 (18,388) million and fixed interest rates EUR 118 (189) million.
Derivatives are carried at fair value in the statement of financial position net per contract. Thus, swap contracts with a positive net fair value are recognised in the statement of financial position under “Other assets”, while swap contracts with a negative net fair value are recognised under “Other liabilities”.
Derivative instruments net exposure after collaterals
| | | | |
| (Amounts in EUR million) | | 2014 | | 2013 |
Derivative instruments in financial position | | 1,329 | | 1,615 |
Netting by counterparty | | -799 | | -745 |
Derivative instruments net per counterparty | | 530 | | 870 |
Accrued interest net per counterparty | | -64 | | -125 |
Net exposure before collaterals | | 465 | | 745 |
Collateral given | | | | -10 |
Net exposure | | 465 | | 735 |
See also Risk Management, Credit Risk, Derivatives.
53
(14) AUTHORISED CAPITAL – PAID-IN CAPITAL
The member countries’ portions of authorised capital are as follows:
| | | | | | | | | | | | | | |
| (Amounts in EUR million) | | 2014 | | | Share, in % | | | 2013 | | | Share, in % |
Member country | | | | | | | |
Denmark | | | 1,293.9 | | | | 21.1% | | | | 1,293.9 | | | 21.1% |
Estonia | | | 56.3 | | | | 0.9% | | | | 56.3 | | | 0.9% |
Finland | | | 1,088.1 | | | | 17.7% | | | | 1,088.1 | | | 17.7% |
Iceland | | | 58.1 | | | | 0.9% | | | | 58.1 | | | 0.9% |
Latvia | | | 82.1 | | | | 1.3% | | | | 82.1 | | | 1.3% |
Lithuania | | | 119.8 | | | | 2.0% | | | | 119.8 | | | 2.0% |
Norway | | | 1,320.8 | | | | 21.5% | | | | 1,320.8 | | | 21.5% |
Sweden | | | 2,122.8 | | | | 34.6% | | | | 2,122.8 | | | 34.6% |
Total | | | 6,141.9 | | | | 100.0% | | | | 6,141.9 | | | 100.0% |
The member countries’ portions of paid-in capital are as follows: |
| (Amounts in EUR million) | | 2014 | | | Share, in % | | | 2013 | | | Share, in % |
Member country | | | | | | | | | | | | | | |
Denmark | | | 89.2 | | | | 21.3% | | | | 89.2 | | | 21.3% |
Estonia | | | 3.1 | | | | 0.7% | | | | 3.1 | | | 0.7% |
Finland | | | 74.4 | | | | 17.8% | | | | 74.4 | | | 17.8% |
Iceland | | | 3.9 | | | | 0.9% | | | | 3.9 | | | 0.9% |
Latvia | | | 4.4 | | | | 1.1% | | | | 4.4 | | | 1.1% |
Lithuania | | | 6.9 | | | | 1.6% | | | | 6.9 | | | 1.6% |
Norway | | | 77.1 | | | | 18.4% | | | | 77.1 | | | 18.4% |
Sweden | | | 159.5 | | | | 38.1% | | | | 159.5 | | | 38.1% |
Total | | | 418.6 | | | | 100.0% | | | | 418.6 | | | 100.0% |
54
(15) STATUTORY RESERVE AND CREDIT RISK FUNDS
At the end of 2014, the Statutory Reserve amounted to EUR 686.3 million, or 11.2% of the Bank’s authorised capital of EUR 6,141.9 million.
The General Credit Risk Fund recognised in “Equity” is built up by means of allocations from prior years’ profits. This fund is established to cover unidentified, exceptional credit losses. The Statutory Reserve and the General Credit Risk Fund together constitute the Bank’s general reserves. The General Credit Risk Fund amounted to EUR 1,275.0 million in 2014.
In accordance with its Statutes, the Bank has a Special Credit Risk Fund for the Project Investment Loan facility (PIL). This fund is primarily designed to cover the Bank’s own risk in respect of this PIL loan facility, which in part is guaranteed by the member countries. In 2014, the fund amounted to EUR 395.9 million. The Bank assumes 100% of any losses under individual PIL loans, up to the amount available at any given time in the Special Credit Risk Fund for PIL. Only after this fund has been fully used can the Board of Directors call the member country guarantees.
Taken together, these credit risk funds (General Credit Risk Fund and Special Credit Risk Fund PIL) amounted to EUR 1,671.0 million as of 31 December 2014.
55
(16) COLLATERAL AND COMMITMENTS
| | | | | | | | |
| (Amounts in EUR million) | | 2014 | | | 2013 | |
Guarantees issued at nominal amount (Note 8) | | | - | | | | - | |
Loans agreed but not yet disbursed (Note 8) | | | 1,316 | | | | 1,374 | |
Borrowing commitments | | | 54 | | | | 10 | |
Collateral provided for staff loans 1 | | | - | | | | - | |
Callable commitments in financial placements | | | 9 | | | | 16 | |
Collateral received for collateralised placements 2 3 | | | 727 | | | | 1,126 | |
Gross collateral with respect to derivatives exposure | | | | | | | | |
Collateral received 2 4 | | | 1,452 | | | | 601 | |
Collateral given 1 | | | - | | | | 10 | |
1 Book value.
2 Fair value.
3 Including cash EUR 14 (-) million and securities EUR 713 (1,126) million received.
4 Including cash EUR 818 (283) million and securities EUR 634 (318) million received.
56
(17) FAIR VALUE OF FINANCIAL INSTRUMENTS
| | | | | | | | | | | | | | | | | | | | | | | | |
| | | | | | | | | 2014 | | | | | | | | | 2013 | |
| | | | | | | | | | | | | | | | | | | |
| (Amounts in EUR million) | | Carrying amount | | | Fair value | | | Difference | | | Carrying amount | | | Fair value | | | Difference | |
Assets | | | | | | | | | | | | | | | | | | | | | | | | |
Cash accounts with banks 1 | | | 100 | | | | 100 | | | | - | | | | 101 | | | | 101 | | | | - | |
Cash equivalents held at fair value 1 | | | 1,123 | | | | 1,123 | | | | - | | | | 1,406 | | | | 1,406 | | | | - | |
Other cash and cash equivalents held at amortised cost 2 | | | 417 | | | | 417 | | | | - | | | | 250 | | | | 250 | | | | - | |
Cash and cash equivalents, total | | | 1,639 | | | | 1,639 | | | | - | | | | 1,758 | | | | 1,758 | | | | - | |
| Placements with credit institutions 2 | | | 7 | | | | 7 | | | | - | | | | 6 | | | | 6 | | | | - | |
Debt securities held at fair value 1 3 | | | 2,889 | | | | 2,889 | | | | - | | | | 2,752 | | | | 2,752 | | | | - | |
Other debt securities held at amortised cost 1 | | | 2,601 | | | | 2,768 | | | | 167 | | | | 2,592 | | | | 2,703 | | | | 111 | |
Debt securities, total | | | 5,490 | | | | 5,656 | | | | 167 | | | | 5,343 | | | | 5,454 | | | | 111 | |
| Other financial placements at fair value 1 3 | | | 22 | | | | 22 | | | | - | | | | 24 | | | | 24 | | | | - | |
Hedged loans outstanding in fair value hedging relationships 2 | | | 2,899 | | | | 2,899 | | | | - | | | | 2,518 | | | | 2,518 | | | | - | |
Loans outstanding, other 2 | | | 12,257 | | | | 12,259 | | | | 2 | | | | 12,149 | | | | 12,155 | | | | 6 | |
Loans outstanding, total | | | 15,156 | | | | 15,159 | | | | 2 | | | | 14,667 | | | | 14,673 | | | | 6 | |
Hedging derivatives at fair value 2 | | | 1,274 | | | | 1,274 | | | | - | | | | 1,146 | | | | 1,146 | | | | - | |
Other derivatives at fair value 2 | | | 924 | | | | 924 | | | | - | | | | 163 | | | | 163 | | | | - | |
Derivatives at fair value, total | | | 2,198 | | | | 2,198 | | | | - | | | | 1,309 | | | | 1,309 | | | | - | |
| Receivables from defaulted counterparties at fair value 3 | | | 8 | | | | 8 | | | | - | | | | 8 | | | | 8 | | | | - | |
| | | | | | |
| | | | | | | | | | | | 169 | | | | | | | | | | | | 117 | |
| | | | | | |
Liabilities | | | | | | | | | | | | | | | | | | | | | | | | |
| Short-term amounts owed to credit institutions 2 | | | 872 | | | | 872 | | | | - | | | | 372 | | | | 372 | | | | - | |
| Long-term amounts owed to credit institutions 2 | | | - | | | | - | | | | - | | | | - | | | | - | | | | - | |
Hedged debt securities issued in fair value hedging relationships 2 | | | 18,675 | | | | 18,675 | | | | - | | | | 18,157 | | | | 18,157 | | | | - | |
Other debt securities issued 2 | | | 694 | | | | 695 | | | | 1 | | | | 189 | | | | 190 | | | | 1 | |
Debt securities issued, total | | | 19,369 | | | | 19,370 | | | | 1 | | | | 18,347 | | | | 18,347 | | | | 1 | |
Hedged other debt in fair value hedging relationships 2 | | | 77 | | | | 77 | | | | - | | | | 71 | | | | 71 | | | | - | |
Other debt 2 | | | - | | | | - | | | | - | | | | 3 | | | | 3 | | | | - | |
Other debt, total | | | 77 | | | | 77 | | | | - | | | | 74 | | | | 74 | | | | - | |
Hedging derivatives at fair value 2 | | | 1,152 | | | | 1,152 | | | | - | | | | 1,117 | | | | 1,117 | | | | - | |
Other derivatives at fair value 2 | | | 177 | | | | 177 | | | | - | | | | 498 | | | | 498 | | | | - | |
Derivatives at fair value, total | | | 1,329 | | | | 1,329 | | | | - | | | | 1,615 | | | | 1,615 | | | | - | |
| | | | | | | | | | | | - | | | | | | | | | | | | 1 | |
Net | | | | | | | | | | | 169 | | | | | | | | | | | | 118 | |
1 The fair value is determined according to market quotes for identical instruments.
2 The fair value is determined using valuation techniques with observable market inputs.
3 The fair value is determined using valuation techniques with unobservable market inputs.
57
Level of fair value measurement for financial instruments at the end of the period
The table below analyses financial instruments’ fair value at the end of the year by the level in the fair value hierarchy into which the fair value measurement is categorised. See Accounting policies, Determination of fair value.
| | | | | | | | | | | | | | | | | | | | | | | | |
| | | 31 Dec 2014 | | | 31 Dec 2013 | |
(Amounts in EUR million) | | Level 1 | | | Level 2 | | | Level 3 | | | Level 1 | | | Level 2 | | | Level 3 | |
Assets | | | | | | | | | | | | | | | | | | | | | | | | |
Cash accounts with banks | | | 100 | | | | | | | | | | | | 101 | | | | | | | | | |
Cash equivalents held at fair value | | | 1,123 | | | | | | | | | | | | 1,406 | | | | | | | | | |
Other cash and cash equivalents held at amortised cost | | | | | | | 417 | | | | | | | | | | | | 250 | | | | | |
Cash and cash equivalents, total | | | 1,222 | | | | 417 | | | | | | | | 1,508 | | | | 250 | | | | | |
| Placements with credit institutions | | | | | | | 7 | | | | | | | | | | | | 6 | | | | | |
Debt securities held at fair value | | | 2,865 | | | | | | | | 23 | | | | 2,709 | | | | | | | | 43 | |
Other debt securities held at amortised cost | | | 2,768 | | | | | | | | | | | | 2,703 | | | | | | | | | |
Debt securities, total | | | 5,633 | | | | | | | | 23 | | | | 5,411 | | | | | | | | 43 | |
| Other financial placements held at fair value | | | 2 | | | | | | | | 21 | | | | 2 | | | | | | | | 23 | |
Hedged loans outstanding in fair value hedging relationships | | | | | | | 2,899 | | | | | | | | | | | | 2,518 | | | | | |
Loans outstanding, other | | | | | | | 12,259 | | | | | | | | | | | | 12,155 | | | | | |
Loans outstanding, total | | | | | | | 15,159 | | | | | | | | | | | | 14,673 | | | | | |
| Derivatives | | | | | | | 2,198 1 | | | | | | | | | | | | 1,309 | | | | | |
| Receivables from defaulted counterparties | | | | | | | | | | | 8 2 | | | | | | | | | | | | 8 2 | |
Financial assets, total | | | 6,857 | | | | 17,780 | | | | 51 | | | | 6,921 | | | | 16,238 | | | | 74 | |
| | | | | | |
Liabilities | | | | | | | | | | | | | | | | | | | | | | | | |
| Short-term amounts owed to credit institutions | | | | | | | 872 | | | | | | | | | | | | 372 | | | | | |
| Long-term amounts owed to credit institutions | | | | | | | | | | | | | | | | | | | | | | | | |
Debt securities issued | | | | | | | | | | | | | | | | | | | | | | | | |
Hedged debt securities issued in fair value hedging relationships | | | | | | | 18,675 | | | | | | | | | | | | 18,157 | | | | | |
Other debt securities issued | | | | | | | 695 | | | | | | | | | | | | 190 | | | | | |
Hedged other debt in fair value hedging relationships | | | | | | | 77 | | | | | | | | | | | | 71 | | | | | |
Other debt | | | | | | | - | | | | | | | | | | | | 3 | | | | | |
Debt securities issued, total | | | | | | | 19,446 | | | | | | | | | | | | 18,421 | | | | | |
| Derivatives | | | | | | | 1,329 1 | | | | | | | | | | | | 1,615 | | | | | |
Financial liabilities, total | | | | | | | 21,647 | | | | | | | | | | | | 20,409 | | | | | |
1 Valuation adjustments related to counterparty credit risk of over-the-counter derivative transactions are not reflected in the fair values of the derivative positions. The Bank is developing a robust modelling methodology for the calculation of Credit Valuation Adjustment (CVA), reflecting the market value of counterparty default risk, and Debit Valuation Adjustment (DVA), reflecting the market value of the Bank’s own default, in the fair values of derivative positions. The methodology will take into account projected exposure profiles of derivative transactions and credit risk mitigants, such as exposure netting and collateral. According to preliminary calculations the estimated effects of CVA and DVA on the fair values of derivative positions as of 31 December 2014 are immaterial.
2 Receivables from defaulted treasury counterparties are measured at fair value. Receivables from defaulted lending counterparties are measured at cost minus impairment.
58
Changes in fair values categorised at level 3
| | | | | | | | | | |
| (Amounts in EUR million) | | Debt securities held at fair value | | Other
financial
placements
held at fair
value | | Receivables
from defaulted
counterparties | | Level 3, total | |
31 Dec 2012 | | 44 | | 22 | | 10 | | | 76 | |
| Matured transactions | | | | | | | | | | |
| Sold transactions | | -3 | | | | -7 | | | -10 | |
| Changes in fair values | | 2 | | 2 | | 5 | | | 9 | |
31 Dec 2013 | | 43 | | 23 | | 8 | | | 74 | |
| Matured transactions | | -5 | | | | | | | -5 | |
| Sold transactions | | -16 | | | | -7 | | | -23 | |
| Changes in fair values | | - | | -1 | | 6 | | | 4 | |
31 Dec 2014 | | 23 | | 21 | | 8 | | | 51 | |
Sensitivity analysis of level 3 financial instruments
| | | | | | | | | | | | | | | | | | | | | | | | |
| | | | | | | | | 2014 | | | | | | | | | 2013 | |
| (Amounts in EUR million) | | Carrying
amount | | | Favourable
change | | | Unfavourable change | | | Carrying
amount | | | Favourable
change | | | Unfavourable
change | |
| Financial instruments categorised at level 3 | | | 51 | | | | 1 | | | | -1 | | | | 74 | | | | 3 | | | | -2 | |
The table above shows the sensitivity of the fair value of level 3 instruments to changes in key assumptions. The sensitivity analysis of the debt securities valued as level 3 is based on cashflow evaluation on Bloomberg. The implied market spread over reference curve has been changed reflecting a credit migration of the issuer. The fair value for other financial placements in level 3 is received from the funds in question and is based on their present value of cash flows. No quotation exists for these placements.
59
(18) MATURITY PROFILE OF FINANCIAL ASSETS AND LIABILITIES
The table below sets out a maturity analysis for financial assets and liabilities containing principal and interest flows. For loans outstanding, undiscounted cash flows are presented until contractual final maturity. For borrowing outstanding and derivatives with call options, cash flows are presented in the time bucket corresponding to the first possible termination date. Cash flows are presented on net basis for interest rate swaps and on gross basis for all other swaps. Interest cash flows are projected based on the interest rates prevailing on the closing date. See also Notes 11 and 13, and Risk Management, Liquidity Risk.
The 2014 figures are not directly comparable with the previous year’s figures due to changed handling of derivatives within the tables and adaptation of projected interest cash flows in the 2014 table.
2014
| | | | | | | | | | | | | | | | | | | | | | | | | | | | |
| [Amounts in EUR million] | | Carrying amount | | | Contractual
cash flows | | | Up to and including 3 months | | | Over 3 months and up to and including 6 months | | | Over 6 months and up to and including 1 year | | | Over 1 year and up to and including 5 years | | | Over 5 years | |
Assets | | | | | | | | | | | | | | | | | | | | | | | | | | | | |
| Cash and cash equivalents | | | 1,639 | | | | 1,640 | | | | 945 | | | | 694 | | | | - | | | | - | | | | - | |
| Financial placements | | | | | | | | | | | | | | | | | | | | | | | | | | | | |
Debt securities | | | 5,490 | | | | 5,781 | | | | 195 | | | | 257 | | | | 478 | | | | 4,021 | | | | 830 | |
| Loans outstanding | | | 15,156 | | | | 16,438 | | | | 406 | | | | 566 | | | | 797 | | | | 8,188 | | | | 6,481 | |
| Other assets | | | | | | | | | | | | | | | | | | | | | | | | | | | | |
Derivatives | | | | | | | | | | | | | | | | | | | | | | | | | | | | |
Receivables | | | 28,897 | | | | 14,908 | | | | 829 | | | | 909 | | | | 2,417 | | | | 7,980 | | | | 2,773 | |
Payables | | | -26,699 | | | | -12,016 | | | | -683 | | | | -800 | | | | -2,137 | | | | -6,359 | | | | -2,037 | |
| | | | 2,198 | | | | 2,892 | | | | 146 | | | | 109 | | | | 280 | | | | 1,621 | | | | 736 | |
Assets, total | | | 24,483 | | | | 26,751 | | | | 1,692 | | | | 1,626 | | | | 1,556 | | | | 13,830 | | | | 8,047 | |
| | | | | | | |
Liabilities | | | | | | | | | | | | | | | | | | | | | | | | | | | | |
| Amounts owed to credit institutions | | | | | | | | | | | | | | | | | | | | | | | | | | | | |
Short-term | | | 872 | | | | 872 | | | | 872 | | | | - | | | | - | | | | - | | | | - | |
Long-term | | | - | | | | - | | | | - | | | | - | | | | - | | | | - | | | | - | |
| | | | 872 | | | | 872 | | | | 872 | | | | - | | | | - | | | | - | | | | - | |
| Short-term debt | | | - | | | | - | | | | - | | | | - | | | | - | | | | - | | | | - | |
| Debts evidenced by certificates | | | 19,446 | | | | 20,994 | | | | 494 | | | | 1,250 | | | | 1,961 | | | | 13,425 | | | | 3,864 | |
| Other liabilities | | | | | | | | | | | | | | | | | | | | | | | | | | | | |
Derivatives | | | | | | | | | | | | | | | | | | | | | | | | | | | | |
Receivables | | | -6,273 | | | | -6,427 | | | | -206 | | | | -914 | | | | -293 | | | | -3,846 | | | | -1,167 | |
Payables | | | 7,602 | | | | 6,832 | | | | 176 | | | | 1,072 | | | | 275 | | | | 3,905 | | | | 1,404 | |
| | | | 1,329 | | | | 405 | | | | -31 | | | | 158 | | | | -18 | | | | 59 | | | | 237 | |
Liabilities, total | | | 21,647 | | | | 22,271 | | | | 1,335 | | | | 1,408 | | | | 1,942 | | | | 13,485 | | | | 4,101 | |
| | | | | | | |
| | | | | | | | | | | | | | | | | | | | | | | | | | | | |
Net during the period | | | | | | | | | | | 358 | | | | 218 | | | | -387 | | | | 345 | | | | 3,946 | |
| | | | | | | |
Loans agreed but not yet disbursed | | | | | | | | | | | 1,316 | | | | - | | | | - | | | | - | | | | - | |
60
The table set forth below presents assets and liabilities according to their remaining maturities, calculated from closing date to maturity date. The possibility of prepayments is taken into consideration regarding derivative contracts and borrowing transactions. Loans outstanding, however, are reported according to the latest possible repayment date.
2013
| | | | | | | | | | | | | | | | | | | | | | | | | | | | |
| [Amounts in EUR million] | | Carrying amount | | | Gross
nominal
amounts | | | Up to and
including 3
months | | | Over 3
months and
up to and
including 6
months | | | Over 6
months and
up to and
including 1
year | | | Over 1 year
and up to
and
including 5 years | | | Over 5
years | |
Assets | | | | | | | | | | | | | | | | | | | | | | | | | | | | |
| Cash and cash equivalents | | | 1,758 | | | | 1,758 | | | | 1,358 | | | | 400 | | | | - | | | | - | | | | - | |
| Financial placements | | | | | | | | | | | | | | | | | | | | | | | | | | | | |
Debt securities | | | 5,343 | | | | 5,342 | | | | 447 | | | | 182 | | | | 372 | | | | 3,530 | | | | 810 | |
| Loans outstanding | | | 14,667 | | | | 14,462 | | | | 174 | | | | 484 | | | | 576 | | | | 7,529 | | | | 5,699 | |
| Other assets | | | | | | | | | | | | | | | | | | | | | | | | | | | | |
Derivatives | | | | | | | | | | | | | | | | | | | | | | | | | | | | |
Receivables | | | 21,869 | | | | 21,373 | | | | 880 | | | | 1,892 | | | | 2,383 | | | | 12,581 | | | | 3,636 | |
Payables | | | -20,560 | | | | -20,560 | | | | -814 | | | | -1,826 | | | | -2,303 | | | | -12,162 | | | | -3,454 | |
| | | | 1,309 | | | | 813 | | | | 66 | | | | 66 | | | | 80 | | | | 420 | | | | 182 | |
| Accrued interest and fees receivable | | | 318 | | | | 318 | | | | 175 | | | | 114 | | | | 29 | | | | - | | | | - | |
Assets, total | | | 23,395 | | | | 22,692 | | | | 2,219 | | | | 1,246 | | | | 1,057 | | | | 11,479 | | | | 6,691 | |
| | | | | | | | | | | | | | | | | | | | | | | | | | | | | |
Liabilities | | | | | | | | | | | | | | | | | | | | | | | | | | | | |
| Amounts owed to credit institutions | | | | | | | | | | | | | | | | | | | | | | | | | | | | |
Short-term | | | 372 | | | | 372 | | | | 372 | | | | - | | | | - | | | | - | | | | - | |
Long-term | | | - | | | | - | | | | - | | | | - | | | | - | | | | - | | | | - | |
| | | | 372 | | | | 372 | | | | 372 | | | | - | | | | - | | | | - | | | | - | |
| Short-term debt | | | | | | | | | | | - | | | | - | | | | - | | | | - | | | | - | |
| Debts evidenced by certificates | | | 18,421 | | | | 18,048 | | | | 1,078 | | | | 1,362 | | | | 1,753 | | | | 10,951 | | | | 2,904 | |
| Other liabilities | | | | | | | | | | | | | | | | | | | | | | | | | | | | |
Derivatives | | | | | | | | | | | | | | | | | | | | | | | | | | | | |
Receivables | | | -11,036 | | | | -11,036 | | | | -288 | | | | -191 | | | | -555 | | | | -8,238 | | | | -1,763 | |
Payables | | | 12,651 | | | | 12,271 | | | | 345 | | | | 214 | | | | 684 | | | | 8,959 | | | | 2,069 | |
| | | 1,615 | | | | 1,235 | | | | 57 | | | | 23 | | | | 129 | | | | 721 | | | | 306 | |
Accrued interest and fees payable | | | 243 | | | | 243 | | | | 131 | | | | 95 | | | | 17 | | | | - | | | | - | |
Liabilities, total | | | 20,651 | | | | 19,898 | | | | 1,638 | | | | 1,480 | | | | 1,899 | | | | 11,672 | | | | 3,209 | |
| | | | | | | |
Net during the period | | | | | | | | | | | 581 | | | | -234 | | | | -842 | | | | -193 | | | | 3,481 | |
| | | | | | | | | | | | | | | | | | | | | | | | | | | | | |
| Loans agreed but not yet disbursed | | | | | | | | | | | 1,374 | | | | - | | | | - | | | | - | | | | - | |
61
(19) INTEREST RATE RISK
Interest rate risk is the impact that fluctuations in market interest rates can have on the value of the Bank’s interest-bearing assets and liabilities and on the interest income recognised in the statement of comprehensive income. The table below provides information on the extent of the Bank’s interest rate exposure. The assets and liabilities are grouped into buckets defined by their time to maturity or the date of the interest rate adjustment. The difference, or gap, between assets and liabilities in each time bucket makes the Bank sensitive to interest rate fluctuations. See also Risk Management, Market Risk.
2014
| | | | | | | | | | | | | | | | | | | | | | | | | | | | | | | | |
| [Amounts in EUR million] | | Up to and
including
3 months | | | Over 3
months
and up to
and
including
6 months | | | Over 6
months and
up to and
including 1
year | | | Over 1
year and
up to and
including
5 years | | | Over 5
years
and up to
and
including
10 years | | | Over 10
years | | | Undefined | | | Total | |
Assets | | | | | | | | | | | | | | | | | | | | | | | | | | | | | | | | |
Cash and cash equivalents | | | 945 | | | | 694 | | | | - | | | | - | | | | - | | | | - | | | | 0 | | | | 1,639 | |
Financial placements | | | | | | | | | | | | | | | | | | | | | | | | | | | | | | | | |
Placements with credit institutions | | | - | | | | - | | | | - | | | | - | | | | - | | | | - | | | | 7 | | | | 7 | |
Debt securities | | | 1,604 | | | | 110 | | | | 361 | | | | 2,657 | | | | 657 | | | | 56 | | | | 45 | | | | 5,490 | |
Other | | | - | | | | - | | | | - | | | | - | | | | - | | | | - | | | | 22 | | | | 22 | |
| | | | 1,604 | | | | 110 | | | | 361 | | | | 2,657 | | | | 657 | | | | 56 | | | | 73 | | | | 5,518 | |
Loans outstanding | | | 6,033 | | | | 6,307 | | | | 247 | | | | 970 | | | | 857 | | | | 398 | | | | 344 | | | | 15,156 | |
Intangible assets | | | - | | | | - | | | | - | | | | - | | | | - | | | | - | | | | 5 | | | | 5 | |
Tangible assets | | | - | | | | - | | | | - | | | | - | | | | - | | | | - | | | | 28 | | | | 28 | |
Other assets | | | | | | | | | | | | | | | | | | | | | | | | | | | | | | | | |
Derivatives | | | | | | | | | | | | | | | | | | | | | | | | | | | | | | | | |
Receivables1 | | | 14,701 | | | | 3,848 | | | | 1,855 | | | | 11,165 | | | | 2,263 | | | | 606 | | | | 730 | | | | 35,170 | |
Other assets | | | - | | | | - | | | | - | | | | - | | | | - | | | | - | | | | 19 | | | | 19 | |
Accrued interest and fees receivable | | | - | | | | - | | | | - | | | | - | | | | - | | | | - | | | | 306 | | | | 306 | |
Total assets | | | 23,284 | | | | 10,959 | | | | 2,463 | | | | 14,793 | | | | 3,777 | | | | 1,061 | | | | 1,506 | | | | 57,843 | |
| | | | | | | | |
Liabilities and equity | | | | | | | | | | | | | | | | | | | | | | | | | | | | | | | | |
Liabilities | | | | | | | | | | | | | | | | | | | | | | | | | | | | | | | | |
Amounts owed to credit institutions | | | | | | | | | | | | | | | | | | | | | | | | | | | | | | | | |
Short-term | | | 872 | | | | - | | | | - | | | | - | | | | - | | | | - | | | | - | | | | 872 | |
Long-term | | | - | | | | - | | | | - | | | | - | | | | - | | | | - | | | | - | | | | - | |
| | | | 872 | | | | - | | | | - | | | | - | | | | - | | | | - | | | | - | | | | 872 | |
Short-term debt | | | - | | | | - | | | | - | | | | - | | | | - | | | | - | | | | - | | | | - | |
Debts evidenced by certificates | | | 1,572 | | | | 1,185 | | | | 1,870 | | | | 11,271 | | | | 2,263 | | | | 488 | | | | 796 | | | | 19,446 | |
Other liabilities | | | | | | | | | | | | | | | | | | | | | | | | | | | | | | | | |
Derivatives | | | | | | | | | | | | | | | | | | | | | | | | | | | | | | | | |
Payables1 | | | 22,195 | | | | 8,088 | | | | 159 | | | | 1,733 | | | | 1,201 | | | | 553 | | | | 372 | | | | 34,301 | |
Other liabilities | | | - | | | | - | | | | - | | | | - | | | | - | | | | - | | | | 7 | | | | 7 | |
Accrued interest and fees payable | | | - | | | | - | | | | - | | | | - | | | | - | | | | - | | | | 231 | | | | 231 | |
Total liabilities | | | 24,639 | | | | 9,273 | | | | 2,029 | | | | 13,005 | | | | 3,464 | | | | 1,042 | | | | 1,405 | | | | 54,857 | |
| | | | | | | | | | | | | | | | | | | | | | | | | | | | | | | | | |
Equity | | | - | | | | - | | | | - | | | | - | | | | - | | | | - | | | | 2,986 | | | | 2,986 | |
Total liabilities and equity | | | 24,639 | | | | 9,273 | | | | 2,029 | | | | 13,005 | | | | 3,464 | | | | 1,042 | | | | 4,391 | | | | 57,843 | |
Net during the period | | | -1,355 | | | | 1,686 | | | | 434 | | | | 1,788 | | | | 313 | | | | 19 | | | | -2,885 | | | | - | |
Cumulative net during the period | | | -1,355 | | | | 331 | | | | 765 | | | | 2,553 | | | | 2,866 | | | | 2,885 | | | | - | | | | - | |
Guarantee commitments | | | - | | | | - | | | | - | | | | - | | | | - | | | | - | | | | - | | | | - | |
62
2013
| | | | | | | | | | | | | | | | | | | | | | | | | | | | | | | | |
| [Amounts in EUR million] | | Up to and
including
3 months | | | Over 3
months
and up to
and
including
6 months | | | Over 6
months and
up to and
including 1
year | | | Over 1
year and
up to and
including
5 years | | | Over 5
years
and up to
and
including
10 years | | | Over 10
years | | | Undefined | | | Total | |
Assets | | | | | | | | | | | | | | | | | | | | | | | | | | | | | | | | |
Cash and cash equivalents | | | 1,358 | | | | 400 | | | | - | | | | - | | | | - | | | | - | | | | 0 | | | | 1,758 | |
Financial placements | | | | | | | | | | | | | | | | | | | | | | | | | | | | | | | | |
Placements with credit institutions | | | - | | | | - | | | | - | | | | - | | | | - | | | | - | | | | 6 | | | | 6 | |
Debt securities | | | 1,756 | | | | 121 | | | | 253 | | | | 2,533 | | | | 573 | | | | 107 | | | | 2 | | | | 5,343 | |
Other | | | - | | | | - | | | | - | | | | - | | | | - | | | | - | | | | 24 | | | | 24 | |
| | | | 1,756 | | | | 121 | | | | 253 | | | | 2,533 | | | | 573 | | | | 107 | | | | 32 | | | | 5,373 | |
Loans outstanding | | | 5,981 | | | | 6,102 | | | | 226 | | | | 867 | | | | 896 | | | | 390 | | | | 205 | | | | 14,667 | |
Intangible assets | | | - | | | | - | | | | - | | | | - | | | | - | | | | - | | | | 5 | | | | 5 | |
Tangible assets | | | - | | | | - | | | | - | | | | - | | | | - | | | | - | | | | 30 | | | | 30 | |
Other assets | | | | | | | | | | | | | | | | | | | | | | | | | | | | | | | | |
Derivatives | | | | | | | | | | | | | | | | | | | | | | | | | | | | | | | | |
Receivables1 | | | 13,366 | | | | 4,320 | | | | 1,832 | | | | 10,309 | | | | 1,719 | | | | 863 | | | | 496 | | | | 32,905 | |
Other assets | | | - | | | | - | | | | - | | | | - | | | | - | | | | - | | | | 30 | | | | 30 | |
Accrued interest and fees receivable | | | - | | | | - | | | | - | | | | - | | | | - | | | | - | | | | 318 | | | | 318 | |
Total assets | | | 22,460 | | | | 10,943 | | | | 2,311 | | | | 13,709 | | | | 3,188 | | | | 1,359 | | | | 1,116 | | | | 55,086 | |
Liabilities and equity | | | | | | | | | | | | | | | | | | | | | | | | | | | | | | | | |
Liabilities | | | | | | | | | | | | | | | | | | | | | | | | | | | | | | | | |
Amounts owed to credit institutions | | | | | | | | | | | | | | | | | | | | | | | | | | | | | | | | |
Short-term | | | 372 | | | | - | | | | - | | | | - | | | | - | | | | - | | | | - | | | | 372 | |
Long-term | | | - | | | | - | | | | - | | | | - | | | | - | | | | - | | | | - | | | | - | |
| | | | 372 | | | | - | | | | - | | | | - | | | | - | | | | - | | | | - | | | | 372 | |
Short-term debt | | | - | | | | - | | | | - | | | | - | | | | - | | | | - | | | | - | | | | - | |
Debts evidenced by certificates | | | 1,745 | | | | 1,622 | | | | 1,831 | | | | 10,375 | | | | 1,756 | | | | 717 | | | | 373 | | | | 18,421 | |
Other liabilities | | | | | | | | | | | | | | | | | | | | | | | | | | | | | | | | |
Derivatives | | | | | | | | | | | | | | | | | | | | | | | | | | | | | | | | |
Payables1 | | | 22,752 | | | | 6,695 | | | | 74 | | | | 1,740 | | | | 1,050 | | | | 519 | | | | 380 | | | | 33,211 | |
Other liabilities | | | - | | | | - | | | | - | | | | - | | | | - | | | | - | | | | 8 | | | | 8 | |
Accrued interest and fees payable | | | - | | | | - | | | | - | | | | - | | | | - | | | | - | | | | 243 | | | | 243 | |
Total liabilities | | | 24,870 | | | | 8,318 | | | | 1,906 | | | | 12,115 | | | | 2,806 | | | | 1,236 | | | | 1,004 | | | | 52,255 | |
| | | | | | | | | | | | | | | | | | | | | | | | | | | | | | | | | |
Equity | | | - | | | | - | | | | - | | | | - | | | | - | | | | - | | | | 2,831 | | | | 2,831 | |
Total liabilities and equity | | | 24,870 | | | | 8,318 | | | | 1,906 | | | | 12,115 | | | | 2,806 | | | | 1,236 | | | | 3,835 | | | | 55,086 | |
Net during the period | | | -2,410 | | | | 2,625 | | | | 405 | | | | 1,594 | | | | 382 | | | | 123 | | | | -2,719 | | | | - | |
Cumulative net during the period | | | -2,410 | | | | 216 | | | | 621 | | | | 2,215 | | | | 2,596 | | | | 2,719 | | | | - | | | | - | |
Guarantee commitments | | | - | | | | - | | | | - | | | | - | | | | - | | | | - | | | | - | | | | - | |
1Swaps are not netted.
63
(20) CURRENCY RISK
NIB’s operations are mostly in euro and US dollars. The table below shows the net of assets and liabilities in the major currencies. See also Risk Management, Market Risk.
Net currency position as of 31 December 2014:
| | | | | | | | | | | | | | | | | | | | | | | | | | | | | | | | |
| (Amounts in EUR million) | | EUR | | | USD | | | GBP | | | JPY | | | SEK | | | Other
currencies | | | Fair value
adjustments
and swap
netting | | | Total | |
Assets | | | | | | | | | | | | | | | | | | | | | | | | | | | | | | | | |
Cash and cash equivalents | | | 486 | | | | 991 | | | | - | | | | - | | | | 58 | | | | 104 | | | | - | | | | 1,639 | |
Financial placements | | | | | | | | | | | | | | | | | | | | | | | | | | | | | | | | |
Placements with credit institutions | | | 7 | | | | - | | | | - | | | | - | | | | - | | | | - | | | | - | | | | 7 | |
Debt securities | | | 4,743 | | | | 482 | | | | - | | | | - | | | | 133 | | | | 131 | | | | - | | | | 5,490 | |
Other financial placements | | | 22 | | | | - | | | | - | | | | - | | | | - | | | | - | | | | - | | | | 22 | |
| | | | 4,771 | | | | 482 | | | | - | | | | - | | | | 133 | | | | 131 | | | | - | | | | 5,518 | |
Loans outstanding | | | 7,750 | | | | 2,567 | | | | - | | | | 13 | | | | 2,091 | | | | 2,336 | | | | 399 | | | | 15,156 | |
Intangible assets | | | 5 | | | | - | | | | - | | | | - | | | | - | | | | - | | | | - | | | | 5 | |
Tangible assets, property and equipment | | | 28 | | | | - | | | | - | | | | - | | | | - | | | | - | | | | - | | | | 28 | |
Other assets | | | | | | | | | | | | | | | | | | | | | | | | | | | | | | | | |
Derivatives | | | -8,550 | | | | 4,054 | | | | 1,516 | | | | 722 | | | | -1,604 | | | | 4,340 | | | | 1,721 | | | | 2,198 | |
Other assets | | | - | | | | 17 | | | | - | | | | - | | | | - | | | | 2 | | | | - | | | | 19 | |
| | | | -8,551 | | | | 4,071 | | | | 1,516 | | | | 722 | | | | -1,604 | | | | 4,342 | | | | 1,721 | | | | 2,217 | |
Accrued interest and fees receivable | | | 84 | | | | 73 | | | | 25 | | | | 10 | | | | 8 | | | | 110 | | | | -4 | | | | 306 | |
Total assets | | | 4,574 | | | | 8,184 | | | | 1,542 | | | | 745 | | | | 686 | | | | 7,024 | | | | 2,116 | | | | 24,870 | |
| | | | | | | | |
Liabilities and equity | | | | | | | | | | | | | | | | | | | | | | | | | | | | | | | | |
Liabilities | | | | | | | | | | | | | | | | | | | | | | | | | | | | | | | | |
Amounts owed to credit institutions | | | | | | | | | | | | | | | | | | | | | | | | | | | | | | | | |
Short-term amounts owed to credit institutions | | | 833 | | | | 38 | | | | - | | | | - | | | | - | | | | - | | | | - | | | | 872 | |
Long-term amounts owed to credit institutions | | | - | | | | - | | | | - | | | | - | | | | - | | | | - | | | | - | | | | - | |
| | | | 833 | | | | 38 | | | | - | | | | - | | | | - | | | | - | | | | - | | | | 872 | |
Debts evidenced by certificates | | | | | | | | | | | | | | | | | | | | | | | | | | | | | | | | |
Debt securities issued | | | 661 | | | | 8,078 | | | | 1,516 | | | | 735 | | | | 681 | | | | 6,917 | | | | 781 | | | | 19,369 | |
Other debt | | | 62 | | | | - | | | | - | | | | - | | | | - | | | | - | | | | 15 | | | | 77 | |
| | | | 723 | | | | 8,078 | | | | 1,516 | | | | 735 | | | | 681 | | | | 6,917 | | | | 796 | | | | 19,446 | |
Other liabilities | | | | | | | | | | | | | | | | | | | | | | | | | | | | | | | | |
Derivatives | | | - | | | | - | | | | | | | | - | | | | - | | | | - | | | | 1,329 | | | | 1,329 | |
Other liabilities | | | 7 | | | | - | | | | | | | | - | | | | - | | | | - | | | | - | | | | 7 | |
| | | | 7 | | | | - | | | | | | | | - | | | | - | | | | - | | | | 1,329 | | | | 1,336 | |
Accrued interest and fees payable | | | 26 | | | | 65 | | | | 25 | | | | 10 | | | | 4 | | | | 104 | | | | -4 | | | | 231 | |
Total liabilities | | | 1,589 | | | | 8,181 | | | | 1,541 | | | | 745 | | | | 686 | | | | 7,022 | | | | 2,121 | | | | 21,884 | |
Equity | | | 2,776 | | | | - | | | | - | | | | - | | | | - | | | | - | | | | - | | | | 2,776 | |
Total liabilities and equity | | | 4,365 | | | | 8,181 | | | | 1,541 | | | | 745 | | | | 686 | | | | 7,022 | | | | 2,121 | | | | 24,660 | |
Net of assets and liabilities as of 31 Dec 2014 | | | 209 | | | | 3 | | | | - | | | | - | | | | - | | | | 2 | | | | -4 | | | | 210 | |
64
Net currency position as of 31 December 2013:
| | | | | | | | | | | | | | | | | | | | | | | | | | | | | | | | |
| (Amounts in EUR million) | | EUR | | | USD | | | GBP | | | JPY | | | SEK | | | Other
currencies | | | Fair value
adjustments
and swap
netting | | | Total | |
Assets | | | | | | | | | | | | | | | | | | | | | | | | | | | | | | | | |
Cash and cash equivalents | | | 1,317 | | | | 247 | | | | - | | | | - | | | | 117 | | | | 75 | | | | - | | | | 1,758 | |
Financial placements | | | | | | | | | | | | | | | | | | | | | | | | | | | | | | | | |
Placements with credit institutions | | | 6 | | | | - | | | | - | | | | - | | | | - | | | | - | | | | - | | | | 6 | |
Debt securities | | | 4,784 | | | | 411 | | | | - | | | | - | | | | 34 | | | | 114 | | | | - | | | | 5,343 | |
Other financial placements | | | 24 | | | | - | | | | - | | | | - | | | | - | | | | - | | | | - | | | | 24 | |
| | | | 4,814 | | | | 411 | | | | - | | | | - | | | | 34 | | | | 114 | | | | - | | | | 5,373 | |
Loans outstanding | | | 7,718 | | | | 2,592 | | | | - | | | | 16 | | | | 2,085 | | | | 2,015 | | | | 242 | | | | 14,667 | |
Intangible assets | | | 5 | | | | - | | | | - | | | | - | | | | - | | | | - | | | | - | | | | 5 | |
Tangible assets, property and equipment | | | 30 | | | | - | | | | - | | | | - | | | | - | | | | - | | | | - | | | | 30 | |
Other assets | | | | | | | | | | | | | | | | | | | | | | | | | | | | | | | | |
Derivatives | | | -9,369 | | | | 3,830 | | | | 1,548 | | | | 1,205 | | | | -1,769 | | | | 4,120 | | | | 1,744 | | | | 1,309 | |
Other assets | | | 1 | | | | 27 | | | | - | | | | - | | | | - | | | | 2 | | | | - | | | | 30 | |
| | | | -9,367 | | | | 3,857 | | | | 1,548 | | | | 1,205 | | | | -1,769 | | | | 4,122 | | | | 1,744 | | | | 1,339 | |
Accrued interest and fees receivable | | | 107 | | | | 72 | | | | 23 | | | | 9 | | | | 10 | | | | 102 | | | | -6 | | | | 318 | |
Total assets | | | 4,624 | | | | 7,180 | | | | 1,571 | | | | 1,231 | | | | 477 | | | | 6,428 | | | | 1,980 | | | | 23,490 | |
| | | | | | | | |
Liabilities and equity | | | | | | | | | | | | | | | | | | | | | | | | | | | | | | | | |
Liabilities | | | | | | | | | | | | | | | | | | | | | | | | | | | | | | | | |
Amounts owed to credit institutions | | | | | | | | | | | | | | | | | | | | | | | | | | | | | | | | |
Short-term amounts owed to credit institutions | | | 284 | | | | 88 | | | | - | | | | - | | | | - | | | | - | | | | - | | | | 372 | |
Long-term amounts owed to credit institutions | | | - | | | | - | | | | - | | | | - | | | | - | | | | - | | | | - | | | | - | |
| | | | 284 | | | | 88 | | | | - | | | | - | | | | - | | | | - | | | | - | | | | 372 | |
Debts evidenced by certificates | | | | | | | | | | | | | | | | | | | | | | | | | | | | | | | | |
Debt securities issued | | | 1,395 | | | | 7,025 | | | | 1,548 | | | | 1,222 | | | | 468 | | | | 6,325 | | | | 364 | | | | 18,347 | |
Other debt | | | 62 | | | | - | | | | - | | | | - | | | | - | | | | 3 | | | | 9 | | | | 74 | |
| | | | 1,457 | | | | 7,025 | | | | 1,548 | | | | 1,222 | | | | 468 | | | | 6,328 | | | | 373 | | | | 18,421 | |
Other liabilities | | | | | | | | | | | | | | | | | | | | | | | | | | | | | | | | |
Derivatives | | | - | | | | - | | | | - | | | | - | | | | - | | | | - | | | | 1,615 | | | | 1,615 | |
Other liabilities | | | 8 | | | | - | | | | - | | | | - | | | | - | | | | - | | | | - | | | | 8 | |
| | | | 8 | | | | - | | | | - | | | | - | | | | - | | | | - | | | | 1,615 | | | | 1,623 | |
Accrued interest and fees payable | | | 46 | | | | 65 | | | | 23 | | | | 9 | | | | 8 | | | | 98 | | | | -6 | | | | 243 | |
Total liabilities | | | 1,796 | | | | 7,178 | | | | 1,571 | | | | 1,230 | | | | 476 | | | | 6,426 | | | | 1,982 | | | | 20,659 | |
Equity | | | 2,614 | | | | - | | | | - | | | | - | | | | - | | | | - | | | | - | | | | 2,614 | |
Total liabilities and equity | | | 4,410 | | | | 7,178 | | | | 1,571 | | | | 1,230 | | | | 476 | | | | 6,426 | | | | 1,982 | | | | 23,273 | |
| | | | | | | | |
| | | | | | | | | | | | | | | | | | | | | | | | | | | | | | | | | |
Net of assets and liabilities as of 31 Dec 2013 | | | 215 | | | | 2 | | | | - | | | | - | | | | 1 | | | | 2 | | | | -3 | | | | 217 | |
65
(21) AVERAGE STATEMENT OF FINANCIAL POSITION
| | | | | | | | |
| (Amounts in EUR million) | | 2014 | | | 2013 | |
Assets | | | | | | | | |
Cash and cash equivalents | | | 2,195 | | | | 2,806 | |
Financial placements | | | | | | | | |
Placements with credit institutions | | | 6 | | | | 5 | |
Debt securities | | | 5,382 | | | | 5,186 | |
Other | | | 23 | | | | 21 | |
| | | | 5,411 | | | | 5,212 | |
Loans outstanding | | | 14,702 | | | | 14,996 | |
Intangible assets | | | 5 | | | | 5 | |
Tangible assets | | | 29 | | | | 29 | |
Other assets | | | | | | | | |
Derivatives (incl. exchange rate adjustments) | | | 1,622 | | | | 1,816 | |
Other assets | | | 24 | | | | 26 | |
| | | | 1,646 | | | | 1,842 | |
Accrued interest and fees receivable | | | 309 | | | | 324 | |
Total assets | | | 24,297 | | | | 25,213 | |
| | |
Liabilities and equity | | | | | | | | |
Liabilities | | | | | | | | |
Amounts owed to credit institutions | | | | | | | | |
Short-term amounts owed to credit institutions | | | 498 | | | | 1,045 | |
Long-term amounts owed to credit institutions | | | - | | | | 4 | |
| | | | 498 | | | | 1,049 | |
Short-term debt | | | - | | | | - | |
Debts evidenced by certificates | | | | | | | | |
Debt securities issued | | | 19,199 | | | | 19,819 | |
Other debt | | | 76 | | | | 76 | |
| | | | 19,275 | | | | 19,896 | |
Other liabilities | | | | | | | | |
Derivatives (incl. exchange rate adjustments) | | | 1,368 | | | | 1,264 | |
Other liabilities | | | 9 | | | | 10 | |
| | | | 1,377 | | | | 1,275 | |
Accrued interest and fees payable | | | 232 | | | | 244 | |
Total liabilities | | | 21,383 | | | | 22,463 | |
Equity | | | 2,914 | | | | 2,750 | |
Total liabilities and equity | | | 24,297 | | | | 25,213 | |
The average statement of financial position is calculated on a monthly basis.
66
(22) RELATED PARTY DISCLOSURES
The Bank provides administrative services to and enters into transactions with the Nordic Development Fund (NDF) and the Nordic Environment Finance Corporation (NEFCO), which have, for the most part, the same owners as NIB. The following table shows the outstanding balance of amounts owed to NDF, NEFCO and the trust funds administered by them, and the interest paid during the year. The interest paid to these institutions is at normal commercial rates.
| | | | | | | | | | | | | | | | |
| (Amounts in EUR 1,000) | | Interest from
related parties | | | Interest to related parties | | | Amounts owed by related parties as of 31 Dec | | | Amounts owed to related parties as of 31 Dec | |
2014 | | | - | | | | 17 | | | | 38 | | | | 40,012 | |
2013 | | | - | | | | 6 | | | | 82 | | | | 84,464 | |
| | | | |
Rental income (NDF, NEFCO) (Amounts in EUR 1,000) | | | | | | | | NDF | | | NEFCO | |
2014 | | | | | | | | | | | 141 | | | | 294 | |
2013 | | | | | | | | | | | 138 | | | | 234 | |
67
(23) CASH FLOW STATEMENT
Specification of the change in cash and cash equivalents, net on 31 December:
| | | | | | | | |
| (Amounts in EUR 1,000) | | 2014 | | | 2013 | |
Cash and balances with banks1 | | | 99,786 | | | | 101,406 | |
Short-term placements with credit institutions | | | 812,682 | | | | 529,995 | |
Collateralised placements2 | | | 726,671 | | | | 1,126,214 | |
Cash and cash equivalents | | | 1,639,139 | | | | 1,757,616 | |
| | | | | | | | | |
Short-term amounts owed to credit institutions3 | | | -872,010 | | | | -372,402 | |
Cash and cash equivalents, net | | | 767,129 | | | | 1,385,213 | |
| | | | | | | | | |
Change in cash and cash equivalents, net | | | -618,084 | | | | 161,363 | |
1 Including an initial margin requirement of EUR 836 (688) thousand for futures on 31 December.
2 Net exposure after collaterals for collateralised placements EUR 164 (215) thousand.
3 Of which cash received as collateral EUR 831,553 (282,651) thousand.
68
(24) EXCHANGE RATES
| | | | | | | | |
| | | EUR rate on 31 Dec 2014 | | | EUR rate on 31 Dec 2013 | |
DKK Danish krone | | | 7.4453 | | | | 7.4593 | |
ISK Icelandic króna | | | 154.151 | | | | 158.151 | |
NOK Norwegian krone | | | 9.042 | | | | 8.363 | |
SEK Swedish krona | | | 9.393 | | | | 8.8591 | |
ARS Argentine peso | | | 10.295212 | | | | 8.964132 | |
AUD Australian dollar | | | 1.4829 | | | | 1.5423 | |
BRL Brazilian real | | | 3.2207 | | | | 3.2576 | |
CAD Canadian dollar | | | 1.4063 | | | | 1.4671 | |
CHF Swiss franc | | | 1.2024 | | | | 1.2276 | |
CZK Czech koruna | | | 27.735 | | | | 27.427 | |
GBP Pound sterling | | | 0.7789 | | | | 0.8337 | |
HKD Hong Kong dollar | | | 9.417 | | | | 10.6933 | |
JPY Japanese yen | | | 145.23 | | | | 144.72 | |
MXN Mexican peso | | | 17.8679 | | | | 18.0731 | |
NZD New Zealand dollar | | | 1.5525 | | | | 1.6762 | |
PLN Polish zloty | | | 4.2732 | | | | 4.1543 | |
RUB Russian rouble | | | 72.337 | | | | 45.3246 | |
SDR Special drawing right | | | 0.8383 | | | | 0.8953 | |
SGD Singapore dollar | | | 1.6058 | | | | 1.7414 | |
TRY Turkish lira | | | 2.832 | | | | 2.9605 | |
TWD New Taiwan dollar | | | 38.18782 | | | | 41.05842 | |
USD US dollar | | | 1.2141 | | | | 1.3791 | |
ZAR South African rand | | | 14.0353 | | | | 14.566 | |
1 Reuters closing.
2 The exchange rate is calculated using the year-end market rate for USD/relevant currency, which then provides the EUR/relevant currency rate.
3 IMF (International Monetary Fund) closing per 31 December 2014 and per 30 December 2013.
69
[25] POST BALANCE SHEET EVENTS
There have been no material post balance sheet events that would require disclosure or adjustment to these financial statements. On 5 March 2015, the Board of Directors reviewed and signed the financial statements. These financial statements will be submitted for approval to the Annual Meeting of the Board of Governors scheduled to be held no later than by the end of May 2015.
70
Independent Auditors’ Report to the Control
Committee of the Nordic Investment Bank
Independent auditors’ report on the financial statements
In our capacity as auditors appointed by the Control Committee of the Nordic Investment Bank we have audited the accompanying financial statements of the Bank, which comprise the statement of financial position as at 31 December 2014, and the statement of comprehensive income, statement of changes in equity and statement of cash flows for the year then ended, and notes, comprising a summary of significant accounting policies and other explanatory information.
The Board of Directors’ and the President’s responsibility for the financial statements
The Board of Directors and the President are responsible for the preparation of the financial statements that give a true and fair view in accordance with International Financial Reporting Standards, and for such internal control as they determine is necessary to enable the preparation of financial statements that are free from material misstatement, whether due to fraud or error.
Auditor’s responsibility
Our responsibility is to express an opinion on these financial statements based on our audit. We conducted our audit in accordance with International Standards on Auditing. Those standards require that we comply with ethical requirements and plan and perform the audit to obtain reasonable assurance whether the financial statements are free from material misstatement.
An audit involves performing procedures to obtain audit evidence about the amounts and disclosures in the financial statements. The procedures selected depend on the auditor’s judgment, including the assessment of the risks of material misstatement of the financial statements, whether due to fraud or error. In making those risk assessments, the auditor considers internal control relevant to the entity’s preparation and fair presentation of the financial statements in order to design audit procedures that are appropriate in the circumstances, but not for the purpose of expressing an opinion on the effectiveness of the entity’s internal control. An audit also includes evaluating the appropriateness of accounting policies used and the reasonableness of accounting estimates made by management, as well as evaluating the overall presentation of the financial statements.
We believe that the audit evidence we have obtained is sufficient and appropriate to provide a basis for our audit opinion.
Opinion
In our opinion, the financial statements give a true and fair view of the financial position of the Nordic Investment Bank as at 31 December 2014, and of its financial performance and its cash flows for the year then ended in accordance with International Financial Reporting Standards as issued by the International Accounting Standards Board.
Report on the other requirements
In accordance with the Terms of Engagement our audit also included a review of whether the Board of Directors’ and the President’s administration have complied with the Statutes of the Bank. It is our opinion that the administration of the Board of Directors and the President complied with the Statutes of the Bank.
| | |
Helsinki, 6 March 2015 | | |
Sixten Nyman | | Hans Åkervall |
Authorised Public Accountant | | Authorised Public Accountant |
| |
KPMG Oy Ab | | KPMG AB |
Töölönlahdenkatu 3A | | Tegelbacken 4 A |
00100 Helsinki | | 103 23 Stockholm |
Finland | | Sweden |
71
Statement by the Control Committee of the
Nordic Investment Bank on the audit of the
administration and accounts of the bank
To the Board of Governors of the Nordic Investment Bank
In accordance with section 17 of the Statutes of the Nordic Investment Bank, we have been appointed to ensure that the operations of the Bank are conducted in accordance with its Statutes and to bear responsibility for the audit of the Bank and annually deliver an auditors’ report to the Board of Governors. Having completed our assignment for the year 2014, we hereby submit the following report.
The Control Committee met during the fiscal year as well as after the Bank’s Financial Statements had been prepared, and the Committee performed the control and examination measures considered necessary. The Annual Report of the Bank was examined at a meeting in Helsinki on 6 March 2015. In carrying out its tasks, the Control Committee received such information and carried out such examination measures as it deemed necessary to assess the Bank’s position in regard to its risks. We have also received the Independent Auditors’ Report, submitted on 6 March 2015 by the authorized public accountants appointed by the Control Committee.
Based on the audit, carried out by the independent auditors, we consider that:
| | ¡ | | The Bank’s operations during the financial year have been conducted in accordance with the Statutes; |
| | ¡ | | The Board of Directors and the President have complied with the Statutes of the Bank; and that |
| | ¡ | | The Financial Statements give a true and fair view of the financial position of the Bank as at 31 December 2014 and of its results and financing in 2014. The Statement of Comprehensive Income shows a profit of EUR 210,211,265.10 for the financial period. |
We recommend to the Board of Governors that:
| | ¡ | | The allocation of the Bank’s profit for the financial period, as proposed by the Board of Directors, be approved; |
| | ¡ | | The Statement of Comprehensive Income and the Statement of Financial Position be adopted; and |
| | ¡ | | The Board of Directors and the President be discharged from liability for the administration of the Bank’s operations during the accounting period examined by us. |
| | | | | | |
Helsinki, 6 March 2015 | | | | |
| | Leo Ašmanis | | | | |
| | | | | | |
Sigurður Þórðarson | | Karin Gaardsted | | Rannar Vassiljev | | |
| | | | | | |
Arto Pirttilahti | | Höskuldur Þórhallsson | | Karina Korna | | |
| | | | | | |
Daiva Raudonienė | | Kristian Norheim | | Penilla Gunther | | |
72