Exhibit XII
| | |
 | | Financial Report 2015 |
Contents
| | | | |
Report of the Board of Directors | | | 1 | |
| Proposal by the Board of Directors to the Board of Governors | | | 8 | |
Statement of comprehensive income | | | 9 | |
Statement of financial position | | | 10 | |
Changes in equity | | | 11 | |
Cash flow statement | | | 12 | |
| Notes to the financial statements | | | 14 | |
Note 1: Segment information | | | 33 | |
Note 2: Interest income and interest expense | | | 35 | |
Note 3: Commission income and fees received | | | 36 | |
Note 4: Net profit/loss on financial operations | | | 37 | |
Note 5: General administrative expenses | | | 38 | |
Note 6: Impairment of loans | | | 42 | |
Note 7: Financial placements | | | 43 | |
Note 8: Loans outstanding and guarantee commitments | | | 45 | |
Note 9: Intangible assets, tangible assets (property and equipment) | | | 50 | |
Note 10: Depreciation | | | 52 | |
| | | | |
Note 11: Other assets | | | 53 | |
Note 12: Debts evidenced by certificates and swaps | | | 54 | |
Note 13: Other liabilities | | | 55 | |
Note 14: Authorised capital – paid-in capital | | | 56 | |
Note 15: Statutory reserve and credit risk funds | | | 57 | |
Note 16: Collateral and commitments | | | 58 | |
Note 17: Fair value of financial instruments | | | 59 | |
Note 18: Maturity profile of financial assets and liabilities | | | 62 | |
Note 19: Interest rate risk | | | 64 | |
Note 20: Currency risk | | | 66 | |
Note 21: Related party disclosures | | | 68 | |
Note 22: Cash flow statement | | | 69 | |
Note 23: Exchange rates | | | 70 | |
Note 24: Post balance sheet events | | | 71 | |
Auditor´s report | | | 72 | |
Statement by the Control Committee | | | 74 | |
Report of the Board of Directors
Summary
| ● | | The Board concluded NIB’s strategy review in 2015. There will be no change to the core business model. The Bank will continue with the mission of financing investments that improve competitiveness and the environment in the region. The Board sees both pillars as being of equal importance. It put emphasis on identifying bankable environmental projects and cross-border investments that support member country integration. |
| ● | | Furthermore, it was decided that NIB will develop lending activities in two ways. The first route is to better serve SMEs and mid-sized corporates, which are important for growth and jobs in the region. The other initiative is to increase flexibility in non-member-country lending. The new lending initiatives to be implemented in 2016 are expected to promote the favourable development of lending volumes and support sustainable growth in the region. |
| ● | | NIB’s lending activities continued to develop very positively in 2015, with disbursements of loans reaching an all-time high of EUR 2,716 million. |
| ● | | Loans achieving a “good” or “excellent” mandate rating accounted for 94% of the total amount of lending. The majority of the environmental loans were for projects aimed at climate change mitigation in the member countries. Loans promoting competitiveness mainly supported investments in R&D, infrastructure and energy. |
| ● | | The profit was EUR 215 million (2014: EUR 210 million). |
| ● | | NIB raised EUR 4.3 billion in new funding and continued to issue NIB Environmental Bonds. |
| ● | | The Bank’s overall risk position remained strong in 2015, the main drivers being high asset quality, solid liquidity, and strong capitalisation. |
| ● | | During 2015, the Bank strengthened its risk management practice in line with evolving market standards. The Bank implemented, amongst other things, an improved framework for estimating loss given default and started developing an internal capital adequacy assessment process. |
Operating environment
Global growth weakened somewhat in 2015, reflecting uneven developments in the major regions. The recovery in advanced economies was not enough to fully offset the slowdown in emerging markets.
The Nordic–Baltic region experienced modest growth, but developments in the world economy affected the member countries in different ways. As a result of the low oil price, growth in oil-exporting Norway slowed down, whereas the rest of the region benefited from lower commodity prices. Some countries felt the effect of Russia’s weakened economy. On the positive side, Denmark, and particularly Sweden and Iceland, fared relatively well, and the Baltic countries showed resilience.
As a result of these developments, underlying demand for corporate investment-related credit remained subdued. The public sector’s demand for credit, however, was supported by large-scale investment needs. Against the background of a competitive Nordic banking sector and active bond markets, spreads remained compressed in most markets.
Strategy conclusions and implementation
In 2015, the Board of Directors concluded the Bank’s strategy review, which had been initiated one year before. During the process, the Board covered all relevant aspects of the Bank, such as its mission and success factors, lending operations, capital and liquidity, and the implications of possible changes in the strategy.
The key conclusion was that the present business model remains the foundation of NIB’s operations. The Bank will continue with the mission of financing investments that improve competitiveness and the environment in the region. The Board sees both pillars as being of equal importance. It put emphasis on identifying bankable environmental projects and cross-border investments.
NIB adopted a framework for monitoring and ex-post mandate assessment in order to evaluate the results of projects financed by the Bank.
Despite the unchanged focus, the Board saw it as important for the Bank to develop its lending activities in order to stay flexible and relevant for the future. The Board decided that during the coming years, NIB will seek to increase lending to SMEs in cooperation with financial intermediaries and to mid-sized corporates, which are important for growth and job creation in the region.
1
NIB will also put more emphasis on non-member-country lending. The Bank will cease to limit its non-member-country lending activities only to focus countries, with the aim of increasing non-member-country lending in the longer term, up to approximately one fifth of the annual new lending. By doing so, NIB is responding to its customers’ wishes for the Bank to become more involved in financing their investments outside the Nordic–Baltic region.
In addition, the Bank will increasingly focus on member country integration, investments in the Baltic countries and projects in the Arctic region.
The Board took its first decisions on how to implement the strategy conclusions for broadened lending activities. An Arctic Financing Facility with a framework of up to EUR 500 million in loans for projects in the Arctic region was set up.
The Board also adopted new financial policies for lending to SMEs and mid-sized corporates.
With the purpose of “keeping the house in order” and supporting the new lending initiatives, the Board stressed the importance of further advancement of compliance, governance and enterprise architecture, development of human resources, and improvement in the working environment. As a result, a number of projects were initiated, for instance an enhanced staff training programme.
Lending activities
NIB’s lending activities were better than anticipated in 2015. The Bank signed 45 loan agreements with an aggregate value of EUR 2,830 million. More than half of these loans were to new borrowers, which was in line with the Bank’s aim of broadening its client base. Lending volumes by business sector are displayed in the table below.
Disbursements of loans increased to an all-time high of EUR 2,716 million, compared to EUR 2,274 million in 2014. The largest sector was industries and services, with a substantial part of NIB’s financing provided for research and development. The public sector in the member countries was also a major recipient of loans.
High liquidity and subdued investment in the Nordic–Baltic region affected NIB’s loan portfolio through larger-than-average early redemptions of loans.
| | | | | | | | |
LENDING (IN EUR MILLION, UNLESS OTHERWISE SPECIFIED) | | 2015 | | | 2014 | |
Loans agreed according to areas: | | | | | | | | |
Energy and environment | | | 710 | | | | 630 | |
Infrastructure and telecom | | | 823 | | | | 557 | |
Industries and services | | | 996 | | | | 926 | |
Financial institutions and SMEs | | | 301 | | | | 277 | |
Loans agreed, total | | | 2,830 | | | | 2,389 | |
Member countries | | | 2,740 | | | | 2,327 | |
Non-member countries | | | 90 | | | | 62 | |
Loans disbursed, total | | | 2,716 | | | | 2,274 | |
Member countries | | | 2,546 | | | | 2,181 | |
Non-member countries | | | 170 | | | | 93 | |
Number of loan agreements, total | | | 45 | | | | 45 | |
Member countries | | | 44 | | | | 43 | |
Non-member countries | | | 1 | | | | 2 | |
Loans outstanding and guarantees | | | 15,627 | | | | 15,156 | |
Member countries | | | 13,347 | | | | 12,705 | |
Non-member countries | | | 2,341 | | | | 2,506 | |
Collective impairments | | | -61 | | | | -55 | |
Repayments/prepayments | | | 2,351 | | | | 2,005 | |
2
Mission fulfilment
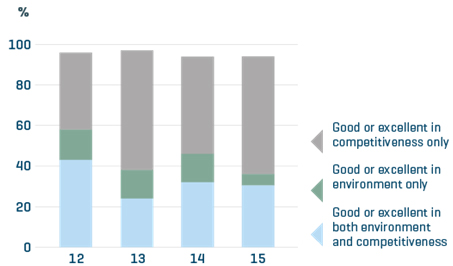
Each NIB-financed project is rated regarding how well it fulfils the Bank’s mission to improve competitiveness and the environment of the Nordic–Baltic countries. In 2015, the loans achieving a “good” or “excellent” mandate rating accounted for 94% of the total amount of loans agreed.
Besides fulfilling its mission, NIB’s lending operations are expected to add value to what the market provides. This is achieved by offering flexible long-term loans, providing diversification of financing sources and sharing expertise. NIB does not compete with commercial or other financiers; it complements them, especially through longer maturities.
Mandate rating
Competitiveness impact
In 2015, the largest part (36%) of NIB’s lending in the membership area was extended to industrial and service companies. NIB supported technological innovation in the member countries by providing financing to customers’ R&D programmes and investments in new production facilities. Moreover, a significant share of NIB’s lending to corporate clients was used to finance acquisitions of member and non-member area companies. Companies add value to their product offerings by developing and adopting new technology and skills through R&D and acquisitions. All agreed loans for corporates’ R&D activities received a “good” or “excellent” competitiveness rating. The share of acquisition projects rated at “good” and “excellent” was 44%. In total, lending to finance R&D projects and acquisitions accounted for 23% and 8%, respectively, of NIB’s loans agreed.
Infrastructure investments have a long-term impact on the region’s ability to maintain its attractiveness as a place to do business. As most of NIB’s member countries are sparsely populated, the quality of transport infrastructure and services is of utmost importance for creating a productive business environment. In 2015, NIB contributed 22% of its total loans agreed to transport infrastructure projects. All these loans received a “good” or “excellent” competitiveness rating.
The key focus of investments in the energy sector was on fuel diversification in order to reduce the region’s dependence on imported fuels. This trend also involved the upgrade of production technologies to increase the efficiency of energy assets. A significant share of NIB’s lending in the energy sector was provided for investments in new production facilities fuelled by local biomass resources.
Member area utilities continued to modernise and expand energy transmission and distribution networks. These investments help remove transmission bottlenecks and secure energy supply in all demand and weather conditions. NIB’s lending to the energy sector accounted for 25% of total loans agreed. The share of investments in new heat and power production facilities was 12%. All loans in this sector received a “good” or “excellent” competitiveness and/or environmental mandate rating.
In order to support small companies in better access to finance in member countries, NIB reached out to smaller counterparties by providing financing through financial intermediaries. Excluding unallocated credit lines, these loan programmes accounted for 7% of NIB’s total lending. This is considered an important method for NIB to strengthen the capacity of such companies to invest, grow and create jobs. Also, these loans were rated “good” or “excellent” for mandate impact.
3
Environmental impact
NIB defines loans to projects with significant direct or indirect positive environmental impacts as environmental loans, regardless of the sector in which they occur. In 2015, a total volume of EUR 1,019 million was agreed for projects with an environmental mandate rating of “good” or “excellent”, which is equivalent to 36% of the total agreed volume.
The majority of the environmental loans were related to projects aimed at climate change mitigation in the member countries. These were investments in energy efficiency improvements in public and commercial buildings, as well as investments in public rail transport infrastructure. Financing was also provided for renewable energy projects in the hydropower and waste-to-energy sectors.
When implemented, the NIB-financed energy projects will add 0.52 TWh annually to renewable energy generation. The Bank estimates that the loans agreed in 2015 are helping to reduce CO2 emissions by 50,100 tonnes annually, prorated to NIB’s share of the financing. Loans allocated for climate change mitigation projects accounted for 33% of NIB’s total lending volume.
Financing was also provided for two new wastewater treatment plants in Finland and for the technical improvement of industrial plants in Norway to reduce nitrogen oxide emissions into the air by 40%. Furthermore, an environmental loan was provided for an R&D programme with a focus on improving energy and resource efficiency in industrial production.
NIB’s Sustainability Policy and Guidelines cover the environmental, social and ethical aspects of the Bank’s operations. More detailed information on NIB’s corporate responsibility matters are described in the Annual Report 2015, specifically under GRI reporting, available online.
Treasury activities
NIB acquires funds for its lending by borrowing on the international capital markets. During 2015, NIB raised EUR 4.3 billion in new funding through 25 funding transactions. At year-end, outstanding debt totalled EUR 20.9 billion in 18 currencies. The largest transaction in 2015 was a three-year, USD 1.25 billion global benchmark transaction, which was issued in March. In September, NIB launched its second US dollar- denominated benchmark transaction, a five-year, USD 1 billion transaction.
Of the new funding issued in 2015, over EUR 2 billion was issued in US dollars, 13% directly in euros and 12% in Nordic currencies.
NIB continued to issue NIB Environmental Bonds (NEBs) and launched its first EUR benchmark bond under the NEB programme. A seven-year, EUR 500 million Environmental Bond benchmark was issued in September. NEBs are mainly sold to investors following socially responsible investment principles. The proceeds from the bonds are used to finance eligible projects with a positive impact on the environment. In 2015, the Bank enhanced the information and reporting towards investors regarding NIB Environmental Bonds on its website.
Of the total NIB investor base in 2015, Europe (including the Nordics) accounted for 42% and the Americas for 21%, while investors based in Asia bought 18% of NIB’s new issuance, and investors from the Australia/New Zealand region contributed a share of 12%.
| | | | | | | | | | | | |
FINANCIAL ACTIVITIES (IN EUR MILLION) | | 2015 | | | 2014 | | | 2013 | |
New debt issues | | | 4,276 | | | | 3,361 | | | | 4,080 | |
Debts evidenced by certificates at year-end | | | 20,862 | | | | 19,446 | | | | 18,421 | |
Number of borrowing transactions | | | 25 | | | | 35 | | | | 42 | |
Number of borrowing currencies | | | 11 | | | | 10 | | | | 12 | |
4
Risk management
The Bank’s overall risk position remained strong in 2015, with high asset quality, a solid liquidity and strong capitalisation being the main drivers.
The credit quality of the lending exposure was stable in 2015: 83% of the exposure was in investment-grade categories (risk classes 1–10), which was the same level as at year-end 2014. The exposure in the weakest risk classes (17–20), declined slightly to 0.4% (2014: 1%). The loan portfolio remained well balanced. There were no material changes in the geographical and sectoral distribution of the loan portfolio. At year-end, the member countries accounted for 84% (2014: 82%) of the total lending exposure, followed by 6% for Central and Eastern Europe, and 5% for Asia.
As in the previous year, the credit quality of the Treasury portfolio was strong, with close to 100% of the exposure in the investment-grade categories (risk classes 1–10). Of the Treasury exposure, 39% was within the member countries, compared to 35% the year before. The geographical distribution of the Treasury portfolio continued to be weighted towards Germany, Finland, the Netherlands and Sweden, accounting for 53% of the total exposure (2014: 57%).
The market risk remained largely unchanged. The Bank is mainly exposed to interest rate risk, credit spread risk in treasury operations and cross-currency basis risk. The market value sensitivities towards a one-basis-point shift in the specific yield curves were EUR 0.95 million, EUR 1.6 million and EUR 2 million, respectively.
The Bank’s liquidity position remained strong during 2015. At the end of the year, the liquidity buffer amounted to EUR 9,077 million, of which 29%, or EUR 2,653 million, was held as cash and short-term money market instruments, and 71%, or EUR 6,424 million, in securities with longer maturities.
The survival horizon, net stable funding ratio (NSFR) and liquidity coverage ratio[1] (LCR) are the measurements used for the purpose of assessing the liquidity risk. At year-end, the survival horizon measured according to the Bank’s liquidity policy was 431 days. The NFSR was approximately 150% and the LCR approximately 1,200%. The minimum NSFR and LCR requirements for commercial banks are 100% following the implementation of Basel III.
The Bank’s ordinary lending ceiling corresponds to 250% of the authorised capital and accumulated general reserves. At the end of 2015, the ordinary lending ceiling amounted to EUR 20,922 million, while the ordinary lending portfolio amounted to EUR 13,956 million.
The Bank strengthened its risk management in line with evolving market standards. During 2015, the Bank improved and implemented a framework for estimating loss given default and further developed risk management reporting to the decision-making bodies. Furthermore, the Bank started the work of developing an internal capital adequacy assessment process.
It was decided that the Bank should move from one-way to two-way credit support agreements. This is now the market standard and is expected to decrease the cost of derivative contracts for the Bank. It also requires a higher liquidity buffer to mitigate the need for the Bank to post collateral with swap counterparties.
Compliance
There were no allegations of corruption involving members of the Bank’s personnel. The Board of Directors was informed that three new external allegations of corruption were registered during 2015 and that the cases are currently under investigation by the Bank’s Committee on Fighting Corruption, in consultation with national enforcement agencies and co-financing partners. The Compliance Unit followed up with national enforcement agencies on other fraud and corruption cases for which investigations were concluded in 2013 and 2014.
During 2015, a major review of the Bank’s compliance and anti-corruption framework was undertaken. With the assistance of external consultants, the Bank also undertook a review of its current procedures and processes relating to anti-money laundering and counteracting terrorist financing. Proposed changes resulting from the reviews will be implemented in 2016.
[1] Liquidity coverage ratio is a measure banks need to report and adhere to. Given NIB’s business model based on long-term lending matched with long-term funding, LCR is less relevant for NIB than it is for commercial banks.
5
Financial results
NIB’s performance during the year demonstrates the underlying strength of its business model. Despite low interest rates, the Bank managed to improve its financial results. Profit totalled EUR 215 million, up from EUR 210 million in 2014.
The profit reflected growth in net interest income and lower loan impairment charges. This was partially offset by lower profits from financial operations.
The net interest income amounted to EUR 247 million, up 3% from the previous year. Both lending and treasury operations posted a net interest income higher than in 2014. Particularly encouraging was the net interest income growth from lending, mainly driven by a larger loan book. Commission income rose by EUR 3 million, to EUR 12 million.
The financial markets were volatile during the year, which resulted in greater uncertainty and wider spreads. In 2015, NIB updated its valuation model for derivative instruments in order to better align the valuation methods with the current market practice. A EUR 12 million net return on financial operations was recorded, which reflected the volatility of the markets and the fair value movements.
Administrative expenses and depreciation increased compared to 2014, mainly due to the changed depreciation methodology on intangible assets with a once-for-all effect of EUR 4.5 million. Further, the Bank made an extra provision of EUR 2 million for the purpose of planning, training and adapting to the changing banking industry requirements. As a consequence, the cost/income ratio based on underlying costs deteriorated from 15.1% in 2014 to 18.8% in 2015.
The quality of the loan portfolio remained high. Loan impairment charges were down, and in 2015 loan impairment charges amounted to EUR 3 million. New collective impairment charges amounted to EUR 6 million and the reversals of previously recorded impairments to EUR 3 million. The Bank continued to adopt a conservative approach in relation to impairments.
Since year-end 2014, the Bank’s total assets have increased by EUR 2 billion to EUR 27.3 billion.
| | | | | | | | | | | | |
KEY FIGURES (IN EUR MILLION) | | 2015 | | | 2014 | | | 2013 | |
Net interest income | | | 247 | | | | 239 | | | | 244 | |
Profit/loss on financial operations | | | 12 | | | | 26 | | | | 20 | |
Administrative expenses and depreciation | | | 50* | | | | 41 | | | | 39 | |
Loan impairments | | | 3 | | | | 21 | | | | 15 | |
Profit/loss | | | 215 | | | | 210 | | | | 217 | |
Equity | | | 3,146 | | | | 2,986 | | | | 2,831 | |
Total assets | | | 27,311 | | | | 24,870 | | | | 23,490 | |
Solvency ratio (equity/total assets, %) | | | 11.5% | | | | 12.0% | | | | 12.1% | |
Cost/income ratio | | | 18.8%* | | | | 15.1% | | | | 14.3% | |
* Including the effects from changed depreciation methodology and the extra provision as mentioned above.
Dividend
The Board of Directors proposes to the Board of Governors that EUR 55 million be paid as dividends to the Bank’s member countries for the year 2015.
6
Chairmanship and meetings
During the year, the Board had eight meetings and one online meeting, all chaired by Pentti Pikkarainen (Finland). As well as formal agenda items, the meetings included seminars (four during the year) with the Bank’s customers, investors and other invited experts. In connection with the Board meetings in Lithuania and Norway, the members visited the LNG terminal in Klaipeda, the Lysebotn 2 hydropower plant and the Ryfast road tunnel in Stavanger, which are financed by NIB loans. In London, the Board met with the rating agency Standard & Poor’s, the Financial Conduct Authority (FCA), HSBC and the EBRD. The Board continued its efforts to further improve the efficiency of the decision-making process on the basis of a self-evaluation process that had been finalised. The Board also discussed the possibility of undergoing a “fit and proper” test.
Outlook
Going into 2016, prospects across the main regions remain uneven. Although global growth is projected to gather pace somewhat, uncertainties remain, caused by declining commodity prices, weaker emerging market economies and financial market volatility. Forecasts for the Nordic–Baltic countries vary from a slight pick-up in activity in Finland to continued robust growth in Sweden.
As Nordic banks continue to supply credit and corporate investment remains modest despite accommodative central bank policies, volumes and margins are unlikely to pick up in the near term. Meanwhile, the rise in short-term financing rates in the US dollar could further increase spreads in the euro corporate bond market.
In 2016, the Bank expects somewhat lower results compared to the previous year. This is due to lower income from treasury operations in the prevailing market conditions. NIB expects that the new lending initiatives, which will be gradually implemented in 2016, will further support the favourable development of lending volumes and sustainable growth in the region.
7
Proposal by the Board of Directors to the Board of Governors
The Board of Directors’ proposal with regard to the financial results for the year 2015 takes into account the need to maintain the Bank’s ratio of equity to total risk-weighted assets at a secure level, which is a prerequisite for maintaining the Bank’s high creditworthiness.
In accordance with section 11 of the Statutes of the Bank, the profit for 2015 of EUR 215,398,492.93 is to be allocated as follows:
| ● | | EUR 110,398,492.93 will be transferred to the General Credit Risk Fund as a part of equity; |
| ● | | EUR 50,000,000.00 will be transferred to the Special Credit Risk Fund for Project Investment Loans; |
| ● | | no transfer is made to the Statutory Reserve. The Statutory Reserve amounts to EUR 686,325,305.70 or 11.2 % of the Bank’s authorized capital stock; and |
| ● | | EUR 55,000,000.00 will be made available for distribution as dividends to the Bank’s member countries. |
More information can be found in the statement of comprehensive income, the statement of financial position, the changes in equity and cash flow statement, as well as the notes to the financial statements.
| | | | |
| | Helsinki, 3 March 2016 | | |
Pentti Pikkarainen Sven Hegelund Þorsteinn Þorsteinsson | | Trond Eklund Julie Sonne Henrik Normann President & CEO | | Kaspars Āboliņš Algimantas Rimkūnas Madis Üürike |
8
Statement of comprehensive income 1 January – 31 December
| | | | | | | | | | | | |
| EUR 1,000 | | NOTE | | 2015 | | 2014 |
Interest income | | | | | | | 338,781 | | | | 382,760 | |
Interest expense | | | | | | | -92,005 | | | | -143,652 | |
Net interest income | | | (1), (2), (21) | | | | 246,776 | | | | 239,108 | |
| | | |
Commission income and fees received | | | (3) | | | | 12,218 | | | | 9,326 | |
Commission expense and fees paid | | | | | | | -2,212 | | | | -2,092 | |
Net profit/loss on financial operations | | | (4) | | | | 11,521 | | | | 25,684 | |
Foreign exchange gains and losses | | | | | | | 82 | | | | 187 | |
Operating income | | | | | | | 268,385 | | | | 272,211 | |
| | | |
Expenses | | | | | | | | | | | | |
General administrative expenses | | | (5), (21) | | | | 41,740 | | | | 37,386 | |
Depreciation | | | (9), (10) | | | | 8,737 | | | | 3,709 | |
Impairment of loans | | | (6), (8) | | | | 2,509 | | | | 20,905 | |
Total expenses | | | | | | | 52,987 | | | | 62,000 | |
| | | | | | | | | | | | | |
PROFIT/LOSS FOR THE YEAR | | | | | | | 215,398 | | | | 210,211 | |
| | | |
| | | | | | | | | | | | | |
Total comprehensive income | | | | | | | 215,398 | | | | 210,211 | |
The Nordic Investment Bank’s accounts are kept in euro.
9
Statement of financial position at 31 December
| | | | | | | | | | | | | | | | |
EUR 1,000 | | | | NOTE | | 2015 | | 2014 |
ASSETS | | | | | | | (1), (18), (19), (20) | | | | | | | | | |
Cash and cash equivalents | | | | | | | (17), (22) | | | | 2,666,070 | | | | 1,639,139 | |
Financial placements | | | | | | | (17) | | | | | | | | | |
Placements with credit institutions | | | | | | | | | | | 7,921 | | | | 6,571 | |
Debt securities | | | | | | | (7) | | | | 6,080,069 | | | | 5,489,623 | |
Other | | | | | | | | | | | 22,023 | | | | 22,190 | |
| | | | | | | | | | | | 6,110,012 | | | | 5,518,384 | |
Loans outstanding | | | | | | | (8), (17) | | | | 15,626,946 | | | | 15,156,486 | |
Intangible assets | | | | | | | (9) | | | | – | | | | 5,217 | |
Tangible assets, property and equipment | | | | | | | (9) | | | | 28,360 | | | | 28,324 | |
Other assets | | | | | | | (11), (17) | | | | | | | | | |
Derivatives | | | | | | | | | | | 2,557,979 | | | | 2,198,003 | |
Other assets | | | | | | | (21) | | | | 23,103 | | | | 19,259 | |
| | | | | | | | | | | | 2,581,083 | | | | 2,217,262 | |
Accrued interest and fees receivable | | | | | | | | | | | 298,977 | | | | 305,590 | |
TOTAL ASSETS | | | | | | | | | | | 27,311,447 | | | | 24,870,400 | |
| | | | |
LIABILITIES AND EQUITY | | | | | | | (1), (18), (19), (20) | | | | | | | | | |
Liabilities | | | | | | | | | | | | | | | | |
Amounts owed to credit institutions | | | | | | | (17), (21) | | | | | | | | | |
Short-term amounts owed to credit institutions | | | | | | | (16), (22) | | | | 1,448,888 | | | | 872,010 | |
Long-term amounts owed to credit institutions | | | | | | | | | | | 18,000 | | | | – | |
| | | | | | | | | | | | 1,466,888 | | | | 872,010 | |
Repurchase agreements | | | | | | | | | | | 122,556 | | | | – | |
Debts evidenced by certificates | | | | | | | (12), (17) | | | | | | | | | |
Debt securities issued | | | | | | | | | | | 20,802,164 | | | | 19,369,052 | |
Other debt | | | | | | | | | | | 59,860 | | | | 76,597 | |
| | | | | | | | | | | | 20,862,024 | | | | 19,445,649 | |
Other liabilities | | | | | | | (13), (17) | | | | | | | | | |
Derivatives | | | | | | | | | | | 1,480,736 | | | | 1,329,097 | |
Other liabilities | | | | | | | | | | | 9,946 | | | | 6,760 | |
| | | | | | | | | | | | 1,490,682 | | | | 1,335,857 | |
Accrued interest and fees payable | | | | | | | | | | | 222,800 | | | | 230,786 | |
Total liabilities | | | | | | | | | | | 24,164,950 | | | | 21,884,302 | |
Equity | | | | | | | | | | | | | | | | |
Authorised and subscribed capital | | | 6,141,903 | | | | | | | | | | | | | |
of which callable capital | | | -5,723,302 | | | | | | | | | | | | | |
Paid-in capital | | | 418,602 | | | | (14) | | | | 418,602 | | | | 418,602 | |
Reserve funds | | | | | | | (15) | | | | | | | | | |
Statutory Reserve | | | | | | | | | | | 686,325 | | | | 686,325 | |
General Credit Risk Fund | | | | | | | | | | | 1,430,252 | | | | 1,275,041 | |
Special Credit Risk Fund PIL | | | | | | | | | | | 395,919 | | | | 395,919 | |
Profit/loss for the year | | | | | | | | | | | 215,398 | | | | 210,211 | |
Total equity | | | | | | | | | | | 3,146,497 | | | | 2,986,099 | |
TOTAL LIABILITIES AND EQUITY | | | | | | | | | | | 27,311,447 | | | | 24,870,400 | |
Collateral and commitments | | | | | | | (16) | | | | | | | | | |
The Nordic Investment Bank’s accounts are kept in euro.
10
Changes in equity
| | | | | | | | | | | | | | | | | | | | | | | | | | | | | | | | | | | | | | |
EUR 1,000 | | PAID-IN
CAPITAL | | | STATUTORY
RESERVE | | | GENERAL
CREDIT RISK
FUND | | | SPECIAL
CREDIT RISK
FUND PIL | | | PAYMENTS TO THE
BANK’S STATUTORY
RESERVE AND CREDIT
RISK FUNDS | | | APPROPRIATION TO
DIVIDEND PAYMENT | | | OTHER VALUE
ADJUSTMENTS | | | PROFIT/LOSS
FOR THE YEAR | | | TOTAL | | | |
| | | |
| EQUITY AT 31 DECEMBER 2013 | | | 418,602 | | | | 686,325 | | | | 1,112,831 | | | | 395,919 | | | | 0 | | | | 0 | | | | 0 | | | | 217,210 | | | | 2,830,887 | | | |
| | | |
| Appropriations between reserve funds | | | | | | | | | | | 162,210 | | | | | | | | | | | | 55,000 | | | | | | | | -217,210 | | | | 0 | | | |
| | | |
| Paid-in capital | | | | | | | | | | | | | | | | | | | | | | | | | | | | | | | | | | | 0 | | | |
| | | |
| Called-in authorised and subscribed capital | | | | | | | | | | | | | | | | | | | | | | | | | | | | | | | | | | | 0 | | | |
| | | |
| Payments to the Bank’s Statutory Reserve and credit risk funds, receivable | | | | | | | | | | | | | | | | | | | | | | | | | | | | | | | | | | | 0 | | | |
| | | |
| Dividend payment | | | | | | | | | | | | | | | | | | | | | | | -55,000 | | | | | | | | | | | | -55,000 | | | |
| | | |
| Comprehensive income for the year | | | | | | | | | | | | | | | | | | | | | | | | | | | | | | | 210,211 | | | | 210,211 | | | |
| | | |
| EQUITY AT 31 DECEMBER 2014 | | | 418,602 | | | | 686,325 | | | | 1,275,041 | | | | 395,919 | | | | 0 | | | | 0 | | | | 0 | | | | 210,211 | | | | 2,986,099 | | | |
| | | |
| Appropriations between reserve funds | | | | | | | | | | | 155,211 | | | | | | | | | | | | 55,000 | | | | | | | | -210,211 | | | | 0 | | | |
| | | |
| Paid-in capital | | | | | | | | | | | | | | | | | | | | | | | | | | | | | | | | | | | 0 | | | |
| | | |
| Called-in authorised and subscribed capital | | | | | | | | | | | | | | | | | | | | | | | | | | | | | | | | | | | 0 | | | |
| | | |
| Payments to the Bank’s Statutory Reserve and credit risk funds, receivable | | | | | | | | | | | | | | | | | | | | | | | | | | | | | | | | | | | 0 | | | |
| | | |
| Dividend payment | | | | | | | | | | | | | | | | | | | | | | | -55,000 | | | | | | | | | | | | -55,000 | | | |
| | | |
| Comprehensive income for the year | | | | | | | | | | | | | | | | | | | | | | | | | | | | | | | 215,398 | | | | 215,398 | | | |
EQUITY AT 31 DECEMBER 2015 | | | 418,602 | | | | 686,325 | | | | 1,430,252 | | | | 395,919 | | | | 0 | | | | 0 | | | | 0 | | | | 215,398 | | | | 3,146,497 | | | |
| | | | | | | | |
PROPOSED APPROPRIATION OF THE YEAR’S PROFIT/LOSS | | 2015 | | | 2014 | |
Appropriation to Statutory Reserve | | | – | | | | – | |
Appropriations to credit risk reserve funds | | | | | | | | |
General Credit Risk Fund | | | 110,398 | | | | 155,211 | |
Special Credit Risk Fund PIL | | | 50,000 | | | | – | |
Appropriation to dividend payment | | | 55,000 | | | | 55,000 | |
Profit/loss for the year | | | 215,398 | | | | 210,211 | |
The Nordic Investment Bank’s accounts are kept in euro.
11
Cash flow statement 1 January – 31 December
| | | | | | | | | | |
EUR 1,000 | | NOTE | | JAN–DEC 2015 | | | JAN–DEC 2014 | |
Cash flows from operating activities | | | | | | | | | | |
Profit/loss from operating activities | | | | | 215,398 | | | | 210,211 | |
| | | |
Adjustments: | | | | | | | | | | |
Unrealised gains/losses of financial assets held at fair value | | | | | 13,865 | | | | -27,631 | |
Depreciation and write-down in value of tangible and intangible assets | | | | | 8,737 | | | | 3,709 | |
Change in accrued interest and fees (assets) | | | | | 6,613 | | | | 12,491 | |
Change in accrued interest and fees (liabilities) | | | | | -7,986 | | | | -12,069 | |
Impairment of loans | | | | | 2,509 | | | | 20,905 | |
Adjustment to hedge accounting | | | | | -20,667 | | | | 1,019 | |
Other adjustments to the year’s profit | | | | | 376 | | | | -641 | |
Adjustments, total | | | | | 3,447 | | | | -2,217 | |
| | | |
Lending | | | | | | | | | | |
Disbursements of loans | | | | | -2,715,757 | | | | -2,273,619 | |
Repayments of loans | | | | | 2,350,532 | | | | 2,005,001 | |
Capitalisations, redenominations, index adjustments, etc. | | | | | -51 | | | | -69 | |
Exchange rate adjustments | | | | | -247,764 | | | | -84,071 | |
Lending, total | | | | | -613,039 | | | | -352,758 | |
| | | | | | | | | | | |
Cash flows from operating activities, total | | | | | -394,193 | | | | -144,763 | |
| | | |
Cash flows from investing activities | | | | | | | | | | |
Placements and debt securities | | | | | | | | | | |
Purchase of debt securities | | | | | -2,168,290 | | | | -2,555,763 | |
Sold and matured debt securities | | | | | 1,614,972 | | | | 2,489,721 | |
Placements with credit institutions | | | | | -1,350 | | | | -830 | |
Other financial placements | | | | | 2,699 | | | | 1,663 | |
Exchange rate adjustments, etc. | | | | | -59,523 | | | | -36,599 | |
Placements and debt securities, total | | | | | -611,491 | | | | -101,808 | |
| | | |
Other items | | | | | | | | | | |
Acquisition of intangible assets | | | | | -1,005 | | | | -1,637 | |
Acquisition of tangible assets | | | | | -2,551 | | | | -861 | |
Change in other assets | | | | | 5,676 | | | | 16,570 | |
Other items, total | | | | | 2,120 | | | | 14,072 | |
| | | | | | | | | | | |
Cash flows from investing activities, total | | | | | -609,372 | | | | -87,736 | |
12
| | | | | | | | | | | | |
EUR 1,000 | | NOTE | | | JAN–DEC 2015 | | | JAN–DEC 2014 | |
| | | | | | | | | | | | |
Cash flows from financing activities | | | | | | | | | | | | |
Debts evidenced by certificates | | | | | | | | | | | | |
Issues of new debt | | | | | | | 4,276,138 | | | | 3,360,777 | |
Redemptions | | | | | | | -3,636,669 | | | | -4,031,164 | |
Exchange rate adjustments | | | | | | | 884,174 | | | | 1,272,741 | |
Debts evidenced by certificates, total | | | | | | | 1,523,643 | | | | 602,354 | |
| | | |
Other items | | | | | | | | | | | | |
Long-term placements from credit institutions | | | | | | | 18,000 | | | | – | |
Change in swap receivables | | | | | | | -441,813 | | | | -653,925 | |
Change in swap payables | | | | | | | 218,769 | | | | -277,680 | |
Change in other liabilities | | | | | | | 3,186 | | | | -1,334 | |
Dividend paid | | | | | | | -55,000 | | | | -55,000 | |
Paid-in capital and reserves | | | | | | | – | | | | – | |
Other items, total | | | | | | | -256,858 | | | | -987,939 | |
| | | | | | | | | | | | |
Cash flows from financing activities, total | | | | | | | 1,266,784 | | | | -385,585 | |
| | | | | | | | | | | | |
CHANGE IN CASH AND CASH EQUIVALENTS, NET | | | (22) | | | | 263,219 | | | | -618,084 | |
| | | |
Opening balance for cash and cash equivalents, net | | | | | | | 767,129 | | | | 1,385,213 | |
Closing balance for cash and cash equivalents, net | | | | | | | 1,030,348 | | | | 767,129 | |
| | | |
Additional information to the statement of cash flows | | | | | | | | | | | | |
Interest income received | | | | | | | 345,394 | | | | 395,321 | |
Interest expense paid | | | | | | | -99,991 | | | | -155,722 | |
The cash flow statement has been prepared using the indirect method and cash flow items cannot be directly concluded from the statements of financial positions.
13
Notes to the financial statements
Accounting policies
General operating principles
The operations of the Nordic Investment Bank (hereinafter called “the Bank” or “NIB”) are governed by an agreement (hereinafter called “the Agreement”) between the governments of Denmark, Estonia, Finland, Iceland, Latvia, Lithuania, Norway and Sweden (hereinafter called “the member countries”), and the Statutes adopted in conjunction with the Agreement. NIB is an international financial institution that operates in accordance with sound banking principles. NIB finances private and public projects that have high priority for the member countries and borrowers. NIB finances projects both within and outside the member countries, and offers its clients long-term loans and guarantees on competitive market terms.
NIB acquires the funds to finance its lending by borrowing on international capital markets.
The authorised capital stock of the Bank is subscribed by the member countries. Any increase or decrease in the authorised capital stock shall be decided by the Board of Governors, upon a proposal of the Board of Directors of the Bank.
In the member countries, the Bank has the legal status of an international legal person, with full legal capacity, and is exempt from payment restrictions and credit policy measures. The Agreement concerning NIB contains provisions regarding immunities and privileges accorded to the Bank, e.g. the exemption of the Bank’s assets and income from taxation.
The headquarters of the Bank are located at Fabianinkatu 34 in Helsinki, Finland.
Significant accounting policies
Basis for preparing the financial statements
The Bank’s financial statements have been prepared in accordance with International Financial Reporting Standards (IFRS) issued by the International Accounting Standards Board (IASB). The Bank’s accounts are kept in euro. With the exceptions noted below, they are based on historical cost.
Significant accounting judgements and estimates
As part of the process of preparing the financial statements in conformity with IFRS, the Bank’s management is required to make certain judgements, estimates and assumptions that may affect the Bank’s profits, its financial position and other information presented in the Annual Report. These estimates are based on available information and the judgements made by the Bank’s management. Actual outcomes may deviate from the assessments made, and such deviations may at times be substantial.
The Bank uses various valuation models and techniques to estimate the fair values of assets and liabilities. There are significant uncertainties related to these estimates, in particular when they involve modelling complex financial instruments, such as derivative instruments used for hedging activities related to both borrowing and lending. The estimates are highly dependent on market data, such as the level of interest rates, currency rates and other factors. The uncertainties related to these estimates are reflected mainly in the statement of financial position. NIB undertakes continuous development in order to improve the basis for fair value estimates, with regard to both modelling and market data. Changes in estimates resulting from refinements in assumptions and methodologies are reflected in the period in which the enhancements are first applied.
Judgements and estimates are also associated with impairment testing of loans and claims.
14
Foreign currency translation
Monetary assets and liabilities denominated in foreign currencies are recognised in the accounts at the exchange rate prevailing on the closing date. Non-monetary assets and liabilities are recognised in the accounts at the euro rate prevailing on the transaction date. Income and expenses recognised in currencies other than the euro are converted on a daily basis to the euro, in accordance with the euro exchange rate prevailing on that day.
Realised and unrealised exchange rate gains and losses are recognised in the statement of comprehensive income.
The Bank uses the official exchange rates published for the euro by the European Central Bank. See Note 23.
Recognition and derecognition of financial instruments
Financial instruments are recognised in the statement of financial position on a settlement date basis, except for derivative instruments, which are recognized on a trade date basis.
A financial asset is derecognised when the contractual rights to the cash flows from the financial asset expire.
A financial liability is removed from the statement of financial position when the obligation specified in the contract is discharged, cancelled or expires.
Basis for classification and measurement
The financial statements have been prepared on the historical cost basis, except for the following material items in the statement of financial position.
Following the early adoption of IFRS 9 in 2011, the Bank classifies its financial assets into the following categories: those measured at amortised cost, and those measured at fair value. This classification depends on both the contractual characteristics of the assets and the business model adopted for their management.
Financial assets at amortised cost
An investment is classified at “amortised cost” only if both of the following criteria are met: the objective of the Bank’s business model is to hold the assets in order to collect the contractual cash flows, and the contractual terms of the financial assets must give rise on specified dates to cash flows that are only payments of principal and interest on the principal amount outstanding.
Financial assets at fair value
If either of the two criteria above is not met, the asset cannot be classified in the amortised cost category and must be classified at fair value.
Recognised financial assets and financial liabilities designated as hedged items in qualifying fair value hedge relationships are adjusted for changes in fair value attributable to the risk being hedged.
Determination of fair value
The fair value of financial instruments, including derivative instruments that are traded in a liquid market, is the bid or offered closing price on the balance sheet date. Where the fair values cannot be derived from active markets, they are determined using a variety of valuation techniques that include the use of mathematical models. The input to these models is taken from observable market data where possible. Many of NIB’s financial instruments are not traded in a liquid market, such as the Bank’s borrowing transactions with embedded derivative instruments. These are measured at fair value using different valuation models and techniques. This process involves determining future expected cash flows, which can then be discounted to the balance sheet date. The estimation of future cash flows for these instruments is subject to assumptions on market data, and in some cases, in particular where options are involved, even on the behaviour of the Bank’s counterparties. The fair value estimate may therefore be subject to variations and may not be realisable in the market. Under different market assumptions, the values could also differ substantially.
15
The Bank measures fair values using the following fair value hierarchy, which reflects the significance of the inputs used in making the measurements:
Level 1: Quoted market prices (unadjusted) in an active market for identical instruments.
Level 2: Valuation techniques based on observable inputs, either directly (i.e. as prices) or indirectly (i.e. derived from prices). This category includes instruments valued using: quoted market prices in active markets for similar instruments, quoted prices for identical or similar instruments in markets that are considered less than active, or other valuation techniques where all significant inputs are directly or indirectly observable from market data.
Level 3: Valuation techniques using significant unobservable inputs. This category includes all instruments where the valuation technique includes inputs not based on observable data and where the unobservable inputs have a significant effect on the instrument’s valuation. This category includes instruments that are valued based on quoted prices for similar instruments where significant unobservable adjustments or assumptions are required to reflect differences between the instruments.
See Note 17 for further details.
Cash and cash equivalents
Cash and cash equivalents comprise monetary assets and placements with original maturities of six months or less, calculated from the date the acquisition and placements were made.
Cash and cash equivalents in the cash flow statement refers to the net amount of monetary assets, placements and liabilities with original maturities of six months or less, calculated from the time the transaction was entered into.
Financial placements
Items recognised as financial placements in the statement of financial position include placements with credit institutions and placements in debt securities, for example, bonds and other debt certificates, as well as certain placements in instruments with equity features. The placements are initially recognised on the settlement date. Their subsequent accounting treatment depends on both the Bank’s business model for managing the placements and their contractual cash flow characteristics.
Reclassifications
Following the amendment to IAS 39 issued in October 2008, permitting the reclassification of financial assets in certain restricted circumstances, the Bank decided to reclassify EUR 715 million of its trading portfolio assets into the held-to-maturity portfolio. This amendment has been applied retrospectively to commence on 1 September 2008. The reclassification has resulted in the cessation of fair value accounting for those assets previously designated as held for trading. The fair values of the assets at the date of reclassification became their new amortised cost, and those assets will subsequently be accounted for on that measurement basis. The reclassified cost will be amortised over the instrument’s expected remaining lifetime through interest income using the effective interest method. See Note 7.
Lending
The Bank may grant loans and provide guarantees under its Ordinary Lending or under special lending facilities. The special lending facilities, which carry member country guarantees, consist of Project Investment Loans (PIL) and Environmental Investment Loans (MIL).
Ordinary Lending includes loans and guarantees within and outside the member countries. The Bank’s Ordinary Lending ceiling corresponds to 250% of its authorised capital and accumulated general reserves and amounts to EUR 20,922 million following the allocations of the year’s profit in accordance with the Board of Directors’ proposal.
16
Project Investment Loans are granted for financing creditworthy projects in the emerging markets of Africa, Asia, Europe and Eurasia, Latin America and the Middle East. The Bank’s Statutes permit loans to be granted and guarantees to be issued under the PIL facility up to an amount corresponding to EUR 4,000 million. The member countries guarantee the PIL loans up to a total amount of EUR 1,800 million. The Bank, however, will assume 100% of any losses incurred under an individual PIL loan, up to the amount available at any given time in the Special Credit Risk Fund for PIL. Only thereafter would the Bank be able to call on the member countries’ guarantees according to the following principle: the member countries guarantee 90% of each loan under the PIL facility up to a total amount of EUR 1,800 million. Payment under the member countries’ guarantees would take place at the request of the Board of Directors, as provided for under an agreement between the Bank and each individual member country.
The Bank is authorised to grant special Environmental Investment Loans, originally up to the amount of EUR 300 million, for the financing of environmental projects in the areas adjacent to the member countries. The Bank’s member countries guarantee 100% of the MIL facility. For further information about the MIL facility as of 31 December 2015, see “Distribution of loans outstanding and guarantees by various types of security” in Note 8.
The Bank’s lending transactions are recognised in the statement of financial position at the time the funds are transferred to the borrower. Loans are recognised initially at historical cost, which corresponds to the fair value of the transferred funds, including transaction costs. Loans outstanding are carried at amortised cost. If the loans are hedged against changes in fair value caused by changes in market interest rates by using derivative instruments, they are recognised in the statement of financial position at fair value, with value changes recognised in the statement of comprehensive income.
Impairment of loans and receivables
Impairment of individually assessed loans
The Bank reviews its problem loans and receivables on each reporting date to assess whether an allowance for impairment should be recorded in the statement of comprehensive income. In particular, the judgement of the management is required in estimating the amount and timing of future cash flows when determining the level of allowance required. Such estimates are based on assumptions about a number of factors, and actual results may differ, resulting in future changes to the allowance.
Receivables are carried at their estimated recoverable amount. Where the collectability of identified loans is in doubt, specific impairment losses are recognised in the statement of comprehensive income. Impairment is defined as the difference between the carrying value of the asset and the net present value of expected future cash flows, determined using the instrument’s original effective interest rate, where applicable. If the carrying amount of the loan is higher than the net present value of the estimated future cash flows, including the fair value of the collaterals, the loan is impaired.
For issued guarantees, the impairment is recognised when it is both probable that the guarantee will need to be settled and the settlement amount can be reliably estimated.
In the event that payments in respect of an ordinary loan are more than 90 days overdue, all of the borrower’s loans are deemed to be non-performing, and consequently the need for impairment is assessed and recognised.
In the event that payments in respect of a PIL loan to a government or guaranteed by a government are more than 180 days overdue, all of the borrower’s loans are deemed to be non-performing.
Whenever payments in respect of a PIL loan that is not to a government or guaranteed by a government are more than 90 days overdue, all of the borrower’s loans are deemed to be non-performing. Impairment losses are then recognised in respect of the part of the outstanding loan principal, interest, and fees that correspond to the Bank’s own risk for this loan facility at any given point in time.
Whenever payments in respect of a MIL loan that is not to a government or guaranteed by a government are more than 90 days overdue, or payments in respect of a MIL loan to a government or guaranteed by a government are more than 180 days overdue, all of the borrower’s loans are deemed to be non-performing. Due to the Bank’s member countries’ guarantees, no impairment losses are recognised for MIL loans.
Impairment of collectively assessed loans
Loans that are not individually impaired will be transferred to a group of loans with similar risk characteristics for a collective impairment test.
17
The Bank assesses the need to make a collective impairment test on exposures which, although not specifically identified as requiring a specific allowance, have a greater risk of default than when originally granted. This collective impairment test is based on any deterioration in the internal rating of the groups of loans or investments from the time they were granted or acquired. These internal ratings take into consideration factors such as any deterioration in counterparty risk, the value of collaterals or securities received, and the outlook for the sector, as well as identified structural weaknesses or deterioration in cash flows.
The process includes the management’s judgement based on the current macroeconomic environment and the current view of the expected economic outlook. In the Bank’s view, the assumptions and estimates made are appropriately conservative and are reflective of the predicted economic conditions, the Bank’s portfolio characteristics and their correlation with losses incurred based on historical loss experience. The impairment remains related to the group of loans until the losses have been identified on an individual basis.
Intangible assets
Intangible assets mainly consist of investments in software, software licences and ongoing investments in new ICT systems. Acquisitions that generate economic benefits exceeding costs beyond one year are recognised as intangible assets. The investments are carried at historical cost, and are amortised over the assessed useful life of the assets, which is estimated to be between three and five years. The amortisations are made on a straight-line basis.
Tangible assets
Tangible assets in the statement of financial position include land, buildings, office equipment and other tangible assets owned by the Bank. The assets are recognised at historical cost, less any accumulated depreciation based on their assessed useful life. No depreciations are made for land. The Bank’s office building in Helsinki is depreciated on a straight-line basis over a 40-year period. The Bank’s other buildings are depreciated over a 30-year period. The depreciation period for office equipment and other tangible assets is determined by assessing the individual item. The depreciation period is usually three to five years. The depreciations are calculated on a straight-line basis.
Write-downs and impairment of intangible and tangible assets
The Bank’s assets are reviewed annually for impairment. If there is any objective evidence of impairment, the impairment loss is determined based on the recoverable amount of the assets.
Derivative instruments and hedge accounting
The Bank’s derivative instruments are recognised on a trade-date basis at fair value in the statement of financial position as “Other assets” or “Other liabilities”.
During the time the Bank holds a derivative instrument, any changes in the fair value of such an instrument are recognised in the statement of comprehensive income, or directly in “Equity” as part of the item “Other value adjustments”, depending on the purpose for which the instruments were acquired. The value changes of derivative instruments that were not acquired for hedging purposes are recognised in the statement of comprehensive income. The accounting treatment for derivative instruments that were acquired for hedging purposes depends on whether the hedging operation was in respect of cash flow or fair value.
When hedging future cash flows, the change in fair value of the effective portion of the hedging instrument is recognised directly in “Equity” as part of the item “Other value adjustments” until the maturity of the instrument. At maturity, the amount accumulated in “Equity” is included in the statement of comprehensive income in the same period or periods during which the hedged item affects the statement of comprehensive income. Currently, the Bank does not have cash flow hedging, although it may choose to do so at any time.
In order to protect NIB from market risks that arise as an inherent part of its borrowing and lending activities, the Bank enters into swap transactions. The net effect of the swap hedging is to convert the borrowing and lending transactions to floating rates. This hedging activity is an integral part of the Bank’s business process and is a fair value hedge.
When hedging the fair value of a financial asset or liability, the derivative instrument’s change in fair value is recognised in the statement of comprehensive income together with the hedged item’s change in fair value in “Net profit on financial operations”.
18
Sometimes a derivative may be a component of a hybrid financial instrument that includes both the derivative and a host contract. Such embedded derivative instruments are part of a structured financing transaction that is hedged against changes in fair value by means of matching swap contracts. In such cases, both the hedged borrowing transaction and the hedging derivative instrument are recognised at fair value with changes in fair value in the statement of comprehensive income.
The hedge accounting is based on a clearly documented relationship between the item hedged and the hedging instrument. When there is a high (negative) correlation between the hedging instrument on the one hand and the value change of the hedged item or the cash flows generated by the hedged item on the other, the hedge is regarded as effective. The hedging relationship is documented at the time the hedge transaction is entered into, and the effectiveness of the hedge is continually assessed.
Borrowing
The Bank’s borrowing transactions are recognised in the statement of financial position at the time the funds are transferred to the Bank. The borrowing transactions are recognised initially at a cost that comprises the fair value of the funds transferred, less transaction costs. The Bank uses derivative instruments to hedge the fair value of virtually all its borrowing transactions. In these instances, the borrowing transaction is subsequently recognised in the statement of financial position at fair value, with any changes in value recognised in the statement of comprehensive income.
Securities delivered under repurchase agreements are not derecognised from the statement of financial position. Cash received under repurchase agreements is recognised in the statement of financial position as “Amounts owed to credit institutions”.
Equity
As of 31 December 2015, the Bank’s authorised and subscribed capital is EUR 6,141.9 million, of which the paid-in portion is EUR 418.6 million. Payment of the subscribed, non-paid-in portion of the authorised capital, i.e. the callable capital, will take place at the request of the Bank’s Board of Directors to the extent that the Board deems it necessary for the fulfilment of the Bank’s debt obligations.
The Bank’s reserves have been built up by means of appropriations from the profits of previous accounting periods, and consist of the Statutory Reserve, as well as the General Credit Risk Fund and the Special Credit Risk Fund for PIL.
The Bank’s profits, after allocation to appropriate credit risk funds, are transferred to the Statutory Reserve until it amounts to 10% of NIB’s subscribed authorised capital. Thereafter, the Board of Governors, upon a proposal by the Bank’s Board of Directors, decides upon the allocation of the profits between the reserve fund and dividends on the subscribed capital.
The General Credit Risk Fund is designed to cover unidentified exceptional risks in the Bank’s operations. Allocations to the Special Credit Risk Fund for PIL are made primarily to cover the Bank’s own risk in respect of credit losses on PIL loans.
Interest
The Bank’s net interest income includes accrued interest on loans, debt securities, placements and accruals of the premium or discount value of financial instruments. Net interest income also includes interest expenses on debts, swap fees and borrowing costs.
Fees and commissions
Fees collected when disbursing loans are recognised as income at the time of the disbursement, which means that fees and commissions are recognised as income at the same time as the costs are incurred. Commitment fees are charged on loans that are agreed but not yet disbursed and are accrued in the statement of comprehensive income over the commitment period.
Annually recurrent costs arising as a result of the Bank’s borrowing, investment and payment transactions are recognised under the item “Commission expense and fees paid”.
Financial transactions
The Bank recognises in “Net profit on financial operations” both realised and unrealised gains and losses on debt securities and other financial instruments. Adjustments for hedge accounting are included.
19
Administrative expenses
The Bank provides services to its related parties, the Nordic Development Fund (NDF) and the Nordic Environment Finance Corporation (NEFCO). Payments received by the Bank for providing services at cost to these organisations are recognised as a reduction in the Bank’s administrative expenses. NIB receives a host country reimbursement from the Finnish Government equal to the tax withheld from the salaries of NIB’s employees. This payment reduces the Bank’s administrative expenses, as shown in Note 5.
Leasing agreements
Leasing agreements are classified as operating leases if the rewards and risks incident to ownership of the leased asset, in all major respects, lie with the lessor. Lease payments under operating leases are recognised on a straight-line basis over the lease term. The Bank’s rental agreements are classified as operating leases.
Employee pensions and insurance
The Bank is responsible for arranging pension security for its employees. In accordance with the Host Country Agreement between the Bank and the Finnish Government and as part of the Bank’s pension arrangements, the Bank has decided to apply the Finnish state pension system. Contributions to this pension system, which are paid into the Finnish State Pension Fund, are calculated as a percentage of salaries. The Finnish Ministry of Finance determines the basis for the contributions and establishes the actual percentage of the contributions according to a proposal from the local government pensions institution Keva. See Note 5.
NIB also provides its permanent employees with a supplementary pension insurance scheme arranged by a private pension insurance company. This is group pension insurance based on a defined contribution plan. The Bank’s pension liability is completely covered.
In addition to the applicable local social security systems, NIB has taken out, for example, comprehensive accident, life, medical and disability insurance policies for its employees in the form of group insurance.
Segment information
Segment information and currency distribution in the notes are presented in nominal amounts. The adjustment to hedge accounting is presented as a separate item (except for Note 1, the primary reporting segment).
Reclassifications
In addition to the reclassifications under financial placements, some other minor reclassifications have been made. The comparative figures have been adjusted accordingly.
International financial reporting standards and interpretations
New and amended standards applied in the financial year 2015
NIB has no transactions that have been affected by new amendments or standards during 2015.
Adoption of new and amended standards and interpretations applicable in future financial years
NIB has not yet adopted the following new and amended standards and interpretations already issued by the IASB. NIB will adopt them as of the effective date or, if the date is other than the first day of the financial year, from the beginning of the subsequent financial year.
| ● | | Amendment to IAS 1 Presentation of Financial Statements: Disclosure Initiative (effective for financial years beginning on or after 1 January 2016). The amendments are designed to encourage companies to apply judgement in determining what information to disclose in the financial statements. For example, the amendments clarify the application of the materiality concept and judgement when determining where and in what order information is presented in the financial disclosures. The interpretation has no significant impact on NIB’s financial statements. |
20
| ● | | New IFRS 9 Financial Instruments (effective for financial years beginning on or after 1 January 2018): IFRS 9 replaces the existing guidance in IAS 39 Financial Instruments: Recognition and Measurement. IFRS 9 includes revised guidance on the classification and measurement of financial instruments, including a new expected credit loss model for calculating impairment on financial assets, and the new general hedge accounting requirements. It also carries forward the guidance on recognition and derecognition of financial instruments from IAS 39. NIB is assessing the impact of IFRS 9. |
| ● | | Amendments to IAS 16 Property, Plant and Equipment and IAS 38 Intangible Assets — Clarification of Acceptable Methods of Depreciation and Amortisation (effective for financial years beginning on or after 1 January 2016): The amendments clarify IAS 16 and IAS 38 in that the revenue-based method cannot be used to depreciate property, plant and equipment and may only be used in limited circumstances to amortise intangible assets. The amendments will have no impact on NIB’s financial statements. |
| ● | | Annual Improvements to IFRSs, (2012-2014 cycle) (effective for financial years beginning on or after 1 January 2016): The annual improvements process provides a mechanism for minor and non-urgent amendments to IFRSs to be grouped together and issued in one package annually. These amendments cover four standards. Their impacts vary standard by standard but are not significant. |
RISK MANAGEMENT
The Bank assumes a conservative approach to risk-taking. Careful balancing of mission fulfilment, revenue generation and risk mitigation is a key consideration in the Bank’s risk-taking. The constituent documents require that loans be granted in accordance with sound banking principles, that adequate security be obtained for the loans, unless sufficient security is considered to exist under the circumstances, and that the Bank protect itself against the risk of exchange rate losses to the extent practicable. The Bank’s risk tolerance is defined with the objective of maintaining strong credit quality, stable earnings and a level of capital and liquidity required to maintain the Bank’s AAA/Aaa rating.
The main risks — credit risk, market risk, liquidity risk, operational risk and compliance risk — are managed carefully with the overall objective of maintaining financial soundness and avoiding activities that could threaten the Bank’s reputation. As an international financial institution, the Bank is not subject to national or international banking regulations. However, the Bank’s risk management framework is regularly reviewed and adapted to changing conditions with the aim of complying in substance with what the Bank identifies as the relevant market standards and best practices, including the recommendations of the Basel Committee on Banking Supervision.
The Bank’s risk management framework comprises risk policies and procedures formulated for the assessment, measurement, monitoring and reporting of risks including several layers of limits set to manage the exposure to quantifiable risks. The Bank recognises that effective risk management is based on a sound risk culture, which is characterised, among other things, by a high level of awareness concerning risk and risk management in the organisation. Regular training of staff in risk-related matters is part of the Bank’s risk management practice.
Key risk responsibilities
The Board of Directors lays down the general framework for the Bank’s risk management by approving its risk policies, including maximum limits for exposure to the main types of risk. The Board approves credits and grants authorisation to the Bank to raise funds in the capital markets based on its estimated funding requirements.
The President is responsible for managing the risk profile of the Bank within the framework set by the Board of Directors and for ensuring that the Bank’s aggregate risk is consistent with its financial resources and willingness to take risk. The Board of Directors has delegated some credit approval authority to the President for execution in the Credit Committee.
The following committees assist and advise the President:
The Executive Committee consists of the President and senior officers, whose appointment to the committee has been confirmed by the Board of Directors. The committee is the forum for addressing policy and management issues, including following up the financial results, business plan and strategy of the Bank. The committee meets approximately twice a month.
The Credit Committee consists of the President and senior officers appointed by the Board of Directors. The committee is responsible for preparing and making decisions on credit matters related to lending operations and for decisions on treasury counterparties. Among other things, the committee reviews all credit proposals before they are submitted to the Board of Directors for approval. The committee usually meets weekly.
The Finance Committee consists of the President, the Head of Treasury and the Head of Risk and Finance. The committee is responsible for preparing and making decisions on matters related to treasury operations. The committee makes recommendations and, where appropriate, decisions in the area of market, counterparty and liquidity risk exposure. It also monitors the Bank’s borrowing activities and has oversight of treasury risk reporting to the Board of Directors. The committee usually meets monthly.
21
The Asset and Liability Committee (ALCO) consists of the members of the Executive Committee and the Chief Risk Officer. Together with the Executive Committee, it has overall responsibility for the Bank’s risk management. ALCO’s duties include monitoring the Bank’s balance sheet development and capital adequacy, setting targets and limits for risk to be managed at the bank level, reviewing liquidity risk management and funding structure, as well as monitoring performance against the agreed risk appetite. The committee meets approximately six times a year.
The ICT Council assists and advises the President in information and communications technology matters, and functions as a steering committee for ICT development projects. The President, however, makes his decisions on ICT matters in the Executive Committee. The ICT Council consists of the Head of ICT and of other senior staff members.
The Bank has established a segregation of duties between units that enter into business transactions with customers or otherwise expose the Bank to risk, and units in charge of risk assessment, risk measurement, monitoring and control.
The business units, Lending and Treasury, are responsible for implementing the Bank’s business strategy. Lending is responsible for loan origination and mandate fulfilment in accordance with the Bank’s willingness to take risk. Treasury provides support by executing the funding strategy and managing the liquidity as well as balance sheet risks (Asset and Liability Management). The business units carry out the day-to-day management of all risks assumed in their operations and ensure that an adequate return is achieved for the risks taken. The Head of Lending and the Head of Treasury report to the President.
The Risk Management unit within Risk and Finance carries out independent measuring, controlling, monitoring and reporting of the Bank’s credit risk, liquidity risk, market risk and operational risk exposures. The assessment of risk related to new instruments is carried out in the New Product and Structure Committee chaired by a representative of Risk and Finance. The Head of Risk and Finance reports to the President.
Credit and Analysis is responsible for assessing and monitoring counterparty credit risk in the Bank’s lending and treasury operations. The Credit unit oversees that credit proposals are in compliance with established limits and policies. The Special Credits unit manages transactions requiring particular attention due to restructuring work-out and recovery processing. The Head of Credit and Analysis reports to the President.
The Legal department supports all units of the Bank carrying the responsibility for minimising and mitigating legal risks in the Bank’s operational and administrative activities. The General Counsel reports to the President.
The Compliance function assists the Bank in identifying, assessing, monitoring and reporting on compliance risks in matters relating to the institution, its operations and the personal conduct of staff members. The Chief Compliance Officer reports to the President, with unrestricted access to the Chairman of the Board of Directors and the Chairman of the Control Committee.
Internal Audit provides an independent evaluation of the controls, risk management and governance processes. The Head of Internal Audit reports to the Board of Directors and the Control Committee.
The Control Committee is the Bank’s supervisory body. It ensures that the operations of the Bank are conducted in accordance with the Statutes. The committee is responsible for the audit of the Bank and submits its annual audit report to the Board of Governors. The committee also monitors the anti-corruption and compliance practices of the Bank.
Credit risk
Credit risk is the Bank’s main financial risk. Credit risk is defined as the risk of loss resulting from the failure of the Bank’s borrowers and other counterparties to fulfil their contractual obligations and that collateral provided does not cover the Bank’s claims. Following from NIB’s mission, most of the credit risk stems from the Bank’s lending operations. The Bank is also exposed to credit risk in its treasury activities, where credit risk derives from the financial assets that the Bank uses for investing its liquidity, such as fixed-income securities and interbank deposits, and from derivative instruments used for managing currency and interest rate risks and other market risks related to structured funding transactions.
Credit risk management
The Bank’s credit risk management builds on the principles of (1) appropriate risk diversification within the scope of the mission; (2) thorough risk assessment at the credit appraisal stage; (3) risk-based pricing and risk mitigation; (4) continuous risk monitoring at the individual counterparty level as well as portfolio level; (5) avoidance of undesirable risks to the extent possible.
22
Credit risk limits
The maximum credit exposure that the Bank is willing to take is expressed in terms of exposure limits set by the Board of Directors. Credit exposure is the aggregate of lending and treasury exposure. The limits are scaled to the Bank’s equity, the counterparty’s equity, the size of the total credit exposure and the Bank’s economic capital. Limits are set at both counterparty and portfolio levels.
Counterparty limits are determined based on the probability of default and expected loss. The Bank defines a single counterparty as a counterparty or group of counterparties that are legally and/or financially consolidated or otherwise interdependent from a risk perspective. For exposure limit purposes, the Bank considers the entity where the risk resides, i.e. the risk-owner, as the counterparty. The risk-owner is the entity that is ultimately responsible for the Bank’s claim and may be different from the obligor if the risk is transferred through a guarantee. In order for a guarantee to be eligible for risk transfer, it must cover the full exposure and be a guarantee undertaking securing the borrower’s debt “as for own debt”, meaning that the Bank can make a claim under the guarantee immediately after the borrower has failed to pay on a due date.
To prevent excessive concentrations, the Bank applies portfolio-level limits for large counterparty exposure, as well as for industry sector and country exposures. The Bank has not set limits for the aggregate lending exposure in its member countries. Lending in non-member countries is subject to country limits. For the Bank’s treasury operations, country limits have been set for exposure in member and non-member countries.
As a general principle, the Bank limits the maximum amount granted as loan or guarantee for a single project to 50% of the total project cost. Financing to small and medium-sized enterprises, small mid-cap corporates and mid-cap corporates in the Bank’s member countries can be extended up to 75% of the total project or financing need fulfilling NIB’s mandate criteria.
Credit risk assessment
The counterparty’s debt servicing capacity is a key consideration for credit approval. The assessment of a counterparty’s creditworthiness focuses on identifying the main financial and business risks related to the counterparty. Based on the assessment, a risk rating indicating the probability of default (PD) is assigned to the counterparty. The credit risk assessment includes the use of quantitative risk methodologies and models as well as qualitative assessments based on expert judgement. The process of assigning PD ratings to counterparties is carried out in the Credit & Analysis department.
A separate expected loss (EL) rating is assigned at the transaction level. The EL rating factors in the loss given default (LGD), i.e. the loss severity in the event of a counterparty default. The LGD assignment process relies on models that produce an LGD estimate based on the type of counterparty and the characteristics of the transaction, such as guarantees, collateral, the seniority of the claim and other credit enhancing factors in the transaction. The responsibility for assigning the LGD lies with the cross-departmental Transaction Team, except for assigning LGD to sovereign counterparties, which is the responsibility of Credit & Analysis. The risk ratings are approved by the Credit Committee.
The Bank’s risk rating system comprises 20 classes to differentiate the risk of counterparty default and the expected loss on a transaction. In addition, separate D classes apply for doubtful and non-performing transactions. For reference to external ratings, the internal scales are mapped to the ratings of S&P and Moody’s such that classes 1 to 10 correspond to the external rating equivalent of the investment grade AAA to BBB- and Aaa to Baa3, respectively.
Credit risk mitigation
The Bank lends and invests on a senior unsecured or secured basis. The level of credit enhancement required in the Bank’s lending depends, among other things, on the creditworthiness of the counterparty and the tenor and repayment structure of the loan. When lending on an unsecured basis, the Bank requires that various undertakings, such as negative pledges and financial and non-financial covenants, are incorporated in the loan documentation.
In its secured lending, the Bank primarily relies on collateral and/or guarantees. The collateral should preferably be independent from the obligor (e.g. third-party shares or commercial real estate that can readily be taken into alternative use) and there should be a reasonably functioning market for the collateral.
The distribution of the Bank’s portfolio of outstanding loans and guarantee commitments by type of credit enhancement at year-end 2015 is presented below with further information in Note 8.
23
Loans outstanding
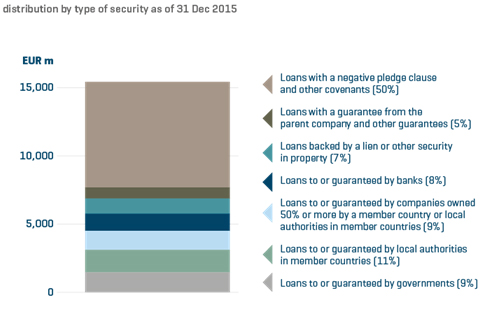
In its treasury operations, the Bank uses netting and collateralisation to mitigate credit risk related to derivatives and collateralised placements. The Bank undertakes swap transactions only with counterparties that meet the required minimum counterparty credit rating and have executed an International Swaps and Derivatives Association (ISDA) Master Agreement and signed a Credit Support Annex (CSA). Collateralised placements are made on the terms of the Global Master Repurchase Agreement (GMRA).
The ISDA master agreement allows for a single net settlement of all swap transactions covered by the agreement in the event of a counterparty default or early termination of the transactions. Netting is applied for the measurement of the Bank’s credit exposure only in cases when it is deemed to be legally enforceable in the relevant jurisdiction and against a counterparty. At year-end 2015, netting reduced the swap exposure by EUR 772 million from a gross total market value of EUR 2,748 million to EUR 1,976 million (year-end 2014: EUR 2,376 million and EUR 1,628 million, respectively).
The CSA further mitigates credit risk related to swaps, as the swap positions are marked to market daily and the resulting exposures exceeding agreed thresholds are collateralised by cash or high-quality government securities. At year-end 2015, the Bank held EUR 1,829 million (2014: EUR 1,452 million) in gross collateral received, of which EUR 1,440 million (2014: EUR 818 million) was in cash and EUR 389 million (2014: EUR 634 million) in securities (See Note 16, Collateral and Commitments).
Credit risk monitoring
The Bank puts strong emphasis on continuous monitoring of the credit risk development in its lending and treasury operations. Credit risk is monitored both at counterparty level and at portfolio level. The primary responsibility for credit risk monitoring resides with the unit responsible for the client relationship, i.e. Lending, Treasury and Special Credits with support from Credit & Analysis. Risk Management carries out the portfolio level monitoring.
All lending exposures are subject to continuous monitoring of contractual compliance and events/signals that could potentially lead to or indicate a material change in risk. In addition, an annual follow-up is conducted on the entire loan portfolio. The annual follow-up is presented to the Credit Committee and reported to the Board of Directors.
Treasury exposures are subject to continuous monitoring of events and market signals that could potentially lead to or indicate a material change in risk. At a minimum, the counterparties are analysed and the risk class validated every two years. The follow-up is presented to the Credit Committee.
Following the identification of a seriously deteriorated debt repayment capacity and/or a serious deterioration in the financial standing, the counterparty is placed on the watch-list and becomes subject to specific watch-list monitoring. Watch-listed counterparties are reviewed by the Credit Committee at agreed intervals and reported to the Board of Directors.
24
If a credit exposure requires the expertise of specialists in workout and restructuring, it will be transferred to the Special Credits unit. The unit’s primary objective is to take over responsibility for distressed loans from Lending and devote sufficient time and effort to the individual case in order that the Bank may recover all or as much as possible of distressed loans outstanding.
Credit risk monitoring at portfolio level includes, among others, an analysis of the aggregate credit risk exposure, credit risk concentrations and changes in the risk profile. The development is reported to ALCO and the Board of Directors.
Compliance with existing limits is monitored regularly; for treasury counterparties, limit compliance is monitored on a daily basis. Exposure in excess of maximum limits may occur e.g. due to downgrade of a counterparty rating. Limit breaches are reported to senior management, relevant committees and the Board of Directors.
Risk-based pricing
The Statutes stipulate that the Bank shall operate according to sound banking principles and aim for a profit allowing the formation of reserves and a reasonable return on capital.
Loans and guarantees are priced to cover the Bank’s cost of funds, administration costs, the cost of the risk involved in the transaction and the cost of capital employed. For loan pricing purposes, the Bank uses a pricing tool that enables calculation of the minimum earnings required on a loan in order to cover all lending related costs and an appropriate return for the level of risk assumed. Internal credit risk ratings and associated risk parameters, as well as the structure of the transaction, are key input factors in the pricing tool.
Credit risk reserves, impairment methodology
The Bank maintains two credit risk funds within its equity, in addition to the Statutory Reserve. The General Credit Risk Fund is available to cover unexpected losses arising from the Bank’s lending and other business activities. At year-end 2015, the fund amounted to EUR 1,430 million before allocation of the profit for the year. The Statutes require that the Bank maintains the Special Credit Risk Fund for the Project Investment Loan (PIL) facility to cover the Bank’s own risk on such loans before resorting to the member countries’ guarantees that support the facility. At year-end 2015, the fund amounted to EUR 396 million before allocation of the profit for the year.
At least every four months, the Bank reviews the need for impairment provisions on weak exposures. The assessment is carried out both at the level of the individual counterparty and collectively for groups of counterparties. At the counterparty level, a specific impairment provision is recognised if there is objective evidence that the counterparty’s capacity to fulfil its obligations has deteriorated to the extent that full repayment is unlikely, taking into consideration any collateral received. Collective impairment provisions are determined on a portfolio basis for exposures with similar credit risk characteristics as reflected in their risk ratings. The process includes the management’s judgement based on the current macroeconomic environment and the current view of the expected economic outlook. In the Bank’s view, the assumptions and estimates made are appropriately conservative and are reflective of the predicted economic conditions, the Bank’s portfolio characteristics and their correlation with losses incurred based on historical loss experience. In the assessment of sovereign exposures, the Bank takes into account its preferred creditor status. The Bank’s principles for impairment provisioning are described in more detail in the section “Significant accounting policies”.
25
Credit risk exposure
Tables 1 to 3 below provide an overview of the Bank’s aggregate credit risk exposure at year-end 2015. Aggregate credit exposure comprises lending and treasury exposure. Lending exposure includes loans outstanding (after deduction of specific impairment but before collective impairment) and loans agreed but not yet disbursed, without taking into account any collateral or other credit enhancement. Regarding the treasury exposure, capital market investments are included at nominal value, while derivatives are included at market value net of collateral held when credit support agreements are in place, and at market value with an add-on for potential future exposure when not under a credit support agreement. The exposure to collateralised placements is calculated as a fixed percentage of the market value of the collateral held.
TABLE 1. Credit risk exposure by internal rating based on expected loss (EL) (in EUR million)
| | | | | | | | | | | | | | | | | | | | | | | | | | | | |
RISK CLASS | | S&P EQUIVALENT | | | LENDING | | | TREASURY | | | 31 DEC 2015 TOTAL | | | LENDING | | | TREASURY | | | 31 DEC 2014 TOTAL | |
1–2 | | | AAA/AA+ | | | | 3,659 | | | | 5,181 | | | | 8,839 | | | | 3,076 | | | | 3,806 | | | | 6,881 | |
3–4 | | | AA/AA- | | | | 559 | | | | 1,001 | | | | 1,560 | | | | 588 | | | | 1,714 | | | | 2,303 | |
5–6 | | | A+/A | | | | 1,412 | | | | 1,307 | | | | 2,719 | | | | 930 | | | | 1,019 | | | | 1,949 | |
7–8 | | | A-/BBB+ | | | | 4,907 | | | | 212 | | | | 5,119 | | | | 4,661 | | | | 44 | | | | 4,705 | |
9–10 | | | BBB/BBB- | | | | 3,213 | | | | 0 | | | | 3,213 | | | | 4,185 | | | | 23 | | | | 4,208 | |
11–12 | | | BB+/BB | | | | 2,067 | | | | 0 | | | | 2,067 | | | | 1,793 | | | | 0 | | | | 1,793 | |
13–14 | | | BB/BB- | | | | 333 | | | | 0 | | | | 333 | | | | 672 | | | | 0 | | | | 672 | |
15–16 | | | BB-/B+ | | | | 322 | | | | 0 | | | | 322 | | | | 30 | | | | 0 | | | | 30 | |
17–18 | | | B/B- | | | | 64 | | | | 0 | | | | 64 | | | | 142 | | | | 0 | | | | 142 | |
19–20 | | | B-/CCC | | | | 0 | | | | 0 | | | | 0 | | | | 22 | | | | 0 | | | | 22 | |
D | | | | | | | 74 | | | | 6 | | | | 80 | | | | 59 | | | | 8 | | | | 67 | |
TOTAL | | | | | | | 16,607 | | | | 7,707 | | | | 24,314 | | | | 16,158 | | | | 6,613 | | | | 22,771 | |
| | | | | | | |
Class D | | | | | | | | | | | | | | | | | | | | | | | | | | | | |
Gross | | | | | | | 205 | | | | 46 | | | | 251 | | | | 186 | | | | 83 | | | | 269 | |
Impairment | | | | | | | 131 | | | | 40 | | | | 171 | | | | 126 | | | | 75 | | | | 202 | |
Net | | | | | | | 74 | | | | 6 | | | | 80 | | | | 59 | | | | 8 | | | | 67 | |
Overall, the quality of the Bank’s aggregate credit exposure remained sound and stable in 2015. Lending exposure increased by 3% and treasury exposure by 17%, the latter due to a higher level of liquid assets. At year-end 2015, 83% (2014: 83%) of lending exposure and practically 100% (2014: 100%) of treasury exposure was in risk classes 1-10, corresponding to investment-grade quality. Lending exposure in the best risk classes (EL 1-2) increased as a result of new lending as well as revised loss-given-default (LGD) values. The exposure in the weakest risk classes (EL 17-20) was reduced mainly due to repayment and downgrading of one customer into class D. Of the net exposure in risk class D, EUR 27 million was under the MIL facility (2014: EUR 12 million).
26
TABLE 2. Geographical distribution of the credit risk exposure (in EUR million)
The geographical distribution of the aggregate credit risk exposure is shown in the table below. The distribution is based on the risk-owner’s country of domicile.
| | | | | | | | | | | | | | | | | | | | | | | | |
COUNTRY/REGION | | LENDING | | | TREASURY | | | 31 DEC 2015 TOTAL | | | LENDING | | | TREASURY | | | 31 DEC 2014 TOTAL | |
Denmark | | | 1,610 | | | | 828 | | | | 2,438 | | | | 1,604 | | | | 314 | | | | 1,918 | |
Estonia | | | 221 | | | | 0 | | | | 221 | | | | 238 | | | | 0 | | | | 238 | |
Finland | | | 3,640 | | | | 928 | | | | 4,568 | | | | 3,380 | | | | 926 | | | | 4,306 | |
Iceland | | | 535 | | | | 2 | | | | 537 | | | | 498 | | | | 3 | | | | 501 | |
Latvia | | | 287 | | | | 18 | | | | 305 | | | | 339 | | | | 0 | | | | 339 | |
Lithuania | | | 652 | | | | 20 | | | | 672 | | | | 548 | | | | 20 | | | | 568 | |
Norway | | | 3,030 | | | | 355 | | | | 3,384 | | | | 2,818 | | | | 355 | | | | 3,173 | |
Sweden | | | 4,040 | | | | 871 | | | | 4,912 | | | | 3,903 | | | | 691 | | | | 4,593 | |
Africa and Middle East | | | 187 | | | | 0 | | | | 187 | | | | 240 | | | | 0 | | | | 240 | |
Americas | | | 311 | | | | 604 | | | | 915 | | | | 265 | | | | 416 | | | | 681 | |
Asia-Pacific | | | 857 | | | | 39 | | | | 897 | | | | 958 | | | | 50 | | | | 1,008 | |
Europe | | | 985 | | | | 3,643 | | | | 4,628 | | | | 1,117 | | | | 3,332 | | | | 4,449 | |
Multilaterals | | | 251 | | | | 399 | | | | 650 | | | | 252 | | | | 506 | | | | 758 | |
TOTAL | | | 16,607 | | | | 7,707 | | | | 24,314 | | | | 16,158 | | | | 6,613 | | | | 22,771 | |
In the context of the Bank’s mission, the credit risk exposure continued to be fairly well balanced in terms of geographical distribution, with no significant change over the year. At year-end 2015, the member countries accounted for 84% of the Bank’s lending exposure (2014: 82%). The largest lending exposures outside the member countries were in Poland, China, Brazil, Russia and India. The Bank’s exposure in Russia, Ukraine and Belarus amounted to EUR 312 million (2014: EUR 402 million), of which EUR 84 million (2014: EUR 97 million) was under the MIL facility. The total exposure in Russia, Ukraine and Belarus includes EUR 27 million (2014: EUR 77 million) of agreed, not disbursed loans.
Of the treasury exposure, 39% (2014: 35%) was in the member countries, while the rest of Europe accounted for 47% (2014: 50%), dominated by Germany, the Netherlands and France. The major part of the treasury exposure outside Europe was in Canada.
TABLE 3. Credit risk exposure by industry sector (in EUR million)
The distribution of the credit risk exposure by sector is based on the industry sector of the risk-owner. These sectors are different from the four business areas into which the Bank has organised its lending operations.
| | | | | | | | | | | | | | | | | | | | | | | | |
INDUSTRY SECTOR | | LENDING | | | TREASURY | | | 31 DEC 2015 TOTAL | | | LENDING | | | TREASURY | | | 31 DEC 2014 TOTAL | |
Oil & Gas | | | 344 | | | | 0 | | | | 344 | | | | 371 | | | | 0 | | | | 371 | |
Materials | | | 1,115 | | | | 0 | | | | 1,115 | | | | 1,271 | | | | 0 | | | | 1,271 | |
Industrials | | | 3,668 | | | | 0 | | | | 3,668 | | | | 3,297 | | | | 0 | | | | 3,297 | |
Consumer discretionary | | | 540 | | | | 0 | | | | 540�� | | | | 443 | | | | 0 | | | | 443 | |
Consumer staples | | | 1,018 | | | | 0 | | | | 1,018 | | | | 1,213 | | | | 0 | | | | 1,213 | |
Health care | | | 519 | | | | 0 | | | | 519 | | | | 522 | | | | 0 | | | | 522 | |
Financials | | | 1,442 | | | | 4,470 | | | | 5,913 | | | | 1,322 | | | | 3,398 | | | | 4,720 | |
Information technology | | | 220 | | | | 0 | | | | 220 | | | | 162 | | | | 0 | | | | 162 | |
Telecommunication services | | | 429 | | | | 0 | | | | 429 | | | | 466 | | | | 0 | | | | 466 | |
Utilities | | | 3,773 | | | | 0 | | | | 3,773 | | | | 3,635 | | | | 0 | | | | 3,635 | |
Public sector | | | 3,540 | | | | 3,237 | | | | 6,776 | | | | 3,458 | | | | 3,215 | | | | 6,673 | |
TOTAL | | | 16,607 | | | | 7,707 | | | | 24,314 | | | | 16,158 | | | | 6,613 | | | | 22,771 | |
27
The distribution of the lending exposure by industry sector remained stable in 2015 compared to the previous year, with the public sector, utilities and industrials accounting for 66% (2014: 64%) of the total exposure.
The Bank has defined limits for maximum exposure to single industry sectors both in relation to its economic capital requirement and to its total credit risk exposure. At year-end 2015, the Bank was in compliance with these limits.
TABLE 4. Largest counterparty exposures (% of total credit risk exposure)
A counterparty exposure is defined as the consolidated group exposure, i.e. individual counterparties that are linked to one another by ownership or other group affiliation are considered as one counterparty.
| | | | | | | | |
| | | | 31 DEC 2015 | | | | 31 DEC 2014 | |
Top 5 | | | 9% | | | | 9% | |
Top 10 | | | 16% | | | | 16% | |
Top 20 | | | 27% | | | | 26% | |
The Bank’s limits for large single counterparty exposures and for the aggregate of such large exposures are scaled to its economic capital and equity. Any deviations from the set limits must be approved by the Board of Directors. At year-end 2015, the Bank was within the aggregate limits set for large exposures, with the exception of the limit for large exposures measured against economic capital.
Market risk
The Bank defines market risk as the risk of valuation loss or reduction in the expected earnings stemming from adverse fluctuations in exchange rates, interest rates, credit spreads and cross-currency basis spreads.
Market risks predominantly arise from the Bank’s core business activities and the liquidity portfolio needed to support these activities. The Bank’s strategy is to obtain cost-efficient funding from diversified sources and provide lending that is tailored to the needs of its customers. This gives rise to foreign exchange risk and structural interest rate risk due to mismatches in the Bank’s assets and liabilities in terms of currency composition, maturity profile and interest rate characteristics. Cross-currency basis risk stems from the hedging techniques used by the Bank to mitigate the above risks. This risk relates to transactions exchanging foreign currencies at a future point in time and is mainly driven by liquidity supply and demand in those currencies.
The Bank’s securities portfolio held for liquidity purposes is exposed to interest rate risk and credit spread risk, i.e. potential decline in market value due to perceived change in the credit quality of the issuers of the securities held in the portfolio.
Market risk management
The Bank manages market risks by hedging against foreign exchange risk and interest rate risk with the objective of protecting its earnings and the economic value of its assets and liabilities. Foreign exchange risk is practically fully hedged. Interest rate risk deriving from mismatches between funding and lending is kept at a modest level. The Bank’s tolerance for interest rate risk and credit spread risk pertains to the earnings expectations set for the liquidity portfolio.
As part of its structured funding transactions, the Bank may use financial instruments linked to other market risk factors than the above. A prerequisite is that such transactions are completely hedged with derivatives and that the Bank is able to valuate and measure the risks involved in the derivatives.
All of the Bank’s market risks are transferred to and managed by Treasury. The Risk Management unit provides independent oversight of all significant market risks, supporting the Finance Committee, ALCO and Treasury with risk measurement, analysis, daily monitoring and reporting.
28
Foreign exchange rate risk
The Statutes require that the Bank shall, to the extent practicable, protect itself against the risk of exchange rate losses. Exchange rate risk is measured on the basis of net open positions in each currency. Limits restricting overnight positions have been set to the equivalent of EUR 1 million for all currencies except USD, for which the limit is EUR 4 million. Furthermore, exposure to currencies other than USD and the Nordic currencies may not, in aggregate, exceed the equivalent of EUR 4 million, representing approximately 0.13% of the Bank’s equity.
The Bank hedges foreign exchange rate risk with cross-currency swaps, which gives rise to currency basis risk. The market value sensitivity of the Bank’s swap portfolio to one basis point shift in the relevant currency basis curves was EUR 2 million at year-end 2015.
The Bank does not hedge future net interest income in foreign currency. Loans are provided primarily in euro, US dollars and Nordic currencies. There is a possibility that interest income in currencies other than the euro may cause some fluctuation in the Bank’s future net income in euro terms. However, at present the Bank expects that any such potential fluctuations in future cash flows from its current portfolio would be minor in relation to its total assets and equity.
Interest rate risk
The Bank manages interest rate risk by using derivatives to convert fixed-rate funding into floating-rate liabilities. Fixed-rate lending that is not match-funded is converted to floating-rate receivables. This hedging approach ensures that the interest rate risk between lending and funding in each currency remains low. The majority of the Bank’s interest rate risk, therefore, stems from the portfolio of liquid assets.
The Bank measures and manages interest rate risk by estimating the sensitivity of the economic value of its balance sheet to an interest rate shock. The sensitivity is measured by means of basis point value (BPV) quantifying the impact of a parallel increase in interest rates of one basis point on the present value of interest-bearing assets and liabilities.
The Bank measures its structural net interest income risk by estimating the sensitivity of the accumulated net interest income during the next twelve months to changes in the level of interest rates.
Maximum limits have been set for the acceptable exposure to interest rate risk both at an aggregate balance sheet level and at portfolio level.
A gross limit equivalent to EUR 1.5 million covering all currencies restricts the BPV interest rate risk to approximately 0.05% of the Bank’s equity. In addition, individual BPV limits have been set for interest rate risk in EUR, USD and the Nordic currencies, whereas a combined limit applies for all other currencies. At 31 December 2015, the gross exposure was EUR 0.95 million (2014: EUR 0.99 million).
As a supplementary indicator of interest rate risk, the Bank estimates the worst-case effect of a 0.1% change in interest rates on its net interest income over the lifetime of interest-bearing assets and liabilities due to mismatches in terms of re-pricing periods and volumes. This is managed through a limit of EUR 34 million, corresponding to approximately 1% of the Bank’s equity. At year-end 2015, the exposure amounted to EUR 10.5 million (2014: EUR 11.8 million).
Credit spread risk
The Bank manages its exposure to credit spread risk by calculating the sensitivity of its liquid assets portfolio to credit spread movements. The sensitivity is measured by means of Credit Spread Basis Point Value (Spread BPV) quantifying the impact of an increase of one basis point in credit spreads on the present value of the assets.
Limits have been defined to restrict the decrease in asset value to acceptable levels in accordance with the Bank’s willingness to take risk in its liquidity portfolio. The Bank has set an overall limit of EUR 2.5 million for credit spread risk, with specific sub-limits defined for various asset classes.
As of 31 December 2015, the Bank’s exposure to credit spread risk was EUR 1.58 million (2014: EUR 1.78 million). This means that an increase of all debt-instrument-specific credit spreads by 1% as of that date would have reduced the value of the securities portfolio by approximately EUR 158 million.
To ensure that the liquidity portfolio maintains its market value and liquidity even under severe market conditions, the Bank has set limits to control the asset quality of the portfolio, i.a. by defining minimum requirements for counterparty ratings.
29
Liquidity risk
Liquidity risk is defined as the risk of incurring losses due to an inability to meet payment obligations in a timely manner when they become due. The Bank categorises liquidity risk into funding liquidity risk, which occurs when payment obligations cannot be fulfilled because of an inability to obtain new funding, and market liquidity risk, which occurs when the Bank is unable to sell or transform assets in the liquidity buffer into cash without significant losses.
Liquidity risk management
The Bank’s business model gives rise to liquidity risk mainly through maturity mismatches between assets and liabilities. The liquidity position and adherence to exposure limits is managed by Treasury and monitored by Risk Management on a daily basis.
The Finance Committee and ALCO oversee the development of the Bank’s funding and liquidity position and decide on liquidity risk-related matters in accordance with their respective mandates. The Board of Directors receives regular reports on the liquidity and funding situation of the Bank.
The key metric applied for managing liquidity risk is the survival horizon, which measures how long the Bank would be able to fulfil its payment obligations in a severe stress scenario. The target survival horizon is twelve months, which means that the Bank would be able to meet its payment obligations and continue its business operations without disruption for the coming twelve months under stressed conditions. The minimum requirement is that the survival horizon must at all times exceed nine months. The stress scenario includes, among other things, the assumption of payment disruptions in the loan portfolio, no access to market funding, early termination of all callable funding transactions and severe decline of asset value in the liquidity buffer. At year-end 2015, the survival horizon was 431 days (2014: 456 days).
In addition, the Bank requires that the liquidity position should be strong enough to secure the highest possible issuer credit rating by S&P and Moody’s and fulfil the liquidity coverage ratio (LCR) and net stable funding ratio (NSFR) requirements as specified in the Capital Requirements Regulation of the European Union. At year-end 2015 the LCR was approximately 1200% and the NSFR approximately 150%. The minimum requirement for NSFR and LCR is 100% for regulated banks once the Basel III regulations are fully implemented.
The Bank’s liquidity buffer comprises unencumbered cash, deposits and securities mainly denominated in EUR, USD and the Nordic currencies. In order to ensure that the market value and liquidity of the buffer is preserved during adverse market conditions, the Bank has set strict rules for the composition of the buffer. As such, the buffer must include a minimum level of High Quality Liquid Assets as defined in the EU capital requirement regulation and a minimum level of assets in the internal rating categories corresponding to at least AA- from S&P and Aa3 from Moody’s. Furthermore, the buffer must comprise a certain level of assets eligible as repo collateral in central banks. At present, the Bank does not have direct access to central bank repo facilities.
The maturity profile of the liquidity buffer is structured to fulfil the Bank’s requirement that the expected net cash outflow during the next three months must be covered by maturing investments in the liquidity buffer.
TABLE 5. Composition of the liquidity buffer
| | | | | | | | | | | | |
| | | | | | | 31 DEC 2015 | | | | | | 31 DEC 2014 |
| | | | | | | | | | | | | |
| | | EUR MILLION | | | | % | | EUR MILLION | | | | % |
Cash and cash equivalents | | 678 | | | | 7% | | 516 | | | | 7% |
| Securities issued or guaranteed by sovereigns, public sector entities and supranational institutions | | 3,269 | | | | 36% | | 3,383 | | | | 43% |
Covered bonds | | 2,123 | | | | 23% | | 1,714 | | | | 22% |
Securities issued by financial institutions, excluding covered bonds | | 1,164 | | | | 13% | | 955 | | | | 12% |
Securities received as collateral | | 1,843 | | | | 20% | | 1,330 | | | | 17% |
TOTAL | | 9,077 | | | | 100% | | 7,899 | | | | 100% |
30
Diversification is a key objective of the Bank’s funding and liquidity management. The Bank strives to diversify its borrowing in terms of currencies, maturities, instruments and investor types in order to avoid excessive reliance on individual markets and funding sources. Through regular benchmark issues, the Bank aims to secure broad market access. The annual funding plan is based on the projected twelve-month liquidity requirement and the projected size of the liquidity buffer. The funding plan is regularly adjusted to reflect changes in the liquidity requirement.
The following graph shows the maturity profile of liquid assets and the annual scheduled payments on loans outstanding compared to payments on the Bank’s funding. Payments on loans outstanding are shown until the contractual maturity of the loans. Repayment of funding is shown until the first possible early repayment date and taking into account the cash flow from associated swaps. Short-term amounts owed to credit institutions predominantly comprise cash collateral received from swap counterparties.
Maturity profile of funding, lending and liquid assets
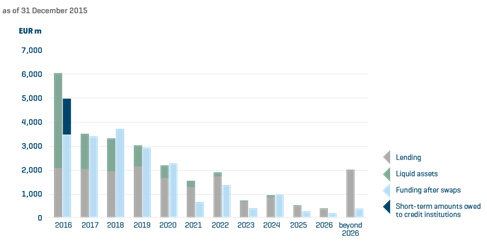
A breakdown of the Bank’s financial assets and liabilities by maturity at year-end 2015 is presented in Note 18.
The Bank has a contingency plan in place which defines the actions to be taken should the Bank encounter a liquidity shortfall in an emergency situation. The President decides on the activation of the contingency plan and subsequently informs the Board of Directors.
Operational risk
The Bank defines operational risk as the risk of direct or indirect losses or damaged reputation due to failure attributable to technology, employees, processes, procedures or physical arrangements, including external events and legal risks.
Operational risk management
The Bank’s status as an international organisation with immunities and privileges granted to the Bank and its personnel, and the fact that the Bank is neither bound by nor under the supervision of any national laws as such, results in a specific need to address potential risks by adopting an extensive set of guidelines, regulations, rules and instructions governing the activities of the Bank and its staff. The Bank’s operational risk management policy is set by the Board of Directors. The policy is complemented by an operational risk management framework comprising the guiding principles for the identification, assessment, monitoring and control of the operational risks that the Bank faces or may face.
NIB’s operational risk management focuses on proactive measures in order to ensure business continuity, the accuracy of information used internally and reported externally, the expertise and integrity of the Bank’s personnel and its adherence to established rules and procedures, as well as on security arrangements to protect the physical and ICT infrastructure of the Bank.
The day-to-day management of operational risk is performed across the organisation and is primarily the responsibility of each function. Emphasis is put on training the Bank’s personnel in risk awareness. In the risk and control self-assessment (RCSA) process, risks are identified and their impact assessed by the various functions for their respective fields of expertise. Focus is placed on identifying key risks and assessing the quality of risk detection and risk mitigation in order to ensure compliance with the Bank’s policies and guidelines. Operational risks are also identified through analysis of results obtained from the Bank’s incident reporting system. Key observations are reported to the management. The Bank strives to continuously build expertise in operational risk management concepts and tools.
31
Compliance risk
Compliance risk is the risk of legal or regulatory sanctions, material financial loss, or loss to reputation due to failure to comply with laws, rules and standards.
The Bank is committed to follow best practices and market standards in the areas of accountability, governance, corporate social responsibility, transparency and business ethics in order to promote sustainability. In managing compliance risk, the Bank places particular emphasis on preventing corruption, money laundering and the financing of terrorism. The Bank’s procedures are aligned with the International Financial Institutions (IFI) Uniform Framework for Preventing and Combating Fraud and Corruption, which the Bank has endorsed.
For NIB, integrity means adherence to the Bank’s ethical values. The Bank focuses on preventive measures as the most effective way to avoid becoming involved with unethical borrowers and projects, money laundering, terrorist financing or tax evasion. Particular emphasis is put on knowing the customers and training the staff to ensure awareness and vigilance. All new clients are screened thoroughly in the Bank’s integrity due diligence processes. Monitoring of integrity risks in the loan portfolio is part of the Bank’s regular follow-up procedures.
The Office of the Chief Compliance Officer oversees and coordinates matters relating to integrity and reputational risks and provides independent expert advice to management and the Board of Directors in compliance matters. Allegations of fraud and corruption in relation to the Bank’s projects or counterparties are investigated by the Committee on Fighting Corruption.
The Chief Compliance Officer reports to the President and has unrestricted access to the chairpersons of the Board of Directors and the Control Committee. He reports regularly to the Board of Directors on serious fraud and corruption investigations and once a year on other integrity and compliance matters. Reports on anti-corruption and compliance matters are presented to the Control Committee at its regular meetings.
Once a year, the Office of the Chief Compliance Officer publishes its Integrity Report on the Bank’s website.
32
Note 1: Segment information
Operating segments
The Bank determines and presents operating segments based on the information that is provided internally to the management. Segment results that are reported to the management include items directly attributable to that segment as well as other items allocated on a reasonable basis.
In its segment reporting, NIB divides its operations into two major segments: lending and treasury operations. Treasury operations consist of asset and liability management and portfolio management.
2015
| | | | | | | | | | | | | | | | | | | | |
(AMOUNTS IN EUR 1,000) | | LENDING | | | ASSET AND LIABILITY MANAGEMENT | | | PORTFOLIO MANAGEMENT | | | TREASURY TOTAL | | | TOTAL | |
Net interest income | | | 145,884 | | | | 30,783 | | | | 70,109 | | | | 100,891 | | | | 246,776 | |
Commission income and fees received | | | 9,379 | | | | 2,839 | | | | – | | | | 2,839 | | | | 12,218 | |
Commission expense and fees paid | | | -161 | | | | -1,356 | | | | -695 | | | | -2,051 | | | | -2,212 | |
Net profit on financial operations | | | 2,567 | | | | 9,147 | | | | -193 | | | | 8,954 | | | | 11,521 | |
Foreign exchange gains and losses | | | – | | | | 82 | | | | – | | | | 82 | | | | 82 | |
Administrative expenses | | | -28,860 | | | | -9,016 | | | | -3,864 | | | | -12,881 | | | | -41,740 | |
Depreciation | | | -5,705 | | | | -2,123 | | | | -910 | | | | -3,033 | | | | -8,737 | |
Impairment of loans | | | -2,509 | | | | – | | | | – | | | | – | | | | -2,509 | |
Profit/loss for the year | | | 120,596 | | | | 30,356 | | | | 64,446 | | | | 94,802 | | | | 215,398 | |
Assets | | | 15,672,071 | | | | 8,485,407 | | | | 3,153,969 | | | | 11,639,376 | | | | 27,311,447 | |
Liabilities and equity | | | 15,672,071 | | | | 8,485,407 | | | | 3,153,969 | | | | 11,639,376 | | | | 27,311,447 | |
2014
| | | | | | | | | | | | | | | | | | | | |
(AMOUNTS IN EUR 1,000) | | LENDING | | | ASSET AND LIABILITY MANAGEMENT | | | PORTFOLIO MANAGEMENT | | | TREASURY TOTAL | | | TOTAL | |
Net interest income | | | 140,188 | | | | 28,123 | | | | 70,796 | | | | 98,920 | | | | 239,108 | |
Commission income and fees received | | | 8,805 | | | | 106 | | | | 414 | | | | 520 | | | | 9,325 | |
Commission expense and fees paid | | | -376 | | | | -701 | | | | -1,015 | | | | -1,716 | | | | -2,092 | |
Net profit on financial operations | | | -379 | | | | -703 | | | | 26,766 | | | | 26,062 | | | | 25,684 | |
Foreign exchange gains and losses | | | – | | | | 187 | | | | – | | | | 187 | | | | 187 | |
Administrative expenses | | | -32,016 | | | | -2,027 | | | | -3,343 | | | | -5,369 | | | | -37,386 | |
Depreciation | | | -2,422 | | | | -901 | | | | -386 | | | | -1,287 | | | | -3,709 | |
Impairment of loans | | | -20,905 | | | | – | | | | – | | | | – | | | | -20,905 | |
Profit/loss for the year | | | 92,895 | | | | 24,084 | | | | 93,232 | | | | 117,316 | | | | 210,211 | |
Assets | | | 15,209,726 | | | | 6,772,439 | | | | 2,888,236 | | | | 9,660,675 | | | | 24,870,400 | |
Liabilities and equity | | | 15,209,726 | | | | 6,772,439 | | | | 2,888,236 | | | | 9,660,675 | | | | 24,870,400 | |
Due to rounding, the total of individual items may differ from the reported sum.
33
Geographical segments
The table below is based on the region where the borrowers reside, according to the domicile of the borrower’s group headquarters.
| | | | | | | | |
(AMOUNTS IN EUR 1,000) | | 2015 NET INTEREST INCOME | | | 2014 NET INTEREST INCOME | |
Member countries | | | | | | | | |
Denmark | | | 14,520 | | | | 13,286 | |
Estonia | | | 1,922 | | | | 1,576 | |
Finland | | | 30,650 | | | | 30,138 | |
Iceland | | | 5,438 | | | | 4,855 | |
Latvia | | | 2,981 | | | | 3,660 | |
Lithuania | | | 5,036 | | | | 3,861 | |
Norway | | | 20,755 | | | | 18,601 | |
Sweden | | | 32,093 | | | | 32,258 | |
Total, member countries | | | 113,394 | | | | 108,235 | |
| | |
Non-member countries | | | | | | | | |
Africa | | | 1,772 | | | | 1,859 | |
Asia | | | 10,698 | | | | 11,007 | |
Europe and Eurasia | | | 13,845 | | | | 13,330 | |
Latin America | | | 5,573 | | | | 5,015 | |
Middle East | | | 601 | | | | 743 | |
Total, non-member countries | | | 32,490 | | | | 31,954 | |
Total, net interest income from lending | | | 145,884 | | | | 140,188 | |
34
Note 2: Interest income and interest expense
| | | | | | | | |
(AMOUNTS IN EUR 1,000) | | 2015 | | | 2014 | |
Interest income | | | | | | | | |
Cash and cash equivalents | | | -309 | | | | 4,448 | |
Debt securities | | | 81,526 | | | | 90,897 | |
Loans outstanding | | | 256,268 | | | | 286,167 | |
Other interest income | | | 1,296 | | | | 1,248 | |
Total, interest income ¹ | | | 338,781 | | | | 382,760 | |
| | |
Interest expense | | | | | | | | |
Short-term amounts owed to credit institutions | | | -1,310 | | | | -491 | |
Long-term amounts owed to credit institutions | | | -9 | | | | – | |
Debts evidenced by certificates | | | 590,836 | | | | 657,227 | |
Swap contracts and other interest expenses, net | | | -497,511 | | | | -513,084 | |
Total, interest expense ² | | | 92,005 | | | | 143,652 | |
¹ Including interest income from financial assets recognised at amortised cost of EUR 308,583 (347,084) thousand.
² Including interest expense from financial liabilities recognised at amortised cost of EUR 122,710 (128,294) thousand.
35
Note 3: Commission income and fees received
| | | | | | | | |
(AMOUNTS IN EUR 1,000) | | 2015 | | | 2014 | |
| |
Commitment fees | | | 2,053 | | | | 1,911 | |
| |
Loan disbursement fees | | | 7,239 | | | | 6,267 | |
| |
Guarantee commissions | | | – | | | | – | |
| |
Premiums on prepayments of loans | | | 2,549 | | | | 733 | |
| |
Commissions on lending of securities | | | 377 | | | | 414 | |
| |
Total, commission income and fees received | | | 12,218 | | | | 9,326 | |
| |
36
Note 4: Net profit/loss on financial operations
Net profit/loss on financial operations included in profit or loss for the period in the table below is presented in the statement of comprehensive income as follows:
| | | | | | | | |
(AMOUNTS IN EUR 1,000) | | 2015 | | | 2014 | |
| |
Bonds held at fair value, realised gains and losses | | | 7,456 | | | | 7,942 | |
| |
Floating-rate notes held at fair value, realised gains and losses | | | 683 | | | | -3,525 | |
| |
Derivatives held at fair value, realised gains and losses | | | -9,242 | | | | -5,361 | |
| |
Commercial paper held at fair value, realised gains and losses | | | -1 | | | | – | |
| |
Other financial placements held at fair value, realised gains and losses | | | -543 | | | | 15 | |
| |
Financial instruments held at fair value, realised gains and losses, total | | | -1,647 | | | | -929 | |
| |
Bonds held at fair value, unrealised gains and losses ¹ | | | -22,356 | | | | 23,938 | |
| |
Floating-rate notes held at fair value, unrealised gains and losses ³ | | | 5,551 | | | | 24,423 | |
| |
Derivatives held at fair value, unrealised gains and losses ² | | | 4,153 | | | | -19,965 | |
| |
Commercial paper held at fair value, unrealised gains and losses ¹ | | | 25 | | | | 12 | |
| |
Other financial placements held at fair value, unrealised gains and losses 4 | | | 3,110 | | | | -1,433 | |
| |
Financial instruments held at fair value, unrealised gains and losses, total | | | -9,517 | | | | 26,974 | |
| |
Bonds held at amortised cost, realised gains and losses 5 | | | 627 | | | | 431 | |
| |
Floating-rate notes held at amortised cost, realised gains and losses 5 | | | – | | | | -645 | |
| |
Financial instruments held at amortised cost, realised gains and losses, total | | | 627 | | | | -214 | |
| |
Adjustment in fair value of hedged loans ² | | | -136,906 | | | | 157,777 | |
| |
Adjustment in fair value of derivatives hedging loans ² | | | 136,001 | | | | -158,531 | |
| |
Adjustment in fair value of hedged debts evidenced by certificates ² | | | 171,545 | | | | -422,739 | |
| |
Adjustment in fair value of derivatives hedging debts evidenced by certificates ² | | | -149,973 | | | | 422,474 | |
| |
Adjustment to hedge accounting, unrealised gains and losses of fair value hedges, total | | | 20,667 | | | | -1,019 | |
| |
Repurchase of NIB bonds, other items | | | 1,391 | | | | 871 | |
| |
Total, net profit/loss on financial operations | | | 11,521 | | | | 25,684 | |
| |
¹ Fair value is determined according to market quotes for identical instruments (Level 1).
² Fair value adjustment is determined using valuation techniques with observable market inputs (Level 2). In 2015, NIB implemented a new valuation model for derivative instruments in order to better align its valuation methods with current market practice. The new model is based on OIS curves; the old model was LIBOR-based. Another new factor that impacts unrealised gains and losses is the cross-currency basis spread. The cross-currency basis spread is the deviation in the nominal interest rate between two currencies in a currency interest rate swap that depends on the difference in the base interest rate of the currencies. This new element may add volatility to the financial statements. The unrealised gains and losses due to the cross-currency basis spreads will be restored by maturity.
³ The fair value adjustments are mainly determined using market quotes for identical instruments (Level 1). The fair value measurements of treasury claims have been determined using valuation techniques with unobservable market inputs (Level 3).
4 Fair value is determined using valuation techniques with unobservable market inputs (Level 3).
5 These sales were made as these financial assets no longer met NIB’s investment policy.
37
Note 5: General administrative expenses
| | | | | | | | |
(AMOUNTS IN EUR 1,000) | | | 2015 | | | | 2014 | |
Staff costs | | | 30,783 | | | | 27,369 | |
Wages and salaries | | | 25,067 1 | | | | 22,204 | |
Social security costs | | | 522 | | | | 518 | |
Other staff costs | | | 5,194 | | | | 4,647 | |
Pension premiums in accordance with the Finnish state pension system | | | 6,074 | | | | 5,895 | |
Other pension premiums | | | 1,665 | | | | 1,796 | |
Office premises costs | | | 1,268 | | | | 1,161 | |
ICT service charges | | | 4,389 | | | | 3,238 | |
Other general administrative expenses | | | 7,364 | | | | 6,996 | |
Cost coverage, NDF and NEFCO | | | -969 | | | | -1,057 | |
Cost coverage, rental income and other administrative income | | | -430 | | | | -444 | |
Total | | | 50,143 | | | | 44,956 | |
| | |
Host country reimbursement according to agreement with the Finnish Government | | | -8,403 | | | | -7,570 | |
Net | | | 41,740 | | | | 37,386 | |
| | |
Remuneration to the auditors | | | | | | | | |
Audit fee 2 | | | 130 | | | | 119 | |
Other audit-related service fees | | | 0 | | | | 78 | |
Total remuneration | | | 130 | | | | 197 | |
¹ An extra provision of EUR 2 million has been made for the purpose of planning, training and adapting to the changing banking industry requirements.
² The cost of issuing comfort letters and certificates in relation to the borrowing operations of the Bank is included in the audit fee.
38
Number of employees in permanent positions ¹
| | | | | | | | |
| | | 2015 | | | 2014 | |
| |
Average number of employees | | | 188 | | | | 186 | |
| |
Average age of employees | | | 47 | | | | 46 | |
| |
Average period (years) of employment | | | 12 | | | | 11 | |
| |
| | |
Distribution by gender as of 31 Dec 2015 ¹ | | | | | | | | |
| |
All employees | | | 189 | | | | 188 | |
| |
Female | | | 80 | | | | 82 | |
| |
Male | | | 109 | | | | 106 | |
| |
Executive Committee (including the President) | | | | | | | | |
| |
Female | | | 1 | | | | 1 | |
| |
Male | | | 6 | | | | 5 | |
| |
Professional staff | | | | | | | | |
| |
Female | | | 61 | | | | 60 | |
| |
Male | | | 94 | | | | 92 | |
| |
Clerical staff | | | | | | | | |
| |
Female | | | 18 | | | | 21 | |
| |
Male | | | 9 | | | | 9 | |
| |
¹ The figures comprise staff in permanent positions including the President.
Compensation for the Board of Directors, the Control Committee, the President and the Executive Committee
Compensation for the Board of Directors (BoD) and the Control Committee (CC) is set by the Board of Governors (BoG). The compensation consists of fixed annual remuneration and an attendee allowance. The members of the BoD and the CC are also entitled to reimbursement of travel and accommodation expenses and a daily allowance in accordance with the Bank’s travel policy.
The BoD decides on the appointment and remuneration of the President. As a rule, the President is appointed on a fixed-term contract for five years at a time, but the existing contract can also be prolonged for a shorter period. The President decides upon the employment of the Executive Committee (ExCo) members. The members of the ExCo are normally employed for an indefinite period of time. The period of notice is six months. The President is authorised by the BoD to make decisions regarding compensation within the scope of Staff Regulations and the Financial Plan. The remuneration package for the members of the ExCo includes a fixed base salary and customary taxable benefits, which are in principle the same for all staff at the managerial level. In addition to this remuneration package, the members of the ExCo enjoy other benefits common to all staff (e.g. health care, supplementary group pension, insurance coverage and staff loans). The Bank can pay performance premiums of up to three months’ salary for excellent and extraordinary performance. The maximum cost for the Bank of performance premiums is a total of 3% of the estimated salary costs.
39
Compensation for the BoD, the CC, the President and the ExCo is presented in the table below. The figures for the President and the ExCo include performance premiums.
| | | | | | | | |
(AMOUNTS IN EUR) | | 2015 COMPENSATION/
TAXABLE INCOME | | | 2014 COMPENSATION/
TAXABLE INCOME | |
| |
Board of Directors | | | | | | | | |
| |
Chairman | | | | | | | | |
| |
annual remuneration | | | 13,258 | | | | 13,258 | |
| |
attendee allowance | | | 1,720 | | | | 1,720 | |
| |
Other Directors and Alternates (15 persons) | | | | | | | | |
| |
annual remuneration | | | 75,967 | | | | 76,244 | |
| |
attendee allowance | | | 14,247 | | | | 13,968 | |
| |
Control Committee | | | | | | | | |
| |
Chairman | | | | | | | | |
| |
annual remuneration | | | 4,375 | | | | 3,646 ¹ | |
| |
attendee allowance | | | 430 | | | | 430 | |
| |
Other members (9 persons) | | | | | | | | |
| |
annual remuneration | | | 16,549 | | | | 15,305 | |
| |
attendee allowance | | | 2,880 | | | | 3,312 | |
| |
President | | | 705,471 | | | | 661,780 | |
| |
Members of the Executive Committee (6 persons) ² | | | 2,385,977 | | | | 2,389,425 ³ | |
| |
¹ No chairman 1 Nov – 31 Dec 2014
² 5 persons 1 Oct 2014 – 31 Mar 2015
³ Includes additional costs due to organisational changes
Pension obligations
NIB is responsible for arranging pension security for its employees. The current pension arrangement consists of pension based on the Finnish state pension system (VaEL Pension) as the basis for the pension benefits. The VaEL Pension is calculated on the basis of the employee’s annual pensionable income and the applicable age-linked pension accrual rate. The employer’s pension contribution in 2015 was 18.25% of the employee’s pensionable income; this amount is not included in the employee’s taxable income. The employee’s pension contribution was either 5.70% or 7.20%, depending on the employee’s age. NIB pays this contribution for its permanent staff, and this part is taxed as a benefit for the employee.
In addition to the VaEL Pension, the Bank has taken out a supplementary group pension insurance policy for all its permanently employed staff, including the President. This pension insurance is based on the principle of a defined contribution. The insurance premium, 6.50%, is calculated on the basis of the employee’s taxable income and paid, in general, until the age of 63. This amount is not included in the employee’s taxable income.
NIB’s contribution (employer’s and employee’s part) to the Finnish state pension system (VaEL) regarding the President amounted to EUR 179,542 and to the supplementary pension scheme EUR 40,164. The corresponding figures for the ExCo members were EUR 571,742 and EUR 251,342.
Staff loans
Staff loans can be granted to permanently employed staff members who have been employed by the Bank for a period of at least one year. The staff loans are granted by a commercial bank, subject to a recommendation from NIB.
At present, the maximum loan amount is EUR 200,000. The employee pays interest on the loan in accordance with the official base rate established by the Ministry of Finance in Finland (0.25% in July–December 2015). The same interest rates, terms and conditions are applicable to all the employees of the Bank, including the President and the ExCo members.
40
As of 31 December 2015, there were no (-) outstanding staff loans to the President or the ExCo members.
Additional benefits for expatriates
Professional staff (including Executive Committee members) who move to Finland for the sole purpose of taking up employment at the Bank are entitled to certain expatriate benefits, such as an expatriate allowance and a spouse/family allowance. In addition, NIB assists the expatriate e.g. in finding accommodation, usually by renting a house or a flat in its own name. The staff member reimburses the Bank a part of the rent, which is equal to at least the taxable value of the accommodation benefit established annually by the Finnish National Board of Taxes.
Rental agreement
NIB owns its headquarters office building in Helsinki. The building’s total area is 18,500 m². The Bank rents office space totalling 2,087 m² adjacent to its main office building. A total of 2,350 m² is rented to external parties. Furthermore, in 2015 the Bank rented office space totalling 33 m² in Moscow.
41
Note 6: Impairment of loans
| | | | | | | | |
(AMOUNTS IN EUR 1,000) | | 2015 | | | 2014 | |
Credit losses from loans | | | – | | | | 70 | |
Credit losses on receivables from defaulted lending counterparties | | | -428 | | | | – | |
Allowances for impairment net change, individually assessed | | | -88 | | | | 2,171 | |
Allowances for impairment net change, collectively assessed | | | 5,807 | | | | 18,665 | |
Reversals of previously recorded allowances for credit losses | | | -2,782 | | | | – | |
Impairment of loans and other assets | | | 2,509 | | | | 20,905 | |
See also Note 8.
42
Note 7: Financial placements
The debt securities were issued by the following counterparties:
| | | | | | | | |
(AMOUNTS IN EUR MILLION) | | 2015 | | | 2014 | |
Governments | | | 1,219 | | | | 1,343 | |
Public institutions | | | 1,623 | | | | 1,527 | |
Other | | | 3,238 | | | | 2,619 | |
Total, debt securities | | | 6,080 | | | | 5,490 | |
The distribution of the Bank’s debt security portfolios was as follows:
| | | | | | | | | | | | | | | | |
| | | | | | BOOK VALUE | | | | | | FAIR VALUE | |
(AMOUNTS IN EUR MILLION) | | 2015 | | | 2014 | | | 2015 | | | 2014 | |
Held at fair value | | | 3,154 | | | | 2,889 | | | | 3,154 | | | | 2,889 | |
Held at amortised cost | | | 2,926 | | | | 2,601 | | | | 3,057 | | | | 2,768 | |
Total, debt securities | | | 6,080 | | | | 5,490 | | | | 6,211 | | | | 5,656 | |
Of these debt securities, EUR 4,345 (4,047) million is at fixed interest rates and EUR 1,735 (1,443) million at floating interest rates.
Reclassified securities
The Bank reclassified financial assets out of the held-for-trading portfolio to the held-to-maturity portfolio during 2008 because these assets are no longer held for the purpose of being sold in the near term. At the same time, assets recognised among cash and cash equivalents became financial placements and are not included in net liquidity. All the reclassifications took place at the fair value at the date of reclassification. The reclassified cost will be amortised over the instrument’s expected remaining lifetime through interest income using the effective interest method.
| | | | | | | | | | | | |
(AMOUNTS IN EUR MILLION) | | BOOK VALUE | | | FAIR VALUE | | | UNRECOGNISED ADJUSTMENTS TO FAIR VALUE | |
2015 | | | 73 | | | | 74 | | | | 0 | |
2014 | | | 96 | | | | 98 | | | | 2 | |
2013 | | | 169 | | | | 164 | | | | -4 | |
2012 | | | 297 | | | | 275 | | | | -22 | |
2011 | | | 409 | | | | 370 | | | | -39 | |
2010 | | | 505 | | | | 483 | | | | -22 | |
2009 | | | 606 | | | | 585 | | | | -21 | |
2008 | | | 684 | | | | 630 | | | | -54 | |
1 Sep 2008 | | | 762 | | | | 715 | | | | -47 | |
43
| | | | | | | | | | | | |
(AMOUNTS IN EUR MILLION) | | RECOGNISED INTEREST INCOME DUE TO
RECLASSIFICATION | | | CHANGE IN UNRECOGNISED
ADJUSTMENT TO FAIR VALUE | | | IMPACT ON PROFIT IF THE
RECLASSIFICATION HAD NOT
BEEN IMPLEMENTED | |
2015 | | | -0.6 | | | | -1.7 | | | | -2.3 | |
2014 | | | -0.7 | | | | 6.2 | | | | 5.5 | |
2013 | | | -1.4 | | | | 17.4 | | | | 16.1 | |
2012 | | | -6.1 | | | | 17.4 | | | | 11.3 | |
2011 | | | -7.3 | | | | -17.7 | | | | -25.0 | |
2010 | | | -8.6 | | | | -0.2 | | | | -8.7 | |
2009 | | | -8.6 | | | | 32.6 | | | | 24.0 | |
2008 | | | -1.5 | | | | -7.3 | | | | -8.8 | |
44
Note 8: Loans outstanding and guarantee commitments
Loans outstanding were distributed as follows over the Bank’s three loan facilities:
| | | | | | | | |
(AMOUNTS IN EUR MILLION) | | | 2015 | | | | 2014 | |
Ordinary Loans | | | | | | | | |
Investment loans in the member countries | | | 13,159 | | | | 12,403 | |
Investment loans in other countries | | | 545 | | | | 519 | |
Regional loans in the Nordic countries | | | 2 | | | | 3 | |
Adjustment to hedge accounting | | | 249 | | | | 378 | |
Total | | | 13,956 | | | | 13,303 | |
| | |
Project Investment Loans (PIL) | | | | | | | | |
Africa | | | 145 | | | | 188 | |
Asia | | | 730 | | | | 828 | |
Europe and Eurasia | | | 326 | | | | 369 | |
Latin America | | | 433 | | | | 389 | |
Middle East | | | 43 | | | | 52 | |
Adjustment to hedge accounting | | | 13 | | | | 22 | |
Total | | | 1,689 | | | | 1,848 | |
| | |
Environmental Investment Loans (MIL) | | | 43 | | | | 61 | |
| | |
Collective impairment | | | -61 | | | | -55 | |
Total, loans outstanding | | | 15,627 | | | | 15,156 | |
The figure for loans outstanding, EUR 15,627 (15,156) million, includes medium-term notes (MTN) of EUR 618 (735) million. These are held at amortised cost unless they form part of a qualifying hedging relationship with a derivative. In a hedge accounting relationship, the MTNs are recognised at fair value.
Loans outstanding at floating interest rates amounted to EUR 12,897 (12,310) million, while those at fixed interest rates amounted to EUR 2,529 (2,502) million. There were no guarantee commitments (-) under Ordinary Lending as of 31 December 2015.
The Bank views forbearance to be modification of loan agreements when the counterparty is considered to be unable to meet the terms and conditions of the contract due to financial difficulties. Modification of the terms and conditions of the contract may include, for example, reduction of the interest rate, principal or accrued interest, or rescheduling of the payment dates of principal and/or interest, and has an actual effect on the future cash flows. Loan forbearance is granted on a selective basis and purposefully to avoid counterparty default in favour of the Bank’s collection opportunities. Counterparties under forbearance activities are moved to the watch list, and are subject to the impairment policies of the Bank. As of 31 December 2015, a total of EUR 45.9 (120.8) million of Ordinary Loans and EUR 101.1 (96.5) million of Project Investment Loans from the Bank’s loans outstanding before impairments are affected by forbearance, and respectively after impairments EUR 45.9 (120.8) million of Ordinary Loans, and EUR 46.2 (44.8) million of Project Investment Loans. The loans affected by forbearance amounted to interest income of EUR 9.2 million in 2015. See also “Credit risk monitoring” under Risk Management.
As of December 2015, there was one (one) non-performing MIL loan totalling EUR 14.8 million. See also “Impairment of loans and receivables” under Accounting policies.
45
A total of EUR 192.3 (181.7) million has been deducted from the Bank’s loans outstanding and from lending claims in “other assets”. Specific allowances for impairment amounted to EUR 131.0 million and collectively assessed allowances amounted to EUR 61.3 million. During 2015, no (-) lending transactions were converted into claims under “other assets”. The following changes in allowances for impairment and effects of foreign currency movements are recognised in the statement of comprehensive income under “impairment of loans” and “foreign exchange gains and losses”.
Specific and collective allowances for impairment
| | | | | | | | |
(AMOUNTS IN EUR MILLION) | | 2015 | | | 2014 | |
Balance at 1 January | | | 181.7 | | | | 156.6 | |
Allowances for impairment, individually assessed | | | 7.5 | | | | 14.2 | |
Allowances for impairment, collectively assessed | | | 5.8 | | | | 18.7 | |
Reversals of previously recorded allowances for impairment | | | -2.8 | | | | -7.7 | |
Balance at 31 December | | | 192.3 | | | | 181.7 | |
See also Note 6.
The distribution of allowances for impairment was as follows:
| | | | | | | | |
(AMOUNTS IN EUR MILLION) | | 2015 | | | 2014 | |
Distribution by loan facility | | | | | | | | |
Ordinary Loans | | | – | | | | – | |
Project Investment Loans (PIL) | | | 54.9 | | | | 51.7 | |
Allowances for impairment, loans outstanding | | | 54.9 | | | | 51.7 | |
Collective impairment | | | 61.3 | | | | 55.5 | |
Impairment losses on defaulted loan customers, other assets | | | 76.1 | | | | 74.5 | |
Total | | | 192.3 | | | | 181.7 | |
| | | | | | | | |
(AMOUNTS IN EUR MILLION) | | 2015 | | | 2014 | |
Distribution by NIB business areas | | | | | | | | |
Energy & Environment | | | 4.1 | | | | 3.8 | |
Financial Institutions & SMEs | | | – | | | | – | |
Industries and Services | | | – | | | | – | |
Infrastructure, Transportation and Telecom | | | 50.8 | | | | 47.9 | |
Allowances for impairment, loans outstanding | | | 54.9 | | | | 51.7 | |
Collective impairment | | | 61.3 | | | | 55.5 | |
Impairment losses on defaulted loan customers, other assets | | | 76.1 | | | | 74.5 | |
Total | | | 192.3 | | | | 181.7 | |
46
As of 31 December 2015, loans agreed but not yet disbursed amounted to the following:
| | | | | | | | |
(AMOUNTS IN EUR MILLION) | | 2015 | | | 2014 | |
Loans agreed but not yet disbursed | | | | | | | | |
Ordinary Loans | | | 936 | | | | 1,005 | |
Project Investment Loans | | | 230 | �� | | | 284 | |
Environmental Investment Loans | | | 27 | | | | 27 | |
Total, loans agreed but not yet disbursed | | | 1,193 | | | | 1,316 | |
The amounts set forth above for loans agreed but not yet disbursed include loans in considerable amounts where certain conditions, primarily interest rate conditions, may not yet have been finally approved.
Distribution according to NIB business areas
| | | | | | | | | | | | | | | | |
(AMOUNTS IN EUR MILLION) | | 2015 SHARE, IN % | | | 2014 SHARE, IN % | |
Loans outstanding as of 31 December | | | | | | | | | | | | | | | | |
Energy & Environment | | | 4,575 | | | | 30% | | | | 4,529 | | | | 31% | |
Financial Institutions & SMEs | | | 2,108 | | | | 14% | | | | 2,016 | | | | 14% | |
Industries and Services | | | 4,910 | | | | 32% | | | | 5,149 | | | | 35% | |
Infrastructure, Transportation and Telecom | | | 3,833 | | | | 25% | | | | 3,119 | | | | 21% | |
Collective impairment | | | -61 | | | | | | | | -55 | | | | | |
Adjustments to hedge accounting | | | 263 | | | | | | | | 399 | | | | | |
Total | | | 15,627 | | | | 100% | | | | 15,156 | | | | 100% | |
| | | | |
Loans disbursed | | | | | | | | | | | | | | | | |
Energy & Environment | | | 483 | | | | 18% | | | | 756 | | | | 33% | |
Financial Institutions & SMEs | | | 394 | | | | 15% | | | | 137 | | | | 6% | |
Industries and Services | | | 932 | | | | 34% | | | | 827 | | | | 36% | |
Infrastructure, Transportation and Telecom | | | 907 | | | | 33% | | | | 554 | | | | 24% | |
Total | | | 2,716 | | | | 100% | | | | 2,274 | | | | 100% | |
Currency distribution of loans outstanding
| | | | | | | | | | | | | | | | | | | | | | | | |
| | | ORDINARY LOANS | | | PIL LOANS | | | TOTAL ¹ | |
(NOMINAL AMOUNTS IN EUR MILLION) | | 2015 | | | 2014 | | | 2015 | | | 2014 | | | 2015 | | | 2014 | |
Currency | | | | | | | | | | | | | | | | | | | | | | | | |
Nordic currencies | | | 4,400 | | | | 4,139 | | | | 66 | | | | 65 | | | | 4,466 | | | | 4,204 | |
EUR | | | 7,574 | | | | 7,200 | | | | 509 | | | | 591 | | | | 8,111 | | | | 7,828 | |
USD | | | 1,556 | | | | 1,424 | | | | 1,046 | | | | 1,097 | | | | 2,616 | | | | 2,544 | |
Other currencies | | | 177 | | | | 162 | | | | 54 | | | | 74 | | | | 232 | | | | 237 | |
Total | | | 13,707 | | | | 12,925 | | | | 1,676 | | | | 1,826 | | | | 15,426 | | | | 14,812 | |
Adjustment to hedge accounting | | | 249 | | | | 378 | | | | 13 | | | | 22 | | | | 263 | | | | 399 | |
Collective impairment | | | | | | | | | | | | | | | | | | | -61 | | | | -55 | |
Total, loans outstanding | | | 13,956 | | | | 13,303 | | | | 1,689 | | | | 1,848 | | | | 15,627 | | | | 15,156 | |
¹ The total amount also includes EUR 43 (61) million in Environmental Investment Loans (MIL)
47
Distribution of loans outstanding and guarantees by various types of security
The following table shows loans outstanding, including guarantee commitments, distributed by type of security:
| | | | | | | | | | | | | | | | |
(AMOUNTS IN EUR MILLION) | | AMOUNT | | | 2015 SHARE, IN % | | | AMOUNT | | | 2014 SHARE, IN % | |
Loans to or guaranteed by governments | | | | | | | | | | | | | | | | |
Loans to or guaranteed by member countries | | | 327 | | | | | | | | 346 | | | | | |
Loans to or guaranteed by other countries | | | 1,128 | | | | | | | | 1,202 | | | | | |
Loans to or guaranteed by governments, total | | | 1,456 | | | | 9.5% | | | | 1,548 | | | | 10.5% | |
| | | | |
Loans to or guaranteed by local authorities in member countries | | | 1,642 | | | | 10.7% | | | | 1,192 | | | | 8.1% | |
| Loans to or guaranteed by companies owned 50% or more by member countries or local authorities in member countries | | | 1,402 | | | | 9.1% | | | | 1,349 | | | | 9.1% | |
Loans to or guaranteed by banks | | | 1,258 | | | | 8.2% | | | | 1,063 | | | | 7.2% | |
Loans backed by a lien or other security in property | | | 1,109 | | | | 7.2% | | | | 773 | | | | 5.2% | |
Loans with a guarantee from the parent company and other guarantees | | | 810 | | | | 5.3% | | | | 1,337 | | | | 9.1% | |
Loans with a negative pledge clause and other covenants | | | 7,748 | | | | 50.4% | | | | 7,547 | | | | 51.1% | |
Loans without formal security | | | 0 | | | | 0.0% | | | | 3 | | | | 0.0% | |
Collective impairment | | | -61 | | | | | | | | -55 | | | | | |
Total | | | 15,364 | | | | 100.0% | | | | 14,757 | | | | 100.0% | |
Adjustment to hedge accounting | | | 263 | | | | | | | | 399 | | | | | |
Total, loans outstanding | | | 15,627 | | | | | | | | 15,156 | | | | | |
According to NIB’s Statutes, the member countries shall cover the Bank’s losses arising from failure of payment in connection with PIL loans up to the following amounts:
| | | | | | | | | | | | | | | | |
(AMOUNTS IN EUR 1,000) | | AMOUNT OF
GUARANTEE | | | 2015 SHARE, IN % | | | AMOUNT OF
GUARANTEE | | | 2014 SHARE, IN % | |
Member country | | | | | | | | | | | | | | | | |
Denmark | | | 377,821 | | | | 21.0% | | | | 377,821 | | | | 21.0% | |
Estonia | | | 13,139 | | | | 0.7% | | | | 13,139 | | | | 0.7% | |
Finland | | | 344,860 | | | | 19.2% | | | | 344,860 | | | | 19.2% | |
Iceland | | | 15,586 | | | | 0.9% | | | | 15,586 | | | | 0.9% | |
Latvia | | | 19,058 | | | | 1.1% | | | | 19,058 | | | | 1.1% | |
Lithuania | | | 29,472 | | | | 1.6% | | | | 29,472 | | | | 1.6% | |
Norway | | | 329,309 | | | | 18.3% | | | | 329,309 | | | | 18.3% | |
Sweden | | | 670,755 | | | | 37.3% | | | | 670,755 | | | | 37.3% | |
Total | | | 1,800,000 | | | | 100.0% | | | | 1,800,000 | | | | 100.0% | |
According to NIB’s Statutes, the member countries shall cover 100% of the Bank’s losses arising from failure of payment in connection with MIL loans. The MIL loan facility has a statutory ceiling of EUR 300 million. Following the Board of Directors’ decision to call for payments under the MIL guarantees in 2014 due to non-payment of one MIL loan, all member countries made guarantee payments to the Bank.
48
The member countries’ total guarantee liabilities under the MIL facility are as follows after the guarantee payments as of 2 July 2014:
| | | | | | | | | | | | | | | | |
(AMOUNTS IN EUR 1,000) | | AMOUNT OF
GUARANTEE | | | 2015 SHARE, IN % | | | AMOUNT OF
GUARANTEE | | | 2014 SHARE, IN % | |
Member country | | | | | | | | | | | | | | | | |
Denmark | | | 65,573 | | | | 23.4% | | | | 65,573 | | | | 23.4% | |
Estonia | | | 2,048 | | | | 0.7% | | | | 2,048 | | | | 0.7% | |
Finland | | | 48,051 | | | | 17.1% | | | | 48,051 | | | | 17.1% | |
Iceland | | | 2,981 | | | | 1.1% | | | | 2,981 | | | | 1.1% | |
Latvia | | | 2,971 | | | | 1.1% | | | | 2,971 | | | | 1.1% | |
Lithuania | | | 4,594 | | | | 1.6% | | | | 4,594 | | | | 1.6% | |
Norway | | | 57,354 | | | | 20.4% | | | | 57,354 | | | | 20.4% | |
Sweden | | | 97,005 | | | | 34.6% | | | | 97,005 | | | | 34.6% | |
Total | | | 280,577 | | | | 100.0% | | | | 280,577 | | | | 100.0% | |
Furthermore, in 2015 the Bank decided to call on the MIL guarantee due to non-payment of one MIL loan. The execution of the decision will take place in 2016.
49
Note 9: Intangible assets, tangible assets (property and equipment)
The Bank’s intangible assets amounted to EUR 0.0 (5.2) million.
| | | | | | | | |
(AMOUNTS IN EUR 1,000) | | COMPUTER SOFTWARE DEVELOPMENT COSTS, TOTAL 2015 | | | COMPUTER SOFTWARE DEVELOPMENT COSTS, TOTAL 2014 | |
Intangible assets | | | | | | | | |
Acquisition value at the beginning of the year | | | 26,576 | | | | 24,939 | |
Acquisitions during the year | | | 1,005 | | | | 1,637 | |
Sales/disposals during the year | | | – | | | | – | |
Acquisition value at the end of the year | | | 27,581 | | | | 26,576 | |
| | |
Accumulated amortisation at the beginning of the year | | | 21,359 | | | | 19,828 | |
Amortisation for the year | | | 6,222 ¹ | | | | 1,531 | |
Accumulated amortisation on sales/disposals during the year | | | – | | | | – | |
Accumulated amortisation at the end the of the year | | | 27,581 | | | | 21,359 | |
Net book value | | | 0 | | | | 5,217 | |
¹ Including effect of EUR 4.2 million from change in depreciation methodology and plan on intangible assets.
As of 31 December 2015, the historical cost of buildings and land was recognised in the statement of financial position (net of depreciation on the buildings in accordance with the depreciation plan) at EUR 22.3 (23.0) million.
The value of office equipment and other tangible assets is recognised at EUR 6.0 (5.3) million.
2015
| | | | | | | | | | | | |
(AMOUNTS IN EUR 1,000) | | BUILDINGS | | | OFFICE EQUIPMENT AND
OTHER TANGIBLE ASSETS | | | TOTAL | |
Tangible assets | | | | | | | | | | | | |
Acquisition value at the beginning of the year | | | 33,769 | | | | 20,017 | | | | 53,786 | |
Acquisitions during the year | | | – | | | | 2,572 | | | | 2,572 | |
Sales/disposals during the year | | | – | | | | -136 | | | | -136 | |
Acquisition value at the end of the year | | | 33,769 | | | | 22,453 | | | | 56,222 | |
| | | |
Accumulated depreciation at the beginning of the year | | | 10,771 | | | | 14,692 | | | | 25,462 | |
Depreciation for the year | | | 673 | | | | 1,842 ¹ | | | | 2,515 | |
Accumulated depreciation on sales/disposals during the year | | | – | | | | -115 | | | | -115 | |
Accumulated depreciation at the end of the year | | | 11,444 | | | | 16,419 | | | | 27,863 | |
Net book value | | | 22,326 | | | | 6,034 | | | | 28,360 | |
¹ Includes additional depreciation of EUR 0.3 million.
On each closing date, the Bank’s assets are assessed to determine whether there is any indication of an asset’s impairment. As of 31 December 2015, there were no indications of impairment of the intangible or tangible assets.
50
2014
| | | | | | | | | | | | |
(AMOUNTS IN EUR 1,000) | | BUILDINGS | | | OFFICE EQUIPMENT AND
OTHER TANGIBLE ASSETS | | | TOTAL | |
| |
Tangible assets | | | | | | | | | | | | |
| |
Acquisition value at the beginning of the year | | | 33,769 | | | | 19,356 | | | | 53,126 | |
| |
Acquisitions during the year | | | – | | | | 918 | | | | 918 | |
| |
Sales/disposals during the year | | | – | | | | -257 | | | | -257 | |
| |
Acquisition value at the end of the year | | | 33,769 | | | | 20,017 | | | | 53,786 | |
| |
| | | |
Accumulated depreciation at the beginning of the year | | | 10,097 | | | | 13,388 | | | | 23,486 | |
| |
Depreciation for the year | | | 673 | | | | 1,504 | | | | 2,178 | |
| |
Accumulated depreciation on sales/disposals during the year | | | – | | | | -201 | | | | -201 | |
| |
Accumulated depreciation at the end of the year | | | 10,771 | | | | 14,692 | | | | 25,462 | |
| |
Net book value | | | 22,999 | | | | 5,325 | | | | 28,324 | |
| |
51
Note 10: Depreciation
| | | | | | | | |
(AMOUNTS IN EUR 1,000) | | 2015 | | | 2014 | |
Intangible assets | | | 6,222 ¹ | | | | 1,531 | |
Tangible assets | | | 2,515 | | | | 2,178 | |
Buildings | | | 673 | | | | 673 | |
Office equipment | | | 1,842 ² | | | | 1,504 | |
Total | | | 8,737 | | | | 3,709 | |
¹ Including effect of EUR 4.2 million from change in depreciation methodology and plan on intangible assets.
² Includes additional depreciation of EUR 0.3 million.
52
Note 11: Other assets
Derivatives are included in “Other assets”.
| | | | | | | | |
(AMOUNTS IN EUR MILLION) | | 2015 | | 2014 |
Interest rate swaps ¹ | | | 18,274 | | | | 15,763 | |
Currency swaps ² | | | 17,996 | | | | 18,677 | |
Total, nominal amount | | | 36,270 | | | | 34,440 | |
Netting of nominal amount per derivative | | | -34,358 | | | | -32,970 | |
Derivative receivables, net | | | 1,912 | | | | 1,470 | |
Adjustment to hedge accounting and changes in fair value of non-hedging derivatives | | | 646 | | | | 728 | |
Derivative instruments | | | 2,558 | | | | 2,198 | |
Receivables from defaulted counterparties | | | 6 | | | | 8 | |
Other | | | 17 | | | | 12 | |
Total | | | 2,581 | | | | 2,217 | |
¹ Interest rate swaps at floating interest rates EUR 6,200 (6,323) million and fixed interest rates EUR 12,073 (9,440) million.
² Currency swaps at floating interest rates EUR 11,309 (11,480) million and fixed interest rates EUR 6,686 (7,197) million.
Derivatives are carried at fair value in the statement of financial position net per contract. Thus, swap contracts with a positive net fair value are recognised in the statement of financial position under “Other assets”, while swap contracts with a negative net fair value are recognised under “Other liabilities”.
Derivative instruments net exposure after collaterals
| | | | | | | | |
(AMOUNTS IN EUR MILLION) | | 2015 | | 2014 |
Derivative instruments in financial position | | | 2,558 | | | | 2,198 | |
Netting by counterparty | | | -795 | | | | -799 | |
Derivative instruments net per counterparty | | | 1,763 | | | | 1,399 | |
Accrued interest net per counterparty | | | 97 | | | | 109 | |
Net exposure before collaterals | | | 1,861 | | | | 1,508 | |
Collateral received | | | -1,725 | | | | -1,382 | |
Net exposure | | | 135 | | | | 125 | |
See also Risk Management, Credit Risk, Credit Risk Mitigation.
53
Note 12: Debts evidenced by certificates and swaps
At year-end, the Bank’s borrowings evidenced by certificates were distributed between the currencies shown in the table below. The table also demonstrates the distribution of borrowings by currency on an after-swap nominal basis.
| | | | | | | | | | | | | | | | | | | | | | | | |
| | | | | BORROWING | | SWAP CONTRACTS PAYABLE/RECEIVABLE | | NET CURRENCY |
(AMOUNTS IN EUR MILLION) | | 2015 | | 2014 | | 2015 | | 2014 | | 2015 | | 2014 |
Currency | | | | | | | | | | | | | | | | | | | | | | | | |
USD | | | 9,675 | | | | 8,078 | | | | -5,169 | | | | -4,054 | | | | 4,506 | | | | 4,024 | |
AUD | | | 2,369 | | | | 2,637 | | | | -2,369 | | | | -2,637 | | | | 0 | | | | 0 | |
NZD | | | 1,821 | | | | 1,603 | | | | -1,821 | | | | -1,603 | | | | 0 | | | | 0 | |
EUR | | | 1,222 | | | | 723 | | | | 8,490 | | | | 8,550 | | | | 9,648 | | | | 9,273 | |
GBP | | | 1,144 | | | | 1,516 | | | | -1,144 | | | | -1,516 | | | | 0 | | | | 0 | |
JPY | | | 559 | | | | 735 | | | | -548 | | | | -722 | | | | 11 | | | | 13 | |
Nordic currencies | | | 2,175 | | | | 1,761 | | | | 2,901 | | | | 2,878 | | | | 5,076 | | | | 4,639 | |
Other currencies | | | 1,272 | | | | 1,597 | | | | -1,051 | | | | -1,373 | | | | 220 | | | | 224 | |
Total | | | 20,238 | | | | 18,650 | | | | -712 | | | | -477 | | | | 19,461 | | | | 18,173 | |
| | | | | | |
| Adjustment to hedge accounting and changes in fair value of non-hedging derivatives | | | 624 | | | | 796 | | | | -365 | | | | -392 | | | | 259 | | | | 404 | |
Total, borrowing outstanding | | | 20,862 | | | | 19,446 | | | | -1,077 | | | | -869 | | | | 19,721 | | | | 18,577 | |
The table set forth above includes the following medium-term note (MTN) programmes: 124 (156) borrowing transactions in the equivalent amount of EUR 5,862 (6,671) million entered into under the Bank’s euro MTN programme; 11 (10) borrowing transactions in the equivalent amount of EUR 9,706 (7,824) million under the Bank’s US MTN programmes; and 37 (38) borrowing transactions in the equivalent amount of EUR 4,171 (4,174) million under the Bank’s Australian MTN programme. There were no borrowing transactions outstanding under the Bank’s Swedish MTN programme during the years 2015 and 2014. The Bank has established a EUR 2,000 million commercial paper programme in Europe.
Of debt securities issued, the amount of EUR 1,402 (2,001) million is at floating interest rates, while EUR 18,725 (16,587) million is at fixed interest rates and EUR 64 (-) million is in short-term discounted papers. Of the other borrowing transactions, the amount of EUR 10 (10) million is at floating interest rates, while EUR 37 (52) million is at fixed interest rates.
54
Note 13: Other liabilities
Derivatives are included in “Other liabilities”.
| | | | | | | | |
(AMOUNTS IN EUR MILLION) | | 2015 | | 2014 |
Interest rate swaps ¹ | | | 18,274 | | | | 15,747 | |
Currency swaps ² | | | 17,255 | | | | 18,182 | |
Total, nominal amount | | | 35,529 | | | | 33,930 | |
Netting of nominal amount per derivative | | | -34,329 | | | | -32,937 | |
Derivative payables, net | | | 1,200 | | | | 993 | |
Adjustment to hedge accounting and changes in fair value of non-hedging derivatives | | | 281 | | | | 336 | |
Derivative instruments | | | 1,481 | | | | 1,329 | |
Other | | | 10 | | | | 7 | |
Total | | | 1,491 | | | | 1,336 | |
¹ Interest rate swaps at floating interest rates EUR 14,427 (11,909) million and fixed interest rates EUR 3,847 (3,838) million.
² Currency swaps at floating interest rates EUR 16,929 (18,065) million and fixed interest rates EUR 327 (118) million.
Derivatives are carried at fair value in the statement of financial position net per contract. Thus, swap contracts with a positive net fair value are recognised in the statement of financial position under “Other assets”, while swap contracts with a negative net fair value are recognised under “Other liabilities”.
Derivative instruments net exposure after collaterals
| | | | | | | | |
(AMOUNTS IN EUR MILLION) | | 2015 | | 2014 |
Derivative instruments in financial position | | | 1,481 | | | | 1,329 | |
Netting by counterparty | | | -795 | | | | -799 | |
Derivative instruments net per counterparty | | | 686 | | | | 530 | |
Accrued interest net per counterparty | | | -79 | | | | -64 | |
Net exposure before collaterals | | | 607 | | | | 465 | |
Collateral given | | | -94 | | | | – | |
Net exposure | | | 513 | | | | 465 | |
See also Risk Management, Credit Risk, Credit Risk Mitigation.
55
Note 14: Authorised capital – paid-in capital
The member countries’ portions of authorised capital are as follows:
| | | | | | | | | | | | | | | | |
(AMOUNTS IN EUR MILLION) | | 2015 | | | SHARE, IN % | | | 2014 | | | SHARE, IN % | |
| |
Member country | | | | | | | | | | | | |
| |
Denmark | | | 1,293.9 | | | | 21.1% | | | | 1,293.9 | | | | 21.1% | |
| |
Estonia | | | 56.3 | | | | 0.9% | | | | 56.3 | | | | 0.9% | |
| |
Finland | | | 1,088.1 | | | | 17.7% | | | | 1,088.1 | | | | 17.7% | |
| |
Iceland | | | 58.1 | | | | 0.9% | | | | 58.1 | | | | 0.9% | |
| |
Latvia | | | 82.1 | | | | 1.3% | | | | 82.1 | | | | 1.3% | |
| |
Lithuania | | | 119.8 | | | | 2.0% | | | | 119.8 | | | | 2.0% | |
| |
Norway | | | 1,320.8 | | | | 21.5% | | | | 1,320.8 | | | | 21.5% | |
| |
Sweden | | | 2,122.8 | | | | 34.6% | | | | 2,122.8 | | | | 34.6% | |
| |
Total | | | 6,141.9 | | | | 100.0% | | | | 6,141.9 | | | | 100.0% | |
| |
The member countries’ portions of paid-in capital are as follows: | |
(AMOUNTS IN EUR MILLION) | | 2015 | | | SHARE, IN % | | | 2014 | | | SHARE, IN % | |
| |
Member country | | | | | | | | | | | | |
| |
Denmark | | | 89.2 | | | | 21.3% | | | | 89.2 | | | | 21.3% | |
| |
Estonia | | | 3.1 | | | | 0.7% | | | | 3.1 | | | | 0.7% | |
| |
Finland | | | 74.4 | | | | 17.8% | | | | 74.4 | | | | 17.8% | |
| |
Iceland | | | 3.9 | | | | 0.9% | | | | 3.9 | | | | 0.9% | |
| |
Latvia | | | 4.4 | | | | 1.1% | | | | 4.4 | | | | 1.1% | |
| |
Lithuania | | | 6.9 | | | | 1.6% | | | | 6.9 | | | | 1.6% | |
| |
Norway | | | 77.1 | | | | 18.4% | | | | 77.1 | | | | 18.4% | |
| |
Sweden | | | 159.5 | | | | 38.1% | | | | 159.5 | | | | 38.1% | |
| |
Total | | | 418.6 | | | | 100.0% | | | | 418.6 | | | | 100.0% | |
| |
56
Note 15: Statutory reserve and credit risk funds
At the end of 2015, the Statutory Reserve amounted to EUR 686.3 million, or 11.2% of the Bank’s authorised capital of EUR 6,141.9 million.
The General Credit Risk Fund recognised in “Equity” is built up by means of allocations from prior years’ profits. This fund is established to cover unidentified, exceptional credit losses. The Statutory Reserve and the General Credit Risk Fund together constitute the Bank’s general reserves. The General Credit Risk Fund amounted to EUR 1,430.3 million in 2015.
In accordance with its Statutes, the Bank has a Special Credit Risk Fund for the Project Investment Loan facility (PIL). This fund is primarily designed to cover the Bank’s own risk in respect of this PIL loan facility, which in part is guaranteed by the member countries. In 2015, the fund amounted to EUR 395.9 million. The Bank assumes 100% of any losses under individual PIL loans, up to the amount available at any given time in the Special Credit Risk Fund for PIL. Only after this fund has been fully used can the Board of Directors call on the member country guarantees.
Taken together, these credit risk funds (General Credit Risk Fund and Special Credit Risk Fund PIL) amounted to EUR 1,826.2 million as of 31 December 2015.
57
Note 16: Collateral and commitments
| | | | | | | | |
(AMOUNTS IN EUR MILLION) | | 2015 | | | 2014 | |
| |
Guarantees issued at nominal amount (Note 8) | | | – | | | | – | |
| |
Loans agreed but not yet disbursed (Note 8) | | | 1,193 | | | | 1,316 | |
| |
Borrowing commitments | | | – | | | | 54 | |
| |
Collateral provided for staff loans 1 | | | – | | | | – | |
| |
Securities given as collateral for repurchase agreements 1 | | | 121 | | | | – | |
| |
Callable commitments in financial placements | | | 6 | | | | 9 | |
| |
Collateral received for collateralised placements 2 3 | | | 1,677 | | | | 727 | |
| |
Gross collateral with respect to derivatives exposure | | | | | | | | |
| |
Collateral received 2 4 | | | 1,829 | | | | 1,452 | |
| |
Collateral given 1 | | | 94 | | | | – | |
| |
1 Book value.
2 Fair value.
3 Including cash of EUR 8 (14) million and securities of EUR 1,669 (713) million received.
4 Including cash of EUR 1,440 (818) million and securities of EUR 389 (634) million received.
58
Note 17: Fair value of financial instruments
| | | | | | | | | | | | | | | | | | | | | | | | |
(AMOUNTS IN EUR MILLION) | | CARRYING
AMOUNT | | | FAIR
VALUE | | | 2015 DIFFERENCE | | | CARRYING
AMOUNT | | | FAIR
VALUE | | | 2014 DIFFERENCE | |
Assets | | | | | | | | | | | | | | | | | | | | | | | | |
Cash accounts with banks ¹ | | | 111 | | | | 111 | | | | – | | | | 100 | | | | 100 | | | | – | |
Cash equivalents held at fair value ¹ | | | 1,985 | | | | 1,985 | | | | – | | | | 1,123 | | | | 1,123 | | | | – | |
Other cash and cash equivalents held at amortised cost ² | | | 570 | | | | 570 | | | | – | | | | 417 | | | | 417 | | | | – | |
Cash and cash equivalents, total | | | 2,666 | | | | 2,666 | | | | – | | | | 1,639 | | | | 1,639 | | | | – | |
Placements with credit institutions ² | | | 8 | | | | 8 | | | | – | | | | 7 | | | | 7 | | | | – | |
Debt securities held at fair value ¹ ³ | | | 3,154 | | | | 3,154 | | | | – | | | | 2,889 | | | | 2,889 | | | | – | |
Other debt securities held at amortised cost ¹ | | | 2,926 | | | | 3,057 | | | | 131 | | | | 2,601 | | | | 2,768 | | | | 167 | |
Debt securities, total | | | 6,080 | | | | 6,211 | | | | 131 | | | | 5,490 | | | | 5,656 | | | | 167 | |
Other financial placements at fair value ¹ ³ | | | 22 | | | | 22 | | | | – | | | | 22 | | | | 22 | | | | – | |
Hedged loans outstanding in fair value hedging relationships ² | | | 2,749 | | | | 2,749 | | | | – | | | | 2,899 | | | | 2,899 | | | | – | |
Loans outstanding, other ² | | | 12,878 | | | | 12,877 | | | | -1 | | | | 12,257 | | | | 12,259 | | | | 2 | |
Loans outstanding, total | | | 15,627 | | | | 15,626 | | | | -1 | | | | 15,156 | | | | 15,159 | | | | 2 | |
Hedging derivatives at fair value ² | | | 1,115 | | | | 1,115 | | | | – | | | | 1,274 | | | | 1,274 | | | | – | |
Other derivatives at fair value ² | | | 1,443 | | | | 1,443 | | | | – | | | | 924 | | | | 924 | | | | – | |
Derivatives at fair value, total | | | 2,558 | | | | 2,558 | | | | – | | | | 2,198 | | | | 2,198 | | | | – | |
Receivables from defaulted counterparties at fair value ³ | | | 6 | | | | 6 | | | | – | | | | 8 | | | | 8 | | | | – | |
| | | | | | | | | | | | 130 | | | | | | | | | | | | 169 | |
| | | | | | |
Liabilities | | | | | | | | | | | | | | | | | | | | | | | | |
Short-term amounts owed to credit institutions ² | | | 1,449 | | | | 1,449 | | | | – | | | | 872 | | | | 872 | | | | – | |
Long-term amounts owed to credit institutions ² | | | 18 | | | | 18 | | | | – | | | | – | | | | – | | | | – | |
Repurchase agreements ² | | | 123 | | | | 123 | | | | – | | | | | | | | | | | | | |
Hedged debt securities issued in fair value hedging relationships ² | | | 20,051 | | | | 20,051 | | | | – | | | | 18,675 | | | | 18,675 | | | | – | |
Other debt securities issued ² | | | 751 | | | | 749 | | | | -1 | | | | 694 | | | | 695 | | | | 1 | |
Debt securities issued, total | | | 20,802 | | | | 20,801 | | | | -1 | | | | 19,369 | | | | 19,370 | | | | 1 | |
Hedged other debt in fair value hedging relationships ² | | | 60 | | | | 60 | | | | – | | | | 77 | | | | 77 | | | | – | |
Other debt ² | | | – | | | | – | | | | – | | | | – | | | | – | | | | – | |
Other debt, total | | | 60 | | | | 60 | | | | – | | | | 77 | | | | 77 | | | | – | |
Hedging derivatives at fair value ² | | | 1,371 | | | | 1,371 | | | | – | | | | 1,152 | | | | 1,152 | | | | – | |
Other derivatives at fair value ² | | | 109 | | | | 109 | | | | – | | | | 177 | | | | 177 | | | | – | |
Derivatives at fair value, total | | | 1,481 | | | | 1,481 | | | | – | | | | 1,329 | | | | 1,329 | | | | – | |
| | | | | | | | | | | | -1 | | | | | | | | | | | | – | |
Net | | | | | | | | | | | 128 | | | | | | | | | | | | 169 | |
¹ The fair value is determined according to market quotes for identical instruments.
² The fair value is determined using valuation techniques with observable market inputs.
³ The fair value is determined using valuation techniques with unobservable market inputs.
59
Level of fair value measurement for financial instruments at the end of the period
The table below analyses financial instruments’ fair value at the end of the year by the level in the fair value hierarchy into which the fair value measurement is categorised. See Accounting policies, Determination of fair value.
| | | | | | | | | | | | | | | | | | | | | | | | |
(AMOUNTS IN EUR MILLION) | | LEVEL 1 | | | LEVEL 2 | | | 2015 LEVEL 3 | | | LEVEL 1 | | | LEVEL 2 | | | 2014 LEVEL 3 | |
Assets | | | | | | | | | | | | | | | | | | | | | | | | |
Cash accounts with banks | | | 111 | | | | | | | | | | | | 100 | | | | | | | | | |
Cash equivalents held at fair value | | | 1,985 | | | | | | | | | | | | 1,123 | | | | | | | | | |
Other cash and cash equivalents held at amortised cost | | | | | | | 570 | | | | | | | | | | | | 417 | | | | | |
Cash and cash equivalents, total | | | 2,096 | | | | 570 | | | | | | | | 1,222 | | | | 417 | | | | | |
Placements with credit institutions | | | | | | | 8 | | | | | | | | | | | | 7 | | | | | |
Debt securities held at fair value | | | 3,132 | | | | | | | | 22 | | | | 2,865 | | | | | | | | 23 | |
Other debt securities held at amortised cost | | | 3,057 | | | | | | | | | | | | 2,768 | | | | | | | | | |
Debt securities, total | | | 6,189 | | | | | | | | 22 | | | | 5,633 | | | | | | | | 23 | |
Other financial placements held at fair value | | | 2 | | | | | | | | 20 | | | | 2 | | | | | | | | 21 | |
Hedged loans outstanding in fair value hedging relationships | | | | | | | 2,749 | | | | | | | | | | | | 2,899 | | | | | |
Loans outstanding, other | | | | | | | 12,877 | | | | | | | | | | | | 12,259 | | | | | |
Loans outstanding, total | | | | | | | 15,626 | | | | | | | | | | | | 15,159 | | | | | |
Derivatives | | | | | | | 2,558 ¹ | | | | | | | | | | | | 2,198 | | | | | |
Receivables from defaulted counterparties | | | | | | | | | | | 6 | | | | | | | | | | | | 8 ² | |
Financial assets, total | | | 8,287 | | | | 18,761 | | | | 49 | | | | 6,857 | | | | 17,780 | | | | 51 | |
| | | | | | |
Liabilities | | | | | | | | | | | | | | | | | | | | | | | | |
Short-term amounts owed to credit institutions | | | | | | | 1,449 | | | | | | | | | | | | 872 | | | | | |
Long-term amounts owed to credit institutions | | | | | | | 18 | | | | | | | | | | | | | | | | | |
Repurchase agreements | | | | | | | 123 | | | | | | | | | | | | | | | | | |
Debt securities issued | | | | | | | | | | | | | | | | | | | | | | | | |
Hedged debt securities issued in fair value hedging relationships | | | | | | | 20,051 | | | | | | | | | | | | 18,675 | | | | | |
Other debt securities issued | | | | | | | 749 | | | | | | | | | | | | 695 | | | | | |
Hedged other debt in fair value hedging relationships | | | | | | | 60 | | | | | | | | | | | | 77 | | | | | |
Other debt | | | | | | | – | | | | | | | | | | | | – | | | | | |
Debt securities issued, total | | | | | | | 20,861 | | | | | | | | | | | | 19,446 | | | | | |
Derivatives | | | | | | | 1,481 ¹ | | | | | | | | | | | | 1,329 | | | | | |
Financial liabilities, total | | | | | | | 23,931 | | | | | | | | | | | | 21,647 | | | | | |
¹ Due to ongoing negotiations regarding two-way Credit Support Annex (CSA) for derivatives, the Bank has decided to exclude Credit Valuation Adjustment (CVA), reflecting the market value of counterparty default risk, and Debit Valuation Adjustment (DVA), reflecting the market value of the Bank’s own default, in the fair values of derivative positions. The negotiations are expected to be finalised during 2016. At 31 December 2015, CVA amounted to EUR -12 million, while DVA was EUR 31 million. Under the assumption that the two-way CSA negotiations would reach agreement with all counterparties, CVA is estimated to amount to EUR -6 million, while DVA would amount to EUR 3 million at 31 December 2015.
² Receivables from defaulted treasury counterparties are measured at fair value. Receivables from defaulted lending counterparties are measured at cost minus impairment.
60
Changes in fair values categorised at level 3
| | | | | | | | | | | | | | | | |
(AMOUNTS IN EUR MILLION) | | DEBT SECURITIES HELD AT FAIR VALUE | | | OTHER FINANCIAL
PLACEMENTS HELD AT FAIR VALUE | | | RECEIVABLES FROM DEFAULTED COUNTERPARTIES | | | LEVEL 3,
TOTAL | |
| |
31 Dec 2013 | | | 43 | | | | 23 | | | | 8 | | | | 74 | |
| |
Matured transactions | | | -5 | | | | | | | | | | | | -5 | |
| |
Sold transactions | | | -16 | | | | | | | | -7 | | | | -23 | |
| |
Changes in fair values | | | – | | | | -1 | | | | 6 | | | | 4 | |
| |
31 Dec 2014 | | | 23 | | | | 21 | | | | 8 | | | | 51 | |
| |
Matured transactions | | | | | | | -1 | | | | | | | | -1 | |
| |
Sold transactions | | | | | | | | | | | -48 | | | | -48 | |
| |
Changes in fair values | | | -1 | | | | 1 | | | | 46 | | | | 46 | |
31 Dec 2015 | | | 22 | | | | 20 | | | | 6 | | | | 49 | |
Sensitivity analysis of level 3 financial instruments
| | | | | | | | | | | | | | | | | | | | | | | | |
(AMOUNTS IN EUR MILLION) | | CARRYING
AMOUNT | | | FAVOURABLE CHANGE | | | 2015 UNFAVOURABLE CHANGE | | | CARRYING
AMOUNT | | | FAVOURABLE CHANGE | | | 2014 UNFAVOURABLE CHANGE | |
| Financial instruments categorised at level 3 | | | 49 | | | | 1 | | | | -1 | | | | 51 | | | | 1 | | | | -1 | |
| |
The table above shows the sensitivity of the fair value of level 3 instruments to changes in key assumptions. The sensitivity analysis of the debt securities valued as level 3 is based on cash flow evaluation on Bloomberg. The implied market spread over the reference curve has been changed, reflecting a credit migration of the issuer. The fair value for other financial placements in level 3 is received from the funds in question and is based on the present value of their cash flows. No quotation exists for these placements.
61
Note 18: Maturity profile of financial assets and liabilities
The table below sets out a maturity analysis for financial assets and liabilities containing principal and interest flows. For loans outstanding, undiscounted cash flows are presented until contractual final maturity. For borrowing outstanding and derivatives with call options, cash flows are presented in the time bucket corresponding to the first possible termination date. Cash flows are presented on net basis for interest rate swaps and on gross basis for all other swaps. Interest cash flows are projected based on the interest rates prevailing on the closing date. See also Notes 11 and 13, and Risk Management, Liquidity Risk.
2015
| | | | | | | | | | | | | | | | | | | | | | | | | | | | | | |
(AMOUNTS IN EUR MILLION) | | | | CARRYING AMOUNT | | | CONTRACTUAL CASH FLOWS | | | UP TO AND INCLUDING 3 MONTHS | | | OVER 3
MONTHS AND UP TO AND INCLUDING 6 MONTHS | | | OVER 6 MONTHS AND UP TO AND INCLUDING 1 YEAR | | | OVER 1 YEAR AND UP TO AND INCLUDING 5 YEARS | | | OVER 5 YEARS | |
Assets | | | | | | |
| Cash and cash equivalents | | | | | 2,666 | | | | 2,666 | | | | 2,666 | | | | – | | | | – | | | | – | | | | – | |
| Financial placements | | | | | | |
Debt securities | | | | | 6,080 | | | | 6,325 | | | | 288 | | | | 494 | | | | 652 | | | | 4,282 | | | | 609 | |
Loans outstanding | | | | | 15,627 | | | | 16,847 | | | | 365 | | | | 739 | | | | 948 | | | | 7,602 | | | | 7,193 | |
Other assets | | | | | | |
Derivatives | | | | | | |
Receivables | | | | | 30,424 | | | | 13,580 | | | | 576 | | | | 1,696 | | | | 1,143 | | | | 7,238 | | | | 2,928 | |
Payables | | | | | -27,866 | | | | -10,443 | | | | -395 | | | | -1,177 | | | | -830 | | | | -5,754 | | | | -2,288 | |
| | | | | | 2,558 | | | | 3,137 | | | | 182 | | | | 519 | | | | 313 | | | | 1,484 | | | | 641 | |
Assets, total | | | | | 26,931 | | | | 28,976 | | | | 3,501 | | | | 1,752 | | | | 1,913 | | | | 13,368 | | | | 8,443 | |
| | |
Liabilities | | | | | | |
| Amounts owed to credit institutions | | | | | | |
Short-term | | | | | 1,449 | | | | 1,449 | | | | 1,449 | | | | – | | | | – | | | | – | | | | – | |
Long-term | | | | | 18 | | | | 18 | | | | – | | | | – | | | | 18 | | | | – | | | | – | |
| | | | | | 1,467 | | | | 1,467 | | | | 1,449 | | | | – | | | | 18 | | | | – | | | | – | |
Repurchase agreements | | | | | 123 | | | | 122 | | | | – | | | | 122 | | | | – | | | | – | | | | – | |
Debts evidenced by certificates | | | | | 20,862 | | | | 22,393 | | | | 1,414 | | | | 2,544 | | | | 502 | | | | 13,434 | | | | 4,500 | |
Other liabilities | | | | | | |
Derivatives | | | | | | |
Receivables | | | | | -6,491 | | | | -6,403 | | | | -165 | | | | -290 | | | | -236 | | | | -3,769 | | | | -1,942 | |
Payables | | | | | 7,972 | | | | 7,250 | | | | 153 | | | | 373 | | | | 196 | | | | 4,113 | | | | 2,415 | |
| | | | | | 1,481 | | | | 847 | | | | -13 | | | | 83 | | | | -40 | | | | 343 | | | | 473 | |
Liabilities, total | | | | | 23,932 | | | | 24,830 | | | | 2,850 | | | | 2,749 | | | | 480 | | | | 13,778 | | | | 4,972 | |
| | | | | | | | | | | | | | | | | | | | | | | | | | | | | | | |
Net during the period | | | | | 651 | | | | -998 | | | | 1,433 | | | | -410 | | | | 3,470 | |
| | | | | | | | |
| Loans agreed but not yet disbursed | | | | | | | | | | | | | 1,193 | | | | – | | | | – | | | | – | | | | – | |
62
2014
| | | | | | | | | | | | | | | | | | | | | | | | | | | | | | |
(AMOUNTS IN EUR MILLION) | | | | CARRYING AMOUNT | | | CONTRACTUAL CASH FLOWS | | | UP TO AND INCLUDING 3 MONTHS | | | OVER 3
MONTHS AND UP TO AND INCLUDING 6 MONTHS | | | OVER 6 MONTHS AND UP TO AND INCLUDING 1 YEAR | | | OVER 1 YEAR AND UP TO AND INCLUDING 5 YEARS | | | OVER 5 YEARS | |
Assets | | | | | | | | | | | | | | | | | | | | | | | | | | | | | | |
Cash and cash equivalents | | | | | 1,639 | | | | 1,640 | | | | 945 | | | | 694 | | | | – | | | | – | | | | – | |
Financial placements | | | | | | | | | | | | | | | | | | | | | | | | | | | | | | |
Debt securities | | | | | 5,490 | | | | 5,781 | | | | 195 | | | | 257 | | | | 478 | | | | 4,021 | | | | 830 | |
Loans outstanding | | | | | 15,156 | | | | 16,438 | | | | 406 | | | | 566 | | | | 797 | | | | 8,188 | | | | 6,481 | |
Other assets | | | | | | | | | | | | | | | | | | | | | | | | | | | | | | |
Derivatives | | | | | | | | | | | | | | | | | | | | | | | | | | | | | | |
Receivables | | | | | 28,897 | | | | 14,908 | | | | 829 | | | | 909 | | | | 2,417 | | | | 7,980 | | | | 2,773 | |
Payables | | | | | -26,699 | | | | -12,016 | | | | -683 | | | | -800 | | | | -2,137 | | | | -6,359 | | | | -2,037 | |
| | | | | | 2,198 | | | | 2,892 | | | | 146 | | | | 109 | | | | 280 | | | | 1,621 | | | | 736 | |
Assets, total | | | | | 24,483 | | | | 26,751 | | | | 1,692 | | | | 1,626 | | | | 1,556 | | | | 13,830 | | | | 8,047 | |
| | | | | | | | |
Liabilities | | | | | | | | | | | | | | | | | | | | | | | | | | | | | | |
| Amounts owed to credit institutions | | | | | | | | | | | | | | | | | | | | | | | | | | | | | | |
Short-term | | | | | 872 | | | | 872 | | | | 872 | | | | – | | | | – | | | | – | | | | – | |
Long-term | | | | | – | | | | – | | | | – | | | | – | | | | – | | | | – | | | | – | |
| | | | | | 872 | | | | 872 | | | | 872 | | | | – | | | | – | | | | – | | | | – | |
Repurchase agreements | | | | | – | | | | – | | | | – | | | | – | | | | – | | | | – | | | | – | |
Debts evidenced by certificates | | | | | 19,446 | | | | 20,994 | | | | 494 | | | | 1,250 | | | | 1,961 | | | | 13,425 | | | | 3,864 | |
Other liabilities | | | | | | | | | | | | | | | | | | | | | | | | | | | | | | |
Derivatives | | | | | | | | | | | | | | | | | | | | | | | | | | | | | | |
Receivables | | | | | -6,273 | | | | -6,427 | | | | -206 | | | | -914 | | | | -293 | | | | -3,846 | | | | -1,167 | |
Payables | | | | | 7,602 | | | | 6,832 | | | | 176 | | | | 1,072 | | | | 275 | | | | 3,905 | | | | 1,404 | |
| | | | | | 1,329 | | | | 405 | | | | -31 | | | | 158 | | | | -18 | | | | 59 | | | | 237 | |
Liabilities, total | | | | | 21,647 | | | | 22,271 | | | | 1,335 | | | | 1,408 | | | | 1,942 | | | | 13,485 | | | | 4,101 | |
| | | | | | | | | | | | | | | | | | | | | | | | | | | | | | |
Net during the period | | | | | | | | | | | | | 358 | | | | 218 | | | | -387 | | | | 345 | | | | 3,946 | |
| | | | | | | | | | | | | | | | | | | | | | | | | | | | | | |
| | | | | | | | |
| Loans agreed but not yet disbursed | | | | | | | | | | | | | 1,316 | | | | – | | | | – | | | | – | | | | – | |
63
Note 19: Interest rate risk
Interest rate risk is the impact that fluctuations in market interest rates can have on the value of the Bank’s interest-bearing assets and liabilities and on the interest income recognised in the statement of comprehensive income. The table below provides information on the extent of the Bank’s interest rate exposure. The assets and liabilities are grouped into buckets defined by their time to maturity or the date of the interest rate adjustment. The difference, or gap, between assets and liabilities in each time bucket makes the Bank sensitive to interest rate fluctuations. See also Risk Management, Market Risk.
2015
| | | | | | | | | | | | | | | | | | | | | | | | | | | | | | | | |
(AMOUNTS IN EUR MILLION) | | UP TO AND
INCLUDING
3 MONTHS | | | OVER 3
MONTHS
AND UP TO AND
INCLUDING 6 MONTHS | | | OVER 6
MONTHS
AND UP TO AND
INCLUDING 1 YEAR | | | OVER 1
YEAR AND
UP TO AND
INCLUDING
5 YEARS | | | OVER 5
YEARS AND
UP TO AND
INCLUDING
10 YEARS | | | OVER 10 YEARS | | | UNDEFINED | | | TOTAL | |
Assets | | | | |
Cash and cash equivalents | | | 2,666 | | | | – | | | | – | | | | – | | | | – | | | | – | | | | 0 | | | | 2,666 | |
Financial placements | | | | |
Placements with credit institutions | | | – | | | | – | | | | – | | | | – | | | | – | | | | – | | | | 8 | | | | 8 | |
Debt securities | | | 1,925 | | | | 159 | | | | 329 | | | | 3,106 | | | | 504 | | | | 35 | | | | 22 | | | | 6,080 | |
Other | | | – | | | | – | | | | – | | | | – | | | | – | | | | – | | | | 22 | | | | 22 | |
| | | | 1,925 | | | | 159 | | | | 329 | | | | 3,106 | | | | 504 | | | | 35 | | | | 52 | | | | 6,110 | |
Loans outstanding | | | 6,264 | | | | 6,604 | | | | 269 | | | | 977 | | | | 860 | | | | 452 | | | | 201 | | | | 15,627 | |
Intangible assets | | | – | | | | – | | | | – | | | | – | | | | – | | | | – | | | | – | | | | – | |
Tangible assets | | | – | | | | – | | | | – | | | | – | | | | – | | | | – | | | | 28 | | | | 28 | |
Other assets | | | | |
Derivatives | | | | |
Receivables ¹ | | | 15,773 | | | | 5,211 | | | | 212 | | | | 11,442 | | | | 3,008 | | | | 624 | | | | 646 | | | | 36,916 | |
Other assets | | | – | | | | – | | | | – | | | | – | | | | – | | | | – | | | | 23 | | | | 23 | |
Accrued interest and fees receivable | | | – | | | | – | | | | – | | | | – | | | | – | | | | – | | | | 299 | | | | 299 | |
Total assets | | | 26,627 | | | | 11,975 | | | | 810 | | | | 15,525 | | | | 4,371 | | | | 1,111 | | | | 1,250 | | | | 61,669 | |
| |
Liabilities and equity | | | | |
Liabilities | | | | |
Amounts owed to credit institutions | | | | |
Short-term | | | 1,449 | | | | – | | | | – | | | | – | | | | – | | | | – | | | | – | | | | 1,449 | |
Long-term | | | – | | | | – | | | | 18 | | | | – | | | | – | | | | – | | | | – | | | | 18 | |
| | | | 1,449 | | | | 0 | | | | 18 | | | | 0 | | | | 0 | | | | 0 | | | | 0 | | | | 1,467 | |
Repurchase agreements | | | – | | | | 123 | | | | – | | | | – | | | | – | | | | – | | | | 0 | | | | 123 | |
Debts evidenced by certificates | | | 2,275 | | | | 2,699 | | | | 212 | | | | 11,496 | | | | 3,008 | | | | 548 | | | | 624 | | | | 20,862 | |
Other liabilities | | | | |
Derivatives | | | | |
Payables ¹ | | | 23,875 | | | | 7,986 | | | | 246 | | | | 1,558 | | | | 1,185 | | | | 679 | | | | 309 | | | | 35,838 | |
Other liabilities | | | – | | | | – | | | | – | | | | – | | | | – | | | | – | | | | 10 | | | | 10 | |
Accrued interest and fees payable | | | – | | | | – | | | | – | | | | – | | | | – | | | | – | | | | 223 | | | | 223 | |
Total liabilities | | | 27,599 | | | | 10,808 | | | | 476 | | | | 13,053 | | | | 4,193 | | | | 1,227 | | | | 1,166 | | | | 58,523 | |
| | | | | | | | |
Equity | | | – | | | | – | | | | – | | | | – | | | | – | | | | – | | | | 3,146 | | | | 3,146 | |
Total liabilities and equity | | | 27,599 | | | | 10,808 | | | | 476 | | | | 13,053 | | | | 4,193 | | | | 1,227 | | | | 4,313 | | | | 61,669 | |
| | | | | | | | | | | | | | | | | | | | | | | | | | | | | | | | | |
Net during the period | | | -972 | | | | 1,167 | | | | 335 | | | | 2,471 | | | | 179 | | | | -117 | | | | -3,063 | | | | 0 | |
Cumulative net during the period | | | -972 | | | | 194 | | | | 529 | | | | 3,000 | | | | 3,179 | | | | 3,063 | | | | 0 | | | | | |
Guarantee commitments | | | – | | | | – | | | | – | | | | – | | �� | | – | | | | – | | | | – | | | | – | |
64
2014
| | | | | | | | | | | | | | | | | | | | | | | | | | | | | | | | |
(AMOUNTS IN EUR MILLION) | | UP TO AND
INCLUDING
3 MONTHS | | | OVER 3
MONTHS
AND UP TO
AND
INCLUDING 6
MONTHS | | | OVER 6
MONTHS
AND UP TO
AND
INCLUDING 1
YEAR | | | OVER 1
YEAR AND
UP TO AND
INCLUDING
5 YEARS | | | OVER 5
YEARS AND
UP TO AND
INCLUDING
10 YEARS | | | OVER
10
YEARS | | | UNDEFINED | | | TOTAL | |
| |
Assets | | | | | | | | | | | | | | | | | | | | | | | | | | | | | | | | |
| |
Cash and cash equivalents | | | 945 | | | | 694 | | | | – | | | | – | | | | – | | | | – | | | | 0 | | | | 1,639 | |
| |
Financial placements | | | | | | | | | | | | | | | | | | | | | | | | | | | | | | | | |
| |
Placements with credit institutions | | | – | | | | – | | | | – | | | | – | | | | – | | | | – | | | | 7 | | | | 7 | |
| |
Debt securities | | | 1,604 | | | | 110 | | | | 361 | | | | 2,657 | | | | 657 | | | | 56 | | | | 45 | | | | 5,490 | |
| |
Other | | | – | | | | – | | | | – | | | | – | | | | – | | | | – | | | | 22 | | | | 22 | |
| |
| | | 1,604 | | | | 110 | | | | 361 | | | | 2,657 | | | | 657 | | | | 56 | | | | 73 | | | | 5,518 | |
| |
Loans outstanding | | | 6,033 | | | | 6,307 | | | | 247 | | | | 970 | | | | 857 | | | | 398 | | | | 344 | | | | 15,156 | |
| |
Intangible assets | | | – | | | | – | | | | – | | | | – | | | | – | | | | – | | | | 5 | | | | 5 | |
| |
Tangible assets | | | – | | | | – | | | | – | | | | – | | | | – | | | | – | | | | 28 | | | | 28 | |
| |
Other assets | | | | | | | | | | | | | | | | | | | | | | | | | | | | | | | | |
| |
Derivatives | | | | | | | | | | | | | | | | | | | | | | | | | | | | | | | | |
| |
Receivables ¹ | | | 14,701 | | | | 3,848 | | | | 1,855 | | | | 11,165 | | | | 2,263 | | | | 606 | | | | 730 | | | | 35,170 | |
| |
Other assets | | | – | | | | – | | | | – | | | | – | | | | – | | | | – | | | | 19 | | | | 19 | |
| |
Accrued interest and fees receivable | | | – | | | | – | | | | – | | | | – | | | | – | | | | – | | | | 306 | | | | 306 | |
| |
Total assets | | | 23,284 | | | | 10,959 | | | | 2,463 | | | | 14,793 | | | | 3,777 | | | | 1,061 | | | | 1,506 | | | | 57,843 | |
| |
| | | | | | | | |
Liabilities and equity | | | | | | | | | | | | | | | | | | | | | | | | | | | | | | | | |
| |
Liabilities | | | | | | | | | | | | | | | | | | | | | | | | | | | | | | | | |
| |
Amounts owed to credit institutions | | | | | | | | | | | | | | | | | | | | | | | | | | | | | | | | |
| |
Short-term | | | 872 | | | | – | | | | – | | | | – | | | | – | | | | – | | | | – | | | | 872 | |
| |
Long-term | | | – | | | | – | | | | – | | | | – | | | | – | | | | – | | | | – | | | | – | |
| |
| | | 872 | | | | – | | | | – | | | | – | | | | – | | | | – | | | | – | | | | 872 | |
| |
Short-term debt | | | – | | | | – | | | | – | | | | – | | | | – | | | | – | | | | – | | | | – | |
| |
Debts evidenced by certificates | | | 1,572 | | | | 1,185 | | | | 1,870 | | | | 11,271 | | | | 2,263 | | | | 488 | | | | 796 | | | | 19,446 | |
| |
Other liabilities | | | | | | | | | | | | | | | | | | | | | | | | | | | | | | | | |
| |
Derivatives | | | | | | | | | | | | | | | | | | | | | | | | | | | | | | | | |
| |
Payables ¹ | | | 22,195 | | | | 8,088 | | | | 159 | | | | 1,733 | | | | 1,201 | | | | 553 | | | | 372 | | | | 34,301 | |
| |
Other liabilities | | | – | | | | – | | | | – | | | | – | | | | – | | | | – | | | | 7 | | | | 7 | |
| |
Accrued interest and fees payable | | | – | | | | – | | | | – | | | | – | | | | – | | | | – | | | | 231 | | | | 231 | |
| |
Total liabilities | | | 24,639 | | | | 9,273 | | | | 2,029 | | | | 13,005 | | | | 3,464 | | | | 1,042 | | | | 1,405 | | | | 54,857 | |
| |
| | | | | | | | |
Equity | | | – | | | | – | | | | – | | | | – | | | | – | | | | – | | | | 2,986 | | | | 2,986 | |
| |
Total liabilities and equity | | | 24,639 | | | | 9,273 | | | | 2,029 | | | | 13,005 | | | | 3,464 | | | | 1,042 | | | | 4,391 | | | | 57,843 | |
| |
| | | | | | | | |
Net during the period | | | -1,355 | | | | 1,686 | | | | 434 | | | | 1,788 | | | | 313 | | | | 19 | | | | -2,885 | | | | – | |
| |
Cumulative net during the period | | | -1,355 | | | | 331 | | | | 765 | | | | 2,553 | | | | 2,866 | | | | 2,885 | | | | – | | | | – | |
| |
Guarantee commitments | | | – | | | | – | | | | – | | | | – | | | | – | | | | – | | | | – | | | | – | |
| |
¹ Swaps are not netted.
65
Note 20: Currency risk
NIB’s operations are mostly in euro and US dollars. The table below shows the net of assets and liabilities in the major currencies.
See also Risk Management, Market Risk.
Net currency position as of 31 December 2015:
| | | | | | | | | | | | | | | | | | | | | | | | | | | | | | | | | | |
(AMOUNTS IN EUR MILLION) | | EUR | | | USD | | | SEK | | | NOK | | | DKK | | | OTHER
CURRENCIES | | | FAIR VALUE ADJUSTMENTS AND SWAP NETTING | | | TOTAL | | | |
Assets | | | | | | | | | | | | | | | | | | | | | | | | | | | | | | | | | | |
Cash and cash equivalents | | | 1,480 | | | | 1,180 | | | | 1 | | | | 2 | | | | 3 | | | | 1 | | | | – | | | | 2,666 | | | |
Financial placements | | | | | | | | | | | | | | | | | | | | | | | | | | | | | | | | | | |
Placements with credit institutions | | | 8 | | | | – | | | | – | | | | – | | | | – | | | | – | | | | – | | | | 8 | | | |
Debt securities | | | 4,662 | | | | 827 | | | | 195 | | | | 109 | | | | 287 | | | | 1 | | | | – | | | | 6,080 | | | |
Other financial placements | | | 22 | | | | – | | | | – | | | | – | | | | – | | | | – | | | | – | | | | 22 | | | |
| | | | 4,692 | | | | 827 | | | | 195 | | | | 109 | | | | 287 | | | | 1 | | | | – | | | | 6,110 | | | |
Loans outstanding | | | 8,027 | | | | 2,639 | | | | 2,248 | | | | 1,657 | | | | 559 | | | | 235 | | | | 263 | | | | 15,627 | | | |
Intangible assets | | | – | | | | – | | | | – | | | | – | | | | – | | | | – | | | | – | | | | – | | | |
Tangible assets, property and equipment | | | 28 | | | | – | | | | – | | | | – | | | | – | | | | – | | | | – | | | | 28 | | | |
Other assets | | | | | | | | | | | | | | | | | | | | | | | | | | | | | | | | | | |
Derivatives | | | -8,490 | | | | 5,169 | | | | -1,640 | | | | -407 | | | | -856 | | | | 6,937 | | | | 1,846 | | | | 2,558 | | | |
Other assets | | | – | | | | 21 | | | | – | | | | – | | | | 2 | | | | – | | | | – | | | | 23 | | | |
| | | | -8,490 | | | | 5,190 | | | | -1,640 | | | | -407 | | | | -854 | | | | 6,937 | | | | 1,846 | | | | 2,581 | | | |
Accrued interest and fees receivable | | | 75 | | | | 74 | | | | 6 | | | | 21 | | | | 6 | | | | 116 | | | | 2 | | | | 299 | | | |
Total assets | | | 5,812 | | | | 9,909 | | | | 809 | | | | 1,382 | | | | – | | | | 7,290 | | | | 2,110 | | | | 27,311 | | | |
| | | | | | | | | |
Liabilities and equity | | | | | | | | | | | | | | | | | | | | | | | | | | | | | | | | | | |
Liabilities | | | | | | | | | | | | | | | | | | | | | | | | | | | | | | | | | | |
Amounts owed to credit institutions | | | | | | | | | | | | | | | | | | | | | | | | | | | | | | | | | | |
Short-term amounts owed to credit institutions | | | 1,342 | | | | 107 | | | | – | | | | – | | | | – | | | | – | | | | – | | | | 1,449 | | | |
Long-term amounts owed to credit institutions | | | 18 | | | | – | | | | – | | | | – | | | | – | | | | – | | | | – | | | | 18 | | | |
| | | | 1,360 | | | | 107 | | | | – | | | | – | | | | – | | | | – | | | | – | | | | 1,467 | | | |
Repurchase agreements | | | 123 | | | | – | | | | – | | | | – | | | | – | | | | – | | | | – | | | | 123 | | | |
Debts evidenced by certificates | | | | | | | | | | | | | | | | | | | | | | | | | | | | | | | | | | |
Debt securities issued | | | 1,111 | | | | 9,739 | | | | 805 | | | | 1,364 | | | | – | | | | 7,172 | | | | 611 | | | | 20,802 | | | |
Other debt | | | 47 | | | | – | | | | – | | | | – | | | | – | | | | – | | | | 13 | | | | 60 | | | |
| | | | 1,158 | | | | 9,739 | | | | 805 | | | | 1,364 | | | | – | | | | 7,172 | | | | 624 | | | | 20,862 | | | |
Other liabilities | | | | | | | | | | | | | | | | | | | | | | | | | | | | | | | | | | |
Derivatives | | | – | | | | – | | | | – | | | | – | | | | – | | | | – | | | | 1,481 | | | | 1,481 | | | |
Other liabilities | | | 9 | | | | – | | | | 1 | | | | – | | | | – | | | | – | | | | – | | | | 10 | | | |
| | | | 9 | | | | – | | | | 1 | | | | – | | | | – | | | | – | | | | 1,481 | | | | 1,491 | | | |
Accrued interest and fees payable | | | 23 | | | | 63 | | | | 2 | | | | 18 | | | | – | | | | 116 | | | | 2 | | | | 223 | | | |
Total liabilities | | | 2,672 | | | | 9,909 | | | | 808 | | | | 1,382 | | | | – | | | | 7,287 | | | | 2,107 | | | | 24,165 | | | |
Equity | | | 2,931 | | | | – | | | | – | | | | – | | | | – | | | | – | | | | – | | | | 2,931 | | | |
Total liabilities and equity | | | 5,603 | | | | 9,909 | | | | 808 | | | | 1,382 | | | | – | | | | 7,287 | | | | 2,107 | | | | 27,096 | | | |
| | | | | | | | | | | | | | | | | | | | | | | | | | | | | | | | | | | |
| Net of assets and liabilities as of 31 Dec 2015 | | | 208 | | | | – | | | | – | | | | – | | | | – | | | | 2 | | | | 3 | | | | 215 | | | |
66
Net currency position as of 31 December 2014:
| | | | | | | | | | | | | | | | | | | | | | | | | | | | | | | | |
(AMOUNTS IN EUR MILLION) | | EUR | | | USD | | | SEK | | | NOK | | | DKK | | | OTHER
CURRENCIES | | | FAIR VALUE
ADJUSTMENTS
AND SWAP
NETTING | | | TOTAL | |
Assets | | | | | | | | | | | | | | | | | | | | | | | | | | | | | | | | |
Cash and cash equivalents | | | 486 | | | | 991 | | | | 58 | | | | 1 | | | | 102 | | | | 2 | | | | – | | | | 1,639 | |
Financial placements | | | | | | | | | | | | | | | | | | | | | | | | | | | | | | | | |
Placements with credit institutions | | | 7 | | | | – | | | | – | | | | – | | | | – | | | | – | | | | – | | | | 7 | |
Debt securities | | | 4,743 | | | | 482 | | | | 133 | | | | 116 | | | | 14 | | | | 1 | | | | – | | | | 5,490 | |
Other financial placements | | | 22 | | | | – | | | | – | | | | – | | | | – | | | | – | | | | – | | | | 22 | |
| | | | 4,771 | | | | 482 | | | | 133 | | | | 116 | | | | 14 | | | | 1 | | | | – | | | | 5,518 | |
Loans outstanding | | | 7,750 | | | | 2,567 | | | | 2,091 | | | | 1,653 | | | | 456 | | | | 240 | | | | 399 | | | | 15,156 | |
Intangible assets | | | 5 | | | | – | | | | – | | | | – | | | | – | | | | – | | | | – | | | | 5 | |
Tangible assets, property and equipment | | | 28 | | | | – | | | | – | | | | – | | | | – | | | | – | | | | – | | | | 28 | |
Other assets | | | | | | | | | | | | | | | | | | | | | | | | | | | | | | | | |
Derivatives | | | -8,550 | | | | 4,054 | | | | -1,604 | | | | -701 | | | | -576 | | | | 7,855 | | | | 1,721 | | | | 2,198 | |
Other assets | | | – | | | | 17 | | | | – | | | | – | | | | 2 | | | | – | | | | – | | | | 19 | |
| | | | -8,551 | | | | 4,071 | | | | -1,604 | | | | -701 | | | | -574 | | | | 7,855 | | | | 1,721 | | | | 2,217 | |
Accrued interest and fees receivable | | | 84 | | | | 73 | | | | 8 | | | | 22 | | | | 3 | | | | 121 | | | | -4 | | | | 306 | |
Total assets | | | 4,574 | | | | 8,184 | | | | 686 | | | | 1,091 | | | | 1 | | | | 8,219 | | | | 2,116 | | | | 24,870 | |
| | | | | | | | |
Liabilities and equity | | | | | | | | | | | | | | | | | | | | | | | | | | | | | | | | |
Liabilities | | | | | | | | | | | | | | | | | | | | | | | | | | | | | | | | |
Amounts owed to credit institutions | | | | | | | | | | | | | | | | | | | | | | | | | | | | | | | | |
Short-term amounts owed to credit institutions | | | 833 | | | | 38 | | | | – | | | | – | | | | – | | | | – | | | | – | | | | 872 | |
Long-term amounts owed to credit institutions | | | – | | | | – | | | | – | | | | – | | | | – | | | | – | | | | – | | | | – | |
| | | | 833 | | | | 38 | | | | – | | | | – | | | | – | | | | – | | | | – | | | | 872 | |
Debt evidenced by certificates | | | | | | | | | | | | | | | | | | | | | | | | | | | | | | | | |
Debt securities issued | | | 661 | | | | 8,078 | | | | 681 | | | | 1,073 | | | | – | | | | 8,096 | | | | 781 | | | | 19,369 | |
Other debt | | | 62 | | | | – | | | | – | | | | – | | | | – | | | | – | | | | 15 | | | | 77 | |
| | | | 723 | | | | 8,078 | | | | 681 | | | | 1,073 | | | | – | | | | 8,096 | | | | 796 | | | | 19,446 | |
Other liabilities | | | | | | | | | | | | | | | | | | | | | | | | | | | | | | | | |
Derivatives | | | – | | | | – | | | | – | | | | – | | | | – | | | | – | | | | 1,329 | | | | 1,329 | |
Other liabilities | | | 7 | | | | – | | | | – | | | | – | | | | – | | | | – | | | | – | | | | 7 | |
| | | | 7 | | | | – | | | | – | | | | – | | | | – | | | | – | | | | 1,329 | | | | 1,336 | |
Accrued interest and fees payable | | | 26 | | | | 65 | | | | 4 | | | | 18 | | | | 1 | | | | 121 | | | | -4 | | | | 231 | |
Total liabilities | | | 1,589 | | | | 8,181 | | | | 686 | | | | 1,090 | | | | 1 | | | | 8,216 | | | | 2,121 | | | | 21,884 | |
Equity | | | 2,776 | | | | – | | | | – | | | | – | | | | – | | | | – | | | | – | | | | 2,776 | |
Total liabilities and equity | | | 4,365 | | | | 8,181 | | | | 686 | | | | 1,090 | | | | 1 | | | | 8,216 | | | | 2,121 | | | | 24,660 | |
| | | | | | | | | | | | | | | | | | | | | | | | | | | | | | | | |
| Net of assets and liabilities as of 31 Dec 2014 | | | 209 | | | | 3 | | | | – | | | | – | | | | – | | | | 2 | | | | -4 | | | | 210 | |
67
Note 21: Related party disclosures
Nordic Development Fund and Nordic Environment Finance Corporation
The Bank provides administrative services to and enters into transactions with the Nordic Development Fund (NDF) and the Nordic Environment Finance Corporation (NEFCO), which have, for the most part, the same owners as NIB. The following table shows the outstanding balance of amounts owed to NDF, NEFCO and the trust funds administered by them, and the interest paid during the year. The interest paid to these institutions is at normal commercial rates.
| | | | | | | | | | | | | | | | |
(AMOUNTS IN EUR 1,000) | | INTEREST FROM
RELATED PARTIES | | | INTEREST TO
RELATED
PARTIES | | | AMOUNTS OWED BY RELATED
PARTIES AS OF 31 DEC | | | AMOUNTS OWED TO RELATED PARTIES AS OF 31 DEC | |
2015 | | | – | | | | -22 | | | | 13 | | | | 17,994 | |
2014 | | | – | | | | 17 | | | | 38 | | | | 40,012 | |
Rental income (NDF, NEFCO)
| | | | | | | | |
(AMOUNTS IN EUR 1,000) | | NDF | | | NEFCO | |
2015 | | | 52 | | | | 98 | |
2014 | | | 141 | | | | 294 | |
Key management personnel
The Bank has identified members of the Board of Directors, the Control Committee and the Executive Committee as key management personnel. There have been no transactions between the Bank and key management personnel. Information regarding the compensation of key management personnel for the relevant reporting periods can be found in Note 5.
68
Note 22: Cash flow statement
Specification of the change in cash and cash equivalents, net on 31 December:
| | | | | | | | |
(AMOUNTS IN EUR 1,000) | | | 2015 | | | | 2014 | |
Cash and balances with banks 1 | | | 111,256 | | | | 99,786 | |
Short-term placements with credit institutions | | | 861,672 | | | | 812,682 | |
Collateralised placements 2 | | | 1,693,142 | | | | 726,671 | |
Cash and cash equivalents | | | 2,666,070 | | | | 1,639,139 | |
| | |
Short-term amounts owed to credit institutions 3 | | | -1,448,888 | | | | -872,010 | |
Repurchase agreements | | | -122,556 | | | | – | |
Short-term debt | | | -64,277 | | | | – | |
Cash and cash equivalents, net | | | 1,030,348 | | | | 767,129 | |
| | | | | | | | | |
Change in cash and cash equivalents, net | | | 263,219 | | | | -618,084 | |
¹ Including an initial margin requirement of EUR 413 (836) thousand for futures on 31 December.
² Net exposure after collaterals for collateralised placements EUR 993 (164) thousand.
³ Of which cash received as collateral EUR 1,448,881 (831,553) thousand.
69
Note 23: Exchange rates
| | | | | | | | |
| | | | EUR RATE ON 31 DEC 2015 | | | | EUR RATE ON 31 DEC 2014 | |
DKK Danish krone | | | 7.4626 | | | | 7.4453 | |
ISK Icelandic króna 1 | | | 141.15 | | | | 154.15 | |
NOK Norwegian krone | | | 9.603 | | | | 9.042 | |
SEK Swedish krona | | | 9.1895 | | | | 9.393 | |
ARS Argentine peso 2 | | | 14.14056 | | | | 10.29521 | |
AUD Australian dollar | | | 1.4897 | | | | 1.4829 | |
BRL Brazilian real | | | 4.3117 | | | | 3.2207 | |
CAD Canadian dollar | | | 1.5116 | | | | 1.4063 | |
CHF Swiss franc | | | 1.0835 | | | | 1.2024 | |
CZK Czech koruna | | | 27.023 | | | | 27.735 | |
GBP Pound sterling | | | 0.73395 | | | | 0.7789 | |
HKD Hong Kong dollar | | | 8.4376 | | | | 9.417 | |
JPY Japanese yen | | | 131.07 | | | | 145.23 | |
MXN Mexican peso | | | 18.9145 | | | | 17.8679 | |
NZD New Zealand dollar | | | 1.5923 | | | | 1.5525 | |
PLN Polish zloty | | | 4.2639 | | | | 4.2732 | |
RUB Russian rouble | | | 80.6736 | | | | 72.337 | |
SDR Special drawing right 3 | | | 0.78565 | | | | 0.838 | |
SGD Singapore dollar | | | 1.5417 | | | | 1.6058 | |
TRY Turkish lira | | | 3.1765 | | | | 2.832 | |
TWD New Taiwan dollar 2 | | | 35.8096 | | | | 38.1878 | |
USD US dollar | | | 1.0887 | | | | 1.2141 | |
ZAR South African rand | | | 16.953 | | | | 14.0353 | |
¹ Reuters closing.
² The exchange rate is calculated using the year-end market rate for USD/relevant currency, which then provides the EUR/relevant currency rate.
³ IMF (International Monetary Fund) closing per 31 December 2015 and per 31 December 2014.
70
Note 24: Post balance sheet events
There have been no material post balance sheet events that would require disclosure or adjustment to these financial statements. On 3 March 2016, the Board of Directors reviewed and signed the financial statements. These financial statements will be submitted for approval to the Annual Meeting of the Board of Governors scheduled to be held no later than by the end of May 2016.
71
INDEPENDENT AUDITORS’ REPORT
TO THE CONTROL COMMITTEE OF THE NORDIC INVESTMENT BANK
Independent auditors’ report on the financial statements
In our capacity as auditors appointed by the Control Committee of the Nordic Investment Bank we have audited the accompanying financial statements of the Bank, which comprise the statement of financial position as at 31 December 2015, and the statement of comprehensive income, statement of changes in equity and statement of cash flows for the year then ended, and notes, comprising a summary of significant accounting policies and other explanatory information.
The Board of Directors’ and the President’s responsibility for the financial statements
The Board of Directors and the President are responsible for the preparation of the financial statements that give a true and fair view in accordance with International Financial Reporting Standards, and for such internal control as they determine is necessary to enable the preparation of financial statements that are free from material misstatement, whether due to fraud or error.
Auditor’s responsibility
Our responsibility is to express an opinion on these financial statements based on our audit. We conducted our audit in accordance with International Standards on Auditing. Those standards require that we comply with ethical requirements and plan and perform the audit to obtain reasonable assurance whether the financial statements are free from material misstatement.
An audit involves performing procedures to obtain audit evidence about the amounts and disclosures in the financial statements. The procedures selected depend on the auditor’s judgment, including the assessment of the risks of material misstatement of the financial statements, whether due to fraud or error. In making those risk assessments, the auditor considers internal control relevant to the entity’s preparation and fair presentation of the financial statements in order to design audit procedures that are appropriate in the circumstances, but not for the purpose of expressing an opinion on the effectiveness of the entity’s internal control. An audit also includes evaluating the appropriateness of accounting policies used and the reasonableness of accounting estimates made by management, as well as evaluating the overall presentation of the financial statements.
We believe that the audit evidence we have obtained is sufficient and appropriate to provide a basis for our audit opinion.
Opinion
In our opinion, the financial statements give a true and fair view of the financial position of the Nordic Investment Bank as at 31 December 2015, and of its financial performance and its cash flows for the year then ended in accordance with International Financial Reporting Standards as issued by the International Accounting Standards Board.
72
Report on the other requirements
In accordance with the Terms of Engagement our audit also included a review of whether the Board of Directors’ and the President’s administration have complied with the Statutes of the Bank. It is our opinion that the administration of the Board of Directors and the President complied with the Statutes of the Bank.
Helsinki, 4 March 2016
| | |
Sixten Nyman | | Hans Åkervall |
Authorised Public Accountant | | Authorised Public Accountant |
| |
KPMG Oy Ab | | KPMG AB |
Töölönlahdenkatu 3A | | Tegelbacken 4A |
00100 Helsinki | | 103 23 Stockholm |
Finland | | Sweden |
73
STATEMENT BY THE CONTROL COMMITTEE OF THE NORDIC INVESTMENT BANK ON THE AUDIT OF THE ADMINISTRATION AND ACCOUNTS OF THE BANK
To the Board of Governors of the Nordic Investment Bank
In accordance with section 17 of the Statutes of the Nordic Investment Bank, we have been appointed to ensure that the operations of the Bank are conducted in accordance with its Statutes and to bear responsibility for the audit of the Bank and annually deliver an auditors’ report to the Board of Governors. Having completed our assignment for the year 2015, we hereby submit the following report.
The Control Committee met during the fiscal year as well as after the Bank’s Financial Statements had been prepared, and the Committee performed the control and examination measures considered necessary. The Annual Report of the Bank was examined at a meeting in Helsinki on 4 March 2016. In carrying out its tasks, the Control Committee received such information and carried out such examination measures as it deemed necessary to assess the Bank’s position in regard to its risks. We have also received the Independent Auditors’ Report, submitted on 4 March 2016 by the authorised public accountants appointed by the Control Committee.
Based on the audit, carried out by the independent auditors, we consider that:
The Bank’s operations during the financial year have been conducted in accordance with the Statutes;
The Board of Directors and the President have complied with the Statutes of the Bank; and that
The Financial Statements give a true and fair view of the financial position of the Bank as at 31 December 2015 and of its results and financing in 2015. The Statement of Comprehensive Income shows a profit of EUR 215,398,492.93 for the financial period.
We recommend to the Board of Governors that:
The allocation of the Bank’s profit for the financial period, as proposed by the Board of Directors, be approved;
The Statement of Comprehensive Income and the Statement of Financial Position be adopted; and
The Board of Directors and the President be discharged from liability for the administration of the Bank’s operations during the accounting period examined by us.
| | | | |
| | Helsinki, 4 March 2016 | | |
| | Leo Ašmanis | | |
| | |
| Sigurður Þórðarson | | Karin Gaardsted | | Remo Holsmer |
| | |
| Arto Pirttilahti | | Höskuldur Þórhallsson | | Karina Korna |
| | |
| Daiva Raudonienė | | Michael Tetzschner | | Penilla Gunther |
74