Exhibit X

| | |

| | Financial Report 2016 |
Contents
| | | | |
| Report of the Board of Directors | | | 1 | |
| |
| Operating and financial review | | | 8 | |
| |
| Statement of comprehensive income | | | 13 | |
| |
| Statement of financial position | | | 14 | |
| |
| Changes in equity | | | 15 | |
| |
| Cash flow statement | | | 16 | |
| |
| Notes to the financial statements | | | 18 | |
| |
Note 1: Accounting policies | | | 18 | |
| |
Note 2: Risk management | | | 25 | |
| |
Note 3: Segment information | | | 39 | |
| |
Note 4: Net interest income | | | 41 | |
| |
Note 5: Commission income and fees received | | | 42 | |
| |
Note 6: Net profit on financial operations | | | 43 | |
| |
Note 7: Personnel expenses | | | 44 | |
| |
Note 8: Other general administrative expenses | | | 47 | |
| |
Note 9: Net loan losses | | | 48 | |
| |
Note 10: Debt securities | | | 49 | |
| |
Note 11: Loans outstanding and guarantee commitments | | | 50 | |
| |
Note 12: Intangible assets, tangible assets (property and equipment) | | | 55 | |
| | | | |
Note 13: Depreciation | | | 57 | |
| |
Note 14: Other assets | | | 58 | |
| |
Note 15: Debts evidenced by certificates and swaps | | | 59 | |
| |
Note 16: Other liabilities | | | 60 | |
| |
Note 17: Equity | | | 61 | |
| |
Note 18: Collateral and commitments | | | 62 | |
| |
Note 19: Fair value of financial instruments | | | 64 | |
| |
Note 20: Maturity profile of financial assets and liabilities | | | 67 | |
| |
Note 21: Interest rate risk | | | 69 | |
| |
Note 22: Currency risk | | | 71 | |
| |
Note 23: Related party disclosures | | | 73 | |
| |
Note 24: Cash flow statement | | | 74 | |
| |
Note 25: Exchange rates | | | 75 | |
| |
Note 26: Post balance sheet events | | | 76 | |
| |
| Auditor’s report | | | 77 | |
| |
| Statement by the Control Committee | | | 81 | |
| |
| Proposal by the Board of Directors to the Board of Governors | | | 82 | |
REPORT OF THE BOARD OF DIRECTORS
Summary
| • | In 2016, NIB’s operations exceeded expectations in terms of lending volumes and financial results. |
| • | The Bank’s operations focused on implementing the areas of activity that the Board identified in the latest strategy review. The Bank increased lending to SMEs and mid-sized corporates, and launched the Arctic Financing Facility. |
| • | As a new initiative, NIB started purchasing green bonds issued by companies or municipalities in the member countries. The purpose of this new product is to finance environmental projects and to support the green bond market. |
| • | Loans provided to projects achieving a “good” or “excellent” mandate rating for improving competitiveness and the environment accounted for 96% of the total amount of lending, excluding investments in green bonds. |
| • | In 2016, long-term loans to projects with a “good” or “excellent” mandate rating on their environmental impact amounted to an all-time high of EUR 1,567 million, or 37% of agreed loans. These loans were provided, to a large extent, for projects aimed at improving wastewater treatment and water supply in the member countries. |
| • | Loans aimed at improving competitiveness mainly supported investments in R&D, infrastructure and energy. |
| • | In order to identify areas of improvement in project implementation, NIB launched ex-post mandate assessments of financed projects. |
| • | NIB’s volume of loans agreed grew markedly. The Bank signed 58 loan agreements and invested in eight green bonds with a combined value of EUR 4,363 million. Financing long-term investments in public infrastructure was one of the principal drivers of this development. |
| • | Disbursements of loans also saw a significant increase to an all-time high of EUR 3,373 million. |
| • | The profit was EUR 212 million (2015: EUR 215 million). |
| • | NIB raised an all-time high of EUR 6.7 billion in new funding and continued to issue NIB Environmental Bonds. |
Operating environment
The global and Nordic–Baltic economies grew by 3% and 2%, respectively, in 2016—a very similar pace as in the previous year. However, within the region, the developments continued to vary between the countries. While the strong growth of the Swedish economy has slowed somewhat, in Finland, the economy showed signs of improvement. The decline in oil investment is still damping activity in Norway, and weak global demand for exports has kept the economy in low gear in Denmark. The Icelandic economy is showing strong growth, with early signs of overheating. The Estonian, Latvian and Lithuanian economies ended the year on a good note, and this positive momentum is expected to carry over into 2017.
Despite favourable financing conditions, corporate investment activity and related demand for long-term loans remained subdued. Loans to non-financial corporations in the four main Nordic markets grew by an average of 3.7% in 2016. Meanwhile, the demand from the public sector for long-term loans to finance infrastructure investments grew strongly, and margins also compressed further. Corporate spreads for euro area BBB-rated companies ended 2016 about 30–50 basis points lower than at the end of 2015.
Lending activities
NIB’s lending activities saw continued strong development in 2016, with new lending volume reaching an all-time high. In particular, demand for long-term financing from municipalities in the member countries increased substantially. The Bank signed 58 loan agreements and invested in eight green bonds with an aggregate value of EUR 4,363 million (out of which EUR 143 million were invested in green bonds). Disbursements of loans also saw a significant increase to an all-time high of EUR 3,373 million, compared to EUR 2,716 million in 2015. More than half of the new loans were extended to new borrowers. Lending volumes by business sector are displayed in the table below.
1
Loans agreed
EUR m
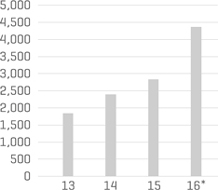
*including Lending Green Bonds
Following the review of NIB’s strategy performed a year earlier, the core business model of the Bank remains intact. NIB continues to fulfil its mission to finance investments that improve competitiveness and the environment in the region. However, it was decided that within this mission, NIB will develop its lending activities in order to increase its impact.
One focus area is to increase lending to small and medium-sized enterprises (SMEs) in cooperation with financial intermediaries, as well as to mid-sized corporates. These activities have been initiated, and NIB’s offering is being broadened with new lending products, for example through risk-sharing mechanisms. NIB’s aim is to complement other sources of financing and to stand ready to respond to demand. Alongside these new initiatives, the Bank continues its traditional lending through local banks and other financial intermediary institutions.
A further aim based on the review is to increase NIB’s lending activities in non-member countries to approximately one fifth of the total amount of annual new lending. The purpose of these activities is to support the Bank’s clients by financing investments outside the Nordic–Baltic region. NIB has enhanced its outreach activities directed towards the member country business community and its partners among regional financial institutions. As a result, the project pipeline is developing and the first transaction was concluded. The Bank also completed a review of its China lending programme.
The strategic focus on projects in the Arctic region is being implemented within the framework of the EUR 500 million Arctic Financing Facility. This activity had a good start in 2016, with several loans approved and four deals signed.
Another prioritised activity is financing investments in the Baltic countries. During the year, NIB was actively sourcing deals in this region and building a good pipeline, which is expected to materialise in 2017.
| | | | | | | | | | | | |
LENDING (IN EUR MILLION, UNLESS OTHERWISE SPECIFIED) | | 2016 | | | 2015 | | | 2014 | |
Loans agreed, including green bond investments, according to business areas: | | | | | | | | | | | | |
Energy and environment | | | 1,534 | | | | 710 | | | | 630 | |
Infrastructure, transportation and telecom | | | 1,198 | | | | 823 | | | | 557 | |
Industries and services | | | 912 | | | | 996 | | | | 926 | |
Financial institutions and SMEs | | | 720 | | | | 301 | | | | 277 | |
Loans agreed, including green bond investments, total | | | 4,363 | | | | 2,830 | | | | 2,389 | |
Loans disbursed, total | | | 3,373 | | | | 2,716 | | | | 2,274 | |
Number of loan agreements, including green bond investments, total | | | 66 | | | | 45 | | | | 45 | |
Repayments/prepayments | | | 2,471 | | | | 2,351 | | | | 2,005 | |
Loans outstanding and guarantees | | | 16,640 | | | | 15,627 | | | | 15,156 | |
Member countries | | | 14,831 | | | | 13,347 | | | | 12,705 | |
Non-member countries | | | 1,851 | | | | 2,341 | | | | 2,506 | |
Collective impairments | | | -42 | | | | -61 | | | | -55 | |
2
Mission fulfillment*
Projects financed by the Bank are expected to contribute to the Bank’s mission to improve competitiveness and the environment of the Nordic–Baltic countries. Before approval is given in each individual case, all eligible investments are scrutinised and rated against the criteria developed on the basis of the Bank’s mission. In 2016, loans achieving a “good” or “excellent” mandate rating accounted for 96% of the total amount of loans agreed. Some 37% of the new lending is classified as environmental.
In 2016, NIB started a procedure of performing ex-post mandate assessments of financed projects. The Bank will continue to keep systematic records of how well the expected mandate contribution was achieved. The first cases of completed ex-post mandate assessments were presented to the Board during the year.
Mandate rating
% of loans agreed, excluding
Lending Green Bond purchases
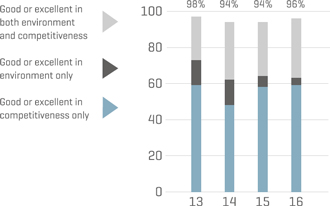
* NIB buying green bonds is classified as lending. The data provided in the sections “Mission fulfilment”, “Competitiveness impact” and “Environmental impact” are calculated on the basis of the total amount of loans agreed that do not include investments in green bonds. The reason is that the mandate rating, which is required for regular lending, does not apply to green bond investments due to the nature of bond transactions. NIB defines loans with “good” or “excellent” environmental mandate as environmental loans.
Competitiveness impact
In 2016, the largest part (27%) of NIB’s lending was extended for investment projects in member country municipalities, typically regional growth centres that are attracting new population and experiencing rising pressure on their public infrastructure. These projects will improve key infrastructure services in education, public transport, and water supply and wastewater treatment. These investments will have long-term impacts on the growth potential and business environment in the whole Nordic–Baltic region.
The Bank continued financing investments by energy utilities in energy production and networks. An effective and sustainable energy system is a cornerstone of long-term competitiveness. The utilities in Norway mainly invested in electricity networks and rolled out automated metering systems to improve the management of the distribution network and to facilitate the development of smart grids. NIB also financed several heat and power production facilities fuelled with local biomass in Finland and Sweden, and a geothermal project in Iceland. Energy sector projects accounted for 18% of the total loans agreed.
NIB extended loans to support research and development activities in several member countries. Innovations add value to companies’ product offerings and have spill-over effects on other companies in the member area business clusters and regions. Loans to finance R&D accounted for 14% of NIB’s lending.
In line with NIB’s strategy to reach out to smaller member area companies, NIB increased its lending to financial intermediaries. Loan programmes for SMEs and non-member country counterparts reached 12% of NIB’s total lending in 2016. The 50% annual increase in NIB-funded loan programmes for small and medium-sized companies will improve the capacity of such companies to grow and innovate.
3
Environmental impact
NIB’s major environmental impact comes through its traditional long-term lending. Since 2011, NIB has also raised funds for its environmental lending through issuing green bonds. Last year, this was complemented when NIB started to buy green bonds issued by companies and municipalities in the member countries. NIB is actively participating in setting standards for green financing.
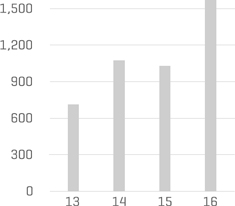
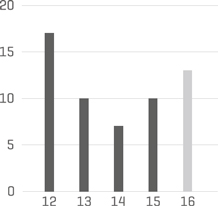
In 2016, long-term loans for projects with a “good” or “excellent” mandate rating on their environmental impact amounted to an all-time high of EUR 1,567 million, or 37% of agreed loans.
Environmental loans
(of loans agreed, excluding Lending Green Bonds)
EUR m
In particular, the Bank financed eight wastewater treatment projects in Sweden and Norway for a total of EUR 683 million, which was a markedly larger amount than in any of the previous years. Several wastewater treatment projects included biogas utilisation of the sludge and thus contributed to climate change mitigation.
Public transport projects with a climate change mitigation effect received a total of EUR 390 million in loans from NIB. Loans for biomass-fired power plants and hydropower investments in Sweden, Finland and Norway amounted to EUR 378 million.
The energy projects that the Bank financed in 2016 are expected to add 1.5 TWh annually to renewable energy generation. NIB estimates that the loans agreed during the year have the potential to reduce CO2 emissions by 280,000 tonnes annually, prorated to NIB’s share of the financing.
With a framework of EUR 500 million, NIB launched a new lending product for investing in green bonds issued by companies or municipalities in the member countries. The purpose of the new approach is to support the development of the green bond market, finance environmental investments and promote good standards. In 2016, NIB invested in eight bond transactions, which exceeded expectations. At year-end, the Bank held EUR 143 million in green bonds.
As an active promoter of the green bond market, NIB was elected as a member of the Executive Committee of the Green Bond Principles, an international group of issuers, investors and intermediaries in the green bond market. NIB was also appointed by the European Commission as an observer to the High-Level Expert Group on sustainable finance.
NIB’s Sustainability Policy and Guidelines cover the environmental, social and ethical aspects of the Bank’s operations. More detailed information on NIB’s corporate responsibility matters are described in the Annual Report 2016, specifically under “GRI reporting”, available online (click here).
Treasury activities
In 2016, NIB’s funding amounted to EUR 6.7 billion, which was the largest amount NIB has ever raised in one year. Altogether, the Bank issued 58 bonds. At year-end, outstanding debt totalled EUR 24 billion in 18 currencies.
4
In 2016, NIB issued three USD-denominated global benchmark transactions and maintained its position as a leading USD benchmark issuer. The overall funding costs from the programme are deemed to be attractive and to contribute positively to NIB’s business model.
The Bank continued the NIB Environmental Bond (NEB) programme targeting sustainability-conscious investors. In this segment, NIB also continued to develop well, issuing a record-high number of environmental bonds, totalling EUR 763 million, in three transactions. An eight-year, EUR 500 million Environmental Bond benchmark was issued in June, and bonds in Swedish kronor in January and September. The proceeds from the Environmental Bond issues are used to finance projects with a positive impact on the environment.
NIB’s investor base continued to be global and diversified. Of all investors that NIB’s bond issues attracted during the year, only 14% were from the Bank’s member countries; given that the Bank lent almost exclusively within its member countries, this means that NIB continued to draw funds into the Nordic–Baltic region. Of the investors, 44% were from Europe (excluding the member countries) and investors from the Americas accounted for 20%, while investors based in Asia bought 17% of NIB’s new issuance. Investors from other regions of the world contributed 5% to NIB’s annual funding.
In 2016, the Bank gradually moved from one-way to two-way credit support agreements with its derivative counterparties. This is now the market standard and is expected to decrease the cost of derivative contracts for the Bank. It also requires a higher liquidity buffer to mitigate the need for the Bank to post collateral with swap counterparties.
Risk management
The Bank’s overall risk position remained strong, with high asset quality, solid liquidity and strong capitalisation.
The credit quality of the lending exposure was stable, with 85% of the exposure placed in investment-grade categories (risk classes 1–10; it was 83% at year-end 2015). The exposure in the best risk classes (1–2) increased, mainly due to growth in lending to the public sector. This reflects the Bank’s response to the demand for financing from this sector in the Bank’s member countries. In terms of geographical distribution, lending exposure in Norway and Sweden increased the most.
The Treasury portfolio continued to be of high credit quality, with close to 100% of the exposure in the investment-grade categories (risk classes 1–10).
In terms of market risk, the Bank is mainly exposed to interest rate risk, credit spread risk and cross currency basis risk in treasury operations. Market risk is monitored with sensitivity-based measures and managed within strict limits. The Bank’s overall market risk remained almost unchanged compared to the previous year. At the end of the year, the Bank’s liquidity buffer amounted to EUR 11,097 million. The survival horizon measured according to the Bank’s liquidity policy was 443 days, exceeding the target level of 365 days. More detailed commentary on the Bank’s risk exposures is provided in the “Risk management” section in the notes to the financial statements.
The Bank continued to strengthen its risk management in line with evolving market standards. During 2016, the Bank progressed with the development of an internal capital adequacy assessment process and started the development of a methodology for expected credit loss calculation in accordance with the new IFRS 9 standard. Risk management reporting was also further improved during the year.
In early 2016, the Bank implemented the methodology developed for calculating credit valuation adjustments (CVA/DVA) for counterparty credit risk in the derivative portfolio.
Financial results
Despite the low interest rate environment, the Bank managed to maintain its financial results. NIB’s annual profit of EUR 212 million, compared to EUR 215 million in 2015, was the result of the successful advancement in lending operations, higher net profit on financial operations, and lower general administrative expenses. Net interest income deviated negatively by EUR 5 million compared with last year.
As described above, the quality of the loan portfolio remained high, and the Bank continues to adopt a conservative approach in relation to loan impairment provisions.
More detailed commentary on the Bank’s financial results can be found in the Operating and financial review.
Dividend
The Board of Directors proposes to the Board of Governors that EUR 55 million be paid in dividends to the Bank’s member countries for the year 2016.
5
Governance
The Control Committee is the Bank’s supervisory body. It ensures that the operations of the Bank are conducted in accordance with the Statutes. The Control Committee is responsible for the audit of the Bank and submits its annual audit report to the Board of Governors. In 2016, the Control Committee for the first time appointed an independent expert, Peter Engberg Jensen, to assist on matters within its responsibility. This was done to further strengthen the competence within the Committee and to enhance its supervisory capabilities.
The Control Committee appointed Anders Tagde, Authorised Public Accountant from KPMG Sweden, as dual-signing external auditor, together with Marcus Tötterman, Authorised Public Accountant from KPMG Finland.
Compliance
Two new external cases of corruption involving borrowers of the Bank were reported to the Board. These cases are currently under investigation by the Office of the Chief Compliance Officer (OCCO). In addition, in cooperation with national enforcement agencies, OCCO followed up on other cases registered in previous years.
In February 2016, the Board of Directors adopted three new policies in NIB’s anti-corruption framework: the Speaking-up and Whistleblowing Policy; the Compliance, Integrity and Anti-corruption Policy; and the Investigation and Enforcement Policy. As part of the latter policy, a Sanctions Panel was established. The panel consists of three members, including two external members, both appointed by the Board of Directors in June 2016. An appeal function and procedures were also established in line with the Investigation and Enforcement Policy.
During 2016, a comprehensive assessment of the Bank’s integrity and corruption risks was conducted. On the basis of this assessment, the Bank will improve its control and screening procedures for anti-money laundering and counteracting terrorist financing as well as integrity issues and sanctions.
Adjustment and alignment of NIB’s authorised capital
In line with the Bank’s Statutes, NIB’s Board of Governors decided to review, adjust and align the authorised capital of the Bank according to the allocation currently in force for the authorised capital; each member country’s share, in percentage of paid-in capital and callable capital, is equal to its share of the authorised capital. This was based on a proposal from the Board of Directors. The adjustment also concerns the member countries’ statutory guarantee, where it was decided to also align each member country’s share of the guarantee for the Project Investment Loan and Environmental Investment Loan facilities in accordance with its share of the authorised capital of the Bank. The changes will enter into force as soon as the approval or ratification process is completed in all member countries in early 2017.
Chairmanship and meetings
During the year, the Board of Directors had eight ordinary meetings and one extra online meeting. Seven meetings were held in Helsinki, Finland, and one in Copenhagen, Denmark. Four meetings were chaired by Mr Pentti Pikkarainen (Finland) and the remaining four meetings by the new Chairman, Mr Kaspars Āboliņš (Latvia). Three seminars were held for the Members of the Board.
In connection with the Nordic Council session held in Copenhagen in November, NIB organised its 40th Anniversary event with external speakers: Finland’s Prime Minister, Mr Juha Sipilä, and Latvia’s Minister of Finance, Ms Dana Reizniece-Ozola, as well as Professor in the Economics of Innovation from the University of Sussex, Ms Mariana Mazzucato.
Other strategy initiatives
Implementing the strategy review completed a year earlier, NIB conducted a number of measures with the aim of “keeping the house in order”. The Bank carried out the first round of the training programme “Raising the Bar” for staff members, initiated the implementation of the comprehensive ICT project FOBORA (an integrated system for treasury front office, back office, risk management and accounting), and continued the ongoing renovation of its office building in Helsinki.
6
Outlook
Entering 2017, economic indicators are pointing to a modest global cyclical upswing in industrial activity. In the absence of clarity, however, forecasts for economic growth globally and the Nordic–Baltic region continue to have positive indications but below full potential. Inflation and commodity prices are forecast to rise, while short-term interest rates should increase slightly in the US but remain unchanged in the euro area and most of Europe.
In this context, the long-term trend of subdued corporate investment is expected to continue. On the other hand, infrastructure investments by local and regional governments in the Nordic–Baltic countries should continue to generate demand for long-term capital.
Lower net interest income and valuation effects are expected to result in a lower profit in 2017. At the same time, the implementation of the strategic initiatives that started in 2016 will help the Bank build a healthy flow of deals in lending.
7
OPERATING AND FINANCIAL REVIEW
Ratios and key figures
| | | | | | | | |
(AMOUNTS IN EUR MILLION UNLESS OTHERWISE STATED) | | | 2016 | | | | 2015 | |
Net interest income | | | 242 | | | | 247 | |
Profit before net loan losses | | | 232 | | | | 218 | |
Net Profit | | | 212 | | | | 215 | |
Loans disbursed | | | 3,373 | | | | 2,716 | |
Loans agreed | | | 4,363 | | | | 2,830 | |
% of loans achieving good or above mandate | | | 95.7% | | | | 94.1% | |
Loans outstanding | | | 16,640 | | | | 15,627 | |
Total assets | | | 30,178 | | | | 27,311 | |
New debt issues | | | 6,700 | | | | 4,276 | |
Debts evidenced by certificates | | | 23,907 | | | | 20,862 | |
Total equity | | | 3,275 | | | | 3,146 | |
Equity/total assets (%) | | | 10.9% | | | | 11.5% | |
Profit/average equity (%) | | | 6.7% | | | | 7.0% | |
Cost/income (%) | | | 16.1% | | | | 18.8% | |
Number of employees (average during the year) | | | 192 | | | | 188 | |
Total comprehensive income
Total operating income increased from EUR 268 million to EUR 276 million and total operating expenses decreased by EUR 6 million resulting in an increase in profit before net losses from EUR 218 million to EUR 232 million. The main driver for the increase in operating income was one off gains related to the implementation of two way credit support annexes (CSAs).
The main change in operating expenses related to the additional depreciation and amortisations recorded in 2015. Net loan losses increased from the low amount in 2015 of EUR 3 million to EUR 20 million in 2016 resulting in a decrease in net profit from EUR 215 million to EUR 212 million.
The Bank separates the foreign currency basis spread from financial instruments used in fair value hedging and this separated amount recorded in “Other comprehensive income” amounted to EUR -28 million. The resulting total comprehensive income for the year amounted to EUR 184 million down from EUR 215 million in 2015.
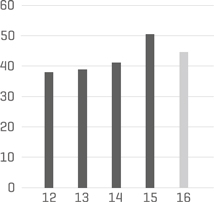
Net interest income
Net interest income decreased from EUR 247 million in 2015 to EUR 242 million in 2016 mainly due to the continuing lower interest rates. The adverse impact of the negative interest rates has been mitigated by increased volumes of loans outstanding.
Despite the challenging negative rate environment interest income from lending was EUR 150.4 million which was EUR 4.5 million higher than in 2015 due to the mitigating factors described above. Treasury, on the other hand has limited options available to lessen the impact from market conditions and as a result their interest income decreased by EUR 9.5 million to EUR 91.4 million.
Commission income and fees
Fee and commission income was EUR 13 million compared to EUR 12 million in 2015. EUR 0.5 million of the increase relates to commitment fees due to higher volumes. EUR 0.5 million relates to early repayment fees on the prepayment of loans which were also higher than in the previous year.
8
Net interest income
EUR m
Commission income and fees
EUR m
Profit on financial operations
EUR m
9
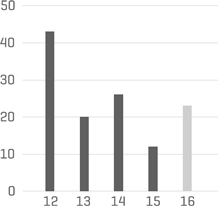
Profit on financial operations
The profit on financial operations of EUR 23 million is EUR 12 million higher than in 2015. The result comprises realised profit of EUR 19 million and unrealised profit of EUR 4 million. This year’s result includes one off gains related to cost compensation from counterparties for the implementation of two way credit support annexes (CSAs). Also contributing are buybacks of issued bonds and termination of related swaps, sales of amortised cost bonds, as well as income from claims. The unrealised profit is driven by positive valuation effects from spread tightening earlier in the year and hedge accounting valuations.
Total operating expenses
Although other administrative expenses are EUR 2 million higher than in 2015, largely related to IT expenditure the total operating expenses decreased by EUR 6 million mainly as a result of the decrease in depreciation due to additional depreciation and amortisations recorded in 2015.
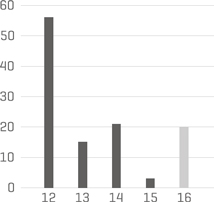
Net loan losses
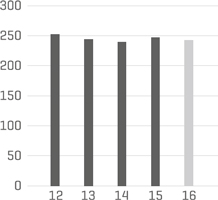
Net loan losses consist of a reduction of the collective impairment provision of EUR 19 million, an increase of EUR 41 million in individually assessed impairments and recovery on claims of EUR 2 million. The credit quality of the total loan portfolio remains high and the Bank continues to adopt a conservative approach to loan impairment provisions.
Other comprehensive income
The bank separates the foreign currency basis spread from financial instruments used in fair value hedging and this separated amount is recorded in “Other comprehensive income” (OCI). The valuation of foreign currency basis spread will be zero upon maturity and therefore the amount recorded in OCI will not be reclassified to the income statement.
Operating expenses
EUR m
10
Net loan losses
EUR m
Balance Sheet
| | | | | | | | |
(AMOUNTS IN EUR MILLIONS) | | 2016 | | | 2015 | |
Cash and cash equivalents | | | 4,456 | | | | 2,666 | |
Financial placements | | | 6,600 | | | | 6,110 | |
Loans outstanding | | | 16,640 | | | | 15,627 | |
Derivatives | | | 2,157 | | | | 2,558 | |
Other assets | | | 325 | | | | 350 | |
Total assets | | | 30,178 | | | | 27,311 | |
| | |
Equity | | | 3,275 | | | | 3,146 | |
Owed to credit institutions | | | 1,329 | | | | 1,467 | |
Debts evidenced by certificates | | | 23,907 | | | | 20,862 | |
Derivatives | | | 1,444 | | | | 1,481 | |
Other liabilities | | | 223 | | | | 355 | |
Total liabilities and equity | | | 30,178 | | | | 27,311 | |
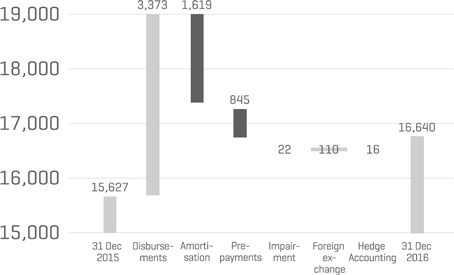
Loans outstanding
During the year, NIB experienced strong demand for its long-term financing resulting in an increase in loans outstanding from EUR 15,627 million to EUR 16,640 million as at 31 December 2016. The Bank signed 58 loan agreements (2015: 45) and invested in eight green bonds with a combined value of EUR 4,363 million (2015: EUR 2,830 million). Disbursements totalled EUR 3,373 million (2015: EUR 2,716 million).
11
Loans outstanding development during 2016
EUR m
Funding
During the year, NIB raised EUR 6.7 billion (EUR 4.3 billion) in new funding through 58 issues in 9 different currencies with an average maturity of five years. The most significant transactions included, the three-year, USD 1.25 billion global benchmark in February which was followed by a five-year USD 1 billion benchmark in August and in September, NIB issued a global USD 1 billion bond, its third and final of 2016. The Bank continued to issue NIB Environmental Bonds and a total of EUR 763 million was issued during the year.
12
STATEMENT OF COMPREHENSIVE INCOME
| | | | | | | | | | | | |
EUR 1,000 | | NOTE | | | 2016 | | | 2015 | |
Interest income | | | | | | | 311,856 | | | | 338,781 | |
Interest expense | | | | | | | -70,047 | | | | -92,005 | |
Net interest income | | | (3) (4) | | | | 241,809 | | | | 246,776 | |
| | | |
Commission income and fees received | | | (5) | | | | 13,124 | | | | 12,218 | |
Commission expense and fees paid | | | | | | | -2,025 | | | | -2,212 | |
Net fee and commission income | | | | | | | 11,099 | | | | 10,006 | |
| | | |
Net profit/loss on financial operations | | | (6) | | | | 23,292 | | | | 11,521 | |
Foreign exchange gains and losses | | | | | | | 22 | | | | 82 | |
Total operating income | | | | | | | 276,222 | | | | 268,385 | |
| | | |
Expenses | | | | | | | | | | | | |
General administrative expenses | | | | | | | | | | | | |
Personnel expenses | | | (7) | | | | -28,637 | | | | -29,925 | |
Other administrative expenses | | | (8) | | | | -13,617 | | | | -11,815 | |
Depreciation | | | (13) | | | | -2,319 | | | | -8,737 | |
Total operating expenses | | | | | | | -44,573 | | | | -50,478 | |
| | | |
Profit before loan losses | | | | | | | 231,649 | | | | 217,907 | |
Net loan losses | | | (9) | | | | -19,839 | | | | -2,509 | |
Net Profit for the year | | | | | | | 211,810 | | | | 215,398 | |
| | | |
Other comprehensive income | | | | | | | | | | | | |
Items that will not be reclassified to income statement | | | | | | | | | | | | |
Fair value hedges | | | | | | | | | | | | |
Valuation of cross currency basis spread | | | | | | | -28,202 | | | | – | |
Total other comprehensive income | | | | | | | -28,202 | | | | – | |
| | | | | | | | | | | | |
Total comprehensive income | | | | | | | 183,608 | | | | 215,398 | |
13
STATEMENT OF FINANCIAL POSITION
| | | | | | | | | | | | |
EUR 1,000 | | NOTE | | | 2016 | | | 2015 | |
ASSETS | | | | | | | | | | | | |
Cash and cash equivalents | | | (24) | | | | 4,455,860 | | | | 2,666,070 | |
Financial placements | | | | | | | | | | | | |
Placements with credit institutions | | | | | | | 8,771 | | | | 7,921 | |
Debt securities | | | (10) | | | | 6,572,244 | | | | 6,080,069 | |
Other | | | | | | | 18,901 | | | | 22,023 | |
| | | | | | | | 6,599,916 | | | | 6,110,012 | |
Loans outstanding | | | (11) | | | | 16,640,030 | | | | 15,626,946 | |
Intangible assets | | | (12) | | | | 938 | | | | – | |
Tangible assets, property and equipment | | | (12) | | | | 26,723 | | | | 28,360 | |
Other assets | | | | | | | | | | | | |
Derivatives | | | (14) | | | | 2,156,921 | | | | 2,557,979 | |
Other assets | | | (14) | | | | 12,589 | | | | 23,103 | |
| | | | | | | | 2,169,510 | | | | 2,581,083 | |
Accrued interest and fees receivable | | | | | | | 285,353 | | | | 298,977 | |
TOTAL ASSETS | | | | | | | 30,178,330 | | | | 27,311,447 | |
| | | |
LIABILITIES AND EQUITY | | | | | | | | | | | | |
Liabilities | | | | | | | | | | | | |
Amounts owed to credit institutions | | | | | | | | | | | | |
Short-term amounts owed to credit institutions | | | (18) (24) | | | | 1,310,873 | | | | 1,448,888 | |
Long-term amounts owed to credit institutions | | | | | | | 17,973 | | | | 18,000 | |
| | | | | | | | 1,328,846 | | | | 1,466,888 | |
Repurchase agreements | | | | | | | – | | | | 122,556 | |
Debts evidenced by certificates | | | (15) | | | | | | | | | |
Debt securities issued | | | | | | | 23,825,644 | | | | 20,802,164 | |
Other debt | | | | | | | 81,745 | | | | 59,860 | |
| | | | | | | | 23,907,389 | | | | 20,862,024 | |
Other liabilities | | | | | | | | | | | | |
Derivatives | | | (16) | | | | 1,444,341 | | | | 1,480,736 | |
Other liabilities | | | (16) | | | | 11,355 | | | | 9,946 | |
| | | | | | | | 1,455,696 | | | | 1,490,682 | |
Accrued interest and fees payable | | | | | | | 211,294 | | | | 222,800 | |
Total liabilities | | | | | | | 26,903,225 | | | | 24,164,950 | |
| | | |
Equity | | | (17) | | | | 3,275,105 | | | | 3,146,497 | |
| | | | | | | | | | | | |
TOTAL LIABILITIES AND EQUITY | | | | | | | 30,178,330 | | | | 27,311,447 | |
14
CHANGES IN EQUITY
| | | | | | | | | | | | | | | | | | | | | | | | | | | | |
EUR 1,000 | | PAID-IN CAPITAL | | | STATUTORY RESERVE | | | GENERAL CREDIT
RISK FUND | | | SPECIAL CREDIT RISK
FUND PIL | | | FUNDS AVAILABLE
FOR APPROPRIATION | | | HEDGING
RESERVE | | | TOTAL | |
EQUITY AT 31 DECEMBER 2014 | | | 418,602 | | | | 686,325 | | | | 1,275,041 | | | | 395,919 | | | | 210,211 | | | | – | | | | 2,986,099 | |
Profit for the year | | | – | | | | – | | | | – | | | | – | | | | 215,398 | | | | – | | | | 215,398 | |
Other comprehensive income | | | – | | | | – | | | | – | | | | – | | | | 0 | | | | – | | | | 0 | |
Total comprehensive income | | | 0 | | | | 0 | | | | 0 | | | | 0 | | | | 215,398 | | | | 0 | | | | 215,398 | |
Transaction with owners in their capacity as owners | | | | | | | | | | | | | | | | | | | | | | | | | | | | |
Appropriations between reserve funds | | | – | | | | – | | | | 155,211 | | | | – | | | | -155,211 | | | | – | | | | 0 | |
Dividends | | | – | | | | – | | | | – | | | | – | | | | -55,000 | | | | – | | | | -55,000 | |
EQUITY AT 31 DECEMBER 2015 | | | 418,602 | | | | 686,325 | | | | 1,430,252 | | | | 395,919 | | | | 215,398 | | | | 0 | | | | 3,146,497 | |
Profit for the year | | | – | | | | – | | | | – | | | | – | | | | 211,810 | | | | – | | | | 211,810 | |
Other comprehensive income | | | – | | | | – | | | | – | | | | – | | | | – | | | | -28,202 | | | | -28,202 | |
Total comprehensive income | | | 0 | | | | 0 | | | | 0 | | | | 0 | | | | 212,810 | | | | -28,202 | | | | 184,608 | |
Transaction with owners in their capacity as owners | | | | | | | | | | | | | | | | | | | | | | | | | | | | |
Appropriations between reserve funds | | | – | | | | – | | | | 110,398 | | | | 50,000 | | | | -160,398 | | | | – | | | | 0 | |
Dividends | | | – | | | | – | | | | – | | | | – | | | | -55,000 | | | | – | | | | -55,000 | |
EQUITY AT 31 DECEMBER 2016 | | | 418,602 | | | | 686,325 | | | | 1,540,651 | | | | 445,919 | | | | 211,810 | | | | -28,202 | | | | 3,275,105 | |
| | | | | | | | |
PROPOSED APPROPRIATION OF THE YEAR’S PROFIT | | 2016 | | | 2015 | |
Appropriations to credit risk reserve funds | | | | | | | | |
General Credit Risk Fund | | | 156,810 | | | | 110,398 | |
Special Credit Risk Fund PIL | | | – | | | | 50,000 | |
Appropriation to dividend payment | | | 55,000 | | | | 55, 000 | |
Profit/loss for the year | | | 211,810 | | | | 215,398 | |
The accompanying notes are an integral part of these financial statements.
15
CASH FLOW STATEMENT
| | | | | | | | | | | | |
EUR 1,000 | | NOTE | | | JAN–DEC 2016 | | | JAN–DEC 2015 | |
Cash flows from operating activities | | | | | | | | | | | | |
Net profit for the year | | | | | | | 211,810 | | | | 215,398 | |
| | | |
Adjustments: | | | | | | | | | | | | |
Unrealised gains/losses of financial assets held at fair value | | | | | | | 1,548 | | | | 13,865 | |
Depreciation and write-down in value of tangible and intangible assets | | | | | | | 2,319 | | | | 8,737 | |
Change in accrued interest and fees (assets) | | | | | | | 13,625 | | | | 6,613 | |
Change in accrued interest and fees (liabilities) | | | | | | | -11,506 | | | | -7,986 | |
Impairment of loans | | | | | | | 19,839 | | | | 2,509 | |
Adjustment to hedge accounting | | | | | | | -4,271 | | | | -20,667 | |
Other adjustments to the year’s profit | | | | | | | -628 | | | | 376 | |
Adjustments, total | | | | | | | 20,926 | | | | 3,447 | |
| | | |
Lending | | | | | | | | | | | | |
Disbursements of loans | | | | | | | -3,373,252 | | | | -2,715,757 | |
Repayments of loans | | | | | | | 2,464,579 | | | | 2,350,532 | |
Capitalisations, redenominations, index adjustments, etc. | | | | | | | -32 | | | | -51 | |
Exchange rate adjustments | | | | | | | -110,135 | | | | -247,764 | |
Lending, total | | | | | | | -1,018,840 | | | | -613,039 | |
| | | | | | | | | | | | | |
Cash flows from operating activities, total | | | | | | | -786,103 | | | | -394,193 | |
| | | |
Cash flows from investing activities | | | | | | | | | | | | |
Placements and debt securities | | | | | | | | | | | | |
Purchase of debt securities | | | | | | | -2,287,945 | | | | -2,168,290 | |
Sold and matured debt securities | | | | | | | 1,843,682 | | | | 1,614,972 | |
Placements with credit institutions | | | | | | | -850 | | | | -1,350 | |
Other financial placements | | | | | | | 2,714 | | | | 2,699 | |
Exchange rate adjustments, etc. | | | | | | | -47,891 | | | | -59,523 | |
Placements and debt securities, total | | | | | | | -490,290 | | | | -611,491 | |
| | | |
Other items | | | | | | | | | | | | |
Acquisition of intangible assets | | | | | | | -938 | | | | -1,005 | |
Acquisition of tangible assets | | | | | | | -682 | | | | -2,551 | |
Change in other assets | | | | | | | 10,698 | | | | 5,676 | |
Other items, total | | | | | | | 9,078 | | | | 2,120 | |
| | | | | | | | | | | | | |
Cash flows from investing activities, total | | | | | | | -481,212 | | | | -609,372 | |
16
| | | | | | | | | | | | |
EUR 1,000 | | NOTE | | | JAN–DEC 2016 | | | JAN–DEC 2015 | |
Cash flows from financing activities | | | | | | | | | | | | |
Debts evidenced by certificates | | | | | | | | | | | | |
Issues of new debt | | | | | | | 6,700,059 | | | | 4,276,138 | |
Redemptions | | | | | | | -3,823,944 | | | | -3,636,669 | |
Exchange rate adjustments | | | | | | | 380,563 | | | | 884,174 | |
Debts evidenced by certificates, total | | | | | | | 3,256,678 | | | | 1,523,643 | |
| | | |
Other items | | | | | | | | | | | | |
Long-term placements from credit institutions | | | | | | | -27 | | | | 18,000 | |
Change in swap receivables | | | | | | | 265,363 | | | | -441,813 | |
Change in swap payables | | | | | | | -86,468 | | | | 218,769 | |
Change in other liabilities | | | | | | | 1,409 | | | | 3,186 | |
Dividend paid | | | | | | | -55,000 | | | | -55,000 | |
Other items, total | | | | | | | 125,277 | | | | -256,858 | |
| | | | | | | | | | | | | |
Cash flows from financing activities, total | | | | | | | 3,381,955 | | | | 1,266,784 | |
| | | | | | | | | | | | | |
CHANGE IN CASH AND CASH EQUIVALENTS, NET | | | | | | | 2,114,639 | | | | 263,219 | |
| | | |
Opening balance for cash and cash equivalents, net | | | (24) | | | | 1,030,348 | | | | 767,129 | |
Closing balance for cash and cash equivalents, net | | | (24) | | | | 3,144,987 | | | | 1,030,348 | |
| | | |
Additional information to the statement of cash flows | | | | | | | | | | | | |
Interest income received | | | | | | | 325,481 | | | | 345,394 | |
Interest expense paid | | | | | | | -81,553 | | | | -99,991 | |
The accompanying notes are an integral part of these financial statements.
17
NOTE 1: ACCOUNTING POLICIES
Reporting entity
The operations of the Nordic Investment Bank (hereinafter called “the Bank” or “NIB”) are governed by an agreement (hereinafter called “the Agreement”) between the governments of Denmark, Estonia, Finland, Iceland, Latvia, Lithuania, Norway and Sweden (hereinafter called “the member countries”), and the statutes adopted in conjunction with the Agreement (hereinafter called “the Statutes”). NIB is an international financial institution that operates in accordance with sound banking principles. NIB finances private and public projects that have high priority for the member countries and borrowers. NIB finances projects both within and outside the member countries, and offers its clients long-term loans and guarantees on competitive market terms.
NIB acquires the funds to finance its lending by borrowing on international capital markets.
The authorised capital stock of the Bank is subscribed by the member countries. Any increase or decrease in the authorised capital stock shall be decided by the Board of Governors, upon a proposal of the Board of Directors of the Bank.
In the member countries, the Bank has the legal status of an international legal person, with full legal capacity, and is exempt from payment restrictions and credit policy measures. The Agreement concerning NIB contains provisions regarding immunities and privileges accorded to the Bank, e.g. the exemption of the Bank’s assets and income from taxation.
The headquarters of the Bank are located at Fabianinkatu 34 in Helsinki, Finland.
Basis of accounting
The Bank’s financial statements have been prepared in accordance with International Financial Reporting Standards (IFRS) issued by the International Accounting Standards Board (IASB). The financial statements have been prepared in accordance with the historical cost convention with some exceptions described in the policies below.
The cash flow statement has been prepared using the indirect method whereby operating profit is adjusted for effects of non-cash transactions such as depreciation and loan losses. The cash flows are classified by operating, investing and financing activities
On 9 March 2017, the Board of Directors approved the financial statements for publication. These financial statements will be submitted for approval to the Annual Meeting of the Board of Governors scheduled to be held no later than by the end of May 2017.
Functional and presentation currency
The Bank’s functional and presentation currency is the euro and the financial statements are presented in EUR 1,000, unless otherwise indicated. All figures in the accounts have been rounded and consequently the sum of individual figures may deviate from the presented sum figure. Furthermore, all percentages are subject to possible rounding differences.
Significant accounting judgements and estimates
As part of the process of preparing the financial statements in conformity with IFRS, the Bank’s management is required to make certain judgements, estimates and assumptions that may affect the Bank’s profits, its financial position and other information presented in the Annual Report. These estimates are based on available information and the judgements made by the Bank’s management. Actual outcomes may deviate from the assessments made, and such deviations may at times be significant.
The Bank uses various valuation models and techniques to estimate the fair values of assets and liabilities. There are significant uncertainties related to these estimates, in particular when they involve modelling complex financial instruments, such as derivative instruments used for hedging activities related to both borrowing and lending. The estimates are highly dependent on market data, such as the level of interest rates, currency rates and other factors. The uncertainties related to these estimates are reflected mainly in the statement of financial position. NIB undertakes continuous development in order to improve the basis for fair value estimates, with regard to both modelling and market data. Changes in estimates resulting from refinements in assumptions and methodologies are reflected in the period in which the enhancements are first applied.
Judgements and estimates are also associated with impairment testing of loans and claims.
18
Foreign currency translation
Monetary assets and liabilities denominated in foreign currencies are recognised in the accounts at the exchange rate prevailing on the closing date. Non-monetary assets and liabilities are recognised in the accounts at the euro rate prevailing on the transaction date. Income and expenses recognised in currencies other than the euro are converted on a daily basis to the euro, in accordance with the euro exchange rate prevailing on that day.
Realised and unrealised exchange rate gains and losses are recognised in the statement of comprehensive income.
The Bank uses the official exchange rates published for the euro by the European Central Bank with some exceptions, as disclosed in Note 25.
Recognition and derecognition of financial instruments
Financial instruments are recognised in the statement of financial position on a settlement date basis, except for derivative instruments, which are recognized on a trade date basis.
A financial asset is derecognised when the contractual rights to the cash flows from the financial asset expire.
A financial liability is derecognised from the statement of financial position when the obligation specified in the contract is discharged, cancelled or expires.
Basis for classification and measurement
The financial statements have been prepared on the historical cost basis, except for the following material items in the statement of financial position.
Following the early adoption of IFRS 9 in 2011, the Bank classifies its financial assets into the following categories: those measured at amortised cost, and those measured at fair value. This classification depends on both the contractual characteristics of the assets and the business model adopted for their management.
Financial assets at amortised cost
An investment is classified at “amortised cost” only if it is not designated as a FVTPL and both of the following criteria are met: the objective of the Bank’s business model is to hold the assets in order to collect the contractual cash flows, and the contractual terms of the financial assets must give rise on specified dates to cash flows that are only payments of principal and interest on the principal amount outstanding.
Financial assets at fair value
If either of the two criteria above is not met, the asset cannot be classified in the amortised cost category and must be classified at fair value.
Recognised financial assets and financial liabilities designated as hedged items in qualifying fair value hedge relationships are adjusted for changes in fair value attributable to the risk being hedged.
Determination of fair value
The fair value of financial instruments, including derivative instruments that are traded in a liquid market, is the bid or offered closing price on the balance sheet date. Where the fair values cannot be derived from active markets, they are determined using a variety of valuation techniques which include the use of mathematical models. The input to these models is taken from observable market data where possible. Many of NIB’s financial instruments are not traded in a liquid market, such as the Bank’s borrowing transactions with embedded derivative instruments. These are measured at fair value using different valuation models and techniques. This process involves determining future expected cash flows, which can then be discounted to the balance sheet date. The estimation of future cash flows for these instruments is subject to assumptions on market data, and in some cases, in particular where options are involved, on the behaviour of the Bank’s counterparties. The fair value estimate may therefore be subject to variations and may not be realisable in the market. Under different market assumptions, the values could also differ significantly.
The Bank measures fair values using the following fair value hierarchy, which reflects the significance of the inputs used in making the measurements:
Level 1: Quoted market prices (unadjusted) in an active market for identical instruments.
19
Level 2: Valuation techniques based on observable inputs, either directly (i.e. as prices) or indirectly (i.e. derived from prices). This category includes instruments valued using: quoted market prices in active markets for similar instruments, quoted prices for identical or similar instruments in markets that are considered less than active or other valuation techniques where all significant inputs are directly or indirectly observable from market data.
Level 3: Valuation techniques using significant unobservable inputs. This category includes all instruments where the valuation technique includes inputs not based on observable data and where the unobservable inputs have a significant effect on the instrument’s valuation. This category includes instruments that are valued based on quoted prices for similar instruments where significant unobservable adjustments or assumptions are required to reflect differences between the instruments.
See Note 19 for further details.
Offsetting
A financial asset and a financial liability are offset and the net amount recognised only where there is a legal right to do so and the intention is to settle on a net basis.
Cash and cash equivalents
Cash and cash equivalents comprise monetary assets and placements with original maturities of six months or less, calculated from the date the acquisition and placements were made.
Cash and cash equivalents in the cash flow statement refers to the net amount of monetary assets, placements and liabilities with original maturities of six months or less, calculated from the time the transaction was entered into.
Financial placements
Items recognised as financial placements in the statement of financial position include placements with credit institutions and placements in debt securities, for example, bonds and other debt certificates, as well as certain placements in instruments with equity features. The placements are initially recognised on the settlement date. Their subsequent accounting treatment depends on both the Bank’s business model for managing the placements and their contractual cash flow characteristics.
Loans outstanding
The Bank’s lending transactions are recognised in the statement of financial position at the time the funds are transferred to the borrower. Loans are recognised initially at historical cost, which corresponds to the fair value of the transferred funds, including transaction costs. Loans outstanding are carried at amortised cost. If the loans are hedged against changes in fair value caused by changes in market interest rates by using derivative instruments, they are recognised in the statement of financial position at fair value, with value changes recognised in the statement of comprehensive income.
Impairment of loans and receivables
The bank applies the principles set out in IAS 39 for impairment of loans and receivables. The bank will apply the expected credit loss model according to IFRS 9, from 1 January 2018.
Impairment of individually assessed loans
Exposures to obligors in default classes are classified as non-performing. A default occurs with regard to an obligor when either or both of the following have taken place:
(a) NIB considers that the obligor is unlikely to pay its credit obligations in full, without recourse by the institution to actions such as realising security.
(b) The obligor is past due by more than 90 or 180 days in the case of sovereign lending exposure to member countries, or countries with which NIB has an existing framework agreement in place.
Obligors that satisfy the criteria in (a) above are set to default class D1 and those that satisfy the criteria in (b) above are set to default class D2. If both criteria (a) and (b) are satisfied, the obligor is set to default class D2.
20
The Bank reviews its non-performing loans and receivables at each reporting date to assess whether an allowance for impairment should be recorded in the statement of comprehensive income. In particular, the judgement of the management is required in estimating the amount and timing of future cash flows when determining the level of allowance required. Such estimates are based on assumptions about a number of factors, and actual results may differ, resulting in future changes to the allowance.
Where the collectability of identified loans is in doubt, specific impairment losses are recognised in the statement of comprehensive income. Impairment is defined as the difference between the carrying value of the asset and the net present value of expected future cash flows, determined using the instrument’s original effective interest rate, where applicable. If the carrying amount of the loan is higher than the net present value of the estimated future cash flows, including the fair value of the collaterals, the loan is impaired.
For issued guarantees, the impairment is recognised when it is both probable that the guarantee will need to be settled and the settlement amount can be reliably estimated.
Impairment of collectively assessed loans
Loans that are not individually impaired will be transferred to a group of loans with similar risk characteristics for a collective impairment test.
The Bank assesses the need to make a collective impairment test on exposures that, although not specifically identified as requiring a specific allowance, have a greater risk of default than when originally granted. This collective impairment test is based on any deterioration in the internal rating of the groups of loans or investments from the time they were granted or acquired. These internal ratings take into consideration factors such as any deterioration in counterparty risk, the value of collaterals or securities received, and the outlook for the sector, as well as identified structural weaknesses or deterioration in cash flows.
The process includes the management’s judgement based on the current macroeconomic environment and the current view of the expected economic outlook. In the Bank’s view, the assumptions and estimates made are appropriately conservative and are reflective of the predicted economic conditions, the Bank’s portfolio characteristics and their correlation with losses incurred based on historical loss experience. The impairment remains related to the group of loans until the losses have been identified on an individual basis.
Intangible assets
Intangible assets mainly consist of investments in software, software licences and ongoing investments in new ICT systems. Acquisitions that generate economic benefits exceeding costs beyond one year are recognised as intangible assets. The investments are carried at historical cost, and are amortised over the assessed useful life of the assets, which is estimated to be between three and five years. The amortisations are made on a straight-line basis.
Tangible assets
Tangible assets in the statement of financial position include land, buildings, office equipment and other tangible assets owned by the Bank. The assets are recognised at historical cost, less any accumulated depreciation based on their assessed useful life. Land is not depreciated. The Bank’s office building in Helsinki is depreciated on a straight-line basis over a 40-year period. The Bank’s other buildings are depreciated over a 30-year period. The depreciation period for office equipment and other tangible assets is determined by assessing the individual item. The depreciation period is usually three to five years. The depreciations are calculated on a straight-line basis.
Write-downs and impairment of intangible and tangible assets
The Bank’s assets are reviewed annually for impairment. If there is any objective evidence of impairment, the impairment loss is determined based on the recoverable amount of the assets.
Derivative instruments and hedge accounting
The Bank’s derivative instruments used to manage interest rate and currency risk are recognised on a trade-date basis at fair value in the statement of financial position as “Other assets” or “Other liabilities”. The Bank applies hedge accounting in accordance with IFRS 9 when the conditions set out by the standard are met. The hedge accounting is based on a clearly documented relationship between the item hedged and the hedging instrument. When there is a high (negative) correlation between the hedging instrument on the one hand and the value change of the hedged item or the cash flows generated by the hedged item on the other, the hedge is regarded as effective. The hedging relationship is documented at the time the hedge transaction is entered into, and the effectiveness of the hedge is continually assessed.
Derivatives where hedge accounting is not applied are recognised at fair value through the income statement.
21
Fair value hedging
When a derivative is designated as the hedging instrument in a hedge of the change in fair value of a recognised asset or liability or a firm commitment that could affect profit or loss, changes in the fair value of the derivative are recognised immediately in profit or loss together with changes in the fair value of the hedged item that are attributable to the hedged risk in the same line item in the statement of profit or loss and OCI as the hedged item. Sometimes a derivative may be a component of a hybrid financial instrument that includes both the derivative and a host contract. Such embedded derivative instruments are part of a structured financing transaction that is hedged against changes in fair value by means of matching swap contracts. In such cases, both the hedged borrowing transaction and the hedging derivative instrument are recognised at fair value with changes in fair value in the statement of comprehensive income.
Currently the Banks fair value hedges mainly relate to swapping fixed to floating rates on its borrowing and lending transactions.
Cash flow hedging
When a derivative is designated as the hedging instrument in a hedge of the variability in cash flows attributable to a particular risk associated with a recognised asset or liability that could affect profit or loss, the effective portion of changes in the fair value of the derivative is recognised in OCI and presented in the hedging reserve within equity. Any ineffective portion of changes in the fair value of the derivative is recognised immediately in profit or loss. The amount recognised in OCI is reclassified to profit or loss as a reclassification adjustment in the same period as the hedged cash flows affect profit or loss, and in the same line item in the statement of profit or loss and OCI. Currently the Bank does not apply cash flow hedge accounting but may choose to in the future.
Foreign currency basis spread
Following the early adoption of IFRS 9 in 2011, the bank separates the foreign currency basis spread from financial instruments used in hedging and this separated amount is recorded in “Other comprehensive income” (OCI). The foreign currency basis spread will be zero upon maturity and therefore the amount recorded in OCI will not be reclassified to the income statement.
Discontinuance of hedge accounting
If the hedging derivative expires or is sold, terminated or exercised, or the hedge no longer meets the criteria for fair value hedge accounting, or the hedge designation is revoked, then hedge accounting is discontinued prospectively. Any adjustment up to the point of discontinuation to a hedged item for which the effective interest method is used is amortised to profit or loss as part of the recalculated effective interest rate of the item over its remaining life.
Debts evidenced by certificates
The Bank’s borrowing transactions are recognised in the statement of financial position at the time the funds are transferred to the Bank. The borrowing transactions are recognised initially at a cost that comprises the fair value of the funds transferred, less transaction costs. The Bank uses derivative instruments to hedge the fair value of virtually all its borrowing transactions. In these instances, the borrowing transaction is subsequently recognised in the statement of financial position at fair value, with any changes in value recognised in the statement of comprehensive income.
Securities delivered under repurchase agreements are not derecognised from the statement of financial position. Cash received under repurchase agreements is recognised in the statement of financial position as “Amounts owed to credit institutions”.
Equity
As of 31 December 2016, the Bank’s authorised and subscribed capital is EUR 6,141.9 million, of which the paid-in portion is EUR 418.6 million. Payment of the subscribed, non-paid-in portion of the authorised capital, i.e. the callable capital, will take place at the request of the Bank’s Board of Directors to the extent that the Board deems it necessary for the fulfilment of the Bank’s debt obligations.
The Bank’s reserves have been built up by means of appropriations from the profits of previous accounting periods, and consist of the Statutory Reserve, as well as the General Credit Risk Fund and the Special Credit Risk Fund for PIL (see note 17).
The Bank’s profits, after allocation to appropriate credit risk funds, are transferred to the Statutory Reserve until it amounts to 10% of NIB’s subscribed authorised capital. Thereafter, the Board of Governors, upon a proposal by the Bank’s Board of Directors, decides upon the allocation of the profits between the reserve fund and dividends on the subscribed capital.
The General Credit Risk Fund is designed to cover unidentified exceptional risks in the Bank’s operations. Allocations to the Special Credit Risk Fund for PIL are made primarily to cover the Bank’s own risk in respect of credit losses on PIL loans.
22
The hedging reserve consists of the unrealised value changes of currency basis spreads of derivatives included in hedge accounting. Valuation changes will be zero upon maturity and therefore the amount recorded in the hedging reserve will not be reclassified to the income statement.
Interest
The Bank’s net interest income includes accrued interest on loans, debt securities, placements and accruals of the premium or discount value of financial instruments. Net interest income also includes interest expenses on debts, swap fees and borrowing costs.
Fees and commissions
Fees collected when disbursing loans are recognised as income at the time of the disbursement, which means that fees and commissions are recognised as income at the same time as the costs are incurred. Commitment fees are charged on loans that are agreed but not yet disbursed and are accrued in the statement of comprehensive income over the commitment period.
Annually recurrent costs arising as a result of the Bank’s borrowing, investment and payment transactions are recognised under the item “Commission expense and fees paid”.
Financial transactions
The Bank recognises in “Net profit on financial operations” both realised and unrealised gains and losses on debt securities and other financial instruments. Adjustments for hedge accounting are included.
Administrative expenses
The Bank provides services to its related parties, the Nordic Development Fund (NDF) and the Nordic Environment Finance Corporation (NEFCO). Payments received by the Bank for providing services at cost to these organisations are recognised as a reduction in the Bank’s administrative expenses. NIB receives a host country reimbursement from the Finnish Government equal to the tax withheld from the salaries of NIB’s employees. This payment reduces the Bank’s administrative expenses, as shown in Note 7.
Leasing agreements
Leasing agreements are classified as operating leases if the rewards and risks incident to ownership of the leased asset, in all major respects, lie with the lessor. Lease payments under operating leases are recognised on a straight-line basis over the lease term. The Bank’s rental agreements are classified as operating leases.
Employee pensions and insurance
The Bank is responsible for arranging pension security for its employees. In accordance with the Host Country Agreement between the Bank and the Finnish Government and as part of the Bank’s pension arrangements, the Bank has decided to apply the Finnish state pension system. Contributions to this pension system, which are paid into the Finnish State Pension Fund, are calculated as a percentage of salaries. The Finnish Ministry of Finance determines the basis for the contributions and establishes the actual percentage of the contributions according to a proposal from the local government pension institution Keva. See Note 7.
NIB also provides its permanent employees with a supplementary pension insurance scheme arranged by a private pension insurance company. This is group pension insurance based on a defined contribution plan. The Bank’s pension liability is completely covered.
In addition to the applicable local social security systems, NIB has taken out, for example, comprehensive accident, life, medical and disability insurance policies for its employees in the form of group insurance.
Segment information
Segment information and currency distribution in the notes are presented in nominal amounts. The adjustment to hedge accounting is presented as a separate item (except for Note 3, the primary reporting segment).
Reclassifications
Some other minor reclassifications have been made. The comparative figures have been adjusted accordingly.
23
New and amended standards applied in the financial year 2016
NIB has no transactions that have been materially affected by new amendments or standards during 2016.
Adoption of new and amended standards and interpretations applicable in future financial years
NIB has not yet adopted the following new and amended standards and interpretations already issued by the IASB. NIB will adopt them as of the effective date or, if the date is other than the first day of the financial year, from the beginning of the subsequent financial year.
| • | New IFRS 9 Financial Instruments (effective for financial years beginning on or after 1 January 2018): IFRS 9 replaces the existing guidance in IAS 39 Financial Instruments: Recognition and Measurement. IFRS 9 includes revised guidance on the classification and measurement of financial instruments, including a new expected credit loss model for calculating impairment on financial assets, and the new general hedge accounting requirements. It also carries forward the guidance on recognition and derecognition of financial instruments from IAS 39. |
Classification and Measurement – The new standard introduces a new financial asset classification type, Fair value through other comprehensive income (FVOCI) for financial assets held in a business model whose objective is to hold assets to collect contractual cash flows and selling financial assets and the cash flows consist solely payments of principal and interest on the principal amount outstanding (“SPPI”). NIB is assessing the impact of this change and some assets may fall into this new category.
Expected credit loss – The bank continues to develop its model for forecasting expected credit losses according to the new standard. Preliminary analysis indicates that the new approach will not have a very significant impact however, testing and calibration of the model continues and the final outcome may differ from the preliminary analysis.
| • | IFRS 16 Leases substantially changes the accounting treatment as the majority of leases will become on-balance sheet liabilities with corresponding right of use assets on the balance sheet. The standard replaces IAS 17 Leases and is effective as of January 1, 2019. However, the Bank does not have significant leasing commitments and therefore the new standard is not expected to have a significant impact. The current operating lease commitments disclosed in Note 18 provide, subject to the provision of the standard, an indicator of the impact of the implementation of IFRS 16 on the Banks statement of financial position. |
| • | There are no other IFRS standards or interpretations that are not yet effective that would be expected to have a material impact on the Bank. |
24
NOTE 2: RISK MANAGEMENT
The Bank assumes a conservative approach to risk-taking. Careful balancing of mission fulfilment, revenue generation and risk mitigation is a key consideration in the Bank’s risk-taking. The constituent documents require that loans be granted in accordance with sound banking principles, that adequate security be obtained for the loans, unless sufficient security is considered to exist under the circumstances, and that the Bank protect itself against the risk of exchange rate losses to the extent practicable. The Bank’s risk tolerance is defined with the objective of maintaining strong credit quality, stable earnings and a level of capital and liquidity required to maintain the Bank’s AAA/Aaa rating.
The main risks — credit risk, market risk, liquidity risk, operational risk and compliance risk — are managed carefully with the overall objective of maintaining financial soundness and avoiding activities that could threaten the Bank’s reputation. As an international financial institution, the Bank is not subject to national or international prudential regulation of the banking sector. However, the Bank’s risk management framework is regularly reviewed and adapted to changing conditions with the aim of complying in substance with what the Bank identifies as the relevant market standards and best practices, including the standards and guidelines of the Basel Committee on Banking Supervision.
The Bank’s risk management framework comprises risk policies and procedures formulated for the assessment, measurement, monitoring and reporting of risks including a comprehensive limit system for managing the exposure to quantifiable risks. The Bank recognises that effective risk management is based on a sound risk culture, which is characterised, among other things, by a high level of awareness concerning risk and risk management in the organisation. Regular training of staff in risk-related matters is part of the Bank’s risk management practices.
Key risk responsibilities
The Board of Directors lays down the general framework for the Bank’s risk management by approving its risk management policies, including maximum limits for exposure to the main types of risk. The Board approves credits and grants authorisation to the Bank to raise funds in the capital markets based on its estimated funding requirements.
The President is responsible for managing the risk profile of the Bank within the framework set by the Board of Directors and for ensuring that the Bank’s aggregate risk is consistent with its financial resources and willingness to take risk. The Board of Directors has delegated some credit approval authority to the President for execution in the Credit Committee.
The following committees assist and advise the President:
The Executive Committee consists of the President and senior officers, whose appointment to the committee has been confirmed by the Board of Directors. The committee is the forum for addressing policy and management issues, including following up the financial results, business plan and strategy of the Bank. The committee meets approximately twice a month.
The Credit Committee consists of the President and senior officers appointed by the Board of Directors. The committee is responsible for preparing and making decisions on credit matters related to lending operations and for decisions on treasury counterparties. Among other things, the committee reviews all credit proposals before they are submitted to the Board of Directors for approval. The committee usually meets weekly.
The Finance Committee consists of the President, the Head of Treasury and the Head of Risk and Finance. The committee is responsible for preparing and making decisions on matters related to treasury operations. The committee makes recommendations and, where appropriate, decisions in the area of market, counterparty and liquidity risk exposure. It also monitors the Bank’s borrowing activities and has oversight of treasury risk reporting to the Board of Directors. The committee usually meets monthly.
The Asset and Liability Committee (ALCO) consists of the members of the Executive Committee and the Chief Risk Officer. Together with the Executive Committee, it has overall responsibility for the Bank’s risk management. ALCO’s duties include monitoring the Bank’s balance sheet development and capital adequacy, setting targets and limits for risk to be managed at the bank level, reviewing liquidity risk management and funding structure, as well as monitoring performance against the agreed risk appetite. The committee meets approximately six times a year.
The Business and Technology Committee (BTC) assists and advises the President in information and communications technology (ICT) matters and functions as a steering committee for ICT development projects. The President makes strategically important decisions on ICT matters in the Executive Committee. The BTC consists of the Head of ICT and other senior staff members appointed by the President. The chairman of the Committee shall be a member of the Executive Committee.
25
In addition to the advisory bodies to the President, the Bank has the following permanent internal committees focusing on risk aspects:
The New Product and Structure Committee scrutinises product and deal structure proposals which from a risk and/or administrative point of view significantly differ from what the Bank has entered into previously.
The Council of Fighting Corruption has been established to enhance the awareness of integrity and corruption risks among the Bank’s staff and stakeholders.
In the day-to-day operations, the Bank has established a segregation of duties between units that enter into business transactions with customers or otherwise expose the Bank to risk, and units in charge of risk assessment, risk measurement, monitoring and control.
The business units, Lending and Treasury, are responsible for implementing the Bank’s business strategy. Lending is responsible for loan origination and mandate fulfilment in accordance with the Bank’s willingness to take risk. Treasury provides support by executing the funding strategy and managing the liquidity as well as balance sheet risks (Asset and Liability Management). The business units carry out the day-to-day management of all risks assumed in their operations and ensure that an adequate return is achieved for the risks taken. The Head of Lending and the Head of Treasury report to the President.
The Risk Management unit within Risk and Finance carries out independent measuring, controlling, monitoring and reporting of the Bank’s credit risk, liquidity risk, market risk and operational risk exposures. The Head of Risk and Finance reports to the President.
Credit and Analysis is responsible for assessing and monitoring counterparty credit risk in the Bank’s lending and treasury operations. The Credit unit oversees that credit proposals are in compliance with established limits and policies. The Special Credits unit manages transactions requiring particular attention due to restructuring work-out and recovery processing. The Head of Credit and Analysis reports to the President.
The Legal department supports all units of the Bank carrying the responsibility for minimising and mitigating legal risks in the Bank’s operational and administrative activities. The General Counsel reports to the President.
The Compliance function assists the Bank in identifying, assessing, monitoring and reporting on compliance risks in matters relating to the institution, its operations and the personal conduct of staff members. The Chief Compliance Officer reports to the President, with unrestricted access to the Chairman of the Board of Directors and the Chairman of the Control Committee.
Internal Audit provides an independent evaluation of the controls, risk management and governance processes. The Head of Internal Audit reports to the Board of Directors and the Control Committee.
The Control Committee is the Bank’s supervisory body. It ensures that the operations of the Bank are conducted in accordance with the Statutes. The committee is responsible for the audit of the Bank’s accounts and submits its annual audit statement to the Board of Governors. The committee also monitors the anti-corruption and compliance practices of the Bank.
Credit risk
Credit risk is the Bank’s main financial risk. Credit risk is defined as the risk of loss resulting from the failure of the Bank’s borrowers and other counterparties to fulfil their contractual obligations and that collateral provided does not cover the Bank’s claims. Following from NIB’s mission, most of the credit risk stems from the Bank’s lending operations. The Bank is also exposed to credit risk in its treasury activities, where credit risk derives from the financial assets that the Bank uses for investing its liquidity, such as fixed-income securities and interbank deposits, and from derivative instruments used for managing currency and interest rate risks and other market risks related to structured funding transactions.
Credit risk management
The Bank’s credit risk management builds on the principles of (1) appropriate risk diversification within the scope of the mission; (2) thorough risk assessment at the credit appraisal stage; (3) risk-based pricing and risk mitigation; (4) continuous risk monitoring at the individual counterparty level as well as portfolio level; (5) avoidance of undesirable risks to the extent possible.
Credit risk limits
The maximum credit exposure that the Bank is willing to take is expressed in terms of exposure limits set by the Board of Directors. Credit exposure is the aggregate of lending and treasury exposure. Limits at counterparty level are scaled to the Bank’s equity and the counterparty’s equity. Portfolio level limits are defined in relation to the Bank’s equity.
26
Counterparty limits are determined based on the probability of default and expected loss. The Bank defines a single counterparty as a counterparty or group of counterparties that are legally and/or financially consolidated or otherwise interdependent from a risk perspective. For exposure limit purposes, the Bank considers the entity where the risk resides, i.e. the risk-owner, as the counterparty. The risk-owner is the entity that is ultimately responsible for the Bank’s claim and may be different from the obligor if the risk is transferred through a guarantee. In order for a guarantee to be eligible for risk transfer, it must cover the full exposure and be a guarantee undertaking securing the borrower’s debt “as for own debt”, meaning that the Bank can make a claim under the guarantee immediately after the borrower has failed to pay on a due date.
To prevent excessive concentrations, the Bank applies portfolio-level limits for large counterparty exposure, as well as for industry sector and country exposures. The Bank has not set limits for the aggregate lending exposure in its member countries. Lending in non-member countries is subject to country limits. For the Bank’s treasury operations, country limits apply for exposure in member and non-member countries.
As a general principle, the Bank limits the maximum amount granted as loan or guarantee for a single project to 50% of the total project cost. Financing to small and medium-sized enterprises, small mid-cap corporates and mid-cap corporates in the Bank’s member countries can be extended up to 75% of the total project or financing need qualifying for a NIB mandate.
Credit risk assessment
The counterparty’s debt servicing capacity is a key consideration for credit approval. The assessment of a counterparty’s creditworthiness focuses on identifying the main financial and business risks related to the counterparty. Based on the assessment, a risk rating indicating the probability of default (PD) is assigned to the counterparty. The credit risk assessment includes the use of quantitative risk methodologies and models as well as qualitative assessments based on expert judgement. The process of assigning PD ratings to counterparties is carried out in the Credit & Analysis department.
A separate expected loss (EL) rating is assigned at the transaction level. The EL rating factors in the loss given default (LGD), i.e. the loss severity in the event of a counterparty default. The LGD assignment process relies on models that produce an LGD estimate based on the type of counterparty and the characteristics of the transaction, such as guarantees, collateral, the seniority of the claim and other credit enhancing factors in the transaction. The risk ratings are approved by the Credit Committee.
The Bank’s risk rating system comprises 20 classes to differentiate the risk of counterparty default and the expected loss on a transaction. In addition, a separate D class applies for non-performing transactions. For reference to external ratings, the internal scales are mapped to the ratings of S&P and Moody’s such that classes 1 to 10 correspond to the external rating equivalent of the investment grade AAA to BBB- and Aaa to Baa3, respectively.
Credit risk mitigation
The Bank lends and invests on a senior unsecured or secured basis. The level of credit enhancement required in the Bank’s lending depends, among other things, on the creditworthiness of the counterparty and the tenor and repayment structure of the loan. When lending on an unsecured basis, the Bank requires that various undertakings, such as negative pledges and financial and non-financial covenants, are incorporated in the loan agreements.
In its secured lending, the Bank primarily relies on collateral and/or guarantees. The collateral should preferably be independent from the obligor (e.g. third-party shares or commercial real estate that can readily be taken into alternative use) and there should be a reasonably functioning market for the collateral.
The distribution of the Bank’s lending portfolio by type of credit enhancement at year-end 2016 is presented below with further information in Note 11.
27
Lending by type of security
as of 31 Dec 2016
EUR m
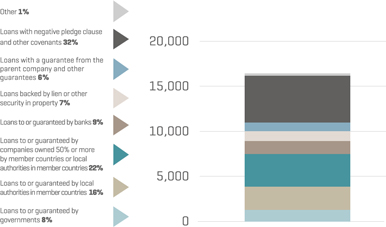
In its treasury operations, the Bank applies netting and collateralisation to mitigate counterparty credit risk related to derivatives and collateralised placements. The Bank undertakes swap transactions only with counterparties that meet the required minimum counterparty credit rating and have executed an International Swaps and Derivatives Association (ISDA) Master Agreement and signed a Credit Support Annex (CSA). Collateralised placements in the form of reverse repo transactions are made on the terms of the Global Master Repurchase Agreement (GMRA).
The ISDA master agreement allows for a single net settlement of all swap transactions covered by the agreement in the event of a counterparty default or early termination of the transactions. Netting is applied for the measurement of the Bank’s credit exposure only in cases when it is deemed to be legally valid and enforceable in the relevant jurisdiction and against a counterparty. At year-end 2016, netting reduced the swap exposure by EUR 889 million from a gross total market value of EUR 2,264 million to EUR 1,375 million (year-end 2015: EUR 2,748 million and EUR 1,976 million, respectively).
The CSA further mitigates credit risk related to swaps, as the swap positions are marked to market daily and the resulting exposures exceeding agreed thresholds, if any, are collateralised by cash or high-quality government securities. At year-end 2016, the Bank held EUR 1,420 million (2015: EUR 1,829 million) in gross collateral received, of which EUR 1,309 million (2015: EUR 1,440 million) was in cash and EUR 111 million (2015: EUR 389 million) in securities (See Note 18, Collateral and Commitments).
Credit risk monitoring
The Bank puts strong emphasis on continuous monitoring of the credit risk development in its lending and treasury operations. Credit risk is monitored both at counterparty level and at portfolio level. The primary responsibility for credit risk monitoring resides with the unit responsible for the client relationship, i.e. Lending, Treasury and Special Credits with support from Credit & Analysis. Risk Management carries out the portfolio level monitoring.
All lending exposures are subject to continuous monitoring of contractual compliance and events/signals that could potentially lead to or indicate a material change in risk. In addition, an annual follow-up is conducted on the entire loan portfolio. The annual follow-up is presented to the Credit Committee and reported to the Board of Directors.
Treasury exposures are subject to continuous monitoring of events and market signals that could potentially lead to or indicate a material change in risk. At a minimum, the counterparties are analysed and the risk class validated every two years. The follow-up is presented to the Credit Committee.
Following the identification of a seriously deteriorated debt repayment capacity and/or a serious deterioration in the financial standing, the counterparty is placed on the watch-list and becomes subject to specific watch-list monitoring. Watch-listed counterparties are reviewed by the Credit Committee at agreed intervals and reported to the Board of Directors.
If a credit exposure requires the expertise of specialists in workout and restructuring, it will be transferred to the Special Credits unit. The unit’s primary objective is to take over responsibility for distressed loans from Lending and devote sufficient time and effort to the individual case in order that the Bank may recover all or as much as possible of distressed loans outstanding.
28
Credit risk monitoring at portfolio level includes, among others, an analysis of the aggregate credit risk exposure, credit risk concentrations and changes in the risk profile. The development is reported to ALCO and the Board of Directors.
Compliance with existing limits is monitored regularly; for treasury counterparties, limit compliance is monitored on a daily basis. Exposure in excess of maximum limits may occur e.g. due to downgrade of a counterparty rating. Limit breaches are reported to senior management, relevant committees and the Board of Directors.
Risk-based pricing
The Statutes stipulate that the Bank shall operate according to sound banking principles and aim for a profit allowing the formation of reserves and a reasonable return on capital.
Loans and guarantees are priced to cover the Bank’s cost of funds, administration costs, the cost of the risk involved in the transaction and the cost of capital employed. For loan pricing purposes, the Bank uses a pricing tool that enables calculation of the minimum earnings required on a loan in order to cover all lending related costs and an appropriate return for the level of risk assumed. Internal credit risk ratings and associated risk parameters, as well as the structure of the transaction, are key input factors in the pricing tool.
Credit risk reserves, impairment methodology
The Bank maintains two credit risk funds within its equity, in addition to the Statutory Reserve. The General Credit Risk Fund is available to cover unexpected losses arising from the Bank’s lending and other business activities. At year-end 2016, the fund amounted to EUR 1,541 million before allocation of the profit for the year. The Statutes require that the Bank maintains the Special Credit Risk Fund for the Project Investment Loan (PIL) facility to cover the Bank’s own risk on such loans before resorting to the member countries’ guarantees that support the facility. At year-end 2016, the fund amounted to EUR 446 million before allocation of the profit for the year.
At least every four months, the Bank reviews the need for impairment provisions on weak exposures. The assessment is carried out both at the level of the individual counterparty and collectively for groups of counterparties. At the counterparty level, a specific impairment provision is recognised if there is objective evidence that the counterparty’s capacity to fulfil its obligations has deteriorated to the extent that full repayment is unlikely, taking into consideration any collateral received. Collective impairment provisions are determined on a portfolio basis for exposures with similar credit risk characteristics as reflected in their risk ratings. The process includes the management’s judgement based on the current macroeconomic environment and the current view of the expected economic outlook. In the Bank’s view, the assumptions and estimates made are appropriately conservative and are reflective of the predicted economic conditions, the Bank’s portfolio characteristics and their correlation with losses incurred based on historical loss experience. In the assessment of sovereign exposures, the Bank takes into account its preferred creditor status. The Bank’s principles for impairment provisioning are described in more detail in note 1 “Accounting policies”.
Credit risk exposure
Tables 1 to 3 below provide an overview of the Bank’s aggregate credit risk exposure at year-end 2016 distributed according to expected loss (EL) before collective impairment. Aggregate credit exposure comprises lending and treasury exposure. Lending exposure includes loans outstanding and loans agreed but not yet disbursed, without taking into account any collateral or other credit enhancement. Regarding the treasury exposure, capital market investments are included at nominal value, while derivatives are included at market value net of collateral held. The exposure to collateralised placements in the form of reverse repo transactions is calculated as a fixed percentage of the market value of the collateral held.
29
TABLE 1. Credit risk exposure by internal rating based on expected loss (EL) (in EUR million)
| | | | | | | | | | | | | | | | | | | | | | | | | | | | |
| | | |
| RISK | | S&P | | | 31 DEC 2016 | | | 31 DEC 2015 | |
| | | | | | | |
CLASS | | EQUIVALENT | | | LENDING | | | TREASURY | | | TOTAL | | | LENDING | | | TREASURY | | | TOTAL | |
1–2 | | | AAA/AA+ | | | | 4,458 | | | | 5,005 | | | | 9,463 | | | | 3,659 | | | | 5,181 | | | | 8,839 | |
3–4 | | | AA/AA- | | | | 1,231 | | | | 1,991 | | | | 3,223 | | | | 559 | | | | 1,001 | | | | 1,560 | |
5–6 | | | A+/A | | | | 1,544 | | | | 1,164 | | | | 2,707 | | | | 1,412 | | | | 1,307 | | | | 2,719 | |
7–8 | | | A-/BBB+ | | | | 4,799 | | | | 232 | | | | 5,031 | | | | 4,907 | | | | 212 | | | | 5,119 | |
9–10 | | | BBB/BBB- | | | | 3,582 | | | | 1 | | | | 3,583 | | | | 3,213 | | | | 0 | | | | 3,213 | |
11–12 | | | BB+/BB | | | | 1,671 | | | | 0 | | | | 1,671 | | | | 2,067 | | | | 0 | | | | 2,067 | |
13–14 | | | BB/BB- | | | | 718 | | | | 0 | | | | 718 | | | | 333 | | | | 0 | | | | 333 | |
15–16 | | | BB-/B+ | | | | 289 | | | | 0 | | | | 289 | | | | 322 | | | | 0 | | | | 322 | |
17–18 | | | B/B- | | | | 15 | | | | 0 | | | | 15 | | | | 64 | | | | 0 | | | | 64 | |
19–20 | | | B-/CCC | | | | 7 | | | | 0 | | | | 7 | | | | 0 | | | | 0 | | | | 0 | |
D | | | | | | | 21 | | | | 2 | | | | 23 | | | | 74 | | | | 6 | | | | 80 | |
TOTAL | | | | | | | 18,335 | | | | 8,396 | | | | 26,730 | | | | 16,607 | | | | 7,707 | | | | 24,314 | |
| | | | | | | |
Class D | | | | | | | | | | | | | | | | | | | | | | | | | | | | |
Gross | | | | | | | 118 | | | | 45 | | | | 163 | | | | 205 | | | | 46 | | | | 251 | |
Impairment | | | | | | | 97 | | | | 42 | | | | 140 | | | | 131 | | | | 40 | | | | 171 | |
Net | | | | | | | 21 | | | | 2 | | | | 23 | | | | 74 | | | | 6 | | | | 80 | |
The quality of the Bank’s aggregate credit exposure remained sound in 2016. Lending exposure increased by 10% due to a high volume of loan disbursements. Around one third of the disbursements were to counterparties in the best risk classes (EL1-2), which was largely explained by new lending to the public sector. Treasury exposure increased by 9% due to a higher level of liquid assets. At year-end 2016, 85% (2015: 83%) of lending exposure and practically 100% (2015: 100%) of treasury exposure was in risk classes 1-10, corresponding to investment-grade quality. The lending exposure in the weakest risk classes (EL 17-20) was reduced mainly due to repayment. The decrease in exposure in risk class D (non-performing) was the result of payments received, write off of claims as well as the upgrade of one customer.
30
TABLE 2. Geographical distribution of the credit risk exposure (in EUR million)
The geographical distribution of the aggregate credit risk exposure is shown in the table below. The distribution is based on the risk-owner’s country of domicile.
| | | | | | | | | | | | | | | | | | | | | | | | |
| | |
| | | 31 DEC 2016 | | | 31 DEC 2015 | |
| | | | | | |
COUNTRY/REGION | | LENDING | | | TREASURY | | | TOTAL | | | LENDING | | | TREASURY | | | TOTAL | |
Denmark | | | 1,324 | | | | 1,311 | | | | 2,635 | | | | 1,610 | | | | 828 | | | | 2,438 | |
Estonia | | | 215 | | | | 0 | | | | 215 | | | | 221 | | | | 0 | | | | 221 | |
Finland | | | 4,068 | | | | 911 | | | | 4,978 | | | | 3,640 | | | | 928 | | | | 4,568 | |
Iceland | | | 618 | | | | 1 | | | | 619 | | | | 535 | | | | 2 | | | | 537 | |
Latvia | | | 232 | | | | 48 | | | | 280 | | | | 287 | | | | 18 | | | | 305 | |
Lithuania | | | 625 | | | | 0 | | | | 625 | | | | 652 | | | | 20 | | | | 672 | |
Norway | | | 4,103 | | | | 277 | | | | 4,380 | | | | 3,030 | | | | 355 | | | | 3,384 | |
Sweden | | | 4,944 | | | | 1,334 | | | | 6,278 | | | | 4,040 | | | | 871 | | | | 4,912 | |
Africa and Middle East | | | 125 | | | | 0 | | | | 125 | | | | 187 | | | | 0 | | | | 187 | |
Americas | | | 253 | | | | 800 | | | | 1,054 | | | | 311 | | | | 604 | | | | 915 | |
Asia-Pacific | | | 587 | | | | 31 | | | | 618 | | | | 857 | | | | 39 | | | | 897 | |
Europe | | | 903 | | | | 3,136 | | | | 4,039 | | | | 985 | | | | 3,643 | | | | 4,628 | |
Multilaterals | | | 336 | | | | 547 | | | | 883 | | | | 251 | | | | 399 | | | | 650 | |
TOTAL | | | 18,335 | | | | 8,396 | | | | 26,730 | | | | 16,607 | | | | 7,707 | | | | 24,314 | |
In the context of the Bank’s mission, the credit risk exposure continued to be fairly well balanced in terms of geographical distribution. At year-end 2016, the member countries accounted for 88% of the Bank’s lending exposure (2015: 84%) with the exposure to Norway and Sweden showing the largest increase in 2016. The largest lending exposures outside the member countries were in Poland, China, Brazil and India. The Bank’s exposure in Russia, Ukraine and Belarus amounted to EUR 159 million (2015: EUR 312 million), including EUR 55 million (2015: EUR 84 million) under the MIL facility and EUR 25 million (2015: EUR 27 million) in agreed, not disbursed loans.
Of the treasury exposure, 46% (2015: 39%) was in the member countries, while the rest of Europe accounted for 37% (2015: 47%), dominated by Germany, The Netherlands and France. The major part of the treasury exposure outside Europe was in Canada.
TABLE 3. Credit risk exposure by industry sector (in EUR million)
The distribution of the credit risk exposure by sector is based on the industry sector of the risk-owner. These sectors are different from the four business areas into which the Bank has organised its lending operations.
| | | | | | | | | | | | | | | | | | | | | | | | |
| | |
| | | 31 DEC 2016 | | | 31 DEC 2015 | |
| | | | | | |
INDUSTRY SECTOR | | LENDING | | | TREASURY | | | TOTAL | | | LENDING | | | TREASURY | | | TOTAL | |
Oil & Gas | | | 125 | | | | 0 | | | | 125 | | | | 344 | | | | 0 | | | | 344 | |
Materials | | | 1,053 | | | | 0 | | | | 1,053 | | | | 1,115 | | | | 0 | | | | 1,115 | |
Industrials | | | 3,540 | | | | 0 | | | | 3,540 | | | | 3,668 | | | | 0 | | | | 3,668 | |
Consumer discretionary | | | 568 | | | | 0 | | | | 568 | | | | 540 | | | | 0 | | | | 540 | |
Consumer staples | | | 977 | | | | 0 | | | | 977 | | | | 1,018 | | | | 0 | | | | 1,018 | |
Health care | | | 551 | | | | 0 | | | | 551 | | | | 519 | | | | 0 | | | | 519 | |
Financials | | | 2,202 | | | | 5,275 | | | | 7,477 | | | | 1,442 | | | | 4,470 | | | | 5,913 | |
Information technology | | | 186 | | | | 0 | | | | 186 | | | | 220 | | | | 0 | | | | 220 | |
Telecommunication services | | | 309 | | | | 0 | | | | 309 | | | | 429 | | | | 0 | | | | 429 | |
Utilities | | | 4,255 | | | | 0 | | | | 4,255 | | | | 3,773 | | | | 0 | | | | 3,773 | |
Public sector | | | 4,569 | | | | 3,121 | | | | 7,689 | | | | 3,540 | | | | 3,237 | | | | 6,776 | |
TOTAL | | | 18,335 | | | | 8,396 | | | | 26,730 | | | | 16,607 | | | | 7,707 | | | | 24,314 | |
31
The distribution of the lending exposure by industry sector remained stable in 2016 compared to the previous year, with the public sector, the utility sector and the industrials sector accounting for 67% (2015: 66%) of the total exposure. In nominal terms the most significant increase was in the exposure to the public sector and the financial sector. The exposure to these sectors increased as a consequence of new lending and included EUR 1.1 billion in agreed, not disbursed loans at year-end 2016.
The Bank has defined limits for maximum exposure to a single industry measured by the economic capital requirement and total credit risk exposure in relation to the Bank’s equity. At year-end 2016, the Bank was in compliance with these limits.
TABLE 4. Largest counterparty exposures (% of total credit risk exposure)
A counterparty exposure is defined as the consolidated group exposure, i.e. individual counterparties that are linked to one another by ownership or other group affiliation are considered as one counterparty.
| | | | |
| | |
| | | 31 DEC 2016 | | 31 DEC 2015 |
Top 5 | | 10% | | 9% |
Top 10 | | 17% | | 16% |
Top 20 | | 27% | | 27% |
The limits for large single counterparty exposures and for the aggregate of such large exposures are scaled to the Bank’s equity. Any deviations from the set limits must be approved by the Board of Directors. At year-end 2016, the Bank was within the aggregate limits set for large exposures
Market risk
The Bank defines market risk as the risk of valuation loss or reduction in the expected earnings stemming from adverse fluctuations in exchange rates, interest rates, credit spreads and cross-currency basis spreads.
Market risks predominantly arise from the Bank’s core business activities and the liquidity portfolio needed to support these activities. The Bank’s strategy is to obtain cost-efficient funding from diversified sources and provide lending that is tailored to the needs of its customers. This gives rise to foreign exchange risk and structural interest rate risk due to mismatches in the Bank’s assets and liabilities in terms of currency composition, maturity profile and interest rate characteristics. Cross-currency basis risk stems from the hedging techniques used by the Bank to mitigate spot foreign exchange risk deriving from funding and lending in different currencies. This risk relates to transactions exchanging foreign currencies at a future point in time.
The Bank’s securities portfolio held for liquidity purposes is exposed to interest rate risk and credit spread risk, i.e. potential decline in market value due to perceived change in the credit quality of the issuers of the securities held in the portfolio.
Market risk management
The Bank manages market risks by hedging against foreign exchange risk and interest rate risk with the objective of protecting its earnings and the economic value of its assets and liabilities. Foreign exchange risk is practically fully hedged. Interest rate risk deriving from mismatches between funding and lending is kept at a modest level. The Bank’s tolerance for interest rate risk and credit spread risk pertains to the earnings expectations set for the liquidity portfolio.
As part of its structured funding transactions, the Bank may use financial instruments linked to other market risk factors than the above. A prerequisite is that such transactions are completely hedged with derivatives and that the Bank is able to valuate and measure the risks involved in the derivatives.
All of the Bank’s market risks are transferred to and managed by Treasury. The Risk Management unit provides independent oversight of all significant market risks, supporting the Finance Committee, ALCO and Treasury with risk measurement, analysis, daily monitoring and reporting.
32
Foreign exchange rate risk
Table 5. Foreign exchange rate risk (in EUR million)
| | | | | | | | | | |
| | | | |
| | | | | | TOTAL LIMIT | | 31 DEC 2016 | | 31 DEC 2015 |
Net open positions | | | USD | | | 4,000 | | 1,940 | | 2,030 |
| | | | DKK | | | 1,000 | | 0,170 | | 0,010 |
| | | | SEK | | | 1,000 | | 0,300 | | 0,460 |
| | | | NOK | | | 1,000 | | 0,280 | | 0,110 |
| | | | Other currencies, Total | | | 4,000 | | 1,770 | | 2,570 |
The Statutes require that the Bank shall, to the extent practicable, protect itself against the risk of exchange rate losses.
Exchange rate risk is measured on the basis of net open positions in each currency. The limits set to restrict the overnight positions and the actual exposure as at year-end 2016 is presented in the above table. Note 22, Currency risk, shows the net of assets and liabilities at fair value in the major currencies as of year-end 2016.
The Bank hedges foreign exchange rate risk with cross-currency basis swaps, which gives rise to currency basis risk. The market value sensitivity of the Bank’s swap portfolio to one basis point shift in the relevant currency basis curves was EUR 2 million at year-end 2016 (2015: EUR 2 million) mostly deriving from the euro/US dollar basis.
The Bank does not hedge future net interest income in foreign currency. Loans are provided primarily in euro, US dollars and Nordic currencies. There is a possibility that interest income in currencies other than the euro may cause some fluctuation in the Bank’s future net income in euro terms. However, at present the Bank expects that any such potential fluctuations in future cash flows from its current portfolio would be minor in relation to its total assets and equity.
Interest rate risk
Table 6. Interest rate risk (in EUR million)
| | | | | | |
| | | |
| | | TOTAL GROSS LIMIT | | 31 DEC 2016 | | 31 DEC 2015 |
Sensitivity to 1bp change in interest rates | | 1,500 | | 0,884 | | 0,950 |
Development of interest rate risk
EUR
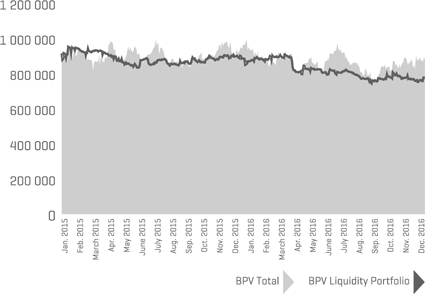
33
The Bank manages interest rate risk by using derivatives to convert fixed-rate funding into floating-rate liabilities. Fixed-rate lending that is not match-funded is converted to floating-rate receivables. This hedging approach ensures that the interest rate risk between lending and funding in each currency remains low. The majority of the Bank’s interest rate risk, therefore, stems from the portfolio of liquid assets.
The Bank measures and manages interest rate risk by estimating the sensitivity of the economic value of its balance sheet to an interest rate shock. The sensitivity is measured by means of basis point value (BPV) quantifying the impact of a parallel increase in interest rates of one basis point on the present value of interest-bearing assets and liabilities.
Maximum limits have been set for the acceptable exposure to interest rate risk both at an aggregate balance sheet level and at portfolio level.
A gross limit equivalent to EUR 1.5 million covering all currencies restricts the BPV interest rate risk to approximately 0.05% of the Bank’s equity. In addition, individual BPV limits have been set for interest rate risk in EUR, USD and the Nordic currencies, whereas a combined limit applies for all other currencies. As a supplementary indicator of interest rate risk, the Bank estimates the worst-case effect of a 0.1% change in interest rates on its net interest income over the lifetime of interest-bearing assets and liabilities due to mismatches in terms of re-pricing periods and volumes. This is managed through a limit of EUR 34 million, corresponding to approximately 1% of the Bank’s equity. At year-end 2016, the exposure amounted to EUR 13.9 million (2015: EUR 10.5 million).
Credit spread risk
Table 7. Credit spread risk (in EUR million)
| | | | | | |
| | | |
| | | TOTAL LIMIT | | 31 DEC 2016 | | 31 DEC 2015 |
Sensitivity to 1bp change in credit spreads | | 2,500 | | 1,688 | | 1,580 |
Development of credit spread risk
EUR
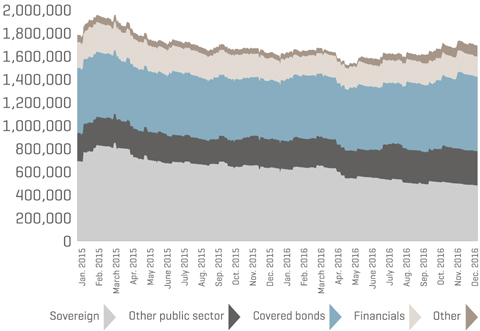
34
The Bank manages its exposure to credit spread risk by calculating the sensitivity of its liquid assets portfolio to credit spread movements. The sensitivity is measured by means of Credit Spread Basis Point Value (Spread BPV) quantifying the impact of an increase of one basis point in credit spreads on the present value of the assets.
Limits have been defined to restrict the decrease in asset value to acceptable levels in accordance with the Bank’s willingness to accept risk in its liquidity portfolio. The Bank has set an overall limit of EUR 2.5 million for credit spread risk, with specific sub-limits defined for various asset classes. To ensure that the liquidity portfolio maintains its market value and liquidity under severe market conditions, the assets in the portfolio must satisfy minimum rating requirements and other quality criteria.
Liquidity risk
Liquidity risk is defined as the risk of incurring losses due to an inability to meet payment obligations in a timely manner when they become due. The Bank categorises liquidity risk into funding liquidity risk, which occurs when payment obligations cannot be fulfilled because of an inability to obtain new funding, and market liquidity risk, which occurs when the Bank is unable to sell or transform assets in the liquidity buffer into cash without significant losses.
Liquidity risk management
The Bank’s business model gives rise to liquidity risk mainly through maturity mismatches between assets (loans and treasury investments) and liabilities (borrowing and equity). The liquidity position and adherence to exposure limits is managed by Treasury and monitored by Risk Management on a daily basis.
The Finance Committee and ALCO oversee the development of the Bank’s funding and liquidity position and decide on liquidity risk-related matters in accordance with their respective mandates. The Board of Directors receives regular reports on the liquidity and funding situation of the Bank.
The key metric applied for managing liquidity risk is the survival horizon, which measures how long the Bank would be able to fulfil its payment obligations in a severe stress scenario. The target survival horizon is twelve months, which means that the Bank would be able to meet its payment obligations and continue its business operations without disruption for the coming twelve months under stressed conditions. The minimum requirement is that the survival horizon must at all times exceed nine months. The stress scenario includes, among other things, the assumption of payment disruptions in the loan portfolio, no access to market funding, early termination of all callable funding transactions and severe decline of asset value in the liquidity buffer. At year-end 2016, the survival horizon was 443 days (2015: 431 days).
35
Development of the survival horizon
Days
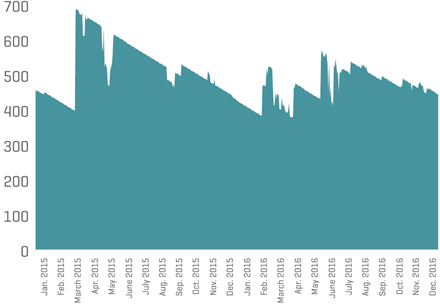
In addition, the Bank requires that the liquidity position should be strong enough to secure the highest possible issuer credit rating by S&P and Moody’s and fulfil the liquidity coverage ratio (LCR) and net stable funding ratio (NSFR) requirements as specified in the Capital Requirements Regulation of the European Union. At year-end 2016 the LCR was approximately 3500% (2015: 1200%) and the NFSR approximately 160% (2015: 150%). The minimum requirement for NSFR and LCR is 100% for regulated banks once the Basel III regulations are fully implemented.
The Bank’s liquidity buffer comprises unencumbered cash, deposits and securities mainly denominated in EUR, USD and the Nordic currencies. In order to ensure that the market value and liquidity of the buffer is preserved during adverse market conditions, the Bank has set strict rules for the composition of the buffer. As such, the buffer must include a minimum level of High Quality Liquid Assets as defined in the EU capital requirement regulation and a minimum level of assets in the internal rating categories corresponding to at least AA- from S&P and Aa3 from Moody’s. Furthermore, the buffer must comprise a certain level of assets eligible as repo collateral in central banks. The Bank does not have direct access to central bank repo facilities but can repo its bond securities via intermediating banks.
The maturity profile of the liquidity buffer is structured to fulfil the Bank’s requirement that the expected net cash outflow during the next three months must be covered by maturing investments in the liquidity buffer.
TABLE 8. Composition of the liquidity buffer
| | | | | | | | |
| | |
| | | 31 DEC 2016 | | 31 DEC 2015 |
| | | | |
| | | EUR MILLION | | % | | EUR MILLION | | % |
Cash and cash equivalents | | 356 | | 3% | | 678 | | 7% |
Securities issued or guaranteed by sovereigns, public sector entities and supranational institutions | | 3,273 | | 29% | | 3,269 | | 36% |
Covered bonds | | 2,570 | | 23% | | 2,123 | | 23% |
Securities issued by financial institutions, excluding covered bonds | | 1,544 | | 14% | | 1,164 | | 13% |
Securities received as collateral | | 3,354 | | 30% | | 1,843 | | 20% |
TOTAL | | 11,097 | | 100% | | 9,077 | | 100% |
36
Diversification is a key objective of the Bank’s funding and liquidity management. The Bank strives to diversify its borrowing in terms of currencies, maturities, instruments and investor types in order to avoid excessive reliance on individual markets and funding sources. Through regular benchmark issues, the Bank aims to secure broad market access. The annual funding plan is based on the projected twelve-month liquidity requirement and the projected size of the liquidity buffer. The funding plan is regularly adjusted to reflect changes in the liquidity requirement.
The following graph shows the maturity profile of liquid assets and the annual scheduled payments on loans outstanding compared to payments on the Bank’s funding. Payments on loans outstanding are shown until the contractual maturity of the loans. Repayment of funding is shown until the first possible early repayment date and taking into account the cash flow from associated swaps. Short-term amounts owed to credit institutions predominantly comprise cash collateral received from swap counterparties.
Maturity profile of funding, lending and liquid assets
As of 31 December 2016
EUR m
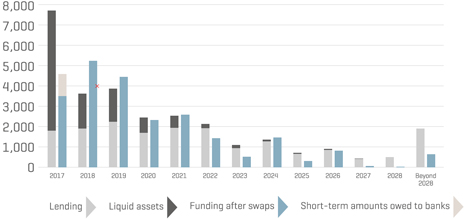
A breakdown of the Bank’s financial assets and liabilities by maturity at year-end 2016 is presented in Note 20.
The Bank has a contingency plan in place which defines the actions to be taken should the Bank encounter a liquidity shortfall in an emergency situation. The President decides on the activation of the contingency plan and subsequently informs the Board of Directors.
Operational risk
The Bank defines operational risk as the risk of direct or indirect losses or damaged reputation due to failure attributable to technology, employees, processes, procedures or physical arrangements, including external events and legal risks.
Operational risk management
NIB’s operational risk management focuses on proactive measures in order to ensure business continuity, the accuracy of information used internally and reported externally, the expertise and integrity of the Bank’s personnel and its adherence to established rules and procedures, as well as on security arrangements to protect the physical and ICT infrastructure of the Bank. The Bank’s operational risk management policy is set by the Board of Directors. The policy is complemented by an operational risk management framework comprising the guiding principles for the identification, assessment, monitoring and control of the operational risks that the Bank faces or may face.
The day-to-day management of operational risk is performed across the organisation and is primarily the responsibility of each function. Emphasis is put on training the Bank’s personnel in risk awareness. In the risk and control self-assessment (RCSA) process, risks are identified and their impact assessed by the various functions for their respective fields of expertise. Focus is placed on identifying key risks and assessing the quality of risk detection and risk mitigation in order to ensure compliance with the Bank’s policies and guidelines. Operational risks are also identified through analysis of results obtained from the Bank’s incident reporting system. Recent priority areas include increased focus on risks in the Bank’s key processes and further development of reporting on material operational risks and trends. No material losses were incurred as a result of operational risks during the year. The Bank strives to continuously build expertise in operational risk management concepts and tools.
37
Compliance risk
Compliance risk is the risk of legal or regulatory sanctions, material financial loss, or loss to reputation due to failure to comply with laws, rules and standards.
The Bank is committed to follow best practices and market standards in the areas of accountability, governance, corporate social responsibility, transparency and business ethics in order to promote sustainability. In managing compliance risk, the Bank places particular emphasis on preventing corruption, money laundering and the financing of terrorism. The Bank’s procedures are aligned with the International Financial Institutions (IFI) Uniform Framework for Preventing and Combating Fraud and Corruption, which the Bank has endorsed.
For NIB, integrity means adherence to the Bank’s ethical values. The Bank focuses on preventive measures as the most effective way to avoid becoming involved with unethical borrowers and projects, money laundering, terrorist financing or tax evasion. Particular emphasis is put on knowing the customers and training the staff to ensure awareness and vigilance. All new clients are screened thoroughly in the Bank’s integrity due diligence processes. Monitoring of integrity risks in the loan portfolio is part of the Bank’s regular follow-up procedures.
The Office of the Chief Compliance Officer oversees and coordinates matters relating to integrity and reputational risks and provides independent expert advice to management and the Board of Directors in compliance matters. Allegations of fraud and corruption in relation to the Bank’s projects or counterparties are investigated by the Office of the Chief Compliance Officer (OCCO) and sanctioning is decided upon by the newly established Sanctions Panel.
The Chief Compliance Officer reports to the President and has unrestricted access to the chairpersons of the Board of Directors and the Control Committee. He reports to the Board of Directors on serious fraud and corruption investigations and once a year on other integrity and compliance matters. Reports on anti-corruption and compliance matters are presented to the Control Committee at its regular meetings.
Once a year, the Office of the Chief Compliance Officer publishes its Integrity Report on the Bank’s website.
38
NOTE 3: SEGMENT INFORMATION
Operating segments
Operating segments are reported in a manner consistent with the internal reporting provided to the chief operating decision maker (“CODM”), who is responsible for allocating resources and assessing the performance of the operating segments. The CODM at NIB is the President. Segment results that are reported to the management include items directly attributable to that segment as well as other items allocated on a reasonable basis. In its segment reporting, NIB divides its operations into two major segments: lending and treasury operations. Treasury operations consist of Asset and Liability Management and Portfolio Management.
2016
| | | | | | | | | | |
(AMOUNTS IN EUR 1,000) | | LENDING | | ASSET AND LIABILITY MANAGEMENT | | PORTFOLIO MANAGEMENT | | TREASURY TOTAL | | TOTAL |
Net interest income | | 150,404 | | 28,224 | | 63,181 | | 91,405 | | 241,809 |
Commission income and fees received | | 10,531 | | 2,478 | | 115 | | 2,593 | | 13,124 |
Commission expense and fees paid | | -165 | | -1,273 | | -587 | | -1,859 | | -2,025 |
Net profit on financial operations | | 825 | | 14,416 | | 8,051 | | 22,467 | | 23,292 |
Foreign exchange gains and losses | | – | | 22 | | – | | 22 | | 22 |
Administrative expenses | | -27,661 | | -10,215 | | -4,378 | | -14,592 | | -42,254 |
Depreciation | | -1,440 | | -615 | | -264 | | -879 | | -2,319 |
Impairment of loans | | -19,839 | | – | | – | | – | | -19,839 |
Profit/loss for the year | | 112,654 | | 33,037 | | 66,119 | | 99,156 | | 211,810 |
Assets | | 16,684,812 | | 6,921,645 | | 6,571,873 | | 13,493,518 | | 30,178,330 |
Liabilities and equity | | 16,684,812 | | 6,921,645 | | 6,571,873 | | 13,493,518 | | 30,178,330 |
2015
| | | | | | | | | | |
(AMOUNTS IN EUR 1,000) | | LENDING | | ASSET AND LIABILITY MANAGEMENT | | PORTFOLIO MANAGEMENT | | TREASURY TOTAL | | TOTAL |
Net interest income | | 145,884 | | 30,783 | | 70,109 | | 100,891 | | 246,776 |
Commission income and fees received | | 9,379 | | 2,839 | | – | | 2,839 | | 12,218 |
Commission expense and fees paid | | -161 | | -1,356 | | -695 | | -2,051 | | -2,212 |
Net profit on financial operations | | 2,567 | | 9,147 | | -193 | | 8,954 | | 11,521 |
Foreign exchange gains and losses | | – | | 82 | | – | | 82 | | 82 |
Administrative expenses | | -28,860 | | -9,016 | | -3,864 | | -12,881 | | -41,740 |
Depreciation | | -5,705 | | -2,123 | | -910 | | -3,033 | | -8,737 |
Impairment of loans | | -2,509 | | – | | – | | – | | -2,509 |
Profit/loss for the year | | 120,596 | | 30,356 | | 64,446 | | 94,802 | | 215,398 |
Assets | | 15,672,071 | | 5,559,295 | | 6,080,081 | | 11,639,376 | | 27,311,447 |
Liabilities and equity | | 15,672,071 | | 5,559,295 | | 6,080,081 | | 11,639,376 | | 27,311,447 |
39
Geographical segments
The table below is based on the region where the borrowers reside, according to the domicile of the borrower’s group headquarters.
| | | | | | | | |
| | |
(AMOUNTS IN EUR 1,000) | | 2016 NET INTEREST INCOME | | | 2015 NET INTEREST INCOME | |
Member countries | | | | | | | | |
Denmark | | | 16,062 | | | | 14,520 | |
Estonia | | | 1,927 | | | | 1,922 | |
Finland | | | 28,101 | | | | 30,650 | |
Iceland | | | 6,129 | | | | 5,438 | |
Latvia | | | 2,227 | | | | 2,981 | |
Lithuania | | | 5,659 | | | | 5,036 | |
Norway | | | 23,672 | | | | 20,755 | |
Sweden | | | 39,085 | | | | 32,093 | |
Total, member countries | | | 122,863 | | | | 113,394 | |
| | |
Non-member countries | | | | | | | | |
Africa | | | 1,276 | | | | 1,772 | |
Asia | | | 9,225 | | | | 10,698 | |
Europe and Eurasia | | | 10,812 | | | | 13,845 | |
Latin America | | | 5,782 | | | | 5,573 | |
Middle East | | | 447 | | | | 601 | |
Total, non-member countries | | | 27,541 | | | | 32,490 | |
Total, net interest income from lending | | | 150,404 | | | | 145,884 | |
40
NOTE 4: NET INTEREST INCOME
| | | | | | | | |
| | |
(AMOUNTS IN EUR 1,000) | | 2016 | | | 2015 | |
Interest income | | | | | | | | |
Cash and cash equivalents | | | -1,643 | | | | -309 | |
Placements with credit institutions more than 6 mths | | | -147 | | | | – | |
Debt securities | | | 70,117 | | | | 81,526 | |
Loans outstanding | | | 242,510 | | | | 256,268 | |
Other interest income | | | 1,019 | | | | 1,296 | |
Total, interest income | | | 311,856 | | | | 338,781 | |
Of which, interest income from financial assets that is not measured at fair value through the income statement | | | 285,449 | | | | 308,583 | |
Interest expense | | | | | | | | |
Short-term amounts owed to credit institutions | | | 1,345 | | | | -1,310 | |
Long-term amounts owed to credit institutions | | | -60 | | | | -9 | |
Short-term repurchase agreements | | | -436 | | | | – | |
Debts evidenced by certificates | | | 487,060 | | | | 590,836 | |
Swap contracts and other interest expenses, net | | | -417,861 | | | | -497,511 | |
Total, interest expense | | | 70,047 | | | | 92,005 | |
Of which, interest expense from financial liabilities that is not measured at fair value through the income statement | | | 166,192 | | | | 122,710 | |
Net interest income | | | 241,809 | | | | 246,776 | |
Interest income and expense includes amounts from related parties as described in note 23.
41
NOTE 5: COMMISSION INCOME AND FEES RECEIVED
| | | | | | | | |
| | |
(AMOUNTS IN EUR 1,000) | | 2016 | | | 2015 | |
Commitment fees | | | 2,584 | | | | 2,053 | |
Loan disbursement fees | | | 7,151 | | | | 7,239 | |
Guarantee commissions | | | – | | | | – | |
Early repayment fees | | | 3,095 | | | | 2,549 | |
Commissions on lending of securities | | | 293 | | | | 377 | |
Total, commission income and fees received | | | 13,124 | | | | 12,218 | |
42
NOTE 6: NET PROFIT ON FINANCIAL OPERATIONS
| | | | | | | | |
| | |
(AMOUNTS IN EUR 1,000) | | 2016 | | | 2015 | |
Financial instruments held at fair value, realised gains and losses | | | 16,096 | | | | -1,647 | |
Financial instruments held at fair value, unrealised gains and losses | | | -280 | | | | -9,517 | |
Financial instruments held at amortised cost, realised gains and losses | | | 1,062 | | | | 627 | |
Adjustment to hedge accounting, unrealised gains and losses of fair value hedges | | | 4,271 | | | | 20,667 | |
Repurchase of NIB bonds, other items | | | 2,142 | | | | 1,391 | |
Net profit on financial operations | | | 23,292 | | | | 11,521 | |
This year’s result includes one off gains of EUR 16.0 million related to cost compensation from counterparties for the implementation of two way credit support annexes.
43
NOTE 7: PERSONNEL EXPENSES
| | | | | | | | |
| | |
(AMOUNTS IN EUR 1,000) | | 2016 | | | 2015 | |
Salaries and other remuneration | | | 24,299 | | | | 25,196 | |
Social security and employee insurances | | | 2,793 | | | | 2,322 | |
Pensions | | | 7,412 | | | | 7,739 | |
Other personnel expenses | | | 3,197 | | | | 3,071 | |
Gross personnel expenses | | | 37,700 | | | | 38,328 | |
Host country reimbursement according to agreement with the Finnish Government | | | -9,064 | | | | -8,403 | |
Net personnel expenses | | | 28,637 | | | | 29,925 | |
The personnel expenses include costs for the Board of Directors and the Control Committee. In 2015, an extra provision of EUR 2 million was reserved for the purpose of planning, training and adapting to the changing banking industry requirements.
| | | | | | | | |
| | |
NUMBER OF EMPLOYEES IN PERMANENT POSITIONS | | 2016 | | | 2015 | |
Average number of employees | | | 192 | | | | 188 | |
Average age of employees | | | 47 | | | | 47 | |
Average period (years) of employment | | | 12 | | | | 12 | |
Distribution by gender as of 31 Dec | | | | | | | | |
All employees | | | 195 | | | | 189 | |
Female | | | 85 | | | | 82 | |
Male | | | 110 | | | | 106 | |
Executive Committee (including the President) | | | | | | | | |
Female | | | 1 | | | | 1 | |
Male | | | 6 | | | | 5 | |
Professional staff | | | | | | | | |
Female | | | 67 | | | | 60 | |
Male | | | 99 | | | | 92 | |
Clerical staff | | | | | | | | |
Female | | | 17 | | | | 21 | |
Male | | | 5 | | | | 9 | |
The figures in the table above comprise of staff in permanent positions including the President.
Compensation for the Board of Directors, the Control Committee, the President and the Executive Committee
Compensation for the Board of Directors (BoD) and the Control Committee (CC) is set by the Board of Governors (BoG). The compensation consists of fixed annual remuneration and an attendee allowance. The members of the BoD and the CC are also entitled to reimbursement of travel and accommodation expenses and a daily allowance in accordance with the Bank’s travel policy.
44
The BoD decides on the appointment and remuneration of the President. As a rule, the President is appointed on a fixed-term contract for five years at a time, but the existing contract can also be prolonged for a shorter period. The current President’s contract commenced on 1 April 2012 and was due to expire on 31 March 2017, however the contract has been extended until 31 March 2020. The President decides upon the employment of the Executive Committee (ExCo) members. The members of the ExCo are normally employed for an indefinite period of time. The period of notice is six months. The President is authorised by the BoD to make decisions regarding compensation within the scope of the Staff Policy, Staff Regulations and the Financial Plan. The remuneration package for the members of the ExCo includes a fixed base salary and customary taxable benefits, which are in principle the same for all staff at the managerial level. In addition to this remuneration package, the members of the ExCo enjoy other benefits common to all staff (e.g. health care, supplementary group pension, insurance coverage and staff loans). The Bank can pay performance premiums of up to three months’ salary for excellent and extraordinary performance and are presented in the table below if awarded. The maximum cost for the Bank of performance premiums is a total of 3% of the estimated salary costs.
| | | | | | | | |
| | |
SALARIES AND OTHER REMUNERATION IN EUR 1,000 | | 2016 | | | 2015 | |
Board of Directors (remuneration and attendee allowance) | | | | | | | | |
Chairman | | | 15 | | | | 15 | |
Other Directors and Alternates (15 persons) | | | 86 | | | | 90 | |
Control Committee | | | | | | | | |
Chairman | | | 5 | | | | 5 | |
Other members (9 persons) | | | 17 | | | | 19 | |
President | | | 751 | | | | 705 | |
Members of the Executive Committee (6 persons) | | | 2,447 | | | | 2,386 | |
Other staff | | | 20,978 | | | | 21,976 | |
Total | | | 24,299 | | | | 25,196 | |
The executive committee comprised of five persons during the period from 1 October 2014 to 31 March 2015.
Pension obligations
NIB is responsible for arranging pension security for its employees. The current pension arrangement consists of pensions based on the Finnish state pension system (VaEL Pension) as the basis for the pension benefits. The VaEL Pension is calculated on the basis of the employee’s annual pensionable income and the applicable age-linked pension accrual rate. The employer’s pension contribution in 2016 was 15.85% of the pensionable income. The employee’s pension contribution was either 5.70% or 7.20%, depending on the employee’s age. NIB pays this contribution for its permanent staff, and it is taxed as a benefit for the employee. The State pension is accounted for as a defined contribution plan.
In addition to the VaEL Pension, the Bank has taken out a supplementary group pension insurance policy for all its permanently employed staff, including the President. This pension insurance is based on the principle of a defined contribution. The insurance premium, 6.50%, is calculated on the basis of the employee’s taxable income and paid until the age of 63. The supplementary pension is also accounted for as a defined contribution plan
The employer’s pension contribution regarding the President amounted to EUR 216,057 (219,706) of which EUR 42,964 (40,164) comprised supplementary pension premiums. The corresponding figures for the ExCo members were EUR 811,950 (823,084) and EUR 266,495 (251,342) respectively.
Staff loans
Staff loans can be granted to permanently employed staff members who have been employed by the Bank for a period of at least one year. The staff loans are granted by a commercial bank, subject to a recommendation from NIB.
At present, the maximum loan amount is EUR 200,000. The employee pays interest on the loan in accordance with the official base rate established by the Ministry of Finance in Finland or 0.25% whichever is the higher. The same interest rates, terms and conditions are applicable to all the employees of the Bank, including the President and the ExCo members.
As of 31 December 2016, there were no (-) outstanding staff loans to the President or the ExCo members.
45
Additional benefits for expatriate personnel
Professional staff (including Executive Committee members) who move to Finland for the sole purpose of taking up employment at the Bank are entitled to certain expatriate benefits, such as an expatriate allowance and a spouse/family allowance. In addition, NIB assists the expatriate in finding accommodation, usually by renting a house or a flat in its own name. The staff member reimburses the Bank for a part of the rent, which is equal to at least the taxable value of the accommodation benefit established annually by the Finnish National Board of Taxes.
Host country reimbursement
According to the Host Country Agreement between the government of the Republic of Finland and the Bank the amount of tax withheld in advance on the salaries of the Bank’s staff and the final tax on salaries collected shall be repaid to the Bank. Amounts repaid contribute to the surplus the Bank may distribute among the member countries.
46
NOTE 8: OTHER GENERAL ADMINISTRATIVE EXPENSES
| | | | | | | | |
| | |
(AMOUNTS IN EUR 1,000) | | 2016 | | | 2015 | |
IT | | | 8,256 | | | | 6,645 | |
Office premises | | | 1,823 | | | | 1,430 | |
Travel | | | 1,221 | | | | 1,305 | |
Communications and marketing | | | 386 | | | | 380 | |
Other administrative expenses | | | 3,228 | | | | 3,369 | |
Cost coverage, NDF and NEFCO (Note 23) | | | -905 | | | | -969 | |
Rental and other income | | | -393 | | | | -344 | |
Total | | | 13,617 | | | | 11,815 | |
| | |
| | | | | | | | | |
| Remuneration to the auditors | | 2016 | | | 2015 | |
Audit fee | | | 97 | | | | 64 | |
Other audit-related service fees | | | 87 | | | | 66 | |
Total remuneration | | | 184 | | | | 130 | |
47
NOTE 9: NET LOAN LOSSES
| | | | | | | | |
| | |
(AMOUNTS IN EUR 1,000) | | 2016 | | | 2015 | |
Increase in provisions | | | 47,343 | | | | 5,807 | |
Reversals of previous provisions | | | -25,580 | | | | -88 | |
Net impairment losses | | | 21,763 | | | | 5,719 | |
Recoveries on claims | | | -1,924 | | | | -3,210 | |
Net loan losses | | | 19,839 | | | | 2,509 | |
See also Note 11 ‘Loans outstanding and guarantee commitments’.
48
NOTE 10: DEBT SECURITIES
The debt securities were issued by the following counterparties:
| | | | |
| | |
(AMOUNTS IN EUR MILLION) | | 2016 | | 2015 |
Governments | | 1,103 | | 1,219 |
Public institutions | | 1,778 | | 1,623 |
Other | | 3,692 | | 3,238 |
Total, debt securities | | 6,572 | | 6,080 |
The distribution of the Bank’s debt security portfolios was as follows:
| | | | | | | | |
| | | BOOK VALUE | | FAIR VALUE |
| | | | |
| (AMOUNTS IN EUR MILLION) | | 2016 | | 2015 | | 2016 | | 2015 |
Held at fair value | | 4,157 | | 3,154 | | 4,157 | | 3,154 |
Held at amortised cost | | 2,416 | | 2,926 | | 2,534 | | 3,057 |
Total, debt securities | | 6,572 | | 6,080 | | 6,690 | | 6,211 |
Of these debt securities, EUR 4,413 (4,345) million is at fixed interest rates and EUR 2,159 (1,735) million at floating interest rates. The fair values are disclosed in Note 19.
49
NOTE 11: LOANS OUTSTANDING AND GUARANTEE COMMITMENTS
| | | | |
| | |
(AMOUNTS IN EUR MILLION) | | 2016 | | 2015 |
Ordinary loans | | 15,160 | | 13,707 |
Project investment loans | | 1,311 | | 1,731 |
Environmental investment loans | | 30 | | 43 |
Total loans outstanding before impairment and hedge accounting | | 16,501 | | 15,481 |
Individual assessed impairments | | -97 | | -55 |
Collectively assessed impairments | | -42 | | -61 |
Total impairments | | -139 | | -116 |
Adjustment to hedge accounting | | 278 | | 263 |
Total loans outstanding | | 16,640 | | 15,627 |
The fair values of amount above are disclosed in Note 19.
The Bank may grant loans and provide guarantees under its Ordinary Lending or under special lending facilities. The special lending facilities, which carry member country guarantees, consist of Project investment loans (PIL) and Environmental investment loans (MIL).
Ordinary Lending includes loans and guarantees within and outside the member countries. The Bank’s Ordinary Lending ceiling corresponds to 250% of its authorised capital and accumulated general reserves and amounts to EUR 21,244 million following the allocations of the year’s profit in accordance with the Board of Directors’ proposal.
Project Investment Loans are granted for financing creditworthy projects in the emerging markets of Africa, Asia, Europe and Eurasia, Latin America and the Middle East. The Bank’s Statutes permit loans to be granted and guarantees to be issued under the PIL facility up to an amount corresponding to EUR 4,000 million. The member countries guarantee the PIL loans up to a total amount of EUR 1,800 million. The Bank, however, will assume 100% of any losses incurred under an individual PIL loan, up to the amount available at any given time in the Special Credit Risk Fund for PIL. Only thereafter would the Bank be able to call on the member countries’ guarantees according to the following principle: the member countries guarantee 90% of each loan under the PIL facility up to a total amount of EUR 1,800 million. Payment under the member countries’ guarantees would take place at the request of the Board of Directors, as provided for under an agreement between the Bank and each individual member country.
The Bank is authorised to grant special Environmental Investment Loans, originally up to the amount of EUR 300 million, for the financing of environmental projects in the areas adjacent to the member countries. The Bank’s member countries guarantee 100% of the MIL facility.
The table below presents the movement schedule of loans before impairment and hedge accounting adjustments.
2016
| | | | | | | | |
(AMOUNTS IN EUR MILLION) | | ORDINARY LOANS | | PROJECT INVESTMENT LOANS | | ENVIRONMENTAL INVESTMENT LOANS | | TOTAL |
Opening balance | | 13,707 | | 1,731 | | 43 | | 15,481 |
Lending for the year | | 3,367 | | 4 | | 3 | | 3,373 |
Amortisation, write-offs, redemption, other | | -1,990 | | -458 | | -16 | | -2,465 |
Translation differences | | 77 | | 34 | | 1 | | 112 |
Closing balance | | 15,160 | | 1,311 | | 30 | | 16,501 |
Adjustment to hedge accounting | | | | | | | | 278 |
Loan impairments (see below) | | | | | | | | -139 |
Net balance | | | | | | | | 16,640 |
50
2015
| | | | | | | | |
(AMOUNTS IN EUR MILLION) | | ORDINARY LOANS | | PROJECT INVESTMENT LOANS | | ENVIRONMENTAL INVESTMENT LOANS | | TOTAL |
Opening balance | | 12,925 | | 1,878 | | 61 | | 14,864 |
Lending for the year | | 2,601 | | 115 | | – | | 2,716 |
Amortisation, write-offs, redemption, other | | -1,949 | | -381 | | -20 | | -2,350 |
Translation differences | | 130 | | 120 | | 2 | | 251 |
Closing balance | | 13,707 | | 1,731 | | 43 | | 15,481 |
Adjustment to hedge accounting | | | | | | | | 263 |
Loan impairments (see below) | | | | | | | | -116 |
Net balance | | | | | | | | 15,627 |
The loans outstanding of EUR 16,640 (15,627) million, includes medium-term notes (MTN) of EUR 295 (618) million. These are held at amortised cost unless they form part of a qualifying hedging relationship with a derivative. In a hedge accounting relationship, the MTNs are recognised at fair value.
Loans outstanding at floating interest rates amounted to EUR 13,228 (12,897) million, while those at fixed interest rates amounted to EUR 3,176 (2,529) million. There were no guarantee commitments (-) under Ordinary Lending as of 31 December 2016.
The Bank defines “Forbearance” as a concession granted to a counterparty for reasons of financial difficulties, i.e. a concession that would not otherwise be considered by the lender. Forbearance recognition is not limited to measures that give rise to a loss for the lender. Modification of the terms and conditions of the contract may include, for example, reduction of the interest rate, principal or accrued interest, or rescheduling of the payment dates of principal and/or interest, and has an actual effect on the future cash flows. Loan forbearance is granted on a selective basis and purposefully to avoid counterparty default in favour of the Bank’s collection opportunities. Counterparties under forbearance activities are moved to the watch list, and are subject to the impairment policies of the Bank. As of 31 December 2016, there were no Ordinary loans (2015: EUR 45.9 million) and EUR 118.3 (101.1) million of Project investment loans affected by forbearance. There were no impairments recorded for Ordinary loans as at 31 December 2016 (2015: EUR 45.9 million). The impairments recorded for Project investment loans amounted to EUR 20.9 million at 31 December 2016 (2015: EUR 46.2 million). The interest income on loans affected by forbearance amounted to EUR 4.2 million in 2016. See also “Credit risk monitoring” under Risk Management.
During 2016, the Bank adjusted its non-performing definition to be in line with the Basel’s definition for non-performing. As of 31 December 2016, there were three non-performing PIL loans totalling EUR 118.6 million. According to the prevailing definition, there was one non-performing MIL loan totalling EUR 14.8 million as of 31 December 2015, however using the new definition, the number of loans would have been five amounting to EUR 129.7 million. See also “Impairment of loans and receivables” under Accounting policies.
A total of EUR 139.4 (192.3) million has been deducted from the Bank’s loans outstanding and from lending claims in “other assets”. Specific allowances for impairment amounted to EUR 97.4 million and collectively assessed allowances amounted to EUR 42.0 million. During 2016, no (-) lending transactions were converted into claims under “other assets”. The following changes in allowances for impairment and effects of foreign currency movements are recognised in the statement of comprehensive income under “net loan losses“ and “foreign exchange gains and losses“.
Specific and collective allowances for impairment
2016
| | | | | | | | |
(AMOUNTS IN EUR MILLION) | | INDIVIDUALLY ASSESSED | | INDIVIDUALLY ASSESSED | | COLLECTIVELY ASSESSED | | |
| | | | |
| | | ORDINARY LOANS | | PROJECT INVESTMENT LOANS | | ALL LOANS | | TOTAL |
Opening balance | | 0 | | 55 | | 61 | | 116 |
New provisions | | – | | 47 | | – | | 47 |
Reversal of provisions | | – | | -6 | | -19 | | -26 |
Impairment losses through income statement (note 9) | | 0 | | 41 | | -19 | | 22 |
Translation differences | | – | | 2 | | – | | 2 |
Closing balance | | 0 | | 97 | | 42 | | 139 |
51
2015
| | | | | | | | |
(AMOUNTS IN EUR MILLION) | | INDIVIDUALLY ASSESSED | | INDIVIDUALLY ASSESSED | | COLLECTIVELY ASSESSED | | |
| | | | |
| | | ORDINARY LOANS | | PROJECT INVESTMENT LOANS | | ALL LOANS | | TOTAL |
Opening balance | | 0 | | 52 | | 55 | | 107 |
New provisions | | – | | – | | 6 | | 6 |
Reversal of provisions | | – | | – | | – | | 0 |
Impairment losses through income statement (note 9) | | 0 | | 0 | | 6 | | 6 |
Translation differences | | – | | 3 | | – | | 3 |
Closing balance | | 0 | | 55 | | 61 | | 116 |
As of 31 December 2016, loans agreed but not yet disbursed amounted to the following:
| | | | |
| | |
| (AMOUNTS IN EUR MILLION) | | 2016 | | 2015 |
Loans agreed but not yet disbursed | | | | |
Ordinary Loans | | 1,835 | | 936 |
Project Investment Loans | | 134 | | 230 |
Environmental Investment Loans | | 25 | | 27 |
Total, loans agreed but not yet disbursed | | 1,994 | | 1,193 |
The amounts set forth above for loans agreed but not yet disbursed include loans in considerable amounts where certain conditions, primarily interest rate conditions, may not yet have been finally approved.
Currency distribution of loans outstanding
| | | | | | | | | | | | |
| | | ORDINARY LOANS | | PROJECT INVESTMENT LOANS | | ALL LOANS 1 |
| | | | | | |
(NOMINAL AMOUNTS IN EUR MILLION) | | 2016 | | 2015 | | 2016 | | 2015 | | 2016 | | 2015 |
Currency | | | | | | | | | | | | |
Nordic currencies | | 6,119 | | 4,400 | | 57 | | 66 | | 6,177 | | 4,466 |
EUR | | 7,261 | | 7,574 | | 366 | | 509 | | 7,647 | | 8,111 |
USD | | 1,619 | | 1,556 | | 739 | | 1,046 | | 2,365 | | 2,616 |
Other currencies | | 161 | | 177 | | 51 | | 54 | | 215 | | 232 |
Total after individiual impairments | | 15,160 | | 13,707 | | 1,213 | | 1,676 | | 16,404 | | 15,426 |
Adjustment to hedge accounting | | 255 | | 249 | | 23 | | 13 | | 278 | | 263 |
Collective impairment | | | | | | | | | | -42 | | -61 |
Total, loans outstanding | | 15,415 | | 13,956 | | 1,236 | | 1,689 | | 16,640 | | 15,627 |
1 The total amount also includes EUR 30 (43) million in Environmental Investment Loans (MIL)
52
Distribution of loans outstanding and guarantees by various types of security
The following table shows loans outstanding, including guarantee commitments, distributed by type of security:
| | | | | | | | |
| | |
| | | 2016 | | 2015 |
(AMOUNTS IN EUR MILLION) | | AMOUNT | | SHARE IN % | | AMOUNT | | SHARE IN % |
Loans to or guaranteed by governments | | | | | | | | |
Loans to or guaranteed by member countries | | 278 | | | | 327 | | |
Loans to or guaranteed by other countries | | 968 | | | | 1,128 | | |
Loans to or guaranteed by governments, total | | 1,246 | | 7.6% | | 1,456 | | 9.4% |
Loans to or guaranteed by local authorities in member countries | | 2,593 | | 15.8% | | 1,642 | | 10.6% |
Loans to or guaranteed by companies owned 50% or more by member countries or local authorities in member countries | | 3,616 | | 22.0% | | 1,402 | | 9.1% |
Loans to or guaranteed by banks | | 1,422 | | 8.7% | | 1,258 | | 8.2% |
Loans backed by a lien or other security in property | | 1,124 | | 6.9% | | 1,109 | | 7.2% |
Loans with a guarantee from the parent company and other guarantees | | 940 | | 5.7% | | 810 | | 5.3% |
Loans with a negative pledge clause and other covenants | | 5,224 | | 31.8% | | 7,748 | | 50.2% |
Loans without formal security | | 96 | | 0.6% | | 0 | | 0.0% |
Lending Green Bonds | | 143 | | 0.9% | | 0 | | 0.0% |
Total | | 16,404 | | 100% | | 15,425 | | 100% |
Collective impairment | | -42 | | | | -61 | | |
Adjustment to hedge accounting | | 278 | | | | 263 | | |
Total, loans outstanding | | 16,640 | | | | 15,627 | | |
According to NIB’s Statutes, the member countries shall cover the Bank’s losses arising from failure of payment in connection with PIL loans up to the following amounts:
| | | | | | | | |
| | | | |
| | | 2016 | | | | 2015 | | |
(AMOUNTS IN EUR 1,000) | | AMOUNT OF GUARANTEE | | SHARE IN % | | AMOUNT OF GUARANTEE | | SHARE IN % |
Member country | | | | | | | | |
Denmark | | 377,821 | | 21.0% | | 377,821 | | 21.0% |
Estonia | | 13,139 | | 0.7% | | 13,139 | | 0.7% |
Finland | | 344,860 | | 19.2% | | 344,860 | | 19.2% |
Iceland | | 15,586 | | 0.9% | | 15,586 | | 0.9% |
Latvia | | 19,058 | | 1.1% | | 19,058 | | 1.1% |
Lithuania | | 29,472 | | 1.6% | | 29,472 | | 1.6% |
Norway | | 329,309 | | 18.3% | | 329,309 | | 18.3% |
Sweden | | 670,755 | | 37.3% | | 670,755 | | 37.3% |
Total | | 1 800,000 | | 100% | | 1 800,000 | | 100% |
According to NIB’s Statutes, the member countries shall cover 100% of the Bank’s losses arising from failure of payment in connection with MIL loans. The MIL loan facility has a statutory ceiling of EUR 300 million. Following the Board of Directors’ decision to call for payments under the MIL guarantees in 2014 due to non-payment of one MIL loan, all member countries made guarantee payments to the Bank.
The member countries’ total guarantee liabilities under the MIL facility are as follows after the guarantee payments as of 2 July 2014. Furthermore, in 2015 the Bank decided to call on the MIL guarantee due to non-payment of one MIL loan. The execution of the decision took place in 2016.
53
| | | | | | | | |
| | | |
| | | 2016 | | 2015 | | |
| | | | |
(AMOUNTS IN EUR 1,000) | | AMOUNT OF GUARANTEE | | SHARE IN % | | AMOUNT OF GUARANTEE | | SHARE IN % |
Member country | | | | | | | | |
Denmark | | 62,211 | | 23.4% | | 65,573 | | 23.4% |
Estonia | | 1,943 | | 0.7% | | 2,048 | | 0.7% |
Finland | | 45,587 | | 17.1% | | 48,051 | | 17.1% |
Iceland | | 2,828 | | 1.1% | | 2,981 | | 1.1% |
Latvia | | 2,818 | | 1.1% | | 2,971 | | 1.1% |
Lithuania | | 4,358 | | 1.6% | | 4,594 | | 1.6% |
Norway | | 54,413 | | 20.4% | | 57,354 | | 20.4% |
Sweden | | 92,031 | | 34.6% | | 97,005 | | 34.6% |
Total | | 266,191 | | 100% | | 280,577 | | 100% |
After the Board of Governors’ annual meeting in May 2016 concerning the adjustment and alignment of the Bank’s authorised capital, the Bank’s Governors have made a unanimous decision in autumn to adjust and align NIB’s authorised capital so that each member country’s share in percentage of paid-in capital and callable capital will be equal to its share of the authorised capital. The adjustment and alignment also concerns the member countries’ statutory guarantee shares in percentage for the Project Investment Loan facility (PIL) and the Environmental Investment Loan facility (MIL). In several member countries, the decision needs to be ratified by parliament before it enters into force. The changes are expected to be implemented first half of 2017.
54
NOTE 12: INTANGIBLE ASSETS, TANGIBLE ASSETS (PROPERTY AND EQUIPMENT)
| | | | |
| | |
| | | COMPUTER SOFTWARE DEVELOPMENT COSTS, TOTAL | | COMPUTER SOFTWARE DEVELOPMENT COSTS, TOTAL |
| | |
(AMOUNTS IN EUR 1,000) | | 2016 | | 2015 |
Intangible assets | | | | |
Acquisition value at the beginning of the year | | 27,581 | | 26,576 |
Acquisitions during the year | | 938 | | 1,005 |
Sales/disposals during the year | | – | | – |
Acquisition value at the end of the year | | 28,519 | | 27,581 |
| | |
Accumulated amortisation at the beginning of the year | | 27,581 | | 21,359 |
Amortisation for the year | | – | | 6,222 |
Accumulated amortisation on sales/disposals during the year | | – | | – |
Accumulated amortisation at the end the of the year | | 27,581 | | 27,581 |
Net book value | | 938 | | 0 |
During 2015 an impairment charge of EUR 4.2 million was booked in relation to intangible assets. The additions in 2016 relate mainly to a new integrated Treasury Front office, Back office, Risk & Accounting IT solution (FOBORA) which is in the implementation phase.
2016
| | | | | | |
| | | |
(AMOUNTS IN EUR 1,000) | | BUILDINGS | | OFFICE EQUIPMENT AND OTHER TANGIBLE ASSETS | | TOTAL |
Tangible assets | | | | | | |
Acquisition value at the beginning of the year | | 33,769 | | 22,453 | | 56,222 |
Acquisitions during the year | | – | | 704 | | 704 |
Sales/disposals during the year | | – | | -182 | | -182 |
Acquisition value at the end of the year | | 33,769 | | 22,975 | | 56,744 |
| | | |
Accumulated depreciation at the beginning of the year | | 11,444 | | 16,419 | | 27,863 |
Depreciation for the year | | 673 | | 1,646 | | 2,319 |
Accumulated depreciation on sales/disposals during the year | | – | | -161 | | -161 |
Accumulated depreciation at the end of the year | | 12,117 | | 17,904 | | 30,021 |
Net book value | | 21,652 | | 5,071 | | 26,723 |
On each closing date, the Bank’s assets are assessed to determine whether there is any indication of an asset’s impairment. As of 31 December 2016, there were no indications of impairment of the intangible or tangible assets.
55
2015
| | | | | | |
(AMOUNTS IN EUR 1,000) | | BUILDINGS | | OFFICE EQUIPMENT AND OTHER TANGIBLE ASSETS | | TOTAL |
Tangible assets | | | | | | |
Acquisition value at the beginning of the year | | 33,769 | | 20,017 | | 53,786 |
Acquisitions during the year | | – | | 2,572 | | 2,572 |
Sales/disposals during the year | | – | | -136 | | -136 |
Acquisition value at the end of the year | | 33,769 | | 22,453 | | 56,222 |
| | | |
Accumulated depreciation at the beginning of the year | | 10,771 | | 14,692 | | 25,462 |
Depreciation for the year | | 673 | | 1,842 | | 2,515 |
Accumulated depreciation on sales/disposals during the year | | – | | -115 | | -115 |
Accumulated depreciation at the end of the year | | 11,444 | | 16,419 | | 27,863 |
Net book value | | 22,326 | | 6,034 | | 28,360 |
56
NOTE 13: DEPRECIATION
| | | | |
| | |
(AMOUNTS IN EUR 1,000) | | 2016 | | 2015 |
Intangible assets (Note 12) | | 0 | | 6,222 |
Tangible assets (Note 12) | | 2,319 | | 2,515 |
Buildings | | 673 | | 673 |
Office equipment | | 1,646 | | 1,842 |
Total | | 2,319 | | 8,737 |
During 2015 impairment charge of EUR 4.2 million and EUR 0.3 million were booked in relation to intangible assets and office equipment respectively.
57
NOTE 14: OTHER ASSETS
Derivatives are included in “Other assets”.
| | | | |
| | |
(AMOUNTS IN EUR MILLION) | | 2016 | | 2015 |
Interest rate swaps at floating rates | | 6,184 | | 6,200 |
Interest rate swaps at fixed rates | | 14,626 | | 12,073 |
Currency swaps at floating rates | | 11,594 | | 11,309 |
Currency swaps at fixed rates | | 6,998 | | 6,686 |
Total, nominal amount | | 39,401 | | 36,270 |
Netting of nominal amount per derivative | | -37,755 | | -34,358 |
Derivative receivables, net | | 1,647 | | 1,912 |
Adjustment to hedge accounting and changes in fair value of non-hedging derivatives | | 510 | | 646 |
Derivative instruments | | 2,157 | | 2,558 |
Receivables from defaulted counterparties | | 2 | | 6 |
Other | | 10 | | 17 |
Total | | 2,170 | | 2,581 |
Derivatives are carried at fair value in the statement of financial position net per contract. Thus, swap contracts with a positive net fair value are recognised in the statement of financial position under “Other assets”, while swap contracts with a negative net fair value are recognised under “Other liabilities”.
Derivative instruments net exposure after collaterals
| | | | |
| | |
(AMOUNTS IN EUR MILLION) | | 2016 | | 2015 |
Derivative instruments in financial position | | 2,157 | | 2,558 |
Netting by counterparty | | -913 | | -795 |
Derivative instruments net per counterparty | | 1,244 | | 1,763 |
Accrued interest net per counterparty | | 97 | | 97 |
Net exposure before collaterals | | 1,341 | | 1,861 |
Collateral received | | -1,212 | | -1,725 |
Net exposure | | 130 | | 135 |
See also Risk Management, Credit Risk, Derivatives.
58
NOTE 15: DEBTS EVIDENCED BY CERTIFICATES AND SWAPS
At year-end, the Bank’s borrowings evidenced by certificates were distributed between the currencies shown in the table below. The table also demonstrates the distribution of borrowings by currency on an after-swap nominal basis.
| | | | | | | | | | | | | | | | | | | | | | | | |
| | | BORROWING | | | SWAP CONTRACTS PAYABLE/RECEIVABLE | | | NET CURRENCY | |
| | | | | | |
(AMOUNTS IN EUR MILLION) | | 2016 | | | 2015 | | | 2016 | | | 2015 | | | 2016 | | | 2015 | |
Currency | | | | | | | | | | | | | | | | | | | | | | | | |
USD | | | 11,039 | | | | 9,739 | | | | -7,243 | | | | -5,169 | | | | 3,796 | | | | 4,570 | |
AUD | | | 2,579 | | | | 2,369 | | | | -2,579 | | | | -2,369 | | | | – | | | | – | |
NZD | | | 2,095 | | | | 1,821 | | | | -2,095 | | | | -1,821 | | | | – | | | | – | |
EUR | | | 2,222 | | | | 1,158 | | | | 8,547 | | | | 8,490 | | | | 10,769 | | | | 9,648 | |
GBP | | | 1,127 | | | | 1,144 | | | | -1,127 | | | | -1,144 | | | | – | | | | – | |
JPY | | | 567 | | | | 559 | | | | -563 | | | | -548 | | | | 4 | | | | 11 | |
Nordic currencies | | | 2,667 | | | | 2,175 | | | | 5,442 | | | | 2,901 | | | | 8,110 | | | | 5,076 | |
Other currencies | | | 1,134 | | | | 1,272 | | | | -922 | | | | -1,051 | | | | 211 | | | | 220 | |
Total | | | 23,430 | | | | 20,238 | | | | -541 | | | | -712 | | | | 22,890 | | | | 19,526 | |
Adjustment to hedge accounting and changes in fair value of non-hedging derivatives | | | 477 | | | | 624 | | | | -172 | | | | -365 | | | | 305 | | | | 259 | |
Total, issued debt securities | | | 23,907 | | | | 20,862 | | | | -713 | | | | -1,077 | | | | 23,195 | | | | 19,785 | |
The table set forth above includes the following medium-term note (MTN) programmes: 140 (124) borrowing transactions in the equivalent amount of EUR 7,354 (5,862) million entered into under the Bank’s euro MTN programme; 17 (11) borrowing transactions in the equivalent amount of EUR 10,955 (9,706) million under the Bank’s US MTN programmes; and 44 (37) borrowing transactions in the equivalent amount of EUR 4,626 (4,171) million under the Bank’s Australian MTN programme. There were no borrowing transactions outstanding under the Bank’s Swedish MTN programme during the years 2016 and 2015. The Bank has established a EUR 2,000 million commercial paper programme in Europe.
Of debt securities issued, the amount of EUR 1,796 (1,402) million is at floating interest rates, while EUR 21,578 (18,725) million is at fixed interest rates and EUR 0 (64) million is in short-term discounted papers. Of the other borrowing transactions, the amount of EUR 10 (10) million is at floating interest rates, while EUR 47 (37) million is at fixed interest rates.
59
NOTE 16: OTHER LIABILITIES
Derivatives are included in “Other liabilities”.
| | | | | | | | |
| | |
(AMOUNTS IN EUR MILLION) | | 2016 | | | 2015 | |
Interest rate swaps at floating interest rates | | | 16,407 | | | | 14,427 | |
Interest rate swaps at fixed interest rates | | | 4,404 | | | | 3,847 | |
Currency swaps at floating interest rates | | | 17,354 | | | | 16,929 | |
Currency swaps at fixed rates | | | 718 | | | | 327 | |
Total, nominal amount | | | 38,884 | | | | 35,529 | |
Netting of nominal amount per derivative | | | -37,778 | | | | -34,329 | |
Derivative payables, net | | | 1,106 | | | | 1,200 | |
Adjustment to hedge accounting and changes in fair value of non-hedging derivatives | | | 338 | | | | 281 | |
Derivative instruments | | | 1,444 | | | | 1,481 | |
Other | | | 11 | | | | 10 | |
Total | | | 1,456 | | | | 1,491 | |
Derivatives are carried at fair value in the statement of financial position net per contract. Thus, swap contracts with a positive net fair value are recognised in the statement of financial position under “Other assets”, while swap contracts with a negative net fair value are recognised under “Other liabilities”.
Derivative instruments net exposure after collaterals
| | | | | | | | |
| | |
(AMOUNTS IN EUR MILLION) | | 2016 | | | 2015 | |
Derivative instruments in financial position | | | 1,444 | | | | 1,481 | |
Netting by counterparty | | | -913 | | | | -795 | |
Derivative instruments net per counterparty | | | 532 | | | | 686 | |
Accrued interest net per counterparty | | | -72 | | | | -79 | |
Net exposure before collaterals | | | 460 | | | | 607 | |
Collateral given | | | -207 | | | | -94 | |
Net exposure | | | 252 | | | | 513 | |
See also Risk Management, Credit Risk, Derivatives.
60
NOTE 17: EQUITY
The member countries’ portions of authorised capital are as follows:
| | | | | | | | | | | | | | | | |
| | | | |
(AMOUNTS IN EUR MILLION) | | 2016 | | | SHARE, IN % | | | 2015 | | | SHARE, IN % | |
Member country | | | | | | | | | | | | | | | | |
Denmark | | | 1,293.9 | | | | 21.1% | | | | 1,293.9 | | | | 21.1% | |
Estonia | | | 56.3 | | | | 0.9% | | | | 56.3 | | | | 0.9% | |
Finland | | | 1,088,1 | | | | 17.7% | | | | 1,088,1 | | | | 17.7% | |
Iceland | | | 58.1 | | | | 0.9% | | | | 58.1 | | | | 0.9% | |
Latvia | | | 82.1 | | | | 1.3% | | | | 82.1 | | | | 1.3% | |
Lithuania | | | 119.8 | | | | 2.0% | | | | 119.8 | | | | 2.0% | |
Norway | | | 1,320.8 | | | | 21.5% | | | | 1,320.8 | | | | 21.5% | |
Sweden | | | 2,122.8 | | | | 34.6% | | | | 2,122.8 | | | | 34.6% | |
Total | | | 6,141.9 | | | | 100.0% | | | | 6,141.9 | | | | 100.0% | |
The member countries’ portions of paid-in capital are as follows:
| | | | | | | | | | | | | | | | |
| | | | |
(AMOUNTS IN EUR MILLION) | | 2016 | | | SHARE, IN % | | | 2015 | | | SHARE, IN % | |
Member country | | | | | | | | | | | | | | | | |
Denmark | | | 89.2 | | | | 21.3% | | | | 89.2 | | | | 21.3% | |
Estonia | | | 3.1 | | | | 0.7% | | | | 3.1 | | | | 0.7% | |
Finland | | | 74.4 | | | | 17.8% | | | | 74.4 | | | | 17.8% | |
Iceland | | | 3.9 | | | | 0.9% | | | | 3.9 | | | | 0.9% | |
Latvia | | | 4.4 | | | | 1.1% | | | | 4.4 | | | | 1.1% | |
Lithuania | | | 6.9 | | | | 1.6% | | | | 6.9 | | | | 1.6% | |
Norway | | | 77.1 | | | | 18.4% | | | | 77.1 | | | | 18.4% | |
Sweden | | | 159.5 | | | | 38.1% | | | | 159.5 | | | | 38.1% | |
Total | | | 418.6 | | | | 100.0% | | | | 418.6 | | | | 100.0% | |
After the Board of Governors’ annual meeting in May 2016 concerning the adjustment and alignment of the Bank’s authorised capital, the Bank’s Governors have made a unanimous decision in autumn to adjust and align NIB’s authorised capital so that each member country’s share in percentage of paid-in capital and callable capital will be equal to its share of the authorised capital. The adjustment and alignment also concerns the member countries’ statutory guarantee shares in percentage for the Project Investment Loan facility (PIL) and the Environmental Investment Loan facility (MIL). In several member countries, the decision needs to be ratified by parliament before it enters into force. The changes are expected to be implemented in the first half of 2017.
Statutory reserve and credit risk funds
At the end of 2016, the Statutory Reserve amounted to EUR 686.3 million, or 11.2% of the Bank’s authorised capital of EUR 6,141.9 million.
The General Credit Risk Fund recognised in “Equity” is built up by means of allocations from prior years’ profits. This fund is established to cover unidentified, exceptional credit losses. The Statutory Reserve and the General Credit Risk Fund together constitute the Bank’s general reserves. The General Credit Risk Fund amounted to EUR 1,540.7 million in 2016.
In accordance with its Statutes, the Bank has a Special Credit Risk Fund for the Project Investment Loan facility (PIL). This fund is primarily designed to cover the Bank’s own risk in respect of this PIL loan facility, which in part is guaranteed by the member countries. In 2016, the fund amounted to EUR 445.9 million. The Bank assumes 100% of any losses under individual PIL loans, up to the amount available at any given time in the Special Credit Risk Fund for PIL. Only after this fund has been fully used can the Board of Directors call on the member country guarantees. Taken together, these credit risk funds (General Credit Risk Fund and Special Credit Risk Fund PIL) amounted to EUR 1,986.6 million as of 31 December 2016.
61
NOTE 18: COLLATERAL AND COMMITMENTS
| | | | | | | | |
| | |
(AMOUNTS IN EUR MILLION) | | 2016 | | | 2015 | |
Guarantees issued at nominal amount (Note 11) | | | – | | | | – | |
Loans agreed but not yet disbursed (Note 11) | | | 1,994 | | | | 1,193 | |
Borrowing commitments | | | – | | | | – | |
Collateral provided for staff loans 1 | | | – | | | | – | |
Securities given as collateral for repurchase agreements 1 | | | – | | | | 121 | |
Callable commitments in financial placements | | | 5 | | | | 6 | |
Collateral received for collateralised placements 2 3 | | | 3,208 | | | | 1,677 | |
Collateral given for collateralised placements 1 4 | | | 15 | | | | | |
Gross collateral with respect to derivatives exposure | | | | | | | | |
Collateral received 2 5 | | | 1,420 | | | | 1,829 | |
Collateral given 14 | | | 207 | | | | 94 | |
1 Book value.
2 Fair value.
3 Including cash of EUR 2 (8) million and securities of EUR 3,207 (1,669) million received.
4 Cash collateral.
5 Including cash of EUR 1,309 (1,440) million and securities of EUR 111 (389) million received.
Operating leases – NIB as lessee
At 31 December, the future minimum lease payments under non-cancellable leases were as follows;
| | | | | | | | |
| | |
(AMOUNTS IN EUR MILLION) | | 2016 | | | 2015 | |
Within one year | | | 1,062 | | | | 978 | |
Later than one but not two years | | | 978 | | | | 978 | |
Later than two but not three years | | | 905 | | | | 973 | |
Later than tree but not four years | | | 6 | | | | 905 | |
Later than four but not five years | | | – | | | | 6 | |
Later than five years | | | – | | | | – | |
Total | | | 2,951 | | | | 3,840 | |
The leases mainly related to office space and IT equipment
62
Operating leases – NIB as lessor
At 31 December, the future minimum lease receipts under non-cancellable leases were as follows;
| | | | | | | | |
| | |
(AMOUNTS IN EUR MILLION) | | 2016 | | | 2015 | |
Within one year | | | 1,449 | | | | 1,468 | |
Later than one but not two years | | | 142 | | | | 142 | |
Later than two but not three years | | | 142 | | | | 142 | |
Later than three but not four years | | | – | | | | 142 | |
Total | | | 1,733 | | | | 1,894 | |
The bank sub-lets office space to related parties as described in Note 23 and rents properties received as security in default situations. These properties are held for sale but rented until sold.
Purchase commitments
During 2016 the Bank initiated a procurement process for the purpose of purchasing an integrated Treasury Front office, Back office, Risk & Accounting IT solution (FOBORA) in order to modernise NIB’s business processes and IT systems. The procurement process engaged several potential vendors and it was concluded by end of November 2016 with one successful vendor. At 31 December 2016, the non-cancellable purchase commitment amounted to EUR 6.5 million.
63
NOTE 19: FAIR VALUE OF FINANCIAL INSTRUMENTS
| | | | | | | | | | | | | | | | | | | | | | | | |
| | |
| | | 2016 | | | 2015 | |
| | | | | | |
(AMOUNTS IN EUR MILLION) | | CARRYING AMOUNT | | | FAIR VALUE | | | DIFFERENCE | | | CARRYING AMOUNT | | | FAIR VALUE | | | DIFFERENCE | |
Assets | | | | | | | | | | | | | | | | | | | | | | | | |
Cash accounts with banks 1 | | | 107 | | | | 107 | | | | – | | | | 111 | | | | 111 | | | | – | |
Cash equivalents held at fair value 1 | | | 3,877 | | | | 3,877 | | | | – | | | | 1,985 | | | | 1,985 | | | | – | |
Other cash and cash equivalents held at amortised cost 2 | | | 472 | | | | 472 | | | | – | | | | 570 | | | | 570 | | | | – | |
Cash and cash equivalents, total | | | 4,456 | | | | 4,456 | | | | – | | | | 2,666 | | | | 2,666 | | | | – | |
Placements with credit institutions 2 | | | 9 | | | | 9 | | | | – | | | | 8 | | | | 8 | | | | – | |
Debt securities held at fair value 13 | | | 4,157 | | | | 4,157 | | | | – | | | | 3,154 | | | | 3,154 | | | | – | |
Other debt securities held at amortised cost 1 | | | 2,416 | | | | 2,534 | | | | 118 | | | | 2,926 | | | | 3,057 | | | | 131 | |
Debt securities, total | | | 6,572 | | | | 6,690 | | | | 118 | | | | 6,080 | | | | 6,211 | | | | 131 | |
Other financial placements at fair value 13 | | | 19 | | | | 19 | | | | – | | | | 22 | | | | 22 | | | | – | |
Hedged loans outstanding in fair value hedging relationships 2 | | | 3,321 | | | | 3,321 | | | | – | | | | 2,749 | | | | 2,749 | | | | – | |
Green lending bonds at fair value 1 | | | 143 | | | | 143 | | | | – | | | | | | | | | | | | | |
Loans outstanding, other 2 | | | 13,177 | | | | 13,185 | | | | 8 | | | | 12,878 | | | | 12,877 | | | | -1 | |
Loans outstanding, total | | | 16,640 | | | | 16,648 | | | | 8 | | | | 15,627 | | | | 15,626 | | | | -1 | |
Hedging derivatives at fair value 2 | | | 732 | | | | 732 | | | | – | | | | 1,115 | | | | 1,115 | | | | – | |
Other derivatives at fair value 2 | | | 1,425 | | | | 1,425 | | | | – | | | | 1,443 | | | | 1,443 | | | | – | |
Derivatives at fair value, total | | | 2,157 | | | | 2,157 | | | | – | | | | 2,558 | | | | 2,558 | | | | – | |
Receivables from defaulted counterparties at fair value 3 | | | 2 | | | | 2 | | | | – | | | | 6 | | | | 6 | | | | – | |
| | | | | | | | | | | | 126 | | | | | | | | | | | | 130 | |
| | | | | | |
Liabilities | | | | | | | | | | | | | | | | | | | | | | | | |
Short-term amounts owed to credit institutions 2 | | | 1,311 | | | | 1,311 | | | | – | | | | 1,449 | | | | 1,449 | | | | – | |
Long-term amounts owed to credit institutions 2 | | | 18 | | | | 18 | | | | – | | | | 18 | | | | 18 | | | | – | |
Repurchase agreements 2 | | | – | | | | – | | | | – | | | | 123 | | | | 123 | | | | – | |
Hedged debt securities issued in fair value hedging relationships 2 | | | 22,668 | | | | 22,668 | | | | – | | | | 20,051 | | | | 20,051 | | | | – | |
Other debt securities issued 2 | | | 1,157 | | | | 1,158 | | | | 1 | | | | 751 | | | | 749 | | | | -1 | |
Debt securities issued, total | | | 23,826 | | | | 23,826 | | | | 1 | | | | 20,802 | | | | 20,801 | | | | -1 | |
Hedged other debt in fair value hedging relationships 2 | | | 82 | | | | 82 | | | | – | | | | 60 | | | | 60 | | | | – | |
Other debt 2 | | | – | | | | – | | | | – | | | | – | | | | – | | | | – | |
Other debt, total | | | 82 | | | | 82 | | | | 0 | | | | 60 | | | | 60 | | | | – | |
Hedging derivatives at fair value 2 | | | 1,392 | | | | 1,392 | | | | – | | | | 1,371 | | | | 1,371 | | | | – | |
Other derivatives at fair value 2 | | | 53 | | | | 53 | | | | – | | | | 109 | | | | 109 | | | | – | |
Derivatives at fair value, total | | | 1,444 | | | | 1,444 | | | | 0 | | | | 1,481 | | | | 1,481 | | | | – | |
| | | | | | | | | | | | 1 | | | | | | | | | | | | -1 | |
Net | | | | | | | | | | | 127 | | | | | | | | | | | | 128 | |
1 The fair value is determined according to market quotes for identical instruments.
2 The fair value is determined using valuation techniques with observable market inputs.
3 The fair value is determined using valuation techniques with unobservable market inputs.
64
Level of fair value measurement for financial instruments at the end of the period
The table below analyses financial instruments’ fair value at the end of the year by the level in the fair value hierarchy into which the fair value measurement is categorised. See Accounting policies, Determination of fair value.
| | | | | | | | | | | | | | | | | | | | | | | | |
| | |
| | | 2016 | | | 2015 | |
| | | | | | |
(AMOUNTS IN EUR MILLION) | | LEVEL 1 | | | LEVEL 2 | | | LEVEL 3 | | | LEVEL 1 | | | LEVEL 2 | | | LEVEL 3 | |
Assets | | | | | | | | | | | | | | | | | | | | | | | | |
Cash accounts with banks | | | 107 | | | | – | | | | – | | | | 111 | | | | – | | | | – | |
Cash equivalents held at fair value | | | 3,877 | | | | – | | | | – | | | | 1,985 | | | | – | | | | – | |
Other cash and cash equivalents held at amortised cost | | | – | | | | 472 | | | | – | | | | – | | | | 570 | | | | – | |
Cash and cash equivalents, total | | | 3,984 | | | | 472 | | | | 0 | | | | 2,096 | | | | 570 | | | | 0 | |
Placements with credit institutions | | | – | | | | 9 | | | | – | | | | – | | | | 8 | | | | – | |
Debt securities held at fair value | | | 4,138 | | | | – | | | | 18 | | | | 3,132 | | | | – | | | | 22 | |
Other debt securities held at amortised cost | | | 2,534 | | | | – | | | | – | | | | 3,057 | | | | – | | | | – | |
Debt securities, total | | | 6,672 | | | | 0 | | | | 18 | | | | 6,189 | | | | 0 | | | | 22 | |
Other financial placements held at fair value | | | 3 | | | | | | | | 16 | | | | 2 | | | | – | | | | 20 | |
Hedged loans outstanding in fair value hedging relationships | | | – | | | | 3,321 | | | | – | | | | – | | | | 2,749 | | | | – | |
Green lending bonds at fair value | | | 143 | | | | – | | | | – | | | | – | | | | – | | | | – | |
Loans outstanding, other | | | – | | | | 13,185 | | | | – | | | | – | | | | 12,877 | | | | – | |
Loans outstanding, total | | | 143 | | | | 16,506 | | | | 0 | | | | 0 | | | | 15,626 | | | | 0 | |
Derivatives | | | – | | | | 2,157 | | | | – | | | | – | | | | 2,558 | | | | – | |
Receivables from defaulted counterparties | | | – | | | | – | | | | 2 | | | | – | | | | – | | | | 6 | |
Financial assets, total | | | 10,802 | | | | 19,143 | | | | 37 | | | | 8,287 | | | | 18,761 | | | | 49 | |
| | | | | | |
Liabilities | | | | | | | | | | | | | | | | | | | | | | | | |
Short-term amounts owed to credit institutions | | | | | | | 1,311 | | | | | | | | | | | | 1,449 | | | | | |
Long-term amounts owed to credit institutions | | | | | | | 18 | | | | | | | | | | | | 18 | | | | | |
Repurchase agreements | | | | | | | – | | | | | | | | | | | | 123 | | | | | |
Debt securities issued | | | | | | | | | | | | | | | | | | | | | | | | |
Hedged debt securities issued in fair value hedging relationships | | | | | | | 22,668 | | | | | | | | | | | | 20,051 | | | | | |
Other debt securities issued | | | | | | | 1,158 | | | | | | | | | | | | 749 | | | | | |
Hedged other debt in fair value hedging relationships | | | | | | | 82 | | | | | | | | | | | | 60 | | | | | |
Other debt | | | | | | | – | | | | | | | | | | | | – | | | | | |
Debt securities issued, total | | | | | | | 23,908 | | | | | | | | | | | | 20,861 | | | | | |
Derivatives | | | | | | | 1,444 | | | | | | | | | | | | 1,481 | | | | | |
Financial liabilities, total | | | | | | | 26,681 | | | | | | | | | | | | 23,931 | | | | | |
In 2015, due to ongoing negotiations regarding two-way Credit Support Annex (CSA) for derivatives, the Bank decided to exclude Credit Valuation Adjustment (CVA), reflecting the market value of counterparty default risk, and Debit Valuation Adjustment (DVA), reflecting the market value of the Bank’s own default, in the fair values of derivative positions. The largest counterparty negotiation were finalised during 2016 and the remainder in 2017. At 31 December 2015, unrecorded CVA amounted to EUR -12 million, while DVA was EUR 31 million. At 31 December 2016, recorded CVA amounted to EUR -8 million, while DVA was EUR 10 million. Receivables from defaulted treasury counterparties are measured at fair value. Receivables from defaulted lending counterparties are measured at cost minus impairment.
65
Changes in fair values categorised at level 3
| | | | | | | | | | | | | | | | |
(AMOUNTS IN EUR MILLION) | | DEBT SECURITIES HELD
AT FAIR VALUE | | | OTHER FINANCIAL PLACEMENTS
HELD AT FAIR VALUE | | | RECEIVABLES FROM
DEFAULTED COUNTERPARTIES | | | LEVEL 3, TOTAL | |
31 Dec 2014 | | | 23 | | | | 21 | | | | 8 | | | | 51 | |
Matured transactions | | | – | | | | -1 | | | | – | | | | -1 | |
Sold transactions | | | – | | | | – | | | | -48 | | | | -48 | |
Changes in fair values | | | -1 | | | | 1 | | | | 46 | | | | 46 | |
31 Dec 2015 | | | 22 | | | | 20 | | | | 6 | | | | 49 | |
Matured transactions | | | | | | | | | | | | | | | | |
Sold transactions | | | | | | | | | | | | | | | | |
Claims received | | | – | | | | – | | | | -5 | | | | -5 | |
Claims Written off | | | – | | | | – | | | | -84 | | | | -84 | |
Changes in fair values | | | -4 | | | | -4 | | | | 86 | | | | 78 | |
31 Dec 2016 | | | 18 | | | | 16 | | | | 2 | | | | 37 | |
Sensitivity analysis of level 3 financial instruments
| | | | | | | | | | | | | | | | | | | | | | | | |
| | | | | | |
| | | | | | 2016 | | | | | | | | | 2015 | | | | |
| | | | | | |
(AMOUNTS IN EUR MILLION) | | CARRYING
AMOUNT | | | FAVOURABLE
CHANGE | | | UNFAVOURABLE
CHANGE | | | CARRYING
AMOUNT | | | FAVOURABLE
CHANGE | | | UNFAVOURABLE CHANGE | |
Financial instruments categorised at level 3 | | | 37 | | | | 1 | | | | -1 | | | | 49 | | | | 1 | | | | -1 | |
The table above shows the sensitivity of the fair value of level 3 instruments to changes in key assumptions. The sensitivity analysis of the debt securities valued as level 3 is based on cash flow evaluation on Bloomberg. The implied market spread over the reference curve has been changed, reflecting a credit migration of the issuer. The fair value for other financial placements in level 3 is received from the funds in question and is based on the present value of their cash flows. No quotation exists for these placements.
66
NOTE 20: MATURITY PROFILE OF FINANCIAL ASSETS AND LIABILITIES
The table below sets out a maturity analysis for financial assets and liabilities containing principal and interest flows. For loans outstanding, undiscounted cash flows are presented until contractual final maturity. For borrowing outstanding and derivatives with call options, cash flows are presented until the first possible termination date. Cash flows are presented on net basis for interest rate swaps and on gross basis for all other swaps. Interest cash flows are projected based on the interest rates prevailing on the closing date. See also Notes 14 and 16, and Risk Management, Liquidity Risk.
2016
| | | | | | | | | | | | | | | | | | | | | | | | | | | | |
| | | | | | | |
(AMOUNTS IN EUR MILLION) | | CARRYING
AMOUNT | | | CONTRACTUAL
CASH FLOWS | | | UP TO AND
INCLUDING
3 MONTHS | | | OVER 3 MONTHS
AND UP TO AND
INCLUDING 6 MONTHS | | | OVER 6 MONTHS
AND UP TO AND
INCLUDING 1 YEAR | | | OVER 1 YEAR
AND UP TO AND
INCLUDING 5 YEARS | | | OVER 5 YEARS | |
Assets | | | | | | | | | | | | | | | | | | | | | | | | | | | | |
Cash and cash equivalents | | | 4,456 | | | | 4,453 | | | | 4,453 | | | | | | | | | | | | | | | | | |
Financial placements | | | | | | | | | | | | | | | | | | | | | | | | | | | | |
Debt securities | | | 6,572 | | | | 6,773 | | | | 528 | | | | 489 | | | | 669 | | | | 4,565 | | | | 522 | |
Loans outstanding | | | 16,640 | | | | 17,917 | | | | 374 | | | | 469 | | | | 925 | | | | 7,774 | | | | 8,375 | |
Other assets | | | | | | | | | | | | | | | | | | | | | | | | | | | | |
Derivatives | | | | | | | | | | | | | | | | | | | | | | | | | | | | |
Receivables | | | 34,096 | | | | 14,957 | | | | 823 | | | | 1,489 | | | | 980 | | | | 8,209 | | | | 3,457 | |
Payables | | | -31,939 | | | | -11,931 | | | | -630 | | | | -1,221 | | | | -703 | | | | -6,566 | | | | -2,810 | |
| | | | 2,157 | | | | 3,026 | | | | 193 | | | | 268 | | | | 277 | | | | 1,643 | | | | 647 | |
Assets, total | | | 29,825 | | | | 32,169 | | | | 5,548 | | | | 1,226 | | | | 1,871 | | | | 13,982 | | | | 9,544 | |
Liabilities | | | | | | | | | | | | | | | | | | | | | | | | | | | | |
Amounts owed to credit institutions | | | | | | | | | | | | | | | | | | | | | | | | | | | | |
Short-term | | | 1,311 | | | | 1,311 | | | | 1,311 | | | | – | | | | – | | | | – | | | | – | |
Long-term | | | 18 | | | | 18 | | | | – | | | | 18 | | | | – | | | | – | | | | – | |
| | | | 1,329 | | | | 1,329 | | | | 1,311 | | | | 18 | | | | 0 | | | | 0 | | | | 0 | |
Debts evidenced by certificates | | | 23,907 | | | | 25,543 | | | | 2,857 | | | | 427 | | | | 1,033 | | | | 15,785 | | | | 5,442 | |
Other liabilities | | | | | | | | | | | | | | | | | | | | | | | | | | | | |
Derivatives | | | | | | | | | | | | | | | | | | | | | | | | | | | | |
Receivables | | | -5,856 | | | | -6,383 | | | | -236 | | | | -41 | | | | -496 | | | | -3,753 | | | | -1,857 | |
Payables | | | 7,300 | | | | 7,044 | | | | 191 | | | | 67 | | | | 490 | | | | 4,129 | | | | 2,168 | |
| | | | 1,444 | | | | 661 | | | | -46 | | | | 27 | | | | -6 | | | | 376 | | | | 311 | |
Liabilities, total | | | 26,680 | | | | 27,533 | | | | 4,122 | | | | 471 | | | | 1,027 | | | | 16,160 | | | | 5,753 | |
| | | | | | | | | | | | | | | | | | | | | | | | | | | | | |
Net during the period | | | | | | | | | | | 1,426 | | | | 755 | | | | 844 | | | | -2,178 | | | | 3,791 | |
| | | | | | | |
Loans agreed but not yet disbursed | | | | | | | | | | | 1,994 | | | | | | | | | | | | | | | | | |
67
2015
| | | | | | | | | | | | | | | | | | | | | | | | | | | | |
(AMOUNTS IN EUR MILLION) | | CARRYING
AMOUNT | | | CONTRACTUAL
CASH FLOWS | | | UP TO AND
INCLUDING
3 MONTHS | | | OVER 3 MONTHS
AND UP TO AND
INCLUDING 6 MONTHS | | | OVER 6 MONTHS
AND UP TO AND
INCLUDING 1 YEAR | | | OVER 1 YEAR
AND UP TO AND
INCLUDING 5 YEARS | | | OVER 5 YEARS | |
Assets | | | | | | | | | | | | | | | | | | | | | | | | | | | | |
Cash and cash equivalents | | | 2,666 | | | | 2,666 | | | | 2,666 | | | | – | | | | – | | | | – | | | | – | |
Financial placements | | | | | | | | | | | | | | | | | | | | | | | | | | | | |
Debt securities | | | 6,080 | | | | 6,325 | | | | 288 | | | | 494 | | | | 652 | | | | 4,282 | | | | 609 | |
Loans outstanding | | | 15,627 | | | | 16,847 | | | | 365 | | | | 739 | | | | 948 | | | | 7,602 | | | | 7,193 | |
Other assets | | | | | | | | | | | | | | | | | | | | | | | | | | | | |
Derivatives | | | | | | | | | | | | | | | | | | | | | | | | | | | | |
Receivables | | | 30,424 | | | | 13,580 | | | | 576 | | | | 1,696 | | | | 1,143 | | | | 7,238 | | | | 2,928 | |
Payables | | | -27,866 | | | | -10,443 | | | | -395 | | | | -1,177 | | | | -830 | | | | -5,754 | | | | -2,288 | |
| | | | 2,558 | | | | 3,137 | | | | 182 | | | | 519 | | | | 313 | | | | 1,484 | | | | 641 | |
Assets, total | | | 26,931 | | | | 28,976 | | | | 3,501 | | | | 1,752 | | | | 1,913 | | | | 13,368 | | | | 8,443 | |
Liabilities | | | | | | | | | | | | | | | | | | | | | | | | | | | | |
Amounts owed to credit institutions | | | | | | | | | | | | | | | | | | | | | | | | | | | | |
Short-term | | | 1,449 | | | | 1,449 | | | | 1,449 | | | | – | | | | – | | | | – | | | | – | |
Long-term | | | 18 | | | | 18 | | | | – | | | | – | | | | 18 | | | | – | | | | – | |
| | | | 1,467 | | | | 1,467 | | | | 1,449 | | | | – | | | | 18 | | | | – | | | | – | |
Repurchase agreements | | | 123 | | | | 122 | | | | – | | | | 122 | | | | – | | | | – | | | | – | |
Debts evidenced by certificates | | | 20,862 | | | | 22,393 | | | | 1,414 | | | | 2,544 | | | | 502 | | | | 13,434 | | | | 4,500 | |
Other liabilities | | | | | | | | | | | | | | | | | | | | | | | | | | | | |
Derivatives | | | | | | | | | | | | | | | | | | | | | | | | | | | | |
Receivables | | | -6,491 | | | | -6,403 | | | | -165 | | | | -290 | | | | -236 | | | | -3,769 | | | | -1,942 | |
Payables | | | 7,972 | | | | 7,250 | | | | 153 | | | | 373 | | | | 196 | | | | 4,113 | | | | 2,415 | |
| | | | 1,481 | | | | 847 | | | | -13 | | | | 83 | | | | -40 | | | | 343 | | | | 473 | |
Liabilities, total | | | 23,932 | | | | 24,830 | | | | 2,850 | | | | 2,749 | | | | 480 | | | | 13,778 | | | | 4,972 | |
| | | | | | | | | | | | | | | | | | | | | | | | | | | | | |
Net during the period | | | | | | | | | | | 651 | | | | -998 | | | | 1,433 | | | | -410 | | | | 3,470 | |
| | | | | | | |
Loans agreed but not yet disbursed | | | | | | | | | | | 1,193 | | | | – | | | | – | | | | – | | | | – | |
68
NOTE 21: INTEREST RATE RISK
Interest rate risk is the impact that fluctuations in market interest rates can have on the value of the Bank’s interest-bearing assets and liabilities and on the interest income recognised in the statement of comprehensive income. The table below provides information on the extent of the Bank’s interest rate exposure. The assets and liabilities are grouped into buckets defined by their time to maturity or the date of the interest rate adjustment. The difference, or gap, between assets and liabilities in each time bucket makes the Bank sensitive to interest rate fluctuations. See also Risk Management, Market Risk.
2016
| | | | | | | | | | | | | | | | | | | | | | | | | | | | | | | | |
(AMOUNTS IN EUR MILLION) | | UP TO AND
INCLUDING
3 MONTHS | | | OVER 3 MONTHS
AND UP TO AND
INCLUDING
6 MONTHS | | | OVER 6 MONTHS
AND UP TO AND
INCLUDING
1 YEAR | | | OVER 1 YEAR
AND UP TO AND
INCLUDING
5 YEARS | | | OVER 5 YEARS
AND UP TO AND
INCLUDING
10 YEARS | | | OVER
10 YEARS | | | UNDEFINED | | | TOTAL | |
Assets | | | | | | | | | | | | | | | | | | | | | | | | | | | | | | | | |
Cash and cash equivalents | | | 4,456 | | | | – | | | | – | | | | – | | | | – | | | | – | | | | – | | | | 4,456 | |
Financial placements | | | | | | | | | | | | | | | | | | | | | | | | | | | | | | | | |
Placements with credit institutions | | | – | | | | – | | | | – | | | | – | | | | – | | | | – | | | | 9 | | | | 9 | |
Debt securities | | | 2,419 | | | | 350 | | | | 283 | | | | 3,007 | | | | 455 | | | | 35 | | | | 23 | | | | 6,572 | |
Other | | | 0 | | | | 0 | | | | 0 | | | | 0 | | | | 0 | | | | 0 | | | | 19 | | | | 19 | |
| | | | 2,419 | | | | 350 | | | | 283 | | | | 3,007 | | | | 455 | | | | 35 | | | | 51 | | | | 6,600 | |
Loans outstanding | | | 6,538 | | | | 6,817 | | | | 149 | | | | 1,518 | | | | 899 | | | | 483 | | | | 237 | | | | 16,640 | |
Intangible assets | | | – | | | | – | | | | – | | | | – | | | | – | | | | – | | | | 1 | | | | 1 | |
Tangible assets | | | – | | | | – | | | | – | | | | – | | | | – | | | | – | | | | 27 | | | | 27 | |
Other assets | | | | | | | | | | | | | | | | | | | | | | | | | | | | | | | | |
Derivatives | | | | | | | | | | | | | | | | | | | | | | | | | | | | | | | | |
Receivables 1 | | | 17,461 | | | | 3,206 | | | | 764 | | | | 13,336 | | | | 4,018 | | | | 616 | | | | 550 | | | | 39,952 | |
Other assets | | | | | | | | | | | | | | | | | | | | | | | | | | | 13 | | | | 13 | |
Accrued interest and fees receivable | | | | | | | | | | | | | | | | | | | | | | | | | | | 285 | | | | 285 | |
Total assets | | | 30,873 | | | | 10,373 | | | | 1,196 | | | | 17,861 | | | | 5,372 | | | | 1,133 | | | | 1,163 | | | | 67,973 | |
| | | | | | | | |
Liabilities and equity | | | | | | | | | | | | | | | | | | | | | | | | | | | | | | | | |
Liabilities | | | | | | | | | | | | | | | | | | | | | | | | | | | | | | | | |
Amounts owed to credit institutions | | | | | | | | | | | | | | | | | | | | | | | | | | | | | | | | |
Short-term | | | 1,311 | | | | – | | | | – | | | | – | | | | – | | | | – | | | | – | | | | 1,311 | |
Long-term | | | – | | | | 18 | | | | – | | | | – | | | | – | | | | – | | | | – | | | | 18 | |
| | | | 1,311 | | | | 18 | | | | 0 | | | | 0 | | | | 0 | | | | 0 | | | | 0 | | | | 1,329 | |
Repurchase agreements | | | | | | | | | | | | | | | | | | | | | | | | | | | | | | | | |
Debts evidenced by certificates | | | 4,128 | | | | 567 | | | | 766 | | | | 13,393 | | | | 3,993 | | | | 585 | | | | 477 | | | | 23,907 | |
Other liabilities | | | | | | | | | | | | | | | | | | | | | | | | | | | | | | | | |
Derivatives | | | | | | | | | | | | | | | | | | | | | | | | | | | | | | | | |
Payables 1 | | | 28,573 | | | | 5,788 | | | | 277 | | | | 2,319 | | | | 1,134 | | | | 794 | | | | 355 | | | | 39,239 | |
Other liabilities | | | – | | | | – | | | | – | | | | – | | | | – | | | | – | | | | 11 | | | | 11 | |
Accrued interest and fees payable | | | – | | | | – | | | | – | | | | – | | | | – | | | | – | | | | 211 | | | | 211 | |
Total liabilities | | | 34,012 | | | | 6,373 | | | | 1,042 | | | | 15,711 | | | | 5,127 | | | | 1,378 | | | | 1,055 | | | | 64,698 | |
| | | | | | | | |
Equity | | | | | | | | | | | | | | | | | | | | | | | | | | | 3,275 | | | | 3,275 | |
Total liabilities and equity | | | 34,012 | | | | 6,373 | | | | 1,042 | | | | 15,711 | | | | 5,127 | | | | 1,378 | | | | 4,330 | | | | 67,973 | |
| | | | | | | | | | | | | | | | | | | | | | | | | | | | | | | | | |
Net during the period | | | -3,139 | | | | 4,000 | | | | 154 | | | | 2,150 | | | | 246 | | | | -245 | | | | -3,167 | | | | | |
Cumulative net during the period | | | -3,139 | | | | 862 | | | | 1,016 | | | | 3,166 | | | | 3,412 | | | | 3,167 | | | | 0 | | | | | |
Guarantee commitments | | | – | | | | – | | | | – | | | | – | | | | – | | | | – | | | | – | | | | – | |
1 Swaps are not netted.
69
2015
| | | | | | | | | | | | | | | | | | | | | | | | | | | | | | | | |
(AMOUNTS IN EUR MILLION) | | UP TO AND
INCLUDING
3 MONTHS | | | OVER 3 MONTHS
AND UP TO AND
INCLUDING
6 MONTHS | | | OVER 6 MONTHS
AND UP TO AND
INCLUDING
1 YEAR | | | OVER 1 YEAR
AND UP TO AND
INCLUDING
5 YEARS | | | OVER 5 YEARS
AND UP TO AND
INCLUDING
10 YEARS | | | OVER
10 YEARS | | | UNDEFINED | | | TOTAL | |
Assets | | | | | | | | | | | | | | | | | | | | | | | | | | | | | | | | |
Cash and cash equivalents | | | 2,666 | | | | – | | | | – | | | | – | | | | – | | | | – | | | | – | | | | 2,666 | |
Financial placements | | | | | | | | | | | | | | | | | | | | | | | | | | | | | | | | |
Placements with credit institutions | | | – | | | | – | | | | – | | | | – | | | | – | | | | – | | | | 8 | | | | 8 | |
Debt securities | | | 1,925 | | | | 159 | | | | 329 | | | | 3,106 | | | | 504 | | | | 35 | | | | 22 | | | | 6,080 | |
Other | | | – | | | | – | | | | – | | | | – | | | | – | | | | – | | | | 22 | | | | 22 | |
| | | | 1,925 | | | | 159 | | | | 329 | | | | 3,106 | | | | 504 | | | | 35 | | | | 52 | | | | 6,110 | |
Loans outstanding | | | 6,264 | | | | 6,604 | | | | 269 | | | | 977 | | | | 860 | | | | 452 | | | | 201 | | | | 15,627 | |
Intangible assets | | | – | | | | – | | | | – | | | | – | | | | – | | | | – | | | | – | | | | – | |
Tangible assets | | | – | | | | – | | | | – | | | | – | | | | – | | | | – | | | | 28 | | | | 28 | |
Other assets | | | | | | | | | | | | | | | | | | | | | | | | | | | | | | | | |
Derivatives | | | | | | | | | | | | | | | | | | | | | | | | | | | | | | | | |
Receivables 1 | | | 15,773 | | | | 5,211 | | | | 212 | | | | 11,442 | | | | 3,008 | | | | 624 | | | | 646 | | | | 36,916 | |
Other assets | | | – | | | | – | | | | – | | | | – | | | | – | | | | – | | | | 23 | | | | 23 | |
Accrued interest and fees receivable | | | – | | | | – | | | | – | | | | – | | | | – | | | | – | | | | 299 | | | | 299 | |
Total assets | | | 26,627 | | | | 11,975 | | | | 810 | | | | 15,525 | | | | 4,371 | | | | 1,111 | | | | 1,250 | | | | 61,669 | |
| | | | | | | | |
Liabilities and equity | | | | | | | | | | | | | | | | | | | | | | | | | | | | | | | | |
Liabilities | | | | | | | | | | | | | | | | | | | | | | | | | | | | | | | | |
Amounts owed to credit institutions | | | | | | | | | | | | | | | | | | | | | | | | | | | | | | | | |
Short-term | | | 1,449 | | | | – | | | | – | | | | – | | | | – | | | | – | | | | – | | | | 1,449 | |
Long-term | | | – | | | | – | | | | 18 | | | | – | | | | – | | | | – | | | | – | | | | 18 | |
| | | | 1,449 | | | | 0 | | | | 18 | | | | 0 | | | | 0 | | | | 0 | | | | 0 | | | | 1,467 | |
Repurchase agreements | | | – | | | | 123 | | | | – | | | | – | | | | – | | | | – | | | | – | | | | 123 | |
Debts evidenced by certificates | | | 2,275 | | | | 2,699 | | | | 212 | | | | 11,496 | | | | 3,008 | | | | 548 | | | | 624 | | | | 20,862 | |
Other liabilities | | | | | | | | | | | | | | | | | | | | | | | | | | | | | | | | |
Derivatives | | | | | | | | | | | | | | | | | | | | | | | | | | | | | | | | |
Payables 1 | | | 23,875 | | | | 7,986 | | | | 246 | | | | 1,558 | | | | 1,185 | | | | 679 | | | | 309 | | | | 35,838 | |
Other liabilities | | | – | | | | – | | | | – | | | | – | | | | – | | | | – | | | | 10 | | | | 10 | |
Accrued interest and fees payable | | | – | | | | – | | | | – | | | | – | | | | – | | | | – | | | | 223 | | | | 223 | |
Total liabilities | | | 27,599 | | | | 10,808 | | | | 476 | | | | 13,053 | | | | 4,193 | | | | 1,227 | | | | 1,166 | | | | 58,523 | |
| | | | | | | | |
Equity | | | – | | | | – | | | | – | | | | – | | | | – | | | | – | | | | 3,146 | | | | 3,146 | |
Total liabilities and equity | | | 27,599 | | | | 10,808 | | | | 476 | | | | 13,053 | | | | 4,193 | | | | 1,227 | | | | 4,313 | | | | 61,669 | |
| | | | | | | | | | | | | | | | | | | | | | | | | | | | | | | | | |
Net during the period | | | -972 | | | | 1,167 | | | | 335 | | | | 2,471 | | | | 179 | | | | -117 | | | | -3,063 | | | | 0 | |
Cumulative net during the period | | | -972 | | | | 194 | | | | 529 | | | | 3,000 | | | | 3,179 | | | | 3,063 | | | | 0 | | | | | |
Guarantee commitments | | | – | | | | – | | | | – | | | | – | | | | – | | | | – | | | | – | | | | – | |
1 Swaps are not netted.
70
NOTE 22: CURRENCY RISK
NIB’s operations are mostly in euro and US dollars. The table below shows the net of assets and liabilities in the major currencies. See also Risk Management, Market Risk.
Net currency position as of 31 December 2016:
| | | | | | | | | | | | | | | | | | | | | | | | | | | | | | | | |
(AMOUNTS IN EUR MILLION) | | EUR | | | USD | | | SEK | | | NOK | | | DKK | | | OTHER
CURRENCIES | | | FAIR VALUE
ADJUSTMENTS
AND SWAP
NETTING | | | TOTAL | |
Assets | | | | | | | | | | | | | | | | | | | | | | | | | | | | | | | | |
Cash and cash equivalents | | | 3,124 | | | | 463 | | | | 1 | | | | 1 | | | | 865 | | | | 2 | | | | – | | | | 4,456 | |
Financial placements | | | | | | | | | | | | | | | | | | | | | | | | | | | | | | | | |
Placements with credit institutions | | | 9 | | | | – | | | | – | | | | – | | | | – | | | | – | | | | – | | | | 9 | |
Debt securities | | | 4,351 | | | | 1,172 | | | | 187 | | | | 170 | | | | 691 | | | | – | | | | – | | | | 6,572 | |
Other financial placements | | | 19 | | | | – | | | | – | | | | – | | | | – | | | | – | | | | – | | | | 19 | |
| | | | 4,379 | | | | 1,172 | | | | 187 | | | | 170 | | | | 691 | | | | 0 | | | | 0 | | | | 6,600 | |
Loans outstanding | | | 7,557 | | | | 2,414 | | | | 2,927 | | | | 2,599 | | | | 649 | | | | 216 | | | | 278 | | | | 16,640 | |
Intangible assets | | | 1 | | | | – | | | | – | | | | – | | | | – | | | | – | | | | – | | | | 1 | |
Tangible assets, property and equipment | | | 27 | | | | – | | | | – | | | | – | | | | – | | | | – | | | | – | | | | 27 | |
Other assets | | | | | | | | | | | | | | | | | | | | | | | | | | | | | | | | |
Derivatives | | | -8,547 | | | | 7,243 | | | | -2,035 | | | | -1,194 | | | | -2,215 | | | | 7,288 | | | | 1,616 | | | | 2,157 | |
Other assets | | | 4 | | | | 9 | | | | – | | | | – | | | | – | | | | – | | | | – | | | | 13 | |
| | | | -8,544 | | | | 7,252 | | | | -2,035 | | | | -1,194 | | | | -2,215 | | | | 7,288 | | | | 1,616 | | | | 2,170 | |
Accrued interest and fees receivable | | | 68 | | | | 80 | | | | 7 | | | | 21 | | | | 7 | | | | 98 | | | | 4 | | | | 285 | |
Total assets | | | 6,611 | | | | 11,381 | | | | 1,088 | | | | 1,598 | | | | -4 | | | | 7,605 | | | | 1,898 | | | | 30,178 | |
| | | | | | | | |
Liabilities and equity | | | | | | | | | | | | | | | | | | | | | | | | | | | | | | | | |
Liabilities | | | | | | | | | | | | | | | | | | | | | | | | | | | | | | | | |
Amounts owed to credit institutions | | | | | | | | | | | | | | | | | | | | | | | | | | | | | | | | |
Short-term amounts owed to credit institutions | | | 1,036 | | | | 275 | | | | – | | | | – | | | | – | | | | – | | | | – | | | | 1,311 | |
Long-term amounts owed to credit institutions | | | 18 | | | | – | | | | – | | | | – | | | | – | | | | – | | | | – | | | | 18 | |
| | | | 1,054 | | | | 275 | | | | 0 | | | | 0 | | | | 0 | | | | 0 | | | | 0 | | | | 1,329 | |
Debts evidenced by certificates | | | | | | | | | | | | | | | | | | | | | | | | | | | | | | | | |
Debt securities issued | | | 2,165 | | | | 11,039 | | | | 1,083 | | | | 1,581 | | | | – | | | | 7,505 | | | | 452 | | | | 23,826 | |
Other debt | | | 57 | | | | – | | | | – | | | | – | | | | – | | | | – | | | | 25 | | | | 82 | |
| | | | 2,222 | | | | 11,039 | | | | 1,083 | | | | 1,581 | | | | 0 | | | | 7,505 | | | | 477 | | | | 23,907 | |
Other liabilities | | | | | | | | | | | | | | | | | | | | | | | | | | | | | | | | |
Derivatives | | | – | | | | – | | | | – | | | | – | | | | – | | | | – | | | | 1,444 | | | | 1,444 | |
Other liabilities | | | 11 | | | | – | | | | – | | | | – | | | | – | | | | – | | | | 0 | | | | 11 | |
| | | | 11 | | | | 0 | | | | 0 | | | | 0 | | | | 0 | | | | 0 | | | | 1,444 | | | | 1,456 | |
Accrued interest and fees payable | | | 19 | | | | 72 | | | | 4 | | | | 17 | | | | -3 | | | | 98 | | | | 4 | | | | 211 | |
Total liabilities | | | 3,306 | | | | 11,386 | | | | 1,087 | | | | 1,598 | | | | -3 | | | | 7,604 | | | | 1,925 | | | | 26,903 | |
Equity | | | 3,091 | | | | 0 | | | | 0 | | | | 0 | | | | 0 | | | | 0 | | | | -28 | | | | 3,063 | |
Total liabilities and equity | | | 6,397 | | | | 11,386 | | | | 1,087 | | | | 1,598 | | | | -3 | | | | 7,604 | | | | 1,897 | | | | 29,967 | |
| | | | | | | | | | | | | | | | | | | | | | | | | | | | | | | | | |
Net of assets and liabilities as of 31 Dec 2016 | | | 214 | | | | -5 | | | | 1 | | | | 0 | | | | -1 | | | | 2 | | | | 1 | | | | 212 | |
71
Net currency position as of 31 December 2015:
| | | | | | | | | | | | | | | | | | | | | | | | | | | | | | | | |
(AMOUNTS IN EUR MILLION) | | EUR | | | USD | | | SEK | | | NOK | | | DKK | | | OTHER
CURRENCIES | | | FAIR VALUE
ADJUSTMENTS
AND SWAP
NETTING | | | TOTAL | |
Assets | | | | | | | | | | | | | | | | | | | | | | | | | | | | | | | | |
Cash and cash equivalents | | | 1,480 | | | | 1,180 | | | | 1 | | | | 2 | | | | 3 | | | | 1 | | | | – | | | | 2,666 | |
Financial placements | | | | | | | | | | | | | | | | | | | | | | | | | | | | | | | | |
Placements with credit institutions | | | 8 | | | | – | | | | – | | | | – | | | | – | | | | – | | | | – | | | | 8 | |
Debt securities | | | 4,662 | | | | 827 | | | | 195 | | | | 109 | | | | 287 | | | | 1 | | | | – | | | | 6,080 | |
Other financial placements | | | 22 | | | | – | | | | – | | | | – | | | | – | | | | – | | | | – | | | | 22 | |
| | | | 4,692 | | | | 827 | | | | 195 | | | | 109 | | | | 287 | | | | 1 | | | | – | | | | 6,110 | |
Loans outstanding | | | 8,027 | | | | 2,639 | | | | 2,248 | | | | 1,657 | | | | 559 | | | | 235 | | | | 263 | | | | 15,627 | |
Intangible assets | | | – | | | | – | | | | – | | | | – | | | | – | | | | – | | | | – | | | | – | |
Tangible assets, property and equipment | | | 28 | | | | – | | | | – | | | | – | | | | – | | | | – | | | | – | | | | 28 | |
Other assets | | | | | | | | | | | | | | | | | | | | | | | | | | | | | | | | |
Derivatives | | | -8,490 | | | | 5,169 | | | | -1,640 | | | | -407 | | | | -856 | | | | 6,937 | | | | 1,846 | | | | 2,558 | |
Other assets | | | – | | | | 21 | | | | – | | | | – | | | | 2 | | | | – | | | | – | | | | 23 | |
| | | | -8,490 | | | | 5,190 | | | | -1,640 | | | | -407 | | | | -854 | | | | 6,937 | | | | 1,846 | | | | 2,581 | |
Accrued interest and fees receivable | | | 75 | | | | 74 | | | | 6 | | | | 21 | | | | 6 | | | | 116 | | | | 2 | | | | 299 | |
Total assets | | | 5,812 | | | | 9,909 | | | | 809 | | | | 1,382 | | | | – | | | | 7,290 | | | | 2,110 | | | | 27,311 | |
| | | | | | | | |
Liabilities and equity | | | | | | | | | | | | | | | | | | | | | | | | | | | | | | | | |
Liabilities | | | | | | | | | | | | | | | | | | | | | | | | | | | | | | | | |
Amounts owed to credit institutions | | | | | | | | | | | | | | | | | | | | | | | | | | | | | | | | |
Short-term amounts owed to credit institutions | | | 1,342 | | | | 107 | | | | – | | | | – | | | | – | | | | – | | | | – | | | | 1,449 | |
Long-term amounts owed to credit institutions | | | 18 | | | | – | | | | – | | | | – | | | | – | | | | – | | | | – | | | | 18 | |
| | | | 1,360 | | | | 107 | | | | – | | | | – | | | | – | | | | – | | | | – | | | | 1,467 | |
Repurchase agreements | | | 123 | | | | – | | | | – | | | | – | | | | – | | | | – | | | | – | | | | 123 | |
Debts evidenced by certificates | | | | | | | | | | | | | | | | | | | | | | | | | | | | | | | | |
Debt securities issued | | | 1,111 | | | | 9,739 | | | | 805 | | | | 1,364 | | | | – | | | | 7,172 | | | | 611 | | | | 20,802 | |
Other debt | | | 47 | | | | – | | | | – | | | | – | | | | – | | | | – | | | | 13 | | | | 60 | |
| | | | 1,158 | | | | 9,739 | | | | 805 | | | | 1,364 | | | | – | | | | 7,172 | | | | 624 | | | | 20,862 | |
Other liabilities | | | | | | | | | | | | | | | | | | | | | | | | | | | | | | | | |
Derivatives | | | – | | | | – | | | | – | | | | – | | | | – | | | | – | | | | 1,481 | | | | 1,481 | |
Other liabilities | | | 9 | | | | – | | | | 1 | | | | – | | | | – | | | | – | | | | – | | | | 10 | |
| | | | 9 | | | | – | | | | 1 | | | | – | | | | – | | | | – | | | | 1,481 | | | | 1,491 | |
Accrued interest and fees payable | | | 23 | | | | 63 | | | | 2 | | | | 18 | | | | – | | | | 116 | | | | 2 | | | | 223 | |
Total liabilities | | | 2,672 | | | | 9,909 | | | | 808 | | | | 1,382 | | | | – | | | | 7,287 | | | | 2,107 | | | | 24,165 | |
Equity | | | 2,931 | | | | – | | | | – | | | | – | | | | – | | | | – | | | | – | | | | 2,931 | |
Total liabilities and equity | | | 5,603 | | | | 9,909 | | | | 808 | | | | 1,382 | | | | – | | | | 7,287 | | | | 2,107 | | | | 27,096 | |
| | | | | | | | | | | | | | | | | | | | | | | | | | | | | | | | | |
Net of assets and liabilities as of 31 Dec 2015 | | | 208 | | | | – | | | | – | | | | – | | | | – | | | | 2 | | | | 3 | | | | 215 | |
72
NOTE 23: RELATED PARTY DISCLOSURES
Nordic Development Fund and Nordic Environment Finance Corporation
According to the constituent documents of Nordic Development Fund (NDF) and Nordic Environment Finance Corporation ( NEFCO), their principal offices shall be located at the principal office of Nordic Investment Bank (NIB). Furthermore the Statutes of NDF and NEFCO set out that their Control Committee members appointed by the Nordic Council shall be the same persons as appointed by the Council to the Control Committee of NIB. In addition the Statutes of NDF and NEFCO set out that the powers vested in their respective Board of Directors may to the extent appropriate be delegated to the President of the respective organisation and /or to NIB.
The Bank provides administrative services to NDF and NEFCO the compensation of which is disclosed in note 8. The following table shows the outstanding balance of amounts owed to NDF, NEFCO and the trust funds administered by them, and the interest paid during the year. The interest paid to these institutions is at normal commercial rates.
| | | | | | | | | | | | | | | | |
(AMOUNTS IN EUR 1,000) | | INTEREST FROM
RELATED PARTIES | | | INTEREST TO
RELATED PARTIES | | | AMOUNTS OWED BY
RELATED PARTIES AS
OF 31 DEC | | | AMOUNTS OWED TO
RELATED PARTIES AS
OF 31 DEC | |
2016 | | | – | | | | -60 | | | | 10 | | | | 18,045 | |
2015 | | | – | | | | -22 | | | | 13 | | | | 17,994 | |
Rental income (NDF, NEFCO) | | | | | | | | | | | | | | | | |
| | | | | | | | |
(AMOUNTS IN EUR 1,000) | | NDF | | | NEFCO | |
2016 | | | 146 | | | | 267 | |
2015 | | | 52 | | | | 98 | |
Key management personnel
The Bank has identified members of the Board of Directors, the Control Committee and the Executive Committee as key management personnel. There have been no transactions between the Bank and key management personnel. Information regarding the compensation of key management personnel for the relevant reporting periods can be found in Note 7.
73
NOTE 24: CASH FLOW STATEMENT
Specification of the change in cash and cash equivalents, net on 31 December:
| | | | | | | | |
| | |
(AMOUNTS IN EUR 1,000) | | 2016 | | | 2015 | |
Cash and balances with banks 1 | | | 107,049 | | | | 111,256 | |
Short-term placements with credit institutions | | | 1,122,663 | | | | 861,672 | |
Collateralised placements 2 | | | 3,226,148 | | | | 1,693,142 | |
Cash and cash equivalents | | | 4,455,860 | | | | 2,666,070 | |
| | |
Short-term amounts owed to credit institutions 3 | | | -1,310,873 | | | | -1,448,888 | |
Repurchase agreements | | | | | | | -122,556 | |
Short-term debt | | | | | | | -64,277 | |
Cash and cash equivalents, net | | | 3,144,987 | | | | 1,030,349 | |
| | |
Change in cash and cash equivalents, net | | | 2,114,639 | | | | 263,219 | |
1 Including an initial margin requirement of EUR 295 (413) thousand for futures on 31 December.
2 Net exposure after collaterals for collateralised placements EUR 6,138 (993) thousand.
3 Of which cash received as collateral EUR 1,310,597 (1,448,881) thousand
74
NOTE 25: EXCHANGE RATES
| | | | | | | | |
| | |
| | | EUR RATE ON 31 DEC 2016 | | | EUR RATE ON 31 DEC 2015 | |
DKK Danish krone | | | 7.4344 | | | | 7.4626 | |
ISK Icelandic króna 1 | | | 118.8 | | | | 141.15 | |
NOK Norwegian krone | | | 9.0863 | | | | 9.603 | |
SEK Swedish krona | | | 9.5525 | | | | 9.1895 | |
ARS Argentine peso 2 | | | 16.72175 | | | | 14.14056 | |
AUD Australian dollar | | | 1.4596 | | | | 1.4897 | |
BRL Brazilian real | | | 3.4305 | | | | 4.3117 | |
CAD Canadian dollar | | | 1.4188 | | | | 1.5116 | |
CHF Swiss franc | | | 1.0739 | | | | 1.0835 | |
CZK Czech koruna | | | 27.021 | | | | 27.023 | |
GBP Pound sterling | | | 0.85618 | | | | 0.73395 | |
HKD Hong Kong dollar | | | 8.1751 | | | | 8.4376 | |
JPY Japanese yen | | | 123.4 | | | | 131.07 | |
MXN Mexican peso | | | 21.7719 | | | | 18.9145 | |
NZD New Zealand dollar | | | 1.5158 | | | | 1.5923 | |
PLN Polish zloty | | | 4.4103 | | | | 4.2639 | |
RUB Russian rouble | | | 64.3 | | | | 80.6736 | |
SDR Special drawing right 3 | | | 0.78411 | | | | 0.78565 | |
SGD Singapore dollar | | | 1.5234 | | | | 1.5417 | |
TRY Turkish lira | | | 3.7072 | | | | 3.1765 | |
TWD New Taiwan dollar 2 | | | 34.1662 | | | | 35.8096 | |
USD US dollar | | | 1.0541 | | | | 1.0887 | |
ZAR South African rand | | | 14.457 | | | | 16.953 | |
1 Reuters closing.
2 The exchange rate is calculated using the year-end market rate for USD/relevant currency, which then provides the EUR/relevant currency rate.
3 IMF (International Monetary Fund) closing per 31 December 2016 and per 31 December 2015.
75
NOTE 26: POST BALANCE SHEET EVENTS
On 24 January 2017, NIB priced a new 5-year global USD 1.25 billion bond, the Bank’s first public benchmark of 2017. The issue has a final maturity of 1 February 2022, pays a semi-annual coupon of 2.125% and has an issue price of 99.939%, to give a spread of +23.5 basis points over the UST 2% due December 2021, equivalent to 17 basis points over mid-swaps.
There have been no other material post balance sheet events that would require disclosure or adjustment to these financial statements.
76
AUDITOR’S REPORT
Independent Auditor’s Report
To the Control Committee of the Nordic Investment Bank
Independent Auditor’s Report on the Financial Statements
Opinion
In our capacity as auditors appointed by the Control Committee of the Nordic Investment Bank we have audited the financial statements of Nordic Investment Bank for the year ended 31 December, 2016. The financial statements comprise the statement of financial position, statement of comprehensive income, statement of changes in equity, cash flow statement and notes, including a summary of significant accounting policies.
In our opinion the financial statements give a true and fair view of the Nordic Investment Bank’s financial position as at December 31, 2016 and of its financial performance and its cash flows for the year ended in accordance with International Financial Reporting Standards (IFRS).
Basis for Opinion
We conducted our audit in accordance with International Standards on Auditing. Our responsibilities under those standards are further described in the Auditor’s Responsibilities for the Audit of Financial Statements section of our report.
We are independent of the Bank in accordance with the International Ethics Standards Board of Accountants’ Code of Ethics for Professional Accountants (IESBA Code) together with the ethical requirements that are relevant to our audit of the financial statements, and we have fulfilled our other ethical responsibilities in accordance with these requirements and the IESBA code.
We believe that the audit evidence we have obtained is sufficient and appropriate to provide a basis for our opinion.
Materiality
The scope of our audit was influenced by our application of materiality. The materiality is determined based on our professional judgement and is used to determine the nature, timing and extent of our audit procedures and to evaluate the effect of identified misstatements on the financial statements as a whole. The level of materiality we set is based on our assessment of the magnitude of misstatements that, individually or in aggregate, could reasonably be expected to have influence on the economic decisions of the users of the financial statements. We have also taken into account misstatements and/or possible misstatements that in our opinion are material for qualitative reasons for the users of the financial statements.
Key Audit Matters
Key audit matters are those matters that, in our professional judgment, were of most significance in our audit of the financial statements of the current period. These matters were addressed in the context of our audit of the financial statements as a whole, and in forming our opinion thereon, and we do not provide a separate opinion on these matters.
We have also addressed the risk of management override of internal controls. This includes consideration of whether there was evidence of management bias that represented a risk of material misstatement due to fraud.
| | |
| THE KEY AUDIT MATTER | | HOW THE MATTER WAS ADDRESSED IN THE AUDIT |
| Valuation of financial placements and derivatives (Refer to Summary of significant Accounting policies: Determination of fair value, Financial placements, Derivative instruments and hedge accounting and to the notes 10, 14, 16 and 19 to the financial statements) |
77
| • | Due to the business model in use by NIB, assets classified as financial placements account for a substantial part of the balance sheet. NIB also has substantial positions in derivative financial assets and financial liabilities due to its policy to hedge interest rate and currency risk. |
| • | The valuation of these items has a significant impact on the Statement of Comprehensive Income so they have been identified as a key audit area |
Our audit procedures over financial placements included, among others,
| • | Assessment and testing of the design and operating effectiveness of the controls over valuations. |
| • | Valuation testing by comparing values in accounting to independently obtained market prices. |
| • | Assessing the liquidity of these items for indications of impairment. |
| • | Confirming existence of these items at year end by obtaining external confirmations |
Our audit procedures over derivative financial assets and financial liabilities included, among others,
| • | Assessing the appropriateness of the calculation models used. |
| • | Challenging the assumptions used by comparing to market information. |
| • | Identifying controls over the calculation process and assessing their effectiveness. |
| • | Testing the valuation of the derivatives on a spot check basis by using market data obtained from an external provider of market information. |
| • | We also read and assessed the disclosures made in the financial statements for valuation adjustments |
Hedge accounting (Refer to Summary of significant accounting polices: Derivative instruments and hedge accounting and note 19 to the financial statements)
| • | NIB uses hedge accounting to reduce the accounting mismatch in the reporting between the accounting of financial assets, financial liabilities and the accounting of related derivative contracts hedging inherent market risks of borrowing and lending activities |
| • | The accounting process has been subject to significant development during financial year 2016. Inter alia hedging instruments included in fair value hedges excludes cross currency basis spread movements from the hedging relationship recognizing movements in the hedging reserve through Other Comprehensive Income. |
| • | Due to the complexity of the accounting requirements for hedge accounting, the change in NIB’s hedge accounting process and the effect on the line items in the Statement of Comprehensive Income, the correct application of hedge accounting has been considered a key audit area. |
Our procedures included, among others,
| • | Assessing the internal control procedures relating to inclusion of derivatives in a hedge accounting relationship and the effectiveness tests. |
| • | Assessing the accounting treatment of the hedging relationships for compliance with the relevant accounting standard by using our financial instruments accounting specialists. |
| • | Challenging the assumptions used by comparing to market information. |
| • | Assessing the hedge effectiveness testing which is prepared by NIB. |
| • | We also read and assessed the disclosures made in the financial statements for hedge accounting. |
Impairment of loans (Refer to Summary of significant accounting polices: Impairment of loans and receivable and notes 9 and 11 to the financial statements.)
| • | Management judgement is required to determine the amount and timing of loan impairment provisions. |
| • | Due to the substantial size of loans outstanding on the balance sheet and the significance of the judgement applied, impairment of loans has been identified as a key audit area. |
Our procedures included, among others,
| • | Gaining an understanding of the impairment process and identifying and testing the key controls in place. |
| • | Inspecting the minutes of the key governance meetings including Credit Committee and Board to ensure that there are governance controls in place. |
78
| ● | Evaluating the borrowers where increased credit risk has occurred and assessing the level of collective impairment booked. For significant provisions made, we understood and challenged the provisioning methodologies and underlying assumption used by comparing to our own expectations based on our knowledge of the macroeconomic environment and the borrowers. |
| ● | Comparing realised credit losses to the impairments booked to assess the reasonableness of impairment provisions. |
Responsibilities of the Board of Directors and the President for the Financial Statements
The Board of Directors and the President are responsible for the preparation and fair presentation of financial statements in accordance with International Financial Reporting Standards (IFRS), and for such internal control as they determine is necessary to enable the preparation of financial statements that are free from material misstatement, whether due to fraud or error.
In preparing the financial statements, the Board of Directors and the President are responsible for assessing the Bank’s ability to continue as going concern, disclosing, as applicable, matters relating to going concern and using the going concern basis of accounting unless there is an intention to liquidate the Bank or to cease operations, or there is no realistic alternative but to do so.
Those charged with governance are responsible for overseeing the Bank’s financial reporting process.
Auditor’s Responsibilities for the Audit of the Financial Statements
Our objectives are to obtain reasonable assurance on whether the financial statements as a whole are free from material misstatement, whether due to fraud or error, and to issue an auditor’s report that includes our opinion. Reasonable assurance is a high level of assurance, but is not a guarantee that an audit conducted in accordance with ISAs will always detect a material misstatement when it exists. Misstatements can arise from fraud or error and are considered material if, individually or in aggregate, they could reasonably be expected to influence the economic decisions of users taken on the basis of the financial statements.
As part of an audit in accordance with ISAs, we exercise professional judgment and maintain professional scepticism throughout the audit. We also:
| ● | Identify and assess the risks of material misstatement of the financial statements, whether due to fraud or error, design and perform audit procedures responsive to those risks, and obtain audit evidence that is sufficient and appropriate to provide a basis for our opinion. The risk of not detecting a material misstatement resulting from fraud is higher than for one resulting from error, as fraud may involve collusion, forgery, intentional omissions, misrepresentations, or the override of internal control. |
| ● | Obtain an understanding of internal control relevant to the audit in order to design audit procedures that are appropriate in the circumstances, but not for the purpose of expressing an opinion on the effectiveness of the Bank’s internal control. |
| ● | Evaluate the appropriateness of accounting policies used and the reasonableness of accounting estimates and related disclosures made by management. |
| ● | Conclude on the appropriateness of the Board of Directors’ and the President’s use of the going concern basis of accounting and based on the audit evidence obtained, whether a material uncertainty exists related to events or conditions that may cast significant doubt on the Bank’s ability to continue as a going concern. If we conclude that a material uncertainty exists, we are required to draw attention in our auditor’s report to the related disclosures in the financial statements or, if such disclosures are inadequate, to modify our opinion. Our conclusions are based on the audit evidence obtained up to the date of our auditor’s report. However, future events or conditions may cause the Bank to cease to continue as a going concern. |
| ● | Evaluate the overall presentation, structure and content of the financial statements, including the disclosures, and whether the financial statements represent the underlying transactions and events so that the financial statements give a true and fair view. |
We communicate with those charged with governance regarding, among other matters, the planned scope and timing of the audit and significant audit findings, including any significant deficiencies in internal control that we identify during our audit.
We also provide those charged with governance with a statement that we have complied with relevant ethical requirements regarding independence, and communicate with them all relationships and other matters that may reasonably be thought to bear on our independence, and where applicable, related safeguards.
79
From the matters communicated with those charged with governance, we determine those matters that were of most significance in the audit of the financial statements of the current period and are therefore the key audit matters. We describe these matters in our auditor’s report unless law or regulation precludes public disclosure about the matter or when, in extremely rare circumstances, we determine that a matter should not be communicated in our report because the adverse consequences of doing so would reasonably be expected to outweigh the public interest benefits of such communication
Other Reporting Requirements
Other Information
The Board of Directors and the President are responsible for the other information. The other information comprises information included in the report of the Board of Directors, in the Operating and financial review and in the Annual Report, but does not include the financial statements and our report thereon. We obtained the report of the Board of Directors and the Operating and financial review prior to the date of the auditor’s report, and the Annual Report is expected to be made available to us after that date.
Our opinion on the financial statements does not cover the other information.
In connection with our audit of the financial statements, our responsibility is to read the other information identified above and, in doing so, consider whether the other information is materially inconsistent with the financial statements or our knowledge obtained in the audit, or otherwise appears to be materially misstated.
In our opinion, the information in the report of the Board of Directors and in the Operating and financial review is consistent with the information in the information in the financial statements.
If, based on the work we have performed on the report of the Board of Directors and on the Operating and financial review, we conclude that there is a material misstatement of this other information, we are required to report this fact. We have nothing to report in this regard.
Report on the other requirements
In accordance with the Terms of Engagement our audit also included a review of whether the Board of Directors’ and the President’s administration have complied with the Statutes of the Bank. It is our opinion that the administration of the Board of Directors and the President complied with the Statutes of the Bank.
| | |
Helsinki 10 March, 2017 | | |
| |
Marcus Tötterman | | Anders Tagde |
Authorised Public Accountant, KHT | | Authorized Public Accountant |
| |
KPMG Oy Ab | | KPMG AB |
Töölönlahdenkatu 3A | | Vasagatan 16 |
00100 Helsinki | | 111 20 Stockholm |
Finland | | Sweden |
80
STATEMENT BY THE CONTROL COMMITTEE
STATEMENT BY THE CONTROL COMMITTEE OF THE NORDIC INVESTMENT BANK ON THE AUDIT OF THE ADMINISTRATION AND ACCOUNTS OF THE BANK
To the Board of Governors of the Nordic Investment Bank
In accordance with section 17 of the Statutes of the Nordic Investment Bank, we have been appointed to ensure that the operations of the Bank are conducted in accordance with its Statutes and to bear responsibility for the audit of the Bank and annually deliver an auditors’ report to the Board of Governors. Having completed our assignment for the year 2016, we hereby submit the following report.
The Control Committee met during the fiscal year as well as after the Bank’s Financial Statements had been prepared, and the Committee performed the control and examination measures considered necessary. The Annual Report of the Bank was examined at a meeting in Helsinki on 10 March 2017. In carrying out its tasks, the Control Committee received such information and carried out such examination measures as it deemed necessary to assess the Bank’s position in regard to its risks. We have also received the Independent Auditors’ Report, submitted on 10 March 2017 by the authorised public accountants appointed by the Control Committee.
Based on the audit, carried out by the independent auditors, we consider that:
The Bank’s operations during the financial year have been conducted in accordance with the Statutes;
The Board of Directors and the President have complied with the Statutes of the Bank; and that
The Financial Statements give a true and fair view of the financial position of the Bank as at 31 December 2016 and of its results and financing in 2016. The Statement of Comprehensive Income shows a profit of EUR 211,810,055.68 for the financial period.
We recommend to the Board of Governors that:
The allocation of the Bank’s profit for the financial period, as proposed by the Board of Directors, be approved;
The Statement of Comprehensive Income and the Statement of Financial Position be adopted; and
The Board of Directors and the President be discharged from liability for the administration of the Bank’s operations during the accounting period examined by us.
| | | | |
Helsinki, 10 March 2017 |
Sigurður Þórðarson |
| Rasa Kavolytė | | Sjúrður Skaale | | Remo Holsmer |
| Arto Pirttilahti | | Höskuldur Þórhallsson | | Karina Ploka |
| Sigita Ščajevienė | | Michael Tetzschner | | Penilla Gunther |
81
PROPOSAL BY THE BOARD OF DIRECTORS TO THE BOARD OF GOVERNORS
The Board of Directors’ proposal with regard to the financial results for the year 2016 takes into account the need to maintain the Bank’s ratio of equity to total risk-weighted assets at a secure level, which is a prerequisite for maintaining the Bank’s high creditworthiness.
In accordance with section 11 of the Statutes of the Bank, the profit for 2016 of EUR 211,810,055.68 is to be allocated as follows:
– EUR 156,810,055.68 will be transferred to the General Credit Risk Fund as a part of equity; and
– EUR 55,000,000.00 will be made available for distribution as dividends to the Bank’s member countries.
More information can be found in the statement of comprehensive income, the statement of financial position, the changes in equity and cash flow statement, as well as the notes to the financial statements.
| | | | |
Helsinki, 9 March 2017 |
| Kaspars Āboliņš | | Esther Finnbogadóttir | | Trond Eklund on behalf of Silje Gamstøbakk |
| Sven Hegelund | | Julie Sonne | | Pekka Morén |
| Jurgita Uzielienė | | Henrik Normann President & CEO | | Madis Üürike |
82