Exhibit IX
Interim Management Statement
January to April 2017
| | |
| Nordic Investment Bank | | Interim Management Statement January–April 2017 |
Table of Contents
| | | | |
Ratios and key figures | | | 3 | |
| |
President and CEO’s comment | | | 4 | |
| |
Operating and financial review | | | | |
Comprehensive income | | | 5 | |
Financial position | | | 7 | |
| |
Financial statements | | | | |
| |
Statement of comprehensive income | | | 10 | |
Statement of financial position | | | 11 | |
Statement of changes in equity | | | 12 | |
Cash flow statement | | | 13 | |
Basis of preparation | | | 14 | |
| |
Ratio definitions | | | 14 | |
2 (14)
| | |
| Nordic Investment Bank | | Interim Management Statement January–April 2017 |
Ratios and key figures
| | | | | | | | | | | | |
in EUR millions unless otherwise specified | | Apr 2017* | | | Apr 2016* | | | Dec 2016 | |
Net interest income | | | 80 | | | | 75 | | | | 242 | |
Profit before net loan losses | | | 103 | | | | 56 | | | | 232 | |
Net profit | | | 110 | | | | 51 | | | | 212 | |
Loans disbursed | | | 781 | | | | 627 | | | | 3,373 | |
Loans agreed | | | 610 | | | | 865 | | | | 4,363 | |
Mandate fulfilment ** | | | 91 | % | | | 100 | % | | | 96 | % |
Loans outstanding | | | 16,681 | | | | 15,658 | | | | 16,640 | |
Total assets | | | 28,824 | | | | 27,481 | | | | 30,178 | |
New debt issues | | | 2,543 | | | | 2,470 | | | | 6,700 | |
Debts evidenced by certificates | | | 22,926 | | | | 21,156 | | | | 23,907 | |
Total equity | | | 3,398 | | | | 3,157 | | | | 3,275 | |
Equity/total assets *** | | | 11.8 | % | | | 11.5 | % | | | 10.9 | % |
Profit/average equity *** | | | 9.9 | % | | | 4.9 | % | | | 6.7 | % |
Cost/income *** | | | 14.2 | % | | | 23.8 | % | | | 16.1 | % |
Number of employees (average during the period) | | | 192 | | | | 190 | | | | 192 | |
| * | Unaudited figures, to be read in conjunction with NIB’s 2016 audited financial statements. |
| ** | See page 8 for mandate fulfilment explanation. |
| *** | See page 14 for ratio definitions. |
3 (14)
| | |
| Nordic Investment Bank | | Interim Management Statement January–April 2017 |
Comments on NIB’s financial figures for January–April 2017
The flow of deals in NIB’s lending continued to be at a high level, with a total of EUR 781 million in loans disbursed (Jan–Apr 2016: EUR 627 million). New loans agreed totalled EUR 610 million (Jan–Apr 2016: EUR 865 million).
Demand for long-term financing from the municipal sector in the Bank’s member countries has been a main driver. Proceeds have been used for upgrading and replacing infrastructure in the areas of water supply and wastewater treatment, as well as energy efficiency in public buildings, energy generation and distribution. Also in the private sector, NIB experienced good demand for long-term financing with loans disbursed to financial intermediates for on-lending to SMEs and to large member country corporates for investments in R&D.
The profit for the period amounted to EUR 110 million, up from EUR 51 million in the same period a year ago. The increase in earnings was primarily attributable to unrealised gains on financial operations of EUR 35 million, compared to unrealised losses of EUR 5 million in 2016. The unrealised gains arise from valuations of interest rate and currency swaps, which are used for hedging market risks in funding and loan transactions. The unrealised gains will reverse as the underlying financial transactions reach maturity.
The underlying profit (excluding net profit and loss on financial operations) increased by EUR 17 million to EUR 71 million. This increase was mainly attributed to a reversal of loan impairments and higher net interest income.
During the first four months, the Bank carried out 32 new funding transactions and raised EUR 2.5 billion, which accounts for close to half of this year’s funding plan. In January, the Bank issued its first USD benchmark for the year: a five-year, USD 1.25 billion global issue.
Given the good loan pipeline the deal flow and new disbursements are expected to continue at the same pace for the rest of the year.
Henrik Normann
President & CEO
4 (14)
| | |
| Nordic Investment Bank | | Interim Management Statement January–April 2017 |
Operating and financial review
Jan-Apr 2017 compared to Jan-Apr 2016
Total comprehensive income
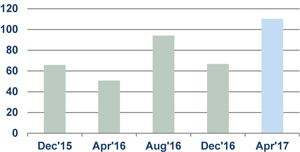
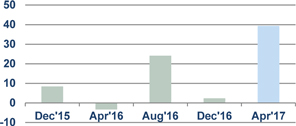
The net profit totalled EUR 110.3 million, up from EUR 50.8 million in the same period last year.
Total operating income increased from EUR 73.8 million in 2016 to EUR 120.2 million. Total operating expenses decreased by EUR 0.5 million to EUR 17 million, resulting in profit before net losses reaching EUR 103.2 million (Jan–Apr 2016: EUR 56.3 million).
Net profit from financial operations increased by EUR 42.7 million and was the main driver for the increase in operating income. The net profit on financial operations for the period Jan–Apr 2017 of EUR 39.4 included unrealised fair value gains of EUR 35.2 million and realised gains of EUR 4.2 million. The unrealised gains will reverse as the underlying financial transactions reach maturity. Other drivers include a EUR 5.1 million increase in interest income and loan impairment reversals of EUR 7.1 million.
The Bank separates the foreign currency basis spread from financial instruments used in fair value hedging and this separated amount recorded in “Other comprehensive income” (OCI) amounted to EUR 12.4 million. In 2016, the amount was EUR -37.5 million with additional cash flow hedge reserve movements of EUR -3.1 million. The resulting total comprehensive income for the period amounted to EUR 122.7 million compared to EUR 10.2 million in 2016.
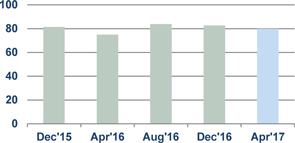
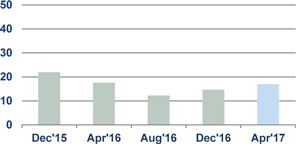
Net interest income
Net interest income for the period amounted to EUR 80.2 million (Jan–Apr 2016: EUR 75.2 million). The adverse impact of the negative interest rates has been mitigated by increased volumes of loans outstanding compared to the same period in 2016.
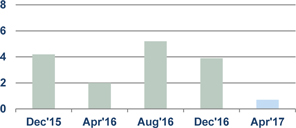
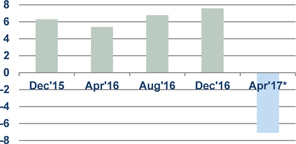
Net commission income and fees
Fee and commission income was EUR 0.7 million compared to EUR 2.0 million in 2016.
Tertial net profit
EUR m
Tertial net interest income
EUR m
Tertial net commission income and fees
EUR m
5 (14)
| | |
| Nordic Investment Bank | | Interim Management Statement January–April 2017 |
Net profit on financial operations
The profit on financial operations totalled EUR 39.4 million, up EUR 42.7 million on a year ago. The result comprises realised profit of EUR 4.2 million and unrealised profit of EUR 35.2 million. The unrealised profit is driven by positive valuation effects from spread tightening as well as hedge accounting valuations. These gains are expected to reverse as the underlying transactions reach maturity.
Total operating expenses
Total operating expenses were in line with the previous year. The Bank continues to focus on costs to ensure an efficient cost/income ratio.
Net loan losses
Net loan losses decreased in the period under review due to loan impairment reversals. The credit quality of the total loan portfolio remains high, and the Bank continues to adopt a conservative approach to loan impairment provisions.
Other comprehensive income
The Bank separates the foreign currency basis spread from financial instruments used in fair value hedging and this separated amount is recorded in OCI. The valuation of foreign currency basis spread will be zero upon maturity and, therefore, the amount recorded in OCI will not be reclassified to the income statement.
Tertial net profit on financial operations
EUR m
Tertial total operating expenses
EUR m
Tertial net loan losses
EUR m
| * | The net loan loss gain for the period ended April 2017 is due to loan impairment reversals. |
6 (14)
| | |
| Nordic Investment Bank | | Interim Management Statement January–April 2017 |
Financial position
| | | | | | | | | | | | |
(in EUR millions) | | Apr 2017* | | | Apr 2016* | | | Dec 2016 | |
Cash and cash equivalents | | | 3,686 | | | | 3,687 | | | | 4,456 | |
Financial placements | | | 6,538 | | | | 6,059 | | | | 6,600 | |
Loans outstanding | | | 16,681 | | | | 15,658 | | | | 16,640 | |
Derivatives | | | 1,636 | | | | 1,801 | | | | 2,157 | |
Other assets | | | 283 | | | | 276 | | | | 325 | |
| | | | | | | | | | | | |
Total assets | | | 28,824 | | | | 27,481 | | | | 30,178 | |
| | | |
Equity | | | 3,398 | | | | 3,157 | | | | 3,275 | |
Owed to credit institutions | | | 1,007 | | | | 939 | | | | 1,329 | |
Debts evidenced by certificates | | | 22,926 | | | | 21,156 | | | | 23,907 | |
Derivatives | | | 1,322 | | | | 1,352 | | | | 1,444 | |
Other liabilities | | | 171 | | | | 877 | | | | 223 | |
| | | | | | | | | | | | |
Total liabilities and equity | | | 28,824 | | | | 27,481 | | | | 30,178 | |
| | | | | | | | | | | | |
| * | Unaudited figures, to be read in conjunction with NIB’s 2016 audited financial statements. |
Loans outstanding
Total loans outstanding amounted to EUR 16,681 million which is EUR 1,023 million higher than at 30 April 2016. Total loans agreed in the period amounted to EUR 610 million, which is EUR 255 million less than for the same period in 2016; however, demand for NIB’s long-term financing remains strong and total disbursements are expected to increase in the coming months.
Lending
| | | | | | | | | | | | | | | | |
in EUR millions, unless otherwise specified | | Apr 2017 | | | 2016 | | | 2015 | | | 2014 | |
Loans agreed, including green bond investments, according to business areas: | | | 610 | | | | 4,363 | | | | 2,830 | | | | 2,389 | |
- Energy and environment | | | 29 | | | | 1,534 | | | | 710 | | | | 630 | |
- Infrastructure , transportation and telecom | | | — | | | | 1,198 | | | | 823 | | | | 557 | |
- Industries and services | | | 444 | | | | 912 | | | | 996 | | | | 926 | |
- Financial institutions and SMEs | | | 136 | | | | 720 | | | | 301 | | | | 277 | |
| | | | | | | | | | | | | | | | |
Loans disbursed, total | | | 781 | | | | 3,373 | | | | 2,716 | | | | 2,274 | |
| | | | | | | | | | | | | | | | |
Number of loan agreements, incl. green bond investments | | | 12 | | | | 66 | | | | 45 | | | | 45 | |
| | | | | | | | | | | | | | | | |
Repayments/prepayments | | | 549 | | | | 2,465 | | | | 2,351 | | | | 2,005 | |
| | | | | | | | | | | | | | | | |
Loans outstanding and guarantees | | | 16,681 | | | | 16,640 | | | | 15,627 | | | | 15,156 | |
- Member countries | | | 14,994 | | | | 14,831 | | | | 13,347 | | | | 12,705 | |
- Non-member countries | | | 1,722 | | | | 1,851 | | | | 2,341 | | | | 2,506 | |
| | | | | | | | | | | | | | | | |
Net loan losses | | | 7 | | | | -20 | | | | -3 | | | | -21 | |
| | | | | | | | | | | | | | | | |
7 (14)
| | |
| Nordic Investment Bank | | Interim Management Statement January–April 2017 |
Loans outstanding development during 2017 (EUR millions)
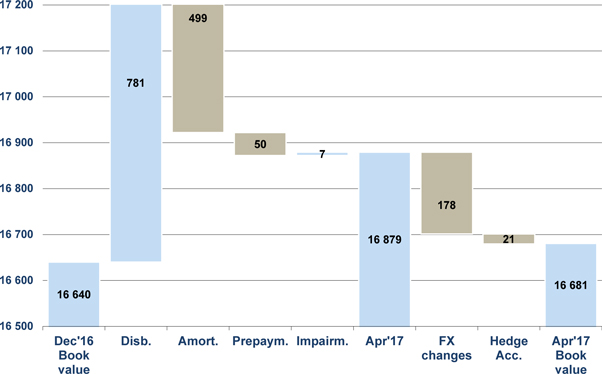
Total loans outstanding excluding exchange rate and valuation effects increased from EUR 16,640 million to EUR 16,879 million. The book value amounted to EUR 16,681 million due to foreign exchange and hedge accounting effects of EUR 178 million and EUR 21 million, respectively.
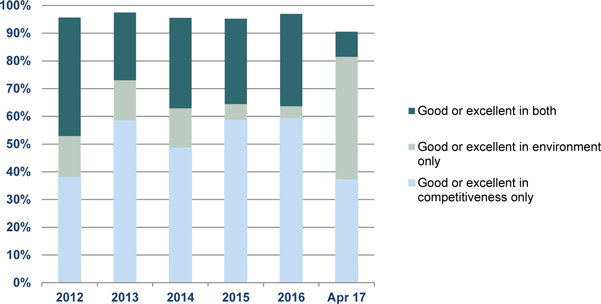
Mission fulfilment
Projects financed by the Bank are expected to contribute to the Bank’s mission of improving competitiveness and the environment in the Nordic–Baltic countries. Before approval is given in each individual case, all eligible investments are scrutinised and rated against the criteria developed on the basis of the Bank’s mission. In 2017, loans achieving a “good” or “excellent” mandate rating accounted for 91% of the total amount of loans agreed. Some 44% of the new lending is classified as environmental.
Mandate rating for agreed loans
(excluding lending green bond purchases)
8 (14)
| | |
| Nordic Investment Bank | | Interim Management Statement January–April 2017 |
Funding
The funding plan for 2017 is EUR 4.5 billion. The strategy for 2017 is to complete between one and three benchmark transactions in US dollars and/or euros, complemented by other public and private issues in order to maintain a diversified portfolio of currencies and a global investor base.
During the period, NIB raised EUR 2,543 million (Jan–Apr 2016: EUR 2,470 million) in new funding through 32 new bond issues. The Bank’s first global benchmark of the year was issued on 24 January. The five-year, USD 1.25 billion issue pays a semi-annual coupon of 2.125%, offering a spread of +23.5 basis points over the reference UST 2%, due in December 2021. This was equivalent to 17 basis points over mid swaps. During the first months of 2017, NIB also increased outstanding public issues by GBP 250 million and AUD 145 million. In the Nordic currencies, NOK 500 million and SEK 500 million were raised. In addition, private placements in ARS, BRL, EUR, INR, TRY and USD were issued.
9 (14)
| | |
| Nordic Investment Bank | | Interim Management Statement January–April 2017 |
Statement of comprehensive income
| | | | | | | | | | | | |
| EUR 1,000 | | Jan-Apr 2017* | | | Jan-Apr 2016* | | | Jan-Dec 2016 | |
Interest income | | | 100,254 | | | | 102,415 | | | | 311,856 | |
Interest expense | | | -20,017 | | | | -27,231 | | | | -70,047 | |
| | | | | | | | | | | | |
Net interest income | | | 80,237 | | | | 75,183 | | | | 241,809 | |
| | | |
Commission income and fees received | | | 1,980 | | | | 3,096 | | | | 13,124 | |
Commission expense and fees paid | | | -1,269 | | | | -1,072 | | | | -2,025 | |
| | | | | | | | | | | | |
Net fee and commission income | | | 711 | | | | 2,024 | | | | 11,099 | |
| | | |
Net profit/loss on financial operations | | | 39,417 | | | | -3,312 | | | | 23,292 | |
Foreign exchange gains and losses | | | -126 | | | | -52 | | | | 22 | |
| | | | | | | | | | | | |
Total operating income | | | 120,238 | | | | 73,842 | | | | 276,222 | |
| | | |
Expenses | | | | | | | | | | | | |
General administrative expenses | | | | | | | | | | | | |
Personnel expenses | | | -11,454 | | | | -11,362 | | | | -28,637 | |
Other administrative expenses | | | -4,959 | | | | -5,471 | | | | -13,617 | |
Depreciation | | | -625 | | | | -736 | | | | -2,319 | |
| | | | | | | | | | | | |
Total operating expenses | | | -17,037 | | | | -17,570 | | | | -44,573 | |
| | | | | | | | | | | | |
Profit before loan losses | | | 103,200 | | | | 56,272 | | | | 231,649 | |
Net loan losses | | | 7,103 | | | | -5,441 | | | | -19,839 | |
| | | | | | | | | | | | |
Net profit for the period | | | 110,304 | | | | 50,831 | | | | 211,810 | |
| | | |
Other comprehensive income** | | | | | | | | | | | | |
Items that will not be reclassified to income statement | | | | | | | | | | | | |
Valuation of cross currency basis spread | | | 12,388 | | | | -37,508 | | | | -28,202 | |
Items that will be reclassified to income statement | | | | | | | | | | | | |
Net change in cash flow hedge reserve | | | — | | | | -3,125 | | | | — | |
| | | | | | | | | | | | |
Total other comprehensive income | | | 12,388 | | | | -40,633 | | | | -28,202 | |
| | | | | | | | | | | | |
Total comprehensive income | | | 122,693 | | | | 10,199 | | | | 183,608 | |
| | | | | | | | | | | | |
| * | Unaudited figures, to be read in conjunction with NIB’s audited financial statements for 2016. |
| ** | The movement in the fair value of cross currency basis spreads if hedging swaps is recognised in the hedging reserve. The effective portion of net change in fair value hedging instruments of cash flow hedges is also recognised in the hedging reserve. These swaps will be held to maturity, and the unrealised gains and losses due to cross-currency basis spreads will be zero at maturity. |
10 (14)
| | |
| Nordic Investment Bank | | Interim Management Statement January–April 2017 |
Statement of financial position
| | | | | | | | | | | | |
| EUR 1,000 | | 30 Apr 2017* | | | 30 Apr 2016* | | | 31 Dec 2016 | |
ASSETS | | | | | | | | | | | | |
Cash and cash equivalents | | | 3,686,416 | | | | 3,687,423 | | | | 4,455,860 | |
Financial placements | | | | | | | | | | | | |
Placements with credit institutions | | | 8,771 | | | | 8,471 | | | | 8,771 | |
Debt securities | | | 6,511,382 | | | | 6,028,544 | | | | 6,572,244 | |
Other | | | 17,449 | | | | 22,080 | | | | 18,901 | |
| | | | | | | | | | | | |
| | | 6,537,602 | | | | 6,059,095 | | | | 6,599,916 | |
Loans outstanding | | | 16,680,661 | | | | 15,657,593 | | | | 16,640,030 | |
Intangible assets | | | 2,917 | | | | — | | | | 938 | |
Tangible assets, property and equipment | | | 27,234 | | | | 27,706 | | | | 26,723 | |
Other assets | | | | | | | | | | | | |
Derivatives | | | 1,636,182 | | | | 1,801,309 | | | | 2,156,921 | |
Other assets | | | 18,651 | | | | 24,582 | | | | 12,589 | |
| | | | | | | | | | | | |
| | | 1,654,833 | | | | 1,825,891 | | | | 2,169,510 | |
Accrued interest and fees receivable | | | 234,339 | | | | 223,346 | | | | 285,353 | |
| | | | | | | | | | | | |
TOTAL ASSETS | | | 28,824,003 | | | | 27,481,054 | | | | 30,178,330 | |
| | | | | | | | | | | | |
| | | |
LIABILITIES AND EQUITY | | | | | | | | | | | | |
Liabilities | | | | | | | | | | | | |
Short-term amounts owed to credit institutions | | | 992,617 | | | | 921,340 | | | | 1,310,873 | |
Long-term amounts owed to credit institutions | | | 14,882 | | | | 18,000 | | | | 17,973 | |
| | | | | | | | | | | | |
| | | 1,007,498 | | | | 939,340 | | | | 1,328,846 | |
Repurchase agreements | | | — | | | | 717,212 | | | | — | |
Debts evidenced by certificates | | | | | | | | | | | | |
Debt securities issued | | | 22,846,736 | | | | 21,095,828 | | | | 23,825,644 | |
Other debt | | | 79,743 | | | | 60,077 | | | | 81,745 | |
| | | | | | | | | | | | |
| | | 22,926,479 | | | | 21,155,905 | | | | 23,907,389 | |
Other liabilities | | | | | | | | | | | | |
Derivatives | | | 1,321,795 | | | | 1,352,191 | | | | 1,444,341 | |
Other liabilities | | | 11,786 | | | | 12,052 | | | | 11,355 | |
| | | | | | | | | | | | |
| | | 1,333,581 | | | | 1,364,242 | | | | 1,455,696 | |
Accrued interest and fees payable | | | 158,647 | | | | 147,659 | | | | 211,294 | |
| | | | | | | | | | | | |
Total liabilities | | | 25,426,205 | | | | 24,324,358 | | | | 26,903,225 | |
| | | |
Equity | | | 3,397,797 | | | | 3,156,696 | | | | 3,275,105 | |
| | | | | | | | | | | | |
| | | |
TOTAL LIABILITIES AND EQUITY | | | 28,824,003 | | | | 27,481,054 | | | | 30,178,330 | |
| | | | | | | | | | | | |
| * | Unaudited figures, to be read in conjunction with NIB’s audited financial statements for 2016. |
11 (14)
| | |
| Nordic Investment Bank | | Interim Management Statement January–April 2017 |
Statement of changes in equity
| | | | | | | | | | | | | | | | | | | | | | | | | | | | |
EUR 1,000 | | Paid-in
capital | | | Statutory
Reserve | | | General
Credit Risk
Fund | | | Special
Credit
Risk Fund
PIL | | | Funds
available for
appropriation | | | Hedging
Reserve | | | Total | |
Equity at 31 December 2015 | | | 418,602 | | | | 686,325 | | | | 1,430,252 | | | | 395,919 | | | | 215,398 | | | | 0 | | | | 3,146,497 | |
| | | | | | | | | | | | | | | | | | | | | | | | | | | | |
Profit for the period | | | — | | | | — | | | | — | | | | — | | | | 50,831 | | | | — | | | | 50,831 | |
Other comprehensive income | | | — | | | | — | | | | — | | | | — | | | | — | | | | -40,633 | | | | -40,633 | |
| | | | | | | | | | | | | | | | | | | | | | | | | | | | |
Total comprehensive income | | | 0 | | | | 0 | | | | 0 | | | | 0 | | | | 50,831 | | | | -40,633 | | | | 10,199 | |
| | | | | | | | | | | | | | | | | | | | | | | | | | | | |
Transaction with owners in their capacity as owners | | | | | | | | | | | | | | | | | | | | | | | | | | | | |
Appropriations between reserve funds | | | — | | | | — | | | | 110,398 | | | | 50,000 | | | | -160,398 | | | | — | | | | 0 | |
| | | | | | | | | | | | | | | | | | | | | | | | | | | | |
Equity at 30 April 2016 | | | 418,602 | | | | 686,325 | | | | 1,540,651 | | | | 445,919 | | | | 105,831 | | | | -40,633 | | | | 3,156,696 | |
| | | | | | | | | | | | | | | | | | | | | | | | | | | | |
Profit for the period | | | — | | | | — | | | | — | | | | — | | | | 160,979 | | | | | | | | 160,979 | |
Other comprehensive income | | | — | | | | — | | | | — | | | | — | | | | | | | | 12,430 | | | | 12,430 | |
| | | | | | | | | | | | | | | | | | | | | | | | | | | | |
Total comprehensive income | | | 0 | | | | 0 | | | | 0 | | | | 0 | | | | 160,979 | | | | 12,430 | | | | 173,409 | |
| | | | | | | | | | | | | | | | | | | | | | | | | | | | |
Transaction with owners in their capacity as owners | | | | | | | | | | | | | | | | | | | | | | | | | | | | |
Dividends | | | — | | | | — | | | | — | | | | — | | | | -55,000 | | | | — | | | | -55,000 | |
| | | | | | | | | | | | | | | | | | | | | | | | | | | | |
Equity at 31 December 2016 | | | 418,602 | | | | 686,325 | | | | 1,540,651 | | | | 445,919 | | | | 211,810 | | | | -28,202 | | | | 3,275,105 | |
| | | | | | | | | | | | | | | | | | | | | | | | | | | | |
Profit for the period | | | — | | | | — | | | | — | | | | — | | | | 110,304 | | | | — | | | | 110,304 | |
Other comprehensive income | | | — | | | | — | | | | — | | | | — | | | | — | | | | 12,388 | | | | 12,388 | |
| | | | | | | | | | | | | | | | | | | | | | | | | | | | |
Total comprehensive income | | | 0 | | | | 0 | | | | 0 | | | | 0 | | | | 110,304 | | | | 12,388 | | | | 122,693 | |
| | | | | | | | | | | | | | | | | | | | | | | | | | | | |
Transaction with owners in their capacity as owners | | | | | | | | | | | | | | | | | | | | | | | | | | | | |
Appropriations between reserve funds | | | — | | | | — | | | | 156,810 | | | | — | | | | -156,810 | | | | — | | | | 0 | |
| | | | | | | | | | | | | | | | | | | | | | | | | | | | |
Equity at 30 April 2017 | | | 418,602 | | | | 686,325 | | | | 1,697,461 | | | | 445,919 | | | | 165,304 | | | | -15,814 | | | | 3,397,797 | |
| | | | | | | | | | | | | | | | | | | | | | | | | | | | |
12 (14)
| | |
| Nordic Investment Bank | | Interim Management Statement January–April 2017 |
Cash flow statement
| | | | | | | | | | | | |
EUR 1,000 | | Jan-Apr 2017 | | | Jan-Apr 2016 | | | Jan-Dec 2016 | |
Cash flows from operating activities | | | | | | | | | | | | |
Net profit for the period | | | 110,304 | | | | 50,831 | | | | 211,810 | |
| | | |
Adjustments: | | | | | | | | | | | | |
Unrealised gains/losses of financial assets held at fair value | | | -28,674 | | | | -3,144 | | | | 1,548 | |
Depreciation and write-down in value of tangible and intangible assets | | | 625 | | | | 736 | | | | 2,319 | |
Change in accrued interest and fees (assets) | | | 51,014 | | | | 75,631 | | | | 13,625 | |
Change in accrued interest and fees (liabilities) | | | -52,647 | | | | -75,141 | | | | -11,506 | |
Net loan losses | | | -7,103 | | | | 5,441 | | | | 19,839 | |
Adjustment to hedge accounting | | | -9,119 | | | | 7,798 | | | | -4,271 | |
Other adjustments to the period’s profit | | | 2,918 | | | | 2,850 | | | | -628 | |
| | | | | | | | | | | | |
Adjustments, total | | | -42,988 | | | | 14,171 | | | | 20,926 | |
| | | |
Lending | | | | | | | | | | | | |
Disbursements of loans | | | -781,386 | | | | -627,128 | | | | -3,373,252 | |
Repayments of loans | | | 549,247 | | | | 606,243 | | | | 2,464,579 | |
Capitalisations, redenominations, index adjustments, etc. | | | -418 | | | | -1 | | | | -32 | |
Exchange rate adjustments | | | 178,124 | | | | 37,127 | | | | -110,135 | |
| | | | | | | | | | | | |
Lending, total | | | -54,433 | | | | 16,241 | | | | -1,018,840 | |
| | | | | | | | | | | | |
| | | |
Cash flows from operating activities, total | | | 12,884 | | | | 81,244 | | | | -786,103 | |
| | | |
Cash flows from investing activities | | | | | | | | | | | | |
Placements and debt securities | | | | | | | | | | | | |
Purchase of debt securities | | | -949,100 | | | | -803,263 | | | | -2,287,945 | |
Sold and matured debt securities | | | 961,841 | | | | 833,895 | | | | 1,843,682 | |
Placements with credit institutions | | | — | | | | -550 | | | | -850 | |
Other financial placements | | | 1,332 | | | | — | | | | 2,714 | |
Exchange rate adjustments, etc. | | | 47,809 | | | | 25,436 | | | | -47,891 | |
| | | | | | | | | | | | |
Placements and debt securities, total | | | 61,882 | | | | 55,518 | | | | -490,290 | |
| | | |
Other items | | | | | | | | | | | | |
Acquisition of intangible assets | | | -1,979 | | | | — | | | | -938 | |
Acquisition of tangible assets | | | -1,136 | | | | -83 | | | | -682 | |
Change in other assets | | | -5,149 | | | | -1,042 | | | | 10,698 | |
| | | | | | | | | | | | |
Other items, total | | | -8,264 | | | | -1,125 | | | | 9,078 | |
| | | | | | | | | | | | |
| | | |
Cash flows from investing activities, total | | | 53,618 | | | | 54,394 | | | | -481,212 | |
Cash flows from financing activities | | | | | | | | | | | | |
Debts evidenced by certificates | | | | | | | | | | | | |
Issues of new debt | | | 2,543,225 | | | | 2,470,388 | | | | 6,700,059 | |
Redemptions | | | -3,040,611 | | | | -3,399,482 | | | | -3,823,944 | |
Exchange rate adjustments | | | -521,712 | | | | -539,890 | | | | 380,563 | |
| | | | | | | | | | | | |
Debts evidenced by certificates, total | | | -1,019,097 | | | | -1,468,984 | | | | 3,256,678 | |
| | | |
Other items | | | | | | | | | | | | |
Long-term placements from credit institutions | | | -3,091 | | | | — | | | | -27 | |
Change in swap receivables | | | 541,892 | | | | 756,950 | | | | 265,363 | |
Change in swap payables | | | -37,825 | | | | -132,106 | | | | -86,468 | |
Change in other liabilities | | | 432 | | | | 2,106 | | | | 1,409 | |
Dividend paid | | | — | | | | — | | | | -55,000 | |
| | | | | | | | | | | | |
Other items, total | | | 501,408 | | | | 626,950 | | | | 125,277 | |
| | | | | | | | | | | | |
Cash flows from financing activities, total | | | -517,689 | | | | -842,034 | | | | 3,381,955 | |
| | | | | | | | | | | | |
| | | |
CHANGE IN CASH AND CASH EQUIVALENTS, NET | | | -451,188 | | | | -706,396 | | | | 2,114,639 | |
| | | | | | | | | | | | |
| | | |
Opening balance for cash and cash equivalents, net | | | 3,144,987 | | | | 1,030,348 | | | | 1,030,348 | |
| | | | | | | | | | | | |
Closing balance for cash and cash equivalents, net | | | 2,693,799 | | | | 323,952 | | | | 3,144,987 | |
| | | | | | | | | | | | |
| | | |
Additional information to the statement of cash flows | | | | | | | | | | | | |
Interest income received | | | 151,267 | | | | 178,046 | | | | 325,481 | |
Interest expense paid | | | -72,665 | | | | -102,373 | | | | -81,553 | |
13 (14)
| | |
| Nordic Investment Bank | | Interim Management Statement January–April 2017 |
Basis of preparation
This unaudited Interim Management Statement is not presented in accordance with IAS 34 Interim Financial Reporting.
The accounting policies and methods of computation are largely the same as described in Note 1 to the Financial Report 2016; however, the disclosure is significantly less.
Ratio definitions
| | |
| Equity/Total Assets = | | Total equity at reporting date Total assets at reporting date |
| |
| Profit/average equity = | | Annualised profit for the period Average equity for the period |
| |
| Cost/income = | | Total operating expenses for the period Total operating income for the period |
14 (14)