Exhibit X
| | |
| Nordic Investment Bank | | Interim Management Statement January–August 2017 |
Table of Contents
| | | | |
Highlights | | | 3 | |
| |
Key figures and ratios | | | 3 | |
| |
President and CEO’s comments | | | 4 | |
| |
Operating and financial review | | | | |
Comprehensive income | | | 5 | |
Financial position | | | 6 | |
| |
Financial statements | | | | |
| |
Statement of comprehensive income | | | 10 | |
Statement of financial position | | | 11 | |
Statement of changes in equity | | | 12 | |
Cash flow statement | | | 13 | |
Net interest income | | | 14 | |
Net profit on financial operations | | | 14 | |
Loan impairment provisions | | | 14 | |
Basis of preparation | | | 15 | |
| |
Ratio definitions | | | 15 | |
2 (15)
| | |
| Nordic Investment Bank | | Interim Management Statement January–August 2017 |
Highlights
In the first eight months of the year, the need for long-term financing from the municipal sector in the Bank’s member countries has been the main driver. The Bank also had continued demand for long-term financing in the private sector, with loans disbursed to financial intermediaries to support SMEs, and also loans to large member country corporates to finance R&D. The flow of deals in the Bank’s lending continued to be at a high level, with a total of EUR 1,996 million in loans agreed and EUR 1,813 million in loans disbursed.
Key figures and ratios
| | | | | | | | | | | | |
(in EUR millions unless otherwise specified) | | Aug 2017* | | | Aug 2016* | | | Dec 2016 | |
Net interest income | | | 161 | | | | 159 | | | | 242 | |
Profit before net loan losses | | | 149 | | | | 157 | | | | 232 | |
Net profit | | | 160 | | | | 145 | | | | 212 | |
Loans disbursed | | | 1,813 | | | | 1,946 | | | | 3,373 | |
Loans agreed | | | 1,996 | | | | 2,545 | | | | 4,363 | |
Mandate fulfilment, %** | | | 96 | % | | | 95 | % | | | 96 | % |
Loans outstanding | | | 17,127 | | | | 16,158 | | | | 16,640 | |
Total assets | | | 28,338 | | | | 27,611 | | | | 30,178 | |
New debt issues | | | 4,027 | | | | 4,470 | | | | 6,700 | |
Debts evidenced by certificates | | | 22,718 | | | | 21,746 | | | | 23,907 | |
Total equity | | | 3,394 | | | | 3,186 | | | | 3,275 | |
Equity / total assets (%)*** | | | 12.0 | % | | | 11.5 | % | | | 10.9 | % |
Profit / average equity (%) *** | | | 7.1 | % | | | 6.9 | % | | | 6.7 | % |
- Operating profit / average equity (%) *** | | | 6.7 | % | | | 6.5 | % | | | 6.5 | % |
Cost / income (%)*** | | | 16.2 | % | | | 16.0 | % | | | 16.1 | % |
- Operating cost / income (%) *** | | | 17.1 | % | | | 16.6 | % | | | 16.4 | % |
Number of employees (average during the year) | | | 191 | | | | 191 | | | | 192 | |
| * | Unaudited figures, to be read in conjunction with NIB’s 2016 audited financial statements. |
| ** | see page 7 for mandate fulfilment explanation |
| *** | see page 15 for ratio definitions |
3 (15)
| | |
| Nordic Investment Bank | | Interim Management Statement January–August 2017 |
Comments on NIB’s financial figures for January–August 2017
The purpose of the Nordic Investment Bank is to finance projects that improve the competitiveness and environment of the Nordic and Baltic countries. Demand for long-term financing from NIB has been good, and a total of EUR 1,813 million in loans has been disbursed (January–August 2016: EUR 1,946 million).
The main driver for the continuing strong demand for long-term financing is the need to update public infrastructure in the member countries. Proceeds have been used for upgrading and replacing infrastructure in the areas of water supply and wastewater treatment, energy generation and distribution, as well as public transportation and road infrastructure. NIB also experienced continued demand from the private sector for long-term financing, with loans disbursed to financial intermediates for on-lending to SMEs and to large member country corporates for investments in R&D.
NIB assesses all projects it finances and scores them on their competitiveness and environmental impact in the Nordic–Baltic countries. Only projects that contribute sufficiently strongly to NIB’s mandate fulfilment qualify for loan approval. Well above 90% of all projects financed this year have been assessed to have a significant positive impact on the competitiveness and/or environment of the region.
The profit for the period amounted to EUR 160 million, up from EUR 145 million in the same period a year ago.
During the first eight months, the Bank carried out 44 new funding transactions and raised EUR 4.0 billion (Jan–Aug 2016: EUR 4.5 billion). The Bank expects to fund between EUR 4.5 billion and EUR 5.5 billion for the full year.
Given the good loan pipeline, the flows of deals and new disbursements are expected to continue at the same pace for the rest of the year.
Henrik Normann
President & CEO
4 (15)
| | |
| Nordic Investment Bank | | Interim Management Statement January–August 2017 |
Operating and financial review
January–August 2017 compared to January–August 2016
Comprehensive Income
Net Profit
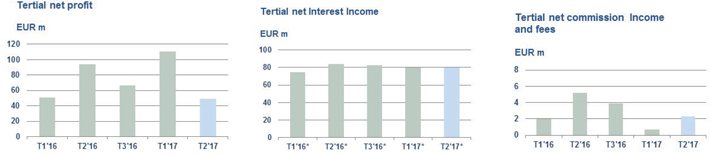
The net profit for the period January–August 2017 totalled EUR 159.9 million, up from EUR 145.0 million in the same period last year. Total operating income decreased from EUR 187.2 million in 2016 to EUR 178.0 million. Total operating expenses decreased by EUR 1.0 million to EUR 28.9 million, resulting in profit before net losses reaching EUR 149.2 million (January–August 2016: EUR 157.3 million).
Net profit increased by EUR 14.9 million, mainly due to reversals of loan loss provisions of EUR 10.7 million.
Net interest income
Net interest income for the period amounted to EUR 160.5 million (January–August 2016: EUR 159.0 million). The adverse impact of the negative interest rates has been mitigated by increased volumes of loans outstanding compared to the same period in 2016.
Net commission income and fees
Fee and commission income for the period January–August 2017 was EUR 3.0 million, compared to EUR 7.2 million in 2016, mainly as a result of lower prepayments.
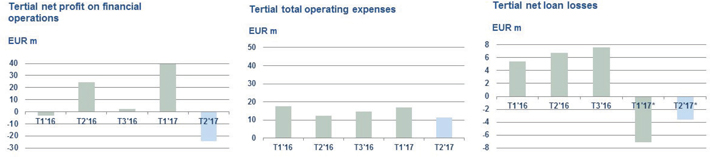
Net profit on financial operations
The profit on financial operations for the period January–August 2017 totalled EUR 15.0 million, which was EUR 5.9 million lower than the same period in 2016. The result comprises realised profit of EUR 5.6 million and unrealised profit of EUR 9.4 million. The unrealised profit is driven by positive valuation effects from spread tightening as well as hedge accounting valuations. These gains are expected to reverse as the underlying transactions reach maturity.
Total operating expenses
Total operating expenses were EUR 1.0 million lower than in 2016. The Bank continues to focus on costs to ensure an efficient operating cost/income ratio.
Net loan losses
The total provision for loan losses at period end amounted to EUR 123.3 million, down from EUR 139.4 million on 31 December 2016. The decrease was mainly due to a reduction in the collectively assessed impairment allowances and foreign exchange translation effects. There were no new individual assessed impairments during the period; however, existing provisions were modified, resulting in a net increase of EUR 2.2 million.
| * | T3 – September to December |
5 (15)
| | |
| Nordic Investment Bank | | Interim Management Statement January–August 2017 |
Other comprehensive income
The Bank separates the foreign currency basis spread from financial instruments used in fair value hedging, and this separated amount is recorded in “Other comprehensive income” (OCI). The valuation of foreign currency basis spread will be zero upon maturity, and therefore, the amount recorded in OCI will not be reclassified in the income statement.
OCI amounted to EUR 14.4 million for the period January–August 2017. In 2016, the amount was EUR - 50.2 million comprising of EUR -54.1 million related to cross currency basis spread with additional cash flow hedge reserve movements of EUR 3.9 million. The resulting total comprehensive income for the period amounted to EUR 174.3 million, compared to EUR 94.8 million in 2016.
| | | | |
| | | | * The net loan loss gains for the periods ended April 2017 and 31 August 2017 are mainly due to loan impairment reversals. |
Financial position
| | | | | | | | | | | | |
(in EUR millions) | | Aug 2017* | | | Aug 2016* | | | Dec 2016 | |
Cash and cash equivalents | | | 3,341 | | | | 2,665 | | | | 4,456 | |
Financial placements | | | 6,446 | | | | 6,394 | | | | 6,600 | |
Loans outstanding | | | 17,127 | | | | 16,158 | | | | 16,640 | |
Derivatives | | | 1,116 | | | | 2,097 | | | | 2,157 | |
Other assets | | | 308 | | | | 297 | | | | 325 | |
| | | | | | | | | | | | |
Total assets | | | 28,338 | | | | 27,611 | | | | 30,178 | |
| | | |
Equity | | | 3,394 | | | | 3,186 | | | | 3,275 | |
Owed to credit institutions | | | 534 | | | | 1,133 | | | | 1,329 | |
Debts evidenced by certificates | | | 22,718 | | | | 21,746 | | | | 23,907 | |
Derivatives | | | 1,506 | | | | 1,261 | | | | 1,444 | |
Other liabilities | | | 186 | | | | 285 | | | | 223 | |
| | | | | | | | | | | | |
Total liabilities and equity | | | 28,338 | | | | 27,611 | | | | 30,178 | |
| | | | | | | | | | | | |
| * | Unaudited figures, to be read in conjunction with NIB’s 2016 audited financial statements. |
Loans outstanding
Total loans outstanding amounted to EUR 17,127 million, which is EUR 969 million higher than on 31 August 2016. Total loans agreed in the period amounted to EUR 1,996 million, which is EUR 549 million less than for the same period in 2016; however, demand for NIB’s long-term financing remains strong and total disbursements are expected to increase in the coming months.
6 (15)
| | |
| Nordic Investment Bank | | Interim Management Statement January–August 2017 |
Loans outstanding development during 2017
(in EUR millions)
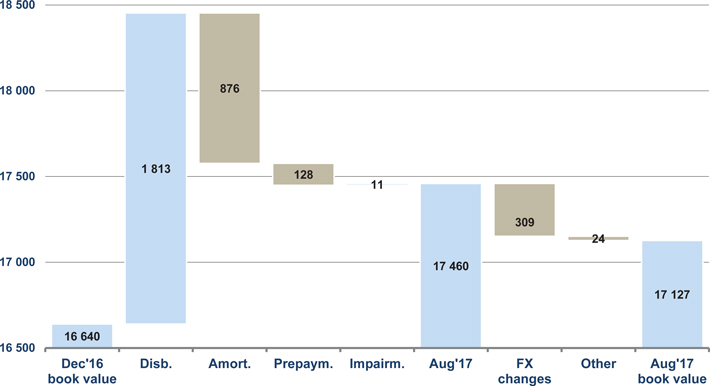
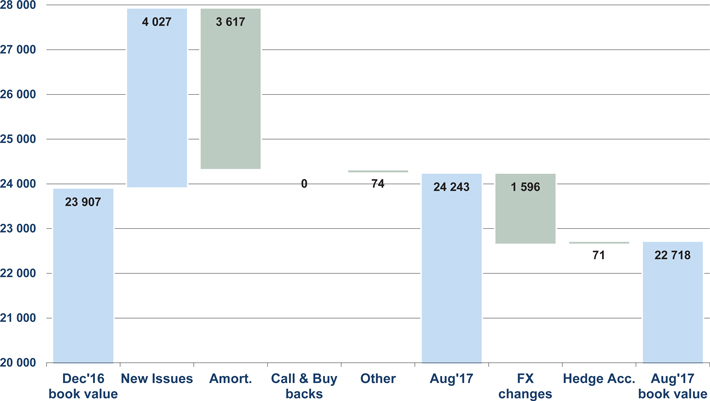
Total loans outstanding, excluding exchange rate and valuation effects, increased from EUR 16,640 million to EUR 17,460 million. The book value amounted to EUR 17,127 million due to foreign exchange, valuation of lending green bonds and hedge accounting effects of EUR 309 million and EUR 24 million, respectively.
Lending Highlights
| | | | | | | | | | | | | | | | |
(in EUR millions, unless otherwise specified) | | Aug 2017 | | | 2016 | | | 2015 | | | 2014 | |
Loans agreed according to business area: | | | 1,996 | | | | 4,363 | | | | 2,830 | | | | 2,389 | |
- Energy and environment | | | 276 | | | | 1,534 | | | | 710 | | | | 630 | |
- Infrastructure , transportation and telecom | | | 737 | | | | 1,198 | | | | 823 | | | | 557 | |
- Industries and services | | | 766 | | | | 912 | | | | 996 | | | | 926 | |
- Financial institutions and SMEs | | | 217 | | | | 720 | | | | 301 | | | | 277 | |
Number of loan agreements | | | 31 | | | | 66 | | | | 45 | | | | 45 | |
Loans disbursed, total | | | 1,813 | | | | 3,373 | | | | 2,716 | | | | 2,274 | |
Repayments / prepayments | | | 1,004 | | | | 2,471 | | | | 2,351 | | | | 2,005 | |
Loans outstanding and guarantees | | | 17,127 | | | | 16,640 | | | | 15,627 | | | | 15,156 | |
- Member countries | | | 15,610 | | | | 14,831 | | | | 13,347 | | | | 12,705 | |
- Non-member countries | | | 1,640 | | | | 1,948 | | | | 2,396 | | | | 2,558 | |
- Impairment provision | | | -123 | | | | -139 | | | | -116 | | | | -107 | |
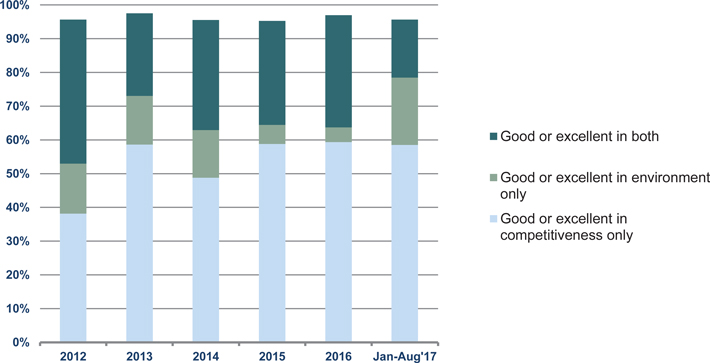
Mission fulfilment
Projects financed by the Bank through loans are expected to contribute to the Bank’s mission of improving competitiveness and the environment in the Nordic–Baltic countries. Before approval is given in each individual case, all eligible projects are scrutinised and rated against the criteria developed based on the Bank’s mission. In 2017, loans achieving a “good” or “excellent” mandate rating accounted for 96% of the total amount of loans agreed.
7 (15)
| | |
| Nordic Investment Bank | | Interim Management Statement January–August 2017 |
Mandate rating for agreed loans
(Excluding lending green bond purchases)
Funding
The Bank expects to raise between EUR 4.5 billion and EUR 5.5 billion of new funding during 2017. The total amount depends on how much collateral the Bank needs to fund to warehouse as liquidity.
The strategy for 2017 is to issue between one and three benchmark transactions in US dollars and/or euros, complemented by other public and private issues in order to maintain a diversified portfolio of currencies and a global investor base. In addition, the Bank aims to continue issuing NIB Environmental Bonds (NEBs).
During the period, NIB raised EUR 4,027 million (January–August 2016: EUR 4,470 million) in new funding through 44 new issues. The Bank’s first global benchmark of the year was issued on 24 January. The five-year, USD 1.25 billion issue was sold globally, with 51% going into EMEA (Europe, Middle East and Africa), 28% into the Americas and 21% into Asia.
In May 2017, the Bank issued its first NIB Environmental Bond for the year by increasing its outstanding NEB 2024 by a further EUR 500 million, taking the amount outstanding to a total of EUR 1 billion. This is the biggest outstanding environmental bond by NIB so far. The issue will finance environmental projects mainly located in the Nordic region.
In August 2017, the Bank issued a five-year, SEK 2 billion environmental bond. This is the largest environmental bond NIB has issued in Swedish kronor. The bond was sold to Swedish investors.
Also in August, the Bank issued a two-year, USD 500 million transaction under its global USD programme for collateral purposes. Further, the Bank increased outstanding public issues by GBP 250 million and AUD 270 million. In addition, private placements have been issued in various currencies.
8 (15)
| | |
| Nordic Investment Bank | | Interim Management Statement January–August 2017 |
Debt development during 2017
in EUR millions
9 (15)
| | |
| Nordic Investment Bank | | Interim Management Statement January–August 2017 |
Statement of comprehensive income
| | | | | | | | | | | | |
EUR 1,000 | | Jan-Aug 2017* | | | Jan-Aug 2016* | | | Jan-Dec 2016 | |
Interest income | | | 202,389 | | | | 208,189 | | | | 311,856 | |
Interest expense | | | -41,863 | | | | -49,141 | | | | -70,047 | |
| | | | | | | | | | | | |
Net interest income | | | 160,526 | | | | 159,048 | | | | 241,809 | |
| | | |
Commission income and fees received | | | 4,975 | | | | 8,823 | | | | 13,124 | |
Commission expense and fees paid | | | -1,998 | | | | -1,578 | | | | -2,025 | |
| | | | | | | | | | | | |
Net fee and commission income | | | 2,977 | | | | 7,245 | | | | 11,099 | |
| | | |
Net profit/loss on financial operations | | | 15,027 | | | | 20,929 | | | | 23,292 | |
Foreign exchange gains and losses | | | -481 | | | | -23 | | | | 22 | |
| | | | | | | | | | | | |
Total operating income | | | 178,049 | | | | 187,199 | | | | 276,222 | |
| | | |
Expenses | | | | | | | | | | | | |
General administrative expenses | | | | | | | | | | | | |
Personnel expenses | | | -19,519 | | | | -19,279 | | | | -28,637 | |
Other administrative expenses | | | -8,124 | | | | -9,143 | | | | -13,617 | |
Depreciation | | | -1,238 | | | | -1,474 | | | | -2,319 | |
| | | | | | | | | | | | |
Total operating expenses | | | -28,881 | | | | -29,897 | | | | -44,573 | |
| | | |
Profit before loan losses | | | 149,168 | | | | 157,302 | | | | 231,649 | |
Net loans losses | | | 10,727 | | | | -12,285 | | | | -19,839 | |
| | | | | | | | | | | | |
Net profit for the period | | | 159,896 | | | | 145,017 | | | | 211,810 | |
| | | |
Other comprehensive income** | | | | | | | | | | | | |
Items that will not be reclassified to income statement | | | | | | | | | | | | |
Valuation of cross currency basis spread | | | 14,447 | | | | -54,114 | | | | -28,202 | |
Items that will be reclassified to income statement | | | | | | | | | | | | |
Net change in cash flow hedge reserve | | | — | | | | 3,911 | | | | — | |
| | | | | | | | | | | | |
Total other comprehensive income | | | 14,447 | | | | -50,203 | | | | -28,202 | |
| | | | | | | | | | | | |
Total comprehensive income | | | 174,342 | | | | 94,814 | | | | 183,608 | |
| | | | | | | | | | | | |
| * | Unaudited figures, to be read in conjunction with NIB’s audited financial statements for 2016. |
| ** | The movement in the fair value of cross currency basis spreads if hedging swaps is recognised in the hedging reserve. |
These swaps will be held to maturity, and the unrealised gains and losses due to cross-currency basis spreads will be zero at maturity.
10 (15)
| | |
| Nordic Investment Bank | | Interim Management Statement January–August 2017 |
Statement of financial position
| | | | | | | | | | | | |
EUR 1,000 | | 31 Aug 2017* | | | 31 Aug 2016* | | | 31 Dec 2016 | |
ASSETS | | | | | | | | | | | | |
Cash and cash equivalents | | | 3,340,509 | | | | 2,665,268 | | | | 4,455,860 | |
Financial placements | | | | | | | | | | | | |
Placements with credit institutions | | | 8,771 | | | | 8,771 | | | | 8,771 | |
Debt securities | | | 6,423,279 | | | | 6,362,508 | | | | 6,572,244 | |
Other | | | 14,254 | | | | 22,508 | | | | 18,901 | |
| | | | | | | | | | | | |
| | | 6,446,304 | | | | 6,393,788 | | | | 6,599,916 | |
| | | |
Loans outstanding | | | 17,127,283 | | | | 16,157,795 | | | | 16,640,030 | |
Intangible assets | | | 4,022 | | | | — | | | | 938 | |
Tangible assets, property and equipment | | | 28,922 | | | | 27,002 | | | | 26,723 | |
Other assets | | | | | | | | | | | | |
Derivatives | | | 1,115,858 | | | | 2,096,524 | | | | 2,156,921 | |
Other assets | | | 19,995 | | | | 20,468 | | | | 12,589 | |
| | | | | | | | | | | | |
| | | 1,135,853 | | | | 2,116,992 | | | | 2,169,510 | |
Accrued interest and fees receivable | | | 255,498 | | | | 250,444 | | | | 285,353 | |
| | | | | | | | | | | | |
TOTAL ASSETS | | | 28,338,391 | | | | 27,611,289 | | | | 30,178,330 | |
| | | | | | | | | | | | |
| | | |
LIABILITIES AND EQUITY | | | | | | | | | | | | |
Liabilities | | | | | | | | | | | | |
Short-term amounts owed to credit institutions | | | 516,953 | | | | 1,114,959 | | | | 1,310,873 | |
Long-term amounts owed to credit institutions | | | 17,327 | | | | 17,973 | | | | 17,973 | |
| | | | | | | | | | | | |
| | | 534,280 | | | | 1,132,931 | | | | 1,328,846 | |
| | | |
Repurchase agreements | | | — | | | | 104,211 | | | | — | |
Debts evidenced by certificates | | | | | | | | | | | | |
Debt securities issued | | | 22,651,354 | | | | 21,686,248 | | | | 23,825,644 | |
Other debt | | | 66,950 | | | | 59,600 | | | | 81,745 | |
| | | | | | | | | | | | |
| | | 22,718,304 | | | | 21,745,847 | | | | 23,907,389 | |
Other liabilities | | | | | | | | | | | | |
Derivatives | | | 1,506,119 | | | | 1,261,293 | | | | 1,444,341 | |
Other liabilities | | | 11,967 | | | | 11,971 | | | | 11,355 | |
| | | | | | | | | | | | |
| | | 1,518,086 | | | | 1,273,264 | | | | 1,455,696 | |
Accrued interest and fees payable | | | 173,275 | | | | 168,723 | | | | 211,294 | |
| | | | | | | | | | | | |
Total liabilities | | | 24,943,944 | | | | 24,424,978 | | | | 26,903,225 | |
| | | |
Equity | | | 3,394,447 | | | | 3,186,311 | | | | 3,275,105 | |
| | | | | | | | | | | | |
TOTAL LIABILITIES AND EQUITY | | | 28,338,391 | | | | 27,611,289 | | | | 30,178,330 | |
| | | | | | | | | | | | |
| * | Unaudited figures, to be read in conjunction with NIB’s audited financial statements for 2016. |
11 (15)
| | |
| Nordic Investment Bank | | Interim Management Statement January–August 2017 |
Statement of changes in equity
| | | | | | | | | | | | | | | | | | | | | | | | | | | | |
EUR 1,000 | | Paid-in
capital | | | Statutory
reserve | | | General
Credit Risk
Fund | | | Special
Credit Risk
Fund PIL | | | Funds
available for
appropriation | | | Hedging
reserve | | | Total | |
Equity at 31 December 2015 | | | 418,602 | | | | 686,325 | | | | 1,430,252 | | | | 395,919 | | | | 215,398 | | | | 0 | | | | 3,146,497 | |
| | | | | | | | | | | | | | | | | | | | | | | | | | | | |
Profit for the period | | | — | | | | — | | | | — | | | | — | | | | 145,017 | | | | — | | | | 145,017 | |
Other comprehensive income | | | — | | | | — | | | | — | | | | — | | | | | | | | -50,203 | | | | -50,203 | |
| | | | | | | | | | | | | | | | | | | | | | | | | | | | |
Total comprehensive income | | | 0 | | | | 0 | | | | 0 | | | | 0 | | | | 145,017 | | | | -50,203 | | | | 94,814 | |
| | | | | | | | | | | | | | | | | | | | | | | | | | | | |
Transaction with owners in their capacity as owners | | | | | | | | | | | | | | | | | | | | | | | | | | | | |
Appropriations between reserve funds | | | — | | | | — | | | | 110,398 | | | | 50,000 | | | | -160,398 | | | | — | | | | 0 | |
Dividends | | | — | | | | — | | | | — | | | | — | | | | -55,000 | | | | — | | | | -55,000 | |
| | | | | | | | | | | | | | | | | | | | | | | | | | | | |
Equity at 31 August 2016 | | | 418,602 | | | | 686,325 | | | | 1,540,651 | | | | 445,919 | | | | 145,017 | | | | -50,203 | | | | 3,186,311 | |
| | | | | | | | | | | | | | | | | | | | | | | | | | | | |
Profit for the period | | | — | | | | — | | | | — | | | | — | | | | 66,793 | | | | — | | | | 66,793 | |
Other comprehensive income | | | — | | | | — | | | | — | | | | — | | | | | | | | 22,000 | | | | 22,000 | |
| | | | | | | | | | | | | | | | | | | | | | | | | | | | |
Total comprehensive income | | | 0 | | | | 0 | | | | 0 | | | | 0 | | | | 66,793 | | | | 22,000 | | | | 88,793 | |
| | | | | | | | | | | | | | | | | | | | | | | | | | | | |
| | | | | | | |
Equity at 31 December 2016 | | | 418,602 | | | | 686,325 | | | | 1,540,651 | | | | 445,919 | | | | 211,810 | | | | -28,202 | | | | 3,275,105 | |
| | | | | | | | | | | | | | | | | | | | | | | | | | | | |
Profit for the period | | | — | | | | — | | | | — | | | | — | | | | 159,896 | | | | — | | | | 159,896 | |
Other comprehensive income | | | — | | | | — | | | | — | | | | — | | | | | | | | 14,447 | | | | 14,447 | |
| | | | | | | | | | | | | | | | | | | | | | | | | | | | |
Total comprehensive income | | | 0 | | | | 0 | | | | 0 | | | | 0 | | | | 159,896 | | | | 14,447 | | | | 174,342 | |
| | | | | | | | | | | | | | | | | | | | | | | | | | | | |
Transaction with owners in their capacity as owners | | | | | | | | | | | | | | | | | | | | | | | | | | | | |
Appropriations between reserve funds | | | — | | | | — | | | | 156,810 | | | | — | | | | -156,810 | | | | — | | | | 0 | |
| | | | | | | | | | | | | | | | | | | | | | | | | | | | |
Dividends | | | — | | | | — | | | | | | | | — | | | | -55,000 | | | | — | | | | -55,000 | |
| | | | | | | | | | | | | | | | | | | | | | | | | | | | |
Equity at 31 August 2017 | | | 418,602 | | | | 686,325 | | | | 1,697,461 | | | | 445,919 | | | | 159,896 | | | | -13,756 | | | | 3,394,447 | |
| | | | | | | | | | | | | | | | | | | | | | | | | | | | |
12 (15)
| | |
| Nordic Investment Bank | | Interim Management Statement January–August 2017 |
Cash flow statement
| | | | | | | | | | | | |
EUR 1,000 | | Jan-Aug 2017* | | | Jan-Aug 2016* | | | Jan-Dec 2016 | |
Cash flows from operating activities | | | | | | | | | | | | |
Net profit for the period | | | 159,896 | | | | 145,017 | | | | 211,810 | |
| | | |
Adjustments: | | | | | | | | | | | | |
Unrealised gains/losses of financial assets held at fair value | | | -9,394 | | | | -8,872 | | | | 1,548 | |
Depreciation and write-down in value of tangible and intangible assets | | | 1,238 | | | | 1,474 | | | | 2,319 | |
Change in accrued interest and fees (assets) | | | 29,854 | | | | 48,533 | | | | 13,625 | |
Change in accrued interest and fees (liabilities) | | | -38,019 | | | | -54,077 | | | | -11,506 | |
Impairment of loans | | | -10,727 | | | | 12,285 | | | | 19,839 | |
Adjustment to hedge accounting | | | -606 | | | | -508 | | | | -4,271 | |
Other adjustments to the period’s profit | | | -122 | | | | 2,254 | | | | -628 | |
| | | | | | | | | | | | |
Adjustments, total | | | -27,777 | | | | 1,089 | | | | 20,926 | |
| | | |
| | | | | | | | | | | | |
Lending | | | | | | | | | | | | |
Disbursements of loans | | | -1,813,276 | | | | -1,945,973 | | | | -3,373,252 | |
Repayments of loans | | | 1,004,340 | | | | 1,427,981 | | | | 2,464,579 | |
Capitalisations, redenominations, index adjustments, etc. | | | 80 | | | | -26 | | | | -32 | |
Exchange rate adjustments | | | 308,575 | | | | 76,667 | | | | -110,135 | |
| | | | | | | | | | | | |
Lending, total | | | -500,280 | | | | -441,351 | | | | -1,018,840 | |
| | | | | | | | | | | | |
| | | |
Cash flows from operating activities, total | | | -368,162 | | | | -295,245 | | | | -786,103 | |
| | | | | | | | | | | | |
Cash flows from investing activities | | | | | | | | | | | | |
| | | |
Placements and debt securities | | | | | | | | | | | | |
Purchase of debt securities | | | -1,339,955 | | | | -1,533,672 | | | | -2,287,945 | |
Sold and matured debt securities | | | 1,361,204 | | | | 1,245,378 | | | | 1,843,682 | |
Placements with credit institutions | | | — | | | | -850 | | | | -850 | |
Other financial placements | | | 2,312 | | | | 320 | | | | 2,714 | |
Exchange rate adjustments, etc. | | | 131,424 | | | | 18,093 | | | | -47,891 | |
| | | | | | | | | | | | |
Placements and debt securities, total | | | 154,985 | | | | -270,731 | | | | -490,290 | |
| | | | | | | | | | | | |
| | | |
Other items | | | | | | | | | | | | |
Acquisition of intangible assets | | | -3,084 | | | | — | | | | -938 | |
Acquisition of tangible assets | | | -3,437 | | | | -117 | | | | -682 | |
Change in other assets | | | -6,492 | | | | 5,430 | | | | 10,698 | |
| | | | | | | | | | | | |
Other items, total | | | -13,013 | | | | 5,313 | | | | 9,078 | |
| | | | | | | | | | | | |
| | | |
Cash flows from investing activities, total | | | 141,972 | | | | -265,418 | | | | -481,212 | |
| | | | | | | | | | | | |
| | | |
Cash flows from financing activities | | | | | | | | | | | | |
| | | |
Debts evidenced by certificates | | | | | | | | | | | | |
Issues of new debt | | | 4,027,428 | | | | 4,469,633 | | | | 6,700,059 | |
Redemptions | | | -3,691,128 | | | | -3,607,799 | | | | -3,823,944 | |
Exchange rate adjustments | | | -1,595,551 | | | | -254,537 | | | | 380,563 | |
| | | | | | | | | | | | |
Debts evidenced by certificates, total | | | -1,259,252 | | | | 607,297 | | | | 3,256,678 | |
| | | | | | | | | | | | |
| | | |
Other items | | | | | | | | | | | | |
Long-term placements from credit institutions | | | -645 | | | | -27 | | | | -27 | |
Change in swap receivables | | | 1,029,728 | | | | 575,541 | | | | 265,363 | |
Change in swap payables | | | 189,316 | | | | -211,784 | | | | -86,468 | |
Change in other liabilities | | | 612 | | | | 2,025 | | | | 1,409 | |
Dividend paid | | | -55,000 | | | | -55,000 | | | | -55,000 | |
| | | | | | | | | | | | |
Other items, total | | | 1,164,010 | | | | 310,756 | | | | 125,277 | |
| | | | | | | | | | | | |
| | | |
Cash flows from financing activities, total | | | -95,241 | | | | 918,053 | | | | 3,381,955 | |
| | | |
CHANGE IN CASH AND CASH EQUIVALENTS, NET | | | -321,431 | | | | 357,390 | | | | 2,114,639 | |
| | | | | | | | | | | | |
| | | |
Opening balance for cash and cash equivalents, net | | | 3,144,987 | | | | 1,030,348 | | | | 1,030,348 | |
Closing balance for cash and cash equivalents, net | | | 2,823,556 | | | | 1,387,738 | | | | 3,144,987 | |
| | | |
Additional information to the statement of cash flows | | | | | | | | | | | | |
Interest income received | | | 232,243 | | | | 256,722 | | | | 325,481 | |
Interest expense paid | | | -79,882 | | | | -103,218 | | | | -81,553 | |
| * | Unaudited figures, to be read in conjunction with NIB’s audited financial statements for 2016. |
The cash flow statement has been prepared using the indirect method and cash flow items cannot be directly concluded from the statements of financial positions.
13 (15)
| | |
| Nordic Investment Bank | | Interim Management Statement January–August 2017 |
Net interest income
| | | | | | | | | | | | |
EUR 1,000 | | Jan-Aug 2017 | | | Jan-Aug 2016 | | | Jan-Dec 2016 | |
Cash and cash equivalents | | | -9,128 | | | | 1,562 | | | | -1,643 | |
Placements with credit institutions for more than 6 months | | | -38 | | | | -107 | | | | -147 | |
Debt securities | | | 43,154 | | | | 46,919 | | | | 70,117 | |
Loans outstanding | | | 168,040 | | | | 159,262 | | | | 242,510 | |
Other interest income | | | 361 | | | | 554 | | | | 1,019 | |
| | | | | | | | | | | | |
Total interest income | | | 202,389 | | | | 208,189 | | | | 311,856 | |
| | | |
Short-term amounts owed to credit institutions | | | -1,467 | | | | 2,430 | | | | 1,345 | |
Long-term amounts owed to credit institutions | | | -50 | | | | -32 | | | | -60 | |
Short-term repurchase agreements | | | — | | | | -419 | | | | -436 | |
Debts evidenced by certificates | | | 355,047 | | | | 316,498 | | | | 487,060 | |
Swap contracts and other interest expenses, net | | | -311,667 | | | | -269,337 | | | | -417,861 | |
| | | | | | | | | | | | |
Total interest expense | | | 41,863 | | | | 49,141 | | | | 70,047 | |
| | | | | | | | | | | | |
Net interest income | | | 160,526 | | | | 159,048 | | | | 241,809 | |
| | | | | | | | | | | | |
Net profit on financial operations
| | | | | | | | | | | | |
EUR 1,000 | | Jan-Aug 2017 | | | Jan-Aug 2016 | | | Jan-Dec 2016 | |
Financial instruments held at fair value, realised gains and losses | | | 5,275 | | | | 10,163 | | | | 16,096 | |
Financial instruments held at fair value, unrealised gains and losses | | | 8,863 | | | | 7,082 | | | | -280 | |
Financial instruments held at amortised cost, realised gains and losses | | | 184 | | | | 1,062 | | | | 1,062 | |
Adjustment to hedge accounting, unrealised gains and losses of fair value hedges | | | 606 | | | | 508 | | | | 4,271 | |
Repurchase of NIB bonds, other items | | | 99 | | | | 2,113 | | | | 2,142 | |
| | | | | | | | | | | | |
Net profit on financial operations | | | 15,027 | | | | 20,929 | | | | 23,292 | |
| | | | | | | | | | | | |
| | | | | | | | | | | | | | | | |
Loan impairment provisions | | Individually
impaired | | | Individually
impaired | | | Collectively
impaired | | | | |
EUR 1,000 | | Ordinary
loans | | | Project
investment
loans | | | All loans | | | Total | |
Opening balance at 31 December 2016 | | | 0 | | | | 97,402 | | | | 42,003 | | | | 139,405 | |
New provisions | | | — | | | | 10,259 | | | | — | | | | 10,259 | |
Reversal of provisions | | | — | | | | -8,104 | | | | -12,882 | | | | -20,986 | |
| | | | | | | | | | | | | | | | |
Net loan losses | | | 0 | | | | 2,155 | | | | -12,882 | | | | -10,727 | |
| | | | | | | | | | | | | | | | |
Foreign exchange gains and losses | | | — | | | | -5,373 | | | | — | | | | -5,373 | |
| | | | | | | | | | | | | | | | |
Closing balance at 31 August 2017 | | | 0 | | | | 94,183 | | | | 29,121 | | | | 123,305 | |
| | | | | | | | | | | | | | | | |
14 (15)
| | |
| Nordic Investment Bank | | Interim Management Statement January–August 2017 |
Basis of preparation
This unaudited Interim Management Statement is not presented in accordance with IAS 34 Interim Financial
Reporting.
The accounting policies and methods of computation are largely the same as described in Note 1 to the Financial Report 2016; however, the disclosure is significantly less.
Ratio definitions
| | |
Equity / total assets = | | Total equity at reporting date |
| | Total assets at reporting date |
| |
Profit / average equity = | | Annualised profit for the period |
| | Average equity for the period |
| |
Cost / income = | | Total operating expenses for the period |
| | Total operating income for the period |
| |
Operating cost / income = | | Total operating expenses for the period |
| | Total adjusting operating income for the period |
| |
Adjusted operating income = | | Operating income less unrealised gains/losses on financial operations |
| |
Operating profit / average equity = | | Annualised operating profit for the period |
| | Average equity for the period |
| |
Adjusted operating profit = | | Net profit less unrealised gains/losses on financial operations |
15 (15)