Exhibit XI


Contents
| | | | |
| Report of the Board of Directors | | | 3 | |
| |
| Operating and financial review | | | 9 | |
| |
| Financial statements | | | | |
| |
| Statement of comprehensive income | | | 14 | |
| |
| Statement of financial position | | | 15 | |
| |
| Changes in equity | | | 16 | |
| |
| Cash flow statement | | | 17 | |
| |
| Notes to the financial statements | | | 21 | |
| |
Note 1: Accounting policies | | | 21 | |
| |
Note 2: Risk management | | | 28 | |
| |
Note 3: Segment information | | | 40 | |
| |
Note 4: Net interest income | | | 43 | |
| |
Note 5: Commission income and fees received | | | 44 | |
| |
Note 6: Net profit on financial operations | | | 45 | |
| |
Note 7: Personnel expenses | | | 46 | |
| |
Note 8: Other administrative expenses | | | 48 | |
| |
Note 9: Net loan losses | | | 49 | |
| |
Note 10: Debt securities | | | 50 | |
| |
Note 11: Loans outstanding and guarantee commitments | | | 51 | |
| |
Note 12: Intangible assets, tangible assets (property and equipment) | | | 61 | |
| | | | |
| |
Note 13: Depreciation | | | 63 | |
| |
Note 14: Other assets | | | 64 | |
| |
Note 15: Debts evidenced by certificates and swaps | | | 65 | |
| |
Note 16: Other liabilities | | | 67 | |
| |
Note 17: Capitalisation and reserves | | | 68 | |
| |
Note 18: Collateral and commitments | | | 70 | |
| |
Note 19: Fair value of financial instruments | | | 72 | |
| |
Note 20: Maturity profile of financial assets and liabilities | | | 75 | |
| |
Note 21: Interest rate risk | | | 77 | |
| |
Note 22: Currency risk | | | 79 | |
| |
Note 23: Related party disclosures | | | 81 | |
| |
Note 24: Cash flow statement | | | 82 | |
| |
Note 25: Exchange rates | | | 83 | |
| |
Note 26: Post balance sheet events | | | 84 | |
| |
| Proposal by the Board of Directors | | | 85 | |
| |
| Auditor’s report | | | 86 | |
| |
| Statement by the Control Committee | | | 90 | |
Report of the Board of Directors 2017
Summary
The purpose of the Nordic Investment Bank is to support the Nordic–Baltic region through long-term financing. All the projects it finances are assessed in order to seek productivity improvements and environmental benefits for society. While not the main driver for NIB’s activity, the Bank’s strong financial standing supports its ability to have an impact.
On the global scale, NIB’s member countries are highly advanced in many respects. Still, it would be wrong to rest on past achievements. The Baltic economies are still in the process of catching up, and solutions need to be found for the challenge of attaining sustainable growth in the whole region. Accordingly, NIB needs to contribute to its member countries’ efforts to tackle climate change, protect marine environments, prevent pollution and improve productivity.
In 2017, NIB continued to increase its relevance and expanded its lending operations. The Bank signed 55 loans with customers, totalling EUR 3,665 million.
Loans aimed at improving competitiveness mainly supported investments in R&D, infrastructure and energy. On the environmental side, the focus was on projects aimed at improving wastewater treatment and water supply in the member countries.
NIB acquires the funds for lending by borrowing on international capital markets. In 2017, the Bank raised EUR 5.9 billion (2016: EUR 6.7 billion) in new funding and continued to be the leading Nordic issuer of green bonds.
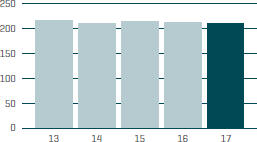
In 2017, NIB’s profit was EUR 211 million. The Board proposes that EUR 55 million be paid as dividends to the member countries.
During the year, the Board discussed a follow-up on the strategy process that was conducted three years ago. The Board has been satisfied so far. The discussions focused on the Bank’s capital and sustainable finance.
3
Operating environment
The macroeconomic environment improved further in 2017, both globally and in the Nordic–Baltic countries. Corporate profit and employment growth were robust, while consumers and businesses were optimistic. Defaults and volatility in the financial markets remained low from a historical perspective. Commercial lending standards and creditor protection have deteriorated because of ample liquidity and global yield-chasing. Subdued inflation allowed central banks to largely maintain their monetary stimulus. This policy does not only affect underlying interest rates in general; credit spreads are still at historic lows, which puts pressure on net interest income.
Favourable global developments boosted exports and growth in NIB’s member countries, which are all small, open economies on the world scale. Strong growth contributed to tightening in the labour markets, which could increase inflationary pressure—particularly in the smaller economies. Also, fixed investments recorded strong growth throughout the region.
Lending activities
NIB’s lending activities benefited from the increased investment activity and developed favourably in 2017. This was mainly driven by continued demand for long-term financing from municipalities in the member countries, but also increasingly by growing corporate investments.
All in all, the Bank signed 55 loan agreements and invested in nine green bonds with an aggregate value of EUR 3,812 million. Disbursements of loans totalled EUR 3,147 million, compared to EUR 3,373 million in 2016. More than half of the new loans were extended to new borrowers, further increasing NIB’s relevance and diversifying the portfolio. Lending volumes by business sector are displayed in table “Loans agreed”. The geographical distribution of NIB’s new lending is displayed in the chart below.
Loans agreed 2017
Geographical distribution
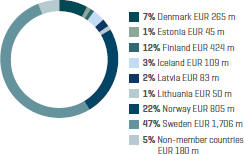
A large part of the new loans agreed were provided for infrastructure investments. In this area, NIB provided financing for investments in traffic infrastructure (such as railways, roads and airports) and social infrastructure (such as education institutions and hospitals). In the energy and environment sector, several loans were provided for investments to improve wastewater treatment facilities and upgrade electricity networks.
In the private sector, NIB continued its traditional lending to corporate borrowers to finance capital expenditure as well as R&D. NIB also started making loans to mid-cap companies after a comprehensive outreach process. Lending to small and medium-sized enterprises (SMEs) continued at a high level through onlending via local banks and other financial intermediary institutions.
With regard to the special initiatives launched in recent years, loans and green bond investments to the Baltic member countries grew substantially and totalled EUR 202 million. Loans specifically assigned as Arctic lending amounted to EUR 47million, on top of which a number of loans were extended to finance projects geographically located in this part of the member region. In order to step up non-member-country lending, contact was maintained with companies and trade organisations in the member countries, as well as with existing or potential financial intermediaries.
With a framework of EUR 500 million, NIB continued investing in green bonds issued by companies or municipalities in the member countries. The purpose of this approach is to support tthe development of the green bond market, finance environmental investments and promote good standards. In 2017, NIB invested in nine bond transactions. These included a subscription to Lithuania’s first green bond, issued by the country’s leading energy company. The Bank’s holdings in green bonds totalled EUR 283 million by year-end.
Loans agreed
EUR m
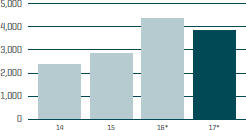
*Including investments in green bonds
4
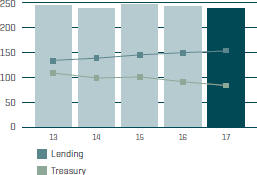
Lending
| | | | | | | | | | | | | | | | |
| In millions of euro, unless otherwise stated | | 2014 | | | 2015 | | | 2016 | | | 2017 | |
Loans agreed (without green bond investments) | | | 2,389 | | | | 2,830 | | | | 4,220 | | | | 3,665 | |
Green bond investments, total | | | | | | | | | | | 143 | | | | 147 | |
Loans agreed, including green bond investments, according to business areas: | | | | | | | | | | | | | | | | |
Energy and environment | | | 630 | | | | 710 | | | | 1,534 | | | | 562 | |
Infrastructure, transportation and telecom | | | 557 | | | | 823 | | | | 1,198 | | | | 1,620 | |
Industries and services | | | 926 | | | | 996 | | | | 912 | | | | 972 | |
Financial institutions and SMEs | | | 277 | | | | 301 | | | | 720 | | | | 658 | |
Number of loan agreements | | | 45 | | | | 45 | | | | 58 | | | | 55 | |
Number of green bond investments | | | | | | | | | | | 8 | | | | 9 | |
Loans disbursed, total | | | 2,274 | | | | 2,716 | | | | 3,373 | | | | 3,147 | |
Repayments/prepayments | | | 2,005 | | | | 2,351 | | | | 2,471 | | | | 1,832 | |
Loans and green bond investments outstanding | | | 15,156 | | | | 15,627 | | | | 16,640 | | | | 17,232 | |
Member countries | | | 12,705 | | | | 13,347 | | | | 14,831 | | | | 15,867 | |
Non-member countries | | | 2,558 | | | | 2,396 | | | | 1,948 | | | | 1,504 | |
Loan impairment provision | | | -107 | | | | -116 | | | | -139 | | | | -139 | |
Financing the future
Sustainable financing has gained importance in political debate in the Bank’s member countries. As sustainability is the core of the Bank’s business model, the Board considered how the Bank could further increase its relevance in this field. As a follow-up to these discussions, the Board decided to revisit the Bank’s mandate rating framework in 2018.
Financing projects that help to reduce the burden on the environment is becoming increasingly important. There is a growing realisation at the global level that there are no alternatives to sustainable development. As agreed at the UN climate conference in 2015, a green transition is required to limit the increase in the average global temperature.
The UN Sustainable Development Goals are the most encompassing global roadmap to tackle not only environmental, but also economic and social challenges. NIB’s mission for competitiveness and the environment supports many of these goals. Some of the loan projects also have a positive social impact, such as education and modern healthcare facilities.
NIB actively contributes to improving the standards of sustainable financing. In 2017, the Bank had observer status in the EU’s High-Level Expert Group on Sustainable Finance. NIB is also a member of the Green Bond Principles Executive Committee.
Cooperation with the other Nordic financial institutions, the Nordic Environment Finance Corporation (NEFCO) and the Nordic Development Fund (NDF), was also enhanced. One example of this cooperation is funding provided by NIB to NEFCO for the renovation of university buildings in Ukraine for better energy efficiency and the reduction of greenhouse gas emissions. The Nordic institutions also joined forces for the common Finance Day at COP23 in Bonn.
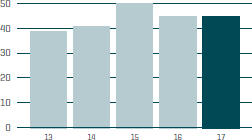
Mission fulfilment1
NIB’s major impact comes from its long-term lending to projects. All projects are analysed from the perspective of competitiveness and the environmental impact.
The Bank uses an internal mandate rating system to assess the impact. In 2017, loans achieving a “good” or “excellent” rating accounted for 97% of the total amount of lending. The Bank’s aim is for at least 90% of loans to achieve those ratings.
After a NIB-financed project has been completed, the Bank’s analysts follow up on the benefits achieved. In 2017, the Board reviewed 14 such ex-post assessments. Of these, seven projects had achieved the expected impacts, four projects had partly achieved them, two had not achieved them, and one project did not have sufficient data for the assessment. NIB uses the results to further develop its mandate rating tools and apply the lessons learned to future projects.
Mission fulfilment rating
% of loans agreed, excluding investments in green bonds and unallocated credit facilities2

1 Due to the nature of bond transactions, the mission fulfilment rating that is required for regular lending does not apply to green bond investments. Accordingly, the loan data provided in the sections “Mission fulfilment”, “Competitiveness impact” and “Environmental impact” do not include investments in green bonds.
2 In 2016 and 2017, unallocated credit lines accounted for 1% and 4% of loans agreed, respectively.
5
Competitiveness impact
A large part of NIB’s lending contributes to strengthening competitiveness, which is broadly defined as a region’s ability to sustain productivity growth. This is a way for NIB to support societies in reaching higher levels of prosperity and well-being.
NIB has a long tradition of funding infrastructure projects that have a positive impact on the region’s transport and communication sectors, as well as on urban development. In 2017, investments in key infrastructure services were made mainly by NIB’s public sector clients and accounted for 52% of agreed loans in 2017. A total of EUR 931 million was provided to improve transport systems in the member countries. Nearly 40% of this amount was earmarked for road projects in Norway, and 13% of all public transport financing went to projects in Estonia, Latvia and Lithuania.
The financing of municipal investments in water supply (10% of loans agreed), education institutions (6%) and energy projects (4%) totalled EUR 909 million. Most of these projects are located in growing urban areas, where the increase of population and economic activity are putting pressure on the existing public infrastructure. These investments will have long-term impacts on the growth potential and business environment in the whole Nordic–Baltic region.
In the private sector, the Bank continued to increase lending to smaller businesses—SMEs and small mid-caps—through loan programmes in cooperation with financial intermediaries. Loan programmes accounted for 14% of loans agreed in 2017. Reaching out to smaller businesses adds to the dynamism of the member countries’ economies and their ability to adjust to changing market trends.
A significant part of NIB’s lending targets projects that support technical progress and the development of human capital. Large member area companies benefitted from NIB’s lending to their R&D investments, which accounted for 18% of NIB’s agreed volume. By investing in scientific and engineering activities and knowledge, companies in the member countries are creating intangible assets that are the key drivers of growth of productivity—and hence prosperity—in the member countries.
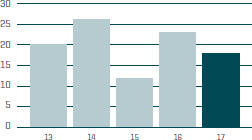
Environmental impact
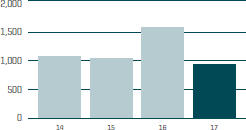
NIB defines loans to projects with significant direct or indirect positive environmental impacts as environmental loans, regardless of the sector in which they occur. In 2017, twenty-one loans with a total volume of EUR 941 million were agreed for projects with an environmental mission rating of “good” or “excellent”, which is equivalent to 27% of all agreed and rated loans.
During the year, the Bank provided eight loans for wastewater treatment projects, totalling EUR 268 million. These projects resulted in an added treatment capacity of 290,000 population equivalent units. Several of the wastewater treatment projects included the utilisation of the sludge for biogas, and thus also contribute to climate change mitigation. NIB also agreed five loans, totalling EUR 84 million, for traditional climate financing projects like biomass-fired power plants and small-scale hydropower investments. Lending to public transport projects that also contribute to climate change mitigation amounted to EUR 92 million. Three loans were agreed to finance green buildings certified according to the highest or second-highest levels in BREEAM and LEED, with a total volume of EUR 393 million.
NIB-financed energy projects will add 0.11 TWh annually to renewable energy generation. NIB estimates that the loans agreed in 2017 are helping to reduce or avoid 48,500 tonnes of CO2 emissions annually, prorated to NIB’s share of the financing.
Loans with significant environmental effects were funded with the proceeds of NIB Environmental Bonds (NEBs). During 2017, the Bank financed projects with NEB proceeds equivalent to EUR 694 million through 16 disbursements.
NIB’s Sustainability Policy and Guidelines cover the environmental, social and ethical aspects of the Bank’s operations. More detailed information on NIB’s approach to sustainability management is described in the Annual Report 2017 (specifically under “Sustainability Management”), available online. In 2017, NIB started implementing the new GRI Standards as a framework for reporting on sustainability matters.
Environmental loans
of loans agreed, excluding investments in green bonds and unallocated credit facilities
EUR m
6
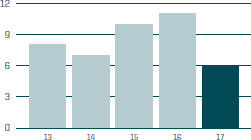
Treasury activities
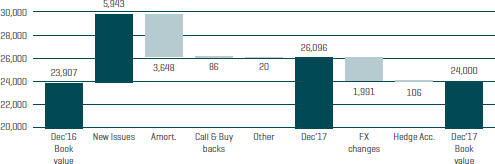
NIB acquires the funds for lending by borrowing on international capital markets. In 2017, the Bank raised EUR 5.9 billion in new funding through 58 bond transactions. At year-end, outstanding debt totalled EUR 24 billion, issued in 17 different currencies.
NIB maintained the position of a price-leading USD benchmark issuer by issuing two global USD-denominated benchmark transactions. The overall funding cost from the programme continued to contribute positively to NIB’s business model.
Continuing the NIB Environmental Bond (NEB) programme, the Bank issued seven green bonds, totalling EUR 920 million. With the total amount of NEBs outstanding at EUR 2.9 billion as of the end of December 2017, NIB remained the biggest Nordic issuer of green bonds. NIB Environmental Bonds mainly target sustainability-oriented investors.
The Bank’s overall investor base continued to be global and diversified, and only 17% of the new funding was raised through investors from the member countries. Since the Bank lends almost exclusively within its member countries, this means that NIB continued to draw international funds to the Nordic–Baltic region.
Of the rest of the new funding, 29% came from Europe and 15% from the Americas, while investors based in Asia accounted for 33% of NIB’s new debt. Investors from other regions of the world contributed 6% to NIB’s annual funding.
During 2017, NIB’s own liquidity portfolio, which is a major part of the Bank’s liquidity buffer and amounted to EUR 6.7 billion at year-end, generated a return of 0.44%. This is considered satisfactory given the low risk profile and in a very low—and even negative—yield environment.
Risk management
The Bank’s overall risk position remained strong, with high asset quality, solid liquidity and strong capitalisation.
The credit quality of the lending exposure was stable, with 86% of the exposure placed in investment-grade categories (risk classes EL1–10; 85% at year-end 2016). The exposure in the best risk classes (EL1–2) increased, mainly due to growth in lending to the public sector in the member countries. This reflects the Bank’s response to the demand for financing from this sector. The public sector accounted for 28% of the total lending exposure at year-end 2017. In terms of geographical distribution, lending exposure in Sweden increased the most (by 19%).
Credit quality in the Treasury portfolio remained solid, with 100% of the exposure in the investment-grade categories (risk classes EL1–10).
In terms of market risk, the Bank is mainly exposed to interest rate risk, credit spread risk and cross-currency basis risk in Treasury operations. The Bank’s overall market risk remained almost unchanged compared to the previous year.
At the end of the year, the Bank’s liquidity buffer amounted to EUR 10,454 million. The survival horizon measured according to the Bank’s liquidity policy was 417 days, exceeding the target level of 365 days.
The Bank further develops its risk management in line with evolving market standards. In 2017, the Bank progressed with the development of an internal capital adequacy assessment process and completed the development of expected credit loss calculation in accordance with the new IFRS 9 standard, as disclosed in the “New accounting policies” section in the notes to the financial statements.
A more detailed commentary on the Bank’s risk exposures is provided in the “Risk management” section in the notes to the financial statements.
Financial results
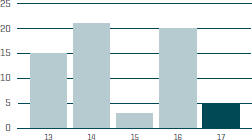
The net profit for the year was in line with the previous year and amounted to EUR 211 million. Despite the low interest rate environment, the Bank’s net interest income was only EUR 4 million lower than in 2016, due to the growth in loans outstanding. Total operating income decreased, which was attributable to one-off gains related to the implementation of two-way credit support annexes (CSAs) in 2016, as well as lower disbursement and early repayment fees compared to the previous year. Total operating expenses were in line with the previous year, and the Bank maintained its efficient cost/income ratio. As described above, the quality of the loan portfolio remained high, and the Bank’s net loan losses decreased from a loss of EUR 20 million in 2016 to EUR 5 million in 2017.
A more detailed commentary on the Bank’s financial results can be found in the Operating and Financial Review.
Dividend
The Board of Directors proposes to the Board of Governors that EUR 55 million be paid in dividends to the Bank’s member countries for the year 2017.
7
Governance
The Board of Directors held eight ordinary meetings and three extra online meetings. Seven meetings took place at the Bank’s office in Helsinki, Finland, and one meeting in Malmö, Sweden. All meetings were chaired by the Chairperson of the Board, Mr Kaspars Āboliņš (Latvia). Seven seminars and two site visits were held in connection with the Board meetings.
The Control Committee (the Bank’s supervisory body responsible for the audit of the Bank) had two ordinary meetings during the year. The Control Committee’s Chairmanship, reinforced by an independent expert, held six meetings in 2017 to meet the Committee’s responsibilities. At its autumn meeting, the Control Committee appointed Ernst & Young Oy as external auditor for NIB for 2018–2021.
NIB’s capital
In 2016, the Board of Governors approved an adjustment to align the percentage shares of paid-in capital and callable capital to correspond to the percentage of the authorised capital of each member country. The Project Investment Loan and Environmental Investment Loan guarantee schemes were also aligned according to the same distribution key as for the capital. The decision was based on a proposal from the Board of Directors.
After the conclusion of national approvals and ratification procedures in all eight member countries, as well as the payments to reflect the capital alignment, the revised Statutes entered into force and were announced in April 2017.
Compliance
During the year, the Board of Directors was informed about one new investigation and four ongoing investigations of prohibited practices and complaints related to lending operations. The Board of Directors was also informed about one allegation of internal misconduct. No sanctions were imposed by the Sanctions Panel during 2017.
In its December meeting, the Board of Directors adopted the Policy on Handling of Insider Information and Prevention of Market Abuse. The Policy takes into consideration the EU Market Abuse Regulation, which is being incorporated into EU member countries’ legislation.
In March 2017, the Board of Directors participated in a business ethics seminar organised by the Office of the Chief Compliance Officer in collaboration with the Institute of Business Ethics. A similar seminar was arranged for the Bank’s staff and managers in October 2017.
Other development projects
NIB continued implementing other initiatives with the aim of improving the efficiency and quality of the Bank’s operations. These included a resource-consuming IT project, FOBORA (an integrated solution for treasury front office, back office, risk management and accounting), which has turned out to be challenging. The second round of the training programme “Raising the Bar” was organised. The programme was aimed at developing the staff’s skills in management and knowledge of the Bank’s offering and customer needs. NIB continued the renovation of its office building in Helsinki and completed the second of three phases of the project.
Outlook
Demand is expected to be mainly driven by large investment needs in the public sector. NIB aims to cement its strong presence in this market and fulfil its role as a long-term lender. In the private sector, there are signs that investments will start to pick up further. NIB will continue its efforts to serve not only large corporates, but also the needs of mid-sized corporates for long-term financing.
NIB is entering 2018 with an optimistic outlook for the economies in the Nordic–Baltic region. Political risks are still present, but cyclical trade momentum is expected to remain positive and monetary policy supportive. Rates, spreads and default levels are all expected to remain low in the coming year, which will put the net interest income under pressure.
8
Operating and financial review
Highlights
The flow of deals in the Bank’s lending continued to be at a high level, with a total of EUR 3,812 million in loans agreed and EUR 3,147 million in loans disbursed. The need for long-term financing from the municipal sector in the Bank’s member countries has been a main driver of demand during 2017. The Bank also had increasing demand for long-term financing in the private sector, with loans disbursed to financial intermediaries to support SMEs, and loans to large member country corporates to finance R&D. The net profit was in line with expectations and the bank maintained an efficient cost/income ratio.
Key figures and ratios
| | | | | | | | |
In millions of euro, unless otherwise stated | | | 2017 | | | | 2016 | |
Net interest income | | | 238 | | | | 242 | |
Profit before net loan losses | | | 216 | | | | 232 | |
Net Profit | | | 211 | | | | 212 | |
| | | | | | | | | |
Loans disbursed | | | 3,147 | | | | 3,373 | |
Loans agreed | | | 3,812 | | | | 4,363 | |
% of loans achieving good or above mandate | | | 97% | | | | 96% | |
| | | | | | | | | |
Loans outstanding | | | 17,232 | | | | 16,640 | |
Total assets | | | 29,953 | | | | 30,178 | |
New debt issues | | | 5,943 | | | | 6,700 | |
Debts evidenced by certificates | | | 24,000 | | | | 23,907 | |
Total equity | | | 3,456 | | | | 3,275 | |
| | | | | | | | | |
Equity/total assets (%) | | | 11.5% | | | | 10.9% | |
Profit/average equity (%) | | | 6.2% | | | | 6.7% | |
Cost/income (%) | | | 17.2% | | | | 16.1% | |
Number of employees (average during the year) | | | 193 | | | | 192 | |
9
Total comprehensive income
Net Profit
The net profit for the year was in line with the previous year and amounted to EUR 211 million. Total operating income decreased from EUR 276 million to EUR 261 million which was attributable to one off gains in 2016 related to the implementation of two way credit support annexes (CSAs) as well as lower disbursement and early repayment fees compared to the previous year. There was also a decrease in net interest income of EUR 4 million. Total operating expenses of EUR 45 million were similar to 2016; however, there was a significant change in net loan losses, which decreased from a loss of EUR 20 million in 2016 to a loss of EUR 5 million in 2017.
Net interest income
Net interest income decreased from EUR 242 million in 2016 to EUR 238 million in 2017 mainly due to continuing lower interest rates. The adverse impact of the low interest rate environment has been offset by increased volumes of loans outstanding with net interest income from lending amounting to EUR 153 million which was EUR 3 million higher than in 2016. Treasury, on the other hand has limited options available to lessen the impact from market conditions and as a result, their interest income decreased by EUR 6 million to EUR 85 million.
Net commission income and fees
Net commission income and fees were EUR 6 million compared to EUR 11 million in 2016. EUR 3 million of the decrease related to lower loan disbursement fees and a further EUR 2 million related to less early repayment fees.
Net Profit
EUR m
Net interest income
EUR m
Net commission income and fees
EUR m
10
Net profit on financial operations
The profit on financial operations of EUR 18 million was EUR 5 million lower than in 2016. The result comprises realised profit of EUR 8 million (EUR 19 million) and unrealised profit of EUR 10 million (EUR 4 million). Last year’s result included one off gains of EUR 16 million related to compensation from counterparties for the implementation of two way credit support annexes (CSAs). The unrealised profit is driven by positive valuation effects, which are expected to reverse as the underlying transactions reach maturity.
Total operating expenses
The Bank maintained its efficient cost/income ratio during 2017 with total operating expenses amounting to EUR 45 million which was similar to 2016. Personnel expenses amounting to EUR 31 million were EUR 2 million higher than the previous year whereas other administrative expenses and depreciation were collectively EUR 2 million lower.
Net loan losses
The total provision for loan losses at period end amounted to EUR 139 million and was unchanged from 31 December 2016. Individually assessed impairments decreased from EUR 97 million to EUR 93 million mainly due to foreign exchange movements of EUR 6 million. There were no new individual assessed impairments of note during the period; however, existing provisions were modified, resulting in an increase of EUR 2 million impacting net loan losses. This combined with an increase in collective impairments of EUR 3 million resulted in net loan losses of EUR 5 million.
Other comprehensive income
The bank separates the foreign currency basis spread from financial instruments used in fair value hedging and this separated amount is recorded in “Other comprehensive income” (OCI). The valuation of foreign currency basis spread will be zero upon maturity and therefore the amount recorded in OCI will not be reclassified to the income statement. The main change during 2017 was related to market value changes of cross currency swaps hedging the Bank’s funding in Australian and New Zealand dollars and British pounds.
Net profit on financial operations
EUR m
Total operating expenses
EUR m
Net loan losses
EUR m
11
Financial position
| | | | | | | | |
In millions of euro | | 2017 | | | 2016 | |
Cash and cash equivalents | | | 4,736 | | | | 4,456 | |
Financial placements | | | 6,620 | | | | 6,600 | |
Loans outstanding | | | 17,232 | | | | 16,640 | |
Derivatives | | | 1,028 | | | | 2,157 | |
Other assets | | | 337 | | | | 325 | |
Total assets | | | 29,953 | | | | 30,178 | |
| | |
Equity | | | 3,456 | | | | 3,275 | |
Owed to credit institutions | | | 580 | | | | 1,329 | |
Debts evidenced by certificates | | | 24,000 | | | | 23,907 | |
Derivatives | | | 1,597 | | | | 1,444 | |
Other liabilities | | | 320 | | | | 223 | |
Total liabilities and equity | | | 29,953 | | | | 30,178 | |
Loans outstanding
During the year, NIB experienced strong demand for its long-term financing resulting in an increase in loans outstanding from EUR 16,640 million to EUR 17,232 million at 31 December 2017. The Bank signed 55 loan agreements (2016: 58) and invested in 9 green bonds with a combined value of EUR 3,812 million (2016: EUR 4,363 million). After loans have been ageed there is usually a period of time before the loans are disbursed. Disbursements in 2017 totalled EUR 3,147 million (2016: EUR 3,373 million).
Total loans outstanding, excluding exchange rate and valuation effects, increased from EUR 16,640 million to EUR 17,949 million. The book value amounted to EUR 17,232 million due to foreign exchange, valuation of lending green bonds and hedge accounting effects of EUR 620 million and EUR 98 million, respectively.
Loans outstanding development during 2017
EUR m
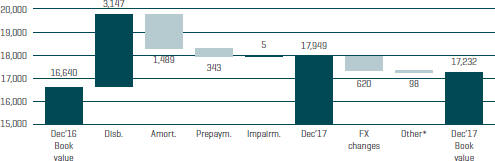
* fair valuation of lending green bonds and hedge accounting.
Mission fulfilment
Projects financed by the Bank through loans are expected to contribute to the Bank’s mission of improving competitiveness and the environment in the Nordic–Baltic countries. Before approval is given in each individual case, all projects are scrutinised and rated against the criteria developed based on the Bank’s mission. The rating scale consists of negative, neutral, marginal, moderate, good and excellent. In 2017, loans achieving a “good” or “excellent” mandate rating accounted for 97% of the total amount of loans agreed.
12
Funding
During the year, NIB raised EUR 5.9 billion (EUR 6.7 billion) in new funding through 58 issues in 12 different currencies with an average maturity of five years. The Bank’s first global benchmark of the year was issued on 24 January. The five-year, USD 1.25 billion issue was sold globally, with 51% going into EMEA (Europe, Middle East and Africa), 28% into the Americas and 21% into Asia. The second global benchmark of the year was traded in September. The three-year USD 1.0 billion issue was evenly distributed across a global investor base, with the Americas taking 34% and the EMEA and Asia regions 33% each.
During 2017, the Bank issued the equivalent of EUR 920 million (EUR 763 million) in NIB Environmental Bonds. NIB Environmental Bonds are funding transactions the proceeds of which are used for selected environmental projects to be financed by NIB. In May 2017, the Bank issued its first NIB Environmental Bond for the year by increasing its outstanding NEB 2024 by a further EUR 500 million, taking the amount outstanding to a total of EUR 1 billion. This is the biggest outstanding environmental bond by NIB so far. In August 2017, the Bank issued a five-year, SEK 2 billion environmental bond. This is the largest environmental bond NIB has issued in Swedish kronor. The bond was sold to Swedish investors. Two smaller environmental bonds in BRL and INR were also issued during the year.
NIB complemented the USD global benchmarks and NIB Environmental Bonds by increasing public outstanding issues by GBP 550 million and AUD 270 million. Further, a new NOK 1.25 billion with maturity in 2023 was issued. For collateral purposes a two-year USD 500 million transaction was issued under its global USD programme. In addition, private placements have been issued in various currencies.
Debt development during 2017
EUR m
13
Statement of comprehensive income
| | | | | | | | | | | | |
| In thousands of euro | | NOTE | | | 2017 | | | 2016 | |
Interest income | | | | | | | 300,116 | | | | 311,856 | |
Interest expense | | | | | | | -61,793 | | | | -70,047 | |
Net interest income | | | (3) (4) | | | | 238,323 | | | | 241,809 | |
| | | |
Commission income and fees received | | | (5) | | | | 8,536 | | | | 13,124 | |
Commission expense and fees paid | | | | | | | -2,574 | | | | -2,025 | |
Net fee and commission income | | | | | | | 5,963 | | | | 11,099 | |
| | | |
Net profit/loss on financial operations | | | (6) | | | | 17,563 | | | | 23,292 | |
Foreign exchange gains and losses | | | | | | | -616 | | | | 22 | |
Total operating income | | | | | | | 261,233 | | | | 276,222 | |
| | | |
Expenses | | | | | | | | | | | | |
General administrative expenses | | | | | | | | | | | | |
Personnel expenses | | | (7) | | | | -30,774 | | | | -28,637 | |
Other administrative expenses | | | (8) | | | | -12,424 | | | | -13,617 | |
Depreciation | | | (13) | | | | -1,675 | | | | -2,319 | |
Total operating expenses | | | | | | | -44,873 | | | | -44,573 | |
| | | |
Profit before loan losses | | | | | | | 216,359 | | | | 231,649 | |
Net loan losses | | | (9) | | | | -5,378 | | | | -19,839 | |
Net Profit for the year | | | | | | | 210,981 | | | | 211,810 | |
| | | |
Other comprehensive income | | | | | | | | | | | | |
Items that will not be reclassified to income statement | | | | | | | | | | | | |
Fair value hedges | | | | | | | | | | | | |
Valuation of cross currency basis spread | | | | | | | 25,167 | | | | -28,202 | |
Total other comprehensive income | | | | | | | 25,167 | | | | -28,202 | |
| | | | | | | | | | | | |
Total comprehensive income | | | | | | | 236,148 | | | | 183,608 | |
The accompanying notes are an integral part of these financial statements.
14
Statement of financial position
| | | | | | | | | | | | |
In thousands of euro | | NOTE | | | 31 December 2017 | | | 31 December 2016 | |
ASSETS | | | | | | | | | | | | |
Cash and cash equivalents | | | (24 | ) | | | 4,736,109 | | | | 4,455,860 | |
Financial placements | | | | | | | | | | | | |
Placements with credit institutions | | | | | | | 8,771 | | | | 8,771 | |
Debt securities | | | (10 | ) | | | 6,594,935 | | | | 6,572,244 | |
Other | | | | | | | 16,395 | | | | 18,901 | |
| | | | | | | | 6,620,101 | | | | 6,599,916 | |
Loans outstanding | | | (11 | ) | | | 17,231,623 | | | | 16,640,030 | |
Intangible assets | | | (12 | ) | | | 5,320 | | | | 938 | |
Tangible assets, property and equipment | | | (12 | ) | | | 30,286 | | | | 26,723 | |
Other assets | | | | | | | | | | | | |
Derivatives | | | (14 | ) | | | 1,027,915 | | | | 2,156,921 | |
Other assets | | | (14 | ) | | | 29,399 | | | | 12,589 | |
| | | | | | | | 1,057,314 | | | | 2,169,510 | |
Accrued interest and fees receivable | | | | | | | 272,045 | | | | 285,353 | |
TOTAL ASSETS | | | | | | | 29,952,798 | | | | 30,178,330 | |
| | | |
LIABILITIES AND EQUITY | | | | | | | | | | | | |
Liabilities | | | | | | | | | | | | |
Amounts owed to credit institutions | | | | | | | | | | | | |
Short-term amounts owed to credit institutions | | | (18 | ) (24) | | | 562,823 | | | | 1,310,873 | |
Long-term amounts owed to credit institutions | | | | | | | 17,327 | | | | 17,973 | |
| | | | | | | | 580,150 | | | | 1,328,846 | |
Repurchase agreements | | | | | | | 99,490 | | | | – | |
Debts evidenced by certificates | | | (15 | ) | | | | | | | | |
Debt securities issued | | | | | | | 23,934,066 | | | | 23,825,644 | |
Other debt | | | | | | | 65,688 | | | | 81,745 | |
| | | | | | | | 23,999,754 | | | | 23,907,389 | |
Other liabilities | | | | | | | | | | | | |
Derivatives | | | (16 | ) | | | 1,597,451 | | | | 1,444,341 | |
Other liabilities | | | (16 | ) | | | 10,190 | | | | 11,355 | |
| | | | | | | | 1,607,641 | | | | 1,455,696 | |
Accrued interest and fees payable | | | | | | | 209,511 | | | | 211,294 | |
Total liabilities | | | | | | | 26,496,545 | | | | 26,903,225 | |
| | | |
Equity | | | (17 | ) | | | 3,456,253 | | | | 3,275,105 | |
| | | | | | | | | | | | |
TOTAL LIABILITIES AND EQUITY | | | | | | | 29,952,798 | | | | 30,178,330 | |
The accompanying notes are an integral part of these financial statements.
15
Changes in equity
| | | | | | | | | | | | | | | | | | | | | | | | | | | | |
In thousands of euro | | PAID-IN
CAPITAL | | | STATUTORY
RESERVE | | | GENERAL CREDIT
RISK FUND | | | SPECIAL CREDIT RISK
FUND PIL | | | FUNDS AVAILABLE
FOR APPROPRIATION | | | HEDGING
RESERVE | | | TOTAL | |
EQUITY AT 31 DECEMBER 2015 | | | 418,602 | | | | 686,325 | | | | 1,430,252 | | | | 395,919 | | | | 215,398 | | | | 0 | | | | 3,146,497 | |
Profit for the year | | | – | | | | – | | | | – | | | | – | | | | 211,810 | | | | – | | | | 211,810 | |
Other comprehensive income | | | – | | | | – | | | | – | | | | – | | | | – | | | | -28,202 | | | | -28,202 | |
Total comprehensive income | | | 0 | | | | 0 | | | | 0 | | | | 0 | | | | 211,810 | | | | -28,202 | | | | 183,608 | |
Transaction with owners in their capacity as owners | | | | | | | | | | | | | | | | | | | | | | | | | | | | |
Appropriations between reserve funds | | | – | | | | – | | | | 110,398 | | | | 50,000 | | | | -160,398 | | | | – | | | | 0 | |
Dividends | | | – | | | | – | | | | – | | | | – | | | | -55,000 | | | | – | | | | -55,000 | |
EQUITY AT 31 DECEMBER 2016 | | | 418,602 | | | | 686,325 | | | | 1,540,651 | | | | 445,919 | | | | 211,810 | | | | -28,202 | | | | 3,275,105 | |
Profit for the year | | | – | | | | – | | | | – | | | | – | | | | 210,981 | | | | – | | | | 210,981 | |
Other comprehensive income | | | – | | | | – | | | | – | | | | – | | | | – | | | | 25,167 | | | | 25,167 | |
Total comprehensive income | | | 0 | | | | 0 | | | | 0 | | | | 0 | | | | 210,981 | | | | 25,167 | | | | 236,148 �� | |
Transaction with owners in their capacity as owners | | | | | | | | | | | | | | | | | | | | | | | | | | | | |
Appropriations between reserve funds | | | – | | | | – | | | | 156,810 | | | | – | | | | -156,810 | | | | – | | | | 0 | |
Dividends | | | – | | | | – | | | | – | | | | – | | | | -55,000 | | | | – | | | | -55,000 | |
EQUITY AT 31 DECEMBER 2017 | | | 418,602 | | | | 686,325 | | | | 1,697,461 | | | | 445,919 | | | | 210,981 | | | | -3,035 | | | | 3,456,253 | |
Proposed appropriation of the year’s profit
| | | | | | | | |
In thousands of euro | | 2017 | | | 2016 | |
Appropriations to credit risk reserve funds | | | | | | | | |
General Credit Risk Fund | | | 155,981 | | | | 156,810 | |
Appropriation to dividend payment | | | 55,000 | | | | 55,000 | |
Profit for the year | | | 210,981 | | | | 211,810 | |
The accompanying notes are an integral part of these financial statements.
16
Cash flow statement
| | | | | | | | | | | | |
In thousands of euro | | NOTE | | | 2017 | | | 2016 | |
Cash flows from operating activities | | | | | | | | | | | | |
Net profit for the year | | | | | | | 210,981 | | | | 211,810 | |
| | | |
Adjustments: | | | | | | | | | | | | |
Unrealised gains/losses of financial assets held at fair value | | | | | | | -15,434 | | | | 1,548 | |
Depreciation and write-down in value of tangible and intangible assets | | | | | | | 1,675 | | | | 2,319 | |
Change in accrued interest and fees (assets) | | | | | | | 13,308 | | | | 13,625 | |
Change in accrued interest and fees (liabilities) | | | | | | | -1,783 | | | | -11,506 | |
Impairment of loans | | | | | | | 5,378 | | | | 19,839 | |
Adjustment to hedge accounting | | | | | | | 5,927 | | | | -4,271 | |
Other adjustments to the year’s profit | | | | | | | 2,581 | | | | -628 | |
Adjustments, total | | | | | | | 11,653 | | | | 20,926 | |
| | | |
Lending | | | | | | | | | | | | |
Disbursements of loans | | | | | | | -3,146,630 | | | | -3,373,252 | |
Repayments of loans | | | | | | | 1,831,788 | | | | 2,464,579 | |
Capitalisations, redenominations, index adjustments, etc. | | | | | | | -558 | | | | -32 | |
Exchange rate adjustments | | | | | | | 620,015 | | | | -110,135 | |
Lending, total | | | | | | | -695,384 | | | | -1,018,840 | |
| | | | | | | | | | | | | |
Cash flows from operating activities, total | | | | | | | -472,750 | | | | -786,103 | |
| | | |
Cash flows from investing activities | | | | | | | | | | | | |
Placements and debt securities | | | | | | | | | | | | |
Purchase of debt securities | | | | | | | -2,229,069 | | | | -2,287,945 | |
Sold and matured debt securities | | | | | | | 2,034,312 | | | | 1,843,682 | |
Placements with credit institutions | | | | | | | – | | | | -850 | |
Other financial placements | | | | | | | 3,000 | | | | 2,714 | |
Exchange rate adjustments, etc. | | | | | | | 167,559 | | | | -47,891 | |
Placements and debt securities, total | | | | | | | -24,198 | | | | -490,290 | |
The accompanying notes are an integral part of these financial statements.
17
| | | | | | | | | | | | |
In thousands of euro | | NOTE | | | 2017 | | | 2016 | |
Other items | | | | | | | | | | | | |
Acquisition of intangible assets | | | | | | | -4,382 | | | | -938 | |
Acquisition of tangible assets | | | | | | | -5,239 | | | | -682 | |
Change in other assets | | | | | | | -16,461 | | | | 10,698 | |
Other items, total | | | | | | | -26,082 | | | | 9,078 | |
| | | | | | | | | | | | | |
Cash flows from investing activities, total | | | | | | | -50,280 | | | | -481,212 | |
| | | |
Cash flows from financing activities | | | | | | | | | | | | |
Debts evidenced by certificates | | | | | | | | | | | | |
Issues of new debt | | | | | | | 5,942,745 | | | | 6,700,059 | |
Redemptions | | | | | | | -3,753,856 | | | | -3,823,944 | |
Exchange rate adjustments | | | | | | | -1,990,713 | | | | 380,563 | |
Debts evidenced by certificates, total | | | | | | | 198,177 | | | | 3,256,678 | |
| | | |
Other items | | | | | | | | | | | | |
Long-term placements from credit institutions | | | | | | | -645 | | | | -27 | |
Change in swap receivables | | | | | | | 1,056,858 | | | | 265,363 | |
Change in swap payables | | | | | | | 256,161 | | | | -86,468 | |
Change in other liabilities | | | | | | | -3,711 | | | | 1,409 | |
Dividend paid | | | | | | | -55,000 | | | | -55,000 | |
Other items, total | | | | | | | 1,253,662 | | | | 125,277 | |
| | | | | | | | | | | | | |
Cash flows from financing activities, total | | | | | | | 1,451,839 | | | | 3,381,955 | |
| | | | | | | | | | | | | |
CHANGE IN CASH AND CASH EQUIVALENTS, NET | | | | | | | 928,810 | | | | 2,114,639 | |
| | | |
Opening balance for cash and cash equivalents, net | | | (24) | | | | 3,144,987 | | | | 1,030,348 | |
Closing balance for cash and cash equivalents, net | | | (24) | | | | 4,073,797 | | | | 3,144,987 | |
| | | |
Additional information to the statement of cash flows | | | | | | | | | | | | |
Interest income received | | | | | | | 313,424 | | | | 325,481 | |
Interest expense paid | | | | | | | -63,576 | | | | -81,553 | |
The accompanying notes are an integral part of these financial statements.
18
History of NIB
Cooperation of Member Countries
Institutionalized Nordic Cooperation
Cooperation among the Nordic countries encompasses a wide range of activities, including economic policy, development of industrial technology, communications and the harmonization of legal systems. The most important formal basis for Nordic cooperation is the Helsinki Agreement of 1962. This agreement sets out the aims of Nordic cooperation and contains provisions for the Nordic Council and, as subsequently amended, for the Nordic Council of Ministers. The Nordic Council, which was founded in 1952, is a forum for consultation and discussion at the parliamentary level of matters of common interest to the Nordic countries, which may lead to presentation of recommendations to the Nordic Council of Ministers and to the governments of the Nordic countries. The Nordic Council of Ministers, in which each Nordic country has one vote, is empowered to make decisions on matters of cooperation that are considered binding on the governments of the Nordic countries, subject to parliamentary approval in certain matters.
The Baltic countries, Estonia, Latvia and Lithuania, have for several years participated in the Nordic cooperation, for example, by attending the sessions of the Nordic Council and some meetings of the Nordic Council of Ministers.
EFTA and EU
The Nordic countries have steadily broadened their mutual commercial relationships, a development encouraged by the creation in 1960 of the European Free Trade Association (“EFTA”), which established a framework for the development of inter-Nordic trade during the 1960s and 1970s.
Following Denmark’s entry into the European Community (the predecessor to the European Union) in 1973, the other four Nordic countries concluded bilateral free-trade agreements with the European Community in order to promote free trade within the Nordic region. The EFTA member countries, with the exclusion of Switzerland, and the European Union (“EU”) established the European Economic Area (“EEA”), a free trade zone in Europe, effective January 1, 1994.
Effective January 1, 1995, Finland and Sweden became members of the EU, leaving Norway and Iceland as the only Nordic countries that presently are members of EFTA. At the introduction of the Euro on January 1, 1999, Finland was the only Nordic country to participate in the economic and monetary union of the EU (“EMU”). Effective May 1, 2004 Estonia, Latvia and Lithuania became members of the EU. Estonia, Latvia and Lithuania are also members of the EMU. Estonia joined the EMU on January 1, 2011, Latvia on January 1, 2014 and Lithuania on January 1, 2015.
Other forms of cooperation
Nordic cooperation also includes coordination of policy positions in international organizations. Consultations are held regularly on issues arising within the United Nations and the United Nations Commission for Trade and Development. The Member countries are jointly represented in the International Monetary Fund, the International Bank for Reconstruction and Development and other international organizations.
Implications for NIB
Discussions within the Nordic Council and the Nordic Council of Ministers over a number of years led to the establishment of the Nordic Investment Bank (the”Establishing Agreement”), which was signed on December 4, 1975. The signatories of the Establishing Agreement were Denmark, Finland, Iceland, Norway and Sweden.
The Establishing Agreement and the Statutes of NIB became effective on June 1, 1976, and NIB commenced operations on August 2 of that year.
On September 15, 1981, the Nordic Council of Ministers approved a program to promote Member country cooperation in project exports, primarily to developing countries. The decision, as amended on February 28, 1982, included, as one major element of the program, the creation of a joint financing facility to grant loans and issue loan guarantees (“project investment loans”). The facility became effective on July 1, 1982, and forms currently the main part of NIB’s lending activities outside Member countries. See Note 11.
In August 1996, the Nordic prime ministers decided to establish a special environmental loan facility (the “Environmental Investment Loan Facility”) to finance environmental investments in the region neighbouring the Nordic countries. The facility was approved by the Nordic Council of Ministers on January 25, 1997, and became effective on August 28, 1997. The facility, which is part of NIB’s lending activities, comprises loans and guarantees to both the public and private sector for financing investments aimed at protecting the environment and reducing cross border pollution in the neighbouring area to the Member countries. See Note 11.
In November 1997, the Nordic Council of Ministers decided that the legal framework of NIB and its related parties NEFCO and NDF (each, as defined below) should be revised to reflect their status as international organizations. In relation to NIB, this led to the signing of the 1998 Agreement on October 23, 1998.
On October 23, 1998, the Nordic countries entered into a novation of the Establishing Agreement (the “1998 Agreement”). The 1998 Agreement came into force on July 18, 1999, and the Establishing Agreement ceased to be effective on the same date.
19
On January 1, 2005, Estonia, Latvia and Lithuania became members of NIB following a policy decision taken by the Nordic prime ministers in June 2003. The new members have essentially the same rights and obligations as the original members. The 2004 Agreement mandates a new structure for the governance of the Bank, which was fully implemented as of January 1, 2005. On January 1, 2005, NIB introduced an entirely new body, the Board of Governors, which replaced the Nordic Council of Ministers and its functions in the previous legal framework of the Bank. The 2004 Agreement did not change the activities of the Bank.
Implications for NIB’s related parties
On May 19, 1988, the Nordic Council of Ministers decided to establish the Nordic Development Fund (“NDF”), an international financial institution, for financing projects of Nordic interest in developing countries on concessional terms. The establishing agreement of NDF was signed by the five Nordic countries (“NDF member countries”) on November 3, 1988, and NDF commenced operations on February 1, 1989. NDF is a separate legal entity with its own Board of Directors and with a capital base provided by the NDF member countries.
On March 2, 1990, the Nordic Council of Ministers decided to establish the Nordic Environment Finance Corporation (“NEFCO”), an international financial institution, for promoting investments of Nordic environmental interest in Eastern and Central Europe. NEFCO is a separate legal entity with its own Board of Directors and with a capital base provided by the NEFCO member countries.
According to the constituent documents of NDF and NEFCO, their principal offices shall be located at the principal office of NIB. Furthermore, the Statutes of NDF and NEFCO set out that their Control Committee members appointed by the Nordic Council shall be the same persons as appointed by the Council to the Control Committee of NIB. In addition, the Statutes of NDF and NEFCO set out that the powers vested in their respective Board of Directors may be delegated to the President of the respective organisation and /or to NIB. NIB provides administrative services to NDF and NEFCO the compensation of which is disclosed in Note 8 of the annual financial statements.
20
Note 1: Accounting policies
Reporting entity
The Nordic Investment Bank (“NIB” or “the Bank”) was established as an international financial institution by the founding members Denmark, Finland, Iceland, Norway and Sweden (the “Nordic countries”) to provide medium and long-term loans and guarantees. The Bank commenced operations on August 2, 1976.
NIB’s ownership base was expanded to include Estonia, Latvia and Lithuania through an agreement (the “2004 Agreement”), which came into force on January 1, 2005 following ratification by Denmark, Estonia, Finland, Iceland, Latvia, Lithuania, Norway and Sweden (the “Member countries”). Since January 1, 2005, NIB has been governed by the provisions of the 2004 Agreement and the statutes (the “Statutes”) as amended from time to time. NIB represents one facet of the tradition of cooperation among governments, organizations, companies and individuals in the Member countries stemming partly from their common heritage and geographical proximity.
The 2004 Agreement provides NIB the privileges and immunities common to international financial institutions (“IFIs”), such as inviolability of its premises, protection from search and seizure of its property and assets, protection from pre-judgment remedies, and broad tax exemptions.
NIB finances its operations from the capital paid in by Member countries, retained earnings and by borrowing on the international capital markets.
NIB’s principal office is located at Fabianinkatu 34, Helsinki, Finland.
Statutory purposes
The purpose of NIB, according to the 2004 Agreement and the Statutes is to make financing available in accordance with sound banking principles, taking into account socio-economic considerations, to realise investment projects of interest to the Member countries and other countries which receive such financing. NIB is required to make a profit from its operations in order to provide for the accumulation of reserves and a reasonable return on its paid-in capital; however, it is not a profit maximising entity.
Legal status
Under the 2004 Agreement, NIB has the status of an international legal person with full legal capacity. In particular, NIB has the capacity to enter into agreements, to acquire and dispose of immovable and movable property, and to be a party to legal proceedings before courts of law and other authorities. The 2004 Agreement further states that NIB, as a common international financial institution to the Member countries, has the same status as other legal persons conducting similar operations within and outside the Member countries.
The 2004 Agreement also contains, among others, provisions regarding certain immunities. According to these provisions the Member countries have agreed that actions may be brought against NIB only in a court of competent jurisdiction in the territory of a country in which NIB has established an office, or has appointed an agent for the purpose of accepting service of process, or when NIB has otherwise expressly accepted jurisdiction. Actions may, however, be brought by a Member country or by persons acting for or deriving claims from a Member country only if NIB has given its express consent thereto.
In addition, the 2004 Agreement provides that property and assets of NIB wherever located and by whomsoever held shall be immune from execution of judgment or decree by judicial or administrative authority before such judgment or decree is final. The property and assets of the Bank wherever located and by whomsoever held shall further be immune from search, requisition, confiscation and expropriation by executive or legislative action. The Bank, its property and assets shall also be immune from procedural measures of constraints, such as seizure.
The 2004 Agreement stipulates that the premises and archives of NIB and all documents belonging to it or held by it shall be inviolable.
The 2004 Agreement also states that NIB is exempt from payment restrictions and credit policy measures, which in any manner prevent or impede the fulfilment of its commitments and that NIB, its income, assets and property shall be exempt from all taxation as set forth in the relevant Article. Consequently, NIB shall be exempt from taxes on the purchase and transfer of real estate and securities and on the procurement of goods and services in connection with the official activities of NIB. Lending and borrowing by NIB is also exempt from all taxes and charges of a similar nature.
21
On October 20, 2010, a revised Host Country Agreement between NIB and the Government of Finland was signed. The agreement confirms NIB´s status as an international organization and further regulates certain privileges and immunities concerning NIB and its staff as well as social security for the staff. The agreement was enacted in Finland and came into force on January 16, 2011.
Basis of accounting
The Bank’s financial statements have been prepared in accordance with International Financial Reporting Standards (IFRS) issued by the International Accounting Standards Board (IASB). The financial statements have been prepared in accordance with the historical cost convention with some exceptions described in the policies below.
The cash flow statement has been prepared using the indirect method whereby operating profit is adjusted for effects of non-cash transactions such as depreciation and loan losses. The cash flows are classified by operating, investing and financing activities. Cash flow items cannot be directly determined from the statement of financial position.
On 8 March 2018, the Board of Directors approved the financial statements for publication. These financial statements will be submitted for approval to the Annual Meeting of the Board of Governors scheduled to be held no later than by the end of May 2018.
Functional and presentation currency
The Bank’s functional and presentation currency is the euro and the financial statements are presented in EUR 1,000, unless otherwise indicated. All figures in the accounts have been rounded and consequently the sum of individual figures may deviate from the presented sum figure. Furthermore, all percentages are subject to possible rounding differences.
Significant accounting judgements and estimates
As part of the process of preparing the financial statements in conformity with IFRS, the Bank’s management is required to make certain judgements, estimates and assumptions that may affect the Bank’s profits, its financial position and other information presented in the Annual Report. These estimates are based on available information and the judgements made by the Bank’s management. Actual outcomes may deviate from the assessments made, and such deviations may at times be significant.
The Bank uses various valuation models and techniques to estimate the fair values of assets and liabilities. There are significant uncertainties related to these estimates, in particular when they involve modelling complex financial instruments, such as derivative instruments used for
hedging activities related to both borrowing and lending.
The estimates are highly dependent on market data, such as the level of interest rates, currency rates and other factors. The uncertainties related to these estimates are reflected mainly in the statement of financial position. NIB undertakes continuous development in order to improve the basis for fair value estimates, with regard to both modelling and market data. Changes in estimates resulting from refinements in assumptions and methodologies are reflected in the period in which the enhancements are first applied.
Judgements and estimates are also associated with impairment testing.
Foreign currency translation
Monetary assets and liabilities denominated in foreign currencies are recognised in the accounts at the exchange rate prevailing on the closing date. Non-monetary assets and liabilities are recognised in the accounts at the euro rate prevailing on the transaction date. Income and expenses recognised in currencies other than the euro are converted on a daily basis to the euro, in accordance with the euro exchange rate prevailing on that day.
Realised and unrealised exchange rate gains and losses are recognised in the statement of comprehensive income.
The Bank uses the official exchange rates published for the euro by the European Central Bank with some exceptions, as disclosed in Note 25.
Recognition and derecognition of financial instruments
Financial instruments are recognised in the statement of financial position on a settlement date basis, except for derivative instruments, which are recognized on a trade date basis.
A financial asset is derecognised when the contractual rights to the cash flows from the financial asset expire.
A financial liability is derecognised from the statement of financial position when the obligation specified in the contract is discharged, cancelled or expires.
Basis for classification and measurement
Following the early adoption of IFRS 9 in 2011, the Bank classifies its financial assets into the following categories: those measured at amortised cost, and those measured at fair value. This classification depends on both the contractual characteristics of the assets and the business model adopted for their management.
Financial assets at amortised cost
An investment is classified at “amortised cost” only if both of the following criteria are met: the objective of the Bank’s business model is to hold the assets in order to collect the contractual cash flows, and the contractual terms of the financial assets must give rise on specified dates to cash flows that are only payments of principal and interest on the principal amount outstanding.
22
Financial assets at fair value
If either of the two criteria above is not met, the asset cannot be classified in the amortised cost category and must be classified at fair value through proft and loss (FVTPL). All other financial assets are classified as FVTPL.
See hedging policy below for those financial assets and financial liabilities designated as hedged items in a qualifying fair value hedge relationship.
Determination of fair value
The fair value of financial instruments, including derivative instruments that are traded in a liquid market, is the bid or offered closing price on the balance sheet date. Where the fair values cannot be derived from active markets, they are determined using a variety of valuation techniques, which include the use of mathematical models. The input to these models is taken from observable market data where possible. Many of NIB’s financial instruments are not traded in a liquid market, such as the Bank’s borrowing transactions with embedded derivative instruments. These are measured at fair value using different valuation models and techniques. This process involves determining future expected cash flows, which can then be discounted to the balance sheet date. The estimation of future cash flows for these instruments is subject to assumptions on market data, and in some cases, in particular where options are involved, on the behaviour of the Bank’s counterparties. The fair value estimate may therefore be subject to variations and may not be realisable in the market. Under different market assumptions, the values could also differ significantly.
The Bank measures fair values using the following fair value hierarchy, which reflects the significance of the inputs used in making the measurements:
Level 1: Quoted market prices (unadjusted) in an active market for identical instruments.
Level 2: Valuation techniques based on observable inputs, either directly (i.e. as prices) or indirectly (i.e. derived from prices). This category includes instruments valued using: quoted market prices in active markets for similar instruments, quoted prices for identical or similar instruments in markets that are considered less than active or other valuation techniques where all significant inputs are directly or indirectly observable from market data.
Level 3: Valuation techniques using significant unobservable inputs. This category includes all instruments where the valuation technique includes inputs not based on observable data and where the unobservable inputs have a significant effect on the instrument’s valuation. This category includes instruments that are valued based on quoted prices for similar instruments where significant unobservable adjustments or assumptions are required to reflect differences between the instruments.
See Note 19 for further details.
Offsetting
A financial asset and a financial liability are offset and the net amount recognised only where there is a legal right to do so and the intention is to settle on a net basis.
Cash and cash equivalents
Cash and cash equivalents comprise monetary assets and placements with original maturities of six months or less, calculated from the date the acquisition and placements were made.
Cash and cash equivalents in the cash flow statement refers to the net amount of monetary assets, placements and liabilities with original maturities of six months or less, calculated from the time the transaction was entered into.
Financial placements
Items recognised as financial placements in the statement of financial position include placements with credit institutions and placements in debt securities, for example, bonds and other debt certificates, as well as certain placements in instruments with equity features. The placements are initially recognised on the settlement date. Their subsequent accounting treatment depends on both the Bank’s business model for managing the placements and their contractual cash flow characteristics.
Loans outstanding
The Bank’s lending transactions are recognised in the statement of financial position at the time the funds are transferred to the borrower. Loans are recognised initially at historical cost, which corresponds to the fair value of the transferred funds, including transaction costs. Loans outstanding are carried at amortised cost. If the loans are hedged against changes in fair value caused by changes in market interest rates by using derivative instruments, they are recognised in the statement of financial position at fair value, with value changes recognised in the statement of comprehensive income.
23
Impairment of loans
The bank applies the principles set out in IAS 39 for impairment of loans and receivables. The bank will apply the expected credit loss model according to IFRS 9, from 1 January 2018.
Impairment of individually assessed loans
Exposures to obligors in default classes are classified as non-performing. A default occurs with regard to an obligor when either or both of the following have taken place:
(a) NIB considers that the obligor is unlikely to pay its credit obligations in full, without recourse by the Bank to actions such as realising security.
(b) The obligor is past due by more than 90 and in the case of sovereign lending exposure to member countries 180 days, or countries with which NIB has an existing framework agreement in place.
Obligors that satisfy the criteria in (a) above are set to default class D1 and those that satisfy the criteria in (b) above are set to default class D2. If both criteria (a) and (b) are satisfied, the obligor is set to default class D2.
The Bank reviews its non-performing loans and receivables at each reporting date to assess whether an allowance for impairment should be recorded in the statement of comprehensive income. In particular, the judgement of the management is required in estimating the amount and timing of future cash flows when determining the level of allowance required. Such estimates are based on assumptions about a number of factors, and actual results may differ, resulting in future changes to the allowance.
For issued guarantees, the impairment is recognised when it is probable that the guarantee will need to be settled and the settlement amount can be reliably estimated.
Impairment of collectively assessed loans
Loans that are not individually impaired will be transferred to a group of loans with similar risk characteristics for a collective impairment test.
The Bank assesses the need to make a collective impairment test on exposures that, although not specifically identified as requiring a specific allowance, have a greater risk of default than when originally granted. This collective impairment test is based on any deterioration in the internal rating of the groups of loans or investments from the time they were granted or acquired. These internal ratings take into consideration factors such as any deterioration in counterparty risk, the value of collaterals or securities received, and the outlook for the sector, as well as identified structural weaknesses or deterioration in cash flows.
The process includes the management’s judgement based on the current macroeconomic environment and the current view of the expected economic outlook. In the Bank’s view, the assumptions and estimates made are appropriately conservative and are reflective of the predicted economic conditions, the Bank’s portfolio characteristics and their correlation with losses incurred based on historical loss experience. The impairment remains related to the group of loans until the losses have been identified on an individual basis or there has been an improvement in the credit rating and the loan is no longer classified within the greater risk category.
Intangible assets
Intangible assets mainly consist of investments in software, software licences and ongoing investments in new IT systems. Acquisitions that generate economic benefits exceeding costs beyond one year are recognised as intangible assets. The investments are carried at historical cost, and are amortised over the assessed useful life of the assets, which is estimated to be between three and five years. The amortisations are made on a straight-line basis.
Tangible assets
Tangible assets in the statement of financial position include land, buildings, office equipment and other tangible assets owned by the Bank. The assets are recognised at historical cost, less any accumulated depreciation based on their assessed useful life. Land is not depreciated. The Bank’s office building in Helsinki is depreciated on a straight-line basis over a 40-year period. The Bank’s other buildings are depreciated over a 30-year period. The depreciation period for office equipment and other tangible assets is determined by assessing the individual item. The depreciation period is usually three to five years. The depreciations are calculated on a straight-line basis.
24
Write-downs and impairment of intangible and tangible assets
The Bank’s assets are reviewed annually for impairment. If there is any objective evidence of impairment, the impairment loss is determined based on the recoverable amount of the assets.
Derivative instruments and hedge accounting
The Bank’s derivative instruments used to manage interest rate and currency risk are recognised on a trade-date basis at fair value in the statement of financial position as “Other assets” or “Other liabilities”. The Bank applies hedge accounting in accordance with IFRS 9 when the conditions set out by the standard are met. The hedge accounting is based on a clearly documented relationship between the item hedged and the hedging instrument. When there is a high (negative) correlation between the hedging instrument on the one hand and the value change of the hedged item or the cash flows generated by the hedged item on the other, the hedge is regarded as effective. The hedging relationship is documented at the time the hedge transaction is entered into, and the effectiveness of the hedge is continually assessed.
Derivatives where hedge accounting is not applied are recognised at fair value through profit and loss.
Fair value hedging
When a derivative is designated as the hedging instrument in a hedge of the change in fair value of a recognised asset or liability or a firm commitment that could affect profit or loss, changes in the fair value of the derivative are recognised immediately in profit or loss in the same line item as the changes in fair value of the hedged item. Currently the Banks fair value hedges mainly relate to swapping fixed to floating rates on its borrowing and lending transactions.
Cash flow hedging
When a derivative is designated as the hedging instrument in a hedge exposures to variations in future interest payments on instruments with variable interest rates or for hedging of currency exposures, the effective portion of changes in the fair value of the derivative is recognised in Other Comprehensive Income (OCI) and presented in the hedging reserve within equity. Any ineffective portion of changes in the fair value of the derivative is recognised immediately in profit or loss. The amount recognised in OCI is reclassified to profit or loss as a reclassification adjustment in the same period as the hedged cash flows affect profit or loss. Currently the Bank does not apply cash flow hedge accounting but may choose to in the future.
Foreign currency basis spread
Following the early adoption of IFRS 9 in 2011, the bank separates the foreign currency basis spread from financial instruments used in hedging and this separated amount is recorded in “Other comprehensive income” (OCI). The foreign currency basis spread will be zero upon maturity and therefore the amount recorded in OCI will not be reclassified to the income statement.
Discontinuance of hedge accounting
If the hedging derivative expires or is sold, terminated or exercised, or the hedge no longer meets the criteria for fair value hedge accounting, or the hedge designation is revoked, then hedge accounting is discontinued prospectively. Any adjustment up to the point of discontinuation to a hedged item for which the effective interest method is used is amortised to profit or loss as part of the recalculated effective interest rate of the item over its remaining life. If the hedged item is derecognised, the unamortised fair value is recognised immediately in profit or loss.
Debts evidenced by certificates
The Bank’s borrowing transactions are recognised in the statement of financial position at the time the funds are transferred to the Bank. The borrowing transactions are recognised initially at a cost that comprises the fair value of the funds transferred, less transaction costs. The Bank uses derivative instruments to hedge the fair value of virtually all its borrowing transactions. In these instances, the borrowing transaction is subsequently recognised in the statement of financial position at fair value, with any changes in value recognised in the statement of comprehensive income.
Securities delivered under repurchase agreements are not derecognised from the statement of financial position. Cash received under repurchase agreements is recognised in the statement of financial position as “Amounts owed to credit institutions”.
Equity
As of 31 December 2017, the Bank’s authorised and subscribed capital is EUR 6,142 million, of which the paid-in portion is EUR 419 million. Payment of the subscribed, non-paid-in portion of the authorised capital, i.e. the callable capital, will take place at the request of the Bank’s Board of Directors to the extent that the Board deems it necessary for the fulfilment of the Bank’s debt obligations.
The Bank’s reserves have been built up by means of appropriations from the profits of previous accounting periods, and consist of the Statutory Reserve, as well as the General Credit Risk Fund and the Special Credit Risk Fund for PIL. See note 17.
25
The Bank’s profits, after allocation to appropriate credit risk funds, are transferred to the Statutory Reserve until it amounts to 10% of NIB’s subscribed authorised capital. Thereafter, the Board of Governors, upon a proposal by the Bank’s Board of Directors, decides upon the allocation of the profits between the reserve fund and dividends on the subscribed capital.
The General Credit Risk Fund is designed to cover unidentified exceptional risks in the Bank’s operations. Allocations to the Special Credit Risk Fund for PIL are made primarily to cover the Bank’s own risk in respect of credit losses on PIL loans.
The hedging reserve consists of the unrealised value changes of foreign currency basis spreads of derivatives included in hedge accounting. Valuation changes will be zero upon maturity and therefore the amount recorded in the hedging reserve will not be reclassified to the income statement.
Interest
The Bank’s net interest income includes accrued interest on loans, debt securities, placements and accruals of the premium or discount value of financial instruments. Net interest income also includes interest expenses on debts, swap fees and borrowing costs.
Fees and commissions
Fees collected when disbursing loans are recognised as income at the time of the disbursement, which means that fees and commissions are recognised as income at the same time as the costs are incurred. Commitment fees are charged on loans that are agreed but not yet disbursed and are accrued in the statement of comprehensive income over the commitment period.
Annually recurrent costs arising as a result of the Bank’s borrowing, investment and payment transactions are recognised under the item “Commission expense and fees paid”.
Financial transactions
The Bank recognises in “Net profit on financial operations” both realised and unrealised gains and losses on debt securities and other financial instruments. Adjustments for hedge accounting are also included in this item.
Administrative expenses
The Bank provides services to its related parties, the Nordic Development Fund (NDF) and the Nordic Environment Finance Corporation (NEFCO). Payments received by the Bank for providing services at cost to these organisations are recognised as a reduction in the Bank’s administrative expenses. NIB receives a host country reimbursement from the Finnish Government equal to the tax withheld from the salaries of NIB’s employees. This payment reduces the Bank’s administrative expenses, as shown in Note 7.
Leasing agreements
Leasing agreements are classified as operating leases if the rewards and risks incident to ownership of the leased asset, in all major respects, lie with the lessor. Lease payments under operating leases are recognised on a straight-line basis over the lease term. The Bank’s rental agreements are classified as operating leases.
Employee pensions and insurance
The Bank is responsible for arranging pension security for its employees. In accordance with the Host Country Agreement between the Bank and the Finnish Government and as part of the Bank’s pension arrangements, the Bank has decided to apply the Finnish state pension system. Contributions to this pension system, which are paid into the Finnish State Pension Fund, are calculated as a percentage of salaries. The Finnish Ministry of Finance determines the basis for the contributions and establishes the actual percentage of the contributions according to a proposal from the local government pension institution Keva. See Note 7. The Bank’s pension liability is completely covered.
NIB also provides its permanent employees with a supplementary pension insurance scheme arranged by a private pension insurance company. This is group pension insurance based on a defined contribution plan. In addition to the applicable local social security systems, NIB has taken out, for example, comprehensive accident, life, medical and disability insurance policies for its employees in the form of group insurance.
Segment information
Segment information and currency distribution in the notes are presented in nominal amounts. The adjustment to hedge accounting is presented as a separate item (except for Note 3, the primary reporting segment).
Reclassifications
Some other minor reclassifications have been made. The comparative figures have been adjusted accordingly.
26
New and amended standards applied in the financial year 2017
NIB has no transactions that have been materially affected by new amendments or standards during 2017.
Adoption of new and amended standards and interpretations applicable in future financial years
NIB has not yet adopted the following new and amended standards and interpretations already issued by the IASB. NIB will adopt them as of the effective date or, if the date is other than the first day of the financial year, from the beginning of the subsequent financial year.
New IFRS 9 Financial Instruments effective for financial years beginning on or after 1 January 2018
IFRS 9 ‘Financial Instruments’ (IFRS 9) has been issued in phases over a number of years with entities allowed to adopt the various versions of the standard or wait until the final version was published.
The first phases covered ‘Classification and measurement’ and ‘Hedge Accounting’, which the Bank early adopted. In July 2014, the IASB issued the final version of IFRS 9, adding ‘impairment’ and amending previous versions, the most significant amendment being the introduction of a new asset classification ‘Fair value through other comprehensive income’ (FVOCI).
The Bank will adopt IFRS 9 as issued by the IASB in July 2014 with a date of transition of 1 January 2018, which will result in changes in accounting policies and adjustments to amounts recognised in the financial statements as described below. As the Bank had earlier adopted the previous versions of IFRS 9, the changes are limited to new rules on impairment and the new asset classification FVOCI.
Classification and Measurement – The new standard introduces a new financial asset classification type, Fair value through other comprehensive income (FVOCI) for financial assets held in a business model whose objective is to hold assets to collect contractual cash flows and selling financial assets and the cash flows consist solely payments of principal and interest on the principal amount outstanding (“SPPI”). As at 1 January 2018, NIB will not record any assets in this asset classification.
Impairment – The new impairment requirements are based on an expected credit loss (ECL) model and will replace the current incurred loss model. The expected credit loss model applies to financial assets recorded at amortised cost or at fair value through other comprehensive income, such as loans, debt securities and most loan commitments and financial guarantee contracts. The Bank is required to recognise an allowance for either 12-month or lifetime expected credit losses (ECLs), depending on whether there has been a significant increase in credit risk since initial recognition. The measurement of ECLs reflects a probability-weighted outcome, the time value of money and the best available forward-looking information. The new model incorporates forward-looking information through the inclusion of macroeconomic factors. Further explanations of inputs, assumptions and techniques used in estimating the ECL will be disclosed in the 2018 annual financial statements. The adoption of the new impairment model resulted in a decrease in equity of EUR 3 million at 1 January 2018.
IFRS 16 Leases substantially changes the accounting treatment as the majority of leases will become on-balance sheet liabilities with corresponding right of use assets on the balance sheet. The standard replaces IAS 17 Leases and is effective as of January 1, 2019. However, the Bank does not have significant leasing commitments and therefore the new standard is not expected to have a significant impact.
There are no other IFRS standards or interpretations that are not yet effective that would be expected to have a material impact on the Bank.
27
Note 2: Risk management
The Bank assumes a conservative approach to risk-taking. Careful balancing of mission fulfilment, revenue generation and risk mitigation is a key consideration in the Bank’s risk-taking. The constituent documents require that loans be granted in accordance with sound banking principles, that adequate security be obtained for the loans, unless sufficient security is considered to exist under the circumstances, and that the Bank protect itself against the risk of exchange rate losses to the extent practicable. The Bank’s risk tolerance is defined with the objective of maintaining strong credit quality, stable earnings and a level of capital and liquidity required to maintain the Bank’s AAA/Aaa rating.
The main risks — credit risk, market risk, liquidity risk, operational risk and compliance risk — are managed carefully with the overall objective of maintaining financial soundness and avoiding activities that could threaten the Bank’s reputation. Other risks are managed based on conducted materiality assessment. As an international financial institution, the Bank is not subject to national or international prudential regulation of the banking sector. However, the Bank’s risk management framework is regularly reviewed and adapted to changing conditions with the aim of complying in substance with what the Bank identifies as the relevant market standards and best practices, including the standards and guidelines of the Basel Committee on Banking Supervision.
The Bank’s risk management framework comprises risk policies and procedures formulated for the assessment, measurement, monitoring and reporting of risks including a comprehensive limit system for managing the exposure to quantifiable risks. The Bank recognises that effective risk management is based on a sound risk culture, which is characterised, among other things, by a high level of awareness concerning risk and risk management in the organisation. Regular training of staff in risk-related matters is part of the Bank’s risk management practices.
Key risk responsibilities
The Board of Directors lays down the general framework for the Bank’s risk management by approving its risk management policies, including maximum limits for exposure to the main types of risk. The Board approves credits and grants authorisation to the Bank to raise funds in the capital markets based on its estimated funding requirements.
The President is responsible for managing the risk profile of the Bank within the framework set by the Board of Directors and for ensuring that the Bank’s aggregate risk is consistent with its financial resources and willingness to take risk. The Board of Directors has delegated some credit approval authority to the President for execution in the Credit Committee.
The following committees assist and advise the President:
The Executive Committee consists of the President and senior officers, whose appointment to the committee has been confirmed by the Board of Directors. The committee is the forum for addressing policy and management issues, including following up the financial results, business plan and strategy of the Bank. The committee meets approximately twice a month.
The Credit Committee consists of the President and senior officers appointed by the Board of Directors. The committee is responsible for preparing and making decisions on credit matters related to lending operations and for decisions on treasury counterparties. Among other things, the committee reviews all credit proposals before they are submitted to the Board of Directors for approval. The committee usually meets weekly.
The Finance Committee consists of the President, the Head of Treasury and the Head of Finance. The committee is responsible for preparing and making decisions on matters related to treasury operations. The committee makes recommendations and, where appropriate, decisions in the area of market, counterparty and liquidity risk exposure. It also monitors the Bank’s borrowing activities and has oversight of treasury risk reporting to the Board of Directors. The committee usually meets monthly.
The Asset and Liability Committee (ALCO) consists of the members of the Executive Committee and the Chief Risk Officer. Together with the Executive Committee, it has overall responsibility for the Bank’s risk management. ALCO’s duties include monitoring the Bank’s balance sheet development and capital adequacy, setting targets and limits for risk to be managed at the bank level, reviewing liquidity risk management and funding structure, as well as monitoring performance against the agreed risk appetite. The committee meets approximately six times a year.
The Business and Technology Committee (BTC) consists of the Head of Business Services, Head of Finance, Head of IT, Head of Treasury and Head or Deputy Head of Lending. BTC is responsible for aligning the Bank’s enterprise architecture with strategic goals by prioritizing, directing, monitoring and governing the technology development.
28
In addition to the advisory bodies to the President, the Bank has the following permanent internal committees focusing on risk aspects:
The New Product and Structure Committee scrutinises product and deal structure proposals, which from a risk and/or administrative point of view significantly differ from what the Bank has entered into previously.
The Council of Fighting Corruption has been established to enhance the awareness of integrity and corruption risks among the Bank’s staff and stakeholders.
In the day-to-day operations, the Bank has established a segregation of duties between units that enter into business transactions with customers or otherwise expose the Bank to risk, and units in charge of risk assessment, risk measurement, monitoring and control.
The business units, Lending and Treasury, are responsible for implementing the Bank’s business strategy. Lending is responsible for loan origination and mandate fulfilment in accordance with the Bank’s willingness to take risk. Treasury provides support by executing the funding strategy and managing the liquidity as well as balance sheet risks (Asset and Liability Management). The business units carry out the day-to-day management of all risks assumed in their operations and ensure that an adequate return is achieved for the risks taken. The Head of Lending and the Head of Treasury report to the President.
The Risk Management unit within Finance carries out independent measuring, controlling, monitoring and reporting of the Bank’s credit risk, liquidity risk, market risk and operational risk exposures as well as its capital adequacy. The Chief Risk Officer, who heads the Risk Management unit, reports to the Head of Finance, who in turn reports to the President.
Credit and Analysis is responsible for independently assessing counterparty credit risk in the Bank’s lending and treasury operations as well as for counterparty monitoring. The Credit unit oversees that credit proposals are in compliance with established limits and policies. The Special Credits unit manages transactions requiring particular attention due to restructuring work-out and recovery processing. The Head of Credit and Analysis reports to the President.
The Legal department supports all units of the Bank carrying the responsibility for minimising and mitigating legal risks in the Bank’s operational and administrative activities. The General Counsel reports to the President.
The Compliance function assists the Bank in identifying, assessing, monitoring and reporting on compliance risks in matters relating to the institution, its operations and the personal conduct of staff members. The Chief Compliance Officer reports to the President, with unrestricted access to the Chairman of the Board of Directors and the Chairman of the Control Committee.
Internal Audit provides an independent evaluation of the controls, risk management and governance processes. The Head of Internal Audit reports to the Board of Directors and the Control Committee.
The Control Committee is the Bank’s supervisory body. It ensures that the operations of the Bank are conducted in accordance with the Statutes. The committee is responsible for the audit of the Bank’s accounts and submits its annual audit statement to the Board of Governors. The committee also monitors the anti-corruption and compliance practices of the Bank.
Credit risk
Credit risk is the Bank’s main financial risk. Credit risk is defined as the risk of loss resulting from the failure of the Bank’s borrowers and other counterparties to fulfil their contractual obligations and that collateral provided does not cover the Bank’s claims. Following from NIB’s mission, most of the credit risk stems from the Bank’s lending operations. The Bank is also exposed to credit risk in its treasury activities, where credit risk derives from the financial assets that the Bank uses for investing its liquidity, such as fixed-income securities and interbank deposits, and from derivative instruments used for managing currency and interest rate risks and other market risks related to structured funding transactions.
Credit risk management
The Bank’s credit risk management builds on the principles of (1) appropriate risk diversification within the scope of the mission; (2) thorough risk assessment at the credit appraisal stage; (3) risk-based pricing and risk mitigation; (4) continuous risk monitoring at the individual counterparty level as well as portfolio level; (5) avoidance of undesirable risks to the extent possible.
Credit risk limits
The maximum credit exposure that the Bank is willing to take is expressed in terms of exposure limits set by the Board of Directors. Credit exposure is the aggregate of lending and treasury exposure. Limits at counterparty level are scaled to the Bank’s equity and the counterparty’s equity. Portfolio level limits are defined in relation to the Bank’s equity.
29
Counterparty limits are determined based on the probability of default and expected loss. The Bank defines a single counterparty as a counterparty or group of counterparties that are legally and/or financially consolidated or otherwise interdependent from a risk perspective. For exposure limit purposes, the Bank considers the entity where the risk resides, i.e. the risk-owner, as the counterparty. The risk-owner is the entity that is ultimately responsible for the Bank’s claim and may be different from the obligor if the risk is transferred through a guarantee. In order for a guarantee to be eligible for risk transfer, it must cover the full exposure and be a guarantee undertaking securing the borrower’s debt “as for own debt”, meaning that the Bank can make a claim under the guarantee immediately after the borrower has failed to pay on a due date.
To prevent excessive concentrations, the Bank applies portfolio-level limits for large counterparty exposures, as well as for industry sector and country exposures. The Bank has not set limits for the aggregate lending exposure in its member countries. Lending in non-member countries is subject to country limits. For the Bank’s treasury operations, country limits apply for exposure in member and non-member countries.
As a general principle, the Bank limits the maximum amount granted as loan or guarantee for a single project to 50% of the total project cost. Financing to small and medium-sized enterprises, small mid-cap corporates and mid-cap corporates in the Bank’s member countries can be extended up to 75% of the total project or financing need qualifying for a NIB mandate.
Credit risk assessment
The counterparty’s debt servicing capacity is a key consideration for credit approval. The assessment of a counterparty’s creditworthiness focuses on identifying the main financial and business risks related to the counterparty. Based on the assessment, a risk rating indicating the probability of default (PD) is assigned to the counterparty. The credit risk assessment includes the use of quantitative risk methodologies and models as well as qualitative assessments based on expert judgement. The process of assigning PD ratings to counterparties is carried out in the Credit & Analysis department.
A separate expected loss (EL) rating is assigned at the transaction level. The EL rating factors in the loss given default (LGD), i.e. the loss severity in the event of a counterparty default. The LGD assignment process relies on models that produce an LGD estimate based on the type of counterparty and the characteristics of the transaction, such as guarantees, collateral, the seniority of the claim and other credit enhancing factors in the transaction. The risk ratings are approved by the Credit Committee.
The Bank’s risk rating system comprises 20 classes to differentiate the risk of counterparty default and the expected loss on a transaction. In addition, a separate D class applies for non-performing transactions. For reference to external ratings, the internal scales are mapped to the ratings of S&P and Moody’s such that classes 1 to 10 correspond to the external rating equivalent of the investment grade AAA to BBB- and Aaa to Baa3, respectively.
Credit risk mitigation
According to NIB’s statutes, adequate credit enhancement is required in order to reduce credit risk in the Bank’s lending. Loans granted by the Bank are either unsecured or secured. The Bank seeks to mitigate the credit risk related to unsecured loans by including various covenants, undertakings, prepayment events and events of default in the loan documentation. The requirements vary depending on the type of borrower and the tenor and amortisation profile of the loan.
Some of the Bank’s lending is secured by collateral or guaranteed by the parent of the borrower or a third party. The value of the collateral should preferably not be correlated with the creditworthiness of the borrower nor be related to the borrower’s business and there should be a functioning market for such assets.
The distribution of the Bank’s lending portfolio by type of credit enhancement at year-end 2017 is presented below with further information in Note 11.
Lending by type of credit enhancement
as of 31 Dec 2017
EUR m
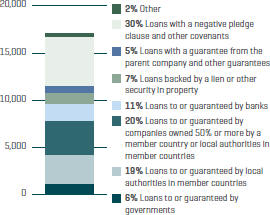
30
In its treasury operations, the Bank applies netting and collateralisation to mitigate counterparty credit risk related to derivatives and collateralised placements. The Bank undertakes swap transactions only with counterparties that meet the required minimum counterparty credit rating and have executed an International Swaps and Derivatives Association (ISDA) Master Agreement and signed a Credit Support Annex (CSA). Collateralised placements in the form of reverse repo transactions are made on the terms of the Global Master Repurchase Agreement (GMRA).
The ISDA master agreement allows for a single net settlement of all swap transactions covered by the agreement in the event of a counterparty default or early termination of the transactions. Netting is applied for the measurement of the Bank’s credit exposure only in cases when it is deemed to be legally valid and enforceable in the relevant jurisdiction. At year-end 2017, netting reduced the swap exposure by EUR 540 million from a gross total market value of EUR 1,110 million to EUR 571 million (year-end 2016: EUR 2,264 million and EUR 1,375 million, respectively).
The CSAs further mitigate credit risk related to swaps. Swap positions are marked to market daily and the resulting positive exposures (receivable) exceeding agreed thresholds, if any, are collateralised by cash or, for certain counterparties, with high-quality government securities. Since 2016, NIB enters into two-way CSAs, which means that the Bank posts collateral when the market value of the swap position is negative (liability). At year-end 2017, approximately 92% of the Bank’s swaps measured by nominal value were under two-way CSAs. Close to 7% were under one-way CSAs meaning that NIB is not required to post collateral for its swap liabilities. The remaining portion of less than 0.5% of the total nominal swap exposure was with counterparties with whom no CSA has been concluded. At year-end 2017, the Bank held EUR 556 million (2016: EUR 1,420 million) in gross collateral received, of which EUR 547 million (2016: EUR 1,309 million) was in cash and EUR 9 million (2016: EUR 111 million) in securities (See Note 18, Collateral and Commitments). The Bank had posted collateral of EUR 899 million (2016: EUR 207 million).
Credit risk monitoring
The Bank puts strong emphasis on continuous monitoring of the credit risk development in its lending and treasury operations. Credit risk is monitored both at counterparty level and at portfolio level. The primary responsibility for credit risk monitoring resides with the unit responsible for the client relationship i.e. Lending, Treasury and Special Credits with support from Credit & Analysis. Risk Management carries out the portfolio level monitoring.
All lending exposures are subject to continuous monitoring of contractual compliance and events/signals that could potentially lead to or indicate a material change in risk. In addition, an annual follow-up is conducted on the entire loan portfolio. The annual follow-up is presented to the Credit Committee and reported to the Board of Directors.
Treasury exposures are subject to continuous monitoring of events and market signals that could potentially lead to or indicate a material change in risk. At a minimum, the counterparties are analysed and the risk class validated every two years. The follow-up is presented to the Credit Committee.
Following the identification of a seriously deteriorated debt repayment capacity and/or a serious deterioration in the financial standing, the counterparty is placed on the watch-list and becomes subject to specific watch-list monitoring. Watch-listed counterparties are reviewed by the Credit Committee at agreed intervals and reported to the Board of Directors. If a credit exposure requires the expertise of specialists in workout and restructuring, it will be transferred to the Special Credits unit. The unit’s primary objective is to take over responsibility for distressed loans from Lending and devote sufficient time and effort to the individual case in order that the Bank may recover all or as much as possible of distressed loans outstanding.
Credit risk monitoring at portfolio level includes, among others, an analysis of the aggregate credit risk exposure, credit risk concentrations and changes in the risk profile. The development is reported to the Executive Committee, ALCO and the Board of Directors.
Compliance with existing limits is monitored regularly; for treasury counterparties, limit compliance is monitored on a daily basis. Exposure in excess of maximum limits may occur e.g. due to downgrade of a counterparty rating. Limit breaches are reported to senior management, relevant committees and the Board of Directors.
Risk-based pricing
The Statutes stipulate that the Bank shall operate according to sound banking principles and aim for a profit allowing the formation of reserves and a reasonable return on capital. Loans and guarantees are priced to cover the Bank’s cost of funds, administration costs, the cost of the risk involved in the transaction and the cost of capital employed. For loan pricing purposes, the Bank uses a pricing tool that enables calculation of the minimum earnings required on a loan in order to cover all lending related costs and an appropriate return for the level of risk assumed. Internal credit risk ratings and associated risk parameters, as well as the structure of the transaction, are key input factors in the pricing tool.
Credit risk reserves, impairment methodology
The Bank maintains two credit risk funds within its equity, in addition to the Statutory Reserve. The General Credit Risk Fund is available to cover unexpected losses arising from the Bank’s lending and other business activities. At year-end 2017, the fund amounted to EUR 1,697 million before allocation of the profit for the year. The Statutes require that the Bank maintains the Special Credit Risk Fund for the Project Investment Loan (PIL) facility to cover the Bank’s own risk on such loans before resorting to the member countries’ guarantees that support the facility. At year-end 2017, the fund amounted to EUR 446 million before allocation of the profit for the year.
31
At least every four months, the Bank reviews the need for impairment provisions on weak exposures. The assessment is carried out both at the level of the individual counterparty and collectively for groups of counterparties. At the counterparty level, an individually assessed impairment provision is recognised if there is objective evidence that the counterparty’s capacity to fulfil its obligations has deteriorated to the extent that full repayment is unlikely, taking into consideration any collateral received. Collective impairment provisions are determined on a portfolio basis for exposures with similar credit risk characteristics as reflected in their risk ratings. The process includes the management’s judgement based on the current macroeconomic environment and the current view of the expected economic outlook. In the Bank’s view, the assumptions and estimates made are appropriately conservative and are reflective of the predicted economic conditions, the Bank’s portfolio characteristics and their correlation with losses incurred based on historical loss experience. In the assessment of sovereign exposures, the Bank takes into account its preferred creditor status. The Bank’s principles for impairment provisioning are described in more detail in Note 1 “Accounting policies”.
Credit risk exposure
Tables 1 to 3 below provide an overview of the Bank’s aggregate credit risk exposure at year-end 2017 distributed according to expected loss (EL) before collective impairment. Aggregate credit exposure comprises lending and treasury exposure. Lending exposure includes loans outstanding and loan commitments, without taking into account any collateral or other credit enhancement. Regarding the treasury exposure, capital market investments are included at nominal value, while derivatives are included at market value net of collateral held. The exposure in reverse repo transactions is calculated as a fixed percentage of the nominal value of the transaction thus reflecting that these are collateralised placements.
TABLE 1. Credit risk exposure by internal rating based on expected loss (EL) (in EUR million)
| | | | | | | | | | | | | | | | | | | | | | | | | | | | |
| | | |
| RISK | | S&P | | | 31 December 2017 | | | 31 December 2016 | |
| | | | | | | |
CLASS | | EQUIVALENT | | | LENDING | | | TREASURY | | | TOTAL | | | LENDING | | | TREASURY | | | TOTAL | |
1–2 | | | AAA/AA+ | | | | 5,321 | | | | 5,516 | | | | 10,838 | | | | 4,458 | | | | 5,005 | | | | 9,463 | |
3–4 | | | AA/AA- | | | | 1,249 | | | | 2,417 | | | | 3,666 | | | | 1,231 | | | | 1,991 | | | | 3,223 | |
5–6 | | | A+/A | | | | 1,888 | | | | 787 | | | | 2,675 | | | | 1,544 | | | | 1,164 | | | | 2,707 | |
7–8 | | | A-/BBB+ | | | | 4,790 | | | | 74 | | | | 4,864 | | | | 4,799 | | | | 232 | | | | 5,031 | |
9–10 | | | BBB/BBB- | | | | 3,444 | | | | 2 | | | | 3,446 | | | | 3,582 | | | | 1 | | | | 3,583 | |
11–12 | | | BB+/BB | | | | 1,962 | | | | 0 | | | | 1,962 | | | | 1,671 | | | | 0 | | | | 1,671 | |
13–14 | | | BB/BB- | | | | 524 | | | | 0 | | | | 524 | | | | 718 | | | | 0 | | | | 718 | |
15–16 | | | BB-/B+ | | | | 136 | | | | 0 | | | | 136 | | | | 289 | | | | 0 | | | | 289 | |
17–18 | | | B/B- | | | | 8 | | | | 0 | | | | 8 | | | | 15 | | | | 0 | | | | 15 | |
19–20 | | | B-/CCC | | | | 5 | | | | 0 | | | | 5 | | | | 7 | | | | 0 | | | | 7 | |
D | | | | | | | 7 | | | | 0 | | | | 7 | | | | 21 | | | | 2 | | | | 23 | |
TOTAL | | | | | | | 19,333 | | | | 8,796 | | | | 28,129 | | | | 18,335 | | | | 8,396 | | | | 26,730 | |
| | | | | | | |
Class D | | | | | | | | | | | | | | | | | | | | | | | | | | | | |
Gross | | | | | | | 100 | | | | 0 | | | | 100 | | | | 118 | | | | 45 | | | | 163 | |
Impairment | | | | | | | 93 | | | | 0 | | | | 93 | | | | 97 | | | | 42 | | | | 140 | |
Net | | | | | | | 7 | | | | 0 | | | | 7 | | | | 21 | | | | 2 | | | | 23 | |
32
The quality of the Bank’s aggregate credit exposure remained sound in 2017. Lending exposure increased by around 5% due to a high volume of loan disbursements. Close to 30% of the disbursements were to counterparties in the best risk classes (EL1-2), which was largely explained by new lending to the public sector. Treasury exposure increased by around 5 % due to a shift from reverse repos to uncollateralised placements with banks. A significant part of these placements were with central banks. At year-end 2017, 86% (2016: 85%) of lending exposure and 100% (2016: 99.9%) of treasury exposure was in risk classes 1-10, corresponding to investment-grade quality. The lending exposure in the weakest risk classes (EL 17-20) was reduced mainly due to repayment. The decrease in exposure in risk class D (non-performing) was the result of payments received, adjustment of individually assessed impairments and foreign exchange translation effects.
TABLE 2. Geographical distribution of the credit risk exposure (in EUR million)
The geographical distribution of the aggregate credit risk exposure is shown in the table below. The distribution is based on the risk-owner’s country of domicile.
| | | | | | | | | | | | | | | | | | | | | | | | |
| | |
| | | 31 December 2017 | | | 31 December 2016 | |
| | | | | | |
COUNTRY/REGION | | LENDING | | | TREASURY | | | TOTAL | | | LENDING | | | TREASURY | | | TOTAL | |
Denmark | | | 1,485 | | | | 1,602 | | | | 3,087 | | | | 1,324 | | | | 1,311 | | | | 2,635 | |
Estonia | | | 227 | | | | 0 | | | | 227 | | | | 215 | | | | 0 | | | | 215 | |
Finland | | | 4,009 | | | | 1,461 | | | | 5,470 | | | | 4,068 | | | | 911 | | | | 4,978 | |
Iceland | | | 615 | | | | 0 | | | | 615 | | | | 618 | | | | 1 | | | | 619 | |
Latvia | | | 267 | | | | 48 | | | | 315 | | | | 232 | | | | 48 | | | | 280 | |
Lithuania | | | 653 | | | | 0 | | | | 653 | | | | 625 | | | | 0 | | | | 625 | |
Norway | | | 4,277 | | | | 374 | | | | 4,651 | | | | 4,103 | | | | 277 | | | | 4,380 | |
Sweden | | | 5,873 | | | | 1,407 | | | | 7,280 | | | | 4,944 | | | | 1,334 | | | | 6,278 | |
Africa and Middle East | | | 93 | | | | 0 | | | | 93 | | | | 125 | | | | 0 | | | | 125 | |
Americas | | | 176 | | | | 937 | | | | 1,113 | | | | 253 | | | | 800 | | | | 1,054 | |
Asia-Pacific | | | 564 | | | | 99 | | | | 663 | | | | 587 | | | | 31 | | | | 618 | |
Europe | | | 778 | | | | 2,297 | | | | 3,074 | | | | 903 | | | | 3,136 | | | | 4,039 | |
Multilaterals | | | 317 | | | | 570 | | | | 888 | | | | 336 | | | | 547 | | | | 883 | |
TOTAL | | | 19,333 | | | | 8,796 | | | | 28,129 | | | | 18,335 | | | | 8,396 | | | | 26,730 | |
In the context of the Bank’s mission, the credit risk exposure continued to be fairly well balanced in terms of geographical distribution. At year-end 2017, the member countries accounted for 90% of the Bank’s lending exposure (2016: 88%) with the exposure to Sweden showing the largest increase (+19%) in 2017. The largest lending exposures outside the member countries were in Poland, China, Brazil, France and India. The Bank’s exposure in Russia, Ukraine and Belarus amounted to EUR 104 million (2016: EUR 152 million), including EUR 44 million (2016: EUR 55 million) under the MIL facility and EUR 22 million (2016: EUR 25 million) in agreed, not disbursed loans. At year end the Bank had no exposure to Ukraine (2016: EUR 7 million.)
Of the treasury exposure, 56% (2016: 46%) was in the member countries, while the rest of Europe accounted for 26% (2016: 37%), dominated by Germany and The Netherlands. The major part of the treasury exposure outside Europe was in Canada.
33
TABLE 3. Credit risk exposure by industry sector (in EUR million)
The distribution of the credit risk exposure by sector is based on the industry sector of the risk-owner. These sectors are different from the four business areas into which the Bank has organised its lending operations.
| | | | | | | | | | | | | | | | | | | | | | | | |
| | |
| | | 31 December 2017 | | | 31 December 2016 | |
| | | | | | |
INDUSTRY SECTOR | | LENDING | | | TREASURY | | | TOTAL | | | LENDING | | | TREASURY | | | TOTAL | |
Oil & Gas | | | 45 | | | | 0 | | | | 45 | | | | 125 | | | | 0 | | | | 125 | |
Materials | | | 939 | | | | 0 | | | | 939 | | | | 1,053 | | | | 0 | | | | 1,053 | |
Industrials | | | 3,691 | | | | 0 | | | | 3,691 | | | | 3,540 | | | | 0 | | | | 3,540 | |
Consumer discretionary | | | 524 | | | | 0 | | | | 524 | | | | 568 | | | | 0 | | | | 568 | |
Consumer staples | | | 932 | | | | 0 | | | | 932 | | | | 977 | | | | 0 | | | | 977 | |
Health care | | | 638 | | | | 0 | | | | 638 | | | | 551 | | | | 0 | | | | 551 | |
Financials | | | 2,759 | | | | 5,488 | | | | 8,246 | | | | 2,202 | | | | 5,275 | | | | 7,477 | |
Information technology | | | 265 | | | | 0 | | | | 265 | | | | 186 | | | | 0 | | | | 186 | |
Telecommunication services | | | 267 | | | | 0 | | | | 267 | | | | 309 | | | | 0 | | | | 309 | |
Utilities | | | 3,896 | | | | 0 | | | | 3,896 | | | | 4,255 | | | | 0 | | | | 4,255 | |
Public sector | | | 5,377 | | | | 3,308 | | | | 8,685 | | | | 4,569 | | | | 3,121 | | | | 7,689 | |
TOTAL | | | 19,333 | | | | 8,796 | | | | 28,129 | | | | 18,335 | | | | 8,396 | | | | 26,730 | |
The distribution of the lending exposure by industry sector remained stable in 2017 compared to the previous year, with the public sector, the utility sector and the industrials sector accounting for 67% (2016: 67%) of the total exposure. In nominal terms the most significant increase was in the exposure to the public sector and the financial sector. The exposure to these sectors increased as a consequence of new lending and included EUR 1.3 billion in agreed, not disbursed loans at year-end 2017.
The Bank has defined limits for maximum exposure to a single industry measured by the economic capital requirement and total credit risk exposure in relation to the Bank’s equity. At year-end 2017, the Bank was in compliance with these limits.
TABLE 4. Largest counterparty exposures (% of total credit risk exposure)
A counterparty exposure is defined as the consolidated group exposure, i.e. individual counterparties that are linked to one another by ownership or otherwise interdependent from a risk perspective are considered as one counterparty.
| | | | |
| | |
| | | 31 December 2017 | | 31 December 2016 |
Top 5 | | 11% | | 10% |
Top 10 | | 18% | | 17% |
Top 20 | | 28% | | 27% |
The limits for large single counterparty exposures and for the aggregate of such large exposures are scaled to the Bank’s equity. Any deviations from the set limits must be approved by the Board of Directors. At year-end 2017, the Bank was within the aggregate limits set for large exposures.
34
Market risk
The Bank defines market risk as the risk of valuation loss or reduction in the expected earnings stemming from adverse fluctuations in exchange rates, interest rates, credit spreads and cross-currency basis spreads.
Market risks predominantly arise from the Bank’s core business activities and the liquidity portfolio needed to support these activities. The Bank’s strategy is to obtain cost-efficient funding from diversified sources and provide lending that is tailored to the needs of its customers. This gives rise to foreign exchange risk and structural interest rate risk due to mismatches in the Bank’s assets and liabilities in terms of currency composition, maturity profile and interest rate characteristics. Cross-currency basis risk stems from the hedging techniques used by the Bank to mitigate spot foreign exchange risk deriving from funding and lending in different currencies. This risk reflects the liquidity charge for exchanging foreign currencies at a future point in time.
The Bank’s securities portfolio held for liquidity purposes as well as the portfolio of green bond investments are exposed to interest rate risk and credit spread risk. Credit spread risk refers to the potential decline in market value due to perceived change in the credit quality of the issuers of the securities held in the portfolios.
Market risk management
The Bank manages market risks by hedging against foreign exchange risk and interest rate risk with the objective of protecting its earnings and the economic value of its assets and liabilities. Foreign exchange risk is practically fully hedged. Interest rate risk deriving from mismatches between funding and lending is kept at a modest level. The Bank’s tolerance for interest rate risk and credit spread risk pertains to the earnings expectations set for the liquidity portfolio.
As part of its structured funding transactions, the Bank may use financial instruments linked to other market risk factors than the above. A prerequisite is that such transactions are completely hedged with derivatives and that the Bank is able to valuate and measure the risks involved in the derivatives.
The Bank’s market risks are managed by Treasury. The Risk Management unit provides independent oversight of all significant market risks, supporting the Finance Committee, ALCO and Treasury with risk measurement, analysis, daily monitoring and reporting.
Foreign exchange rate risk
TABLE 5. Foreign exchange rate risk (in EUR million)
| | | | | | | | | | |
| | | | |
| Net open positions | | | | | TOTAL LIMIT | | 31 December 2017 | | 31 December 2016 |
| | | | USD | | | 4.00 | | 0.81 | | 1.94 |
| | | | DKK | | | 1.00 | | 0.42 | | 0.17 |
| | | | SEK | | | 1.00 | | 0.32 | | 0.30 |
| | | | NOK | | | 1.00 | | 0.50 | | 0.28 |
| | | | Other currencies, Total | | | 4.00 | | 2.20 | | 1.77 |
The Statutes require that the Bank shall, to the extent practicable, protect itself against the risk of exchange rate losses.
Exchange rate risk is measured on the basis of net open positions in each currency. The limits set to restrict the overnight positions and the actual exposure as at year-end 2017 are presented in the above table. Note 22, Currency risk, shows the net of assets and liabilities at fair value in the major currencies as of year-end 2017.
The Bank hedges foreign exchange rate risk with cross-currency basis swaps, which gives rise to currency basis risk. The market value sensitivity of the Bank’s swap portfolio to one basis point shift in the relevant currency basis curves was EUR 1.8 million at year-end 2017 (2016: EUR 2 million) mostly deriving from the euro/US dollar, euro/ Australian dollar and euro/Swedish krona basis.
The Bank does not hedge future net interest income in foreign currency. Loans are provided primarily in euro, Nordic currencies and US dollars. There is a possibility that interest income in currencies other than the euro may cause some fluctuation in the Bank’s future net income in euro terms. However, at present the Bank expects that any such potential fluctuations in future cash flows from its current portfolio would be minor in relation to its total assets and equity.
35
Interest rate risk
TABLE 6. Interest rate risk (in EUR million)
| | | | | | |
| | | |
| | | TOTAL GROSS LIMIT | | 31 December 2017 | | 31 December 2016 |
Sensitivity to 1bp change in interest rates | | 1.50 | | 0.90 | | 0.88 |
Development of interest rate risk
in EUR
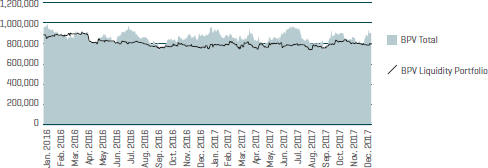
The Bank manages interest rate risk by using derivatives to convert fixed-rate funding into floating-rate liabilities. Fixed-rate lending that is not match- funded is converted to floating-rate receivables. This hedging approach ensures that the interest rate risk between lending and funding in each currency remains low. The majority of the Bank’s interest rate risk, therefore, stems from the portfolio of liquid assets.
The Bank measures and manages interest rate risk by estimating the sensitivity of the economic value of its balance sheet to an interest rate shock. The sensitivity is measured by means of basis point value (BPV) quantifying the impact of an interest rate change of one basis point on the present value of interest-bearing assets and liabilities.
Maximum limits have been set for the acceptable exposure to interest rate risk both at an aggregate balance sheet level and at portfolio level. A gross limit equivalent to EUR 1.5 million covering all currencies restricts the BPV interest rate risk to approximately 0.05% of the Bank’s equity. In addition, individual BPV limits have been set for interest rate risk in EUR, USD and the Nordic currencies, whereas a combined limit applies for all other currencies. As a supplementary indicator of interest rate risk, the Bank estimates the worst-case effect of a 0.1% change in interest rates on its net interest income over the lifetime of interest-bearing assets and liabilities due to mismatches in terms of re-pricing periods and volumes. This is managed through a limit of EUR 34 million, corresponding to approximately 1% of the Bank’s equity. At year-end 2017, the exposure amounted to EUR 10.5 million (2016: EUR 13.9 million).
36
Credit spread risk
TABLE 7. Credit spread risk (in EUR million)
| | | | | | |
| | | |
| | | TOTAL LIMIT | | 31 December 2017 | | 31 December 2016 |
Sensitivity to 1bp change in credit spreads | | 2.50 | | 1.88 | | 1.69 |
Development of credit spread risk
in EUR

The Bank manages its exposure to credit spread risk by measuring the sensitivity of its portfolios of marketable securities to credit spread movements. The sensitivity is measured by means of Credit Spread Basis Point Value (Spread BPV) quantifying the impact of an increase of one basis point in credit spreads on the present value of the assets.
Limits have been defined to restrict the decrease in asset value to acceptable levels in accordance with the Bank’s willingness to accept risk in its liquidity portfolio. The Bank has set an overall limit of EUR 2.5 million for credit spread risk, with specific sub-limits defined for various asset classes. To ensure that the liquidity portfolio maintains its market value and liquidity under severe market conditions, the assets in the portfolio must satisfy minimum rating requirements and other quality criteria.
Liquidity risk
Liquidity risk is defined as the risk of incurring losses due to an inability to meet payment obligations in a timely manner when they become due. The Bank categorises liquidity risk into funding liquidity risk, which occurs when payment obligations cannot be fulfilled because of an inability to obtain new funding, and market liquidity risk, which occurs when the Bank is unable to sell or transform assets in the liquidity buffer into cash without significant losses.
Liquidity risk management
The Bank’s business model gives rise to liquidity risk mainly through maturity mismatches between assets (loans and treasury investments) and liabilities (borrowing and equity). The liquidity position and adherence to exposure limits is managed by Treasury and monitored by Risk Management on a daily basis.
The Finance Committee and ALCO oversee the development of the Bank’s funding and liquidity position and decide on liquidity risk-related matters in accordance with their respective mandates. The Board of Directors receives regular reports on the liquidity and funding situation of the Bank.
The key metric applied for managing liquidity risk is the survival horizon, which measures how long the Bank would be able to fulfil its payment obligations in a severe stress scenario. The target survival horizon is twelve months, which means that the Bank would be able to meet its payment obligations and continue its business operations without disruption for the coming twelve months under severely stressed conditions. The minimum requirement is that the survival horizon must at all times exceed nine months. The stress scenario includes, among other things, the assumption of payment disruptions in the loan portfolio, no access to market funding, early termination of all callable funding transactions, collateral provided for swap exposure and severe decline of asset value in the liquidity buffer. At year-end 2017, the survival horizon was 417 days (2016: 443 days).
Development of the survival horizon
in days
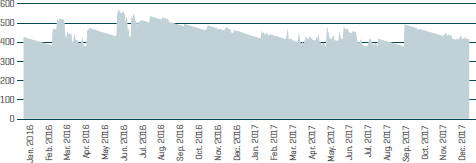
37
In addition, the Bank requires that the liquidity position should be strong enough to secure the highest possible issuer credit rating by S&P and Moody’s and fulfil the liquidity coverage ratio (LCR) and net stable funding ratio (NSFR) requirements as specified in the Capital Requirements Regulation of the European Union. At year-end 2017 the LCR was approximately 1400% (2016: 3500%) and the NFSR approximately 160% (2016: 160%). The minimum requirement for NSFR and LCR is 100% for regulated banks.
The Bank’s liquidity buffer comprises unencumbered cash, deposits and securities mainly denominated in EUR, USD and the Nordic currencies. In order to ensure that the market value and liquidity of the buffer is preserved during adverse market conditions, the Bank has set strict rules for the composition of the buffer. As such, the buffer must include a minimum level of High Quality Liquid Assets as defined in the EU capital requirement regulation and a minimum level of assets in the internal rating categories corresponding to at least AA- from S&P and Aa3 from Moody’s. Furthermore, the buffer must comprise a certain level of assets eligible as repo collateral in central banks. The Bank does not have direct access to central bank repo facilities but can repo its bond securities via intermediating banks.
The maturity profile of the liquidity buffer is structured to fulfil the Bank’s requirement that the expected net cash outflow during the next three months must be covered by maturing investments in the liquidity buffer.
TABLE 8. Composition of the liquidity buffer
| | | | | | | | |
| | |
| | | 31 December 2017 | | 31 December 2016 |
| | | | |
| | | EUR MILLION | | % | | EUR MILLION | | % |
Cash and cash equivalents | | 1,069 | | 10% | | 356 | | 3% |
Securities issued or guaranteed by sovereigns, public sector entities and supranational institutions | | 2,749 | | 26% | | 3,273 | | 29% |
Covered bonds | | 2,770 | | 26% | | 2,570 | | 23% |
Securities issued by financial institutions, excluding covered bonds | | 1,476 | | 14% | | 1,544 | | 14% |
Securities received as collateral | | 2,391 | | 23% | | 3,354 | | 30% |
Total liquidity buffer | | 10,454 | | 100% | | 11,097 | | 100% |
Diversification is a key objective of the Bank’s funding and liquidity management. The Bank strives to diversify its borrowing in terms of currencies, maturities, instruments and investor types in order to avoid excessive reliance on individual markets and funding sources. Through regular benchmark issues, the Bank aims to secure broad market access. The annual funding plan is based on the projected twelve-month liquidity requirement and the projected size of the liquidity buffer. The funding plan is regularly adjusted to reflect changes in the liquidity requirement.
The following graph shows the maturity profile of liquid assets and the annual scheduled payments on loans outstanding compared to payments on the Bank’s funding. Payments on loans outstanding are shown until the contractual maturity of the loans. Repayment of funding is shown until the first possible early repayment date and taking into account the cash flow from associated swaps. Short-term amounts owed to credit institutions predominantly comprise cash collateral received from swap counterparties.
Maturity profile of funding, lending and liquid assets
as of 31 December 2017
EUR m
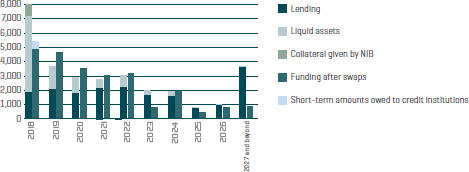
A breakdown of the Bank’s financial assets and liabilities by maturity at year-end 2017 is presented in Note 20.
The Bank has a contingency plan in place which defines the actions to be taken should the Bank encounter a liquidity shortfall in an emergency situation. The President decides on the activation of the contingency plan and subsequently informs the Board of Directors.
38
Operational risk
The Bank defines operational risk as the risk of direct or indirect losses or damaged reputation due to failure attributable to technology, employees, processes, procedures or physical arrangements, including external events and legal risks.
Operational risk management
NIB’s operational risk management focuses on proactive measures in order to ensure business continuity, the accuracy of information used internally and reported externally, the expertise and integrity of the Bank’s personnel and its adherence to established rules and procedures, as well as on security arrangements to protect the physical and IT infrastructure of the Bank. The Bank’s operational risk management policy is set by the Board of Directors. The policy is complemented by an operational risk management framework comprising the guiding principles for the identification, assessment, monitoring and control of the operational risks that the Bank faces or may face.
The day-to-day management of operational risk is performed across the organisation and is primarily the responsibility of each function. Emphasis is put on training the Bank’s personnel in risk awareness. In the risk and control self-assessment (RCSA) process, risks are identified and their impact assessed by the various functions for their respective fields of expertise. Focus is placed on identifying key risks and assessing the quality of risk detection and risk mitigation in order to ensure compliance with the Bank’s policies and guidelines. Operational risks are also identified through analysis of results obtained from the Bank’s incident reporting system. No material losses were incurred as a result of operational risks during the year.
Priority areas for operational risk management include increased focus on risks in the Bank’s key processes and further development of reporting on material operational risks and trends. The FOBORA (Front-Office/Back-Office/ Risk Management/Accounting) project spanning over a period from 2017 to 2019 will transform many of the Bank’s processes and IT infrastructure and, thus, is a focus area for operational risk assessment and process planning.
Compliance risk
Compliance risk is the risk of legal or regulatory sanctions, material financial loss, or loss to reputation due to failure to comply with laws, rules and standards.
The Bank is committed to follow best practices and market standards in the areas of accountability, governance, corporate social responsibility, transparency and business ethics in order to promote sustainability. In managing compliance risk, the Bank places particular emphasis on preventing corruption, money laundering and the financing of terrorism. The Bank’s procedures are aligned with the International Financial Institutions (IFI) Uniform Framework for Preventing and Combating Fraud and Corruption, which the Bank has endorsed.
For NIB, integrity means adherence to the Bank’s ethical values. The Bank focuses on preventive measures as the most effective way to avoid becoming involved with unethical borrowers and projects, money laundering, terrorist financing or tax evasion. Particular emphasis is put on knowing the customers and training the staff to ensure awareness and vigilance. All new clients are screened thoroughly in the Bank’s integrity due diligence processes. Monitoring of integrity risks in the loan portfolio is part of the Bank’s regular follow-up procedures.
The Office of the Chief Compliance Officer (OCCO) oversees and coordinates matters relating to integrity and reputational risks and provides independent expert advice to management and the Board of Directors in compliance matters. Allegations of fraud and corruption in relation to the Bank’s projects or counterparties are investigated by the OCCO and sanctioning is decided upon by the Sanctions Panel.
The Chief Compliance Officer reports to the President and has unrestricted access to the chairpersons of the Board of Directors and the Control Committee. He reports to the Board of Directors on serious fraud and corruption investigations and once a year on other integrity and compliance matters. Reports on anti-corruption and compliance matters are presented to the Control Committee at its regular meetings.
Once a year, the Office of the Chief Compliance Officer publishes its Integrity Report on the Bank’s website.
39
Note 3: Segment information
Operating segments
Operating segments are reported in a manner consistent with the internal reporting provided to the chief operating decision maker (“CODM”), who is responsible for allocating resources and assessing the performance of the operating segments. The CODM at NIB is the President. Segment results that are reported to the management include items directly attributable to that segment as well as other items allocated on a reasonable basis. In its segment reporting, NIB divides its operations into two major segments: lending and treasury operations. Treasury operations consist of liquidity management, collateral management, portfolio management and funding operations.
Lending operations are described in detail in Note 11 and Funding operations in Note 15.
Treasury Operations
Liquidity Management
NIB’s liquidity policy, which was revised in 2014, is based on stress testing and incorporates recommendations from Basel III (a set of comprehensive changes to the then-existing capital adequacy framework, published by the Basel Committee on Banking Supervision in December 2010), EU directives and the rating methodologies used by rating agencies. The policy includes a survival horizon that measures the period the Bank is able to meet all its payment obligations arising from ongoing business operations during a severe stress scenario. The target is to maintain a survival horizon of at least twelve months. At the end of 2017, NIB calculated its survival horizon as 417 days.
To mitigate its liquidity risk, the Bank maintains a liquidity buffer. The liquidity buffer is mainly invested in EUR, but also in USD and the Nordic currencies. At the end of 2017, the liquidity buffer, which also included cash and securities received from swap counterparties to mitigate counterparty risk, amounted to EUR 10,454 million. Of this, EUR 3,739.7 million is held as cash and short-term money market instruments (36%), and EUR 6,714.4 million is held in securities with longer maturities (64%). To ensure that the buffer maintains its market value and liquidity under severe market conditions, it must fulfil the quality requirements stipulated in the liquidity policy. At the end of 2017, 83% of the liquidity buffer was invested in high quality liquidity assets (HQLA), 85% was eligible as collateral for securities repurchase transactions or repos at one or several central banks, and 95% of the assets belonged to the Bank’s top four internal rating categories. In addition, the Bank fulfils the liquidity coverage ratio (LCR) and net stable funding ratio (NSFR) requirements as specified in the Capital Requirements Regulation of the European Union. Under the objective of achieving additional earnings, part of the liquidity is invested in longer-term government securities, covered bonds and senior bonds issued by financial institutions with a credit rating of ‘A’ or above. For further information in this regard, see Note 2.
Collateral Management
The Bank receives collateral from its counterparties in order to mitigate counterparty risk arising from derivative transactions. In 2016, the Bank started a process to move from unilateral to bilateral credit support agreements with its derivative counterparties. This change requires a higher liquidity buffer as the Bank needs to post collateral, mainly EUR cash holdings, with its swap counterparties. For further information in this regard, see Note 2. The amount of cash collateral held at year-end 2017 was EUR 547.2 million. For further information regarding received collateral at year-end, please refer to Note 18.
Portfolio Management
The Bank’s portfolio management deals with the management of that portion of NIB’s liquidity that is invested in longer term securities. Two portfolios have been established: (1) a portfolio with security investments measured at amortized cost and (2) actively managed portfolios measured at fair value. The amortized cost portfolio comprises of fixed rate debt securities issued by highly rated issuers. The return on this portfolio is an important contributor to NIB’s total results.
The actively managed portfolios contribute to NIB’s results through active yield curve and duration management strategies using fixed income derivatives as well as security investments. The strategies are carried out by both internal and external managers. The Bank currently has agreements in place with two external managers who operate with unfunded mandates. As of the end of 2017, the external managers were authorized to take positions of up to an aggregate of USD 200 million, corresponding to EUR 166.8 million. The risk and size of the actively managed portfolios are restricted by overall market risk limits; see Note 2 to the Financial Statements.
For information regarding accounting treatment and volumes of NIB’s financial placements as of December 31, 2017, please refer to Note 10 to the Financial Statements. The volume of outstanding derivatives as of December 31, 2017 are set forth in Note 14.
40
2017
| | | | | | | | | | |
In thousands of euro | | LENDING | | ASSET AND LIABILITY MANAGEMENT | | PORTFOLIO MANAGEMENT | | TREASURY TOTAL | | TOTAL |
Net interest income | | 153,208 | | 31,792 | | 53,323 | | 85,116 | | 238,323 |
Commission income and fees received | | 6,956 | | 1,580 | | | | 1,580 | | 8,536 |
Commission expense and fees paid | | -111 | | -1,636 | | -827 | | -2,463 | | -2,574 |
Net profit on financial operations | | 4,195 | | 4,500 | | 8,868 | | 13,368 | | 17,563 |
Foreign exchange gains and losses | | | | -616 | | | | -616 | | -616 |
Administrative expenses | | -28,653 | | -10,182 | | -4,364 | | -14,545 | | -43,198 |
Depreciation | | -1,023 | | -457 | | -196 | | -653 | | -1,675 |
Net loan losses | | -5,378 | | – | | – | | – | | -5,378 |
Profit/loss for the year | | 129,194 | | 24,981 | | 56,804 | | 81,787 | | 210,981 |
2016
| | | | | | | | | | |
In thousands of euro | | LENDING | | ASSET AND LIABILITY MANAGEMENT | | PORTFOLIO MANAGEMENT | | TREASURY TOTAL | | TOTAL |
Net interest income | | 150,404 | | 28,224 | | 63,181 | | 91,405 | | 241,809 |
Commission income and fees received | | 10,531 | | 2,478 | | 115 | | 2,593 | | 13,124 |
Commission expense and fees paid | | -165 | | -1,273 | | -587 | | -1,859 | | -2,025 |
Net profit on financial operations | | 825 | | 14,416 | | 8,051 | | 22,467 | | 23,292 |
Foreign exchange gains and losses | | – | | 22 | | – | | 22 | | 22 |
Administrative expenses | | -27,661 | | -10,215 | | -4,378 | | -14,592 | | -42,254 |
Depreciation | | -1,440 | | -615 | | -264 | | -879 | | -2,319 |
Net loan losses | | -19,839 | | – | | – | | – | | -19,839 |
Profit/loss for the year | | 112,654 | | 33,037 | | 66,119 | | 99,156 | | 211,810 |
41
Geographical segments
The table below is based on the region where the borrowers reside, according to the domicile of the borrower’s group headquarters.
| | | | | | | | |
| | |
In thousands of euro | | 2017 NET INTEREST INCOME | | | 2016 NET INTEREST INCOME | |
Member countries | | | | | | | | |
Denmark | | | 14,571 | | | | 16,062 | |
Estonia | | | 1,845 | | | | 1,927 | |
Finland | | | 29,016 | | | | 28,101 | |
Iceland | | | 7,139 | | | | 6,129 | |
Latvia | | | 1,868 | | | | 2,227 | |
Lithuania | | | 5,859 | | | | 5,659 | |
Norway | | | 25,882 | | | | 23,672 | |
Sweden | | | 46,689 | | | | 39,085 | |
Total, member countries | | | 132,870 | | | | 122,863 | |
| | |
Non-member countries | | | | | | | | |
Africa | | | 622 | | | | 1,276 | |
Asia | | | 7,192 | | | | 9,225 | |
Europe and Eurasia | | | 7,657 | | | | 10,812 | |
Latin America | | | 4,517 | | | | 5,782 | |
Middle East | | | 350 | | | | 447 | |
Total, non-member countries | | | 20,338 | | | | 27,541 | |
Total, net interest income from lending | | | 153,208 | | | | 150,404 | |
42
Note 4: Net interest income
| | | | | | | | |
| | |
In thousands of euro | | 2017 | | | 2016 | |
Interest income | | | | | | | | |
Cash and cash equivalents | | | -14,125 | | | | -1,643 | |
Placements with credit institutions more than 6 mths | | | -57 | | | | -147 | |
Debt securities | | | 63,490 | | | | 70,117 | |
Loans outstanding | | | 250,412 | | | | 242,510 | |
Other interest income | | | 395 | | | | 1,019 | |
Total, interest income | | | 300,116 | | | | 311,856 | |
Of which, interest income from financial assets that is not measured at fair value through the income statement | | | 284,278 | | | | 285,449 | |
Interest expense | | | | | | | | |
Short-term amounts owed to credit institutions | | | -2,183 | | | | 1,345 | |
Long-term amounts owed to credit institutions | | | -84 | | | | -60 | |
Short-term repurchase agreements | | | -29 | | | | -436 | |
Debts evidenced by certificates | | | 536,487 | | | | 487,060 | |
Swap contracts and other interest expenses, net | | | -472,398 | | | | -417,861 | |
Total, interest expense | | | 61,793 | | | | 70,047 | |
Of which, interest expense from financial liabilities that is not measured at fair value through the income statement | | | 192,635 | | | | 166,192 | |
Net interest income | | | 238,323 | | | | 241,809 | |
Interest income and expense includes amounts from related parties as described in Note 23.
43
Note 5: Commission income and fees received
| | | | | | | | |
| | |
In thousands of euro | | 2017 | | | 2016 | |
Commitment fees | | | 2,234 | | | | 2,584 | |
Loan disbursement fees | | | 4,512 | | | | 7,151 | |
Guarantee commissions | | | – | | | | – | |
Early repayment fees | | | 1,521 | | | | 3,095 | |
Commissions on lending of securities | | | 269 | | | | 293 | |
Total, commission income and fees received | | | 8,536 | | | | 13,124 | |
44
Note 6: Net profit on financial operations
| | | | | | | | |
| | |
In thousands of euro | | 2017 | | | 2016 | |
Financial instruments held at fair value, realised gains and losses | | | 4,591 | | | | 16,096 | |
Financial instruments held at fair value, unrealised gains and losses | | | 16,191 | | | | -280 | |
Financial instruments held at amortised cost, realised gains and losses | | | 184 | | | | 1,062 | |
Adjustment to hedge accounting, unrealised gains and losses of fair value hedges | | | -5,927 | | | | 4,271 | |
Repurchase of NIB bonds, other items | | | 2,525 | | | | 2,142 | |
Net profit on financial operations | | | 17,563 | | | | 23,292 | |
This year’s result includes one off gains for EUR 2.3 million (2016: EUR 16.0 million) related to cost compensation from counterparties for the implementation of two way credit support annexes.
45
Note 7: Personnel expenses
Net personnel expenses
| | | | | | | | |
| | |
In thousands of euro | | 2017 | | | 2016 | |
Salaries and other remuneration | | | 27,225 | | | | 24,299 | |
Social security and employee insurances | | | 2,535 | | | | 2,793 | |
Pensions | | | 7,606 | | | | 7,412 | |
Other personnel expenses | | | 2,821 | | | | 3,197 | |
Gross personnel expenses | | | 40,187 | | | | 37,700 | |
Host country reimbursement according to agreement with the Finnish Government (see page 47) | | | -9,414 | | | | -9,064 | |
Net personnel expenses | | | 30,774 | | | | 28,637 | |
The salaries and other remuneration expense include costs for the Board of Directors and the Control Committee described below in more detail.
During 2017, a provision of EUR 2 million was reserved for the purpose of planning, training and adapting to the changing banking industry requirements.
Number of employees in permanent positions
| | | | | | | | |
| | |
| | | 2017 | | | 2016 | |
Average number of employees | | | 193 | | | | 192 | |
Average age of employees | | | 48 | | | | 47 | |
Average period (years) of employment | | | 12 | | | | 12 | |
Distribution by gender as of 31 Dec | | | | | | | | |
All employees | | | 193 | | | | 195 | |
Female | | | 80 | | | | 85 | |
Male | | | 113 | | | | 110 | |
Executive Committee (including the President) | | | | | | | | |
Female | | | 1 | | | | 1 | |
Male | | | 6 | | | | 6 | |
Professional staff | | | | | | | | |
Female | | | 68 | | | | 67 | |
Male | | | 102 | | | | 99 | |
Clerical staff | | | | | | | | |
Female | | | 11 | | | | 17 | |
Male | | | 5 | | | | 5 | |
The figures in the table above comprise of staff in permanent positions including the President.
Compensation for the Board of Directors, the Control Committee, the President and the Executive Committee
Compensation for the Board of Directors (BoD) and the Control Committee (CC) is set by the Board of Governors (BoG). The compensation consists of fixed annual remuneration and an attendee allowance. The members of the BoD and the CC are also entitled to reimbursement of travel and accommodation expenses and a daily allowance in accordance with the Bank’s travel policy.
The BoD decides on the appointment and remuneration of the President. As a rule, the President is appointed on a fixed-term contract for five years at a time, but the existing contract can also be prolonged for a shorter period. The current President’s contract commenced on 1 April 2012 and was due to expire on 31 March 2017; however the contract has been extended until 31 March 2020. The President decides upon the employment of the Executive Committee (ExCo) members. The members of the ExCo are normally employed for an indefinite period of time. The period of notice is six months. The President is authorised by the BoD to make decisions regarding compensation within the scope of the Staff Policy, Staff Regulations and the Financial Plan. The remuneration package for the members of the ExCo includes a fixed base salary and customary taxable benefits, which are in principle the same for all staff at the managerial level. In addition to this remuneration package, the members of the ExCo enjoy other benefits common to all staff (e.g. health care, supplementary group pension, insurance coverage and staff loans). The Bank can pay performance premiums of up to three months’ salary for excellent and extraordinary performance and are presented in the table below if awarded. The maximum cost for the Bank of performance premiums is a total of 3% of the salary costs.
The table below includes fees paid to the Board of Directors and Control Committee as well as the taxable income of the President and Executive Committee.
| | | | | | | | |
| | |
In thousands of euro | | 2017 | | | 2016 | |
Board of Directors (remuneration and attendee allowance) | | | | | | | | |
Chairman | | | 15 | | | | 15 | |
Other Directors and Alternates (15 persons) | | | 86 | | | | 86 | |
Control Committee | | | | | | | | |
Chairman | | | 5 | | | | 5 | |
Other members (9 persons) | | | 17 | | | | 17 | |
President | | | 782 | | | | 751 | |
Members of the Executive Committee (6 persons) | | | 2,636 | | | | 2,447 | |
46
Pension obligations
NIB is responsible for arranging pension security for its employees. The current pension arrangement consists of pensions based on the Finnish public sector pension system (JuEL Pension) as the basis for the pension benefits. The JuEL Pension is calculated on the basis of the employee’s annual pensionable income and the applicable age-linked pension accrual rate. The employer’s pension contribution in 2017 was 15.16% of the pensionable income. The employee’s pension contribution was either 6.15% or 7.65%, depending on the employee’s age. NIB pays this contribution for its permanent staff, and it is taxed as a benefit for the employee. This pension is accounted for as a defined contribution plan.
In addition to the JuEL Pension, the Bank has taken out a supplementary group pension insurance policy for all its permanently employed staff, including the President. This pension insurance is based on the principle of a defined contribution. The insurance premium, 6.5%, is calculated on the basis of the employee’s taxable income and paid until the age of 63. The supplementary pension is also accounted for as a defined contribution plan.
The employer’s pension contribution regarding the President amounted to EUR 223,146 (216,057) of which EUR 44,825 (42,964) comprised supplementary pension premiums. The corresponding figures for the ExCo members were EUR 846,811 (811,950) and EUR 277,058 (266,495) respectively.
Staff loans
Staff loans can be granted to permanently employed staff members who have been employed by the Bank for a period of at least one year. The staff loans are granted by a commercial bank, subject to a recommendation from NIB.
At present, the maximum loan amount is EUR 200,000. The employee pays interest on the loan in accordance with the official base rate established by the Ministry of Finance in Finland or 0.25% whichever is the higher. The same interest rates, terms and conditions are applicable to all the employees of the Bank, including the President and the ExCo members.
As of 31 December 2017, there were no (-) outstanding staff loans to the President or the ExCo members.
Additional benefits for expatriate personnel
Professional staff (including Executive Committee members) who move to Finland for the sole purpose of taking up employment at the Bank are entitled to certain expatriate benefits, such as an expatriate allowance and a spouse/ family allowance. In addition, NIB assists the expatriate in finding accommodation, usually by renting a house or a flat in its own name. The staff member reimburses the Bank for a part of the rent, which is equal to at least the taxable value of the accommodation benefit established annually by the Finnish National Board of Taxes.
Host country reimbursement
According to the Host Country Agreement between the government of the Republic of Finland and the Bank the amount of tax withheld in advance on the salaries of the Bank’s staff and the final tax on salaries collected shall be repaid to the Bank. Amounts repaid contribute to the surplus the Bank may distribute among the member countries.
47
Note 8: Other administrative expenses
| | | | | | | | |
| | |
In thousands of euro | | 2017 | | | 2016 | |
IT | | | 7,473 | | | | 8,256 | |
Office premises | | | 2,460 | | | | 1,823 | |
Travel | | | 1,138 | | | | 1,221 | |
Communications and marketing | | | 455 | | | | 386 | |
Other administrative expenses | | | 2,439 | | | | 3,228 | |
Cost coverage, NDF and NEFCO (Note 23) | | | -1,043 | | | | -905 | |
Rental and other income | | | -498 | | | | -393 | |
Total | | | 12,424 | | | | 13,617 | |
| | |
| | | | | | | | | |
| Remuneration to the auditors | | 2017 | | | 2016 | |
Audit fee | | | 97 | | | | 97 | |
Other audit-related service fees | | | 121 | | | | 87 | |
Total remuneration | | | 218 | | | | 184 | |
48
Note 9: Net loan losses
| | | | | | | | |
| | |
In thousands of euro | | 2017 | | | 2016 | |
Increase in provisions | | | 13,686 | | | | 47,343 | |
Reversals of previous provisions | | | -8,307 | | | | -25,580 | |
Net impairment losses | | | 5,378 | | | | 21,763 | |
Recoveries on claims | | | – | | | | -1,924 | |
Net loan losses | | | 5,378 | | | | 19,839 | |
See also Note 11 ‘Loans outstanding and guarantee commitments’.
49
Note 10: Debt securities
The debt securities were issued by the following counterparties:
| | | | |
| | |
In millions of euro | | 2017 | | 2016 |
Governments | | 965 | | 1,103 |
Public institutions | | 1,699 | | 1,778 |
Other | | 3,932 | | 3,692 |
Total, debt securities | | 6,595 | | 6,572 |
The distribution of the Bank’s debt security portfolios was as follows:
| | | | | | | | |
| | | BOOK VALUE | | FAIR VALUE |
| | | | |
In millions of euro | | 2017 | | 2016 | | 2017 | | 2016 |
Held at fair value | | 4,182 | | 4,157 | | 4,182 | | 4,157 |
Held at amortised cost | | 2,413 | | 2,416 | | 2,493 | | 2,534 |
Total, debt securities | | 6,595 | | 6,572 | | 6,675 | | 6,690 |
Of these debt securities, EUR 4,665 (4,413) million is at fixed interest rates and EUR 1,929 (2,159 ) million at floating interest rates. The fair values are disclosed in Note 19.
50
Note 11: Loans outstanding and guarantee commitments
At 31 December 2017, 642 loans amounting to EUR 17,232 (16,640) million were outstanding, including medium-term notes (MTN) of EUR 71 (295) million. These are held at amortised cost unless they form part of a qualifying hedging relationship with a derivative in a hedge accounting relationship, the MTNs are recognised at fair value.
At 31 December 2017, loans outstanding before impairments and hedge accounting adjustments with floating interest rates amounted to EUR 13,596 (13,447) million, while those with fixed interest rates amounted to EUR 3,596 (3,054) million. As a general rule fixed interest loans are converted to floating rates through the use of derivatives instruments.
| | | | |
| | |
In millions of euro | | 2017 | | 2016 |
Ordinary loans | | 16,249 | | 15,160 |
Project investment loans | | 922 | | 1,311 |
Environmental investment loans | | 21 | | 30 |
Total loans outstanding before impairment and hedge accounting | | 17,193 | | 16,501 |
Individually assessed impairments | | -93 | | -97 |
Collectively assessed impairments | | -46 | | -42 |
Loan impairments | | -139 | | -139 |
Hedge accounting adjustments | | 178 | | 278 |
Total loans outstanding | | 17,232 | | 16,640 |
The Bank has currently two main categories of lending: ordinary lending and lending under special programs described below in detail.
2017
| | | | | | | | |
In millions of euro | | ORDINARY LOANS | | PROJECT INVESTMENT LOANS | | ENVIRONMENTAL INVESTMENT LOANS | | TOTAL |
Opening balance | | 15,160 | | 1,311 | | 30 | | 16,501 |
Disbursements | | 3,144 | | 2 | | 1 | | 3,147 |
Amortisation, write-offs, redemption, other | | -1,527 | | -293 | | -10 | | -1,829 |
Translation differences | | -528 | | -98 | | -1 | | -626 |
Closing balance | | 16,249 | | 922 | | 21 | | 17,193 |
Loan impairments | | | | | | | | -139 |
Hedge accounting adjustments | | | | | | | | 178 |
Net balance | | | | | | | | 17,232 |
2016
| | | | | | | | |
In millions of euro | | ORDINARY LOANS | | PROJECT INVESTMENT LOANS | | ENVIRONMENTAL INVESTMENT LOANS | | TOTAL |
Opening balance | | 13,707 | | 1,731 | | 43 | | 15,481 |
Disbursements | | 3,367 | | 4 | | 3 | | 3,373 |
Amortisation, write-offs, redemption, other | | -1,990 | | -458 | | -16 | | -2,465 |
Translation differences | | 77 | | 34 | | 1 | | 112 |
Closing balance | | 15,160 | | 1,311 | | 30 | | 16,501 |
Loan impairments | | | | | | | | -139 |
Hedge accounting adjustments | | | | | | | | 278 |
Net balance | | | | | | | | 16,640 |
51
Ordinary Lending
NIB’s ceiling for ordinary lending amounts to 250% of its authorized capital stock and accumulated, unallocated reserves (the Statutory Reserve and the General Credit Risk Fund). After allocation of the profit in accordance with the Board of Directors’ proposal for fiscal year 2017, the Bank’s ordinary lending ceiling will amount to EUR 21,697 (21,244) million. At 31 December 2017, outstanding ordinary lending amounted to the equivalent of EUR 16,423 (15,431) million, which represented 189.2% (181.6%) of the Bank’s authorized capital stock and accumulated reserves. There were no guarantee commitments under ordinary lending as of 31 December 2017.
The Bank’s ordinary loans have traditionally been grouped into two categories: investment loans and regional loans. However, the significance of regional loans has been diminishing and the importance of investments in green bonds increasing. At 31 December 2017, investment loan, regional loan commitments and investment in green bonds totalled EUR 18,736 (17,251) million, of which EUR 16,410 (15,415) million was outstanding.
As a rule investment loans are granted for projects situated in the Member countries or for projects situated outside the Member countries if either the security or the party providing security for the project or the borrower is located in one of the Member countries. In addition the lending to Poland and certain other EU member countries is currently also made as investment loans. At 31 December 2017, NIB had investment loan commitments totalling EUR 18,735 (17,249) million, of which EUR 16,410 (15,414) million was outstanding. The majority of the outstanding amount, EUR 15,713 (14,734) million was granted for projects situated in the Member countries.
Green bond investments
In 2016, NIB allocated EUR 500 million to be invested in green bonds issued by companies or municipalities in its member countries. The purpose of this initiative is to support the development of the green bond market, to finance environmental investments in conformity with NIB’s mandate criteria and to promote good standards in this field. At the end of 2017, the Bank held EUR 283 (143) million in green bonds.
The table below sets forth the total principal amount and percentage distribution of investment loans, regional loans and green bond investments outstanding as well as issued guarantees at 31 December, allocated by country according to the domicile of the borrower’s group headquarters.
| | | | | | | | | | | | | | | | |
| | | | |
In millions of euro | | 2017 | | | % | | | 2016 | | | % | |
Czech Republic | | | 2 | | | | 0.0% | | | | 4 | | | | 0.0% | |
Denmark | | | 1,364 | | | | 8.4% | | | | 1,324 | | | | 8.7% | |
Estonia | | | 189 | | | | 1.2% | | | | 191 | | | | 1.3% | |
Finland | | | 3,404 | | | | 20.9% | | | | 3,337 | | | | 22.0% | |
France | | | 126 | | | | 0.8% | | | | 75 | | | | 0.5% | |
Germany | | | 28 | | | | 0.2% | | | | 20 | | | | 0.1% | |
Iceland | | | 581 | | | | 3.6% | | | | 570 | | | | 3.8% | |
Latvia | | | 200 | | | | 1.2% | | | | 232 | | | | 1.5% | |
Lithuania | | | 537 | | | | 3.3% | | | | 493 | | | | 3.3% | |
Norway | | | 3,869 | | | | 23.8% | | | | 3,796 | | | | 25.0% | |
Poland | | | 482 | | | | 3.0% | | | | 510 | | | | 3.4% | |
Slovak Republic | | | 1 | | | | 0.0% | | | | 2 | | | | 0.0% | |
Sweden | | | 5,467 | | | | 33.6% | | | | 4,606 | | | | 30.4% | |
Total Loans | | | 16,249 | | | | 100.0% | | | | 15,160 | | | | 100.0% | |
Guarantees | | | – | | | | | | | | – | | | | | |
Hedge accounting adjustments | | | 161 | | | | | | | | 255 | | | | | |
Total Loans and Guarantees | | | 16,410 | | | | | | | | 15,415 | | | | | |
52
Following a review of the Bank��s lending strategy completed in 2015, the Bank decided to establish the following facilities within ordinary lending: an Arctic Financing Facility with a framework of up to EUR 500 million in loans for projects in the Arctic region, a EUR 250 million facility for financing to small- and medium sized enterprises (SME) including small mid cap corporates (SMC), and a facility of EUR 500 million for lending to mid-cap corporates (MCC) in the market segment between SME/SMC and the larger corporates that have traditionally been NIB’s customers.
At the end of 2017, EUR 238 (201) million had been allocated under the Arctic Financing Facility, and EUR 63 (50) million had been allocated under the facility for lending to MCC corporates, while no allocations had been made under the facility for SME and SMC enterprises.
Loans under Special Lending Programs
In addition to its ordinary lending, the Bank has currently two special lending programs, which are authorized by its Statutes.
NIB may make project investment loans and give related guarantees under the project investment loans (“PIL”) facility. The authorization for the PIL facility is EUR 4 billion.
Under the Environmental Investment Loan Facility (“MIL”), the Bank may make investment loans and guarantees up to a maximum amount of EUR 300 million to finance projects to improve the environment and reduce pollution in the regions neighbouring the Member countries.
Project Investment Loans (PIL)
PIL loans and guarantees are intended to finance projects in Asia, Latin America, Central and Eastern Europe, Africa and the Middle East, where such projects are in the interest of Member and recipient countries. The strategy is to maintain the level of lending to non-Member countries at an average of historical levels of one-fifth of total lending in the long term. These loans are intended to help meet the demand for long-term financing of projects and are made in accordance with regular banking practices. Such loans can be made to governments or against government guarantees but also for infrastructure projects and other public or private sector projects without a guarantee from the government. Projects may be co-financed with other multilateral and bilateral institutions as well as with commercial banks. The structure of the PIL facility is primarily governed by the Bank’s Statutes and related bilateral PIL guarantee agreements between the Bank and each of the Member countries. The authorization for the PIL facility is set forth in the Statutes, which currently limits the PIL facility to EUR 4 billion. The PIL facility carries a partial guarantee from the Member countries. Each PIL loan is guaranteed on an individual basis by the Member countries for a maximum of 90% of its principal amount plus interest up to an aggregate amount of EUR 1.8 billion, or 45% of the total program. The Board of Directors has the authority to designate which loans and guarantees should be included in this program at any given time. The Board of Directors also determines whether to call on the Member country guarantees. Since the inception of the program in 1982, no such calls have been made. The guarantee agreements have been amended over the years as the authorization for the program has been increased several times. The last increase in the PIL facility from EUR 3.3 billion to EUR 4.0 billion, with no change in the EUR 1.8 billion guarantee limit, became effective on July 1, 2004. In connection with this increase, and with the same effective date, NIB decided to adjust the guidelines for calling the Member countries’ guarantees and the Bank entered into new bilateral guarantee agreements with each of the Member countries. Under the adjusted guidelines, the related Special Credit Risk Fund for PIL is intended as a first loss reserve and NIB will assume 100% of any losses incurred under an individual PIL loan, up to the amount available at any given time in the Special Credit Risk Fund PIL. Only thereafter would NIB call on the Member countries’ guarantees.
53
According to NIB’s Statutes, the member countries shall cover the Bank’s losses arising from failure of payment in connection with PIL loans up to the following amounts:
| | | | | | | | |
| | | | |
| | | 2017 | | | | 2016 | | |
In thousands of euro | | AMOUNT OF GUARANTEE | | SHARE IN % | | AMOUNT OF GUARANTEE | | SHARE IN % |
Member country | | | | | | | | |
Denmark | | 379,208 | | 21.1% | | 377,821 | | 21.0% |
Estonia | | 16,486 | | 0.9% | | 13,139 | | 0.7% |
Finland | | 318,902 | | 17.7% | | 344,860 | | 19.2% |
Iceland | | 17,020 | | 0.9% | | 15,586 | | 0.9% |
Latvia | | 24,053 | | 1.3% | | 19,058 | | 1.1% |
Lithuania | | 35,108 | | 2.0% | | 29,472 | | 1.6% |
Norway | | 387,087 | | 21.5% | | 329,309 | | 18.3% |
Sweden | | 622,135 | | 34.6% | | 670,755 | | 37.3% |
Total | | 1,800,000 | | 100.0% | | 1,800,000 | | 100.0% |
At 31 December 2017, NIB had commitments for 214 project investment loans totalling EUR 961 (1,370) million, of which 211 loans in the amount of EUR 846 (1,236) million was outstanding. As of 31 December 2017, no guarantees were issued under this facility. The table below sets forth the allocation of project investment loans (PIL) by outstanding principal amount as well as total commitments for each country at 31 December.
2017
| | | | |
| | |
In millions of euro | | LOANS OUTSTANDING | | TOTAL COMMITMENTS |
Sovereign PIL | | | | |
Botswana | | 21 | | 21 |
Brazil | | 34 | | 34 |
China | | 197 | | 217 |
Hungary | | 2 | | 2 |
Indonesia | | – | | – |
Jordan | | 2 | | 2 |
Mauritius | | 4 | | 4 |
Mexico | | – | | – |
Poland | | 13 | | 13 |
Romania | | 4 | | 4 |
Russia | | 15 | | 15 |
Slovak Republic | | 1 | | 1 |
Thailand | | – | | – |
Tunisia | | 38 | | 38 |
Turkey | | 23 | | 23 |
Venezuela | | 0 | | 0 |
Vietnam | | 56 | | 56 |
Total sovereign PIL | | 412 | | 432 |
| | | | | |
Non-sovereign PIL | | | | |
Brazil | | 140 | | 140 |
Bulgaria | | 8 | | 8 |
Chile | | 6 | | 6 |
Colombia | | – | | – |
India | | 169 | | 169 |
Laos | | 12 | | 12 |
Mexico | | 4 | | 4 |
Multinational | | 93 | | 188 |
Philippines | | 28 | | 28 |
Russia | | 44 | | 44 |
South Africa | | 4 | | 4 |
Total non-sovereign PIL | | 511 | | 606 |
| | | | | |
PIL, total | | 922 | | 1,037 |
Loan impairments | | -93 | | -93 |
Hedge accounting adjustments | | 17 | | 17 |
Total | | 846 | | 961 |
54
2016
| | | | | | | | |
In millions of euro | | LOANS OUTSTANDING | | | TOTAL COMMITMENTS | |
Sovereign PIL | | | | | | | | |
Botswana | | | 27 | | | | 27 | |
Brazil | | | 62 | | | | 62 | |
China | | | 264 | | | | 293 | |
Hungary | | | 5 | | | | 5 | |
Indonesia | | | 1 | | | | 1 | |
Jordan | | | 3 | | | | 3 | |
Mauritius | | | 5 | | | | 5 | |
Mexico | | | 7 | | | | 7 | |
Poland | | | 23 | | | | 23 | |
Romania | | | 10 | | | | 10 | |
Russia | | | 21 | | | | 21 | |
Slovak Republic | | | 2 | | | | 2 | |
Thailand | | | 3 | | | | 3 | |
Tunisia | | | 51 | | | | 51 | |
Turkey | | | 31 | | | | 31 | |
Venezuela | | | 1 | | | | 1 | |
Vietnam | | | 76 | | | | 76 | |
Total sovereign PIL | | | 591 | | | | 619 | |
| | | | | | | | | |
Non-sovereign PIL | | | | | | | | |
Brazil | | | 206 | | | | 206 | |
Bulgaria | | | 11 | | | | 11 | |
Chile | | | – | | | | – | |
Colombia | | | 7 | | | | 7 | |
India | | | 224 | | | | 224 | |
Laos | | | 16 | | | | 16 | |
Mexico | | | – | | | | – | |
Multinational | | | 129 | | | | 234 | |
Philippines | | | 36 | | | | 36 | |
Russia | | | 83 | | | | 83 | |
South Africa | | | 8 | | | | 8 | |
Non-sovereign PIL, total | | | 720 | | | | 825 | |
| | | | | | | | | |
PIL, total | | | 1,311 | | | | 1,445 | |
Loan impairments | | | -97 | | | | -97 | |
Hedge accounting adjustments | | | 23 | | | | 23 | |
Total | | | 1,236 | | | | 1,370 | |
Environmental Investment Loans (MIL)
Since 1 January 2005, the EUR 300 million MIL facility has been allocated for loans and guarantees for the financing of private and public projects in the neighbouring area of the Member countries to improve the environment and reduce cross border pollution in the region. The structure of the MIL facility is primarily governed by the Bank’s Statutes and the related bilateral MIL guarantee agreements between the Bank and each of the Member countries. According to NIB’s Statutes, the Member countries guarantees 100% of the Bank’s losses arising from failure of payment. It is within the powers of the Board of Directors to designate which loans and guarantees should be included under this facility at any given time. At 31 December 2017, NIB had commitments amounting to EUR 44 (55) million under this facility, of which EUR 21 (30) million was outstanding. As of 31 December 2017, no guarantee has been issued under this facility. At two occasions, in 2014 and 2016 the Board of Directors decided to call on the MIL guarantees due to non-payment of one MIL loan. Following the payments in relation to the calls, the guarantee liability stands at EUR 266 (266) million. The allocation of guarantee liability among the Member countries under the MIL facility has been adjusted and aligned as described above under Project Investment Loans (PIL).
The table below sets forth the allocation of Environmental Investments Loans (MIL) by outstanding principal amount as well as total commitments at 31 December.
2017
| | | | |
Environmental investment loans (MIL) | | EUR millions | | Total Commitments EUR millions |
Belarus | | 3 | | 25 |
Russia | | 18 | | 20 |
Ukraine | | – | | – |
Total | | 21 | | 44 |
2016
| | | | |
Environmental investment loans (MIL) | | EUR MILLIONS | | TOTAL COMMITMENTS EUR MILLIONS |
Belarus | | 2 | | 25 |
Russia | | 21 | | 23 |
Ukraine | | 7 | | 7 |
Total | | 30 | | 55 |
55
The following table sets forth the amount member countries guarantee losses arising from failure of payment in connection with MIL loans
| | | | | | | | |
| | |
| | | 2017 | | 2016 |
In thousands of euro | | AMOUNT OF GUARANTEE | | SHARE IN % | | AMOUNT OF GUARANTEE | | SHARE IN % |
Member country | | | | | | | | |
Denmark | | 56,079 | | 21.1% | | 62,211 | | 23.4% |
Estonia | | 2,438 | | 0.9% | | 1,943 | | 0.7% |
Finland | | 47,160 | | 17.7% | | 45,587 | | 17.1% |
Iceland | | 2,517 | | 0.9% | | 2,828 | | 1.1% |
Latvia | | 3,557 | | 1.3% | | 2,818 | | 1.1% |
Lithuania | | 5,192 | | 2.0% | | 4,358 | | 1.6% |
Norway | | 57,244 | | 21.5% | | 54,413 | | 20.4% |
Sweden | | 92,004 | | 34.6% | | 92,031 | | 34.6% |
Total | | 266,191 | | 100.0% | | 266,191 | | 100.0% |
The following table sets forth a breakdown per business sector of NIB’s outstanding loans and issued guarantees at 31 December.
| | | | | | | | |
| | |
| | | 2017 | | 2016 |
In millions of euro | | AMOUNT | | % | | AMOUNT | | % |
Energy and environment | | 5,094 | | 29.6% | | 5,256 | | 31.9% |
Infrastructure, transportation and telecom | | 4,722 | | 27.5% | | 4,355 | | 26.4% |
Industries and services | | 4,665 | | 27.1% | | 4,512 | | 27.3% |
Financial institutions and SMEs | | 2,428 | | 14.1% | | 2,236 | | 13.5% |
Lending green bonds | | 283 | | 1.6% | | 143 | | 0.9% |
Total before impairments and hedge accounting | | 17,193 | | 100.0% | | 16,501 | | 100.0% |
Individually assessed impairments | | -93 | | | | -97 | | |
Collectively assessed impairments | | -46 | | | | -42 | | |
Hedge accounting adjustments | | 178 | | | | 278 | | |
Total | | 17,232 | | | | 16,640 | | |
56
The following table sets forth the scheduled amortizations of outstanding loans at 31 December.
| | | | |
| | |
In millions of euro | | 2017 | | 2016 |
2017 | | – | | 1,537 |
2018 | | 1,615 | | 1,675 |
2019 | | 1,871 | | 2,047 |
2020 | | 1,573 | | 1,529 |
2021 | | 1,968 | | 1,887 |
2022 | | 2,094 | | 1,823 |
2023 and thereafter | | 8,072 | | 6,003 |
Total before impairments and hedge accounting | | 17,193 | | 16,501 |
Individually assessed impairments | | -93 | | -97 |
Collectively assessed impairments | | -46 | | -42 |
Hedge accounting adjustments | | 178 | �� | 278 |
Total | | 17,232 | | 16,640 |
The remaining average time to maturity/re-pricing of loans outstanding at December 31, 2017, calculated to the next date on which the Bank has the right to adjust the terms of the interest rate or currency of denomination, was 4 years and 5 months (4 years and 7 months), with actual maturities from the date of first disbursement ranging from 2 to 30 years (from 2 to 30 years).
Currency distribution of loans outstanding
| | | | | | | | | | | | |
| | | ORDINARY LOANS | | PROJECT INVESTMENT LOANS | | ALL LOANS 1 |
| | | | | | |
In millions of euro | | 2017 | | 2016 | | 2017 | | 2016 | | 2017 | | 2016 |
EUR | | 7,345 | | 7,261 | | 277 | | 366 | | 7,642 | | 7,647 |
USD | | 1,797 | | 1,619 | | 565 | | 837 | | 2,362 | | 2,463 |
Nordic currencies | | 6,870 | | 6,119 | | 43 | | 57 | | 6,913 | | 6,177 |
Other currencies | | 237 | | 161 | | 37 | | 51 | | 276 | | 215 |
Total before impairments and hedge accounting | | 16,249 | | 15,160 | | 922 | | 1,311 | | 17,193 | | 16,501 |
Individually assessed impairments | | – | | – | | -93 | | -97 | | -93 | | -97 |
Collectively assessed impairments | | – | | – | | – | | – | | -46 | | -42 |
Hedge accounting adjustments | | 161 | | 255 | | 17 | | 23 | | 178 | | 278 |
Total | | 16,410 | | 15,415 | | 846 | | 1,236 | | 17,232 | | 16,640 |
1 The total amount also includes EUR 21 (30) million in Environmental Investment Loans (MIL).
Distribution of loans outstanding and guarantees by various types of security
The following table shows loans outstanding, including guarantee commitments, distributed by type of security:
| | | | | | | | |
| | | | |
| | | 2017 | | | | 2016 | | |
| | | EUR MILLIONS | | SHARE IN % | | EUR MILLIONS | | SHARE IN % |
Loans to or guaranteed by governments | | | | | | | | |
Loans to or guaranteed by member countries | | 285 | | | | 278 | | |
Loans to or guaranteed by other countries | | 779 | | | | 968 | | |
Loans to or guaranteed by governments, total | | 1,063 | | 6.3% | | 1,246 | | 7.6% |
Loans to or guaranteed by local authorities in member countries | | 3,165 | | 18.5% | | 2,593 | | 15.8% |
Loans to or guaranteed by companies owned 50% or more by member countries or local authorities in member countries | | 3,474 | | 20.3% | | 3,616 | | 22.0% |
Loans to or guaranteed by banks | | 1,819 | | 10.6% | | 1,422 | | 8.7% |
Loans backed by a lien or other security in property | | 1,196 | | 7.0% | | 1,124 | | 6.9% |
Loans with a guarantee from the parent company and other guarantees | | 849 | | 5.0% | | 940 | | 5.7% |
Loans with a negative pledge clause and other covenants | | 5,165 | | 30.2% | | 5,224 | | 31.8% |
Loans without formal security | | 85 | | 0.5% | | 96 | | 0.6% |
Lending green bonds | | 283 | | 1.7% | | 143 | | 0.9% |
Total after individually assessed impairments | | 17,099 | | 100.0% | | 16,404 | | 100.0% |
Collectively assessed impairments | | -46 | | | | -42 | | |
Hedge accounting adjustments | | 178 | | | | 278 | | |
Total loans outstanding | | 17,232 | | | | 16,640 | | |
57
Credit policy
Mission and mandate
The mission of NIB, as currently defined, is to promote sustainable growth of its Member countries by providing long-term complementary financing, based on sound banking principles, to projects that strengthen competitiveness and/or enhance the environment. NIB fulfils this mandate by providing financing in the form of loans and guarantees for activities in which NIB can add value and complement other financing sources. Moreover, NIB assesses the environmental aspect of all its financing. Projects contributing to the fulfilment of the Bank’s mandate are typically found in the following sectors: environment, energy, transport, logistics and communications and innovation. Nonetheless projects with high mandate ratings, as assessed by the Bank, are also approved in other sectors. NIB remains flexible in terms of supporting different areas of the economy but places particular emphasis on projects involving: investments in infrastructure; investments improving the environment; large investments by the corporate sector; and small and medium-sized enterprises, targeted in cooperation with financial intermediaries. In 2015, NIB’s Board of Directors concluded a strategy process in which the mandate and mission described above were confirmed. In addition, NIB’s Board of Directors decided to place greater emphasis on the following areas: small and medium sized enterprise (SME) and mid-sized corporate financing, non-Member country lending (increasing it in the longer term to the previous level of approximately one-fifth of the Bank’s lending), Arctic financing and increased focus on lending to the Baltic countries (see also “Ordinary Lending” above). In 2016, NIB started investing in green bonds as part of its lending activities (see above).
Regarding NIB’s lending outside the Member countries, an agreement is generally required regarding the recipient country’s recognition of NIB as a legal person under public international law and as having legal capacity under the national law of the country in question as well as recognition of NIB’s status as an IFI. The Bank follows a policy similar to that of other international financial institutions concerning the debt service obligations of its borrowers. Therefore, the Bank has not participated in any debt rescheduling of sovereign debt.
Loans may be granted for both public and private projects. A loan will not be made, nor a guarantee provided, if opposed by the government of the country in which the related project is located. The Bank has a number of processes in place for assessing the eligibility of the projects. The Bank applies a mandate-rating tool as well as a sustainability policy to ensure that its financing fulfils the objectives and mission of the Bank. In addition, the Bank has an integrity due diligence procedure in relation to its granting of loans.
Risk assessment
The policies of the Bank requires its operations to be conducted in accordance with sound banking principles and that loans and guarantees are granted on market-based banking terms. Within the framework of NIB’s financial guidelines and risk management, the Bank’s lending operations are classified with respect to counterparty risk and the value of the security provided. A risk class is then determined for each loan. See “Note 2: Risk Management.”
In addition to the overall maximum lending exposures described in Section 7 of the Statutes, specific limits apply to the portfolio (non-Member country and sector limits) and to the counterparty level. The Board of Directors of NIB has decided that the maximum amount of loans granted by the Bank for a single project generally should not exceed 50% of the total cost of the project (for SME and mid-sized corporate financing this limit is set at 75%) and that the maximum amount granted to borrowers belonging to a single group of companies should not, as a rule, exceed 20% of the Bank’s total equity. This 20% limit is not applicable for loans to sovereign counterparties. The 20% limit is reduced in the case of less creditworthy borrowers.
The table below sets forth NIB’s 10 largest non-sovereign lending exposures (defined as total disbursements and loan commitments (a “loan commitment” comes into being upon execution of a loan agreement)), including issued guarantees, at 31 December 2017, calculated as a percentage of a) total lending exposure and b) total equity of the Bank.
| | | | |
| | |
RANK | | % of total
lending exposure | | % of total equity |
1 | | 2.3% | | 13.2% |
2 | | 2.0% | | 11.5% |
3 | | 1.8% | | 10.1% |
4 | | 1.6% | | 9.2% |
5 | | 1.4% | | 8.2% |
6 | | 1.3% | | 7.7% |
7 | | 1.3% | | 7.4% |
8 | | 1.3% | | 7.2% |
9 | | 1.3% | | 7.2% |
10 | | 1.2% | | 7.0% |
58
The Board of Directors has decided to limit the exposure (defined as total disbursements and loan commitments) of PIL (defined below) and other non-Member country loans by setting a country limit related to credit standing of the host country. For information about NIB’s exposure under the PIL facility, see “Loans under Special Lending Programs – Project Investment Loans.”
Under the Statutes, NIB is required to protect itself against exchange rate losses and to obtain adequate security for its loans and loan guarantees when required. There are no specific requirements regarding the types of security that the Bank may accept. The Bank may grant unsecured loans to counterparties that are sufficiently creditworthy. In such lending, the Bank requires various undertakings by the counterparty (e.g. negative pledge and other financial or non-financial covenants). The Bank generally requires higher degrees of credit enhancement for project and structured finance transactions. At 31 December 2017, 20.2% (17.5%) of NIB’s outstanding loans were granted directly to, or guaranteed by, Member countries or local authorities therein, and an additional 24.9% (27.9%) were granted to or guaranteed by other countries (including emerging market countries), or companies that are owned (50% or more) by Member countries or local authorities therein. Without of any kind of security was 2.2% (1.5%) of the total outstanding loans (and green bond investments, as discussed below), the remainder of the outstanding loans had some form of protection through collateral, corporate or other guarantees or covenants.
As noted above, NIB is required under the Statutes to protect itself against foreign exchange rate risks. NIB’s general policy is to grant loans in the same currencies in which it borrows or to convert funds obtained by it into other currencies with appropriate forward exchange risk coverage. NIB has processes in place to control and measure the matching of the maturities of its loans to those of its borrowings. In this respect, the Board of Directors has approved limits for the maximum impact on the Bank’s net interest income due to future refinancing or reinvestment risks. For further information in this regard, see “Note 2: Risk Management.”
The majority of the Bank’s loans are made with final maturities of between five and fifteen years. Disbursements, amortizations and final maturities of the Bank’s loans are dependent upon each project’s schedule of development, cash flow generation, ultimate economic life and the availability to NIB of appropriate funding.
Pricing policy
The Bank’s Statutes require it to grant loans on sound banking terms. Therefore there is no subsidy element in the terms offered by the Bank. Loans and guarantees are priced to cover the Bank’s cost of funds, its administrative costs and the cost of the risks associated with a loan. In addition, a reasonable return on the capital employed is expected to be achieved. The Bank employs a risk-based pricing tool for the pricing of its loans.
NIB’s loans are made at both fixed and floating rates of interest. In both cases, the rate is determined by reference to the incremental cost of funds in the relevant currency and by the underlying security and maturity of the loan. In order to compensate NIB for maintaining sufficient liquidity and accommodate its borrowers’ loan disbursement requirements, NIB has established a schedule of commitment fees to be charged on the undisbursed portions of its loan commitments. The total price of NIB’s loans may also include other fees.
Credit risk monitoring and provision policy
The Bank has a robust process for monitoring of its lending exposure. The monitoring process covers the counterparties’ repayment ability, the value of the credit enhancement, the factors that affect the risk classification and the counterparty’s compliance with all terms and conditions of the transaction including project implementation. Project and structured finance transactions are subject to more detailed monitoring. Furthermore, all loans deemed to represent high credit risk and all watch-listed loans are subject to more detailed and specific monitoring and reporting requirements.
59
A loan is classified as impaired when it is considered likely that the counterparty is unable to meet its contractual obligations and the estimated value of any collateral provided is deemed insufficient, and thus the Bank is at risk of sustaining a credit loss. An allowance for the impairment is calculated and recognized in the Bank’s financial statements in accordance with the IFRS requirements. In respect of PIL loans, impairment losses are recognized for the outstanding principal, interest and fees on loans that fall within the Bank’s own risk for PIL loans.
Loans that are not individually impaired are transferred to a group of loans with similar risk characteristics for a collective impairment test. The Bank assesses the need to make collective impairment on exposures, which, although not specifically identified as requiring a specific allowance, have a greater risk of default than when originally granted. This collective impairment is based on any deterioration in the internal rating of the groups of loans or investments from the time they were granted or acquired. These internal ratings take into consideration factors such as any deterioration in counterparty risk, value of collateral or security received and sector outlook, as well as identified structural weaknesses or deterioration in cash flows. From 1 January 2018, onwards NIB will adopt a new impairment model called the Expected Credit Loss Model in accordance with the new accounting standard IFRS 9 ‘Financial Instruments’. For further information regarding the impact of the new impairment model please refer to Note 1.
The Bank defines “Forbearance” as a concession granted to a counterparty for reasons of financial difficulties, i.e. a concession that would not otherwise be considered by the lender. Forbearance recognition is not limited to measures that give rise to a loss for the lender. Modification of the terms and conditions of the contract may include, for example, reduction of the interest rate, principal or accrued interest, or rescheduling of the payment dates of principal and/or interest, and has an actual effect on the future cash flows. Loan forbearance is granted on a selective basis and purposefully to avoid counterparty default in favour of the Bank’s collection opportunities. Counterparties under forbearance activities are moved to the watch list, and are subject to the impairment policies of the Bank. As of 31 December 2017, there were no Ordinary loans (-) and EUR 100 (118) million of Project investment loans affected by forbearance. There were no impairments recorded for Ordinary loans as at 31 December 2017 or 31 December 2016. The outstanding balance after impairments recorded for Project investment loans affected by forbearance amounted to EUR 7 (21) million at 31 December 2017. The interest income on loans affected by forbearance amounted to EUR 4 (4) million in 2017. See also “Credit risk monitoring” under Note 2: Risk Management.
During 2016, the Bank adjusted its non-performing definition to be in line with the Basel’s definition for non-performing. As of 31 December 2017, there were four non-performing PIL loans totalling EUR 102 million and as of 31 December 2016, there were three non-performing PIL loans totalling EUR 119 million. See also “Impairment of loans and receivables” under Note 1: Accounting Policies.
A total of EUR 139 (139) million has been deducted from the Bank’s loans outstanding and from lending claims in “other assets”. Specific allowances for impairment amounted to EUR 93 (97) million and collectively assessed allowances amounted to EUR 46 (42) million. During 2017 or 2016, no lending transactions were converted into claims under “other assets”. The following changes in allowances for impairment and effects of foreign currency movements are recognised in the statement of comprehensive income under “net loan losses“ and “foreign exchange gains and losses“.
60
Specific and collective allowances for impairment
2017
| | | | | | | | |
In millions of euro | | INDIVIDUALLY ASSESSED
ORDINARY LOANS | | INDIVIDUALLY ASSESSED
PROJECT INVESTMENT LOANS | | COLLECTIVELY ASSESSED
ALL LOANS | | TOTAL |
Opening balance | | 0 | | 97 | | 42 | | 139 |
New provisions | | – | | 10 | | 4 | | 14 |
Reversal of provisions | | – | | -8 | | – | | -8 |
Impairment losses through income statement (Note 9) | | 0 | | 2 | | 4 | | 5 |
Translation differences | | – | | -6 | | – | | -6 |
Closing balance | | 0 | | 93 | | 46 | | 139 |
2016
| | | | | | | | |
In millions of euro | | INDIVIDUALLY ASSESSED
ORDINARY LOANS | | INDIVIDUALLY ASSESSED
PROJECT INVESTMENT LOANS | | COLLECTIVELY ASSESSED
ALL LOANS | | TOTAL |
Opening balance | | 0 | | 55 | | 61 | | 116 |
New provisions | | – | | 47 | | – | | 47 |
Reversal of provisions | | – | | -6 | | -19 | | -26 |
Impairment losses through income statement (Note 9) | | 0 | | 41 | | -19 | | 22 |
Translation differences | | – | | 2 | | – | | 2 |
Closing balance | | 0 | | 97 | | 42 | | 139 |
As of 31 December, loans agreed but not yet disbursed amounted to the following:
| | | | |
| | |
In millions of euro | | 2017 | | 2016 |
Ordinary Loans | | 2,325 | | 1,835 |
Project Investment Loans | | 115 | | 134 |
Environmental Investment Loans | | 23 | | 25 |
Total, loans agreed but not yet disbursed | | 2,464 | | 1,994 |
The amounts set forth above for loans agreed but not yet disbursed include loans where certain conditions, primarily interest rate conditions, may not yet have been finally approved.
Note 12: Intangible assets, tangible assets (property and equipment)
| | | | |
| | |
| | | COMPUTER SOFTWARE DEVELOPMENT COSTS, TOTAL | | COMPUTER SOFTWARE DEVELOPMENT COSTS, TOTAL |
In thousands of euro | | 2017 | | 2016 |
Intangible assets | | | | |
Acquisition value at the beginning of the year | | 28,519 | | 27,581 |
Acquisitions during the year | | 4,382 | | 938 |
Sales/disposals during the year | | -18,257 | | – |
Acquisition value at the end of the year | | 14,644 | | 28,519 |
Accumulated amortisation at the beginning of the year | | 27,581 | | 27,581 |
Amortisation for the year | | – | | – |
Accumulated amortisation on sales/disposals during the year | | -18,257 | | – |
Accumulated amortisation at the end of the year | | 9,324 | | 27,581 |
Net book value | | 5,320 | | 938 |
The additions in 2016 and 2017 relate mainly to a new integrated Treasury Front office, Back office, Risk & Accounting IT solution (FOBORA) which is in the implementation phase.
61
2017
| | | | | | | | | | | | |
| | | |
In thousands of euro | | BUILDINGS | | | OFFICE EQUIPMENT AND
OTHER TANGIBLE ASSETS | | | TOTAL | |
Tangible assets | | | | | | | | | | | | |
Acquisition value at the beginning of the year | | | 33,769 | | | | 22,975 | | | | 56,744 | |
Acquisitions during the year | | | – | | | | 5,333 | | | | 5,333 | |
Sales/disposals during the year | | | – | | | | -1,989 | | | | -1,989 | |
Acquisition value at the end of the year | | | 33,769 | | | | 26,319 | | | | 60,088 | |
| | | |
Accumulated depreciation at the beginning of the year | | | 12,117 | | | | 17,904 | | | | 30,021 | |
Depreciation for the year | | | 673 | | | | 1,002 | | | | 1,675 | |
Accumulated depreciation on sales/disposals during the year | | | – | | | | -1,895 | | | | -1,895 | |
Accumulated depreciation at the end of the year | | | 12,790 | | | | 17,011 | | | | 29,801 | |
Net book value | | | 20,979 | | | | 9,307 | | | | 30,286 | |
On each closing date, the Bank’s assets are assessed to determine whether there is any indication of an asset’s impairment. As of 31 December 2017, there were no indications of impairment of the intangible or tangible assets.
2016
| | | | | | |
In thousands of euro | | BUILDINGS | | OFFICE EQUIPMENT AND OTHER TANGIBLE ASSETS | | TOTAL |
Tangible assets | | | | | | |
Acquisition value at the beginning of the year | | 33,769 | | 22,453 | | 56,222 |
Acquisitions during the year | | – | | 704 | | 704 |
Sales/disposals during the year | | – | | -182 | | -182 |
Acquisition value at the end of the year | | 33,769 | | 22,975 | | 56,744 |
| | | |
Accumulated depreciation at the beginning of the year | | 11,444 | | 16,419 | | 27,863 |
Depreciation for the year | | 673 | | 1,646 | | 2,319 |
Accumulated depreciation on sales/disposals during the year | | – | | -161 | | -161 |
Accumulated depreciation at the end of the year | | 12,117 | | 17,904 | | 30,021 |
Net book value | | 21,652 | | 5,071 | | 26,723 |
62
Note 13: Depreciation
| | | | |
| | |
In thousands of euro | | 2017 | | 2016 |
Intangible assets (Note 12) | | 0 | | 0 |
Tangible assets (Note 12) | | 1,675 | | 2,319 |
Buildings | | 673 | | 673 |
Office equipment | | 1,002 | | 1,646 |
Total | | 1,675 | | 2,319 |
63
Note 14: Other assets
| | | | |
| | |
In millions of euro | | 2017 | | 2016 |
Interest rate swaps at floating rates | | 6,660 | | 6,184 |
Interest rate swaps at fixed rates | | 15,260 | | 14,626 |
Currency swaps at floating rates | | 10,214 | | 11,594 |
Currency swaps at fixed rates | | 6,830 | | 6,998 |
Total, nominal amount | | 38,964 | | 39,401 |
Netting of nominal amount per derivative | | -38,374 | | -37,755 |
Derivative receivables, net | | 590 | | 1,647 |
Adjustment to hedge accounting and changes in fair value of non-hedging derivatives | | 438 | | 510 |
Derivative instruments | | 1,028 | | 2,157 |
Receivables from defaulted counterparties | | – | | 2 |
Other | | 29 | | 10 |
Total | | 1,057 | | 2,170 |
Derivatives are carried at fair value in the statement of financial position net per contract. Thus, swap contracts with a positive net fair value are recognised in the statement of financial position under “Other assets”, while swap contracts with a negative net fair value are recognised under “Other liabilities”.
The table below shows the net exposure of derivative instruments after collaterals at 31 December.
| | | | |
| | |
In millions of euro | | 2017 | | 2016 |
Derivative instruments in financial position | | 1,028 | | 2,157 |
Netting by counterparty | | -507 | | -913 |
Derivative instruments net per counterparty | | 521 | | 1,244 |
Accrued interest net per counterparty | | 48 | | 97 |
Net exposure before collaterals | | 568 | | 1,341 |
Collateral received | | -515 | | -1,212 |
Net exposure | | 53 | | 130 |
See also Risk Management, Credit Risk, Derivatives.
64
Note 15: Debts evidenced by certificates and swaps
| | | | |
| | |
In millions of euro | | 2017 | | 2016 |
Opening Balance | | 23,907 | | 20,862 |
New issues | | 5,943 | | 6,700 |
Amortisation | | -3,648 | | -3,595 |
Call and buybacks | | -86 | | -160 |
Net movement in other debt | | – | | -64 |
Other | | -20 | | -69 |
Balance before valuation adjustments | | 26,096 | | 23,674 |
Foreign exchange movements | | -1,991 | | 381 |
Hedge accounting adjustments | | -106 | | -147 |
Closing balance | | 24,000 | | 23,907 |
At year-end, the Bank’s debt evidenced by certificates were distributed between the currencies shown in the table below. The table also demonstrates the distribution by currency on an after-swap nominal basis.
| | | | | | | | | | | | | | | | | | | | | | | | |
| | | DEBT | | | SWAP CONTRACTS PAYABLE/RECEIVABLE | | | NET BALANCE | |
| | | | | | |
In millions of euro | | 2017 | | | 2016 | | | 2017 | | | 2016 | | | 2017 | | | 2016 | |
Currency | | | | | | | | | | | | | | | | | | | | | | | | |
USD | | | 10,186 | | | | 11,039 | | | | -6,574 | | | | -7,243 | | | | 3,612 | | | | 3,796 | |
AUD | | | 2,362 | | | | 2,579 | | | | -2,362 | | | | -2,579 | | | | – | | | | – | |
NZD | | | 1,677 | | | | 2,095 | | | | -1,677 | | | | -2,095 | | | | – | | | | – | |
EUR | | | 2,894 | | | | 2,222 | | | | 8,584 | | | | 8,547 | | | | 11,477 | | | | 10,769 | |
GBP | | | 1,688 | | | | 1,127 | | | | -1,587 | | | | -1,127 | | | | 101 | | | | – | |
JPY | | | 170 | | | | 567 | | | | -170 | | | | -563 | | | | – | | | | 4 | |
Nordic currencies | | | 3,079 | | | | 2,667 | | | | 5,943 | | | | 5,442 | | | | 9,021 | | | | 8,110 | |
Other currencies | | | 1,573 | | | | 1,134 | | | | -1,399 | | | | -922 | | | | 174 | | | | 211 | |
Subtotal | | | 23,628 | | | | 23,430 | | | | 758 | | | | -541 | | | | 24,387 | | | | 22,890 | |
Hedge accounting adjustments and changes in fair value of non-hedging derivatives | | | 371 | | | | 477 | | | | -189 | | | | -172 | | | | 183 | | | | 305 | |
Total | | | 24,000 | | | | 23,907 | | | | 570 | | | | -713 | | | | 24,569 | | | | 23,195 | |
65
The Bank’s primary source of funding is through the issuance of bonds in the main financial markets globally. The objective is to raise advantageous funds to the benefit of the Bank’s customers. The Bank seeks to take advantage of favourable market conditions, adapting its borrowing operations to investor preferences in terms of currency, maturity, liquidity and structures. Within this strategy, the objective is to raise funds at the lowest possible cost while taking into consideration the risks involved in the structure and complexity of the individual transactions. Furthermore, potential mismatches between the terms of the funding and lending transactions are taken into consideration. To this extent, the proceeds from the issues are converted in the derivatives markets to best manage the Bank’s foreign exchange, interest rate and refinancing risks.
Most of NIB’s medium and long-term borrowing is conducted under its borrowing programs. At year-end 2017 the Bank had the following active programs:
| ● | the Euro Medium Term Note Program (the “EMTN Program”) with a ceiling of EUR 15 billion, |
| ● | the U.S. Medium Term Note Series D Program registered with the U.S. Securities and Exchange Commission (the “U.S. MTN Program”) with a ceiling of USD 20 billion, and |
| ● | the Australian and New Zealand Dollar Domestic Medium Term Note Program with a current ceiling of AUD 8 billion. |
During 2017, NIB borrowed EUR 5,943 (6,700) million by means of 58 transactions in twelve different currencies. EUR 3,280 (2,588) million of this total came from 50 transactions under the EMTN Program. Under the U.S. MTN Program, NIB issued three transactions, two of which were global benchmark issuances in the amount of USD 1.25 billion and USD 1.0 billion, respectively. During 2016, NIB issued 39 transactions under the EMTN Program and seven transactions under the U.S. MTN Program of which three were global benchmark issuances in the amount of USD 1.25 billion, USD 1.0 billion and USD 1.0 billion, respectively. The weighted average maturity for NIB’s borrowing operations in 2017 was 5.2 years, compared with 4.9 years in 2016.
Of debt securities issued, the amount of EUR 1,580 (1,796) million is at floating interest rates, while EUR 21,991 (21,578) million is at fixed interest rates and EUR 0 (0) million is in short-term discounted papers. Of the other borrowing transactions, the amount of EUR 10 (10) million is at floating interest rates, while EUR 47 (47) million is at fixed interest rates.
NIB may issue notes as part of NIB’s Environmental Bond (“NEB”) program. NIB has established an internal framework that allows for the funds raised through issuances of NEB to be directed to its environmental lending in NIB’s member countries and EU countries. Lending projects are eligible under the framework if they satisfy strict internal environmental sustainability criteria. Payment of principal and interest on such notes is made solely on the credit standing of NIB as a single institution and is not directly linked to the performance of environmental lending projects. Accordingly, such notes neither constitute “asset-backed” securities, nor are they otherwise credit-linked to any of NIB’s environmental lending projects. NIB Environmental Bonds can be issued under any of NIB’s debt issuance programs.
At year-end 2017, the Bank had a total of EUR 2,910 (2,030) million outstanding in NIB Environmental Bonds. During 2017, NIB issued seven NIB Environmental Bonds totalling EUR 920 (763) million under its environmental framework. In May 2017, the Bank issued its first benchmark NIB Environmental Bond for the year by increasing its outstanding NEB 2024 by a further EUR 500 million. In August 2017, the Bank issued a five-year, SEK 2.0 billion environmental bond which was increased with SEK 500 million in September. In October 2017, the Bank increased its SEK 2023 twice totalling SEK 1.5 billion. Further, two smaller environmental bonds in BRL and INR was issued during the year. During 2016, NIB issued three NIB Environmental Bonds under its environmental framework, a five-year, SEK 1.0 billion bond, an eight-year, EUR 500 million bond and a seven-year, SEK 1.5 billion bond.
For the years 2017 and 2018, the Board of Directors of the Bank has authorized the Bank to raise medium and long-term borrowings in an aggregate amount of up to EUR 6.5 billion and EUR 7.0 billion respectively.
In 2008, NIB replaced its Euro Commercial Paper Program (“ECP Program”) with a new STEP -compliant ECP Program having a ceiling of EUR 2 billion. In addition to borrowings under this program and through short-term transactions under the EMTN Program, NIB can obtain short-term funds in the interbank market through money market loans and through repo transactions. These transactions are undertaken in most of the currencies listed under “Debt” above.
For the years 2017 and 2018, the Board of Directors has authorized the Bank to raise short-term funding, provided that the outstanding amount at any one time in each of these years does not exceed EUR 3.0 billion.
NIB had no commercial paper outstanding under the ECP Program at year-ends 2017 and 2016.
66
Note 16: Other liabilities
| | | | |
| | |
In millions of euro | | 2017 | | 2016 |
Interest rate swaps at floating interest rates | | 16,949 | | 16,407 |
Interest rate swaps at fixed interest rates | | 5,000 | | 4,404 |
Currency swaps at floating interest rates | | 17,010 | | 17,354 |
Currency swaps at fixed rates | | 715 | | 718 |
Total, nominal amount | | 39,875 | | 38,884 |
Netting of nominal amount per derivative | | -38,327 | | -37,778 |
Derivative payables, net | | 1,348 | | 1,106 |
Adjustment to hedge accounting and changes in fair value of non-hedging derivatives | | 250 | | 338 |
Derivative instruments | | 1,597 | | 1,444 |
Other | | 10 | | 11 |
Total | | 1,608 | | 1,456 |
Derivatives are carried at fair value in the statement of financial position net per contract. Thus, swap contracts with a positive net fair value are recognised in the statement of financial position under “Other assets”, while swap contracts with a negative net fair value are recognised under “Other liabilities”.
Derivative instruments net exposure after collaterals
| | | | |
| | |
In millions of euro | | 2017 | | 2016 |
Derivative instruments in financial position | | 1,597 | | 1,444 |
Netting by counterparty | | -507 | | -913 |
Derivative instruments net per counterparty | | 1,090 | | 532 |
Accrued interest net per counterparty | | -114 | | -72 |
Net exposure before collaterals | | 976 | | 460 |
Collateral given | | -899 | | -207 |
Net exposure | | 77 | | 252 |
See also Risk Management, Credit Risk, Derivatives.
67
Note 17: Capitalisation and reserves
The following table sets forth the capitalization of NIB at December 31, 2017.
| | | | | | | | |
In millions of euro | | Outstanding at
December 31, 2017 | | | Outstanding at
December 31, 2016 | |
Equity: | | | | | | | | |
Authorized and subscribed capital | | | 6,142 | | | | 6,142 | |
Of which callable capital | | | -5,723 | | | | -5,723 | |
Paid-in capital | | | 419 | | | | 419 | |
Statutory Reserve | | | 686 | | | | 686 | |
General Credit Risk Fund | | | 1,697 | | | | 1,541 | |
Special Credit Risk Fund PIL | | | 446 | | | | 446 | |
Hedging reserve | | | -3 | | | | -28 | |
Profit for the year | | | 211 | | | | 212 | |
Total Equity | | | 3,456 | | | | 3,275 | |
| | |
Funded Debt | | | 24,000 | | | | 23,907 | |
Total Capitalization | | | 27,456 | | | | 27,183 | |
The member countries’ portions of authorised capital are as follows:
| | | | | | | | | | | | | | | | |
| | | | |
In millions of euro | | 2017 | | | SHARE, IN % | | | 2016 | | | SHARE, IN % | |
Member country | | | | | | | | | | | | | | | | |
Denmark | | | 1,294 | | | | 21.1% | | | | 1,294 | | | | 21.1% | |
Estonia | | | 56 | | | | 0.9% | | | | 56 | | | | 0.9% | |
Finland | | | 1,088 | | | | 17.7% | | | | 1,088 | | | | 17.7% | |
Iceland | | | 58 | | | | 0.9% | | | | 58 | | | | 0.9% | |
Latvia | | | 82 | | | | 1.3% | | | | 82 | | | | 1.3% | |
Lithuania | | | 120 | | | | 2.0% | | | | 120 | | | | 2.0% | |
Norway | | | 1,321 | | | | 21.5% | | | | 1,321 | | | | 21.5% | |
Sweden | | | 2,123 | | | | 34.6% | | | | 2,123 | | | | 34.6% | |
Total | | | 6,142 | | | | 100.0% | | | | 6,142 | | | | 100.0% | |
The member countries’ portions of paid-in capital are as follows:
| | | | | | | | | | | | | | | | |
| | | | |
In millions of euro | | 2017 | | | SHARE, IN % | | | 2016 | | | SHARE, IN % | |
Member country | | | | | | | | | | | | | | | | |
Denmark | | | 88 | | | | 21.1% | | | | 89 | | | | 21.3% | |
Estonia | | | 4 | | | | 0.9% | | | | 3 | | | | 0.7% | |
Finland | | | 74 | | | | 17.7% | | | | 74 | | | | 17.8% | |
Iceland | | | 4 | | | | 0.9% | | | | 4 | | | | 0.9% | |
Latvia | | | 6 | | | | 1.3% | | | | 4 | | | | 1.1% | |
Lithuania | | | 8 | | | | 2.0% | | | | 7 | | | | 1.6% | |
Norway | | | 90 | | | | 21.5% | | | | 77 | | | | 18.4% | |
Sweden | | | 145 | | | | 34.6% | | | | 160 | | | | 38.1% | |
Total | | | 419 | | | | 100.0% | | | | 419 | | | | 100.0% | |
68
Authorised Capital Stock
The Board of Governors can, upon a proposal by the Board of Directors of NIB, decide upon an increase in the authorised capital stock of the Bank. To become effective, such a decision usually requires the approval of the parliaments of the Member countries.
The authorised capital stock of the Bank, which initially was approximately EUR 510 million, has been increased several times, most recently in June 2010, when the Board of Governors decided to increase the Bank’s authorised capital by EUR 2,000 million to EUR 6,142 million. The capital increase came into force on February 16, 2011 following confirmation of the increase by all Member countries. The increase was allocated to the callable portion of the authorised capital stock. The split of NIB’s authorised capital into paid-in capital and callable capital is discussed below under “Paid-in Capital and Callable Capital.”
As stipulated in NIB’s Statutes, any increase of the authorised capital stock is allocated among the Member countries based upon their gross national income (GNI) at market prices as determined from time to time by the Board of Governors. From the establishment of NIB in 1975 until the Baltic countries joined NIB on January 1, 2005, gross national income (GNI) was calculated at factor prices for the Nordic countries as an average of the data from the two most recent years available. Since January 1, 2005 the source for the GNI statistics has been the International Monetary Fund’s International Financial Statistics publication. Allocations of new subscribed capital among the Member countries were fixed at the time of each increase and no adjustments or equalisation payments were made with respect to capital already subscribed. Accordingly, and because the GNI among the Member countries has varied over the years, the authorised and paid-in portions of the Member countries’ capital have not been the same.
In 2016 the Bank’s Board of Governors decided to adjust and align NIB’s authorised capital so that each Member country’s share in percentage of paid-in capital and callable capital would equal its share of the authorised capital. The adjustment and alignment also concerns the Member countries’ respective percentage share of statutory guarantee for the Project Investment Loan facility (PIL) and the Environmental Investment Loan facility (MIL), as described further in “Lending Operations of NIB – Loans under Special Lending Programs – Project Investment Loans (PIL)” in Note 11. Following the completion of the approval process in each Member country, the changes have entered into force and have been implemented.
Paid-in Capital and Callable Capital
The Statutes provide that NIB’s authorised capital stock shall consist of a paid-in portion and a callable portion. Of NIB’s total authorised capital stock of currently EUR 6,142 million, the paid-in portion amounts to EUR 419 million, which corresponds to approximately 6.8% of the total authorised capital stock of the Bank. All subscribed capital not paid in is subject to call by the Board of Directors of NIB to the extent that the Board deems it necessary for the fulfilment of the Bank’s debt obligations. The Statutes do not require that calls be made pro rata, but it is anticipated that, in the first instance, calls would be made in that manner. Failure by any Member country to make payment on any such call would not excuse any other Member country from its obligation to make payment. No Member country can legally be required on any such call to pay more than the unpaid balance of the callable portion of its subscribed capital. To date no such calls have been made.
In view of NIB’s mission as an institution for regional cooperation, there are no provisions in the 2004 Agreement for admitting additional countries. While a Member country may withdraw by giving notice in accordance with the provisions set forth in the 2004 Agreement, the 2004 Agreement also provides that a withdrawing country must remain liable for those commitments of NIB that were in force at the time of the withdrawal to the same extent as immediately prior to such withdrawal.
Reserves
Under the Statutes, NIB’s annual net profits are to be transferred to a statutory reserve (the “Statutory Reserve”) until such reserve equals 10% of the authorised capital stock of the Bank. Thereafter, the Board of Governors, acting upon the proposal of the Board of Directors of NIB, will determine the allocation of net profits between further transfers to the Statutory Reserve and the payment of dividends to the Member countries.
At December 31, 2017, the Statutory Reserve of NIB amounted to EUR 686 million or 11% of the Bank’s authorised capital. NIB has annually allocated a portion of the respective year’s profit as a general credit risk reserve (the “General Credit Risk Fund”) for unidentified risks in the Bank’s operations. At December 31, 2017, the General Credit Risk Fund amounted to EUR 1,697 million. The General Credit Risk Fund is available to cover losses arising from NIB’s lending portfolio as well as other risks NIB assumes in its business activities, such as the activities of its treasury department. The risks covered with respect to the treasury activities include market risks as well as counterparty risks. For further information in this regard, please see “Risk Management” in Note 2. NIB’s Board of Directors has proposed to the Board of Governors that EUR 156.0 million of the profit for 2017 be allocated to the General Credit Risk Fund.
As required by Section 8 of the Statutes, the Bank has established a separate special credit risk fund to be used exclusively for any future project investment loan losses (the “Special Credit Risk Fund PIL”). At December 31, 2017, the Special Credit Risk Fund PIL amounted to EUR 446 million. For further information regarding the project investment loans facility and the Member countries’ guarantees, see “Loans under Special Lending Programs” in Note 11.
As part of the terms and conditions of membership, Estonia, Latvia and Lithuania have paid into NIB’s reserves the aggregate amount of EUR 43 million in the same proportion as their respective shares of the subscribed capital.
NIB’s Board of Directors has proposed to the Board of Governors to make EUR 55.0 million available for distribution as dividends to Member countries in 2018 arising from the net profit for 2017.
69
Note 18: Collateral and commitments
| | | | | | | | |
| | |
| In millions of euro | | 2017 | | | 2016 | |
Guarantees issued at nominal amount (Note 11) | | | – | | | | – | |
Loans agreed but not yet disbursed (Note 11) | | | 2,464 | | | | 1,994 | |
Borrowing commitments | | | – | | | | – | |
Collateral provided for staff loans 1 | | | – | | | | – | |
Securities and cash given as collateral for repurchase agreements 1 6 7 | | | 96 | | | | – | |
Callable commitments in financial placements | | | 3 | | | | 5 | |
Collateral received for collateralised placements 2 3 | | | 2,485 | | | | 3,208 | |
Collateral given for collateralised placements 1 4 | | | – | | | | 15 | |
Gross collateral with respect to derivatives exposure | | | | | | | | |
Collateral received 2 5 | | | 556 | | | | 1,420 | |
Collateral given 1 4 | | | 899 | | | | 207 | |
1 Book value. 2 Fair value. 3 Including cash of EUR 4 (2) million and securities of EUR 2,481 (3,207) million received. 4 Cash collateral. 5 Including cash of EUR 547 (1,309) million and securities of EUR 9 (111) million received. 6 Including cash EUR 1 (-) million and securities EUR 95 (-) million given. 7 Excluding four repurchase agreements traded in December 2017 with value in March 2018 as the risk related to these are not transferred before value date.
Operating leases – NIB as lessee
At 31 December, the future minimum lease payments under non-cancellable leases were as follows;
| | | | | | | | |
| | |
| In millions of euro | | 2017 | | | 2016 | |
Within one year | | | 1,120 | | | | 1,062 | |
Later than one but not two years | | | 556 | | | | 978 | |
Later than two but not three years | | | 6 | | | | 905 | |
Later than three but not four years | | | – | | | | 6 | |
Later than four but not five years | | | – | | | | – | |
Later than five years | | | – | | | | – | |
Total | | | 1,681 | | | | 2,951 | |
The leases mainly related to office space and IT equipment
70
Operating leases – NIB as lessor
At 31 December, the future minimum lease receipts under non-cancellable leases were as follows;
| | | | | | | | |
| | |
| In millions of euro | | 2017 | | | 2016 | |
Within one year | | | 614 | | | | 1,449 | |
Later than one but not two years | | | 71 | | | | 142 | |
Later than two but not three years | | | – | | | | 142 | |
Later than three but not four years | | | – | | | | – | |
Total | | | 685 | | | | 1,733 | |
The bank sub-lets office space to related parties as described in Note 23 and rents properties received as security in default situations. These properties are held for sale but rented until sold.
Purchase commitments
During 2016 the Bank initiated a procurement process for the purpose of purchasing an integrated Treasury Front office, Back office, Risk & Accounting IT solution (FOBORA) in order to modernise NIB’s business processes and IT systems. The procurement process engaged several potential vendors and it was concluded by end of November 2016 with one successful vendor. At 31 December 2017, the non-cancellable purchase commitment amounted to EUR 5.3 million.
71
Note 19: Fair value of financial instruments
| | | | | | | | | | | | | | | | | | | | | | | | |
| | |
| | | 2017 | | | 2016 | |
| | | | | | |
In millions of euro | | CARRYING AMOUNT | | | FAIR VALUE | | | DIFFERENCE | | | CARRYING AMOUNT | | | FAIR VALUE | | | DIFFERENCE | |
Assets | | | | | | | | | | | | | | | | | | | | | | | | |
Cash accounts with banks 1 | | | 64 | | | | 64 | | | | – | | | | 107 | | | | 107 | | | | – | |
Cash equivalents held at fair value 1 | | | 2,768 | | | | 2,768 | | | | – | | | | 3,877 | | | | 3,877 | | | | – | |
Other cash and cash equivalents held at amortised cost 2 | | | 1,905 | | | | 1,905 | | | | – | | | | 472 | | | | 472 | | | | – | |
Cash and cash equivalents, total | | | 4,736 | | | | 4,736 | | | | – | | | | 4,456 | | | | 4,456 | | | | – | |
Placements with credit institutions 2 | | | 9 | | | | 9 | | | | – | | | | 9 | | | | 9 | | | | – | |
Debt securities held at fair value 1,3 | | | 4,182 | | | | 4,182 | | | | – | | | | 4,157 | | | | 4,157 | | | | – | |
Other debt securities held at amortised cost 1 | | | 2,413 | | | | 2,493 | | | | 80 | | | | 2,416 | | | | 2,534 | | | | 118 | |
Debt securities, total | | | 6,595 | | | | 6,675 | | | | 80 | | | | 6,572 | | | | 6,690 | | | | 118 | |
Other financial placements at fair value 1,3 | | | 16 | | | | 16 | | | | – | | | | 19 | | | | 19 | | | | – | |
Hedged loans outstanding in fair value hedging relationships 2 | | | 3,689 | | | | 3,689 | | | | – | | | | 3,321 | | | | 3,321 | | | | – | |
Green lending bonds at fair value 1 | | | 283 | | | | 283 | | | | – | | | | 143 | | | | 143 | | | | – | |
Loans outstanding, other 2 | | | 13,259 | | | | 13,265 | | | | 6 | | | | 13,177 | | | | 13,185 | | | | 8 | |
Loans outstanding, total | | | 17,232 | | | | 17,238 | | | | 6 | | | | 16,640 | | | | 16,648 | | | | 8 | |
Hedging derivatives at fair value 2 | | | 593 | | | | 593 | | | | – | | | | 732 | | | | 732 | | | | – | |
Other derivatives at fair value 2 | | | 435 | | | | 435 | | | | – | | | | 1,425 | | | | 1,425 | | | | – | |
Derivatives at fair value, total | | | 1,028 | | | | 1,028 | | | | – | | | | 2,157 | | | | 2,157 | | | | – | |
Receivables from defaulted counterparties at fair value 3 | | | | | | | | | | | – | | | | 2 | | | | 2 | | | | – | |
| | | | | | | | | | | | 86 | | | | | | | | | | | | 126 | |
| | | | | | |
Liabilities | | | | | | | | | | | | | | | | | | | | | | | | |
Short-term amounts owed to credit institutions 2 | | | 563 | | | | 563 | | | | – | | | | 1,311 | | | | 1,311 | | | | – | |
Long-term amounts owed to credit institutions 2 | | | 17 | | | | 17 | | | | – | | | | 18 | | | | 18 | | | | – | |
Repurchase agreements 2 | | | 99 | | | | 99 | | | | – | | | | – | | | | – | | | | – | |
Hedged debt securities issued in fair value hedging relationships 2 | | | 22,893 | | | | 22,893 | | | | – | | | | 22,668 | | | | 22,668 | | | | – | |
Other debt securities issued 2 | | | 1,041 | | | | 1,047 | | | | 6 | | | | 1,157 | | | | 1,158 | | | | 1 | |
Debt securities issued, total | | | 23,934 | | | | 23,940 | | | | 6 | | | | 23,826 | | | | 23,826 | | | | 1 | |
Hedged other debt in fair value hedging relationships 2 | | | 66 | | | | 66 | | | | – | | | | 82 | | | | 82 | | | | – | |
Other debt 2 | | | – | | | | – | | | | – | | | | – | | | | – | | | | – | |
Other debt, total | | | 66 | | | | 66 | | | | – | | | | 82 | | | | 82 | | | | 0 | |
Hedging derivatives at fair value 2 | | | 1,545 | | | | 1,545 | | | | – | | | | 1,392 | | | | 1,392 | | | | – | |
Other derivatives at fair value 2 | | | 53 | | | | 53 | | | | – | | | | 53 | | | | 53 | | | | – | |
Derivatives at fair value, total | | | 1,597 | | | | 1,597 | | | | – | | | | 1,444 | | | | 1,444 | | | | 0 | |
| | | | | | | | | | | | 6 | | | | | | | | | | | | 1 | |
Net | | | | | | | | | | | 80 | | | | | | | | | | | | 125 | |
1 The fair value is determined according to market quotes for identical instruments. 2 The fair value is determined using valuation techniques with observable market inputs. 3 The fair value is determined using valuation techniques with unobservable market inputs.
72
Level of fair value measurement for financial instruments at the end of the period
The table below analyses financial instruments’ fair value at the end of the year by the level in the fair value hierarchy into which the fair value measurement is categorised. See Accounting policies, Determination of fair value.
| | | | | | | | | | | | | | | | | | | | | | | | |
| | |
| | | 2017 | | | 2016 | |
| | | | | | |
In millions of euro | | LEVEL 1 | | | LEVEL 2 | | | LEVEL 3 | | | LEVEL 1 | | | LEVEL 2 | | | LEVEL 3 | |
Assets | | | | | | | | | | | | | | | | | | | | | | | | |
Cash accounts with banks | | | 64 | | | | – | | | | – | | | | 107 | | | | – | | | | – | |
Cash equivalents held at fair value | | | 2,768 | | | | – | | | | – | | | | 3,877 | | | | – | | | | – | |
Other cash and cash equivalents held at amortised cost | | | – | | | | 1,905 | | | | – | | | | – | | | | 472 | | | | – | |
Cash and cash equivalents, total | | | 2,832 | | | | 1,905 | | | | | | | | 3,984 | | | | 472 | | | | 0 | |
Placements with credit institutions | | | – | | | | 9 | | | | – | | | | – | | | | 9 | | | | – | |
Debt securities held at fair value | | | 4,167 | | | | – | | | | 15 | | | | 4,138 | | | | – | | | | 18 | |
Other debt securities held at amortised cost | | | 2,493 | | | | – | | | | – | | | | 2,534 | | | | – | | | | – | |
Debt securities, total | | | 6,660 | | | | 0 | | | | 15 | | | | 6,672 | | | | 0 | | | | 18 | |
Other financial placements held at fair value | | | – | | | | – | | | | 16 | | | | 3 | | | | | | | | 16 | |
Hedged loans outstanding in fair value hedging relationships | | | – | | | | 3,689 | | | | – | | | | – | | | | 3,321 | | | | – | |
Green lending bonds at fair value | | | 283 | | | | – | | | | – | | | | 143 | | | | – | | | | – | |
Loans outstanding, other | | | – | | | | 13,265 | | | | – | | | | – | | | | 13,185 | | | | – | |
Loans outstanding, total | | | 283 | | | | 16,955 | | | | 0 | | | | 143 | | | | 16,506 | | | | 0 | |
Derivatives | | | – | | | | 1,028 | | | | – | | | | – | | | | 2,157 | | | | – | |
Receivables from defaulted counterparties | | | – | | | | – | | | | 0 | | | | – | | | | – | | | | 2 | |
Financial assets, total | | | 9,775 | | | | 19,896 | | | | 32 | | | | 10,802 | | | | 19,143 | | | | 37 | |
| | | | | | |
Liabilities | | | | | | | | | | | | | | | | | | | | | | | | |
Short-term amounts owed to credit institutions | | | – | | | | 563 | | | | – | | | | – | | | | 1,311 | | | | – | |
Long-term amounts owed to credit institutions | | | – | | | | 17 | | | | – | | | | – | | | | 18 | | | | – | |
Repurchase agreements | | | – | | | | 99 | | | | – | | | | – | | | | – | | | | – | |
Debt securities issued | | | | | | | | | | | | | | | | | | | | | | | | |
Hedged debt securities issued in fair value hedging relationships | | | – | | | | 22,893 | | | | – | | | | – | | | | 22,668 | | | | – | |
Other debt securities issued | | | – | | | | 1,047 | | | | – | | | | – | | | | 1,158 | | | | – | |
Hedged other debt in fair value hedging relationships | | | – | | | | 66 | | | | – | | | | – | | | | 82 | | | | – | |
Other debt | | | – | | | | – | | | | – | | | | – | | | | – | | | | – | |
Debt securities issued, total | | | 0 | | | | 24,006 | | | | 0 | | | | 0 | | | | 23,908 | | | | 0 | |
Derivatives | | | 0 | | | | 1,597 | | | | 0 | | | | 0 | | | | 1,444 | | | | 0 | |
Financial liabilities, total | | | 0 | | | | 26,283 | | | | 0 | | | | 0 | | | | 26,681 | | | | 0 | |
At 31 December 2016, recorded Credit Valuation Adjustment (CVA) amounted to EUR - 8 million, while Debit Valuation Adjustment (DVA) was EUR 10 million. At 31 December 2017, recorded CVA amounted to EUR - 4 million, while DVA was EUR 5 million. Receivables from defaulted treasury counterparties are measured at fair value. Receivables from defaulted lending counterparties are measured at cost minus impairment.
73
Changes in fair values categorised at level 3
| | | | | | | | | | | | | | | | |
In millions of euro | | DEBT SECURITIES HELD
AT FAIR VALUE | | | OTHER FINANCIAL PLACEMENTS
HELD AT FAIR VALUE | | | RECEIVABLES FROM DEFAULTED COUNTERPARTIES | | | LEVEL 3, TOTAL | |
31 Dec 2015 | | | 22 | | | | 20 | | | | 6 | | | | 49 | |
Matured transactions | | | – | | | | – | | | | – | | | | 0 | |
Sold transactions | | | – | | | | – | | | | – | | | | 0 | |
Claims received | | | – | | | | – | | | | -5 | | | | -5 | |
Claims Written off | | | – | | | | – | | | | -84 | | | | -84 | |
Changes in fair values | | | -4 | | | | -4 | | | | 86 | | | | 78 | |
31 Dec 2016 | | | 18 | | | | 16 | | | | 2 | | | | 37 | |
Matured transactions | | | – | | | | – | | | | – | | | | 0 | |
Sold transactions | | | – | | | | – | | | | – | | | | 0 | |
Claims received | | | – | | | | – | | | | -2 | | | | -2 | |
Claims Written off | | | – | | | | – | | | | -37 | | | | -37 | |
Changes in fair values | | | -3 | | | | – | | | | 38 | | | | 35 | |
31 Dec 2017 | | | 15 | | | | 16 | | | | 0 | | | | 32 | |
Sensitivity analysis of level 3 financial instruments
| | | | | | | | | | | | | | | | | | | | | | | | |
| | | | | | |
| | | | | | 2017 | | | | | | | | | 2016 | | | | |
| | | | | | |
In millions of euro | | CARRYING
AMOUNT | | | FAVOURABLE
CHANGE | | | UNFAVOURABLE
CHANGE | | | CARRYING
AMOUNT | | | FAVOURABLE
CHANGE | | | UNFAVOURABLE
CHANGE | |
Financial instruments categorised at level 3 | | | 32 | | | | — | | | | — | | | | 37 | | | | 1 | | | | -1 | |
The table above shows the sensitivity of the fair value of level 3 instruments to changes in key assumptions. The sensitivity analysis of the debt securities valued as level 3 is based on cash flow evaluation on Bloomberg. The implied market spread over the reference curve has been changed, reflecting a credit migration of the issuer. The fair value for other financial placements in level 3 is received from the funds in question and is based on the present value of their cash flows. No quotation exists for these placements.
74
Note 20: Maturity profile of financial assets and liabilities
The table below sets out a maturity analysis for financial assets and liabilities containing principal and interest flows. For loans outstanding, undiscounted cash flows are presented until contractual final maturity. For borrowing outstanding and derivatives with call options, cash flows are presented until the first possible termination date. Cash flows are presented on net basis for interest rate swaps and on gross basis for all other swaps. Interest cash flows are projected based on the interest rates prevailing on the closing date. See also Notes 14 and 16, and Risk Management, Liquidity Risk.
2017
| | | | | | | | | | | | | | | | | | | | | | | | | | | | |
In millions of euro | | CARRYING
AMOUNT | | | CONTRACTUAL
CASH FLOWS | | | UP TO AND
INCLUDING
3 MONTHS | | | OVER 3 MONTHS
AND UP TO AND
INCLUDING
6 MONTHS | | | OVER 6 MONTHS
AND UP TO AND
INCLUDING
1 YEAR | | | OVER 1 YEAR
AND UP TO AND
INCLUDING
5 YEARS | | | OVER 5 YEARS | |
Assets | | | | | | | | | | | | | | | | | | | | | | | | | | | | |
Cash and cash equivalents | | | 4,736 | | | | 4,732 | | | | 4,732 | | | | – | | | | – | | | | – | | | | – | |
Financial placements | | | | | | | | | | | | | | | | | | | | | | | | | | | | |
Debt securities | | | 6,595 | | | | 6,762 | | | | 514 | | | | 445 | | | | 794 | | | | 4,244 | | | | 765 | |
Other | | | 16 | | | | 13 | | | | – | | | | – | | | | – | | | | – | | | | 13 | |
Loans outstanding | | | 17,232 | | | | 18,553 | | | | 357 | | | | 546 | | | | 923 | | | | 8,112 | | | | 8,615 | |
Other assets | | | | | | | | | | | | | | | | | | | | | | | | | | | | |
Derivatives | | | | | | | | | | | | | | | | | | | | | | | | | | | | |
Receivables | | | 28,564 | | | | 7,797 | | | | 678 | | | | 693 | | | | 415 | | | | 3,966 | | | | 2,044 | |
Payables | | | -27,536 | | | | -6,464 | | | | -536 | | | | -552 | | | | -313 | | | | -3,391 | | | | -1,672 | |
| | | | 1,028 | | | | 1,334 | | | | 142 | | | | 142 | | | | 102 | | | | 575 | | | | 373 | |
Assets, total | | | 29,607 | | | | 31,394 | | | | 5,745 | | | | 1,133 | | | | 1,819 | | | | 12,931 | | | | 9,765 | |
Liabilities | | | | | | | | | | | | | | | | | | | | | | | | | | | | |
Amounts owed to credit institutions | | | | | | | | | | | | | | | | | | | | | | | | | | | | |
Short-term | | | 563 | | | | 556 | | | | 556 | | | | – | | | | – | | | | – | | | | – | |
Long-term | | | 17 | | | | 14 | | | | – | | | | 14 | | | | – | | | | – | | | | – | |
| | | | 580 | | | | 570 | | | | 556 | | | | 14 | | | | 0 | | | | 0 | | | | 0 | |
Repurchase agreements | | | 99 | | | | 99 | | | | 99 | | | | – | | | | – | | | | – | | | | – | |
Debts evidenced by certificates | | | 24,000 | | | | 25,733 | | | | 3,373 | | | | 800 | | | | 1,270 | | | | 15,077 | | | | 5,213 | |
Other liabilities | | | | | | | | | | | | | | | | | | | | | | | | | | | | |
Derivatives | | | | | | | | | | | | | | | | | | | | | | | | | | | | |
Receivables | | | -10,838 | | | | -12,384 | | | | -1,101 | | | | -198 | | | | -446 | | | | -8,389 | | | | -2,250 | |
Payables | | | 12,435 | | | | 12,586 | | | | 1,191 | | | | 176 | | | | 309 | | | | 8,497 | | | | 2,413 | |
| | | | 1,597 | | | | 202 | | | | 90 | | | | -22 | | | | -137 | | | | 108 | | | | 163 | |
Liabilities, total | | | 26,276 | | | | 26,604 | | | | 4,118 | | | | 792 | | | | 1,133 | | | | 15,185 | | | | 5,376 | |
| | | | | | | | | | | | | | | | | | | | | | | | | | | | | |
Net during the period | | | | | | | | | | | 1,627 | | | | 341 | | | | 686 | | | | -2,254 | | | | 4,389 | |
| | | | | | | |
Loans agreed but not yet disbursed | | | | | | | | | | | 2,464 | | | | | | | | | | | | | | | | | |
75
2016
| | | | | | | | | | | | | | | | | | | | | | | | | | | | |
In millions of euro | | CARRYING
AMOUNT | | | CONTRACTUAL
CASH FLOWS | | | UP TO AND
INCLUDING
3 MONTHS | | | OVER 3 MONTHS
AND UP TO AND
INCLUDING
6 MONTHS | | | OVER 6 MONTHS
AND UP TO AND
INCLUDING
1 YEAR | | | OVER 1 YEAR
AND UP TO AND
INCLUDING
5 YEARS | | | OVER 5 YEARS | |
Assets | | | | | | | | | | | | | | | | | | | | | | | | | | | | |
Cash and cash equivalents | | | 4,456 | | | | 4,453 | | | | 4,453 | | | | – | | | | – | | | | – | | | | – | |
Financial placements | | | | | | | | | | | | | | | | | | | | | | | | | | | | |
Debt securities | | | 6,572 | | | | 6,773 | | | | 528 | | | | 489 | | | | 669 | | | | 4,565 | | | | 522 | |
Other | | | 19 | | | | 15 | | | | – | | | | – | | | | – | | | | – | | | | 15 | |
Loans outstanding | | | 16,640 | | | | 17,917 | | | | 374 | | | | 469 | | | | 925 | | | | 7,774 | | | | 8,375 | |
Other assets | | | | | | | | | | | | | | | | | | | | | | | | | | | | |
Derivatives | | | | | | | | | | | | | | | | | | | | | | | | | | | | |
Receivables | | | 34,096 | | | | 14,957 | | | | 823 | | | | 1,489 | | | | 980 | | | | 8,209 | | | | 3,457 | |
Payables | | | -31,939 | | | | -11,931 | | | | -630 | | | | -1,221 | | | | -703 | | | | -6,566 | | | | -2,810 | |
| | | | 2,157 | | | | 3,026 | | | | 193 | | | | 268 | | | | 277 | | | | 1,643 | | | | 647 | |
Assets, total | | | 29,844 | | | | 32,184 | | | | 5,548 | | | | 1,226 | | | | 1,871 | | | | 13,982 | | | | 9,559 | |
Liabilities | | | | | | | | | | | | | | | | | | | | | | | | | | | | |
Amounts owed to credit institutions | | | | | | | | | | | | | | | | | | | | | |
Short-term | | | 1,311 | | | | 1,311 | | | | 1,311 | | | | – | | | | – | | | | – | | | | – | |
Long-term | | | 18 | | | | 18 | | | | – | | | | 18 | | | | – | | | | – | | | | – | |
| | | | 1,329 | | | | 1,329 | | | | 1,311 | | | | 18 | | | | 0 | | | | 0 | | | | 0 | |
Debts evidenced by certificates | | | 23,907 | | | | 25,543 | | | | 2,857 | | | | 427 | | | | 1,033 | | | | 15,785 | | | | 5,442 | |
Other liabilities | | | | | | | | | | | | | | | | | | | | | | | | | | | | |
Derivatives | | | | | | | | | | | | | | | | | | | | | | | | | | | | |
Receivables | | | -5,856 | | | | -6,383 | | | | -236 | | | | -41 | | | | -496 | | | | -3,753 | | | | -1,857 | |
Payables | | | 7,300 | | | | 7,044 | | | | 191 | | | | 67 | | | | 490 | | | | 4,129 | | | | 2,168 | |
| | | | 1,444 | | | | 661 | | | | -46 | | | | 27 | | | | -6 | | | | 376 | | | | 311 | |
Liabilities, total | | | 26,680 | | | | 27,533 | | | | 4,122 | | | | 471 | | | | 1,027 | | | | 16,160 | | | | 5,753 | |
| | | | | | | | | | | | | | | | | | | | | | | | | | | | | |
Net during the period | | | | | | | | | | | 1,426 | | | | 755 | | | | 844 | | | | -2,178 | | | | 3,806 | |
| | | | | | | |
Loans agreed but not yet disbursed | | | | | | | | | | | 1,994 | | | | | | | | | | | | | | | | | |
76
Note 21: Interest rate risk
Interest rate risk is the impact that fluctuations in market interest rates can have on the value of the Bank’s interest-bearing assets and liabilities and on the interest income recognised in the statement of comprehensive income. The table below provides information on the extent of the Bank’s interest rate exposure. The assets and liabilities are grouped into buckets defined by their time to maturity or the date of the interest rate adjustment. The difference, or gap, between assets and liabilities in each time bucket makes the Bank sensitive to interest rate fluctuations. See also Risk Management, Market Risk.
2017
| | | | | | | | | | | | | | | | | | | | | | | | | | | | | | | | |
In millions of euro | | UP TO AND
INCLUDING
3 MONTHS | | | OVER 3 MONTHS
AND UP TO AND
INCLUDING
6 MONTHS | | | OVER 6 MONTHS
AND UP TO AND
INCLUDING
1 YEAR | | | OVER 1 YEAR
AND UP TO AND
INCLUDING
5 YEARS | | | OVER 5 YEARS
AND UP TO AND
INCLUDING
10 YEARS | | | OVER 10 YEARS | | | UNDEFINED | | | TOTAL | |
Assets | | | | | | | | | | | | | | | | | | | | | | | | | | | | | | | | |
Cash and cash equivalents | | | 4,737 | | | | – | | | | – | | | | – | | | | – | | | | – | | | | – | | | | 4,736 | |
Financial placements | | | | | | | | | | | | | | | | | | | | | | | | | | | | | | | | |
Placements with credit institutions | | | – | | | | – | | | | – | | | | – | | | | – | | | | – | | | | 9 | | | | 9 | |
Debt securities | | | 2,151 | | | | 307 | | | | 558 | | | | 2,815 | | | | 736 | | | | 10 | | | | 18 | | | | 6,595 | |
Other | | | – | | | | – | | | | – | | | | – | | | | – | | | | – | | | | 16 | | | | 16 | |
| | | | 2,151 | | | | 307 | | | | 558 | | | | 2,815 | | | | 736 | | | | 10 | | | | 43 | | | | 6,620 | |
Loans outstanding | | | 7,106 | | | | 6,559 | | | | 80 | | | | 1,940 | | | | 927 | | | | 486 | | | | 134 | | | | 17,232 | |
Intangible assets | | | – | | | | – | | | | – | | | | – | | | | – | | | | – | | | | 5 | | | | 5 | |
Tangible assets | | | – | | | | – | | | | – | | | | – | | | | – | | | | – | | | | 30 | | | | 30 | |
Other assets | | | | | | | | | | | | | | | | | | | | | | | | | | | | | | | | |
Derivatives | | | | | | | | | | | | | | | | | | | | | | | | | | | | | | | | |
Receivables 1 | | | 17,689 | | | | 2,446 | | | | 1,156 | | | | 13,215 | | | | 3,688 | | | | 770 | | | | 438 | | | | 39,402 | |
Other assets | | | – | | | | – | | | | – | | | | – | | | | – | | | | – | | | | 29 | | | | 29 | |
Accrued interest and fees receivable | | | – | | | | – | | | | – | | | | – | | | | – | | | | – | | | | 272 | | | | 272 | |
Total assets | | | 31,683 | | | | 9,311 | | | | 1,795 | | | | 17,970 | | | | 5,351 | | | | 1,265 | | | | 952 | | | | 68,327 | |
Liabilities and equity | | | | | | | | | | | | | | | | | | | | | | | | | | | | | | | | |
Liabilities | | | | | | | | | | | | | | | | | | | | | | | | | | | | | | | | |
Amounts owed to credit institutions | | | | | | | | | | | | | | | | | | | | | | | | | | | | | | | | |
Short-term | | | 563 | | | | – | | | | – | | | | – | | | | – | | | | – | | | | – | | | | 563 | |
Long-term | | | 3 | | | | 14 | | | | – | | | | – | | | | – | | | | – | | | | – | | | | 17 | |
| | | | 566 | | | | 14 | | | | 0 | | | | 0 | | | | 0 | | | | 0 | | | | 0 | | | | 580 | |
Repurchase agreements | | | 100 | | | | – | | | | – | | | | – | | | | – | | | | – | | | | – | | | | 99 | |
Debts evidenced by certificates | | | 4,383 | | | | 462 | | | | 1,156 | | | | 13,221 | | | | 3,653 | | | | 753 | | | | 371 | | | | 24,000 | |
Other liabilities | | | | | | | | | | | | | | | | | | | | | | | | | | | | | | | | |
Derivatives | | | | | | | | | | | | | | | | | | | | | | | | | | | | | | | | |
Payables1 | | | 29,037 | | | | 5,235 | | | | 202 | | | | 3,036 | | | | 1,316 | | | | 849 | | | | 297 | | | | 39,971 | |
Other liabilities | | | – | | | | – | | | | – | | | | – | | | | – | | | | – | | | | 10 | | | | 10 | |
Accrued interest and fees payable | | | – | | | | – | | | | – | | | | – | | | | – | | | | – | | | | 210 | | | | 210 | |
Total liabilities | | | 34,086 | | | | 5,711 | | | | 1,358 | | | | 16,257 | | | | 4,968 | | | | 1,602 | | | | 888 | | | | 64,871 | |
| | | | | | | | |
Equity | | | – | | | | – | | | | – | | | | – | | | | – | | | | – | | | | 3,456 | | | | 3,456 | |
Total liabilities and equity | | | 34,086 | | | | 5,711 | | | | 1,358 | | | | 16,257 | | | | 4,968 | | | | 1,602 | | | | 4,344 | | | | 68,327 | |
| | | | | | | | | | | | | | | | | | | | | | | | | | | | | | | | | |
Net during the period | | | -2,402 | | | | 3,599 | | | | 437 | | | | 1,713 | | | | 382 | | | | -337 | | | | -3,392 | | | | 0 | |
Cumulative net during the period | | | -2,402 | | | | 1,197 | | | | 1,634 | | | | 3,347 | | | | 3,729 | | | | 3,392 | | | | 0 | | | | | |
Guarantee commitments | | | – | | | | – | | | | – | | | | – | | | | – | | | | – | | | | – | | | | – | |
1 Swaps are not netted.
77
2016
| | | | | | | | | | | | | | | | | | | | | | | | | | | | | | | | |
In millions of euro | | UP TO AND
INCLUDING
3 MONTHS | | | OVER 3 MONTHS
AND UP TO AND
INCLUDING 6 MONTHS | | | OVER 6 MONTHS
AND UP TO AND
INCLUDING 1 YEAR | | | OVER 1 YEAR
AND UP TO AND
INCLUDING 5 YEARS | | | OVER 5 YEARS
AND UP TO AND
INCLUDING 10 YEARS | | | OVER
10 YEARS | | | UNDEFINED | | | TOTAL | |
Assets | | | | | | | | | | | | | | | | | | | | | | | | | | | | | | | | |
Cash and cash equivalents | | | 4,456 | | | | – | | | | – | | | | – | | | | – | | | | – | | | | – | | | | 4,456 | |
Financial placements | | | | | | | | | | | | | | | | | | | | | | | | | | | | | | | | |
Placements with credit institutions | | | – | | | | – | | | | – | | | | – | | | | – | | | | – | | | | 9 | | | | 9 | |
Debt securities | | | 2,419 | | | | 350 | | | | 283 | | | | 3,007 | | | | 455 | | | | 35 | | | | 23 | | | | 6,572 | |
Other | | | 0 | | | | 0 | | | | 0 | | | | 0 | | | | 0 | | | | 0 | | | | 19 | | | | 19 | |
| | | | 2,419 | | | | 350 | | | | 283 | | | | 3,007 | | | | 455 | | | | 35 | | | | 51 | | | | 6,600 | |
Loans outstanding | | | 6,538 | | | | 6,817 | | | | 149 | | | | 1,518 | | | | 899 | | | | 483 | | | | 237 | | | | 16,640 | |
Intangible assets | | | – | | | | – | | | | – | | | | – | | | | – | | | | – | | | | 1 | | | | 1 | |
Tangible assets | | | – | | | | – | | | | – | | | | – | | | | – | | | | – | | | | 27 | | | | 27 | |
Other assets | | | | | | | | | | | | | | | | | | | | | | | | | | | | | | | | |
Derivatives | | | | | | | | | | | | | | | | | | | | | | | | | | | | | | | | |
Receivables 1 | | | 17,461 | | | | 3,206 | | | | 764 | | | | 13,336 | | | | 4,018 | | | | 616 | | | | 550 | | | | 39,952 | |
Other assets | | | – | | | | – | | | | – | | | | – | | | | – | | | | – | | | | 13 | | | | 13 | |
Accrued interest and fees receivable | | | – | | | | – | | | | – | | | | – | | | | – | | | | – | | | | 285 | | | | 285 | |
Total assets | | | 30,873 | | | | 10,373 | | | | 1,196 | | | | 17,861 | | | | 5,372 | | | | 1,133 | | | | 1,163 | | | | 67,973 | |
| | | | | | | | |
Liabilities and equity | | | | | | | | | | | | | | | | | | | | | | | | | | | | | | | | |
Liabilities | | | | | | | | | | | | | | | | | | | | | | | | | | | | | | | | |
Amounts owed to credit institutions | | | | | | | | | | | | | | | | | | | | | | | | | | | | | | | | |
Short-term | | | 1,311 | | | | – | | | | – | | | | – | | | | – | | | | – | | | | – | | | | 1,311 | |
Long-term | | | – | | | | 18 | | | | – | | | | – | | | | – | | | | – | | | | – | | | | 18 | |
| | | | 1,311 | | | | 18 | | | | 0 | | | | 0 | | | | 0 | | | | 0 | | | | 0 | | | | 1,329 | |
Repurchase agreements | | | – | | | | – | | | | – | | | | – | | | | – | | | | – | | | | – | | | | 0 | |
Debts evidenced by certificates | | | 4,128 | | | | 567 | | | | 766 | | | | 13,393 | | | | 3,993 | | | | 585 | | | | 477 | | | | 23,907 | |
Other liabilities | | | | | | | | | | | | | | | | | | | | | | | | | | | | | | | | |
Derivatives | | | | | | | | | | | | | | | | | | | | | | | | | | | | | | | | |
Payables 1 | | | 28,573 | | | | 5,788 | | | | 277 | | | | 2,319 | | | | 1,134 | | | | 794 | | | | 355 | | | | 39,239 | |
Other liabilities | | | – | | | | – | | | | – | | | | – | | | | – | | | | – | | | | 11 | | | | 11 | |
Accrued interest and fees payable | | | – | | | | – | | | | – | | | | – | | | | – | | | | – | | | | 211 | | | | 211 | |
Total liabilities | | | 34,012 | | | | 6,373 | | | | 1,042 | | | | 15,711 | | | | 5,127 | | | | 1,378 | | | | 1,055 | | | | 64,698 | |
| | | | | | | | |
Equity | | | – | | | | – | | | | – | | | | – | | | | – | | | | – | | | | 3,275 | | | | 3,275 | |
Total liabilities and equity | | | 34,012 | | | | 6,373 | | | | 1,042 | | | | 15,711 | | | | 5,127 | | | | 1,378 | | | | 4,330 | | | | 67,973 | |
| | | | | | | | | | | | | | | | | | | | | | | | | | | | | | | | | |
Net during the period | | | -3,139 | | | | 4,000 | | | | 154 | | | | 2,150 | | | | 246 | | | | -245 | | | | -3,167 | | | | | |
Cumulative net during the period | | | -3,139 | | | | 862 | | | | 1,016 | | | | 3,166 | | | | 3,412 | | | | 3,167 | | | | 0 | | | | | |
Guarantee commitments | | | – | | | | – | | | | – | | | | – | | | | – | | | | – | | | | – | | | | – | |
1 Swaps are not netted.
78
Note 22: Currency risk
NIB’s operations are mostly in euro and US dollars. The table below shows the net of assets and liabilities in the major currencies. See also Risk Management, Market Risk.
Net currency position as of 31 December 2017:
| | | | | | | | | | | | | | | | | | | | | | | | | | | | | | | | |
In millions of euro | | EUR | | | USD | | | SEK | | | NOK | | | DKK | | | OTHER
CURRENCIES | | | FAIR VALUE
ADJUSTMENTS
AND SWAP
NETTING | | | TOTAL | |
Assets | | | | | | | | | | | | | | | | | | | | | | | | | | | | | | | | |
Cash and cash equivalents | | | 3,638 | | | | 264 | | | | 0 | | | | 0 | | | | 833 | | | | 2 | | | | – | | | | 4,736 | |
Financial placements | | | | | | | | | | | | | | | | | | | | | | | | | | | | | | | | |
Placements with credit institutions | | | 9 | | | | – | | | | – | | | | – | | | | – | | | | – | | | | – | | | | 9 | |
Debt securities | | | 4,313 | | | | 1,018 | | | | 120 | | | | 225 | | | | 918 | | | | 0 | | | | – | | | | 6,595 | |
Other financial placements | | | 16 | | | | – | | | | – | | | | – | | | | – | | | | – | | | | – | | | | 16 | |
| | | | 4,338 | | | | 1,018 | | | | 120 | | | | 225 | | | | 918 | | | | 0 | | | | 0 | | | | 6,620 | |
Loans outstanding | | | 7,546 | | | | 2,318 | | | | 3,499 | | | | 2,681 | | | | 732 | | | | 276 | | | | 178 | | | | 17,232 | |
Intangible assets | | | 5 | | | | – | | | | – | | | | – | | | | – | | | | – | | | | – | | | | 5 | |
Tangible assets, property and equipment | | | 30 | | | | – | | | | – | | | | – | | | | – | | | | – | | | | – | | | | 30 | |
Other assets | | | | | | | | | | | | | | | | | | | | | | | | | | | | | | | | |
Derivatives | | | -8,584 | | | | 6,574 | | | | -2,179 | | | | -1,274 | | | | -2,490 | | | | 7,195 | | | | 1,786 | | | | 1,028 | |
Other assets | | | 3 | | | | 17 | | | | 0 | | | | 0 | | | | – | | | | 10 | | | | – | | | | 29 | |
| | | | -8,581 | | | | 6,591 | | | | -2,179 | | | | -1,274 | | | | -2,490 | | | | 7,204 | | | | 1,786 | | | | 1,057 | |
Accrued interest and fees receivable | | | 61 | | | | 69 | | | | 10 | | | | 20 | | | | 8 | | | | 99 | | | | 5 | | | | 272 | |
Total assets | | | 7,038 | | | | 10,260 | | | | 1,450 | | | | 1,654 | | | | 1 | | | | 7,582 | | | | 1,969 | | | | 29,953 | |
| | | | | | | | |
Liabilities and equity | | | | | | | | | | | | | | | | | | | | | | | | | | | | | | | | |
Liabilities | | | | | | | | | | | | | | | | | | | | | | | | | | | | | | | | |
Amounts owed to credit institutions | | | | | | | | | | | | | | | | | | | | | | | | | | | | | | | | |
Short-term amounts owed to credit institutions | | | 553 | | | | 0 | | | | – | | | | 0 | | | | – | | | | 10 | | | | – | | | | 563 | |
Long-term amounts owed to credit institutions | | | 17 | | | | – | | | | – | | | | – | | | | – | | | | – | | | | – | | | | 17 | |
| | | | 570 | | | | 0 | | | | 0 | | | | 0 | | | | 0 | | | | 10 | | | | 0 | | | | 580 | |
Repurchase agreement | | | 99 | | | | – | | | | – | | | | – | | | | – | | | | – | | | | – | | | | 99 | |
Debts evidenced by certificates | | | | | | | | | | | | | | | | | | | | | | | | | | | | | | | | |
Debt securities issued | | | 2,837 | | | | 10,186 | | | | 1,442 | | | | 1,636 | | | | – | | | | 7,471 | | | | 363 | | | | 23,934 | |
Other debt | | | 57 | | | | – | | | | – | | | | – | | | | – | | | | 0 | | | | 9 | | | | 66 | |
| | | | 2,894 | | | | 10,186 | | | | 1,442 | | | | 1,636 | | | | 0 | | | | 7,471 | | | | 371 | | | | 24,000 | |
Other liabilities | | | | | | | | | | | | | | | | | | | | | | | | | | | | | | | | |
Derivatives | | | – | | | | – | | | | – | | | | – | | | | – | | | | – | | | | 1,597 | | | | 1,597 | |
Other liabilities | | | 10 | | | | 0 | | | | 0 | | | | 0 | | | | – | | | | 0 | | | | – | | | | 10 | |
| | | | 10 | | | | 0 | | | | 0 | | | | 0 | | | | 0 | | | | 0 | | | | 1,597 | | | | 1,608 | |
Accrued interest and fees payable | | | 20 | | | | 64 | | | | 7 | | | | 17 | | | | -2 | | | | 99 | | | | 5 | | | | 210 | |
Total liabilities | | | 3,592 | | | | 10,250 | | | | 1,449 | | | | 1,653 | | | | -2 | | | | 7,580 | | | | 1,973 | | | | 26,497 | |
Equity | | | 3,248 | | | | 0 | | | | 0 | | | | 0 | | | | 0 | | | | 0 | | | | -3 | | | | 3,245 | |
Total liabilities and equity | | | 6,841 | | | | 10,250 | | | | 1,449 | | | | 1,653 | | | | -2 | | | | 7,580 | | | | 1,970 | | | | 29,742 | |
| | | | | | | | | | | | | | | | | | | | | | | | | | | | | | | | | |
Net of assets and liabilities as of 31 Dec 2017 | | | 197 | | | | 10 | | | | 1 | | | | 0 | | | | 3 | | | | 2 | | | | -2 | | | | 211 | |
79
Net currency position as of 31 December 2016:
| | | | | | | | | | | | | | | | | | | | | | | | | | | | | | | | |
In millions of euro | | EUR | | | USD | | | SEK | | | NOK | | | DKK | | | OTHER
CURRENCIES | | | FAIR VALUE
ADJUSTMENTS
AND SWAP
NETTING | | | TOTAL | |
Assets | | | | | | | | | | | | | | | | | | | | | | | | | | | | | | | | |
Cash and cash equivalents | | | 3,124 | | | | 463 | | | | 1 | | | | 1 | | | | 865 | | | | 2 | | | | – | | | | 4,456 | |
Financial placements | | | | | | | | | | | | | | | | | | | | | | | | | | | | | | | | |
Placements with credit institutions | | | 9 | | | | – | | | | – | | | | – | | | | – | | | | – | | | | – | | | | 9 | |
Debt securities | | | 4,351 | | | | 1,172 | | | | 187 | | | | 170 | | | | 691 | | | | – | | | | – | | | | 6,572 | |
Other financial placements | | | 19 | | | | – | | | | – | | | | – | | | | – | | | | – | | | | – | | | | 19 | |
| | | | 4,379 | | | | 1,172 | | | | 187 | | | | 170 | | | | 691 | | | | 0 | | | | 0 | | | | 6,600 | |
Loans outstanding | | | 7,557 | | | | 2,414 | | | | 2,927 | | | | 2,599 | | | | 649 | | | | 216 | | | | 278 | | | | 16,640 | |
Intangible assets | | | 1 | | | | – | | | | – | | | | – | | | | – | | | | – | | | | – | | | | 1 | |
Tangible assets, property and equipment | | | 27 | | | | – | | | | – | | | | – | | | | – | | | | – | | | | – | | | | 27 | |
Other assets | | | | | | | | | | | | | | | | | | | | | | | | | | | | | | | | |
Derivatives | | | -8,547 | | | | 7,243 | | | | -2,035 | | | | -1,194 | | | | -2,215 | | | | 7,288 | | | | 1,616 | | | | 2,157 | |
Other assets | | | 4 | | | | 9 | | | | – | | | | – | | | | – | | | | – | | | | – | | | | 13 | |
| | | | -8,544 | | | | 7,252 | | | | -2,035 | | | | -1,194 | | | | -2,215 | | | | 7,288 | | | | 1,616 | | | | 2,170 | |
Accrued interest and fees receivable | | | 68 | | | | 80 | | | | 7 | | | | 21 | | | | 7 | | | | 98 | | | | 4 | | | | 285 | |
Total assets | | | 6,611 | | | | 11,381 | | | | 1,088 | | | | 1,598 | | | | -4 | | | | 7,605 | | | | 1,898 | | | | 30,178 | |
| | | | | | | | |
Liabilities and equity | | | | | | | | | | | | | | | | | | | | | | | | | | | | | | | | |
Liabilities | | | | | | | | | | | | | | | | | | | | | | | | | | | | | | | | |
Amounts owed to credit institutions | | | | | | | | | | | | | | | | | | | | | | | | | | | | | | | | |
Short-term amounts owed to credit institutions | | | 1,036 | | | | 275 | | | | – | | | | – | | | | – | | | | – | | | | – | | | | 1,311 | |
Long-term amounts owed to credit institutions | | | 18 | | | | – | | | | – | | | | – | | | | – | | | | – | | | | – | | | | 18 | |
| | | | 1,054 | | | | 275 | | | | 0 | | | | 0 | | | | 0 | | | | 0 | | | | 0 | | | | 1,329 | |
Repurchase agreements | | | – | | | | – | | | | – | | | | – | | | | – | | | | – | | | | – | | | | – | |
Debts evidenced by certificates | | | | | | | | | | | | | | | | | | | | | | | | | | | | | | | | |
Debt securities issued | | | 2,165 | | | | 11,039 | | | | 1,083 | | | | 1,581 | | | | – | | | | 7,505 | | | | 452 | | | | 23,826 | |
Other debt | | | 57 | | | | – | | | | – | | | | – | | | | – | | | | – | | | | 25 | | | | 82 | |
| | | | 2,222 | | | | 11,039 | | | | 1,083 | | | | 1,581 | | | | 0 | | | | 7,505 | | | | 477 | | | | 23,907 | |
Other liabilities | | | | | | | | | | | | | | | | | | | | | | | | | | | | | | | | |
Derivatives | | | – | | | | – | | | | – | | | | – | | | | – | | | | – | | | | 1,444 | | | | 1,444 | |
Other liabilities | | | 11 | | | | – | | | | – | | | | – | | | | – | | | | – | | | | 0 | | | | 11 | |
| | | | 11 | | | | 0 | | | | 0 | | | | 0 | | | | 0 | | | | 0 | | | | 1,444 | | | | 1,456 | |
Accrued interest and fees payable | | | 19 | | | | 72 | | | | 4 | | | | 17 | | | | -3 | | | | 98 | | | | 4 | | | | 211 | |
Total liabilities | | | 3,306 | | | | 11,386 | | | | 1,087 | | | | 1,598 | | | | -3 | | | | 7,604 | | | | 1,925 | | | | 26,903 | |
Equity | | | 3,091 | | | | 0 | | | | 0 | | | | 0 | | | | 0 | | | | 0 | | | | -28 | | | | 3,063 | |
Total liabilities and equity | | | 6,397 | | | | 11,386 | | | | 1,087 | | | | 1,598 | | | | -3 | | | | 7,604 | | | | 1,897 | | | | 29,967 | |
| | | | | | | | | | | | | | | | | | | | | | | | | | | | | | | | | |
Net of assets and liabilities as of 31 Dec 2016 | | | 214 | | | | -5 | | | | 1 | | | | 0 | | | | -1 | | | | 2 | | | | 1 | | | | 212 | |
80
Note 23: Related party disclosures
Nordic Development Fund and Nordic Environment Finance Corporation
According to the constituent documents of Nordic Development Fund (NDF) and Nordic Environment Finance Corporation (NEFCO), their principal offices shall be located at the principal office of Nordic Investment Bank (NIB). Furthermore the Statutes of NDF and NEFCO set out that their Control Committee members appointed by the Nordic Council shall be the same persons as appointed by the Council to the Control Committee of NIB. In addition the Statutes of NDF and NEFCO set out that the powers vested in their respective Board of Directors may to the extent appropriate be delegated to the President of the respective organisation and /or to NIB.
The Bank provides administrative services to NDF and NEFCO the compensation of which is disclosed in Note 8. The following table shows the outstanding balance of amounts owed to NDF, NEFCO and the trust funds administered by them, and the interest paid during the year. The interest paid to these institutions is at normal commercial rates.
| | | | | | | | | | | | | | | | |
In thousands of euro | | INTEREST FROM
RELATED PARTIES | | | INTEREST TO
RELATED PARTIES | | | AMOUNTS OWED BY
RELATED PARTIES AS
OF 31 DEC | | | AMOUNTS OWED TO
RELATED PARTIES AS
OF 31 DEC | |
2017 | | | – | | | | -84 | | | | 38 | | | | 17,271 | |
2016 | | | – | | | | -60 | | | | 10 | | | | 18,045 | |
Rental income (NDF, NEFCO) | | | | | | | | | | | | | | | | |
| | | | | | | | |
In thousands of euro | | NDF | | | NEFCO | |
2017 | | | 146 | | | | 266 | |
2016 | | | 146 | | | | 267 | |
Key management personnel
The Bank has identified members of the Board of Directors, the Control Committee and the Executive Committee as key management personnel. There have been no transactions between the Bank and key management personnel. Information regarding the compensation of key management personnel for the relevant reporting periods can be found in Note 7.
81
Note 24: Cash flow statement
Specification of the change in cash and cash equivalents, net on 31 December:
| | | | | | | | |
| | |
In thousands of euro | | 2017 | | | 2016 | |
Cash and balances with banks 1 | | | 63,997 | | | | 107,049 | |
Short-term placements with credit institutions | | | 2,184,787 | | | | 1,122,663 | |
Collateralised placements 2 | | | 2,487,325 | | | | 3,226,148 | |
Cash and cash equivalents | | | 4,736,109 | | | | 4,455,860 | |
| | |
Short-term amounts owed to credit institutions 3 | | | -562,823 | | | | -1,310,873 | |
Repurchase agreements 4 | | | -99,490 | | | | – | |
Short-term debt | | | – | | | | – | |
Cash and cash equivalents, net | | | 4,073,797 | | | | 3,144,987 | |
| | |
Change in cash and cash equivalents, net | | | 928,810 | | | | 2,114,639 | |
1 Including an initial margin requirement of EUR 344 (295) thousand for futures on 31 December
2 Net exposure after collaterals for collateralised placements EUR 5,806 (6,138) thousand
3 Of which cash received as collateral EUR 552,668 (1,310,597) thousand
4 Net exposure after collaterals for repurchase agreements EUR 3,662 (-) thousand
82
Note 25: Exchange rates
| | | | | | | | |
| | |
| | | EURO EXCHANGE RATE
AT 31 DECEMBER 2017 | | | EURO EXCHANGE RATE
AT 31 DECEMBER 2016 | |
DKK Danish krone | | | 7.4449 | | | | 7.4344 | |
ISK Icelandic króna 1 | | | 124.7 | | | | 118.8 | |
NOK Norwegian krone | | | 9.8403 | | | | 9.0863 | |
SEK Swedish krona | | | 9.8438 | | | | 9.5525 | |
ARS Argentine peso 2 | | | 22.54242 | | | | 16.72175 | |
AUD Australian dollar | | | 1.5346 | | | | 1.4596 | |
BRL Brazilian real | | | 3.9729 | | | | 3.4305 | |
CAD Canadian dollar | | | 1.5039 | | | | 1.4188 | |
CHF Swiss franc | | | 1.1702 | | | | 1.0739 | |
CZK Czech koruna | | | 25.535 | | | | 27.021 | |
GBP Pound sterling | | | 0.88723 | | | | 0.85618 | |
HKD Hong Kong dollar | | | 9.372 | | | | 8.1751 | |
INR Indian rupee | | | 76.6055 | | | | 71.5935 | |
JPY Japanese yen | | | 135.01 | | | | 123.4 | |
MXN Mexican peso | | | 23.6612 | | | | 21.7719 | |
NZD New Zealand dollar | | | 1.685 | | | | 1.5158 | |
PLN Polish zloty | | | 4.177 | | | | 4.4103 | |
RUB Russian rouble | | | 69.392 | | | | 64.3 | |
SDR Special drawing right 3 | | | 0.84213 | | | | 0.78411 | |
SGD Singapore dollar | | | 1.6024 | | | | 1.5234 | |
TRY Turkish lira | | | 4.5464 | | | | 3.7072 | |
TWD New Taiwan dollar 2 | | | 35.532 | | | | 34.1662 | |
USD US dollar | | | 1.1993 | | | | 1.0541 | |
ZAR South African rand | | | 14.8054 | | | | 14.457 | |
1 Reuters closing.
2 The exchange rate is calculated using the year-end market rate for USD/relevant currency, which then provides the EUR/relevant currency rate.
3 IMF (International Monetary Fund) closing per 31 December 2017 and per 31 December 2016.
83
Note 26: Post balance sheet events
There have been no material post balance sheet events that would require disclosure or adjustment to these financial statements.
84
Proposal by the Board of Directors to the Board of Governors
The Board of Directors’ proposal with regard to the financial results for the year 2017 takes into account the need to maintain the Bank’s ratio of equity to total risk-weighted assets at a secure level, which is a prerequisite for maintaining the Bank’s high creditworthiness.
In accordance with section 11 of the Statutes of the Bank, the profit for 2017 of EUR 210,981,104.10 is to be allocated as follows:
– EUR 155,981,104.10 will be transferred to the General Credit Risk Fund as a part of equity; and
– EUR 55,000,000.00 will be made available for distribution as dividends to the Bank’s member countries.
More information can be found in the statement of comprehensive income, the statement of financial position, the changes in equity and cash flow statement, as well as the notes to the financial statements.
| | | | |
Helsinki, 8 March 2018 |
Kaspars Āboliņš (Chairman) |
Julie Sonne | | Madis Üürike | | Pekka Morén |
Esther Finnbogadóttir | | Sven Hegelund (Deputy Chairman) | | Jurgita Uzielienė |
Sindre Weme on behalf of Silje Gamstøbakk | | | | |
| | | | |
| Henrik Normann (President & CEO) |
85
Auditor’s Report
Independent Auditor’s Report
To the Control Committee of the Nordic Investment Bank
Independent Auditor’s Report on the Financial Statements
Opinion
In our capacity as auditors appointed by the Control Committee of the Nordic Investment Bank we have audited the financial statements of Nordic Investment Bank for the year ended 31 December, 2017. The financial statements comprise the statement of financial position, statement of comprehensive income, statement of changes in equity, cash flow statement and notes, including a summary of significant accounting policies.
In our opinion the financial statements give a true and fair view of the Nordic Investment Bank’s financial position as at December 31, 2017 and of its financial performance and its cash flows for the year ended in accordance with International Financial Reporting Standards (IFRS).
Basis for Opinion
We conducted our audit in accordance with International Standards on Auditing. Our responsibilities under those standards are further described in the Auditor’s Responsibilities for the Audit of Financial Statements section of our report.
We are independent of the Bank in accordance with the International Ethics Standards Board of Accountants’ Code of Ethics for Professional Accountants (IESBA Code) together with the ethical requirements that are relevant to our audit of the financial statements, and we have fulfilled our other ethical responsibilities in accordance with these requirements and the IESBA code.
We believe that the audit evidence we have obtained is sufficient and appropriate to provide a basis for our opinion.
Materiality
The scope of our audit was influenced by our application of materiality. The materiality is determined based on our professional judgement and is used to determine the nature, timing and extent of our audit procedures and to evaluate the effect of identified misstatements on the financial statements as a whole. The level of materiality we set is based on our assessment of the magnitude of misstatements that, individually or in aggregate, could reasonably be expected to have influence on the economic decisions of the users of the financial statements. We have also taken into account misstatements and/or possible misstatements that in our opinion are material for qualitative reasons for the users of the financial statements.
Key Audit Matters
Key audit matters are those matters that, in our professional judgment, were of most significance in our audit of the financial statements of the current period. These matters were addressed in the context of our audit of the financial statements as a whole, and in forming our opinion thereon, and we do not provide a separate opinion on these matters.
We have also addressed the risk of management override of internal controls. This includes consideration of whether there was evidence of management bias that represented a risk of material misstatement due to fraud.
86
| | |
| THE KEY AUDIT MATTER | | HOW THE MATTER WAS ADDRESSED IN THE AUDIT |
Valuation of financial placements and derivatives (Refer to Summary of significant Accounting policies: Determination of fair value, Financial placements, Derivative instruments and hedge accounting and to the notes 10, 14, 16 and 19 to the financial statements)
| • | Due to the business model in use by NIB, assets classified as financial placements account for a substantial part of the balance sheet. NIB also has substantial positions in derivative financial assets and financial liabilities due to its policy to hedge interest rate and currency risk. |
| • | The valuation of these items has a significant impact on the Statement of Comprehensive Income so they have been identified as a key audit area. |
Our audit procedures over financial placements included, among others,
| • | Assessment and testing of the design and operating effectiveness of the controls over valuations. |
| • | Valuation testing by comparing values in accounting to independently obtained market prices. |
| • | Assessing the valuation of Other debt securities held at amortised cost for indications of impairment. |
| • | Confirming existence of these items at year end by obtaining external confirmations. |
Our audit procedures over derivative financial assets and financial liabilities included, among others,
| • | Assessing the appropriateness of the calculation models used. |
| • | Challenging the assumptions used by comparing to market information. |
| • | Identifying controls over the calculation process and assessing their effectiveness. |
| • | Testing the valuation of the derivatives on a spot check basis by using market data obtained from an external provider of market information. |
| • | We also read and assessed the disclosures made in the financial statements for valuation adjustments. |
Hedge accounting (Refer to Summary of significant accounting polices: Derivative instruments and hedge accounting and note 19 to the financial statements)
| • | NIB uses hedge accounting to reduce the accounting mismatch in the reporting between the accounting of financial assets, financial liabilities and the accounting of related derivative contracts hedging inherent market risks of borrowing and lending activities. |
| • | Due to the complexity of the accounting requirements for hedge accounting, the change in NIB’s hedge accounting process and the effect on the line items in the Statement of Comprehensive Income, the correct application of hedge accounting has been considered a key audit area. |
Our procedures included, among others,
| • | Assessing the internal control procedures relating to inclusion of derivatives in a hedge accounting relationship and the effectiveness tests. |
| • | Assessing the accounting treatment of the hedging relationships for compliance with the relevant accounting standard by assistance of our financial instruments accounting specialists. |
| • | Assessing the hedge effectiveness testing which is prepared by NIB. |
| • | We also read and assessed the disclosures made in the financial statements for hedge accounting. |
87
| | |
| THE KEY AUDIT MATTER | | HOW THE MATTER WAS ADDRESSED IN THE AUDIT |
Impairment of loans (Refer to Summary of significant accounting polices: Impairment of loans and receivable and notes 9 and 11 to the financial statements.)
| • | Management judgement is required to determine the amount and timing of loan impairment provisions. |
| • | Due to the substantial size of loans outstanding on the balance sheet and the significance of the judgement applied, impairment of loans has been identified as a key audit area. |
Our procedures included, among others,
| • | Gaining an understanding of the impairment process and identifying and testing the key controls in place. |
| • | Inspecting the minutes of the key governance meetings including Credit Committee and Board to ensure that there are governance controls in place. |
| • | Evaluating the borrowers where increased credit risk has occurred and assessing the level of collective impairment booked. For significant provisions made, we understood and challenged the provisioning methodologies and underlying assumption used by comparing to our own expectations based on our knowledge of the macroeconomic environment and the borrowers. |
| • | Comparing realised credit losses to the impairments booked to assess the reasonableness of impairment provisions. |
| • | We also read and assessed the disclosures made in the financial statements concerning application of IFRS 9 -impairments, applicable on or after 1 January 2018. |
Responsibilities of the Board of Directors and the President for the Financial Statements
The Board of Directors and the President are responsible for the preparation and fair presentation of financial statements in accordance with International Financial Reporting Standards (IFRS), and for such internal control as they determine is necessary to enable the preparation of financial statements that are free from material misstatement, whether due to fraud or error.
In preparing the financial statements, the Board of Directors and the President are responsible for assessing the Bank’s ability to continue as going concern, disclosing, as applicable, matters relating to going concern and using the going concern basis of accounting unless there is an intention to liquidate the Bank or to cease operations, or there is no realistic alternative but to do so.
Those charged with governance are responsible for overseeing the Bank’s financial reporting process.
Auditor’s Responsibilities for the Audit of the Financial Statements
Our objectives are to obtain reasonable assurance on whether the financial statements as a whole are free from material misstatement, whether due to fraud or error, and to issue an auditor’s report that includes our opinion. Reasonable assurance is a high level of assurance, but is not a guarantee that an audit conducted in accordance with ISAs will always detect a material misstatement when it exists. Misstatements can arise from fraud or error and are considered material if, individually or in aggregate, they could reasonably be expected to influence the economic decisions of users taken on the basis of the financial statements.
As part of an audit in accordance with ISAs, we exercise professional judgment and maintain professional scepticism throughout the audit. We also:
| ● | Identify and assess the risks of material misstatement of the financial statements, whether due to fraud or error, design and perform audit procedures responsive to those risks, and obtain audit evidence that is sufficient and appropriate to provide a basis for our opinion. The risk of not detecting a material misstatement resulting from fraud is higher than for one resulting from error, as fraud may involve collusion, forgery, intentional omissions, misrepresentations, or the override of internal control. |
| ● | Obtain an understanding of internal control relevant to the audit in order to design audit procedures that are appropriate in the circumstances, but not for the purpose of expressing an opinion on the effectiveness of the Bank’s internal control. |
| ● | Evaluate the appropriateness of accounting policies used and the reasonableness of accounting estimates and related disclosures made by management. |
| ● | Conclude on the appropriateness of the Board of Directors’ and the President’s use of the going concern basis of accounting and based on the audit evidence obtained, whether a material uncertainty exists related to events or conditions that may cast significant doubt on the Bank’s ability to continue as a going concern. If we conclude that a material uncertainty exists, we are required to draw attention in our auditor’s report to the related disclosures in the financial statements or, if such disclosures are inadequate, to modify our opinion. Our conclusions are based on the audit evidence obtained up to the date of our auditor’s report. However, future events or conditions may cause the Bank to cease to continue as a going concern. |
| ● | Evaluate the overall presentation, structure and content of the financial statements, including the disclosures, and whether the financial statements represent the underlying transactions and events so that the financial statements give a true and fair view. |
88
We communicate with those charged with governance regarding, among other matters, the planned scope and timing of the audit and significant audit findings, including any significant deficiencies in internal control that we identify during our audit.
We also provide those charged with governance with a statement that we have complied with relevant ethical requirements regarding independence, and communicate with them all relationships and other matters that may reasonably be thought to bear on our independence, and where applicable, related safeguards.
From the matters communicated with those charged with governance, we determine those matters that were of most significance in the audit of the financial statements of the current period and are therefore the key audit matters. We describe these matters in our auditor’s report unless law or regulation precludes public disclosure about the matter or when, in extremely rare circumstances, we determine that a matter should not be communicated in our report because the adverse consequences of doing so would reasonably be expected to outweigh the public interest benefits of such communication.
Other Reporting Requirements
Information in relation to the Audit Engagement
Auditors representing KPMG have been appointed auditors by the Control Committee since the financial year 2008. The undersigned auditors have acted as responsible auditors since the financial year 2016.
Other Information
The Board of Directors and the President are responsible for the other information. The other information comprises information included in the report of the Board of Directors, in the Operating and financial review and in the Annual Report, but does not include the financial statements and our report thereon. We obtained the report of the Board of Directors and the Operating and financial review prior to the date of the auditor’s report, and the Annual Report is expected to be made available to us after that date.
Our opinion on the financial statements does not cover the other information.
In connection with our audit of the financial statements, our responsibility is to read the other information identified above and, in doing so, consider whether the other information is materially inconsistent with the financial statements or our knowledge obtained in the audit, or otherwise appears to be materially misstated.
In our opinion, the information in the report of the Board of Directors and in the Operating and financial review is consistent with the information in the information in the financial statements.
If, based on the work we have performed on the report of the Board of Directors and on the Operating and financial review, we conclude that there is a material misstatement of this other information, we are required to report this fact. We have nothing to report in this regard.
Report on the other requirements
In accordance with the Terms of Engagement our audit also included a review of whether the Board of Directors’ and the President’s administration have complied with the Statutes of the Bank. It is our opinion that the administration of the Board of Directors and the President complied with the Statutes of the Bank.
| | |
Helsinki 9 March, 2018 | | |
| |
Marcus Tötterman | | Anders Tagde |
Authorized Public Accountant, KHT | | Authorized Public Accountant |
| |
KPMG Oy Ab | | KPMG AB |
Töölönlahdenkatu 3A | | Vasagatan 16 |
00100 Helsinki | | 111 20 Stockholm |
Finland | | Sweden |
89
Statement by the Control Committee
Statement by the Control Committee of the Nordic Investment Bank on the audit of the administration and accounts of the bank
To the Board of Governors of the Nordic Investment Bank
In accordance with section 17 of the Statutes of the Nordic Investment Bank, we have been appointed to ensure that the operations of the Bank are conducted in accordance with its Statutes and to bear responsibility for the audit of the Bank and annually deliver an auditors’ report to the Board of Governors. Having completed our assignment for the year 2017, we hereby submit the following report.
The Control Committee met during the fiscal year as well as after the Bank’s Financial Statements had been prepared, and the Committee performed the control and examination measures considered necessary. The Annual Report of the Bank was examined at a meeting in Helsinki on 9 March 2018. In carrying out its tasks, the Control Committee received such information and carried out such examination measures as it deemed necessary to assess the Bank’s position in regard to its risks. We have also received the Independent Auditors’ Report, submitted on 9 March 2018 by the authorised public accountants appointed by the Control Committee.
Based on the audit, carried out by the independent auditors, we consider that:
The Bank’s operations during the financial year have been conducted in accordance with the Statutes;
The Board of Directors and the President have complied with the Statutes of the Bank; and that
The Financial Statements give a true and fair view of the financial position of the Bank as at 31 December 2017 and of its results and financing in 2017. The Statement of Comprehensive Income shows a profit of EUR 210,981,104.10 for the financial period.
We recommend to the Board of Governors that:
The allocation of the Bank’s profit for the financial period, as proposed by the Board of Directors, be approved; The Statement of Comprehensive Income and the Statement of Financial Position be adopted; and
The Board of Directors and the President be discharged from liability for the administration of the Bank’s operations during the accounting period examined by us.
| | | | |
Helsinki, 9 March 2018 |
Sigurður Þórðarson (Chairman) |
| Rasa Kavolytė (Deputy Chairman) | | Sjúrður Skaale | | Remo Holsmer |
| | |
| Sigita Ščajevienė | | Vilhjálmur Árnason | | Karina Ploka |
| | |
| Arto Pirttilahti | | Michael Tetzschner | | Staffan Danielsson |
90