Exhibit VIII
Interim Management Statement
January–April 2018
(Unaudited)
| | |
| Nordic Investment Bank | | Interim Management Statement January–April 2018 |
Table of Contents
| | | | |
Highlights | | | 3 | |
| |
Key figures and ratios | | | 3 | |
| |
President and CEO’s comments | | | 4 | |
| |
Operating and financial review | | | | |
Comprehensive income | | | 5 | |
Financial position | | | 6 | |
| |
Financial statements | | | | |
| |
Statement of comprehensive income | | | 10 | |
Statement of financial position | | | 11 | |
Statement of changes in equity | | | 12 | |
Cash flow statement | | | 13 | |
Notes to the interim management statement | | | 14 | |
Note 1 - Net interest income | | | 14 | |
Note 2 - Net profit on financial operations | | | 14 | |
Note 3 - Adoption of IFRS 9—expected credit loss | | | 14 | |
Note 4 - Basis of preparation | | | 16 | |
| |
Ratio definitions | | | 16 | |
2 (16)
| | |
| Nordic Investment Bank | | Interim Management Statement January–April 2018 |
Highlights
In the first four months of the year, demand for long-term financing from member country corporate borrowers has been the main driver of disbursements. The Bank also had continued demand for long-term financing from the municipal sector and from financial intermediaries to support SMEs. The flow of deals in the Bank’s lending continued to be at a high level, with a total of EUR 1,104 million in new loans agreed and EUR 1,376 million in loans disbursed.
Key figures and ratios
| | | | | | | | | | | | |
(in EUR million unless otherwise specified) | | Apr 2018* | | | Apr 2017* | | | Dec 2017 | |
Net interest income | | | 74 | | | | 80 | | | | 238 | |
Profit before net loan losses | | | 68 | | | | 103 | | | | 216 | |
Net profit | | | 68 | | | | 110 | | | | 211 | |
Loans disbursed | | | 1,376 | | | | 781 | | | | 3,147 | |
Loans agreed | | | 1,104 | | | | 610 | | | | 3,812 | |
Mandate fulfilment ** | | | 83 | % | | | 91 | % | | | 97 | % |
Loans outstanding | | | 17,737 | | | | 16,681 | | | | 17,232 | |
Total assets | | | 30,109 | | | | 28,824 | | | | 29,953 | |
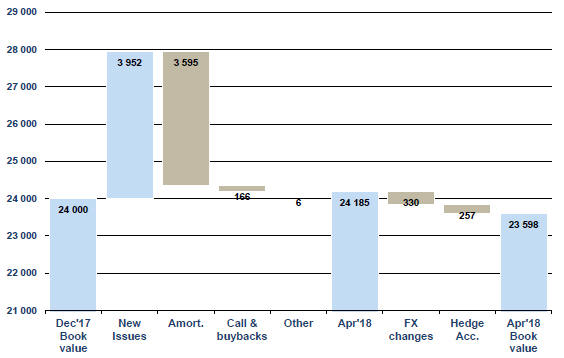
New debt issues | | | 3,952 | | | | 2,543 | | | | 5,943 | |
Debts evidenced by certificates | | | 23,598 | | | | 22,926 | | | | 24,000 | |
Total equity | | | 3,525 | | | | 3,398 | | | | 3,456 | |
Equity/total assets *** | | | 11.7 | % | | | 11.8 | % | | | 11.5 | % |
Profit/average equity *** | | | 5.8 | % | | | 9.9 | % | | | 6.2 | % |
Cost/income *** | | | 17.1 | % | | | 14.2 | % | | | 17.2 | % |
Number of employees (average during the year) | | | 195 | | | | 192 | | | | 193 | |
| * | Unaudited figures, to be read in conjunction with NIB’s 2017 audited financial statements. |
| ** | See page 7 for mandate fulfilment explanation |
| *** | See page 16 for ratio definitions |
3 (16)
| | |
| Nordic Investment Bank | | Interim Management Statement January–April 2018 |
Comments on NIB’s financial figures for January–April 2018
By providing long-term loans to its customers, NIB has a lasting impact on the productivity and environment of the Nordic and Baltic countries. Demand for long-term financing from NIB increased with loans disbursed totalling EUR 1,376 million (January–April 2017: EUR 781 million). Loans disbursed by the Bank add value and complement commercial bank lending to help ensure sustainable growth.
One main driver for the increase has been larger investment needs in the private sector. After a few years of subdued investments in the private sector, demand started to pick up last year, and that trend has continued into 2018. In the private sector, NIB has disbursed loans to finance large corporate investments in member countries in new production capacity and R&D. NIB has also disbursed loans to financial intermediates for on-lending to SMEs. The other main driver of increased demand is the need to update public infrastructure. Proceeds have been used to upgrade and replace public transportation and road infrastructure, water supply and wastewater treatment, and energy generation and distribution, as well as to upgrade and construct public buildings, such as schools and hospitals.
NIB reviews all projects it finances and scores them for productivity gains and environmental benefits in the Nordic–Baltic countries. Only projects that contribute sufficiently to sustainable development qualify for financing by NIB. About 83% of all projects financed this year have been assessed as having a significant positive impact on the productivity and/or environment of the region.
The profit for the period amounted to EUR 68 million, a decrease of EUR 42 million compared to last year (EUR 110 million). The main reason for the lower profit was lower unrealised valuation gains on financial operations. Unrealised gains on financial operations amounted to EUR 2 million in the first four months of this year compared to a gain of EUR 35 million in the corresponding period last year.
During the first four months, the Bank carried out 38 new funding transactions and raised EUR 4.0 billion (January–April 2017: EUR 2.5 billion). The Bank expects to fund between EUR 5.5 billion and EUR 6.5 billion for the full year.
Given the good loan pipeline, the flows of deals and new disbursements are expected to continue at the same pace for the rest of the year.
Henrik Normann
President & CEO
4 (16)
| | |
| Nordic Investment Bank | | Interim Management Statement January–April 2018 |
Operating and financial review
January–April 2018 compared to January–April 2017
Comprehensive Income
Net Profit
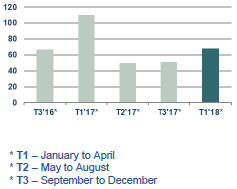
The net profit for the period January–April 2018 totalled EUR 67.8 million, down from EUR 110.3 million in the same period last year. Total operating income decreased from EUR 120.2 million in 2017 to EUR 82.1 million. Total operating expenses decreased by EUR 3.0 million to EUR 14.0 million, resulting in profit before net loan losses decreasing to EUR 68.1 million (January–April 2017: EUR 103.2 million).
Net profit decreased by EUR 42.5 million compared to the same period in 2017, mainly due to a decrease in net interest income of EUR 5.8 million, a decrease in unrealised gains from financial operations of EUR 33.3 million, and reversals of loan loss provisions in 2017 resulting in a net gain of EUR 7.1 million.
Net interest income
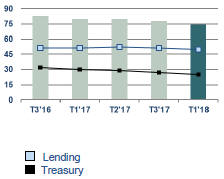
Net interest income for the period amounted to EUR 74.5 million (January–April 2017: EUR 80.2 million). Despite the increased volume of loans outstanding compared to 2017, net interest income on lending activities decreased from EUR 50.5 million to EUR 49.7 million. Interest income on treasury activities also decreased, from EUR 29.7 million to EUR 24.8 million due to the low yield environment.
Net commission income and fees
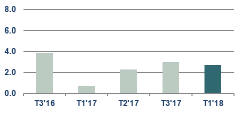
Net fee and commission income for the period January–April 2018 was EUR 2.7 million, compared to EUR 0.7 million in 2017, mainly as a result of increased number of loans agreed and disbursed.
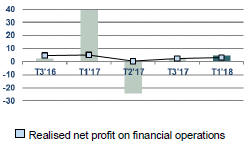
Net profit on financial operations
The net profit on financial operations for the period January–April 2018 totalled EUR 5.0 million, which was EUR 34.4 million lower than the same period in 2017. The result comprises realised profit of EUR 3.1 million and unrealised profit of EUR 1.9 million. The unrealised profit in 2017 was driven by positive valuation effects from spread tightening as well as hedge accounting valuations; however, as expected, these unrealised gains reversed due to market conditions and when the underlying transactions reached maturity.
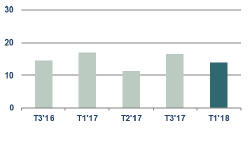
Total operating expenses
Total operating expenses were EUR 3.0 million lower than in 2017. The Bank continues to focus on costs to ensure an efficient ratio of operating cost to income.
Net loan losses
The total provision for loan losses at period end amounted to EUR 141.7 million, which is similar to the position on 1 January 2018. The adoption of IFRS 9, discussed later in this report increased the provision by EUR 2.9 million. This provision also covers treasury assets held at amortised cost, the movement of which had an insignificant effect on net profit. There were no new individual assessed impairments during the period.
| | | | |
Tertial net profit EUR m | | Tertial net Interest Income EUR m | | Tertial net commission Income and fees EUR m |
| | 
| | 
|
5 (16)
| | |
| Nordic Investment Bank | | Interim Management Statement January–April 2018 |
Other comprehensive income
The Bank separates the foreign currency basis spread from financial instruments used in fair value hedging, and this separated amount is recorded in “Other comprehensive income” (OCI). The valuation of foreign currency basis spread will be zero upon maturity, and therefore, the amount recorded in OCI will not be reclassified in the income statement.
OCI related to cross currency basis spread amounted to EUR 4.1 million for the period (January–April 2017: EUR 12.4 million). The resulting total comprehensive income for the period amounted to EUR 72.0 million, compared to EUR 122.7 million in 2017.
| | | | |
Tertial net profit on financial operations EUR m | | Tertial total operating expenses EUR m | | Tertial net loan losses EUR m |
| |  | | 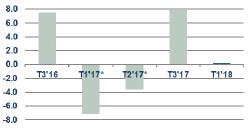 |
| * | The net loan loss gains for the periods ended 30 April 2017 and 31 August 2017 are mainly due to loan impairment reversals. |
Financial position
| | | | | | | | | | | | |
(in EUR million) | | Apr 2018* | | | Apr 2017* | | | Dec 2017 | |
Cash and cash equivalents | | | 4,439 | | | | 3,686 | | | | 4,736 | |
Financial placements | | | 6,694 | | | | 6,538 | | | | 6,620 | |
Loans outstanding | | | 17,737 | | | | 16,681 | | | | 17,232 | |
Derivatives | | | 929 | | | | 1,636 | | | | 1,028 | |
Other assets | | | 310 | | | | 283 | | | | 337 | |
| | | | | | | | | | | | |
Total assets | | | 30,109 | | | | 28,824 | | | | 29,953 | |
| | | |
Equity | | | 3,525 | | | | 3,398 | | | | 3,456 | |
Owed to credit institutions | | | 396 | | | | 1,007 | | | | 580 | |
Repurchase agreements | | | 255 | | | | — | | | | 99 | |
Debts evidenced by certificates | | | 23,598 | | | | 22,926 | | | | 24,000 | |
Derivatives | | | 1,655 | | | | 1,322 | | | | 1,597 | |
Other liabilities | | | 679 | | | | 171 | | | | 221 | |
| | | | | | | | | | | | |
Total liabilities and equity | | | 30,109 | | | | 28,824 | | | | 29,953 | |
| | | | | | | | | | | | |
| * | Unaudited figures, to be read in conjunction with NIB’s 2017 audited financial statements. |
Loans outstanding
Total loans outstanding amounted to EUR 17,737 million, which is EUR 1,056 million higher than on 30 April 2017. Demand for NIB’s long-term financing remains strong, and total loans disbursed in the period amounted to EUR 1,376 million, which is EUR 595 million more than for the same period in 2017.
6 (16)
| | |
| Nordic Investment Bank | | Interim Management Statement January–April 2018 |
Development of loans outstanding during 2018
(in EUR million)
EUR m
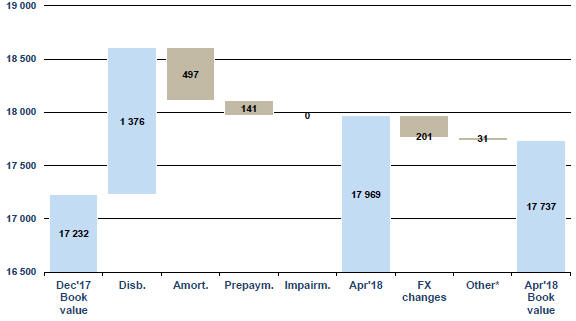
| * | Fair valuation of lending green bonds and hedge accounting. |
Total loans outstanding, excluding exchange rate and valuation effects, increased from EUR 17,232 million to EUR 17,969 million. The book value amounted to EUR 17,737 million due to foreign exchange, valuation of lending green bonds and hedge accounting effects of EUR 201 million and EUR 31 million, respectively.
Lending highlights
| | | | | | | | | | | | | | | | |
(in EUR million, unless otherwise specified) | | Apr 2018* | | | 2017 | | | 2016 | | | 2015 | |
Loans agreed according to business area: | | | 1,104 | | | | 3,812 | | | | 4,363 | | | | 2,830 | |
- Energy and environment | | | 63 | | | | 562 | | | | 1,534 | | | | 710 | |
- Infrastructure , transportation and telecom | | | 260 | | | | 1,620 | | | | 1,198 | | | | 823 | |
- Industries and services | | | 552 | | | | 972 | | | | 912 | | | | 996 | |
- Financial institutions and SMEs | | | 229 | | | | 658 | | | | 720 | | | | 301 | |
| | | | | | | | | | | | | | | | |
Number of loan agreements | | | 14 | | | | 64 | | | | 66 | | | | 45 | |
| | | | | | | | | | | | | | | | |
Loans disbursed, total | | | 1,376 | | | | 3,147 | | | | 3,373 | | | | 2,716 | |
| | | | | | | | | | | | | | | | |
Repayments / prepayments | | | 638 | | | | 1,832 | | | | 2,465 | | | | 2,351 | |
| | | | | | | | | | | | | | | | |
Loans outstanding and guarantees | | | 17,737 | | | | 17,232 | | | | 16,640 | | | | 15,627 | |
- Member countries | | | 16,472 | | | | 15,867 | | | | 14,831 | | | | 13,347 | |
- Non-member countries | | | 1,404 | | | | 1,504 | | | | 1,948 | | | | 2,396 | |
- Impairment provision | | | -139 | | | | -139 | | | | -139 | | | | -116 | |
| * | Unaudited figures, to be read in conjunction with NIB’s 2017 audited financial statements. |
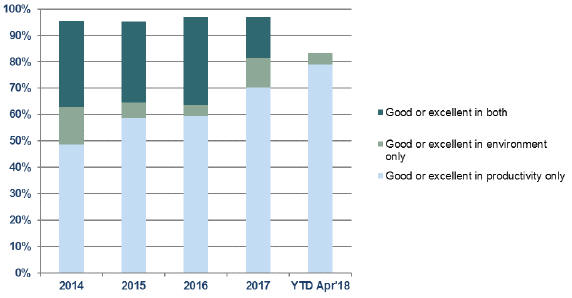
Mission fulfilment
Projects financed by the Bank through loans are expected to contribute to the Bank’s mission of improving productivity and the environment in the Nordic–Baltic countries. Before approval is given in each individual case, all eligible projects are scrutinised and rated against the criteria developed based on the Bank’s mission. In the four-month period that ended on 30 April 2018, loans achieving a “good” or “excellent” mandate rating accounted for 83% of the total amount of loans agreed.
7 (16)
| | |
| Nordic Investment Bank | | Interim Management Statement January–April 2018 |
Mandate rating for agreed loans
(Excluding lending green bond purchases)
Funding
The Bank expects to raise between EUR 5.5 billion and EUR 6.5 billion of new funding during 2018. The strategy for 2018 is to complete two or three benchmark transactions in US dollars and euros, complemented by other public and private issues to maintain a diversified portfolio of currencies and a global investor base. In addition, NIB’s aim is to continue issuing NIB Environmental Bonds.
During the period, NIB raised EUR 4.0 billion (January–April 2017: EUR 2.5 billion) in new funding through 38 new issues. The Bank’s first global benchmark of the year was issued on 23 January. The three-year, USD 1 billion issue pays a semi-annual coupon of 2.25%.
On 24 April, the Bank brought to the market its first environmental bond of the year, a new, 7.5-year, EUR 500 million transaction. The issue pays a coupon of 0.500%.
During the period, NIB issued a new GBP 500 million bond with maturity in 2023, a new five-year NZD 400 million bond, which was increased by NZD 375 million to total NZD 775 million and an AUD 50 million transaction with maturity in 2028.
In addition, a two-year USD 500 million transaction was issued. The Bank also increased an outstanding bond with maturity in 2023 by further NOK 1,750 million, taking the new total to NOK 3.0 billion. Various private placements in BRL, EUR, HKD, INR, MXN, NOK, SEK, TRY and USD were also issued.
8 (16)
| | |
| Nordic Investment Bank | | Interim Management Statement January–April 2018 |
Debt development during 2018
in EUR millions
9 (16)
| | |
| Nordic Investment Bank | | Interim Management Statement January–April 2018 |
Statement of comprehensive income
| | | | | | | | | | | | |
EUR 1,000 | | Jan-Apr 2018* | | | Jan-Apr 2017* | | | Jan-Dec 2017 | |
Interest income | | | 96,725 | �� | | | 100,254 | | | | 300,116 | |
Interest expense | | | -22,256 | | | | -20,017 | | | | -61,793 | |
| | | | | | | | | | | | |
Net interest income | | | 74,469 | | | | 80,237 | | | | 238,323 | |
| | | |
Commission income and fees received | | | 3,976 | | | | 1,980 | | | | 8,536 | |
Commission expense and fees paid | | | -1,277 | | | | -1,269 | | | | -2,574 | |
| | | | | | | | | | | | |
Net fee and commission income | | | 2,698 | | | | 711 | | | | 5,963 | |
| | | |
Net profit/loss on financial operations | | | 4,969 | | | | 39,417 | | | | 17,563 | |
Foreign exchange gains and losses | | | -44 | | | | -126 | | | | -616 | |
| | | | | | | | | | | | |
Total operating income | | | 82,092 | | | | 120,238 | | | | 261,233 | |
| | | |
Expenses | | | | | | | | | | | | |
General administrative expenses | | | | | | | | | | | | |
Personnel expenses | | | -9,948 | | | | -11,454 | | | | -30,774 | |
Other administrative expenses | | | -3,493 | | | | -4,959 | | | | -12,424 | |
Depreciation | | | -602 | | | | -625 | | | | -1,675 | |
| | | | | | | | | | | | |
Total operating expenses | | | -14,043 | | | | -17,037 | | | | -44,873 | |
| | | | | | | | | | | | |
Profit before loan losses | | | 68,050 | | | | 103,200 | | | | 216,359 | |
Net loan losses | | | -231 | | | | 7,103 | | | | -5,378 | |
| | | | | | | | | | | | |
Net profit for the period | | | 67,819 | | | | 110,304 | | | | 210,981 | |
| | | |
Other comprehensive income** | | | | | | | | | | | | |
Items that will not be reclassified to income statement | | | | | | | | | | | | |
Valuation of cross currency basis spread | | | 4,134 | | | | 12,388 | | | | 25,167 | |
| | | | | | | | | | | | |
Total other comprehensive income | | | 4,134 | | | | 12,388 | | | | 25,167 | |
| | | | | | | | | | | | |
Total comprehensive income | | | 71,953 | | | | 122,693 | | | | 236,148 | |
| | | | | | | | | | | | |
| * | Unaudited figures, to be read in conjunction with NIB’s audited financial statements for 2017. |
10 (16)
| | |
| Nordic Investment Bank | | Interim Management Statement January–April 2018 |
Statement of financial position
| | | | | | | | | | | | |
EUR 1,000 | | 30 Apr 2018* | | | 30 Apr 2017* | | | 31 Dec 2017 | |
ASSETS | | | | | | | | | | | | |
Cash and cash equivalents | | | 4,439,035 | | | | 3,686,416 | | | | 4,736,109 | |
Financial placements | | | | | | | | | | | | |
Placements with credit institutions | | | 9,021 | | | | 8,771 | | | | 8,771 | |
Debt securities | | | 6,668,437 | | | | 6,511,382 | | | | 6,594,935 | |
Other | | | 16,218 | | | | 17,449 | | | | 16,395 | |
| | | | | | | | | | | | |
| | | 6,693,676 | | | | 6,537,602 | | | | 6,620,101 | |
Loans outstanding | | | 17,736,858 | | | | 16,680,661 | | | | 17,231,623 | |
Intangible assets | | | 6,189 | | | | 2,917 | | | | 5,320 | |
Tangible assets, property and equipment | | | 30,106 | | | | 27,234 | | | | 30,286 | |
Other assets | | | | | | | | | | | | |
Derivatives | | | 929,347 | | | | 1,636,182 | | | | 1,027,915 | |
Other assets | | | 35,306 | | | | 18,651 | | | | 29,399 | |
| | | | | | | | | | | | |
| | | 964,653 | | | | 1,654,833 | | | | 1,057,314 | |
Accrued interest and fees receivable | | | 238,345 | | | | 234,339 | | | | 272,045 | |
| | | | | | | | | | | | |
TOTAL ASSETS | | | 30,108,863 | | | | 28,824,003 | | | | 29,952,798 | |
| | | | | | | | | | | | |
| | | |
LIABILITIES AND EQUITY | | | | | | | | | | | | |
Liabilities | | | | | | | | | | | | |
Short-term amounts owed to credit institutions | | | 381,739 | | | | 992,617 | | | | 562,823 | |
Long-term amounts owed to credit institutions | | | 14,427 | | | | 14,882 | | | | 17,327 | |
| | | | | | | | | | | | |
| | | 396,166 | | | | 1,007,498 | | | | 580,150 | |
Repurchase agreements | | | 254,651 | | | | — | | | | 99,490 | |
Debts evidenced by certificates | | | | | | | | | | | | |
Debt securities issued | | | 23,534,503 | | | | 22,846,736 | | | | 23,934,066 | |
Other debt | | | 63,561 | | | | 79,743 | | | | 65,688 | |
| | | | | | | | | | | | |
| | | 23,598,064 | | | | 22,926,479 | | | | 23,999,754 | |
Other liabilities | | | | | | | | | | | | |
Derivatives | | | 1,655,104 | | | | 1,321,795 | | | | 1,597,451 | |
Other liabilities | | | 500,558 | | | | 11,786 | | | | 10,190 | |
| | | | | | | | | | | | |
| | | 2,155,662 | | | | 1,333,581 | | | | 1,607,641 | |
Accrued interest and fees payable | | | 178,982 | | | | 158,647 | | | | 209,511 | |
| | | | | | | | | | | | |
Total liabilities | | | 26,583,525 | | | | 25,426,205 | | | | 26,496,545 | |
| | | |
Equity | | | 3,525,338 | | | | 3,397,797 | | | | 3,456,253 | |
| | | | | | | | | | | | |
| | | |
TOTAL LIABILITIES AND EQUITY | | | 30,108,863 | | | | 28,824,003 | | | | 29,952,798 | |
| | | | | | | | | | | | |
| * | Unaudited figures, to be read in conjunction with NIB’s audited financial statements for 2017. |
11 (16)
| | |
| Nordic Investment Bank | | Interim Management Statement January–April 2018 |
Statement of changes in equity
| | | | | | | | | | | | | | | | | | | | | | | | | | | | |
EUR 1,000 | | Paid-in
capital | | | Statutory
Reserve | | | General
Credit Risk
Fund | | | Special
Credit
Risk Fund
PIL | | | Funds
available for
appropriation | | | Hedging
Reserve | | | Total | |
Equity at 31 December 2016 | | | 418,602 | | | | 686,325 | | | | 1,540,651 | | | | 445,919 | | | | 211,810 | | | | -28,202 | | | | 3,275,105 | |
| | | | | | | | | | | | | | | | | | | | | | | | | | | | |
Profit for the period | | | — | | | | — | | | | — | | | | — | | | | 110,304 | | | | — | | | | 110,304 | |
Other comprehensive income | | | — | | | | — | | | | — | | | | — | | | | — | | | | 12,388 | | | | 12,388 | |
| | | | | | | | | | | | | | | | | | | | | | | | | | | | |
Total comprehensive income | | | 0 | | | | 0 | | | | 0 | | | | 0 | | | | 110,304 | | | | 12,388 | | | | 122,693 | |
| | | | | | | | | | | | | | | | | | | | | | | | | | | | |
Transaction with owners in their capacity as owners | | | | | | | | | | | | | | | | | | | | | | | | | | | | |
Appropriations between reserve funds | | | — | | | | — | | | | 156,810 | | | | — | | | | -156,810 | | | | — | | | | 0 | |
| | | | | | | | | | | | | | | | | | | | | | | | | | | | |
Equity at 30 April 2017 | | | 418,602 | | | | 686,325 | | | | 1,697,461 | | | | 445,919 | | | | 165,304 | | | | -15,814 | | | | 3,397,797 | |
| | | | | | | | | | | | | | | | | | | | | | | | | | | | |
Profit for the period | | | — | | | | — | | | | — | | | | — | | | | 100,677 | | | | — | | | | 100,677 | |
Other comprehensive income | | | — | | | | — | | | | — | | | | — | | | | — | | | | 12,779 | | | | 12,779 | |
| | | | | | | | | | | | | | | | | | | | | | | | | | | | |
Total comprehensive income | | | 0 | | | | 0 | | | | 0 | | | | 0 | | | | 100,677 | | | | 12,779 | | | | 113,456 | |
| | | | | | | | | | | | | | | | | | | | | | | | | | | | |
Transaction with owners in their capacity as owners | | | | | | | | | | | | | | | | | | | | | | | | | | | | |
Dividends | | | — | | | | — | | | | — | | | | — | | | | -55,000 | | | | — | | | | -55,000 | |
| | | | | | | | | | | | | | | | | | | | | | | | | | | | |
Equity at 31 December 2017 | | | 418,602 | | | | 686,325 | | | | 1,697,461 | | | | 445,919 | | | | 210,981 | | | | -3,035 | | | | 3,456,253 | |
| | | | | | | | | | | | | | | | | | | | | | | | | | | | |
Adoption of IFRS 9 | | | | | | | -2,867 | | | | | | | | | | | | | | | | | | | | -2,867 | |
| | | | | | | | | | | | | | | | | | | | | | | | | | | | |
Equity at 1 January 2018 | | | 418,602 | | | | 683,458 | | | | 1,697,461 | | | | 445,919 | | | | 210,981 | | | | -3,035 | | | | 3,453,386 | |
| | | | | | | | | | | | | | | | | | | | | | | | | | | | |
Profit for the period | | | — | | | | — | | | | — | | | | — | | | | 67,819 | | | | — | | | | 67,819 | |
Other comprehensive income | | | — | | | | — | | | | — | | | | — | | | | — | | | | 4,134 | | | | 4,134 | |
| | | | | | | | | | | | | | | | | | | | | | | | | | | | |
Total comprehensive income | | | 0 | | | | 0 | | | | 0 | | | | 0 | | | | 67,819 | | | | 4,134 | | | | 71,953 | |
| | | | | | | | | | | | | | | | | | | | | | | | | | | | |
Transaction with owners in their capacity as owners | | | | | | | | | | | | | | | | | | | | | | | | | | | | |
Appropriations between reserve funds | | | — | | | | — | | | | 155,981 | | | | — | | | | -155,981 | | | | — | | | | 0 | |
| | | | | | | | | | | | | | | | | | | | | | | | | | | | |
Equity at 30 April 2018 | | | 418,602 | | | | 683,458 | | | | 1,853,442 | | | | 445,919 | | | | 122,819 | | | | 1,098 | | | | 3,525,338 | |
| | | | | | | | | | | | | | | | | | | | | | | | | | | | |
12 (16)
| | |
| Nordic Investment Bank | | Interim Management Statement January–April 2018 |
Cash flow statement
| | | | | | | | | | | | |
EUR 1,000 | | Jan-Apr 2018* | | | Jan-Apr 2017* | | | Jan-Dec 2017 | |
Cash flows from operating activities | | | | | | | | | | | | |
Net profit for the period | | | 67,819 | | | | 110,304 | | | | 210,981 | |
| | | |
Adjustments: | | | | | | | | | | | | |
Unrealised gains/losses of financial assets held at fair value | | | -11,465 | | | | -28,674 | | | | -15,434 | |
ECL non-lending activities | | | -9 | | | | | | | | | |
Depreciation and write-down in value of tangible and intangible assets | | | 602 | | | | 625 | | | | 1,675 | |
Change in accrued interest and fees (assets) | | | 33,359 | | | | 51,014 | | | | 13,308 | |
Change in accrued interest and fees (liabilities) | | | -30,529 | | | | -52,647 | | | | -1,783 | |
Net loan losses (ECL lending activities) | | | 231 | | | | -7,103 | | | | 5,378 | |
Adjustment to hedge accounting | | | 7,317 | | | | -9,119 | | | | 5,927 | |
Other adjustments to the period’s profit | | | 3,973 | | | | 2,918 | | | | 2,581 | |
| | | | | | | | | | | | |
Adjustments, total | | | 3,479 | | | | -42,988 | | | | 11,653 | |
| | | |
Lending | | | | | | | | | | | | |
Disbursements of loans | | | -1,375,697 | | | | -781,386 | | | | -3,146,630 | |
Repayments of loans | | | 638,062 | | | | 549,247 | | | | 1,831,788 | |
Capitalisations, redenominations, index adjustments, etc. | | | -73 | | | | -418 | | | | -558 | |
Exchange rate adjustments | | | 200,979 | | | | 178,124 | | | | 620,015 | |
| | | | | | | | | | | | |
Lending, total | | | -536,729 | | | | -54,433 | | | | -695,384 | |
| | | | | | | | | | | | |
| | | |
Cash flows from operating activities, total | | | -465,431 | | | | 12,884 | | | | -472,750 | |
| | | |
Cash flows from investing activities | | | | | | | | | | | | |
Placements and debt securities | | | | | | | | | | | | |
Purchase of debt securities | | | -838,844 | | | | -949,100 | | | | -2,229,069 | |
Sold and matured debt securities | | | 740,896 | | | | 961,841 | | | | 2,034,312 | |
Placements with credit institutions | | | -250 | | | | — | | | | | |
Other financial placements | | | | | | | 1,332 | | | | 3,000 | |
Exchange rate adjustments, etc. | | | 14,873 | | | | 47,809 | | | | 167,559 | |
| | | | | | | | | | | | |
Placements and debt securities, total | | | -83,325 | | | | 61,882 | | | | -24,198 | |
| | | |
Other items | | | | | | | | | | | | |
Acquisition of intangible assets | | | -869 | | | | -1,979 | | | | -4,382 | |
Acquisition of tangible assets | | | -422 | | | | -1,136 | | | | -5,239 | |
Change in other assets | | | -8,773 | | | | -5,149 | | | | -16,461 | |
| | | | | | | | | | | | |
Other items, total | | | -10,064 | | | | -8,264 | | | | -26,082 | |
| | | | | | | | | | | | |
| | | |
Cash flows from investing activities, total | | | -93,389 | | | | 53,618 | | | | -50,280 | |
Cash flows from financing activities | | | | | | | | | | | | |
Debts evidenced by certificates | | | | | | | | | | | | |
Issues of new debt | | | 3,952,171 | | | | 2,543,225 | | | | 5,942,745 | |
Redemptions | | | -3,767,199 | | | | -3,040,611 | | | | -3,753,856 | |
Exchange rate adjustments | | | -329,765 | | | | -521,712 | | | | -1,990,713 | |
| | | | | | | | | | | | |
Debts evidenced by certificates, total | | | -144,793 | | | | -1,019,097 | | | | 198,177 | |
| | | |
Other items | | | | | | | | | | | | |
Long-term placements from credit institutions | | | -2,900 | | | | -3,091 | | | | -645 | |
Change in swap receivables | | | 47,352 | | | | 541,892 | | | | 1,056,858 | |
Change in swap payables | | | -101,356 | | | | -37,825 | | | | 256,161 | |
Change in other liabilities | | | 489,366 | | | | 432 | | | | -3,711 | |
Dividend paid | | | — | | | | — | | | | -55,000 | |
| | | | | | | | | | | | |
Other items, total | | | 432,461 | | | | 501,408 | | | | 1,253,662 | |
| | | | | | | | | | | | |
Cash flows from financing activities, total | | | 287,669 | | | | -517,689 | | | | 1,451,839 | |
| | | | | | | | | | | | |
| | | |
CHANGE IN CASH AND CASH EQUIVALENTS, NET | | | -271,151 | | | | -451,188 | | | | 928,810 | |
| | | | | | | | | | | | |
| | | |
Opening balance for cash and cash equivalents, net | | | 4,073,797 | | | | 3,144,987 | | | | 3,144,987 | |
| | | | | | | | | | | | |
Closing balance for cash and cash equivalents, net | | | 3,802,645 | | | | 2,693,799 | | | | 4,073,797 | |
| | | | | | | | | | | | |
| | | |
Additional information to the statement of cash flows | | | | | | | | | | | | |
Interest income received | | | 130,424 | | | | 151,267 | | | | 313,424 | |
Interest expense paid | | | -52,785 | | | | -72,665 | | | | -63,576 | |
| * | Unaudited figures, to be read in conjunction with NIB’s audited financial statements for 2017. |
The cash flow statement has been prepared using the indirect method and cash flow items cannot be directly concluded from the statements of financial positions.
13 (16)
| | |
| Nordic Investment Bank | | Interim Management Statement January–April 2018 |
Note 1 - Net interest income
| | | | | | | | | | | | |
EUR 1,000 | | Jan-Apr 2018 | | | Jan-Apr 2017 | | | Jan-Dec 2017 | |
Cash and cash equivalents | | | -4,249 | | | | -5,149 | | | | -14,125 | |
Placements with credit institutions for more than 6 months | | | -39 | | | | — | | | | -57 | |
Debt securities | | | 19,342 | | | | 21,661 | | | | 63,490 | |
Loans outstanding | | | 81,671 | | | | 83,545 | | | | 250,412 | |
Other interest income | | | — | | | | 197 | | | | 395 | |
| | | | | | | | | | | | |
Total interest income | | | 96,725 | | | | 100,254 | | | | 300,116 | |
| | | |
Short-term amounts owed to credit institutions | | | 567 | | | | 778 | | | | 2,183 | |
Long-term amounts owed to credit institutions | | | 31 | | | | 21 | | | | 84 | |
Short-term repurchase agreements | | | 197 | | | | — | | | | 29 | |
Debts evidenced by certificates | | | -191,633 | | | | -186,367 | | | | -536,487 | |
Swap contracts and other interest expenses, net | | | 168,583 | | | | 165,551 | | | | 472,398 | |
| | | | | | | | | | | | |
Total interest expense | | | -22,256 | | | | -20,017 | | | | -61,793 | |
| | | | | | | | | | | | |
| | | |
Net interest income | | | 74,469 | | | | 80,237 | | | | 238,323 | |
| | | | | | | | | | | | |
Note 2 - Net profit on financial operations | | | | | | | | | | | | |
EUR 1,000 | | Jan-Apr 2018 | | | Jan-Apr 2017 | | | Jan-Dec 2017 | |
Financial instruments held at fair value, realised gains and losses | | | 3,049 | | | | 3,971 | | | | 4,591 | |
Financial instruments held at fair value, unrealised gains and losses | | | 9,226 | | | | 26,044 | | | | 16,191 | |
Financial instruments held at amortised cost, realised gains and losses | | | — | | | | 184 | | | | 184 | |
Adjustment to hedge accounting, unrealised gains and losses of fair value hedges | | | -7,317 | | | | 9,119 | | | | -5,927 | |
Repurchase of NIB bonds, other items | | | 11 | | | | 99 | | | | 2,525 | |
| | | | | | | | | | | | |
Net profit on financial operations | | | 4,969 | | | | 39,417 | | | | 17,563 | |
| | | | | | | | | | | | |
Note 3 - Adoption of IFRS 9—expected credit loss
IFRS 9 ‘Financial Instruments’ has been issued in phases over a number of years with entities allowed to adopt the various versions of the standard or wait until the final version was published. The first phases covered “classification and measurement” and “hedge accounting”, which the Bank adopted early. In July 2014, the IASB issued the final version of IFRS 9, adding “impairment” and amending previous versions, the most significant amendment being the introduction of a new asset classification: “Fair value through other comprehensive income”.
The Bank adopted IFRS 9 as issued by the IASB in July 2014, on 1 January 2018. As the Bank had earlier adopted the previous versions of IFRS 9, the changes were limited to new rules on impairment and the new asset classification.
Classification and measurement—The new standard introduces a new financial asset classification type: “fair value through other comprehensive income” (FVOCI) for financial assets held in a business model whose objective is to hold assets to collect contractual cash flows and selling financial assets, and the cash flows consist solely payments of principal and interest on the principal amount outstanding (“SPPI”). NIB currently does not record any assets in this asset classification.
Impairment—The new impairment requirements are based on an expected credit loss (ECL) model and replaced the current incurred loss model. The expected credit loss model applies to financial assets recorded at amortised cost or at FVOCI, such as loans, debt securities and most loan commitments and financial guarantee contracts. The Bank is required to recognise an allowance for either 12-month or lifetime ECLs,
14 (16)
| | |
| Nordic Investment Bank | | Interim Management Statement January–April 2018 |
depending on whether there has been a significant increase in credit risk since initial recognition. The measurement of ECLs reflects a probability-weighted outcome, the time value of money and the best available forward-looking information. The new model incorporates forward-looking information through the inclusion of macroeconomic factors. Further explanations of inputs, assumptions and techniques used in estimating the ECL will be disclosed in the 2018 annual financial statements. The adoption of the new impairment model resulted in a decrease in equity of EUR 2.9 million on 1 January 2018.
| | | | | | | | | | | | | | | | | | | | |
Expected credit loss provision EUR 1,000 | | Stage 1 | | | Stage 2 | | | Stage 3 | | | Collective
&
Individual | | | Total | |
Balance at 31 December 2017 | | | — | | | | — | | | | — | | | | 138,842 | | | | 138,842 | |
Adoption of IFRS 9 | | | 25,224 | | | | 23,291 | | | | 93,194 | | | | -138,842 | | | | 2,867 | |
| | | | | | | | | | | | | | | | | | | | |
Balance at 1 January 2018 | | | 25,224 | | | | 23,291 | | | | 93,194 | | | | 0 | | | | 141,709 | |
Transfer to Stage 1 | | | 137 | | | | -137 | | | | — | | | | — | | | | 0 | |
Transfer to Stage 2 | | | -606 | | | | 606 | | | | — | | | | — | | | | 0 | |
Transfer to Stage 3 | | | — | | | | — | | | | — | | | | — | | | | 0 | |
New assets originated or purchased | | | 2,232 | | | | 38 | | | | — | | | | — | | | | 2,271 | |
Amortisations and repayments | | | -981 | | | | -1,434 | | | | — | | | | — | | | | -2,416 | |
Impact of remeasurment on existing assets | | | 2,644 | | | | -3,843 | | | | 1,565 | | | | — | | | | 367 | |
Foreign exchange adjustments and other changes | | | — | | | | — | | | | -239 | | | | — | | | | -239 | |
| | | | | | | | | | | | | | | | | | | | |
Net change in period | | | 3,426 | | | | -4,769 | | | | 1,326 | | | | 0 | | | | -18 | |
| | | | | | | | | | | | | | | | | | | | |
Balance at 30 April 2018 | | | 28,649 | | | | 18,522 | | | | 94,520 | | | | 0 | | | | 141,691 | |
| | | | | | | | | | | | | | | | | | | | |
| | | | | |
Expected credit loss income statement EUR 1,000 | | | | | | | | | | | | | | | |
Net result on financial operations | | | | | | | | | | | | | | | | | | | 9 | |
Net loan losses | | | | | | | | | | | | | | | | | | | -231 | |
Foreign exchange gains and losses | | | | | | | | | | | | | | | | | | | 239 | |
| | | | | | | | | | | | | | | | | | | | |
Total gain recognised in income statement during period | | | | | | | | | | | | | | | | 18 | |
| | | | | | | | | | | | | | | | | | | | |
| | | | | |
Assets subject to expected credit loss EUR 1,000 | | | | | Stage 1 | | | Stage 2 | | | Stage 3 | | | Total | |
Exposure at 1 January 2018 | | | | | | | 21,792,574 | | | | 853,192 | | | | 101,963 | | | | 22,747,729 | |
Transfer to Stage 1 | | | | | | | 14,795 | | | | -14,795 | | | | — | | | | 0 | |
Transfer to Stage 2 | | | | | | | -18,543 | | | | 18,543 | | | | — | | | | 0 | |
Transfer to Stage 3 | | | | | | | — | | | | — | | | | — | | | | 0 | |
New assets originated or purchased | | | | | | | 2,361,074 | | | | 1,235 | | | | — | | | | 2,362,309 | |
Amortisations and repayments | | | | | | | -2,178,644 | | | | -95,255 | | | | — | | | | -2,273,899 | |
Foreign exchange adjustments and other changes | | | | | | | -169,572 | | | | -4,728 | | | | 584 | | | | -173,716 | |
| | | | | | | | | | | | | | | | | | | | |
Exposure at 30 April 2018 | | | | | | | 21,801,684 | | | | 758,192 | | | | 102,546 | | | | 22,662,422 | |
| | | | | | | | | | | | | | | | | | | | |
| | | | | |
Exposure by asset type | | | | | | | | | | | | | | | | | | | | |
Loans outstanding | | | | | | | | | | | | | | | | | | | 17,447,620 | |
Loan commitments | | | | | | | | | | | | | | | | | | | 2,139,849 | |
Treasury assets at amortised cost | | | | | | | | | | | | | | | | | | | 3,074,952 | |
| | | | | | | | | | | | | | | | | | | | |
Total exposure at 30 April 2018 | | | | | | | | | | | | | | | | | | | 22,662,422 | |
| | | | | | | | | | | | | | | | | | | | |
15 (16)
| | |
| Nordic Investment Bank | | Interim Management Statement January–April 2018 |
Note 4 - Basis of preparation
This unaudited Interim Management Statement is not presented in accordance with IAS 34 Interim Financial Reporting, as this statement excludes a number of disclosures. The accounting policies and methods of computation are largely the same as described in Note 1 to the Financial Report 2017 with the exception of IFRS 9, as described on the previous pages 14 and 15.
Ratio definitions
| | |
| Equity / total assets = | | Total equity at reporting date Total assets at reporting date |
| |
| Profit / average equity = | | Annualised profit for the period Average equity for the period |
| |
| Cost / income = | | Total operating expenses for the period Total operating income for the period |
16 (16)