Exhibit IX

Table of Contents
| | |
3 | | Highlights |
| |
3 | | Key figures and ratios |
| |
4 | | President & CEO’s comments |
| |
5 | | Operating and financial review |
| |
5 | | Total comprehensive income |
7 | | Financial position |
| |
10 | | Financial statements |
| |
10 | | Statement of comprehensive income |
11 | | Statement of financial position |
13 | | Statement of changes in equity |
14 | | Cash flow statement |
| |
16 | | Notes to the Interim Financial Statements |
| |
16 | | Note 1 - Segment information |
18 | | Note 2 - Net interest income |
18 | | Note 3 - Net profit on financial operations |
19 | | Note 4 - Expected credit loss |
19 | | Note 5 - Net loan losses |
20 | | Note 6 - Classification of financial instruments |
21 | | Note 7 - Fair value of financial assets and liabilities |
21 | | Note 8 - Loans outstanding |
21 | | Note 9 - Debts evidenced by certificates |
22 | | Note 10 - Basis of preparation |
| |
22 | | Ratio definitions |
| |
23 | | Report on Review of Interim Financial Report |
2 | Interim Financial Report
Highlights
During the half year ending 30 June 2019, a total of EUR 1,339 million in new loans were agreed and EUR 1,484 million were disbursed. The disbursements in the first half year were lower than the historically high level of 2018. The net profit for the period amounted to EUR 95 million, down from EUR 110 million for the corresponding period in 2018.
In January, NIB issued its first Nordic–Baltic Blue Bond. The five-year SEK 2 billion bond was launched under the NIB Environmental Bond Framework and the proceeds will finance investments in water resource management and protection.
At its annual meeting on 24 May 2019, the Nordic Investment Bank’s Board of Governors approved amendments to NIB’s Statutes, which will be submitted to undergo the required national procedures of member countries. The intent of the amendments is to ensure continued adherence with sound banking principles and maintain the Bank’s relevance to fulfil its mandate.
Key figures and ratios
| | | | | | | | | | | | |
In millions of euro unless otherwise specified | | Jan-Jun 2019 | | | Jan-Jun 2018 | | | Jan-Dec 2018 | |
Net interest income | | | 107 | | | | 112 | | | | 223 | |
Profit before net loan losses | | | 91 | | | | 109 | | | | 167 | |
Net profit | | | 95 | | | | 110 | | | | 173 | |
Loans disbursed | | | 1,484 | | | | 2,153 | | | | 4,047 | |
Loans agreed | | | 1,339 | | | | 1,896 | | | | 4,330 | |
Mandate fulfilment * | | | 100 | % | | | 87 | % | | | 91 | % |
Loans outstanding | | | 18,715 | | | | 18,267 | | | | 19,065 | |
Total assets | | | 31,708 | | | | 31,157 | | | | 31,710 | |
New debt issues | | | 2,895 | | | | 5,203 | | | | 6,620 | |
Debts evidenced by certificates | | | 25,598 | | | | 25,132 | | | | 25,651 | |
Total equity | | | 3,641 | | | | 3,518 | | | | 3,578 | |
Equity/total assets ** | | | 11.5 | % | | | 11.3 | % | | | 11.3 | % |
Profit/average equity ** | | | 5.2 | % | | | 6.3 | % | | | 4.9 | % |
Cost/income ** | | | 20.1 | % | | | 17.0 | % | | | 20.6 | % |
Number of employees (average during the period) | | | 198 | | | | 196 | | | | 197 | |
| * | See page 8 for mandate fulfilment explanation |
| ** | See page 22 for ratio definitions |
3 | Interim Financial Report
President & CEO’s comments January–June 2019
NIB provides long-term loans to its customers to ensure sustainable growth and lasting impact on the productivity and environment of the Nordic-Baltic region. Demand for long-term financing from NIB is still strong. The disbursements in the first half of the year were, as anticipated, lower than the historically high level of 2018. During the six-month period ended 30 June 2019, a total of EUR 1.3 billion in new loans were agreed and EUR 1.5 billion million were disbursed. The credit quality of the loan portfolio improved during the period resulting in a reduction in loan loss provisions.
NIB reviews all projects and scores them for productivity gains and environmental benefits in the Nordic–Baltic countries. Projects that contribute sufficiently to sustainable development qualify for financing by NIB. All projects financed this year have been assessed as having significant positive impact on the productivity and/or environment of the region.
As expected, the profit for the period amounting to EUR 95 million was lower than for the corresponding period in 2018. The main reason for the decrease was a lower unrealised result on financial operations and lower net interest income.
During the first six months of 2019, the Bank raised EUR 2.9 billion in new funding (January–June 2018: EUR 5.2 billion). The decrease in funding requirements is a result of lower loan disbursements and lower collateral requirements. In February, NIB listed its inaugural Nordic–Baltic Blue Bond for water management and protection on Nasdaq Stockholm. The listing marked the first blue bond on NASDAQ’s Nordic Sustainable Debt Market. The bond was issued under NIB’s Environmental Bond Framework and supports the Bank’s lending to selected wastewater treatment projects, prevention of water pollution and water-related climate change adaptation.
The Banking industry has undergone significant changes since the last financial crisis in terms of capital and risk management and regulatory oversight. In order to ensure continued adherence with sound banking principles the Bank is in the process to change its Statutes. At its annual meeting in May, the Nordic Investment Bank’s Board of Governors approved amendments to the Bank’s Statutes, subject to the required national procedures (including ratification if needed) to enter into force. These amendments will permit NIB to be more relevant in its operations and thereby add more value and efficiency in achieving its mission. Sound and comprehensive polices for capital and risk management allow NIB to maintain the highest possible issuer credit rating and obtain funds from the capital markets on advantageous terms, which is essential for the implementation of its mandate.
Henrik Normann, President & CEO
4 | Interim Financial Report
Operating and financial review
Total comprehensive income
January–June 2019 compared to January–June 2018
NET PROFIT
The net profit for the period January–June 2019 amounted to EUR 94.7 million, down from EUR 110.4 million in the same period last year. Total operating income decreased from EUR 131.1 million to EUR 113.3 million. Total operating expenses increased by EUR 0.5 million to EUR 22.7 million, resulting in profit before net loan losses decreasing to EUR 90.6 million (January–June 2018: EUR 108.8 million).
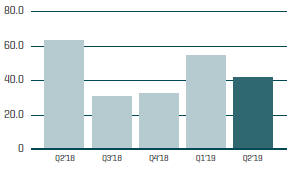
NET INTEREST INCOME
Net interest income for the period amounted to EUR 106.5 million (January–June 2018: EUR 111.6 million). Net interest income on lending activities increased by EUR 1.0 million, due to higher average loans outstanding. Interest income on treasury activities decreased by EUR 6.0 million due to the low yield environment.
NET COMMISSION INCOME AND FEES
Net fee and commission income for the period January–June 2019 was EUR 4.0 million, compared to EUR 5.9 million in 2018, due to the lower volume of loans agreed and disbursed in the six month period under review.
| | | | |
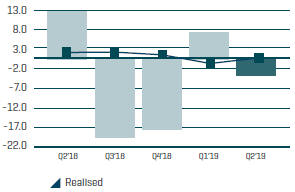
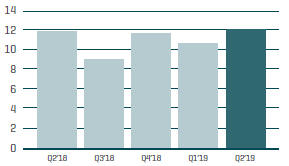
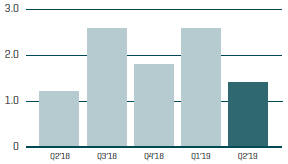
NET PROFIT EUR m | | NET INTEREST INCOME EUR m | | NET COMMISSION INCOME AND FEES EUR m |
 | |  | |  |
5 | Interim Financial Report
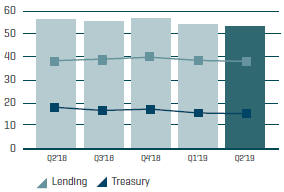
NET PROFIT ON FINANCIAL OPERATIONS
The net profit on financial operations for the period January–June 2019 totalled EUR 2.8 million, which was EUR 10.8 million lower than the same period in 2018. The result includes unrealised gains of EUR 2.8 million. The unrealised results will reverse when the underlying transactions reach maturity.
TOTAL OPERATING EXPENSES
Total operating expenses were EUR 0.5 million higher than in 2018. The Bank continues to focus on costs to ensure an efficient ratio of operating cost to income.
NET LOAN LOSSES
The total provision for expected credit losses on assets held at amortised cost amounted to EUR 116.7 million at 30 June 2019, which is EUR 3.4 million less than at 31 December 2018. This provision covers both loans outstanding and treasury assets held at amortised cost. There were no new non-performing loans during the period and no realised losses. The gain recognised in the income statement for net loan losses of EUR 4.0 million relates to recoveries on non-performing loans of EUR 1.4 million and EUR 2.6 million related to the improved credit quality of performing loans.
OTHER COMPREHENSIVE INCOME
The Bank separates the foreign currency basis spread from financial instruments used in fair value hedge accounting, and this separated amount is recorded in “Other comprehensive income” (OCI) which amounted to EUR 9.2 million for the period (January–June 2018: EUR 9.3 million). The resulting total comprehensive income for the period amounted to EUR 103.9 million, compared to EUR 119.7 million in 2018.
| | | | |
NET PROFIT ON FINANCIAL OPERATIONS EUR m | | TOTAL OPERATING EXPENSES EUR m | | NET LOAN LOSSES EUR m |
 | |  | |  |
| | | | |
| | | | * The gains recognised in “net loan losses” above are due to loan impairment reversals. |
6 | Interim Financial Report
Financial position
LOANS OUTSTANDING
Total loans outstanding amounted to EUR 18,715 million, which is EUR 448 million higher than on 30 June 2018. Demand for NIB’s long-term financing remains strong. However, the disbursements in the first half year were lower than the historically high level in 2018. The total loans disbursed during the period amounted to EUR 1,484 million, which is EUR 669 million lower than for the same period in 2018. Total repayments amounted to EUR 1,083 million compared to EUR 258 million for the corresponding period in 2018.
Total loans outstanding, excluding exchange rate and valuation effects, decreased from EUR 19,065 million at 31 December 2018 to EUR 18,671 million. The book value amounted to EUR 18,715 million due to foreign exchange and fair valuations/transfers and hedge accounting effects of EUR 1 million and EUR 42 million, respectively.
DEVELOPMENT OF LOANS OUTSTANDING DURING 2019
EUR m
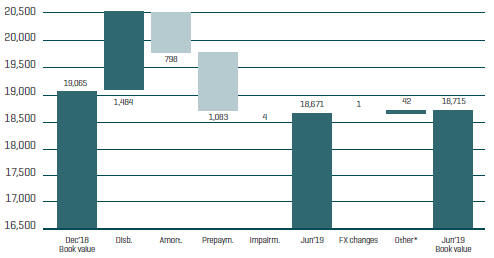
| * | Fair valuations/transfers and hedge accounting. |
7 | Interim Financial Report
LENDING HIGHLIGHTS
| | | | | | | | | | | | | | | | | | | | |
in EUR millions, unless otherwise specified | | Jan-Jun
2019 | | | 2018 | | | 2017 | | | 2016 | | | 2015 | |
Loans agreed excluding green bond investments | | | 1,339 | | | | 4,269 | | | | 3,665 | | | | 4,221 | | | | 2,830 | |
Green bond investments | | | — | | | | 61 | | | | 147 | | | | 143 | | | | — | |
Total disbursements | | | 1,484 | | | | 4,047 | | | | 3,147 | | | | 3,373 | | | | 2,716 | |
Total loans disbursed by business area: | | | | | | | | | | | | | | | | | | | | |
Energy and water | | | 79 | | | | 840 | | | | 737 | | | | 1,154 | | | | 483 | |
Infrastructure, transport and telecom | | | 221 | | | | 1,192 | | | | 818 | | | | 791 | | | | 907 | |
Industries and services | | | 499 | | | | 1,339 | | | | 932 | | | | 836 | | | | 932 | |
Financial institutions and SMEs | | | 685 | | | | 675 | | | | 660 | | | | 593 | | | | 394 | |
Number of loans agreements in period | | | 20 | | | | 58 | | | | 55 | | | | 58 | | | | 45 | |
Number of green bond investments in period | | | 0 | | | | 3 | | | | 9 | | | | 8 | | | | — | |
Loans outstanding | | | 18,715 | | | | 19,065 | | | | 17,232 | | | | 16,640 | | | | 15,627 | |
Member countries | | | 17,716 | | | | 17,960 | | | | 15,867 | | | | 14,831 | | | | 13,347 | |
Non-member countries | | | 1,113 | | | | 1,222 | | | | 1,504 | | | | 1,948 | | | | 2,396 | |
Loan impairment provision | | | -114 | | | | -117 | | | | -139 | | | | -139 | | | | -116 | |
MISSION FULFILMENT
Projects financed by NIB contribute to the Bank’s mission of improving productivity and the environment in the Nordic–Baltic countries. Before approval is given in each individual case, all eligible projects are evaluated and rated against the criteria developed based on the Bank’s mission. In the six-month period that ended on 30 June 2019, loans achieving a “good” or “excellent” mandate rating accounted for 100% of the total amount of loans agreed.
MANDATE RATING FOR AGREED LOANS
(Excluding lending green bond purchases)
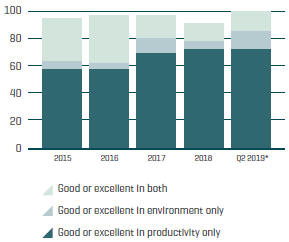
| * | 6 months ended 30 June 2019 |
8 | Interim Financial Report
FUNDING
The Bank expects to fund between EUR 5.0 billion and EUR 6.0 billion during 2019. The strategy for 2019 is to complete two benchmark transactions in US dollars or euros, complemented by other public and private issues, to maintain a diversified portfolio of currencies and a global investor base. In addition, NIB’s aim is to continue issuing NIB Environmental Bonds. By the end of June, the Bank had raised EUR 2.9 billion (January–June 2018: EUR 5.2 billion) in new funding. The decrease in funding requirements is a result of lower loan disbursements and lower collateral requirements.
In January, NIB issued its first Nordic–Baltic Blue Bond. The five-year SEK 2 billion bond was launched under the NIB Environmental Bond Framework and will focus on investments within water resource management and protection.
In May, the Bank issued a USD 1 billion benchmark, the first of the year, which has a final maturity of 21 May 2024.
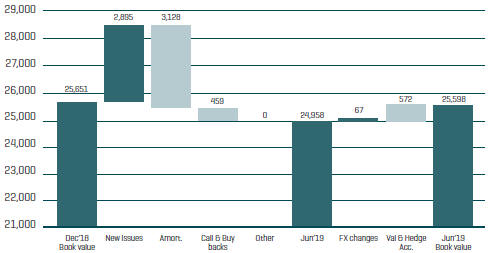
DEBT DEVELOPMENT DURING 2019
EUR m
9 | Interim Financial Report
Financial statements
Statement of comprehensive income
| | | | | | | | | | | | | | |
In thousands of euro | | NOTE | | Jan-Jun 2019 | | | Jan-Jun 2018 | | | Jan-Dec 2018 | |
Interest income from financial assets measured at amortised cost | | | | | 161,883 | | | | 141,892 | | | | 298,371 | |
Interest income from financial assets measured at fair value | | | | | 12,999 | | | | 9,459 | | | | 24,711 | |
Interest expense | | | | | -68,368 | | | | -39,748 | | | | -99,590 | |
| | | | | | | | | | | | | | |
Net interest income | | (2) | | | 106,514 | | | | 111,603 | | | | 223,492 | |
| | | | |
Commission income and fees received | | | | | 5,184 | | | | 7,530 | | | | 13,271 | |
Commission expense and fees paid | | | | | -1,208 | | | | -1,603 | | | | -2,546 | |
| | | | | | | | | | | | | | |
Net fee and commission income | | | | | 3,976 | | | | 5,927 | | | | 10,725 | |
| | | | |
Net profit/loss on financial operations | | (3) | | | 2,805 | | | | 13,580 | | | | -23,776 | |
Foreign exchange gains and losses | | | | | 33 | | | | -6 | | | | -160 | |
| | | | | | | | | | | | | | |
Total operating income | | | | | 113,329 | | | | 131,104 | | | | 210,281 | |
| | | | |
Expenses | | | | | | | | | | | | | | |
General administrative expenses | | | | | | | | | | | | | | |
Personnel expenses | | | | | -16,206 | | | | -15,428 | | | | -28,971 | |
Other administrative expenses | | | | | -5,252 | | | | -5,844 | | | | -12,321 | |
Depreciation | | | | | -1,286 | | | | -986 | | | | -1,937 | |
| | | | | | | | | | | | | | |
Total operating expenses | | | | | -22,743 | | | | -22,257 | | | | -43,228 | |
| | | | | | | | | | | | | | |
| | | | |
Profit before loan losses | | | | | 90,585 | | | | 108,847 | | | | 167,053 | |
Net loan losses | | (5) | | | 4,071 | | | | 1,577 | | | | 5,957 | |
| | | | | | | | | | | | | | |
Net profit for the period | | | | | 94,657 | | | | 110,424 | | | | 173,009 | |
| | | | |
Other comprehensive income | | | | | | | | | | | | | | |
Items that will not be reclassified to income statement | | | | | | | | | | | | | | |
Fair value hedges | | | | | | | | | | | | | | |
Valuation of cross currency basis spread | | | | | 9,201 | | | | 9,287 | | | | 6,160 | |
| | | | | | | | | | | | | | |
Total other comprehensive income | | | | | 9,201 | | | | 9,287 | | | | 6,160 | |
| | | | | | | | | | | | | | |
Total comprehensive income | | | | | 103,857 | | | | 119,711 | | | | 179,169 | |
| | | | | | | | | | | | | | |
The accompanying notes are an integral part of these financial statements.
10 | Interim Financial Report
Statement of financial position
| | | | | | | | | | | | | | |
In thousands of euro | | NOTE | | 30 Jun 2019 | | | 30 Jun 2018 | | | 31 Dec 2018 | |
ASSETS | | | | | | | | | | | | | | |
Cash and cash equivalents | | | | | 2,391,245 | | | | 4,687,518 | | | | 4,757,905 | |
Financial placements | | | | | | | | | | | | | | |
Placements with credit institutions | | | | | 2,130,701 | | | | 9,021 | | | | 9,021 | |
Debt securities | | | | | 6,560,837 | | | | 6,772,067 | | | | 6,454,748 | |
Other | | | | | 15,123 | | | | 16,218 | | | | 15,761 | |
| | | | | | | | | | | | | | |
| | | | | 8,706,660 | | | | 6,797,306 | | | | 6,479,531 | |
Loans outstanding | | (8) | | | 18,714,595 | | | | 18,266,843 | | | | 19,065,056 | |
Intangible assets | | | | | 15,113 | | | | 7,389 | | | | 9,205 | |
Tangible assets, property and equipment | | | | | 32,530 | | | | 30,709 | | | | 30,771 | |
Other assets | | | | | | | | | | | | | | |
Derivatives | | | | | 1,348,528 | | | | 1,032,470 | | | | 1,068,260 | |
Other assets | | | | | 242,772 | | | | 59,889 | | | | 4,520 | |
| | | | | | | | | | | | | | |
| | | | | 1,591,301 | | | | 1,092,359 | | | | 1,072,781 | |
Accrued interest and fees receivable | | | | | 256,072 | | | | 275,215 | | | | 294,421 | |
| | | | | | | | | | | | | | |
TOTAL ASSETS | | | | | 31,707,515 | | | | 31,157,339 | | | | 31,709,670 | |
| | | | | | | | | | | | | | |
The accompanying notes are an integral part of these financial statements.
11 | Interim Financial Report
| | | | | | | | | | | | | | |
In thousands of euro | | NOTE | | 30 Jun 2019 | | | 30 Jun 2018 | | | 31 Dec 2018 | |
LIABILITIES AND EQUITY | | | | | | | | | | | | | | |
Liabilities | | | | | | | | | | | | | | |
Short-term amounts owed to credit institutions | | | | | 691,786 | | | | 502,819 | | | | 575,394 | |
Long-term amounts owed to credit institutions | | | | | 8,435 | | | | 9,486 | | | | 9,486 | |
| | | | | | | | | | | | | | |
| | | | | 700,221 | | | | 512,304 | | | | 584,879 | |
Debts evidenced by certificates | | (9) | | | 25,597,957 | | | | 25,132,131 | | | | 25,651,370 | |
Other liabilities | | | | | | | | | | | | | | |
Derivatives | | | | | 1,288,951 | | | | 1,682,652 | | | | 1,649,158 | |
Other liabilities | | | | | 261,845 | | | | 93,402 | | | | 10,080 | |
| | | | | | | | | | | | | | |
| | | | | 1,550,795 | | | | 1,776,054 | | | | 1,659,238 | |
Accrued interest and fees payable | | | | | 217,129 | | | | 218,754 | | | | 236,629 | |
| | | | | | | | | | | | | | |
Total liabilities | | | | | 28,066,103 | | | | 27,639,243 | | | | 28,132,116 | |
| | | | |
Equity | | | | | 3,641,412 | | | | 3,518,096 | | | | 3,577,554 | |
| | | | | | | | | | | | | | |
| | | | |
TOTAL LIABILITIES AND EQUITY | | | | | 31,707,515 | | | | 31,157,339 | | | | 31,709,670 | |
| | | | | | | | | | | | | | |
The accompanying notes are an integral part of these financial statements.
12 | Interim Financial Report
Statement of changes in equity
| | | | | | | | | | | | | | | | | | | | | | | | | | | | |
In thousands of euro | | PAID-IN
CAPITAL | | | STATUTORY
RESERVE | | | GENERAL
CREDIT RISK
FUND | | | SPECIAL
CREDIT
RISK FUND
PIL | | | PROFIT
AVAILABLE FOR
APPROPRIATION | | | HEDGING
RESERVE | | | TOTAL | |
EQUITY AT 1 JANUARY 2018 | | | 418,602 | | | | 686,325 | | | | 1,694,594 | | | | 445,919 | | | | 210,981 | | | | -3,035 | | | | 3,453,386 | |
| | | | | | | | | | | | | | | | | | | | | | | | | | | | |
Profit for the period | | | — | | | | — | | | | — | | | | — | | | | 110,424 | | | | — | | | | 110,424 | |
Other comprehensive income | | | — | | | | — | | | | — | | | | — | | | | — | | | | 9,287 | | | | 9,287 | |
| | | | | | | | | | | | | | | | | | | | | | | | | | | | |
Total comprehensive income | | | 0 | | | | 0 | | | | 0 | | | | 0 | | | | 110,424 | | | | 9,287 | | | | 119,711 | |
| | | | | | | | | | | | | | | | | | | | | | | | | | | | |
Transactions with owners in their capacity as owners | | | | | | | | | | | | | | | | | | | | | | | | | | | | |
Appropriation of profit | | | — | | | | — | | | | 155,981 | | | | — | | | | -155,981 | | | | — | | | | 0 | |
Dividends | | | — | | | | — | | | | — | | | | — | | | | -55,000 | | | | — | | | | -55,000 | |
| | | | | | | | | | | | | | | | | | | | | | | | | | | | |
EQUITY AT 30 JUNE 2018 | | | 418,602 | | | | 686,325 | | | | 1,850,575 | | | | 445,919 | | | | 110,424 | | | | 6,252 | | | | 3,518,096 | |
| | | | | | | | | | | | | | | | | | | | | | | | | | | | |
Profit for the period | | | — | | | | — | | | | — | | | | — | | | | 62,585 | | | | — | | | | 62,585 | |
Other comprehensive income | | | — | | | | — | | | | — | | | | — | | | | — | | | | -3,127 | | | | -3,127 | |
| | | | | | | | | | | | | | | | | | | | | | | | | | | | |
Total comprehensive income | | | 0 | | | | 0 | | | | 0 | | | | 0 | | | | 62,585 | | | | -3,127 | | | | 59,458 | |
| | | | | | | | | | | | | | | | | | | | | | | | | | | | |
Transactions with owners in their capacity as owners | | | | | | | | | | | | | | | | | | | | | | | | | | | | |
Realisation of PIL losses | | | — | | | | — | | | | 18,978 | | | | -18,978 | | | | — | | | | — | | | | 0 | |
| | | | | | | | | | | | | | | | | | | | | | | | | | | | |
EQUITY AT 31 DECEMBER 2018 | | | 418,602 | | | | 686,325 | | | | 1,869,553 | | | | 426,941 | | | | 173,009 | | | | 3,124 | | | | 3,577,554 | |
| | | | | | | | | | | | | | | | | | | | | | | | | | | | |
Profit for the period | | | | | | | | | | | | | | | | | | | 94,657 | | | | | | | | 94,657 | |
Other comprehensive income | | | | | | | | | | | | | | | | | | | | | | | 9,201 | | | | 9,201 | |
| | | | | | | | | | | | | | | | | | | | | | | | | | | | |
Total comprehensive income | | | 0 | | | | 0 | | | | 0 | | | | 0 | | | | 94,657 | | | | 9,201 | | | | 103,857 | |
| | | | | | | | | | | | | | | | | | | | | | | | | | | | |
Transactions with owners in their capacity as owners | | | | | | | | | | | | | | | | | | | | | | | | | | | | |
Appropriation of profit | | | — | | | | — | | | | 133,009 | | | | — | | | | -133,009 | | | | — | | | | 0 | |
Dividends | | | — | | | | — | | | | — | | | | — | | | | -40,000 | | | | — | | | | -40,000 | |
| | | | | | | | | | | | | | | | | | | | | | | | | | | | |
EQUITY AT 30 JUNE 2019 | | | 418,602 | | | | 686,325 | | | | 2,002,562 | | | | 426,941 | | | | 94,657 | | | | 12,325 | | | | 3,641,412 | |
| | | | | | | | | | | | | | | | | | | | | | | | | | | | |
The accompanying notes are an integral part of these financial statements.
13 | Interim Financial Report
Cash flow statement
| | | | | | | | | | | | |
In thousands of euro | | Jan-Jun 2019 | | | Jan-Jun 2018 | | | Jan-Dec 2018 | |
Cash flows from operating activities | | | | | | | | | | | | |
Net profit for the period | | | 94,657 | | | | 110,424 | | | | 173,009 | |
| | | |
Adjustments: | | | | | | | | | | | | |
Unrealised gains/losses of financial assets held at fair value | | | 9,905 | | | | -26,982 | | | | -14,275 | |
ECL non-lending activities | | | 44 | | | | 2 | | | | -20 | |
Depreciation and write-down in value of tangible and intangible assets | | | 1,286 | | | | 986 | | | | 1,937 | |
Change in accrued interest and fees (assets) | | | 38,375 | | | | -3,180 | | | | -22,377 | |
Change in accrued interest and fees (liabilities) | | | -19,499 | | | | 9,243 | | | | 27,117 | |
Net loan losses (ECL lending activities) | | | -4,071 | | | | -1,577 | | | | -5,957 | |
Adjustment to hedge accounting | | | -8,826 | | | | 11,729 | | | | 37,523 | |
Other adjustments to the period´s profit | | | -2,169 | | | | 5,090 | | | | 7,031 | |
| | | | | | | | | | | | |
Adjustments, total | | | 15,044 | | | | -4,689 | | | | 30,979 | |
| | | |
Lending | | | | | | | | | | | | |
Disbursements of loans | | | -1,483,726 | | | | -2,153,195 | | | | -4,046,710 | |
Repayments of loans | | | 1,881,455 | | | | 1,047,765 | | | | 2,113,670 | |
Transfers of lending green bonds to debt securities | | | 48,149 | | | | — | | | | — | |
Capitalisations, redenominations, index adjustments, etc. | | | -10,864 | | | | -6 | | | | 897 | |
| | | | | | | | | | | | |
Lending, total | | | 435,015 | | | | -1,105,436 | | | | -1,932,143 | |
| | | | | | | | | | | | |
| | | |
Cash flows from operating activities, total | | | 544,715 | | | | -999,701 | | | | -1,728,154 | |
| | | |
Cash flows from investing activities | | | | | | | | | | | | |
Placements and debt securities | | | | | | | | | | | | |
Purchase of debt securities | | | -1,135,498 | | | | -1,173,598 | | | | -1,891,112 | |
Transfers of lending green bonds to debt securities | | | -48,149 | | | | — | | | | — | |
Sold or matured debt securities | | | 1,209,492 | | | | 1,010,760 | | | | 2,048,213 | |
Placements with credit institutions | | | -1,971,792 | | | | -250 | | | | -250 | |
Other financial placements | | | 107 | | | | — | | | | 218 | |
| | | | | | | | | | | | |
Placements and debt securities, total | | | -1,945,840 | | | | -163,088 | | | | 157,069 | |
The accompanying notes are an integral part of these financial statements.
14 | Interim Financial Report
| | | | | | | | | | | | |
In thousands of euro | | Jan-Jun 2019 | | | Jan-Jun 2018 | | | Jan-Dec 2018 | |
| | | |
Other items | | | | | | | | | | | | |
Acquisition of intangible assets | | | -1,440 | | | | -2,069 | | | | -3,885 | |
Acquisition of tangible assets | | | -2,660 | | | | -1,409 | | | | -2,421 | |
Change in other assets | | | -911 | | | | -33,331 | | | | 23,680 | |
| | | | | | | | | | | | |
Other items, total | | | -5,011 | | | | -36,809 | | | | 17,373 | |
| | | | | | | | | | | | |
| | | |
Cash flows from investing activities, total | | | -1,950,851 | | | | -199,897 | | | | 174,443 | |
| | | |
Cash flows from financing activities | | | | | | | | | | | | |
Debts evidenced by certificates | | | | | | | | | | | | |
Issues of new debt | | | 2,666,577 | | | | 5,203,371 | | | | 6,619,670 | |
Redemptions | | | -3,420,578 | | | | -3,852,731 | | | | -4,924,256 | |
| | | | | | | | | | | | |
Debts evidenced by certificates, total | | | -754,001 | | | | 1,350,640 | | | | 1,695,415 | |
| | | |
Other items | | | | | | | | | | | | |
Long-term placements from credit institutions | | | -1,051 | | | | -7,842 | | | | -7,842 | |
Change in swap receivables excluding fair value changes | | | 51,923 | | | | -29,000 | | | | -60,891 | |
Change in swap payables excluding fair value changes | | | -396,767 | | | | -59,420 | | | | 34,237 | |
Change in other liabilities | | | 5,408 | | | | 82,248 | | | | -2,206 | |
Dividend paid | | | -40,000 | | | | -55,000 | | | | -55,000 | |
| | | | | | | | | | | | |
Other items, total | | | -380,486 | | | | -69,013 | | | | -91,702 | |
| | | | | | | | | | | | |
| | | |
Cash flows from financing activities, total | | | -1,134,486 | | | | 1,281,627 | | | | 1,603,713 | |
| | | | | | | | | | | | |
| | | |
CHANGE IN CASH AND CASH EQUIVALENTS, NET | | | -2,540,622 | | | | 82,030 | | | | 50,002 | |
| | | | | | | | | | | | |
| | | |
Opening balance for cash and cash equivalents, net | | | 4,182,512 | | | | 4,073,797 | | | | 4,073,797 | |
| | | | | | | | | | | | |
Exchange rate adjustments | | | 57,569 | | | | 28,874 | | | | 58,714 | |
Closing balance for cash and cash equivalents, net | | | 1,699,458 | | | | 4,184,700 | | | | 4,182,512 | |
| | | | | | | | | | | | |
| | | |
Additional information to the statement of cash flows | | | | | | | | | | | | |
Interest income received | | | 213,231 | | | | 148,181 | | | | 300,706 | |
Interest expense paid | | | -87,867 | | | | -30,505 | | | | -72,473 | |
The accompanying notes are an integral part of these financial statements.
The cash flow statement has been prepared using the indirect method and cash flow items cannot be directly concluded from the statements of financial positions.
15 | Interim Financial Report
Notes to the interim financial statements
Note 1: Segment information
Operating segments are reported in a manner consistent with the internal reporting provided to the chief operating decision maker (“CODM”), who is responsible for allocating resources and assessing the performance of the operating segments. The CODM at NIB is the President. Segment results that are reported to the management include items directly attributable to that segment as well as other items allocated on a reasonable basis. In its segment reporting, NIB divides its operations into two major segments: lending and treasury operations. Treasury operations consist of asset and liability management, funding operations and portfolio management. Funding operations are reported as part of asset and liability management. The operating segments are explained in more detail in the Financial Report 2018, Note 3 “Segment information”.
| | | | | | | | | | | | | | | | | | | | |
In thousands of euro | | LENDING | | | ASSET AND LIABILITY
MANAGEMENT | | | PORTFOLIO MANAGEMENT | | | TREASURY TOTAL | | | TOTAL | |
Net interest income | | | 76,219 | | | | 14,175 | | | | 16,120 | | | | 30,295 | | | | 106,514 | |
Commission income and fees received | | | 3,826 | | | | 1,358 | | | | — | | | | 1,358 | | | | 5,184 | |
Commission expense and fees paid | | | -37 | | | | -975 | | | | -196 | | | | -1,171 | | | | -1,208 | |
Net profit on financial operations | | | 817 | | | | -3,527 | | | | 5,516 | | | | 1,989 | | | | 2,805 | |
Foreign exchange gains and losses | | | — | | | | 33 | | | | — | | | | 33 | | | | 33 | |
Operating expenses | | | -14,750 | | | | -5,596 | | | | -2,398 | | | | -7,994 | | | | -22,743 | |
Net loan losses | | | 4,071 | | | | — | | | | — | | | | — | | | | 4,071 | |
| | | | | | | | | | | | | | | | | | | | |
Profit for period ended 30 June 2019 | | | 70,147 | | | | 5,468 | | | | 19,042 | | | | 24,510 | | | | 94,657 | |
| | | | | | | | | | | | | | | | | | | | |
16 | Interim Financial Report
| | | | | | | | | | | | | | | | | | | | |
In thousands of euro | | LENDING | | | ASSET AND LIABILITY
MANAGEMENT | | | PORTFOLIO MANAGEMENT | | | TREASURY TOTAL | | | TOTAL | |
Net interest income | | | 75,464 | | | | 12,832 | | | | 23,307 | | | | 36,139 | | | | 111,603 | |
Commission income and fees received | | | 7,199 | | | | 331 | | | | 0 | | | | 331 | | | | 7,530 | |
Commission expense and fees paid | | | -40 | | | | -1,052 | | | | -511 | | | | -1,563 | | | | -1,603 | |
Net profit on financial operations | | | 274 | | | | 14,831 | | | | -1,524 | | | | 13,307 | | | | 13,580 | |
Foreign exchange gains and losses | | | — | | | | -6 | | | | — | | | | -6 | | | | -6 | |
Operating Expenses | | | -14,446 | | | | -5,468 | | | | -2,343 | | | | -7,811 | | | | -22,257 | |
Net loan losses | | | 1,577 | | | | — | | | | — | | | | — | | | | 1,577 | |
| | | | | | | | | | | | | | | | | | | | |
Profit for period ended 30 June 2018 | | | 70,028 | | | | 21,468 | | | | 18,929 | | | | 40,397 | | | | 110,424 | |
| | | | | | | | | | | | | | | | | | | | |
| | | | | |
In thousands of euro | | LENDING | | | ASSET AND LIABILITY
MANAGEMENT | | | PORTFOLIO MANAGEMENT | | | TREASURY TOTAL | | | TOTAL | |
Net interest income | | | 154,032 | | | | 27,277 | | | | 42,182 | | | | 69,459 | | | | 223,492 | |
Commission income and fees received | | | 12,415 | | | | 856 | | | | — | | | | 856 | | | | 13,271 | |
Commission expense and fees paid | | | -95 | | | | -1,551 | | | | -900 | | | | -2,451 | | | | -2,546 | |
Net profit on financial operations | | | 49 | | | | -8,619 | | | | -15,207 | | | | -23,826 | | | | -23,776 | |
Foreign exchange gains and losses | | | — | | | | -160 | | | | — | | | | -160 | | | | -160 | |
Operating expenses | | | -27,790 | | | | -10,807 | | | | -4,632 | | | | -15,438 | | | | -43,228 | |
Net loan losses | | | 5,957 | | | | — | | | | — | | | | — | | | | 5,957 | |
| | | | | | | | | | | | | | | | | | | | |
Profit for year ended 31 December 2018 | | | 144,569 | | | | 6,996 | | | | 21,444 | | | | 28,441 | | | | 173,009 | |
| | | | | | | | | | | | | | | | | | | | |
17 | Interim Financial Report
Note 2: Net interest income
| | | | | | | | | | | | |
In thousands of euro | | Jan-Jun 2019 | | | Jan-Jun 2018 | | | Jan-Dec 2018 | |
Cash and cash equivalents | | | -1,053 | | | | -5,781 | | | | -6,686 | |
Placements with credit institutions | | | -3,806 | | | | -39 | | | | -98 | |
Debt securities | | | 30,608 | | | | 30,600 | | | | 60,913 | |
Loans outstanding | | | 149,034 | | | | 126,572 | | | | 268,953 | |
Other interest income | | | 100 | | | | — | | | | — | |
| | | | | | | | | | | | |
Total, interest income | | | 174,882 | | | | 151,351 | | | | 323,082 | |
| | | |
Of which, interest income from financial assets measured at amortised cost | | | 161,883 | | | | 141,892 | | | | 298,371 | |
Short-term amounts owed to credit institutions | | | 1,196 | | | | 553 | | | | 455 | |
Long-term amounts owed to credit institutions | | | 26 | | | | 45 | | | | 72 | |
Short-term repurchase agreements | | | — | | | | 279 | | | | 345 | |
Debts evidenced by certificates | | | -281,719 | | | | -287,154 | | | | -578,171 | |
Swap contracts and other interest expenses, net | | | 212,129 | | | | 246,530 | | | | 477,708 | |
| | | | | | | | | | | | |
Total, interest expense | | | -68,368 | | | | -39,748 | | | | -99,590 | |
| | | | | | | | | | | | |
| | | |
Of which, interest expense from financial liabilities measured at amortised cost | | | -175,093 | | | | -123,393 | | | | -286,705 | |
| | | |
Net Interest Income | | | 106,514 | | | | 111,603 | | | | 223,492 | |
| | | | | | | | | | | | |
Note 3: Net profit on financial operations
| | | | | | | | | | | | |
In thousands of euro | | Jan-Jun 2019 | | | Jan-Jun 2018 | | | Jan-Dec 2018 | |
Financial instruments held at fair value, realised gains and losses | | | 57 | | | | 3,365 | | | | 7,163 | |
Financial instruments held at fair value, unrealised gains and losses | | | -5,997 | | | | 21,742 | | | | 6,484 | |
Financial instruments held at amortised cost, realised gains and losses | | | 7 | | | | 154 | | | | 154 | |
Adjustment to hedge accounting, unrealised gains and losses of fair value hedges | | | 8,826 | | | | -11,729 | | | | -37,523 | |
Repurchase of NIB bonds, other items | | | -87 | | | | 49 | | | | -54 | |
| | | | | | | | | | | | |
Net profit on financial operations | | | 2,805 | | | | 13,580 | | | | -23,776 | |
| | | | | | | | | | | | |
18 | Interim Financial Report
Note 4: Expected credit loss
| | | | | | | | | | | | | | | | |
In thousands of euro | | STAGE 1 | | | STAGE 2 | | | STAGE 3 | | | TOTAL | |
Balance at 1 January 2018 | | | 25,224 | | | | 23,291 | | | | 93,194 | | | | 141,709 | |
Transfer to Stage 1 | | | 2,694 | | | | -2,694 | | | | — | | | | 0 | |
Transfer to Stage 2 | | | -2,967 | | | | 2,967 | | | | — | | | | 0 | |
Transfer to Stage 3 | | | 0 | | | | 0 | | | | — | | | | 0 | |
New assets originated or purchased | | | 4,092 | | | | 38 | | | | — | | | | 4,130 | |
Amortisations and repayments | | | -2,146 | | | | -1,864 | | | | — | | | | -4,009 | |
Impact of remeasurment on existing assets | | | 107 | | | | -4,445 | | | | 2,643 | | | | -1,695 | |
Foreign exchange adjustments and other changes | | | — | | | | — | | | | 1,381 | | | | 1,381 | |
| | | | | | | | | | | | | | | | |
Net change income statement | | | 1,781 | | | | -5,998 | | | | 4,023 | | | | -194 | |
| | | | | | | | | | | | | | | | |
| | | | |
Balance at 30 June 2018 | | | 27,005 | | | | 17,292 | | | | 97,218 | | | | 141,515 | |
| | | | | | | | | | | | | | | | |
Transfer to Stage 1 | | | 2,182 | | | | -2,182 | | | | — | | | | 0 | |
Transfer to Stage 2 | | | 1,659 | | | | -1,659 | | | | — | | | | 0 | |
Transfer to Stage 3 | | | 0 | | | | 0 | | | | — | | | | 0 | |
New assets originated or purchased | | | 4,184 | | | | 99 | | | | — | | | | 4,283 | |
Amortisations and repayments | | | -4,366 | | | | -1,879 | | | | — | | | | -6,246 | |
Impact of remeasurment on existing assets | | | -4,582 | | | | 2,317 | | | | -174 | | | | -2,439 | |
Foreign exchange adjustments and other changes | | | — | | | | — | | | | 2,275 | | | | 2,275 | |
| | | | | | | | | | | | | | | | |
Net change income statement | | | -925 | | | | -3,304 | | | | 2,102 | | | | -2,127 | |
| | | | | | | | | | | | | | | | |
| | | | |
Realised losses | | | | | | | | | | | -19,223 | | | | -19,223 | |
| | | | |
Balance at 31 December 2018 | | | 26,080 | | | | 13,988 | | | | 80,097 | | | | 120,165 | |
| | | | | | | | | | | | | | | | |
Transfer to Stage 1 | | | 1,314 | | | | -1,314 | | | | — | | | | 0 | |
Transfer to Stage 2 | | | 0 | | | | 0 | | | | — | | | | 0 | |
Transfer to Stage 3 | | | 0 | | | | 0 | | | | — | | | | 0 | |
New assets originated or purchased | | | 3,482 | | | | 67 | | | | — | | | | 3,549 | |
Amortisations and repayments | | | -2,973 | | | | -1,431 | | | | — | | | | -4,403 | |
Impact of remeasurment on existing assets | | | -130 | | | | -1,653 | | | | -1,387 | | | | -3,170 | |
Foreign exchange adjustments and other changes | | | — | | | | — | | | | 603 | | | | 603 | |
| | | | | | | | | | | | | | | | |
Net change income statement | | | 1,693 | | | | -4,331 | | | | -784 | | | | -3,423 | |
| | | | | | | | | | | | | | | | |
| | | | |
Balance at 30 June 2019 | | | 27,773 | | | | 9,657 | | | | 79,313 | | | | 116,741 | |
| | | | | | | | | | | | | | | | |
| | | | | | | | | | | | |
ECL - STATEMENT OF FINANCIAL POSITION | | | | | | | | | | | | |
| | | |
In thousands of euro | | 30 Jun 2019 | | | 30 Jun 2018 | | | 31 Dec 2018 | |
Financial placements | | | 326 | | | | 304 | | | | 281 | |
Loans outstanding and commitments | | | 116,415 | | | | 141,211 | | | | 119,883 | |
| | | | | | | | | | | | |
Total | | | 116,741 | | | | 141,515 | | | | 120,165 | |
| | | | | | | | | | | | |
| | | |
ECL - STATEMENT OF COMPREHENSIVE INCOME | | | | | | | | | | | | |
| | | |
In thousands of euro | | Jan-Jun 2019 | | | Jun-Dec 2018 | | | Jan-Jun 2018 | |
Net result on financial operations | | | -44 | | | | 20 | | | | -2 | |
Net loan losses (Note 5) | | | 4,071 | | | | 4,381 | | | | 1,577 | |
Foreign exchange gains and losses | | | -603 | | | | -2,275 | | | | -1,381 | |
| | | | | | | | | | | | |
Total recognised in income statement | | | 3,423 | | | | 2,127 | | | | 194 | |
| | | | | | | | | | | | |
Note 5: Net loan losses
| | | | | | | | | | | | |
In thousands of euro | | Jan-Jun 2019 | | | Jan-Jun 2018 | | | Jan-Dec 2018 | |
Change in expected credit loss on performing loans | | | 2,684 | | | | 4,220 | | | | 8,426 | |
Change in expected credit loss on non-performing loans | | | 1,387 | | | | -2,643 | | | | -2,469 | |
Decrease of provisions to cover realised loan losses | | | 0 | | | | 0 | | | | 19,223 | |
Realised loan losses | | | 0 | | | | 0 | | | | -19,223 | |
| | | | | | | | | | | | |
Net loan losses | | | 4,071 | | | | 1,577 | | | | 5,957 | |
| | | | | | | | | | | | |
The gains recognised for “Net loan Losses” arise from the improved credit quality of the loan portfolio during the periods under review. There were no realised losses for the periods Jan-Jun 2019 or Jan-Jun 2018. In the period Sep-Dec 2018, the Bank recorded realised losses of EUR 19,223 thousand comprising principal of EUR 18,978 and interest of EUR 245 thousand.
19 | Interim Financial Report
Note 6: Classification of financial instruments
| | | | | | | | | | | | | | | | |
In millions of euro | | AMORTISED
COST (AC) | | | FAIR VALUE
TROUGH
PROFIT AND
LOSS (FVTPL) | | | DERIVATIVES
FOR
HEDGING | | | TOTAL | |
Financial assets | | | | | | | | | | | | | | | | |
Cash and cash equivalents | | | 1,074 | | | | 1,318 | | | | — | | | | 2,391 | |
Financial placements with credit institutions | | | 9 | | | | 2,122 | | | | — | | | | 2,131 | |
Debt securities | | | 2,018 | | | | 4,543 | | | | — | | | | 6,561 | |
Other financial placements | | | — | | | | 15 | | | | — | | | | 15 | |
Loans outstanding | | | 18,682 | | | | 33 | | | | — | | | | 18,715 | |
Derivatives | | | — | | | | 741 | | | | 607 | | | | 1,349 | |
| | | | | | | | | | | | | | | | |
Total 30 June 2019 | | | 21,783 | | | | 8,772 | | | | 607 | | | | 31,161 | |
| | | | |
Financial liabilities | | | | | | | | | | | | | | | | |
Short-term amounts owed to credit institutions | | | 692 | | | | — | | | | — | | | | 692 | |
Long-term amounts owed to credit institutions | | | 8 | | | | — | | | | — | | | | 8 | |
Debt securities issued | | | 24,743 | | | | 855 | | | | — | | | | 25,598 | |
Derivatives | | | — | | | | 199 | | | | 1090 | | | | 1,289 | |
| | | | | | | | | | | | | | | | |
Total 30 June 2019 | | | 25,443 | | | | 1,054 | | | | 1,090 | | | | 27,587 | |
| | | | | | | | | | | | | | | | |
| | | | | | | | | | | | | | | | |
In millions of euro | | AMORTISED
COST (AC) | | | FAIR VALUE
TROUGH
PROFIT AND
LOSS (FVTPL) | | | DERIVATIVES
FOR
HEDGING | | | TOTAL | |
Financial assets | | | | | | | | | | | | | | | | |
Cash and cash equivalents | | | 1,644 | | | | 3,044 | | | | — | | | | 4,688 | |
Financial placements with credit institutions | | | 9 | | | | — | | | | — | | | | 9 | |
Debt securities | | | 2,474 | | | | 4,298 | | | | — | | | | 6,772 | |
Other financial placements | | | — | | | | 16 | | | | — | | | | 16 | |
Loans outstanding | | | 17,966 | | | | 301 | | | | — | | | | 18,267 | |
Derivatives | | | — | | | | 537 | | | | 495 | | | | 1,032 | |
| | | | | | | | | | | | | | | | |
Total 30 June 2018 | | | 22,093 | | | | 8,196 | | | | 495 | | | | 30,784 | |
| | | | |
Financial liabilities | | | | | | | | | | | | | | | | |
Short-term amounts owed to credit institutions | | | 503 | | | | — | | | | — | | | | 503 | |
Long-term amounts owed to credit institutions | | | 9 | | | | — | | | | — | | | | 9 | |
Debt securities issued | | | 25,132 | | | | — | | | | — | | | | 25,132 | |
Derivatives | | | — | | | | 214 | | | | 1,468 | | | | 1,683 | |
| | | | | | | | | | | | | | | | |
Total 30 June 2018 | | | 25,644 | | | | 214 | | | | 1,468 | | | | 27,327 | |
| | | | | | | | | | | | | | | | |
20 | Interim Financial Report
Note 7: Fair value of financial assets and liabilities
| | | | | | | | | | | | | | | | | | | | | | | | |
| | | 30 Jun 2019 | | | 30 Jun 2018 | | | 31 Dec 2018 | |
In millions of euro | | CARRYING
AMOUNT | | | FAIR
VALUE | | | CARRYING
AMOUNT | | | FAIR
VALUE | | | CARRYING
AMOUNT | | | FAIR
VALUE | |
Financial assets | | | | | | | | | | | | | | | | | | | | | | | | |
Cash and cash equivalents | | | 2,391 | | | | 2,390 | | | | 4,688 | | | | 4,687 | | | | 4,758 | | | | 4,758 | |
Financial placements with credit institutions | | | 2,131 | | | | 2,131 | | | | 9 | | | | 9 | | | | 9 | | | | 9 | |
Debt securities | | | 6,561 | | | | 6,635 | | | | 6,722 | | | | 6,839 | | | | 6,455 | | | | 6,509 | |
Other financial placements | | | 15 | | | | 15 | | | | 16 | | | | 16 | | | | 16 | | | | 16 | |
Loans outstanding | | | 18,715 | | | | 18,915 | | | | 18,267 | | | | 18,274 | | | | 19,065 | | | | 19,059 | |
Derivatives | | | 1,349 | | | | 1,349 | | | | 1,032 | | | | 1,032 | | | | 1,068 | | | | 1,068 | |
| | | | | | | | | | | | | | | | | | | | | | | | |
Total | | | 31,161 | | | | 31,434 | | | | 30,734 | | | | 30,857 | | | | 31,371 | | | | 31,419 | |
| | | | | | |
Financial liabilities | | | | | | | | | | | | | | | | | | | | | | | | |
Short-term amounts owed to credit institutions | | | 692 | | | | 692 | | | | 503 | | | | 503 | | | | 575 | | | | 575 | |
Long-term amounts owed to credit institutions | | | 8 | | | | 8 | | | | 9 | | | | 9 | | | | 9 | | | | 9 | |
Debt securities issued | | | 25,598 | | | | 24,501 | | | | 25,132 | | | | 25,132 | | | | 26,651 | | | | 26,651 | |
Derivatives | | | 1,289 | | | | 1,289 | | | | 1,683 | | | | 1,683 | | | | 1,649 | | | | 1,649 | |
| | | | | | | | | | | | | | | | | | | | | | | | |
Total | | | 27,587 | | | | 26,490 | | | | 27,327 | | | | 27,327 | | | | 28,885 | | | | 28,885 | |
| | | | | | | | | | | | | | | | | | | | | | | | |
The determination of fair value is described in the Financial Report 2018, Note 1 “Accounting policies”.
Note 8: Loans outstanding
| | | | | | | | | | | | |
In thousands of euro | | Jan-Jun 2019 | | | Jul-Dec 2018 | | | Jan-Jun 2018 | |
Opening Balance | | | 19,065,056 | | | | 18,266,843 | | | | 17,231,623 | |
Disbursements | | | 1,483,726 | | | | 1,893,515 | | | | 2,153,195 | |
Amortisations | | | -798,003 | | | | -746,854 | | | | -790,138 | |
Prepayments | | | -1,083,452 | | | | -319,051 | | | | -257,627 | |
Changes in expected credit losses (note 4) | | | 3,691 | | | | 4,767 | | | | 1,456 | |
Foreign exchange movements | | | 1,081 | | | | -34,423 | | | | -57,982 | |
Valuations and hedge accounting | | | 90,990 | | | | 1,157 | | | | -13,684 | |
Reclassifications and other movements | | | -48,494 | | | | -897 | | | | — | |
| | | | | | | | | | | | |
Closing balance | | | 18,714,595 | | | | 19,065,056 | | | | 18,266,843 | |
| | | | | | | | | | | | |
See Note 6 and Note 7 for classification and fair value of loans outstanding.
Note 9: Debts evidenced by certificates
| | | | | | | | | | | | |
In thousands of euro | | Jan-Jun 2019 | | | Jul-Dec 2018 | | | Jan-Jun 2018 | |
Opening Balance | | | 25,651,370 | | | | 25,132,130 | | | | 23,999,754 | |
New debt issues | | | 2,894,531 | | | | 1,416,300 | | | | 5,203,371 | |
Amortisations | | | -3,128,094 | | | | -1,044,801 | | | | -3,677,542 | |
Calls and buy backs | | | -459,326 | | | | -19,094 | | | | -166,007 | |
Foreign exchange movements | | | 67,115 | | | | 3,731 | | | | -10,802 | |
Valuations and hedge accounting | | | 572,361 | | | | 171,404 | | | | -208,132 | |
Transfers and other | | | — | | | | -8,300 | | | | -8,512 | |
| | | | | | | | | | | | |
Closing balance | | | 25,597,957 | | | | 25,651,370 | | | | 25,132,130 | |
| | | | | | | | | | | | |
See Note 6 and Note 7 for classification and fair value of debts evidenced by certificates.
21 | Interim Financial Report
Note 10: Basis of preparation
The interim financial statements are presented in accordance with IAS 34 “Interim Financial Reporting”. The accounting policies and methods of computation are the same as described in Note 1 of NIB’s Financial Report 2018, with the exception of IFRS 16, as described below.
IFRS 16 Leases substantially changed the accounting treatment by recognising more leases as liabilities with corresponding right of use assets on the balance sheet. The standard replaced IAS 17 Leases and is effective as of 1 January 2019. However, the Bank does not have significant leasing commitments and therefore the new standard had an immaterial impact.
There have been no material post balance sheet events that would require disclosure or adjustment to these financial statements.
There have been no material changes in relation to transactions with related parties compared to those described in Note 24 “Related party disclosures” in the 2018 Annual Report.
RATIO DEFINITIONS
| | |
| Equity/total assets = | | Total equality at reporting date Total assets at reporting date |
| |
| Profit/average equity = | | Annualised profit for the period Average equity for the period |
| |
| Cost/income = | | Total operating expenses for the period Total operating income for the period |
HELSINKI, 28 AUGUST 2019
| | | | |
| | Sven Hegelund (Chairman) | | |
| | |
| Julie Sonne | | Madis Üürike | | Pekka Morén |
| | |
Esther Finnbogadóttir (Deputy Chairman) | | Kaspars Ãbolinš | | Jurgita Uzieliené |
| | |
| Silje Gamstøbakk | | | | |
| | |
Henrik Normann (President & CEO) | | | | |
22 | Interim Financial Report
Review Opinion
To the Board of Directors of Nordic Investment Bank
Report on Review of Interim Financial Report
INTRODUCTION
We have reviewed the interim financial report of Nordic Investment Bank consisting of balance sheet as of June 30, 2019 and the related statements of income, changes in equity and cash flows for the six-month period then ended, and a summary of significant accounting policies and other explanatory notes.
Management is responsible for the preparation and fair presentation of this interim financial report in accordance with IAS 34. Our responsibility is to express a conclusion on this interim financial report based on our review.
SCOPE OF REVIEW
We conducted our review in accordance with International Standard on Review Engagements 2410, “Review of Interim Financial Information Performed by the Independent Auditor of the Entity.”
A review of the interim financial report consists of making inquiries, primarily of persons responsible for financial and accounting matters, and applying analytical and other review procedures. A review is substantially less in scope than an audit conducted in accordance with International Standards on Auditing and consequently does not enable us to obtain assurance that we would become aware of all significant matters that might be identified in an audit. Accordingly, we do not express an audit opinion.
CONCLUSION
Based on our review, nothing has come to our attention that causes us to believe that the accompanying interim financial report does not present fairly, in all material respects, the financial position of the entity as at June 30, 2019, and of its financial performance and its cash flows for the six-month period then ended in accordance with IAS 34.
Helsinki, 28 August 2019
| | |
| Ernst & Young Oy | | Ernst & Young AB |
| Authorized Public | | Authorized Public |
| Accountant Firm | | Accountant Firm |
| |
| Terhi Mäkinen | | Mona Alfredsson |
| Authorized Public | | Authorized Public |
| Accountant | | Accountant |
23 | Interim Financial Report