Highlights
The Nordic Investment Bank has been established to serve societal interests. In practice this is done by financing projects that improve productivity and benefit the environment of the Nordic and Baltic countries. In order to fulfil its purpose efficiently, the Bank needs to be financially strong.
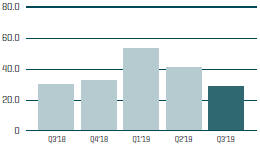
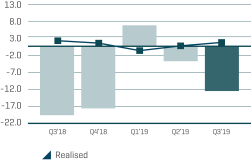
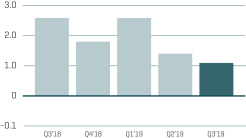
During the nine month period ending 30 September 2019, a total of EUR 1,608 million in new loans were agreed and EUR 1,799 million were disbursed. The disbursements were lower than the historically high level of 2018. The net profit for the period amounted to EUR 123 million, down from EUR 141 million for the corresponding period in 2018.
In January, NIB issued its first Nordic–Baltic Blue Bond. The five-year SEK 2 billion bond was launched under the NIB Environmental Bond Framework and the proceeds will finance investments in water resource management and protection.
At its annual meeting on 24 May 2019, the Nordic Investment Bank’s Board of Governors approved amendments to NIB’s Statutes, which will be submitted to undergo the required national procedures of member countries. The intent of the amendments is to ensure continued adherence with sound banking principles and maintain the Bank’s relevance to fulfil its mandate.
In July, NIB issued a new 20-year DKK 1 billion benchmark issue. This is the first bond NIB has listed on Nasdaq Copenhagen and the first DKK issue after more than a twenty year absence in this market.
In September, Japan’s Government Pension Investment Fund (GPIF) and NIB launched a joint collaboration to promote the integration of environmental, social and governance (ESG) considerations in investment decisions and the growth of sustainable finance markets.
Key figures and ratios
| | | | | | | | | | | | |
In millions of euro unless otherwise specified | | Jan-Sep 2019* | | | Jan-Sep 2018* | | | Jan-Dec 2018 | |
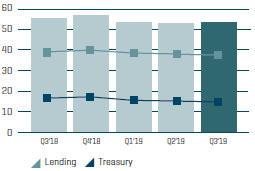
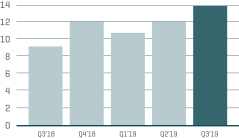
Net interest income | | | 160 | | | | 167 | | | | 223 | |
Profit before net loan losses | | | 118 | | | | 136 | | | | 167 | |
Net profit | | | 123 | | | | 141 | | | | 173 | |
Loans disbursed | | | 1,799 | | | | 2,606 | | | | 4,047 | |
Loans agreed | | | 1,608 | | | | 2,534 | | | | 4,330 | |
Mandate fulfilment ** | | | 99 | % | | | 88 | % | | | 91 | % |
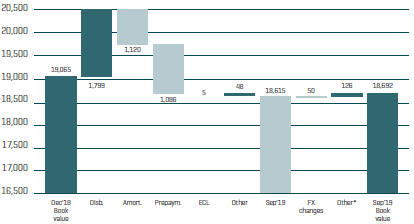
Loans outstanding | | | 18,627 | | | | 18,508 | | | | 19,065 | |
Total assets | | | 32,722 | | | | 31,206 | | | | 31,710 | |
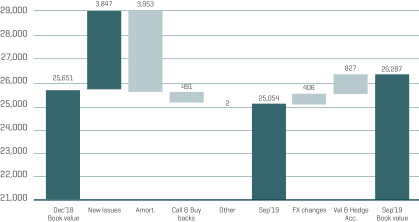
New debt issues | | | 3,847 | | | | 6,224 | | | | 6,620 | |
Debts evidenced by certificates | | | 26,287 | | | | 24,935 | | | | 25,651 | |
Total equity | | | 3,673 | | | | 3,536 | | | | 3,578 | |
Equity/total assets *** | | | 11.2 | % | | | 11.3 | % | | | 11.3 | % |
Profit/average equity *** | | | 4.5 | % | | | 5.3 | % | | | 4.9 | % |
Cost/income *** | | | 23.7 | % | | | 18.7 | % | | | 20.6 | % |
Number of employees (average during the period) | | | 198 | | | | 197 | | | | 197 | |
| * | Unaudited figures, to be read in conjunction with NIB’s 2018 audited financial statements |
| ** | See page 7 for mandate fulfilment explanation |
| *** | See page 17 for ratio definitions |
3 | Interim Management Statement