| | |

| | |
FINANCIAL REPORT 2021 | | NIB FINANCIAL REPORT 2021 / 2 |
| | |
| | |
| | |
FINANCIAL REPORT 2021 | | NIB FINANCIAL REPORT 2021 / 3 |
| | |
|
| |
| REPORT OF THE BOARD OF DIRECTORS |
| |
PRESIDENT AND CEO’S COMMENTS |
| |
| OPERATING AND FINANCIAL REVIEW |
| |
| CAPITAL AND LIQUIDITY MANAGEMENT |
| |
| FINANCIAL STATEMENTS |
| |
| PROPOSAL BY THE BOARD OF DIRECTORS |
| |
| AUDITOR’S REPORT |
| |
| GOVERNANCE STATEMENT |
| |
| REPORT OF THE CONTROL COMMITTEE CHAIRMANSHIP |
| |
| REPORT OF THE CONTROL COMMITTEE |
| |
| |
| |
| |
| |
| |
| |
| |
| |
| |
| |
| |
| |
| |
| |
| |
| |
| |
| |
| |
| |
| |
| |
| |
| |
| |
| |
| |
| |
| |
| |
| |
|
Report of the Board of Directors
SUMMARY
In 2021, the COVID-19 pandemic continued to affect the Nordic-Baltic economies. At the same time, investment activity was low. Consequently, NIB’s lending volumes normalised after record-high activity in 2020. A total of EUR 2,440 million was disbursed (EUR 4,853 million in 2020), of which EUR 340 million was disbursed as COVID Response Loans (EUR 1,470 million in 2020).
NIB continued to provide long-term financing to projects that deliver a lasting impact on the productivity and environment of the region. Loans achieving ratings of “good” or “excellent” on at least one of these mandates accounted for 97% of the total amount of disbursed funds (from the rated projects). Some 73% of the total loans disbursed and rated were channelled to projects that provide environmental benefits, which reflects both the goal set by the Board to increase environmental lending as well as the growing interest for sustainable finance. During the year, NIB disbursed its first sustainability linked loans.
In 2021, NIB raised new funding with a nominal value of EUR 6.9 billion through 71 bond transactions. The Bank marked its 10th anniversary as an issuer of green and blue bonds by raising a total of EUR 898 million in NIB Environmental Bonds (NEBs), consisting of a six-year EUR 500 million bond, a five-year SEK 3 billion bond and an inaugural NOK 1 billion bond.
The net profit of EUR 159.2 million for the year was EUR 5.5 million lower than in 2020.
The Board of Directors proposes to the Board of Governors that a sum of EUR 40 million be distributed to the Banks’ member countries from the 2021 net profit as dividend, which equates to a pay-out ratio of 25% of net profit.
NIB launched its revised Sustainability Policy, which describes the principles and commitments the Bank follows. The policy defines a new set of ambitions for NIB and takes a decisive stance against fossil fuels. The assessment of ESG performance at counterparty level is incorporated.
NIB’s Board of Directors completed a review of the Bank’s business strategy. The mission to finance projects that improve productivity and benefit the environment was re-confirmed, as was the importance of the Bank’s triple-A credit rating. NIB will continue to develop on its product offering and increase its activity in under-served market segments to better meet the needs of its customers and owners.
The Bank’s stakeholder survey confirmed that NIB has a leading position as a provider of sustainable long-term financing in the Nordic–Baltic region.
The Board approved the new Capital and Liquidity Recovery Plan. This aligns the Bank’s risk management framework with the recent statutory changes and the requirements set out in the Board of Governor’s Principles. NIB has a strong capital and liquidity position.
| | |
On the Board’s agenda In 2021, NIB celebrated its 45th anniversary. To continue to deliver on our mission in the future, the Board reviewed NIB’s business strategy. The foundations of the Bank are solid, and NIB’s |

| | triple-A credit rating continues to be the cornerstone of the business model. The Bank is committed to playing its part as a financier of a sustainable Nordic–Baltic region in line with the climate goals of the Paris Agreement and supporting the green transition by further developing our product offering. Esther Finnbogadóttir Chair of the Board of Directors |
| | |
| | |
FINANCIAL REPORT 2021 | | NIB FINANCIAL REPORT 2021 / 4 |
| | |
|
| |
| REPORT OF THE BOARD OF DIRECTORS |
| |
PRESIDENT AND CEO’S COMMENTS |
| |
| OPERATING AND FINANCIAL REVIEW |
| |
| CAPITAL AND LIQUIDITY MANAGEMENT |
| |
| FINANCIAL STATEMENTS |
| |
| PROPOSAL BY THE BOARD OF DIRECTORS |
| |
| AUDITOR’S REPORT |
| |
| GOVERNANCE STATEMENT |
| |
| REPORT OF THE CONTROL COMMITTEE CHAIRMANSHIP |
| |
| REPORT OF THE CONTROL COMMITTEE |
| |
| |
| |
| |
| |
| |
| |
| |
| |
| |
| |
| |
| |
| |
| |
| |
| |
| |
| |
| |
| |
| |
| |
| |
| |
| |
| |
| |
| |
| |
| |
| |
|
OPERATING ENVIRONMENT
The COVID-19 pandemic continued to affect both the global and the Nordic–Baltic economies in 2021. The emergence of new virus variants and uneven vaccination rates have affected economies to varying degrees. Still, the Nordic and Baltic economies were less volatile on average, experiencing lower contraction in 2020 and smaller subsequent recovery in 2021 than the rest of the world.
The majority of advanced economies posted a strong recovery, driven by private consumption growth and policy support. Central banks continued to provide abundant liquidity to the financial system. As a result, interest rates remained at historically low levels. At the same time, investment activity was low due to high levels of uncertainty. All this affected the overall demand for financing negatively.
The second half of the year was characterised by negative supply-chains effects and labour market shortages. A significant increase in energy prices slowly started to feed into producer and consumer prices, subsequently increasing the headline inflation pressure. At the end of 2021, the emergence of new virus variant, Omicron, introduced more uncertainty to the economic outlook.
STRATEGY REVIEW
NIB’s Board of Directors completed a review of the Bank’s business strategy in 2021. The Board re-confirmed NIB’s mission – to finance projects that improve productivity and benefit the environment of the Nordic and Baltic countries. The twin environment and productivity mandates remain equally relevant.
The COP26 conference further highlighted the urgency of climate action and the important role of IFIs and the private sector in mobilising climate finance. NIB will increase its climate finance activities, focusing on financing high-impact transitions in hard-to-abate sectors. Further, NIB will support the development of sustainable finance and capital markets in its member countries by broadening its product offering and promoting high quality standard.
Development of the client value proposition is central to the updated strategy. This will be achieved by broadening the Bank’s product offering, localising and digitalising services, and combining sustainability expertise with its investment products. Development of the product offering includes: (i) sustainability-linked lending, (ii) increasing activity in the sub-investment grade and mid-cap market segments, (iii) expanding bond investments, (iv) developing risk-sharing models such as InvestEU, and (v) providing MREL (minimum requirement for own funds and eligible liabilities) lending to financial institutions for SME financing. NIB will continue to focus on long-term lending and increase its activity in under-served market segments within the limits of its risk appetite.
NIB will also develop its value proposition for its member countries, with a focus on topics that are of high common interest, contributing to decarbonisation plans and sustainable finance. In addition, there is the potential for NIB to amplify its impact through partnerships with official agencies and institutions. NIB will maintain capital headroom for counter-cyclical lending and financing projects of special importance to its owners.
NIB’s triple-A credit rating continues to be the cornerstone of the Bank’s business model. The objective is to sustain profitability by broadening NIB’s engagement across client segments, reducing concentrations in low return market segments, moderately increasing risk-taking in line with its Risk Appetite Statement, managing the balance sheet actively, and improving the efficiency of its business process.
| | |
| | |
FINANCIAL REPORT 2021 | | NIB FINANCIAL REPORT 2021 / 5 |
| | |
|
| |
| REPORT OF THE BOARD OF DIRECTORS |
| |
PRESIDENT AND CEO’S COMMENTS |
| |
| OPERATING AND FINANCIAL REVIEW |
| |
| CAPITAL AND LIQUIDITY MANAGEMENT |
| |
| FINANCIAL STATEMENTS |
| |
| PROPOSAL BY THE BOARD OF DIRECTORS |
| |
| AUDITOR’S REPORT |
| |
| GOVERNANCE STATEMENT |
| |
| REPORT OF THE CONTROL COMMITTEE CHAIRMANSHIP |
| |
| REPORT OF THE CONTROL COMMITTEE |
LENDING
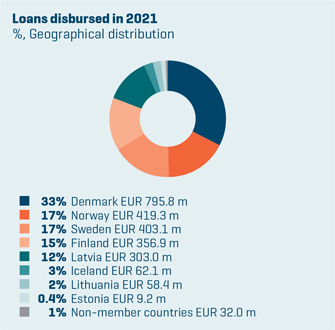
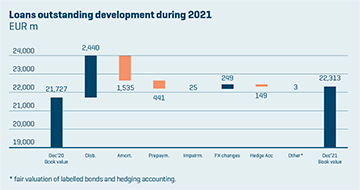
Against the backdrop of the changing operating environment, NIB’s lending volumes normalised in 2021, following the record high lending of 2020 that was driven by the Bank’s COVID response. NIB continued to provide long-term financing to projects that deliver lasting impact on the productivity and environment of the region. A total of EUR 2,440 million in loans was disbursed (EUR 4,853 million in 2020), of which EUR 340 million was disbursed as Response Loans (EUR 1,470 million in 2020). The decreased demand was reflected in the volume of agreed loans which was EUR 1,852 million (EUR 5,666 million in 2020).
Lending outstanding at year-end amounted to EUR 22,313 million (EUR 21,727 million in 2020). Despite the business impact of the pandemic and the uncertain outlook, credit risk in the portfolio remained stable.
LENDING KEY FIGURES
| | | | | | | | | | | | | | | | | | | | |
| | | | | | |
In millions of
euros, unless
otherwise specified | | 2017 | | | 2018 | | | 2019 | | | 2020 | | | 2021 | |
| | | | | |
Loans agreed (without labelled bond and CP investments) | | | 3,665 | | | | 4,269 | | | | 3,185 | | | | 5,632 | | | | 1,683 | |
| | | | | |
Labelled bond and CP investments, total | | | 147 | | | | 61 | | | | 131 | | | | 34 | | | | 169 | |
| | | | | |
Total disbursements | | | 3,147 | | | | 4,047 | | | | 2,676 | | | | 4,853 | | | | 2,440 | |
| | | | | |
Number of loan agreements | | | 55 | | | | 58 | | | | 55 | | | | 59 | | | | 36 | |
| | | | | |
Number of labelled bond and CP investments | | | 9 | | | | 3 | | | | 9 | | | | 4 | | | | 14 | |
| | | | | |
Repayments/prepayments | | | 1,832 | | | | 577 | | | | 2,826 | | | | -1 878 | | | | -1,989 | |
| | | | | |
Lending outstanding | | | 17,232 | | | | 19,065 | | | | 18,931 | | | | 21,727 | | | | 22,313 | |
| | | | | |
Member countries | | | 15,867 | | | | 17,960 | | | | 18,055 | | | | 21,098 | | | | 21,827 | |
| | | | | |
Non-member countries | | | 1,504 | | | | 1,222 | | | | 996 | | | | 798 | | | | 635 | |
| | | | | |
Loan impairment provision | | | -139 | | | | -117 | | | | -119 | | | | -169 | | | | -150 | |
| | |
| | |
FINANCIAL REPORT 2021 | | NIB FINANCIAL REPORT 2021 / 6 |
| | |
|
| |
| REPORT OF THE BOARD OF DIRECTORS |
| |
PRESIDENT AND CEO’S COMMENTS |
| |
| OPERATING AND FINANCIAL REVIEW |
| |
| CAPITAL AND LIQUIDITY MANAGEMENT |
| |
| FINANCIAL STATEMENTS |
| |
| PROPOSAL BY THE BOARD OF DIRECTORS |
| |
| AUDITOR’S REPORT |
| |
| GOVERNANCE STATEMENT |
| |
| REPORT OF THE CONTROL COMMITTEE CHAIRMANSHIP |
| |
| REPORT OF THE CONTROL COMMITTEE |
| |
| |
| |
| |
| |
| |
| |
| |
| |
| |
| |
| |
| |
| |
| |
| |
| |
| |
| |
| |
| |
| |
| |
| |
| |
| |
| |
| |
| |
| |
| |
| |
|
MISSION FULFILMENT
Projects considered for financing are expected to contribute to the fulfilment of NIB’s mission and are assessed and rated for their potential impacts on productivity and the environment on a scale from “negative” to “excellent”. At least 90% of loans (by disbursement) should achieve a “good” or “excellent” rating in at least one of these two mandates.
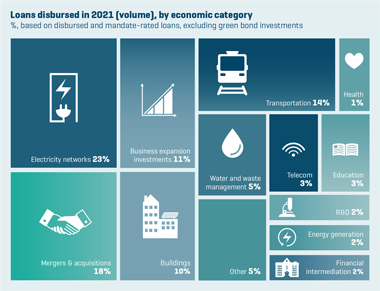
In 2021, loans achieving ratings of “good” or “excellent” on at least one of the mandates accounted for 97% of the total amount of disbursed funds (from the rated projects), and 41% of projects were rated “good” or “excellent” on both mandates. 2.7% of total disbursed and rated loans went to projects within the transport and energy sectors that received a negative environmental mandate rating. The rationale for financing such projects is the positive contribution to productivity in the region.
As shown in the graph below, 65.6% of NIB’s loans disbursed and rated were channelled to projects that significantly contribute to improvements in terms of productivity (for the member country companies and, more importantly, the wider economy). Some 72.8% of the total loans disbursed and rated were channelled to projects with “good” or “excellent” environmental benefits. This high share of
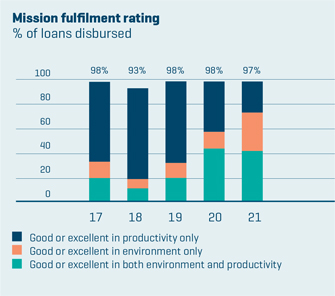
environmental mandate fulfilment reflects both the goal set by the Board to increase environmental lending as well as the growing interest for sustainable finance.
Three years after a NIB-financed project has been completed, the Bank’s analysts follow up on the actual impact the project has had, compared to the impact that was anticipated in the ex-ante analysis stage. In 2021, 15 such ex-post assessments were completed. Roughly, 90% of the ex-ante identified impacts have materialised or partly materialised. NIB uses these results to further develop its mandate rating methodology and apply the lessons learned to the assessment of future projects.
IMPACT
In 2021, the operational environment continued to be affected by the pandemic. Strong governmental policy support, various recovery instruments and accommodative monetary policy impacted the debt market. As mentioned above, the year 2020 was extraordinary in terms of NIB’s lending volumes, mainly due to the Bank’s COVID Response. Compared to 2020 levels, the lower levels of disbursements in 2021 led also to somewhat lower identifiable project-related impacts. Moreover, in 2021, the total disbursement numbers were affected by a couple of large disbursements to individual projects. Therefore, the top ten largest disbursements represent 59% of total disbursements of the year (excluding COVID Response loans).
Productivity
From a sectoral perspective, 2021 has been characterised by a relatively large share of disbursements (EUR 434 million, 22.8% of total mandate rated and disbursed loans) made to projects in the sector of electricity distribution and transmission (395 km of transmission lines, including trans-border connections and connections to renewable energy generation) in Norway, Denmark, Iceland, and Finland.
Given the decarbonisation strategies of NIB’s member countries and the need for further electrification of the economies, investments in grids play a critical role, both from the economic and environmental perspectives. This became especially important in the second half of the year, when the Nordic–Baltic region, along with the rest of Europe, experienced high price volatility in both the natural gas and electricity markets. The situation clearly highlighted a need to further strengthen transmission, balancing and storage capacities in parallel to the roll-out of new generation capacities.
| | |
| | |
FINANCIAL REPORT 2021 | | NIB FINANCIAL REPORT 2021 / 7 |
| | |
|
| |
| REPORT OF THE BOARD OF DIRECTORS |
| |
PRESIDENT AND CEO’S COMMENTS |
| |
| OPERATING AND FINANCIAL REVIEW |
| |
| CAPITAL AND LIQUIDITY MANAGEMENT |
| |
| FINANCIAL STATEMENTS |
| |
| PROPOSAL BY THE BOARD OF DIRECTORS |
| |
| AUDITOR’S REPORT |
| |
| GOVERNANCE STATEMENT |
| |
| REPORT OF THE CONTROL COMMITTEE CHAIRMANSHIP |
| |
| REPORT OF THE CONTROL COMMITTEE |
| |
| |
| |
| |
| |
| |
| |
| |
| |
| |
| |
| |
| |
| |
| |
| |
| |
| |
| |
| |
| |
| |
| |
| |
| |
| |
| |
| |
| |
| |
| |
| |
|
The second largest group of disbursements financed mergers and acquisitions (M&A) (EUR 346 million, 18.2%) in Denmark and Norway. For NIB, it is not enough to just finance these activities. What matters are the potential synergies (financial, manufacturing, and logistical) and new possibilities (including access to new markets, suppliers, and capital injections) that are created as a result of the acquisition, as is the sharing of skills, knowledge, and know-how.
EUR 209 million (11%) were channelled to general business expansion investments in Lithuania, Finland, Sweden and Germany, mostly in the manufacturing sector. Most of the investments included expansion of business either in a new location or by expanding the existing production facilities. These types of loans are crucially important for productivity, since they are financing the creation of tangible assets, which are often more efficient than existing ones. Therefore, they enhance the competitiveness of Nordic–Baltic companies.
Loans covering transportation infrastructure and vehicles in Finland, Denmark, Lithuania and Estonia accounted for EUR 262 million (13.7%). The investments cover a wide array of projects – airports, ports, railway rolling stock, municipal light traffic road infrastructure and public transportation. These investments are necessary for the mobility of people and goods.
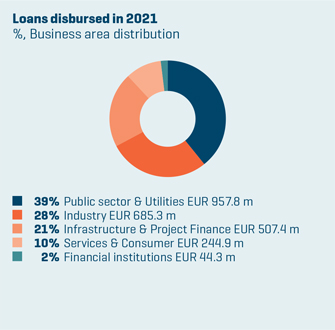
The rest of disbursements are spread out roughly evenly over the other sectors, among which the largest were waste and water management projects (EUR 100 million, 5.3%) and educational and healthcare infrastructure (EUR 78 million, 4.1%). Compared to previous years, less than usual has been disbursed to financial institutions (EUR 44 million, 2.3%).
Environment
The total environmental impact figures also decreased in 2021. This is partly due to lower disbursements, partly due to fewer energy generation investments and more enabling projects (M&As, electricity networks, municipality investment programmes) being financed. Enabling projects typically have less quantifiable impacts.
However, the importance of financing enabling activities should not be underestimated. The above-mentioned expansion and strengthening of electricity grids in four member countries enabled the connection of additional renewable energy to the network (1,072 MW) and increased electricity transmission. Electrification is seen as a key pillar in building a sustainable society and requires significant investments into transmission and distribution systems. Transport is a sector where electrification plays a crucial role in phasing out fossil fuels and where absolute impacts are challenging to quantify. NIB has not only financed
electrification of rail transport, but also the development and manufacturing of batteries for electrified road transports.
Overall, the total disbursements contributed to quantifiable impacts of 41,000 tonnes of net CO2 emissions reduced or avoided annually (396,000 tonnes in 2020), and total expected renewable energy generation annually of 39 GWh (738 GWh in 2020).
NIB’s first sustainability-linked loans were disbursed in 2021. These loans are connected to a few key performance indicators (KPI’s) in a company’s overall sustainability strategy. The intention is to support the achievement of company-level sustainability targets. Thus, the impact reporting for sustainability-linked loans differs from project-specific financing. M&A are another example where environmental benefits are assessed at company level and for which quantifying impact is difficult. Most M&A’s are considered neutral in terms of environmental impact, however, in 2021, one project was identified to bring significant environmental benefits within material recycling contributing to the development of a circular economy.
| | |
| | |
FINANCIAL REPORT 2021 | | NIB FINANCIAL REPORT 2021 / 8 |
| | |
|
| |
| REPORT OF THE BOARD OF DIRECTORS |
| |
PRESIDENT AND CEO’S COMMENTS |
| |
| OPERATING AND FINANCIAL REVIEW |
| |
| CAPITAL AND LIQUIDITY MANAGEMENT |
| |
| FINANCIAL STATEMENTS |
| |
| PROPOSAL BY THE BOARD OF DIRECTORS |
| |
| AUDITOR’S REPORT |
| |
| GOVERNANCE STATEMENT |
| |
| REPORT OF THE CONTROL COMMITTEE CHAIRMANSHIP |
| |
| REPORT OF THE CONTROL COMMITTEE |
| |
| |
| |
| |
| |
| |
| |
| |
| |
| |
| |
| |
| |
| |
| |
| |
| |
| |
| |
| |
| |
| |
| |
| |
| |
| |
| |
| |
| |
| |
| |
| |
| |
FUNDING AND OTHER TREASURY ACTIVITIES
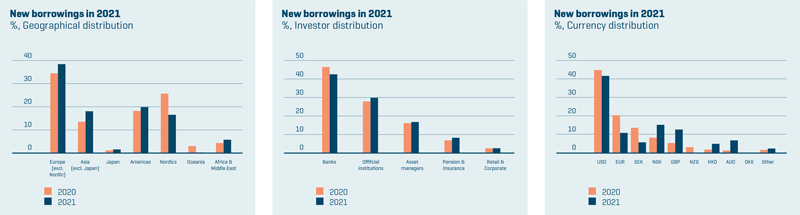
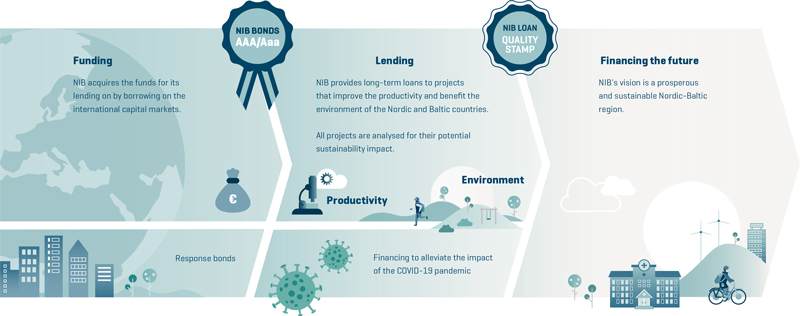
NIB acquires the funds for lending by borrowing on the international capital markets. NIB’s funding strategy rests on four pillars: global benchmark issuance in USD, a strong presence in the sustainable bond market, public bonds in other major currencies and meeting investors’ demand for tailored issuance in specific formats and currencies.
In 2021, NIB raised new funding with a nominal value of EUR 6.9 billion through 71 bond transactions. The Bank maintained a diversified global investor base. European investors outside the Nordic countries continue to be the largest group of buyers, accounting for 35% of investments. NIB issued two global USD-denominated benchmark transactions this year, totalling USD 2.25 billion (EUR 1.9 billion). In January, the Bank issued a five-year USD 1.25 billion global benchmark and another USD 1.0 billion bond with a three-year maturity followed in September. Both attracted strong support from global investors. Central banks and bank treasuries remain the main investor base in NIB’s USD benchmark transactions. In May, the Bank issued its inaugural USD 700 million five-year benchmark bond linked to the SOFR (Secured Overnight Financing Rate) index.
Since 2011, the Bank has been issuing NIB Environmental Bonds (NEBs), the proceeds of which are used to finance projects that benefit the environment and support the transition to a low carbon economy. In 2021, NIB celebrated its 10th anniversary as an issuer of green and blue bonds by raising a total of EUR 898 million in NEBs, consisting of a six-year EUR 500 million bond, a five-year SEK 3 billion bond, and an inaugural NOK 1 billion bond. The Bank has now issued EUR 5.8 billion in NEBs and financed some 130 sustainable projects with the proceeds.
In order to manage the liquidity risk, NIB maintains a significant liquidity buffer, which amounted to EUR 11.3 billion at year-end. Its size is determined by the Bank’s twelve-month target for the survival horizon, which is the duration for which NIB can continue to fulfil all its payment obligations and continue normal business operations without obtaining any new funding, even under severely stressed market conditions. The Bank has a strong liquidity position and the survival horizon at the end of 2021 was 450 days. The liquidity bond portfolio, which currently forms EUR 7.6 billion of the liquidity buffer, generated a positive return of 0.8%. The return is considered satisfactory, even though the negative yield environment is putting continued pressure on profitability.
| | |
| | |
FINANCIAL REPORT 2021 | | NIB FINANCIAL REPORT 2021 / 9 |
| | |
|
| |
| REPORT OF THE BOARD OF DIRECTORS |
| |
PRESIDENT AND CEO’S COMMENTS |
| |
| OPERATING AND FINANCIAL REVIEW |
| |
| CAPITAL AND LIQUIDITY MANAGEMENT |
| |
| FINANCIAL STATEMENTS |
| |
| PROPOSAL BY THE BOARD OF DIRECTORS |
| |
| AUDITOR’S REPORT |
| |
| GOVERNANCE STATEMENT |
| |
| REPORT OF THE CONTROL COMMITTEE CHAIRMANSHIP |
| |
| REPORT OF THE CONTROL COMMITTEE |
| |
| |
| |
| |
| |
| |
| |
| |
| |
| |
| |
| |
| |
| |
| |
| |
| |
| |
| |
| |
| |
| |
| |
| |
| |
| |
| |
| |
| |
| |
| |
| |
| |
SUSTAINABILITY AGENDA
As highlighted at the COP26 meeting in Glasgow, this decade will be decisive for collective efforts to decouple economic activity from fossil fuel use. The financial sector is ready to step up its efforts. Investors and asset owners are demanding more impact, transparency and are supporting initiatives towards net zero emissions by 2050. Banks and financial intermediaries are responding by developing further sustainable financial products. Regulatory bodies are increasingly paying attention to ESG matters and rating agencies are broadening their ESG evaluation offering. The EU taxonomy is close to ratification. All in all, the sustainable finance market continues to grow rapidly.
In 2021, NIB launched its revised Sustainability Policy. In the new policy, the Bank takes a stronger stance against fossil fuels, effectively banning any direct financing of fossil fuel-based energy generation. It also describes a new set of ambitions and a clear assessment
of ESG performance at counterparty level. The policy is designed to send a strong signal of “transition”, whereby NIB will work and engage with clients who agree on a robust and credible transition pathway in accordance with the Paris Agreement. The Bank will particularly target “hard-to-abate” sectors that might not be green today but are quickly required to become part of the solution.
As mentioned above, NIB disbursed its first Sustainability-Linked Loans (SLL), which further support the Bank’s efforts to finance clients’ transition strategies. The SLL market has grown rapidly in recent months. NIB intends to support the development of the market with high integrity and standards.
During the year, NIB expanded its fixed-income investments to support the development of sustainable capital markets in its member region. The scope has broadened from green bonds to all types of labelled bonds, including social, sustainability and sustainability-linked bonds.
| | |
| | |
FINANCIAL REPORT 2021 | | NIB FINANCIAL REPORT 2021 / 10 |
| | |
|
| |
| REPORT OF THE BOARD OF DIRECTORS |
| |
PRESIDENT AND CEO’S COMMENTS |
| |
| OPERATING AND FINANCIAL REVIEW |
| |
| CAPITAL AND LIQUIDITY MANAGEMENT |
| |
| FINANCIAL STATEMENTS |
| |
| PROPOSAL BY THE BOARD OF DIRECTORS |
| |
| AUDITOR’S REPORT |
| |
| GOVERNANCE STATEMENT |
| |
| REPORT OF THE CONTROL COMMITTEE CHAIRMANSHIP |
| |
| REPORT OF THE CONTROL COMMITTEE |
| |
| |
| |
| |
| |
| |
| |
| |
| |
| |
| |
| |
| |
| |
| |
| |
| |
| |
| |
| |
| |
| |
| |
| |
| |
| |
| |
| |
| |
| |
| |
| |
|
In the Bank’s treasury operations, NIB adopted a Responsible Investment Framework, which introduces sustainability and ESG considerations as additional criteria for its liquidity portfolio investments.
As a signatory to Task Force on Climate-Related Financial Disclosures (TCFD), NIB continues to work towards fully integrating climate risks and opportunities in its core operations. More broadly, NIB has also started to look beyond counterparty-level ESG assessments to explore how best to evaluate ESG factors at the portfolio level.
In 2021, NIB joined the Coalition of Finance Ministers for Climate Action as an institutional partner. The Coalition brings together fiscal and economic policymakers from over 60 countries in leading the global climate response and in securing a just transition towards low-carbon resilient development.
A limited assurance was conducted for the first time on NIB’s Impact Report for 2020. The scope of this valuable assurance work is being expanded for the Impact Report 2021 to include further lending impact indicators, which demonstrates NIB’s commitment to increased transparency through reliable disclosures across the financial sector.
RISK MANAGEMENT
NIB monitors international risk management regulations and standards and takes them into account where relevant. The Bank has strengthened its risk, capital and liquidity management framework in recent years. In 2020, the amended Statutes and the Principles for Capital and Liquidity Management (‘Principles’) introduced high-level statutory requirements for capital, leverage, and liquidity. These are supported by a Risk Appetite Statement (RAS) and an Internal Capital Adequacy Assessment Process (ICAAP), and are operationalised via risk management policies, guidelines, and procedures.
The RAS sets the principles for risk taking, risk mitigation and risk avoidance. In 2021, the RAS was updated as a part of the annual review cycle, with a refinement of key risk indicators and the introduction of a statement on climate risk – ensuring coverage of emerging risks and highlighting the risk management side of our commitment to, inter alia, the TCFD.
The ICAAP, which is conducted annually, is one of the main tools used by the Board of Directors to ensure that the Bank operates within the established risk appetite as well as capital and liquidity adequacy targets. In 2021, NIB maintained adequate capital and liquidity buffers throughout the year, despite the continued challenges stemming from the COVID-19 pandemic. An increase in equity (through net profit)
combined with a modest increase of the risk-based (economic) capital requirement enabled the Bank to maintain its strong capital position, with a capital headroom1 of EUR 733 million (19% of adjusted common equity).
Asset quality remained solid. As of end-2021, 94% of the lending exposure was within the investment-grade category, and the public sector accounted for 32% of total lending exposure. In terms of geographical distribution, 96% of the lending exposure was to counterparties located in the Bank’s member countries. As for the treasury portfolio, all exposure was well within the investment-grade category, with 90% within the best risk classes (equivalent to ratings of AAA to AA-). In terms of market risk, the Bank is mainly exposed to interest rate risk, credit spread risk, and cross-currency basis risk via its treasury operations. While the valuations of mark-to-market financial instruments varied throughout the year, the Bank’s overall market risk remained modest. As of end-2021, it was essentially unchanged compared to the previous year.
NIB continued to improve its risk management framework during 2021. Several policies and procedures were reviewed and updated to reflect the implementation of the three lines of defence model as well as to keep up with best practices. High-level principles and requirements for managing market risks were formalised at the Policy (Board) level, and a number of policies and guidelines related to operational risks were clarified and adopted. The framework for managing model risks became operational. The Board approved the new Capital and Liquidity Recovery Plan, while management adopted its own set of financial risk limits. Combined, these milestones completed the Bank’s ‘waterfall’ risk management system, which cascades from Statutes and Principles to the RAS and to the Risk Management Policy (and downstream to specific policies for each core risk category) down to management limits and operations.
In the aftermath of the COVID-19 pandemic, an extensive overhaul and validation of the model used to estimate expected credit loss (ECL) was initiated. The work will be completed in 2022. Lastly, work continued towards a more systematic integration of sustainability / ESG (including climate risk) factors into the Bank’s core processes (lending and treasury).
1 “Capital headroom” is defined as the capital supply (adjusted common equity) minus capital demand, i.e., the internally assessed risk-based (economic) capital requirement for the current operations covering all identified risks the Bank is exposed to (i.e., credit, market and operational risk, and buffers for macroprudential risks and stress testing).
| | |
| | |
FINANCIAL REPORT 2021 | | NIB FINANCIAL REPORT 2021 / 11 |
| | |
|
| |
| REPORT OF THE BOARD OF DIRECTORS |
| |
PRESIDENT AND CEO’S COMMENTS |
| |
| OPERATING AND FINANCIAL REVIEW |
| |
| CAPITAL AND LIQUIDITY MANAGEMENT |
| |
| FINANCIAL STATEMENTS |
| |
| PROPOSAL BY THE BOARD OF DIRECTORS |
| |
| AUDITOR’S REPORT |
| |
| GOVERNANCE STATEMENT |
| |
| REPORT OF THE CONTROL COMMITTEE CHAIRMANSHIP |
| |
| REPORT OF THE CONTROL COMMITTEE |
| |
| |
| |
| |
| |
| |
| |
| |
| |
| |
| |
| |
| |
| |
| |
| |
| |
| |
| |
| |
| |
| |
| |
| |
| |
| |
| |
| |
| |
| |
| |
| |
|
FINANCIAL RESULTS
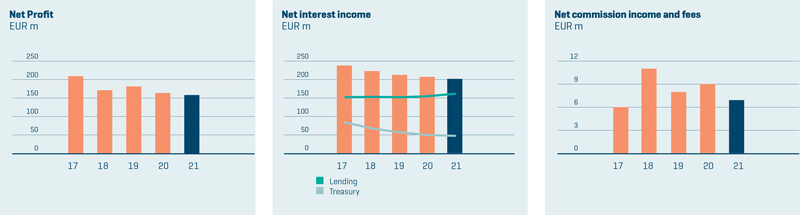
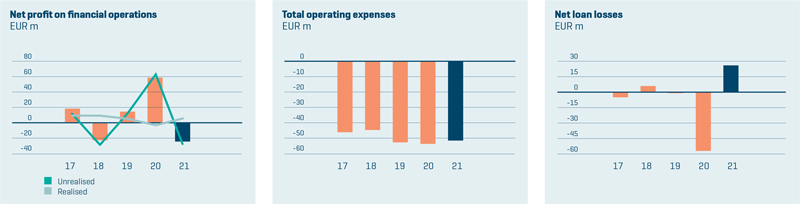
The net profit for the year of EUR 159.2 million was EUR 5.5 million lower than in 2020. Total operating income decreased from EUR 273.9 million to EUR 184.8 million, mainly due to a decrease in net profit on financial operations of EUR 82.5 million. Net interest income decreased by EUR 4.1 million and net fees and commission decreased by EUR 2.3 million. Total operating expenses of EUR 51.5 million were EUR 0.9 million lower than in 2020.
Following the outbreak of COVID-19 in 2020, the global operating environment rapidly deteriorated. As a result, the Bank adjusted the macro-financial scenarios used to calculate the expected credit loss (“ECL”) provision resulting in net loan losses of EUR 57 million. During 2021, the macro-financial scenarios improved, resulting in a decrease of the ECL and the Bank recorded a reversal of EUR 25.9 million in net loan losses. The Bank did not record any realised loan losses nor any new non-performing loans during 2021.
Net interest income for the year amounted to EUR 201.4 million, compared to EUR 205.5 million in 2020. Net interest income from lending activities of EUR 162.4 million was EUR 7.1 million higher than in previous years due to a larger loan balance. Net interest income from treasury activities decreased by EUR 11.2 million to EUR 39.0 million due to the low yield environment. A more detailed commentary on the Bank’s financial results can be found in the Operating and Financial Review in the Financial Report.
The Bank is in a strong financial position with solid capital and liquidity ratios, well above the minimum requirements stipulated in the Statutes and compliant with the limits and monitoring thresholds defined in the Risk Appetite Statement. Total assets increased from EUR 35,422 million to EUR 37,553 million and total equity increased from EUR 3,861 million to EUR 3,999 million. A more detailed commentary on the Bank’s statutory metrics can be found in the Capital and Liquidity Management section in the Financial Report.
DIVIDEND
For 2020, the Board of Directors proposed that no dividend be paid to NIB’s member countries, with approval by the Board of Governors. This decision was part of the owners’ will to maximise the Bank’s response to the COVID-19 pandemic and to show strong support for NIB’s activities, while preserving its solid capitalisation. Although there are still significant uncertainties that may impact the economy in the future, the macroeconomic outlook has improved. As stated, NIB is in a strong financial position with solid capital and liquidity ratios, therefore the Board of Directors proposes to the Board of Governors that the payment of dividends be reinstated, and that a sum of EUR 40 million be distributed to the Banks’ member countries from the 2021 net profit, which equates to a pay-out ratio of 25% of net profit.
GOVERNANCE
NIB’s Board of Directors held eleven meetings in 2021. Due to the ongoing pandemic, meetings were held fully online until July, and after that in hybrid mode (i.e., some members attended in person, while others attended remotely via secure video call). Ms Esther Finnbogadóttir (Iceland) chaired all Board meetings. A hybrid meeting was held in Reykjavík on 26 August (meeting 8/2021) and three hybrid meetings took place in Helsinki. Four separate Board seminars were held.
The Control Committee (the Bank’s supervisory body responsible for appointing the Bank’s external auditors) had two ordinary meetings during the year. The first ordinary meeting was held online and the second was held in hybrid mode in Oslo. The Control Committee Chairmanship is reinforced by an independent expert, the re-appointment of whom was approved by the Control Committee on 12 February 2021 for a two-year period. The Control Committee Chairmanship held seven meetings (either online or in hybrid mode because of the pandemic situation).
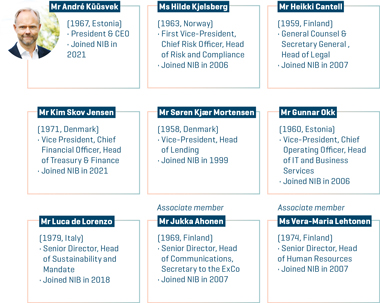
From 1 April 2021, the Board of Directors appointed Mr André Küüsvek (Estonia) to serve as President and Chief Executive Officer (CEO) of the Bank. The President of NIB is appointed by the Board of Directors for a term of five years at a time. Mr Küüsvek succeeded Mr Henrik Normann (Denmark), who had occupied the position from April 2012. Mr Küüsvek is the first NIB President from a Baltic country.
The Board of Directors also approved to include the Head of Sustainability and Mandate as an ordinary member to the Executive Committee and the Mandate, Credit and Compliance Committee.
COMPLIANCE
Efforts to further strengthen NIB’s integrity and compliance framework continued this year. The Integrity & Compliance Office (ICO) reviewed three of the Bank’s policies to improve their accessibility and align them with current best practices. In addition, a new e-learning course targeting all staff members was launched.
In accordance with best market practice, ICO conducted a money laundering and terrorism financing risk assessment of NIB’s lending operations. The assessment concluded that, considering both the inherent risk associated with our customers and the control measures the Bank has in place, NIB’s residual money laundering and terrorism financing risk is low. To further enhance controls, relevant policy reviews and further staff trainings will be arranged in 2022. More information about ICO’s activities can be found in NIB’s annual Integrity Report, which will be published in March 2022.
| | |
| | |
FINANCIAL REPORT 2021 | | NIB FINANCIAL REPORT 2021 / 12 |
| | |
|
| |
| REPORT OF THE BOARD OF DIRECTORS |
| |
PRESIDENT AND CEO’S COMMENTS |
| |
| OPERATING AND FINANCIAL REVIEW |
| |
| CAPITAL AND LIQUIDITY MANAGEMENT |
| |
| FINANCIAL STATEMENTS |
| |
| PROPOSAL BY THE BOARD OF DIRECTORS |
| |
| AUDITOR’S REPORT |
| |
| GOVERNANCE STATEMENT |
| |
| REPORT OF THE CONTROL COMMITTEE CHAIRMANSHIP |
| |
| REPORT OF THE CONTROL COMMITTEE |
| |
| |
| |
| |
| |
| |
| |
| |
| |
| |
| |
| |
| |
| |
| |
| |
| |
| |
| |
| |
| |
| |
| |
| |
| |
| |
| |
| |
| |
| |
| |
| |
|

Most Board meetings were held in hybrid mode in 2021. Photo: Ville Maali.
BUSINESS CONTINUITY AND HYBRID WORKING
Based in Helsinki, NIB takes into account the advice and guidelines of the Finnish government and health care authorities regarding the developments of the COVID-19 epidemic. Following the improved epidemic situation and vaccination coverage in Finland, most of the Bank’s staff returned to the office during autumn, and the Bank implemented a hybrid work model. Since then, the epidemic situation deteriorated again, resulting in most of the staff reverting to a remote work mode by year-end.
OTHER DEVELOPMENT PROJECTS
Stakeholder survey
NIB actively seeks feedback from its key target groups by conducting a comprehensive stakeholder survey every three years, most recently in autumn 2021. A total of 139 interviews were conducted with lending customers, investors, and public authorities. The results confirmed that NIB’s reputation continues to be very strong among all of these stakeholders. The Bank is seen as a leading provider of long-term financing in the region. Climate change adaptation and mitigation as well as the green transition are on top of the agenda. The results support the conclusions of the strategy review.
Work Engagement Survey
NIB also conducts regular work engagement surveys among its staff to collect feedback on NIB as an employer, the work environment, the management, individual motivation, and wellbeing. The most recent survey was conducted in 2021, where a total of 192 answers were received. The survey results were very positive, especially with regards to individual work engagement and motivational drivers, supervisory work and teamwork, reflecting strong levels of commitment overall. The Bank’s handling of health and safety during the pandemic received an excellent score. Compared to our previous survey (2018), results have improved across all areas. Further, Bank-wide development needs were identified in relation to digitalisation and the implementation of new initiatives.
Digitalisation
Several initiatives were implemented to adapt the Bank’s IT to a digitalised operating environment and to ensure more stable and secure remote working solutions. Digitalisation of workplace services continued, with the installation of Office 365, the provision of new workstations, and an updated security solution. The first steps to further digitalise the lending process were taken.
From a governance perspective, two primary focus areas are IT process management and IT security improvement. Several enhancements of the IT security domain have been implemented and the three-line-defence model for IT security is now fully operational.
| | |
| | |
FINANCIAL REPORT 2021 | | NIB FINANCIAL REPORT 2021 / 13 |
| | |
|
| |
| REPORT OF THE BOARD OF DIRECTORS |
| |
PRESIDENT AND CEO’S COMMENTS |
| |
| OPERATING AND FINANCIAL REVIEW |
| |
| CAPITAL AND LIQUIDITY MANAGEMENT |
| |
| FINANCIAL STATEMENTS |
| |
| PROPOSAL BY THE BOARD OF DIRECTORS |
| |
| AUDITOR’S REPORT |
| |
| GOVERNANCE STATEMENT |
| |
| REPORT OF THE CONTROL COMMITTEE CHAIRMANSHIP |
| |
| REPORT OF THE CONTROL COMMITTEE |
| |
| |
| |
| |
| |
| |
| |
| |
| |
| |
| |
| |
| |
| |
| |
| |
| |
| |
| |
| |
| |
| |
| |
| |
| |
| |
| |
| |
| |
| |
| |
| |
|
In order to meet growing capacity demands and to better manage related operational risks, NIB has decided to outsource its data centre infrastructure. The outsourcing process was initiated during 2021 and will continue into 2022. Further, the Enterprise Data Warehouse (EDW) project has delivered important results on data modelling and key business applications. Work on the future operating model and roles and responsibilities is ongoing, aiming for NIB to become a data driven Bank.
Internal sustainability management
NIB’s newly renovated office building received certification under the Excellent level of the BREEAM rating system for green buildings in spring of this year. The certification assures that the facilities meet the highest standards in several sustainability dimensions, including energy efficiency and building materials. When financing real estate projects, NIB requires its customers to obtain a high level of external certification. Therefore, it was important to apply the same requirements to NIB’s own premises. An overview of how NIB manages its internal footprint is available in the Impact Report 2021.
OUTLOOK
Although vaccination efforts have somewhat mitigated the negative effects of the COVID-19 pandemic on the real economy, the epidemiological situation remains a major cause for concern, not least due to new virus variants. The overall level of uncertainty regarding the economic outlook is still elevated. The consensus is that the global economy will continue a broad recovery in 2022, mainly spurred by hopes that the vaccination efforts will prove to be successful in reducing the spread of the disease.
The monetary policy stance in advanced economies is expected to remain accommodative in 2022, with interest rates remaining at historically low levels. However, given the inflationary pressures, the likelihood of a somewhat less accommodative monetary policy is increasing. The possible change of monetary stance will largely depend on the policymaker’s view on whether the price shocks are temporary or not.
The overall demand for financing is still affected by the sizable fiscal support from governments, including various recovery funds, which has led to a steep increase in public debt. Due to high levels of uncertainty, corporate investments will potentially remain subdued. At the same time, the growing momentum behind the development of a sustainable finance universe will create new opportunities.
Going forward, NIB has a role to play in the green recovery of the Nordic-Baltic region. In this context, the Bank will particularly support the decarbonisation plans of its member countries.
NIB will continue to focus on long-term lending and increase its activities in under-served segments of the market. Overall, the Bank expects new lending volumes to be moderately higher in 2022 compared to 2021. In line with its updated business strategy, NIB will broaden its product offering and participate in developing sustainable finance and capital markets in the Nordic–Baltic region, with a focus on setting high quality standards in the market and supporting high impact transitions.
| | |
| | |
FINANCIAL REPORT 2021 | | NIB FINANCIAL REPORT 2021 / 14 |
| | |
|
|
REPORT OF THE BOARD OF DIRECTORS |
| |
PRESIDENT AND CEO’S COMMENTS |
|
OPERATING AND FINANCIAL REVIEW |
| |
| CAPITAL AND LIQUIDITY MANAGEMENT |
| |
| FINANCIAL STATEMENTS |
| |
| PROPOSAL BY THE BOARD OF DIRECTORS |
| |
| AUDITOR’S REPORT |
| |
| GOVERNANCE STATEMENT |
| |
| REPORT OF THE CONTROL COMMITTEE CHAIRMANSHIP |
| |
| REPORT OF THE CONTROL COMMITTEE |
| |
| |
| |
| |
| |
| |
| |
| |
| |
| |
| |
| |
| |
| |
| |
| |
| |
| |
| |
| |
| |
| |
| |
| |
| |
| |
| |
| |
| |
| |
| |
| |
| |
President & CEO’s comments January–December 2021
This is the first annual financial report for which I am President, and it is therefore an opportune time to reflect on my first months at the Bank. Prior to joining NIB, my impression of the Bank was that of a professional institution with a strong financial position anchored to a clear mandate. I am pleased to report that my expectations have been met and my first impressions have been very positive indeed. I would like to take this opportunity to thank everyone at NIB and the Board of Directors for making me feel very welcome and I look forward to our future cooperation together.
What has really impressed me to date, is the engagement of the Bank’s owners through the active participation of the Board in the governance of the Bank. During the autumn, the Board reviewed the Bank’s business strategy, the objective of which was to adapt to the changing operating environment and to accelerate the delivery of our mission. Our new strategy continues to focus on our key strengths but will also explore new products to enhance our client and owner value propositions, further details of which can be found here. The Board also approved NIB’s updated Sustainability Policy, details of which can be found here. These are two very significant milestones in setting the course for the Bank to follow during these increasingly complex and challenging times.
The Bank’s net profit for the year amounted to EUR 159 million, total assets increased from EUR 35,422 million to EUR 37,553 million and our total equity increased from EUR 3,861 million to EUR 3,999 million. The Bank is in a strong financial position with solid capital and liquidity ratios, and on this basis, management supports the Board decision to reinstate dividends after last year’s suspension.
I look forward to implementing the new strategy and I am confident that NIB will play an important role in the post-COVID recovery in the member countries, by providing sustainable finance solutions and facilitating positive change.
André Küüsvek, President & CEO
Executive Committee
MEMBERS
| | |
| | |
FINANCIAL REPORT 2021 | | NIB FINANCIAL REPORT 2021 / 15 |
| | |
|
| |
| REPORT OF THE BOARD OF DIRECTORS |
| |
| PRESIDENT AND CEO’S COMMENTS |
| |
| OPERATING AND FINANCIAL REVIEW |
| |
| |
| HIGHLIGHTS |
| |
| |
| KEY FIGURES AND RATIOS |
|
| TOTAL COMPREHENSIVE INCOME |
|
| FINANCIAL POSITION |
| |
| CAPITAL AND LIQUIDITY MANAGEMENT |
| |
| FINANCIAL STATEMENTS |
| |
| PROPOSAL BY THE BOARD OF DIRECTORS |
| |
| AUDITOR’S REPORT |
| |
| GOVERNANCE STATEMENT |
| |
| REPORT OF THE CONTROL COMMITTEE CHAIRMANSHIP |
| |
| |
| |
| |
| |
| |
| |
| |
| |
| |
| |
| |
| |
| |
| |
| |
| |
| |
| |
| |
| |
| |
| |
| |
| |
Operating and financial review
Highlights
During 2021, the Bank disbursed EUR 2,440 million in loans compared to EUR 4,853 million in 2020 when the Bank disbursed a historically high amount in response to the COVID-19 crisis.
The Bank is in a strong financial position with solid capital and liquidity ratios. Total assets increased from EUR 35,422 million in 2020 to EUR 37,553 million at 31 December 2021 and total equity increased from EUR 3,861 million to EUR 3,999 million. The net profit for the year amounted to EUR 159 million compared to EUR 165 million in 2020 due to an increase in unrealised losses on financial instruments offset by a decrease in net loan loss provisions.
Key figures and ratios
| | | | | | | | |
| | | |
In millions of euro, unless otherwise
stated | | 2021 | | | 2020 | |
| | |
Net interest income | | | 201 | | | | 206 | |
| | |
Profit before net loan losses | | | 133 | | | | 221 | |
| | |
Net Profit | | | 159 | | | | 165 | |
| | |
| | | | | | | | |
| | |
Loans disbursed | | | 2,440 | | | | 4,853 | |
| | |
Loans agreed | | | 1,852 | | | | 5,666 | |
| | |
% of loans achieving good or above mandate | | | 97% | | | | 98% | |
| | |
| | | | | | | | |
| | |
Lending outstanding | | | 22,313 | | | | 21,727 | |
| | |
Total assets | | | 37,553 | | | | 35,422 | |
| | |
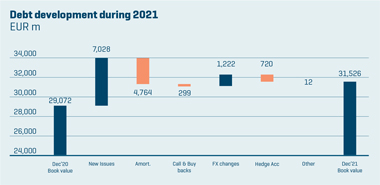
New debt issues | | | 7,028 | | | | 7,540 | |
| | |
Debts evidenced by certificates | | | 31,526 | | | | 29,072 | |
| | |
Total equity | | | 3,999 | | | | 3,861 | |
| | |
| | | | | | | | |
| | |
Equity/total assets (%) | | | 10.6% | | | | 10.9% | |
| | |
Net profit/average equity (%) | | | 4.1% | | | | 4.4% | |
| | |
Cost/income (%) | | | 27.9% | | | | 19.1% | |
| | |
Number of employees at year end | | | 221 | | | | 222 | |
| | |
| | |
FINANCIAL REPORT 2021 | | NIB FINANCIAL REPORT 2021 / 16 |
| | |
|
| |
| REPORT OF THE BOARD OF DIRECTORS |
| |
| PRESIDENT AND CEO’S COMMENTS |
| |
| OPERATING AND FINANCIAL REVIEW |
|
| HIGHLIGHTS |
|
KEY FIGURES AND RATIOS |
| |
| TOTAL COMPREHENSIVE INCOME |
|
FINANCIAL POSITION |
| |
| CAPITAL AND LIQUIDITY MANAGEMENT |
| |
| FINANCIAL STATEMENTS |
| |
| PROPOSAL BY THE BOARD OF DIRECTORS |
| |
| AUDITOR’S REPORT |
| |
| GOVERNANCE STATEMENT |
| |
| REPORT OF THE CONTROL COMMITTEE CHAIRMANSHIP |
| |
| |
| |
| |
| |
| |
| |
| |
| |
| |
| |
| |
| |
| |
| |
| |
| |
| |
| |
| |
| |
| |
| |
| |
| |
| |
| |
Total comprehensive income
NET PROFIT
The net profit for the year amounted to EUR 159.2 million, which is EUR 5.5 million lower than last year. Total operating income decreased from EUR 273.9 million to EUR 184.8 million mainly due to a decrease in net profit on financial operations of EUR 82.5 million. Net interest income decreased by EUR 4.1 million and net fee and commission income decreased by EUR 2.3 million. Total operating expenses of EUR 51.5 million were EUR 0.9 million lower than in 2020. The Bank has decreased the expected credit loss provision resulting in positive net loan losses of EUR 25.9 million. There have been no realised loan losses during the year.
NET INTEREST INCOME
Net interest income for the year amounted to EUR 201.4 million which is 4.1 million lower than in 2020. Net interest income on lending activities was EUR 7.1 million higher than in 2020, due to a higher volume of loans outstanding. The interest income on treasury activities decreased by EUR 11.2 million due to the ongoing low yield environment.
NET FEE AND COMMISSION INCOME
Net fee and commission income amounted to EUR 7.0 million, compared to EUR9.3 million in 2020, due to the higher volume of loans agreed and disbursed last year.
| | |
| | |
FINANCIAL REPORT 2021 | | NIB FINANCIAL REPORT 2021 / 17 |
| | |
|
| |
| REPORT OF THE BOARD OF DIRECTORS |
| |
| PRESIDENT AND CEO’S COMMENTS |
| |
| OPERATING AND FINANCIAL REVIEW |
|
| HIGHLIGHTS |
|
KEY FIGURES AND RATIOS |
| |
| TOTAL COMPREHENSIVE INCOME |
|
FINANCIAL POSITION |
| |
| CAPITAL AND LIQUIDITY MANAGEMENT |
| |
| FINANCIAL STATEMENTS |
| |
| PROPOSAL BY THE BOARD OF DIRECTORS |
| |
| AUDITOR’S REPORT |
| |
| GOVERNANCE STATEMENT |
| |
| REPORT OF THE CONTROL COMMITTEE CHAIRMANSHIP |
| |
| |
| |
| |
| |
| |
| |
| |
| |
| |
| |
| |
| |
| |
| |
| |
| |
| |
| |
| |
| |
| |
| |
| |
| |
| |
| |
NET PROFIT/LOSS ON FINANCIAL OPERATIONS
The loss on financial operations amounted to EUR 23.7 million compared to a gain of EUR 58.8 million in 2020. This result includes realised net gains of EUR 4.8 million and unrealised net losses of EUR 28.5 million compared to realised net losses of EUR 5.0 million and unrealised net profits of EUR 63.8 million in 2020. During 2020 and 2021, the financial markets experienced large market movements because of the COVID-19 outbreak. This has significantly increased the volatility of unrealised gains and losses recorded on financial instruments that NIB holds to hedge its interest rate risks and in its liquidity portfolio.
The unrealised valuation gains and losses on interest rate hedges mainly arise from the change of the interest rate spreads that are embedded in the Bank’s funding and lending transactions. When the Bank raises funds with fixed rates or offers borrowers fixed rate loans, it hedges the resulting interest rate risk using swaps, in which the fixed rate is swapped to the short-term money market floating rates referred to as the IBORS (e.g., LIBOR, EURIBOR, STIBOR, NIBOR etc.). In keeping with what NIB believes is industry best practice, the valuation of these swaps is based on a risk-free discounting rate called OIS (Overnight Interest rate Swap). The changes in spread between the risk-free rates (the OIS rates) and the relevant IBORs applicable to each such swap creates unrealised valuation gains and losses. It should be noted that as the Bank intends to hold these transactions to maturity, so that they are not sold for a price based on their exit market value,
these valuation gains and losses will not be realised as the transactions will settle at par.
The unrealised valuation gains and losses on assets in the Bank’s liquidity portfolio arise from changes in credit spreads. The Bank maintains a large liquidity portfolio, which it invests in high quality bonds. The interest rate risk may be hedged using swaps but when credit spreads widen, this results in negative valuations on the bonds. In periods of financial turbulence credit spreads tend to rise, which also affects NIB’s high quality bonds. As the Bank intends to hold the bonds to maturity, so that they are not sold based on the current exit market value, the valuation gains and losses will reverse, as the bonds will settle at par.
TOTAL OPERATING EXPENSES
Total operating expenses amounted to EUR 51.5 million comprising personnel expenses of EUR 29.2 million, administrative expenses of EUR 12.8 million and depreciation of EUR 9.5 million. The main administrative expenses are IT, office premises, travel and project consultancy cost, however due to COVID-19, the travel and project consultancy costs were lower than usual. Personnel costs decreased by EUR 2.1 million which was mainly due to staff turnover and reduced activities due to COVID-19.
| | |
| | |
FINANCIAL REPORT 2021 | | NIB FINANCIAL REPORT 2021 / 18 |
| | |
|
| |
| REPORT OF THE BOARD OF DIRECTORS |
| |
| PRESIDENT AND CEO’S COMMENTS |
| |
| OPERATING AND FINANCIAL REVIEW |
|
| HIGHLIGHTS |
|
KEY FIGURES AND RATIOS |
| |
| TOTAL COMPREHENSIVE INCOME |
|
FINANCIAL POSITION |
| |
| CAPITAL AND LIQUIDITY MANAGEMENT |
| |
| FINANCIAL STATEMENTS |
| |
| PROPOSAL BY THE BOARD OF DIRECTORS |
| |
| AUDITOR’S REPORT |
| |
| GOVERNANCE STATEMENT |
| |
| REPORT OF THE CONTROL COMMITTEE CHAIRMANSHIP |
| |
| |
| |
| |
| |
| |
| |
| |
| |
| |
| |
| |
| |
| |
| |
| |
| |
| |
| |
| |
| |
| |
| |
| |
| |
NET LOAN LOSSES
Following the outbreak of COVID-19 in 2020, the global operating environment rapidly deteriorated and as a result, the Bank adjusted the macro-financial scenarios used to calculate the expected credit loss (“ECL”) provision. In 2020, there was an increase in the ECL provision from EUR 122.3 million at 31 December 2019 to EUR 172.6 million at 31 December 2020. During 2021, the macro-financial scenarios improved, resulting in a decrease of the ECL provision to EUR 152.4 million at 31 December 2021.
There have been no significant observed changes in the credit quality of the overall loan portfolio and there were no new non-performing loans during the period and no realised losses. The gain recognised in the income statement for net loan losses of EUR 25.9 million relates to recoveries on non-performing loans of EUR 0.5 million and EUR 25.4 million related to the change in ECL on performing loans.
OTHER COMPREHENSIVE INCOME
The Bank separates the foreign currency basis spread from financial instruments used in fair value hedge accounting and this separated amount is recorded in “Other comprehensive income” (OCI) which amounted to a loss of EUR 21.6 million for the year compared to a gain of EUR 9.1 million in 2020.
This recorded loss is due to the widening of the Cross Currency Basis spreads, which negatively affect the valuation of basis swaps used to convert funding currencies into lending currencies.
For financial liabilities recorded at fair value through profit or loss, valuation changes due to changes in own credit spreads need to be recorded in OCI. In 2021, the impact was insignificant. The resulting total comprehensive profit for the year amounted to EUR 137.9 million, compared to EUR 170.4 million in 2020.
| | |
| | |
FINANCIAL REPORT 2021 | | NIB FINANCIAL REPORT 2021 / 19 |
| | |
|
| |
| REPORT OF THE BOARD OF DIRECTORS |
| |
| PRESIDENT AND CEO’S COMMENTS |
| |
| OPERATING AND FINANCIAL REVIEW |
|
| HIGHLIGHTS |
|
| KEY FIGURES AND RATIOS |
|
TOTAL COMPREHENSIVE INCOME |
| |
| FINANCIAL POSITION |
| |
CAPITAL AND LIQUIDITY MANAGEMENT |
| |
| FINANCIAL STATEMENTS |
| |
| PROPOSAL BY THE BOARD OF DIRECTORS |
| |
| AUDITOR’S REPORT |
| |
| GOVERNANCE STATEMENT |
| |
| REPORT OF THE CONTROL COMMITTEE CHAIRMANSHIP |
| |
| |
| |
| |
| |
| |
| |
| |
| |
| |
| |
| |
| |
| |
| |
| |
| |
| |
| |
| |
| |
| |
| |
| |
| |
Financial position
LENDING OUTSTANDING
Total lending outstanding amounted to EUR 22,313 million, comprising loans outstanding of EUR 21,975 million and investments of EUR 338 million in labelled bonds and CPs. The total disbursements in 2021 amounted to EUR 2,440 million. More information regarding loans agreed can be found on our website at Agreed Loans.
Total lending outstanding, excluding exchange rate and valuation effects, increased from EUR 21,727 million at 31 December 2020 to EUR 22,215 million. The book value amounted to EUR 22,313 million due to foreign exchange movements and fair valuations/hedge accounting effects of EUR 249 million and EUR -151 million, respectively.
MISSION FULFILMENT
NIB’s vision is a prosperous and sustainable Nordic-Baltic region. All projects proposed for financing undergo an assessment of their potential impact on productivity and the environment of the member country area. This mission fulfilment is rated on a five-grade scale from “negative” to “excellent”. In response to the COVID-19 pandemic, NIB provided “response loans” to alleviate the economic and social consequences of the crisis. These response loans are tracked separately and are not included in the standard mandate rating. During 2021, projects achieving a “good” or “excellent” mandate rating accounted for 97% of the total amount of loans agreed excluding response loans which exceeded the target of 90%.
| | |
| | |
FINANCIAL REPORT 2021 | | NIB FINANCIAL REPORT 2021 / 20 |
| | |
|
| |
| REPORT OF THE BOARD OF DIRECTORS |
| |
| PRESIDENT AND CEO’S COMMENTS |
| |
| OPERATING AND FINANCIAL REVIEW |
|
| HIGHLIGHTS |
|
| KEY FIGURES AND RATIOS |
|
TOTAL COMPREHENSIVE INCOME |
| |
| FINANCIAL POSITION |
| |
CAPITAL AND LIQUIDITY MANAGEMENT |
| |
| FINANCIAL STATEMENTS |
| |
| PROPOSAL BY THE BOARD OF DIRECTORS |
| |
| AUDITOR’S REPORT |
| |
| GOVERNANCE STATEMENT |
| |
| REPORT OF THE CONTROL COMMITTEE CHAIRMANSHIP |
| |
| |
| |
| |
| |
| |
| |
| |
| |
| |
| |
| |
| |
| |
| |
| |
| |
| �� |
| |
| |
| |
| |
| |
| |
| |
FUNDING
During 2021, NIB raised new funding with a nominal value of EUR 6.9 billion through 71 issues in eleven currencies with an average maturity of 4.4 years.
The Bank completed two global USD benchmarks during the year and complemented the issuance by other public and private transactions, hence maintaining a global investor base and a diversified portfolio of currencies. NIB continued its strong presence in the sustainable bond market by issuing NIB Environmental Bonds (NEB). This year the Bank celebrated its 10th anniversary as a green and blue bond issuer.
On 7 January, NIB priced a five-year GBP 600 million issue. The transaction was NIB’s largest ever new sterling benchmark, with the final order-book reaching over GBP 800 million.
On 13 January, the Bank issued its first global USD benchmark issue for the year. The five-year USD 1.25 billion benchmark transaction has a final maturity on 21 January 2026 and was met with strong support from investors.
On 25 March, NIB issued its first NEB for the year. The EUR 500 million transaction was an increase of a NEB due April 2027, bringing the new total outstanding to EUR 1 billion. With this re-opening, NIB’s total environmental bond issuance surpassed EUR 5 billion.
On 6 May, NIB issued its inaugural USD 700 million five-year benchmark bond linked to the SOFR (Secured Overnight Financing Rate) index.
On 14 September, NIB priced a 3-year USD 1 billion benchmark, the second USD benchmark of the year. The transaction attracted strong support from over 50 global investors, with the order-book closing in excess of USD 1.9 billion.
On 13 October, NIB issued two Environmental Bonds (NEBs): a 5-year SEK 3 billion NEB, and a 6-year NOK 1 billion NEB – the Bank’s inaugural green bond issued in Norwegian kroner. With these two bonds, NIB marked its 10th anniversary as a green bond issuer. The Bank has now issued EUR 5.8 billion in environmental bonds and financed over 130 sustainable projects with the proceeds.
A full list of funding transactions can be found on our website at Funding Transactions.
| | |
| | |
FINANCIAL REPORT 2021 | | NIB FINANCIAL REPORT 2021 / 21 |
| | |
|
| |
| REPORT OF THE BOARD OF DIRECTORS |
| |
| PRESIDENT AND CEO’S COMMENTS |
| |
OPERATING AND FINANCIAL REVIEW |
| |
| CAPITAL AND LIQUIDITY MANAGEMENT |
| |
FINANCIAL STATEMENTS |
| |
| PROPOSAL BY THE BOARD OF DIRECTORS |
| |
| AUDITOR’S REPORT |
| |
| GOVERNANCE STATEMENT |
| |
| REPORT OF THE CONTROL COMMITTEE CHAIRMANSHIP |
| |
| REPORT OF THE CONTROL COMMITTEE |
| |
| |
| |
| |
| |
| |
| |
| |
| |
| |
| |
| |
| |
| |
| |
| |
| |
| |
| |
| |
| |
| |
| |
| |
| |
| |
| |
| |
| |
| |
| |
| |
|
| Capital and liquidity management |
The Statutes require NIB to have adequate capital and liquidity management in accordance with sound banking principles. The Bank shall have in place sound and effective strategies for risk, capital and liquidity assessments, which shall be conducted at least annually and reviewed regularly. The Bank’s capital and liquidity management shall be based on assessed risks in its operations, supplemented by stress testing. The Principles for Capital and Liquidity Management set by the Board of Governors further specify requirements as follows:
TABLE 1. Statutory ratio requirements and year-end values
| | | | | | | | | | | | |
| | | | |
| Statutory metrics | | Minimum | | | 2021 | | | 2020 | |
| | | |
Risk-based (economic) capital ratio | | | 100% | | | | 147% | | | | 142% | |
| | | |
Leverage ratio | | | 7.0% | | | | 10.6% | | | | 11.1% | |
| | | |
Leverage ratio with callable capital | | | 20.0% | | | | 30.9% | | | | 32.9% | |
| | | |
Liquidity survival horizon (days) | | | 180 | | | | 450 | | | | 418 | |
Key components of the NIB risk, capital and liquidity management framework are the Risk Appetite Statement (RAS) and the Internal Capital Adequacy Assessment Process (ICAAP). To monitor and manage compliance with statutory requirements, the Board of Directors sets limits and monitoring thresholds in the RAS securely above the minima set by the Principles for Capital and Liquidity Management as well as those set out in the Bank’s Capital and Liquidity Recovery Plan. The Bank uses its ICAAP to evaluate the amount of capital and liquidity needed to cover the risks it is or might be exposed to. The ICAAP is conducted on an annual basis. The Bank maintains a sufficient amount of capital and liquidity to cover all material risks and to ensure that operations can be continued without disruptions even in extremely adverse situations. Moreover, in accordance with Principle 3 of the Principles for Capital and Liquidity Management, NIB has put in place contingency measures and procedures for capital, leverage and liquidity adequacy to safeguard its viability.
RISK-BASED (ECONOMIC) CAPITAL
The Statutes require that the Bank’s paid-in capital and accumulated reserves exceed its internally assessed capital requirement covering the nature and level of the risks to which the Bank is or might be exposed. The Principles for Capital and Liquidity Management further establish a risk-based capital adequacy requirement to ensure that the Bank maintains an appropriate level of capital. This is operationalised via a risk-based capital ratio minimum requirement of 100 per cent.
NIB uses an internal economic capital approach to estimate and set the risk-based capital requirements for credit risk, market risk, operational risk, and other business risks. The amount of economic capital reserved to cover these risks, also calibrated to preserve the highest possible (AAA/Aaa) credit rating, is defined as the minimum economic capital requirement. Potential diversification benefits across the main risk categories (credit, market, liquidity, and operational) are not applied. In addition to the minimum economic capital requirement, the Bank maintains macroprudential capital buffers and additional management buffers (e.g. stress test buffer) as appropriate. The Bank may release capital buffers under stressed conditions or when otherwise required to fulfil its purpose.
The credit risk economic capital model is an application of the so-called structural model broadly adopted in the industry. In technical terms, the simulation model is based on a multivariate-threshold t-copula approach. The key idea behind the model is that an individual obligor enters into default when the value of its assets crosses a threshold determined by the counterparty’s creditworthiness. The model for asset values is estimated based on historical equity data incorporating geographical, industrial, and firm-size dimensions. The likelihood that a counterparty’s assets drop below the default threshold depends on the probability of default (PD) estimates and rating scale. Finally, the actual size of default loss depends on two elements: the counterparty exposure at default (EAD) and the loss given default (LGD). The actual loss, as a proportion of the current exposures, is assumed to be random and is informed from the internal LGD methodology. The credit risk migration element is also a function of credit transition probabilities, credit spread values for each rating category, and the sensitivity of loans to spread movements. The transition probabilities are sourced from external credit rating agency data and split between corporate and sovereign lending
| | |
| | |
FINANCIAL REPORT 2021 | | NIB FINANCIAL REPORT 2021 / 22 |
|
| |
| REPORT OF THE BOARD OF DIRECTORS |
| |
| PRESIDENT AND CEO’S COMMENTS |
| |
OPERATING AND FINANCIAL REVIEW |
| |
| CAPITAL AND LIQUIDITY MANAGEMENT |
| |
FINANCIAL STATEMENTS |
| |
| PROPOSAL BY THE BOARD OF DIRECTORS |
| |
| AUDITOR’S REPORT |
| |
| GOVERNANCE STATEMENT |
| |
| REPORT OF THE CONTROL COMMITTEE CHAIRMANSHIP |
| |
| REPORT OF THE CONTROL COMMITTEE |
| |
| |
| |
| |
| |
| |
| |
| |
| |
| |
| |
| |
| |
| |
| |
| |
| |
| |
| |
| |
| |
| |
| |
| |
| |
| |
| |
| |
| |
| |
| |
| |
categories. Credit spreads are estimated from internal historical lending experience, while the spread sensitivities are determined by the cash-flow structure of each individual loan.
The market risk economic capital model captures the following sub-categories: interest rate risk (covering both the economic value and net interest income risk perspectives), credit spread risk, currency basis risk, and foreign exchange risk. The Bank applies various stress testing approaches for the calculation of market risk economic capital requirements across these market risk sub-categories, and recognises diversification benefits between them in the calculation of the overall economic capital requirement for market risk.
For operational risk, the economic capital requirement is obtained by first calculating the regulatory capital requirement using the standardised approach and then scaling that requirement up to arrive at a conservative estimate.
The regulatory macroprudential tools have been designed to mitigate potential systemic risks, help counter procyclicality in the financial system, and to reserve additional capital above regulatory minimum requirements so that banks have better tools to react and operate under stressed conditions. Due to its legal status, national banking legislation does not apply to NIB, nor it is subject to direct supervision from any supervisory authority. NIB nevertheless monitors international regulations and standards on capital and liquidity management and takes them into account to the extent deemed relevant and/or feasible. Therefore, NIB includes in its ICAAP the relevant macroprudential buffers (namely for capital conservation and countercyclicality) as well as a stress test buffer.
The capital conservation buffer is a fixed percentage (2.5 per cent as of 31 December 2021) of the Bank’s risk-weighted assets (RWA). The countercyclical buffer is calculated as the weighted-average of the private sector exposures and respective countercyclical buffer rates in those countries where the risk exposures are located. The stress test buffer is normally derived from macroeconomic stress testing, based on severely adverse scenarios which build in severe yet plausible shocks to the real economy and financial markets. Scenarios are usually benchmarked to those from supervisory macroeconomic stress tests, but also incorporate expert judgment and/or specific elements to better test sensitivities to relevant factors such as the impact of particular shocks (like the COVID-19 pandemic) on sectors and/ or regions.
As of 31 December 2021, the minimum economic capital requirement was EUR 2,673 million, composed of EUR 1,980 million for credit risk, EUR 595 million for market risk, and EUR 98 million for operational risk. The capital conservation buffer was EUR 316 million and the countercyclical capital buffer was EUR 21 million. The stress test
buffer was EUR 193 million. The total economic capital requirement thus amounted to EUR 3,203 million.
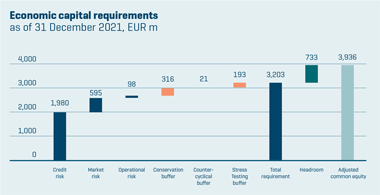
Adjusted common equity (paid-in capital and accumulated reserves after deduction of appropriate adjustment items) provides the risk coverage (loss-absorbing capacity) and is used as a benchmark to determine capital adequacy. As of 31 December 2021, the Bank’s adjusted common equity amounted to EUR 3,936 million.
As of 31 December 2021, the economic capital ratio (adjusted common equity divided by the minimum economic capital requirement) was 147 per cent (2020: 142 per cent, see Table 1 above). The capital headroom (difference between adjusted common equity and the total economic capital requirement) was EUR 733 million (2020: EUR 697 million).
LEVERAGE
In line with sound banking principles and practices, the risk of excessive leverage is recognised and managed. The leverage ratio calculation follows the regulatory approach, considering full exposures (both on- and off-balance sheet) and thereby provides the Bank with an all-inclusive metric to measure and monitor the volume of its activities in relation to its loss-absorbing capacity.
The Principles for Capital and Liquidity Management set two specific leverage ratio requirements. The first is that the Bank’s leverage ratio must exceed 7 per cent. The second is that the leverage ratio when including callable capital (in the numerator) must exceed
| | |
| | |
FINANCIAL REPORT 2021 | | NIB FINANCIAL REPORT 2021 / 23 |
| | |
|
| |
| REPORT OF THE BOARD OF DIRECTORS |
| |
| PRESIDENT AND CEO’S COMMENTS |
| |
OPERATING AND FINANCIAL REVIEW |
| |
| CAPITAL AND LIQUIDITY MANAGEMENT |
| |
FINANCIAL STATEMENTS |
| |
| PROPOSAL BY THE BOARD OF DIRECTORS |
| |
| AUDITOR’S REPORT |
| |
| GOVERNANCE STATEMENT |
| |
| REPORT OF THE CONTROL COMMITTEE CHAIRMANSHIP |
| |
| REPORT OF THE CONTROL COMMITTEE |
| |
| |
| |
| |
| |
| |
| |
| |
| |
| |
| |
| |
| |
| |
| |
| |
| |
| |
| |
| |
| |
| |
| |
| |
| |
| |
| |
| |
| |
| |
| |
| |
20 per cent. A key reflection of owner support and an important element of the Bank’s capital management, callable capital is authorised capital that is not paid-in.
The exposure amount of an on-balance sheet asset is its accounting value remaining after specific credit risk adjustments. The exposure amount for off-balance sheet items, arising for instance from credit and liquidity commitments, is determined by multiplying the notional amount of an item by an appropriate credit conversion factor. The exposure amount of derivatives transactions is calculated as the sum of the replacement cost and an add-on for counterparty credit risk representing the potential future exposure of the transactions. Cash collateral may be recognised in the calculation as a reduction of exposure.
The leverage ratio is calculated as adjusted common equity divided by the total exposure measure. The leverage ratio with callable capital is calculated as adjusted common equity, including callable capital, divided by the total exposure measure.
As of 31 December 2021, the leverage ratio was 10.6 per cent (2020: 11.1 per cent, see Table 1 above) and the leverage ratio with callable capital was 30.9 per cent (2020: 32.9 per cent).
LIQUIDITY
The Bank’s business model gives rise to liquidity risk mainly through maturity mismatches between financial assets (loans and treasury investments) and liabilities (borrowing and equity). The Statutes require that NIB maintain a liquidity reserve necessary for continuing its operations for a period of at least six months under a severe stress scenario. The Principles for Capital and Liquidity Management further
establish a minimum liquidity requirement to safeguard that the Bank can meet its payment obligations without interruption and continue its operations even under adverse market conditions.
This requirement is operationalised via a minimum survival horizon requirement, which measures the time span during which the Bank is able to fulfil its payment obligations (stemming from ongoing business operations) under a severe stress scenario. The stress scenario considers the Bank continuing to disburse loans, the funding market becoming inaccessible, the credit risk of the loan portfolio, the market risk and liquidity risk of the liquidity reserve, and additional collateral requirements for derivative transactions.
To manage liquidity risk, NIB has integrated an Internal Liquidity Adequacy Assessment Process (ILAAP) into its ICAAP, thereby following the same operational and decision-making procedures as for its capital adequacy assessment.
The liquidity position is also calibrated to preserve the highest possible (AAA/Aaa) credit rating and to fulfil the liquidity coverage ratio (LCR) and net stable funding ratio (NSFR) requirements. The Bank’s liquidity risk measurement and liquidity buffer are described in detail in the Financial statements Note 2: Risk management.
As of 31 December 2021, the liquidity survival horizon was 450 days (2020: 418 days, see Table 1 above). The LCR was 5,162 per cent (2020: 4,407 per cent) and NSFR 160 per cent (2020: 165 per cent).
| | |
| | |
FINANCIAL REPORT 2021 | | NIB FINANCIAL REPORT 2021 / 24 |
| | |
|
| |
| REPORT OF THE BOARD OF DIRECTORS |
| |
| PRESIDENT AND CEO’S COMMENTS |
| |
| OPERATING AND FINANCIAL REVIEW |
| |
| CAPITAL AND LIQUIDITY MANAGEMENT |
| |
FINANCIAL STATEMENTS |
| |
| STATEMENT OF COMPREHENSIVE INCOME |
| |
STATEMENT OF FINANCIAL POSITION |
| |
| CHANGES IN EQUITY |
| |
| CASH FLOW STATEMENT |
| |
| NOTES |
| |
| PROPOSAL BY THE BOARD OF DIRECTORS |
| |
| AUDITOR’S REPORT |
| |
| GOVERNANCE STATEMENT |
| |
| REPORT OF THE CONTROL COMMITTEE CHAIRMANSHIP |
| |
| REPORT OF THE CONTROL COMMITTEE |
| |
| |
| |
| |
| |
| |
| |
| |
| |
| |
| |
| |
| |
| |
| |
| |
| |
| |
| |
| |
Statement of comprehensive income
| | | | | | | | | | | | |
| In thousands of euro | | NOTE | | | 2021 | | | 2020 |
Interest income from financial assets held at amortised cost | | | | | | | 197,089 | | | | 254,355 | |
Interest income from financial assets held at fair value | | | | | | | 4,159 | | | | 18,160 | |
Interest expense | | | | | | | 145 | | | | -66,973 | |
Net interest income | | | (3) (4) | | | | 201,393 | | | | 205,543 | |
| | | | | | | | | | | | | |
Commission income and fees received | | | (5) | | | | 9,199 | | | | 12,485 | |
Commission expense and fees paid | | | | | | | -2,165 | | | | -3,145 | |
Net fee and commission income | | | | | | | 7,034 | | | | 9,340 | |
| | | | | | | | | | | | | |
Net profit/loss on financial operations | | | (6) | | | | -23,663 | | | | 58,810 | |
Foreign exchange gains and losses | | | | | | | 13 | | | | 183 | |
Total operating income | | | | | | | 184,777 | | | | 273,876 | |
| | | | | | | | | | | | |
Expenses | | | | | | | | | | | | |
General administrative expenses | | | | | | | | | | | | |
Personnel expenses | | | (7) | | | | -29,182 | | | | -31,327 | |
Other administrative expenses | | | (8) | | | | -12,766 | | | | -13,563 | |
Depreciation | | | (14) | | | | -9,545 | | | | -7,546 | |
Total operating expenses | | | | | | | -51,493 | | | | -52,437 | |
| | | | | | | | | | | | | |
Profit before loan losses | | | | | | | 133,284 | | | | 221,439 | |
Net loan losses | | | (9) | | | | 25,874 | | | | -56,744 | |
Net Profit for the year | | | | | | | 159,158 | | | | 164,695 | |
| | | | | | | | | | | | | |
Other comprehensive income | | | | | | | | | | | | |
Items that will be reclassified to income statement | | | | | | | | | | | | |
Fair value hedges - valuation of cross currency basis spread | | | | | | | -21,612 | | | | 9,120 | |
Items that will not be reclassified to income statement | | | | | | | | | | | | |
Changes in own credit risk on liabilities recorded at fair value | | | | | | | 329 | | | | -3,376 | |
Total other comprehensive income | | | | | | | -21,283 | | | | 5,744 | |
| | | | | | | | | | | | | |
Total comprehensive income | | | | | | | 137,876 | | | | 170,439 | |
The accompanying notes are an integral part of these financial statements.
| | |
| | |
FINANCIAL REPORT 2021 | | NIB FINANCIAL REPORT 2021 / 25 |
| | |
|
| |
| REPORT OF THE BOARD OF DIRECTORS |
| |
| PRESIDENT AND CEO’S COMMENTS |
| |
| OPERATING AND FINANCIAL REVIEW |
| |
| CAPITAL AND LIQUIDITY MANAGEMENT |
| |
| FINANCIAL STATEMENTS |
| |
STATEMENT OF COMPREHENSIVE INCOME |
| |
| STATEMENT OF FINANCIAL POSITION |
| |
CHANGES IN EQUITY |
| |
| CASH FLOW STATEMENT |
| |
| NOTES |
| |
| PROPOSAL BY THE BOARD OF DIRECTORS |
| |
| AUDITOR’S REPORT |
| |
| GOVERNANCE STATEMENT |
| |
| REPORT OF THE CONTROL COMMITTEE CHAIRMANSHIP |
| |
| REPORT OF THE CONTROL COMMITTEE |
| |
| |
| |
| |
| |
| |
| |
| |
| |
| |
Statement of financial position
| | | | | | | | | | | | |
| In thousands of euro | | Note | | | 31 December 2021 | | | 31 December 2020 | |
ASSETS | | | | | | | | | | | | |
Cash and cash equivalents | | | (26) | | | | 1,826,451 | | | | 2,270,386 | |
Financial placements | | | | | | | | | | | | |
Placements with credit institutions | | | | | | | 3,881,023 | | | | 1,968,836 | |
Debt securities | | | (11) | | | | 8,291,062 | | | | 7,912,255 | |
Other | | | | | | | 8,661 | | | | 8,907 | |
| | | | | | | | 12,180,747 | | | | 9,889,998 | |
Loans outstanding | | | (12) | | | | 21,975,146 | | | | 21,554,808 | |
Intangible assets | | | (13) | | | | 7,524 | | | | 12,018 | |
Tangible assets, property and equipment | | | (13) | | | | 35,632 | | | | 37,256 | |
Other assets | | | | | | | | | | | | |
Derivatives | | | (15) (24) | | | | 1,254,828 | | | | 1,405,770 | |
Other assets | | | (15) | | | | 31,916 | | | | 19,614 | |
| | | | | | | | 1,286,744 | | | | 1,425,384 | |
Accrued interest and fees receivable | | | | | | | 241,145 | | | | 232,197 | |
TOTAL ASSETS | | | | | | | 37,553,390 | | | | 35,422,047 | |
The accompanying notes are an integral part of these financial statements.
| | |
| | |
FINANCIAL REPORT 2021 | | NIB FINANCIAL REPORT 2021 / 26 |
| | |
|
| |
| REPORT OF THE BOARD OF DIRECTORS |
| |
| PRESIDENT AND CEO’S COMMENTS |
| |
| OPERATING AND FINANCIAL REVIEW |
| |
| CAPITAL AND LIQUIDITY MANAGEMENT |
| |
| FINANCIAL STATEMENTS |
| |
STATEMENT OF COMPREHENSIVE INCOME |
| |
| STATEMENT OF FINANCIAL POSITION |
| |
CHANGES IN EQUITY |
| |
| CASH FLOW STATEMENT |
| |
| NOTES |
| |
| PROPOSAL BY THE BOARD OF DIRECTORS |
| |
| AUDITOR’S REPORT |
| |
| GOVERNANCE STATEMENT |
| |
| REPORT OF THE CONTROL COMMITTEE CHAIRMANSHIP |
| |
| REPORT OF THE CONTROL COMMITTEE |
| |
| |
| |
| |
| |
| |
| |
| |
| |
| |
| |
| |
| |
| |
| |
| |
| |
| |
| | | | | | | | | | | | |
| | | | |
| In thousands of euro | | NOTE | | | 31 DECEMBER 2021 | | | 31 DECEMBER 2020 | |
| | | |
LIABILITIES AND EQUITY | | | | | | | | | | | | |
| | | |
Liabilities | | | | | | | | | | | | |
| | | |
Amounts owed to credit institutions | | | | | | | | | | | | |
| | | |
Short-term amounts owed to credit institutions | | | (19) (26) | | | | 751,697 | | | | 723,795 | |
| | | |
Long-term amounts owed to credit institutions | | | | | | | - | | | | - | |
| | | |
| | | | | | | | 751,697 | | | | 723,795 | |
| | | |
| | | | | | | | | | | | | |
| | | |
Debts evidenced by certificates | | | (16) | | | | 31,525,985 | | | | 29,071,696 | |
| | | |
Other liabilities | | | | | | | | | | | | |
| | | |
Derivatives | | | (17)(24) | | | | 1,052,474 | | | | 1,362,269 | |
| | | |
Other liabilities | | | (17) | | | | 39,426 | | | | 227,905 | |
| | | |
| | | | | | | | 1,091,900 | | | | 1,590,174 | |
| | | |
Accrued interest and fees payable | | | | | | | 185,171 | | | | 175,620 | |
| | | |
Total liabilities | | | | | | | 33,554,753 | | | | 31,561,285 | |
| | | |
| | | | | | | | | | | | | |
| | | |
Equity | | | (18) | | | | 3,998,637 | | | | 3,860,761 | |
| | | |
| | | | | | | | | | | | | |
| | | |
TOTAL LIABILITIES AND EQUITY | | | | | | | 37,553,390 | | | | 35,422,047 | |
The accompanying notes are an integral part of these financial statements.
| | |
| | |
FINANCIAL REPORT 2021 | | NIB FINANCIAL REPORT 2021 / 27 |
| | |
|
| |
| REPORT OF THE BOARD OF DIRECTORS |
| |
| PRESIDENT AND CEO’S COMMENTS |
| |
| OPERATING AND FINANCIAL REVIEW |
| |
| CAPITAL AND LIQUIDITY MANAGEMENT |
| |
| FINANCIAL STATEMENTS |
| |
| STATEMENT OF COMPREHENSIVE INCOME |
| |
STATEMENT OF FINANCIAL POSITION |
| |
| CHANGES IN EQUITY |
| |
CASH FLOW STATEMENT |
| |
| NOTES |
| |
| PROPOSAL BY THE BOARD OF DIRECTORS |
| |
| AUDITOR’S REPORT |
| |
| GOVERNANCE STATEMENT |
| |
| REPORT OF THE CONTROL COMMITTEE CHAIRMANSHIP |
| |
| REPORT OF THE CONTROL COMMITTEE |
| |
| |
| |
| |
| |
| |
| |
| |
| |
| |
| |
| |
| |
| |
| |
| |
| |
| |
| |
| |
| |
| |
| |
| |
| |
| |
| |
| |
| |
| |
| |
| |
Changes in equity
| | | | | | | | | | | | | | | | | | | | | | | | | | | | | | | | |
| In thousands of euro | | PAID-IN CAPITAL | | | STATUTORY
RESERVE | | | GENERAL
CREDIT
RISK FUND | | | SPECIAL CREDIT
RISK FUND PIL | | | PROFIT AVAILABLE
FOR APPROPRI-
ATION | | | CHANGES
IN OWN
CREDIT
RISK ON
LIABILITIES
RECORDED
AT
FAIR VALUE | | | COST OF
HEDGING
RESERVE | | | TOTAL | |
EQUITY AT 31 DECEMBER 2019 | | | 418,602 | | | | 686,325 | | | | 2,002,562 | | | | 426,941 | | | | 181,982 | | | | 0 | | | | 18,910 | | | | 3,735,323 | |
Profit for the year | | | - | | | | - | | | | - | | | | - | | | | 164,695 | | | | - | | | | - | | | | 164,695 | |
Other comprehensive income | | | - | | | | - | | | | - | | | | - | | | | - | | | | -3,376 | | | | 9,120 | | | | 5,744 | |
Total comprehensive income | | | 0 | | | | 0 | | | | 0 | | | | 0 | | | | 164,695 | | | | -3,376 | | | | 9,120 | | | | 170,439 | |
Transaction with owners in their capacity as owners | | | | | | | | | | | | | | | | | | | | | | | | | | | | | | | | |
Appropriation of year | | | - | | | | - | | | | 136,982 | | | | - | | | | -136,982 | | | | - | | | | - | | | | 0 | |
Dividends | | | - | | | | - | | | | - | | | | - | | | | -45,000 | | | | - | | | | - | | | | -45,000 | |
Change in statutes (Note 18) | | | 426,941 | | | | - | | | | - | | | | -426,941 | | | | - | | | | - | | | | - | | | | 0 | |
EQUITY AT 31 DECEMBER 2020 | | | 845,543 | | | | 686,325 | | | | 2,139,544 | | | | 0 | | | | 164,695 | | | | -3,376 | | | | 28,030 | | | | 3,860,761 | |
Profit for the year | | | - | | | | - | | | | - | | | | - | | | | 159,158 | | | | - | | | | - | | | | 159,158 | |
Other comprehensive income | | | - | | | | - | | | | - | | | | - | | | | - | | | | 329 | | | | -21,612 | | | | -21,283 | |
Total comprehensive income | | | 0 | | | | 0 | | | | 0 | | | | 0 | | | | 159,158 | | | | 329 | | | | -21,612 | | | | 137,876 | |
Transaction with owners in their capacity as owners | | | | | | | | | | | | | | | | | | | | | | | | | | | | | | | | |
Appropriation of profit | | | - | | | | 150,559 | | | | 14,136 | | | | - | | | | -164,695 | | | | - | | | | - | | | | 0 | |
EQUITY AT 31 DECEMBER 2021 | | | 845,543 | | | | 836,884 | | | | 2,153,680 | | | | 0 | | | | 159,159 | | | | -3,047 | | | | 6,418 | | | | 3,998,637 | |
The accompanying notes are an integral part of these financial statements.
| | |
| | |
FINANCIAL REPORT 2021 | | NIB FINANCIAL REPORT 2021 / 28 |
| | |
|
| |
| REPORT OF THE BOARD OF DIRECTORS |
| |
| PRESIDENT AND CEO’S COMMENTS |
| |
| OPERATING AND FINANCIAL REVIEW |
| |
| CAPITAL AND LIQUIDITY MANAGEMENT |
| |
| FINANCIAL STATEMENTS |
| |
| STATEMENT OF COMPREHENSIVE INCOME |
| |
| STATEMENT OF FINANCIAL POSITION |
| |
CHANGES IN EQUITY |
| |
| CASH FLOW STATEMENT |
| |
NOTES |
| |
| PROPOSAL BY THE BOARD OF DIRECTORS |
| |
| AUDITOR’S REPORT |
| |
| GOVERNANCE STATEMENT |
| |
| REPORT OF THE CONTROL COMMITTEE CHAIRMANSHIP |
| |
| REPORT OF THE CONTROL COMMITTEE |
| |
| |
| |
| |
| |
| |
| |
| |
| |
| |
| |
| |
| |
| |
| |
| |
| |
| |
Cash flow statement
| | | | | | | | | | | | |
| In thousands of euro | | NOTE | | | 2021 | | | 2020 | |
Cash flows from operating activities | | | | | | | | | | | | |
Net profit for the year | | | | | | | 159,158 | | | | 164,695 | |
| | | | | | | | | | | | | |
Adjustments: | | | | | | | | | | | | |
Unrealised gains/losses of financial assets held at fair value | | | | | | | -9,169 | | | | -12,900 | |
ECL non-lending activities | | | | | | | -323 | | | | 301 | |
Depreciation and write-down in value of tangible and intangible assets | | | | | | | 9,545 | | | | 7,546 | |
Change in accrued interest and fees (assets) | | | | | | | -8,948 | | | | 42,646 | |
Change in accrued interest and fees (liabilities) | | | | | | | 10,584 | | | | -46,184 | |
Net loan losses (ECL lending activities) | | | | | | | -25,874 | | | | 56,744 | |
Adjustment to hedge accounting | | | | | | | 37,966 | | | | -51,157 | |
Other adjustments to the net profit for the year | | | | | | | -104 | | | | 3,023 | |
Adjustments, total | | | | | | | 13,676 | | | | 18 | |
Lending | | | | | | | | | | | | |
Disbursements of loans | | | | | | | -2,270,722 | | | | -4,818,897 | |
Repayments of loans | | | | | | | 1,975,518 | | | | 1,867,353 | |
Capitalisations, redenominations, index adjustments, etc. | | | | | | | 1,390 | | | | 430 | |
Lending, total | | | | | | | -293,815 | | | | -2,951,115 | |
| | | | | | | | | | | | | |
Cash flows from operating activities, total | | | | | | | -120,980 | | | | -2,786,402 | |
| | | | | | | | | | | | | |
Cash flows from investing activities | | | | | | | | | | | | |
Placements and debt securities | | | | | | | | | | | | |
Purchase of debt securities | | | | | | | -2,191,647 | | | | -1,090,285 | |
Sold and/or matured debt securities | | | | | | | 1,645,287 | | | | 786,599 | |
Placements with credit institutions | | | | | | | -2,002,565 | | | | 1,335,090 | |
Other financial placements | | | | | | | 51 | | | | 5,379 | |
Placements and debt securities, total | | | | | | | -2,548,873 | | | | 1,036,783 | |
The accompanying notes are an integral part of these financial statements.
| | |
| | |
FINANCIAL REPORT 2021 | | NIB FINANCIAL REPORT 2021 / 29 |
| | |
|
| |
| REPORT OF THE BOARD OF DIRECTORS |
| |
| PRESIDENT AND CEO’S COMMENTS |
| |
| OPERATING AND FINANCIAL REVIEW |
| |
| CAPITAL AND LIQUIDITY MANAGEMENT |
| |
| FINANCIAL STATEMENTS |
| |
| STATEMENT OF COMPREHENSIVE INCOME |
| |
| STATEMENT OF FINANCIAL POSITION |
| |
CHANGES IN EQUITY |
| |
| CASH FLOW STATEMENT |
| |
NOTES |
| |
| PROPOSAL BY THE BOARD OF DIRECTORS |
| |
| AUDITOR’S REPORT |
| |
| GOVERNANCE STATEMENT |
| |
| REPORT OF THE CONTROL COMMITTEE CHAIRMANSHIP |
| |
| REPORT OF THE CONTROL COMMITTEE |
| |
| |
| |
| |
| |
| |
| |
| |
| |
| |
| |
| |
| |
| |
| |
| |
| |
| |
| | | | | | | | | | | | |
| In thousands of euro | | NOTE | | | 2021 | | | 2020 | |
Other items | | | | | | | | | | | | |
Acquisition of intangible assets | | | | | | | -1,617 | | | | -4,872 | |
Acquisition of tangible assets | | | | | | | -1,810 | | | | -4,296 | |
Change in other assets | | | | | | | -1,431 | | | | 1,684 | |
Other items, total | | | | | | | -4,858 | | | | -7,484 | |
| | | | | | | | | | | | | |
Cash flows from investing activities, total | | | | | | | -2,553,732 | | | | 1,029,299 | |
| | | | | | | | | | | | | |
Cash flows from financing activities | | | | | | | | | | | | |
Debts evidenced by certificates | | | | | | | | | | | | |
Issues of new debt | | | | | | | 7,027,535 | | | | 7,540,409 | |
Redemptions | | | | | | | -5,073,812 | | | | -4,142,020 | |
Debts evidenced by certificates, total | | | | | | | 1,953,722 | | | | 3,398,389 | |
| | | | | | | | | | | | | |
Other items | | | | | | | | | | | | |
Long-term placements from credit institutions | | | | | | | - | | | | -8,435 | |
Change in swap receivables excluding fair value changes | | | | | | | 92,626 | | | | -274,019 | |
Change in swap payables excluding fair value changes | | | | | | | 147,890 | | | | -248,028 | |
Change in other liabilities | | | | | | | -2,491 | | | | -3,808 | |
Dividend paid | | | | | | | - | | | | -45,000 | |
Other items, total | | | | | | | 238,025 | | | | -579,290 | |
| | | | | | | | | | | | | |
Cash flows from financing activities, total | | | (26 | ) | | | 2,191,747 | | | | 2,819,099 | |
| | | | | | | | | | | | | |
CHANGE IN CASH AND CASH EQUIVALENTS, NET | | | (26 | ) | | | -482,964 | | | | 1,061,996 | |
| | | | | | | | | | | | | |
Opening balance for cash and cash equivalents, net | | | | | | | 1,546,591 | | | | 471,700 | |
Exchange rate adjustments | | | | | | | 11,127 | | | | 12,895 | |
Closing balance for cash and cash equivalents, net | | | | | | | 1,074,754 | | | | 1,546,591 | |
| | | | | | | | | | | | | |
Additional information to the statement of cash flows | | | | | | | | | | | | |
Interest income received | | | | | | | 192,300 | | | | 315,144 | |
Interest expense paid | | | | | | | 9,696 | | | | -113,157 | |
The accompanying notes are an integral part of these financial statements.
| | |
| | |
FINANCIAL REPORT 2021 | | NIB FINANCIAL REPORT 2021 / 30 |
| | |
|
|
| REPORT OF THE BOARD OF DIRECTORS |
| |
| PRESIDENT AND CEO’S COMMENTS |
|
| OPERATING AND FINANCIAL REVIEW |
| |
| CAPITAL AND LIQUIDITY MANAGEMENT |
| |
| FINANCIAL STATEMENTS |
| |
| STATEMENT OF COMPREHENSIVE INCOME |
| |
| STATEMENT OF FINANCIAL POSITION |
| |
| CHANGES IN EQUITY |
| |
| CASH FLOW STATEMENT |
| |
| NOTES |
| |
| PROPOSAL BY THE BOARD OF DIRECTORS |
| |
| AUDITOR’S REPORT |
| |
| GOVERNANCE STATEMENT |
| |
| REPORT OF THE CONTROL COMMITTEE CHAIRMANSHIP |
| |
| REPORT OF THE CONTROL COMMITTEE |
| |
| |
| |
| |
| |
| |
| |
| |
| |
| |
| |
| |
| |
| |
| |
| |
| |
| |
Note 1: Accounting policies
REPORTING ENTITY - HISTORY OF NIB
Cooperation of Member Countries
Institutionalised Nordic Cooperation
Cooperation among the Nordic countries comprises a wide range of activities, including economic policy, development of industrial technology, communications and the harmonisation of legal systems.
The most important formal basis for Nordic cooperation is the Helsinki Agreement of 1962. This agreement sets out the aims of Nordic cooperation and contains provisions for the Nordic Council and, as subsequently amended, for the Nordic Council of Ministers.
The Nordic Council is a forum for consultation and discussion on issues of common interests at a parliamentary level. The Nordic Council of Ministers is empowered to make decisions on matters of cooperation that are considered binding to the governments of the Nordic countries.
Since 1992, the three Baltic countries Estonia, Latvia and Lithuania have been cooperating closely with the Nordic countries under the framework of the Nordic–Baltic Eight (NB8) format. Under NB8, regular meetings between the Nordic and Baltic prime ministers and foreign ministers are held to discuss questions of regional interest and international issues.
EFTA and EU
The Nordic countries have steadily broadened their mutual commercial relationships, a development encouraged by the creation of the European Free Trade Association (“EFTA”) in 1960, which established a framework for the development of inter-Nordic trade during the 1960s and 1970s.
Following Denmark’s entry into the European Community (the predecessor to the European Union) in 1973, the other four Nordic countries concluded bilateral free-trade agreements with the European Community in order to promote free trade within the Nordic region.
Effective 1 January 1994, the EFTA member countries, with the exclusion of Switzerland, and the European Union (“EU”) established the European Economic Area (“EEA”), a free trade zone in Europe.
On 1 January 1995, Finland and Sweden became members of the EU, leaving Norway and Iceland as the only Nordic countries that presently are EFTA members. At the introduction of the Euro on 1 January 1999, Finland was the only Nordic country to participate in the economic and monetary union of the EU (“EMU”).
Effective 1 May 2004, Estonia, Latvia and Lithuania became members of the EU and subsequently of the EMU. Estonia joined the EMU on 1 January 2011, Latvia on 1 January 2014 and Lithuania on 1 January 2015.
Other forms of cooperation
Nordic–Baltic cooperation also includes coordination of policy positions in international organisations. Consultations are held regularly on issues arising within the United Nations and the United Nations Commission for Trade and Development. The member countries are jointly represented in the International Monetary Fund, the International Bank for Reconstruction and Development and other international organisations.
Establishment of the Nordic Investment Bank
Discussions within the Nordic Council and the Nordic Council of Ministers over a number of years led to the establishment of the Nordic Investment Bank. The legal basis for NIB is the “Establishing Agreement”, which was signed on 4 December 1975. The signatories of the Establishing Agreement were Denmark, Finland, Iceland, Norway and Sweden.
The Establishing Agreement and the Statutes of NIB became effective on 1 June 1976, and the Bank commenced operations on 2 August of that year.
On 15 September 1981, the Nordic Council of Ministers approved a programme to promote member country cooperation in project exports, primarily to developing countries. The decision, as amended on 28 February 1982, included, as one major element of the programme, the creation of a joint financing facility to grant loans and issue loan guarantees (“project investment loans”). The facility became effective on 1 July 1982, and has formed the main part of NIB’s lending activities outside Member countries. See Note 12.
| | |
| | |
FINANCIAL REPORT 2021 | | NIB FINANCIAL REPORT 2021 / 31 |
| | |
|
| |
| REPORT OF THE BOARD OF DIRECTORS |
| |
| PRESIDENT AND CEO’S COMMENTS |
| |
| OPERATING AND FINANCIAL REVIEW |
| |
| CAPITAL AND LIQUIDITY MANAGEMENT |
| |
| FINANCIAL STATEMENTS |
| |
| STATEMENT OF COMPREHENSIVE INCOME |
| |
| STATEMENT OF FINANCIAL POSITION |
| |
| CHANGES IN EQUITY |
| |
| CASH FLOW STATEMENT |
| |
| NOTES |
| |
| PROPOSAL BY THE BOARD OF DIRECTORS |
| |
| AUDITOR’S REPORT |
| |
| GOVERNANCE STATEMENT |
| |
| REPORT OF THE CONTROL COMMITTEE CHAIRMANSHIP |
| |
| REPORT OF THE CONTROL COMMITTEE |
| |
| |
| |
| |
| |
| |
| |
| |
| |
| |
| |
| |
| |
| |
| |
| |
|
In August 1996, the Nordic prime ministers decided to establish a special environmental loan facility (the “Environmental Investment Loan Facility”) to finance environmental investments in the region neighbouring the Nordic countries. The facility was approved by the Nordic Council of Ministers on 25 January 1997, and became effective on 28 August 1997. The facility, which was part of NIB’s lending activities, comprised loans and guarantees to both the public and private sector for financing investments aimed at protecting the environment and reducing cross border pollution in the neighbouring area to the member countries. See Note 12.
The project investment loan and environmental investment loan programmes were incorporated into NIB’s normal lending activities as part of the Statutory changes which came into effect on 29 July 2020 and are described below.
In November 1997, the Nordic Council of Ministers decided that the legal framework of NIB and its sister organisation NEFCO and NDF (each, as defined below) should be revised to reflect their status as international institutions. In relation to NIB, this led to the signing of the 1998 Agreement on 23 October 1998.
On 23 October 1998, the Nordic countries entered into a novation of the Establishing Agreement (the “1998 Agreement”). The 1998 Agreement came into force on 18 July 1999, and the Establishing Agreement ceased to be effective on the same date.
On 1 January 2005, Estonia, Latvia and Lithuania became members of NIB on equal terms with the original member countries following a policy decision taken by the Nordic prime ministers in June 2003. The new members have the same rights and obligations as the original members.
The 2004 Agreement mandates a new structure for the governance of the Bank, which was fully implemented as of 1 January 2005. NIB introduced an entirely new body, the Board of Governors, which replaced the Nordic Council of Ministers and its functions in the previous legal framework of the Bank. The 2004 Agreement did not change the activities of the Bank.
At its annual meeting on 24 May 2019, the Board of Governors approved substantial amendments to the Statutes and an amendment to the Agreement was agreed and signed on 28 February 2020. This Amending Agreement and the amendments to the Statues came into effect on 29 July 2020. The amendments consisted of the following:
- Replacing the current statutory gearing limit with a risk-based comprehensive framework for capital and liquidity management, in accordance with sound banking principles, and introducing minimum requirements for capital, liquidity and leverage;
- Discontinuing the special loan facilities for Project Investment Loans (PIL) and Environmental Investment Loans (MIL). The outstanding amounts under the PIL and MIL facilities have become part of NIB’s ordinary lending, and new lending of this type will in future also constitute ordinary lending. In addition, the special credit risk fund for PIL has been converted into paid-in capital and the Member countries’ PIL guarantees into callable capital. The MIL has not been converted;
- Improving institutional governance, clarifying the role of the Control Committee and the external auditors, and strengthening the role of the Chairmanship of the Bank’s Control Committee; and
- Allowing for limited equity participation as a new form of financing for the Bank, in addition to loans and guarantees, with the unanimous approval of the Board of Directors.
Implications for NIB’s related parties/sister organisations
On 19 May 1988, the Nordic Council of Ministers decided to establish the Nordic Development Fund (“NDF”), an international financial institution, for financing projects of Nordic interest in developing countries on concessional terms. The establishing agreement of NDF was signed by the five Nordic countries (“NDF member countries”) on 3 November 1988, and NDF commenced operations on 1 February 1989. NDF is a separate legal entity with its own Board of Directors and with a capital base provided by the NDF member countries.
On 2 March 1990, the Nordic Council of Ministers decided to establish the Nordic Environment Finance Corporation (“NEFCO”), an international financial institution, for promoting investments of Nordic environmental interest in Eastern and Central Europe. NEFCO is a separate legal entity with its own Board of Directors and with a capital base provided by the NEFCO member countries.
According to the constituent documents of NDF and NEFCO, their principal offices shall be located at the principal office of NIB. Furthermore, the Statutes of NDF and NEFCO set out that their Control Committee members appointed by the Nordic Council shall be the same persons as appointed by the Council to the Control Committee of NIB. In addition, the Statutes of NDF and NEFCO set out that the powers vested in their respective Board of Directors may be delegated to the President of the respective organisation and/or to NIB. NIB
| | |
| | |
FINANCIAL REPORT 2021 | | NIB FINANCIAL REPORT 2021 / 32 |
| | |
|
| |
| REPORT OF THE BOARD OF DIRECTORS |
| |
| PRESIDENT AND CEO’S COMMENTS |
| |
| OPERATING AND FINANCIAL REVIEW |
| |
| CAPITAL AND LIQUIDITY MANAGEMENT |
| |
| FINANCIAL STATEMENTS |
| |
| STATEMENT OF COMPREHENSIVE INCOME |
| |
| STATEMENT OF FINANCIAL POSITION |
| |
| CHANGES IN EQUITY |
| |
| CASH FLOW STATEMENT |
| |
| NOTES |
| |
| PROPOSAL BY THE BOARD OF DIRECTORS |
| |
| AUDITOR’S REPORT |
| |
| GOVERNANCE STATEMENT |
| |
| REPORT OF THE CONTROL COMMITTEE CHAIRMANSHIP |
| |
| REPORT OF THE CONTROL COMMITTEE |
| |
| |
| |
| |
| |
| |
| |
| |
| |
| |
| |
| |
| |
| |
| |
| |
|
provides administrative services to NDF and NEFCO the compensation of which is disclosed in Note 8 of the annual financial statements.
Statutory Purposes
The purpose of NIB, according to the 2004 Agreement and the Statutes is to make financing available in accordance with sound banking principles, taking into account socio-economic considerations, to realise investment projects of interest to the Member countries and other countries, which receive such financing. NIB is required to make a profit from its operations in order to provide for the accumulation of reserves and a reasonable return on its paid-in capital; however, it is not a profit maximising entity.
NIB finances its operations from the capital paid in by Member countries, retained earnings and by borrowing on the international capital markets.
Legal Status
Under the 2004 Agreement, NIB has the status of an international legal person with full legal capacity. In particular, NIB has the capacity to enter into agreements, to acquire and dispose of immovable and movable property, and to be a party to legal proceedings before courts of law and other authorities. The 2004 Agreement further states that NIB, as a common international financial institution to the Member countries, has the same status as other legal persons conducting similar operations within and outside the Member countries.
The 2004 Agreement also contains, among others, provisions regarding certain immunities. According to these provisions the Member countries have agreed that actions may be brought against NIB only in a court of competent jurisdiction in the territory of a country in which NIB has established an office, or has appointed an agent for the purpose of accepting service of process, or when NIB has otherwise expressly accepted jurisdiction. Actions may, however, be brought by a Member country or by persons acting for or deriving claims from a Member country only if NIB has given its express consent thereto.
In addition, the 2004 Agreement provides that property and assets of NIB wherever located and by whomsoever held shall be immune from execution of judgment or decree by judicial or administrative authority before such judgment or decree is final. The property and assets of the Bank wherever located and by whomsoever held shall further be immune from search, requisition, confiscation and expropriation by executive or legislative action. The Bank, its property and assets shall also be immune from procedural measures of constraints, such as seizure.
The 2004 Agreement stipulates that the premises and archives of NIB and all documents belonging to it or held by it shall be inviolable.
The 2004 Agreement also states that NIB is exempt from payment restrictions and credit policy measures, which in any manner prevent or impede the fulfilment of its commitments and that NIB, its income, assets and property shall be exempt from all taxation as set forth in the relevant Article. Consequently, NIB shall be exempt from taxes on the purchase and transfer of real estate and securities and on the procurement of goods and services in connection with the official activities of NIB. Lending and borrowing by NIB is also exempt from all taxes and charges of a similar nature.
On 20 October 2010, a revised Host Country Agreement between NIB and the Government of Finland was signed. The agreement confirms NIB´s status as an international organization and further regulates certain privileges and immunities concerning NIB and its staff as well as social security for the staff. The agreement was enacted in Finland and came into force on 16 January 2011.
NIB’s Headquarters is located at Fabianinkatu 34, Helsinki, Finland.
BASIS OF ACCOUNTING
The Bank’s financial statements have been prepared in accordance with International Financial Reporting Standards (IFRS) issued by the International Accounting Standards Board (IASB). The financial statements have been prepared in accordance with the historical cost convention with some exceptions described in the policies below.
The cash flow statement has been prepared using the indirect method whereby net profit is adjusted for effects of non-cash transactions such as fair valuations, depreciation and loan losses. The cash flows are classified by operating, investing and financing activities. Cash flow items cannot be directly determined from the statement of financial position.
On 17 February 2022, the Board of Directors approved the financial statements for publication. These financial statements will be submitted for approval to the Annual Meeting of the Board of Governors scheduled to be held no later than by the end of May 2021.
| | |
| | |
FINANCIAL REPORT 2021 | | NIB FINANCIAL REPORT 2021 / 33 |
| | |
|
| |
| REPORT OF THE BOARD OF DIRECTORS |
| |
| PRESIDENT AND CEO’S COMMENTS |
| |
| OPERATING AND FINANCIAL REVIEW |
| |
| CAPITAL AND LIQUIDITY MANAGEMENT |
| |
| FINANCIAL STATEMENTS |
| |
| STATEMENT OF COMPREHENSIVE INCOME |
| |
| STATEMENT OF FINANCIAL POSITION |
| |
| CHANGES IN EQUITY |
| |
| CASH FLOW STATEMENT |
| |
| NOTES |
| |
| PROPOSAL BY THE BOARD OF DIRECTORS |
| |
| AUDITOR’S REPORT |
| |
| GOVERNANCE STATEMENT |
| |
| REPORT OF THE CONTROL COMMITTEE CHAIRMANSHIP |
| |
| REPORT OF THE CONTROL COMMITTEE |
| |
| |
| |
| |
| |
| |
| |
| |
| |
| |
| |
| |
| |
| |
| |
| |
|
NEW ACCOUNTING STANDARDS ADOPTED IN 2021 AND NEW STANDARDS FOR FINANCIAL YEARS BEGINNING ON OR AFTER 1 JANUARY 2022
The Bank did not adopt any new standards during 2021. The Bank early adopted the ‘Interest Rate Benchmark Reform - Phase 2’ amendments in 2020. There are no IFRS standards or interpretations that are not yet effective that would be expected to have a material impact on the Bank.
FUNCTIONAL AND PRESENTATION CURRENCY
The Bank’s functional and presentation currency is the euro and the financial statements are presented in EUR 1,000, unless otherwise indicated. All figures in the accounts have been rounded and consequently the sum of individual figures may deviate from the presented sum figure. Furthermore, all percentages are subject to possible rounding differences.
SIGNIFICANT ACCOUNTING JUDGEMENTS AND ESTIMATES
As part of the process of preparing the financial statements in conformity with IFRS, the Bank’s management is required to make certain judgements, estimates and assumptions that may affect the Bank’s profits, its financial position and other information presented in the Annual Report. These estimates are based on available information and the judgements made by the Bank’s management. Actual outcomes may deviate from the assessments made, and such deviations may at times be significant.
The Bank uses various valuation models and techniques to estimate the fair values of assets and liabilities. There are significant uncertainties related to these estimates, in particular when they involve modelling complex financial instruments, such as derivative instruments used for hedging activities related to both borrowing and lending.
The estimates are highly dependent on market data, such as the level of interest rates, currency rates and other factors. The uncertainties related to these estimates are reflected mainly in the statement of financial position. NIB undertakes continuous development in order to improve the basis for fair value estimates, with regard to both modelling and market data. Changes in estimates resulting from refinements in assumptions and methodologies are reflected in the period in which the enhancements are first applied.
Significant judgement and estimates are also applied to loan impairment testing in accordance with IFRS 9.
FOREIGN CURRENCY TRANSLATION
Monetary assets and liabilities denominated in foreign currencies are recognised in the accounts at the exchange rate prevailing on the closing date. Non-monetary assets and liabilities are recognised in the accounts at the euro rate prevailing on the transaction date. Income and expenses recognised in currencies other than the euro are converted on a daily basis to the euro, in accordance with the euro exchange rate prevailing on that day.
Realised and unrealised exchange rate gains and losses are recognised in the statement of comprehensive income.
The Bank uses exchange rates acquired from a leading market data provider based on rates prevailing at 13:00 GMT at 31 December except for Special drawing right (SDR) which is based on the International Monetary Fund (IMF) published rate as disclosed in Note 27.
RECOGNITION AND DERECOGNITION OF FINANCIAL INSTRUMENTS
Financial instruments are recognised in the statement of financial position on a trade date basis.
A financial asset is derecognised when the contractual rights to the cash flows from the financial asset expire or when there has been a signifcant change of risk and reward.
A financial liability is derecognised from the statement of financial position when the obligation specified in the contract is discharged, cancelled or expired.
Basis for classification and measurement
The Bank classifies its financial assets and liabilities into the following categories: those measured at amortised cost, and those measured at fair value. This classification depends on both the contractual characteristics of the assets and liabilities as well as the business model adopted for their management.
Financial assets and liabilities at amortised cost
An investment or liability is classified at “amortised cost” only if both of the following criteria are met: the objective of the Bank’s business model is to hold the assets and liabilities in order to collect or pay the contractual cash flows, and the contractual terms of the financial assets must give rise on specified dates to cash flows that are only payments of principal and interest on the principal amount outstanding.
| | |
| | |
FINANCIAL REPORT 2021 | | NIB FINANCIAL REPORT 2021 / 34 |
| | |
|
| |
| REPORT OF THE BOARD OF DIRECTORS |
| |
| PRESIDENT AND CEO’S COMMENTS |
| |
| OPERATING AND FINANCIAL REVIEW |
| |
| CAPITAL AND LIQUIDITY MANAGEMENT |
| |
| FINANCIAL STATEMENTS |
| |
| STATEMENT OF COMPREHENSIVE INCOME |
| |
| STATEMENT OF FINANCIAL POSITION |
| |
| CHANGES IN EQUITY |
| |
| CASH FLOW STATEMENT |
| |
| NOTES |
| |
| PROPOSAL BY THE BOARD OF DIRECTORS |
| |
| AUDITOR’S REPORT |
| |
| GOVERNANCE STATEMENT |
| |
| REPORT OF THE CONTROL COMMITTEE CHAIRMANSHIP |
| |
| REPORT OF THE CONTROL COMMITTEE |
| |
| |
| |
| |
| |
| |
| |
| |
| |
| |
| |
| |
| |
| |
| |
| |
|
Financial assets at fair value
If either of the two criteria above is not met, the asset cannot be classified in the amortised cost category and must be classified at fair value through profit and loss (FVTPL) or fair value through other comprehensive income (FVOCI). FVOCI is used to classify assets held for payments of principal, interest and to sell. All other financial assets are classified as FVTPL.
See hedging policy below for those financial assets and financial liabilities designated as hedged items in a qualifying fair value hedge relationship.
Determination of fair value
The fair value of financial instruments, including derivative instruments that are traded in a liquid market, is the bid or offered closing price on the balance sheet date. Where the fair values cannot be derived from active markets, they are determined using a variety of valuation techniques, which include the use of mathematical models. The input to these models is taken from observable market data where possible. Many of NIB’s financial instruments are not traded in a liquid market, such as the Bank’s borrowing transactions with embedded derivative instruments. These are measured at fair value using different valuation models and techniques. This process involves determining future expected cash flows, which can then be discounted to the balance sheet date. The estimation of future cash flows for these instruments is subject to assumptions on market data, and in some cases, in particular where options are involved, on the behaviour of the Bank’s counterparties. The fair value estimate may therefore be subject to variations. Under different market assumptions, the values could also differ significantly.
The Bank measures fair values using the following fair value hierarchy, which reflects the significance of the inputs used in making the measurements:
Level 1: Quoted market prices (unadjusted) in an active market for identical instruments.
Level 2: Valuation techniques based on observable inputs, either directly (i.e. as prices) or indirectly (i.e. derived from prices). This category includes instruments valued using: quoted market prices in active markets for similar instruments, quoted prices for identical or similar instruments in markets that are considered less than active or other valuation techniques where all significant inputs are directly or indirectly observable from market data.
Level 3: Valuation techniques using significant unobservable inputs. This category includes all instruments where the valuation technique includes inputs not based on observable data and where the
unobservable inputs have a significant effect on the instrument’s valuation. This category includes instruments that are valued based on quoted prices for similar instruments where significant unobservable adjustments or assumptions are required to reflect differences between the instruments.
The Bank recognises transfers between levels of the fair value hierarchy as of the end of the reporting period during which the change has occurred. All level 2 valuations are based on acquired market data from external sources using NIB developed models. See Note 20 for further details.
Offsetting
A financial asset and a financial liability are offset and the net amount recognised only where there is a legal right to do so and the intention is to settle on a net basis.
CASH AND CASH EQUIVALENTS
Cash and cash equivalents comprise monetary assets and placements with original maturities of three months or less, calculated from the date the acquisition and placements were made.
Cash and cash equivalents in the cash flow statement refers to the net amount of monetary assets, placements and liabilities with original maturities of three months or less, calculated from the time the transaction was entered into.
FINANCIAL PLACEMENTS
Items recognised as financial placements in the statement of financial position include placements with credit institutions and placements in debt securities, for example, bonds and other debt certificates, as well as certain placements in instruments with equity features. The placements are initially recognised on trade date. Their subsequent accounting treatment depends on both the Bank’s business model for managing the placements and their contractual cash flow characteristics.
LOANS OUTSTANDING
The Bank’s loan transactions are recognised in the statement of financial position at the time the funds are transferred to the borrower. Loans are recognised initially at fair value which corresponds to transferred funds, including transaction costs. Loans outstanding are subsequently carried at amortised cost except for some structured loans that do not meet
| | |
| | |
FINANCIAL REPORT 2021 | | NIB FINANCIAL REPORT 2021 / 35 |
| | |
|
| |
| REPORT OF THE BOARD OF DIRECTORS |
| |
| PRESIDENT AND CEO’S COMMENTS |
| |
| OPERATING AND FINANCIAL REVIEW |
| |
| CAPITAL AND LIQUIDITY MANAGEMENT |
| |
| FINANCIAL STATEMENTS |
| |
| STATEMENT OF COMPREHENSIVE INCOME |
| |
| STATEMENT OF FINANCIAL POSITION |
| |
| CHANGES IN EQUITY |
| |
| CASH FLOW STATEMENT |
| |
| NOTES |
| |
| PROPOSAL BY THE BOARD OF DIRECTORS |
| |
| AUDITOR’S REPORT |
| |
| GOVERNANCE STATEMENT |
| |
| REPORT OF THE CONTROL COMMITTEE CHAIRMANSHIP |
| |
| REPORT OF THE CONTROL COMMITTEE |
| |
| |
| |
| |
| |
| |
| |
| |
| |
| |
| |
| |
| |
| |
| |
| |
|
the amortised cost classification criteria and are therefore recorded at fair value. If the loans are hedged against changes in fair value due to the hedged risk, the carrying value of the hedged loans are adjusted by the fair value of the risk being hedged.
IMPAIRMENT OF LOANS
The bank uses an expected credit loss model (ECL) to estimate the provision for potential impairments. The Bank recognises a loss allowance for ECL on financial assets measured at amortised cost, or at fair value through comprehensive income, and for loan commitments. The ECL comprises of a three-stage model based on changes in credit quality since initial recognition. Impairments are reported based in either twelve month or lifetime expected credit losses, depending on the stage allocation of the financial asset. The stage allocation also determines if interest income for the financial asset are reported on gross carrying amount as for Stage 1 and 2 assets or net of impairment allowance for Stage 3 assets.
Stage 1 - includes financial assets that have not had a significant deterioration in credit quality since initial recognition or have a low risk at the reporting date. For these assets, the ECL is a probability-weighted result of default events that are possible within next 12 months after the reporting date.
Stage 2 - includes financial assets that have had a significant deterioration in credit quality since initial recognition, but for which there is no objective evidence of impairment. For these assets, the lifetime ECL results from all possible default events over the expected lifetime weighted with the probability of default.
Stage 1 and 2 assets are categorised as performing assets and the model calculations are updated at each reporting date.
Stage 3 - includes assets that have been categorised as non-performing in the Bank’s credit rating processes. For the non-performing assets, assessment is done on an individual basis, as opposed to generic calculation rules for the Stage 1 and 2 assets. Exposures in default classes are classified as non-performing. A default occurs with regard to an obligor when either or both of the following have taken place:
| (a) | NIB considers that the obligor is unlikely to pay its credit obligations in full, |
| (b) | The obligor is past due by more than 90 and in the case of sovereign lending exposure to member countries 180 days, or countries with which NIB has an existing framework agreement in place. |
Obligors that satisfy the criteria in (a) above are set to default class D1 and those that satisfy the criteria in (b) above are set to default class D2. If both criteria (a) and (b) are satisfied, the obligor is set to default class D2.
The Bank reviews its non-performing loans and receivables at each reporting date to assess whether an allowance for impairment should be recorded in the statement of comprehensive income. In particular, the judgement of the management is required in estimating the amount and timing of future cash flows when determining the level of allowance required. Such estimates are based on assumptions about a number of factors, and actual results may differ, resulting in future changes to the allowance.
Further details regarding the ECL model, related inputs and governance can be found in Note Note 10.
INTANGIBLE ASSETS
Intangible assets mainly consist of investments in software, software licences and in 2019 right-to use assets arising from leasing arrangements. Acquisitions that generate economic benefits exceeding costs beyond one year are recognised as intangible assets. The investments are carried at historical cost, and are amortised over the assessed useful life of the assets, which is estimated to be between three and five years. The amortisations are made on a straight-line basis.
TANGIBLE ASSETS
Tangible assets in the statement of financial position include land, buildings, office equipment and other tangible assets owned by the Bank. The assets are recognised at historical cost, less any accumulated depreciation based on their assessed useful life. Land is not depreciated. The Bank’s office building in Helsinki is depreciated on a straight-line basis over a 40-year period. The Bank’s other buildings are depreciated over a 30-year period. The depreciation period for office equipment and other tangible assets is determined by assessing the individual item. The depreciation period is usually three to five years. The depreciations are calculated on a straight-line basis.
WRITE-DOWNS AND IMPAIRMENT OF INTANGIBLE AND TANGIBLE ASSETS
The Bank’s assets are reviewed annually for impairment. If there is any objective evidence of impairment, the impairment loss is determined based on the recoverable amount of the assets.
| | |
| | |
FINANCIAL REPORT 2021 | | NIB FINANCIAL REPORT 2021 / 36 |
| | |
|
| |
| REPORT OF THE BOARD OF DIRECTORS |
| |
| PRESIDENT AND CEO’S COMMENTS |
| |
| OPERATING AND FINANCIAL REVIEW |
| |
| CAPITAL AND LIQUIDITY MANAGEMENT |
| |
| FINANCIAL STATEMENTS |
| |
| STATEMENT OF COMPREHENSIVE INCOME |
| |
| STATEMENT OF FINANCIAL POSITION |
| |
| CHANGES IN EQUITY |
| |
| CASH FLOW STATEMENT |
| |
| NOTES |
| |
| PROPOSAL BY THE BOARD OF DIRECTORS |
| |
| AUDITOR’S REPORT |
| |
| GOVERNANCE STATEMENT |
| |
| REPORT OF THE CONTROL COMMITTEE CHAIRMANSHIP |
| |
| REPORT OF THE CONTROL COMMITTEE |
| |
| |
| |
| |
| |
| |
| |
| |
| |
| |
| |
| |
| |
| |
| |
| |
|
DERIVATIVE INSTRUMENTS AND HEDGE ACCOUNTING
The Bank’s derivative instruments used to manage interest rate and currency risk are recognised on a trade-date basis at fair value in the statement of financial position as “Other assets” or “Other liabilities”. The Bank applies hedge accounting in accordance with IFRS 9 when the conditions set out by the standard are met. The hedge accounting is based on a clearly documented relationship between the item hedged and the hedging instrument. When there is a high (negative) correlation between the hedging instrument on the one hand and the value change of the hedged item or the cash flows generated by the hedged item on the other, the hedge is regarded as effective. The hedging relationship is documented at the time the hedge transaction is entered into, and the effectiveness of the hedge is continually assessed.
Derivatives where hedge accounting is not applied are recognised at fair value through profit and loss.
Fair value hedging
When a derivative is designated as the hedging instrument in a hedge of the change in fair value of a recognised asset or liability or a firm commitment that could affect profit or loss, changes in the fair value of the derivative are recognised immediately in profit or loss in the same line item as the changes in fair value of the hedged item due to the hedged risk. Currently the Bank’s fair value hedges mainly relate to swapping fixed to floating rates on its borrowing and lending transactions.
Foreign currency basis spread
The bank separates the foreign currency basis spread from financial instruments used in hedging and this separated amount is recorded in “Other comprehensive income” (OCI).
Cash flow hedging
Currently the Bank does not apply cash flow hedge accounting.
Discontinuance of hedge accounting
If the hedging derivative expires or is sold, terminated or exercised, or the hedge no longer meets the criteria for fair value hedge accounting, then hedge accounting is discontinued prospectively. Any adjustment up to the point of discontinuation to a hedged item for which the effective interest method is used is amortised to profit or loss as part of the recalculated
effective interest rate of the item over its remaining life. If the hedged item is derecognised, the unamortised fair value is recognised immediately in profit or loss.
DEBTS EVIDENCED BY CERTIFICATES
The Bank’s borrowing transactions are recognised in the statement of financial position at trade date. The borrowing transactions are recognised initially at a cost that comprises the fair value of the funds transferred, less transaction costs. The Bank uses derivative instruments to hedge the fair value of virtually all its borrowing transactions. In these instances, the borrowing transaction is subsequently recognised in the statement of financial position at fair value, with any changes in value recognised in the statement of comprehensive income.
For financial liabilities recorded at fair value through the profit and loss, valuation changes due to changes in own credit spreads are recorded in Other Comprehensive Income.
Securities delivered under repurchase agreements are not derecognised from the statement of financial position. Cash received under repurchase agreements is recognised in the statement of financial position as “Amounts owed to credit institutions”.
INTEREST
The Bank’s net interest income includes accrued interest on loans, debt securities, placements and accruals of the premium or discount value of financial instruments. Net interest income also includes interest expenses on debts, swap fees and borrowing costs measured using the effective interest method.
FEES AND COMMISSIONS
Fees collected when disbursing loans are recognised as income at the time of the disbursement, which means that fees and commissions are recognised as income at the same time as the costs are incurred. Commitment fees are charged on loans that are agreed but not yet disbursed and are recognised in the statement of comprehensive income over the commitment period.
FINANCIAL TRANSACTIONS
The Bank recognises in “Net profit on financial operations” both realised and unrealised gains and losses on debt securities and other financial instruments. Adjustments for hedge accounting are also included in this item.
| | |
| | |
FINANCIAL REPORT 2021 | | NIB FINANCIAL REPORT 2021 / 37 |
| | |
|
| |
| REPORT OF THE BOARD OF DIRECTORS |
| |
| PRESIDENT AND CEO’S COMMENTS |
| |
| OPERATING AND FINANCIAL REVIEW |
| |
| CAPITAL AND LIQUIDITY MANAGEMENT |
| |
| FINANCIAL STATEMENTS |
| |
| STATEMENT OF COMPREHENSIVE INCOME |
| |
| STATEMENT OF FINANCIAL POSITION |
| |
| CHANGES IN EQUITY |
| |
| CASH FLOW STATEMENT |
| |
| NOTES |
| |
| PROPOSAL BY THE BOARD OF DIRECTORS |
| |
| AUDITOR’S REPORT |
| |
| GOVERNANCE STATEMENT |
| |
| REPORT OF THE CONTROL COMMITTEE CHAIRMANSHIP |
| |
| REPORT OF THE CONTROL COMMITTEE |
| |
| |
| |
| |
| |
| |
| |
| |
| |
| |
| |
| |
| |
| |
| |
| |
|
LEASING AGREEMENTS
The Bank applies a single recognition and measurement approach for all leases, except for short-term leases and leases of low-value assets. The Bank recognises lease liabilities to make lease payments and right-of-use assets representing the right to use the underlying assets. The liability and asset are equal at recognition date. Short-term leases and leases of low-value assets are recognised on a straight-line basis over the lease term.
Right-of-use assets
The Bank recognises right-of-use assets at the commencement date of the lease (i.e., the date the underlying asset is available for use). Right-of-use assets are measured at cost, less any accumulated depreciation and impairment losses, and adjusted for any remeasurement of lease liabilities. The cost of right-of-use assets includes the amount of lease liabilities recognised, initial direct costs incurred, and lease payments made at or before the commencement date less any lease incentives received. Right-of-use assets are depreciated on a straight-line basis over the lease term. The right of use assets are presented as part of intangible assets in Note 13.
Lease liabilities
At the commencement date of the lease, the Bank recognises lease liabilities measured at the present value of lease payments to be made over the lease term.
EMPLOYEE BENEFITS
Defined contribution plans
The Bank is responsible for arranging pension security for its employees. In accordance with the Host Country Agreement between the Bank and the Finnish Government and as part of the Bank’s pension arrangements, the Bank has decided to apply the Finnish state pension system. Contributions to this pension system, which are paid into the Finnish State Pension Fund, are calculated as a percentage of salaries. The Finnish Ministry of Finance determines the basis for the contributions and establishes the actual percentage of the contributions in co-operation with the local government pension institution Keva. See Note 7. The Bank’s pension liability is completely covered.
NIB also provides its permanent employees with a supplementary pension insurance scheme arranged by a private pension insurance company. This is group pension insurance based on a defined contribution plan.
Obligations for contributions to defined contribution plans are expensed as the related service is provided and recognised as personnel expenses in profit or loss.
Short-term employee benefits
Short-term employee benefits are expensed as the related service is provided.
SEGMENT INFORMATION
Operating segments are reported in a manner consistent with the internal reporting provided to the chief operating decision maker (“CODM”), who is responsible for allocating resources and assessing the performance of the operating segments. Segment results that are reported to the management include items directly attributable to that segment as well as other items allocated on a reasonable basis. As the Bank is a single entity in one location there are no unallocated items.
| | |
| | |
FINANCIAL REPORT 2021 | | NIB FINANCIAL REPORT 2021 / 38 |
| | |
|
| |
| REPORT OF THE BOARD OF DIRECTORS |
| |
| PRESIDENT AND CEO’S COMMENTS |
| |
| OPERATING AND FINANCIAL REVIEW |
| |
| CAPITAL AND LIQUIDITY MANAGEMENT |
| |
| FINANCIAL STATEMENTS |
| |
| STATEMENT OF COMPREHENSIVE INCOME |
| |
| STATEMENT OF FINANCIAL POSITION |
| |
| CHANGES IN EQUITY |
| |
| CASH FLOW STATEMENT |
| |
| NOTES |
| |
| PROPOSAL BY THE BOARD OF DIRECTORS |
| |
| AUDITOR’S REPORT |
| |
| GOVERNANCE STATEMENT |
| |
| REPORT OF THE CONTROL COMMITTEE CHAIRMANSHIP |
| |
| REPORT OF THE CONTROL COMMITTEE |
| |
| |
| |
| |
| |
| |
| |
| |
| |
| |
| |
| |
| |
| |
| |
| |
| |
| |
Note 2: Risk management
RISK MANAGEMENT FRAMEWORK
NIB monitors international risk management regulations and standards and takes them into account to the extent deemed relevant and/or feasible. The Bank has established a risk, capital and liquidity management framework, with high-level statutory requirements stipulated in the Statutes and the Principles for Capital and Liquidity Management, supported by a Risk Appetite Statement (RAS), an Internal Capital Adequacy Assessment Process (ICAAP), and a Capital and Liquidity Recovery Plan.
The Risk Appetite Statement sets the principles for the Bank’s risk-taking, risk mitigation and risk avoidance. It aims to align willingness to take risk with the statutory requirements, strategic business objectives, and capital planning. In addition, it also helps raise risk awareness across the organisation. The Risk Appetite Statement is made operational via specific policies and procedures, monitoring metrics, a limit system and internal controls. Adherence to the Risk Appetite Statement is continuously monitored and regularly reported to senior management. The RAS is reviewed by senior management and the Board of Directors at least on an annual basis in order to ensure that risk-taking stays within risk-bearing capacity. As stated in the RAS, NIB strives to maintain its issuer credit rating at the highest possible level, supported by strong capital and liquidity positions as well as stable earnings and operational efficiency. In 2021, the RAS was supplemented by a specific section on climate risk, highlighting the importance of this emerging risk category.
The Statutes require that NIB has in place sound and effective strategies for risk, capital, and liquidity assessments, which shall be conducted at least annually and reviewed regularly. The Bank uses its Internal Capital Adequacy Assessment Process (ICAAP) to evaluate the amount of capital and liquidity needed to cover the risks the Bank is or might be exposed to. The ICAAP is conducted on an annual basis. The Bank maintains a sufficient amount of capital and liquidity to cover all material risks and to ensure that operations can be continued without disruptions even in extremely adverse situations. The ICAAP also considers macroprudential elements and allocates capital buffers as appropriate. Stress testing is used to provide a forward-looking view on the Bank’s risk exposures.
The Capital and Liquidity Recovery Plan provides a tool to manage risk, capital and liquidity positions during severely adverse situations. The Bank has established a monitoring system for its statutory metrics (capital ratio, leverage ratios, and liquidity survival horizon), defined
escalation procedures, and designed a set of action plans to be executed in case any statutory metric is deemed to be at risk of breaching its minimum requirement. The Capital and Liquidity Recovery Plan is approved by the Board of Directors.
The main risks — credit risk, market risk, liquidity risk, operational risk and compliance risk — are managed carefully with the overall objective of maintaining financial soundness and avoiding activities that could threaten the Bank’s reputation. Other risks are managed based on conducted materiality assessment. The Bank’s risk management framework is regularly reviewed and adapted to changing conditions.
The Bank’s risk management framework comprises risk policies and procedures formulated for the identification, measurement, monitoring and reporting of risks including a comprehensive limit system for managing the exposure to quantifiable risks. The Bank recognises that effective risk management is based on a sound risk culture, which is characterised, among other things, by a high level of awareness concerning risk and risk management in the organisation. Regular training of staff in risk-related matters is part of the Bank’s risk management practices.
RISK GOVERNANCE
The three-lines-of-defence model provides the basis for the NIB risk governance. The model aims to provide clear segregation of duties between units that enter into business transactions with customers or otherwise expose the Bank to risks, and units in charge of risk assessment, risk measurement, monitoring and control.
The risk governance model, including the roles and responsibilities of the decision-making bodies, is described in more detail in the Bank’s Governance Statement and Risk Management Policy.
CREDIT RISK
Credit risk is the Bank’s main financial risk. Credit risk is defined as the risk of loss resulting from the failure of the Bank’s borrowers and other counterparties to fulfil their contractual obligations and that collateral provided does not cover the Bank’s claims. Following from the NIB mission, most of the credit risk stems from the Bank’s lending operations. The Bank is also exposed to credit risk in its treasury activities, where credit risk derives from the financial assets that the Bank uses for investing its liquidity, such as fixed-income securities and interbank deposits, and from derivative instruments used for managing currency and interest rate risks and other market risks related to structured funding transactions.
| | |
| | |
FINANCIAL REPORT 2021 | | NIB FINANCIAL REPORT 2021 / 39 |
| | |
|
| |
| REPORT OF THE BOARD OF DIRECTORS |
| |
| PRESIDENT AND CEO’S COMMENTS |
| |
| OPERATING AND FINANCIAL REVIEW |
| |
| CAPITAL AND LIQUIDITY MANAGEMENT |
| |
| FINANCIAL STATEMENTS |
| |
| STATEMENT OF COMPREHENSIVE INCOME |
| |
| STATEMENT OF FINANCIAL POSITION |
| |
| CHANGES IN EQUITY |
| |
| CASH FLOW STATEMENT |
| |
| NOTES |
| |
| PROPOSAL BY THE BOARD OF DIRECTORS |
| |
| AUDITOR’S REPORT |
| |
| GOVERNANCE STATEMENT |
| |
| REPORT OF THE CONTROL COMMITTEE CHAIRMANSHIP |
| |
| REPORT OF THE CONTROL COMMITTEE |
| |
| |
| |
| |
| |
| |
| |
| |
| |
| |
| |
| |
| |
| |
| |
| |
| |
| |
Credit risk management
The Bank’s credit risk management builds on the principles of (1) appropriate risk diversification within the scope of the mission; (2) thorough risk assessment at the credit appraisal stage; (3) risk-based pricing and risk mitigation; (4) continuous risk monitoring at the individual counterparty level as well as portfolio level; (5) avoidance of undesirable risks to the extent possible.
Credit risk limits
The maximum credit exposure that the Bank is willing to take is expressed in terms of exposure limits set by the Board of Directors. Credit exposure is the aggregate of lending and treasury exposure. Limits at counterparty level are scaled to the Bank’s equity and the counterparty’s equity. Concentration limits with respect to large exposures and industry sector are defined in relation to the Bank’s equity and/or economic capital.
Counterparty limits are determined based on the probability of default and expected loss. The Bank defines a single counterparty as a counterparty or group of counterparties that are legally and/or financially consolidated or otherwise interdependent from a risk perspective. For exposure limit purposes, the Bank considers the entity where the risk resides, i.e. the risk-owner, as the counterparty. The risk-owner is the entity that is ultimately responsible for the Bank’s claim and may be different from the obligor if the risk is transferred through a guarantee. In order for a guarantee to be eligible for risk transfer, it must cover the full exposure and be a guarantee undertaking securing the borrower’s debt “as for own debt”, meaning that the Bank can make a claim under the guarantee immediately after the borrower has failed to pay on a due date.
To prevent excessive concentrations, the Bank applies portfolio-level limits for large counterparty exposures, as well as for industry sector and country exposures. The Bank has not set limits for the aggregate lending exposure in its member countries. Lending in non-member countries is subject to country limits. For the Bank’s treasury operations, country limits apply for exposure in all countries.
As a general principle, the Bank limits the maximum amount granted as loan or guarantee for a single project to 50% of the total project cost. Financing to SMEs, small mid-cap and mid-cap corporates in the Bank’s member countries can be extended up to 75% of the total project or financing need qualifying for a NIB mandate.
Credit risk assessment
The counterparty’s debt servicing capacity is a key consideration for credit approval. The assessment of a counterparty’s creditworthiness focuses on identifying their main financial and business risks. Based on the assessment, a risk rating indicating the probability of default (PD) is assigned to the counterparty. The credit risk assessment includes the use of quantitative risk methodologies and models as well as qualitative assessments based on expert judgement. The process of proposing PD ratings for counterparties is carried out in the first line of defence in the respective business area (lending and/or treasury).
A separate expected loss (EL) rating is assigned at the transaction level. The EL rating factors in the loss given default (LGD), i.e. the loss severity in the event of a counterparty default. The LGD assignment relies on models that produce a LGD estimate based on the type of counterparty and the characteristics of the transaction (such as guarantees, collateral, the seniority of the claim, and other potential credit enhancing factors in the transaction).
The second line of defence Credit function reviews risk rating proposals, providing a second opinion (control role). Credit risk ratings (PD, LGD, EL) are ultimately approved by the Mandate, Credit and Compliance Committee.
The Bank’s risk rating system comprises 20 classes to differentiate the risk of counterparty default (PD) and the expected loss (EL) on a transaction. In addition, a separate D class applies for non-performing transactions. For reference to ratings from credit rating agencies, internal ratings are mapped to those of S&P and Moody’s such that internal classes 1-10 correspond to their investment-grade categories (respectively AAA to BBB- and Aaa to Baa3).
In addition to counterparty-level and transaction-level diligence and credit risk assessments, the Bank applies the IFRS 9 accounting standard for estimating expected credit loss (ECL), thereby applying forward-looking provisioning for all financial assets under scope of ECL estimation. The ECL methodology, including the Stage 1-3 classification of assets, is described in more detail in Note 10: Expected credit loss.
Credit risk mitigation
According to the NIB Statutes, adequate credit enhancement is required in order to reduce credit risk in the Bank’s lending. Loans granted by the Bank are either unsecured or secured. The Bank seeks to mitigate the credit risk related to unsecured loans by including various covenants, undertakings, prepayment events and events of default in the loan documentation. The requirements vary depending on borrower type, tenor, and the amortisation profile of the loan.
| | |
| | |
FINANCIAL REPORT 2021 | | NIB FINANCIAL REPORT 2021 / 40 |
| | |
|
| |
| REPORT OF THE BOARD OF DIRECTORS |
| |
| PRESIDENT AND CEO’S COMMENTS |
| |
| OPERATING AND FINANCIAL REVIEW |
| |
| CAPITAL AND LIQUIDITY MANAGEMENT |
| |
| FINANCIAL STATEMENTS |
| |
| STATEMENT OF COMPREHENSIVE INCOME |
| |
| STATEMENT OF FINANCIAL POSITION |
| |
| CHANGES IN EQUITY |
| |
| CASH FLOW STATEMENT |
| |
| NOTES |
| |
| PROPOSAL BY THE BOARD OF DIRECTORS |
| |
| AUDITOR’S REPORT |
| |
| GOVERNANCE STATEMENT |
| |
| REPORT OF THE CONTROL COMMITTEE CHAIRMANSHIP |
| |
| REPORT OF THE CONTROL COMMITTEE |
| |
| |
| |
| |
| |
| |
| |
| |
| |
| |
| |
| |
| |
| |
| |
| |
| |
| |
Some of the Bank’s lending is secured by collateral or guaranteed by the parent of the borrower or a third party. The value of the collateral should preferably not be correlated with the creditworthiness of the borrower and there should be a functioning market for such assets.
The distribution of the Bank’s lending portfolio by type of credit enhancement at year-end 2021 is presented below, with further information available in Note 3: Segment information and Note 12: Loans outstanding and guarantee commitments.
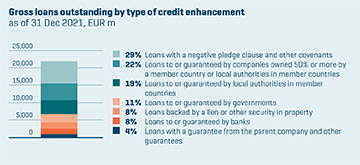
In its treasury operations, the Bank applies netting and collateralisation to mitigate counterparty credit risk related to derivatives and collateralised placements. The Bank undertakes swap transactions only with counterparties that meet the required minimum counterparty credit rating, have executed an International Swaps and Derivatives Association (ISDA) Master Agreement, and have signed a Credit Support Annex (CSA). Collateralised placements in the form of reverse repo transactions are made on the terms of the Global Master Repurchase Agreement (GMRA).
An ISDA Master Agreement allows for a single net settlement of all swap transactions covered by the agreement in the event of a counterparty default or early termination of the transactions. Netting is applied for the measurement of the Bank’s credit exposure only in cases when it is deemed to be legally valid and enforceable in the relevant jurisdiction. At year-end 2021, netting reduced the swap exposure by EUR 626 million from a gross total market value of EUR 1,399 million to EUR 772 million (2020: EUR 1,547 million and EUR 737 million, respectively).
The CSAs further mitigate credit risk related to swaps. Swap positions are marked to market daily and the resulting positive exposures (receivable) exceeding agreed thresholds, if any, are collateralised by cash or, for certain counterparties, with high-quality government securities. Since 2016, NIB enters into two-way CSAs, which means that the Bank posts collateral when the market value of the swap position is negative (liability). At year-end 2021, approximately 99.6% of the Bank’s swaps (measured by nominal value) were under two-way CSAs. Only 0.3% were under one-way CSAs (for which NIB is not required to post collateral for its swap liabilities) and 0.1% with counterparties with whom no CSA has been concluded.
At year-end 2021, the Bank held EUR 748 million (2020: EUR 723 million) in gross collateral received for swaps, of which EUR 748 million (2020: EUR 723 million) was in cash and EUR 0 million (2020: EUR 0 million) in securities (see Note 19: Collateral and commitments). The Bank had posted collateral of EUR 400 million (2020: EUR 523 million).
Credit risk monitoring
The Bank puts strong emphasis on continuous monitoring of the credit risk development in its lending and treasury operations. Credit risk is monitored both at counterparty-level and at portfolio-level. The primary responsibility for credit risk monitoring resides with the department/unit responsible for the client relationship i.e. Lending, Treasury and/or Special Credits. Risk & Compliance carries out the portfolio-level monitoring.
All lending exposures are subject to continuous monitoring of contractual compliance and events/signals that could potentially lead to or indicate a material change in risk. In addition, an annual follow-up is conducted on the entire loan portfolio. The annual follow-up is presented to the Mandate, Credit and Compliance Committee and reported to the Board of Directors.
| | |
| | |
FINANCIAL REPORT 2021 | | NIB FINANCIAL REPORT 2021 / 41 |
| | |
|
| |
| REPORT OF THE BOARD OF DIRECTORS |
| |
| PRESIDENT AND CEO’S COMMENTS |
| |
| OPERATING AND FINANCIAL REVIEW |
| |
| CAPITAL AND LIQUIDITY MANAGEMENT |
| |
| FINANCIAL STATEMENTS |
| |
| STATEMENT OF COMPREHENSIVE INCOME |
| |
| STATEMENT OF FINANCIAL POSITION |
| |
| CHANGES IN EQUITY |
| |
| CASH FLOW STATEMENT |
| |
| NOTES |
| |
| PROPOSAL BY THE BOARD OF DIRECTORS |
| |
| AUDITOR’S REPORT |
| |
| GOVERNANCE STATEMENT |
| |
| REPORT OF THE CONTROL COMMITTEE CHAIRMANSHIP |
| |
| REPORT OF THE CONTROL COMMITTEE |
| |
| |
| |
| |
| |
| |
| |
| |
| |
| |
| |
| |
| |
| |
| |
| |
| |
| |
Treasury exposures are subject to continuous monitoring of events and market signals that could potentially lead to or indicate a material change in risk. The risk ratings of the counterparties are reassessed regularly. The follow-up is presented to the Mandate, Credit and Compliance Committee.
If a counterparty is identified as having seriously deteriorated debt repayment capacity and/or a serious deterioration in its financial standing, it is placed on the watch-list and becomes subject to specific watchlist monitoring. Watchlisted counterparties are reviewed by the Mandate, Credit and Compliance Committee at agreed intervals and reported to the Board of Directors. If a credit exposure requires the expertise of specialists in workout and restructuring, it will be transferred to the Special Credits function. The function’s primary objective is to take over responsibility for distressed loans from Lending and devote sufficient time and effort to the individual case to help the Bank recover all or as much as possible of distressed loans outstanding.
Credit risk monitoring at portfolio-level includes, inter alia, an analysis of the aggregate credit risk exposure, credit risk concentrations and changes in the risk profile. The development is reported to the Executive Committee, the Asset & Liability Committee, and the Board of Directors.
Compliance with limits is monitored regularly. For treasury counterparties, limit compliance is monitored on a daily basis. Exposure in excess of maximum limits may occur e.g. due to downgrade of a counterparty rating. Limit breaches are reported to senior management, relevant committees and the Board of Directors.
Risk-based pricing
The Statutes stipulate that the Bank shall operate according to sound banking principles and aim for a profit allowing the formation of reserves and a reasonable return on capital. Loans and guarantees are priced to cover the Bank’s cost of funds, administration costs, the cost of the risk involved in the transaction and the cost of capital employed. For loan pricing purposes, the Bank uses a pricing tool that enables calculation of the minimum earnings required in order to cover all lending-related costs and an appropriate return for the level of risk assumed. Internal credit risk ratings and associated risk parameters, as well as the structure of the transaction, are key input factors in the pricing tool.
Credit risk exposure
Tables 1-3 below provide an overview of the Bank’s aggregate credit risk exposure at year-end 2021, distributed by expected loss (EL) ratings. Aggregate credit exposure comprises lending and treasury exposure. Lending exposure includes loans outstanding and loan commitments, without taking into account any collateral or credit enhancements. For treasury exposure, capital market investments are included at nominal value and derivatives are included at market value net of collateral. The exposure in reverse repo transactions is calculated as a fixed percentage of the nominal value of the transaction, thus reflecting the collateralised nature of these placements.
| | |
| | |
FINANCIAL REPORT 2021 | | NIB FINANCIAL REPORT 2021 / 42 |
| | |
|
| |
| REPORT OF THE BOARD OF DIRECTORS |
| |
| PRESIDENT AND CEO’S COMMENTS |
| |
| OPERATING AND FINANCIAL REVIEW |
| |
| CAPITAL AND LIQUIDITY MANAGEMENT |
| |
| FINANCIAL STATEMENTS |
| |
| STATEMENT OF COMPREHENSIVE INCOME |
| |
| STATEMENT OF FINANCIAL POSITION |
| |
| CHANGES IN EQUITY |
| |
| CASH FLOW STATEMENT |
| |
| NOTES |
| |
| PROPOSAL BY THE BOARD OF DIRECTORS |
| |
| AUDITOR’S REPORT |
| |
| GOVERNANCE STATEMENT |
| |
| REPORT OF THE CONTROL COMMITTEE CHAIRMANSHIP |
| |
| REPORT OF THE CONTROL COMMITTEE |
| |
| |
| |
| |
| |
| |
| |
| |
| |
| |
|
TABLE 1. Credit risk exposure by internal rating based on expected loss (EL) (in EUR million)
| | | | | | | | | | | | | | | | | | | | | | | | | | |
RISK CLASS | | S&P EQUIVALENT | | 31 DECEMBER 2021 | | | 31 DECEMBER 2020 | |
| | LENDING | | | TREASURY | | | TOTAL | | | LENDING | | | TREASURY | | | TOTAL | |
1–2 | | AAA/AA+ | | | 7,090 | | | | 8,272 | | | | 15,362 | | | | 6,320 | | | | 6,749 | | | | 13,069 | |
3–4 | | AA/AA- | | | 1,570 | | | | 1,838 | | | | 3,408 | | | | 2,319 | | | | 1,384 | | | | 3,703 | |
5–6 | | A+/A | | | 2,840 | | | | 746 | | | | 3,587 | | | | 2,229 | | | | 1,055 | | | | 3,285 | |
7–8 | | A-/BBB+ | | | 5,839 | | | | 258 | | | | 6,097 | | | | 6,529 | | | | 233 | | | | 6,763 | |
9–10 | | BBB/BBB- | | | 5,369 | | | | 95 | | | | 5,463 | | | | 4,864 | | | | 71 | | | | 4,935 | |
11–12 | | BB+/BB | | | 763 | | | | 0 | | | | 763 | | | | 1,331 | | | | 0 | | | | 1,331 | |
13–14 | | BB/BB- | | | 498 | | | | 0 | | | | 498 | | | | 671 | | | | 0 | | | | 671 | |
15–16 | | BB-/B+ | | | 135 | | | | 0 | | | | 135 | | | | 57 | | | | 0 | | | | 57 | |
17–18 | | B/B- | | | 31 | | | | 0 | | | | 31 | | | | 41 | | | | 0 | | | | 41 | |
19–20 | | B-/CCC | | | 7 | | | | 0 | | | | 7 | | | | 0 | | | | 0 | | | | 0 | |
D | | | | | 0 | | | | 0 | | | | 0 | | | | 0 | | | | 0 | | | | 0 | |
TOTAL | | | | | 24,142 | | | | 11,209 | | | | 35,351 | | | | 24,362 | | | | 9,493 | | | | 33,855 | |
| | | | | | | | | | | | | | | | | | | | | | | | | | | |
Class D | | | | | | | | | | | | | | | | | | | | | | | | | | |
Gross | | | | | 76 | | | | 0 | | | | 76 | | | | 71 | | | | 0 | | | | 71 | |
Impairment | | | | | 76 | | | | 0 | | | | 76 | | | | 71 | | | | 0 | | | | 71 | |
Net | | | | | 0 | | | | 0 | | | | 0 | | | | 0 | | | | 0 | | | | 0 | |
The quality of the Bank’s aggregate credit exposure remained sound in 2021. Lending exposure decreased moderately (-1%) compared to 2020. Close to 97% of disbursements were to investment-grade (EL 1-10) counterparties, which was largely driven by lending to the public sector, utilities and financials. Treasury exposure rose by roughly 18%, mainly as an increase in bond investments. At year-end 2021, 94% (2020: 91%) of lending exposure and 100% (2020: 100%) of the treasury exposure was in risk classes EL 1-10, corresponding to investment-grade quality. Exposure in risk class D (non-performing) remained essentially unchanged and fully provisioned.
TABLE 2. Geographical distribution of the credit risk exposure (in EUR million)
| | | | | | | | | | | | | | | | | | | | | | | | |
| | | 31 DECEMBER 2021 | | | 31 DECEMBER 2020 | |
| COUNTRY/REGION | | LENDING | | | TREASURY | | | TOTAL | | | LENDING | | | TREASURY | | | TOTAL | |
Denmark | | | 2,302 | | | | 2,564 | | | | 4,866 | | | | 1,985 | | | | 1,994 | | | | 3,979 | |
Estonia | | | 993 | | | | 0 | | | | 993 | | | | 1,028 | | | | 0 | | | | 1,028 | |
Finland | | | 4,789 | | | | 1,362 | | | | 6,151 | | | | 4,817 | | | | 1,440 | | | | 6,257 | |
Iceland | | | 600 | | | | 59 | | | | 659 | | | | 571 | | | | 35 | | | | 606 | |
Latvia | | | 850 | | | | 115 | | | | 965 | | | | 764 | | | | 105 | | | | 869 | |
Lithuania | | | 1,321 | | | | 50 | | | | 1,371 | | | | 1,410 | | | | 50 | | | | 1,460 | |
Norway | | | 5,527 | | | | 1,095 | | | | 6,621 | | | | 5,340 | | | | 913 | | | | 6,253 | |
Sweden | | | 6,902 | | | | 1,146 | | | | 8,048 | | | | 7,172 | | | | 908 | | | | 8,080 | |
Africa and Middle East | | | 23 | | | | 0 | | | | 23 | | | | 33 | | | | 0 | | | | 33 | |
Americas | | | 13 | | | | 771 | | | | 784 | | | | 78 | | | | 839 | | | | 917 | |
Asia-Pacific | | | 224 | | | | 127 | | | | 352 | | | | 287 | | | | 128 | | | | 415 | |
Europe | | | 388 | | | | 2,912 | | | | 3,300 | | | | 451 | | | | 2,446 | | | | 2,896 | |
Multilaterals | | | 211 | | | | 1,007 | | | | 1,219 | | | | 428 | | | | 635 | | | | 1,063 | |
Total | | | 24,142 | | | | 11,209 | | | | 35,351 | | | | 24,362 | | | | 9,493 | | | | 33,855 | |
In the context of the Bank’s mission, the credit risk exposure continued to be fairly well balanced in terms of geographical distribution. At year-end 2021, the member countries accounted for 96% of the Bank’s lending exposure (2020: 95%). The largest lending exposures outside the member countries were in multilateral institutions, Poland and China. Of the treasury exposure, 57% (2020: 57%) was in the member countries, while (the rest of) Europe - excluding exposures to multilateral institutions - accounted for 26% (2020: 26%), dominated by Germany and France. Most of the treasury exposure outside Europe was in Canada.
| | |
| | |
FINANCIAL REPORT 2021 | | NIB FINANCIAL REPORT 2021 / 43 |
| | |
|
| |
| REPORT OF THE BOARD OF DIRECTORS |
| |
| PRESIDENT AND CEO’S COMMENTS |
| |
| OPERATING AND FINANCIAL REVIEW |
| |
| CAPITAL AND LIQUIDITY MANAGEMENT |
| |
| FINANCIAL STATEMENTS |
| |
| STATEMENT OF COMPREHENSIVE INCOME |
| |
| STATEMENT OF FINANCIAL POSITION |
| |
| CHANGES IN EQUITY |
| |
| CASH FLOW STATEMENT |
| |
| NOTES |
| |
| PROPOSAL BY THE BOARD OF DIRECTORS |
| |
| AUDITOR’S REPORT |
| |
| GOVERNANCE STATEMENT |
| |
| REPORT OF THE CONTROL COMMITTEE CHAIRMANSHIP |
| |
| REPORT OF THE CONTROL COMMITTEE |
| |
| |
| |
| |
| |
| |
| |
| |
| |
| |
| |
| |
| |
| |
|
TABLE 3. Credit risk exposure by industry sector (in EUR million)
| | | | | | | | | | | | | | | | | | | | | | | | |
| | | 31 DECEMBER 2021 | | | 31 DECEMBER 2020 | |
| INDUSTRY SECTOR | | LENDING | | | TREASURY | | | TOTAL | | | LENDING | | | TREASURY | | | TOTAL | |
Energy | | | 0 | | | | 0 | | | | 0 | | | | 0 | | | | 0 | | | | 0 | |
Materials | | | 1,225 | | | | 0 | | | | 1,225 | | | | 1,349 | | | | 0 | | | | 1,349 | |
Industrials | | | 3,652 | | | | 50 | | | | 3,702 | | | | 3,693 | | | | 20 | | | | 3,713 | |
Consumer discretionary | | | 459 | | | | 6 | | | | 466 | | | | 547 | | | | 0 | | | | 547 | |
Consumer staples | | | 1,309 | | | | 58 | | | | 1,367 | | | | 1,196 | | | | 16 | | | | 1,213 | |
Health care | | | 683 | | | | 33 | | | | 716 | | | | 761 | | | | 25 | | | | 786 | |
Financials | | | 3,772 | | | | 5,189 | | | | 8,961 | | | | 3,731 | | | | 5,103 | | | | 8,833 | |
Information technology | | | 589 | | | | 16 | | | | 605 | | | | 552 | | | | 14 | | | | 566 | |
Telecommunication services | | | 364 | | | | 24 | | | | 388 | | | | 337 | | | | 24 | | | | 361 | |
Utilities | | | 4,483 | | | | 58 | | | | 4,541 | | | | 3,996 | | | | 48 | | | | 4,044 | |
Public sector | | | 7,605 | | | | 5,775 | | | | 13,380 | | | | 8,200 | | | | 4,242 | | | | 12,442 | |
TOTAL | | | 24,142 | | | | 11,209 | | | | 35,351 | | | | 24,362 | | | | 9,493 | | | | 33,855 | |
The distribution of the lending exposure by industry sector remained stable in 2021 compared to the previous year, with the four largest sectors (public sector, utilities, financials, and industrials) together accounting for 81% (2020: 81%) of the total exposure. The Bank has defined limits for maximum credit risk exposure and economic capital consumption (requirement) to single industries, scaled in relation to the Bank’s equity. At year-end 2021, the Bank was in compliance with these limits.
TABLE 4. Largest counterparty exposures (% of total credit risk exposure)
| | | | | | | | |
| | | 31 DECEMBER 2021 | | | 31 DECEMBER 2020 | |
Top 5 | | | 12 | % | | | 11 | % |
Top 10 | | | 20 | % | | | 19 | % |
Top 20 | | | 32 | % | | | 30 | % |
Limits for large single counterparty exposures and for the aggregate of such large exposures are scaled to the Bank’s equity. At year-end 2021, the Bank was within the aggregate limits set for large exposures.
Any deviations from the set limits must be approved by the Board of Directors.
| | |
| | |
FINANCIAL REPORT 2021 | | NIB FINANCIAL REPORT 2021 / 44 |
| | |
|
| |
| REPORT OF THE BOARD OF DIRECTORS |
| |
| PRESIDENT AND CEO’S COMMENTS |
| |
| OPERATING AND FINANCIAL REVIEW |
| |
| CAPITAL AND LIQUIDITY MANAGEMENT |
| |
| FINANCIAL STATEMENTS |
| |
| STATEMENT OF COMPREHENSIVE INCOME |
| |
| STATEMENT OF FINANCIAL POSITION |
| |
| CHANGES IN EQUITY |
| |
| CASH FLOW STATEMENT |
| |
| NOTES |
| |
| PROPOSAL BY THE BOARD OF DIRECTORS |
| |
| AUDITOR’S REPORT |
| |
| GOVERNANCE STATEMENT |
| |
| REPORT OF THE CONTROL COMMITTEE CHAIRMANSHIP |
| |
| REPORT OF THE CONTROL COMMITTEE |
| |
| |
| |
| |
| |
| |
| |
| |
| |
| |
| |
| |
| |
| |
| |
| |
|
MARKET RISK
The Bank defines market risk as the risk of valuation loss or reduction in the expected earnings stemming from adverse fluctuations in exchange rates, interest rates, credit spreads and cross-currency basis spreads.
Market risks predominantly arise from the Bank’s core business activities and the liquidity portfolio needed to support these activities. The Bank’s strategy is to obtain cost-efficient funding from diversified sources and provide lending that is tailored to the needs of its customers. This gives rise to foreign exchange risk and interest rate risk due to mismatches between the Bank’s assets and liabilities in terms of currency composition, maturity profile, and interest rate characteristics. Cross-currency basis risk stems from the hedging techniques used by the Bank to mitigate foreign exchange risk deriving from funding and lending in different currencies. This risk reflects the liquidity charge for exchanging foreign currencies at a future point in time.
The Bank’s securities portfolio is exposed to interest rate risk and credit spread risk. Credit spread risk refers to the potential decline in market value due to perceived change in the credit quality of the issuers of the securities held in the portfolios.
Market risk management
The Bank manages market risks by hedging against foreign exchange risk and interest rate risk, with the objective of protecting its earnings and the economic value of its assets and liabilities. Foreign exchange risk is practically fully hedged. Interest rate risk deriving from mismatches between funding and lending is kept at a modest level. The Bank’s tolerance for interest rate risk and credit spread risk pertains to the size, quality and earnings expectations set for the liquidity portfolio. As part of its structured funding transactions, the Bank may use financial instruments linked to other market risk factors than the above. Prerequisites for such transactions are that they be completely hedged with derivatives and that the Bank is able to value these transactions and measure the risks involved in the derivatives. The Bank’s market risks are managed by Treasury. Risk & Compliance provides independent oversight of all significant market risks, supporting the Treasury Committee, Asset & Liability Committee, and Treasury with risk measurement, analysis, daily monitoring, and reporting.
TABLE 5. Foreign exchange rate risk (in EUR million)
| | | | | | | | | | | | |
| Net open positions | | TOTAL LIMIT | | | 31 DECEMBER 2021 | | | 31 DECEMBER 2020 | |
USD | | | 6.00 | | | | 1.22 | | | | 0.49 | |
DKK | | | 3.00 | | | | 0.44 | | | | -0.08 | |
NOK | | | 3.00 | | | | 0.27 | | | | 0.38 | |
SEK | | | 3.00 | | | | 0.20 | | | | 0.50 | |
ISK | | | 1.00 | | | | 0.00 | | | | 0.00 | |
Other currencies, Total | | | 4.00 | | | | 1.40 | | | | 1.43 | |
The Statutes require that the Bank shall, to the extent practicable, protect itself against the risk of exchange rate losses.
Exchange rate risk is measured on the basis of net open positions in each currency. The limits set to restrict the overnight positions and the actual exposures as at year-end 2021 are presented in the above table. Note 23 (Currency risk) shows the net currency positions at fair value in the major currencies as of year-end 2021.
The Bank hedges foreign exchange risk with cross-currency basis swaps, which gives rise to currency basis risk. Changes in the currency basis have an impact on the mark-to-market valuation of the Bank’s swap portfolio. The overall valuation sensitivity to a one basis point shift across all currency basis curves was EUR 0.8 million at year-end 2021 (2020: EUR 0.5 million). The net sensitivity was driven by the net exposure to funding currencies (mostly EUR/USD, EUR/GBP basis and EUR/AUD) and the non-euro lending currencies (mainly EUR/NOK, EUR/SEK and EUR/DKK).
The Bank does not hedge future net interest income in foreign currency. Loans are provided primarily in EUR, Nordic currencies, and USD. Interest income in currencies other than EUR may cause some fluctuation in the Bank’s future net income in EUR terms. At present, however, the Bank expects that any such potential fluctuations in future cash flows from its portfolio would be minor in relation to its total assets and equity.
| | |
| | |
FINANCIAL REPORT 2021 | | NIB FINANCIAL REPORT 2021 / 45 |
| | |
|
| |
| REPORT OF THE BOARD OF DIRECTORS |
| |
| PRESIDENT AND CEO’S COMMENTS |
| |
| OPERATING AND FINANCIAL REVIEW |
| |
| CAPITAL AND LIQUIDITY MANAGEMENT |
| |
| FINANCIAL STATEMENTS |
| |
| STATEMENT OF COMPREHENSIVE INCOME |
| |
| STATEMENT OF FINANCIAL POSITION |
| |
| CHANGES IN EQUITY |
| |
| CASH FLOW STATEMENT |
| |
| NOTES |
| |
| PROPOSAL BY THE BOARD OF DIRECTORS |
| |
| AUDITOR’S REPORT |
| |
| GOVERNANCE STATEMENT |
| |
| REPORT OF THE CONTROL COMMITTEE CHAIRMANSHIP |
| |
| REPORT OF THE CONTROL COMMITTEE |
| |
| |
| |
| |
| |
| |
| |
| |
| |
| |
| |
| |
| |
| |
| |
| |
|
TABLE 6. Interest rate risk (in EUR million)
| | | | | | | | | | | | |
| | | TOTAL GROSS
LIMIT | | | 31 DECEMBER 2021 | | | 31 DECEMBER 2020 | |
| Sensitivity to 1bp change in interest rates | | | 1.80 | | | | 0.86 | | | | 0.95 | |
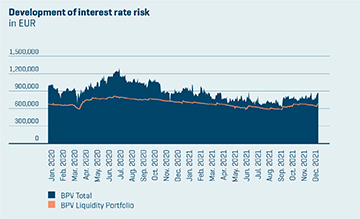
The Bank manages interest rate risk by using derivatives to convert fixed-rate funding into floating-rate liabilities. Fixed-rate lending that is not match-funded is converted to floating-rate receivables. This hedging approach ensures that the interest rate risk between lending and funding in each currency remains low. The majority of the Bank’s interest rate risk, therefore, stems from the portfolio of liquid assets.
The Bank measures and manages interest rate risk by estimating the sensitivity of the economic value of its balance sheet to an interest rate shock. The sensitivity is measured by means of basis point value (BPV), quantifying the impact of an interest rate change of one basis point on the present value of interest-bearing assets and liabilities.
Maximum limits have been set for the acceptable exposure to interest rate risk, both at aggregate-level (balance sheet) and at portfolio-level. A gross limit equivalent to EUR 1.8 million covering all currencies restricts the BPV interest rate risk to approximately 0.05% of the Bank’s equity. In addition, individual BPV limits have been set for interest rate risk in EUR, USD and the Nordic currencies, whereas a combined limit applies for all other currencies.
| | |
| | |
FINANCIAL REPORT 2021 | | NIB FINANCIAL REPORT 2021 / 46 |
| | |
|
| |
| REPORT OF THE BOARD OF DIRECTORS |
| |
| PRESIDENT AND CEO’S COMMENTS |
| |
| OPERATING AND FINANCIAL REVIEW |
| |
| CAPITAL AND LIQUIDITY MANAGEMENT |
| |
| FINANCIAL STATEMENTS |
| |
| STATEMENT OF COMPREHENSIVE INCOME |
| |
| STATEMENT OF FINANCIAL POSITION |
| |
| CHANGES IN EQUITY |
| |
| CASH FLOW STATEMENT |
| |
| NOTES |
| |
| PROPOSAL BY THE BOARD OF DIRECTORS |
| |
| AUDITOR’S REPORT |
| |
| GOVERNANCE STATEMENT |
| |
| REPORT OF THE CONTROL COMMITTEE CHAIRMANSHIP |
| |
| REPORT OF THE CONTROL COMMITTEE |
| |
| |
| |
| |
| |
| |
| |
| |
| |
| |
| |
| |
| |
| |
| |
| |
| |
| |
| | | | | | | | | | | | |
TABLE 7. Credit spread risk (in EUR million) | |
| | | | |
| | | TOTAL LIMIT | | | 31 DECEMBER
2021 | | | 31 DECEMBER
2020 | |
| | | |
Sensitivity to 1bp
change in credit
spreads | | | 3.00 | | | | 2.20 | | | | 2.15 | |

The Bank manages its exposure to credit spread risk by measuring the sensitivity of its portfolios of marketable securities to credit spread movements. The sensitivity is measured by means of a credit spread BPV, quantifying the impact of a one basis point increase in credit spreads on the present value of the assets.
Limits have been defined to restrict the decrease in asset value to an acceptable level in accordance with the Bank’s willingness to accept risk in its liquidity portfolio and in the portfolio of labelled bond investments. The Bank has set an overall limit of EUR 3.0 million for credit spread risk, with specific sub-limits defined for various asset classes. To ensure that the liquidity portfolio maintains its market value and liquidity under severe market conditions, the assets in the portfolio must satisfy minimum rating requirements and other high-quality criteria.
| | |
| | |
FINANCIAL REPORT 2021 | | NIB FINANCIAL REPORT 2021 / 47 |
| | |
|
| |
| REPORT OF THE BOARD OF DIRECTORS |
| |
| PRESIDENT AND CEO’S COMMENTS |
| |
| OPERATING AND FINANCIAL REVIEW |
| |
| CAPITAL AND LIQUIDITY MANAGEMENT |
| |
| FINANCIAL STATEMENTS |
| |
| STATEMENT OF COMPREHENSIVE INCOME |
| |
| STATEMENT OF FINANCIAL POSITION |
| |
| CHANGES IN EQUITY |
| |
| CASH FLOW STATEMENT |
| |
| NOTES |
| |
| PROPOSAL BY THE BOARD OF DIRECTORS |
| |
| AUDITOR’S REPORT |
| |
| GOVERNANCE STATEMENT |
| |
| REPORT OF THE CONTROL COMMITTEE CHAIRMANSHIP |
| |
| REPORT OF THE CONTROL COMMITTEE |
| |
| |
| |
| |
| |
| |
| |
| |
| |
| |
| |
| |
| |
| |
| |
| |
| |
| |
LIQUIDITY RISK
Liquidity risk is defined as the risk of incurring losses due to an inability to meet payment obligations in a timely manner when they become due. The Bank categorises liquidity risk into funding liquidity risk, which occurs when payment obligations cannot be fulfilled because of an inability to obtain new funding, and market liquidity risk, which occurs when the Bank is unable to sell or transform assets in the liquidity buffer into cash without significant losses.
Liquidity risk management
The Bank’s business model gives rise to liquidity risk mainly through maturity mismatches between assets (loans and treasury investments) and liabilities (borrowing and equity). The liquidity position and adherence to exposure limits is managed by Treasury and monitored by Risk & Compliance on a daily basis.
The Asset & Liability Committee oversees the development of the Bank’s funding and liquidity position and decides on liquidity risk-related matters in accordance with its mandate. The Board of Directors receives regular reports on the funding and liquidity positions of the Bank.
The key metric applied for managing liquidity risk is the survival horizon, which measures how long the Bank would be able to fulfil its payment obligations in a severe stress scenario. The target value for this metric is twelve months, the Board of Directors minimum accepted value is nine months, while the Bank’s Statutes require a minimum of six months. The stress scenario includes, among other things, the assumption of payment disruptions in the loan portfolio, no access to market funding, early termination of all callable funding transactions, collateral provided for swap exposure and severe decline of asset value in the liquidity buffer. At year-end 2021, the survival horizon was 450 days (2020: 418 days).
In addition, the Bank requires that the liquidity position should be strong enough to maintain the highest possible issuer credit rating by S&P (AAA) and Moody’s (Aaa) and fulfil the liquidity coverage ratio (LCR) and net stable funding ratio (NSFR) requirements as set in the Liquidity Policy and defined in the European banking sector standards. At year-end 2021 the LCR was 5,162% (2020: 4,407%) and the NFSR 160% (2020: 165%).
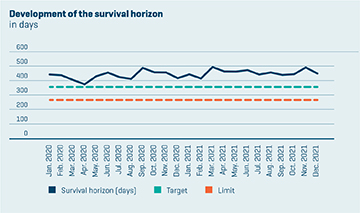
As displayed in Table 8, the Bank’s liquidity buffer comprises unencumbered cash, deposits and securities denominated in EUR, USD and the Nordic currencies. In order to ensure that the market value and liquidity of the buffer are preserved during adverse market conditions, the Bank has set strict rules for its composition. The buffer must include a minimum level of High Quality Liquid Assets (HQLA) as defined in the European banking sector standards, and a minimum share of assets in the internal rating categories EL 1-4 (corresponding to at least AA-/Aa3 from S&P/Moody’s). Furthermore, the buffer must comprise a certain share of assets eligible as repo collateral in central banks. The Bank does not have direct access to central bank repo facilities, but can repo its bond securities via intermediary banks.
The maturity profile of the liquidity buffer is structured to fulfil the Bank’s requirement that the expected net cash outflow during the next three months must be covered by maturing investments in the liquidity buffer.
| | |
| | |
FINANCIAL REPORT 2021 | | NIB FINANCIAL REPORT 2021 / 48 |
| | |
|
| |
| REPORT OF THE BOARD OF DIRECTORS |
| |
| PRESIDENT AND CEO’S COMMENTS |
| |
| OPERATING AND FINANCIAL REVIEW |
| |
| CAPITAL AND LIQUIDITY MANAGEMENT |
| |
| FINANCIAL STATEMENTS |
| |
| STATEMENT OF COMPREHENSIVE INCOME |
| |
| STATEMENT OF FINANCIAL POSITION |
| |
| CHANGES IN EQUITY |
| |
| CASH FLOW STATEMENT |
| |
| NOTES |
| |
| PROPOSAL BY THE BOARD OF DIRECTORS |
| |
| AUDITOR’S REPORT |
| |
| GOVERNANCE STATEMENT |
| |
| REPORT OF THE CONTROL COMMITTEE CHAIRMANSHIP |
| |
| REPORT OF THE CONTROL COMMITTEE |
| |
| |
| |
| |
| |
| |
| |
| |
| |
| |
| |
| |
| |
| |
| |
| |
| |
| |
| | | | | | | | |
TABLE 8. Composition of the liquidity buffer |
| | | | | | | | | | | | | | | | |
| | | 31 DECEMBER 2021 | | | 31 DECEMBER 2020 | |
| | | EUR MILLION | | | % | | | EUR MILLION | | | % | |
| Cash and cash equivalents | | | 722 | | | | 5% | | | | 835 | | | | 7% | |
| Securities issued or guaranteed by sovereigns, public sector entities and supranational institutions | | | 5,336 | | | | 40% | | | | 3,850 | | | | 34% | |
| Covered bonds | | | 3,569 | | | | 27% | | | | 3,132 | | | | 28% | |
| Securities issued by financial institutions, excluding covered bonds | | | 1,252 | | | | 9% | | | | 1,238 | | | | 11% | |
| Securities issued by corporates | | | 248 | | | | 2% | | | | 178 | | | | 2% | |
| Securities received as collateral | | | 2,172 | | | | 16% | | | | 2,084 | | | | 18% | |
| Total liquidity buffer | | | 13,299 | | | | | | | | 11,317 | | | | 100% | |
Diversification is a key objective of the Bank’s funding and liquidity management. The Bank strives to diversify its borrowing in terms of currencies, maturities, instruments, and investor types in order to avoid excessive reliance on individual markets or funding sources. Through regular benchmark issues, the Bank aims to secure broad market access. The annual funding plan is based on the projected twelve-month liquidity requirement and the projected size of the liquidity buffer. The funding plan is regularly adjusted to reflect changes in the liquidity requirement.
The following graph shows the maturity profile of liquid assets and the annual scheduled payments on loans outstanding compared to payments on the Bank’s funding. Payments on loans outstanding are shown until the contractual maturity of the loans. Repayment of funding is shown until the first possible early repayment date, taking into account the cash flow from associated swaps. Short-term amounts owed to credit institutions predominantly comprise cash collateral received from swap counterparties, while collateral given represents the cash collateral posted to swap counterparties. A breakdown of the Bank’s financial assets and liabilities by maturity at year-end 2021 is presented in Note 21: Maturity profile of financial assets and liabilities.
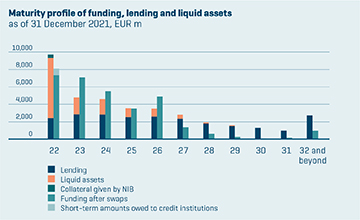
REFERENCE RATE REFORM
Following the financial crisis, various regulatory authorities initiated processes to find robust and transaction-based alternatives to Interbank Offered Rates (IBOR). A key milestone of this work came in March 2021, when the UK Financial Conduct Authority announced the cessation dates for the publication of Libor and the replacement of Libor by new risk-free rates (RFR).
The publication of main tenors of USD Libor will continue until June 2023, while all other Libor rates ceased at the end of 2021. New transactions should not reference USD Libor after 2021 and the rates until June 2023 are available mainly for the purpose of legacy transactions. Regulators have not announced any plans to discontinue Euribor or Nordic IBOR rates, but in the longer term these markets may transition to risk-free rates as well.
| | |
| | |
FINANCIAL REPORT 2021 | | NIB FINANCIAL REPORT 2021 / 49 |
| | |
|
| |
| REPORT OF THE BOARD OF DIRECTORS |
| |
| PRESIDENT AND CEO’S COMMENTS |
| |
| OPERATING AND FINANCIAL REVIEW |
| |
| CAPITAL AND LIQUIDITY MANAGEMENT |
| |
| FINANCIAL STATEMENTS |
| |
| STATEMENT OF COMPREHENSIVE INCOME |
| |
| STATEMENT OF FINANCIAL POSITION |
| |
| CHANGES IN EQUITY |
| |
| CASH FLOW STATEMENT |
| |
| NOTES |
| |
| PROPOSAL BY THE BOARD OF DIRECTORS |
| |
| AUDITOR’S REPORT |
| |
| GOVERNANCE STATEMENT |
| |
| REPORT OF THE CONTROL COMMITTEE CHAIRMANSHIP |
| |
| REPORT OF THE CONTROL COMMITTEE |
| |
| |
| |
| |
| |
| |
| |
| |
| |
| |
| |
| |
| |
| |
| |
| |
| |
| |
New RFR-based transactions typically apply compounded daily interest rates, which has required development in different IT systems. The Bank conducted its first bond and swap transactions referencing RFR in 2021 and is also ready to offer RFR loans to clients. The transitioning of a few legacy Libor transactions in GBP and CHF is currently being negotiated with counterparties, while discussions with counterparties of USD Libor transactions will be initiated during 2022.
The publication of the Euro Overnight Index Average (EONIA) also ended at year-end 2021 and the rate was replaced by Euro short-term rate (€STR). Most of NIB’s credit support documents originally referenced EONIA and those agreements were amended during 2021 to apply the €STR rate. Following the market practice for valuations, NIB has switched the discounting base curves in EUR from EONIA to €STR and in USD from the Fed Funds Rate to the Secured Overnight Financing Rate (SOFR). The impact of the discount switches on the statement of comprehensive income was insignificant.
OPERATIONAL RISK
The Bank defines operational risk as the risk of direct or indirect losses or damaged reputation due to risk events attributable to technology, people, processes, procedures or physical arrangements and/or external events.
Operational risk management
NIB’s operational risk management focuses on proactive measures in order to ensure operational resilience and business continuity, information security, the accuracy of information used internally and reported externally, the expertise and integrity of the Bank’s personnel and its adherence to established rules and procedures, as well as on security arrangements to protect the physical and information assets of the Bank, its personnel and processes.
The Bank’s Operational Risk Policy is set by the Board of Directors. The Policy is complemented by an Operational Risk Guideline comprising the guiding principles for the identification, assessment, monitoring and control of operational risks the Bank faces or may face. In day-to-day operations, the three-lines-of-defence model ensures accountability and defines the roles and responsibilities for operational risk management for all processes across the organisation. Process owners must manage the operational risks associated with their process. Emphasis is put on increasing risk awareness of the Bank’s personnel.
Risks are identified and their impact assessed by the various functions for their respective fields of expertise in risk assessments, such as the risk and control self-assessment process. Focus is placed on identifying key risks and assessing the quality of risk detection and mitigation to ensure compliance with the Bank’s policies and guidelines. Operational risks are also identified through analysis of results obtained from the Bank’s event reporting system. No material financial losses were incurred as a result of operational risks during the year.
Priority areas for operational risk management include increased focus on risks in the Bank’s core processes and further development of reporting on material operational risks and trends.
In 2021 the business continuity framework was comprehensively restructured to better meet business dependencies and needs, and to ensure that the Bank remains operational and resilient. As part of this work the Business Continuity Guideline was refined.
Moreover, the Operational Risk Policy and Guideline documents were updated and the Information Security Risk Assessment Guidelines were introduced.
Due to the continued COVID-19 situation in 2021, the emphasis was on securing the Bank’s operations, availability of core systems and safety of the staff.
COMPLIANCE RISK
The Bank defines integrity risk as the risk of legal or regulatory sanctions, material financial loss, or loss to reputation that NIB may suffer as a result of its failure to comply with those laws, regulations, rules, self-regulatory organisation standards and codes of conduct concerning market conduct and transparency standards, managing conflicts of interest and the prevention of money laundering, terrorist financing, market abuse, corruption and fraud.
The Bank is committed to following international best practices and market standards in the areas of accountability, governance, corporate social responsibility, transparency and business ethics. Consequently, the Bank’s policies draw upon relevant market standards; in particular the International Financial Institutions’ Uniform Framework for Preventing and Combating Fraud and Corruption, which the Bank has endorsed.
The integrity of its own activities and of its staff is governed through the Bank’s Code of Conduct, which sets the values and ethical standards expected from staff. The Code covers topics such as conflicts of interests, gifts, hospitality, trading limitations and perquisite positions.
| | |
| | |
FINANCIAL REPORT 2021 | | NIB FINANCIAL REPORT 2021 / 50 |
| | |
|
| |
| REPORT OF THE BOARD OF DIRECTORS |
| |
| PRESIDENT AND CEO’S COMMENTS |
| |
| OPERATING AND FINANCIAL REVIEW |
| |
| CAPITAL AND LIQUIDITY MANAGEMENT |
| |
| FINANCIAL STATEMENTS |
| |
| STATEMENT OF COMPREHENSIVE INCOME |
| |
| STATEMENT OF FINANCIAL POSITION |
| |
| CHANGES IN EQUITY |
| |
| CASH FLOW STATEMENT |
| |
| NOTES |
| |
| PROPOSAL BY THE BOARD OF DIRECTORS |
| |
| AUDITOR’S REPORT |
| |
| GOVERNANCE STATEMENT |
| |
| REPORT OF THE CONTROL COMMITTEE CHAIRMANSHIP |
| |
| REPORT OF THE CONTROL COMMITTEE |
| |
| |
| |
| |
| |
| |
| |
| |
| |
| |
| |
| |
| |
| |
| |
| |
| |
| |
Further, NIB places particular emphasis on mitigating the risk of engaging with parties and projects that are, or potentially could be, associated with corruption, fraud, money laundering or the financing of terrorism. This is achieved through investing significant efforts in the Integrity Due Diligence (IDD) applicable to customers and counterparties. The IDD aims at identifying any integrity or reputational risk indicators of entities that have a reputation of engaging in illegal or unethical behaviour.
Allegations of fraud, corruption, collusion or any other Prohibited Practices related to the Bank’s projects and allegations of Misconduct by staff are investigated following a preliminary assessment of the allegation. The investigations are conducted by the Integrity and Compliance Office (ICO), which issues a findings report that is presented for decision to the President (for cases related to staff) or to the Sanctions Panel (for cases related to other parties).
The ICO oversees and coordinates matters relating to integrity and reputational risks and provides independent expert advice to staff, management and the Board of Directors in integrity matters.
The Chief Compliance Officer (CCO) reports to the Chief Risk Officer with a dotted reporting line to the President as well as unrestricted access to the chairpersons of the Board of Directors and the Control Committee. The CCO regularly reports to the Board of Directors and the Control Committee. The CCO is also the appointed Data Protection Officer (DPO), who monitors the processing of personal data within NIB and acts as the contact point for data subjects in matters regarding the processing of their personal data.
Once a year, the ICO publishes its Integrity Report, which is available on the Bank’s website.
| | |
| | |
FINANCIAL REPORT 2021 | | NIB FINANCIAL REPORT 2021 / 51 |
| | |
|
| |
| REPORT OF THE BOARD OF DIRECTORS |
| |
| PRESIDENT AND CEO’S COMMENTS |
| |
| OPERATING AND FINANCIAL REVIEW |
| |
| CAPITAL AND LIQUIDITY MANAGEMENT |
| |
| FINANCIAL STATEMENTS |
| |
| STATEMENT OF COMPREHENSIVE INCOME |
| |
| STATEMENT OF FINANCIAL POSITION |
| |
| CHANGES IN EQUITY |
| |
| CASH FLOW STATEMENT |
| |
| NOTES |
| |
| PROPOSAL BY THE BOARD OF DIRECTORS |
| |
| AUDITOR’S REPORT |
| |
| GOVERNANCE STATEMENT |
| |
| REPORT OF THE CONTROL COMMITTEE CHAIRMANSHIP |
| |
| REPORT OF THE CONTROL COMMITTEE |
| |
| |
| |
| |
| |
| |
| |
| |
| |
| |
| |
| |
| |
| |
| |
| |
| |
| |
Note 3: Segment information
OPERATING SEGMENTS
Operating segments are reported in a manner consistent with the internal reporting provided to the chief operating decision maker (“CODM”), who is responsible for allocating resources and assessing the performance of the operating segments. The CODM at NIB is the President. Segment results that are reported to the management include items directly attributable to that segment as well as other items allocated on a reasonable basis. In its segment reporting, NIB divides its operations into two major segments: lending and treasury operations. Treasury operations consist of Asset and Liability Management (liquidity management, collateral management, funding operations) and Portfolio Management
| | | | | | | | | | | | | | | | | | | | |
2021 | | | | | | | | | | | | | | | | | | | | |
In thousands of euro | | | LENDING TOTAL | | | | ASSET AND LIABILITY MANAGEMENT | | | | PORTFOLIO MANAGEMENT | | | | TREASURY TOTAL | | | | TOTAL | |
Net interest income | | | 162,443 | | | | 22,205 | | | | 16,745 | | | | 38,951 | | | | 201,393 | |
Commission income and fees received | | | 9,003 | | | | 195 | | | | - | | | | 195 | | | | 9,199 | |
Commission expense and fees paid | | | -48 | | | | -2,108 | | | | -9 | | | | -2,117 | | | | -2,165 | |
Net profit on financial operations | | | 4,852 | | | | -37,955 | | | | 9,440 | | | | -28,515 | | | | -23,663 | |
Foreign exchange gains and losses | | | - | | | | 13 | | | | - | | | | 13 | | | | 13 | |
Administrative expenses | | | -27,652 | | | | -10,007 | | | | -4,289 | | | | -14,295 | | | | -41,948 | |
Depreciation | | | -6,116 | | | | -2,400 | | | | -1,029 | | | | -3,429 | | | | -9,545 | |
Net loan losses | | | 25,874 | | | | - | | | | - | | | | 0 | | | | 25,874 | |
Profit/loss for the year | | | 168,356 | | | | -30,056 | | | | 20,859 | | | | -9,197 | | | | 159,158 | |
| | | | | | | | | | | | | | | | | | | | |
2020 | | | | | | | | | | | | | | | | | | | | |
In thousands of euro | | | LENDING TOTAL | | | | ASSET AND LIABILITY MANAGEMENT | | | | PORTFOLIO MANAGEMENT | | | | TREASURY TOTAL | | | | TOTAL | |
Net interest income | | | 155,362 | | | | 27,068 | | | | 23,113 | | | | 50,181 | | | | 205,543 | |
Commission income and fees received | | | 12,338 | | | | 147 | | | | 0 | | | | 147 | | | | 12,485 | |
Commission expense and fees paid | | | -130 | | | | -2,790 | | | | -225 | | | | -3,015 | | | | -3,145 | |
Net profit on financial operations | | | 2,492 | | | | 47,621 | | | | 8,698 | | | | 56,319 | | | | 58,810 | |
Foreign exchange gains and losses | | | - | | | | 183 | | | | 0 | | | | 183 | | | | 183 | |
Administrative expenses | | | -28,903 | | | | -11,192 | | | | -4,796 | | | | -15,988 | | | | -44,891 | |
Depreciation | | | -4,574 | | | | -2,081 | | | | -892 | | | | -2,972 | | | | -7,546 | |
Net loan losses | | | -56,744 | | | | - | | | | - | | | | - | | | | -56,744 | |
Profit/loss for the year | | | 79,840 | | | | 58,957 | | | | 25,897 | | | | 84,855 | | | | 164,695 | |
| | |
| | |
FINANCIAL REPORT 2021 | | NIB FINANCIAL REPORT 2021 / 52 |
| | |
|
| |
| REPORT OF THE BOARD OF DIRECTORS |
| |
| PRESIDENT AND CEO’S COMMENTS |
| |
| OPERATING AND FINANCIAL REVIEW |
| |
| CAPITAL AND LIQUIDITY MANAGEMENT |
| |
| FINANCIAL STATEMENTS |
| |
| STATEMENT OF COMPREHENSIVE INCOME |
| |
| STATEMENT OF FINANCIAL POSITION |
| |
| CHANGES IN EQUITY |
| |
| CASH FLOW STATEMENT |
| |
| NOTES |
| |
| PROPOSAL BY THE BOARD OF DIRECTORS |
| |
| AUDITOR’S REPORT |
| |
| GOVERNANCE STATEMENT |
| |
| REPORT OF THE CONTROL COMMITTEE CHAIRMANSHIP |
| |
| REPORT OF THE CONTROL COMMITTEE |
| |
| |
| |
| |
| |
| |
| |
| |
| |
| |
| |
| |
| |
| |
| |
| |
| |
| |
GEOGRAPHICAL SEGMENTS
The table below is based on the region where the borrowers reside, according to the domicile of the borrower’s group headquarters.
| | | | | | | | |
| In thousands of euro | | 2021 NET INTEREST
INCOME | | | 2020 NET INTEREST
INCOME | |
| Member countries | | | | | | | | |
| Denmark | | | 14,023 | | | | 12,375 | |
| Estonia | | | 2,791 | | | | 2,833 | |
| Finland | | | 36,974 | | | | 34,277 | |
| Iceland | | | 6,611 | | | | 6,973 | |
| Latvia | | | 2,582 | | | | 1,653 | |
| Lithuania | | | 6,932 | | | | 6,191 | |
| Norway | | | 31,329 | | | | 28,511 | |
| Sweden | | | 54,901 | | | | 54,829 | |
| Total, member countries | | | 156,142 | | | | 147,642 | |
| | | | | | | | | |
| Non-member countries | | | | | | | | |
| Africa | | | 159 | | | | 223 | |
| Asia | | | 707 | | | | 1,728 | |
| Europe and Eurasia | | | 4,253 | | | | 3,591 | |
| Americas | | | 1,105 | | | | 2,040 | |
| Middle East | | | 76 | | | | 138 | |
| Total, non-member countries | | | 6,301 | | | | 7,720 | |
| Total, net interest income from lending | | | 162,443 | | | | 155,362 | |
Lending Operations
Mission and mandate
The mission of NIB, as currently defined, is to promote sustainable growth of its Member countries by providing long-term complementary financing, based on sound banking principles, to projects that strengthen productivity and/or enhance the environment. NIB fulfils this mandate by providing financing in the form of loans and guarantees for activities in which NIB can add value and complement other financing sources. Moreover, NIB assesses the environmental aspect of all its financing.
Regarding NIB’s lending outside the Member countries, an agreement is generally required regarding the recipient country’s recognition of NIB as a legal person under public international law and as having legal capacity under the national law of the country in question as well as recognition of NIB’s status as an IFI. The Bank follows a policy similar to that of other international financial institutions concerning the debt service obligations of its borrowers. Therefore, the Bank has not participated in any debt rescheduling of sovereign debt.
Loans may be granted for both public and private projects. A loan will not be made, nor a guarantee provided, if opposed by the government of the country in which the related project is located. The Bank has a number of processes in place for assessing the eligibility of the projects. The Bank applies a mandate-rating tool as well as a sustainability policy to ensure that its financing fulfils the objectives and mission of the Bank. In addition, the Bank has an integrity due diligence procedure in relation to its granting of loans.
Lending Categories
The Bank previously had two main categories of lending: ordinary lending and lending under Special Programs. Lending under special programs comprised Project Investment Loans (PIL) and Environmental Investment Loans (MIL). Under the new statutes that came into force during 2020 these special programs were discontinued. The outstanding amounts under the PIL and MIL facilities became part of NIB’s ordinary lending, and new lending of this type since the statutes change, now constitutes ordinary lending.
NIB has allocated EUR 500 million to be invested in green bonds, social bonds, sustainability bonds and sustainability-linked bonds issued by companies or municipalities in the Bank’s member countries. The investments are used to finance environmentally sustainable projects that can contribute to mitigating climate change and achieve positive social outcomes in the
| | |
| | |
FINANCIAL REPORT 2021 | | NIB FINANCIAL REPORT 2021 / 53 |
|
| |
| REPORT OF THE BOARD OF DIRECTORS |
| |
| PRESIDENT AND CEO’S COMMENTS |
| |
| OPERATING AND FINANCIAL REVIEW |
| |
| CAPITAL AND LIQUIDITY MANAGEMENT |
| |
| FINANCIAL STATEMENTS |
| |
| STATEMENT OF COMPREHENSIVE INCOME |
| |
| STATEMENT OF FINANCIAL POSITION |
| |
| CHANGES IN EQUITY |
| |
| CASH FLOW STATEMENT |
| |
| NOTES |
| |
| PROPOSAL BY THE BOARD OF DIRECTORS |
| |
| AUDITOR’S REPORT |
| |
| GOVERNANCE STATEMENT |
| |
| REPORT OF THE CONTROL COMMITTEE CHAIRMANSHIP |
| |
| REPORT OF THE CONTROL COMMITTEE |
| |
| |
| |
| |
| |
| |
| |
| |
| |
| |
| |
| |
| |
| |
| |
| |
| |
| |
Nordic-Baltic region. At the end of 2021, the Bank held labelled bonds and CPs of EUR 330 (172) million at fair value recorded in debt securities.
For more information see Note 12: Loans outstanding and guarantee commitments.
Treasury Operations
Assets and Liability Management
Liquidity Management
NIB’s liquidity policy is based on stress testing and incorporates recommendations from Basel III (published by the Basel Committee on Banking Supervision), EU directives and the rating methodologies used by rating agencies. The policy includes a survival horizon that measures the period the Bank is able to meet all its payment obligations arising from ongoing business operations during a severe stress scenario. The target is to maintain a survival horizon of at least twelve months. At the end of 2021, NIB calculated its survival horizon as 450 days (418 days).
To mitigate liquidity risk, the Bank maintains a liquidity buffer that is mainly invested in EUR, but also in the USD and the Nordic currencies. At the end of 2021, the liquidity buffer, which also included cash and securities received from swap counterparties to mitigate counterparty credit risk, amounted to EUR 13,299 (11,317) million. Of this, EUR 5,279 (3,701) million was held as cash and short-term money market instruments 40% (33%), and EUR 8,021 (7,616) million was held in securities 60% (67%). In order to minimize market value volatility and liquidity risk under severe market conditions, the liquidity buffer must fulfil quality requirements stipulated in the liquidity policy. At the end of 2021, 89% (85%) of the liquidity buffer was invested in high quality liquidity assets (HQLA), 88% (87%) was eligible as collateral for securities repurchase transactions or repos at one or several central banks, and 93% (89%) of the assets belonged to the Bank’s top four internal rating categories. In addition, the Bank fulfils the liquidity coverage ratio (LCR) and net stable funding ratio (NSFR) requirements as specified in the Capital Requirements Regulation of the European Union. Under the objective of achieving additional earnings, part of the liquidity is invested in longer-term, high quality assets. For further information see Note 2: Risk management.
Collateral Management
The Bank receives collateral from its counterparties in order to mitigate counterparty risk arising from derivative transactions. The Bank has moved from unilateral to bilateral credit support agreements with its derivative counterparties which requires a higher liquidity buffer as the Bank also needs to post collateral, mainly EUR cash holdings, with its swap counterparties. For further information in this regard, see Note 2: Risk management. The amount of cash collateral held at year-end 2021 was EUR 752 (724) million and the amount of cash collateral posted amounted to EUR 400 (523) million. For further information regarding received collateral at year-end, please refer to Note 19: Collateral and commitments.
Funding Operations
The Bank’s primary source of funding is through the issuance of bonds in the main financial markets globally. The objective is to raise advantageous funds to the benefit of the Bank’s customers. The Bank seeks to take advantage of favourable market conditions, adapting its borrowing operations to investor preferences in terms of currency, maturity, liquidity and structures. Within this strategy, the objective is to raise funds at the lowest possible cost while taking into consideration a diversified funding base and the risks involved in the structure and complexity of the individual transactions.
Furthermore, potential mismatches between the terms of the funding and lending transactions are taken into consideration. To this extent, the proceeds from the issues are converted in the derivatives markets to best manage the Bank’s foreign exchange, interest rate and refinancing risks.
Most of NIB’s medium and long-term borrowing is conducted under its borrowing programs. At year-end 2021 the Bank had the following active programs:
| • | | the Euro Medium Term Note Program (the “EMTN Program”), the program amount was changed in 2021 to unlimited on the total aggregate principal amount of bonds which may be issued or outstanding at any time under the program, |
| • | | the U.S. Medium Term Note Series D Program registered with the U.S. Securities and Exchange Commission (the “U.S. MTN Program”), with a ceiling of USD 20 billion, and |
| • | | the Australian and New Zealand Dollar Domestic Medium Term Note Program with a current ceiling of AUD 8 billion. |
During 2021, NIB borrowed EUR 7,028 (7,540) million by means of 71 transactions in 11 different currencies. EUR 4,158 (4,555) million of this total came from 59 transactions under
| | |
| | |
FINANCIAL REPORT 2021 | | NIB FINANCIAL REPORT 2021 / 54 |
|
| |
| REPORT OF THE BOARD OF DIRECTORS |
| |
| PRESIDENT AND CEO’S COMMENTS |
| |
| OPERATING AND FINANCIAL REVIEW |
| |
| CAPITAL AND LIQUIDITY MANAGEMENT |
| |
| FINANCIAL STATEMENTS |
| |
| STATEMENT OF COMPREHENSIVE INCOME |
| |
| STATEMENT OF FINANCIAL POSITION |
| |
| CHANGES IN EQUITY |
| |
| CASH FLOW STATEMENT |
| |
| NOTES |
| |
| PROPOSAL BY THE BOARD OF DIRECTORS |
| |
| AUDITOR’S REPORT |
| |
| GOVERNANCE STATEMENT |
| |
| REPORT OF THE CONTROL COMMITTEE CHAIRMANSHIP |
| |
| REPORT OF THE CONTROL COMMITTEE |
| |
| |
| |
| |
| |
| |
| |
| |
| |
| |
| |
| |
| |
| |
| |
| |
| |
| |
the EMTN Program. Under the U.S. MTN Program, NIB issued three transactions, which were global benchmark issuances in the amount of USD 1.0 billion and 1.25 billion, respectively and an inaugural bond of USD 700 million linked to the SOFR index. During 2020, NIB issued 33 transactions under the EMTN Program and two transactions under the U.S. MTN Program both of which were global benchmark issuances in the amount of USD 1.5 billion each.
The weighted average maturity for NIB’s borrowing operations in 2021 was 4.4 years, compared with 3.6 years in 2020. Of debt securities outstanding, the amount of EUR 2,039 (1,302) million is at floating interest rates, while EUR 29,194 (26,749) million is at fixed interest rates which is mainly swapped to floating rate.
During 2020, the Bank established the NIB Response Bond Framework, under which the Bank can issue Response Bonds, the proceeds of which are used to finance projects that alleviate the social and economic impact of the COVID-19 pandemic. At year-end 2021, the Bank had a total of EUR 1,390 (1,399) million outstanding in NIB Response Bonds.
NIB may issue notes as part of NIB’s Environmental Bond (“NEB”) program. NIB has established an internal framework that allows for the funds raised through issuances of NEB to be directed to its environmental lending in NIB’s member countries and EU countries. Lending projects are eligible under the framework if they satisfy strict internal environmental criteria. Payment of principal and interest on such notes is made solely on the credit standing of NIB as a single institution and is not directly linked to the performance of environmental lending projects. Accordingly, such notes neither constitute “asset-backed” securities, nor are they otherwise credit-linked to any of NIB’s environmental lending projects. NIB Environmental Bonds can be issued under any of NIB’s debt issuance programs.
At year-end 2021, the Bank had a total of EUR 4,819 (4,455) million outstanding in NIB Environmental Bonds. During 2021, NIB issued three NIB Environmental Bonds under its environmental framework, totalling EUR 898 million. In March 2021, the Bank issued its first NIB Environmental Bond for the year by increasing its outstanding NEB 2027 by a further EUR 500 million. In October 2021, the Bank issued a five-year SEK 3.0 billion environmental bond and a six-year NOK 1.0 billion inaugural green bond. During 2020, NIB issued two NIB Environmental Bonds under its environmental framework, totalling EUR 643 million, consisting of one EUR 500 million environmental bond and a SEK 1.5 billion Nordic-Baltic Blue Bond.
For the years 2021 and 2020, the Board of Directors of the Bank has authorized the Bank to raise medium and long- term borrowings in an aggregate amount of up to EUR 8.0 billion and EUR 8.0 billion respectively.
NIB has a Euro Commercial Paper Program (“ECP Program”) with a ceiling of EUR 2 billion. In addition to borrowings under this program and through short-term transactions under the EMTN Program, NIB can obtain short-term funds in the interbank market through money market loans and through repo transactions. These transactions are undertaken in most of the currencies listed in Note 16: Debts evidenced by certificates and swaps.
For the years 2021 and 2020, the Board of Directors has authorized the Bank to raise short-term funding, provided that the outstanding amount at any one time in each of these years does not exceed EUR 3.0 billion.
NIB had no commercial paper outstanding under the ECP Program at year-ends 2021 and 2020.
Portfolio Management
The Bank’s portfolio management deals with the management of that portion of NIB’s liquidity that is invested in longer term securities. Two portfolios have been established: (1) a portfolio with security investments measured at amortized cost issued by highly rated issuers and (2) actively managed portfolios measured at fair value. Although, the main objective is to mitigate liquidity risk some environmental, social and governance aspects are factored into the investment decision. The return from the portfolios continues to contribute to NIB’s total results, however diminishing due to the very low yield environment. NIB has signed the United Nations Principles for Responsible Investment (PRI), in which NIB has committed to incorporate environmental, social and governance factors in its investment and ownership decisions. During 2021, the Bank finalised and published its Responsible Investment Framework in which external ESG rating data is used to assign internal ESG scores to Treasury Investments.
The actively managed portfolios contribute to NIB’s results through active yield curve and duration management strategies using fixed income derivatives as well as security investments. The Bank had an agreement with an external manager, but this arrangement was terminated during 2021.
For information regarding accounting treatment and volumes of NIB’s financial placements as of December 31, 2021, please refer to Note 11: Debt securities. The volume of outstanding derivatives as of December 31, 2021 are set forth in Note 15: Other assets.
| | |
| | |
FINANCIAL REPORT 2021 | | NIB FINANCIAL REPORT 2021 / 55 |
| | |
|
| |
| REPORT OF THE BOARD OF DIRECTORS |
| |
| PRESIDENT AND CEO’S COMMENTS |
| |
| OPERATING AND FINANCIAL REVIEW |
| |
| CAPITAL AND LIQUIDITY MANAGEMENT |
| |
| FINANCIAL STATEMENTS |
| |
| STATEMENT OF COMPREHENSIVE INCOME |
| |
| STATEMENT OF FINANCIAL POSITION |
| |
| CHANGES IN EQUITY |
| |
| CASH FLOW STATEMENT |
| |
| NOTES |
| |
| PROPOSAL BY THE BOARD OF DIRECTORS |
| |
| AUDITOR’S REPORT |
| |
| GOVERNANCE STATEMENT |
| |
| REPORT OF THE CONTROL COMMITTEE CHAIRMANSHIP |
| |
| REPORT OF THE CONTROL COMMITTEE |
| |
| |
| |
| |
| |
| |
| |
| |
| |
| |
| |
| |
| |
| |
| |
| |
| |
| |
| |
| |
| |
| |
| |
| |
| |
| |
|
Note 4: Net interest income
| | | | | | | | |
In thousands of euro | | | 2021 | | | | 2020 | |
| Interest income | | | | | | | | |
| Cash and cash equivalents | | | -17,446 | | | | -10,735 | |
| Long-term placements with credit institutions | | | -17,024 | | | | -14,505 | |
| Debt securities | | | 33,515 | | | | 47,747 | |
| Loans outstanding | | | 201,862 | | | | 249,853 | |
| Other interest income | | | 341 | | | | 155 | |
| Total, interest income | | | 201,248 | | | | 272,515 | |
| Of which, interest income from financial assets measured at amortised cost | | | 197,089 | | | | 254,355 | |
| Interest expense | | | | | | | | |
| Short-term amounts owed to credit institutions | | | 7,686 | | | | 4,999 | |
| Long-term amounts owed to credit institutions | | | - | | | | 21 | |
| Short-term repurchase agreements | | | - | | | | 25 | |
| Debts evidenced by certificates | | | -382,637 | | | | -448,733 | |
| Swap contracts and other interest expenses, net | | | 375,096 | | | | 376,714 | |
| Total, interest expense | | | 145 | | | | -66,973 | |
| Of which, interest expense from financial liabilities measured at amortised cost | | | -12,147 | | | | -121,316 | |
| Net interest income | | | 201,393 | | | | 205,543 | |
Interest income and expense includes amounts from related parties as described in Note 25: Related party disclosures.
Note 5: Commission income and fees received
| | | | | | | | |
In thousands of euro | | | 2021 | | | | 2020 | |
| Commitment fees | | | 3,652 | | | | 3,008 | |
| Loan disbursement fees | | | 4,649 | | | | 8,584 | |
| Early repayment fees | | | 702 | | | | 745 | |
| Commissions on lending of securities | | | 195 | | | | 147 | |
| Total | | | 9,199 | | | | 12,485 | |
Note 6: Net profit/loss on financial operations
| | | | | | | | |
In thousands of euro | | | 2021 | | | | 2020 | |
| Financial instruments measured at fair value, realised gains and losses | | | 4,776 | | | | -4,985 | |
| Financial instruments measured at fair value, unrealised gains and losses | | | 9,169 | | | | 12,959 | |
| Financial instruments measured at amortised cost, realised gains and losses | | | 34 | | | | -21 | |
| | |
| Expected credit loss on financial placements | | | 323 | | | | -301 | |
| Adjustment to hedge accounting, unrealised gains and losses of fair value hedges | | | -37,966 | | | | 51,157 | |
| Net profit/loss on financial operations | | | -23,663 | | | | 58,810 | |
| | |
| | |
FINANCIAL REPORT 2021 | | NIB FINANCIAL REPORT 2021 / 56 |
| | |
|
| |
| REPORT OF THE BOARD OF DIRECTORS |
| |
| PRESIDENT AND CEO’S COMMENTS |
| |
| OPERATING AND FINANCIAL REVIEW |
| |
| CAPITAL AND LIQUIDITY MANAGEMENT |
| |
| FINANCIAL STATEMENTS |
| |
| STATEMENT OF COMPREHENSIVE INCOME |
| |
| STATEMENT OF FINANCIAL POSITION |
| |
| CHANGE IN EQUITY |
| |
| CASH FLOW STATEMENT |
| |
| NOTES |
| |
| PROPOSAL BY THE BOARD OF DIRECTORS |
| |
| AUDITOR’S REPORT |
| |
| GOVERNANCE STATEMENT |
| |
| REPORT OF THE CONTROL COMMITTEE CHAIRMANSHIP |
| |
| REPORT OF THE CONTROL COMMITTEE |
| |
| |
| |
| |
| |
| |
| |
| |
| |
| |
| |
| |
| |
| |
| |
| |
| |
| |
Note 7: Personnel expenses, compensation and benefits
NET PERSONNEL EXPENSES
| | | | | | | | |
| | | |
| In thousands of euro | | 2021 | | | 2020 | |
| | |
Salaries and other remuneration | | | 27,404 | | | | 28,112 | |
| | | |
Social security and employee insurances | | | 1,761 | | | | 2,790 | |
| | | |
Pensions | | | 8,982 | | | | 8,799 | |
| | | |
Board and Control Committee remuneration | | | 164 | | | | 155 | |
| | | |
Other personnel expenses | | | 1,849 | | | | 2,157 | |
| | | |
Gross personnel expenses | | | 40,160 | | | | 42,013 | |
| | | |
Host country reimbursement according to agreement with the Finnish Government (see next page) | | | -10,978 | | | | -10,686 | |
| | | |
Net personnel expenses | | | 29,182 | | | | 31,327 | |
EMPLOYEES
| | | | | | | | |
| | | |
| | | 2021 | | | 2020 | |
| | |
Number of employees at 31 December | | | 221 | | | | 222 | |
| | | |
Average age of employees | | | 46 | | | | 46 | |
| | | |
Average period (years) of employment | | | 10 | | | | 11 | |
| | | |
Distribution by gender as of 31 Dec | | | | | | | | |
| | | |
Female | | | 90 | | | | 93 | |
| | | |
Male | | | 131 | | | | 129 | |
The number of employees in the table above includes all contracted employees. Permanent employees and those with fixed term contracts of four years or more amounted to 198 (2020: 193). Employees on substitute contracts, fixed term contracts less than four years and temporary contracts amounted to 23 (2020: 29).
COMPENSATION FOR THE BOARD OF DIRECTORS, THE CONTROL COMMITTEE, THE PRESIDENT AND THE EXECUTIVE COMMITTEE
Compensation for the Board of Directors (BoD) and the Control Committee (CC) is set by the Board of Governors (BoG). The compensation consists of fixed annual remuneration and an attendee allowance. The members of the BoD and the CC are also entitled to reimbursement of travel and accommodation expenses and a daily allowance in accordance with the Bank’s Travel Policy.
The BoD decides on the appointment and remuneration of the President. As a rule, the President is appointed on a fixed-term contract for five years at a time, but the existing contract can also be prolonged. The previous President’s contract commenced on 1 April 2012 and the contract was extended twice, until 31 March 2021. The current President’s contract commenced on 1 April 2021 for a five year period.
The President decides upon the employment of the Executive Committee (ExCo) members. The President is authorised by the BoD to make decisions regarding compensation within the scope of the Staff Regulations and the annually approved financial plan. The remuneration package for the members of the ExCo includes a fixed base salary and customary taxable benefits and allowances, which are in principle the same for all staff at the managerial level.
The Bank can pay performance premiums to the President, ExCo members and staff for excellent and extraordinary performance. The performance premiums (excluding staff) are presented in the table below, if awarded.
The table below includes fees paid to the Board of Directors and Control Committee as well as the taxable income of the President and Executive Committee.
| | | | | | | | |
| | | |
| In thousands of euro | | 2021 | | | 2020 | |
| | |
Board of Directors (remuneration and attendee allowance) | | | | | | | | |
| | | |
Chairman | | | 16 | | | | 17 | |
| | | |
Other Directors and Alternates (15 persons) | | | 101 | | | | 111 | |
| | | |
Control Committee | | | | | | | | |
| | | |
Chairman | | | 8 | | | | 9 | |
| | | |
Other members (9 persons) | | | 21 | | | | 18 | |
| | | |
President (*) Henrik Normann | | | 415 | | | | 855 | |
| | | |
President(*) André Küüsvek | | | 564 | | | | - | |
| | | |
Members and Associate members of the Executive Committee (**) | | | 3,002 | | | | 3,404 | |
*Henrik Normann until 31 March 2021. André Küüsvek from 1 April 2021. **Heikki Cantell, Hilde Kjelsberg, Gunnar Okk, all of 2020 & 2021. Lars Eibeholm until 30 June 2020, Thomas Wrangdahl until 31 August 2020. Luca De Lorenzo, Søren Mortensen, Vera-Maria Lehtonen, Jukka Ahonen from 1 September 2020 onwards. Björn Ordell all of 2020 and until 30 June 2021. Kim Skov Jensen from 18 October 2021.
| | |
| | |
FINANCIAL REPORT 2021 | | NIB FINANCIAL REPORT 2021 / 57 |
| | |
|
| |
| REPORT OF THE BOARD OF DIRECTORS |
| |
| PRESIDENT AND CEO’S COMMENTS |
| |
| OPERATING AND FINANCIAL REVIEW |
| |
| CAPITAL AND LIQUIDITY MANAGEMENT |
| |
| FINANCIAL STATEMENTS |
| |
| STATEMENT OF COMPREHENSIVE INCOME |
| |
| STATEMENT OF FINANCIAL POSITION |
| |
| CHANGES IN EQUITY |
| |
| CASH FLOW STATEMENT |
| |
| NOTES |
| |
| PROPOSAL BY THE BOARD OF DIRECTORS |
| |
| AUDITOR’S REPORT |
| |
| GOVERNANCE STATEMENT |
| |
| REPORT OF THE CONTROL COMMITTEE CHAIRMANSHIP |
| |
| REPORT OF THE CONTROL COMMITTEE |
| |
| |
| |
| |
| |
| |
| |
| |
| |
| |
| |
| |
| |
| |
| |
| |
| |
| |
| | | | | | | | |
| | | |
| Distribution by gender as of 31 Dec | | 2021 | | | 2020 | |
| | |
Board of Directors | | | | | | | | |
| | | |
Female | | | 5 | | | | 4 | |
| | | |
Male | | | 3 | | | | 4 | |
| | | |
Control Committee | | | | | | | | |
| | | |
Female | | | 1 | | | | 2 | |
| | | |
Male | | | 9 | | | | 8 | |
| | | |
Members and Associate members of the Executive Committee including the President | | | | | | | | |
| | | |
Female | | | 2 | | | | 2 | |
| | | |
Male | | | 7 | | | | 7 | |
There were no advances, credit granted or any debt arrangements between the Bank and the members of CC, BoD, the President or the ExCo members, nor commitments entered into by the Bank on their behalf by way of guarantee of any kind.
BENEFITS
Pension benefits
NIB is responsible for arranging the pension security for its employees. The Finnish public sector pension system (JuEL Pension) forms the basis for the pension benefits. The JuEL Pension is calculated based on the employee’s annual taxable income and the applicable age-linked pension accrual rate. The employer’s pension contribution in 2021 was 16.59% of the pensionable income. The employee’s pension contribution was either 7,15% or 8,65%, depending on the employee’s age. NIB pays this contribution for its permanent staff, and it is taxed as a benefit for the employee. The pension is accounted for as a defined contribution plan. In addition to the JuEL Pension, the Bank has taken out a supplementary group pension insurance policy for its entire permanently employed staff. The insurance premium, 6.5%, is calculated based on the employee’s taxable income and paid until the age of individual retirement under the JuEL Pension, with an upper age limit of 65 years. The supplementary pension is also accounted for as a defined contribution plan. The employer’s pension contribution regarding the current President amounted to EUR 259,987 (-) and EUR 98,653 (197,175) regarding the former President. The corresponding figure for the ExCo members was EUR 1,001,932(982,665 ) of which EUR 272,001 (295,339) related to supplementary pension premiums. The BoD and the CC members are not eligible for NIB pension arrangements.
Insurances
NIB has taken out several (both statutory and voluntary) insurance policies for its staff: unemployment insurance, group accident insurance, group life insurance, medical insurance and disability insurance. All personal insurance policies are valid for the total duration of employment (if not otherwise stated for the separate insurance alternatives). Longer periods of absence from work may interrupt the insurance coverage temporarily. Some of the insurances are available only to staff with a longer fixed term contract and permanently employed staff. The BoD and CC members are not under the coverage of the above mentioned insurances.
Health care
NIB has also arranged occupational health care for its staff through a private medical centre in Finland. The Bank’s medical insurance covers in addition use of other health care service providers if needed and it covers public sector health care services for more severe or complex medical treatment needs. The occupational health care benefit includes both preventive health care and wellbeing actions for staff and medical care. The BoD and CC members are not under the coverage of the health care benefit.
Additional expatriate benefits
Professional staff (including ExCo members) who move to Finland for the sole purpose of taking up employment at the Bank are entitled to certain expatriate benefits, such as an expatriate allowance and a spouse/ family allowance. In addition, NIB assists the expatriate in finding accommodation, usually by renting a house or a flat in its own name. The staff member reimburses the Bank for a part of the rent, which is equal to at least the taxable value of the accommodation benefit established annually by the Finnish National Board of Taxes.
TAXATION AND HOST COUNTRY REIMBURSEMENT
According to an agreement between the Bank’s Member countries, taxation of staff and ExCo members salaries and taxable benefits and the President’s remuneration, shall be taxed in the host country Finland in accordance with applicable Finnish taxation legislation.
According to the Host Country Agreement between the government of the Republic of Finland and the Bank, the amount of tax withheld in advance on the salaries of the Bank’s staff and the final tax on salaries collected shall be reimbursed to the Bank. Amounts repaid contribute to the surplus the Bank may distribute among the Member countries.
| | |
| | |
FINANCIAL REPORT 2021 | | NIB FINANCIAL REPORT 2021 / 58 |
|
| |
| REPORT OF THE BOARD OF DIRECTORS |
| |
| PRESIDENT AND CEO’S COMMENTS |
| |
| OPERATING AND FINANCIAL REVIEW |
| |
| CAPITAL AND LIQUIDITY MANAGEMENT |
| |
| FINANCIAL STATEMENTS |
| |
| STATEMENT OF COMPREHENSIVE INCOME |
| |
| STATEMENT OF FINANCIAL POSITION |
| |
| CHANGES IN EQUITY |
| |
| CASH FLOW STATEMENT |
| |
| NOTES |
| |
| PROPOSAL BY THE BOARD OF DIRECTORS |
| |
| AUDITOR’S REPORT |
| |
| GOVERNANCE STATEMENT |
| |
| REPORT OF THE CONTROL COMMITTEE CHAIRMANSHIP |
| |
| REPORT OF THE CONTROL COMMITTEE |
| |
| |
| |
| |
| |
| |
| |
| |
| |
| |
| |
| |
| |
| |
| |
| |
| |
| |
| |
| |
| |
| |
| |
| |
| |
| |
|
Note 8: Other administrative expenses
| | | | | | | | |
| In thousands of euro | | 2021 | | | 2020 | |
| IT & purchased data | | | 10,343 | | | | 10,584 | |
| Office premises | | | 2,061 | | | | 2,552 | |
| Travel | | | 146 | | | | 188 | |
Communications and marketing | | | 434 | | | | 352 | |
Other administrative expenses | | | 2,696 | | | | 2,279 | |
| Cost coverage, NDF and NEFCO (Note 25) | | | -2,606 | | | | -1,904 | |
| Rental and other income | | | -307 | | | | -488 | |
| Total | | | 12,766 | | | | 13,563 | |
| | | | | | | | | |
| Remuneration to the auditors | | | 2021 | | | | 2020 | |
| Audit fee | | | 157 | | | | 179 | |
| Other audit-related fees | | | 140 | | | | 177 | |
| Non-audit related fees | | | 61 | | | | 81 | |
| Total remuneration | | | 359 | | | | 436 | |
Note 9: Net loan losses
| | | | | | | | |
| In thousands of euro | | 2021 | | | 2020 | |
Change in expected credit loss on performing loans | | | 25,383 | | | | -57,504 | |
Change in expected credit loss on non-performing loans | | | 491 | | | | 759 | |
Decrease of provision to cover realised losses | | | - | | | | - | |
Realised loan losses | | | - | | | | - | |
| Net loan losses | | | 25,874 | | | | -56,744 | |
See also Note 12: Loans outstanding and guarantee commitments.
Note 10: Expected credit loss
Impairment Methodology
Introduction and governance
The Bank calculates and reports its impairments based on expected credit losses (ECL). The ECL Framework is based on the requirements of the International Financial Reporting Standard (IFRS 9 Financial Instruments). Additionally, the guidance of the Basel Committee on Banking Supervision and Global Public Policy Committee are followed, where applicable. The ECL Framework is governed by the Bank’s Risk Management Policy. The Executive Committee reviews and the President approves the ECL Framework. The Mandate, Credit and Compliance Committee approves the impairment allowances and ECL model based calculation results.
Three Stage Model
The Bank recognises a loss allowance for ECL on financial assets measured at amortised cost, or at fair value through comprehensive income, and for loan commitments. The ECL comprises of a three-stage model based on changes in credit quality since initial recognition. Impairments are reported based in either 12 months or lifetime expected credit losses, depending on the stage allocation of the financial asset. The stage allocation also determines if interest income for the financial asset is reported on gross carrying amount or net of impairment allowance.
Stage 1 - includes financial assets that have not had a significant increase in credit risk since initial recognition or have a low risk at the reporting date. For these assets, the allowance amount is calculated based on the coming 12 months.
Stage 2 - includes financial assets that have had a significant increase in credit risk since initial recognition, but for which there is no objective evidence of impairment. For these assets, the allowance amount is calculated based on expected lifetime of the asset. A significant increase in credit risk is considered to have occurred if the life-time default probability (PD) has increased by 100% compared to that at the initial recognition. Additional triggers are considered, including significant downgrading or watch-listing of the asset.
Stage 1 and 2 assets are categorised as performing assets.
| | |
| | |
FINANCIAL REPORT 2021 | | NIB FINANCIAL REPORT 2021 / 59 |
|
| |
| REPORT OF THE BOARD OF DIRECTORS |
| |
| PRESIDENT AND CEO’S COMMENTS |
| |
| OPERATING AND FINANCIAL REVIEW |
| |
| CAPITAL AND LIQUIDITY MANAGEMENT |
| |
| FINANCIAL STATEMENTS |
| |
| STATEMENT OF COMPREHENSIVE INCOME |
| |
| STATEMENT OF FINANCIAL POSITION |
| |
| CHANGES IN EQUITY |
| |
| CASH FLOW STATEMENT |
| |
| NOTES |
| |
| PROPOSAL BY THE BOARD OF DIRECTORS |
| |
| AUDITOR’S REPORT |
| |
| GOVERNANCE STATEMENT |
| |
| REPORT OF THE CONTROL COMMITTEE CHAIRMANSHIP |
| |
| REPORT OF THE CONTROL COMMITTEE |
| |
| |
| |
| |
| |
| |
| |
| |
| |
| |
| |
| |
| |
| |
| |
| |
| |
| |
| |
| |
| |
| |
| |
| |
| |
| |
|
Stage 3 - includes assets that have been categorised as non-performing in the Bank’s credit rating processes. For the non-performing assets, assessment is done on an individual basis, as opposed to the collective model used for the Stage 1 and 2 assets. Exposures in default classes are classified as non-performing. A default occurs with regard to an obligor when either or both of the following have taken place:
| i) | NIB considers that the obligor is unlikely to pay its credit obligations in full, without recourse by the Bank to actions such as realising security; or |
| ii) | the obligor is past due by more than 90 or in the case of sovereign lending by more than 180 days. |
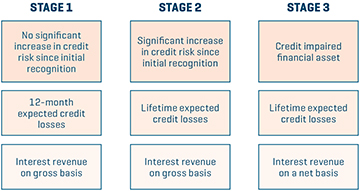
Inputs
The ECL calculation is performed at the level of individual financial assets and the main components comprise Probability of Default (PD), Loss Given Default (LGD), Exposure at Default (EAD) and Discount Factor. The model is forward-looking: current and future macroeconomic conditions are incorporated into the model through macro-financial scenarios.
Each transaction in the Bank’s portfolio has an internal PD rating associated with it. This rating is essentially a long-term, best estimate rating resulting in a neutral estimate without
explicit buffers of conservatism. For ECL purposes, the PD is estimated based on a regression model of macroeconomic variables to observed default data. PD term structures are derived for each rating grade reflecting the macro-financial scenarios. The short-end of the PD term structure (up to 3 years) reflects the macro-financial scenarios, while the long-end of the PD term structure is based on long-run average behaviour. The term structure construction considers both outright default probabilities and rating migration behaviour.
Loss Given Default (LGD ) is the magnitude of the likely loss if there is a default. The Bank has established a Rating Framework for LGD, according to which LGD estimates are generated for all of the Bank’s exposures. The estimates are derived separately for different counterparty types: corporates, financial institutions, sovereigns and local & regional governments, and project finance. Credit enhancements (collateral, guarantees) and other transaction characteristics impact the LGD estimate. Depending on counterparty type, different datasets and modelling approaches are employed.
Exposure at Default (EAD) represents the expected exposure in the event of a default and is measured from discounted contractual cash flows. Loan commitments are included using a Credit Conversion Factor (CCF). The discount factor is calculated based on the Effective Interest Rate (EIR) of a contract.
Macro-Financial Scenarios - The ECL is forward looking. The starting point is the Bank’s view of the current and future macroeconomic conditions and credit environment. It should be noted that the same overall macroeconomic view is used also as a basis for all other macroeconomic forecasting needs within the Bank (inter alia business & financial planning and ICAAP & stress testing). The Bank considers a range of outcomes in a probability-weighted manner. The purpose is to capture possible non-linear behaviour in the dependence of the ECL on economic conditions. The macro-financial scenarios consist of three scenarios: baseline, upside, and downside. Each scenario has an assigned probability based on expert judgment, intended to reflect the prevailing perceived distribution of risks.
The Mandate, Credit and Compliance Committee may do post-model adjustments to the model-based ECL estimates as deemed necessary, inter alia to reflect additional factors such as significant events not explicitly incorporated within the modelling of ECL or in the credit risk ratings.
The loan impairment accounting policy is described in Note 1: Accounting policies, and the results of the ECL are described below.
| | |
| | |
FINANCIAL REPORT 2021 | | NIB FINANCIAL REPORT 2021 / 60 |
| | |
|
| |
| REPORT OF THE BOARD OF DIRECTORS |
| |
| PRESIDENT AND CEO’S COMMENTS |
| |
| OPERATING AND FINANCIAL REVIEW |
| |
| CAPITAL AND LIQUIDITY MANAGEMENT |
| |
| FINANCIAL STATEMENTS |
|
| STATEMENT OF COMPREHENSIVE INCOME |
|
| STATEMENT OF FINANCIAL POSITION |
|
| CHANGES IN EQUITY |
|
| CASH FLOW STATEMENT |
| |
| NOTES |
| |
| PROPOSAL BY THE BOARD OF DIRECTORS |
| |
| AUDITOR’S REPORT |
| |
| GOVERNANCE STATEMENT |
| |
| REPORT OF THE CONTROL COMMITTEE CHAIRMANSHIP |
| |
| REPORT OF THE CONTROL COMMITTEE |
| |
| |
| |
| |
| |
| |
| |
| |
| |
| |
| |
| |
| |
| |
| |
| |
| |
| |
| |
| |
| |
| |
| |
| |
| |
| |
|
| | | | | | | | | | | | | | | | |
| | | | | |
Expected credit loss provision In millions of euro | | STAGE 1 | | | STAGE 2 | | | STAGE 3 | | | TOTAL | |
| | | | |
Balance at 31 December 2019 | | | 29 | | | | 14 | | | | 80 | | | | 122 | |
| | | | |
Transfer to Stage 1 | | | - | | | | - | | | | - | | | | 0 | |
| | | | |
Transfer to Stage 2 | | | -5 | | | | 5 | | | | - | | | | 0 | |
| | | | |
Transfer to Stage 3 | | | - | | | | - | | | | - | | | | 0 | |
| | | | |
New assets originated or purchased | | | 8 | | | | 1 | | | | - | | | | 10 | |
| | | | |
Amortisations and repayments | | | -4 | | | | -2 | | | | -1 | | | | -7 | |
| | | | |
Impact of remeasurment on existing assets | | | 24 | | | | 30 | | | | - | | | | 54 | |
| | | | |
Foreign exchange adjustments and other changes | | | - | | | | - | | | | -7 | | | | -7 | |
| | | | |
Net change income statement | | | 23 | | | | 35 | | | | -7 | | | | 50 | |
| | | | |
Realised losses | | | - | | | | - | | | | - | | | | 0 | |
| | | | |
Balance at 31 December 2020 | | | 52 | | | | 48 | | | | 73 | | | | 173 | |
| | | | |
Transfer to Stage 1 | | | 3 | | | | -3 | | | | - | | | | 0 | |
| | | | |
Transfer to Stage 2 | | | 0 | | | | 0 | | | | - | | | | 0 | |
| | | | |
Transfer to Stage 3 | | | - | | | | - | | | | - | | | | 0 | |
| | | | |
New assets originated or purchased | | | 3 | | | | 0 | | | | - | | | | 4 | |
| | | | |
Amortisations and repayments | | | -3 | | | | -3 | | | | - | | | | -6 | |
| | | | |
Impact of remeasurment on existing assets | | | -23 | | | | 0 | | | | 0 | | | | -24 | |
| | | | |
Foreign exchange adjustments and other changes | | | - | | | | - | | | | 6 | | | | 6 | |
| | | | |
Net change income statement | | | -20 | | | | -6 | | | | 6 | | | | -20 | |
| | | | |
Realised losses | | | - | | | | - | | | | - | | | | 0 | |
| | | | |
Balance at 31 December 2021 | | | 32 | | | | 42 | | | | 78 | | | | 152 | |
| | | | | | | | |
| | | |
Expected credit loss
In millions of euro | | 31-DEC-21 | | | 31-DEC-20 | |
| | |
Loans outstanding | | | 150 | | | | 169 | |
| | |
Other receivables | | | 2 | | | | 2 | |
| | |
Loan commitments | | | 1 | | | | 1 | |
| | |
Financial placements | | | 0 | | | | 1 | |
| | |
Total | | | 152 | | | | 173 | |
| | | | | | | | |
| | | |
Expected credit loss income statement In millions of euro | | 2021 | | | 2020 | |
| | |
Net result on financial operations | | | 0 | | | | 0 | |
| | |
Net loan losses (Note 9) | | | 26 | | | | -57 | |
| | |
Foreign exchange gains and losses | | | -6 | | | | 7 | |
| | |
Total recognised in income statement | | | 20 | | | | -50 | |
The Bank defines “forbearance” as a concession granted to a counterparty for reasons of financial difficulties, i.e. a concession that would not otherwise be considered by the lender. Forbearance recognition is not limited to measures that give rise to a loss for the lender. Modification of the terms and conditions of the contract may include, for example, reduction of the interest rate, principal or accrued interest, or rescheduling of the payment dates of principal and/or interest, and has an actual effect on the future cash flows. Loan forbearance is granted on a selective basis and purposefully to avoid counterparty default in favour of the Bank’s collection opportunities. Loans granted forbearance are automatically watch listed, and subject to the impairment policies of the Bank. As of 31 December 2021, there were three non-performing (stage 3) loans totalling EUR 76 (71) million. A total of EUR 151 (171) million has been deducted from the Bank’s loans outstanding and from lending claims in “other assets”. Specific allowances for impairment amounted to EUR 76 (71) million and ECL on stage 1 & 2 assets amounted to EUR 74 (100) million. During 2021 or 2020, no lending transactions were converted into claims under “other assets”.
| | | | | | | | | | | | | | | | |
| | | | | |
Assets subject to expected credit loss
In millions of euro | | STAGE 1 | | | STAGE 2 | | | STAGE 3 | | | TOTAL | |
| | | | |
Exposure at 31 December 2019 | | | 23,994 | | | | 208 | | | | 80 | | | | 24,282 | |
| | | | |
Transfer to Stage 1 | | | - | | | | - | | | | - | | | | 0 | |
| | | | |
Transfer to Stage 2 | | | -1,324 | | | | 1,324 | | | | - | | | | 0 | |
| | | | |
Transfer to Stage 3 | | | - | | | | - | | | | - | | | | 0 | |
| | | | |
New assets originated or purchased | | | 7,465 | | | | 361 | | | | - | | | | 7,825 | |
| | | | |
Amortisations and repayments | | | -4,401 | | | | -130 | | | | - | | | | -4,531 | |
| | | | |
Foreign exchange adjustments and other changes | | | -185 | | | | -23 | | | | -7 | | | | -215 | |
| | | | |
Exposure at 31 December 2020 | | | 25,548 | | | | 1,740 | | | | 73 | | | | 27,360 | |
| | | | |
Transfer to Stage 1 | | | 508 | | | | -508 | | | | - | | | | 0 | |
| | | | |
Transfer to Stage 2 | | | -174 | | | | 174 | | | | - | | | | 0 | |
| | | | |
Transfer to Stage 3 | | | - | | | | - | | | | - | | | | 0 | |
| | | | |
New assets originated or purchased | | | 3,668 | | | | 7 | | | | - | | | | 3,675 | |
| | | | |
Amortisations and repayments | | | -3,296 | | | | -558 | | | | - | | | | -3,854 | |
| | | | |
Foreign exchange adjustments and other changes | | | 209 | | | | 9 | | | | 6 | | | | 223 | |
| | | | |
Exposure at 31 December 2021 | | | 26,462 | | | | 864 | | | | 78 | | | | 27,405 | |
| | | | | | | | |
| | | |
Assets subject to expected credit loss In millions of euro | | 31-DEC-21 | | | 31-DEC-20 | |
| | |
Loans outstanding | | | 22,016 | | | | 21,465 | |
| | |
Loan commitments | | | 2,837 | | | | 3,522 | |
| | |
Treasury assets held at amortised cost | | | 2,552 | | | | 2,373 | |
| | |
Total Exposure | | | 27,405 | | | | 27,360 | |
| | |
| | |
FINANCIAL REPORT 2021 | | NIB FINANCIAL REPORT 2021 / 61 |
| | |
|
|
| REPORT OF THE BOARD OF DIRECTORS |
| |
| PRESIDENT AND CEO’S COMMENTS |
|
| OPERATING AND FINANCIAL REVIEW |
| |
| CAPITAL AND LIQUIDITY MANAGEMENT |
| |
| FINANCIAL STATEMENTS |
|
| STATEMENT OF COMPREHENSIVE INCOME |
|
| STATEMENT OF FINANCIAL POSITION |
|
| CHANGES IN EQUITY |
|
| CASH FLOW STATEMENT |
| |
| NOTES |
| |
| PROPOSAL BY THE BOARD OF DIRECTORS |
| |
| AUDITOR’S REPORT |
| |
| GOVERNANCE STATEMENT |
| |
| REPORT OF THE CONTROL COMMITTEE CHAIRMANSHIP |
| |
| REPORT OF THE CONTROL COMMITTEE |
| |
| |
| |
| |
| |
| |
| |
| |
| |
| |
| |
| |
| |
| |
| |
| |
| |
| |
| |
| |
| |
| |
| |
| |
| |
| |
| |
| |
Note 11: Debt securities
The debt securities were issued by the following counterparties:
| | | | | | | | |
| | | |
| In millions of euro | | 2021 | | | 2020 | |
| | |
Governments | | | 914 | | | | 794 | |
| | |
Public institutions | | | 2,214 | | | | 2,217 | |
| | |
Other | | | 5,162 | | | | 4,901 | |
| | |
Total | | | 8,291 | | | | 7,912 | |
The distribution of the Bank’s debt security portfolios was as follows:
| | | | | | | | | | | | | | | | |
| | | |
| | | BOOK VALUE | | | FAIR VALUE | |
| | | | |
In millions of euro | | | 2021 | | | | 2020 | | | | 2021 | | | | 2020 | |
| | | | |
Held at fair value | | | 6,342 | | | | 6,032 | | | | 6,342 | | | | 6,032 | |
| | | | | |
| Held at amortised cost | | 1,950 | | | 1,880 | | | 1,982 | | | 1,944 | |
| | | | |
Total | | | 8,291 | | | | 7,912 | | | | 8,323 | | | | 7,976 | |
Of these debt securities, EUR 6,583 (6,051) million is at fixed interest rates and EUR 1,708 (1,861) million at floating interest rates. At 31 December 2021, EUR 330 (EUR 172) million of total debt securities were in labelled bonds. The fair values are disclosed in Note 20: Fair value of financial instruments.
Note 12: Loans outstanding and guarantee commitments
At 31 December 2021, 521 (553) loans amounting to EUR 21,975 (21,555) million were outstanding, including medium-term notes (MTN) of EUR 0 (0) million. These are held at amortised cost unless they form part of a qualifying hedging relationship with a derivative in a hedge accounting relationship, the MTNs are recognised at fair value.
At 31 December 2021, loans outstanding before impairments and hedge accounting adjustments with floating interest rates amounted to EUR 16,936 (16,625) million, while those with fixed interest rates amounted to EUR 5,084 (4,846) million. As a general rule fixed interest loans are converted to floating rates through the use of derivatives instruments.
| | | | | | | | |
| | | |
| In millions of euro | | 2021 | | | 2020 | |
| | |
Opening balance | | | 21,555 | | | | 18,799 | |
| | |
Disbursements | | | 2,271 | | | | 4,819 | |
| | |
Amortisation | | | -1,535 | | | | -1,457 | |
| | |
Prepayments | | | -441 | | | | -410 | |
| | |
Change in expected credit losses | | | 25 | | | | -57 | |
| | |
Foreign exchange changes | | | 250 | | | | -187 | |
| | |
Fair value adjustments | | | 0 | | | | 1 | |
| | |
Hedge accounting adjustments | | | -149 | | | | 47 | |
| | |
Other movements | | | -1 | | | | 0 | |
| | |
Closing balance | | | 21,975 | | | | 21,555 | |
| | |
| | |
FINANCIAL REPORT 2021 | | NIB FINANCIAL REPORT 2021 / 62 |
| | |
|
| |
| REPORT OF THE BOARD OF DIRECTORS |
| |
| PRESIDENT AND CEO’S COMMENTS |
| |
| OPERATING AND FINANCIAL REVIEW |
| |
| CAPITAL AND LIQUIDITY MANAGEMENT |
| |
| FINANCIAL STATEMENTS |
|
| STATEMENT OF COMPREHENSIVE INCOME |
|
| STATEMENT OF FINANCIAL POSITION |
|
| CHANGES IN EQUITY |
|
| CASH FLOW STATEMENT |
| |
| NOTES |
| |
| PROPOSAL BY THE BOARD OF DIRECTORS |
| |
| AUDITOR’S REPORT |
| |
| GOVERNANCE STATEMENT |
| |
| REPORT OF THE CONTROL COMMITTEE CHAIRMANSHIP |
| |
| REPORT OF THE CONTROL COMMITTEE |
| |
| |
| |
| |
| |
| |
| |
| |
| |
| |
| |
| |
| |
| |
| |
| |
| |
| |
| |
| |
| |
| |
| |
| |
| |
| |
| |
| |
The following table sets forth a breakdown per business sector of NIB’s outstanding loans and issued guarantees at 31 December.
| | | | | | | | | | | | | | | | |
| | | |
| | | 2021 | | | 2020 | |
| | | | | |
| In millions of euro | | AMOUNT | | | % | | | AMOUNT | | | % | |
| | | | |
Industry | | | 3,923 | | | | 17.8 % | | | | 3,714 | | | | 17.3 % | |
| | | | |
Public Sector & Utilities | | | 8,640 | | | | 39.2 % | | | | 8,297 | | | | 38.6 % | |
| | | | |
Infrastructure & Project Finance | | | 5,634 | | | | 25.6 % | | | | 5,447 | | | | 25.4 % | |
| | | | |
Services and Consumer | | | 2,087 | | | | 9.5 % | | | | 2,129 | | | | 9.9 % | |
| | | | | |
Financial institutions | | | 1,736 | | | | 7.9 % | | | | 1,884 | | | | 8.8 % | |
| | | | |
Total before impairments and hedge accounting | | | 22,021 | | | | 100.0% | | | | 21,471 | | | | 100.0% | |
| | | | |
ECL Stage 3 | | | -76 | | | | | | | | -71 | | | | | |
| | | | |
ECL Stage 1&2 | | | -74 | | | | | | | | -98 | | | | | |
| | | | |
Fair value adjustments | | | 0 | | | | | | | | -1 | | | | | |
| | | | |
Hedge accounting adjustments | | | 105 | | | | | | | | 254 | | | | | |
| | | | | |
Total | | | 21,975 | | | | | | | | 21,555 | | | | | |
The following table sets forth the scheduled amortizations of outstanding loans at 31 December.
| | | | | | | | |
| | | |
| In millions of euro | | 2021 | | | 2020 | |
| | |
2021 | | | | | | | 1,640 | |
| | |
2022 | | | 2,224 | | | | 2,268 | |
| | |
2023 | | | 2,578 | | | | 2,513 | |
| | |
2024 | | | 2,545 | | | | 2,443 | |
| | |
2025 | | | 2,261 | | | | 2,097 | |
| | |
2026 | | | 2,293 | | | | 2,105 | |
| | |
2027 and thereafter | | | 10,120 | | | | 8,405 | |
| | |
| Total before impairments and hedge accounting | | | 22,021 | | | | 21,471 | |
| | |
ECL Stage 3 | | | -76 | | | | -71 | |
| | |
ECL Stage 1&2 | | | -74 | | | | -98 | |
| | |
Fair value adjustments | | | 0 | | | | -1 | |
| | |
Hedge accounting adjustments | | | 105 | | | | 254 | |
| | | |
Total | | | 21,975 | | | | 21,555 | |
The remaining average time to maturity/re-pricing of loans outstanding at 31 December 2021, calculated to the next date on which the Bank has the right to adjust the terms of the interest rate or currency of denomination, was 4 years and 0 months (4 years and 3 months), with actual maturities from the date of first disbursement ranging from 2 to 30 years (from 2 to 30 years).
| | |
| | |
FINANCIAL REPORT 2021 | | NIB FINANCIAL REPORT 2021 / 63 |
|
| |
| REPORT OF THE BOARD OF DIRECTORS |
| |
| PRESIDENT AND CEO’S COMMENTS |
| |
| OPERATING AND FINANCIAL REVIEW |
| |
| CAPITAL AND LIQUIDITY MANAGEMENT |
| |
| FINANCIAL STATEMENTS |
|
| STATEMENT OF COMPREHENSIVE INCOME |
|
| STATEMENT OF FINANCIAL POSITION |
|
| CHANGES IN EQUITY |
|
| CASH FLOW STATEMENT |
| |
| NOTES |
| |
| PROPOSAL BY THE BOARD OF DIRECTORS |
| |
| AUDITOR’S REPORT |
| |
| GOVERNANCE STATEMENT |
| |
| REPORT OF THE CONTROL COMMITTEE CHAIRMANSHIP |
| |
| REPORT OF THE CONTROL COMMITTEE |
| |
| |
| |
| |
| |
| |
| |
| |
| |
| |
| |
| |
| |
| |
| |
| |
| |
| |
| |
| |
| |
| |
| |
| |
| |
| |
|
CURRENCY DISTRIBUTION OF LOANS OUTSTANDING
| | | | | | | | |
| | | |
| In millions of euro | | 2021 | | | 2020 | |
| | |
EUR | | | 9,538 | | | | 9,535 | |
| | |
USD | | | 1,519 | | | | 1,635 | |
| | |
Nordic currencies | | | 10,761 | | | | 10,031 | |
| | |
Other currencies | | | 202 | | | | 269 | |
| | | |
Total before impairments and hedge accounting | | | 22,021 | | | | 21,471 | |
| | |
ECL Stage 3 | | | -76 | | | | -71 | |
| | |
ECL Stage 1&2 | | | -74 | | | | -98 | |
| | |
Fair value adjustments | | | 0 | | | | -1 | |
| | |
Hedge accounting adjustments | | | 105 | | | | 254 | |
| | | |
Total | | | 21,975 | | | | 21,555 | |
DISTRIBUTION OF LOANS OUTSTANDING AND GUARANTEES BY VARIOUS TYPES OF SECURITY
The following table shows loans outstanding, including guarantee commitments, distributed by type of security:
| | | | | | | | | | | | | | | | |
| | | |
| | | 2021 | | | 2020 | |
| | | | |
| | | EUR
MILLIONS | | | SHARE IN % | | | EUR
MILLIONS | | | SHARE IN % | |
| | | | |
Loans to or guaranteed by governments | | | | | | | | | | | | | | | | |
| | | | |
Loans to or guaranteed by member countries | | | 1,980 | | | | | | | | 1,681 | | | | | |
| | | | |
Loans to or guaranteed by other countries | | | 374 | | | | | | | | 435 | | | | | |
| | | | |
Loans to or guaranteed by governments, total | | | 2,355 | | | | 10.7 | % | | | 2,116 | | | | 9.9 | % |
| | | | |
Loans to or guaranteed by local authorities in member countries | | | 4,074 | | | | 18.6 | % | | | 4,177 | | | | 19.5 | % |
| | | | |
Loans to or guaranteed by companies owned 50% or more by member countries or local authorities in member countries | | | 4,750 | | | | 21.6 | % | | | 4,384 | | | | 20.5 | % |
| | | | |
Loans to or guaranteed by banks | | | 1,666 | | | | 7.6 | % | | | 1,810 | | | | 8.5 | % |
| | | | |
Loans backed by a lien or other security in property | | | 1,764 | | | | 8.0 | % | | | 1,804 | | | | 8.4 | % |
| | | | |
Loans with a guarantee from the parent company and other guarantees | | | 952 | | | | 4.3 | % | | | 1,008 | | | | 4.7 | % |
| | | | |
Loans with a negative pledge clause and other covenants | | | 6,385 | | | | 29.1 | % | | | 6,101 | | | | 28.5 | % |
| | | | |
Loans without formal security | | | - | | | | 0.0 | % | | | - | | | | 0.0 | % |
| | | | |
Labelled bonds and CPs | | | - | | | | 0.0 | % | | | - | | | | 0.0 | % |
| | | | | |
Total after individually assessed impairments | | | 21,944 | | | | 100.0 | % | | | 21,400 | | | | 100.0 | % |
| | | | |
ECL Stage 1&2 | | | -74 | | | | | | | | -98 | | | | | |
| | | | |
Hedge accounting adjustments | | | 105 | | | | | | | | 254 | | | | | |
| | | | |
Fair value adjustments | | | 0 | | | | | | | | -1 | | | | | |
| | | | | |
Total loans outstanding | | | 21,975 | | | | | | | | 21,555 | | | | | |
As of 31 December, loans agreed but not disbursed amounted to EUR 2,498 (3,522) million.
| | |
| | |
FINANCIAL REPORT 2021 | | NIB FINANCIAL REPORT 2021 / 64 |
| | |
|
| |
| REPORT OF THE BOARD OF DIRECTORS |
| |
| PRESIDENT AND CEO’S COMMENTS |
| |
| OPERATING AND FINANCIAL REVIEW |
| |
| CAPITAL AND LIQUIDITY MANAGEMENT |
| |
| FINANCIAL STATEMENTS |
|
| STATEMENT OF COMPREHENSIVE INCOME |
|
| STATEMENT OF FINANCIAL POSITION |
|
| CHANGES IN EQUITY |
|
| CASH FLOW STATEMENT |
| |
| NOTES |
| |
| PROPOSAL BY THE BOARD OF DIRECTORS |
| |
| AUDITOR’S REPORT |
| |
| GOVERNANCE STATEMENT |
| |
| REPORT OF THE CONTROL COMMITTEE CHAIRMANSHIP |
| |
| REPORT OF THE CONTROL COMMITTEE |
| |
| |
| |
| |
| |
| |
| |
| |
| |
| |
| |
| |
| |
| |
| |
| |
| |
| |
| |
| |
| |
| |
| |
| |
| |
| |
|
The table below sets forth the total principal amount and percentage distribution of lending outstanding as well as issued guarantees at 31 December, allocated by country according to the domicile of the risk owner’s group headquarters.
| | | | | | | | | | | | | | | | |
| | | 2021 | | | 2020 | |
| | | | |
| In millions of euro | | LOANS
OUTSTANDING | | | TOTAL
COMMITMENTS | | | LOANS
OUTSTANDING | | | TOTAL
COMMITMENTS | |
| | | | |
Denmark | | | 1,936 | | | | - | | | | 1,350 | | | | 635 | |
| | | | |
Estonia | | | 917 | | | | 127 | | | | 943 | | | | 91 | |
| | | | |
Finland | | | 4,244 | | | | 745 | | | | 4,264 | | | | 763 | |
| | | | |
Iceland | | | 579 | | | | 21 | | | | 532 | | | | 39 | |
| | | | |
Latvia | | | 676 | | | | 151 | | | | 419 | | | | 345 | |
| | | | |
Lithuania | | | 1,015 | | | | 380 | | | | 1,064 | | | | 432 | |
| | | | |
Norway | | | 5,371 | | | | 182 | | | | 5,228 | | | | 191 | |
| | | | |
Sweden | | | 6,569 | | | | 436 | | | | 6,828 | | | | 524 | |
| | | | |
Belarus | | | 8 | | | | 13 | | | | 8 | | | | 14 | |
| | | | |
Germany | | | 38 | | | | 10 | | | | 40 | | | | 25 | |
| | | | |
Poland | | | 309 | | | | - | | | | 351 | | | | - | |
| | | | |
Russia | | | 1 | | | | - | | | | 3 | | | | - | |
| | | | |
Turkey | | | 4 | | | | - | | | | 8 | | | | - | |
| | | | |
Other European countries | | | - | | | | - | | | | 1 | | | | - | |
| | | | |
Multilateral | | | 167 | | | | 283 | | | | 156 | | | | 272 | |
| | | | |
Botswana | | | 12 | | | | - | | | | 13 | | | | - | |
| | | | |
Brazil | | | 15 | | | | - | | | | 37 | | | | - | |
| | | | |
China | | | 61 | | | | 150 | | | | 84 | | | | 150 | |
| | | | |
India | | | 76 | | | | - | | | | 82 | | | | - | |
| | | | |
Laos | | | 1 | | | | - | | | | 5 | | | | - | |
| | | | |
Mexico | | | - | | | | - | | | | - | | | | 41 | |
| | | | |
Philippines | | | - | | | | - | | | | 18 | | | | - | |
| | | | |
Tunisia | | | 7 | | | | - | | | | 11 | | | | - | |
| | | | |
United States | | | 3 | | | | - | | | | 6 | | | | - | |
| | | | |
Vietnam | | | 10 | | | | - | | | | 16 | | | | - | |
| | | | |
Other Non-European countries | | | 4 | | | | - | | | | 4 | | | | - | |
| | | | |
Total loans outstanding | | | 22,021 | | | | 2,498 | | | | 21,471 | | | | 3,522 | |
| | | | |
ECL Stage 3 | | | -76 | | | | - | | | | -71 | | | | - | |
| | | | |
ECL Stage 1&2 | | | -74 | | | | -1 | | | | -98 | | | | -1 | |
| | | | |
Fair value adjustments | | | - | | | | - | | | | -1 | | | | - | |
| | | | |
Hedge accounting adjustments | | | 105 | | | | - | | | | 254 | | | | - | |
| | | | | |
Total | | | 21,975 | | | | 2,497 | | | | 21,555 | | | | 3,521 | |
Note 13: Tangible and intangible assets
| | | | | | | | |
| | | |
| In millions of euro | | INTANGIBLE ASSETS 2021 | | | INTANGIBLE ASSETS 2020 | |
| | |
Acquisition value at the beginning of the year | | | 31 | | | | 26 | |
| | |
Acquisitions during the year | | | 2 | | | | 5 | |
| | |
Sales/disposals during the year | | | - | | | | - | |
| | | |
Acquisition value at the end of the year | | | 32 | | | | 31 | |
| | |
| | | | | | | | |
| | | |
Accumulated amortisation at the beginning of the year | | | 19 | | | | 14 | |
| | | |
Amortisation for the year | | | 6 | | | | 5 | |
| | | |
Accumulated amortisation on sales/disposals during the year | | | - | | | | - | |
| | | |
Accumulated amortisation at the end of the year | | | 25 | | | | 19 | |
| | |
Net book value | | | 8 | | | | 12 | |
Intangible assets comprise of software development costs and right-of-use assets arising from leasing contracts.
| | |
| | |
FINANCIAL REPORT 2021 | | NIB FINANCIAL REPORT 2021 / 65 |
| | |
|
| |
| REPORT OF THE BOARD OF DIRECTORS |
| |
| PRESIDENT AND CEO’S COMMENTS |
| |
| OPERATING AND FINANCIAL REVIEW |
| |
| CAPITAL AND LIQUIDITY MANAGEMENT |
| |
| FINANCIAL STATEMENTS |
|
| STATEMENT OF COMPREHENSIVE INCOME |
|
| STATEMENT OF FINANCIAL POSITION |
|
| CHANGES IN EQUITY |
|
| CASH FLOW STATEMENT |
| |
| NOTES |
| |
| PROPOSAL BY THE BOARD OF DIRECTORS |
| |
| AUDITOR’S REPORT |
| |
| GOVERNANCE STATEMENT |
| |
| REPORT OF THE CONTROL COMMITTEE CHAIRMANSHIP |
| |
| REPORT OF THE CONTROL COMMITTEE |
| |
| |
| |
| |
| |
| |
| |
| |
| |
| |
| |
| |
| |
| |
| |
| |
| |
| |
|
| | | | | | | | | | | | |
| 2021 | | | | | | | | | |
| | | | |
| In millions of euro | | BUILDINGS | | | OFFICE EQUIPMENT
AND OTHER
TANGIBLE ASSETS | | | TOTAL | |
| | | |
Tangible assets | | | | | | | | | | | | |
| | | |
Acquisition value at the beginning of the year | | | 43 | | | | 30 | | | | 74 | |
| | | |
Acquisitions during the year | | | 1 | | | | 1 | | | | 2 | |
| | | |
Sales/disposals during the year | | | - | | | | - | | | | 0 | |
| | | |
Acquisition value at the end of the year | | | 45 | | | | 31 | | | | 75 | |
| | | |
| | | | | | | | | | | | | |
| | | |
Accumulated depreciation at the beginning of the year | | | 17 | | | | 19 | | | | 36 | |
| | | |
Depreciation for the year | | | 2 | | | | 1 | | | | 3 | |
| | | |
Accumulated depreciation on sales/disposals during the year | | | - | | | | - | | | | 0 | |
| | | |
Accumulated depreciation at the end of the year | | | 20 | | | | 20 | | | | 40 | |
| | | |
Net book value | | | 25 | | | | 11 | | | | 36 | |
On each closing date, the Bank’s assets are assessed to determine whether there is any indication of an asset’s impairment. As of 31 December 2021, there were no indications of impairment of the intangible or tangible assets.
| | | | | | | | | | | | |
2020 | | | | | | | | | |
| | | | |
| In millions of euro | | BUILDINGS | | | OFFICE EQUIPMENT
AND OTHER
TANGIBLE ASSETS | | | TOTAL | |
| | | |
Tangible assets | | | | | | | | | | | | |
| | | |
Acquisition value at the beginning of the year | | | 40 | | | | 30 | | | | 70 | |
| | | |
Acquisitions during the year | | | 4 | | | | 1 | | | | 5 | |
| | | |
Sales/disposals during the year | | | 0 | | | | 0 | | | | 0 | |
| | | |
Acquisition value at the end of the year | | | 43 | | | | 30 | | | | 74 | |
| | | |
| | | | | | | | | | | | | |
| | | |
Accumulated depreciation at the beginning of the year | | | 15 | | | | 19 | | | | 34 | |
| | | |
Depreciation for the year | | | 2 | | | | 1 | | | | 3 | |
| | | |
Accumulated depreciation on sales/disposals during the year | | | 0 | | | | 0 | | | | 0 | |
| | | |
Accumulated depreciation at the end of the year | | | 17 | | | | 19 | | | | 36 | |
| | | |
Net book value | | | 26 | | | | 11 | | | | 37 | |
| | |
| | |
FINANCIAL REPORT 2021 | | NIB FINANCIAL REPORT 2021 / 66 |
| | |
|
|
| REPORT OF THE BOARD OF DIRECTORS |
| |
| PRESIDENT AND CEO’S COMMENTS |
|
| OPERATING AND FINANCIAL REVIEW |
| |
| CAPITAL AND LIQUIDITY MANAGEMENT |
| |
| FINANCIAL STATEMENTS |
| |
| STATEMENT OF COMPREHENSIVE INCOME |
| |
| STATEMENT OF FINANCIAL POSITION |
| |
| CHANGES IN EQUITY |
| |
| CASH FLOW STATEMENT |
| |
| NOTES |
| |
| PROPOSAL BY THE BOARD OF DIRECTORS |
| |
| AUDITOR’S REPORT |
| |
| GOVERNANCE STATEMENT |
| |
| REPORT OF THE CONTROL COMMITTEE CHAIRMANSHIP |
| |
| REPORT OF THE CONTROL COMMITTEE |
| |
| |
| |
| |
| |
| |
| |
| |
| |
| |
| |
| |
| |
| |
| |
| |
| |
| |
| |
| |
| |
| |
| |
| |
| |
| |
| |
| |
Note 14: Depreciation
| | | | | | | | |
| | | |
| In thousands of euro | | 2021 | | | 2020 | |
| | |
Intangible assets (Note 13) | | | 6,111 | | | | 4,606 | |
| | |
Tangible assets (Note 13) | | | 3,434 | | | | 2,940 | |
| | |
Buildings | | | 2,443 | | | | 2,319 | |
| | |
Office equipment | | | 991 | | | | 620 | |
| | |
Total | | | 9,545 | | | | 7,546 | |
Note 15: Other assets
| | | | | | | | |
| | | |
| In millions of euro | | 2021 | | | 2020 | |
| | |
Interest rate swaps at floating rates | | | 9,335 | | | | 9,100 | |
| | |
Interest rate swaps at fixed rates | | | 21,226 | | | | 20,162 | |
| | |
Currency swaps at floating rates | | | 11,400 | | | | 10,925 | |
| | |
Currency swaps at fixed rates | | | 8,130 | | | | 6,732 | |
| | |
Total, nominal amount | | | 50,090 | | | | 46,919 | |
| | |
Netting of nominal amount per derivative | | | -49,274 | | | | -46,455 | |
| | |
Derivative receivables, net | | | 816 | | | | 463 | |
| | |
Adjustment to hedge accounting and changes in fair value of non-hedging derivatives | | | 439 | | | | 942 | |
| | |
Derivative instruments | | | 1,255 | | | | 1,406 | |
| | |
Other | | | 32 | | | | 20 | |
| | |
Total | | | 1,287 | | | | 1,425 | |
Derivatives are carried at fair value in the statement of financial position net per contract. Thus, swap contracts with a positive net fair value are recognised in the statement of financial position under “Other assets”, while swap contracts with a negative net fair value are recognised under “Other liabilities”.
The table below shows the net exposure of derivative instruments after collaterals at 31 December.
| | | | | | | | |
| | | |
| In millions of euro | | 2021 | | | 2020 | |
| | |
Derivative instruments in financial position | | | 1,255 | | | | 1,406 | |
| | |
Netting by counterparty | | | -602 | | | | -707 | |
| | |
Derivative instruments net per counterparty | | | 653 | | | | 699 | |
| | |
Accrued interest net per counterparty | | | 118 | | | | 107 | |
| | |
Net exposure before collaterals | | | 771 | | | | 806 | |
| | |
Collateral received | | | -722 | | | | -736 | |
| | |
Net exposure | | | 49 | | | | 70 | |
See also Risk Management, Credit Risk, Derivatives.
| | |
| | |
FINANCIAL REPORT 2021 | | NIB FINANCIAL REPORT 2021 / 67 |
|
| |
| REPORT OF THE BOARD OF DIRECTORS |
| |
| PRESIDENT AND CEO’S COMMENTS |
| |
| OPERATING AND FINANCIAL REVIEW |
| |
| CAPITAL AND LIQUIDITY MANAGEMENT |
| |
| FINANCIAL STATEMENTS |
|
| STATEMENT OF COMPREHENSIVE INCOME |
|
| STATEMENT OF FINANCIAL POSITION |
|
| CHANGES IN EQUITY |
|
| CASH FLOW STATEMENT |
| |
| NOTES |
| |
| PROPOSAL BY THE BOARD OF DIRECTORS |
| |
| AUDITOR’S REPORT |
| |
| GOVERNANCE STATEMENT |
| |
| REPORT OF THE CONTROL COMMITTEE CHAIRMANSHIP |
| |
| REPORT OF THE CONTROL COMMITTEE |
| |
| |
| |
| |
| |
| |
| |
| |
| |
| |
| |
| |
| |
| |
| |
| |
| |
| |
| |
| |
| |
| |
| |
| |
| |
| |
|
Note 16: Debts evidenced by certificates and related swaps
| | | | | | | | |
| | | |
| In millions of euro | | 2021 | | | 2020 | |
| | |
Opening balance | | | 29,072 | | | | 26,674 | |
| | |
New issues | | | 7,028 | | | | 7,540 | |
| | |
Amortisation | | | -4,764 | | | | -3,980 | |
| | |
Call and buybacks | | | -299 | | | | -164 | |
| | |
Foreign exchange movements | | | 1,222 | | | | -1,325 | |
| | |
Fair value adjustment on FVTPL debt | | | -8 | | | | 1 | |
| | |
Hedge accounting adjustments | | | -720 | | | | 323 | |
| | |
Other | | | -4 | | | | 1 | |
| | |
Closing balance | | | 31,526 | | | | 29,072 | |
| | | | | | | | | | | | | | | | | | | | | | | | |
At year-end, the Bank’s debt evidenced by certificates were distributed between the currencies shown in the table below. The table also demonstrates the distribution by currency on an after related swap nominal basis. | |
| | | | | | | | | SWAP CONTRACTS | | | | | | | |
| | | |
| | | DEBT | | | PAYABLE/RECEIVABLE | | | NET BALANCE | |
| | | | | | |
| In millions of euro | | 2021 | | | 2020 | | | 2021 | | | 2020 | | | 2021 | | | 2020 | |
| | | | | | |
Currency | | | | | | | | | | | | | | | | | | | | | | | | |
| | | | | | |
USD | | | 10,516 | | | | 9,637 | | | | 399 | | | | 1,364 | | | | 10,915 | | | | 11,001 | |
| | | | | | |
EUR | | | 6,338 | | | | 5,670 | | | | 7,250 | | | | 6,079 | | | | 13,588 | | | | 11,748 | |
| | | | | | |
GBP | | | 3,247 | | | | 3,165 | | | | -3,247 | | | | -3,165 | | | | - | | | | - | |
| | | | | | |
NOK | | | 3,650 | | | | 2,579 | | | | 122 | | | | 116 | | | | 3,772 | | | | 2,695 | |
| | | | | | |
AUD | | | 2,272 | | | | 1,772 | | | | -2,272 | | | | -1,772 | | | | - | | | | - | |
| | | | | | |
SEK | | | 2,935 | | | | 2,822 | | | | 64 | | | | 66 | | | | 3,000 | | | | 2,888 | |
| | | | | | |
NZD | | | 829 | | | | 1,134 | | | | -829 | | | | -1,134 | | | | - | | | | - | |
| | | | | | |
HKD | | | 535 | | | | 426 | | | | -535 | | | | -426 | | | | - | | | | - | |
| | | | | | |
TRY | | | 113 | | | | 173 | | | | -113 | | | | -173 | | | | - | | | | - | |
| | | | | | |
MXN | | | 115 | | | | 112 | | | | -115 | | | | -112 | | | | - | | | | - | |
| | | | | | |
BRL | | | 26 | | | | 45 | | | | -26 | | | | -45 | | | | - | | | | - | |
| | | | | | |
INR | | | 47 | | | | 65 | | | | -47 | | | | -65 | | | | - | | | | - | |
| | | | | | |
DKK | | | 134 | | | | 134 | | | | - | | | | - | | | | 134 | | | | 134 | |
| | | | | | |
JPY | | | 88 | | | | 93 | | | | -88 | | | | -93 | | | | - | | | | - | |
| | | | | | |
Other currencies | | | 325 | | | | 212 | | | | -325 | | | | -212 | | | | - | | | | - | |
| | | | | | |
Subtotal | | | 31,171 | | | | 28,039 | | | | 239 | | | | 427 | | | | 31,409 | | | | 28,467 | |
| | | | | | |
Fair value adjustments | | | 70 | | | | 78 | | | | -70 | | | | -81 | | | | 0 | | | | -3 | |
| | | | | | |
Hedge accounting adjustments | | | 222 | | | | 943 | | | | -224 | | | | -1,029 | | | | -2 | | | | -86 | |
| | | | | | |
Other | | | 63 | | | | 11 | | | | - | | | | -10 | | | | 63 | | | | 1 | |
| | | | | | |
Total | | | 31,526 | | | | 29,072 | | | | -55 | | | | -692 | | | | 31,471 | | | | 28,380 | |
| | |
| | |
FINANCIAL REPORT 2021 | | NIB FINANCIAL REPORT 2021 / 68 |
| | |
|
| |
| REPORT OF THE BOARD OF DIRECTORS |
| |
| PRESIDENT AND CEO’S COMMENTS |
| |
| OPERATING AND FINANCIAL REVIEW |
| |
| CAPITAL AND LIQUIDITY MANAGEMENT |
| |
| FINANCIAL STATEMENTS |
|
| STATEMENT OF COMPREHENSIVE INCOME |
|
| STATEMENT OF FINANCIAL POSITION |
|
| CHANGES IN EQUITY |
|
| CASH FLOW STATEMENT |
| |
| NOTES |
| |
| PROPOSAL BY THE BOARD OF DIRECTORS |
| |
| AUDITOR’S REPORT |
| |
| GOVERNANCE STATEMENT |
| |
| REPORT OF THE CONTROL COMMITTEE CHAIRMANSHIP |
| |
| REPORT OF THE CONTROL COMMITTEE |
| |
| |
| |
| |
| |
| |
| |
| |
| |
| |
| |
| |
| |
| |
| |
| |
| |
| |
| |
| |
| |
| |
| |
| |
| |
| |
|
Note 17: Other liabilities
| | | | | | | | |
| | | |
| In millions of euro | | 2021 | | | 2020 | |
| | |
Interest rate swaps at floating interest rates | | | 22,320 | | | | 21,658 | |
| | |
Interest rate swaps at fixed interest rates | | | 8,241 | | | | 7,604 | |
| | |
Currency swaps at floating interest rates | | | 17,871 | | | | 16,816 | |
| | |
Currency swaps at fixed rates | | | 1,660 | | | | 1,595 | |
| | |
Total, nominal amount | | | 50,092 | | | | 47,672 | |
| | |
Netting of nominal amount per derivative | | | -49,274 | | | | -46,455 | |
| | |
Derivative payables, net | | | 818 | | | | 1,217 | |
| | |
Adjustment to hedge accounting and changes in fair value of non-hedging derivatives | | | 235 | | | | 145 | |
| | |
Derivative instruments | | | 1,052 | | | | 1,362 | |
| | |
Other | | | 39 | | | | 228 | |
| | |
Total | | | 1,092 | | | | 1,590 | |
Derivatives are carried at fair value in the statement of financial position net per contract. Thus, swap contracts with a positive net fair value are recognised in the statement of financial position under “Other assets”, while swap contracts with a negative net fair value are recognised under “Other liabilities”.
DERIVATIVE INSTRUMENTS NET EXPOSURE AFTER COLLATERALS
| | | | | | | | |
| | | |
| In millions of euro | | 2021 | | | 2020 | |
| | |
Derivative instruments in financial position | | | 1,052 | | | | 1,362 | |
| | |
Netting by counterparty | | | -602 | | | | -707 | |
| | |
Derivative instruments net per counterparty | | | 450 | | | | 655 | |
| | |
Accrued interest net per counterparty | | | -45 | | | | -52 | |
| | |
Net exposure before collaterals | | | 406 | | | | 603 | |
| | |
Collateral given | | | -387 | | | | -593 | |
| | |
Net exposure | | | 19 | | | | 10 | |
See also Risk Management, Credit Risk, Derivatives.
| | |
| | |
FINANCIAL REPORT 2021 | | NIB FINANCIAL REPORT 2021 / 69 |
| | |
|
| |
| REPORT OF THE BOARD OF DIRECTORS |
| |
| PRESIDENT AND CEO’S COMMENTS |
| |
| OPERATING AND FINANCIAL REVIEW |
| |
| CAPITAL AND LIQUIDITY MANAGEMENT |
| |
| FINANCIAL STATEMENTS |
|
| STATEMENT OF COMPREHENSIVE INCOME |
|
| STATEMENT OF FINANCIAL POSITION |
|
| CHANGES IN EQUITY |
|
| CASH FLOW STATEMENT |
| |
| NOTES |
| |
| PROPOSAL BY THE BOARD OF DIRECTORS |
| |
| AUDITOR’S REPORT |
| |
| GOVERNANCE STATEMENT |
| |
| REPORT OF THE CONTROL COMMITTEE CHAIRMANSHIP |
| |
| REPORT OF THE CONTROL COMMITTEE |
| |
| |
| |
| |
| |
| |
| |
| |
| |
| |
| |
| |
| |
| |
| |
| |
| |
| |
| |
| |
| |
| |
| |
| |
| |
| |
|
Note 18: Capitalisation and reserves
The following table sets forth the capitalisation of NIB at 31 December.
| | | | | | | | |
| | | |
| In millions of euro | | OUTSTANDING AT
DECEMBER 31, 2021 | | | OUTSTANDING AT
DECEMBER 31, 2020 | |
| | |
Equity: | | | | | | | | |
| | |
Authorised and subscribed capital | | | 8,369 | | | | 8,369 | |
| | |
Of which callable capital | | | -7,523 | | | | -7,523 | |
| | |
Paid-in capital | | | 846 | | | | 846 | |
| | |
Statutory Reserve | | | 837 | | | | 686 | |
| | |
General Credit Risk Fund | | | 2,154 | | | | 2,140 | |
| | |
Hedging reserve | | | 6 | | | | 28 | |
| | |
Changes in own credit risk on liabilities at fair value | | | -3 | | | | -3 | |
| | |
Profit for the year | | | 159 | | | | 165 | |
| | |
Total Equity | | | 3,999 | | | | 3,861 | |
| | |
Debts evidenced by certificates | | | 31,526 | | | | 29,072 | |
| | |
Total Capitalisation | | | 35,525 | | | | 32,932 | |
The member countries’ portions of authorised capital are as follows:
| | | | | | | | | | | | | | | | |
| | | | | |
In millions
of euro | | 2021 | | | SHARE, IN % | | | 2020 | | | SHARE, IN % | |
| | | | |
Member country | | | | | | | | | | | | | | | | |
| | | | |
Denmark | | | 1,763 | | | | 21.1% | | | | 1,763 | | | | 21.1% | |
| | | | |
Estonia | | | 77 | | | | 0.9% | | | | 77 | | | | 0.9% | |
| | | | |
Finland | | | 1,483 | | | | 17.7% | | | | 1,483 | | | | 17.7% | |
| | | | |
Iceland | | | 79 | | | | 0.9% | | | | 79 | | | | 0.9% | |
| | | | |
Latvia | | | 112 | | | | 1.3% | | | | 112 | | | | 1.3% | |
| | | | |
Lithuania | | | 163 | | | | 2.0% | | | | 163 | | | | 2.0% | |
| | | | |
Norway | | | 1,800 | | | | 21.5% | | | | 1,800 | | | | 21.5% | |
| | | | |
Sweden | | | 2,893 | | | | 34.6% | | | | 2,893 | | | | 34.6% | |
| | | | |
Total | | | 8,369 | | | | 100.0% | | | | 8,369 | | | | 100.0% | |
The member countries’ portions of paid-in capital are as follows:
| | | | | | | | | | | | | | | | |
| | | | | |
In
millions of
euro | | 2021 | | | SHARE, IN % | | | 2020 | | | SHARE, IN % | |
| | | | |
| Member country | | | | | | | | | | | | | | | | |
| | | | |
| Denmark | | | 178 | | | | 21.1% | | | | 178 | | | | 21.1% | |
| | | | |
| Estonia | | | 8 | | | | 0.9% | | | | 8 | | | | 0.9% | |
| | | | |
| Finland | | | 150 | | | | 17.7% | | | | 150 | | | | 17.7% | |
| | | | |
| Iceland | | | 8 | | | | 0.9% | | | | 8 | | | | 0.9% | |
| | | | |
| Latvia | | | 11 | | | | 1.3% | | | | 11 | | | | 1.3% | |
| | | | |
| Lithuania | | | 17 | | | | 2.0% | | | | 17 | | | | 2.0% | |
| | | | |
| Norway | | | 182 | | | | 21.5% | | | | 182 | | | | 21.5% | |
| | | | |
| Sweden | | | 293 | | | | 34.6% | | | | 293 | | | | 34.6% | |
| | | | |
| Total | | | 846 | | | | 100.0% | | | | 846 | | | | 100.0% | |
| | |
| | |
FINANCIAL REPORT 2021 | | NIB FINANCIAL REPORT 2021 / 70 |
| | |
|
| |
| REPORT OF THE BOARD OF DIRECTORS |
| |
| PRESIDENT AND CEO’S COMMENTS |
| |
| OPERATING AND FINANCIAL REVIEW |
| |
| CAPITAL AND LIQUIDITY MANAGEMENT |
| |
| FINANCIAL STATEMENTS |
| |
| STATEMENT OF COMPREHENSIVE INCOME |
| |
| STATEMENT OF FINANCIAL POSITION |
| |
| CHANGES IN EQUITY |
| |
CASH FLOW STATEMENT |
| |
| NOTES |
| |
PROPOSAL BY THE BOARD OF DIRECTORS |
| |
| AUDITOR’S REPORT |
| |
| GOVERNANCE STATEMENT |
| |
| REPORT OF THE CONTROL COMMITTEE CHAIRMANSHIP |
| |
| REPORT OF THE CONTROL COMMITTEE |
| |
| |
| |
| |
| |
| |
| |
| |
| |
| |
| |
| |
| |
| |
| |
| |
| |
| |
| |
| |
| |
| |
| |
| |
| |
| |
| |
| |
AUTHORISED CAPITAL STOCK
The Board of Governors can, upon a proposal by the Board of Directors of NIB, decide upon an increase in the authorised capital stock of the Bank. To become effective, such a decision usually requires the approval of the parliaments of the Member countries.
The authorised capital stock of the Bank, which initially was approximately EUR 510 million, has been increased several times. most recently in 2020, when the Bank updated its Statutes. The Bank previously had two main categories of lending: ordinary lending and lending under Special Programs. Lending under special programs comprised Project Investment Loans (PIL) and Environmental Investment Loans (MIL). Under the new statutes that came into force during 2020 these special programs were discontinued. The outstanding amounts under the PIL and MIL facilities became part of NIB’s ordinary lending. The Owner countries’ guarantees related to the PIL loans of 1,800 million has been converted to callable capital and the equity reserve allocated to PIL has been converted to paid-in-capital. As a result the authorised capital of the bank amounts to EUR 8,369 million. The split of NIB’s authorised capital into paid-in capital and callable capital is discussed below under “Paid-in Capital and Callable Capital.”
As stipulated in NIB’s Statutes, any increase of the authorised capital stock is allocated among the Member countries based upon their gross national income (GNI) at market prices as determined from time to time by the Board of Governors. From the establishment of NIB in 1975 until the Baltic countries joined NIB on January 1, 2005, gross national income (GNI) was calculated at factor prices for the Nordic countries as an average of the data from the two most recent years available. Since January 1, 2005 the source for the GNI statistics has been the International Monetary Fund’s International Financial Statistics publication. Allocations of new subscribed capital among the Member countries were fixed at the time of each increase and no adjustments or equalisation payments were made with respect to capital already subscribed. Accordingly, and because the GNI among the Member countries has varied over the years, the authorised and paid-in portions of the Member countries’ capital have not been the same. In 2016, the Bank’s Board of Governors decided to adjust and align NIB’s authorised capital so that each Member country’s share in percentage of paid-in capital and callable capital would equal its share of the authorised capital. Following the completion of the approval process in each Member country, the changes have entered into force and have been implemented.
PAID-IN CAPITAL AND CALLABLE CAPITAL
The Statutes provide that NIB’s authorised capital stock shall consist of a paid-in portion and a callable portion. Of NIB’s total authorised capital stock of currently EUR 8,369 million, the paid-in portion amounts to EUR 846 million, which corresponds to approximately 10% of the total authorised capital stock of the Bank. All subscribed capital not paid in is subject to call by the Board of Directors of NIB to the extent that the Board deems it necessary for the fulfilment of the Bank’s debt obligations. The Statutes do not require that calls be made pro rata, but it is anticipated that, in the first instance, calls would be made in that manner. Failure by any Member country to make payment on any such call would not excuse any other Member country from its obligation to make payment. No Member country can legally be required on any such call to pay more than the unpaid balance of the callable portion of its subscribed capital. To date no such calls have been made.
In view of NIB’s mission as an institution for regional cooperation, there are no provisions in the 2004 Agreement for admitting additional countries. While a Member country may withdraw by giving notice in accordance with the provisions set forth in the 2004 Agreement, the 2004 Agreement also provides that a withdrawing country must remain liable for those commitments of NIB that were in force at the time of the withdrawal to the same extent as immediately prior to such withdrawal.
RESERVES
Under the Statutes, NIB’s annual net profits are to be transferred to a statutory reserve (the “Statutory Reserve”) until such reserve equals at least 10% of the authorised capital stock of the Bank. Thereafter, the Board of Governors, acting upon the proposal of the Board of Directors of NIB, will determine the allocation of net profits between further transfers to the Statutory Reserve, General Credit Risk Fund and the payment of dividends to the Member countries.
At 31 December 2021, the Statutory Reserve of NIB amounted to EUR 837 million or 10% of the Bank’s authorised capital. NIB has annually allocated a portion of the respective year’s profit as a general credit risk reserve (the “General Credit Risk Fund”) for unidentified risks in the Bank’s operations. At 31 December 2021, the General Credit Risk Fund amounted to EUR 2,154 million. The General Credit Risk Fund is available to cover losses arising from NIB’s lending portfolio as well as other risks NIB assumes in its business activities, such as the activities of its treasury department. The risks covered with respect to the treasury activities include market risks as well as counterparty risks. For further information in this regard, please see Note 2: Risk management.
| | |
| | |
FINANCIAL REPORT 2021 | | NIB FINANCIAL REPORT 2021 / 71 |
| | |
|
| |
| REPORT OF THE BOARD OF DIRECTORS |
| |
| PRESIDENT AND CEO’S COMMENTS |
| |
| OPERATING AND FINANCIAL REVIEW |
| |
| CAPITAL AND LIQUIDITY MANAGEMENT |
| |
| FINANCIAL STATEMENTS |
| |
| STATEMENT OF COMPREHENSIVE INCOME |
| |
| STATEMENT OF FINANCIAL POSITION |
| |
| CHANGES IN EQUITY |
| |
CASH FLOW STATEMENT |
| |
| NOTES |
| |
PROPOSAL BY THE BOARD OF DIRECTORS |
| AUDITOR’S REPORT |
| |
| GOVERNANCE STATEMENT |
| |
| REPORT OF THE CONTROL COMMITTEE CHAIRMANSHIP |
| |
| REPORT OF THE CONTROL COMMITTEE |
| |
| |
| |
| |
| |
| |
| |
| |
| |
| |
| |
| |
| |
| |
| |
| |
| |
|
Note 19: Collateral and commitments
| | | | | | | | |
| In millions of euro | | 2021 | | | 2020 | |
Loans agreed but not yet disbursed (Note 12) | | | 2,837 | | | | 3,522 | |
Borrowing commitments | | | - | | | | - | |
Callable commitments in financial placements | | | 2 | | | | 2 | |
Collateral received for collateralised placements 2 3 | | | 2,166 | | | | 2,074 | |
Collateral given for collateralised
placements 1 4 | | | - | | | | - | |
Gross collateral with respect to derivatives exposure | | | | | | | | |
Collateral received 2 5 | | | 748 | | | | 723 | |
Collateral given 1 4 | | | 400 | | | | 523 | |
1 Book value. 2 Fair value. 3 Including cash of EUR 4 (2) million and securities of EUR 2,162 (2,072) million received.
4 Cash collateral. 5 Including cash of EUR 748 (723) million and securities of EUR 0 (0) million received.
NIB AS LESSEE
At 31 December, the future minimum lease payments under non-cancellable leases were as follows;
| | | | | | | | |
| In thousands of euro | | 2021 | | | 2020 | |
Within one year | | | 1,027 | | | | 1,074 | |
Later than one but not two years | | | 851 | | | | 874 | |
Later than two but not three years | | | 656 | | | | 654 | |
Later than three but not four years | | | 326 | | | | 651 | |
Later than four but not five years | | | - | | | | 325 | |
Total | | | 2,860 | | | | 3,578 | |
NIB AS LESSOR
At 31 December, the future minimum lease receipts under non-cancellable leases were as follows;
| | | | | | | | |
| In thousands of euro | | 2021 | | | 2020 | |
Within one year | | | 675 | | | | 633 | |
Later than one but not two years | | | 461 | | | | 421 | |
Later than two but not three years | | | 461 | | | | 421 | |
Later than three but not four years | | | 230 | | | | 421 | |
Later than four but not five years | | | - | | | | 210 | |
Total | | | 1,828 | | | | 2,105 | |
The Bank sub-lets office space to related parties as described in Note 25.
| | |
| | |
FINANCIAL REPORT 2021 | | NIB FINANCIAL REPORT 2021 / 72 |
| | |
|
|
| REPORT OF THE BOARD OF DIRECTORS |
| |
| PRESIDENT AND CEO’S COMMENTS |
|
| OPERATING AND FINANCIAL REVIEW |
| |
| CAPITAL AND LIQUIDITY MANAGEMENT |
| |
| FINANCIAL STATEMENTS |
| |
| STATEMENT OF COMPREHENSIVE INCOME |
| |
| STATEMENT OF FINANCIAL POSITION |
| |
| CHANGES IN EQUITY |
| |
CASH FLOW STATEMENT |
| |
| NOTES |
| |
PROPOSAL BY THE BOARD OF DIRECTORS |
| |
| AUDITOR’S REPORT |
| |
| GOVERNANCE STATEMENT |
| |
| REPORT OF THE CONTROL COMMITTEE CHAIRMANSHIP |
| |
| REPORT OF THE CONTROL COMMITTEE |
| |
| |
| |
| |
| |
| |
| |
| |
| |
| |
| |
| |
| |
| |
| |
| |
| |
|
Note 20: Fair value of financial instruments
CLASSIFICATION OF FINANCIAL INSTRUMENTS
| | | | | | | | | | | | | | | | |
| In millions of euro | | AMORTISED COST (AC) | | | FAIR VALUE THROUGH PROFIT AND LOSS (FVTPL) | | | DERIVATIVES FOR HEDGING | | | TOTAL | |
Financial assets | | | | | | | | | | | | | | | | |
Cash and cash equivalents | | | 1,122 | | | | 704 | | | | - | | | | 1,826 | |
Financial placements with credit institutions | | | 589 | | | | 3,292 | | | | - | | | | 3,881 | |
Debt securities | | | 1,950 | | | | 6,342 | | | | - | | | | 8,291 | |
Other financial placements | | | - | | | | 9 | | | | - | | | | 9 | |
Loans outstanding | | | 21,966 | | | | 10 | | | | - | | | | 21,975 | |
Derivatives | | | - | | | | 606 | | | | 649 | | | | 1,255 | |
Total 31 December 2021 | | | 25,626 | | | | 10,963 | | | | 649 | | | | 37,237 | |
| | | | | | | | | | | | | | | | | |
Financial liabilities | | | | | | | | | | | | | | | | |
Short-term amounts owed to credit institutions | | | 752 | | | | - | | | | - | | | | 752 | |
Long-term amounts owed to credit institutions | | | - | | | | - | | | | - | | | | 0 | |
Debt evidenced by certificates | | | 31,053 | | | | 473 | | | | - | | | | 31,526 | |
Derivatives | | | - | | | | 194 | | | | 859 | | | | 1,052 | |
Total 31 December 2021 | | | 31,805 | | | | 667 | | | | 859 | | | | 33,330 | |
| | | | |
| | | | | | | | | | | | | | | | |
| In millions of euro | | AMORTISED COST (AC) | | | FAIR VALUE
THROUGH PROFIT AND LOSS
(FVTPL) | | | DERIVATIVES FOR HEDGING | | | TOTAL | |
Financial assets | | | | | | | | | | | | | | | | |
Cash and cash equivalents | | | 1,372 | | | | 898 | | | | - | | | | 2,270 | |
Financial placements with credit institutions | | | 7 | | | | 1,961 | | | | - | | | | 1,969 | |
Debt securities | | | 1,880 | | | | 6,032 | | | | - | | | | 7,912 | |
Other financial placements | | | - | | | | 9 | | | | - | | | | 9 | |
Loans outstanding | | | 21,540 | | | | 15 | | | | - | | | | 21,555 | |
Derivatives | | | - | | | | 451 | | | | 954 | | | | 1,406 | |
Total 31 December 2020 | | | 24,800 | | | | 9,367 | | | | 954 | | | | 35,121 | |
| | | | | | | | | | | | | | | | | |
Financial liabilities | | | | | | | | | | | | | | | | |
Short-term amounts owed to credit institutions | | | 724 | | | | - | | | | - | | | | 724 | |
Long-term amounts owed to credit institutions | | | - | | | | - | | | | - | | | | - | |
Debt evidenced by certificates | | | 28,613 | | | | 459 | | | | - | | | | 29,072 | |
Derivatives | | | - | | | | 651 | | | | 711 | | | | 1,362 | |
Total 31 December 2020 | | | 29,336 | | | | 1,110 | | | | 711 | | | | 31,158 | |
| | |
| | |
FINANCIAL REPORT 2021 | | NIB FINANCIAL REPORT 2021 / 73 |
| | |
|
|
| REPORT OF THE BOARD OF DIRECTORS |
| |
| PRESIDENT AND CEO’S COMMENTS |
|
| OPERATING AND FINANCIAL REVIEW |
| |
| CAPITAL AND LIQUIDITY MANAGEMENT |
| |
| FINANCIAL STATEMENTS |
| |
| STATEMENT OF COMPREHENSIVE INCOME |
| |
| STATEMENT OF FINANCIAL POSITION |
| |
| CHANGES IN EQUITY |
| |
CASH FLOW STATEMENT |
| |
| NOTES |
| |
PROPOSAL BY THE BOARD OF DIRECTORS |
| |
| AUDITOR’S REPORT |
| |
| GOVERNANCE STATEMENT |
| |
| REPORT OF THE CONTROL COMMITTEE CHAIRMANSHIP |
| |
| REPORT OF THE CONTROL COMMITTEE |
| |
| |
| |
| |
| |
| |
| |
| |
| |
| |
| |
| |
| |
| |
| |
| |
| |
| |
FAIR VALUATION OF FINANCIAL INSTRUMENTS
| | | | | | | | | | | | | | | | |
| | | 2021 | | | 2020 | |
| In millions of euro | | CARRYING AMOUNT | | | FAIR VALUE | | | CARRYING AMOUNT | | | FAIR VALUE | |
Financial Assets | | | | | | | | | | | | | | | | |
Cash and cash equivalents | | | 1,826 | | | | 1,826 | | | | 2,270 | | | | 2,270 | |
Financial placements with credit institutions | | | 3,881 | | | | 3,881 | | | | 1,969 | | | | 1,969 | |
Debt securities | | | 8,291 | | | | 8,323 | | | | 7,912 | | | | 7,976 | |
Other financial placements | | | 9 | | | | 9 | | | | 9 | | | | 9 | |
Loans outstanding | | | 21,975 | | | | 22,245 | | | | 21,555 | | | | 21,848 | |
Derivatives | | | 1,255 | | | | 1,255 | | | | 1,406 | | | | 1,406 | |
Total | | | 37,237 | | | | 37,539 | | | | 35,121 | | | | 35,478 | |
Financial Liabilities | | | | | | | | | | | | | | | | |
Short-term amounts owed to credit institutions | | | 752 | | | | 752 | | | | 724 | | | | 724 | |
Long-term amounts owed to credit institutions | | | - | | | | - | | | | - | | | | - | |
Debt evidenced by certificates | | | 31,526 | | | | 31,570 | | | | 29,072 | | | | 29,137 | |
Derivatives | | | 1,052 | | | | 1,052 | | | | 1,362 | | | | 1,362 | |
Total | | | 33,330 | | | | 33,374 | | | | 31,158 | | | | 31,223 | |
| | |
| | |
FINANCIAL REPORT 2021 | | NIB FINANCIAL REPORT 2021 / 74 |
| | |
|
|
| REPORT OF THE BOARD OF DIRECTORS |
| |
| PRESIDENT AND CEO’S COMMENTS |
|
| OPERATING AND FINANCIAL REVIEW |
| |
| CAPITAL AND LIQUIDITY MANAGEMENT |
| |
| FINANCIAL STATEMENTS |
| |
| STATEMENT OF COMPREHENSIVE INCOME |
| |
| STATEMENT OF FINANCIAL POSITION |
| |
| CHANGES IN EQUITY |
| |
CASH FLOW STATEMENT |
| |
| NOTES |
| |
PROPOSAL BY THE BOARD OF DIRECTORS |
| |
| AUDITOR’S REPORT |
| |
| GOVERNANCE STATEMENT |
| |
| REPORT OF THE CONTROL COMMITTEE CHAIRMANSHIP |
| |
| REPORT OF THE CONTROL COMMITTEE |
| |
| |
| |
| |
| |
| |
| |
| |
| |
| |
| |
| |
| |
| |
| |
| |
| |
| |
| |
| |
| |
| |
| |
| |
| |
| |
| |
| |
LEVEL OF FAIR VALUE MEASUREMENT FOR FINANCIAL INSTRUMENTS AT THE END OF THE YEAR
The table below analyses financial instruments’ fair value at the end of the year by the level in the fair value hierarchy into which the fair value measurement is categorised.
See Accounting policies, Determination of fair value.
| | | | | | | | | | | | | | | | | | | | | | | | |
| | | |
| | | 2021 | | | 2020 | |
| | | | | | |
| In millions of euro | | LEVEL 1 | | | LEVEL 2 | | | LEVEL 3 | | | LEVEL 1 | | | LEVEL 2 | | | LEVEL 3 | |
| | | | | | |
Financial Assets | | | | | | | | | | | | | | | | | | | | | | | | |
| | | | | | |
Cash and cash equivalents | | | 1,826 | | | | - | | | | - | | | | 2,270 | | | | - | | | | - | |
| | | | | | |
Financial placements with credit institutions | | | - | | | | 3,881 | | | | - | | | | - | | | | 1,969 | | | | - | |
| | | | | | |
Debt securities | | | 8,311 | | | | - | | | | 12 | | | | 7,959 | | | | - | | | | 17 | |
| | | | | | |
Other financial placements | | | - | | | | - | | | | 9 | | | | - | | | | - | | | | 9 | |
| | | | | | |
Loans outstanding | | | - | | | | 22,236 | | | | 10 | | | | - | | | | 21,834 | | | | 15 | |
| | | | | | |
Derivatives | | | - | | | | 1,211 | | | | 44 | | | | - | | | | 1,337 | | | | 69 | |
| | | | | | |
Total | | | 10,138 | | | | 27,328 | | | | 73 | | | | 10,230 | | | | 25,140 | | | | 109 | |
| | | | | | |
Financial Liabilities | | | | | | | | | | | | | | | | | | | | | | | | |
| | | | | | |
Short-term amounts owed to credit institutions | | | - | | | | 752 | | | | - | | | | - | | | | 724 | | | | - | |
| | | | | | |
Long-term amounts owed to credit institutions | | | - | | | | - | | | | - | | | | - | | | | - | | | | - | |
| | | | | | |
Repurchase agreements | | | - | | | | - | | | | - | | | | - | | | | - | | | | - | |
| | | | | | |
Debt evidenced by certificates | | | - | | | | 30,955 | | | | 615 | | | | - | | | | 28,452 | | | | 685 | |
| | | | | | |
Derivatives | | | - | | | | 659 | | | | 393 | | | | - | | | | 1,081 | | | | 281 | |
| | | | | | |
Total | | | 0 | | | | 32,365 | | | | 1,009 | | | | - | | | | 30,257 | | | | 966 | |
At 31 December 2021, recorded Credit Valuation Adjustment (CVA) amounted to EUR -1.9 million, while Debit Valuation Adjustment (DVA) was EUR 0.5 million. At 31 December 2020, recorded CVA amounted to EUR -2 million, while DVA was EUR 0 million. Receivables from defaulted treasury counterparties are measured at fair value. Receivables from defaulted lending counterparties are measured at cost minus impairment.
| | |
| | |
FINANCIAL REPORT 2021 | | NIB FINANCIAL REPORT 2021 / 75 |
| | |
|
|
| REPORT OF THE BOARD OF DIRECTORS |
| |
| PRESIDENT AND CEO’S COMMENTS |
|
| OPERATING AND FINANCIAL REVIEW |
| |
| CAPITAL AND LIQUIDITY MANAGEMENT |
| |
| FINANCIAL STATEMENTS |
| |
| STATEMENT OF COMPREHENSIVE INCOME |
| |
| STATEMENT OF FINANCIAL POSITION |
| |
| CHANGES IN EQUITY |
| |
CASH FLOW STATEMENT |
| |
| NOTES |
| |
PROPOSAL BY THE BOARD OF DIRECTORS |
| |
| AUDITOR’S REPORT |
| |
| GOVERNANCE STATEMENT |
| |
| REPORT OF THE CONTROL COMMITTEE CHAIRMANSHIP |
| |
| REPORT OF THE CONTROL COMMITTEE |
| |
| |
| |
| |
| |
| |
| |
| |
| |
| |
| |
| |
| |
| |
| |
| |
| |
| |
| |
| |
| |
| |
| |
| |
| |
| |
| |
| |
CHANGES IN FAIR VALUES CATEGORISED IN LEVEL 3
| | | | | | | | | | | | | | | | | | | | | | | | | | | | | | | | | | | | |
| | | | |
| | | FINANCIAL ASSETS | | | | | | FINANCIAL LIABILITIES | |
| | | | | | | | | |
| In millions of euro | | DEBT SECURITIES | | | OTHER FINANCIAL
PLACEMENTS | | | LOANS
OUTSTANDING | | | DERIVATIVE
ASSETS | | | LEVEL 3
TOTAL ASSETS | | | | | | DEBT EVIDENCED BY CERTIFICATES | | | DERIVATIVE
LIABILITIES | | | LEVEL 3
TOTAL LIABILITIES | |
| | | | | | | | | |
31 DECEMBER 2019 | | | 21 | | | | 8 | | | | 27 | | | | 64 | | | | 119 | | | | | | | | 1,200 | | | | 294 | | | | 1,494 | |
| | | | | | | | | |
Financial instruments reclassified to level 3 | | | - | | | | - | | | | - | | | | - | | | | 0 | | | | | | | | - | | | | 32 | | | | 32 | |
| | | | | | | | | |
New trades | | | - | | | | - | | | | - | | | | 1 | | | | 1 | | | | | | | | 101 | | | | 1 | | | | 102 | |
| | | | | | | | | |
Matured transactions, buy backs and calls | | | - | | | | -5 | | | | - | | | | -10 | | | | -16 | | | | | | | | -468 | | | | -115 | | | | -583 | |
| | | | | | | | | |
Amortisation | | | -3 | | | | - | | | | -5 | | | | -15 | | | | -22 | | | | | | | | - | | | | -14 | | | | -14 | |
| | | | | | | | | |
Capitalisations | | | - | | | | - | | | | - | | | | 34 | | | | 34 | | | | | | | | - | | | | 35 | | | | 35 | |
| | | | | | | | | |
Sold transactions | | | - | | | | - | | | | - | | | | - | | | | 0 | | | | | | | | - | | | | - | | | | 0 | |
| | | | | | | | | |
Inflation adjustments | | | - | | | | - | | | | 2 | | | | 4 | | | | 6 | | | | | | | | 6 | | | | - | | | | 6 | |
| | | | | | | | | |
Changes in fair values | | | -1 | | | | 7 | | | | 1 | | | | 2 | | | | 7 | | | | | | | | -2 | | | | -1 | | | | -3 | |
| | | | | | | | | |
Exchange rate adjustments | | | - | | | | - | | | | -10 | | | | -10 | | | | -20 | | | | | | | | -153 | | | | 49 | | | | -103 | |
| | | | | | | | | |
31 DECEMBER 2020 | | | 17 | | | | 9 | | | | 15 | | | | 69 | | | | 109 | | | | | | | | 685 | | | | 281 | | | | 966 | |
| | | | | | | | | |
Financial instruments reclassified to level 3 | | | | | | | | | | | | | | | | | | | | | | | | | | | | | | | | | | | | |
| | | | | | | | | |
New trades | | | - | | | | - | | | | - | | | | - | | | | 0 | | | | | | | | 53 | | | | - | | | | 53 | |
| | | | | | | | | |
Matured transactions, buy backs and calls | | | - | | | | - | | | | - | | | | - | | | | 0 | | | | | | | | -49 | | | | -12 | | | | -61 | |
| | | | | | | | | |
Amortisation | | | -5 | | | | - | | | | -4 | | | | -14 | | | | -23 | | | | | | | | -54 | | | | - | | | | -54 | |
| | | | | | | | | |
Capitalisations | | | - | | | | - | | | | - | | | | 1 | | | | 1 | | | | | | | | 2 | | | | 31 | | | | 34 | |
| | | | | | | | | |
Sold transactions | | | - | | | | - | | | | - | | | | - | | | | 0 | | | | | | | | - | | | | - | | | | 0 | |
| | | | | | | | | |
Inflation adjustments | | | - | | | | - | | | | 2 | | | | -7 | | | | -5 | | | | | | | | -7 | | | | -2 | | | | -8 | |
| | | | | | | | | |
Changes in fair values | | | - | | | | - | | | | - | | | | -5 | | | | -4 | | | | | | | | 8 | | | | - | | | | 8 | |
| | | | | | | | | |
Exchange rate adjustments | | | - | | | | - | | | | -3 | | | | -1 | | | | -4 | | | | | | | | -22 | | | | 95 | | | | 73 | |
| | | | | | | | | |
31 DECEMBER 2021 | | | 12 | | | | 9 | | | | 10 | | | | 44 | | | | 73 | | | | | | | | 615 | | | | 393 | | | | 1,009 | |
The debt securities classified as level 3 consist of debt securities that are not traded actively and the valuations are based on external market quotes, which management have applied an overlay to reduce the fair value recorded. The other financial placements consist of Mezzanine placements the valuation of which is obtained from the external fund administrators. The loans outstanding, derivative assets, issued securities and derivative liabilities consist of complex structured products and instruments denominated in currencies which have limited liquidity, the exchange rate of which are acquired from a leading market data provider. These structured products and illquid products are swapped back to back.
Level 3 derivatives fall into two categories based on the underlying instrument and pricing model:
- Structured interest rate swaps,
- Cross currency and foreign exchange linked swaps.
| | |
| | |
FINANCIAL REPORT 2021 | | NIB FINANCIAL REPORT 2021 / 76 |
| | |
|
| |
| REPORT OF THE BOARD OF DIRECTORS |
| |
| PRESIDENT AND CEO’S COMMENTS |
| |
| OPERATING AND FINANCIAL REVIEW |
| |
| CAPITAL AND LIQUIDITY MANAGEMENT |
| |
| FINANCIAL STATEMENTS |
| |
| STATEMENT OF COMPREHENSIVE INCOME |
| |
| STATEMENT OF FINANCIAL POSITION |
| |
| CHANGES IN EQUITY |
| |
| CASH FLOW STATEMENT |
| |
| NOTES |
| |
| PROPOSAL BY THE BOARD OF DIRECTORS |
| |
| AUDITOR’S REPORT |
| |
| GOVERNANCE STATEMENT |
| |
| REPORT OF THE CONTROL COMMITTEE CHAIRMANSHIP |
| |
| REPORT OF THE CONTROL COMMITTEE |
| |
| |
| |
| |
| |
| |
| |
| |
| |
| |
| |
| |
| |
| |
| |
| |
|
Structured interest rate swaps are priced using Hull-White 1 factor model if there is only one underlying interest rate index and Hull-White 2-factor model if there is more than one underlying interest rate index. The models are calibrated to swaption volatilities. Cross currency and foreign exchange linked instruments are valued using Hull-White 1 factor model for interest rate modelling and Black-Scholes model for foreign exchange rates. The model is calibrated to interest rates, swaption volatilities, foreign exchange rates, foreign exchange rate volatilities and correlations between foreign exchange and interest rates.
The table below shows the sensitivity of the Level 3 swap transactions fair value to percentage changes in the level of interest rate and foreign exchange volatility surfaces. For example, if volatility is increased by 25% the impact on the total fair value of Structured interest rate swaps is EUR 3.5 million and if it is decreased by 25% the impact is EUR -3.0 million. Corresponding sensitivities for Cross-currency and FX-linked swaps are EUR -0.4 million and EUR 0.2 million.
| | | | | | | | | | | | | | | | | | | | | | | | | | | | |
Percentage change in
Bermudan/FX volatility | | -75% | | | -50% | | | -25% | | | 25% | | | 50% | | | 75% | | | 100% | |
Structured interest rate swaps in millions of euro | | | -8.0 | | | | -5.6 | | | | -3.0 | | | | 3.5 | | | | 7.7 | | | | 12.5 | | | | 17.9 | |
Cross-currency and FX-linked swaps in millions of euro | | | 0.2 | | | | 0.2 | | | | 0.2 | | | | -0.4 | | | | -0.8 | | | | -1.4 | | | | -2.0 | |
| | |
| | |
FINANCIAL REPORT 2021 | | NIB FINANCIAL REPORT 2021 / 77 |
| | |
|
| |
REPORT OF THE BOARD OF DIRECTORS |
| |
PRESIDENT AND CEO’S COMMENTS |
| |
OPERATING AND FINANCIAL REVIEW |
| |
CAPITAL AND LIQUIDITY MANAGEMENT |
| |
FINANCIAL STATEMENTS |
| |
STATEMENT OF COMPREHENSIVE INCOME |
| |
STATEMENT OF FINANCIAL POSITION |
| |
CHANGES IN EQUITY |
| |
CASH FLOW STATEMENT |
| |
NOTES |
| |
PROPOSAL BY THE BOARD OF DIRECTORS |
| |
AUDITOR’S REPORT |
| |
GOVERNANCE STATEMENT |
| |
REPORT OF THE CONTROL COMMITTEE CHAIRMANSHIP |
| |
REPORT OF THE CONTROL COMMITTEE |
|
|
|
|
|
|
|
|
|
|
Note 21: Maturity profile of financial assets and liabilities
The table below sets out a maturity analysis for financial assets and liabilities containing principal and interest flows. For loans outstanding, undiscounted cash flows are presented until contractual final maturity. For borrowing outstanding and derivatives with call options, cash flows are presented until the first possible termination date. Cash flows are presented on net basis for interest rate swaps and on gross basis for all other swaps. Interest cash flows are projected based on the interest rates prevailing on the closing date. See also Notes 15 and 17, and Risk management, Liquidity Risk.
| | | | | | | | | | | | | | | | | | | | | | | | | | | | |
2021 | | | | | | | | | | | | | | | | | | | | | | | | | | | | |
| | | | | | | | |
| In millions of euro | | CARRYING AMOUNT | | | CONTRACTUAL
CASH FLOWS | | | UP TO AND INCLUDING 3 MONTH | | | OVER 3 MONTHS AND
UP TO AND INCLUDING
6 MONTHS | | | OVER 6 MONTHS AND
UP TO AND INCLUDING
1 YEAR | | | OVER 1 YEAR AND UP
TO AND INCLUDING
5 YEARS | | | OVER 5 YEARS | |
Assets | | | | | | | | | | | | | | | | | | | | | | | | | | | | |
Cash and cash equivalents | | | 1,826 | | | | 1,626 | | | | 1,626 | | | | - | | | | - | | | | - | | | | - | |
Financial placements | | | | | | | | | | | | | | | | | | | | | | | | | | | | |
Placements with credit institutions | | | 3,871 | | | | 4,063 | | | | 3,599 | | | | 464 | | | | - | | | | - | | | | - | |
Debt securities | | | 8,291 | | | | 8,412 | | | | 403 | | | | 304 | | | | 962 | | | | 5,859 | | | | 884 | |
Other | | | 9 | | | | 7 | | | | 0 | | | | 0 | | | | 0 | | | | 0 | | | | 7 | |
Loans outstanding | | | 21,975 | | | | 23,071 | | | | 339 | | | | 714 | | | | 1,311 | | | | 10,491 | | | | 10,216 | |
Other assets | | | | | | | | | | | | | | | | | | | | | | | | | | | | |
Derivative receivables | | | 13,436 | | | | 16,007 | | | | 2,863 | | | | 762 | | | | 1,414 | | | | 9,491 | | | | 1,477 | |
Derivative payables | | | -12,181 | | | | -14,119 | | | | -2,635 | | | | -675 | | | | -1,186 | | | | -8,478 | | | | -1,146 | |
Assets, total | | | 37,228 | | | | 39,067 | | | | 6,194 | | | | 1,570 | | | | 2,502 | | | | 17,363 | | | | 11,438 | |
| | | | | | | | | | | | | | | | | | | | | | | | | | | | | |
Liabilities | | | | | | | | | | | | | | | | | | | | | | | | | | | | |
Amounts owed to credit institutions | | | | | | | | | | | | | | | | | | | | | | | | | | | | |
Short-term | | | 752 | | | | 752 | | | | 752 | | | | - | | | | - | | | | - | | | | - | |
Long-term | | | - | | | | - | | | | - | | | | - | | | | - | | | | - | | | | - | |
| | | | 752 | | | | 752 | | | | 752 | | | | 0 | | | | 0 | | | | 0 | | | | 0 | |
Debts evidenced by certificates | | | 31,526 | | | | 32,599 | | | | 2,638 | | | | 807 | | | | 4,000 | | | | 21,660 | | | | 3,494 | |
Other liabilities | | | | | | | | | | | | | | | | | | | | | | | | | | | | |
Derivative receivables | | | -9,188 | | | | -9,707 | | | | -2,558 | | | | -882 | | | | -971 | | | | -4,482 | | | | -814 | |
Derivative payables | | | 10,240 | | | | 10,498 | | | | 2,608 | | | | 977 | | | | 1,189 | | | | 4,768 | | | | 956 | |
Liabilities, total | | | 33,330 | | | | 34,142 | | | | 3,439 | | | | 903 | | | | 4,219 | | | | 21,946 | | | | 3,635 | |
| | | | | | | | | | | | | | | | | | | | | | | | | | | | | |
Net during the period | | | | | | | | | | | 2,756 | | | | 668 | | | | -1,717 | | | | -4,583 | | | | 7,802 | |
| | | | | | | | | | | | | | | | | | | | | | | | | | | | | |
Loans agreed but not yet disbursed | | | | | | | | | | | 2,837 | | | | | | | | | | | | | | | | | |
| | |
| | |
FINANCIAL REPORT 2021 | | NIB FINANCIAL REPORT 2021 / 78 |
| | |
|
| |
REPORT OF THE BOARD OF DIRECTORS |
| |
PRESIDENT AND CEO’S COMMENTS |
| |
OPERATING AND FINANCIAL REVIEW |
| |
CAPITAL AND LIQUIDITY MANAGEMENT |
| |
FINANCIAL STATEMENTS |
| |
STATEMENT OF COMPREHENSIVE INCOME |
| |
STATEMENT OF FINANCIAL POSITION |
| |
CHANGES IN EQUITY |
| |
CASH FLOW STATEMENT |
| |
NOTES |
| |
PROPOSAL BY THE BOARD OF DIRECTORS |
| |
AUDITOR’S REPORT |
| |
GOVERNANCE STATEMENT |
| |
REPORT OF THE CONTROL COMMITTEE CHAIRMANSHIP |
| |
REPORT OF THE CONTROL COMMITTEE |
|
|
|
|
|
|
|
|
|
|
|
|
|
|
| | | | | | | | | | | | | | | | | | | | | | | | | | | | |
| 2020 | | | | | | | | | | | | | | | | | | | | | |
| | | | | | | |
| In millions of euro | | CARRYING AMOUNT | | | CONTRACTUAL
CASH FLOWS | | | UP TO AND
INCLUDING 3 MONTH | | | OVER 3 MONTHS AND
UP TO AND INCLUDING
6 MONTHS | | | OVER 6 MONTHS AND
UP TO AND INCLUDING
1 YEAR | | | OVER 1 YEAR AND UP
TO AND INCLUDING
5 YEARS | | | OVER 5 YEARS | |
Assets | | | | | | | | | | | | | | | | | | | | | | | | | | | | |
Cash and cash equivalents | | | 2,270 | | | | 2,270 | | | | 2,270 | | | | - | | | | - | | | | - | | | | - | |
Financial placements | | | | | | | | | | | | | | | | | | | | | | | | | | | | |
Placements with credit institutions | | | 1,961 | | | | 1,957 | | | | 1,884 | | | | 73 | | | | - | | | | - | | | | - | |
Debt securities | | | 7,912 | | | | 7,976 | | | | 256 | | | | 432 | | | | 654 | | | | 5,977 | | | | 657 | |
Other | | | 9 | | | | 7 | | | | - | | | | - | | | | - | | | | - | | | | 7 | |
Loans outstanding | | | 21,555 | | | | 22,594 | | | | 350 | | | | 447 | | | | 1,003 | | | | 9,896 | | | | 10,897 | |
Other assets | | | | | | | | | | | | | | | | | | | | | | | | | | | | |
Derivative receivables | | | 8,723 | | | | 9,307 | | | | 775 | | | | 290 | | | | 1,030 | | | | 5,049 | | | | 2,163 | |
Derivative payables | | | -7,317 | | | | -7,587 | | | | -619 | | | | -210 | | | | -841 | | | | -4,144 | | | | -1,773 | |
Assets, total | | | 35,113 | | | | 36,524 | | | | 4,915 | | | | 1,032 | | | | 1,847 | | | | 16,779 | | | | 11,952 | |
| | | | | | | | | | | | | | | | | | | | | | | | | | | | | |
Liabilities | | | | | | | | | | | | | | | | | | | | | | | | | | | | |
Amounts owed to credit institutions | | | | | | | | | | | | | | | | | | | | | | | | | | | | |
Short-term | | | 724 | | | | 724 | | | | 724 | | | | - | | | | - | | | | - | | | | - | |
Long-term | | | - | | | | - | | | | - | | | | - | | | | - | | | | - | | | | - | |
| | | | 724 | | | | 724 | | | | 724 | | | | 0 | | | | 0 | | | | 0 | | | | 0 | |
Debts evidenced by certificates | | | 29,072 | | | | 29,595 | | | | 1,468 | | | | 734 | | | | 3,107 | | | | 20,220 | | | | 4,066 | |
Other liabilities | | | | | | | | | | | | | | | | | | | | | | | | | | | | |
Derivative receivables | | | -14,211 | | | | -14,754 | | | | -4,613 | | | | -1,682 | | | | -1,334 | | | | -6,640 | | | | -486 | |
Derivative payables | | | 15,573 | | | | 15,970 | | | | 4,706 | | | | 1,740 | | | | 1,346 | | | | 7,534 | | | | 644 | |
Liabilities, total | | | 31,158 | | | | 31,534 | | | | 2,284 | | | | 792 | | | | 3,119 | | | | 21,115 | | | | 4,225 | |
| | | | | | | | | | | | | | | | | | | | | | | | | | | | | |
Net during the period | | | | | | | | | | | 2,631 | | | | 239 | | | | -1,272 | | | | -4,336 | | | | 7,727 | |
| | | | | | | | | | | | | | | | | | | | | | | | | | | | | |
Loans agreed but not yet disbursed | | | | | | | | | | | 3,522 | | | | | | | | | | | | | | | | | |
| | |
| | |
FINANCIAL REPORT 2021 | | NIB FINANCIAL REPORT 2021 / 79 |
| | |
|
| |
REPORT OF THE BOARD OF DIRECTORS |
| |
PRESIDENT AND CEO’S COMMENTS |
| |
OPERATING AND FINANCIAL REVIEW |
| |
CAPITAL AND LIQUIDITY MANAGEMENT |
| |
FINANCIAL STATEMENTS |
| |
STATEMENT OF COMPREHENSIVE INCOME |
| |
STATEMENT OF FINANCIAL POSITION |
| |
CHANGES IN EQUITY |
| |
CASH FLOW STATEMENT |
| |
NOTES |
| |
PROPOSAL BY THE BOARD OF DIRECTORS |
| |
AUDITOR’S REPORT |
| |
GOVERNANCE STATEMENT |
| |
REPORT OF THE CONTROL COMMITTEE CHAIRMANSHIP |
| |
REPORT OF THE CONTROL COMMITTEE |
|
|
|
|
|
|
|
|
|
|
|
|
|
|
|
|
|
|
Note 22: Interest rate risk
Interest rate risk is the impact that fluctuations in market interest rates can have on the value of the Bank’s interest-bearing assets and liabilities and on the interest income recognised in the statement of comprehensive income. The table below provides information on the extent of the Bank’s interest rate exposure. The assets and liabilities are grouped into buckets defined by their time to maturity or the date of the interest rate adjustment. The difference, or gap, between assets and liabilities in each time bucket makes the Bank sensitive to interest rate fluctuations. See also Note 2: Risk management.
| | | | | | | | | | | | | | | | | | | | | | | | | | | | | | | | |
2021 | | | | | | | | | | | | | | | | | | | | | | | | | | | | | | | | |
| | | | | | | | | |
| In millions of euro | | UP TO AND
INCLUDING
3 MONTHS | | | OVER 3 MONTHS
AND UP TO AND
INCLUDING 6 MONTHS | | | OVER 6 MONTHS
AND UP TO AND
INCLUDING 1 YEAR | | | OVER 1 YEAR
AND UP TO AND
INCLUDING 5 YEARS | | | OVER 5 YEARS
AND UP TO AND
INCLUDING 10 YEARS | | | OVER
10 YEARS | | | UNDEFINED | | | TOTAL | |
| | | | | | | | | | | | | | | | | | | | | | | | | | | | | | | | | |
Assets | | | | | | | | | | | | | | | | | | | | | | | | | | | | | | | | |
Cash and cash equivalents | | | 1,826 | | | | - | | | | - | | | | - | | | | - | | | | - | | | | - | | | | 1,826 | |
Financial placements | | | | | | | | | | | | | | | | | | | | | | | | | | | | | | | | |
Placements with credit institutions | | | 1,927 | | | | 1,945 | | | | - | | | | - | | | | - | | | | - | | | | 10 | | | | 3,881 | |
Debt securities | | | 2,009 | | | | 176 | | | | 593 | | | | 4,708 | | | | 793 | | | | - | | | | 11 | | | | 8,291 | |
Other | | | - | | | | - | | | | - | | | | - | | | | - | | | | - | | | | 9 | | | | 9 | |
| | | | 3,936 | | | | 2,121 | | | | 593 | | | | 4,708 | | | | 793 | | | | 0 | | | | 29 | | | | 12,181 | |
Loans outstanding | | | 9,768 | | | | 7,492 | | | | 545 | | | | 2,274 | | | | 1,228 | | | | 632 | | | | 36 | | | | 21,975 | |
Intangible assets | | | - | | | | - | | | | - | | | | - | | | | - | | | | - | | | | 8 | | | | 8 | |
Tangible assets | | | - | | | | - | | | | - | | | | - | | | | - | | | | - | | | | 36 | | | | 36 | |
Other assets | | | | | | | | | | | | | | | | | | | | | | | | | | | | | | | | |
Derivative receivables1 | | | 20,227 | | | | 3,296 | | | | 4,003 | | | | 19,490 | | | | 2,214 | | | | 798 | | | | 565 | | | | 50,592 | |
Other assets | | | - | | | | - | | | | - | | | | - | | | | - | | | | - | | | | 32 | | | | 32 | |
Accrued interest and fees receivable | | | - | | | | - | | | | - | | | | - | | | | - | | | | - | | | | 241 | | | | 241 | |
Total assets | | | 35,758 | | | | 12,908 | | | | 5,141 | | | | 26,472 | | | | 4,235 | | | | 1,431 | | | | 946 | | | | 86,891 | |
1 Swaps are not netted.
| | |
| | |
FINANCIAL REPORT 2021 | | NIB FINANCIAL REPORT 2021 / 80 |
| | |
|
| |
REPORT OF THE BOARD OF DIRECTORS |
| |
PRESIDENT AND CEO’S COMMENTS |
| |
OPERATING AND FINANCIAL REVIEW |
| |
CAPITAL AND LIQUIDITY MANAGEMENT |
| |
FINANCIAL STATEMENTS |
| |
STATEMENT OF COMPREHENSIVE INCOME |
| |
STATEMENT OF FINANCIAL POSITION |
| |
CHANGES IN EQUITY |
| |
CASH FLOW STATEMENT |
| |
NOTES |
| |
PROPOSAL BY THE BOARD OF DIRECTORS |
| |
AUDITOR’S REPORT |
| |
GOVERNANCE STATEMENT |
| |
REPORT OF THE CONTROL COMMITTEE CHAIRMANSHIP |
| |
REPORT OF THE CONTROL COMMITTEE |
|
|
|
|
|
|
|
|
|
|
|
|
|
|
|
|
|
|
| | | | | | | | | | | | | | | | | | | | | | | | | | | | | | | | |
| | | | | | | | | |
| In millions of euro | | UP TO AND
INCLUDING
3 MONTHS | | | OVER 3 MONTHS
AND UP TO AND
INCLUDING 6 MONTHS | | | OVER 6 MONTHS
AND UP TO AND
INCLUDING 1 YEAR | | | OVER 1 YEAR
AND UP TO AND
INCLUDING 5 YEARS | | | OVER 5 YEARS
AND UP TO AND
INCLUDING 10 YEARS | | | OVER
10 YEARS | | | UNDEFINED | | | TOTAL | |
Liabilities and equity | | | | | | | | | | | | | | | | | | | | | | | | | | | | | | | | |
Liabilities | | | | | | | | | | | | | | | | | | | | | | | | | | | | | | | | |
Amounts owed to credit institutions | | | | | | | | | | | | | | | | | | | | | | | | | | | | | | | | |
Short-term | | | 752 | | | | - | | | | - | | | | - | | | | - | | | | - | | | | - | | | | 752 | |
Long-term | | | - | | | | - | | | | - | | | | - | | | | - | | | | - | | | | - | | | | - | |
| | | | 752 | | | | 0 | | | | 0 | | | | 0 | | | | 0 | | | | 0 | | | | 0 | | | | 752 | |
Debts evidenced by certificates | | | 4,208 | | | | 793 | | | | 3,882 | | | | 19,328 | | | | 2,226 | | | | 797 | | | | 292 | | | | 31,526 | |
Other liabilities | | | | | | | | | | | | | | | | | | | | | | | | | | | | | | | | |
Derivative payables1 | | | 33,634 | | | | 5,236 | | | | 917 | | | | 6,213 | | | | 2,076 | | | | 2,016 | | | | 298 | | | | 50,390 | |
Other liabilities | | | - | | | | - | | | | - | | | | - | | | | - | | | | - | | | | 39 | | | | 39 | |
Accrued interest and fees payable | | | - | | | | - | | | | - | | | | - | | | | - | | | | - | | | | 185 | | | | 185 | |
Total liabilities | | | 38,594 | | | | 6,028 | | | | 4,800 | | | | 25,541 | | | | 4,302 | | | | 2,814 | | | | 815 | | | | 82,892 | |
Equity | | | - | | | | - | | | | - | | | | - | | | | - | | | | - | | | | 3,999 | | | | 3,999 | |
Total liabilities and equity | | | 38,594 | | | | 6,028 | | | | 4,800 | | | | 25,541 | | | | 4,302 | | | | 2,814 | | | | 4,813 | | | | 86,891 | |
| | | | | | | | | | | | | | | | | | | | | | | | | | | | | | | | | |
Net during the period | | | -2,836 | | | | 6,880 | | | | 341 | | | | 931 | | | | -66 | | | | -1,383 | | | | -3,867 | | | | 0 | |
Cumulative net during the period | | | -2,836 | | | | 4,044 | | | | 4,385 | | | | 5,316 | | | | 5,250 | | | | 3,867 | | | | 0 | | | | - | |
Guarantee commitments | | | - | | | | - | | | | - | | | | - | | | | - | | | | - | | | | - | | | | - | |
1 Swaps are not netted.
| | |
| | |
FINANCIAL REPORT 2021 | | NIB FINANCIAL REPORT 2021 / 81 |
| | |
|
| |
REPORT OF THE BOARD OF DIRECTORS |
| |
PRESIDENT AND CEO’S COMMENTS |
| |
OPERATING AND FINANCIAL REVIEW |
| |
CAPITAL AND LIQUIDITY MANAGEMENT |
| |
FINANCIAL STATEMENTS |
| |
STATEMENT OF COMPREHENSIVE INCOME |
| |
STATEMENT OF FINANCIAL POSITION |
| |
CHANGES IN EQUITY |
| |
CASH FLOW STATEMENT |
| |
NOTES |
| |
PROPOSAL BY THE BOARD OF DIRECTORS |
| |
AUDITOR’S REPORT |
| |
GOVERNANCE STATEMENT |
| |
REPORT OF THE CONTROL COMMITTEE CHAIRMANSHIP |
| |
REPORT OF THE CONTROL COMMITTEE |
|
|
|
|
|
|
|
|
|
|
|
|
|
|
|
|
|
|
| | | | | | | | | | | | | | | | | | | | | | | | | | | | | | | | |
2020 | | | | | | | | | | | | | | | | | | | | | | | | | | | | | | | | |
| | | | | | | | | |
| In millions of euro | | UP TO AND
INCLUDING
3 MONTHS | | | OVER 3 MONTHS AND
UP TO AND INCLUDING 6 MONTHS | | | OVER 6 MONTHS
AND UP TO AND
INCLUDING 1 YEAR | | | OVER 1 YEAR
AND UP TO AND
INCLUDING 5 YEARS | | | OVER 5 YEARS
AND UP TO AND
INCLUDING 10 YEARS | | | OVER
10 YEARS | | | UNDEFINED | | | TOTAL | |
| | | | | | | | | | | | | | | | | | | | | | | | | | | | | | | | | |
Assets | | | | | | | | | | | | | | | | | | | | | | | | | | | | | | | | |
Cash and cash equivalents | | | 2,270 | | | | - | | | | - | | | | - | | | | - | | | | - | | | | - | | | | 2,270 | |
Financial placements | | | | | | | | | | | | | | | | | | | | | | | | | | | | | | | | |
Placements with credit institutions | | | 708 | | | | 1,253 | | | | - | | | | - | | | | - | | | | - | | | | 7 | | | | 1,969 | |
Debt securities | | | 2,069 | | | | 276 | | | | 281 | | | | 4,610 | | | | 618 | | | | - | | | | 58 | | | | 7,912 | |
Other | | | - | | | | - | | | | - | | | | - | | | | - | | | | - | | | | 9 | | | | 9 | |
| | | | 2,778 | | | | 1,529 | | | | 281 | | | | 4,610 | | | | 618 | | | | 0 | | | | 75 | | | | 9,890 | |
Loans outstanding | | | 9,473 | | | | 7,283 | | | | 395 | | | | 2,370 | | | | 1,239 | | | | 633 | | | | 162 | | | | 21,555 | |
Intangible assets | | | - | | | | - | | | | - | | | | - | | | | - | | | | - | | | | 12 | | | | 12 | |
Tangible assets | | | - | | | | - | | | | - | | | | - | | | | - | | | | - | | | | 37 | | | | 37 | |
Other assets | | | | | | | | | | | | | | | | | | | | | | | | | | | | | | | | |
Derivative receivables1 | | | 18,508 | | | | 2,845 | | | | 2,794 | | | | 19,259 | | | | 2,600 | | | | 908 | | | | 1,033 | | | | 47,948 | |
Other assets | | | - | | | | - | | | | - | | | | - | | | | - | | | | - | | | | 20 | | | | 20 | |
Accrued interest and fees receivable | | | - | | | | - | | | | - | | | | - | | | | - | | | | - | | | | 232 | | | | 232 | |
Total assets | | | 33,029 | | | | 11,657 | | | | 3,470 | | | | 26,239 | | | | 4,457 | | | | 1,540 | | | | 1,571 | | | | 81,964 | |
1 Swaps are not netted.
| | |
| | |
FINANCIAL REPORT 2021 | | NIB FINANCIAL REPORT 2021 / 82 |
| | |
|
| |
REPORT OF THE BOARD OF DIRECTORS |
| |
PRESIDENT AND CEO’S COMMENTS |
| |
OPERATING AND FINANCIAL REVIEW |
| |
CAPITAL AND LIQUIDITY MANAGEMENT |
| |
FINANCIAL STATEMENTS |
| |
STATEMENT OF COMPREHENSIVE INCOME |
| |
STATEMENT OF FINANCIAL POSITION |
| |
CHANGES IN EQUITY |
| |
CASH FLOW STATEMENT |
| |
NOTES |
| |
PROPOSAL BY THE BOARD OF DIRECTORS |
| |
AUDITOR’S REPORT |
| |
GOVERNANCE STATEMENT |
| |
REPORT OF THE CONTROL COMMITTEE CHAIRMANSHIP |
| |
REPORT OF THE CONTROL COMMITTEE |
|
|
|
|
|
|
|
|
|
|
|
|
|
|
|
|
|
|
| | | | | | | | | | | | | | | | | | | | | | | | | | | | | | | | |
| | | | | | | | | |
| In millions of euro | | UP TO AND
INCLUDING
3 MONTHS | | | OVER 3 MONTHS AND UP TO AND INCLUDING 6 MONTHS | | | OVER 6 MONTHS
AND UP TO AND
INCLUDING 1 YEAR | | | OVER 1 YEAR
AND UP TO AND
INCLUDING 5 YEARS | | | OVER 5 YEARS
AND UP TO AND
INCLUDING 10 YEARS | | | OVER
10 YEARS | | | UNDEFINED | | | TOTAL | |
Liabilities and equity | | | | | | | | | | | | | | | | | | | | | | | | | | | | | | | | |
Liabilities | | | | | | | | | | | | | | | | | | | | | | | | | | | | | | | | |
Amounts owed to credit institutions | | | | | | | | | | | | | | | | | | | | | | | | | | | | | | | | |
Short-term | | | 724 | | | | - | | | | - | | | | - | | | | - | | | | - | | | | - | | | | 724 | |
Long-term | | | - | | | | - | | | | - | | | | - | | | | - | | | | - | | | | - | | | | - | |
| | | | 724 | | | | 0 | | | | 0 | | | | 0 | | | | 0 | | | | 0 | | | | 0 | | | | 724 | |
Debts evidenced by certificates | | | 2,229 | | | | 357 | | | | 2,779 | | | | 19,165 | | | | 2,615 | | | | 907 | | | | 1,021 | | | | 29,072 | |
Other liabilities | | | | | | | | | | | | | | | | | | | | | | | | | | | | | | | | |
Derivative payables1 | | | 32,866 | | | | 4,383 | | | | 698 | | | | 5,490 | | | | 2,358 | | | | 1,778 | | | | 331 | | | | 47,904 | |
Other liabilities | | | - | | | | - | | | | - | | | | - | | | | - | | | | - | | | | 228 | | | | 228 | |
Accrued interest and fees payable | | | - | | | | - | | | | - | | | | - | | | | - | | | | - | | | | 176 | | | | 176 | |
Total liabilities | | | 35,818 | | | | 4,741 | | | | 3,477 | | | | 24,654 | | | | 4,972 | | | | 2,685 | | | | 1,756 | | | | 78,103 | |
Equity | | | - | | | | - | | | | - | | | | - | | | | - | | | | - | | | | 3,861 | | | | 3,861 | |
Total liabilities and equity | | | 35,818 | | | | 4,741 | | | | 3,477 | | | | 24,654 | | | | 4,972 | | | | 2,685 | | | | 5,616 | | | | 81,964 | |
| | | | | | | | | | | | | | | | | | | | | | | | | | | | | | | | | |
Net during the period | | | -2,789 | | | | 6,916 | | | | -7 | | | | 1,585 | | | | -515 | | | | -1,145 | | | | -4,045 | | | | 0 | |
Cumulative net during the period | | | -2,789 | | | | 4,127 | | | | 4,120 | | | | 5,705 | | | | 5,190 | | | | 4,045 | | | | 0 | | | | - | |
Guarantee commitments | | | - | | | | - | | | | - | | | | - | | | | - | | | | - | | | | - | | | | - | |
1 Swaps are not netted.
| | |
| | |
FINANCIAL REPORT 2021 | | NIB FINANCIAL REPORT 2021 / 83 |
| | |
|
| |
| REPORT OF THE BOARD OF DIRECTORS |
| |
| PRESIDENT AND CEO’S COMMENTS |
| |
| OPERATING AND FINANCIAL REVIEW |
| |
| CAPITAL AND LIQUIDITY MANAGEMENT |
| |
| FINANCIAL STATEMENTS |
| |
| STATEMENT OF COMPREHENSIVE INCOME |
| |
| STATEMENT OF FINANCIAL POSITION |
| |
| CHANGES IN EQUITY |
| |
| CASH FLOW STATEMENT |
| |
| NOTES |
| |
| PROPOSAL BY THE BOARD OF DIRECTORS |
| |
| AUDITOR’S REPORT |
| |
| GOVERNANCE STATEMENT |
| |
REPORT OF THE CONTROL COMMITTEE CHAIRMANSHIP |
| |
| REPORT OF THE CONTROL COMMITTEE |
| |
| |
| |
| |
| |
| |
| |
| |
| |
| |
| |
| |
| |
| |
| |
| |
| |
| |
| |
| |
| |
| |
| |
| |
| |
| |
| |
| |
Note 23: Currency risk
NIB’s operations are mostly in euro and US dollars. The table below shows the net of assets and liabilities in the major currencies. See also Note 2: Risk management.
NET CURRENCY POSITION AS OF 31 DECEMBER 2021
| | | | | | | | | | | | | | | | | | | | | | | | | | | | | | | | |
| | | | | | | | | |
| In millions of euro | | EUR | | | USD | | | SEK | | | NOK | | | DKK | | | OTHER
CURRENCIES | | | FAIR VALUE ADJUSTMENTS
AND SWAP NETTING | | | TOTAL | |
| | | | | | | | |
Assets | | | | | | | | | | | | | | | | | | | | | | | | | | | | | | | | |
| | | | | | | | |
Cash and cash equivalents | | | 1,446 | | | | 79 | | | | - | | | | - | | | | 299 | | | | 2 | | | | - | | | | 1,826 | |
| | | | | | | | |
Financial placements | | | | | | | | | | | | | | | | | | | | | | | | | | | | | | | | |
| | | | | | | | |
Placements with credit institutions | | | 2,538 | | | | - | | | | - | | | | 104 | | | | 1,238 | | | | - | | | | 2 | | | | 3,881 | |
| | | | | | | | |
Debt securities | | | 3,945 | | | | 1,078 | | | | 494 | | | | 1,088 | | | | 1,675 | | | | - | | | | 11 | | | | 8,291 | |
| | | | | | | | |
Other financial placements | | | 9 | | | | - | | | | - | | | | - | | | | - | | | | - | | | | - | | | | 9 | |
| | | | | | | | |
| | | | 6,491 | | | | 1,078 | | | | 494 | | | | 1,191 | | | | 2,913 | | | | 0 | | | | 13 | | | | 12,181 | |
| | | | | | | | |
Loans outstanding | | | 9,465 | | | | 1,443 | | | | 4,409 | | | | 4,742 | | | | 1,610 | | | | 202 | | | | 104 | | | | 21,975 | |
| | | | | | | | |
Intangible assets | | | 8 | | | | - | | | | - | | | | - | | | | - | | | | - | | | | - | | | | 8 | |
| | | | | | | | |
Tangible assets, property and equipment | | | 36 | | | | - | | | | - | | | | - | | | | - | | | | - | | | | - | | | | 36 | |
| | | | | | | | |
Other assets | | | | | | | | | | | | | | | | | | | | | | | | | | | | | | | | |
| | | | | | | | |
Derivatives | | | -6,409 | | | | 7,942 | | | | -1,971 | | | | -2,249 | | | | -4,709 | | | | 7,394 | | | | 1,256 | | | | 1,255 | |
| | | | | | | | |
Other assets | | | 32 | | | | - | | | | - | | | | - | | | | - | | | | - | | | | - | | | | 32 | |
| | | | | | | | |
| | | | -6,378 | | | | 7,942 | | | | -1,971 | | | | -2,249 | | | | -4,709 | | | | 7,394 | | | | 1,256 | | | | 1,287 | |
| | | | | | | | |
Accrued interest and fees receivable | | | 62 | | | | 48 | | | | 16 | | | | 37 | | | | 18 | | | | 60 | | | | - | | | | 241 | |
| | | | | | | | |
Total assets | | | 11,130 | | | | 10,590 | | | | 2,948 | | | | 3,722 | | | | 132 | | | | 7,658 | | | | 1,374 | | | | 37,553 | |
| | |
| | |
FINANCIAL REPORT 2021 | | NIB FINANCIAL REPORT 2021 / 84 |
| | |
|
| |
REPORT OF THE BOARD OF DIRECTORS |
| |
PRESIDENT AND CEO’S COMMENTS |
| |
OPERATING AND FINANCIAL REVIEW |
| |
CAPITAL AND LIQUIDITY MANAGEMENT |
| |
FINANCIAL STATEMENTS |
| |
STATEMENT OF COMPREHENSIVE INCOME |
| |
STATEMENT OF FINANCIAL POSITION |
| |
CHANGES IN EQUITY |
| |
CASH FLOW STATEMENT |
| |
NOTES |
| |
PROPOSAL BY THE BOARD OF DIRECTORS |
| |
AUDITOR’S REPORT |
| |
GOVERNANCE STATEMENT |
| |
REPORT OF THE CONTROL COMMITTEE CHAIRMANSHIP |
| |
REPORT OF THE CONTROL COMMITTEE |
|
|
|
|
|
|
|
|
|
|
|
|
|
|
|
|
|
|
| | | | | | | | | | | | | | | | | | | | | | | | | | | | | | | | |
| | | | | | | | | |
| In millions of euro | | EUR | | | USD | | | SEK | | | NOK | | | DKK | | | OTHER
CURRENCIES | | | FAIR VALUE ADJUSTMENTS
AND SWAP NETTING | | | TOTAL | |
| | | | | | | | |
Liabilities and equity | | | | | | | | | | | | | | | | | | | | | | | | | | | | | | | | |
| | | | | | | | |
Liabilities | | | | | | | | | | | | | | | | | | | | | | | | | | | | | | | | |
| | | | | | | | |
Amounts owed to credit institutions | | | | | | | | | | | | | | | | | | | | | | | | | | | | | | | | |
| | | | | | | | |
Short-term amounts owed to credit institutions | | | 752 | | | | - | | | | - | | | | - | | | | - | | | | - | | | | - | | | | 752 | |
| | | | | | | | |
Long-term amounts owed to credit institutions | | | - | | | | - | | | | - | | | | - | | | | - | | | | - | | | | - | | | | 0 | |
| | | | | | | | |
| | | | 752 | | | | 0 | | | | 0 | | | | 0 | | | | 0 | | | | 0 | | | | 0 | | | | 752 | |
| | | | | | | | |
Debt evidenced by certificates | | | 6,363 | | | | 10,531 | | | | 2,933 | | | | 3,685 | | | | 134 | | | | 7,588 | | | | 292 | | | | 31,526 | |
| | | | | | | | |
Other Liabilities | | | | | | | | | | | | | | | | | | | | | | | | | | | | | | | | |
| | | | | | | | |
Derivatives | | | - | | | | - | | | | - | | | | - | | | | - | | | | - | | | | 1,052 | | | | 1,052 | |
| | | | | | | | |
Other liabilities | | | 14 | | | | 12 | | | | 3 | | | | 1 | | | | 1 | | | | 9 | | | | - | | | | 39 | |
| | | | | | | | |
| | | | 14 | | | | 12 | | | | 3 | | | | 1 | | | | 1 | | | | 9 | | | | 1,052 | | | | 1,092 | |
| | | | | | | | |
Accrued interest and fees payable | | | 35 | | | | 46 | | | | 12 | | | | 36 | | | | -3 | | | | 59 | | | | - | | | | 185 | |
| | | | | | | | |
Total liabilities | | | 7,164 | | | | 10,588 | | | | 2,948 | | | | 3,722 | | | | 132 | | | | 7,656 | | | | 1,345 | | | | 33,555 | |
| | | | | | | | |
| | | | | | | | | | | | | | | | | | | | | | | | | | | | | | | | | |
| | | | | | | | |
Equity | | | 3,836 | | | | 0 | | | | 0 | | | | 0 | | | | 0 | | | | 0 | | | | 3 | | | | 3,839 | |
| | | | | | | | |
| | | | | | | | | | | | | | | | | | | | | | | | | | | | | | | | | |
| | | | | | | | |
Total liabilities and equity | | | 11,000 | | | | 10,588 | | | | 2,948 | | | | 3,722 | | | | 132 | | | | 7,656 | | | | 1,348 | | | | 37,394 | |
| | | | | | | | |
| | | | | | | | | | | | | | | | | | | | | | | | | | | | | | | | | |
| | | | | | | | |
Net of assets and liabilities as of 31 Dec 2021 | | | 130 | | | | 1 | | | | 0 | | | | 0 | | | | 0 | | | | 1 | | | | 26 | | | | 159 | |
| | |
| | |
FINANCIAL REPORT 2021 | | NIB FINANCIAL REPORT 2021 / 85 |
| | |
|
| |
REPORT OF THE BOARD OF DIRECTORS |
| |
PRESIDENT AND CEO’S COMMENTS |
| |
OPERATING AND FINANCIAL REVIEW |
| |
CAPITAL AND LIQUIDITY MANAGEMENT |
| |
FINANCIAL STATEMENTS |
| |
STATEMENT OF COMPREHENSIVE INCOME |
| |
STATEMENT OF FINANCIAL POSITION |
| |
CHANGES IN EQUITY |
| |
CASH FLOW STATEMENT |
| |
NOTES |
| |
PROPOSAL BY THE BOARD OF DIRECTORS |
| |
AUDITOR’S REPORT |
| |
GOVERNANCE STATEMENT |
| |
REPORT OF THE CONTROL COMMITTEE CHAIRMANSHIP |
| |
REPORT OF THE CONTROL COMMITTEE |
|
|
|
|
|
|
|
|
|
|
|
|
|
|
|
|
|
|
NET CURRENCY POSITION AS OF 31 DECEMBER 2020
| | | | | | | | | | | | | | | | | | | | | | | | | | | | | | | | |
| In millions of euro | | EUR | | | USD | | | SEK | | | NOK | | | DKK | | | OTHER
CURRENCIES | | | FAIR VALUE ADJUSTMENTS
AND SWAP NETTING | | | TOTAL | |
Assets | | | | | | | | | | | | | | | | | | | | | | | | | | | | | | | | |
Cash and cash equivalents | | | 1,774 | | | | 34 | | | | - | | | | - | | | | 460 | | | | 2 | | | | - | | | | 2,270 | |
Financial placements | | | | | | | | | | | | | | | | | | | | | | | | | | | | | | | | |
Placements with credit institutions | | | 1,211 | | | | - | | | | - | | | | - | | | | 757 | | | | - | | | | 1 | | | | 1,969 | |
Debt securities | | | 4,065 | | | | 1,076 | | | | 446 | | | | 850 | | | | 1,417 | | | | - | | | | 59 | | | | 7,912 | |
Other financial placements | | | 9 | | | | - | | | | - | | | | - | | | | - | | | | - | | | | - | | | | 9 | |
| | | | 5,285 | | | | 1,076 | | | | 446 | | | | 850 | | | | 2,174 | | | | 0 | | | | 60 | | | | 9,890 | |
Loans outstanding | | | 9,437 | | | | 1,564 | | | | 4,510 | | | | 4,502 | | | | 1,019 | | | | 269 | | | | 253 | | | | 21,555 | |
Intangible assets | | | 12 | | | | - | | | | - | | | | - | | | | - | | | | - | | | | - | | | | 12 | |
Tangible assets, property and equipment | | | 37 | | | | - | | | | - | | | | - | | | | - | | | | - | | | | - | | | | 37 | |
Other assets | | | | | | | | | | | | | | | | | | | | | | | | | | | | | | | | |
Derivatives | | | -6,379 | | | | 7,229 | | | | -2,139 | | | | -2,776 | | | | -3,605 | | | | 6,926 | | | | 2,150 | | | | 1,406 | |
Other assets | | | -265 | | | | - | | | | - | | | | - | | | | 285 | | | | - | | | | - | | | | 20 | |
| | | | -6,644 | | | | 7,229 | | | | -2,139 | | | | -2,776 | | | | -3,321 | | | | 6,926 | | | | 2,150 | | | | 1,425 | |
Accrued interest and fees receivable | | | 57 | | | | 56 | | | | 16 | | | | 30 | | | | 12 | | | | 61 | | | | 0 | | | | 232 | |
Total assets | | | 9,958 | | | | 9,960 | | | | 2,834 | | | | 2,607 | | | | 345 | | | | 7,257 | | | | 2,462 | | | | 35,422 | |
| | |
| | |
FINANCIAL REPORT 2021 | | NIB FINANCIAL REPORT 2021 / 86 |
| | |
|
| |
REPORT OF THE BOARD OF DIRECTORS |
| |
PRESIDENT AND CEO’S COMMENTS |
| |
OPERATING AND FINANCIAL REVIEW |
| |
CAPITAL AND LIQUIDITY MANAGEMENT |
| |
FINANCIAL STATEMENTS |
| |
STATEMENT OF COMPREHENSIVE INCOME |
| |
STATEMENT OF FINANCIAL POSITION |
| |
CHANGES IN EQUITY |
| |
CASH FLOW STATEMENT |
| |
NOTES |
| |
PROPOSAL BY THE BOARD OF DIRECTORS |
| |
AUDITOR’S REPORT |
| |
GOVERNANCE STATEMENT |
| |
REPORT OF THE CONTROL COMMITTEE CHAIRMANSHIP |
| |
REPORT OF THE CONTROL COMMITTEE |
|
|
|
|
|
|
|
|
|
|
|
|
|
|
|
|
|
|
| | | | | | | | | | | | | | | | | | | | | | | | | | | | | | | | |
| In millions of euro | | EUR | | | USD | | | SEK | | | NOK | | | DKK | | | OTHER
CURRENCIES | | | FAIR VALUE ADJUSTMENTS
AND SWAP NETTING | | | TOTAL | |
Liabilities and equity | | | | | | | | | | | | | | | | | | | | | | | | | | | | | | | | |
Liabilities | | | | | | | | | | | | | | | | | | | | | | | | | | | | | | | | |
Amounts owed to credit institutions | | | | | | | | | | | | | | | | | | | | | | | | | | | | | | | | |
Short-term amounts owed to credit institutions | | | 717 | | | | 7 | | | | - | | | | - | | | | - | | | | - | | | | - | | | | 724 | |
Long-term amounts owed to credit institutions | | | - | | | | - | | | | - | | | | - | | | | - | | | | - | | | | - | | | | - | |
| | | | 717 | | | | 7 | | | | 0 | | | | 0 | | | | 0 | | | | 0 | | | | 0 | | | | 724 | |
Debts evidenced by certificates | | | 5,689 | | | | 9,631 | | | | 2,821 | | | | 2,580 | | | | 133 | | | | 7,196 | | | | 1,021 | | | | 29,072 | |
Other liabilities | | | | | | | | | | | | | | | | | | | | | | | | | | | | | | | | |
Derivatives | | | - | | | | - | | | | - | | | | - | | | | - | | | | - | | | | 1,362 | | | | 1,362 | |
Other liabilities | | | -253 | | | | 268 | | | | - | | | | - | | | | 213 | | | | - | | | | - | | | | 228 | |
| | | | -253 | | | | 268 | | | | 0 | | | | 0 | | | | 213 | | | | 0 | | | | 1,362 | | | | 1,590 | |
Accrued interest and fees payable | | | 26 | | | | 52 | | | | 12 | | | | 26 | | | | -1 | | | | 60 | | | | -0 | | | | 176 | |
Total liabilities | | | 6,179 | | | | 9,959 | | | | 2,833 | | | | 2,606 | | | | 345 | | | | 7,256 | | | | 2,383 | | | | 31,561 | |
| | | | | | | | | | | | | | | | | | | | | | | | | | | | | | | | | |
Equity | | | 3,671 | | | | 0 | | | | 0 | | | | 0 | | | | 0 | | | | 0 | | | | 25 | | | | 3,696 | |
| | | | | | | | | | | | | | | | | | | | | | | | | | | | | | | | | |
Total liabilities and equity | | | 9,851 | | | | 9,959 | | | | 2,833 | | | | 2,606 | | | | 345 | | | | 7,256 | | | | 2,408 | | | | 35,257 | |
| | | | | | | | | | | | | | | | | | | | | | | | | | | | | | | | | |
Net of assets and liabilities as of 31 Dec 2020 | | | 107 | | | | 0 | | | | 1 | | | | 0 | | | | 0 | | | | 1 | | | | 55 | | | | 165 | |
| | |
| | |
FINANCIAL REPORT 2021 | | NIB FINANCIAL REPORT 2021 / 87 |
| | |
|
| |
REPORT OF THE BOARD OF DIRECTORS |
| |
PRESIDENT AND CEO’S COMMENTS |
| |
OPERATING AND FINANCIAL REVIEW |
| |
CAPITAL AND LIQUIDITY MANAGEMENT |
| |
FINANCIAL STATEMENTS |
| |
STATEMENT OF COMPREHENSIVE INCOME |
| |
STATEMENT OF FINANCIAL POSITION |
| |
CHANGES IN EQUITY |
| |
CASH FLOW STATEMENT |
| |
NOTES |
| |
PROPOSAL BY THE BOARD OF DIRECTORS |
| |
AUDITOR’S REPORT |
| |
GOVERNANCE STATEMENT |
| |
REPORT OF THE CONTROL COMMITTEE CHAIRMANSHIP |
| |
REPORT OF THE CONTROL COMMITTEE |
|
|
|
|
|
|
|
|
|
|
|
|
|
|
|
|
|
|
Note 24: Derivatives held for risk management and hedge accounting
DERIVATIVES
| | | | | | | | | | | | | | | | | | | | | | | | |
| | | 31 DECEMBER 2021 | | | 31 DECEMBER 2020 | |
| | | | | | FAIR VALUE | | | | | | FAIR VALUE | |
| In millions of euro | | NOMINAL AMOUNT | | | POSITIVE | | | NEGATIVE | | | NOMINAL AMOUNT | | | POSITIVE | | | NEGATIVE | |
Interest rate swaps | | | 4,035 | | | | 31 | | | | 16 | | | | 4,194 | | | | 26 | | | | 46 | |
Cross currency swaps | | | 11,280 | | | | 501 | | | | 167 | | | | 10,672 | | | | 421 | | | | 505 | |
Currency swaps | | | 4,729 | | | | 74 | | | | 11 | | | | 4,347 | | | | 4 | | | | 100 | |
Derivatives not used for hedge accounting | | | 20,044 | | | | 606 | | | | 194 | | | | 19,213 | | | | 451 | | | | 651 | |
Fair value hedges | | | 34,712 | | | | 649 | | | | 859 | | | | 32,048 | | | | 954 | | | | 711 | |
Total derivatives | | | 54,755 | | | | 1,255 | | | | 1,053 | | | | 51,261 | | | | 1,406 | | | | 1,362 | |
| | | | | | | | | | | | | | | | | | | | | | | | |
| | | | | | | | | | | | | | | | | | | | | | | | |
| FAIR VALUE HEDGES | | | | | | | | | | | | | | | | | | | | | | | | |
| | | | | | |
| | | | | | | | | | | | | | | | | | | | | | | | |
| Hedged items | | | | | | | | | | | | | | | | | | | | | | | | |
| | | | | | | | | | | | | | | | | | | | | | | | |
| 2021 | | CARRYING AMOUNT | | | ACCUMULATED HEDGE ADJUSTMENT INCLUDED IN THE CARRYING AMOUNT | |
| In millions of euro | | NOMINAL AMOUNT | | | ASSETS | | | LIABILITIES | | | CHANGE IN FAIR VALUE USED FOR RECOGNISING
HEDGE INEFFECTIVENESS | | | ASSETS | | | LIABILITIES | |
Loans outstanding | | | 5,095 | | | | 5,200 | | | | - | | | | -149 | | | | 105 | | | | - | |
Debts evidenced by certificates | | | 29,398 | | | | - | | | | 29,619 | | | | 720 | | | | - | | | | 222 | |
Total | | | 34,493 | | | | 5,200 | | | | 29,619 | | | | 571 | | | | 105 | | | | 222 | |
| | | | | | |
| | | | | | | | | | | | | | | | | | | | | | | | | |
| 2020 | | CARRYING AMOUNT | | | ACCUMULATED HEDGE ADJUSTMENT
INCLUDED IN THE CARRYING AMOUNT | |
| In millions of euro | | NOMINAL AMOUNT | | | ASSETS | | | LIABILITIES | | | CHANGE IN FAIR VALUE
USED FOR RECOGNISING
HEDGE INEFFECTIVENESS | | | ASSETS | | | LIABILITIES | |
Loans outstanding | | | 4,850 | | | | 5,104 | | | | - | | | | 47 | | | | 254 | | | | - | |
Debts evidenced by certificates | | | 27,127 | | | | - | | | | 28,080 | | | | -323 | | | | - | | | | 943 | |
Total | | | 31,977 | | | | 5,104 | | | | 28,080 | | | | -276 | | | | 254 | | | | 943 | |
| | |
| | |
FINANCIAL REPORT 2021 | | NIB FINANCIAL REPORT 2021 / 88 |
| | |
|
| |
| REPORT OF THE BOARD OF DIRECTORS |
| |
| PRESIDENT AND CEO’S COMMENTS |
| |
| OPERATING AND FINANCIAL REVIEW |
| |
| CAPITAL AND LIQUIDITY MANAGEMENT |
| |
| FINANCIAL STATEMENTS |
| |
| STATEMENT OF COMPREHENSIVE INCOME |
| |
| STATEMENT OF FINANCIAL POSITION |
| |
| CHANGES IN EQUITY |
| |
| CASH FLOW STATEMENT |
| |
| NOTES |
| |
| PROPOSAL BY THE BOARD OF DIRECTORS |
| |
| AUDITOR’S REPORT |
| |
| GOVERNANCE STATEMENT |
| |
| REPORT OF THE CONTROL COMMITTEE CHAIRMANSHIP |
| |
| REPORT OF THE CONTROL COMMITTEE |
| |
| |
| |
| |
| |
| |
| |
| |
| |
| |
| |
| |
| |
| |
| |
| |
|
Derivatives used for hedge accounting
| | | | | | | | | | | | | | | | | | | | | | | | |
| 2021 | | | | | CARRYING AMOUNT | | | | | | | | | | |
| In millions of euro | | NOMINAL AMOUNT | | | ASSETS | | | LIABILITIES | | | CHANGE IN FAIR VALUE
USED FOR RECOGNISING
HEDGE INEFFECTIVENESS | | | INEFFECTIVENESS
RECOGNISED IN
PROFIT OR LOSS | | | COST OF HEDGING
RECOGNISED IN
OCI | |
Swaps hedging loans outstanding | | | 5,314 | | | | 48 | | | | 147 | | | | 174 | | | | 25 | | | | 0 | |
Swaps hedging debts evidenced by certificates | | | 29,398 | | | | 601 | | | | 712 | | | | -783 | | | | -62 | | | | -22 | |
Total | | | 34,712 | | | | 649 | | | | 859 | | | | -609 | | | | -38 | | | | -22 | |
| | | | | | | | | | | | | | | | | | | | | | | | |
| 2020 | | | | | CARRYING AMOUNT | | | | | | | | | | |
| In millions of euro | | NOMINAL AMOUNT | | | ASSETS | | | LIABILITIES | | | CHANGE IN FAIR VALUE
USED FOR RECOGNISING
HEDGE INEFFECTIVENESS | | | INEFFECTIVENESS
RECOGNISED IN
PROFIT OR LOSS | | | COST OF HEDGING
RECOGNISED IN
OCI | |
Swaps hedging loans outstanding | | | 4,921 | | | | 1 | | | | 274 | | | | -71 | | | | -24 | | | | 0 | |
Swaps hedging debts evidenced by certificates | | | 27,127 | | | | 954 | | | | 437 | | | | 398 | | | | 75 | | | | 9 | |
Total | | | 32,048 | | | | 954 | | | | 711 | | | | 327 | | | | 51 | | | | 9 | |
The Bank is subject to market risks arising from fluctuations in exchange rates, interest rates, credit spreads and cross currency basis spreads. The Bank employs a number of hedging strategies to mitigate against these risks as described in Note 2: Risk management, however the Bank only applies hedge accounting for some strategies as described below.
HEDGE ACCOUNTING
The Bank uses interest and cross-currency swaps to hedge its exposure to changes in the fair values of fixed rate funding and lending transactions. The Bank is not allowed under its Risk Management Policy to have open positions, therefore all fixed rate transactions are
swapped back to back. As a consequence, the critical terms of the hedged item and hedging instrument are closely aligned and the maturities of the hedging instruments match the maturities of the underlying hedged items. For more information regarding the maturities of financial assets and liabilities see Note 21: Maturity profile of financial assets and liabilities. In addition to the qualitative assessment of critical terms, the Bank assesses the effectiveness of the hedges by comparing changes in the fair value of the hedged risk with changes in the fair value of the related hedging instrument. Ineffectiveness is recorded in the Statement of Comprehensive income in the line item “Net profit/loss on financial operations”.
| | |
| | |
FINANCIAL REPORT 2021 | | NIB FINANCIAL REPORT 2021 / 89 |
| | |
|
| |
REPORT OF THE BOARD OF DIRECTORS |
| |
PRESIDENT AND CEO’S COMMENTS |
| |
OPERATING AND FINANCIAL REVIEW |
| |
CAPITAL AND LIQUIDITY MANAGEMENT |
| |
FINANCIAL STATEMENTS |
| |
STATEMENT OF COMPREHENSIVE INCOME |
| |
STATEMENT OF FINANCIAL POSITION |
| |
CHANGES IN EQUITY |
| |
CASH FLOW STATEMENT |
| |
NOTES |
| |
PROPOSAL BY THE BOARD OF DIRECTORS |
| |
AUDITOR’S REPORT |
| |
GOVERNANCE STATEMENT |
| |
REPORT OF THE CONTROL COMMITTEE CHAIRMANSHIP |
| |
REPORT OF THE CONTROL COMMITTEE |
|
|
|
|
|
|
|
|
|
|
|
|
|
|
|
|
|
|
Note 25: Related party disclosures
NORDIC DEVELOPMENT FUND AND NORDIC ENVIRONMENT FINANCE CORPORATION
According to the constituent documents of Nordic Development Fund (NDF) and Nordic Environment Finance Corporation (NEFCO), their principal offices shall be located at the principal office of Nordic Investment Bank (NIB). Furthermore, the Statutes of NDF and NEFCO set out that their Control Committee members appointed by the Nordic Council shall be the same persons as appointed by the Council to the Control Committee of NIB. In addition, the Statutes of NDF and NEFCO set out that the powers vested in their respective Board of Directors may to the extent appropriate be delegated to the President of the respective organisation and/or to NIB.
The Bank provides administrative services to NDF and NEFCO the compensation of which is disclosed in Note 8. The following table shows the outstanding balance of amounts owed to NDF, NEFCO and the trust funds administered by them, and the interest paid during the year. The interest paid to these institutions is at normal commercial rates. At 31 December 2021, NIB had loans agreed but not disbursed to NEFCO amounting to EUR 54 million.
| | | | | | | | | | | | | | | | |
| | | | | |
| In thousands of euro | | LENDING
FEES FROM
RELATED PARTIES | | | INTEREST TO
RELATED PARTIES | | | AMOUNTS OWED BY
RELATED PARTIES
AS OF 31 DEC | | | AMOUNTS OWED TO
RELATED PARTIES
AS OF 31 DEC | |
| | | | |
2021 | | | 122 | | | | 1 | | | | 1,036 | | | | 11 | |
| | | | |
2020 | | | 125 | | | | -21 | | | | 26 | | | | 74 | |
Rental income (NDF, NEFCO)
| | | | | | | | |
| | | |
| In thousands of euro | | | NDF | | | | NEFCO | |
| | |
2021 | | | 161 | | | | 274 | |
| | |
2020 | | | 155 | | | | 272 | |
KEY MANAGEMENT PERSONNEL
The Bank has identified members of the Board of Directors, the Control Committee and the Executive Committee as key management personnel. Information regarding the compensation of key management personnel for the relevant reporting periods can be found in Note 7. There have been no other transactions between the Bank and key management personnel.
| | |
| | |
FINANCIAL REPORT 2021 | | NIB FINANCIAL REPORT 2021 / 90 |
| | |
|
| |
| REPORT OF THE BOARD OF DIRECTORS |
| |
| PRESIDENT AND CEO’S COMMENTS |
| |
| OPERATING AND FINANCIAL REVIEW |
| |
| CAPITAL AND LIQUIDITY MANAGEMENT |
| |
| FINANCIAL STATEMENTS |
| |
| STATEMENT OF COMPREHENSIVE INCOME |
| |
| STATEMENT OF FINANCIAL POSITION |
| |
| CHANGES IN EQUITY |
| |
| CASH FLOW STATEMENT |
| |
| NOTES |
| |
| PROPOSAL BY THE BOARD OF DIRECTORS |
| |
| AUDITOR’S REPORT |
| |
| GOVERNANCE STATEMENT |
| |
REPORT OF THE CONTROL COMMITTEE CHAIRMANSHIP |
| |
| REPORT OF THE CONTROL COMMITTEE |
| |
| |
| |
| |
| |
| |
| |
| |
| |
| |
| |
| |
| |
| |
| |
| |
|
Note 26: Cash flow statement
Specification of the change in cash and cash equivalents, net on 31 December:
| | | | | | | | |
| In thousands of euro | | 2021 | | | 2020 | |
Cash and balances with banks 1 | | | 615,017 | | | | 588,760 | |
Short-term placements with credit institutions ² | | | 508,608 | | | | 771,348 | |
Collateralised placements 3 | | | 702,826 | | | | 910,279 | |
Cash and cash equivalents | | | 1,826,451 | | | | 2,270,386 | |
Short-term amounts owed to credit institutions4 | | | -751,697 | | | | -723,795 | |
Repurchase agreements 5 | | | - | | | | - | |
Short-term debt | | | - | | | | - | |
Cash and cash equivalents, net | | | 1,074,754 | | | | 1,546,591 | |
Change in cash and cash equivalents, net | | | -471,837 | | | | 1,074,891 | |
1 Including an initial margin requirement of EUR 72 (281) thousand for futures on 31 December
2 of which cash given as collateral EUR 400,056 (523,348) thousand
3 Net exposure after collaterals for placements with collateral EUR 6,231 (6,144) thousand
4 Of which cash received as collateral EUR751,697 (723,795) thousand
5 Net exposure after collaterals for repurchase agreements EUR 0 (0) thousand.
Note 27: Exchange rates
| | | | | | | | |
| | | EURO
EXCHANGE
RATE AT
31 DECEMBER
2021 | | | EURO
EXCHANGE
RATE AT
31 DECEMBER
2020 | |
DKK Danish krone | | | 7.43631 | | | | 7.44088 | |
ISK Icelandic króna | | | 147.6015 | | | | 156.0581 | |
NOK Norwegian krone | | | 9.98652 | | | | 10.47062 | |
SEK Swedish krona | | | 10.25463 | | | | 10.02819 | |
ARS Argentine peso | | | 116.269 | | | | 103.169 | |
AUD Australian dollar | | | 1.56278 | | | | 1.5888 | |
BRL Brazilian real | | | 6.30986 | | | | 6.3736 | |
CAD Canadian dollar | | | 1.44034 | | | | 1.56428 | |
CHF Swiss franc | | | 1.03278 | | | | 1.08048 | |
CNH Chinese Yuan Renminbi | | | 7.20367 | | | | 7.97992 | |
CZK Czech koruna | | | 24.8715 | | | | 26.2443 | |
GBP Pound sterling | | | 0.84007 | | | | 0.89809 | |
HKD Hong Kong dollar | | | 8.83298 | | | | 9.51385 | |
INR Indian rupee | | | 84.2285 | | | | 89.6357 | |
JPY Japanese yen | | | 130.4065 | | | | 126.4695 | |
MXN Mexican peso | | | 23.15421 | | | | 24.43707 | |
NZD New Zealand dollar | | | 1.65886 | | | | 1.69793 | |
PLN Polish zloty | | | 4.59711 | | | | 4.55903 | |
RON Romanian leu | | | 4.94908 | | | | 4.86804 | |
RUB Russian rouble | | | 85.3551 | | | | 91.4603 | |
SDR Special drawing right | | | 0.8081 | | | | 0.84875 | |
SGD Singapore dollar | | | 1.52858 | | | | 1.62235 | |
TRY Turkish lira | | | 15.24985 | | | | 9.12288 | |
TWD New Taiwan dollar | | | 31.37604 | | | | 34.47926 | |
USD US dollar | | | 1.13257 | | | | 1.22706 | |
ZAR South African rand | | | 18.07144 | | | | 18.02085 | |
The Bank uses exchange rates acquired from a leading market data provider based on rates prevailing at 13:00 GMT at 31 December except for Special drawing right (SDR) which is based on the International Monetary Fund (IMF) published rate.
| | |
| | |
FINANCIAL REPORT 2021 | | NIB FINANCIAL REPORT 2021 / 91 |
| | |
|
| |
REPORT OF THE BOARD OF DIRECTORS |
| |
PRESIDENT AND CEO’S COMMENTS |
| |
OPERATING AND FINANCIAL REVIEW |
| |
CAPITAL AND LIQUIDITY MANAGEMENT |
| |
FINANCIAL STATEMENTS |
| |
STATEMENT OF COMPREHENSIVE INCOME |
| |
STATEMENT OF FINANCIAL POSITION |
| |
CHANGES IN EQUITY |
| |
CASH FLOW STATEMENT |
| |
NOTES |
| |
PROPOSAL BY THE BOARD OF DIRECTORS |
| |
AUDITOR’S REPORT |
| |
GOVERNANCE STATEMENT |
| |
| REPORT OF THE CONTROL COMMITTEE CHAIRMANSHIP |
| |
REPORT OF THE CONTROL COMMITTEE |
|
|
|
|
|
|
|
|
|
|
|
|
|
|
|
|
|
|
Note 28: Post balance sheet events
There have been no material post balance sheet events that would require disclosure or adjustment to these financial statements.
| | |
| | |
FINANCIAL REPORT 2021 | | NIB FINANCIAL REPORT 2021 / 92 |
| | |
|
| |
| REPORT OF THE BOARD OF DIRECTORS |
| |
| PRESIDENT AND CEO’S COMMENTS |
| |
| OPERATING AND FINANCIAL REVIEW |
| |
| CAPITAL AND LIQUIDITY MANAGEMENT |
| |
| FINANCIAL STATEMENTS |
| |
| PROPOSAL BY THE BOARD OF DIRECTORS |
| |
| AUDITOR’S REPORT |
| |
| GOVERNANCE STATEMENT |
| |
REPORT OF THE CONTROL COMMITTEE CHAIRMANSHIP |
| |
| REPORT OF THE CONTROL COMMITTEE |
| |
| |
| |
| |
| |
| |
| |
| |
| |
| |
| |
| |
| |
| |
| |
| |
| |
| |
| |
| |
| |
| |
| |
| |
| |
| |
| |
| |
Proposal by the Board of Directors to the Board of Governors
The Board of Directors’ proposal with regard to the financial results for the year 2021 takes into account the need to maintain the Bank’s ratio of equity to total risk-weighted assets at a secure level, which is a prerequisite for maintaining the Bank’s high creditworthiness.
In accordance with Section 11 of the Statutes of the Bank, the profit for 2021 of EUR 159,158,465.52 is to be allocated as follows:
- EUR 119,158,465.52 will be transferred to the General Credit Risk Fund as a part of equity; and
- EUR 40,000,000.00 will be made available for distribution as dividends to the bank’s member countries.
More information can be found in the statement of comprehensive income, the statement of financial position, the changes in equity and cash flow statement, as well as the notes to the financial statements.
| | | | | | | | |
| | Helsinki, 17 February 2022 | | |
| | |
Esther Finnbogadóttir (Chair of the Board) | | | | Ole Hovland (Deputy Chair) |
| | |
Julie Sonne | | Madis Üürike | | Pekka Morén |
| | |
Līga Kļaviņa | | Jurgita Uzieliene | | Hans Lindblad |
| | |
| | |
FINANCIAL REPORT 2021 | | NIB FINANCIAL REPORT 2021 / 93 |
| | |
|
| |
| REPORT OF THE BOARD OF DIRECTORS |
| |
| PRESIDENT AND CEO’S COMMENTS |
| |
| OPERATING AND FINANCIAL REVIEW |
| |
| CAPITAL AND LIQUIDITY MANAGEMENT |
| |
| FINANCIAL STATEMENTS |
| |
| PROPOSAL BY THE BOARD OF DIRECTORS |
| |
| AUDITOR’S REPORT |
| |
REPORT ON THE AUDIT OF THE FINANCIAL STATEMENTS |
| |
| REPORT ON OTHER REQUIREMENTS |
| |
| GOVERNANCE STATEMENT |
| |
REPORT OF THE CONTROL COMMITTEE CHAIRMANSHIP |
| |
| REPORT OF THE CONTROL COMMITTEE |
| |
| |
| |
| |
| |
| |
| |
| |
| |
| |
| |
| |
| |
| |
| |
| |
| |
| |
| |
| |
| |
| |
|
Auditor’s Report
To the Control Committee of the Nordic Investment Bank
Report on the Audit of the Financial Statements
OPINION
We have audited the financial statements of Nordic Investment Bank (the Bank) which comprise the statement of financial position as at 31 December 2021, and the statement of comprehensive income, statement of changes in equity and statement of cash flows for the year then ended, and notes to the financial statements including a summary of significant accounting policies.
In our opinion the financial statements present fairly, in all material respects, the Nordic Investment Bank’s financial position as at 31 December 2021 and its financial performance and its cash flows for the year then ended in accordance with International Financial Reporting Standards (IFRS).
BASIS FOR OPINION
We conducted our audit in accordance with International Standards on Auditing (ISAs). Our responsibilities under those standards are further described in the Auditor’s Responsibilities for the Audit of Financial Statements section of our report.
We are independent of the Bank in accordance with the International Ethics Standards Board of Accountants’ Code of Ethics for Professional Accountants (IESBA Code) together with the ethical requirements that are relevant to our audit of the financial statements, and we have fulfilled our other ethical responsibilities in accordance with these requirements and the IESBA code.
We believe that the audit evidence we have obtained is sufficient and appropriate to provide a basis for our opinion.
KEY AUDIT MATTERS
Key audit matters are those matters that, in our professional judgment, were of most significance in our audit of the financial statements of the current period. These matters were addressed in the context of our audit of the financial statements as a whole, and in forming our opinion thereon, and we do not provide a separate opinion on these matters. For each matter below, our description of how our audit addressed the matter is provided in that context.
We have fulfilled the responsibilities described in the Auditor’s responsibilities for the audit of the financial statements section of our report, including in relation to these matters. Accordingly, our audit included the performance of procedures designed to respond to our assessment of the risks of material misstatement of the financial statements. The results of our audit procedures, including the procedures performed to address the matters below, provide the basis for our audit opinion on the accompanying financial statements.
| | |
| | |
FINANCIAL REPORT 2021 | | NIB FINANCIAL REPORT 2021 / 94 |
| | |
|
| |
| REPORT OF THE BOARD OF DIRECTORS |
| |
| PRESIDENT AND CEO’S COMMENTS |
| |
| OPERATING AND FINANCIAL REVIEW |
| |
| CAPITAL AND LIQUIDITY MANAGEMENT |
| |
| FINANCIAL STATEMENTS |
| |
| PROPOSAL BY THE BOARD OF DIRECTORS |
| |
| AUDITOR’S REPORT |
| |
REPORT ON THE AUDIT OF THE FINANCIAL STATEMENTS |
| |
| REPORT ON OTHER REQUIREMENTS |
| |
| GOVERNANCE STATEMENT |
| |
REPORT OF THE CONTROL COMMITTEE CHAIRMANSHIP |
| |
| REPORT OF THE CONTROL COMMITTEE |
| |
| |
| |
| |
| |
| |
| |
| |
| |
| |
| |
| |
| |
| |
| |
| |
| |
| |
| |
| |
| |
| |
|
FAIR VALUE MEASUREMENT OF FINANCIAL INSTRUMENTS
| | |
| | |
| Description | | How our audit addressed this key audit matter |
We refer to the Bank’s accounting policies in Note 1 “Determination of fair value” and, “Significant accounting judgements and estimates” and the notes 11, 15, 17 and 20. As a result of the Bank’s business model, a significant portion of the Bank’s balance sheet comprise of financial instruments valued at fair value, these financial instruments consist of bonds and derivatives. The Bank has financial instruments where no market price is available, and in these cases, fair value is determined using valuation models based on market data. These financial instruments are categorised as level 2 in the IFRS fair value valuation hierarchy. The Bank also has financial instruments for which the fair value measurement has been determined using valuation models where the value is affected by input data that cannot be verified by external market data. These financial instruments are categorised as level 3 in the IFRS fair value valuation hierarchy. The Bank has financial assets and financial liabilities categorised as level 2 totalling EUR 27,328 million and EUR 32,365 million respectively. Financial assets and liabilities categorised as level 3 totalled EUR 73 million and EUR 1,009 million respectively. The measurement of financial instruments includes assessments made by the Bank, since valuation models are used. The valuation of these financial instruments is therefore deemed to be a key audit matter. | | Our audit procedures over financial instruments included, among others: • gaining on understanding of the processes and controls put in place by the Bank to identify, measure and recognize financial instruments • testing the general IT controls, including the handling of authorisation and user access regardng the most significant systems used for valuing financial instruments at year end • testing the valuation of financial instruments at fair value by comparing the values recorded to independently obtained market prices on input data on a sample basis • including valuation specialists in our audit team to carry out independent valuations on a sample basis for various types of financial instruments across the entire fair value hierarchy of financial assets and liabilities • examining the assumptions, methodologies and models used by the Bank to estimate value of complex derivative financial instruments using internal models and/or unobservable data. • compared the assumptions made with appropriate benchmarks and price sources and examined any significant deviations • assessing the Bank’s disclosures with presentation requirements in applicable accounting standards. |
| | |
| | |
FINANCIAL REPORT 2021 | | NIB FINANCIAL REPORT 2021 / 95 |
| | |
|
| |
| REPORT OF THE BOARD OF DIRECTORS |
| |
| PRESIDENT AND CEO’S COMMENTS |
| |
| OPERATING AND FINANCIAL REVIEW |
| |
| CAPITAL AND LIQUIDITY MANAGEMENT |
| |
| FINANCIAL STATEMENTS |
| |
| PROPOSAL BY THE BOARD OF DIRECTORS |
| |
| AUDITOR’S REPORT |
| |
REPORT ON THE AUDIT OF THE FINANCIAL STATEMENTS |
| |
| REPORT ON OTHER REQUIREMENTS |
| |
| GOVERNANCE STATEMENT |
| |
| REPORT OF THE CONTROL COMMITTEE CHAIRMANSHIP |
| |
| REPORT OF THE CONTROL COMMITTEE |
| |
| |
| |
| |
| |
| |
| |
| |
| |
| |
| |
| |
| |
| |
| |
| |
| |
| |
| |
| |
| |
| |
| |
| |
| |
| |
| |
| |
HEDGE ACCOUNTING
| | |
| | |
| Description | | How our audit addressed this key audit matter |
We refer to the Bank’s accounting policies in Note 1 “Derivative instruments and hedge accounting” and the notes 2, 20, and 24. The Bank enters into derivative financial instruments to manage its exposure to interest rate and foreign currency risk. Interest rate related derivatives are identified as hedging instruments in fair value hedge accounting relationships. Since hedge accounting is applied, such gains and losses arising from fair value changes on the derivatives are recognized in profit and loss. Derivatives to which hedge accounting is not applied is recorded at fair value through profit and loss. The hedged interest rate risk of the borrowing and lending transactions that are identified as hedged item is valued at fair value. At December 31, 2021 the Bank has EUR 5,200 million of loans identified as hedged instruments, and EUR 29,619 million of borrowing. The hedging derivatives have fair values of EUR -99 million for assets of which EUR 0 million is recognized in OCI for the year and EUR -111 million for liabilities of which EUR -22 million is recognized in OCI for the year. The application of hedge accounting is deemed to be a key audit matter as the large number of contracts necessitates a system to record and track each contract and consideration of hedge effectiveness can involve a significant degree of both complexity and management judgement and are subject to an inherent risk of error. | | Our audit procedures over hedge accounting included, among others: • gaining on understanding of the processes and controls put in place by the Bank to identify, measure and recognize hedge accounting relationships • inspecting, on a sample basis, the Bank’s hedge documentation and contracts • including specialists in our audit team to carry out independent valuations on a sample basis for fair value hedges • assessing the Bank’s disclosures with presentation requirements in applicable accounting standards. |
| | |
| | |
FINANCIAL REPORT 2021 | | NIB FINANCIAL REPORT 2021 / 96 |
| | |
|
| |
| REPORT OF THE BOARD OF DIRECTORS |
| |
| PRESIDENT AND CEO’S COMMENTS |
| |
| OPERATING AND FINANCIAL REVIEW |
| |
| CAPITAL AND LIQUIDITY MANAGEMENT |
| |
| FINANCIAL STATEMENTS |
| |
| PROPOSAL BY THE BOARD OF DIRECTORS |
| |
| AUDITOR’S REPORT |
| |
REPORT ON THE AUDIT OF THE FINANCIAL STATEMENTS |
| |
| REPORT ON OTHER REQUIREMENTS |
| |
| GOVERNANCE STATEMENT |
| |
| REPORT OF THE CONTROL COMMITTEE CHAIRMANSHIP |
| |
| REPORT OF THE CONTROL COMMITTEE |
| |
| |
| |
| |
| |
| |
| |
| |
| |
| |
| |
| |
| |
| |
| |
| |
| |
| |
| |
| |
| |
| |
| |
| |
| |
| |
| |
| |
GRANTING OF LOANS AND PROVISIONING FOR LOAN LOSSES
| | |
| | |
| Description | | How our audit addressed this key audit matter |
We refer to the Bank’s accounting policies in Note 1 “Impairment of loans” and “Significant accounting judgements and estimates” and the notes 9, 10 and 12. Loans outstanding represent EUR 21,975 million (59%) of total assets of the Bank which is net of impairment of loans of EUR 152 million. The impairment requirements are based on an expected credit loss (ECL) model. The Bank is required to recognise an allowance for either 12-month or lifetime ECLs, depending on whether there has been a significant increase in credit risk since initial recognition. The calculation of expected credit loss is a complex process which included calculations reflecting a probability-weighted outcome, the time value of money and the best available forward-looking information. Further, the model incorporates forward-looking information through the inclusion of macroeconomic factors and can include management judgement and estimates. Since the outstanding loans are material and the credit risk represents the largest risk for the Bank and the related impairment are subject to judgement and estimates, we have assessed the granting of loans and provisioning of loan losses as a key audit matter. | | Our audit procedures on granting of loans and provisioning for loan losses included among others: • gaining on understanding of the processes and controls put in place by the Bank to grant new loans and to identify, measure and recognize impairment of loans • testing the design and efficiency of key controls in both the credit process and credit decisions, credit review rating classification as well as identifying and determining credits for which provisions should be made • testing the general IT controls, including the handling of authorisation and uses access regarding these systems • evaluating the key input variables and assumptions in the ECL model including management judgment and estimates and where relevant, compared data and assumptions to external benchmark • testing the mathematical accuracy of the model • inspecting the key governance meetings including Credit Committee and Board to ensure that there are governance controls in place and • assessing the Bank’s disclosures with presentation requirements in applicable accounting standards. |
OTHER INFORMATION THAN THE ANNUAL ACCOUNTS The Board of Directors and the President are responsible for the other information. The other information comprises information included in the report on pages 1-23 and 99-107 and in the Impact Report 2021, but does not include the financial statements and our auditor’s report thereon. We have obtained the pages 1-23 and 99-107 prior to the date of this auditor’s report, and the Impact Report 2021 is expected to be made available to us after that date. Our opinion on the financial statements does not cover the other information. In connection with our audit of the financial statements, our responsibility is to read the | | other information identified above and, in doing so, consider whether the other information is materially inconsistent with the financial statements or our knowledge obtained in the audit, or otherwise appears to be materially misstated. In our opinion, the information on pages 1-23 and 99-107 is consistent with the information in the financial statements. If, based on the work we have performed on the other information that we obtained prior to the date of this auditor’s report, we conclude that there is a material misstatement of this other information, we are required to report that fact. We have nothing to report in this regard. |
| | |
| | |
FINANCIAL REPORT 2021 | | NIB FINANCIAL REPORT 2021 / 97 |
| | |
|
| |
| REPORT OF THE BOARD OF DIRECTORS |
| |
| PRESIDENT AND CEO’S COMMENTS |
| |
| OPERATING AND FINANCIAL REVIEW |
| |
| CAPITAL AND LIQUIDITY MANAGEMENT |
| |
| FINANCIAL STATEMENTS |
| |
| PROPOSAL BY THE BOARD OF DIRECTORS |
| |
| AUDITOR’S REPORT |
| |
REPORT ON THE AUDIT OF THE FINANCIAL STATEMENTS |
| |
| REPORT ON OTHER REQUIREMENTS |
| |
| GOVERNANCE STATEMENT |
| |
REPORT OF THE CONTROL COMMITTEE CHAIRMANSHIP |
| |
| REPORT OF THE CONTROL COMMITTEE |
| |
| |
| |
| |
| |
| |
| |
| |
| |
| |
| |
| |
| |
| |
| |
| |
| |
| |
| |
| |
| |
| |
| |
| |
| |
| |
| |
| |
RESPONSIBILITIES OF THE BOARD OF DIRECTORS AND THE PRESIDENT FOR THE FINANCIAL STATEMENTS
The Board of Directors and the President are responsible for the preparation and fair presentation of the financial statements in accordance with International Financial Reporting Standards (IFRSs), and for such internal control as they determine is necessary to enable the preparation of financial statements that are free from material misstatement, whether due to fraud or error.
In preparing the financial statements, the Board of Directors and the President are responsible for assessing the Bank’s ability to continue as going concern, disclosing, as applicable, matters relating to going concern and using the going concern basis of accounting unless management either intends to liquidate the Bank or to cease operations, or has no realistic alternative but to do so.
Those charged with governance are responsible for overseeing the Bank’s financial reporting process.
AUDITOR’S RESPONSIBILITY FOR THE AUDIT OF THE FINANCIAL STATEMENTS
Our objectives are to obtain reasonable assurance on whether the financial statements as a whole are free from material misstatement, whether due to fraud or error, and to issue an auditor’s report that includes our opinion. Reasonable assurance is a high level of assurance, but is not a guarantee that an audit conducted in accordance with ISA’s will always detect a material misstatement when it exists. Misstatements can arise from fraud or error and are considered material if, individually or in aggregate, they could reasonably be expected to influence the economic decisions of users taken on the basis of the financial statements.
As part of an audit in accordance with ISA’s, we exercise professional judgment and maintain professional skepticism throughout the audit. We also:
| | • | | Identify and assess the risks of material misstatement of the financial statements, whether due to fraud or error, design and perform audit procedures responsive to those risks, and obtain audit evidence that is sufficient and appropriate to provide a basis for our opinion. The risk of not detecting a material misstatement resulting from fraud is higher than for one resulting from error, as fraud may involve collusion, forgery, intentional omissions, misrepresentations, or the override of internal control. |
| | • | | Obtain an understanding of internal control relevant to the audit in order to design audit procedures that are appropriate in the circumstances, but not for the purpose of expressing an opinion on the effectiveness of the Bank’s internal control. |
| | • | | Evaluate the appropriateness of accounting policies used and the reasonableness of accounting estimates and related disclosures made by management. |
| | • | | Conclude on the appropriateness of the Board of Directors’ and the President’s use of the going concern basis of accounting and based on the audit evidence obtained, whether a material uncertainty exists related to events or conditions that may cast significant doubt on the Bank’s ability to continue as a going concern. If we conclude that a material uncertainty exists, we are required to draw attention in our auditor’s report to the related disclosures in the financial statements or, if such disclosures are inadequate, to modify our opinion. Our conclusions are based on the audit evidence obtained up to the date of our auditor’s report. However, future events or conditions may cause the Bank to cease to continue as a going concern. |
| | • | | Evaluate the overall presentation, structure and content of the financial statements, including the disclosures, and whether the financial statements represent the underlying transactions and events so in a manner that achieves fair presentation. |
We communicate with those charged with governance regarding, among other matters, the planned scope and timing of the audit and significant audit findings, including any significant deficiencies in internal control that we identify during our audit.
We also provide those charged with governance with a statement that we have complied with relevant ethical requirements regarding independence, and to communicate with them all relationships and other matters that may reasonably be thought to bear on our independence, and where applicable, related safeguards.
From the matters communicated with those charged with governance, we determine those matters that were of most significance in the audit of the financial statements of the current period and are therefore the key audit matters. We describe these matters in our auditor’s report unless law or regulation precludes public disclosure about the matter or when, in extremely rare circumstances, we determine that a matter should not be communicated in our report because the adverse consequences of doing so would reasonably be expected to outweigh the public interest benefits of such communication.
| | |
| | |
FINANCIAL REPORT 2021 | | NIB FINANCIAL REPORT 2021 / 98 |
| | |
|
| |
| REPORT OF THE BOARD OF DIRECTORS |
| |
| PRESIDENT AND CEO’S COMMENTS |
| |
| OPERATING AND FINANCIAL REVIEW |
| |
| CAPITAL AND LIQUIDITY MANAGEMENT |
| |
| FINANCIAL STATEMENTS |
| |
| PROPOSAL BY THE BOARD OF DIRECTORS |
| |
| AUDITOR’S REPORT |
| |
REPORT ON THE AUDIT OF THE FINANCIAL STATEMENTS |
| |
REPORT ON OTHER REQUIREMENTS |
| |
| GOVERNANCE STATEMENT |
| |
REPORT OF THE CONTROL COMMITTEE CHAIRMANSHIP |
| |
| REPORT OF THE CONTROL COMMITTEE |
| |
| |
| |
| |
| |
| |
| |
| |
| |
| |
| |
| |
| |
| |
| |
| |
| |
| |
| |
| |
| |
| |
| |
| |
| |
| |
| |
| |
Report on other requirements
OPINION
In addition to our audit of the financial statements, we have also audited the administration of the Board of Directors and the President of Nordic Investment Bank for the year 2021 in accordance with the Terms of the Engagement. In our opinion the administration of the Board of Directors and the President, in all material aspects, complied with the Statutes of the Bank.
BASIS FOR OPINION
We conducted the audit in accordance with generally accepted auditing standards. Our responsibilities under those standards are further described in the Auditor’s Responsibilities section. We are independent of the Bank in accordance with professional ethics for accountants and have otherwise fulfilled our ethical responsibilities in accordance with these requirements.
We believe that the audit evidence we have obtained is sufficient and appropriate to provide a basis for our opinions.
RESPONSIBILITIES OF THE BOARD OF DIRECTORS AND THE PRESIDENT
All the powers of the Bank are vested in the Board of Directors except as what is vested in the Board of Governors provided for in Section 13 of the Statutes. The Board of Directors may delegate these powers to the President to the extent considered appropriate.
The President is responsible for the conduct of the current operations of the bank and shall follow the guidelines and instructions given by the Board of Directors.
AUDITOR’S RESPONSIBILITY
Our objective concerning the audit of whether the Board of Director’s and the President’s administration have complied with the Statutes of the bank, is to obtain audit evidence to assess with a reasonable degree of assurance whether any member of the Board of Directors or the President in any material respect has acted in contravention of the Statutes.
Reasonable assurance is a high level of assurance but is not a guarantee that an audit conducted in accordance with International Standards on Auditing will always detect actions or omissions that can give rise to liability to the Bank.
As part of an audit in accordance with International Standards on Auditing, we exercise professional judgment and maintain professional skepticism throughout the audit. The examination of the administration is based primarily on the audit of the accounts. Additional audit procedures performed are based on our professional judgment with starting point in risk and materiality. This means that we focus the examination on such actions, areas and relationships that are material for the operations and where deviations and violations would have particular importance for the Bank’s situation. We examine and test decisions undertaken, support for decisions, actions taken and other circumstances that are relevant to our opinion.
AUDITOR’S APPOINTMENT
Ernst & Young Oy and Ernst & Young AB have been appointed auditors by the Control Committee since the financial year 2018. The undersigned auditors have acted as responsible auditors since financial year 2018.
Helsinki, 18 February 2022
| | |
| Ernst & Young Oy | | Ernst & Young AB |
| |
| Authorized Public | | Authorized Public |
| |
| Accountant Firm | | Accountant Firm |
| |
| Terhi Mäkinen | | Mona Alfredsson |
| |
| Authorized Public | | Authorized Public |
| |
| Accountant | | Accountant |
| | |
| | |
FINANCIAL REPORT 2021 | | NIB FINANCIAL REPORT 2021 / 99 |
| | |
|
| |
| REPORT OF THE BOARD OF DIRECTORS |
| |
| PRESIDENT AND CEO’S COMMENTS |
| |
| OPERATING AND FINANCIAL REVIEW |
| |
| CAPITAL AND LIQUIDITY MANAGEMENT |
| |
| FINANCIAL STATEMENTS |
| |
| PROPOSAL BY THE BOARD OF DIRECTORS |
| |
| AUDITOR’S REPORT |
| |
| GOVERNANCE STATEMENT |
| |
REPORT OF THE CONTROL COMMITTEE CHAIRMANSHIP |
| |
| REPORT OF THE CONTROL COMMITTEE |
| |
| |
| |
| |
| |
| |
| |
| |
| |
| |
| |
| |
| |
| |
| |
| |
| |
| |
| |
| |
| |
| |
| |
| |
| |
| |
| |
| |
Governance Statement
INTRODUCTION
NIB was established as an international financial institution on 4 December 1975 between Denmark, Finland, Iceland, Norway and Sweden by an international treaty. The Bank commenced operations on 2 August 1976. As of 1 January 2005, Estonia, Latvia and Lithuania became members on equal terms. NIB is governed by its constituent documents, which are available here. The constituent documents currently in force include the Agreement concerning the Nordic Investment Bank between its member countries of 11 February 2004 (the “Membership Agreement”) and the related Statutes. These entered into force in 2005 and both were last amended in 2020. The constituent documents also include the Host Country Agreement between the Government of Finland and the Bank of 20 October 2010.
NIB’s governance structure is set out in the Agreement and the Statutes. The Statutes define the relations between and mandate of the Bank’s governing bodies: the Board of Governors, the Board of Directors and the Control Committee. According to the Statutes, NIB also has a President and the staff necessary to carry out its operations.
NIB promotes integrity, transparency, predictability, accountability, responsibility and disclosure as general principles enhancing and furthering good governance. NIB aims to follow best practices in the field of corporate governance.
GOVERNING BODIES OF THE BANK
The governing bodies of the Bank are established pursuant to the Agreement and Statutes and carry out their functions in accordance with their respective Rules of Procedure.
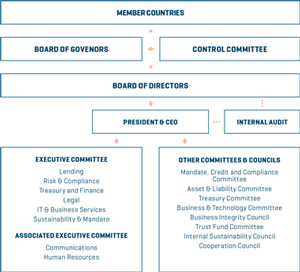
| | |
| | |
FINANCIAL REPORT 2021 | | NIB FINANCIAL REPORT 2021 / 100 |
| | |
|
| |
| REPORT OF THE BOARD OF DIRECTORS |
| |
| PRESIDENT AND CEO’S COMMENTS |
| |
| OPERATING AND FINANCIAL REVIEW |
| |
| CAPITAL AND LIQUIDITY MANAGEMENT |
| |
| FINANCIAL STATEMENTS |
| |
| PROPOSAL BY THE BOARD OF DIRECTORS |
| |
| AUDITOR’S REPORT |
| |
| GOVERNANCE STATEMENT |
| |
REPORT OF THE CONTROL COMMITTEE CHAIRMANSHIP |
| |
| REPORT OF THE CONTROL COMMITTEE |
| |
| |
| |
| |
| |
| |
| |
| |
| |
| |
| |
| |
| |
| |
| |
| |
| |
| |
| |
| |
| |
| |
| |
| |
| |
| |
|
BOARD OF GOVERNORS
The Board of Governors has the powers granted to it in Section 13 of the Statutes. The Board of Governors is composed of eight governors. The Minister designated by it as its Governor represents each member country. The Board of Governors appoints a Chair for a term of one year according to the rotation scheme it has adopted. The Board of Governors holds an annual meeting and such other meetings as deemed appropriate.
Until 31 May 2021, the Governor for Lithuania served as Chair. This role was taken until 12 January 2021 by Vilius Šapoka who was Minister of Finance following which the new Minister of Finance of Lithuania Gintarė Skaistė was appointed. As from 1 June 2021 the Governor for Denmark, Mr Simon Kollerup Minister for Industry, Business and Financial Affairs has served as chair.
The Board of Governors held its annual meeting by written procedure on 26 March 2021.
CONTROL COMMITTEE
The Control Committee is a supervisory body established to ensure that the operations of the Bank are conducted in accordance with the Statutes. It is composed of at least 10 members with the maximum number of members being twelve. The Nordic Council and Parliaments of Estonia, Latvia and Lithuania appoint one member from each country and the Board of Governors appoint two to four members including the chair and deputy chair. The members appointed by the Board of Governors are referred to as the Chairmanship and administer the responsibilities and tasks of the full Committee, monitor the Bank’s financial position, risk levels, capital and liquidity position and oversee the performance of the audit of the Bank’s financial statements, carried out by the external auditors. The full Committee focuses on monitoring fulfilment of NIB’s purpose and in particular its mandate and mission. The full Committee and the Chairmanship each deliver a report annually to the Board of Governors concerning their monitoring tasks as set out in the Rules of Procedure. The Control Committee appoints the external auditors to carry out the audit of the Bank’s financial statements.
To enhance its governance, the Control Committee can appoint an independent expert to assist the Chairmanship in financial and audit matters.
The Control Committee holds at least one meeting each year where the annual report concerning the previous financial year shall be examined. The Chairmanship meets independently at regular intervals each year.
The Control Committee had two ordinary meetings during the year. The first ordinary meeting was held online and the second was held in hybrid mode in Oslo. The Control Committee Chairmanship held seven meetings (either online or in hybrid mode because of the pandemic situation) in 2021.
BOARD OF DIRECTORS
All the powers of the Bank that are not vested with the Board of Governors are vested with the Board of Directors. The Board of Directors approves projects to be financed by the Bank and adopts policy decisions concerning the operations of the Bank, in particular the general framework for financing, borrowing and treasury operations and their management. The Board of Directors may delegate its powers to the President to the extent it considers appropriate.
The Board of Directors is composed of eight directors and eight alternates appointed by each member country. The Board of Directors appoints from among its members a Chair and a Deputy Chair for a term of two years according to the rotation scheme adopted by the Board of Governors.
The Board of Directors held 11 meetings in 2021. Due to the ongoing pandemic, meetings were held fully online or in hybrid mode (i.e. some Members attended in person and others attended remotely via secure video call). Ms Esther Finnbogadóttir (Iceland) chaired all Board meetings, including a hybrid meeting held in Reykjavík (meeting 8/2021 on 26 August 2021). Four separate Board seminars were held.
PRESIDENT
The President is responsible for conducting the Bank’s current operations and is appointed by the Board of Directors for a term of five years at a time.
Henrik Normann was the President and Chief Executive Officer of the Bank from 1 April 2012 until 31 March 2021. The Board of Directors appointed André Küüsvek as President and CEO with effect from 1 April 2021.
| | |
| | |
FINANCIAL REPORT 2021 | | NIB FINANCIAL REPORT 2021 / 101 |
| | |
|
| |
| REPORT OF THE BOARD OF DIRECTORS |
| |
| PRESIDENT AND CEO’S COMMENTS |
| |
| OPERATING AND FINANCIAL REVIEW |
| |
| CAPITAL AND LIQUIDITY MANAGEMENT |
| |
| FINANCIAL STATEMENTS |
| |
| PROPOSAL BY THE BOARD OF DIRECTORS |
| |
| AUDITOR’S REPORT |
| |
| GOVERNANCE STATEMENT |
| |
REPORT OF THE CONTROL COMMITTEE CHAIRMANSHIP |
| |
| REPORT OF THE CONTROL COMMITTEE |
| |
| |
| |
| |
| |
| |
| |
| |
| |
| |
| |
| |
| |
| |
| |
| |
| |
| |
| |
| |
| |
| |
| |
| |
| |
| |
|
ADVISORY BODIES TO THE PRESIDENT
The President is assisted and advised by the Executive Committee, the Mandate, Credit and Compliance Committee, the Asset and Liability Committee and the Treasury Committee, which all operate in accordance with their respective Rules of Procedure.
Executive Committee
The Executive Committee assists and advises the President in general management and decision-making concerning NIB, including all aspects of the performance, policy and financial soundness of the Bank. The Executive Committee consists of the President and Heads of Department as ordinary members. In addition, the Executive Committee has two associate members. The President appoints the ordinary and associate members. The Board of Directors confirms the appointment of the ordinary members. The Executive Committee meets formally approximately twice a month.
In 2021, the Executive Committee held twenty four meetings. The meetings are ordinarily chaired by the President, who reaches decisions after having consulted the members. The Executive Committee also meets informally at the commencement of every working day.
Mandate, Credit and Compliance Committee
The Mandate, Credit and Compliance Committee assists and advises the President in management and decision-making concerning mandate, credit and related integrity and compliance matters as well as the overall risk culture of the Bank. The Committee is responsible for preparation and decision-making related to certain lending activities and counterparty ratings for lending, treasury and mandate matters. The Committee grants loans within the powers delegated to the President by the Board of Directors and in line with the guidelines and instructions given by the Board of Directors. The President exercises his executive powers concerning lending operations in the Committee. The Mandate, Credit and Compliance Committee is composed of the President and the Head of Lending, the Chief Financial Officer, the Chief Risk Officer, the General Counsel and the Head of Sustainability and Mandate. The Mandate, Credit and Compliance Committee is chaired by the President or, in the
absence of the President, another member (other than the Chief Risk Officer). The Committee meets at regular intervals every week. In 2021, the Mandate, Credit and Compliance Committee met seventy-two times
Asset and Liability Committee
The Asset and Liability Committee (“ALCO”) is a body established to assist and advise the President in monitoring and steering NIB’s balance sheet and capital adequacy development, and NIB’s risks on an aggregate level. ALCO is composed of the members of the Executive Committee and Head of Funding and Investor Relations. The President chairs the Committee. The Asset and Liability Committee meets approximately six times a year, but can convene more frequently if necessary. In 2021, the Asset and Liability Committee met nine times.
Treasury Committee
The Treasury Committee assists and advises the President in the management and decision-making concerning NIB’s Treasury operations, more specifically with respect to NIB’s capital markets (funding) and derivatives activities, asset and liability management, and portfolio management. The Treasury Committee consists of the President, the Chief Financial Officer and a designated risk officer. The President chairs the Committee. The Treasury Committee usually convenes once a month. In 2021, the Committee met four times.
Other internal committees and councils
In addition to the advisory bodies to the President, the Bank has the following permanent internal committees and councils: the Business and Technology Committee, Business Integrity Council, Trust Fund Committee, the Internal Sustainability Council and the Cooperation Council. The President is not a member of these internal committees and councils but appoints the members (save for staff representatives on the Cooperation Council who are elected by the staff). The internal committees and councils also operate in accordance with their respective Rules of Procedure or other applicable rules.
The Business and Technology Committee prioritises, directs, monitors and governs NIB’s enterprise architecture, change requests and projects to achieve NIB’s strategic goals. The Committee meets on a regular basis approximately ten times a year. In 2021, the Committee met fourteen times.
The Business Integrity Council aims to enhance the awareness of integrity and corruption risks among the Bank’s staff and stakeholders. The Council deals with both corruption prevention and cases of suspected corruption. The Council generally meets twice a year and gives recommendations to the President for decision-making. In 2021, the Council did not have a meeting.
| | |
| | |
FINANCIAL REPORT 2021 | | NIB FINANCIAL REPORT 2021 / 102 |
| | |
|
| |
| REPORT OF THE BOARD OF DIRECTORS |
| |
| PRESIDENT AND CEO’S COMMENTS |
| |
| OPERATING AND FINANCIAL REVIEW |
| |
| CAPITAL AND LIQUIDITY MANAGEMENT |
| |
| FINANCIAL STATEMENTS |
| |
| PROPOSAL BY THE BOARD OF DIRECTORS |
| |
| AUDITOR’S REPORT |
| |
| GOVERNANCE STATEMENT |
| |
REPORT OF THE CONTROL COMMITTEE CHAIRMANSHIP |
| |
| REPORT OF THE CONTROL COMMITTEE |
| |
| |
| |
| |
| |
| |
| |
| |
| |
| |
| |
| |
| |
| |
| |
| |
| |
| |
| |
| |
| |
| |
| |
| |
| |
| |
|
The Trust Fund Committee ensures that the purposes of the trust funds managed by NIB are fulfilled in the most efficient way. The Committee also approves the activity plan of the trust funds as well as proposed allocations from trust funds. The Committee gives its recommendations to the respective donor(s) for their final decision. In 2021, the Committee met six times.
The Internal Sustainability Council aims to strengthen NIB’s sustainability agenda for its in-house activities. The Council has eight members, representing functions dealing with internal sustainability matters. Decisions and action points proposed by the Council are approved by the President. The Council meets at least quarterly and reports to the Executive Committee. In 2021, the Council met six times.
The Cooperation Council aims at increasing the effectiveness of interaction between NIB and the staff and promoting communications and initiatives between NIB and the staff in issues related to working conditions and the work place. The Council consists of four members representing the Bank and four representing the staff. The President appoints the representatives of the Bank while the representatives of the staff are elected by vote. The Cooperation Council meets at least quarterly. In 2021, the Council met six times.
REMUNERATION AND INCENTIVE PROGRAMMES
The Board of Governors determines the remuneration and attendee allowance for the Board of Directors and for the Control Committee. The President’s terms of employment, including remuneration, are determined by the Board of Directors. The Control Committee approves the remuneration of the external auditors. The principles for the remuneration of staff are set out in the Compensation Regulations approved by the Board of Directors. The Bank applies a fixed salary-based system which reflects the work profile, qualifications, individual competence and the results that NIB expects the employee to achieve as well as a small performance premium programme that rewards excellent and extraordinary performance on a yearly basis.
RISK MANAGEMENT FRAMEWORK
NIB monitors international regulations and standards on risk management and takes them into account to the extent
deemed relevant and/or feasible. The Bank has established a risk, capital and liquidity management framework, with high-level statutory requirements stipulated in the Statutes and the Principles for Capital and Liquidity Management, supported by a Risk Appetite Statement (RAS), an Internal Capital Adequacy Assessment Process (ICAAP), and a Capital and Liquidity Recovery Plan.
The Bank’s risk management framework comprises risk policies and procedures formulated for the identification, measurement, monitoring and reporting of risks including a comprehensive limit system for managing the exposure to quantifiable risks. The Bank recognises that effective risk management is based on a sound risk culture, which is characterised, among other things, by a high level of awareness concerning risk and risk management in the organisation. Regular training of staff in risk-related matters is part of the Bank’s risk management practices.
The three-lines-of-defence model provides the basis for NIB’s risk governance. The model aims to provide clear segregation of duties between units that enter into business transactions with customers or otherwise expose the Bank to risk, and units in charge of risk assessment, risk measurement, monitoring and control.
At NIB the first line business functions, Lending and Treasury, are responsible for managing day-to-day risks within their own operations and activities. Lending is responsible for loan origination and mandate fulfilment in accordance with the Bank’s willingness to take risk. Treasury provides support by executing the funding strategy and managing the liquidity as well as balance sheet risks (asset and liability management).
The second line of defence consist of functions that monitor and oversee the risk-taking of the first line functions. At NIB, the Risk & Compliance department acts as the second line of defence. It independently controls the risk positions of the Bank and implements the Bank’s risk management related policies and practices as approved by the Board of Directors. The Risk & Compliance department has the overall responsibility for identifying, measuring, assessing, monitoring and reporting on risks across risk types and organisational units. The department is responsible for the Bank’s risk models, tools, policies and frameworks (like ICAAP, RAS and capital and liquidity recovery planning) as well as the day-to-day monitoring of market, liquidity and operational risks. It also monitors and reports regularly on credit risk at portfolio level and on capital and liquidity adequacy.
The Compliance function belongs to the second line of defence and oversees, coordinates and reports on matters relating to compliance and integrity risks. The Chief Compliance Officer reports to the Chief Risk Officer (CRO), has a dotted reporting line to the President and has unrestricted access to the Chair of the Board of Directors and the Chair of the Control Committee. The activities and mandate of the Integrity and Compliance Office are set forth in the Integrity and Compliance Policy.
The Chief Risk Officer (CRO) heads the Risk & Compliance department and reports to the President. The CRO is a member of the Executive Committee and the Mandate, Credit and
| | |
| | |
FINANCIAL REPORT 2021 | | NIB FINANCIAL REPORT 2021 / 103 |
| | |
|
| |
| REPORT OF THE BOARD OF DIRECTORS |
| |
| PRESIDENT AND CEO’S COMMENTS |
| |
| OPERATING AND FINANCIAL REVIEW |
| |
| CAPITAL AND LIQUIDITY MANAGEMENT |
| |
| FINANCIAL STATEMENTS |
| |
| PROPOSAL BY THE BOARD OF DIRECTORS |
| |
| AUDITOR’S REPORT |
| |
| GOVERNANCE STATEMENT |
| |
REPORT OF THE CONTROL COMMITTEE CHAIRMANSHIP |
| |
| REPORT OF THE CONTROL COMMITTEE |
| |
| |
| |
| |
| |
| |
| |
| |
| |
| |
| |
| |
| |
| |
| |
| |
| |
| |
| |
| |
| |
| |
| |
| |
| |
| |
|
Compliance Committee, with the role and purpose to ensure that risk considerations are properly taken into account, to influence decision-making and, when necessary, challenge decisions that give rise to material risk. The CRO has unrestricted access to the Chair of the Board of Directors and the Chair of the Control Committee. An important objective is to engage the senior management, Board of Directors and the Control Committee in constructive dialogue on key risk issues.
NIB’s Internal Audit adheres to international professional standards established by the Institute of Internal Auditors. The task of the Internal Audit function is to provide assurance on the effectiveness of the Bank’s internal control, risk management and governance processes, and to make recommendations to the management. Internal Audit provides an independent evaluation of the controls, risk management and governance processes. The Head of Internal Audit reports to the Board of Directors and the Control Committee and works administratively under the auspices of the President. The activities and mandate of the Internal Audit function are set forth in the Internal Audit Charter.
| | |
| | |
FINANCIAL REPORT 2021 | | NIB FINANCIAL REPORT 2021 / 104 |
| | |
|
| |
| REPORT OF THE BOARD OF DIRECTORS |
| |
| PRESIDENT AND CEO’S COMMENTS |
| |
| OPERATING AND FINANCIAL REVIEW |
| |
| CAPITAL AND LIQUIDITY MANAGEMENT |
| |
| FINANCIAL STATEMENTS |
| |
| PROPOSAL BY THE BOARD OF DIRECTORS |
| |
| AUDITOR’S REPORT |
| |
| GOVERNANCE STATEMENT |
| |
REPORT OF THE CONTROL COMMITTEE CHAIRMANSHIP |
| |
| REPORT OF THE CONTROL COMMITTEE |
| |
| |
| |
| |
| |
| |
| |
| |
| |
| |
| |
| |
| |
| |
| |
| |
| |
| |
| |
| |
| |
| |
| |
| |
| |
| |
|
Report of the Control Committee Chairmanship
To the Board of Governors of the Nordic Investment Bank.
This report from the Chairmanship has been presented to the Control Committee at its meeting on 18 February 2022.
RESPONSIBILITIES OF THE CONTROL COMMITTEE AND ITS CHAIRMANSHIP
In accordance with Section 16 of the Statutes of the Nordic Investment Bank, the Control Committee (“Committee”) has been established to monitor that the operations of the Bank are conducted in accordance with its Statutes and the Committee is responsible for appointing the external auditors to carry out the audit of the Bank’s financial statements. The Committee comprises ten members of which eight have been appointed by the Nordic Council and the Parliaments of Estonia, Latvia, and Lithuania. The remaining two members have been appointed as Chair and Deputy Chair by the Board of Governors to act as the Chairmanship, which administers the responsibilities and tasks of the Committee. More specifically, the Chairmanship focuses on overseeing the performance of the audit of the Bank’s financial statements, carried out by the external auditors, and monitors the Bank’s financial position, risk levels, and capital and liquidity positions. The Committee has engaged the services of an external independent expert with in-depth knowledge of the banking industry to assist the Chairmanship with its monitoring activities.
ACTIVITIES
There were no changes in the composition of the Chairmanship during 2021, with Mr Peter Engberg Jensen continuing as Chair and Mr Toomas Vapper as Deputy Chair. The Chairmanship met on seven occasions in fulfilling its obligations.
We, the Chairmanship, reported our activities, findings and recommendations including the status of the external audit to the Committee. The Committee has also received the Independent Auditors’ Report on the 2021 financial statements, submitted on 18 February 2022 by the authorised public accountants. In performing our obligations, we have had unrestricted access to all information, documents, and staff necessary to fulfil our supervisory tasks.
The Chairmanship meetings have several recurring agenda items. In each meeting, the President provides a business update. This is followed by the presentation of the financial position and development by the Chief Financial Officer (CFO) and the Risk & Capital Report by the Chief Risk Officer (CRO). The Head of Internal Audit presents the audit plan and results thereof on a regular basis. In addition to these recurring items, the Chief Compliance Officer, the Head of Operational Risk & Security Control, as well as the Head of Credit report their activities to us at least annually. We also meet with the external auditors on a regular basis to agree on the audit plan and reporting the results of their work. In addition to the audit of the annual financial statements, the external auditors also review the half-year interim financial statements. They perform additional reviews and audit assignments whenever required on certain areas. The Chairmanship meets with both external and internal auditors without senior management presence during the year.
FOCUS AREAS 2021
Change in Statutes and organisational structure
The Bank underwent significant change in 2020, when amendments to the Bank’s Statutes entered into force. The changes to the Statutes included:
| • | | Implementing a comprehensive risk-based framework for capital and liquidity management |
| • | | Improving institutional governance |
| • | | Discontinuing the special loan facilities for Project Investment Loans (PIL) and Environmental Investment Loans (MIL) |
Further information on the statute changes can be found here. The Bank’s organisation was also changed during 2020 to strengthen the three lines of defence structure and implement a clearer separation and clarification of roles and responsibilities between the first and second lines of the Bank.
If 2020 was the year of change, then 2021 was the year in which these changes were operationalised and embedded throughout the organisation. Several policies and procedures
| | |
| | |
FINANCIAL REPORT 2021 | | NIB FINANCIAL REPORT 2021 / 105 |
| | |
|
| |
| REPORT OF THE BOARD OF DIRECTORS |
| |
| PRESIDENT AND CEO’S COMMENTS |
| |
| OPERATING AND FINANCIAL REVIEW |
| |
| CAPITAL AND LIQUIDITY MANAGEMENT |
| |
| FINANCIAL STATEMENTS |
| |
| PROPOSAL BY THE BOARD OF DIRECTORS |
| |
| AUDITOR’S REPORT |
| |
| GOVERNANCE STATEMENT |
| |
REPORT OF THE CONTROL COMMITTEE CHAIRMANSHIP |
| |
| REPORT OF THE CONTROL COMMITTEE |
| |
| |
| |
| |
| |
| |
| |
| |
| |
| |
| |
| |
| |
| |
| |
| |
| |
| |
| |
| |
| |
| |
| |
| |
| |
| |
|
were reviewed and updated to keep up with best practices. High-level principles and requirements for managing market risks were formalised at the Policy (Board) level, and a number of policies and guidelines related to operational risks were clarified and adopted. The framework for managing model risks became operational. The Board approved the Capital and Liquidity Recovery Plan. Lastly, the Bank continued working towards a more systematic integration of sustainability / ESG (including climate risk) factors into the Bank’s core processes (lending and treasury).
Organisationally, the Bank welcomed a new President & CEO, Mr André Küüsvek and the new CFO, Mr. Kim Skov Jensen.
Governance
The Chairmanship receives and reviews multiple reports and policy updates. Key focus areas during 2021 were:
| • | | ICAAP Report FY2020, discussed in April |
| • | | Update of the Risk Appetite Statement, discussed in June |
| • | | Capital and Liquidity Recovery Plan, discussed in January, June and October |
| • | | Operational Risk and Information Security, annual report discussed in April and semi-annual report discussed in October |
| • | | Anti-Money Laundering (‘AML’) risk assessment for 2020, discussed in June |
Business and risk
Considering the ongoing coronavirus situation and related public support initiatives across the region, the impact on the Bank’s operations were discussed at length. In particular, this concerned the high levels of liquidity in the marketplace and subsequent impact on interest rates, lending activities and related margins. Also discussed was the operational impact of remote working and the safety of staff.
During 2021, the internal audit – in conjunction with an external consultancy firm – performed an audit of the IT vision and current state. This was an extensive exercise resulting in several findings, the resolution of which has been monitored by the Chairmanship. Information security and business continuity has been high on the Bank’s agenda and we have received regular updates on the Bank’s information security roadmap, including the
new information security assessment guidelines. The Chairmanship has also reviewed and discussed updates to the Bank’s risk management framework, including the Risk Appetite Statement, Risk Management Policy, the Corporate and Project Rating Framework, the new Market Risk Policy and Model Risk Management Policy and Guidelines.
RISK MANAGEMENT
Monitoring of the limits and thresholds set in the Statutes and by the Board of Governors is the responsibility of the Board of Directors who have fulfilled this obligation through the establishment of necessary frameworks, policies and procedures for the Banks’s risk, capital, leverage and liquidity management, as well as detailed policies for contingency measures and procedures. The main framework document in this regard is the Risk Appetite Statement (RAS), which was adopted in its most recent version by the Board of Directors on 10 June 2021. The RAS outlines the main considerations in the Bank’s risk-taking, risk mitigation and risk avoidance. The Bank’s risk appetite is reviewed annually by the Board of Directors with the goal of aligning risk-taking with the statutory requirements, strategic business objectives, and capital planning. The qualitative statements in the Bank’s RAS are complemented with a set of key risk indicators and their respective monitoring thresholds, including (amongst others) economic capital consumption, leverage ratios, external indicators (e.g. credit rating agencies), and liquidity survival horizon. The purpose of the indicators and thresholds is to support the evaluation of whether the Bank operates within its risk appetite. Risk limits are used to allocate the aggregate risk-taking mandate to business lines and portfolios. The main risk limits are established in the Bank’s Risk Management Policies, which are approved by the Board of Directors.
The resulting risk profile of the Bank is assessed as within the risk limits and consequently within the risk appetite. The risk profile assessment is a point in-time evaluation of the level and types of the Bank’s risk exposures. The assessment includes an evaluation of the Bank’s material risks, foremost credit risk, market risk, liquidity risk and operational risk. The risk profile assessment is based on the Bank’s Internal Capital Adequacy Assessment Process (ICAAP), which also includes an assessment of liquidity adequacy. While the Bank is not directly subject to banking regulation or supervision, it is the Chairmanship’s view that the ICAAP nevertheless in all material aspects follows relevant regulatory guidelines and market practices to produce an assessment of the Bank’s capital and liquidity requirements. The resulting capital and liquidity requirements are compared against the Bank’s risk appetite
| | |
| | |
FINANCIAL REPORT 2021 | | NIB FINANCIAL REPORT 2021 / 106 |
| | |
|
| |
| REPORT OF THE BOARD OF DIRECTORS |
| |
| PRESIDENT AND CEO’S COMMENTS |
| |
| OPERATING AND FINANCIAL REVIEW |
| |
| CAPITAL AND LIQUIDITY MANAGEMENT |
| |
| FINANCIAL STATEMENTS |
| |
| PROPOSAL BY THE BOARD OF DIRECTORS |
| |
| AUDITOR’S REPORT |
| |
| GOVERNANCE STATEMENT |
| |
REPORT OF THE CONTROL COMMITTEE CHAIRMANSHIP |
| |
| REPORT OF THE CONTROL COMMITTEE |
| |
| |
| |
| |
| |
| |
| |
| |
| |
| |
| |
| |
| |
| |
| |
| |
| |
| |
| |
| |
| |
| |
| |
| |
| |
| |
| |
| |
and risk-bearing capacity. This process creates a continuous reinforcing interaction between the RAS and the ICAAP. During 2021, the Bank’s ICAAP Methodology was further improved to reflect a number of recommendations following multiple external reviews since 2019.
The Chairmanship engaged the independent external auditors (EY) to perform specific procedures with regards to the accuracy of NIB’s calculation of statutory metrics and their consistency with the Bank’s risk management framework. This assignment is more limited in scope than the more comprehensive external review made last year when the new Principles for Capital & Liquidity Management entered into force. The Chairmanship’s view is that NIB is adequately capitalised and has sufficient liquidity.
FINANCIAL, CAPITAL AND LIQUIDITY POSITIONS
Financial position
| | | | | | | | |
| | | |
In millions of euro unless
otherwise specified | | 2021 | | | 2020 | |
| | |
Net interest income | | | 201 | | | | 206 | |
| | |
Net profit | | | 159 | | | | 165 | |
| | |
| | | | | | | | |
| | |
Loans disbursed | | | 2,440 | | | | 4,853 | |
| | |
New debt issues | | | 7,028 | | | | 7,540 | |
| | |
| Total equity | | | 3,999 | | | | 3,861 | |
| | |
| | | | | | | | |
| | |
Equity / total assets | | | 10.6% | | | | 10.9% | |
| | |
Profit / average equity | | | 4.1% | | | | 4.4% | |
| | |
Cost/income | | | 27.9% | | | | 19.1% | |
| | |
Numer of people at period end | | | 221 | | | | 222 | |
The net profit for the year amounted to EUR 159 million, which is EUR 6 million lower than last year. Total operating income decreased from EUR 274 million to EUR 185 million mainly due to a decrease in net profit on financial operations of EUR 82 million. Net interest income decreased by EUR 4 million and net fee and commission income decreased by EUR 2 million. Total operating expenses of EUR 51 million were EUR 1 million lower than in 2020. Aligned with macro-financial developments and the resilience of the Bank’s asset quality, the expected credit loss (‘ECL’) provision was reduced, resulting in a EUR 26 million reversal in net loan losses. There were no realised loan losses or new non-performing exposures during the year.
Capital and liquidity positions
The Principles for Capital and Liquidity Management approved by the Board of Governors state that the Bank’s risk-based capital ratio must exceed 100 per cent, the Bank’s leverage ratio must exceed 7 per cent and the leverage ratio with callable capital shall exceed 20 per cent and that the Bank’s liquidity survival horizon shall exceed six months. The table below provides an overview on the development of these requirements year on year.
| | | | | | | | | | | | |
| | | | |
| Statutory metrics | | Minimum | | | 2021 | | | 2020 | |
| | | |
Risk-based (economic) capital ratio | | | 100% | | | | 147% | | | | 142% | |
| | | |
Leverage ratio | | | 7.0% | | | | 10.6% | | | | 11.1% | |
| | | |
Leverage ratio with callable capital | | | 20.0% | | | | 30.9% | | | | 32.9% | |
| | | |
Liquidity survival horizon (days) | | | 180 | | | | 450 | | | | 418 | |
CONCLUSION
We can confirm that the Bank’s 2021 financial statements have been audited by independent external auditors. We also confirm through the procedures described above that we have monitored the Bank’s financial position, risk levels and capital, leverage and liquidity positions and that the reported statutory metrics are above the minimum thresholds stipulated in the Statutes of the Bank.
Helsinki, 17 February 2022
Peter Engberg Jensen (Chairman of the Control Committee)
Toomas Vapper (Deputy Chairman of the Control Committee)
| | |
| | |
FINANCIAL REPORT 2021 | | NIB FINANCIAL REPORT 2021 / 107 |
| | |
|
| |
| REPORT OF THE BOARD OF DIRECTORS |
| |
| PRESIDENT AND CEO’S COMMENTS |
| |
| OPERATING AND FINANCIAL REVIEW |
| |
| CAPITAL AND LIQUIDITY MANAGEMENT |
| |
| FINANCIAL STATEMENTS |
| |
| PROPOSAL BY THE BOARD OF DIRECTORS |
| |
| AUDITOR’S REPORT |
| |
| GOVERNANCE STATEMENT |
| |
REPORT OF THE CONTROL COMMITTEE CHAIRMANSHIP |
| |
| REPORT OF THE CONTROL COMMITTEE |
| |
| |
| |
| |
| |
| |
| |
| |
| |
| |
| |
| |
| |
| |
| |
| |
| |
| |
| |
| |
| |
| |
| |
| |
| |
| |
|
Report of the Control Committee
To the Board of Governors of the Nordic Investment Bank.
In accordance with Section 16 of the Statutes of the Nordic Investment Bank, the Control Committee (“Committee”) has been established to monitor that the operations of the Bank are conducted in accordance with its Statutes and to be responsible for appointing the external auditors to carry out the audit of the Bank’s financial statements. The Committee comprises ten members of which eight have been appointed by the Nordic Council and the Parliaments of Estonia, Latvia and Lithuania. The remaining two members have been appointed as Chair and Deputy Chair by the Board of Governors to act as the Chairmanship, which administers the responsibilities and tasks of the Committee. The Chairmanship oversees the performance of the audit of the Bank’s financial statements, carried out by the external auditors, and monitors the Bank’s financial position, risk levels and capital and liquidity position. Having completed our assignment for the year 2021, the Committee hereby submit the following report.
The Committee met twice in 2021 and its Chairmanship met on eight occasions. The Chairmanship has reported its activities, findings and recommendations including status of the external audit to us. We have also received the Independent Auditors’ Report on the 2021 financial statements, submitted on 18 February 2022 by the authorised public accountants. In performing its obligations, the Committee and its Chairmanship has had unrestricted access to all information, documents and staff necessary to fulfil its supervisory tasks.
The Bank’s mission is to finance projects that improve the productivity and benefit the environment of the Nordic and Baltic countries. During 2021, a total of EUR 1,852 million in new loans were agreed and EUR 2,440 million was disbursed. Before approval is given, all eligible projects are evaluated and rated against the mandate criteria developed based on the Bank’s mission. During 2021 mandate rated projects achieving a “good” or “excellent” mandate rating accounted for 97% of the total amount of loans disbursed exceeding the target level of 90% by a healthy margin.
We can confirm that the Bank’s 2021 financial statements have been audited by independent external auditors and that the Control Committee Chairmanship has reported its activities, findings and recommendations to us. Based on these activities, we confirm that we have monitored the Bank’s financial position, risk levels, and capital, leverage and liquidity positions and that the reported statutory metrics are in accordance with the Statutes of the Bank.
We recommend to the Board of Governors that:
| - | the allocation of the Bank’s profit as proposed by the Board of Directors, be approved; |
| - | the audited financial statements for 2021 be approved. |
| | | | | | | | |
| | Helsinki, 18 February 2022 | | |
| | |
Peter Engberg Jensen (Chair) | | | | Toomas Vapper (Deputy Chair) |
| | |
Sjúrður Skaale | | Aivar Kokk | | Wille Rydman |
| | |
Vilhjálmur Árnason | | Ilze Indriksone | | Algirdas Butkevičius |
| | | |
Michael Tetzschner | | Johan Andersson | | | | |