| | |

| | |
| | |
ANNUAL REPORT 2022 | |  2 2 |
|
About this report: For 2022, NIB is publishing one combined report covering our activities, impact, sustainability, and financial reporting. NIB’s Intergity Report 2022 is available here. |
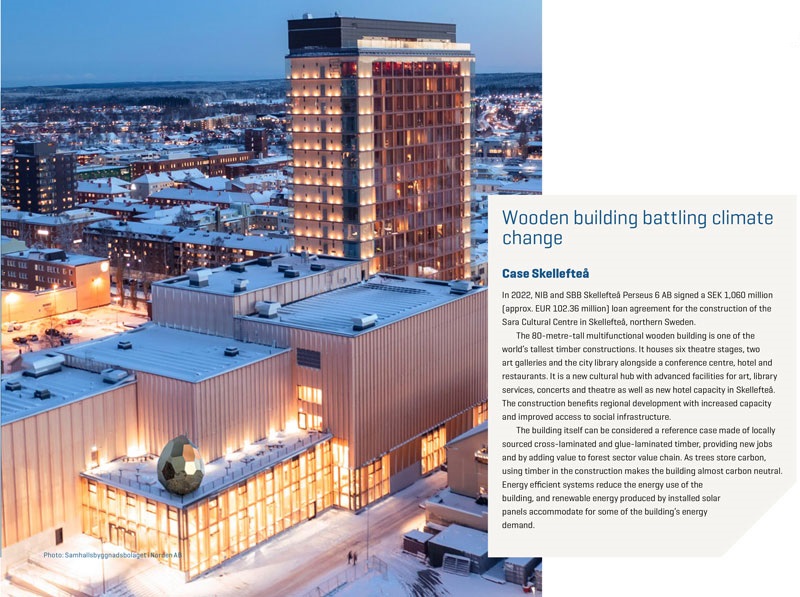
Cover images: Ville Maali and Boliden AB.
| | |
| | |
| | |
ANNUAL REPORT 2022 | | 4 |
| | |
|
| |
| INTRODUCTION |
| |
u This is NIB |
| |
Our year |
| |
CEO message |
| |
Strategy |
| |
Value creation |
| |
| IMPACT |
| |
| GOVERNANCE |
| |
| BOD REPORT |
| |
| FINANCIALS |
| |
| SUSTAINABILITY INDICES |
| |
| |
| |
| |
| |
| |
| |
| |
| |
| |
| |
| |
| |
| |
| |
| |
| |
| |
| |
| |
| |
| |
| |
| |
| |
| |
| |
| |
| |
| |
| |
| |
| |
| |
| |
| |
| |
| |
| |
| |
This is NIB

| | |
| | |
| | |
ANNUAL REPORT 2022 | | 5 |
| | |
|
| |
| INTRODUCTION |
| |
This is NIB |
| |
u Our year |
| |
CEO message |
| |
Strategy |
| |
Value creation |
| |
| IMPACT |
| |
| GOVERNANCE |
| |
| BOD REPORT |
| |
| FINANCIALS |
| |
| SUSTAINABILITY INDICES |
| |
| |
| |
| |
| |
| |
| |
| |
| |
| |
| |
| |
| |
| |
| |
| |
| |
| |
| |
| |
| |
| |
| |
| |
| |
| |
| |
| |
| |
| |
| |
| |
| |
| |
| |
| |
| |
| |
| |
| |
Our year
Lending disbursed includes loans, labelled bonds and MREL investments.
| | |
| | |
| | |
ANNUAL REPORT 2022 | | 6 |
| | |
|
| |
| INTRODUCTION |
| |
This is NIB |
| |
Our year |
| |
u CEO message |
| |
Strategy |
| |
Value creation |
| |
| IMPACT |
| |
| GOVERNANCE |
| |
| BOD REPORT |
| |
| FINANCIALS |
| |
| SUSTAINABILITY INDICES |
| |
| |
| |
| |
| |
| |
| |
| |
| |
| |
| |
| |
| |
| |
| |
| |
| |
| |
| |
| |
| |
| |
| |
| |
| |
| |
| |
| |
| |
| |
| |
| |
| |
| |
| |
| |
| |
| |
| |
| |
Message from the President and CEO
Navigating the storm together
| | |
It was yet another stormy year, with Russia’s war in Ukraine bringing dark clouds over the free world. The aggression keeps causing terrible suffering to the Ukrainian people, whilst also leaving its footprints well beyond the country’s borders. For our member countries, it has not only changed the security landscape but also brought new societal challenges that have thundered all across Europe. On the heels of what seemed a strong post COVID-19 recovery, the war carried new supply-demand imbalances and record-high energy costs that led to inflation, higher interest rates and financial market volatility. Yet, this storm has also cleared the skies for new opportunities. It has underlined the need to end the dependence on malicious fossil fuels and secure cleaner energy supply for generations to come. It has made it ever more evident that we need to push even harder to accelerate the transition to low-carbon economies. Here, NIB has a key part to play. Our mandate to finance projects that improve productivity and benefit the environment is more important than ever. So is our stabilising role: as the increased uncertainty makes other financiers more reluctant to lend, we continue to support our clients. With our long-term lending, NIB’s customers can tackle the issues of today while keeping their sights on a sustainable future. In for the long journey The increased demand for NIB’s financing shows that Nordic-Baltic borrowers are committed to this journey. During the year, | | 
|
| | |
| | |
| | |
ANNUAL REPORT 2022 | | 7 |
| | |
|
| |
| INTRODUCTION |
| |
This is NIB |
| |
Our year |
| |
u CEO message |
| |
Strategy |
| |
Value creation |
| |
| IMPACT |
| |
| GOVERNANCE |
| |
| BOD REPORT |
| |
| FINANCIALS |
| |
| SUSTAINABILITY INDICES |
| |
| |
| |
| |
| |
| |
| |
| |
| |
| |
| |
| |
| |
| |
| |
| |
| |
| |
| |
| |
| |
| |
| |
| |
| |
| |
| |
| |
| |
| |
| |
| |
| |
| |
| |
| |
| |
| |
| |
| |
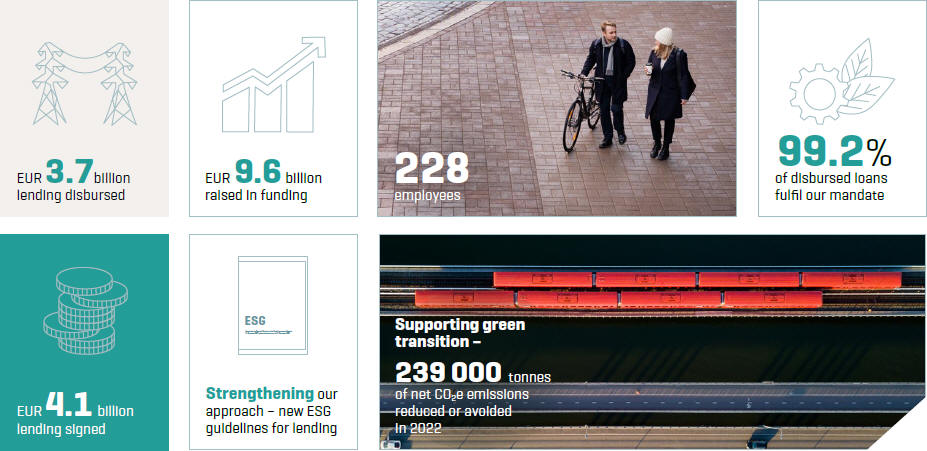
we disbursed EUR 3.7 billion to our clients and signed EUR 4.1 billion in new lending. These agreements include renewable energy generation, transmission networks and energy efficiency improvements – all to make our region more resilient.
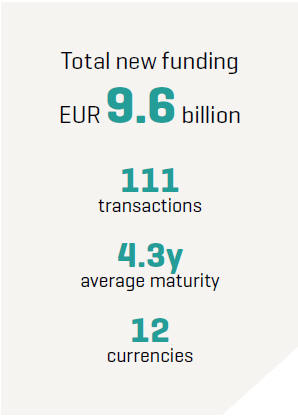
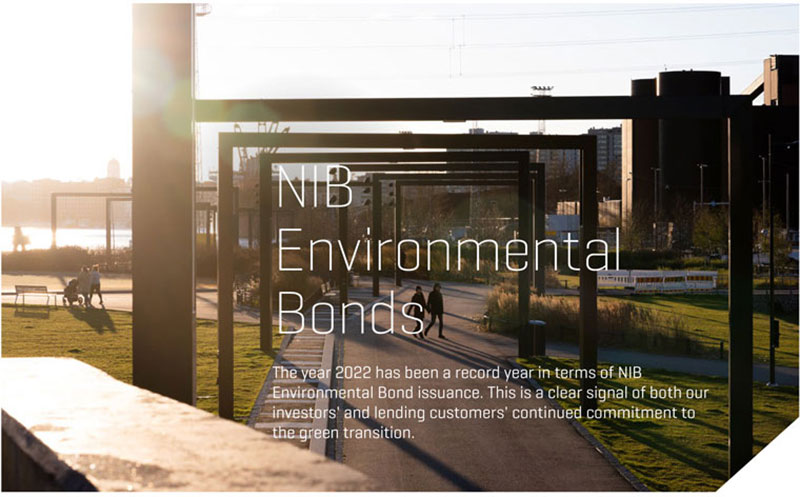
To meet these needs, we raised a record-high EUR 9.6 billion in new funding. For the first time since we started offering NIB Environmental Bonds (NEB), our environmental issuance for the year surpassed EUR 1 billion. NEB transactions in EUR, DKK, NOK and SEK enabled our investors to directly channel funds to the most environmentally sound projects close to their homes.
During 2022, we saw a significant increase in interest rates as central banks started to address high inflation levels. Combined with higher credit spreads and increasing lending volumes, this resulted in a net interest income of EUR 219 million compared to EUR 201 million in 2021. Our loan portfolio remains solid.
While the turmoil in the financial markets temporarily affected unrealised valuations in financial operations and other comprehensive income negatively, some of these reversed in the later part of the year. Our total net profit for 2022 amounted to EUR 139 million compared to EUR 159 million in the previous year.
Staying on course
Despite the turbulence, we remain on course in implementing NIB’s business strategy, which aims to sharpen our capabilities to support the green transition and mobilise climate finance.
During the year, we further strengthened our organisation and focused on promoting an inclusive workplace and leadership development. We restructured our internal committees to bring experts and middle management closer to the decision-making, as well as to streamline the way we work.
With our long- term lending, NIB’s customers can tackle the issues of today while keeping their sights on a sustainable future.
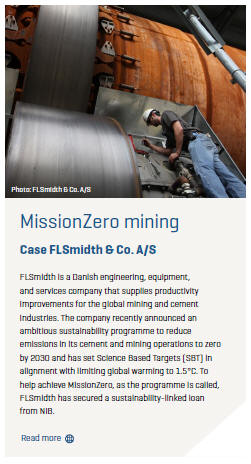
Together with our clients, we continued to mainstream sustainability-linked lending by connecting financing to their ambitious climate targets and corporate strategies. In 2022, we signed four sustainability-linked loans, including sustainable transitions of the energy sector and sectors supporting hard-to-abate cement and mining industry.
In December, we joined the InvestEU programme to further mobilise investment for sustainable energy infrastructure as well as for research, innovation and digitalisation. As an implementing partner of the European Commission guarantee programme, we will be able to take more risk in these areas and enhance our lending to small and medium-sized and mid-cap companies.
As for the way ahead, NIB will proceed with developing the toolbox that supports its clients and owners in achieving their energy independence and climate resilience goals. In 2023, we will finalise NIB’s climate strategy and continue integrating ESG factors in our loan assessment. These developments
will consolidate sustainability as the cornerstone of NIB’s operations.
In light of this, we will also be more ambitious in the fulfilment of our mandate. NIB’s Board of Directors approved our target of 95% of loan disbursements to achieve a “good” or “excellent” rating on its impact on either environment or productivity in 2023.
Guided by the green light
Although the direction is clear, the road remains winding. The ongoing war, inflationary pressures and the volatility in the energy and financial markets have made predictions of the economic environment even foggier.
Contrary to some of Russia’s war objectives, however, the challenges that sought to divide us have brought us ever closer together. We shall keep building on this cooperation further.
During the year, I met with various NIB stakeholders and counterparties – from Nordic-Baltic ministers and ambassadors, public servants or non-governmental institutions to our investors and existing or potential borrowers. They all shared a common goal to come out of this crisis stronger.
To all of them, I also had a common message: we are your Bank – use us.
The storm is likely far from over. Yet even after the darkest of times, the light always comes. By working together, we can let it shine greener than ever before.
André Küüsvek, President and CEO
| | |
| | |
| Read the Report of the Board of Directors | | |
| | |
| | |
| | |
ANNUAL REPORT 2022 | | 8 |
| | |
|
| |
| INTRODUCTION |
| |
This is NIB |
| |
Our year |
| |
CEO message |
| |
u Strategy |
| |
Value creation |
| |
| IMPACT |
| |
| GOVERNANCE |
| |
| BOD REPORT |
| |
| FINANCIALS |
| |
| SUSTAINABILITY INDICES |
| |
| |
| |
| |
| |
| |
| |
| |
| |
| |
| |
| |
| |
| |
| |
| |
| |
| |
| |
| |
| |
| |
| |
| |
| |
| |
| |
| |
| |
| |
| |
| |
| |
| |
| |
| |
| |
| |
| |
| |
NIB’s business strategy and implementation
| | | | | | |
NIB supports the Nordic and Baltic member countries in their decarbonisation plans to achieve climate neutrality by 2050. The Bank complements its financial and investment product offering with sustainability expertise for its clients and investors. NIB is committed to further developing its value proposition based on active dialogue with all its stakeholders on sustainability matters and market needs. In addition to the twin mandates of environment and productivity, the key objectives of NIB’s business strategy are to develop the client and owner value proposition, enhance additionality, and improve capital accumulation while maintaining the Bank’s AAA rating. The drivers of our environmental mandate comprise climate change mitigation, preventive measures (including climate change adaptation), circular economy and pollution reduction. The productivity growth drivers include technical progress and innovation, infrastructure improvements, human capital and equal economic opportunities, and development and improvements in market effciency and the business environment. All projects considered for financing are assessed for their potential impact on the environment and productivity and NIB sets annual targets for the mandate fulfilment of loans. | | | | NIB offers environmental and productivity loans based on its mandate and funds the green loans by issuing NIB Environmental Bonds (NEBs). Since 2021, NIB also provides sustainability-linked loans for financing the sustainability transformation of companies and their value chains to ambitious and credible sustainability targets, expanding the Bank’s product range and impact. During 2022 99.2% of new disbursements received a good or excellent mandate rating (from the mandate rated projects1). EUR 561 million were committed to borrowers operating in hard-to-abate sectors such as chemicals, metals and mining, and transportation and logistics. NIB is also committed to the 30-by-30 pledge made at COP26 and aims to finance projects that | | have a positive environmental impact2 in the amount of at least EUR 30 billion, by the end of 2030. In 2021 and 2022 together, the total cumulative disbursement amount to environmental projects reached EUR 3.37 billion, therefore inducing projects in total of roughly EUR 7.5 billion3 and proving that NIB is on track to achieve the commitment. 1 No mandate rating is performed for response loans. These loans are issued on a specific mandate given by the Bank’s owners. 2 Total project costs in EUR for the loans that have received “good” or “excellent” rated environmental mandate. 3 Taking into account that NIB typically finances up to 50% of a total project costs. |
| | The annual mandate fulfilment targets 2022–2023 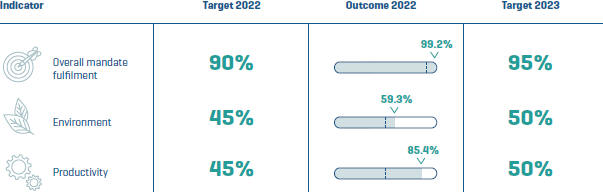
|
| | |
| | |
| | |
ANNUAL REPORT 2022 | | 9 |
| | |
|
| |
| INTRODUCTION |
| |
This is NIB |
| |
Our year |
| |
CEO message |
| |
u Strategy |
| |
Value creation |
| |
| IMPACT |
| |
| GOVERNANCE |
| |
| BOD REPORT |
| |
| FINANCIALS |
| |
| SUSTAINABILITY INDICES |
| |
| |
| |
| |
| |
| |
| |
| |
| |
| |
| |
| |
| |
| |
| |
| |
| |
| |
| |
| |
| |
| |
| |
| |
| |
| |
| |
| |
| |
| |
| | | | | | |
| | Developing the climate strategy Work on climate strategy and integrating climate risk into the Bank’s activities continued in 2022. The Bank identified the focus areas and the most carbon intensive exposures and sectors in its lending portfolio. In 2023, NIB will finalise its climate strategy and set targets. NIB intends to follow the market guidance on net zero transition plans for the financial institutions published by the Glasgow Financial Alliance for Net Zero. The Bank will continue to support the build-out of renewable capacities to further advance the transition of the power and heat sector and to enhance the electrification of the Nordic and Baltic economies. NIB also aims to focus more on financing the high-impact transitions in the hard-to-abate sectors, such as heavy industry and heavy-duty transport and in sectors, where the Bank’s clients face the challenge of improving the climate performance of their value chains. | | | | this guarantee to mobilise investments of up to EUR 480 million in clean energy, the modernisation and decarbonisation of industry, critical raw materials supply, sustainable transport, environmental protection, bioeconomy, digital connectivity, and sustainable data infrastructure. The initiative thus supports NIB’s objective of delivering higher additionality and client value by enhancing the access of long-term financing to the under-served market segments. |
| | 
| | Developing capital markets NIB also continued supporting the development of debt capital markets in the member country region by investing in sustainability and sustainability-linked bonds as well as Baltic commercial paper, with the focus on first time issuers. In addition, NIB invested EUR 94.8 million into Nordic-Baltic MREL issuances, with the Bank’s product focus being on smaller financial institutions with lower access to the capital markets. With MREL investments, the Bank supports the financial institutions in the member countries fulfil their regulatory requirements whilst utilising the financing vehicle for SME on-lending. Enhancing additionality Broadening the risk profile of new lending was identified as an important step in enhancing our additionality and being more accessible to borrowers with a less diverse funding base. In 2022, the share of lending to sub-investment grade counterparties was 19% (EUR 707 million), compared to an average of 12% of all disbursements over the preceding 5 years. This step also contributes to greater profitability, enabling the accumulation of capital for the future fulfilment of NIB’s mission – to finance projects that improve productivity and benefit the environment of the Nordic and Baltic countries. |

| | Closer to our owners and clients Enhancing our additionality and delivering a higher value proposition to our clients and owners are cornerstones of NIB’s business strategy. In order to develop, coordinate and maintain key stakeholder relationships and networks within a member country, the Bank appointed Country Leads for each of the Nordic-Baltic countries, with the responsibility of liaising with governments, public agencies and regulators, business associations, corporates and financial institutions – bringing NIB closer to its clients and owners. | | 
|

| | Mobilising green investments In 2022, NIB became one of the first implementation partners under the InvestEU programme, which provides an EU budgetary guarantee to implementing partners to increase their risk-taking capacity and therefore contributes to mobilising public and private investment for the EU’s policy priorities. NIB will use |
| | |
| | |
| | |
ANNUAL REPORT 2022 | | 10 |
| | |
|
| |
| INTRODUCTION |
| |
This is NIB |
| |
Our year |
| |
CEO message |
| |
Strategy |
| |
u Value creation |
| |
| IMPACT |
| |
| GOVERNANCE |
| |
| BOD REPORT |
| |
| FINANCIALS |
| |
| SUSTAINABILITY INDICES |
| |
| |
| |
| |
| |
| |
| |
| |
| |
| |
| |
| |
| |
| |
| |
| |
| |
| |
| |
| |
| |
| |
| |
| |
| |
| |
| |
| |
| |
| |
| |
| |
| |
| |
| |
| |
| |
| |
| |
| |
How we create long-term value
| | |
| | |
| | |
ANNUAL REPORT 2022 | | 12 |
| | |
|
| |
| INTRODUCTION |
| |
| IMPACT |
| |
u Lending impact |
| |
Funding in 2022 |
| |
NIB Environmental Bonds |
| |
NIB and climate change |
| |
Internal impact |
| |
Impactful workplace |
| |
Sustainability management |
| |
About this report |
| |
Independent Assurance Report |
| |
| GOVERNANCE |
| |
| BOD REPORT |
| |
| FINANCIALS |
| |
| SUSTAINABILITY INDICES |
| |
| |
| |
| |
| |
| |
| |
| |
| |
| |
| |
| |
| |
| |
| |
| |
| |
| |
| |
| |
| |
| |
| |
| |
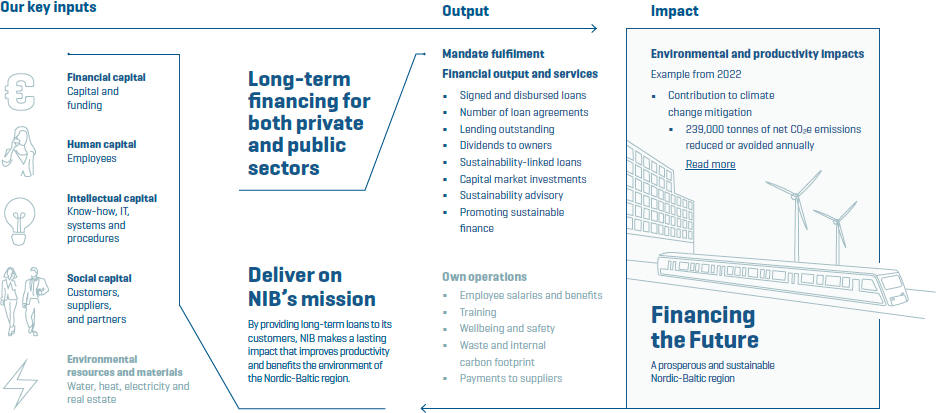
Impact of NIB’s lending
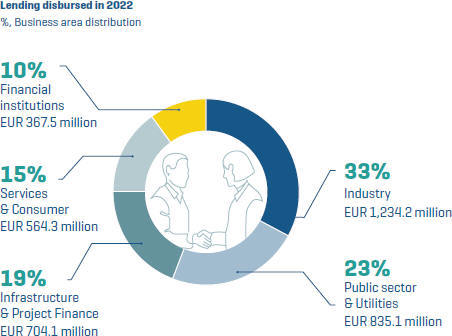
In 2022, a total of EUR 3,527 million in loans1 was disbursed. The increased demand was reflected in the volume of signed loans which was EUR 3,936 million. Lending outstanding at year-end amounted to EUR 22,195 million.
The largest share of disbursements were channelled to the sectors of transmission/ distribution of energy (EUR 577 million, 16% of disbursed loans),
R&D investments (EUR 477 million, 14%) , green buildings (EUR 363 million, 10%), and energy generation (EUR 357 million, 10%).
Overall, the total disbursements contributed to quantifiable impacts of 239,000 tonnes of net CO2 emissions reduced or avoided annually and total expected renewable energy generation annually of 693.2 GWh.
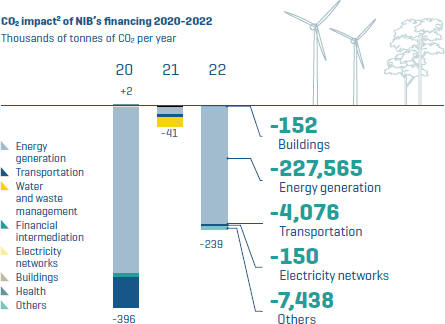
1 Excluding labelled bonds and MREL investments.
2 Calculated from the disbursed and pro-rated loans.
| | |
| | |
| | |
ANNUAL REPORT 2022 | | 13 |
| | |
|
| |
| INTRODUCTION |
| |
| IMPACT |
| |
u Lending impact |
| |
Funding in 2022 |
| |
NIB Environmental Bonds |
| |
NIB and climate change |
| |
Internal impact |
| |
Impactful workplace |
| |
Sustainability management |
| |
About this report |
| |
Independent Assurance Report |
| |
| GOVERNANCE |
| |
| BOD REPORT |
| |
| FINANCIALS |
| |
| SUSTAINABILITY INDICES |
| |
| |
| |
| |
| |
| |
| |
| |
| |
| |
| |
| |
| |
| |
| |
| |
| |
| |
| |
| |
| |
| |
| |
| |
Impact of loans disbursed in 2022
NIB’s share
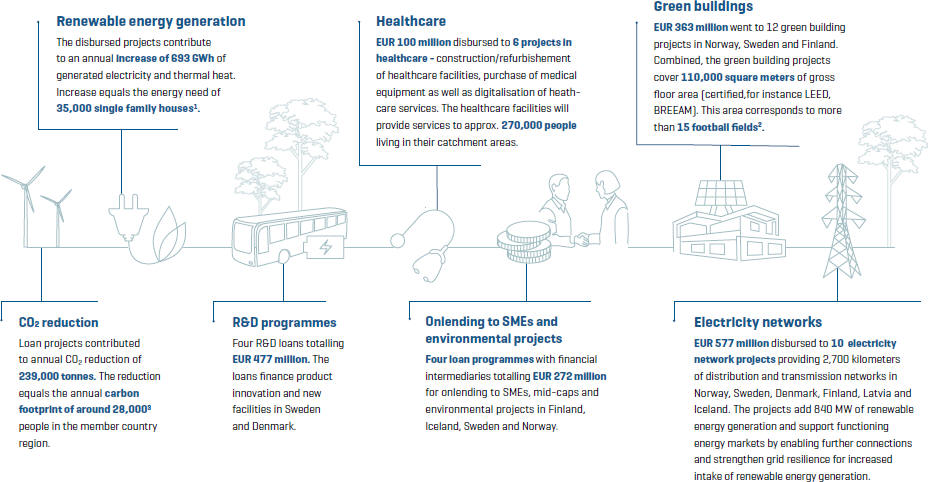
More information on how we calculate impact can be found on our website.
1 Assuming that one single family house in the member country area consumes around 20 MWh per year.
2 Assuming that one football field is 7140 m2. 3 By assuming greenhouse gases of 8.6 tonnes per capita, based on data of Eurostat for member country area in the years 2018-2020.
| | |
| | |
| | |
ANNUAL REPORT 2022 | | 14 |
| | |
|
| |
| INTRODUCTION |
| |
| IMPACT |
| |
u Lending impact |
| |
Funding in 2022 |
| |
NIB Environmental Bonds |
| |
NIB and climate change |
| |
Internal impact |
| |
Impactful workplace |
| |
Sustainability management |
| |
About this report |
| |
Independent Assurance Report |
| |
| GOVERNANCE |
| |
| BOD REPORT |
| |
| FINANCIALS |
| |
| SUSTAINABILITY INDICES |
| |
| |
| |
| |
| |
| |
| |
| |
| |
| |
| |
| |
| |
| |
| |
| |
| |
| |
| |
| |
| |
| |
| |
| |
Supporting the
green transition
During its nearly half-a-century long experience, NIB has proven its strengths not only in financing well planned sustainable developments but also in swiftly reacting to extraordinary situations. Last year was no exception.
Russia’s aggression in Ukraine pushed Europe into an energy crisis and the need for action is urgent. Europe must build up its energy resilience and accelerate its transition to a low-carbon economy. Energy efficiency – in industry and homes – as well as renewable energy generation need to be scaled up now.
In 2022, 26% of disbursements were channelled to the energy-related investments which also reflects the largest challenges and need for financing the member countries have been facing lately.
For instance, along with 2,700 km of transmission and distribution infrastructure, we supported six wind parks in Sweden and Baltics with the capacity of 192.4 GW and new hydro-energy capacities in Norway. This equals the annual carbon footprint of 209,000 tonnes of CO2 equivalent, which corresponds to yearly emission of approximately 24,000 people in our region.
In addition, NIB financed R&D
efforts in the transportation
sector to develop of next-
generation vehicles.
| | |
| | |
| | |
ANNUAL REPORT 2022 | | 15 |
| | |
|
| |
| INTRODUCTION |
| |
| IMPACT |
| |
u Lending impact |
| |
Funding in 2022 |
| |
NIB Environmental Bonds |
| |
NIB and climate change |
| |
Internal impact |
| |
Impactful workplace |
| |
Sustainability management |
| |
About this report |
| |
Independent Assurance Report |
| |
| GOVERNANCE |
| |
| BOD REPORT |
| |
| FINANCIALS |
| |
| SUSTAINABILITY INDICES |
| |
| |
| |
| |
| |
| |
| |
| |
| |
| |
| |
| |
| |
| |
| |
| |
| |
| |
| |
| |
| |
| |
| |
| |
| |
| |
| | | | |
Projects contributing to the climate and energy transition 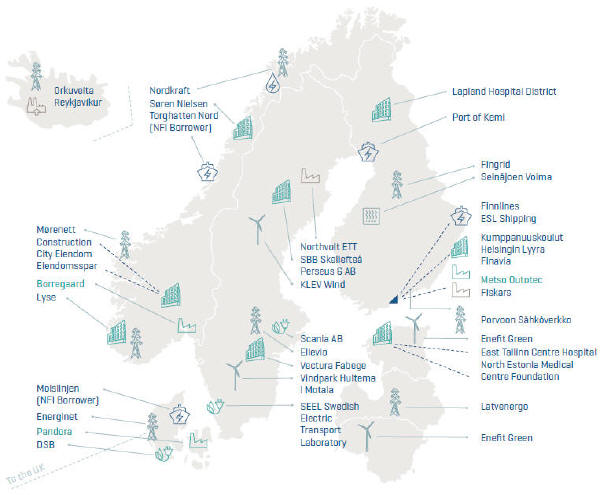
| | In 2022, our disbursed loans contributed to the energy sector in each of the member countries through new renewable energy capacities, upgrades and expansion of transmission and distribution networks that allow connecting more of green energy to the grid, increasing energy efficiency, and implementation of industry transformation measures. These projects are not only in line with the climate targets of our member countries and the Paris Agreement, but also help to increase energy independence of the Nordic-Baltic region. |
| |  | | Industry transformation Industry transformation (SLL1) Electric or hybrid inland transport solutions Electric or hybrid vessels or related port infrastructure Green buildings or energy saving measures Wind energy generation Hydro energy generation Geothermal energy generation District heating Energy networks Interconnector |
| | | | 1 Sustainability-linked loan |
| | |
| | |
| | |
ANNUAL REPORT 2022 | | 16 |
| | |
|
| |
| INTRODUCTION |
| |
| IMPACT |
| |
u Lending impact |
| |
Funding in 2022 |
| |
NIB Environmental Bonds |
| |
NIB and climate change |
| |
Internal impact |
| |
Impactful workplace |
| |
Sustainability management |
| |
About this report |
| |
Independent Assurance Report |
| |
| GOVERNANCE |
| |
| BOD REPORT |
| |
| FINANCIALS |
| |
| SUSTAINABILITY INDICES |
| |
| |
| |
| |
| |
| |
| |
| |
| |
| |
| |
| |
| |
| |
| |
| |
| |
| |
| |
| |
| |
| |
| | |
| | |
| | |
ANNUAL REPORT 2022 | | 17 |
| | |
|
| |
| INTRODUCTION |
| |
| IMPACT |
| |
u Lending impact |
| |
Funding in 2022 |
| |
NIB Environmental Bonds |
| |
NIB and climate change |
| |
Internal impact |
| |
Impactful workplace |
| |
Sustainability management |
| |
About this report |
| |
Independent Assurance Report |
| |
| GOVERNANCE |
| |
| BOD REPORT |
| |
| FINANCIALS |
| |
| SUSTAINABILITY INDICES |
| |
| |
| |
| |
| |
| |
| |
| |
| |
| |
| |
| |
| |
| |
| |
| |
| |
| |
| |
| |
| |
| |
| |
| |
| |
| |
| |
| |
| |
| |
| | |
| | |
| | |
ANNUAL REPORT 2022 | | 18 |
| | |
|
| |
| INTRODUCTION |
| |
| IMPACT |
| |
u Lending impact |
| |
Funding in 2022 |
| |
NIB Environmental Bonds |
| |
NIB and climate change |
| |
Internal impact |
| |
Impactful workplace |
| |
Sustainability management |
| |
About this report |
| |
Independent Assurance Report |
| |
| GOVERNANCE |
| |
| BOD REPORT |
| |
| FINANCIALS |
| |
| SUSTAINABILITY INDICES |
| |
| |
| |
| |
| |
| |
| |
| |
| |
| |
| |
| |
| |
| |
| |
| |
| |
| |
| |
| |
| |
| |
| |
| |
| |
| |
| |
| |
| | |
Advancing digital transformation journeys In 2022, NIB has signed and disbursed loans to a number of companies that are on their digital transformation journey transforming their own internal operations, and more importantly how they reach and communicate with their customers. The digitalisation theme spanned across the sectors. There have been elements of digitalisation financed in business expansion projects in manufacturing and in M&A projects where the company has acquired another smaller company with the necessary digital capabilities. Digitalisation has also been visible in the service sector, in healthcare, and in energy distribution, to mention a few. In addition to the actual digitalisation projects, in 2022, NIB also financed IT infrastructure projects in Denmark and Finland – roll out of fibre networks, which help the member countries to reach their digitalisation targets and support the digital agendas of the companies. We saw our clients increase their focus on digital agendas. | | 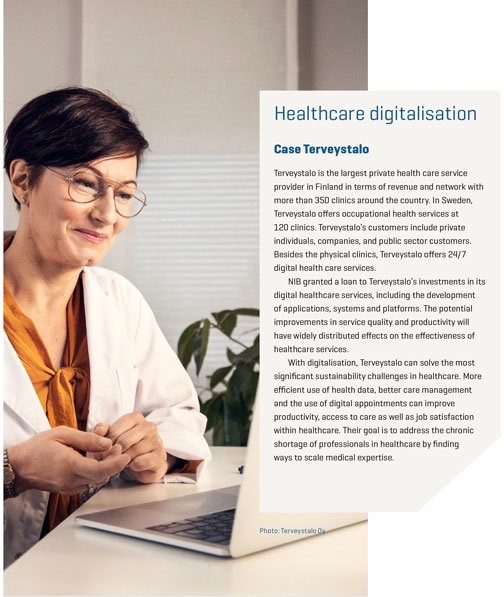 |
| | |
| | |
| | |
ANNUAL REPORT 2022 | | 19 |
| | |
|
| |
| INTRODUCTION |
| |
| IMPACT |
| |
u Lending impact |
| |
Funding in 2022 |
| |
NIB Environmental Bonds |
| |
NIB and climate change |
| |
Internal impact |
| |
Impactful workplace |
| |
Sustainability management |
| |
About this report |
| |
Independent Assurance Report |
| |
| GOVERNANCE |
| |
| BOD REPORT |
| |
| FINANCIALS |
| |
| SUSTAINABILITY INDICES |
| |
| |
| |
| |
| |
| |
| |
| |
| |
| |
| |
| |
| |
| |
| |
| |
| |
| |
| |
| |
| |
| |
| | | | |
| Sustainability-linked loans | | |
NIB offers sustainability-linked loans (SLLs) that incentivise its clients to reach ambitious and verifiable environmental and social sustainability goals. By meeting such goals, customers can enjoy better financing conditions. These goals may encompass climate and other impact categories. NIB’s SLL principles build upon the voluntary Sustainability-Linked Loans Principles of the Loan Market Association and the Sustainability-Linked Bond Principles of the International Capital Market Association. As an international financial institution, we also see as our role to promote the high-quality standards in this growing market. Value-chain emissions (scope 3) often represent the largest portion of companies’ carbon footprint. Therefore NIB actively promotes and requires its clients to include targets for scope 3 emissions, where relevant. NIB publishes consolidated information on its SLLs and underlying key features here. 
| | 
| |  |
| | | | |
| | |
| | |
| | |
ANNUAL REPORT 2022 | | 20 |
| | |
|
| |
| INTRODUCTION |
| |
| IMPACT |
| |
u Lending impact |
| |
Funding in 2022 |
| |
NIB Environmental Bonds |
| |
NIB and climate change |
| |
Internal impact |
| |
Impactful workplace |
| |
Sustainability management |
| |
About this report |
| |
Independent Assurance Report |
| |
| GOVERNANCE |
| |
| BOD REPORT |
| |
| FINANCIALS |
| |
| SUSTAINABILITY INDICES |
| |
| |
| |
| |
| |
| |
| |
| |
| |
| |
| |
| |
| |
| |
| |
| |
| |
| |
| |
| |
|
NIB has provided SLLs to companies in various sectors, associated with different sensitivities to climate transition risks, from food retailing to chemicals and power and heat. By selecting the key performance indicators and targets carefully, SLLs can be tailor-made to support the sustainability transition across many types of companies. SLLs help therefore not only our clients to move toward their sustainability targets, but also NIB to align its lending portfolio with the Paris Agreement in the long term. |
| | |
| | |
| | |
ANNUAL REPORT 2022 | | 21 |
| | |
|
| INTRODUCTION |
| |
| IMPACT |
| |
Lending impact |
| |
u Funding in 2022 |
| |
NIB Environmental Bonds |
| |
NIB and climate change |
| |
Internal impact |
| |
Impactful workplace |
| |
Sustainability management |
| |
About this report |
| |
Independent Assurance Report |
| |
| GOVERNANCE |
| |
| BOD REPORT |
| |
| FINANCIALS |
| |
| SUSTAINABILITY INDICES |
| |
| |
| |
| |
| |
| |
| |
| |
| |
| |
| |
| |
| |
| |
| |
| |
| |
| |
| |
| |
| |
| |
| |
| |
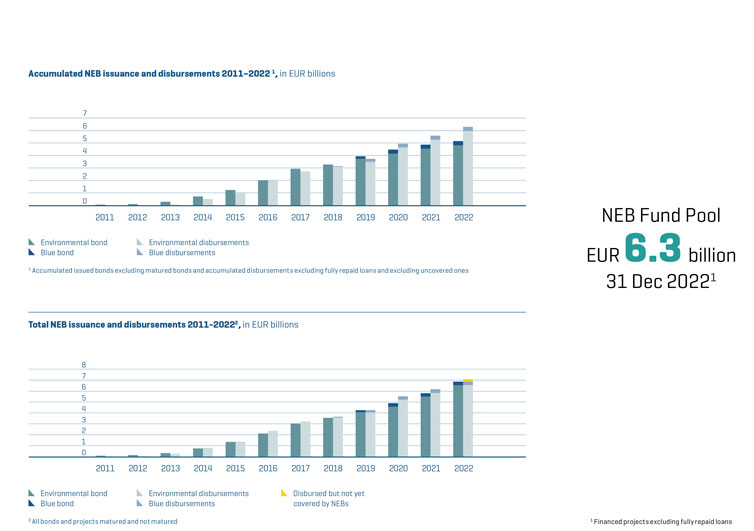
Funding in 2022
NIB acquires the funds for its lending by borrowing on the international capital markets. The Bank’s funding strategy consists of transactions in the public markets, including global benchmark issuance in USD, meeting investor preferences for tailored issuance in specific formats and currencies, and a strong presence in the sustainable bond market. NIB’s bonds enjoy the highest possible credit rating.
In 2022, NIB raised new funding with a nominal value of EUR 9.6 billion through 111 transactions. This is an increase compared to previous year (EUR 6.9 billion). The reason is mainly due to increased demand for NIB financing and higher collateral outflows.
NIB issued two global USD-denominated benchmark transactions with a three-year and five-year maturity of a total of USD 2.50 billion (EUR 2.4 billion). The Bank priced two GBP-denominated benchmark transactions with three-year and four-year maturity of a total of GBP 1.15 billion (EUR 1.4 billion). In addition to public market deals the Bank raised new funding in a record amount of private placements. At the end of 2022, the outstanding debt amounted to EUR 31.6 billion.
NIB’s total Environmental Bond issuance surpassed EUR 1 billion – a record-high amount over a course of one year since NIB started issuing environmental bonds in 2011. The
issuance consisted of a seven-year EUR 500 million bond, an inaugural eight-year DKK 2 billion bond, a five-year SEK 2 billion bond, and an increase of NOK 1 billion to a five-year bond. By the end of 2022, the Bank had issued a total of EUR 6.8 billion in NIB Environmental Bonds. More information on NIB’s Environmental Bonds can be found on pages 23-33.
Selected bond transactions in 2022
| | | | |
| Deal amount | |
| |
| USD 5y global benchmark | | | 1.25 billion | |
| |
| USD 3y global benchmark | | | 1.25 billion | |
| |
| GBP 3y benchmark | | | 800 million | |
| |
| EUR 7y environmental bond | | | 500 million | |
| |
| GBP 4y benchmark | | | 350 million | |
| |
| USD 4y FRN (tap) | | | 350 million | |
| |
| AUD 3y benchmark bond | | | 500 million | |
| |
| DKK 8y environmental bond | | | 2 billion | |
| |
| NOK 4y FRN (tap) | | | 2 billion | |
| |
| SEK 5y environmental bond | | | 2 billion | |
For a full list of funding transactions, please see our website.
| | |
| | |
| | |
ANNUAL REPORT 2022 | | 22 |
| | |
|
| |
| INTRODUCTION |
| |
| IMPACT |
| |
Lending impact |
| |
u Funding in 2022 |
| |
NIB Environmental Bonds |
| |
NIB and climate change |
| |
Internal impact |
| |
Impactful workplace |
| |
Sustainability management |
| |
About this report |
| |
Independent Assurance Report |
| |
| GOVERNANCE |
| |
| BOD REPORT |
| |
| FINANCIALS |
| |
| SUSTAINABILITY INDICES |
| |
| |
| |
| |
| |
| |
| |
| |
| |
| |
| |
| |
| |
| |
| |
| |
| |
| |
| |
| |
| |
| |
| |
| |
| |
| |
| |
| |
NIB Response Bonds
In the spring of 2020, NIB issued two Response Bonds of EUR 1 billion and SEK 4 billion (EUR 1.37 billion1 in total), to finance projects that alleviate the socioeconomic impacts of the COVID-19 pandemic in NIB’s member countries.
These Bonds were globally among the first bond offerings dedicated to finance measures that mitigate the negative socioeconomic impacts of the pandemic. NIB devoted the
proceeds from the bonds to finance three response loans to Baltic states in 2020 and 2021.
The Baltic countries used the proceeds from the response loans in line with NIB’s Response Bond Framework. A bulk of the proceeds covered support measures for smaller companies in Latvia and Lithuania that struggled with disruptions in their operations. As pressures to healthcare systems rose significantly, Estonia and Lithuania used the response loans to finance temporary increases in service capacity and in procurement of personal protection and laboratory testing
equipment. While all Baltic countries introduced expansions in social security, only Estonia utilised funding from NIB in programmes aimed at preserving jobs and expansion of sickness allowances. Government-related entities, such as educational facilities and infrastructure service providers, received a total of EUR 165 million from governments of Estonia and Latvia. In terms of UN Sustainable Development Goals (SDGs), the Response Bonds contributed to SDG 1, SDG 3, SDG 8 and SDG 9.
Read more about the NIB response bonds on our website.
Companies and people affected by NIB response loans
| 1 | The total amount disbursed to the Baltic states was higher than the bond issuance. To match the impacts with the amount issued in response bonds, this report considers impacts from expenditures totalling EUR 1.37 billion. The remaining credit of EUR 380 million extended to the Baltic states mostly fulfil the eligibility criteria of the response bond framework as well. These loans were financed out of NIB’s general liquidity pool. |
| | |
| | |
| | |
ANNUAL REPORT 2022 | | 23 |
|
| |
| INTRODUCTION |
| |
| IMPACT |
| |
Lending impact |
| |
Funding in 2022 |
| |
u NIB Environmental Bonds |
| |
NIB and climate change |
| |
Internal impact |
| |
Impactful workplace |
| |
Sustainability management |
| |
About this report |
| |
Independent Assurance Report |
| |
| GOVERNANCE |
| |
| BOD REPORT |
| |
| FINANCIALS |
| |
| SUSTAINABILITY INDICES |
| |
| |
| |
| |
| |
| |
| |
| |
| |
| |
| |
| |
| |
| |
| |
| |
| |
| |
| |
| |
| |
| |
| | |
| | |
| | |
ANNUAL REPORT 2022 | | 24 |
|
| |
| INTRODUCTION |
| |
| IMPACT |
| |
Lending impact |
| |
Funding in 2022 |
| |
u NIB Environmental Bonds |
| |
NIB and climate change |
| |
Internal impact |
| |
Impactful workplace |
| |
Sustainability management |
| |
About this report |
| |
Independent Assurance Report |
| |
| GOVERNANCE |
| |
| BOD REPORT |
| |
| FINANCIALS |
| |
| SUSTAINABILITY INDICES |
| |
| |
| |
| |
| |
| |
| |
| |
| |
| |
| |
| |
| |
| |
| |
| |
| |
| |
| |
| |
| |
| |
| | | | | | |

| | “In 2022, we issued a record high amount of environmental bonds showing our commitment to sustainable bond markets.” CFO, Kim Skov Jensen |
|
| | | | support and guidelines to the sustainable bond market. NIB has been committed to this work since its establishment in 2014 and a member of the Executive committee since. The sustainable bond market continuous to evolve. NIB aims to stay at the forefront and adapt to any changes and new requirements, whilst maintaining high integrity around sustainable objectives. One prominent initiative in the market has been the introduction of the EU taxonomy. NIB reports its estimated alignment with the taxonomy for its green fund pool, please see page 34. |
At the beginning of 2022, we set the ambitious target of issuing more than EUR 1 billion of environmental bonds. With the four environmental bonds issued, NIB did indeed surpass the EUR 1 billion mark during the year. This is the highest amount ever issued over the course of one year since the Bank started issuing environmental bonds in 2011. The environmental bonds issued in 2022 were denominated in four different currencies: EUR, DKK, NOK and SEK. The first environmental bond for the year, an eight-year DKK 2 billion bond was the Bank’s inaugural NIB Environmental Bond (NEB) denominated in Danish kroner. This transaction was followed by a seven-year EUR 500 million, a five-year SEK 2 billion and a five-year tap bond of NOK 1 billion. | | The EUR 500 million NEB was issued in early March. The bond had the highest subscription rates of any NEB issued. This shows the continued commitment of our green bond investors. Through the NEB issuance in 2022 the Bank drew the attention of new investors, which brings a desirable diversification. In total, NIB has now issued EUR 6.8 billion in environmental bonds under its NEB framework. This record year for NEB issuance was enabled by a robust pipeline of loans with high environmental impact. The urge for energy security and independence has pushed the green transition forward amongst the Bank’s lending clients. In June, NIB was re-elected to the Executive committee of the Principles. The Principles are a global initiative providing |
| | 
| | Jens Hellerup Senior Director, Head of Funding & Investor Relations |
| | | | | | |
| | |
| | |
| | |
ANNUAL REPORT 2022 | | 25 |
|
| |
| INTRODUCTION |
| |
| IMPACT |
| |
Lending impact |
| |
Funding in 2022 |
| |
u NIB Environmental Bonds |
| |
NIB and climate change |
| |
Internal impact |
| |
Impactful workplace |
| |
Sustainability management |
| |
About this report |
| |
Independent Assurance Report |
| |
| GOVERNANCE |
| |
| BOD REPORT |
| |
| FINANCIALS |
| |
| SUSTAINABILITY INDICES |
| |
| |
| |
| |
| |
| |
| |
| |
| |
| |
| |
| |
| |
| |
| |
| |
| |
| |
| |
| |
| |
| |
NIB Environmental Bond issuance in 2022
In 2022, NIB raised a total of EUR 1,048 million in Environmental bonds through four bonds. The issuance consisted of a seven-year EUR 500 million bond, an inaugural eight-year DKK 2 billion bond, a five-year SEK 2 billion bond and a five-year NOK 1 billion bond.
With the four environmental bonds issued, the Bank surpassed the EUR 1 billion mark of NEB issuance during the year. The bonds were sold to a wide-ranging investor base.
NEB issuance 2022
| | | | | | | | | | |
| | | | | | |
| Currency | | Amount in millions | | EUR million equivalent1 | | ISIN | | Value date | | Maturity date |
NOK | | 1,000 | | 97 | | XS2400452228 | | 4.11.2022 | | 20.10.2027 |
SEK | | 2,000 | | 182 | | XS2548946560 | | 24.10.2022 | | 24.10.2027 |
EUR | | 500 | | 500 | | XS2454249652 | | 9.3.2022 | | 9.3.2029 |
DKK | | 2,000 | | 269 | | XS2437424398 | | 28.1.2022 | | 28.1.2030 |
Total, EUR | | | | 1,048 | | | | | | |
1 Based on the trade date foreign exchange rate.
| | |
| | |
| | |
ANNUAL REPORT 2022 | | 26 |
|
| |
| INTRODUCTION |
| |
| IMPACT |
| |
Lending impact |
| |
Funding in 2022 |
| |
u NIB Environmental Bonds |
| |
NIB and climate change |
| |
Internal impact |
| |
Impactful workplace |
| |
Sustainability management |
| |
About this report |
| |
Independent Assurance Report |
| |
| GOVERNANCE |
| |
| BOD REPORT |
| |
| FINANCIALS |
| |
| SUSTAINABILITY INDICES |
| |
| |
| |
| |
| |
| |
| |
| |
| |
| |
| |
| |
| |
| |
| |
| |
| |
| |
| |
| |
| |
| |
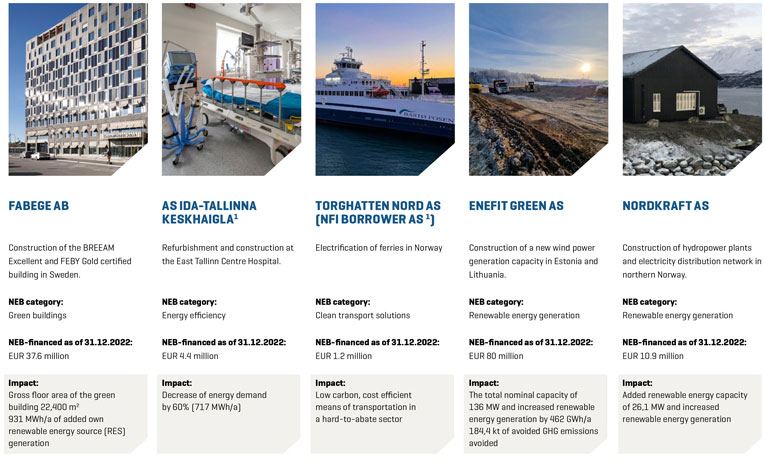
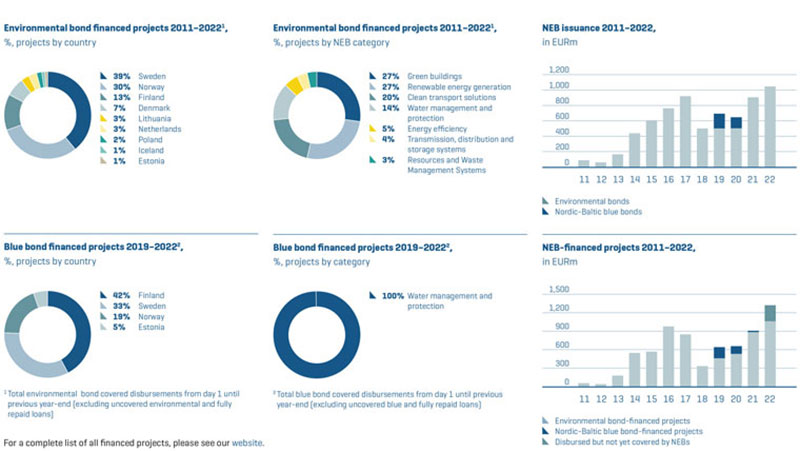
NEB-financed projects in 2022
During the year, NIB financed projects with NEB proceeds over EUR 1 billion, consisting of 24 projects1. A list of all the NEB-financed projects is available on our website.
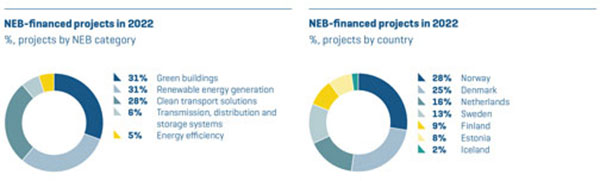
In 2022, 31% of the NEB disbursements were related to the renewable energy generation, mostly supporting the development of wind parks, but also that of geothermal and hydropower facilities. 31% of disbursements were related to development of new green buildings, and 28% for clean transport solutions, especially regarding the electrification of the sector. 6% of the total disbursements dealt with energy transmission and distribution infrastructure. 5% of the disbursements increased energy efficiency through
refurbishment of buildings and replacement of industrial equipment, resulting in energy savings of over 30%. To summarise, a substantial share of NEB-earmarked disbursements in 2022 were channelled towards green transition in the energy sector, allowing NIB to account for impacts of at least 200 MW of added renewable energy generation capacity, 86 200 square meters of certified green buildings, as well as reduction or avoidance of GHG emissions of 207 ktCO2e/a.
From a regional perspective, NIB’s disbursements for the projects in Denmark mainly concerned clean transport solutions (82%). Most of the disbursements for the Norwegian projects (87%) were related to investments in green buildings certified, or to be certified as LEED Platinum or BREEAM Excellent.
NEB-earmarked transactions for projects in Finland were predominantly connected with the development of energy transmission and distribution networks (55%), which are essential for the uptake of renewable energy and electrification processes. Disbursements for projects implemented in Sweden covered diverse needs in all the above-mentioned NEB categories dealing with energy and climate, while almost all financing for Icelandic and Estonian projects helped to increase renewable energy generation capacities (100% and 97% respectively).
1 The number includes fully or partly disbursed loans.
| | |
| | |
| | |
ANNUAL REPORT 2022 | | 27 |
|
| |
| INTRODUCTION |
| |
| IMPACT |
| |
Lending impact |
| |
Funding in 2022 |
| |
u NIB Environmental Bonds |
| |
NIB and climate change |
| |
Internal impact |
| |
Impactful workplace |
| |
Sustainability management |
| |
About this report |
| |
Independent Assurance Report |
| |
| GOVERNANCE |
| |
| BOD REPORT |
| |
| FINANCIALS |
| |
| SUSTAINABILITY INDICES |
| |
| |
| |
| |
| |
| |
| |
| |
| |
| |
| |
| |
| |
| |
| |
| |
| |
| |
| |
| |
| |
| |
1 Partially covered.
Image credits: respective clients.
| | |
| | |
| | |
ANNUAL REPORT 2022 | | 28 |
|
| |
| INTRODUCTION |
| |
| IMPACT |
| |
Lending impact |
| |
Funding in 2022 |
| |
u NIB Environmental Bonds |
| |
NIB and climate change |
| |
Internal impact |
| |
Impactful workplace |
| |
Sustainability management |
| |
About this report |
| |
Independent Assurance Report |
| |
| GOVERNANCE |
| |
| BOD REPORT |
| |
| FINANCIALS |
| |
| SUSTAINABILITY INDICES |
| |
| |
| |
| |
| |
| |
| |
| |
| |
| |
| |
| |
| |
| |
| |
| |
| |
| |
| |
| |
| |
| |
Overview of NIB Environmental Bonds
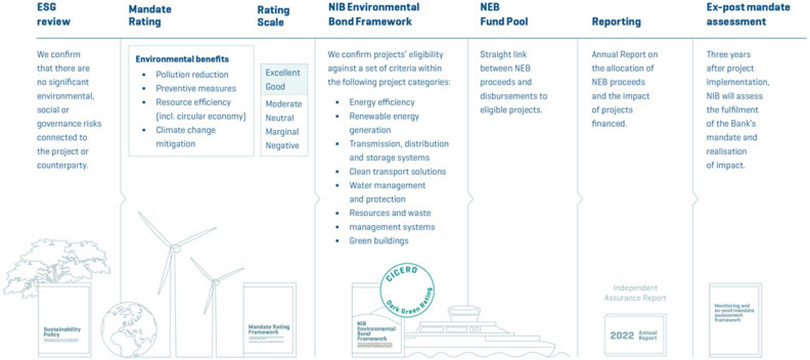
NIB has an explicit mandate to promote environmental projects. In response to investors’ willingness to support sustainable investments specifically, we introduced our NIB Environmental Bond Framework in 2011. Under the framework, NIB issues use of proceeds environmental bonds whose proceeds are used to finance projects that benefit the environment and support the transition to a low-carbon economy. NIB applies a portfolio approach with multiple NEBs financing a pool of projects. The proceeds from a NEB can be allocated to a specific category or to projects belonging to several categories. Proceeds from NEB issuance will only be allocated to new environmental projects,
i.e. projects that have not been completed more than a year prior to NIB’s project review. NIB often finances projects with long construction periods, meaning that even if disbursements are stretched over several years, the project may not yet be completed and is thus still considered a new project by NIB. NIB’s Nordic–Baltic Blue Bonds specifically focus on investments within water management and protection and are aimed at investors who are conscious of the challenges facing our region’s water resources, especially those affecting the Baltic Sea.
The NIB Environmental Bond Framework is aligned with the four core components of the Green Bond Principles (Use
of Proceeds, Process for Project Evaluation and Selection, Management of Proceeds, and Reporting). Further, NIB assesses the alignment of the projects in its NEB Fund Pool with the EU Taxonomy, read more here.
Read more about NIB’s overarching objectives, strategy, policy and processes relating to ESG and sustainability under Sustainability Management and see NIB’s Sustainability Policy and our Governance Statement.
| | | | |
| |
NIB Environmental Bond basic information | |  |
| | | |
Current framework | | NIB Environmental Bond Framework (last updated Oct 2019) |
Second opinion | | CICERO: Dark Green (Oct 2018) |
Types of bonds issued under framework | | Environmental Bonds, Nordic–Baltic Blue Bonds |
Reporting period | | Annual |
Reporting approach | | Portfolio approach with project-specific details provided |
Guidelines / alignment | | Green Bond Principles, EU Taxonomy estimated alignment assessment, UN Sustainable Development Goals |
Verification | | Limited Assurance by KPMG, see page 66-67 |
Impact reporting portals | | Nasdaq Sustainable Bond Network |
| | |
| | |
| | |
ANNUAL REPORT 2022 | | 29 |
|
| |
| INTRODUCTION |
| |
| IMPACT |
| |
Lending impact |
| |
Funding in 2022 |
| |
u NIB Environmental Bonds |
| |
NIB and climate change |
| |
Internal impact |
| |
Impactful workplace |
| |
Sustainability management |
| |
About this report |
| |
Independent Assurance Report |
| |
| GOVERNANCE |
| |
| BOD REPORT |
| |
| FINANCIALS |
| |
| SUSTAINABILITY INDICES |
| |
| |
| |
| |
| |
| |
| |
| |
| |
| |
| |
| |
| |
| |
| |
| |
| |
| |
| |
| |
| |
| |
NEB selection process
| | |
| | |
| | |
ANNUAL REPORT 2022 | | 30 |
|
| |
| INTRODUCTION |
| |
| IMPACT |
| |
Lending impact |
| |
Funding in 2022 |
| |
u NIB Environmental Bonds |
| |
NIB and climate change |
| |
Internal impact |
| |
Impactful workplace |
| |
Sustainability management |
| |
About this report |
| |
Independent Assurance Report |
| |
| GOVERNANCE |
| |
| BOD REPORT |
| |
| FINANCIALS |
| |
| SUSTAINABILITY INDICES |
| |
| |
| |
| |
| |
| |
| |
| |
| |
| |
| |
| |
| |
| |
| |
| |
| |
| |
| |
| |
| |
| |
NIB Environmental Bond Pool
The proceeds of NIB Environmental Bonds are managed on an aggregate basis for multiple environmental bonds (portfolio approach).
| | | | | | | | | | | | | | | | | | | | | | | | |
| NIB Environmental Bonds (not matured) |
| | | | | | | | |
| ISIN code | | Curr | | Amount in
millions | | | EUR million
equivalent1 | | | Year | | | Value date | | | Maturity date | | | Taps |
Environmental bonds | | | | | | | | | | | | | | | | | | | |
XS2400452228 | | NOK | | | 1,000 | | | | 97 | | | | 2022 | | | | 4.11.2022 | | | | 20.10.2027 | | | tap |
XS2548946560 | | SEK | | | 2,000 | | | | 182 | | | | 2022 | | | | 24.10.2022 | | | | 24.10.2027 | | | |
XS2454249652 | | EUR | | | 500 | | | | 500 | | | | 2022 | | | | 9.3.2022 | | | | 9.3.2029 | | | |
XS2437424398 | | DKK | | | 2,000 | | | | 269 | | | | 2022 | | | | 28.1.2022 | | | | 28.1.2030 | | | |
XS2400452731 | | SEK | | | 3,000 | | | | 296 | | | | 2021 | | | | 20.10.2021 | | | | 20.10.2026 | | | |
XS2400452228 | | NOK | | | 1,000 | | | | 101 | | | | 2021 | | | | 20.10.2021 | | | | 20.10.2027 | | | |
XS2166209176 | | EUR | | | 500 | | | | 500 | | | | 2021 | | | | 1.4.2021 | | | | 30.4.2027 | | | tap |
XS2166209176 | | EUR | | | 500 | | | | 500 | | | | 2020 | | | | 30.4.2020 | | | | 30.4.2027 | | | |
XS2055786763 | | EUR | | | 500 | | | | 500 | | | | 2019 | | | | 25.9.2019 | | | | 25.9.2026 | | | |
XS1815070633 | | EUR | | | 500 | | | | 500 | | | | 2018 | | | | 3.5.2018 | | | | 3.11.2025 | | | |
XS1494406074 | | SEK | | | 1,000 | | | | 103 | | | | 2017 | | | | 25.10.2017 | | | | 22.9.2023 | | | tap |
XS1494406074 | | SEK | | | 500 | | | | 51 | | | | 2017 | | | | 16.10.2017 | | | | 22.9.2023 | | | tap |
XS1431730388 | | EUR | | | 500 | | | | 500 | | | | 2017 | | | | 18.5.2017 | | | | 10.6.2024 | | | tap |
XS1494406074 | | SEK | | | 1,500 | | | | 156 | | | | 2016 | | | | 22.9.2016 | | | | 22.9.2023 | | | |
XS1431730388 | | EUR | | | 500 | | | | 500 | | | | 2016 | | | | 10.6.2016 | | | | 10.6.2024 | | | |
XS0824127277 | | SEK | | | 500 | | | | 59 | | | | 2012 | | | | 7.9.2012 | | | | 7.9.2032 | | | |
| Total environmental bonds: | | | | 4,814 | | | | | | | | | | | | | | | |
Blue bonds | | | | | | | | | | | | | | | | | | | | | | | | |
XS2243312407 | | SEK | | | 1,500 | | | | 143 | | | | 2020 | | | | 13.10.2020 | | | | 13.10.2025 | | | |
XS1943607975 | | SEK | | | 2,000 | | | | 193 | | | | 2019 | | | | 1.2.2019 | | | | 1.2.2024 | | | |
| Total blue bonds: | | | | 336 | | | | | | | | | | | | | | | |
| Total NIB Environmental Bonds: | | | | 5,150 | | | | | | | | | | | | | | | |
| | | | | | | | | | | | | | | | | | | | | | | | | |
| | | | | | | | | | | | | | | | | | | | | | | | |
| NIB Environmental Bonds (matured) |
| | | | | | | | |
| ISIN code | | Curr | | Amount in
millions | | | EUR million
equivalent1 | | | Year | | | Value date | | | Maturity date | | | Taps |
NIB Environmental bonds (matured) | | | | | | | |
XS1673097637 | | SEK | | | 500 | | | | 51 | | | | 2017 | | | | 5.10.2017 | | | | 29.8.2022 | | | tap |
XS1673097637 | | SEK | | | 2,000 | | | | 211 | | | | 2017 | | | | 29.8.2017 | | | | 29.8.2022 | | | |
XS1602266923 | | INR | | | 170 | | | | 2 | | | | 2017 | | | | 30.5.2017 | | | | 29.5.2020 | | | |
XS1551670091 | | BRL | | | 5,5 | | | | 2 | | | | 2017 | | | | 23.2.2017 | | | | 24.2.2021 | | | |
XS1347786797 | | SEK | | | 1,000 | | | | 107 | | | | 2016 | | | | 20.1.2016 | | | | 20.1.2021 | | | |
XS1292474282 | | EUR | | | 500 | | | | 500 | | | | 2015 | | | | 17.9.2015 | | | | 19.9.2022 | | | |
XS1222727536 | | SEK | | | 1,000 | | | | 107 | | | | 2015 | | | | 23.4.2015 | | | | 23.4.2020 | | | |
US65562QAW50 | | USD | | | 500 | | | | 397 | | | | 2014 | | | | 30.9.2014 | | | | 30.9.2021 | | | |
XS1031495929 | | EUR | | | 40 | | | | 40 | | | | 2014 | | | | 11.2.2014 | | | | 11.2.2019 | | | |
XS0996470943 | | BRL | | | 343,5 | | | | 105 | | | | 2013 | | | | 6.12.2013 | | | | 6.2.2018 | | | |
XS0975173633 | | SEK | | | 500 | | | | 58 | | | | 2013 | | | | 27.9.2013 | | | | 27.9.2018 | | | |
XS0699238522 | | ZAR | | | 1,006,4 | | | | 92 | | | | 2011 | | | | 22.11.2011 | | | | 19.11.2015 | | | |
| Total matured NIB Environmental Bonds: | | | | 1,673 | | | | | | | | | | | | | | | |
Total issued NIB Environmental Bonds 2011-2022: | | | | 6,823 | | | | | | | | | | | | | | | |
1 Based on the trade date foreign exchange rate.
| | |
| | |
| | |
ANNUAL REPORT 2022 | | 31 |
|
| |
| INTRODUCTION |
| |
| IMPACT |
| |
Lending impact |
| |
Funding in 2022 |
| |
u NIB Environmental Bonds |
| |
NIB and climate change |
| |
Internal impact |
| |
Impactful workplace |
| |
Sustainability management |
| |
About this report |
| |
Independent Assurance Report |
| |
| GOVERNANCE |
| |
| BOD REPORT |
| |
| FINANCIALS |
| |
| SUSTAINABILITY INDICES |
| |
| |
| |
| |
| |
| |
| |
| |
| |
| |
| |
| |
| |
| |
| |
| |
| |
| |
| |
| |
| |
| |
NIB Environmental Bond financed projects 2011-2022
| | |
| | |
| | |
ANNUAL REPORT 2022 | | 32 |
|
| |
| INTRODUCTION |
| |
| IMPACT |
| |
Lending impact |
| |
Funding in 2022 |
| |
u NIB Environmental Bonds |
| |
NIB and climate change |
| |
Internal impact |
| |
Impactful workplace |
| |
Sustainability management |
| |
About this report |
| |
Independent Assurance Report |
| |
| GOVERNANCE |
| |
| BOD REPORT |
| |
| FINANCIALS |
| |
| SUSTAINABILITY INDICES |
| |
| |
| |
| |
| |
| |
| |
| |
| |
| |
| |
| |
| |
| |
| |
| |
| |
| |
| |
| |
| |
| |
| | |
| | |
| | |
ANNUAL REPORT 2022 | | 33 |
|
| |
| INTRODUCTION |
| |
| IMPACT |
| |
Lending impact |
| |
Funding in 2022 |
| |
u NIB Environmental Bonds |
| |
NIB and climate change |
| |
Internal impact |
| |
Impactful workplace |
| |
Sustainability management |
| |
About this report |
| |
Independent Assurance Report |
| |
| GOVERNANCE |
| |
| BOD REPORT |
| |
| FINANCIALS |
| |
| SUSTAINABILITY INDICES |
| |
| |
| |
| |
| |
| |
| |
| |
| |
| |
| |
| |
| |
| |
| |
| |
| |
| |
| |
| |
| |
| |
Impact of NEB-financed projects 2011-2022
Pro-rated to NIB’s share of financing. The share of impact for each category arising from disbursements that were allocated to the NEB pool during 2022 is shown.
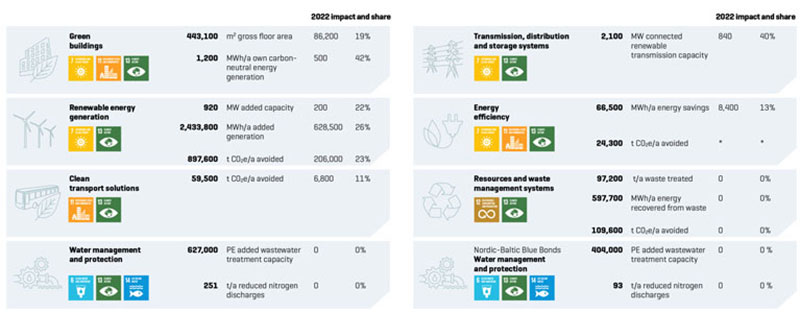
* Not disclosed
Project-specific impact data and NIB’s methodology for assessing impact is published on our website.
The impact numbers under 2022 can contain impacts from disbursements in 2021, that were disbursed but not allocated to NEB pool.
Starting from 2022, NEB impact data includes only the impact of not matured loans.
| | |
| | |
| | |
ANNUAL REPORT 2022 | | 34 |
| | |
|
| |
| INTRODUCTION |
| |
| IMPACT |
| |
Lending impact |
| |
Funding in 2022 |
| |
u NIB Environmental Bonds |
| |
NIB and climate change |
| |
Internal impact |
| |
Impactful workplace |
| |
Sustainability management |
| |
About this report |
| |
Independent Assurance Report |
| |
| GOVERNANCE |
| |
| BOD REPORT |
| |
| FINANCIALS |
| |
| SUSTAINABILITY INDICES |
| |
| |
| |
| |
| |
| |
| |
| |
| |
| |
| |
| |
| |
| |
| |
| |
| |
| |
| |
| |
| |
| |
| |
| |
| |
| |
| |
| |
EU taxonomy alignment
In 2022, we continued to analyse our NEB projects from the EU taxonomy perspective.
Following the adoption of the EU taxonomy for sustainable economic activities in 2020, NIB has now for the second time conducted a screening of the NEB project categories against the EU taxonomy’s Technical Screening Criteria (TSC) for sustainable activities for all six environmental objectives. The purpose of the exercise is to provide NIB’s investors with information on how well NEB-financed projects are deemed to be aligned with the taxonomy. As the screening is done on a project category level, the assessment is based on the estimated taxonomy alignment of the majority of projects within each category. The alignment assessment results are presented separately for Substantial Contribution (SC), as well as for the combination of SC and Do No Significant Harm (DNSH). As is illustrated in the table on page 36, the NEB categories are in general well-aligned to the substantial contribution criteria. DNSH alignment on a category level is more challenging to determine and here the assessment builds on whether relevant DNSH criteria are commonly covered by regular permit processes in combination with NIB’s project sustainability review.
In 2022, NIB started to perform an EU taxonomy alignment assessment for all new projects on a project level. In addition to the regular sustainability due diligence, further information has been requested in order to to assess if the SC and the DNSH criteria can be deemed to be fulfilled. As it was not feasible to
collect granular project data retroactively for already financed projects the project level assessment is currently not extended to previously financed projects. The assessment of the new projects in 2022 can however affect the overall alignment for a project category. The mapping is done on a best effort basis and the EU taxonomy is not yet adopted in its final form. Hence, the results should be seen as preliminary.
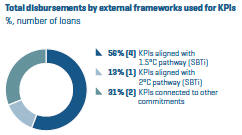
Out of the total disbursed NEB loan volume in 2022, 99.6% were considered taxonomy eligible and 0.4% were not. 77% of the disbursements were considered to fulfil the Substantial Contribution Criteria for the project’s relevant economic activity, while 23% of the disbursements were assessed to fulfil the Substantial Contribution criteria only partly. All projects which were deemed to be only partly aligned with the SC criteria were in the NEB category Green buildings, where NIB applies a certification level approach which is not directly comparable to the taxonomy criteria.
Out of the disbursements for which SC was considered to be aligned, 82% were deemed to fully fulfil the criteria for DNSH and 13% were deemed to be partly fulfil the DNSH criteria. For 5% of the disbursements there was not enough information to assess DNSH alignment. It should be noted that these percentage shares of disbursements are affected by a few large projects. Looking at the number of projects 50% of projects were considered to be fully aligned with DNSH criteria and 43% of the projects were considered partly aligned. Out of the disbursements for which SC was considered to be partly aligned,
Estimated alignment against technical screening criteria for SC and DNSH of NEB projects 2022, % of NEB issuances 2022
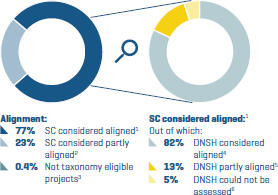
| | 1 | SC considered aligned: the project could demonstrate evidence that TSC for SC are fulfilled |
| | 2 | SC considered partly aligned: the project could demonstrate evidence that the TSC for SC were to a large extent fulfilled |
| | 3 | Project not taxonomy eligible: the economic activity is not covered by the EU taxonomy |
| | 4 | DNSH considered aligned: the project could demonstrate evidence that all TSC for DNSH criteria were fulfilled |
| | 5 | DNSH partly aligned: the project could present partial evidence of TSC for all or certain DNSH criteria fulfilment and/or the DNSH criteria includes what normally would be covered by typical permitting process |
| | 6 | DNSH Could not be assessed: the project was not able to present evidence of any DNSH criteria fulfilment and the DNSH criteria are not covered by the typical permit processes. |
| | |
| | |
| | |
ANNUAL REPORT 2022 | | 35 |
| | |
|
| |
| INTRODUCTION |
| |
| IMPACT |
| |
Lending impact |
| |
Funding in 2022 |
| |
u NIB Environmental Bonds |
| |
NIB and climate change |
| |
Internal impact |
| |
Impactful workplace |
| |
Sustainability management |
| |
About this report |
| |
Independent Assurance Report |
| |
| GOVERNANCE |
| |
| BOD REPORT |
| |
| FINANCIALS |
| |
| SUSTAINABILITY INDICES |
| |
| |
| |
| |
| |
| |
| |
| |
| |
| |
| |
| |
| |
| |
| |
| |
| |
| |
| |
| |
| |
| |
| |
| |
| | |
all were deemed to also just partly fulfil the DNSH criteria. As noted by many actors, such as UNEP-FI, assessing alignment with the DNSH TSC can be challenging. The main reasons are data unavailability, insufficient data quality as well as a lack of evidence related to the DNSH TSC. We see, however, that the access to information has been improving, likely driven by both more stringent regulatory requirements, but also by the general increased awareness of sustainability matters. Typically, NIB’s assessment is that for projects that have successfully undergone a full Environmental Impact Assessment in an EU member state, relevant DNSH criteria can be judged to be fulfilled if the applicable EU directives have been implemented into national legislation. The compliance with Minimum Social Safeguards (MSS) is considered to be to a large extent ensured by NIB’s policies and processes to identify, manage, and mitigate potential negative environmental and social impacts. NIB is currently assessing the need to implement further processes to ensure MSS fulfilment, also in relation to the first draft report on minimum safeguards published in July 2022 by the EU Platform on Sustainable Finance. For a full description of the assessment and assumptions used, please see NIB’s website. During 2022, NIB co-financed the construction of four small-scale (less than 10 MW) run-of-the river hydropower plants. All four plants fulfil the SC criteria for hydropower in the EU taxonomy: two plants are run-of-river plants with no artificial reservoir. The other two have small reservoirs but have a power density exceeding 5 watt/m2. Based on information from Environmental Impact Assessments and dialogue with the client, also the DNSH criteria are deemed to be fulfilled. | | 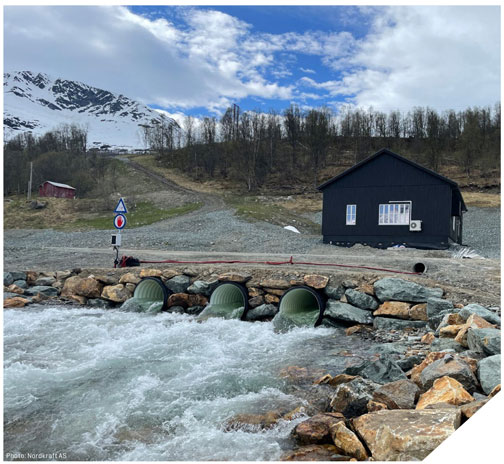 |
| | |
| | |
| | |
ANNUAL REPORT 2022 | | 36 |
| | |
|
| |
| INTRODUCTION |
| |
| IMPACT |
| |
Lending impact |
| |
Funding in 2022 |
| |
u NIB Environmental Bonds |
| |
NIB and climate change |
| |
Internal Impact |
| |
Impactful workplace |
| |
Sustainability management |
| |
About this report |
| |
Independent Assurance Report |
| |
| GOVERNANCE |
| |
| BOD REPORT |
| |
| FINANCIALS |
| |
| SUSTAINABILITY INDICES |
| |
| |
| |
| |
| |
| |
| |
| |
| |
| |
| |
| |
| |
| |
| |
| |
| |
| |
| |
| |
| |
| |
| |
| |
| |
| |
Overview of NEB categories, the primary environmental objective in the EU taxonomy and estimated alignment against technical screening criteria for SC and DNSH
| | | | | | | | | | | | | | |
NEB Framework Project category1 | | | | Taxonomy environmental
objective2 | | Eligibility | | Substantial Contribution (SC) | | SC + Do No Significant Harm (DNSH) | |
| % of NEB
portfolio3 |
|
| | | | | | |
| Energy efficiency | | | | | | | | | | | | | | |
a. Energy efficiency projects in industry | | | | - | | Not eligible | | - | | - | | | 0.4% | |
b. Energy efficiency in existing buildings | | | | Climate change mitigation | | Eligible | | ● | | ● | | | 5% | |
| | | | | | |
| Renewable energy | | | | | | | | | | | | | | |
a. Electricity from wind turbines, solar, tidal, wave and hydropower | | Wind | | Climate change mitigation | | Eligible | | ● | | ● | | | 8% | |
| | | Solar4 | | Climate change mitigation | | Eligible | | ● | | ● | | | 0% | |
| | | Tidal and wave4 | | Climate change mitigation | | Eligible | | ● | | ● | | | 0% | |
| | | Hydro | | Climate change mitigation | | Eligible | | ● | | ● | | | 11% | |
b. Electricity or heat generation from geothermal installations and from biomass | | Geothermal | | Climate change mitigation | | Eligible | | ● | | ● | | | 1% | |
| | | Biomass | | Climate change mitigation | | Eligible | | ● | | ● | | | 6% | |
c. Infrastructure for the production or processing of liquid biofuels4 | | | | Climate change mitigation | | Eligible | | ● | | ● | | | 0% | |
d. Investments in the development, design and manufacturing of renewable energy technologies.4 | | | | Climate change mitigation | | Eligible | | ● | | ● | | | 0% | |
| | | | | | |
| Transmission, distribution and storage systems | | | | | | | | | | | | | | |
| a. Transmission and distribution system (electricity) | | | | Climate change mitigation | | Eligible | | ● | | ● | | | 4% | |
b. District heating and cooling | | | | Climate change mitigation | | Eligible | | ● | | ● | | | 0.01% | |
| | | | | | |
| Clean transport solutions | | | | | | | | | | | | | | |
a. Transport infrastructure | | | | Climate change mitigation | | Eligible | | ● | | ● | | | 4% | |
b. Vehicles and vessels | | | | Climate change mitigation | | Eligible | | ● | | ● | | | 15% | |
| | | | | | |
| Water management and protection | | | | | | | | | | | | | | |
a. Wastewater treatment and water pollution prevention | | | | Sustainable use and protection of water and marine resources | | Eligible | | ● | | ● | | | 18% | |
b. Stormwater systems and flood protection | | | | Climate change adaptation | | Eligible | | ● | | ● | | | 1% | |
c. Protection of water resources4 | | | | Circular economy | | Eligible | | ● | | ● | | | 0% | |
d. Protection and restoration of water and marine ecosystems4 | | | | Substantial contribution to protection and restoration of biodiversity and ecosystems | | Eligible | | ● | | ● | | | 0% | |
| | | | | | |
| Resources and waste management systems | | | | | | | | | | | | | | |
a. Resource efficiency | | Material recovery | | Circular economy | | Eligible | | ● | | ● | | | 1% | |
| | | Pollution prevention4 | | - | | Not eligible | | ● | | ● | | | 0% | |
b. Infrastructure for better waste management | | | | Circular economy | | Eligible | | ● | | ● | | | 0.2% | |
c. Energy recovery from waste | | Biogas | | Climate change mitigation | | Eligible | | ● | | ● | | | 0.01% | |
| | | Waste-to-Energy | | - | | Not eligible | | - | | - | | | 2% | |
| | | | | | |
| Green buildings | | | | | | | | | | | | | | |
| New buildings certified according to LEED Platinum or BREEAM Excellent/Outstanding | | | | Climate change mitigation | | Eligible | | ● | | ● | | | 26% | |
● Estimated aligned ● Partly aligned ● Not aligned ● Could not be assessed
| 1 | Minimum social safeguards: NIB has policies, standards and procedures in place for safeguarding the environmental and social sustainability of NEB projects. |
| 2 | Including enabling activities |
| 3 | The share of NEB funds allocated to each category 2011-2022. |
| 4 | Project categories in which NIB has not yet had any NEB projects are labelled as “Could not be assessed” |
| | |
| | |
| | |
ANNUAL REPORT 2022 | | 37 |
| | |
|
| |
| INTRODUCTION |
| |
| IMPACT |
| |
Lending impact |
| |
Funding in 2022 |
| |
NIB Environmental Bonds |
| |
u NIB and climate change |
| |
Internal impact |
| |
Impactful workplace |
| |
Sustainability management |
| |
About this report |
| |
Independent Assurance Report |
| |
| GOVERNANCE |
| |
| BOD REPORT |
| |
| FINANCIALS |
| |
| SUSTAINABILITY INDICES |
| |
| |
| |
| |
| |
| |
| |
| |
| |
| |
| |
| |
| |
| |
| |
| |
| |
| |
| |
| |
| |
| |
| | | | |
NIB and climate change | | 
|
Work on climate strategy and integrating climate risk into the Bank’s operations continued in 2022. Introduction The recommendations of the Task Force on Climate-related Financial Disclosures (TCFD) provide a framework for companies, including financial sector entities, to disclose information on their governance, strategy, risk management, and metrics and targets that are climate-related. Climate-related disclosures help financial market participants – like investors and lenders – to better assess climate-related risks and opportunities, and ultimately to better price risk and make informed decisions on capital allocation. NIB endorsed the TCFD recommendations in December 2019. The recommendations have provided a good initial benchmark for NIB to develop its climate risk management framework and disclosures, but since the publication of the TCFD recommendations, regulatory requirements have become more extensive and binding, and significantly changed the expectations for climate risk management and the way in which banks should manage climate-related risks in their daily operations. Due to its legal status as an international financial institution, national banking legislation does not apply to NIB, nor is it subject to direct supervision of any supervisory authority. However, NIB monitors international regulations and standards on risk management and adopts those that it identifies to be relevant and represent best practice. | | In 2022, the EU faced an energy crisis due to ceased fossil fuel supply from Russia as a result of Russia’s war against Ukraine, which increased the volatility and pressure on the energy market. In addition, the EU stepped up the climate targets of its Fit for 55 package by issuing the RePowerEU plan to accelerate the green transition. At the same time, the renewable energy capacity in the Nordic and Baltic countries is growing exponentially, and the companies are raising their climate ambitions by increasingly committing to Science Based Targets initiative. Also NIB continued its efforts to enhance its capacity to manage climate-related risks and opportunities. This work covered, among other things, preparations to develop a climate strategy and targets for the Bank that would guide particularly its lending business. In addition to this chapter, see also the TCFD Index on page 194. Governance NIB’s internal governance is described in the Governance Statement that describes the main governing bodies of the Bank, including their powers and responsibilities, and provides an overview of the NIB’s organisational structure, risk management framework and assurance. The Bank’s governance structure and control approach is also applied to climate risk management, as relevant and feasible. For more information on NIB’s governance, see pages 68-78 and Sustainability Management on page 55. |
| | |
| | |
| | |
ANNUAL REPORT 2022 | | 38 |
| | |
|
| |
| INTRODUCTION |
| |
| IMPACT |
| |
Lending impact |
| |
Funding in 2022 |
| |
NIB Environmental Bonds |
| |
u NIB and climate change |
| |
Internal impact |
| |
Impactful workplace |
| |
Sustainability management |
| |
About this report |
| |
Independent Assurance Report |
| |
| GOVERNANCE |
| |
| BOD REPORT |
| |
| FINANCIALS |
| |
| SUSTAINABILITY INDICES |
| |
| |
| |
| |
| |
| |
| |
| |
| |
| |
| |
| |
| |
| |
| |
| |
| |
| |
| |
| |
| |
| |
| |
| |
| |
| |
Strategy
NIB’s mission is to finance projects that improve productivity and benefit the environment of the Nordic and Baltic countries. Supporting the decarbonisation of our economies and societies has long been integrated in NIB’s business strategy. Read more about NIB’s business strategy and implementation on page 8.
Risk management
According to the TCFD recommendations, banks are expected to disclose how they identify, assess, and manage climate-related risks. In addition, banks are expected to consider climate-related risks in the context of traditional risk categories in the banking sector such as credit risk, market risk, liquidity risk, and operational risk.
Climate risk classification
NIB’s initial risk taxonomy was applied, in particular, to capital and liquidity management and quantification. During 2022, the taxonomy was under review and it now better distinguishes between financial and non-financial risks where ESG risks (including climate risk) belong to the latter. The new risk taxonomy will be integrated over time into various internal policies, guidelines and processes and it will also support awareness raising and visualisation of how climate risk fits in with the Bank’s overall risk taxonomy. The taxonomy itself does not take a view on the materiality of the risk categories or how and by whom those risks shall be managed.
Climate risk also forms part of the Bank’s Risk Appetite Statement (RAS). The RAS sets the principles for the Bank’s risk-taking, risk mitigation and risk avoidance. It aims to align willingness to take risk with the statutory requirements, strategic business objectives, and capital planning. In addition, it also helps raise risk awareness across the organisation. The RAS was later supplemented by a specific section on climate
Supporting the
decarbonisation of our
economies and societies
has long been integrated
in our business strategy.
risk, highlighting the importance of this emerging risk category. The statement on climate risk informs the way in which NIB is committed to enhancing its climate risk management and to integrate it into its overall risk management framework. In addition, the climate statement further describes our climate risk appetite in Lending and Treasury business functions. After the introduction of the climate statement, the RAS is made up of 11 building blocks in total. Each building block has a connection to the traditional risk category in the banking sector even though the Bank’s RAS is built on themes rather than on specific risk categories. In line with our values on transparency and good governance, the RAS is published on the Bank’s website.
Risk indentification and assessment
In general, climate risk identification can take place at individual project level, counterparty level and portfolio level. Climate risk can also be identified using inside out perspective, i.e. how the operations of an entity affect climate, while in the traditional risk management focus has been somewhat different.
NIB’s Sustainability Policy and Guidelines provide an overall framework for our climate-related risk assessments at the project and counterparty level. Because climate strategies and targets have a central role in the assessments, we encourage our clients to clearly define and communicate their climate-
related commitments and to develop and execute effective strategies to mitigate climate risks. While sustainability assessment of the project (loan) is still a key part of the credit granting process, the ESG dimensions have moved focus towards assessing the risk of the client, its ESG risks and transition plans. For more information see Sustainability Management on page 55.
The current regulations and standards in the banking sector provide that climate risk should be seen as a risk driver (risk factor) rather than a separate risk category. Subsequently, climate risk would materialise via credit risk, market risk and operational risk, for example. To support climate risk measurement and materiality assessment, in 2022 NIB continued testing and evaluation of analytical tools for measuring the transition risk in its Lending and Treasury portfolios. The metric used was a climate-adjusted probability of default that aims to incorporate long-term climate scenarios into the default probability. A selected set of Lending and Treasury exposures were used for testing data requirements, data coverage with respect to NIB’s counterparties, sectoral coverage, underlying assumptions, and scenarios embedded in the tools, as well as the interpretation of outputs.
The Bank has a long history in using traditional risk ratings (probability of default (PD) ratings) in its risk, capital and liquidity management, and climate-adjusted PD tools could supplement these calculations and processes. However, further testing and analyses is needed before climate-related tools can be considered as an integral part of the risk management framework. Subsequently, the quantitative risk materiality threshold at the portfolio or risk category level has not been confirmed, even though the importance of climate risk management is generally well accepted.
| | |
| | |
| | |
ANNUAL REPORT 2022 | | 39 |
| | |
|
| |
| INTRODUCTION |
| |
| IMPACT |
| |
Lending impact |
| |
Funding in 2022 |
| |
NIB Environmental Bonds |
| |
u NIB and climate change |
| |
Internal impact |
| |
Impactful workplace |
| |
Sustainability management |
| |
About this report |
| |
Independent Assurance Report |
| |
| GOVERNANCE |
| |
| BOD REPORT |
| |
| FINANCIALS |
| |
| SUSTAINABILITY INDICES |
| |
| |
| |
| |
| |
| |
| |
| |
| |
| |
| |
| |
| |
| |
| |
| |
| |
| |
| |
| |
| |
| |
| |
| |
| |
| |
| |
| |
| |
| |
Climate risk quantification
Current regulations in the European banking sector do not specify how climate risk should be quantified. Regulations are developing rapidly, and NIB is following the regulatory developments in this area as well. The development of regulations is monitored via the regulatory monitoring process that has been in place at NIB for years. In the past, the main focus has been on developments in international prudential regulations and standards but over time climate risk related topics have received increasing focus.
NIB does not quantify climate risk in terms of economic capital nor factors in climate risk into its risk category specific economic capital models (like the portfolio credit risk model). However, climate risk has been included qualitatively in NIB’s Internal Capital Adequacy Assessment Process (ICAAP) framework since 2020 and climate risk was part of the Bank’s stress testing in 2021 and 2022. The stress test scenarios focus on the transition risk aspects of climate risk and utilise both business sector and macroeconomic data. The annual capital and liquidity assessment (ICAAP Report), including climate risk elements, is delivered to the Board of Directors for approval, facilitating the discussions on the climate-related risks and NIB’s risk profile in general.
For further details of NIB’s risk management framework please see the Note 2 and Capital and Liquidity Management sections in the Annual Report.
Metrics and targets
Transition risk exposure
As the first priority, NIB has focused its climate risk assessment on the transition risk (i.e. policy & regulation, technology, market, reputation and legal risks) associated with its lending and treasury portfolios. The transition risk is considered as most relevant and material to NIB at this stage since most of NIB’s lending exposure is with the Nordic and Baltic clients.
The first step of the transition risk assessment is heatmapping our loans outstanding and corporate bonds at the sector and segment level, based on three transition risk sensitivity levels (low, moderate and high), to identify focus areas for climate strategy and risk management. The exposures per industry sectors and segments are segmented according to their typical vulnerability to transition risk, through direct/ indirect emissions costs, low-carbon capital expenditure and revenue, for example. The underlying transition pathway aims at climate neutrality by 2050, without considering any specific climate scenario. The climate strategies and targets of NIB’s specific counterparties are not factored in.
NIB’s transition risk heatmapping draws on internal sustainability and sectoral expertise as well as on existing commonly known transition risk heatmap methodologies, such as Moody’s Environmental Heat Map 2021 and the UNEP-FI Transition Risk Heatmap1. Further, the Nordic–Baltic business environment is taken into consideration that is relevant for NIB’s lending business. For more diverse sectors, where a transition risk category is less obvious (e.g. capital goods or consumer retail), we also complement the assessment with information on specific counterparties acquired through our lending due diligence process. The loans to counterparties who focus on road construction, public transport or public real estate, and which were classified as “public sector” according to the
industry classification, were included in the respective sectors and segments for the purpose of this heatmap.
A more detailed counterparty specific approach is adopted for the power and heat sector. This sector is generally regarded as highly vulnerable to transition risks and represents the largest single-sector exposure in loans outstanding in NIB’s lending book. For this sector, the clients are first divided based on their business segment into companies purely providing power transmission and distribution and utilities providing heat and power generation. Second, for the heat and power generating utilities the recent energy mix data is collected. Based on this we categorise the exposure to companies whose fuel mix is unknown or consists of at least 40% fossil fuels as high risk. If the fuel mix consists of 90–100% renewables (i.e. hydro, wind, solar, geothermal, biomass, biogas and recovered heat), the exposure is assessed as low risk. The loans to utilities that fall between are categorised as low or moderate risk, depending on whether the non-renewable share of the fuel mix mainly consists of waste to energy/nuclear (less carbon intensive/ carbon neutral) or fossil fuels (carbon intensive).
Table 1 provides a breakdown of the loans outstanding in NIB’s lending portfolio according to their sensitivity to transition risk. Since the categorisation of a few sectors was refined in 2022 as indicated in the table, the results for 2020-2021 are not fully comparable with 2022. At this stage, the “Financial Institutions” (i.e., banks and diversified financials) and “Public Sector” (i.e., central, regional and local government and supra-nationals) are not assessed due to lack of data and established assessment methodology, respectively.
| 1 | Beyond the Horizon: New Tools and Frameworks for Transition Risk Assessments from UNEP FI’s TCFD Banking Programme – United Nations Environment – Finance Initiative |
| | |
| | |
| | |
ANNUAL REPORT 2022 | | 40 |
| | |
|
| |
| INTRODUCTION |
| |
| IMPACT |
| |
Lending impact |
| |
Funding in 2022 |
| |
NIB Environmental Bonds |
| |
u NIB and climate change |
| |
Internal impact |
| |
Impactful workplace |
| |
Sustainability management |
| |
About this report |
| |
Independent Assurance Report |
| |
| GOVERNANCE |
| |
| BOD REPORT |
| |
| FINANCIALS |
| |
| SUSTAINABILITY INDICES |
| |
| |
| |
| |
| |
| |
| |
| |
| |
| |
| |
| |
| |
| |
| |
| |
| |
| |
| |
| |
| |
| |
| |
| |
| |
| |
| |
| |
| |
| |
| |
| |
| |
| |
| |
| |
| |
| |
| |
| |
| |
| |
| |
| |
| |
| |
Table 1 NIB’s transition risk heatmap and loans outstanding 2020–20221
| | | | | | | | | | | | | | | | | | | | | | | | | | | | |
| | | | 2020 | | | | 2021 | | | | 2022 | | | | | |
Industry sector and segment | |
| Total Balance
[EUR million] |
| |
| Share of Total
[%] |
| |
| Total Balance
[EUR million] |
| |
| Share of Total
[%] |
| |
| Total Balance
[EUR million] |
| |
| Share of Total
[%] |
| | | Transition Risk | |
Oil & Gas | | | 68 | | | | 0.3% | | | | 121 | | | | 0.6% | | | | 144 | | | | 0.6% | | | | | |
Oil & Gas transportation and Storage, Gas Utilities | | | 68 | | | | 0.3% | | | | 121 | | | | 0.6% | | | | 144 | | | | 0.6% | | | | ● | |
Power and Heat | | | 4,046 | | | | 18.9% | | | | 4,175 | | | | 19.0% | | | | 4,605 | | | | 20.2% | | | | | |
Purely power transmission and distribution | | | 1,071 | | | | 5.0% | | | | | | | | | | | | 1,576 | | | | 6.9% | | | | ● | |
Utilities with heat and power generation2 | | | 2,974 | | | | 13.9% | | | | | | | | | | | | 3,029 | | | | 13.3% | | | | | |
Low | | | 2,218 | | | | 10.4% | | | | | | | | | | | | 2,519 | | | | 11.1% | | | | ● | |
Moderate | | | 214 | | | | 1.0% | | | | | | | | | | | | 173 | | | | 0.8% | | | | ● | |
High | | | 402 | | | | 1.9% | | | | | | | | | | | | 337 | | | | 1.5% | | | | ● | |
Energy mix unknown | | | 140 | | | | 0.7% | | | | | | | | | | | | | | | | | | | | ● | |
Metals & Mining | | | 365 | | | | 1.7% | | | | 318 | | | | 1.4% | | | | 442 | | | | 1.9% | | | | | |
Diversified Metals & Mining | | | 226 | | | | 1.1% | | | | 221 | | | | 1.0% | | | | 315 | | | | 1.4% | | | | ● | |
Steel | | | 139 | | | | 0.6% | | | | 97 | | | | 0.4% | | | | 126 | | | | 0.6% | | | | ● | |
Industrials | | | 905 | | | | 4.2% | | | | 915 | | | | 4.2% | | | | 1,077 | | | | 5% | | | | | |
Speciality Chemicals3 | | | | | | | | | | | | | | | | | | | 406 | | | | 1.8% | | | | ● | |
Chemicals excl. Speciality Chemicals3 | | | 464 | | | | 2.2% | | | | 414 | | | | 1.9% | | | | 133 | | | | 0.6% | | | | ● | |
Paper&Forest Products, Packaging | | | 387 | | | | 1.8% | | | | 467 | | | | 2.1% | | | | 422 | | | | 1.9% | | | | ● | |
Commercial & Professional Services | | | 54 | | | | 0.3% | | | | 34 | | | | 0.2% | | | | 115 | | | | 0.5% | | | | ● | |
Capital Goods | | | 1,327 | | | | 6.2% | | | | 1,211 | | | | 5.5% | | | | 1,256 | | | | 5.5% | | | | | |
Building Products | | | 155 | | | | 0.7% | | | | 150 | | | | 0.7% | | | | 150 | | | | 0.7% | | | | ● | |
Construction & Engineering | | | 281 | | | | 1.3% | | | | 276 | | | | 1.3% | | | | 94 | | | | 0.4% | | | | ● | |
Electrical Equipment | | | 5 | | | | 0.0% | | | | 27 | | | | 0.1% | | | | 0 | | | | 0.0% | | | | ● | |
Machinery | | | 885 | | | | 4.1% | | | | 758 | | | | 3.5% | | | | 1,012 | | | | 4.4% | | | | ● | |
Transportation | | | 3,135 | | | | 14.7% | | | | 3,315 | | | | 15.1% | | | | 3,275 | | | | 14.4% | | | | | |
Automobiles3 | | | 345 | | | | 1.6% | | | | 325 | | | | 1.5% | | | | 250 | | | | 1.1% | | | | ● | |
Automobile Components3 | | | | | | | | | | | | | | | | | | | 37 | | | | 0.2% | | | | ● | |
Shipping | | | 76 | | | | 0.4% | | | | 163 | | | | 0.7% | | | | 233 | | | | 1.0% | | | | ● | |
Railroads and public transport | | | 1,007 | | | | 4.7% | | | | 1,173 | | | | 5.3% | | | | 1,059 | | | | 4.7% | | | | ● | |
Airport Services | | | 720 | | | | 3.4% | | | | 699 | | | | 3.2% | | | | 701 | | | | 3.1% | | | | ● | |
Marine Ports & Services | | | 28 | | | | 0.1% | | | | 41 | | | | 0.2% | | | | 64 | | | | 0.3% | | | | ● | |
Roads | | | 902 | | | | 4.2% | | | | 863 | | | | 3.9% | | | | 895 | | | | 3.9% | | | | ● | |
Logistics | | | 57 | | | | 0.3% | | | | 50 | | | | 0.2% | | | | 35 | | | | 0.2% | | | | ● | |
● Low ● Moderate ● High ● Not yet assessed
1 Industry sector refers to NIB’s internal sustainability classification. Total balance refers to nominal values excluding commitments and is not taking into account credit risk mitigations.
2 In 2021 the sensitivity to transition risk for the Power and Heat Sector was made based on exposures for 2020, therefore no granular split is available for 2021. The transition risk classification for 2022 is based on counterparties’ energy mix data from 2021, or, if not available, from 2020.
3 In 2022 the categorisation has been refined. Exposures in 2020 and 2021 are not re-classfied according to the more granular categorisation.
| | |
| | |
| | |
ANNUAL REPORT 2022 | | 41 |
| | |
|
| |
| INTRODUCTION |
| |
| IMPACT |
| |
Lending impact |
| |
Funding in 2022 |
| |
NIB Environmental Bonds |
| |
u NIB and climate change |
| |
Internal impact |
| |
Impactful workplace |
| |
Sustainability management |
| |
About this report |
| |
Independent Assurance Report |
| |
| GOVERNANCE |
| |
| BOD REPORT |
| |
| FINANCIALS |
| |
| SUSTAINABILITY INDICES |
| |
| |
| |
| |
| |
| |
| |
| |
| |
|
| |
| |
| |
| |
| |
| |
| |
| |
| |
| |
| |
| |
| |
| |
| |
| |
| | | | | | | | | | | | | | | | | | | | | | | | | | | | |
| | | | | |
| | | | 2020 | | | | 2021 | | | | 2022 | | | | | |
| | | | | | | |
Industry sector and segment | |
| Total Balance
[EUR million] |
| |
| Share of Total
[%] |
| |
| Total Balance
[EUR million] |
| |
| Share of Total
[%] |
| |
| Total Balance
[EUR million] |
| |
| Share of Total
[%] |
| | | Transition Risk | |
Consumer Retail | | | 1,642 | | | | 7.7% | | | | 1,655 | | | | 7.5% | | | | 1,587 | | | | 7.0% | | | | | |
Consumer Durables and Apparel | | | 421 | | | | 2.0% | | | | 356 | | | | 1.6% | | | | 453 | | | | 2.0% | | | | ● | |
Food and Beverage Production | | | 521 | | | | 2.4% | | | | 563 | | | | 2.6% | | | | 544 | | | | 2.4% | | | | ● | |
Food & Staples Retailing | | | 463 | | | | 2.2% | | | | 483 | | | | 2.2% | | | | 371 | | | | 1.6% | | | | ● | |
Others | | | 237 | | | | 1.1% | | | | 254 | | | | 1.2% | | | | 219 | | | | 1.0% | | | | ● | |
Health Care3 | | | 1,196 | | | | 5.6% | | | | 1,118 | | | | 5.1% | | | | 1,002 | | | | 4.4% | | | | | |
Health Care | | | | | | | | | | | | | | | | | | | 736 | | | | 3.2% | | | | ● | |
Pharma, Life Science & Health Equipment | | | | | | | | | | | | | | | | | | | 266 | | | | 1.2% | | | | ● | |
Real Estate | | | 1,615 | | | | 7.5% | | | | 1,712 | | | | 7.8% | | | | 2,048 | | | | 9.0% | | | | ● | |
Tech and Telecom | | | 899 | | | | 4.2% | | | | 936 | | | | 4.3% | | | | 1,079 | | | | 4.7% | | | | ● | |
Water Utilities | | | 435 | | | | 2.0% | | | | 415 | | | | 1.9% | | | | 374 | | | | 1.6% | | | | ● | |
Financial Institutions | | | 1,855 | | | | 8.7% | | | | 1,949 | | | | 8.9% | | | | 2,237 | | | | 9.8% | | | | ● | |
Public Sector | | | 3,906 | | | | 18.3% | | | | 4,102 | | | | 18.7% | | | | 3,652 | | | | 16.0% | | | | ● | |
Total | | | 21,394 | | | | 100% | | | | 21,942 | | | | 100% | | | | 22,777 | | | | 100% | | | | | |
● Low ● Moderate ● High ● Not yet assessed
3 In 2022 the categorisation has been refined. Exposures in 2020 and 2021 are not re-classfied according to the more granular categorisation.
| | | | |
Distribution of transition risk categories for NIB’s lending portfolio 20211 and 2022, % 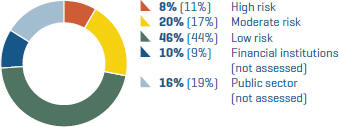
1 2021 data in brackets | | Combining the sensitivity categorisations of Table 1 provides the transition risk distribution for NIB’s lending portfolio as shown in graph Distribution of transition risk categories for NIB’s lending portfolio 2021 and 2022,%. Overall, NIB’s lending portfolio 2020-2022 is characterised by a large share of low risk exposure and a relatively small share of high risk exposure. The share of the loans outstanding not assessed yet is also relatively large. The majority of the counterparties in the public sector are central, regional and local governments within the Nordic and Baltic countries. Comparing the transition risk distribution between 2021 and 2022, there was an increase of 2-3% in low and | | medium risk categories and a similar decrease in high risk and not assessed categories. The decrease in high risk category is partly due to refinement of the sectoral sensitivities. The biggest growth in loans outstanding in 2022 was in the Real Estate sector (EUR 336 million) and the Power and Heat sector (EUR 430 million), where the exposure increased to renewable energy generation and power transmission and distribution. Slight growth is also observed in the Industrials and Metals & Mining sectors. The loans outstanding in the Public Sector decreased the most (EUR 450 million). The overall exposure to Transportation sector also slightly decreased, whereas the loans outstanding in shipping and ports increased. |
| | |
| | |
| | |
ANNUAL REPORT 2022 | | 42 |
| | |
|
| |
| INTRODUCTION |
| |
| IMPACT |
| |
Lending impact |
| |
Funding in 2022 |
| |
NIB Environmental Bonds |
| |
u NIB and climate change |
| |
Internal impact |
| |
Impactful workplace |
| |
Sustainability management |
| |
About this report |
| |
Independent Assurance Report |
| |
| GOVERNANCE |
| |
| BOD REPORT |
| |
| FINANCIALS |
| |
| SUSTAINABILITY INDICES |
| |
| |
| |
| |
| |
| |
| |
| |
| |
| |
| |
| |
| |
| |
| |
| |
| |
| |
| |
| |
| |
| |
| |
| |
| |
| |
Table 2 provides a corresponding breakdown of the exposures to their sensitivity to transition risk in NIB’s treasury corporate bonds portfolio.
Financed emissions of the lending and treasury portfolios (scope 3)
The second step of our transition risk assessment is accounting for NIB’s financed emissions to identify the most carbon intensive exposures and sectors. Financed emissions are the Bank’s scope 3 greenhouse gas emissions (GHG) associated with the loan and investment portfolios (i.e. Category 15, Investment in the GHG Protocol’s accounting rules for Scope 3 emissions). For banks this is by far the most relevant and material part of the total carbon footprint.
We calculate our financed emissions according to the Global GHG Accounting and Reporting Standard for the Financial Industry by the Partnership for Carbon Accounting Financials (PCAF)2 published in 2020.
Using the PCAF standard, we define NIB’s share of our counterparties’ greenhouse gas emissions in proportion with our exposure to counterparties’ total value. For the attribution, we use the PCAF Global Standard for the asset classes “Business Loans” and “Corporate Bonds”.
The calculation was performed based on the counterparties’ reported GHG emissions to the extent available. For those counterparties who do not report their GHG emissions yet, we estimated the emissions using PCAF’s proxy data. The counterparty emissions covered comprise the direct (Scope 1) and indirect (Scope 2) GHG emissions. The counterparties’ Scope 3 emissions were not included in the analysis due to limited data availability and accuracy. The scope of the analysis included the loans outstanding in NIB’s lending portfolio and the corporate bonds investments of NIB’s treasury portfolio as of 31 December 2022. The Financial
Table 2 NIB’s transition risk heatmap and the treasury corporate bonds portfolio 20221
| | | | | | | | | | | | |
Industry sector and segment | |
| Total Balance
[EUR million] 2022 |
| | | Share of Total [%] | | | | Transition Risk | |
Power and Heat | | | 71 | | | | 21% | | | | | |
Purely power transmission and distribution | | | 35 | | | | 10% | | | | ● | |
Utilities with heat and power generation | | | 36 | | | | 10% | | | | | |
Low | | | 36 | | | | 10% | | | | ● | |
Capital Goods | | | 39 | | | | 11% | | | | | |
Machinery | | | 39 | | | | 11% | | | | ● | |
Transportation | | | 28 | | | | 8% | | | | | |
Automobiles & Components | | | 8 | | | | 2% | | | | ● | |
Railroads and public transport | | | 18 | | | | 5% | | | | ● | |
Logistics | | | 2 | | | | 1% | | | | ● | |
Consumer Retail | | | 88 | | | | 26% | | | | | |
Food and Beverage Production | | | 55 | | | | 16% | | | | ● | |
Food & Staples Retailing | | | 13 | | | | 4% | | | | ● | |
Others | | | 21 | | | | 6% | | | | ● | |
Health Care | | | 36 | | | | 10% | | | | | |
Pharma, Life Science & Health Equipment | | | 36 | | | | 10% | | | | ● | |
Real Estate | | | 12 | | | | 3% | | | | ● | |
Tech and Telecom | | | 50 | | | | 14% | | | | | |
Information Technology | | | 21 | | | | 6% | | | | ● | |
Telecom | | | 29 | | | | 8% | | | | ● | |
Financial Institutions | | | 22 | | | | 6% | | | | ● | |
Total | | | 345 | | | | 100% | | | | | |
● Low ● Moderate ● High ● Not yet assessed
1 Industry sector refers to NIB’s internal sustainability classification. Total balance refers to nominal values excluding commitments and is not taking into account credit risk mitigations.
| | |
| Institutions, Public Sector and Water Utilities of the lending book were not assessed due to lack of data and established assessment methodology. The scope of the treasury portfolio was limited to corporate bonds investments, as the PCAF standard 2020 does not cover other relevant asset classes. The accuracy and scope of the financed emissions will be further improved as the data availability and calculation methodologies develop. The methodological details for calculating the financed emissions are described in the TCFD Index. | | Table 3 presents NIB’s estimated financed emissions of the lending portfolio 2022 and Table 4 the estimated financed emissions of the treasury corporate bonds portfolio 2022. The relative indicators of carbon footprint and weighted average carbon intensity (WACI) are also shown to allow for comparison between sectors or with other financial institutions. 2 https://carbonaccountingfinancials.com/ |
| | |
| | |
| | |
ANNUAL REPORT 2022 | | 43 |
| | |
|
| |
| INTRODUCTION |
| |
| IMPACT |
| |
Lending impact |
| |
Funding in 2022 |
| |
NIB Environmental Bonds |
| |
u NIB and climate change |
| |
Internal impact |
| |
Impactful workplace |
| |
Sustainability management |
| |
About this report |
| |
Independent Assurance Report |
| |
| GOVERNANCE |
| |
| BOD REPORT |
| |
| FINANCIALS |
| |
| SUSTAINABILITY INDICES |
| |
| |
| |
| |
| |
| |
| |
| |
| |
| |
| |
| |
| |
| |
| |
| |
| |
| |
| |
| |
| |
| |
Table 3 Financed emissions for NIB’s lending portfolio 20221
| | | | | | | | | | | | | | | | | | | | | | | | | | | | | | | | | | | | | | | | |
| Industry sector and segment | | Total Balance
[EUR million]
2022 | | | Share of Total
Balance [%] | | | Balance for
which financed
emissions are
calculated [EUR
million] 2022 | | | Share of total
balance for
which financed
emissions are
calculated [%] | | | Financed
Emissions,
ktonnes CO2e | | | Share of Total
Financed
Emissions [%] | | | Carbon
Footprint
[tCO2e/
EUR million
invested] | | | WACI [tCO2e/
EUR million
revenue] | | | % of financed
emissions
based on
reported
data | | | % of financed
emissions
based on
estimated data | |
| Oil & Gas (Gas Utilities and Oil & Gas Transportation and storage) | | | 144 | | | | 0.6% | | | | 144 | | | | 100.0% | | | | 11 | | | | 1% | | | | 76 | | | | 5 | | | | 100% | | | | 0% | |
Power and Heat | | | 4,605 | | | | 20.2% | | | | 4,272 | | | | 92.8% | | | | 597 | | | | 56% | | | | 140 | | | | 92 | | | | 94% | | | | 6% | |
| Purely power transmission and distribution | | | 1,549 | | | | 6.8% | | | | 1,478 | | | | 95.4% | | | | 34 | | | | 3% | | | | 23 | | | | 9 | | | | 99% | | | | 1% | |
Utilities with heat and power generation | | | 3,056 | | | | 13.4% | | | | 2,793 | | | | 91.4% | | | | 563 | | | | 53% | | | | 201 | | | | 83 | | | | 92% | | | | 8% | |
Low | | | 2,537 | | | | 11.1% | | | | 2,302 | | | | 90.7% | | | | 160 | | | | 15% | | | | 69 | | | | 42 | | | | 93% | | | | 7% | |
Moderate | | | 181 | | | | 0.8% | | | | 181 | | | | 100.0% | | | | 105 | | | | 10% | | | | 579 | | | | 21 | | | | 93% | | | | 7% | |
High | | | 337 | | | | 1.5% | | | | 310 | | | | 92.0% | | | | 298 | | | | 28% | | | | 960 | | | | 20 | | | | 81% | | | | 19% | |
Metals & Mining (incl. Steel) | | | 442 | | | | 1.9% | | | | 418 | | | | 94.7% | | | | 65 | | | | 6% | | | | 155 | | | | 6 | | | | 100% | | | | 0% | |
Industrials | | | 1,077 | | | | 4.7% | | | | 1,077 | | | | 100.0% | | | | 137 | | | | 13% | | | | 128 | | | | 16 | | | | 97% | | | | 3% | |
Speciality Chemicals | | | 406 | | | | 1.8% | | | | 406 | | | | 100.0% | | | | 24 | | | | 2% | | | | 59 | | | | 4 | | | | 100% | | | | 0% | |
Chemicals excl. Speciality Chemicals | | | 133 | | | | 0.6% | | | | 133 | | | | 100.0% | | | | 51 | | | | 5% | | | | 380 | | | | 3 | | | | 100% | | | | 0% | |
Paper&Forest Products, Packaging | | | 422 | | | | 1.9% | | | | 422 | | | | 100.0% | | | | 59 | | | | 6% | | | | 141 | | | | 9 | | | | 97% | | | | 3% | |
| Commercial & Professional Services | | | 115 | | | | 0.5% | | | | 115 | | | | 100.0% | | | | 3 | | | | 0.3% | | | | 27 | | | | 0 | | | | 86% | | | | 14% | |
Capital Goods | | | 1,256 | | | | 5.5% | | | | 1,224 | | | | 97.5% | | | | 30 | | | | 3% | | | | 24 | | | | 3 | | | | 100% | | | | 0% | |
Transportation | | | 3,275 | | | | 14.4% | | | | 1,962 | | | | 59.9% | | | | 128 | | | | 12% | | | | 65 | | | | 19 | | | | 86% | | | | 14% | |
Automobiles | | | 250 | | | | 1.1% | | | | 250 | | | | 100.0% | | | | 2 | | | | 0.2% | | | | 6 | | | | 0 | | | | 100% | | | | 0% | |
Shipping | | | 233 | | | | 1.0% | | | | 178 | | | | 76.6% | | | | 45 | | | | 4% | | | | 252 | | | | 8 | | | | 84% | | | | 16% | |
Transportation infrastructure2 | | | 2,792 | | | | 12.3% | | | | 1,534 | | | | 54.9% | | | | 82 | | | | 8% | | | | 53 | | | | 12 | | | | 84% | | | | 16% | |
Consumer Retail (incl. Food and Beverage Production) | | | 1,587 | | | | 7.0% | | | | 1,519 | | | | 95.7% | | | | 76 | | | | 7% | | | | 50 | | | | 6 | | | | 96% | | | | 4% | |
Health Care | | | 1,002 | | | | 4.4% | | | | 556 | | | | 55.6% | | | | 7 | | | | 1% | | | | 13 | | | | 1 | | | | 74% | | | | 26% | |
Real Estate | | | 2,048 | | | | 9.0% | | | | 1,764 | | | | 86.1% | | | | 5 | | | | 0.5% | | | | 3 | | | | 5 | | | | 82% | | | | 18% | |
Tech and Telecom | | | 1,079 | | | | 4.7% | | | | 1,053 | | | | 97.6% | | | | 7 | | | | 0.6% | | | | 6 | | | | 1 | | | | 95% | | | | 5% | |
Water Utilities | | | 374 | | | | 1.6% | | | | 0 | | | | | | | | | | | | | | | | | | | | | | | | | | | | | |
Financial Institutions | | | 2,237 | | | | 9.8% | | | | 0 | | | | | | | | | | | | | | | | | | | | | | | | | | | | | |
Public Sector | | | 3,652 | | | | 16.0% | | | | 0 | | | | | | | | | | | | | | | | | | | | | | | | | | | | | |
Total | | | 22,777 | | | | 100.0% | | | | 13,990 | | | | 61.4% | | | | 1,063 | | | | 100% | | | | 76 | | | | 154 | | | | 92% | | | | 8% | |
Please see methodology note for the calculations on page 195
1 Industry sector refers to NIB’s internal sustainability classification. Total balance refers to nominal values excluding commitments and is not taking into
account credit risk mitigations.
2 Includes all the other transition risk heatmap categories of transportation apart from Automobiles and Shipping
| | |
| | |
| | |
ANNUAL REPORT 2022 | | 44 |
| | |
|
| |
| INTRODUCTION |
| |
| IMPACT |
| |
| Lending impact |
| |
Funding in 2022 |
| |
NIB Environmental Bonds |
| |
| u NIB and climate change |
| |
Internal impact |
| |
Impactful workplace |
| |
Sustainability management |
| |
About this report |
| |
Independent Assurance Report |
| |
| GOVERNANCE |
| |
| BOD REPORT |
| |
| FINANCIALS |
| |
| SUSTAINABILITY INDICES |
| |
| |
| |
| |
| |
| |
| |
| |
| |
| |
| |
| |
| |
| |
| |
| |
| |
| |
| |
| |
| |
| |
Table 4 Financed emissions for NIB’s treasury corporate bonds portfolio 20221
| | | | | | | | | | | | | | | | | | | | | | | | | | | | | | | | | | | | | | | | |
| | | | | | | | | | | |
| Industry sector and segment | | Total Balance
[EUR million]
2022 | | | Share of Total
Balance [%] | | | Balance for
which financed
emissions are
calculated
[EUR million] | | | Share of total
balance for
which financed
emissions are
calculated | | | Financed
Emissions,
ktonnes CO2e | | | % of total
financed
emissions | | | Carbon
footprint
[tCO2e/
EUR million
invested] | | | WACI [tCO2e/
EUR million
revenue] | | | % of financed
emissions
based on
reported data | | | % of financed
emissions
based on
estimated data | |
Power and Heat | | | 71 | | | | 21% | | | | 32.3 | | | | 45% | | | | 5.1 | | | | 44% | | | | 159 | | | | 47 | | | | 100% | | | | 0% | |
Capital Goods | | | 39 | | | | 11% | | | | 38.6 | | | | 100% | | | | 1.0 | | | | 9% | | | | 26 | | | | 6 | | | | 100% | | | | 0% | |
Transportation | | | 28 | | | | 8% | | | | 28.2 | | | | 100% | | | | 2.9 | | | | 25% | | | | 103 | | | | 12 | | | | 100% | | | | 0% | |
Consumer Retail | | | 88 | | | | 26% | | | | 55.2 | | | | 62% | | | | 1.6 | | | | 13% | | | | 28 | | | | 10 | | | | 100% | | | | 0% | |
Health Care | | | 36 | | | | 10% | | | | 36.0 | | | | 100% | | | | 0.3 | | | | 3% | | | | 9 | | | | 3 | | | | 100% | | | | 0% | |
Real Estate2 | | | 12 | | | | 3% | | | | 0.0 | | | | | | | | | | | | | | | | | | | | | | | | | | | | | |
Tech and Telecom | | | 50 | | | | 14% | | | | 49.6 | | | | 100% | | | | 0.7 | | | | 6% | | | | 13 | | | | 7 | | | | 100% | | | | 0% | |
Financial Institutions3 | | | 22 | | | | 6% | | | | 0.0 | | | | | | | | | | | | | | | | | | | | | | | | | | | | | |
Total | | | 345 | | | | 100% | | | | 239.8 | | | | 69.5% | | | | 11.6 | | | | 100% | | | | 48 | | | | 85.6 | | | | 100% | | | | 0% | |
1 Industry sector refers to NIB’s internal sustainability classification. Total balance refers to nominal values excluding commitments and is not taking into account credit risk mitigations.
2 Only Green Bond Exposure
3 No financed emissions calculated for financial institutions
| | | | |
Reduced and avoided greenhouse gas emissions of projects financed The annual GHG impact of NIB’s financing during 2020–2022 based on the loans disbursed is shown on page 12. The reduced/ avoided GHG emissions due to projects financed in 2022 are presented under Impact of loans disbursed. NIB calculates these metrics based on the methodologies of the International Financial Institution Framework for a Harmonised Approach to Greenhouse Gas Accounting1. 1 https://unfccc.int/climate-action/sectoral-engagement/ifis-harmonization-of-standards-for-ghg-accounting | | Greenhouse gas emissions
of internal operations The Bank calculates the carbon footprint of its own operations (scopes 1, 2 and 3) according to the Greenhouse Gas Protocol Corporate Accounting and Reporting Standard. For further information, see page 48 and our website. | | |
| | |
| | |
| | |
ANNUAL REPORT 2022 | | 45 |
| | |
| | | |
|
| |
| INTRODUCTION |
| |
| IMPACT |
| |
| Lending impact |
| |
Funding in 2022 |
| |
NIB Environmental Bonds |
| |
| u NIB and climate change |
| |
Internal impact |
| |
Impactful workplace |
| |
Sustainability management |
| |
About this report |
| |
Independent Assurance Report |
| |
| GOVERNANCE |
| |
| BOD REPORT |
| |
| FINANCIALS |
| |
| SUSTAINABILITY INDICES |
| |
| |
| |
| |
| |
| |
| |
| |
| |
| |
| |
| |
| |
| |
| |
| |
| |
| |
| |
| |
| |
| |
NIB’s financed emissions for the lending portfolio accounted for approximately 1,100 kt CO2e (coverage approx. 61%) and for the treasury corporate bond portfolio approximately 12 kt CO2e. The corresponding carbon footprints were 76 tCO2e/million EUR invested and 48 tCO2e/million EUR invested. The key sectoral findings regarding the lending portfolio are as follows:
| | | | |

| | Oil & Gas | | • NIB does not have clients involved in upstream oil & gas and therefore, the share of the financed emissions (<1%) and carbon footprint of this sector (76 tCO2e/million EUR) are relatively low. |
| | |

| | Power & Heat | | • The sector represents NIB’s most material financed emissions (597 ktCO2e and 56%). • Majority of the loans are with counterparties classified as low transition risk, i.e. power transmission & distribution and renewable energy generation companies. For these segments, the carbon footprints are 23 and 69 tCO2e/million EUR. • The share of the loans outstanding with counterparties classified as high transition risk, i.e. energy generation companies with over 40% of fossil fuel in their fuel mix, is only 1.5% of the portfolio. Yet the segment represents 28% of the financed emissions due to its high carbon footprint of 960 tCO2e/million EUR invested. |
| | |

| | Industrials | | • The sector constitutes the second largest share of NIB’s financed emissions (137 ktCO2e and 13% of the total financed emissions). • The biggest contributors include the hard-to-abate chemicals segment (carbon footprint 380 tCO2e/million EUR) and the segment “Paper & Forest Products, Packaging” (carbon footprint 141 tCO2e/million EUR). |
| | |

| | Transportation | | • This sector is associated with the third largest financed emissions (128 ktCO2e and 12%) in NIB’s lending portfolio. • The shipping segment has the highest carbon footprint of 252 tCO2e/million EUR invested, yet this figure should be read with caution as vessel-based emissions data was not available. • Over 80% of the loans in this sector are with infrastructure providers such as public transport, airports and roads. The availability of GHG emissions data is very limited except for the airports, which makes it difficult to estimate the financed emissions for these segments. |
| | |

| | Metals and Mining | | • The share of loans outstanding is small, but this hard-to-abate sector has a relatively high carbon footprint of 155 tCO2e/million EUR invested. |
| | |

| | Capital Goods and Consumer Retail | | • In general, the scope 3 GHG emissions are material to NIB’s clients in these sectors. Hence, the share of financed emissions is expected to increase with the inclusion of scope 3 in the future. • The food and beverage segment constitutes 50% of the financed emissions in the Consumer Retail sector (72 tCO2e/million EUR invested). |
| | |
| | |
| | |
ANNUAL REPORT 2022 | | 46 |
| | |
| | | |
|
| |
| INTRODUCTION |
| |
| IMPACT |
| |
Lending impact |
| |
Funding in 2022 |
| |
NIB Environmental Bonds |
| |
NIB and climate change |
| |
| u Internal impact |
| |
Impactful workplace |
| |
Sustainability management |
| |
About this report |
| |
Independent Assurance Report |
| |
| GOVERNANCE |
| |
| BOD REPORT |
| |
| FINANCIALS |
| |
| SUSTAINABILITY INDICES |
| |
| |
| |
| |
| |
| |
| |
| |
| |
| |
| |
| |
| |
| |
| |
| |
| |
| |
| |
| |
| |
| |
Impact from our internal operations
NIB’s most substantial carbon impact arises from its lending operations. Yet we believe it is important to consistently measure, monitor, and manage our internal processes for business travel, energy performance, waste management, and responsible procurement. We are committed to reducing our own carbon footprint and managing our internal operations sustainably.
Managing our internal operations
NIB’s headquarters have been part of the WWF Green Office network since 2010. In 2022, WWF completed their latest audit and awarded us with the Green Office certificate for the fifth time in a row.
During the year, we have developed our monitoring for key indicators such as water, and heating and cooling management. This will improve how we follow up and report on our internal operations.
In light of the energy crisis, NIB has placed extra emphasis on energy use and resource efficiency. To reduce our own energy consumption, we have reduced the office temperature by one degree as part of the Finnish nation-wide ‘Down a degree’ campaign. In addition, our annual energy saving campaign focused on how energy use could be reduced at home, at the office, and by utilising IT tools.
During 2022, NIB outsourced its inhouse data centre to a centralised third-party data centre with high environmental
performance and energy efficiency, which will reduce energy use. To increase the recycling of ICT equipment, employees are offered the opportunity to purchase equipment such as mobile phones and tablets when they are up for renewal.
To reduce food waste from our canteen, NIB uses a compost machine which turns our biowaste into fertiliser. During the year, the machine produced 732 kg of compost, all of which has been donated to staff. We have also organised a wasteless week to further educate our staff about reducing food waste.
NIB’s direct environmental impact
Waste (tonnes)
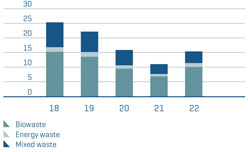
Our office has received WWF Green Office certificate for the fifth time in a row.

| | |
| | |
| | |
ANNUAL REPORT 2022 | | 47 |
| | |
| | | |
|
| |
| INTRODUCTION |
| |
| IMPACT |
| |
| Lending impact |
| |
Funding in 2022 |
| |
NIB Environmental Bonds |
| |
NIB and climate change |
| |
| u Internal impact |
| |
Impactful workplace |
| |
Sustainability management |
| |
About this report |
| |
Independent Assurance Report |
| |
| GOVERNANCE |
| |
| BOD REPORT |
| |
| FINANCIALS |
| |
| SUSTAINABILITY INDICES |
| |
| |
| |
| |
| |
| |
| |
| |
| |
| |
| |
| |
| |
| |
| |
| |
| |
| |
| |
| |
| |
| |
| | | | |
Carbon emissions from internal operations 1 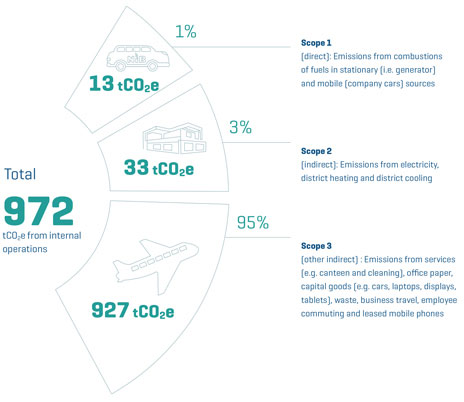
1 Due to rounding, the percentages are not matching up to 100%. | | Responsible procurement The services and goods NIB needs to support its operations and activities are mainly consulting, IT services and devices, data and office supplies. In addition, NIB uses external providers for services such as cleaning, security, catering, and construction at its premises. NIB has established Rules for Internal Procurement, which were last updated in 2022. NIB favours sustainable solutions in its procurement activities and evaluates the sustainability impact as part of the procurement process. NIB incorporated sustainability screenings in the internal procurement operations in 2020. During 2022, we further enhanced our monitoring process with a new e-sourcing tool. All our active contracted suppliers are currently subject to frequent sustainability screening. Read more how we work with suppliers from our webpage and see the Legal framework and policy documents. Our other administrative expenses are reported in Note 8. Carbon emissions from internal operations We report our emissions according to the Greenhouse Gas Protocol Corporate Accounting and Reporting Standard as well as the complementing Corporate Value Chain (Scope 3) Accounting and Reporting Standard. For more information of the standards, visit ghgprotocol.org. In 2022, our internal carbon footprint was 972 tonnes of CO2e, increasing 27% from the previous year. This was mainly due to increased travelling. |
| | |
| | |
| | |
ANNUAL REPORT 2022 | | 48 |
| | |
| | | |
|
| |
| INTRODUCTION |
| |
| IMPACT |
| |
| Lending impact |
| |
Funding in 2022 |
| |
NIB Environmental Bonds |
| |
NIB and climate change |
| |
| u Internal impact |
| |
Impactful workplace |
| |
Sustainability management |
| |
About this report |
| |
Independent Assurance Report |
| |
| GOVERNANCE |
| |
| BOD REPORT |
| |
| FINANCIALS |
| |
| SUSTAINABILITY INDICES |
| |
| |
| |
| |
| |
| |
| |
| |
| |
| |
| |
| |
| |
| |
| |
| |
| |
| |
| |
| |
| |
| |
NIB’s internal carbon emissions
The calculations of Scope 1-3 include the following sources:
| • | | Scope 1 is the combustion of fuels in stationary sources and the combustion of fuels in company owned/controlled cars. |
| • | | Scope 2 is purchased electricity, purchased heat and purchased cooling. |
| • | | Scope 3 takes into account the upstream emissions from purchased goods and services, capital goods, fuel and energy-related activities (not included in Scopes 1 and 2), upstream transportation and distribution, waste, business travel, employee commuting and upstream-leased assets. |
All emissions are stated in tonnes of CO2-equivalent (CO2e). The carbon emissions from our lending portfolio and investments portfolio are excluded from the internal footprint results.
For a more detailed description of the methodology, see our website.
Notes
| 1 | Electricity consumption includes just NIB’s headquarters. The electricity consumption of other NIB owned properties was 69 MWh. |
| 2 | Emissions are based on the electricity that organizations have chosen to purchase, including the purchase of Guarantees of Origin |
| 3 | Emissions are based on the emissions intensity of the local grid area where the electricity usage occurs |
| 4 | From 2020, the HQ’s district heating is based on waste heat. |
| 5 | Adjusted to disclose also location based heating for 2020 and 2021 |
| 6 | The calculation does not include NIB’s investments. |
| 7 | Includes water and wastewater, canteen, cleaning services and greenery services and office paper purchases. |
| 8 | Includes purchased cars and ICT hardware. |
| 9 | Includes leased properties and leased ICT hardware. |
| 10 | Due to changes in calculation methodology, the number for 2020 has been revised |
| 11 | Scopes 1-3 GHG emissions, total (location based) 2018: 1,388 tonnes |
| | | | | | | | | | | | | | | | | | | | |
General indicators | | | Unit | | | | 2019 | | | | 2020 | | | | 2021 | | | | 2022 | |
Net internal area of offices covered | | | m2 | | | | 18,488 | | | | 18,488 | | | | 18,488 | | | | 18,488 | |
Net internal area/permanent employee | | | m2/employee | | | | 92 | | | | 96 | | | | 93 | | | | 87 | |
Energy consumption | | | | | | | | | | | | | | | | | | | | |
Total energy consumption (NIB headquarters) | | | MWh | | | | 3,548 | | | | 3,245 | | | | 3,640 | | | | 3,374 | |
Electricity1 | | | MWh | | | | 1,316 | | | | 1,225 | | | | 1,211 | | | | 1,258 | |
Renewable electricity percentage | | | % | | | | 100% | | | | 100% | | | | 100% | | | | 100% | |
District heating | | | MWh | | | | 1,864 | | | | 1,657 | | | | 2,002 | | | | 1741 | |
District cooling | | | MWh | | | | 368 | | | | 363 | | | | 426 | | | | 375 | |
Carbon free heating and cooling | | | % | | | | 0% | | | | 100% | | | | 100% | | | | 100% | |
Total energy consumption / m2 | | | kWh/m2 | | | | 192 | | | | 176 | | | | 197 | | | | 183 | |
Scope 1: Direct GHG emissions (tCO2e) | | | | | | | | | | | | | | | | | | | | |
Emission from NIB facilities | | | Tonnes | | | | 9 | | | | 9 | | | | 9 | | | | 5 | |
Emissions from NIB fleet | | | Tonnes | | | | 7 | | | | 4 | | | | 6 | | | | 8 | |
Scope 1 GHG emissions | | | Tonnes | | | | 16 | | | | 14 | | | | 15 | | | | 13 | |
Scope 2: Energy indirect GHG emissions (tCO2e) | | | | | | | | | | | | | | | | | | | | |
Electricity, market-based2 | | | Tonnes | | | | 18 | | | | 14 | | | | 18 | | | | 16 | |
Electricity, location based3 | | | Tonnes | | | | 181 | | | | 168 | | | | 185 | | | | 80 | |
Heating, market-based4 | | | Tonnes | | | | 314 | | | | 15 | | | | 14 | | | | 17 | |
Heating, location-based4 | | | Tonnes | | | | | | | | 241 | | | | 268 | | | | 287 | |
District cooling | | | Tonnes | | | | 26 | | | | 0 | | | | 0 | | | | 0 | |
Scope 2 GHG emissions (market-based) | | | Tonnes | | | | 359 | | | | 29 | | | | 32 | | | | 33 | |
Scope 2 GHG emissions (location-based)5 | | | Tonnes | | | | 521 | | | | 409 | | | | 453 | | | | 366 | |
Scope 3: Other indirect GHG emissions (tCO2e)6 | | | | | | | | | | | | | | | | | | | | |
Purchased goods and services7 (Cat 1) | | | Tonnes | | | | 220 | | | | 304 | | | | 210 | | | | 204 | |
Capital Goods8 (Cat 2) | | | Tonnes | | | | 78 | | | | 102 | | | | 117 | | | | 56 | |
Fuel- and energy-related activities not included in Scope 1 or Scope 2 (Cat 3) | | | Tonnes | | | | 97 | | | | 119 | | | | 165 | | | | 151 | |
Waste generated in operations (Cat 5) | | | Tonnes | | | | 1 | | | | 1 | | | | 0 | | | | 1 | |
Business travel (Cat 6) | | | Tonnes | | | | 449 | | | | 100 | | | | 113 | | | | 379 | |
Employee commuting (Cat 7) | | | Tonnes | | | | 30 | | | | 17 | | | | 18 | | | | 19 | |
Upstream leased assets9 (Cat 8) | | | Tonnes | | | | 132 | | | | 118 | | | | 94 | | | | 117 | |
Scope 3 GHG emissions | | | Tonnes | | | | 1,007 | | | | 761 | | | | 718 | | | | 927 | |
Scopes 1-3 GHG emissions, total (market-based)10 | | | Tonnes | | | | 1,381 | | | | 803 | | | | 765 | | | | 972 | |
GHG intensities and miscellaneous GHG information | | | | | | | | | | | | | | | | | | | | |
Total Scope 1-3 GHG emissions / permanent employee | | | Tonnes/employee | | | | 6.8 | | | | 4.2 | | | | 3.9 | | | | 4,6 | |
Total Scope 1-3 GHG emissions / m2 | | | Tonnes/m2 | | | | 0.075 | | | | 0.043 | | | | 0.041 | | | | 0,053 | |
Change in GHG emissions compared to baseline year (2018)11 | | | % | | | | 0% | | | | -42% | | | | -45% | | | | -30% | |
| | |
| | |
| | |
ANNUAL REPORT 2022 | | 49 |
| | |
| | | |
|
| |
| INTRODUCTION |
| |
| IMPACT |
| |
Lending impact |
| |
Funding in 2022 |
| |
NIB Environmental Bonds |
| |
NIB and climate change |
| |
| u Internal impact |
| |
Impactful workplace |
| |
Sustainability management |
| |
About this report |
| |
Independent Assurance Report |
| |
| GOVERNANCE |
| |
| BOD REPORT |
| |
| FINANCIALS |
| |
| SUSTAINABILITY INDICES |
| |
| |
| |
| |
| |
| |
| |
| |
| |
| |
| |
| |
| |
| |
| |
| |
| |
| |
| |
| |
| |
| |
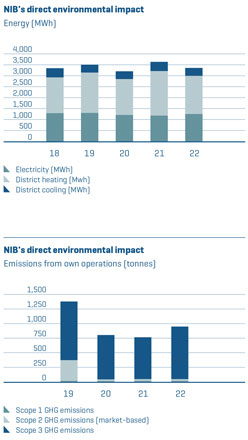

In 2022, the Ancient Woods Foundation acquired an old-grown forest in Lithuania through NIB’s earlier contribution. The forest will be protected to preserve its biodiversity. Read more here.
Compensating for our internal carbon footprint
While aiming to continuously reduce our own carbon footprint, we are stepping up efforts to compensate for the residual emissions that cannot be avoided.
To offset the previous year’s residual emissions to the atmosphere, we have purchased carbon dioxide removal credits from projects that store CO2 in soil and in bio-based construction
materials. Through these projects, NIB not only ensures the durable removal of its own carbon footprint but also supports circular economy projects in its member countries.
NIB has also supported a Baltic Sea cleaning project. NIB’s contribution will improve the handling of dry bulk fertilisers in one of the main cargo terminals in Poland, reducing nutrient discharge to the Baltic Sea from port operations.
| | | | | | | | | | | | | | | | | | | | |
| Water and waste | | | | | | | | | | | | | | | | | | | | |
| | | | Unit | | | | 2019 | | | | 2020 | | | | 2021 | | | | 2022 | |
Water | | | m | 3 | | | 3293 | | | | 2171 | | | | 3101 | | | | 2414 | |
Paper; copy and printing (tonnes) | | | Tonnes | | | | 3,8 | | | | 1,7 | | | | 1,6 | | | | 1,0 | |
Recycled paper; office, newspapers, magazines and brochures | | | Tonnes | | | | 5,1 | | | | 6,2 | | | | 5,6 | | | | 6,0 | |
Other waste | | | Tonnes | | | | 22,4 | | | | 16,1 | | | | 11,2 | | | | 15,4 | |
Biowaste | | | | | | | 13,7 | | | | 9,5 | | | | 7,0 | | | | 10,2 | |
Energy waste | | | | | | | 1,6 | | | | 1,2 | | | | 0,7 | | | | 1,2 | |
Mixed waste | | | | | | | 7,1 | | | | 5,4 | | | | 3,5 | | | | 4,0 | |
| | |
| | |
| | |
ANNUAL REPORT 2022 | | 50 |
| | |
| | | |
|
| |
| INTRODUCTION |
| |
| IMPACT |
| |
Lending impact |
| |
Funding in 2022 |
| |
NIB Environmental Bonds |
| |
NIB and climate change |
| |
Internal impact |
| |
| u Impactful workplace |
| |
Sustainability management |
| |
About this report |
| |
Independent Assurance Report |
| |
| GOVERNANCE |
| |
| BOD REPORT |
| |
| FINANCIALS |
| |
| SUSTAINABILITY INDICES |
| |
| |
| |
| |
| |
| |
| |
| |
| |
| |
| |
| |
| |
| |
| |
| |
| |
| |
| |
| |
| |
| |
| | |
Impactful workplace Our goal is to provide a sustainable working environment for our staff. We want our work to have an impact. In 2022 we focused our activities on promoting an inclusive workplace, on enhancing staff wellbeing and leadership development. Fostering an inclusive workplace For us at NIB a sustainable workplace means that we trust and respect each other. We are committed to promoting the equal treatment of our employees and we seek a balanced staff distribution. We support inclusion and strive to prevent discrimination and harassment. We are taking tangible actions on these matters. In 2022, we published our updated EDI Plan, which is available on our website. Our staff was invited to review and provide input to the plan. The EDI action points will be followed up by end of year 2024 to ensure accountability. For the period between 2022 and 2024, the EDI Plan focuses on attracting, recruiting and retaining a diverse NIB workforce, on wellbeing at work and flexible ways of working, and on increasing organisational awareness, accountability and transparency in diversity and inclusion matters. | | 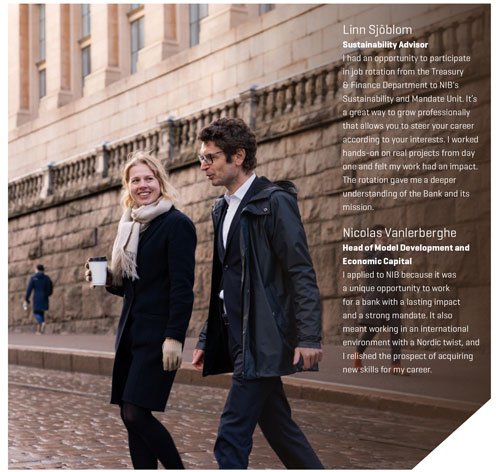 |
| | |
| | |
| | |
ANNUAL REPORT 2022 | | 51 |
| | |
| | | |
|
| |
| INTRODUCTION |
| |
| IMPACT |
| |
Lending impact |
| |
Funding in 2022 |
| |
NIB Environmental Bonds |
| |
NIB and climate change |
| |
Internal impact |
| |
| u Impactful workplace |
| |
Sustainability management |
| |
About this report |
| |
Independent Assurance Report |
| |
| GOVERNANCE |
| |
| BOD REPORT |
| |
| FINANCIALS |
| |
| SUSTAINABILITY INDICES |
| |
| |
| |
| |
| |
| |
| |
| |
| |
| |
| |
| |
| |
| |
| |
| |
| |
| |
| |
| |
| |
| |
| | |
 | | Investing in leadership and professional development In late 2021, NIB initiated the Lead the Way leadership programme. The programme has been running throughout 2022. The programme seeks to strengthen NIB’s shared HR and leadership culture. It uses a coaching approach to support executive management, managers and employees in skills building and strategies for working more inclusively. The focus is on elements such as clarity in communication, self-leadership, feedback culture and performance management. To further strengthen leadership skills within NIB, we chose in 2022 an external partner to provide leadership training for new NIB leaders and those recently appointed to run a team for the first time. The training focuses on inspiring leadership, from objective to results through people, purpose, motivation, and impactful communication. We offer our employees various training opportunities to support development and professional growth. For example in 2022, we launched an internal training called Banking at NIB for recently hired employees. The annual Personal Appraisal and Development Discussions process has been reviewed during 2022. The overall approach has been developed with both staff and manager representatives, and the updated process will be implemented in early 2023. Job rotation We focus on enhancing professional competence through internal job rotations across different departments at NIB. Job rotations have proved an excellent tool for supporting cross-departmental cooperation. They allow the rotating staff to gain a deeper understanding of the Bank. Job rotation is also an opportunity to develop professionally, learn new skills and possibly find a new career path. In 2022, in total seven job rotations were ongoing. |
| | |
| | |
| | |
ANNUAL REPORT 2022 | | 52 |
| | |
| | | |
|
| |
| INTRODUCTION |
| |
| IMPACT |
| |
Lending impact |
| |
Funding in 2022 |
| |
NIB Environmental Bonds |
| |
NIB and climate change |
| |
Internal impact |
| |
| u Impactful workplace |
| |
Sustainability management |
| |
About this report |
| |
Independent Assurance Report |
| |
| GOVERNANCE |
| |
| BOD REPORT |
| |
| FINANCIALS |
| |
| SUSTAINABILITY INDICES |
| |
| |
| |
| |
| |
| |
| |
| |
| |
| |
| |
| |
| |
| |
| |
| |
| |
| |
| |
| |
| |
| |
| |
| |
| |
| |
Supporting wellbeing and a safe work environment
We promote employee wellbeing and health and safety in the work environment. We offer various benefits to promote our staff’s healthy work-life balance.
As part of enhancing employee wellbeing, NIB has a hybrid working model in place. The model is based on a culture of trust, self-leadership, and flexible ways of working. During 2022, we have further increased managers’ and employees’ awareness of hybrid working. A staff survey was conducted with positive results, showing that employees were generally satisfied with hybrid working at NIB. Based on the staff survey, the guiding principles for hybrid working were partly adjusted, providing some increased flexibility.
During 2022, HR continued to arrange quarterly wellbeing sessions, with topics such as resilience and managing physical and mental resources for sustainable performance. In response to the unpredictable geopolitical circumstances, we organised an information and discussion session on the war in Ukraine for the staff in the spring.
We further enhanced the extensive wellbeing benefits that NIB offers to employees. For example, we introduced a new bicycle benefit. More than 20% of the employees have utilized the new bicycle benefit, which is well aligned with NIB’s sustainability efforts, while supporting staff wellbeing.
During the year, NIB considered in particular its safety and security procedures due to the volatile geopolitical situation. Our onsite safety organisation reassembled as we returned to office work after the pandemic. The members received training in fire extinguishing and first aid and were introduced to internal fire safety processes and arrangements. All security-related documentation and instructions were revised and updated.
Our work community
We continued our efforts in attracting and retaining young talent, employees from all NIB´s member countries and female employees. As a result, the number of permanently employed young staff has increased in 2022. NIB hired 22 new employees for permanent positions in 2022. Of these new hires 5 were expatriate employees and 6 of these of employees were below 35 years of age, and 6 were females.
Other developments
To further improve the new employee experience, we have introduced a more formal onboarding journey in 2022. The emphasis is on continuous dialogue and follow-up between the new employee and manager during induction.
We have prepared during 2022 a new process and tool for measuring and improving employee experience, with focus on empowering self-leadership. The tool will be launched in the beginning of 2023. New indicators for measuring the employee experience, such as employee engagement index and employee net promotor score (eNPS) value will also be taken into use.
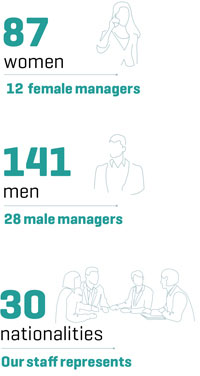
| | |
| | |
| | |
ANNUAL REPORT 2022 | | 53 |
| | |
| | | |
|
| |
| INTRODUCTION |
| |
| IMPACT |
| |
Lending impact |
| |
Funding in 2022 |
| |
NIB Environmental Bonds |
| |
NIB and climate change |
| |
Internal impact |
| |
| u Impactful workplace |
| |
Sustainability management |
| |
About this report |
| |
Independent Assurance Report |
| |
| GOVERNANCE |
| |
| BOD REPORT |
| |
| FINANCIALS |
| |
| SUSTAINABILITY INDICES |
| |
| |
| |
| |
| |
| |
| |
| |
| |
| |
| |
| |
| |
| |
| |
| |
| |
| |
| |
| |
| |
| |
| | |
| | |
| | |
ANNUAL REPORT 2022 | | 54 |
| | |
| | | |
|
| |
| INTRODUCTION |
| |
| IMPACT |
| |
Lending impact |
| |
Funding in 2022 |
| |
NIB Environmental Bonds |
| |
NIB and climate change |
| |
Internal impact |
| |
| u Impactful workplace |
| |
Sustainability management |
| |
About this report |
| |
Independent Assurance Report |
| |
| GOVERNANCE |
| |
| BOD REPORT |
| |
| FINANCIALS |
| |
| SUSTAINABILITY INDICES |
| |
| |
| |
| |
| |
| |
| |
| |
| |
| |
| |
| |
| |
| |
| |
| |
| |
| |
| |
| |
| |
| |
Our work community¹
| | | | | | | | | | | | |
| Based on time-stamp data as per 31 December | | 2022 | | | 2021 | | | 2020 | |
Total number of employees | | | 228 | | | | 221 | | | | 222 | |
Permanent employees | | | 213 | | | | 198 | | | | 193 | |
- Women | | | 83 | | | | 81 | | | | 81 | |
- Men | | | 130 | | | | 117 | | | | 112 | |
Temporary employees | | | 15 | | | | 23 | | | | 29 | |
- Women | | | 4 | | | | 9 | | | | 12 | |
- Men | | | 11 | | | | 14 | | | | 17 | |
Full-time employees | | | 214 | | | | 199 | | | | 200 | |
- Women | | | 79 | | | | 77 | | | | 79 | |
- Men | | | 135 | | | | 122 | | | | 121 | |
Part-time employees2 3 | | | 10 | | | | 22 | | | | 22 | |
- Women | | | 5 | | | | 13 | | | | 14 | |
- Men | | | 5 | | | | 9 | | | | 8 | |
Managerial positions (permanent employees) | | | 40 | | | | 39 | | | | 44 | |
- of which women | | | 12 | | | | 12 | | | | 13 | |
- of which men | | | 28 | | | | 27 | | | | 31 | |
New hires (permanent employees) | | | 22 | | | | 14 | | | | 6 | |
- of which women | | | 6 | | | | 4 | | | | 2 | |
- of which men | | | 16 | | | | 10 | | | | 4 | |
New hires (temporary positions) | | | 11 | | | | 13 | | | | 14 | |
- Women | | | 3 | | | | 5 | | | | 5 | |
- Men | | | 8 | | | | 8 | | | | 9 | |
Leave of absence 3 | | | 4 | | | | 8 | | | | 9 | |
- Women | | | 4 | | | | 6 | | | | 6 | |
- Men | | | 0 | | | | 2 | | | | 3 | |
Average length of employment (permanent employees) | | | 11.52 | | | | 11.90 | | | | 12.80 | |
Exit turnover rate during the year | | | 7.6% | | | | 10.4% | | | | 8.9% | |
Number of permanent employees with university degree (%) | | | 76% | | | | 71% | | | | 74% | |
Average hours of training per year per permanent employee | | | 12.20 | | | | 16.20 | | | | 15.60 | |
¹ NIB has five types of employee contracts: permanent contracts (which are valid until further notice), fixed-term contracts (which are four years and longer), project contracts, substitute contracts and temporary contracts. NIB divides its employees into two main categories: permanent and temporary employees. “Permanent employees” refers to employees with contracts valid until further notice and fixed-term contracts of four years or longer. “Temporary employees” covers all remaining contract types.
² As per 31 December 2022, 4 employees were on paid or unpaid leave. Two employees were on childcare or parental leave and two were on study leave.
3 Historical data recalculated for comparability due to the alignment of calculation principles.
Management composition and diversity by gender – see Note 7.
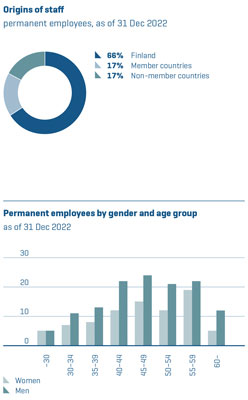
| | |
| | |
| | |
ANNUAL REPORT 2022 | | 55 |
| | |
| | | |
|
| |
| INTRODUCTION |
| |
| IMPACT |
| |
Lending impact |
| |
Funding in 2022 |
| |
NIB Environmental Bonds |
| |
NIB and climate change |
| |
Internal impact |
| |
Impactful workplace |
| |
| u Sustainability management |
| |
About this report |
| |
Independent Assurance Report |
| |
| GOVERNANCE |
| |
| BOD REPORT |
| |
| FINANCIALS |
| |
| SUSTAINABILITY INDICES |
| |
| |
| |
| |
| |
| |
| |
| |
| |
| |
| |
| |
| |
| |
| |
| |
| |
| |
| |
| |
| |
| |
Sustainability management
As humanity is facing the ever more pressing challenges, we are required to rethink the way we use environmental, human and financial resources to promote green and just transitions and opportunities for sustainable economic growth. This shift will require time, coordination, and effort. We are committed to play our role as an international financial institution by financing elements of these transitions, by raising practices and standards, and by promoting dialogue across all actors involved.
NIB’s Sustainability Policy
NIB’s Sustainability Policy sets out the principles, commitments and framework for sustainability at NIB and is approved by the Board of Directors. Its purpose is to define how sustainability is taken into account in all NIB’s business conduct, credit and investment decisions. The policy applies bank-wide and to all of NIB’s operations.
The Sustainability Policy should be read with NIB’s Mission, Strategy and Values, as well as other relevant Bank policies and frameworks, such as the Integrity and Compliance Policy, Integrity Due Diligence Policy, Code of Conducts, Mandate Rating Framework, and Responsible Investment Framework. As the policy also supports the management of ESG-related risks and the assessment of their materiality, it should also be read in conjunction with NIB’s risk management framework (policies and procedures). NIB’s policies and frameworks are available on our website. The Bank’s Integrity Policy Framework is explained in the Integrity Report.
Our exclusion list
The Sustainability Policy also lists counterparty-level activities and projects that NIB will not knowingly finance or invest in (“exclusion list”). To support the goals of the Paris Climate Agreement, we exclude financing for upstream activities, transportation, storage or processing of fossil fuels and fossil-fuel based energy generation. Nor do we finance companies involved in extraction, processing or transport of coal, peat or unconventional or arctic oil and gas. The full exclusion list is available here.
Our principles and commitments
Sustainability is at the core of NIB’s mission and mandate. We are committed to:
| | • | | Supporting sustainable, prosperous and well-functioning societies by providing long-term financing to investments with positive socioeconomic and environmental impacts. We assess all projects considered for financing for their potential impact on productivity and the environment. |
| | • | | Addressing the climate challenge in accordance with the Paris Climate Agreement by limiting global warming to well below 2°C and pursuing efforts to limit it to 1.5°C. Read more about NIB and climate change here. |
| | • | | Supporting the special protected status of the Baltic Sea and its importance for sustainable growth in the region. NIB also has a focus on the protection of the Arctic region’s unique and vulnerable nature. |
| | • | | Incorporating ESG factors in NIB’s investment and credit decisions. |
| | • | | Further developing and supplying financial and investment products that support sustainable finance and encourage and enable sustainable economic activities. |
| | • | | Sharing knowledge and experience to promote sustainable finance in a collaborative and inclusive manner. |
| | • | | Promoting transparency and integrity and disclosing our sustainability performance and impact. |
| | • | | Actively working to increase the sustainability of NIB’s internal operations. |
| | • | | Recognising the importance of equal opportunities, diversity and gender equality, human rights, labour rights and freedom, business ethics, and fighting fraud and corruption. |
| | |
| | |
| | |
ANNUAL REPORT 2022 | | 56 |
| | |
| | | |
|
| |
| INTRODUCTION |
| |
| IMPACT |
| |
Lending impact |
| |
Funding in 2022 |
| |
NIB Environmental Bonds |
| |
NIB and climate change |
| |
Internal impact |
| |
Impactful workplace |
| |
| u Sustainability management |
| |
About this report |
| |
Independent Assurance Report |
| |
| GOVERNANCE |
| |
| BOD REPORT |
| |
| FINANCIALS |
| |
| SUSTAINABILITY INDICES |
| |
| |
| |
| |
| |
| |
| |
| |
| |
| |
| |
| |
| |
| |
| |
| |
| |
| |
| |
| |
| |
| |
Sustainability governance
Governance of climate-related risks and opportunities and Environmental, Social, and Governance (ESG) risks in general is integrated in NIB’s core governance structure. The Governance Statement is available on pages 68-73 and it includes information about the management and supporting committees. More detailed description on NIB’s sustainability governance can be found from NIB’s Sustainability Policy. Read more about NIB’s risk governance in general in the Governance Statement and in the Risk Management Policy.
ESG integration in business
Mandate and sustainability assessment of projects
The Bank works towards its vision by providing long-term lending to projects that improve productivity and benefit the environment of the Nordic and Baltic countries. For this purpose, the Bank assess whether the project or activity considered for financing fulfil the requirements set out in our Mandate Rating Framework.
All investments proposed for financing also undergo a sustainability review in accordance with NIB’s Sustainability Policy and ESG Guidelines for Lending. The review ensures that the project complies with internationally and nationally recognised environmental and social standards and that it is resilient. Assessing the impact of an investment on climate has long been an integral part of NIB’s sustainability due diligence and we quantify the expected change in GHG emissions resulting from a project.
Sustainability governance at NIB
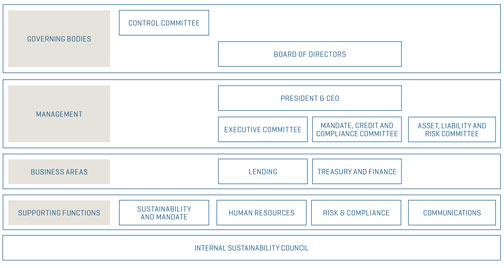
Project monitoring and follow-up
Following project completion, NIB evaluates the realisation of the estimated productivity gains and/or environmental benefits as agreed during the loan negotiation. When a project has reached operating maturity (normally within three years after completion), it receives an ex-post evaluation to assess
if adherence to NIB’s Sustainability Policy and mandate criteria have been fulfilled. The principles for this process are set out in NIB’s Monitoring and Ex-Post Mandate Assessment Framework. NIB uses these results to further develop its mandate rating methodology and apply the lessons learned to the assessment of future projects.
| | |
| | |
| | |
ANNUAL REPORT 2022 | | 57 |
| | |
| | | |
|
| |
| INTRODUCTION |
| |
| IMPACT |
| |
Lending impact |
| |
Funding in 2022 |
| |
NIB Environmental Bonds |
| |
NIB and climate change |
| |
Internal impact |
| |
Impactful workplace |
| |
u Sustainability management |
| |
About this report |
| |
Independent Assurance Report |
| |
| GOVERNANCE |
| |
| BOD REPORT |
| |
| FINANCIALS |
| |
| SUSTAINABILITY INDICES |
| |
| |
| |
| |
| |
| |
| |
| |
| |
| |
| |
| |
| |
| |
| |
| |
| |
| |
| |
| |
| |
| |
| | |
Counterparty ESG assessment In addition to projects, NIB engages with its clients and assess the environmental, social and governance (ESG) profiles of its lending counterparties at the borrower or risk owner level. In the ESG assessment, NIB places special emphasis on reviewing our counterparties’ climate strategies, targets, performance, and governance. The ESG assessment gives more information about how a project financed by NIB supports the overall journey of the client towards more sustainable operations. The review also helps to identify potential significant ESG | | risks. In 2022, we published new ESG Guidelines for our lending operations. NIB has a Responsible Investment Framework and accompanying guidelines and processes to ensure that the companies NIB invests in, and transacts with, meets its expectations of sound ESG performance. The framework has been fully implemented and strengthens NIB’s dialogue with investors and treasury counterparties on material ESG issues. NIB is signatory of the United Nations Principles for Responsible Banking (PRB) and reports accordingly, see page 189. |
Sustainability and Climate Risk Management at NIB
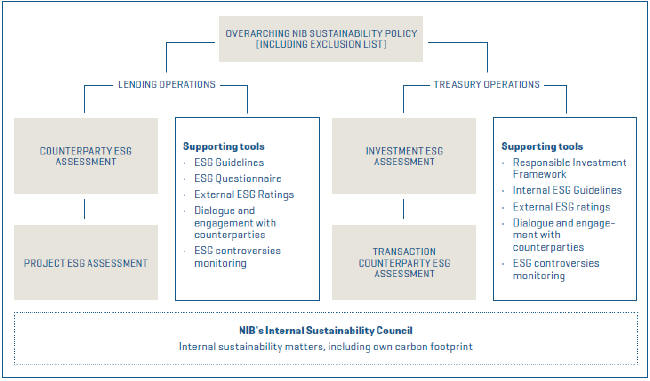
|
Responsible investments in treasury activities NIB is a signatory of the United Nation Principles for Responsible Investment (PRI), thus committing to incorporate environmental, social and governance factors into our investment decisions. NIB will publish its’ first PRI report concerning year 2022 and the report will be available on PRI’s official website during the second half of 2023. The best-in-class approach of the Responsible Investment Framework is ensuring that NIB’s Liquidity Portfolio investments are tilted towards better ESG rated entities. As of end of 2022, 93.1% of the holdings were invested into the four best deciles as can be seen in the graph below. The share of the sustainable thematic investments has increased during 2022, resulting in 10.9% of the total liquidity bond portfolio as of 31.12.2022. |
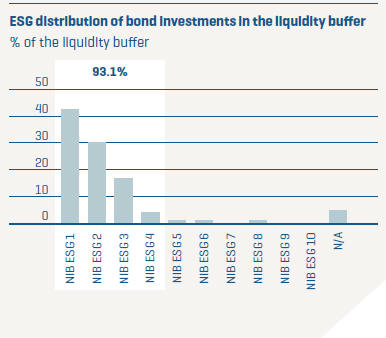
|
| | |
| | |
| | |
ANNUAL REPORT 2022 | | 58 |
| | |
| | | |
|
| |
| INTRODUCTION |
| |
| IMPACT |
| |
Lending impact |
| |
Funding in 2022 |
| |
NIB Environmental Bonds |
| |
NIB and climate change |
| |
Internal impact |
| |
Impactful workplace |
| |
u Sustainability management |
| |
About this report |
| |
Independent Assurance Report |
| |
| GOVERNANCE |
| |
| BOD REPORT |
| |
| FINANCIALS |
| |
| SUSTAINABILITY INDICES |
| |
| |
| |
| |
| |
| |
| |
| |
| |
| |
| |
| |
| |
| |
| |
| |
| |
| |
| |
| |
| |
| |
Our commitments and partnerships
NIB is committed to the following international principles, standards and agreements that support our work.
We also participate in global partnerships and networks.
| | |
| | |
| | |
ANNUAL REPORT 2022 | | 59 |
| | |
| | | |
|
| |
| INTRODUCTION |
| |
| IMPACT |
| |
Lending impact |
| |
Funding in 2022 |
| |
NIB Environmental Bonds |
| |
NIB and climate change |
| |
Internal impact |
| |
Impactful workplace |
| |
| u Sustainability management |
| |
About this report |
| |
Independent Assurance Report |
| |
| GOVERNANCE |
| |
| BOD REPORT |
| |
| FINANCIALS |
| |
| SUSTAINABILITY INDICES |
| |
| |
| |
| |
| |
| |
| |
| |
| |
| |
| |
| |
| |
| |
| |
| |
| |
| |
| |
| |
| |
| |
We report on our impact in line with global frameworks and standards. In addition, our policies and activities are evaluated by independent ESG data and research providers. These unsolicited ratings allow us to track our performance and identify areas for improvement. Learn more on our website.
The use by NIB of any MSCI ESG Research LLC or its affiliates (“MSCI”) data, and the use of MSCI logos, trademarks, service marks or index names herein, do not constitute a sponsorship, endorsement, recommendation, or promotion of NIB by MSCI. MSCI services and data are the property of MSCI or its information providers, and are provided ‘as-is’ and without warranty. MSCI names and logos are trademarks or service marks of MSCI.
| | |
| | |
| | |
ANNUAL REPORT 2022 | | 60 |
| | |
|
| |
| INTRODUCTION |
| |
| IMPACT |
| |
Lending impact |
| |
Funding in 2022 |
| |
NIB Environmental Bonds |
| |
NIB and climate change |
| |
Internal impact |
| |
Impactful workplace |
| |
| u Sustainability management |
| |
About this report |
| |
Independent Assurance Report |
| |
| GOVERNANCE |
| |
| BOD REPORT |
| |
| FINANCIALS |
| |
| SUSTAINABILITY INDICES |
| |
| |
| |
| |
| |
| |
| |
| |
| |
| |
| |
| |
| |
| |
| |
| |
| |
| |
| |
| |
| |
| |
Stakeholder dialogue
NIB engages with a wide range of stakeholders. Our key target groups are our staff, customers, investors, political decision-makers and public administrations, non-governmental organisations, the media, and the general public of the Nordic and Baltic countries.
Stakeholder surveys
NIB actively and regularly seeks feedback from its key target groups. Every three years, NIB conducts a comprehensive stakeholder survey among its lending clients, investors and political decision makers of the Nordic–Baltic region. The surveys aim to improve NIB’s understanding of what our key target groups expect from us, and where their interests lie. The most recent survey was carried out in 2021 and the results are available in our Impact Report 2021. As a follow up to the stakeholder survey in 2021, we identified one core action to start improving in 2022. This is to increase our country focus. NIB has appointed designated country leads to strengthen our stakeholder outreach in each of our member countries. Read more how we use the stakeholder survey in our materiality process on page 62. NIB also conducts regular work engagement surveys among its staff. The most recent survey was conducted in 2021.
Ongoing communication about our activities
As outlined in NIB’s Public Information Policy, the Bank is entrusted with public funds and is therefore publicly accountable. NIB strives to be transparent about its operations and activities and maintains an ongoing exchange of information with all
interested parties. The Bank’s main communication channels include its website, social media, and its annual and quarterly reports. NIB also publishes periodic newsletters informing of the Bank’s activities.
The Bank discloses information on all signed loans on its website. This includes information on the borrower, the loan sum, the loan maturity, a project description, and a summary of the project’s anticipated sustainability impact. Further, we communicate about our funding activities and the bonds we issue. On an annual basis, we report on the impact of the projects financed by the proceeds of NIB Environmental Bonds, see also page 33 for more information.
Category A projects
Loan projects with potentially negative social or environmental impacts are classified as Category A projects. These projects are required to undergo a full environmental impact assessment (EIA). The EIAs are made available on NIB’s website for public comment for 30 days before NIB’s Board of Directors makes a decision on financing. This is one way for stakeholders to voice their opinion on projects considered for NIB funding. Communication on Category A projects is managed via the email address info@nib.int. In 2022, NIB published information about two Category A projects and received no responses.
Reporting concerns to NIB
NIB encourages staff and external parties to report concerns in good faith, including allegations or suspicions of misconduct or prohibited practices (corruption, fraud, coercion, collusion,
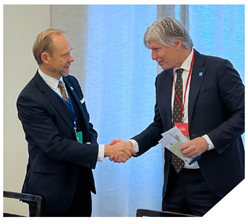
During the year, we organised and attended a variety of events where we had the opportunity to engage with our stakeholders. On November 1, NIB President and CEO, André Küüsvek, addressed the Nordic Council Committee for a Sustainable Nordic Region to discuss our sustainable financing offer and its role in promoting the green transition. The meeting was chaired by Ola Elvestuen, Chair of the committee and member of the Standing Committee on Energy and the Environment in the Norwegian Parliament.
theft, obstruction, money laundering, and terrorist financing) occurring in connection with NIB-related activities. More information is available on NIB’s Integrity Report and website.
| | |
| | |
| | |
ANNUAL REPORT 2022 | | 61 |
| | |
| | | |
|
| |
| INTRODUCTION |
| |
| IMPACT |
| |
Lending impact |
| |
Funding in 2022 |
| |
NIB Environmental Bonds |
| |
NIB and climate change |
| |
Internal impact |
| |
Impactful workplace |
| |
| u Sustainability management |
| |
About this report |
| |
Independent Assurance Report |
| |
| GOVERNANCE |
| |
| BOD REPORT |
| |
| FINANCIALS |
| |
| SUSTAINABILITY INDICES |
| |
| |
| |
| |
| |
| |
| |
| |
| |
| |
| |
| |
| |
| |
| |
| |
| |
| |
| |
| |
| |
| |
NIB’s key stakeholder interactions in 2022
| | | | | | |
| | | Key stakeholders | | Modes of interaction | | 2022 activity examples |
Customers | | Private and public companies, institutions, municipalities, sovereign countries, banks and other IFIs | | Online and live meetings, webinars, newsletters and press releases, social media, other communication | | • 54 new loan agreements • EUR 3,705 million in lending disbursed • SMEs reached via four new loans disbursed to financial institutions |
Investors | | Central banks and commercial banks, pension funds and insurance companies, asset managers and government entities | | Online meetings and live, investor events, conferences, newsletters, webinars, other communication | | • Two USD benchmark bonds issued • >EUR 1 billion NIB Environmental Bonds issued • 111 funding transactions |
Political decision-makers and public administrations | | State representatives in Denmark, Estonia, Finland, Iceland, Latvia, Lithuania, Norway, and Sweden, as well as other selected countries where NIB operates | | Our owners govern NIB via representatives on the Board of Governors (BoG), Board of Directors (BoD) and Control Committee (CC) | | • The BoG held its annual meeting in May • The BoD held nine meetings • The CC held two ordinary meetings • NIB is a institutional partner in the Coalition of Finance Ministers for Climate Action • The COP27 Nordic Pavilion |
NGOs | | Non-governmental organisations raising awareness on environmental protection and social aspects | | Publishing information on signed loans. Inviting comments on loan projects with potentially extensive environmental impacts, known as Category A projects | | • Contributions to NGOs working to protect the Baltic Sea in the form of expertise and donations • Publication of information about two Category A projects |
Media | | Mainly the financial media | | Press releases, newsletters, emails, and interviews with press representatives | | • Press releases on agreed loans • Interviews with NIB’s directors and experts • Answering questions from the media • Offering background information to journalists writing about green investments |
General public | | Anyone interested in NIB’s operations | | Meetings, website, newsletters, press releases, online annual reports, social media | | • Staff giving presentations about NIB and its mission at various events, to student groups and NGOs • Dialogue via info@nib.int |
Staff | | NIB is headquartered in Helsinki and had a total of 228 employees at year-end 2022 | | Meetings, intranet, staff plenum, work engagement surveys, induction for new employees, in-house training | | • Webcasts for the staff • Staff day for all employees • Internal seminars and trainings • Hybrid working survey • Regular Cooperation Council meetings |
| | |
| | |
| | |
ANNUAL REPORT 2022 | | 62 |
| | |
| | | |
|
| |
| INTRODUCTION |
| |
| IMPACT |
| |
Lending impact |
| |
Funding in 2022 |
| |
NIB Environmental Bonds |
| |
NIB and climate change |
| |
Internal impact |
| |
Impactful workplace |
| |
| u Sustainability management |
| |
About this report |
| |
Independent Assurance Report |
| |
| GOVERNANCE |
| |
| BOD REPORT |
| |
| FINANCIALS |
| |
| SUSTAINABILITY INDICES |
| |
| |
| |
| |
| |
| |
| |
| |
| |
| |
| |
| |
| |
| |
| |
| |
| |
| |
| |
| |
| |
| |
Defining what matters
This chapter describes our process for determining the material topics we are reporting on this year. Our report has been prepared in accordance with the GRI Standards and covers the period of 1 January – 31 December 2022.
The aim of our materiality process is to understand how our sustainability context evolves over time and how this affects our stakeholders’ expectations of NIB as a financier of a prosperous and sustainable Nordic–Baltic region. Regular engagement with our stakeholders help us to identify and assess our impact on the economy, environment, and societies, and informs our decisions on what topics to include in our reporting.
Truly material issues do not change annually within NIB. Our most recent, more extensive update to our materiality assessment was done in 2021. We are basing our materiality process on the results of three stakeholder engagements: The
Strategy Review process, the Stakeholder Survey, and the Work Engagement Survey. Our annual sustainability reporting reflects these results. During 2022, we have reviewed our material topics from the previous reporting period to identify changes, new, or emerging topics.
The year 2022 was dominated by the outbreak of war in Ukraine. For NIB’s stakeholders, the immediate impact was short-term energy disruption as well as accelerating inflation in Nordic-Baltic region.
NIB’s role in the current situation is to act in line with its revised strategy and focus on energy independence, the green transition and to support the member country companies. This is in line with NIB’s priorities, which include increasing climate finance activities, focus on high-impact transitions in hard-to-abate sectors and promoting the development of the sustainable finance and capital markets. Read more from the Report of the Board of Directors.
| | |
| | |
| | |
ANNUAL REPORT 2022 | | 63 |
| | |
| | | |
|
| |
| INTRODUCTION |
| |
| IMPACT |
| |
Lending impact |
| |
Funding in 2022 |
| |
NIB Environmental Bonds |
| |
NIB and climate change |
| |
Internal impact |
| |
Impactful workplace |
| |
| u Sustainability management |
| |
About this report |
| |
Independent Assurance Report |
| |
| GOVERNANCE |
| |
| BOD REPORT |
| |
| FINANCIALS |
| |
| SUSTAINABILITY INDICES |
| |
| |
| |
| |
| |
| |
| |
| |
| |
| |
| |
| |
| |
| |
| |
| |
| |
| |
| |
| |
| |
| |
Materiality process
| | | | | | | | |
Our stakeholder engagements | | | | | | Determining our material topics |
STRATEGY REVIEW AND IMPLEMENTATION Stakeholder groups: Board of
Directors, senior management The Board and senior management reviewed NIB’s strategy during autumn 2021, reflecting on the Bank’s mission and mandate, credit rating, product offering and value proposition as an international financial institution operating in the Nordic-Baltic region and beyond. NIB’s business strategy and implementation during 2022 is described on pages 8-9. | | | | | | 1 | | 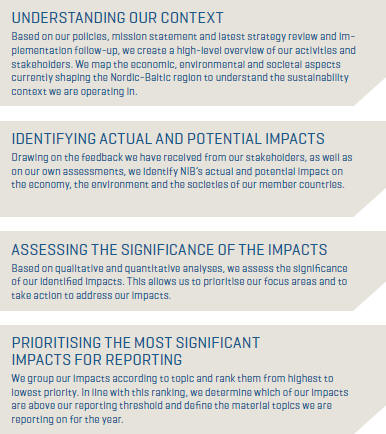 |
| | | | |
| | | | | | |
STAKEHOLDER SURVEY 2021 Stakeholder groups: Lending customers,
investors, public authorities In 2021, NIB conducted a survey among key external stakeholder groups to understand their expectations of the Bank, and asked respondents to evaluate NIB’s activities and product offering in accordance with their perceived relevance to their business. Further, respondents were asked to rank a list of potential ESG-related focus areas for NIB’s financing. | | | | | | 2 |
| | | | | | 3 |
| | | | | | |
WORK ENGAGEMENT SURVEY 2021 Stakeholder group: NIB staff Our most recent Work Engagement Survey was carried out in spring 2021. Our staff gave feedback on their individual motivation, their sense of purpose in working for NIB, personal development opportunities, management and the work community. | | | | | | 4 |
| | | | |
| | |
| | |
| | |
ANNUAL REPORT 2022 | | 64 |
| | |
| | | |
|
| |
| INTRODUCTION |
| |
| IMPACT |
| |
Lending impact |
| |
Funding in 2022 |
| |
NIB Environmental Bonds |
| |
NIB and climate change |
| |
Internal impact |
| |
Impactful workplace |
| |
| u Sustainability management |
| |
About this report |
| |
Independent Assurance Report |
| |
| GOVERNANCE |
| |
| BOD REPORT |
| |
| FINANCIALS |
| |
| SUSTAINABILITY INDICES |
| |
| |
| |
| |
| |
| |
| |
| |
| |
| |
| |
| |
| |
| |
| |
| |
| |
| |
| |
| |
| |
| |
The most material topics 2022
We have grouped the material topics we are reporting on into three categories: sustainable finance, good governance and meaningful work. The relevant GRI disclosures were mapped as closely as possible to these topics. We aim to report in accordance with the GRI Standards, but have a few omissions that are specified in the GRI index. To accurately reflect the impact of NIB’s financing, we have also included a number of own indicators in the index that are in line with our Mandate Rating Framework.
| | | | | | | | |
| | | | | | | Boundary |
| | | Topics | | Description | | Inside NIB | | Outside NIB |
Sustainable finance As the international financial institution (IFI) of the Nordic and Baltic countries, NIB has both an economic and societal role to play. NIB’s purpose is to provide long-term financing to investments that improve productivity and benefit the environment of the eight Nordic and Baltic countries. In times of economic crisis, the owners of the Bank have also authorised NIB to provide additional mitigating instruments to support the member countries and the Bank’s customers. The drivers for NIB’s lending are outlined in the Mandate Rating Framework. Climate change is an environmental as well as a societal challenge. The need to provide climate finance and to transition hard-to-abate sectors is underlined by both our internal and external stakeholders and is one of our main priorities. As outlined in NIB’s Sustainability Policy, the Bank will support its member countries’ efforts to achieve climate goals and enhance biodiversity in nature. |
Economic and social matters ◾ GRI 201: Economic Performance ◾ GRI 203: Indirect Economic Impacts | | Long-term financing Economy | | Both our internal and external stakeholders highlighted the Bank’s role as a long-term financier of a sustainable Nordic–Baltic region and its ability to provide support also in difficult times as NIB’s strongest attributes. The Bank’s strong financial standing is crucial for maintaining its ability to make an impact. NIB aims to earn sufficient return from its business operations to meet economic obligations to ensure its future lending capacity, and to guarantee its owner countries a reasonable return on paid-in capital. | | | | ● |
| | Investments in human capital Economy, people | | To support productivity growth and social cohesion in its member countries, NIB finances projects that contribute to technical progress and innovation, human capital development and equal opportunities. | | | | ● |
Climate and environment ◾ GRI 305: Emissions ◾ Own indicators | | Investments in infrastructure and climate finance Environment | | To achieve environmental benefits and support climate change mitigation and adaptation, NIB finances projects in the areas of transport, electricity and thermal heat generation, green buildings, and water management. | | | | ● |
| | Emissions from NIB-financed projects Environment | | NIB analyses the CO2 impact of each investment considered for financing. New technologies that support climate change adaptation and mitigation are one of NIB’s main focus areas. The Bank supports its member countries’ efforts to achieve climate goals. | | | | ● |
| | | Emissions from NIB’s internal operations Environment | | NIB’s most substantial carbon impact arises from its lending operations. However, it is important for us to reduce the carbon impact of our own internal operations. Our aim is to regularly measure, monitor, improve, manage and transparently report our internal carbon footprint and the progress made. | | ● | | ● |
Good corporate governance As NIB is an IFI entrusted with public funds, the Bank strives to carry out its activities with the highest integrity and in compliance with its own rules and best market practices to maintain our reputation and reliability. Prevention is at the forefront of NIB’s integrity and compliance efforts. NIB’s Integrity and Compliance Policy outlines the commitments and measures to avoid or mitigate and manage integrity and compliance risks. |
Integrity and compliance ◾ GRI 205: Anti-corruption | | Anti-money laundering and anti-bribery and corruption Economy | | Any issues relating to prohibited practices – such as corruption, fraud, bribery, money laundering and terrorist financing – are regarded as material. The Bank’s stakeholders expect high ethical standards from NIB, and we expect high standards from ourselves. | | ● | | ● |
Meaningful work NIB’s staff is a key internal stakeholder group and one of the Bank’s most important assets. Without highly skilled personnel, the Bank cannot reach its targets and fulfil its mission. In line with NIB’s Code of Conduct, the Bank’s goal as an employer is to provide a sustainable and inclusive working environment for its staff. NIB’s corporate values are commitment, competence and cooperation. |
Employment ◾ GRI 401: Employment ◾ GRI 404: Training and education ◾ GRI 406: Non-discrimination | | Training and development People | | NIB employees have raised training and learning opportunities as one of the most important aspects of working at NIB. As an international expert organisation, NIB values employees’ dedication to continuously develop their skills. The Bank offers various training opportunities and aims to support professional growth and individual career planning for its staff. | | ● | | |
| | Equality, diversity and inclusion People | | We are committed to promoting fair and equal treatment of all our employees. We support inclusion and strive to prevent discrimination and harassment. NIB has an internal Equality, Diversity and Inclusion (EDI) Plan in place. The EDI Plan was updated in 2022 and is publicly available. | | ● | | |
| | |
| | |
| | |
ANNUAL REPORT 2022 | | 65 |
| | |
| | | |
|
| |
| INTRODUCTION |
| |
| IMPACT |
| |
Lending impact |
| |
Funding in 2022 |
| |
NIB Environmental Bonds |
| |
NIB and climate change |
| |
Internal impact |
| |
Impactful workplace |
| |
Sustainability management |
| |
| u About this report |
| |
Independent Assurance Report |
| |
| GOVERNANCE |
| |
| BOD REPORT |
| |
| FINANCIALS |
| |
| SUSTAINABILITY INDICES |
| |
| |
| |
| |
| |
| |
| |
| |
| |
| |
| |
| |
| |
| |
| |
| |
| |
| |
| |
| |
| |
| |
About this report
The Nordic Investment Bank (NIB) is an international financial institution (IFI), owned by the governments of the eight Nordic and Baltic countries. The Bank’s only office is located in Helsinki, Finland.
We report on our activities, impact and sustainability performance on an annual basis. For 2022, NIB is publishing one combined Annual Report covering our activities, impact and sustainability reporting, governance, and financials. The annual report of the Board of Directors and audited financial statements for the year ended 31 December are included in the Annual Report and approved by the Board.
Other reports
NIB’s Integrity Report 2022 is available here. All external reports are available on our website at Our year.
Scope of this report
This report covers the period of 1 January to 31 December 2022, which is NIB’s financial year. NIB’s main impact stems from its lending to projects that improve productivity and benefit the environment of the Nordic-Baltic region and other countries. The Bank’s smaller impact arises from the running of its internal operations. NIB therefore reports separately on the impact of NIB-financed activities and on its own internal impact. The lending impact figures presented in this report are based on disbursed loan amounts, unless otherwise indicated. More information on how we calculate impact can be found on our website.
An independent third party has provided limited assurance on selected sustainability information in this report. The scope of the assured information is indicated in the Independent
Assurance Report on page 66-67. Report on the Audit of the Financial Statements is available on pages 170-175.
Disclosure in relation to commitments and initiatives
This report reflects our disclosure in the context of several commitments and initiatives we are participating in, including the following:
| ◾ | On an annual basis, NIB reports on the impact of projects financed by the proceeds of NIB Environmental Bonds (NEBs). |
| ◾ | This report has been prepared in accordance with the GRI Standards. |
| ◾ | This report partly covers the disclosures recommended by the Task Force on Climate-related Financial Disclosure (TCFD). The TCFD disclosure index is available on page 195. |
| ◾ | NIB reports on the implementation of the Principles of Responsible Banking (PRB). See the PRB index on page 189. |
Disclaimer
The historical information presented in this report speaks only as of its respective date. NIB expressly disclaims any intention or obligation to update or revise any such information. This report does not constitute an offer to sell, or the solicitation of an order to buy, any of the securities referred to, and is provided for information purposes only. None of the documents or other information appearing in this report or on any webpages linked from the report should be construed as investment, legal or tax advice.
Any reproduction or distribution of any of the documents or other information appearing in or linked from the report, in whole or in part, or any disclosure of any of their contents may
be prohibited or limited by the laws of certain jurisdictions. By proceeding to any of the webpages or otherwise accessing information in the report, you represent, warrant and agree to your compliance with all such prohibitions or limitations.
By accessing the webpages linked from this report, you represent and warrant that you are permitted to do so under the laws of your respective jurisdiction. NIB shall in no case bear liability for any infringement of any such prohibition or restriction.
On forward-looking statements
This report contains a number of forward-looking statements, which include, but are not limited to, statements relating to the macroeconomic environment in the Nordic-Baltic region, the expected development of NIB’s lending and the execution of the Bank’s mission. These statements are typically identified by words such as “anticipate”, “estimate”, “expect”, or “foresee”, and are included to give our stakeholders the opportunity to understand our expectations about the future and the ways we intend to address emerging challenges. By their very nature, these statements reflect known and unknown risks and uncertainties, which require us to make assumptions that may not prove to be accurate. We caution readers of this report about placing undue reliance on these forward-looking statements, as they are not a guarantee of future performance. We do not undertake to correct any such statements.
Contact
We welcome any comments, questions or suggestions regarding this report or our performance. These can be addressed to info@nib.int.
| | |
| | |
| | |
ANNUAL REPORT 2022 | | 66 |
| | |
| | | |
|
| |
| INTRODUCTION |
| |
| IMPACT |
| |
Lending impact |
| |
Funding in 2022 |
| |
NIB Environmental Bonds |
| |
NIB and climate change |
| |
Internal impact |
| |
Impactful workplace |
| |
Sustainability management |
| |
About this report |
| |
| u Independent Assurance Report |
| |
| GOVERNANCE |
| |
| BOD REPORT |
| |
| FINANCIALS |
| |
| SUSTAINABILITY INDICES |
| |
| |
| |
| |
| |
| |
| |
| |
| |
| |
| |
| |
| |
| |
| |
| |
| |
| |
| |
| |
| |
| |
Independent Assurance Report to the Management of Nordic Investment Bank
We have been engaged by the Management of Nordic Investment Bank (hereafter “NIB”) to provide limited assurance on selected sustainability indicators and information presented in NIB’s Annual Report 2022 (hereafter “Selected Sustainability Information”) for the year ended 31 December 2022.
The Selected Sustainability Information consists of the following:
GRI disclosures
| | • | | GRI 2 General disclosures (2021): 2-7, 2-8, 2-27, 2-30 |
| | • | | GRI 305 Emissions (2016): 305-1, 305-2, 305-3, 305-4, 305-5 |
| | • | | GRI 401 Employment (2016): 401-1 |
| | • | | GRI 404 Training and Education (2016): 404-1, 404-2, 404-3 |
| | • | | GRI 406 Non-discrimination (2016): 406-1 |
Non-financial key performance indicators
| | • | | Impact of NIB’s lending (p.188) |
| | - | Own indicator: Impact of NIB’s lending on CO2 emissions |
| | - | Own indicator: Renewable energy generation |
| | - | Own indicator: R&D programmes |
| | - | Own indicator: Onlending to SMEs and environmental projects |
| | - | Own indicator: Electricity networks |
| | - | Own indicator: Healthcare |
| | - | Own indicator: Green Buildings |
| | • | | Table “Impact of NEB-financed projects 2011-2022”: 2022 share (p.33) |
| | • | | Tables about NIB’s internal carbon emissions (p.48) and “Water and waste” (p.49), including related graphs (pp.46–47, 49) |
| | • | | Table “Our work community” (p.54), including related graphics (pp.52–54), and graphs “Origins of staff” and “Permanent employees by gender and age group” (p.54) |
| | • | | Table “NIB’s transition risk heatmap and loans outstanding 2020-2022”: 2022 share and Transition Risk (pp.40-41) |
| | • | | Graph “Distribution of transition risk categories for NIB’s lending portfolio 2021 and 2022, %” (p.41) |
| | • | | Table “Financed emissions for NIB’s lending portfolio 2022” (p.43) |
Management of NEB proceeds, including internal tracking and allocation of funds from NIB Environmental Bonds proceeds to eligible green projects, for financial year 2022 according to NIB Environmental Bond Framework
Management’s responsibilities
The Management of NIB is responsible for the preparation and presentation of the Selected Sustainability Information in accordance with the reporting criteria, i.e. GRI Sustainability
Reporting Standards, and the information and assertions contained within it, as well as parts in NIB Environmental Bond Framework that are applicable to the Annual Report, principles applied in the calculation of financed emissions against the Partnership for Carbon Accounting Financials (PCAF), Global GHG Accounting and Reporting Standard (2020), and calculation principles that NIB has developed. The Management is also responsible for determining NIB’s objectives with regard to sustainable development performance and reporting, including the identification of stakeholders and material issues, and for establishing and maintaining appropriate performance management and internal control systems from which the reported performance information is derived.
Our responsibilities
Our responsibility is to carry out a limited assurance engagement and to express a conclusion based on the work performed. We conducted our assurance engagement on the Selected Sustainability Information in accordance with International Standard on Assurance Engagements (ISAE) 3000 (Revised), Assurance Engagements other than Audits or Reviews of Historical Financial Information, issued by the International Auditing and Assurance Standards Board IAASB. That Standard requires that we plan and perform the engagement to obtain limited assurance about whether the Selected Sustainability Information is free from material misstatement.
| | |
| | |
| | |
ANNUAL REPORT 2022 | | 67 |
| | |
| | | |
|
| |
| INTRODUCTION |
| |
| IMPACT |
| |
Lending impact |
| |
Funding in 2022 |
| |
NIB Environmental Bonds |
| |
NIB and climate change |
| |
Internal impact |
| |
Impactful workplace |
| |
Sustainability management |
| |
About this report |
| |
| u Independent Assurance Report |
| |
| GOVERNANCE |
| |
| BOD REPORT |
| |
| FINANCIALS |
| |
| SUSTAINABILITY INDICES |
| |
| |
| |
| |
| |
| |
| |
| |
| |
| |
| |
| |
| |
| |
| |
| |
| |
| |
| |
| |
| |
| |
KPMG Oy Ab applies International Standard on Quality Management ISQM 1 which requires the firm to design, implement and operate a system of quality management including policies or procedures regarding compliance with ethical requirements, professional standards and applicable legal and regulatory requirements.
We have complied with the independence and other ethical requirements of the International Ethics Standards Board for Accountants’ International Code of Ethics for Professional Accountants, (including International Independence Standards) (IESBA Code), which is founded on fundamental principles of integrity, objectivity, professional competence and due care, confidentiality and professional behavior.
Procedures performed
A limited assurance engagement on Selected Sustainability Information consists of making inquiries, primarily of persons responsible for the preparation of information presented in the Selected Sustainability Information, and applying analytical and other evidence gathering procedures, as appropriate. In the engagement, we have performed the following procedures, among others:
| • | | Interviewed the members of NIB’s senior management and relevant staff responsible for providing the Selected Sustainability Information; |
| • | | Assessed the application of the GRI Sustainability Reporting Standards reporting principles, in the presentation of the Selected Sustainability Information, as well as parts in NIB Environmental Bond Framework that are applicable to the Annual Report, principles applied in the calculation of financed emissions against the PCAF Global GHG Accounting and Reporting Standard (2020), and calculation principles that NIB has developed. |
| • | | Assessed data management processes, information systems and working methods used to gather and consolidate the Selected Sustainability Information; |
| • | | Reviewed the presented Selected Sustainability Information and assessed its quality and reporting boundary definitions; and |
| • | | Assessed the Selected Sustainability Information’s data accuracy and completeness through a review of the original documents and systems on a sample basis. |
The procedures performed in a limited assurance engagement vary in nature and timing from, and are less in extent than for, a reasonable assurance engagement. Consequently, the level of assurance obtained in a limited assurance engagement is substantially lower than the assurance that would have been obtained had a reasonable assurance engagement been performed.
Inherent limitations
Inherent limitations exist in all assurance engagements due to the selective testing of the information being examined. Therefore fraud, error or non-compliance may occur and not be detected. Additionally, non-financial data may be subject to more inherent limitations than financial data, given both its nature and the methods used for determining, calculating and estimating such data.
Conclusion
Our conclusion has been formed on the basis of, and is subject to, the matters outlined in this report.
We believe that the evidence we have obtained is sufficient and appropriate to provide a basis for our conclusions.
Based on the procedures performed and the evidence obtained, as described above, nothing has come to our attention that causes us to believe that the Selected Sustainability Information subject to the assurance engagement is not prepared, in all material respects, in accordance with the GRI Sustainability Reporting Standards, as well as parts in NIB Environmental Bond Framework that are applicable to the Annual Report, principles of the PCAF Global GHG Accounting and Reporting Standard (2020) in the calculation of financed emissions, and calculation principles that NIB has developed.
Helsinki, 24 February 2023
KPMG Oy Ab
Marcus Tötterman
Authorised Public Accountant
Tomas Otterström
Partner, Advisory

| | |
| | |
ANNUAL REPORT 2022 | | 69 |
| | |
|
| |
| INTRODUCTION |
| |
| IMPACT |
| |
| GOVERNANCE |
| |
u Governance statement |
| |
Members of the Governing bodies and management |
| |
| BOD REPORT |
| |
| FINANCIALS |
| |
| SUSTAINABILITY INDICES |
| |
| |
| |
| |
| |
| |
| |
| |
| |
| |
| |
| |
| |
| |
| |
| |
| |
| |
| |
| |
| |
| |
| |
| |
Governance Statement
Introduction
NIB was established as an international financial institution on 4 December 1975 between Denmark, Finland, Iceland, Norway and Sweden by an international treaty. The Bank commenced operations on 2 August 1976. As of 1 January 2005, Estonia, Latvia and Lithuania became members on equal terms. NIB is governed by its constituent documents, which are available here. The constituent documents currently in force include the Agreement concerning the Nordic Investment Bank between its member countries of 11 February 2004 (the “Agreement”) and the related Statutes. These entered into force in 2005 and both were last amended in 2020. The constituent documents also include the Host Country Agreement between the Government of Finland and the Bank of 20 October 2010.
NIB’s governance structure is set out in the Agreement and the Statutes. The Statutes define the relations between and mandate of the Bank’s governing bodies: the Board of Governors, the Board of Directors and the Control Committee. According to the Statutes, NIB also has a President and the staff necessary to carry out its operations.
NIB promotes integrity, transparency, predictability, accountability, responsibility and disclosure as general principles enhancing and furthering good governance. NIB aims to follow best practices in the field of corporate governance.
Governing bodies of the Bank
The governing bodies of the Bank are established pursuant to the Agreement and Statutes and carry out their functions in accordance with their respective Rules of Procedure.
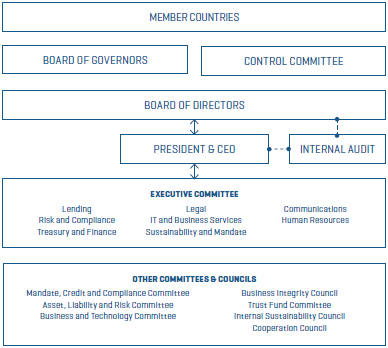
| | |
| | |
ANNUAL REPORT 2022 | | 70 |
| | |
|
| |
| INTRODUCTION |
| |
| IMPACT |
| |
| GOVERNANCE |
| |
u Governance statement |
| |
Members of the Governing bodies and management |
| |
| BOD REPORT |
| |
| FINANCIALS |
| |
| SUSTAINABILITY INDICES |
| |
| |
| |
| |
| |
| |
| |
| |
| |
| |
| |
| |
| |
| |
| |
| |
| |
| |
| |
| |
| |
| |
| |
| |
Board of Governors
The Board of Governors has the powers granted to it in Section 13 of the Statutes. The Board of Governors is composed of eight governors. The Minister designated by it as its Governor represents each member country. The Board of Governors appoints a Chair for a term of one year according to the rotation scheme it has adopted. The Board of Governors holds an annual meeting and such other meetings as deemed appropriate.
Until 31 May 2022 the Governor for Denmark Simon Kollerup Minister for Industry, Business and Financial Affairs has served as Chair. As from 1 June 2022 the Governor for Finland, Annika Saarikko, Minister of Finance, has served as Chair.
The Board of Governors held its annual meeting by written procedure on 5 May 2022.
Control Committee
The Control Committee is a supervisory body established to monitor that the operations of the Bank are conducted in accordance with the Statutes. It is composed of at least ten members with the maximum number of members being twelve. The Nordic Council and Parliaments of Estonia, Latvia and Lithuania appoint one member from each country and the Board of Governors appoint two to four members including the chair and deputy chair. The members appointed by the Board of Governors are referred to as the Chairmanship and administer the responsibilities and tasks of the full Committee, monitor the Bank’s financial position, risk levels, capital and liquidity position and oversee the performance of the audit of the Bank’s financial statements, carried out by the external auditors. The full Committee focuses on monitoring fulfilment of NIB’s purpose and in particular its mandate and mission. The full Committee and the Chairmanship each deliver a report annually to the Board of Governors concerning their monitoring tasks as set out in the Rules of Procedure. The Control Committee appoints the external auditors to carry out the audit of the Bank’s financial statements.
To enhance its governance, the Control Committee has appointed an independent expert to assist the Chairmanship in financial and audit matters since March 2019.
The Control Committee holds at least one meeting each year where the annual report concerning the previous financial year shall be examined. The Chairmanship meets independently at regular intervals each year.
The Control Committee had two ordinary meetings during 2022, the first in Helsinki and the second in Tallinn. The Chairmanship held seven meetings. Toomas Vapper (Estonia), the former Deputy Chair became Chair on 1 June 2022 and Pentti Hakkarainen (Finland) was appointed as its Deputy Chair for a two-year term also from 1 June 2022.
Board of Directors
All the powers of the Bank that are not vested with the Board of Governors are vested with the Board of Directors. The Board of Directors makes the most significant financing decisions and adopts policy decisions concerning the operations of the Bank, in particular the general framework for financing, borrowing and treasury operations and their management. The Board of Directors may delegate its powers to the President to the extent it considers appropriate. The Board of Directors is composed of eight directors and eight alternates appointed by each member country. The Board of Directors appoints from among its members a Chair and a Deputy Chair for a term of two years according to the rotation scheme adopted by the Board of Governors.
The Board of Directors held nine meetings in 2022. Due to ongoing pandemic provisions, the first meeting of the year 1/22 was held fully online, and meetings 2/22 and 3/22 were held as hybrid meetings. The remaining six meetings were held in person.
Esther Finnbogadóttir (Iceland) chaired Board meetings 1/22 – 4/22, completing her two-year term as Chair. Ole Hovland (Norway), previously the Deputy Chair, took up the role of Chair of the Board on 1 June 2022, with Merle Wilkinson (Estonia) becoming the Deputy Chair at the same time.
| | |
| | |
ANNUAL REPORT 2022 | | 71 |
| | |
|
| |
| INTRODUCTION |
| |
| IMPACT |
| |
| GOVERNANCE |
| |
u Governance statement |
| |
Members of the Governing bodies and management |
| |
| BOD REPORT |
| |
| FINANCIALS |
| |
| SUSTAINABILITY INDICES |
| |
| |
| |
| |
| |
| |
| |
| |
| |
| |
| |
| |
| |
| |
| |
| |
| |
| |
| |
| |
| |
| |
| |
| |
President
The President is responsible for conducting the Bank’s current operations and is appointed by the Board of Directors for a term of five years at a time. André Küüsvek is the President and CEO having been appointed by the Board of Directors on 1 April 2021.
Advisory bodies to the President
The President is assisted and advised by the Executive Committee, the Mandate, Credit and Compliance Committee and the Asset, Liability and Risk Committee. The Treasury Committee was abolished, and its tasks re-allocated in September 2022. All the existing committees operate in accordance with their respective Rules of Procedure.
Executive Committee
The Executive Committee assists and advises the President in general management and decision-making concerning NIB, including all aspects of the performance, policy and financial soundness of the Bank. The Executive Committee comprises the President and other senior management representatives the President has appointed as members. The Board of Directors confirms the appointment of members. The Executive Committee meets formally approximately twice a month.
In 2022, the Executive Committee held twenty-five meetings. The meetings are ordinarily chaired by the President, who reaches decisions after having consulted the members. The Executive Committee also meets informally at the commencement of every working day.
Mandate, Credit and Compliance Committee
The Mandate, Credit and Compliance Committee assists and advises the President in management and decision-making concerning mandate, credit and related integrity and compliance matters as well as the overall risk culture of the Bank. The Committee is responsible for preparation and decision-making related to certain lending activities and counterparty ratings for lending and treasury, setting treasury business limits and mandate matters. The Committee grants loans and approves acquisition of certain bonds within the powers delegated to the President by the Board of Directors and in line with the guidelines and instructions given by the Board of Directors.
The President exercises his executive powers concerning lending operations in the Committee. The Mandate, Credit and Compliance Committee is composed of the President and the Head of Lending, the Chief Financial Officer, the Chief Risk Officer, the General Counsel and the Head of Sustainability and Mandate. The Mandate, Credit and Compliance Committee is chaired by the President or, in the absence of the President, another member (other than the Chief Risk Officer). The Committee meets at regular intervals every week. In 2022, the Mandate, Credit and Compliance Committee met sixty-four times.
Asset, Liability and Risk Committee
The Asset, Liability and Risk Committee (“ALR”) is a body established to monitor, analyse, discuss and guide the development and overall management of NIB’s balance sheet, its risk and capital, funding and liquidity positions. Treasury related risk matters (related to funding, asset and liability management, and portfolio management activities) were transferred to the ALR following abolition of the Treasury Committee. The ALR comprises some members of the Executive Committee and other senior staff that the President has appointed as members. All decisions at the ALR require majority support and, at the same time, the Chief Financial Officer as Chair of ALR and the Chief Risk Officer (or their substitutes) both need to be supportive. The ALR meets approximately twelve times a year but can convene more frequently if necessary. In 2022, the ALR met twelve times.
Business and Technology Committee
The Business and Technology Committee chaired by the Chief Operating Officer, is a body established to facilitate IT’s strategic direction and the digital transformation of NIB by prioritising, directing, monitoring and governing NIB’s enterprise IT architecture, IT projects and development initiatives. The Committee meets on a regular basis approximately ten times a year. In 2022, the Committee met eleven times in person and once by written procedure.
Changes to the Advisory Bodies to the President during 2022
With effect from 1 September 2022 changes to the above-mentioned advisory bodies were made with a view to increasing the level of delegation and involvement of experts and middle management in discussions and decision-making. Certain Executive Committee members were released from some committee functions and replaced by middle management level experts.
| | |
| | |
ANNUAL REPORT 2022 | | 72 |
| | |
|
| |
| INTRODUCTION |
| |
| IMPACT |
| |
| GOVERNANCE |
| |
u Governance statement |
| |
Members of the Governing bodies and management |
| |
| BOD REPORT |
| |
| FINANCIALS |
| |
| SUSTAINABILITY INDICES |
| |
| |
| |
| |
| |
| |
| |
| |
| |
| |
| |
| |
| |
| |
| |
| |
| |
| |
| |
| |
| |
| |
| |
| |
In addition, the Treasury Committee was abolished and its functions were transferred to the Asset, Liability and Risk Committee (formerly the Asset and Liability Committee or ALCO) and the Mandate, Credit and Compliance Committee. The changes should increase engagement and the ownership of NIB’s development in the organisation as well as freeing up the President and some Executive Committee members from some committees to have more time available for other responsibilities. Fewer committees should allow for increased business efficiency. Finally, the changes establish a clear hierarchy and reporting lines to the President (and to the Board of Directors) without the President sitting in all committees.
Other internal committees and councils
In addition to the advisory bodies to the President, the Bank has the following permanent internal committees and councils: the Business Integrity Council, the Trust Fund Committee, the Internal Sustainability Council and the Cooperation Council. The President is not a member of these internal committees and councils but appoints the members (save for staff representatives on the Cooperation Council who are elected by the staff). The internal committees and councils also operate in accordance with their respective Rules of Procedure or other applicable rules.
The Business Integrity Council supports awareness raising of integrity and corruption risks among the Bank’s staff and stakeholders. The Council generally meets twice a year. While no formal meeting was held in 2022, several members were consulted on specific topics.
The Trust Fund Committee ensures that the purposes of the trust funds managed by NIB are fulfilled in the most efficient way. The Committee also approves the activity plan of the trust funds as well as proposed allocations from trust funds. The Committee gives its recommendations to the respective donor(s) for their final decision. In 2022, the Committee met two times.
The Internal Sustainability Council aims to strengthen NIB’s sustainability agenda for its in-house activities. The Council has eight members, representing functions dealing with internal sustainability matters. Decisions and action points proposed by the Council are approved by the President. The Council reports to the Executive Committee. In 2022, the Council met two times.
The purpose of the Cooperation Council is to facilitate a cooperation process within NIB with the main aim of improving working conditions and making the interaction between the Bank and the staff more effective, in particular in a manner enabling the Bank to take better account of the staff’s opinions concerning such matters. The Council consists of four members representing the Bank and four representing the staff. The President appoints the representatives of the Bank while the representatives of the staff are elected by vote. The Cooperation Council meets at least quarterly. In 2022, the Council met four times.
Remuneration and incentive programmes
The Board of Governors determines the remuneration and attendee allowance for the Board of Directors and for the Control Committee. The President’s terms of employment, including remuneration, are determined by the Board of Directors. The Control Committee approves the remuneration of the external auditors. The principles for the remuneration of staff are set out in the Compensation Regulations approved by the Board of Directors. The Bank applies a fixed salary-based system which reflects the work profile, qualifications, individual competence and the results that NIB expects the employee to achieve as well as a small performance premium programme that rewards excellent and extraordinary performance on a yearly basis.
Risk management framework
NIB monitors international regulations and standards and adopts those that it identifies to be relevant and represent best practice. The Bank has established a risk, capital and liquidity management framework, with high-level statutory requirements stipulated in the Statutes and the Principles for Capital and Liquidity Management, supported by a Risk Appetite Statement (RAS), an Internal Capital Adequacy Assessment Process (ICAAP), risk management policies, and a Capital and Liquidity Recovery Plan.
| | |
| | |
ANNUAL REPORT 2022 | | 73 |
| | |
|
| |
| INTRODUCTION |
| |
| IMPACT |
| |
| GOVERNANCE |
| |
u Governance statement |
| |
Members of the Governing bodies and management |
| |
| BOD REPORT |
| |
| FINANCIALS |
| |
| SUSTAINABILITY INDICES |
| |
| |
| |
| |
| |
| |
| |
| |
| |
| |
| |
| |
| |
| |
| |
| |
| |
| |
| |
| |
| |
| |
| |
| |
The Bank’s risk management framework comprises risk policies and procedures formulated for the identification, measurement, monitoring and reporting of risks including a comprehensive limit system for managing the exposure to quantifiable risks. The Bank recognises that effective risk management is based on a sound risk culture, which is characterised, among other things, by a high level of awareness concerning risk and risk management in the organisation. Regular training of staff in risk-related matters is part of the Bank’s risk management practices.
The three-lines-of-defence model provides the basis for NIB’s risk governance. The model aims to provide clear segregation of duties between units that enter into business transactions with customers or otherwise expose the Bank to risk, and units in charge of risk assessment, risk measurement, monitoring and control.
At NIB the first line business functions, Lending and Treasury & Finance, are responsible for managing day-to-day risks within their own operations and activities. Lending is responsible for loan origination and mandate fulfilment in accordance with the Bank’s willingness to take risk. Treasury and Finance provides support by executing the funding strategy and managing the liquidity as well as balance sheet risks (asset and liability management).
The second line of defence consist of functions that monitor and oversee the risk-taking of the first line functions. At NIB, the Risk & Compliance department acts as the second line of defence. It independently controls the risk positions of the Bank and implements the Bank’s risk management related policies and practices as approved by the Board of Directors. The Risk & Compliance department has the overall responsibility for identifying, measuring, assessing, monitoring and reporting on risks across risk types and organisational units. The department is responsible for the Bank’s risk models, tools, policies and frameworks (like ICAAP, RAS and capital and liquidity recovery planning and the related reporting) as well as for designing and maintaining of the Bank’s risk limit framework. Limit monitoring is conducted on a regular basis and breaches are reported to the relevant committees, senior management and to the Board of Directors.
The Compliance function belongs to the second line of defence and oversees, coordinates and reports on matters relating to compliance and integrity risks. The Chief Compliance Officer reports to the Chief Risk Officer (CRO), has a dotted reporting line to the President and has unrestricted access to the Chair of the Board of Directors and the Chair of the Control Committee. The activities and mandate of the Integrity and Compliance Office are set forth in the Integrity and Compliance Policy.
The Chief Risk Officer (CRO) heads the Risk & Compliance department and reports to the President. The CRO is a member of the Executive Committee and the Mandate, Credit and Compliance Committee, with the role and purpose to ensure that risk considerations are properly taken into account, to influence decision-making and, when necessary, challenge decisions that give rise to material risk. The CRO is also a decisive member of the Asset, Liability and Risk Committee with respect to risk-related matters. The CRO has unrestricted access to the Chair of the Board of Directors and the Chair of the Control Committee. An important objective is to engage the senior management, Board of Directors and the Control Committee in constructive dialogue on key risk issues.
NIB’s Internal Audit adheres to international professional standards established by the Institute of Internal Auditors. The task of the Internal Audit function is to provide assurance on the effectiveness of the Bank’s internal control, risk management and governance processes, and to make recommendations to the management. Internal Audit provides an independent evaluation of the controls, risk management and governance processes. The Head of Internal Audit reports to the Board of Directors and the Control Committee and works administratively under the auspices of the President. The activities and mandate of the Internal Audit function are set forth in the Internal Audit Charter.
| | |
| | |
ANNUAL REPORT 2022 | | 74 |
| | |
|
| |
| INTRODUCTION |
| |
| IMPACT |
| |
| GOVERNANCE |
| |
Governance statement |
| |
u Members of the Governing bodies and management |
| |
| BOD REPORT |
| |
| FINANCIALS |
| |
| SUSTAINABILITY INDICES |
| |
| |
| |
| |
| |
| |
| |
| |
| |
| |
| |
| |
| |
| |
| |
| |
| |
| |
| |
| |
| |
| |
| |
| |
Board of Directors
as of 31 December 2022
MEMBERS

| | |
| | |
ANNUAL REPORT 2022 | | 75 |
| | |
|
| |
| INTRODUCTION |
| |
| IMPACT |
| |
| GOVERNANCE |
| |
Governance statement |
| |
u Members of the Governing bodies and management |
| |
| BOD REPORT |
| |
| FINANCIALS |
| |
| SUSTAINABILITY INDICES |
| |
| |
| |
| |
| |
| |
| |
| |
| |
| |
| |
| |
| |
| |
| |
| |
| |
| |
| |
| |
| |
| |
| |
| |
| | |
| | |
ANNUAL REPORT 2022 | | 76 |
| | |
|
| |
| INTRODUCTION |
| |
| IMPACT |
| |
| GOVERNANCE |
| |
Governance statement |
| |
u Members of the Governing bodies and management |
| |
| BOD REPORT |
| |
| FINANCIALS |
| |
| SUSTAINABILITY INDICES |
| |
| |
| |
| |
| |
| |
| |
| |
| |
| |
| |
| |
| |
| |
| |
| |
| |
| |
| |
| |
| |
| |
| |
| |
Board of Governors
as of 31 December 2022
MEMBERS
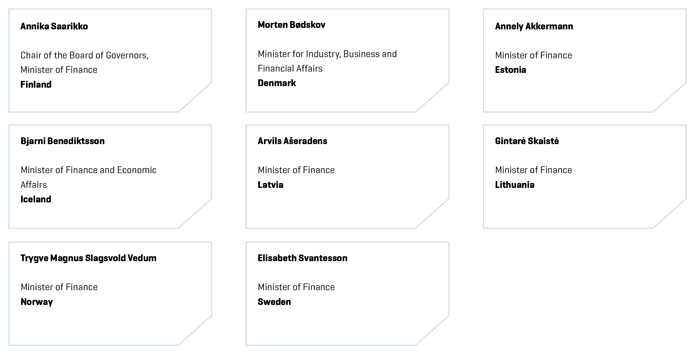
The Annual Meeting of the Board of Governors was held on 5 May 2022.
| | |
| | |
ANNUAL REPORT 2022 | | 77 |
| | |
|
| |
| INTRODUCTION |
| |
| IMPACT |
| |
| GOVERNANCE |
| |
Governance statement |
| |
u Members of the Governing bodies and management |
| |
| BOD REPORT |
| |
| FINANCIALS |
| |
| SUSTAINABILITY INDICES |
| |
| |
| |
| |
| |
| |
| |
| |
| |
| |
| |
| |
| |
| |
| |
| |
| |
| |
| |
| |
| |
| |
| |
| |
Control Committee
AS OF 31 DECEMBER 2022
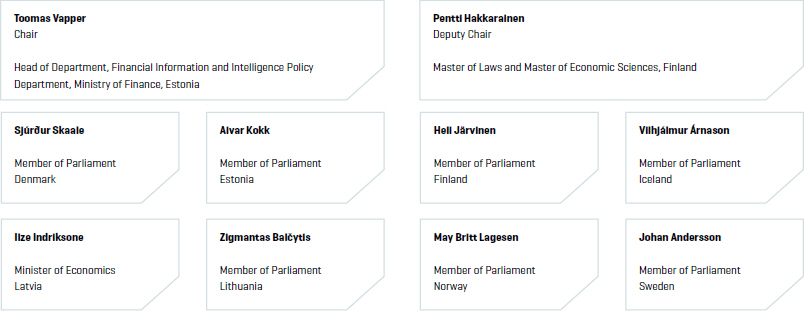
External auditors appointed by the Control Committee
| | |
Terhi Mäkinen | | Mona Alfredsson |
| |
Partner, Authorised Public Accountant, | | Partner, Authorised Public Accountant, |
Ernst & Young, Finland | | Ernst & Young, Sweden |
The Control Committee met twice during 2022.
| | |
| | |
ANNUAL REPORT 2022 | | 78 |
| | |
|
|
| INTRODUCTION |
|
| IMPACT |
|
| GOVERNANCE |
|
Governance Statement |
|
u Members of the Governing bodies and management |
|
| BOD REPORT |
|
| FINANCIALS |
|
| SUSTAINABILITY INDICES |
|
|
|
|
|
|
|
|
|
|
|
|
|
|
|
|
|
|
|
|
|
|
|
|
|
|
|
|
|
|
Executive Committee
as of 31 December 2022
MEMBERS
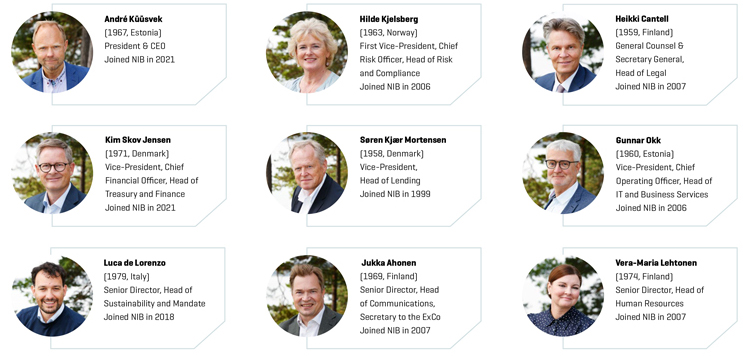
| | |
| | |
ANNUAL REPORT 2022 | | 80 |
| | |
|
| |
| INTRODUCTION |
| |
| IMPACT |
| |
| GOVERNANCE |
| |
BODREPORT |
| |
| FINANCIALS |
| |
| SUSTAINABILITY INDICES |
| |
| |
| |
| |
| |
| |
| |
| |
| |
| |
| |
| |
| |
| |
| |
| |
| |
| |
| |
| |
| |
| |
| |
| |
| |
| |
| |
| |
| |
| |
| |
| |
| |
| |
Report of the Board of Directors 2022
Summary
In 2022 NIB’s operating environment was challenging. Russia’s invasion of Ukraine caused an energy crisis, supply chain disruptions and pushed up inflation both in Europe and in NIB’s Nordic and Baltic member countries. Central banks reacted to price pressures by increasing interest rates at a faster-than-expected pace. Closer to the end of the year, indicators were increasingly pointing towards a period of weaker economic activity in 2023.
Under these circumstances, NIB significantly increased its long-term lending. A total of EUR 3,705 million in loans was disbursed (EUR 2,440 million in 2021). Higher lending volumes reflected the additional demand by member country companies. By stepping up its activities, NIB played a stabilising role during these difficult times.
In 2022, NIB started to implement the strategy approved by the Board at the end of 2021. This included more sustainability-linked lending and increased activity in less well-served market segments. NIB also joined the InvestEU Programme.
NIB’s role in the current situation is to act in line with its revised strategy and focus on the green transition, energy independence, and to support member country companies.
The disbursements to the sectors of energy generation (EUR 357 million, 10% of total disbursed loans) as well as to the transmission and distribution of energy (EUR 577 million, 16%) were among the largest in terms of sectoral composition. Whereas in the previous years the investments in the energy sector were driven mostly by decarbonisation strategies and climate targets, in 2022 security of supply became another prominent driver.
These investments fit well with NIB’s mission to finance projects that improve productivity and benefit the environment in the Nordic and Baltic countries. Accordingly, loans achieving ratings of “good” or “excellent” on at least one of the mandates accounted for 99.2% of the total amount of loans disbursed, well beyond the target of 90%.
Since 2011, the Bank has been issuing NIB Environmental Bonds (NEBs), the proceeds of which are used to finance projects that benefit the environment and support the transition to a low carbon economy. In 2022, NIB’s total NEB issuance surpassed EUR 1 billion – a record-high amount for one year. The overall new funding reached a nominal value of EUR 9.6 billion through 111 bond transactions.
The net profit for the year of EUR 139 million was EUR 20 million lower than in 2021. The underlying core earnings were better than expected with net interest income higher than in 2021. However, due to the volatile financial markets the Bank recorded higher unrealised valuation losses compared to the previous year, and net loan losses was a smaller positive amount in 2022 than in 2021.
The Board of Directors proposes to the Board of Governors that the sum of EUR 25 million be distributed to the Banks’ member countries from the 2022 net profit, which equates to a pay-out ratio of 18% of net profit.
Going forward, the geopolitical situation is one of the most important factors impacting the macroeconomic outlook. The persistence of inflation will be closely monitored by central banks and more interest rate hikes are expected. NIB will play an increasingly important role in promoting the green transition, particularly when it is combined with energy security.
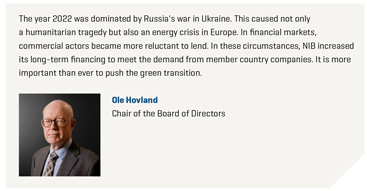
| | |
| | |
ANNUAL REPORT 2022 | | 81 |
| | |
|
| |
| INTRODUCTION |
| |
| IMPACT |
| |
| GOVERNANCE |
| |
| BOD REPORT |
| |
| FINANCIALS |
| |
| SUSTAINABILITY INDICES |
| |
| |
| |
| |
| |
| |
| |
| |
| |
| |
| |
| |
| |
| |
| |
| |
| |
| |
| |
| |
| |
| |
| |
| |
| |
| |
| |
| |
| |
| |
| |
| |
| |
| |
|
Operating environment
After a few years of disruptions caused by COVID-19, the year 2022 was marked by Russia’s war in Ukraine. The ensuing energy crisis, supply chain disruptions and increases in commodity prices pushed up inflation in Europe to rates not seen for decades. NIB’s member countries were also hit by high inflation. To limit further pressures and expectations for higher inflation, central banks had to tighten monetary policy at a faster-than-expected pace.
There were increasing signs of economic slowdown in Europe and the Nordic–Baltic region in the last part of 2022. Various sentiment indicators show a slump in business and consumer confidence. Households’ real disposable income declined as a result of high inflation and rising interest rates. Savings accumulated in particular during the pandemic will partially offset this and support private consumption, but not entirely. As a result, a period of weaker economic activity is to be expected.
Strategy implementation
In 2022, NIB started to implement the strategy which was approved by the Board at the end of 2021. In addition to the twin mandates of environment and productivity, the key objectives of the business strategy are to develop client and owner value propositions, enhance additionality, and improve capital accumulation while maintaining the Bank’s triple-A credit rating.
NIB’s business strategy emphasises the role of IFIs and the private sector in mobilising climate finance and supporting the green transition in its member countries. To this end, NIB continued to mainstream sustainability-linked lending (four loan commitments in 2022) – advising clients on the alignment of their sustainability and finance strategies and setting robust standards for KPIs and reporting. During 2022, the Bank committed EUR 561 million of new lending to borrowers operating in hard-to-abate sectors. In addition, NIB invested in four labelled bonds to promote the development of regional sustainable finance markets.
In line with the additionality objective of increasing lending in less well-served market segments, NIB committed EUR 245 million (four loans) to clients in the Baltic member states, and EUR 928 million to sub-investment grade borrowers. Broadening the Bank’s risk profile of new lending in line with the Risk Appetite Statement supports both the strategy objectives of additionality and capital accumulation.
NIB joined the InvestEU Programme as one of the first implementation partners in December 2022. The initial target is EUR 480 million of InvestEU lending, utilising the risk-sharing mechanism to co-finance strategically important projects that may otherwise be outside the scope of NIB’s risk appetite. NIB’s InvestEU lending will focus on sustainable infrastructure, as well as research, innovation, and digitalisation.
NIB also widened its product offering to promote capital market development via investment in conventional bonds and commercial paper issued by Baltic corporates, as well as MREL bond issuances by Nordic and particularly Baltic banks. In 2022, NIB invested in five MREL bonds totalling EUR 96 million.
An enhanced approach for evaluating the additionality of lending was implemented in 2022, meaning that factors such as loan maturity, contribution to market development, and the crowding in of other financiers are more explicitly taken into to account in the appraisal of new lending.
Although the Nordic–Baltic economies generally recovered well from the COVID-19 pandemic during 2022, certain sectors continued to feel the wide-ranging impacts of the crisis. In line with its stabilising lending role, NIB supported two borrowers with Response Loans amounting to EUR 147 million, continuing to demonstrate its ability to support its clients and owners in both good and uncertain times.
The geopolitical situation caused further challenges to NIB’s member countries and clients. Given the heightened need to increase the resilience of Europe’s economy and energy infrastructure, NIB accelerated the financing of the green transition, helped to build Nordic–Baltic region independence from Russian fossil fuels, and supported member country companies.
| | |
| | |
ANNUAL REPORT 2022 | | 82 |
| | |
|
| |
| INTRODUCTION |
| |
| IMPACT |
| |
| GOVERNANCE |
| |
| BOD REPORT |
| |
| FINANCIALS |
| |
| SUSTAINABILITY INDICES |
| |
| |
| |
| |
| |
| |
| |
| |
| |
| |
| |
| |
| |
| |
| |
| |
| |
| |
| |
| |
| |
| |
| |
| |
|
Lending
In the volatile operating environment, NIB experienced an increased demand for new loans from its member country corporate borrowers, especially in the industrial capital goods and utility sectors. This is typical for IFIs, which have a stabilising role during difficult times. A total of EUR 3,705 million in lending was disbursed (EUR 2,440 million in 2021). The increased demand was reflected in the volume of lending signed which was EUR 4,114 million (EUR 1,852 million in 2021). Lending outstanding at year-end amounted to EUR 22,195 million (EUR 22,313 million in 2021).
Despite the business impact of the pandemic and the uncertain outlook due to the on-going war in Ukraine and the implications of monetary policy, credit risk in the portfolio remained stable.
Lending key figures
| | | | | | | | | | | | | | | | | | | | |
| | | | | | |
In millions of euros, unless otherwise specified | | 2022 | | | 2021 | | | 2020 | | | 2019 | | | 2018 | |
| | | | | |
New loans signed, excluding labelled bonds | | | 3,936 | | | | 1,683 | | | | 5,632 | | | | 3,185 | | | | 4,269 | |
| | | | | |
New labelled bonds | | | 178 | | | | 169 | | | | 34 | | | | 131 | | | | 61 | |
| | | | | |
Total lending disbursements | | | 3,705 | | | | 2,440 | | | | 4,853 | | | | 2,676 | | | | 4,047 | |
| | | | | |
Number of new loan agreements | | | 54 | | | | 36 | | | | 59 | | | | 55 | | | | 58 | |
| | | | | |
Number of new labelled bonds | | | 10 | | | | 14 | | | | 4 | | | | 9 | | | | 3 | |
| | | | | |
Amortisations and prepayments | | | -2,707 | | | | -1,989 | | | | -1,878 | | | | -2,826 | | | | -577 | |
| | | | | |
Lending outstanding | | | 22,195 | | | | 22,313 | | | | 21,727 | | | | 18,931 | | | | 19,065 | |
| | | | | |
Member countries | | | 21,837 | | | | 21,827 | | | | 21,098 | | | | 18,055 | | | | 17,960 | |
| | | | | |
Non-member countries | | | 424 | | | | 635 | | | | 798 | | | | 996 | | | | 1,222 | |
| | | | | |
Expected credit loss | | | -66 | | | | -150 | | | | -169 | | | | -119 | | | | -117 | |
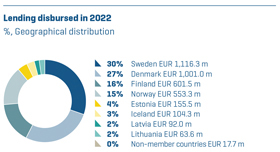
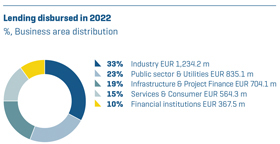
| | |
| | |
ANNUAL REPORT 2022 | | 83 |
| | |
|
| |
| INTRODUCTION |
| |
| IMPACT |
| |
| GOVERNANCE |
| |
| BOD REPORT |
| |
| FINANCIALS |
| |
| SUSTAINABILITY INDICES |
| |
| |
| |
| |
| |
| |
| |
| |
| |
| |
| |
| |
| |
| |
| |
| |
| |
| |
| |
| |
| |
| |
| |
| |
| |
| |
| |
| |
| |
| |
| |
| |
| |
| |
|
Mission fulfilment
Projects considered for financing are expected to contribute to the fulfilment of NIB’s mission. They are assessed and rated for their potential impacts on productivity and the environment on a scale from “negative” to “excellent”. At least 90% of disbursed loans should achieve a “good” or “excellent” rating in at least one of these two mandates. In December, the Board decided to increase the ambition to 95% for 2023.
In 2022, loans achieving ratings of “good” or “excellent” in at least one of the mandates accounted for 99.2% of the total amount of disbursed funds (from the mandate rated projects). 85.4% of the loans were channelled to projects that significantly contribute to improvements in terms of productivity. Some 59.3% of the loans were allocated to projects associated with “good” or “excellent” environmental benefits.
45.5% of projects were rated “good” or “excellent” on both mandates. This reflects the fact productivity and the environment are becoming more and more interlinked. The economic angle of sustainability has been present for a long time. However, it increasingly works the other way where sustainability and environmental considerations feed into the economic aspects of projects. This happens through regulations and pricing, but it also reflects heightened awareness on the long-term costs and opportunities of sustainability.
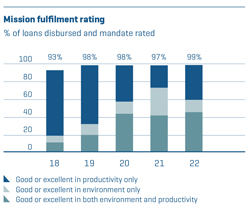
In addition to project level assessments, NIB also conducts Environmental, Social and Governance (ESG) assessments on a counterparty level. This gives more information about how a project financed by NIB complements the overall journey of the client towards more sustainable operations. The review also helps to identify potential ESG risks.
The ESG ratings are organised in a 3-notch scale: “under performer”, “average performer” and “best in class”. In 2023, NIB will further refine the methodology of its ESG assessments and present more granular information on the ESG performance of counterparties in the Annual Report of 2023.
Three years after a NIB-financed project has been completed, the Bank’s analysts follow up on the actual impact the project as compared to the impact that was anticipated in the ex-ante analysis stage. In 2022, 18 such ex-post assessments were completed. Roughly, 95% of the ex-ante identified impacts have materialised or partly materialised. NIB uses these results to further develop its mandate rating methodology and apply the lessons learned to the assessment of future projects.
Impact
The year was characterised by high volatility in energy costs and general uncertainty around the security of supply of energy. Supply chains took an additional hit. In general, the economic confidence is weakened in light of high inflation and looming period of weaker economic activity.
The energy shock and looming recession created increased demand for NIB’s long-term financing. Lending volumes were high, reflecting the need for investments in public infrastructure, especially to strengthen the long-term resilience of the energy sector to supply shocks, as well as to improve transmission and distribution grids to be able to accommodate larger amounts of renewable energy.
In line with this, the disbursements to the sectors of energy generation (EUR 357 million, 10% of total disbursed loans) and the transmission/distribution of energy (EUR 577 million, 16%) were among the largest in terms of sectoral composition. Whereas in previous years the investments in energy sector were driven mostly by decarbonisation strategies and climate targets, in 2022 security of supply was also a prominent driver. Over the year, NIB financed wind, geothermal and hydro energy generation projects.
EUR 577 million (16%) was channelled to projects in electricity transmission and distribution. This corresponds to financed transmission/distribution networks of 2,700
| | |
| | |
ANNUAL REPORT 2022 | | 84 |
| | |
|
| |
| INTRODUCTION |
| |
| IMPACT |
| |
| GOVERNANCE |
| |
| BOD REPORT |
| |
| FINANCIALS |
| |
| SUSTAINABILITY INDICES |
| |
| |
| |
| |
| |
| |
| |
| |
| |
| |
| |
| |
| |
| |
| |
| |
| |
| |
| |
| |
| |
| |
| |
| |
| |
| |
| |
| |
| |
| |
| |
| |
| |
| |
| |
| |
| |
| |
| |
| |
kilometres and an added renewable energy generation capacity of 860 MW. The scope was wide both geographically and technologically. Large subsea interconnectors tie different networks together enabling the sharing of renewable energy and benefiting from shifted consumption peaks and throughs. Medium-distance and voltage transmission lines strengthen the grid capacity and eliminate bottlenecks between different price areas. Investments into distribution networks ensure high availability rates of networks and cost-efficientsolutions, increase the ability of taking on the rapidly increasing capacities of small-scale energy generation, and supporting the electrification of the whole economy.
The transport sector (EUR 257 million, 7%) was hit hard by the COVID-19 pandemic with many projects postponed, scaled-down or re-planned. However, in the long run, the efficient and cost-effective mobility of goods and labour is one of the preconditions of a well-functioning economy. In 2022, NIB financed the electrification of transport vehicles and a wide area of transport projects covering both infrastructure such as ports, airports and roads thus supporting the whole transport value chain.
In 2022, NIB provided loans for several new or renovated buildings (EUR 363 million, 10%) for various purposes, such as schools, hospitals, and business centres, which classify for international (such as BREEAM excellent, LEED gold and platinum) or national energy efficiency certificates or demonstrate significant energy savings and/or innovative approaches. The total pro-rated area of certified buildings financed by NIB in 2022 was 110,000 m2.
NIB supported many of its clients in their digital transformation journey, read more on page 18.
NIB also disbursed funding for environmental and climate related actions for industrial clients, such as electrification and increased energy efficiency of production processes in energy-intensive industries. This will allow for greenhouse gas (GHG) emission reduction and increased energy independence by replacing fossil fuels. In addition, NIB supported resource efficiency and pollution reduction, in line with its sustainability and environmental protection principles.
Overall, the total disbursements contributed to quantifiable impacts of 239,000 tonnes of net CO2e emissions reduced or avoided annually and total expected renewable energy generation annually of 693.2 GWh.
Sustainability
On top of its lending activities, NIB is also contributing to a wider sustainability agenda. The climate and broader sustainability targets are approaching fast and the pace of change towards them is insufficient – science confirms that the world is currently set to miss the important 1.5 °C climate target. COP27 this year took place amid war in Ukraine and an energy crisis. The world cannot afford to lose sight of the long-term challenge of sustainability and climate change.
The current energy crisis has been felt particularly in Europe, including the Nordic and Baltic region. As countries have rushed to secure their energy supply, they have partly returned to using fossil fuels – coal plants have been restarted across Europe and LNG terminals are being
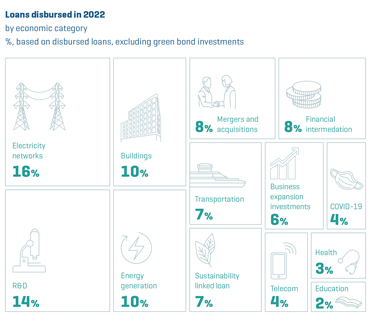
| | |
| | |
ANNUAL REPORT 2022 | | 85 |
| | |
|
| |
| INTRODUCTION |
| |
| IMPACT |
| |
| GOVERNANCE |
| |
BODREPORT |
| |
| FINANCIALS |
| |
| SUSTAINABILITY INDICES |
| |
| |
| |
| |
| |
| |
| |
| |
| |
| |
| |
| |
| |
| |
| |
| |
| |
| |
| |
| |
| |
| |
| |
| |
| |
| |
| |
| |
rapidly built. However, the only long-term solution is to ultimately reduce our dependency from fossil fuels. Further accelerating the green transition is the only logical way out.
There is also an increasing recognition that the green transition goes well beyond the energy system. It needs to permeate the entire economy. Investments are needed for grids to distribute green electricity. Hard-to-abate sectors in industry have to decrease their dependency on fossil fuels and to become more energy efficient. The transportation of goods
and people must become cleaner. It is also increasingly paramount to apply an entire value chain approach, not just a single step within it.
Following the adoption of the new Sustainability Policy in 2021, NIB has further strengthened its approach to assessing the ESG performance of its clients and adopted a revised “ESG Guidelines for Lending”. This allows the Bank to engage further with its clients, along the dimensions of green transition, climate pathways and the overall resilience and
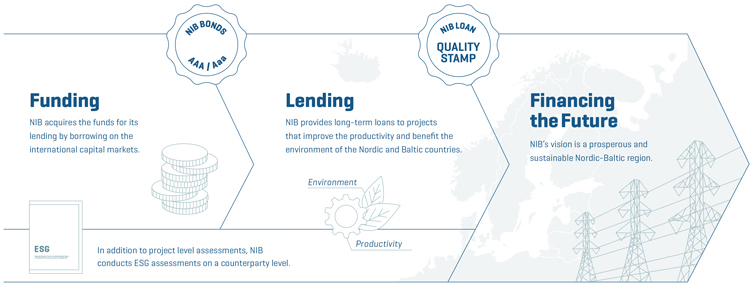
| | |
| | |
ANNUAL REPORT 2022 | | 86 |
| | |
|
| |
| INTRODUCTION |
| |
| IMPACT |
| |
| GOVERNANCE |
| |
BOD REPORT |
| |
| FINANCIALS |
| |
| SUSTAINABILITY INDICES |
| |
| |
| |
| |
| |
| |
| |
| |
| |
| |
| |
| |
| |
| |
| |
| |
| |
| |
| |
| |
| |
| |
| |
| |
| |
| |
| |
| |
| |
| |
| |
| |
| |
| |
sustainability of the client’s business model. A new internal framework for Sustainability Linked Loans was established to consistently assess and further push the transition ambition of clients.
The year 2022 showed that sustainability reporting is a critical element of sustainability strategy. The EU is taking a leading role in defining disclosure requirements, where companies will be expected to publish transparently the impact of their activities, even more so on climate-related disclosures. The international investors are also increasingly calling for high quality, transparent, reliable and comparable non-financial reporting. The EU Corporate Sustainability Reporting Directive (CSRD) and the establishment of the International Sustainability Standards Board (ISSB) are clear examples of the increasing scrutiny and regulation on climate and other sustainability reporting.
NIB continues to improve its impact reporting, driving towards more integrated financial and non-financial reporting. This year, both the financial and impact reports are published at the same time in a single combined report. The Bank has expanded the limited assurance scope to include climate-related disclosures in accordance with the Task Force on Climate-Related Financial Disclosure (TCFD) and has during 2022 become a member of the Partnership for Carbon Accounting Financials (PCAF).
The UN Biodiversity Conference (COP15) held in Montreal ended with a landmark agreement between nations to raise the attention towards nature more broadly. It urges global action on nature through 2030 and aims to reverse biodiversity loss by 2030 through restoring ecosystems and protecting lands and seas. NIB has biodiversity principles within its Sustainability Policy and will continue to integrate biodiversity considerations into its operations.
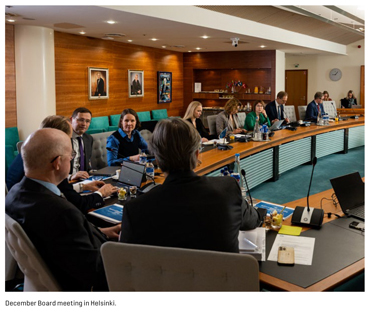
| | |
| | |
ANNUAL REPORT 2022 | | 87 |
| | |
|
| |
| INTRODUCTION |
| |
| IMPACT |
| |
| GOVERNANCE |
| |
BOD REPORT |
| |
| FINANCIALS |
| |
| SUSTAINABILITY INDICES |
| |
| |
| |
| |
| |
| |
| |
| |
| |
| |
| |
| |
| |
| |
| |
| |
| |
| |
| |
| |
| |
| |
| |
| |
| |
| |
| |
| |
| |
| |
| |
| |
| |
| |
Funding and other treasury activities
NIB acquires the funds for lending by borrowing on the international capital markets. NIB’s funding strategy rests on four pillars: global benchmark issuance in USD, a strong presence in the sustainable bond market, public bonds in other major currencies and meeting investors’ demand for tailored issuances in specific formats and currencies.
In 2022, NIB raised new funding with a nominal value of EUR 9.6 billion through 111 bond transactions. The Bank maintained a diversified global investor base with issuances in twelve different currencies. European investors outside the Nordic countries continue to be the largest group of buyers, accounting for 38% of investments.
NIB issued two global USD-denominated benchmark transactions this year, totalling USD
2.5 billion (EUR 2.4 billion). In March, the Bank issued a three-year USD 1.25 billion bond and another USD 1.25 billion bond with a five-year maturity followed in August. Both attracted strong support from global investors. Central banks and bank treasuries remain the main investor base in NIB’s USD benchmark transactions. In 2022, the Bank increased its outstanding SOFR index linked bonds. The total outstanding in the 2026 benchmark bond linked to the SOFR index is USD 1.2 billion.
Since 2011, the Bank has been issuing NIB Environmental Bonds (NEBs), the proceeds of which are used to finance projects that benefit the environment and support the transition to a low carbon economy. In 2022 NIB’s total Environmental Bond issuance surpassed EUR 1 billion – a record-high amount for one year. The issuance consisted of a seven-year EUR 500 million bond, an inaugural eight-year DKK 2 billion bond, a five-year SEK 2 billion bond, and an increase of NOK 1 billion to a five-year bond. The Pension & Insurance companies and Asset Managers within the Nordic region and Europe remain the largest group of buyers.
In order to manage liquidity risk, NIB maintains a significant liquidity buffer, which amounted to EUR 13.5 billion at year-end. Its size is determined by the Bank’s twelve-month target for the survival horizon, which is the duration for which NIB can continue to fulfil all its payment obligations and continue normal business operations without obtaining any new funding, even under severely stressed market conditions.
The Bank has a strong liquidity position and the survival horizon at the end of 2022 was 417 days. Liquidity bond portfolio returns are expected to rise over the next few years in the higher yield environment where the interest rates have increased and credit spreads widened.
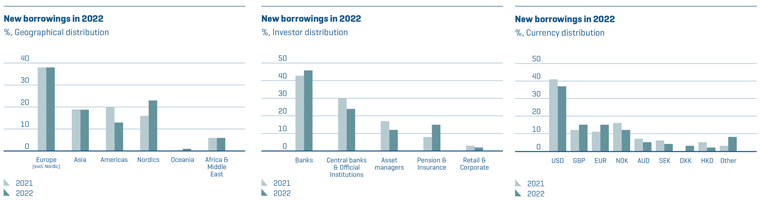
| | |
| | |
ANNUAL REPORT 2022 | | 88 |
| | |
|
| |
| INTRODUCTION |
| |
| IMPACT |
| |
| GOVERNANCE |
| |
| BOD REPORT |
| |
| FINANCIALS |
| |
SUSTAINABILITY INDICES |
| |
| |
| |
| |
| |
| |
| |
| |
| |
| |
| |
| |
| |
| |
| |
| |
| |
| |
| |
| |
| |
| |
| |
| |
| |
| |
| |
| |
| |
| |
| |
| |
| |
| |
| |
| |
| |
| |
| |
| |
Risk management
As in recent years, in 2022 the Bank continued to strengthen its risk, capital and liquidity management framework. In 2020, the amended Statutes and the Principles for Capital and Liquidity Management introduced high-level statutory requirements for capital, leverage and liquidity. These are supported by a Risk Appetite Statement (RAS) and an Internal Capital (and Liquidity) Adequacy Assessment Process (ICAAP), and are operationalised via risk management policies, guidelines and procedures. NIB monitors international regulations and standards on risk management and adopts those that it identifies to be relevant and represent best practice.
The RAS sets the principles for risk taking, mitigation and avoidance. In 2022, the RAS was updated as a part of the annual review cycle, with a refinement of key risk indicators and a reaffirmation of the 2021 statement on climate risk – ensuring coverage of emerging risks and highlighting the risk management side of our commitment to, inter alia, the TCFD.
The ICAAP, which is conducted annually, is one of the main tools used by the Board of Directors to ensure that the Bank operates within the established risk appetite thresholds and Risk Management Policy limits for, inter alia, capital, leverage and liquidity. NIB maintained adequate capital and liquidity throughout the year, despite the challenges stemming from the macro-financial and geopolitical situation. Due to NIB’s response in the exceptional situation, the increase in equity (through net profit) did not match the increase in the risk-based (economic) capital requirement. The Bank nevertheless maintained its strong capital position, with a capital headroom1 of EUR 669 million (17% of adjusted common equity).
Asset quality remained solid. As of year-end 2022, 92% of the lending exposure was within the investment-grade category, and the public sector accounted for 27% of total lending exposure. In terms of geographical distribution, 97% of the lending exposure was to counterparties located in the Bank’s member countries. As for the treasury portfolio, all exposure was well within the investment-grade category, with 86% within the best risk classes (equivalent to ratings of AAA to AA-).
In terms of market risk, the Bank is mainly exposed to interest rate risk, credit spread risk, and cross-currency basis risk via its treasury operations. The underlying risk levels (sensitivities in basis point value terms) from the aforementioned market risk factors were at year end 2022 at similar levels as the previous year. The market movements observed throughout the year, especially for interest rates and FX rates, however, negatively impacted valuations of mark-to-market financial instruments and derivatives. The valuation changes also had an impact on collateral received and posted.
NIB continued to improve its risk management framework during 2022. On the financial risk side, the risk management policies were updated to reflect the revised strategy, the ICAAP Guidelines were revised and the extensive revision of the model and framework used to estimate expected credit loss (ECL) was completed and validated. Several other policies, guidelines and procedures were also reviewed and updated to keep up with best practices and reflect the warranted increased focus on non-financial risks. This includes (but is not limited to) operational risk & resilience and integrity due diligence procedures to prevent financial crime and to ensure compliance with sanctions.
Moreover, as a result of the geopolitical situation, the Bank has intensified the monitoring of changes in the threat landscape and the taking of proactive measures. These include facilities security, travel safety and addressing the risk of both targeted and indirect cyber threats.
Financial results
The net profit for the year of EUR 139 million was EUR 20 million lower than in 2021. Total operating income increased from EUR 185 million to EUR 188 million, due to an increase in net interest income of EUR 18 million partly offset by an increase in net loss on financial operations of EUR 14 million. This decrease was mainly caused by unrealised fair value losses on bonds in the liquidity buffer and lending labelled bonds. As the Bank intends to hold its investments to maturity, the unrealised valuations losses are expected to reverse.
The underlying core earnings were better than expected with net interest income and commission fee income higher than in 2021. Net interest income for the year amounted to EUR 219 million, compared to EUR 201 million in 2021. Net interest income from lending activities of EUR 167 million was EUR 4 million higher than in 2021 due to higher loan volumes and margins. Net interest income from treasury activities increased by EUR 13 million to EUR 52 million as the treasury bond portfolios benefited from increases in the market interest rates and bond
1 “Capital headroom” is defined as the capital supply (adjusted common equity) minus capital demand, i.e., the internally assessed risk-based (economic) capital requirement for the current operations covering all identified risks the Bank is exposed to (i.e., credit, market and operational risk, and buffers for macroprudential risks and stress testing).
| | |
| | |
ANNUAL REPORT 2022 | | 89 |
| | |
|
| |
| INTRODUCTION |
| |
| IMPACT |
| |
| GOVERNANCE |
| |
BOD REPORT |
| |
| FINANCIALS |
| |
| SUSTAINABILITY INDICES |
| |
| |
| |
| |
| |
| |
| |
| |
| |
| |
| |
| |
| |
| |
| |
| |
| |
| |
| |
| |
| |
| |
| |
| |
| |
| |
| |
| |
| |
| |
| |
| |
| |
| |
yields. Total operating expenses of EUR 53 million were EUR 1 million higher than in 2021 and expected, as the level of activities increased when COVID restrictions eased.
The Bank has limited direct lending exposure in Russia and Belarus and therefore the developments in 2022 after Russia’s escalation of war in Ukraine had limited impact on net loan losses for the year. Net loans losses for the year were a positive amount of EUR 4 million compared to EUR 26 million in 2021 when the macro-financial scenarios improved as the global economy began to emerge from COVID-19.
A more detailed commentary on the Bank’s financial results can be found in the Operating and Financial Review, pages 93-98.
The Bank is in a strong financial position with solid capital and liquidity ratios which are above the minimum requirements stipulated in the Statutes and compliant with the limits and monitoring thresholds defined in the Risk Appetite Statement. Total assets increased from EUR 37,553 million to EUR 39,280 million and total equity increased from EUR 3,999 million to EUR 4,101 million. A more detailed commentary on the Bank’s statutory metrics can be found in the Capital and Liquidity Management section, pages 99-101.
Dividend
The Board of Directors proposes to the Board of Governors that a sum of EUR 25 million be distributed to the Banks’ member countries from the 2022 net profit, which equates to a pay-out ratio of 18% of net profit.
Governance
NIB’s Board of Directors held nine meetings in 2022. Due to ongoing pandemic provisions, the first meeting of the year 1/22 was held fully online, and meetings 2/22 and 3/22 were held as hybrid meetings. The remaining six meetings were held in person. Board meeting 7/22 was held on 29 September 2022 in Luxembourg at the premises of the European Investment Bank
(EIB). This provided an opportunity for both banks’ Presidents and senior management to meet, with the conclusion that both NIB and EIB shall increase cooperation. All other in-person Board meetings were held at NIB’s headquarters, in Helsinki.
Four separate Board seminars were held prior to the respective Board meetings. The seminar topics covered NIB’s role in supporting Green Transition and Energy Independence, Additionality, as well as Climate Strategy.
Esther Finnbogadóttir (Iceland) chaired Board meetings 1/22 – 4/22, completing her 2-year term as chair. Ole Hovland (Norway), previously the deputy chair, took up the role of chair of the Board on 1 June 2022. Merle Wilkinson (Estonia) was appointed as a deputy chair as of 1 June 2022.
The Control Committee (the Bank’s supervisory body responsible for appointing the Bank’s external auditors) had two ordinary meetings during the year. The first was on 18 February 2022 in Helsinki, and the second was on 22 September 2022 in Tallinn. After Peter Engberg Jensen (Denmark), Deputy chair Toomas Vapper (Estonia) acceded to chair of the committee, and Pentti Hakkarainen (Finland) was appointed as deputy chair for a 2-year term commencing 1 June 2022. The Control Committee Chairmanship held seven meetings in 2022.
The President updated NIB’s internal committees as well as the Rules of Procedure for those bodies. The changes were implemented in order to further empower the middle management and bring experts closer to the decision-making, as well as to streamline the committees. In this context, the current Asset and Liability Committee (ALCO) was renamed to Asset, Liability and Risk Committee (ALR) with an extended mandate.
The Board of Directors confirmed to include the Head of Communications and the Head of Human Resources as ordinary members of the Executive Committee.
| | |
| | |
ANNUAL REPORT 2022 | | 90 |
| | |
|
| |
| INTRODUCTION |
| |
| IMPACT |
| |
| GOVERNANCE |
| |
| BOD REPORT |
| |
| FINANCIALS |
| |
SUSTAINABILITY INDICES |
| |
| |
| |
| |
| |
| |
| |
| |
| |
| |
| |
| |
| |
| |
| |
| |
| |
| |
| |
| |
| |
| |
| |
| |
| |
| |
| |
| |
| |
| |
| |
| |
| |
| |
| |
| |
| |
| |
| |
| |
Compliance
Alongside its regular work across the Bank’s operations, NIB’s Integrity & Compliance Office (ICO) focused on providing sanctions related support to the Bank’s operations following Russia’s war in Ukraine. This included monitoring the implications of the sanctions for the Bank’s loan and trust fund activities and assessing the potential impact of the issued sanctions on NIB’s clients.
Efforts to further strengthen NIB’s integrity and compliance framework continued. After an extensive review, the Board approved NIB’s revised Integrity Due Diligence Policy and the related procedures across its operations. A review of the Bank’s Codes of Conduct was also initiated. In addition, ICO is involved in the implementation of NIB’s data protection plan, which included, inter alia, the rollout of two mandatory e-Learning courses on data privacy to all staff.
ICO will continue to enhance NIB’s compliance controls and arrange further staff training in 2023. More information can be found in the Integrity Report 2022.
Digitalisation
NIB’s IT has been working over several years to increase the maturity of IT governance and processes and IT security management. In addition, IT has also significantly strengthened the internal IT team by prioritising critical recruitments. Data centre outsourcing, creating cloud services architecture and framework and target integration architecture are all contributing to a more digital organisation.
The digitalisation will be taken forward in all business and support functions with better roadmap planning. NIB launched a major programme to renew its core Lending IT systems, with the objective of streamlining and automating business processes, and delivering an improved customer experience. Another major project is the continuous implementation of a data warehouse project to enable NIB to become a data driven organisation.
Outlook
Normally high inflation, combined with economic uncertainty and rising interest rates, is not favourable for investment activity. However, in the current situation the energy crisis and supply chain disruptions may force businesses and governments to rethink their business models, accelerate the transition to alternative energy sources and restructure supply chains, which all support investment activity. On top of the climate concerns, the biodiversity agenda is also getting more attention.
In previous years, labour markets in the Nordics and Baltics have demonstrated significant resilience to shocks, and employment levels have remained relatively high. As the labour market typically lags the real economic cycle, unemployment may increase in 2023. This could put additional strain on the government’s public finances.
The main uncertainty in Europe is related to how persistent inflation will be and the extent to which higher commodity prices and supply-chain disruption will feed through to core inflation and wages. These factors will be closely monitored by central banks. Additionally, a large source of macroeconomic uncertainty in the Nordic–Baltic region is still the war in Ukraine and the related supply chain effects and energy market situation.
Going forward, NIB will play an increasingly important role in promoting the green transition, especially at a time when energy security is high on policymakers’ agendas. This is the point at which the long-term goal of decarbonisation of the energy sector coincides with the short-to-medium-term goal of increasing energy security.
NIB will continue to provide reliable long-term financing, thus playing a stabilising role. The Bank will do so in cooperation with other IFIs and financiers. The Bank will further develop and broaden its product offering, as well as contribute to further capital market development. In addition, NIB will provide value to its stakeholders by advising on their sustainability journeys and their ESG performance. The accelerating green transition offers many new opportunities where NIB’s financing can add value.
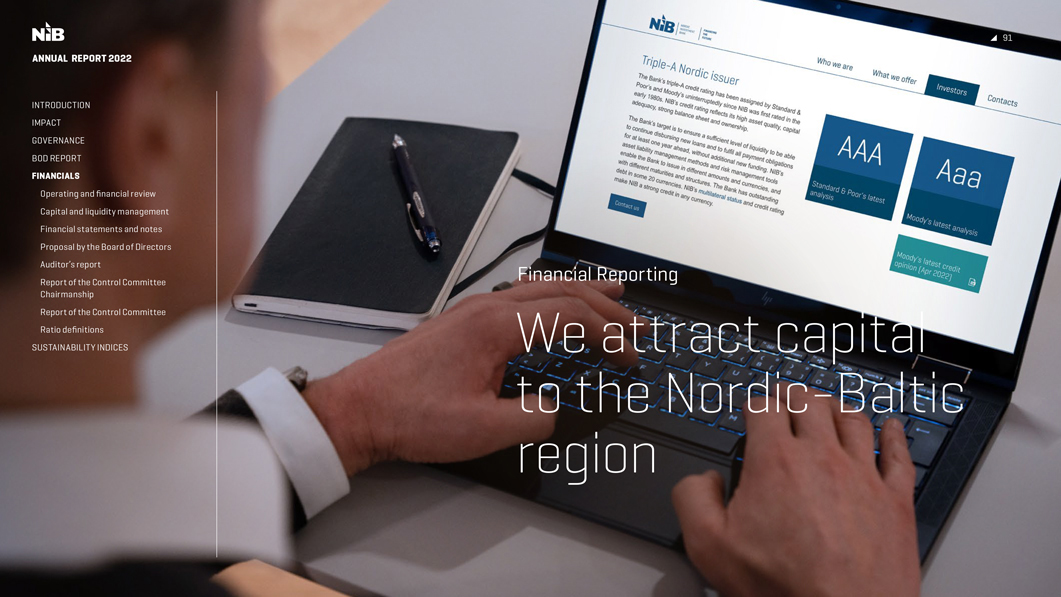
| | |
| | |
ANNUAL REPORT 2022 | | 92 |
| | |
|
| |
| INTRODUCTION |
| |
| IMPACT |
| |
| GOVERNANCE |
| |
| BOD REPORT |
| |
| FINANCIALS |
| |
Operating and financial review |
| |
Capital and liquidity management |
| |
Financial statements and notes |
| |
Proposal by the Board of Directors |
| |
Auditor’s report |
| |
Report of the Control Committee
Chairmanship |
| |
Report of the Control Committee |
| |
Ratio definitions |
| |
| SUSTAINABILITY INDICES |
| |
| |
| |
| |
| |
| |
| |
| |
| |
| |
| |
| |
| |
| |
| |
| |
| |
| |
| |
| |
| |
| |
| | |
| | |
ANNUAL REPORT 2022 | | 93 |
| | |
|
| |
| INTRODUCTION |
| |
| IMPACT |
| |
| GOVERNANCE |
| |
| BOD REPORT |
| |
| FINANCIALS |
| |
u Operating and financial review |
| |
Capital and liquidity .management |
| |
Financial statements and notes |
| |
Proposal by the Board of Directors |
| |
Auditor’s report |
| |
Report of the Control Committee Chairmanship |
| |
Report of the Control Committee |
| |
Ratio definitions |
| |
| SUSTAINABILITY INDICES |
| |
| |
Operating and financial review
Highlights
Demand for NIB lending increased in 2022 driven by a lower supply of long-term credit in the commercial bank and bond markets, acceleration of green transition and climate investments, and a widening of NIBs product offering in line with the bank’s updated business strategy. Total disbursements for the year amounted to EUR 3,705 million and lending signed amounted to EUR 4,114 million, compared to EUR 2,440 million and EUR 1,852 million respectively in 2021.
During 2022, the Bank operated in an environment characterised by volatile financial markets and rising inflation which led to higher interest rates. This new interest rate environment resulted in Treasury interest income being higher than expectations and the prior year. The lending net interest income was also higher than in 2021 due to higher volumes but also higher margins due to general market conditions and also the implementation of the updated NIB strategy. The total net interest income for 2022 amounted to EUR 219 million compared to EUR 201 million in 2021.
The turmoil in financial markets resulted in the Bank recording unrealised valuation losses on financial operations of EUR 42 million compared to losses of EUR 28 million in 2021, mainly in the first half of the year. During the later half of the year some of these losses reversed. As we intend to hold these investments and hedges to maturity the valuation losses are expected to reverse in full.
Due to the increase in demand for lending and larger than usual collateral flows, the Bank increased its funding plan during the year. In 2022, NIB raised EUR 9,630 million through 111 issues in 12 currencies.
Key figures and ratios
| | | | | | | | |
| | | |
In millions of euro, unless otherwise
stated | | 2022 | | | 2021 | |
| | |
Net interest income | | | 219 | | | | 201 | |
| | |
Profit before net loan losses | | | 136 | | | | 133 | |
| | |
Net Profit | | | 139 | | | | 159 | |
| | |
| | | | | | | | |
| | |
Lending disbursed | | | 3,705 | | | | 2,440 | |
| | |
Lending signed | | | 4,114 | | | | 1,852 | |
| | |
Mandate fulfilment | | | 99% | | | | 97% | |
| | |
| | | | | | | | |
| | |
Lending outstanding | | | 22,195 | | | | 22,313 | |
| | |
Total assets | | | 39,280 | | | | 37,553 | |
| | |
New debt issues | | | 9,630 | | | | 7,028 | |
| | |
Debts evidenced by certificates | | | 31,595 | | | | 31,526 | |
| | |
Total equity | | | 4,101 | | | | 3,999 | |
| | |
| | | | | | | | |
| | |
Equity/total assets (%) | | | 10.4% | | | | 10.6% | |
| | |
Net profit/average equity (%) | | | 3.4% | | | | 4.1% | |
| | |
Cost/income (%) | | | 27.9% | | | | 27.9% | |
| | |
Number of employees at year end | | | 228 | | | | 221 | |
| | |
| | |
ANNUAL REPORT 2022 | | 94 |
| | |
|
| |
| INTRODUCTION |
| |
| IMPACT |
| |
| GOVERNANCE |
| |
| BOD REPORT |
| |
| FINANCIALS |
| |
u Operating and financial review |
| |
Capital and liquidity .management |
| |
Financial statements and notes |
| |
Proposal by the Board of Directors |
| |
Auditor’s report |
| |
Report of the Control Committee Chairmanship |
| |
Report of the Control Committee |
| |
Ratio definitions |
| |
| SUSTAINABILITY INDICES |
| |
| |
| |
| |
| |
| |
| |
| |
| |
| |
| |
| |
| |
| |
| |
| |
| |
| |
| |
| |
| |
| |
| |
| |
Total comprehensive income
Net profit
The net profit for the year amounted to EUR 139.3 million, compared to EUR 159.2 million in 2021. The difference is partially related to higher unrealised fair value losses on bonds in the liquidity buffer and lending labelled bonds which is explained further under the section Net profit/loss on financial operations on page 95. Net interest income was on the other hand higher than in 2021 by EUR 17.9 million. Total operating expenses increased by EUR 1.1 million to EUR 52.6 million. Net loan losses for the period was a positive amount of EUR 3.5 million compared to a positive amount of EUR 25.9 million in 2021.
Net interest income
Net interest income for the year increased from EUR 201.4 million to EUR 219.3 million. Net interest income on lending activities increased by EUR 4.5 million from EUR 162.4 million to EUR 166.9 million due to higher loan volumes and margins. The net interest income on treasury activities increased by EUR 13.4 million from EUR 39.0 million to EUR 52.4 million as the Treasury bond portfolios benefited from increases in the market interest rate level and bond yields.
Net fee and commission income
Net fee and commission income for 2022 of EUR 6.8 million was similar to 2021.
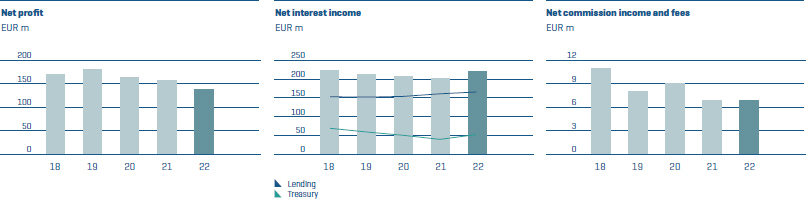
| | |
| | |
ANNUAL REPORT 2022 | | 95 |
| | |
|
| |
| INTRODUCTION |
| |
| IMPACT |
| |
| GOVERNANCE |
| |
| BOD REPORT |
| |
| FINANCIALS |
| |
u Operating and financial review |
| |
Capital and liquidity .management |
| |
Financial statements and notes |
| |
Proposal by the Board of Directors |
| |
Auditor’s report |
| |
Report of the Control Committee Chairmanship |
| |
Report of the Control Committee |
| |
Ratio definitions |
| |
| SUSTAINABILITY INDICES |
| |
| |
| |
| |
| |
| |
| |
| |
| |
| |
| |
| |
| |
| |
| |
| |
| |
| |
| |
| |
| |
| |
| |
| |
Net profit/loss on financial operations
The net loss on financial operations amounted to EUR 37.5 million compared to a loss of EUR 23.7 million in 2021. This result includes realised net gains of EUR 4.9 million and unrealised net losses of EUR 42.4 million compared to realised net profits of EUR 4.8 million and unrealised net losses of EUR 28.5 million in 2021. Against a backdrop of rising inflation, fears of a recession and the turbulent geopolitical environment, risk aversion led to spread widening in financial markets throughout the first half of the year in particular. This generated unrealised valuation losses on interest rate hedges, and on the liquidity buffer and lending labelled bond portfolios of EUR 1.1 million, EUR 29.5 million and EUR 12.6 million respectively.
The unrealised valuation gains and losses on assets in the Bank’s liquidity portfolio arise from changes in credit spreads. The Bank maintains a liquidity portfolio, which it invests in high quality bonds. When credit spreads widen, this results in negative valuations on the bonds. In periods of financial turbulence credit spreads tend to rise, which also affects NIB’s high quality bonds. When the Bank holds the bonds to maturity, so that they are not sold based on the current exit market value, any valuation losses and gains are expected to reverse, as the bonds will settle at par.
The unrealised valuation gains and losses on interest rate hedges mainly arise from the change of the interest rate spreads that are embedded in the Bank’s funding and lending transactions. When the Bank raises funds with fixed rates or offers borrowers fixed rate loans, it hedges the resulting interest rate risk using swaps, in which the fixed rate is swapped to short-term money market floating rates. The valuation of the swaps and underlying transactions use different rates which gives rise to unrealised valuation gains and losses. It should be noted that as the Bank intends to hold these transactions to maturity these valuation gains and losses are expected to reverse in full.
Total operating expenses
Total operating expenses amounted to EUR 52.6 million which is EUR 1.1 million higher than in 2021 but better than plan. The decrease in depreciation of EUR 3.2 million is due to some assets reaching the end of their depreciable lives during 2022. The increase in personnel costs of EUR 2.6 million is due to headcount increases and annual salary adjustments. The increase in total administrative expenses of EUR 1.8 million compared to 2021 was expected as the level of activities in the Bank increased when Covid restrictions eased.
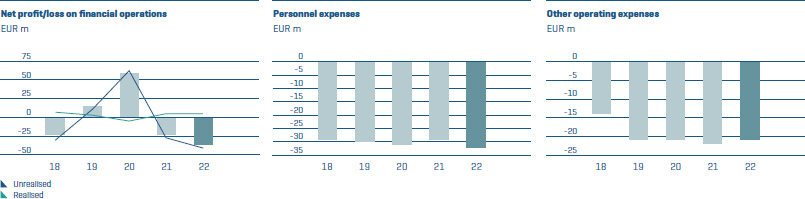
| | |
| | |
ANNUAL REPORT 2022 | | 96 |
| | |
|
| |
| INTRODUCTION |
| |
| IMPACT |
| |
| GOVERNANCE |
| |
| BOD REPORT |
| |
| FINANCIALS |
| |
u Operating and financial review |
| |
Capital and liquidity .management |
| |
Financial statements and notes |
| |
Proposal by the Board of Directors |
| |
Auditor’s report |
| |
Report of the Control Committee Chairmanship |
| |
Report of the Control Committee |
| |
Ratio definitions |
| |
| SUSTAINABILITY INDICES |
| |
| |
| |
| |
| |
| |
| |
| |
| |
| |
| |
| |
| |
| |
| |
| |
| |
| |
| |
| |
| |
| |
| |
| |
Net loan losses
The net loan losses for 2022 was a positive amount of EUR 3.5 million compared to a positive amount of EUR 25.9 million in 2021. The positive amount in 2021 was mainly driven by an improvement in the macro-financial scenarios as the global economy began to emerge from Covid-19 restrictions.
Although the macro-financial scenarios deteriorated somewhat in 2022, the impact on the ECL provisions was not significant. The main drivers for 2022 included an increase in provisions of EUR 20.0 million due to the implementation of a new and more sophisticated ECL model, fully impairing loans in Russia and Belarus amounting to EUR 9.8 million and EUR 20.3 million due to the increase in loans outstanding and committed. These increases in ECL provisions were offset by our lending counterparties having more credit rating upgrades than downgrades, the recovery of losses on a fully impaired loan of EUR 3.2 million, amortisations and prepayments of EUR 6.6 million and the release of a Covid-19 management overlay of EUR 30.0 million. As uncertainties regarding the economic outcome of Covid-19 diminished and considering that the new model is more robust, it was decided that the management overlay was no longer required.
Apart from loans to Russia and Belarus, there were no new non-performing loans during the year. During the first half of 2022, the Bank wrote off old loans of EUR 79.3 million, however this had no impact on net profit as these loans had been fully impaired some years ago.
Other comprehensive income
The Bank separates the foreign currency basis spread from financial instruments used in fair value hedge accounting and this separated amount is recorded in “Other comprehensive income” (OCI) which amounted to a loss of EUR 3.1 million compared to a loss of EUR 21.6 million in 2021. This recorded loss was due to the widening of the Cross Currency Basis spreads, which negatively affect the valuation of basis swaps used to convert funding currencies into lending currencies. These losses are expected to reverse as the Bank intends to hold these transactions to maturity. During the year, the basis spread of some currencies widened against the Euro.
For financial liabilities recorded at fair value through profit or loss, valuation changes due to changes in own credit spreads also need to be recorded in OCI. During 2022, the Bank recorded a positive impact from these changes of EUR 6.1 million compared to EUR 0.3 million in 2021.
Total Comprehensive Income
All in all, NIB had a higher total comprehensive income in 2022 than the previous year. Total comprehensive income ended at EUR 142.3 million compared to EUR 137.9 million in 2021.
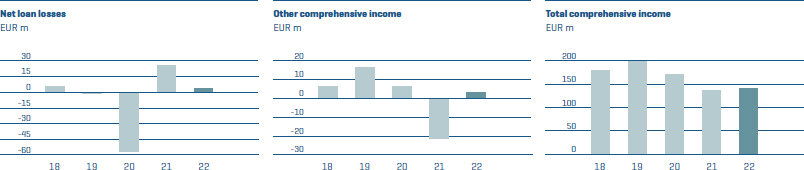
| | |
| | |
ANNUAL REPORT 2022 | | 97 |
| | |
|
| |
| INTRODUCTION |
| |
| IMPACT |
| |
| GOVERNANCE |
| |
| BOD REPORT |
| |
| FINANCIALS |
| |
u Operating and financial review |
| |
Capital and liquidity management |
| |
Financial statements and notes |
| |
Proposal by the Board of Directors |
| |
Auditor’s report |
| |
Report of the Control Committee
Chairmanship |
| |
Report of the Control Committee |
| |
Ratio definitions |
| |
| SUSTAINABILITY INDICES |
| |
| |
Financial position
Lending outstanding
The lending outstanding amounted to EUR 22,195 million. This comprises EUR 21,740 million of loans outstanding and investments of EUR 453 million in Lending labelled bonds. As mentioned earlier in the highlights section, the Bank has experienced strong demand for its lending. The total disbursements and investments during the period amounted to EUR 3,705 million, which is EUR 1,265 million higher than in 2021. More information regarding new signed loans can be found on our website here.
Total lending outstanding increased from EUR 22,313 million at 31 December 2021 to EUR 23,319 million at 31 December 2022, excluding exchange rate and valuation effects. The book value amounted to EUR 22,195 million due to foreign exchange movements of EUR -500 million, hedge accounting effects of EUR -586 million and other adjustments of EUR 39 million. The foreign exchange impact is mainly from the weakening of Nordic currencies against the Euro, partially offset by the strengthening of the USD. The fair value and hedge accounting
adjustments are driven by changes in interest rates similar to what is seen on the liability side of the balance sheet.
Mission fulfilment
NIB’s vision is for a prosperous and sustainable Nordic-Baltic region and the Bank has a dual mandate to provide lending that benefits the environment and/or improves productivity. All projects proposed for financing undergo an assessment of their potential impact on productivity and the environment of the member country area. The mission fulfilment is rated on a five-grade scale from “negative” to “excellent”. In response to the Covid-19 pandemic, NIB provided “response loans” to alleviate the economic and social consequences of the crisis. These response loans are tracked separately and are not included in the standard mandate rating. During 2022, projects achieving a “good” or “excellent” mandate rating accounted for 99% of the total amount of loans disbursed which exceeded the target of 90%.
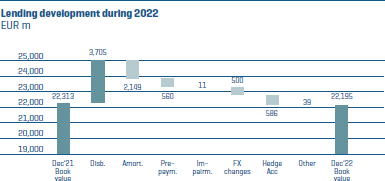
| | |
| | |
ANNUAL REPORT 2022 | | 98 |
| | |
|
| |
| INTRODUCTION |
| |
| IMPACT |
| |
| GOVERNANCE |
| |
| BOD REPORT |
| |
| FINANCIALS |
| |
u Operating and financial review |
| |
Capital and liquidity management |
| |
Financial statements and notes |
| |
Proposal by the Board of Directors |
| |
Auditor’s report |
| |
Report of the Control Committee
Chairmanship |
| |
Report of the Control Committee |
| |
Ratio definitions |
| |
| SUSTAINABILITY INDICES |
Funding
Due to the increase in demand for lending and larger than usual collateral flows, the Bank increased its funding plan during the year. In 2022, NIB raised new funding with a nominal value of EUR 9,593 million through 111 issues in 12 currencies with an average maturity of 4.3 years.
In line with its funding strategy, the Bank issued two global USD benchmarks and complemented the issuance with other public and private transactions, maintaining a global investor base and a diversified portfolio of currencies. NIB continued its strong presence in the sustainable bond market by issuing a record-high amount of more than EUR 1 billion in NIB Environmental Bonds (NEBs). In total, the Bank has now issued a EUR 6.8 billion in green environmental bonds under its NEB Framework, first initiated in 2011.
Some of the larger transactions during 2022 included a three-year GBP 500 million benchmark which has since been increased with a further GBP 300 million, taking the total to GBP 800 million. The Bank also issued its inaugural NIB Environmental Bond denominated in Danish Kroner, an eight-year DKK 2 billion issuance. NIB issued its first global USD benchmark of the year in March, a USD 1.25 billion issue with a maturity of 3 years. The second global USD benchmark was issued in August, a five-year USD 1.25 billion bond. A full list of funding transactions can be found on our website at Funding Transactions.
Total debts evidenced by certificates increased from EUR 31.5 billion to EUR 31.6 billion. During the year, the Bank has recorded foreign exchange movements due to the strengthening of USD offset somewhat by the weakening of the Nordic currencies against the Euro. The Bank has also recorded significant hedge accounting adjustments as interest rates rose. These hedge accounting adjustments offset the impact from the fair value changes of interest rate swaps used to hedge the interest rate risk.
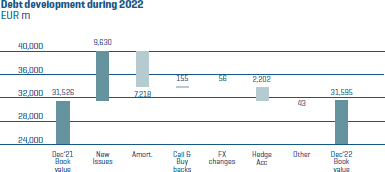
| | |
| | |
ANNUAL REPORT 2022 | | 99 |
| | |
|
| |
| INTRODUCTION |
| |
| IMPACT |
| |
| GOVERNANCE |
| |
| BOD REPORT |
| |
| FINANCIALS |
| |
Operating and financial review |
| |
u Capital and liquidity management |
| |
Financial statements and notes |
| |
Proposal by the Board of Directors |
| |
Auditor’s report |
| |
Report of the Control Committee
Chairmanship |
| |
Report of the Control Committee |
| |
Ratio definitions |
| |
| SUSTAINABILITY INDICES |
| |
| |
| |
| |
| |
| |
| |
| |
| |
| |
| |
| |
| |
| |
| |
| |
| |
| |
| |
| |
| |
| |
| |
| |
Capital and liquidity management
The Statutes require NIB to have adequate capital and liquidity management in accordance with sound banking principles. The Bank shall have in place sound and effective strategies for risk, capital and liquidity assessments, which shall be conducted at least annually and reviewed regularly. The Bank’s capital and liquidity management shall be based on assessed risks in its operations, supplemented by stress testing. The Principles for Capital and Liquidity Management set by the Board of Governors further specify requirements as follows:
TABLE 1. Statutory ratio requirements and year-end values
| | | | | | | | | | | | |
| | | | |
| Statutory metrics | | Minimum | | | 2022 | | | 2021 | |
| | | |
Risk-based (economic) capital ratio | | | 100% | | | | 144% | | | | 147% | |
| | | |
Leverage ratio | | | 7.0% | | | | 10.8% | | | | 10.6% | |
| | | |
Leverage ratio with callable capital | | | 20.0% | | | | 30.9% | | | | 30.9% | |
| | | |
Liquidity survival horizon (days) | | | 180 | | | | 417 | | | | 450 | |
Key components of the NIB risk, capital and liquidity management framework are the Risk Appetite Statement (RAS) and the Internal Capital Adequacy Assessment Process (ICAAP). To monitor and manage compliance with statutory requirements, the Board of Directors sets limits and monitoring thresholds in the RAS securely above the minima set by the Principles for Capital and Liquidity Management as well as those set out in the Bank’s risk management policies and Capital and Liquidity Recovery Plan. The Bank uses its ICAAP to evaluate the amount of capital and liquidity needed to cover the risks it is or might be exposed to. The ICAAP is conducted on an annual basis. The Bank maintains a sufficient amount of capital and liquidity to cover all material risks and to ensure that operations can be continued without disruptions even in extremely adverse situations. Moreover, in accordance with Principle 3 of the Principles for Capital and Liquidity Management, NIB has put in place contingency measures and procedures for capital, leverage and liquidity adequacy to safeguard its viability.
Risk-based (economic) capital
The Statutes require that the Bank’s paid-in capital and accumulated reserves exceed its internally assessed capital requirement covering the nature and level of the risks to which the Bank is or might be exposed. The Principles for Capital and Liquidity Management further establish a risk-based capital adequacy requirement to ensure that the Bank maintains an appropriate level of capital. This is operationalised via a risk-based capital ratio minimum requirement of 100 per cent.
NIB uses an internal economic capital approach to estimate and set the risk-based capital requirements for credit risk, market risk, operational risk, and other business risks. The amount of economic capital reserved to cover these risks, also calibrated to preserve the highest possible (AAA/Aaa) credit rating, is defined as the minimum economic capital requirement. Potential diversification benefits across the main risk categories (credit, market, liquidity, and operational) are not applied. In addition to the minimum economic capital requirement, the Bank maintains macroprudential capital buffers and additional management buffers (e.g. stress test buffer) as appropriate. The Bank may release capital buffers under stressed conditions or when otherwise required to fulfil its purpose.
The credit risk economic capital model is an application of the so-called structural model broadly adopted in the industry. In technical terms, the simulation model is based on a multivariate-threshold t-copula approach. The key idea behind the model is that an individual obligor enters into default when the value of its assets crosses a threshold determined by the counterparty’s creditworthiness. The model for asset values is estimated based on historical equity data incorporating geographical, industrial, and firm-size dimensions. The likelihood that a counterparty’s assets drop below the default threshold depends on the probability of default (PD) estimates and rating scale. Finally, the actual size of default loss depends on two elements: the counterparty exposure at default (EAD) and the loss given default (LGD). The actual loss, as a proportion of the current exposures, is assumed to be random and is informed
| | |
| | |
ANNUAL REPORT 2022 | | 100 |
| | |
|
| |
| INTRODUCTION |
| |
| IMPACT |
| |
| GOVERNANCE |
| |
| BOD REPORT |
| |
| FINANCIALS |
| |
Operating and financial review |
| |
u Capital and liquidity management |
| |
Financial statements and notes |
| |
Proposal by the Board of Directors |
| |
Auditor’s report |
| |
Report of the Control Committee
Chairmanship |
| |
Report of the Control Committee |
| |
Ratio definitions |
| |
| SUSTAINABILITY INDICES |
| |
| |
| |
| |
| |
| |
| |
| |
| |
| |
| |
| |
| |
| |
| |
| |
| |
| |
| |
| |
| |
| |
from the internal LGD methodology. The credit risk migration element is also a function of credit transition probabilities, credit spread values for each rating category, and the sensitivity of loans to spread movements. The transition probabilities are sourced from external credit rating agency data and split between corporate and sovereign lending categories. Credit spreads are estimated from internal historical lending experience, while the spread sensitivities are determined by the cash-flow structure of each individual loan.
The market risk economic capital model captures the following sub-categories: interest rate risk (covering both the economic value and net interest income risk perspectives), credit spread risk, currency basis risk, and foreign exchange risk. The Bank applies various stress testing approaches for the calculation of market risk economic capital requirements across these market risk sub-categories, and recognises diversification benefits between them in the calculation of the overall economic capital requirement for market risk.
For operational risk, the economic capital requirement is obtained by first calculating the regulatory capital requirement using the standardised approach and then scaling that requirement up to arrive at a conservative estimate.
The regulatory macroprudential tools have been designed to mitigate potential systemic risks, help counter procyclicality in the financial system, and to reserve additional capital above regulatory minimum requirements so that banks have better tools to react and operate under stressed conditions. Due to its legal status, national banking legislation does not apply to NIB, nor it is subject to direct supervision from any supervisory authority. Similarly to other IFIs, NIB does not require a banking licence for its operations. NIB monitors international regulations and standards and adopts those that it identifies to be relevant and represent best practice. Therefore, NIB includes in its ICAAP the relevant macroprudential buffers (namely for capital conservation and countercyclicality) as well as a stress test buffer.
The capital conservation buffer is a fixed percentage (2.5 per cent as of 31 December 2022) of the Bank’s risk-weighted assets (RWA). The countercyclical buffer is calculated as the weighted-average of the private sector exposures and respective countercyclical buffer rates in those countries where the relevant risk exposures are located. The stress test buffer is normally derived from macroeconomic stress testing, based on severely adverse scenarios which build in severe yet plausible shocks to the real economy and financial markets. Scenarios are usually benchmarked to those from supervisory macroeconomic stress tests, but also incorporate expert judgment and/or specific elements to better test sensitivities to relevant factors such as the impact of particular shocks (e.g. higher inflation and interest rates, geopolitical risks) on sectors and/or regions.
Economic capital requirements
as of 31 December 2022, EUR m
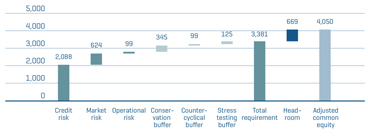
As of 31 December 2022, the minimum economic capital requirement was EUR 2,881 million, composed of EUR 2,088 million for credit risk, EUR 624 million for market risk, and EUR 99 million for operational risk. The capital conservation buffer was EUR 345 million and the countercyclical capital buffer was EUR 99 million. The stress test buffer was EUR 125 million. The total economic capital requirement thus amounted to EUR 3,381 million.
Adjusted common equity (paid-in capital and accumulated reserves after deduction of appropriate adjustment items) provides the risk coverage (loss-absorbing capacity) and is used as the benchmark to determine capital adequacy. As of 31 December 2022, the Bank’s adjusted common equity amounted to EUR 4,050 million.
As of 31 December 2022, the economic capital ratio (adjusted common equity divided by the minimum economic capital requirement) was 144 per cent (2021: 147 per cent, see Table 1 above). The capital headroom (difference between adjusted common equity and the total economic capital requirement) was EUR 669 million (2021: EUR 733 million).
| | |
| | |
ANNUAL REPORT 2022 | | 101 |
| | |
|
| |
| INTRODUCTION |
| |
| IMPACT |
| |
| GOVERNANCE |
| |
| BOD REPORT |
| |
| FINANCIALS |
| |
Operating and financial review |
| |
u Capital and liquidity management |
| |
Financial statements and notes |
| |
Proposal by the Board of Directors |
| |
Auditor’s report |
| |
Report of the Control Committee
Chairmanship |
| |
Report of the Control Committee |
| |
Ratio definitions |
| |
| SUSTAINABILITY INDICES |
| |
| |
| |
| |
| |
| |
| |
| |
| |
| |
| |
| |
| |
| |
| |
| |
| |
| |
| |
| |
| |
| |
Leverage
In line with sound banking principles and practices, the risk of excessive leverage is recognised and managed. The leverage ratio calculation follows the regulatory approach, considering full exposures (both on- and off-balance sheet) and thereby provides the Bank with an all-inclusive metric to measure and monitor the volume of its activities in relation to its loss-absorbing capacity.
The Principles for Capital and Liquidity Management set two specific leverage ratio requirements. The first is that the Bank’s leverage ratio must exceed 7 per cent. The second is that the leverage ratio when including callable capital (in the numerator) must exceed 20 per cent. A key reflection of owner support and an important element of the Bank’s capital management, callable capital is authorised capital that is not paid-in.
The exposure amount of an on-balance sheet asset is its accounting value remaining after specific credit risk adjustments. The exposure amount for off-balance sheet items, arising for instance from credit and liquidity commitments, is determined by multiplying the notional amount of an item by an appropriate credit conversion factor. The exposure amount of derivatives transactions is calculated as the sum of the replacement cost and an add-on for counterparty credit risk representing the potential future exposure of the transactions. Cash collateral may be recognised in the calculation as a reduction of exposure.
The leverage ratio is calculated as adjusted common equity divided by the total exposure measure. The leverage ratio with callable capital is calculated as adjusted common equity, including callable capital, divided by the total exposure measure.
As of 31 December 2022, the leverage ratio was 10.8 per cent (2021: 10.6 per cent, see Table 1 above) and the leverage ratio with callable capital was 30.9 per cent (2021: 30.9 per cent).
Liquidity
The Bank’s business model gives rise to liquidity risk mainly through maturity mismatches between financial assets (loans and treasury investments) and liabilities (borrowing and equity). The Statutes require that NIB maintain a liquidity reserve necessary for continuing its operations for a period of at least six months under a severe stress scenario. The Principles for Capital and Liquidity Management further establish a minimum liquidity requirement to safeguard that the Bank can meet its payment obligations without interruption and continue its operations even under adverse market conditions.
This requirement is operationalised via a minimum survival horizon requirement, which measures the time span during which the Bank is able to fulfil its payment obligations (stemming from ongoing business operations) under a severe stress scenario. The stress scenario considers the Bank continuing to disburse loans, the funding market becoming inaccessible, the credit risk of the loan portfolio, the market risk and liquidity risk of the liquidity reserve, and additional collateral requirements for derivative transactions.
To manage liquidity risk, NIB has integrated an Internal Liquidity Adequacy Assessment Process (ILAAP) into its ICAAP, thereby following the same operational and decision-making procedures as for its capital adequacy assessment.
The liquidity position is also calibrated to preserve the highest possible (AAA/Aaa) credit rating and to fulfil the liquidity coverage ratio (LCR) and net stable funding ratio (NSFR) requirements. The Bank’s liquidity risk measurement and liquidity buffer are described in detail in the Financial statements Note 2: Risk management.
As of 31 December 2022, the liquidity survival horizon was 417 days (2021: 450 days, see Table 1 above). The LCR was 1,176 per cent (2021: 5,162 per cent) and NSFR 164 per cent (2021: 160 per cent).
| | |
| | |
ANNUAL REPORT 2022 | | 102 |
| | |
|
| |
| INTRODUCTION |
| |
| IMPACT |
| |
| GOVERNANCE |
| |
| BOD REPORT |
| |
| FINANCIALS |
| |
Operating and financial review |
| |
Capital and liquidity .management |
| |
u Financial statements and notes |
| |
Proposal by the Board of Directors |
| |
Auditor’s report |
| |
Report of the Control Committee Chairmanship |
| |
Report of the Control Committee |
| |
Ratio definitions |
| |
| SUSTAINABILITY INDICES |
| |
| |
| |
| |
| |
| |
| |
| |
| |
| |
| |
| |
| |
| |
| |
| |
| |
| |
| |
| |
| |
| |
| |
| |
Statement of comprehensive income
| | | | | | | | | | | | |
| In thousands of euro | | Note | | | 2022 | | | 2021 |
Interest income from financial assets held at amortised cost | | | | | | | 365,505 | | | | 197,089 | |
Interest income from financial assets held at fair value | | | | | | | 51,385 | | | | 4,159 | |
Interest expense | | | | | | | -197,617 | | | | 145 | |
Net interest income | | | (3) (4) | | | | 219,272 | | | | 201,393 | |
| | | | | | | | | | | | | |
Commission income and fees received | | | (5) | | | | 8,805 | | | | 9,199 | |
Commission expense and fees paid | | | | | | | -2,012 | | | | -2,165 | |
Net fee and commission income | | | | | | | 6,793 | | | | 7,034 | |
| | | | | | | | | | | | | |
Net profit/loss on financial operations | | | (6) | | | | -37,497 | | | | -23,663 | |
Foreign exchange gains and losses | | | | | | | -214 | | | | 13 | |
Total operating income | | | | | | | 188,353 | | | | 184,777 | |
| | | | | | | | | | | | |
Expenses | | | | | | | | | | | | |
General administrative expenses | | | | | | | | | | | | |
Personnel expenses | | | (7) | | | | -31,764 | | | | -29,182 | |
Other administrative expenses | | | (8) | | | | -14,544 | | | | -12,766 | |
Depreciation | | | (14) | | | | -6,308 | | | | -9,545 | |
Total operating expenses | | | | | | | -52,616 | | | | -51,493 | |
| | | | | | | | | | | | | |
Profit before loan losses | | | | | | | 135,737 | | | | 133,284 | |
Net loan losses | | | (9) | | | | 3,536 | | | | 25,874 | |
Net Profit for the year | | | | | | | 139,273 | | | | 159,158 | |
| | | | | | | | | | | | | |
Other comprehensive income | | | | | | | | | | | | |
Items that will be reclassified to income statement | | | | | | | | | | | | |
Fair value hedges - valuation of cross currency basis spread | | | | | | | -3,029 | | | | -21,612 | |
Items that will not be reclassified to income statement | | | | | | | | | | | | |
Changes in own credit risk on liabilities recorded at fair value | | | | | | | 6,103 | | | | 329 | |
Total other comprehensive income | | | | | | | 3,073 | | | | -21,283 | |
| | | | | | | | | | | | | |
Total comprehensive income | | | | | | | 142,346 | | | | 137,876 | |
The accompanying notes are an integral part of these financial statements.
| | |
| | |
ANNUAL REPORT 2022 | | 103 |
| | |
|
| |
| INTRODUCTION |
| |
| IMPACT |
| |
| GOVERNANCE |
| |
| BOD REPORT |
| |
| FINANCIALS |
| |
Operating and financial review |
| |
Capital and liquidity management |
| |
u Financial statements and notes |
| |
Proposal by the Board of Directors |
| |
Auditor’s report |
| |
Report of the Control Committee
Chairmanship |
| |
Report of the Control Committee |
| |
Ratio definitions |
| |
| SUSTAINABILITY INDICES |
| |
| |
| |
| |
| |
| |
| |
| |
| |
| |
| |
| |
| |
| |
| |
| |
| |
| |
| |
| |
| |
| |
| |
| |
Statement of financial position
| | | | | | | | | | | | |
| In thousands of euro | | Note | | | 31 December 2022 | | | 31 December 2021 | |
Assets | | | | | | | | | | | | |
Cash and cash equivalents | | | (26) | | | | 2,078,406 | | | | 1,826,451 | |
Financial placements | | | | | | | | | | | | |
Placements with credit institutions | | | | | | | 4,469,229 | | | | 3,881,023 | |
Debt securities | | | (11) | | | | 8,768,457 | | | | 8,291,062 | |
Other | | | | | | | 4,532 | | | | 8,661 | |
| | | | | | | | 13,242,218 | | | | 12,180,747 | |
Loans outstanding | | | (12) | | | | 21,739,936 | | | | 21,975,146 | |
Intangible assets | | | (13) | | | | 8,704 | | | | 7,524 | |
Tangible assets, property and equipment | | | (13) | | | | 32,863 | | | | 35,632 | |
Other assets | | | | | | | | | | | | |
Derivatives | | | (15) (24) | | | | 1,817,179 | | | | 1,254,828 | |
Other assets | | | (15) | | | | 34,904 | | | | 31,916 | |
| | | | | | | | 1,852,083 | | | | 1,286,744 | |
Accrued interest and fees receivable | | | | | | | 325,374 | | | | 241,145 | |
Total assets | | | | | | | 39,279,583 | | | | 37,553,390 | |
The accompanying notes are an integral part of these financial statements.
| | |
| | |
ANNUAL REPORT 2022 | | 104 |
| | |
|
| |
| INTRODUCTION |
| |
| IMPACT |
| |
| GOVERNANCE |
| |
| BOD REPORT |
| |
| FINANCIALS |
| |
Operating and financial review |
| |
Capital and liquidity management |
| |
u Financial statements and notes |
| |
Proposal by the Board of Directors |
| |
Auditor’s report |
| |
Report of the Control Committee
Chairmanship |
| |
Report of the Control Committee |
| |
Ratio definitions |
| |
| SUSTAINABILITY INDICES |
| |
| |
| |
| |
| |
| |
| |
| |
| |
| |
| |
| |
| |
| |
| |
| |
| |
| |
| |
| |
| |
| |
| |
| |
| | | | | | | | | | | | |
| | | | |
| In thousands of euro | | Note | | | 31 December 2022 | | | 31 December 2021 | |
| | | |
Liabilities and equity | | | | | | | | | | | | |
| | | |
Liabilities | | | | | | | | | | | | |
| | | |
Amounts owed to credit institutions | | | | | | | | | | | | |
| | | |
Short-term amounts owed to credit institutions | | | (19) (26) | | | | 689,120 | | | | 751,697 | |
| | | |
| | | | | | | | | | | | | |
| | | |
Debts evidenced by certificates | | | (16) | | | | 31,595,081 | | | | 31,525,985 | |
| | | |
Other liabilities | | | | | | | | | | | | |
| | | |
Derivatives | | | (17)(24) | | | | 2,539,630 | | | | 1,052,474 | |
| | | |
Other liabilities | | | (17) | | | | 89,958 | | | | 39,426 | |
| | | |
| | | | | | | | 2,629,588 | | | | 1,091,900 | |
| | | |
Accrued interest and fees payable | | | | | | | 264,811 | | | | 185,171 | |
| | | |
Total liabilities | | | | | | | 35,178,600 | | | | 33,554,753 | |
| | | |
| | | | | | | | | | | | | |
| | | |
Equity | | | (18) | | | | 4,100,983 | | | | 3,998,637 | |
| | | |
| | | | | | | | | | | | | |
| | | |
Total liabilities and equity | | | | | | | 39,279,583 | | | | 37,553,390 | |
The accompanying notes are an integral part of these financial statements.
| | |
| | |
ANNUAL REPORT 2022 | | 105 |
| | |
|
| |
| INTRODUCTION |
| |
| IMPACT |
| |
| GOVERNANCE |
| |
| BOD REPORT |
| |
| FINANCIALS |
| |
Operating and financial review |
| |
Capital and liquidity management |
| |
u Financial statements and notes |
| |
Proposal by the Board of Directors |
| |
Auditor’s report |
| |
Report of the Control Committee Chairmanship |
| |
Report of the Control Committee |
| |
Ratio definitions |
| |
| SUSTAINABILITY INDICES |
| |
| |
| |
| |
| |
| |
| |
| |
| |
| |
| |
| |
| |
| |
| |
| |
| |
| |
| |
| |
| |
| |
| |
| |
Changes in equity
| | | | | | | | | | | | | | | | | | | | | | | | | | | | | | | | |
| In thousands of euro | | Paid-in capital | | | Statutory
reserve | | | General credit risk fund | | | Profit available
for appropriation | | | | | | Changes
in own
credit
risk on
liabilities
recorded
at
fair value | | | Cost of
hedging
reserve | | | Total | |
Equity at 31 December 2020 | | | 845,543 | | | | 686,325 | | | | 2,139,544 | | | | 164,695 | | | | | | | | -3,376 | | | | 28,030 | | | | 3,860,761 | |
Profit for the year | | | - | | | | - | | | | - | | | | 159,158 | | | | | | | | - | | | | - | | | | 159,158 | |
Other comprehensive income | | | - | | | | - | | | | - | | | | - | | | | | | | | 329 | | | | -21,612 | | | | -21,283 | |
Total comprehensive income | | | 0 | | | | 0 | | | | 0 | | | | 159,158 | | | | | | | | 329 | | | | -21,612 | | | | 137,875 | |
Transaction with owners in their capacity as owners | | | | | | | | | | | | | | | | | | | | | | | | | | | | | | | | |
Appropriation of year | | | | | | | 150,559 | | | | 14,136 | | | | -164,695 | | | | | | | | - | | | | - | | | | 0 | |
Equity at 31 December 2021 | | | 845,543 | | | | 836,884 | | | | 2,153,680 | | | | 159,159 | | | | | | | | -3,047 | | | | 6,418 | | | | 3,998,637 | |
Profit for the year | | | - | | | | - | | | | - | | | | 139,273 | | | | | | | | - | | | | - | | | | 139,273 | |
Other comprehensive income | | | - | | | | - | | | | - | | | | - | | | | | | | | 6,103 | | | | -3,029 | | | | 3,073 | |
Total comprehensive income | | | 0 | | | | 0 | | | | 0 | | | | 139,273 | | | | | | | | 6,103 | | | | -3,029 | | | | 142,346 | |
Transaction with owners in their capacity as owners | | | | | | | | | | | | | | | | | | | | | | | | | | | | | | | | |
Appropriation of profit | | | - | | | | - | | | | 119,158 | | | | -119,158 | | | | | | | | - | | | | - | | | | 0 | |
Dividends | | | - | | | | - | | | | - | | | | -40,000 | | | | | | | | - | | | | - | | | | -40,000 | |
Equity at 31 December 2022 | | | 845,543 | | | | 836,884 | | | | 2,272,838 | | | | 139,273 | | | | | | | | 3,056 | | | | 3,388 | | | | 4,100,983 | |
The accompanying notes are an integral part of these financial statements.
| | |
| | |
ANNUAL REPORT 2022 | | 106 |
| | |
|
| |
| INTRODUCTION |
| |
| IMPACT |
| |
| GOVERNANCE |
| |
| BOD REPORT |
| |
| FINANCIALS |
| |
Operating and financial review |
| |
Capital and liquidity management |
| |
u Financial statements and notes |
| |
Proposal by the Board of Directors |
| |
Auditor’s report |
| |
Report of the Control Committee Chairmanship |
| |
Report of the Control Committee |
| |
Ratio definitions |
| |
| SUSTAINABILITY INDICES |
| |
| |
| |
| |
| |
| |
| |
| |
| |
| |
| |
| |
| |
| |
| |
| |
| |
| |
| |
| |
| |
| |
| |
| |
Cash flow statement
| | | | | | | | | | | | |
| In thousands of euro | | Note | | | 2022 | | | 2021 | |
Cash flows from operating activities | | | | | | | | | | | | |
Net profit for the year | | | | | | | 139,273 | | | | 159,158 | |
| | | | | | | | | | | | | |
Adjustments: | | | | | | | | | | | | |
Unrealised gains/losses of financial assets held at fair value | | | | | | | 40,003 | | | | -9,169 | |
ECL non-lending activities | | | | | | | 1,309 | | | | -323 | |
Depreciation and write-down in value of tangible and intangible assets | | | | | | | 6,308 | | | | 9,545 | |
Change in accrued interest and fees (assets) | | | | | | | -84,228 | | | | -8,948 | |
Change in accrued interest and fees (liabilities) | | | | | | | 79,651 | | | | 10,584 | |
Net loan losses (ECL lending activities) | | | | | | | -3,536 | | | | -25,874 | |
Hedge accounting ineffectiveness | | | | | | | 1,058 | | | | 37,966 | |
Other adjustments to the net profit for the year | | | | | | | -1,446 | | | | -104 | |
Adjustments, total | | | | | | | 39,118 | | | | 13,676 | |
Lending | | | | | | | | | | | | |
Disbursements of loans | | | | | | | -3,526,941 | | | | -2,270,722 | |
Repayments of loans | | | | | | | 2,702,232 | | | | 1,975,518 | |
Capitalisations, redenominations, index adjustments, etc. | | | | | | | 7,959 | | | | 1,390 | |
Lending, total | | | | | | | -816,750 | | | | -293,815 | |
| | | | | | | | | | | | | |
Cash flows from operating activities, total | | | | | | | -638,359 | | | | -120,980 | |
| | | | | | | | | | | | | |
Cash flows from investing activities | | | | | | | | | | | | |
Placements and debt securities | | | | | | | | | | | | |
Purchase of debt securities | | | | | | | -2,516,292 | | | | -2,191,647 | |
Sold and/or matured debt securities | | | | | | | 1,729,779 | | | | 1,645,287 | |
Placements with credit institutions | | | | | | | -587,193 | | | | -2,002,565 | |
Other financial placements | | | | | | | -72 | | | | 51 | |
Placements and debt securities, total | | | | | | | -1,373,778 | | | | -2,548,873 | |
The accompanying notes are an integral part of these financial statements.
| | |
| | |
ANNUAL REPORT 2022 | | 107 |
| | |
|
| |
| INTRODUCTION |
| |
| IMPACT |
| |
| GOVERNANCE |
| |
| BOD REPORT |
| |
| FINANCIALS |
| |
Operating and financial review |
| |
Capital and liquidity management |
| |
u Financial statements and notes |
| |
Proposal by the Board of Directors |
| |
Auditor’s report |
| |
Report of the Control Committee Chairmanship |
| |
Report of the Control Committee |
| |
Ratio definitions |
| |
| SUSTAINABILITY INDICES |
| |
| |
| |
| |
| |
| |
| |
| |
| |
| |
| |
| |
| |
| |
| |
| |
| |
| |
| |
| |
| |
| |
| |
| |
| | | | | | | | | | | | |
| In thousands of euro | | Note | | | 2022 | | | 2021 | |
Other items | | | | | | | | | | | | |
Acquisition of intangible assets | | | | | | | -4,051 | | | | -1,617 | |
Acquisition of tangible assets | | | | | | | -383 | | | | -1,810 | |
Change in other assets | | | | | | | -7,740 | | | | -1,431 | |
Other items, total | | | | | | | -12,174 | | | | -4,858 | |
| | | | | | | | | | | | | |
Cash flows from investing activities, total | | | | | | | -1,385,951 | | | | -2,553,732 | |
| | | | | | | | | | | | | |
Cash flows from financing activities | | | | | | | | | | | | |
Debts evidenced by certificates | | | | | | | | | | | | |
Issues of new debt | | | | | | | 9,630,309 | | | | 7,027,535 | |
Redemptions | | | | | | | -7,356,900 | | | | -5,073,812 | |
Debts evidenced by certificates, total | | | | | | | 2,273,409 | | | | 1,953,722 | |
| | | | | | | | | | | | | |
Other items | | | | | | | | | | | | |
Change in swap receivables excluding fair value changes | | | | | | | 30,704 | | | | 92,626 | |
Change in swap payables excluding fair value changes | | | | | | | 56,383 | | | | 147,890 | |
Change in other liabilities | | | | | | | 1,594 | | | | -2,491 | |
Dividend paid | | | | | | | -40,000 | | | | - | |
Other items, total | | | | | | | 48,682 | | | | 238,025 | |
| | | | | | | | | | | | | |
Cash flows from financing activities, total | | | | | | | 2,322,091 | | | | 2,191,747 | |
| | | | | | | | | | | | | |
Change in cash and cash equivalents, net | | | | | | | 297,780 | | | | -482,964 | |
| | | | | | | | | | | | | |
Opening balance for cash and cash equivalents, net | | | (26 | ) | | | 1,074,754 | | | | 1,546,591 | |
Exchange rate adjustments | | | | | | | 16,752 | | | | 11,127 | |
Closing balance for cash and cash equivalents, net | | | (26 | ) | | | 1,389,286 | | | | 1,074,754 | |
| | | | | | | | | | | | | |
Additional information to the statement of cash flows | | | | | | | | | | | | |
Interest income received | | | | | | | 332,661 | | | | 192,300 | |
Interest expense paid | | | | | | | -117,976 | | | | 9,696 | |
The accompanying notes are an integral part of these financial statements.
| | |
| | |
ANNUAL REPORT 2022 | | 108 |
| | |
|
| |
| INTRODUCTION |
| |
| IMPACT |
| |
| GOVERNANCE |
| |
| BOD REPORT |
| |
| FINANCIALS |
| |
Operating and financial review |
| |
Capital and liquidity management |
| |
u Financial statements and notes |
| |
Proposal by the Board of Directors |
| |
Auditor’s report |
| |
Report of the Control Committee Chairmanship |
| |
Report of the Control Committee |
| |
Ratio definitions |
| |
| SUSTAINABILITY INDICES |
| |
| |
| |
| |
| |
| |
| |
| |
| |
| |
| |
| |
| |
| |
| |
| |
| |
| |
| |
| |
| |
| |
| |
| |
Note 1: Accounting policies
REPORTING ENTITY - HISTORY OF NIB
Cooperation of Member Countries
Institutionalised Nordic Cooperation
Cooperation among the Nordic countries comprises a wide range of activities, including economic policy, development of industrial technology, communications and the harmonisation of legal systems.
The most important formal basis for Nordic cooperation is the Helsinki Agreement of 1962. This agreement sets out the aims of Nordic cooperation and contains provisions for the Nordic Council and, as subsequently amended, for the Nordic Council of Ministers.
The Nordic Council is a forum for consultation and discussion on issues of common interests at a parliamentary level. The Nordic Council of Ministers is empowered to make decisions on matters of cooperation that are considered binding to the governments of the Nordic countries.
Since 1992, the three Baltic countries Estonia, Latvia and Lithuania have been cooperating closely with the Nordic countries under the framework of the Nordic–Baltic Eight (NB8) format. Under NB8, regular meetings between the Nordic and Baltic prime ministers and foreign ministers are held to discuss questions of regional interest and international issues.
EFTA and EU
The Nordic countries have steadily broadened their mutual commercial relationships, a development encouraged by the creation of the European Free Trade Association (“EFTA”) in 1960, which established a framework for the development of inter-Nordic trade during the 1960s and 1970s.
Following Denmark’s entry into the European Community (the predecessor to the European Union) in 1973, the other four Nordic countries concluded bilateral free-trade agreements with the European Community in order to promote free trade within the Nordic region.
Effective 1 January 1994, the EFTA member countries, with the exclusion of Switzerland, and the European Union (“EU”) established the European Economic Area (“EEA”), a free trade zone in Europe.
On 1 January 1995, Finland and Sweden became members of the EU, leaving Norway and Iceland as the only Nordic countries that presently are EFTA members. At the introduction of the Euro on 1 January 1999, Finland was the only Nordic country to participate in the economic and monetary union of the EU (“EMU”).
Effective 1 May 2004, Estonia, Latvia and Lithuania became members of the EU and subsequently of the EMU. Estonia joined the EMU on 1 January 2011, Latvia on 1 January 2014 and Lithuania on 1 January 2015.
Other forms of cooperation
Nordic–Baltic cooperation also includes coordination of policy positions in international organisations. Consultations are held regularly on issues arising within the United Nations and the United Nations Commission for Trade and Development. The member countries are jointly represented in the International Monetary Fund, the International Bank for Reconstruction and Development and other international organisations.
Establishment of the Nordic Investment Bank
Discussions within the Nordic Council and the Nordic Council of Ministers over a number of years led to the establishment of the Nordic Investment Bank. The legal basis for NIB is the “Establishing Agreement”, which was signed on 4 December 1975. The signatories of the Establishing Agreement were Denmark, Finland, Iceland, Norway and Sweden.
The Establishing Agreement and the Statutes of NIB became effective on 1 June 1976, and the Bank commenced operations on 2 August of that year.
On 15 September 1981, the Nordic Council of Ministers approved a programme to promote member country cooperation in project exports, primarily to developing countries. The decision, as amended on 28 February 1982, included, as one major element of the programme,
| | |
| | |
ANNUAL REPORT 2022 | | 109 |
| | |
|
| |
| INTRODUCTION |
| |
| IMPACT |
| |
| GOVERNANCE |
| |
| BOD REPORT |
| |
| FINANCIALS |
| |
Operating and financial review |
| |
Capital and liquidity management |
| |
u Financial statements and notes |
| |
Proposal by the Board of Directors |
| |
Auditor’s report |
| |
Report of the Control Committee Chairmanship |
| |
Report of the Control Committee |
| |
Ratio definitions |
| |
| SUSTAINABILITY INDICES |
| |
| |
| |
| |
| |
| |
| |
| |
| |
| |
| |
| |
| |
| |
| |
| |
| |
| |
| |
| |
| |
| |
| |
| |
the creation of a joint financing facility to grant loans and issue loan guarantees (“project investment loans”). The facility became effective on 1 July 1982, and has formed the main part of NIB’s lending activities outside Member countries. See Note 12.
In August 1996, the Nordic prime ministers decided to establish a special environmental loan facility (the “Environmental Investment Loan Facility”) to finance environmental investments in the region neighbouring the Nordic countries. The facility was approved by the Nordic Council of Ministers on 25 January 1997, and became effective on 28 August 1997. The facility, which was part of NIB’s lending activities, comprised loans and guarantees to both the public and private sector for financing investments aimed at protecting the environment and reducing cross border pollution in the neighbouring area to the member countries. See Note 12.
The project investment loan and environmental investment loan programmes were incorporated into NIB’s normal lending activities as part of the Statutory changes which came into effect on 29 July 2020 and are described below.
In November 1997, the Nordic Council of Ministers decided that the legal framework of NIB and its sister organisation NEFCO and NDF (each, as defined below) should be revised to reflect their status as international institutions.In relation to NIB, this led to the signing of the 1998 Agreement on 23 October 1998.
On 23 October 1998, the Nordic countries entered into a novation of the Establishing Agreement (the “1998 Agreement”). The 1998 Agreement came into force on 18 July 1999, and the Establishing Agreement ceased to be effective on the same date.
On 1 January 2005, Estonia, Latvia and Lithuania became members of NIB on equal terms with the original member countries following a policy decision taken by the Nordic prime ministers in June 2003. The new members have the same rights and obligations as the original members.
The 2004 Agreement mandates a new structure for the governance of the Bank, which was fully implemented as of 1 January 2005. NIB introduced an entirely new body, the Board of Governors, which replaced the Nordic Council of Ministers and its functions in the previous legal framework of the Bank. The 2004 Agreement did not change the activities of the Bank.
At its annual meeting on 24 May 2019, the Board of Governors approved substantial amendments to the Statutes and an amendment to the Agreement was agreed and signed on 28 February 2020. This Amending Agreement and the amendments to the Statues came into effect on 29 July 2020. The amendments consisted of the following:
- Replacing the current statutory gearing limit with a risk-based comprehensive framework for capital and liquidity management, in accordance with sound banking principles, and introducing minimum requirements for capital, liquidity and leverage;
- Discontinuing the special loan facilities for Project Investment Loans (PIL) and Environmental Investment Loans (MIL). The outstanding amounts under the PIL and MIL facilities have become part of NIB’s ordinary lending, and new lending of this type will in future also constitute ordinary lending. In addition, the special credit risk fund for PIL has been converted into paid-in capital and the Member countries’ PIL guarantees into callable capital. The MIL has not been converted;
- Improving institutional governance, clarifying the role of the Control Committee and the external auditors, and strengthening the role of the Chairmanship of the Bank’s Control Committee; and
- Allowing for limited equity participation as a new form of financing for the Bank, in addition to loans and guarantees, with the unanimous approval of the Board of Directors.
Implications for NIB’s related parties/sister organisations
On 19 May 1988, the Nordic Council of Ministers decided to establish the Nordic Development Fund (“NDF”), an international financial institution, for financing projects of Nordic interest in developing countries on concessional terms. The establishing agreement of NDF was signed by the five Nordic countries (“NDF member countries”) on 3 November 1988, and NDF commenced operations on 1 February 1989. NDF is a separate legal entity with its own Board of Directors and with a capital base provided by the NDF member countries.
On 2 March 1990, the Nordic Council of Ministers decided to establish the Nordic Environment Finance Corporation (“NEFCO”), an international financial institution, for promoting investments of Nordic environmental interest in Eastern and Central Europe. NEFCO is a separate legal entity with its own Board of Directors and with a capital base provided by the NEFCO member countries.
According to the constituent documents of NDF and NEFCO, their principal offices shall be located at the principal office of NIB. Furthermore, the Statutes of NDF and NEFCO set out that their Control Committee members appointed by the Nordic Council shall be the same persons as appointed by the Council to the Control Committee of NIB. In addition, the Statutes of NDF and NEFCO set out that the powers vested in their respective Board of Directors may be delegated to
| | |
| | |
ANNUAL REPORT 2022 | | 110 |
| | |
|
| |
| INTRODUCTION |
| |
| IMPACT |
| |
| GOVERNANCE |
| |
| BOD REPORT |
| |
| FINANCIALS |
| |
Operating and financial review |
| |
Capital and liquidity management |
| |
u Financial statements and notes |
| |
Proposal by the Board of Directors |
| |
Auditor’s report |
| |
Report of the Control Committee
Chairmanship |
| |
Report of the Control Committee |
| |
Ratio definitions |
| |
| SUSTAINABILITY INDICES |
| |
| |
| |
| |
| |
| |
| |
| |
| |
| |
| |
| |
| |
| |
| |
| |
| |
| |
| |
| |
| |
| |
| |
| |
the President of the respective organisation and/or to NIB. NIB provides administrative services to NDF and NEFCO the compensation of which is disclosed in Note 8 of the annual financial statements.
Statutory Purposes
The purpose of NIB, according to the 2004 Agreement and the Statutes is to make financing available in accordance with sound banking principles, taking into account socio-economic considerations, to realise investment projects of interest to the Member countries and other countries, which receive such financing. NIB is required to make a profit from its operations in order to provide for the accumulation of reserves and a reasonable return on its paid-in capital; however, it is not a profit maximising entity.
NIB finances its operations from the capital paid in by Member countries, retained earnings and by borrowing on the international capital markets.
Legal Status
Under the 2004 Agreement, NIB has the status of an international legal person with full legal capacity. In particular, NIB has the capacity to enter into agreements, to acquire and dispose of immovable and movable property, and to be a party to legal proceedings before courts of law and other authorities. The 2004 Agreement further states that NIB, as a common international financial institution to the Member countries, has the same status as other legal persons conducting similar operations within and outside the Member countries.
The 2004 Agreement also contains, among others, provisions regarding certain immunities. According to these provisions the Member countries have agreed that actions may be brought against NIB only in a court of competent jurisdiction in the territory of a country in which NIB has established an office, or has appointed an agent for the purpose of accepting service of process, or when NIB has otherwise expressly accepted jurisdiction. Actions may, however, be brought by a Member country or by persons acting for or deriving claims from a Member country only if NIB has given its express consent thereto.
In addition, the 2004 Agreement provides that property and assets of NIB wherever located and by whomsoever held shall be immune from execution of judgment or decree by judicial or administrative authority before such judgment or decree is final. The property and assets of the Bank wherever located and by whomsoever held shall further be immune from search, requisition, confiscation and expropriation by executive or legislative action. The Bank, its
property and assets shall also be immune from procedural measures of constraints, such as seizure.
The 2004 Agreement stipulates that the premises and archives of NIB and all documents belonging to it or held by it shall be inviolable.
The 2004 Agreement also states that NIB is exempt from payment restrictions and credit policy measures, which in any manner prevent or impede the fulfilment of its commitments and that NIB, its income, assets and property shall be exempt from all taxation as set forth in the relevant Article. Consequently, NIB shall be exempt from taxes on the purchase and transfer of real estate and securities and on the procurement of goods and services in connection with the official activities of NIB. Lending and borrowing by NIB is also exempt from all taxes and charges of a similar nature.
On 20 October 2010, a revised Host Country Agreement between NIB and the Government of Finland was signed. The agreement confirms NIB´s status as an international organization and further regulates certain privileges and immunities concerning NIB and its staff as well as social security for the staff. The agreement was enacted in Finland and came into force on 16 January 2011.
NIB’s Headquarters is located at Fabianinkatu 34, Helsinki, Finland.
Basis of accounting
The Bank’s financial statements have been prepared in accordance with International Financial Reporting Standards (IFRS) issued by the International Accounting Standards Board (IASB). The financial statements have been prepared in accordance with the historical cost convention with some exceptions described in the policies below.
The cash flow statement has been prepared using the indirect method whereby net profit is adjusted for effects of non-cash transactions such as fair valuations, depreciation and loan losses. The cash flows are classified by operating, investing and financing activities. Cash flow items cannot be directly determined from the statement of financial position.
On 23 February 2023, the Board of Directors approved the financial statements for publication. These financial statements will be submitted for approval to the Annual Meeting of the Board of Governors scheduled to be held no later than by the end of May 2023.
| | |
| | |
ANNUAL REPORT 2022 | | 111 |
| | |
|
| |
| INTRODUCTION |
| |
| IMPACT |
| |
| GOVERNANCE |
| |
| BOD REPORT |
| |
| FINANCIALS |
| |
Operating and financial review |
| |
Capital and liquidity management |
| |
u Financial statements and notes |
| |
Proposal by the Board of Directors |
| |
Auditor’s report |
| |
Report of the Control Committee
Chairmanship |
| |
Report of the Control Committee |
| |
Ratio definitions |
| |
| SUSTAINABILITY INDICES |
| |
| |
| |
| |
| |
| |
| |
| |
| |
| |
| |
| |
| |
| |
| |
| |
| |
| |
| |
| |
| |
| |
| |
| |
New Accounting Standards adopted in 2022 and New standards for financial years beginning on or after 1 January 2023
The Bank did not adopt any new standards during 2022 which had a significant impact. There are no IFRS standards or interpretations that are not yet effective that would be expected to have a material impact on the Bank.
Functional and presentation currency
The Bank’s functional and presentation currency is the euro and the financial statements are presented in EUR 1,000, unless otherwise indicated. All figures in the accounts have been rounded and consequently the sum of individual figures may deviate from the presented sum figure. Furthermore, all percentages are subject to possible rounding differences.
Significant accounting judgements and estimates
As part of the process of preparing the financial statements in conformity with IFRS, the Bank’s management is required to make certain judgements, estimates and assumptions that may affect the Bank’s profits, its financial position and other information presented in the Annual Report. These estimates are based on available information and the judgements made by the Bank’s management. Actual outcomes may deviate from the assessments made, and such deviations may at times be significant.
The Bank uses various valuation models and techniques to estimate the fair values of assets and liabilities. There are significant uncertainties related to these estimates, in particular when they involve modelling complex financial instruments, such as derivative instruments used for hedging activities related to both borrowing and lending.
The estimates are highly dependent on market data, such as the level of interest rates, currency rates and other factors. The uncertainties related to these estimates are reflected mainly in the statement of financial position. NIB undertakes continuous development in order to improve the basis for fair value estimates, with regard to both modelling and market data. Changes in estimates resulting from refinements in assumptions and methodologies are reflected in the period in which the enhancements are first applied.
Significant judgement and estimates are also applied to loan impairment testing in accordance with IFRS 9.
Foreign currency translation
Monetary assets and liabilities denominated in foreign currencies are recognised in the accounts at the exchange rate prevailing on the closing date. Non-monetary assets and liabilities are recognised in the accounts at the euro rate prevailing on the transaction date. Income and expenses recognised in currencies other than the euro are converted on a daily basis to the euro, in accordance with the euro exchange rate prevailing on that day.
Realised and unrealised exchange rate gains and losses are recognised in the statement of comprehensive income.
The Bank uses exchange rates acquired from a leading market data provider based on rates prevailing at 13:00 GMT at 31 December as disclosed in Note 27.
Recognition and derecognition of financial instruments
Financial assets and liabilities, with the exception of loans to customers are initially recognised in the statement of financial position on the trade date, i.e., the date the Bank becomes party to the contractual provisions of the instrument.
A financial asset is derecognised when the contractual rights to the cash flows from the financial asset expire or when substantially all the risks and rewards of the asset have been transferred.
A financial liability is derecognised from the statement of financial position when the obligation specified in the contract is discharged, cancelled or expired.
Financial assets at amortised cost
The Bank measures amounts due from banks, loans and advances to customers and other financial investments at amortised cost only if both of the following conditions are met: a) The financial asset is held within a business model with the objective to hold financial assets in order to collect contractual cash flows, b) The contractual terms of the financial asset give rise on specified dates to cash flows that are solely payments of principal and interest (SPPI) on the principal amount outstanding.
The most significant elements of interest within a lending arrangement are typically the consideration for the time value of money and credit risk. To make the SPPI assessment, the
| | |
| | |
ANNUAL REPORT 2022 | | 112 |
| | |
|
| |
| INTRODUCTION |
| |
| IMPACT |
| |
| GOVERNANCE |
| |
| BOD REPORT |
| |
| FINANCIALS |
| |
Operating and financial review |
| |
Capital and liquidity management |
| |
u Financial statements and notes |
| |
Proposal by the Board of Directors |
| |
Auditor’s report |
| |
Report of the Control Committee
Chairmanship |
| |
Report of the Control Committee |
| |
Ratio definitions |
| |
| SUSTAINABILITY INDICES |
| |
| |
Bank applies judgement and considers relevant factors such as the currency in which the financial asset is denominated, and the period for which the interest rate is set. In contrast, contractual terms that introduce a more than de minimis exposure to risks or volatility in the contractual cash flows that are unrelated to a basic lending arrangement do not give rise to contractual cash flows that are solely payments of principal and interest on the amount outstanding. In such cases, the financial asset is required to be measured at FVPL.
The Bank may issue loans that include features that change the contractual cash flows based on the borrower meeting certain contractually specified environmental, social and governance (ESG) targets. These are known as ESG-linked (or sustainability-linked) loans. For example, the contractual interest rate is reduced if the borrower meets specific targets for reducing carbon emissions. In line with the policy outlined above, if the ESG feature is assessed as resulting in a de minimis exposure to risks or volatility in the contractual cash flows, then the ESG feature does not affect the classification of the loan. At present the Bank does not have any loans where the effect of the ESG feature is assessed as being more than de minimis.
Financial assets at fair value
If the asset fails the amortised cost criteria the financial asset is classified at fair value through profit and loss (FVTPL) or fair value through other comprehensive income (FVOCI). FVOCI is used to classify assets held for payments of principal, interest and to sell. At present the Bank does not hold any FVOCI assets. All other financial assets are classified as FVTPL.
Financial Liabilities
Financial liabilities, other than loan commitments are measured at amortised cost or at FVTPL when they are held for trading and derivative instruments or the fair value designation is applied. The Bank applies the fair value option on structured bonds issued as these instruments include embedded derivatives not closely related to the host contract. The change in fair value of these issued structured bonds is recognised in the income statement except for changes in own credit risk that are recognised in other comprehensive income.
Determination of fair value
The fair value of financial instruments, including derivative instruments that are traded in a liquid market, is the bid or offered closing price on the balance sheet date. Where the fair
values cannot be derived from active markets, they are determined using a variety of valuation techniques, which include the use of mathematical models. The input to these models is taken from observable market data where possible. Many of NIB’s financial instruments are not traded in a liquid market, such as the Bank’s borrowing transactions with embedded derivative instruments. These are measured at fair value using different valuation models and techniques. This process involves determining future expected cash flows, which can then be discounted to the balance sheet date. The estimation of future cash flows for these instruments is subject to assumptions on market data, and in some cases, in particular where options are involved, on the behaviour of the Bank’s counterparties. The fair value estimate may therefore be subject to variations. Under different market assumptions, the values could also differ significantly.
The Bank measures fair values using the following fair value hierarchy, which reflects the significance of the inputs used in making the measurements:
Level 1: Quoted market prices (unadjusted) in an active market for identical instruments.
Level 2: Valuation techniques based on observable inputs, either directly (i.e. as prices) or indirectly (i.e. derived from prices). This category includes instruments valued using: quoted market prices in active markets for similar instruments, quoted prices for identical or similar instruments in markets that are considered less than active or other valuation techniques where all significant inputs are directly or indirectly observable from market data.
Level 3: Valuation techniques using significant unobservable inputs. This category includes all instruments where the valuation technique includes inputs not based on observable data and where the unobservable inputs have a significant effect on the instrument’s valuation. This category includes instruments that are valued based on quoted prices for similar instruments where significant unobservable adjustments or assumptions are required to reflect differences between the instruments.
The Bank recognises transfers between levels of the fair value hierarchy as of the end of the reporting period during which the change has occurred. All level 2 valuations are based on acquired market data from external sources using NIB developed models. See Note 20 for further details.
Offsetting
A financial asset and a financial liability are offset and the net amount recognised only where there is a legal right to do so and the intention is to settle on a net basis.
| | |
| | |
ANNUAL REPORT 2022 | | 113 |
| | |
|
| |
| INTRODUCTION |
| |
| IMPACT |
| |
| GOVERNANCE |
| |
| BOD REPORT |
| |
| FINANCIALS |
| |
Operating and financial review |
| |
Capital and liquidity management |
| |
u Financial statements and notes |
| |
Proposal by the Board of Directors |
| |
Auditor’s report |
| |
Report of the Control Committee Chairmanship |
| |
Report of the Control Committee |
| |
Ratio definitions |
| |
| SUSTAINABILITY INDICES |
| |
| |
| |
| |
| |
| |
| |
| |
| |
| |
| |
| |
| |
| |
| |
| |
| |
| |
| |
| |
| |
| |
| |
| |
Cash and cash equivalents
Cash and cash equivalents comprise monetary assets and placements with original maturities of three months or less, calculated from the date the acquisition and placements were made. Cash and cash equivalents in the cash flow statement refers to the net amount of monetary assets, placements and liabilities with original maturities of three months or less, calculated from the time the transaction was entered into.
Financial placements
Items recognised as financial placements in the statement of financial position include placements with credit institutions and placements in debt securities, for example, bonds and other debt certificates, as well as certain placements in instruments with equity features. The placements are initially recognised on trade date. Their subsequent accounting treatment depends on both the Bank’s business model for managing the placements and their contractual cash flow characteristics.
Loans outstanding
The Bank’s loan transactions are recognised in the statement of financial position at the time the funds are transferred to the borrower. Loans are recognised initially at fair value which corresponds to transferred funds, including transaction costs. Loans outstanding are subsequently carried at amortised cost except for some structured loans that do not meet the amortised cost classification criteria and are therefore recorded at fair value. If the loans are hedged against changes in fair value due to the hedged risk, the carrying value of the hedged loans are adjusted by the change in fair value due to the hedged risk.
Impairment of loans
The bank uses an expected credit loss model (ECL) to estimate the provision for potential impairments. The Bank recognises a loss allowance for ECL on financial assets measured at amortised cost, or at fair value through comprehensive income, and for loan commitments. The ECL comprises of a three-stage model based on changes in credit quality since initial recognition. Impairments are reported based in either twelve month or lifetime expected credit losses, depending on the stage allocation of the financial asset. The stage allocation also determines if interest income for the financial asset are reported on gross carrying amount as for Stage 1 and 2 assets or net of impairment allowance for Stage 3 assets.
Stage 1 - includes financial assets that have not had a significant deterioration in credit quality since initial recognition or have a low risk at the reporting date. For these assets, the ECL is a probability-weighted result of default events that are possible within next 12 months after the reporting date.
Stage 2 - includes financial assets that have had a significant increase in credit risk (SICR) since initial recognition, but for which there is no objective evidence of impairment. For these assets, the allowance amount is calculated based on expected lifetime of the asset. A SICR is considered to have occurred if the life-time default probability (PD) has increased significantly compared to that at the initial recognition. For assets with an initial PD of 1 to 5 a SICR occurs after a 3-notch downgrade, for assets with an initial PD of 6 to 10 a SICR occurs after a 2-notch downgrade whereas assets with an initial PD of 11 to 19 a SICR occurs after a 1 notch downgrade. Stage 1 and 2 assets are categorised as performing assets.
Stage 3 - includes assets that have been categorised as non-performing in the Bank’s credit rating processes. For the non-performing assets, assessment is done on an individual basis, as opposed to generic calculation rules for the Stage 1 and 2 assets. Exposures in default classes are classified as non-performing. A default occurs with regard to an obligor when either or both of the following have taken place:
| (a) | NIB considers that the obligor is unlikely to pay its credit obligations in full, |
| (b) | The obligor is past due by more than 90 and in the case of sovereign lending exposure to member countries 180 days, or countries with which NIB has an existing framework agreement in place. |
Obligors that satisfy the criteria in (a) above are set to default class D1 and those that satisfy the criteria in (b) above are set to default class D2. If both criteria (a) and (b) are satisfied, the obligor is set to default class D2.
The Bank reviews its non-performing loans and receivables at each reporting date to assess whether an allowance for impairment should be recorded in the statement of comprehensive income. In particular, the judgement of the management is required in estimating the amount and timing of future cash flows when determining the level of allowance required. Such estimates are based on assumptions about a number of factors, and actual results may differ, resulting in future changes to the allowance. Further details regarding the ECL model, related inputs and governance can be found in Note 10.
| | |
| | |
ANNUAL REPORT 2022 | | 114 |
| | |
|
| |
| INTRODUCTION |
| |
| IMPACT |
| |
| GOVERNANCE |
| |
| BOD REPORT |
| |
| FINANCIALS |
| |
Operating and financial review |
| |
Capital and liquidity management |
| |
u Financial statements and notes |
| |
Proposal by the Board of Directors |
| |
Auditor’s report |
| |
Report of the Control Committee Chairmanship |
| |
Report of the Control Committee |
| |
Ratio definitions |
| |
| SUSTAINABILITY INDICES |
| |
| |
| |
| |
| |
| |
| |
| |
| |
| |
| |
| |
| |
| |
| |
| |
| |
| |
| |
| |
| |
| |
| |
| |
Intangible assets
Intangible assets mainly consist of investments in software, software licences and right-to use assets arising from leasing arrangements. Acquisitions that generate economic benefits exceeding costs beyond one year are recognised as intangible assets. The investments are carried at historical cost, and are amortised over the assessed useful life of the assets, which is estimated to be between three and five years. The amortisations are made on a straight-line basis.
Tangible assets
Tangible assets in the statement of financial position include land, buildings, office equipment and other tangible assets owned by the Bank. The assets are recognised at historical cost, less any accumulated depreciation based on their assessed useful life. Land is not depreciated. The Bank’s office building in Helsinki is depreciated on a straight-line basis over a 40-year period. The Bank’s other buildings are depreciated over a 30-year period. The depreciation period for office equipment and other tangible assets is determined by assessing the individual item. The depreciation period is usually three to five years. The depreciations are calculated on a straight-line basis.
Write-downs and impairment of intangible and tangible assets
The Bank’s assets are reviewed annually for impairment. If there is any objective evidence of impairment, the impairment loss is determined based on the recoverable amount of the assets.
Derivative instruments and hedge accounting
The Bank’s derivative instruments used to manage interest rate and currency risk are recognised on a trade-date basis at fair value in the statement of financial position as “Other assets” or “Other liabilities”. The Bank applies hedge accounting in accordance with IFRS 9 when the conditions set out by the standard are met. The hedge accounting is based on a clearly documented relationship between the item hedged and the hedging instrument. When there is an economic relationship between the hedging instrument on the one hand and the value change of the hedged item or the cash flows generated by the hedged item on the other, the hedge is regarded as effective. The hedging relationship is documented at the time the hedge transaction is entered into, and the effectiveness of the hedge is continually assessed. Derivatives where hedge accounting is not applied are recognised at fair value through profit and loss.
Fair value hedging
When a derivative is designated as the hedging instrument in a hedge of the change in fair value of a recognised asset or liability or a firm commitment that could affect profit or loss, changes in the fair value of the derivative are recognised immediately in profit or loss in the same line item as the changes in fair value of the hedged item due to the hedged risk. Currently the Bank’s fair value hedges mainly relate to swapping fixed to floating rates on its borrowing and lending transactions.
Foreign currency basis spread
The bank separates the foreign currency basis spread from financial instruments used in hedging and this separated amount is recorded in “Other comprehensive income” (OCI).
Cash flow hedging
Currently the Bank does not apply cash flow hedge accounting.
Discontinuance of hedge accounting
If the hedging derivative expires or is sold, terminated or exercised, or the hedge no longer meets the criteria for fair value hedge accounting, then hedge accounting is discontinued prospectively. Any adjustment up to the point of discontinuation to a hedged item for which the effective interest method is used is amortised to profit or loss as part of the recalculated effective interest rate of the item over its remaining life. If the hedged item is derecognised, the unamortised fair value is recognised immediately in profit or loss.
Debts evidenced by certificates
The Bank’s borrowing transactions are recognised in the statement of financial position when drawn up. The borrowing transactions are recognised initially at a cost that comprises the fair value of the funds transferred, less transaction costs. The Bank uses derivative instruments to hedge the fair value of virtually all its borrowing transactions. In these instances, the carrying amount is adjusted for changes in fair value due to the hedged risk, which is recognised in the income statement. Securities delivered under repurchase agreements are not derecognised from the statement of financial position. Cash received under repurchase agreements is recognised in the statement of financial position as “Amounts owed to credit institutions”.
| | |
| | |
ANNUAL REPORT 2022 | | 115 |
| | |
|
| |
| INTRODUCTION |
| |
| IMPACT |
| |
| GOVERNANCE |
| |
| BOD REPORT |
| |
| FINANCIALS |
| |
Operating and financial review |
| |
Capital and liquidity management |
| |
u Financial statements and notes |
| |
Proposal by the Board of Directors |
| |
Auditor’s report |
| |
Report of the Control Committee Chairmanship |
| |
Report of the Control Committee |
| |
Ratio definitions |
| |
| SUSTAINABILITY INDICES |
| |
| |
| |
| |
| |
| |
| |
| |
| |
| |
| |
| |
| |
| |
| |
| |
| |
| |
| |
| |
| |
| |
| |
| |
Interest
The Bank’s net interest income includes accrued interest on loans, debt securities, placements and accruals of the premium or discount value of financial instruments. Net interest income also includes interest expenses on debts and borrowing costs measured using the effective interest method.
Fees and commissions
Fees collected when disbursing loans are recognised as income over the life of the loan using the effective interest rate method. Commitment fees are charged on loans that are agreed but not yet disbursed and are recognised in the statement of comprehensive income over the commitment period.
Financial transactions
The Bank recognises in “Net profit on financial operations” both realised and unrealised gains and losses on debt securities and other financial instruments. Adjustments for hedge accounting are also included in this item.
Leasing agreements
The Bank applies a single recognition and measurement approach for all leases, except for short-term leases and leases of low-value assets. The Bank recognises lease liabilities to make lease payments and right-of-use assets representing the right to use the underlying assets. The liability and asset are equal at recognition date. Short-term leases and leases of low-value assets are recognised on a straight-line basis over the lease term.
Right-of-use assets
The Bank recognises right-of-use assets at the commencement date of the lease (i.e., the date the underlying asset is available for use). Right-of-use assets are measured at cost, less any accumulated depreciation and impairment losses, and adjusted for any remeasurement of lease liabilities. The cost of right-of-use assets includes the amount of lease liabilities recognised, initial direct costs incurred, and lease payments made at or before the commencement date less any lease incentives received. Right-of-use assets are depreciated on a straight-line basis over the lease term. The right of use assets are presented as part of intangible assets in Note 13.
Lease liabilities
At the commencement date of the lease, the Bank recognises lease liabilities measured at the present value of lease payments to be made over the lease term.
Employee benefits
Defined contribution plans
The Bank is responsible for arranging pension security for its employees. In accordance with the Host Country Agreement between the Bank and the Finnish Government and as part of the Bank’s pension arrangements, the Bank has decided to apply the Finnish state pension system. Contributions to this pension system, which are paid into the Finnish State Pension Fund, are calculated as a percentage of salaries. The Finnish Ministry of Finance determines the basis for the contributions and establishes the actual percentage of the contributions in co-operation with the local government pension institution Keva. See Note 7. The Bank’s pension liability is completely covered. NIB also provides its permanent employees with a supplementary pension insurance scheme arranged by a private pension insurance company. This is group pension insurance based on a defined contribution plan. Obligations for contributions to defined contribution plans are expensed as the related service is provided and recognised as personnel expenses in profit or loss.
Short-term employee benefits
Short-term employee benefits are expensed as the related service is provided.
Segment information
Operating segments are reported in a manner consistent with the internal reporting provided to the chief operating decision maker (“CODM”), who is responsible for allocating resources and assessing the performance of the operating segments. Segment results that are reported to the management include items directly attributable to that segment as well as other items allocated on a reasonable basis. As the Bank is a single entity in one location there are no unallocated items.
| | |
| | |
ANNUAL REPORT 2022 | | 116 |
| | |
|
| |
| INTRODUCTION |
| |
| IMPACT |
| |
| GOVERNANCE |
| |
| BOD REPORT |
| |
| FINANCIALS |
| |
Operating and financial review |
| |
Capital and liquidity management |
| |
u Financial statements and notes |
| |
Proposal by the Board of Directors |
| |
Auditor’s report |
| |
Report of the Control Committee Chairmanship |
| |
Report of the Control Committee |
| |
Ratio definitions |
| |
| SUSTAINABILITY INDICES |
| |
| |
| |
| |
| |
| |
| |
| |
| |
| |
| |
| |
| |
| |
| |
| |
| |
| |
| |
| |
| |
| |
| |
| |
Note 2: Risk management
Risk management framework
NIB monitors international risk management regulations and standards and adopts those that it identifies to be relevant and represent best practice. The Bank has established a risk, capital and liquidity management framework, with high-level statutory requirements stipulated in the Statutes and the Principles for Capital and Liquidity Management, supported by a Risk Appetite Statement (RAS), risk management policies and limits, an Internal Capital Adequacy Assessment Process (ICAAP), and a Capital and Liquidity Recovery Plan.
The Risk Appetite Statement sets the principles for the Bank’s risk-taking, risk mitigation and risk avoidance. It aims to align willingness to take risk with the statutory requirements, strategic business objectives, and capital planning. In addition, it also helps raise risk awareness across the organisation. The Risk Appetite Statement is made operational via specific policies and procedures, monitoring metrics, a limit system and internal controls. Adherence to the Risk Appetite Statement is continuously monitored and regularly reported to senior management and to the Board of Directors. The RAS is reviewed by senior management and the Board of Directors at least on an annual basis in order to ensure that risk-taking stays within risk-bearing capacity. As stated in the RAS, NIB strives to maintain its issuer credit rating at the highest possible level, supported by strong capital and liquidity positions as well as stable earnings and operational efficiency.
The Statutes require that NIB has in place sound and effective strategies for risk, capital, and liquidity assessments, which shall be conducted at least annually and reviewed regularly. The Bank uses its Internal Capital Adequacy Assessment Process (ICAAP) to evaluate the amount of capital and liquidity needed to cover the risks the Bank is or might be exposed to. The ICAAP is conducted on an annual basis. The Bank maintains a sufficient amount of capital and liquidity to cover all material risks and to ensure that operations can be continued without disruptions even in extremely adverse situations. The ICAAP also considers macro-prudential elements and allocates capital buffers as appropriate. Stress testing is used to provide a forward-looking view on the Bank’s risk exposures.
The Capital and Liquidity Recovery Plan provides a tool to manage risk, capital and liquidity positions during severely adverse situations. The Bank has established a monitoring system for its statutory metrics (capital ratio, leverage ratios, and liquidity survival horizon), defined
escalation procedures, and designed a set of action plans to be executed in case any statutory metric is deemed to be at risk of breaching its minimum requirement. The Capital and Liquidity Recovery Plan is approved by the Board of Directors.
The overall objective of the risk management framework is to maintain the Bank’s financial soundness and avoid activities that could threaten the Bank’s reputation. The Bank’s risk management framework is regularly reviewed and adapted to changing conditions. The Bank’s risk taxonomy shows financial and non-financial sources of risk, and it supports the risk identification and assessment processes. Risk management activities are then tailored at the risk category level in accordance with the assessed materiality of risks.
The Bank’s risk management framework comprises risk policies and procedures formulated for the identification, measurement, monitoring and reporting of risks including a comprehensive limit system for managing the exposure to quantifiable risks. The Bank recognises that effective risk management is based on a sound risk culture, which is characterised, among other things, by a high level of awareness concerning risk and risk management in the organisation. Regular training of staff in risk-related matters is part of the Bank’s risk management practices.
Risk governance
The three-lines-of-defence model provides the basis for the NIB risk governance. The model aims to provide clear segregation of duties between units that enter into business transactions with customers or otherwise expose the Bank to risks, and units in charge of risk assessment, risk measurement, monitoring and control.
The risk governance model, including the roles and responsibilities of the decision-making bodies, is described in more detail in the Bank’s Governance Statement and Risk Management Policy.
Credit risk
Credit risk is defined as the risk of loss resulting from the failure of the Bank’s borrowers and other counterparties to fulfil their contractual obligations and that collateral provided does not cover the Bank’s claims. Following from the NIB mission, most of the credit risk stems from the Bank’s lending operations. The Bank is also exposed to credit risk in its treasury activities, where credit risk derives from the financial assets that the Bank uses for investing its liquidity, such as fixed-income securities and interbank deposits, and from counterparty credit risk via derivative instruments used for managing market risks.
| | |
| | |
ANNUAL REPORT 2022 | | 117 |
| | |
|
| |
| INTRODUCTION |
| |
| IMPACT |
| |
| GOVERNANCE |
| |
| BOD REPORT |
| |
| FINANCIALS |
| |
Operating and financial review |
| |
Capital and liquidity management |
| |
u Financial statements and notes |
| |
Proposal by the Board of Directors |
| |
Auditor’s report |
| |
Report of the Control Committee Chairmanship |
| |
Report of the Control Committee |
| |
Ratio definitions |
| |
| SUSTAINABILITY INDICES |
| |
| |
| |
| |
| |
| |
| |
| |
| |
| |
| |
| |
| |
| |
| |
| |
| |
| |
| |
| |
| |
| |
| |
| |
Credit risk management
The Bank’s credit risk management builds on the principles of (1) appropriate risk diversification within the scope of the mission; (2) thorough risk assessment at the credit appraisal stage; (3) risk-based pricing and risk mitigation; (4) continuous risk monitoring at the individual counterparty level as well as portfolio level; (5) avoidance of undesirable risks to the extent possible.
Credit risk limits
The maximum credit exposure that the Bank is willing to take is expressed in terms of exposure limits set by the Board of Directors. Credit exposure is the aggregate of lending and treasury exposure. Limits at counterparty level are scaled to the Bank’s equity and the counterparty’s equity. Concentration limits with respect to large exposures and industry sector are defined in relation to the Bank’s equity and/or economic capital.
Counterparty limits are determined based on the probability of default and expected loss. The Bank defines a single counterparty as a counterparty or group of counterparties that are legally and/or financially consolidated or otherwise interdependent from a risk perspective. For exposure limit purposes, the Bank considers the entity where the risk resides, i.e., the risk-owner, as the counterparty. The risk-owner is the entity that is ultimately responsible for the Bank’s claim and may be different from the obligor if the risk is transferred through a guarantee. In order for a guarantee to be eligible for risk transfer, it must cover the full exposure and be a guarantee undertaking securing the borrower’s debt “as for own debt”, meaning that the Bank can make a claim under the guarantee immediately, unconditionally and irrevocably when the borrower has failed to pay on a due date.
To prevent excessive concentrations, the Bank applies portfolio-level limits for large counterparty exposures, as well as for industry sectors and country exposures. The Bank has not set limits for the aggregate lending exposure in its member countries. Lending in non-member countries is subject to country limits. For the Bank’s treasury operations, country limits apply for exposure in all countries.
As a general principle, the Bank limits the maximum amount granted as loan or guarantee for a single project to 50% of the total project cost. Financing to SMEs, small mid-cap and mid-cap corporates in the Bank’s member countries can be extended up to 75% of the total project or financing need qualifying for a NIB mandate.
Credit risk assessment
The counterparty’s debt servicing capacity is a key consideration for credit approval. The assessment of a counterparty’s creditworthiness focuses on identifying their main financial and business risks. Based on the assessment, a risk rating indicating the probability of default (PD) is assigned to the counterparty. The credit risk assessment includes the use of quantitative risk methodologies and models as well as qualitative assessments based on expert judgement. The process of proposing PD ratings for counterparties is carried out in the first line of defence in the respective business area (lending or treasury).
A separate expected loss (EL) rating is assigned at the transaction level. The EL rating factors in the loss given default (LGD), i.e. the loss severity in the event of a counterparty default. The LGD assignment relies on models that produce a LGD estimate based on the type of counterparty and the characteristics of the transaction (such as guarantees, collateral, the seniority of the claim, and other potential credit enhancing factors in the transaction).
The second line of defence Credit function reviews risk rating proposals, providing a second opinion (control role). Credit risk ratings (PD, LGD, EL) are ultimately approved by the Mandate, Credit and Compliance Committee.
The Bank’s risk rating system comprises 20 classes to differentiate the risk of counterparty default (PD) and the expected loss (EL) on a transaction. In addition, a separate D class applies for non-performing transactions. For reference to ratings from credit rating agencies, internal ratings are mapped to those of S&P and Moody’s such that internal classes 1-10 correspond to their investment-grade categories (respectively AAA to BBB- and Aaa to Baa3).
In addition to counterparty-level and transaction-level diligence and credit risk assessments, the Bank applies the IFRS 9 accounting standard for estimating expected credit loss (ECL), thereby applying forward-looking provisioning for all financial assets under scope of the ECL calculation. The ECL methodology, including the stage classification of assets, is described in more detail in Note 10: Expected credit loss.
| | |
| | |
ANNUAL REPORT 2022 | | 118 |
| | |
|
| |
| INTRODUCTION |
| |
| IMPACT |
| |
| GOVERNANCE |
| |
| BOD REPORT |
| |
| FINANCIALS |
| |
Operating and financial review |
| |
Capital and liquidity management |
| |
u Financial statements and notes |
| |
Proposal by the Board of Directors |
| |
Auditor’s report |
| |
Report of the Control Committee Chairmanship |
| |
Report of the Control Committee |
| |
Ratio definitions |
| |
| SUSTAINABILITY INDICES |
| |
| |
| |
| |
| |
| |
| |
| |
| |
| |
| |
| |
| |
| |
| |
| |
| |
| |
| |
| |
| |
| |
| |
| |
Credit risk mitigation
According to the NIB Statutes, adequate credit enhancement is required in order to reduce credit risk in the Bank’s lending. Loans granted by the Bank are either secured or unsecured. The Bank seeks to mitigate the credit risk related to unsecured loans by including various covenants, undertakings, prepayment events and events of default in the loan documentation. The requirements vary depending on borrower type, tenor, and the amortisation profile of the loan.
Some of the Bank’s lending is secured by collateral or guaranteed by the parent of the borrower or a third party. The value of the collateral should preferably not be correlated with the creditworthiness of the borrower and there should be a functioning market for such assets.
The distribution of the Bank’s lending portfolio by type of credit enhancement at year-end 2022 is presented below, with further information available in Note 3: Segment information and Note 12: Loans outstanding and guarantee commitments.
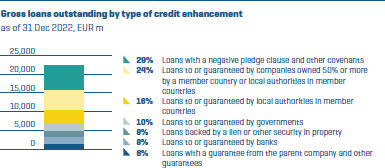
In its treasury operations, the Bank applies netting and collateralisation to mitigate counterparty credit risk related to derivatives and collateralised placements. The Bank undertakes swap transactions only with counterparties that meet the required minimum counterparty credit rating and have executed an International Swaps and Derivatives Association (ISDA) Master Agreement and signed a Credit Support Annex (CSA). Collateralised placements in the form of reverse repo transactions are made on the terms of the Global Master Repurchase Agreement (GMRA).
The ISDA master agreement allows for a single net settlement of all swap transactions covered by the agreement in the event of a counterparty default or early termination of the transactions. Netting is applied for the measurement of the Bank’s credit exposure only in cases when it is deemed to be legally valid and enforceable in the relevant jurisdiction. At year-end 2022, netting reduced the swap exposure by EUR 1,272 million from a gross total market value of EUR 1,881 million to EUR 609 million (2021: EUR 1,399 million and EUR 772 million, respectively).
The CSAs mitigate credit risk related to swaps. Swap positions are marked to market daily and the resulting positive exposures (receivable) exceeding agreed thresholds, if any, are collateralised by cash or, for certain counterparties, with high-quality government securities. Since 2016, NIB enters into two-way CSAs, which means that the Bank posts collateral when the market value of the swap position is negative (liability). At year-end 2022, the total swap exposure with counterparties with whom the Bank has a two-way CSA in place represented 99.8% of the Bank’s swaps measured by nominal value. The remainder (0.2%) was under one-way CSAs, whereby NIB is not required to post collateral for its swap liabilities.
At year-end 2022, the Bank held EUR 623 million (2021: EUR 748 million) in gross collateral received for swaps, of which EUR 623 million (2021: EUR 748 million) was in cash and EUR 0 million (2021: EUR 0 million) in securities (see Note 19: Collateral and commitments). The Bank had posted collateral of EUR 1,150 million (2021: EUR 400 million).
| | |
| | |
ANNUAL REPORT 2022 | | 119 |
| | |
|
| |
| INTRODUCTION |
| |
| IMPACT |
| |
| GOVERNANCE |
| |
| BOD REPORT |
| |
| FINANCIALS |
| |
Operating and financial review |
| |
Capital and liquidity management |
| |
u Financial statements and notes |
| |
Proposal by the Board of Directors |
| |
Auditor’s report |
| |
Report of the Control Committee Chairmanship |
| |
Report of the Control Committee |
| |
Ratio definitions |
| |
| SUSTAINABILITY INDICES |
| |
| |
| |
| |
| |
| |
| |
| |
| |
| |
| |
| |
| |
| |
| |
| |
| |
| |
| |
| |
| |
| |
| |
| |
Credit risk monitoring
The Bank puts strong emphasis on continuous monitoring of the credit risk development in its lending and treasury operations. Credit risk is monitored both at counterparty level and at portfolio levels (e.g. sector, country as well as total portfolio level). The primary responsibility for credit risk monitoring resides with the department/unit responsible for the client relationship i.e., Lending, Treasury and/or Special Credits. Risk & Compliance department independently controls and monitors the risk positions of the Bank and reports on regular basis to all relevant committees and decision-making bodies as needed.
All lending exposures are subject to continuous monitoring of contractual compliance and events or signals that could potentially lead to or indicate a material change in credit risk. In addition, an annual follow-up is conducted on the entire loan portfolio. The annual follow-up is presented to the Mandate, Credit and Compliance Committee and reported to the Board of Directors.
Treasury exposures are subject to continuous monitoring of events and market signals that could potentially lead to or indicate a material change in credit risk. The risk class of the counterparties are reassessed regularly. The follow-up is presented to the Mandate, Credit and Compliance Committee.
If a counterparty is identified as having seriously deteriorated debt repayment capacity and/ or a serious deterioration in its financial standing, it is placed on the watch-list and becomes subject to specific watch-list monitoring. Watch-listed counterparties are reviewed by the Mandate, Credit and Compliance Committee at agreed intervals and reported to the Board of Directors. If a credit exposure requires the expertise of specialists in workout and restructuring, it is transferred to the Special Credits function. The function’s primary objective is to take over responsibility for distressed loans from Lending and devote sufficient time and effort to such cases to ensure the Bank recovers as much as possible from distressed loans outstanding.
Credit risk monitoring at portfolio level includes, inter alia, an analysis of the aggregate credit risk exposure, credit risk concentrations and changes in the risk profile. The development is reported to the Asset, Liability and Risk Committee, the Executive Committee, and the Board of Directors.
Credit risk limits are changed from time to time depending on the available financial resources and changes in the risk appetite. The policy level risk limits are approved by the Board of Directors. Limit monitoring is conducted on a regular basis and breaches are reported to the relevant committees, senior management and to the Board of Directors.
Risk-based pricing
The Statutes stipulate that the Bank shall operate according to sound banking principles and aim for a profit allowing the formation of reserves and a reasonable return on capital. Loans and guarantees are priced to cover the Bank’s cost of funds, administration costs, the cost of risk involved in the transaction and the cost of capital employed. For loan pricing purposes, the Bank uses a pricing tool which calculates the minimum earnings required on a loan in order to cover all lending-related costs and an appropriate return for the level of risk assumed. Internal credit risk ratings and associated risk parameters, as well as the structure of the transaction, are key input factors in the pricing tool.
Credit risk exposure
Tables 1 to 3 below provide an overview of the Bank’s aggregate credit risk exposure at year-end 2022, distributed by expected loss (EL) ratings. Aggregate credit exposure comprises lending and treasury exposure. Lending exposure includes loans outstanding and loan commitments, without taking into account any collateral or other credit enhancement. Regarding the treasury exposure, capital market investments are included at nominal value, while derivatives are included at market value net of collateral. The exposure in reverse repo transactions is calculated as a fixed percentage of the nominal value of the transaction, thus reflecting the collateralised nature of these placements.
| | |
| | |
ANNUAL REPORT 2022 | | 120 |
| | |
|
| |
| INTRODUCTION |
| |
| IMPACT |
| |
| GOVERNANCE |
| |
| BOD REPORT |
| |
| FINANCIALS |
| |
Operating and financial review |
| |
Capital and liquidity management |
| |
u Financial statements and notes |
| |
Proposal by the Board of Directors |
| |
Auditor’s report |
| |
Report of the Control Committee Chairmanship |
| |
Report of the Control Committee |
| |
Ratio definitions |
| |
| SUSTAINABILITY INDICES |
| |
| |
| |
| |
| |
| |
| |
| |
| |
| |
| |
| |
| |
| |
| |
| |
| |
| |
| |
| |
| |
| |
| |
| |
TABLE 1. Credit risk exposure by internal rating based on expected loss (EL) (in EUR million)
| | | | | | | | | | | | | | | | | | | | | | | | | | |
Risk class | | S&P equivalent | | 31 December 2022 | | | 31 December 2021 | |
| | Lending | | | Treasury | | | Total | | | Lending | | | Treasury | | | Total | |
1–2 | | AAA/AA+ | | | 6,380 | | | | 7,829 | | | | 14,208 | | | | 7,090 | | | | 8,272 | | | | 15,362 | |
3–4 | | AA/AA- | | | 1,430 | | | | 1,787 | | | | 3,218 | | | | 1,570 | | | | 1,838 | | | | 3,408 | |
5–6 | | A+/A | | | 3,426 | | | | 1,171 | | | | 4,597 | | | | 2,840 | | | | 746 | | | | 3,587 | |
7–8 | | A-/BBB+ | | | 5,659 | | | | 217 | | | | 5,876 | | | | 5,839 | | | | 258 | | | | 6,097 | |
9–10 | | BBB/BBB- | | | 5,859 | | | | 157 | | | | 6,017 | | | | 5,369 | | | | 95 | | | | 5,463 | |
11–12 | | BB+/BB | | | 1,564 | | | | 0 | | | | 1,564 | | | | 763 | | | | 0 | | | | 763 | |
13–14 | | BB/BB- | | | 398 | | | | 0 | | | | 398 | | | | 498 | | | | 0 | | | | 498 | |
15–16 | | BB-/B+ | | | 70 | | | | 0 | | | | 70 | | | | 135 | | | | 0 | | | | 135 | |
17–18 | | B/B- | | | 10 | | | | 0 | | | | 10 | | | | 31 | | | | 0 | | | | 31 | |
19–20 | | B-/CCC | | | 4 | | | | 0 | | | | 4 | | | | 7 | | | | 0 | | | | 7 | |
D | | | | | 0 | | | | 0 | | | | 0 | | | | 0 | | | | 0 | | | | 0 | |
TOTAL | | | | | 24,800 | | | | 11,161 | | | | 35,962 | | | | 24,142 | | | | 11,209 | | | | 35,351 | |
| | | | | | | | | | | | | | | | | | | | | | | | | | | |
Class D | | | | | | | | | | | | | | | | | | | | | | | | | | |
Gross | | | | | 10 | | | | 0 | | | | 10 | | | | 76 | | | | 0 | | | | 76 | |
Impairment | | | | | 10 | | | | 0 | | | | 10 | | | | 76 | | | | 0 | | | | 76 | |
Net | | | | | 0 | | | | 0 | | | | 0 | | | | 0 | | | | 0 | | | | 0 | |
The quality of the Bank’s aggregate credit exposure remained sound in 2022. Lending exposure increased 3% compared to 2021. Close to 84% of disbursements were to investment-grade (EL 1-10) counterparties, which was largely driven by lending to the utilities, financials, and industrials. Treasury exposure remained at a similar level compared to previous year. At year-end 2022, 92% (2021: 94%) of lending exposure and 100% (2021: 100%) of the treasury exposure was in risk classes EL 1-10, corresponding to investment-grade quality. Exposure in risk class D (non-performing) was down to EUR 10 million (2021: EUR 76 million).
TABLE 2. Geographical distribution of the credit risk exposure (in EUR million)
| | | | | | | | | | | | | | | | | | | | | | | | |
| | | 31 December 2022 | | | 31 December 2021 | |
| Country/Region | | Lending | | | Treasury | | | Total | | | Lending | | | Treasury | | | Total | |
Denmark | | | 2,845 | | | | 1,833 | | | | 4,678 | | | | 2,302 | | | | 2,564 | | | | 4,866 | |
Estonia | | | 1,105 | | | | 35 | | | | 1,140 | | | | 993 | | | | 0 | | | | 993 | |
Finland | | | 4,789 | | | | 1,630 | | | | 6,419 | | | | 4,789 | | | | 1,362 | | | | 6,151 | |
Iceland | | | 672 | | | | 70 | | | | 742 | | | | 600 | | | | 59 | | | | 659 | |
Latvia | | | 845 | | | | 145 | | | | 990 | | | | 850 | | | | 115 | | | | 965 | |
Lithuania | | | 1,284 | | | | 100 | | | | 1,384 | | | | 1,321 | | | | 50 | | | | 1,371 | |
Norway | | | 5,350 | | | | 1,263 | | | | 6,613 | | | | 5,527 | | | | 1,095 | | | | 6,621 | |
Sweden | | | 7,208 | | | | 1,189 | | | | 8,398 | | | | 6,902 | | | | 1,146 | | | | 8,048 | |
Africa and Middle East | | | 14 | | | | 0 | | | | 14 | | | | 23 | | | | 0 | | | | 23 | |
Americas | | | 1 | | | | 1,215 | | | | 1,215 | | | | 13 | | | | 771 | | | | 784 | |
Asia-Pacific | | | 198 | | | | 106 | | | | 304 | | | | 224 | | | | 127 | | | | 352 | |
Europe | | | 310 | | | | 2,907 | | | | 3,218 | | | | 388 | | | | 2,912 | | | | 3,300 | |
Multilaterals | | | 177 | | | | 668 | | | | 846 | | | | 211 | | | | 1,007 | | | | 1,219 | |
Total | | | 24,800 | | | | 11,161 | | | | 35,962 | | | | 24,142 | | | | 11,209 | | | | 35,351 | |
In the context of the Bank’s mission, the credit risk exposure continued to be fairly well-balanced in terms of geographical distribution. At year-end 2022, the member countries accounted for 97% of the Bank’s lending exposure (2021: 96%). The largest lending exposures outside the member countries were in multilateral institutions, Poland and China. Of the treasury exposure, 56% (2021: 57%) was in the member countries, while the rest of Europe, excluding exposures to multilateral institutions, accounted for 26% (2021: 26%), dominated by Germany and France. Most of the treasury exposure outside Europe was in Canada.
| | |
| | |
ANNUAL REPORT 2022 | | 121 |
| | |
|
| |
| INTRODUCTION |
| |
| IMPACT |
| |
| GOVERNANCE |
| |
| BOD REPORT |
| |
| FINANCIALS |
| |
Operating and financial review |
| |
Capital and liquidity management |
| |
u Financial statements and notes |
| |
Proposal by the Board of Directors |
| |
Auditor’s report |
| |
Report of the Control Committee Chairmanship |
| |
Report of the Control Committee |
| |
Ratio definitions |
| |
| SUSTAINABILITY INDICES |
| |
| |
| |
| |
| |
| |
| |
| |
| |
| |
| |
| |
| |
| |
| |
| |
| |
| |
| |
| |
| |
| |
| |
| |
TABLE 3. Credit risk exposure by industry sector (in EUR million)
| | | | | | | | | | | | | | | | | | | | | | | | |
| | | 31 December 2022 | | | 31 December 2021 | |
Industry sector | | Lending | | | Treasury | | | Total | | | Lending | | | Treasury | | | Total | |
Energy | | | 0 | | | | 0 | | | | 0 | | | | 0 | | | | 0 | | | | 0 | |
Materials | | | 1,404 | | | | 0 | | | | 1,404 | | | | 1,225 | | | | 0 | | | | 1,225 | |
Industrials | | | 4,016 | | | | 59 | | | | 4,074 | | | | 3,652 | | | | 50 | | | | 3,702 | |
Consumer discretionary | | | 744 | | | | 8 | | | | 752 | | | | 459 | | | | 6 | | | | 466 | |
Consumer staples | | | 1,115 | | | | 88 | | | | 1,203 | | | | 1,309 | | | | 58 | | | | 1,367 | |
Health care | | | 608 | | | | 36 | | | | 644 | | | | 683 | | | | 33 | | | | 716 | |
Financials | | | 4,325 | | | | 5,859 | | | | 10,184 | | | | 3,772 | | | | 5,189 | | | | 8,961 | |
Information technology | | | 608 | | | | 21 | | | | 629 | | | | 589 | | | | 16 | | | | 605 | |
Telecommunication services | | | 456 | | | | 29 | | | | 485 | | | | 364 | | | | 24 | | | | 388 | |
Utilities | | | 4,808 | | | | 71 | | | | 4,879 | | | | 4,483 | | | | 58 | | | | 4,541 | |
Public sector | | | 6,717 | | | | 4,991 | | | | 11,708 | | | | 7,605 | | | | 5,775 | | | | 13,380 | |
Total | | | 24,800 | | | | 11,161 | | | | 35,962 | | | | 24,142 | | | | 11,209 | | | | 35,351 | |
The distribution of the lending exposure by industry sector remained stable in 2022 compared to the previous year, with the public sector, utilities, financial sector and industrials sectors together accounting for 80% (2021: 81%) of the total exposure. The Bank has defined limits for maximum exposure to a single industry measured by the economic capital requirement and total credit risk exposure in relation to the Bank’s equity. At year-end 2022, the Bank was in compliance with these limits.
TABLE 4. Largest counterparty exposures (% of total credit risk exposure)
| | | | | | | | |
| | | 31 December
2022 | | | 31 December
2021 | |
Top 5 | | | 10 | % | | | 12 | % |
Top 10 | | | 18 | % | | | 20 | % |
Top 20 | | | 29 | % | | | 32 | % |
The limits for large single counterparty exposures and for the aggregate of such large exposures are scaled to the Bank’s equity. Any deviations from the set limits must be approved by the Board of Directors. At year-end 2022, the Bank was within the aggregate limits set for large exposures.
| | |
| | |
ANNUAL REPORT 2022 | | 122 |
| | |
|
| |
| INTRODUCTION |
| |
| IMPACT |
| |
| GOVERNANCE |
| |
| BOD REPORT |
| |
| FINANCIALS |
| |
Operating and financial review |
| |
Capital and liquidity management |
| |
u Financial statements and notes |
| |
Proposal by the Board of Directors |
| |
Auditor’s report |
| |
Report of the Control Committee Chairmanship |
| |
Report of the Control Committee |
| |
Ratio definitions |
| |
| SUSTAINABILITY INDICES |
| |
| |
| |
| |
| |
| |
| |
| |
| |
| |
| |
| |
| |
| |
| |
| |
| |
| |
| |
| |
| |
| |
| |
| |
Market risk
The Bank defines market risk as the risk of valuation loss or reduction in the expected earnings stemming from adverse fluctuations in exchange rates, interest rates, credit spreads and cross-currency basis spreads.
Market risks predominantly arise from the Bank’s core business activities and the liquidity portfolio needed to support these activities. The Bank’s strategy is to obtain cost-efficient funding from diversified sources and provide lending that is tailored to the needs of its customers. This gives rise to foreign exchange risk and interest rate risk due to mismatches between the Bank’s assets and liabilities in terms of currency composition, maturity profile and interest rate characteristics. Cross-currency basis risk stems from the hedging techniques used by the Bank to mitigate foreign exchange risk deriving from funding and lending in different currencies. This risk reflects the liquidity charge for exchanging foreign currencies at a future point in time.
The Bank’s securities portfolio is exposed to interest rate risk and credit spread risk. Credit spread risk refers to the potential decline in market value due to perceived change in the credit quality of the issuers of the securities held in the portfolios.
Market risk management
The Bank manages market risks by hedging against foreign exchange risk and interest rate risk with the objective of protecting its earnings and the economic value of its assets and liabilities. Foreign exchange risk is practically fully hedged. Interest rate risk deriving from mismatches between funding and lending is kept at a modest level. The Bank’s tolerance for interest rate risk and credit spread risk pertains to the size, quality and earnings expectations set for the liquidity portfolio. As part of its structured funding transactions, the Bank may use financial instruments linked to other market risk factors than the above. Prerequisites for such transactions are that they should be completely hedged with derivatives and that the Bank is able to value these transactions and measure the risks involved in the derivatives. The Bank’s market risks are managed by Treasury. Risk & Compliance provides independent oversight of all significant market risks, supporting the Asset, Liability and Risk Committee and Treasury with risk measurement, analysis, daily monitoring and reporting.
TABLE 5. Foreign exchange rate risk (in EUR million)
| | | | | | | | | | | | |
| Net open positions | | Total
limit | | | 31 December 2022 | | | 31 December 2021 | |
USD | | | 6.00 | | | | 0.16 | | | | 1.22 | |
DKK | | | 3.00 | | | | 0.72 | | | | 0.44 | |
NOK | | | 3.00 | | | | 0.51 | | | | 0.27 | |
SEK | | | 3.00 | | | | 0.98 | | | | 0.20 | |
ISK | | | 1.00 | | | | 0.00 | | | | 0.00 | |
Other currencies, Total | | | 4.00 | | | | 1.26 | | | | 1.40 | |
The Statutes require that the Bank shall, to the extent practicable, protect itself against the risk of exchange rate losses.
Exchange rate risk is measured on the basis of net open positions in each currency. The limits set to restrict the overnight positions and the actual exposure as at year-end 2022 are presented in the above table. Note 23: Currency risk shows the net currency positions in the major currencies as of year-end 2022.
The Bank hedges foreign exchange risk with cross-currency basis swaps, which gives rise to currency basis risk. Changes in the currency basis have an impact on the mark-to-market valuation of the Bank’s swap portfolio. The overall valuation sensitivity to a one basis point shift across all currency basis curves was EUR 0.9 million at year-end 2022 (2021: EUR 0.8 million). The net sensitivity was driven by the net exposure to funding currencies (mostly euro/US dollar, euro/British pound and euro/AUD dollar) and the non-euro lending currencies (mainly euro/SEK krona, euro/NOK krone, and euro/Danish krone).
The Bank does not hedge future net interest income in foreign currency. Loans are provided primarily in euro, Nordic currencies and US dollars. There is a possibility that interest income in currencies other than the euro may cause some fluctuation in the Bank’s future net income in euro terms. However, at present the Bank expects that any such potential fluctuations in future cash flows from its current portfolio would be minor in relation to its total assets and equity.
| | |
| | |
ANNUAL REPORT 2022 | | 123 |
| | |
|
| |
| INTRODUCTION |
| |
| IMPACT |
| |
| GOVERNANCE |
| |
| BOD REPORT |
| |
| FINANCIALS |
| |
Operating and financial review |
| |
Capital and liquidity management |
| |
u Financial statements and notes |
| |
Proposal by the Board of Directors |
| |
Auditor’s report |
| |
Report of the Control Committee Chairmanship |
| |
Report of the Control Committee |
| |
Ratio definitions |
| |
| SUSTAINABILITY INDICES |
| |
| |
| |
| |
| |
| |
| |
| |
| |
| |
| |
| |
| |
| |
| |
| |
| |
| |
| |
| |
| |
| |
| |
| |
TABLE 6. Interest rate risk (in EUR million)
| | | | | | | | | | | | |
| | | Total gross
limit | | | 31 December
2022 | | | 31 December
2021 | |
| Sensitivity to 1bp change in interest rates | | | 1.80 | | | | 1.00 | | | | 0.86 | |
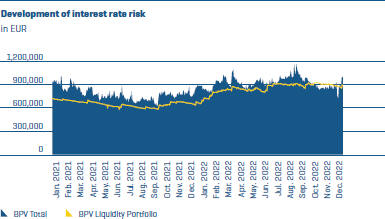
The Bank manages interest rate risk by using derivatives to convert fixed-rate funding into floating-rate liabilities. Fixed-rate lending that is not match-funded is converted to floating-rate receivables. This hedging approach ensures that the interest rate risk between lending and funding in each currency remains low. The majority of the Bank’s interest rate risk, therefore, stems from the portfolio of liquid assets.
The Bank measures and manages interest rate risk by estimating the sensitivity of the economic value of its balance sheet to an interest rate shock. The sensitivity is measured by means of basis point value (BPV), quantifying the impact of an interest rate change of one basis point on the present value of interest-bearing assets and liabilities.
Limits have been set for the acceptable exposure to interest rate risk, both at an aggregate balance sheet level and at portfolio level. A gross limit equivalent to EUR 1.8 million covering all currencies restricts the BPV interest rate risk to 0.04 per cent of the Bank’s equity. In addition, individual BPV limits have been set for interest rate risk in EUR, USD and the Nordic currencies, whereas a combined limit applies for all other currencies.
| | |
| | |
ANNUAL REPORT 2022 | | 124 |
| | |
|
| |
| INTRODUCTION |
| |
| IMPACT |
| |
| GOVERNANCE |
| |
| BOD REPORT |
| |
| FINANCIALS |
| |
Operating and financial review |
| |
Capital and liquidity management |
| |
u Financial statements and notes |
| |
Proposal by the Board of Directors |
| |
Auditor’s report |
| |
Report of the Control Committee Chairmanship |
| |
Report of the Control Committee |
| |
Ratio definitions |
| |
| SUSTAINABILITY INDICES |
| |
| |
| |
| |
| |
| |
| |
| |
| |
| |
| |
| |
| |
| |
| |
| |
| |
| |
| |
| |
| |
| |
| |
| |
TABLE 7. Credit spread risk (in EUR million)
| | | | | | | | | | | | |
| | | | |
| | | Total limit | | | 31 December
2022 | | | 31 December
2021 | |
| | | |
| Sensitivity to 1bp change in credit spreads | | | 3.20 | | | | 2.22 | | | | 2.20 | |
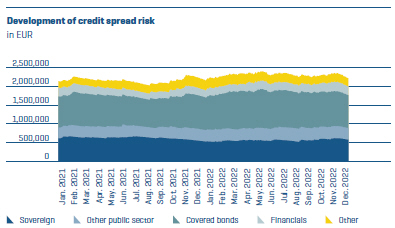
The Bank manages its exposure to credit spread risk by measuring the sensitivity of its portfolios of marketable securities to credit spread movements. The sensitivity is measured by means of Credit Spread Basis Point Value (Spread BPV), quantifying the impact of a one basis point increase in credit spreads on the present value of the assets.
Limits have been defined to restrict the decrease in asset value to an acceptable level in accordance with the Bank’s willingness to accept risk in its liquidity portfolio and in the portfolio of labelled bond investments. The Bank has set an overall limit of EUR 3.2 million for credit spread risk, with specific sub-limits defined for various asset classes. To ensure that the liquidity portfolio maintains its market value and liquidity under severe market conditions, the assets in the portfolio must satisfy minimum rating requirements and other quality criteria.
Liquidity risk
Liquidity risk is defined as the risk of incurring losses due to an inability to meet payment obligations in a timely manner when they become due. The Bank categorises liquidity risk into funding liquidity risk, which occurs when payment obligations cannot be fulfilled because of an inability to obtain new funding, and market liquidity risk, which occurs when the Bank is unable to sell or transform assets in the liquidity buffer into cash without significant losses.
Liquidity risk management
The Bank’s business model gives rise to liquidity risk mainly through maturity mismatches between assets (loans and treasury investments) and liabilities (borrowing and equity). The liquidity position and adherence to exposure limits is managed by Treasury and monitored by Risk & Compliance on a daily basis.
The Asset, Liability and Risk Committee oversees the development of the Bank’s funding and liquidity positions and decides on liquidity risk-related matters in accordance with its mandate. The Board of Directors receives regular reports on the funding and liquidity situation of the Bank.
The key metric applied for managing liquidity risk is the survival horizon, which measures how long the Bank would be able to fulfil its payment obligations in a severe stress scenario. The target value for this metric is twelve months, the Board of Directors minimum accepted value is nine months, while the Bank’s Statutes require a minimum of six months. The stress scenario includes, among other things, the assumption of payment disruptions in the loan portfolio, no access to market funding, early termination of all callable funding transactions, collateral provided for swap exposure and severe decline of asset value in the liquidity buffer. At year-end 2022, the survival horizon was 417 days (2021: 450 days).
In addition, the Bank requires that the liquidity position should be strong enough to maintain the highest possible issuer credit rating by S&P (AAA) and Moody’s (Aaa) and fulfil the liquidity coverage ratio (LCR) and net stable funding ratio (NSFR) requirements as set in the Liquidity Policy and defined in the European banking sector regulations and standards. At year-end 2022 the LCR was 1,176% (2021: 5,162%) and the NFSR 164% (2021: 160%).
| | |
| | |
ANNUAL REPORT 2022 | | 125 |
| | |
|
| |
| INTRODUCTION |
| |
| IMPACT |
| |
| GOVERNANCE |
| |
| BOD REPORT |
| |
| FINANCIALS |
| |
Operating and financial review |
| |
Capital and liquidity management |
| |
u Financial statements and notes |
| |
Proposal by the Board of Directors |
| |
Auditor’s report |
| |
Report of the Control Committee Chairmanship |
| |
Report of the Control Committee |
| |
Ratio definitions |
| |
| SUSTAINABILITY INDICES |
| |
| |
| |
| |
| |
| |
| |
| |
| |
| |
| |
| |
| |
| |
| |
| |
| |
| |
| |
| |
| |
| |
| |
| |
The Bank’s liquidity buffer comprises unencumbered cash, deposits and securities denominated in EUR, USD and the Nordic currencies. In order to ensure that the market value and liquidity of the buffer is preserved during adverse market conditions, the Bank has set strict rules for the composition of the buffer. As such, the buffer must include a minimum level of High Quality Liquid Assets (HQLA) as defined in the European banking sector regulations and a minimum level of assets in the internal rating categories corresponding to at least AA- from S&P and Aa3 from Moody’s. Furthermore, the buffer must comprise a minimum share of assets eligible as repo collateral in central banks. The Bank does not have direct access to central bank repo facilities but can repo its bond securities via intermediating banks.
The maturity profile of the liquidity buffer is structured to fulfil the Bank’s requirement that the expected net cash outflow during the next three months must be covered by maturing investments in the liquidity buffer.
TABLE 8. Composition of the liquidity buffer
| | | | | | | | | | | | | | | | |
| | | 31 December 2022 | | | 31 December 2021 | |
| | | EUR million | | | % | | | EUR million | | | % | |
| Cash and cash equivalents | | | 1,060 | | | | 8% | | | | 722 | | | | 5% | |
| Securities issued or guaranteed by sovereigns, public sector entities and supranational institutions | | | 4,321 | | | | 32% | | | | 5,336 | | | | 40% | |
| Covered bonds | | | 3,582 | | | | 27% | | | | 3,569 | | | | 27% | |
| Securities issued by financial institutions, excluding covered bonds | | | 1,261 | | | | 9% | | | | 1,252 | | | | 9% | |
| Securities issued by corporates | | | 298 | | | | 2% | | | | 248 | | | | 2% | |
| Securities received as collateral | | | 2,959 | | | | 22% | | | | 2,172 | | | | 16% | |
| Total liquidity buffer | | | 13,481 | | | | 100% | | | | 13,299 | | | | 100% | |
Diversification is a key objective of the Bank’s funding and liquidity management. The Bank strives to diversify its borrowing in terms of currencies, maturities, instruments, and investor types in order to avoid excessive reliance on individual markets or funding sources. Through regular benchmark issues, the Bank aims to secure broad market access. The annual funding plan is based on the projected twelve-month liquidity requirement and the projected size of the liquidity buffer. The funding plan is regularly adjusted to reflect changes in the liquidity requirement.
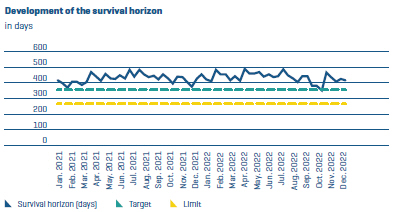
The following graph shows the maturity profile of liquid assets and the annual scheduled payments on loans outstanding compared to payments on the Bank’s funding. Payments on loans outstanding are shown until the contractual maturity of the loans. Repayment of funding is shown until the first possible early repayment date, taking into account the cash flow from associated swaps. Short-term amounts owed to credit institutions predominantly comprise cash collateral received from swap counterparties, while collateral given represents the cash collateral posted to swap counterparties. A breakdown of the Bank’s financial assets and liabilities by maturity at year-end 2022 is presented in Note 21: Maturity profile of financial assets and liabilities.
| | |
| | |
ANNUAL REPORT 2022 | | 126 |
| | |
|
| |
| INTRODUCTION |
| |
| IMPACT |
| |
| GOVERNANCE |
| |
| BOD REPORT |
| |
| FINANCIALS |
| |
Operating and financial review |
| |
Capital and liquidity management |
| |
u Financial statements and notes |
| |
Proposal by the Board of Directors |
| |
Auditor’s report |
| |
Report of the Control Committee Chairmanship |
| |
Report of the Control Committee |
| |
Ratio definitions |
| |
| SUSTAINABILITY INDICES |
| |
| |
| |
| |
| |
| |
| |
| |
| |
| |
| |
| |
| |
| |
| |
| |
| |
| |
| |
| |
| |
| |
| |
| |

Operational risk
The Bank defines operational risk as the risk of direct or indirect losses or damaged reputation due to risk events attributable to technology, people, processes, procedures or physical arrangements and/or external events.
Operational risk management
NIB’s operational risk management focuses on proactive measures to ensure operational resilience, information security, the accuracy of information used internally and reported externally, the expertise and integrity of the Bank’s personnel and its adherence to established rules and procedures, as well as on security arrangements to protect the physical and information assets of the Bank, its personnel and processes.
The Bank’s Operational Risk Policy is set by the Board of Directors. The Policy is complemented by an Operational Risk Guideline comprising the guiding principles for the identification, assessment, monitoring and control of operational risks the Bank faces or may face. In day-to-day operations, the three-lines-of-defence model ensures accountability and defines the roles and responsibilities for operational risk management for all processes across the organisation. Emphasis is also put on increasing risk awareness of the Bank’s personnel.
Risks are identified and their impact assessed by the various functions for their respective fields of expertise in risk assessments, such as the new product and process approval process. Focus is placed on identifying key risks and risk mitigation in order to ensure compliance with the Bank’s policies and guidelines. Operational risks are also identified through analysis of results obtained from the Bank’s operational risk event reporting system. No material financial losses were incurred as a result of operational risks actualising during the year.
As a result of the escalation of war in Ukraine, NIB’s operational risk management has intensified by way of monitoring changes in the Bank’s threat landscape and taking proactive mitigation measures. This includes facilities security, travel safety and addressing the risk of both targeted and indirect cyber threats.
During 2022, the Bank’s management of third-party risks was improved, alongside changes to the risk classification and monitoring practices.
| | |
| | |
ANNUAL REPORT 2022 | | 127 |
| | |
|
| |
| INTRODUCTION |
| |
| IMPACT |
| |
| GOVERNANCE |
| |
| BOD REPORT |
| |
| FINANCIALS |
| |
Operating and financial review |
| |
Capital and liquidity management |
| |
u Financial statements and notes |
| |
Proposal by the Board of Directors |
| |
Auditor’s report |
| |
Report of the Control Committee Chairmanship |
| |
Report of the Control Committee |
| |
Ratio definitions |
| |
| SUSTAINABILITY INDICES |
| |
| |
| |
| |
| |
| |
| |
| |
| |
| |
| |
| |
| |
| |
| |
| |
| |
| |
| |
| |
| |
| |
| |
| |
Compliance risk
The Bank defines integrity risk as the risk of legal or regulatory sanctions, material financial loss, or loss to reputation that NIB may suffer as a result of its failure to comply with those laws, regulations, rules, self-regulatory organisation standards and codes of conduct concerning market conduct and transparency standards, managing conflicts of interest, sanctions compliance, and the prevention of money laundering, terrorist financing, market abuse, corruption and fraud.
The Bank is committed to following international best practices and market standards in the areas of accountability, governance, corporate social responsibility, transparency and business ethics. Consequently, the Bank’s policies draw upon relevant market standards; in particular the International Financial Institutions’ Uniform Framework for Preventing and Combating Fraud and Corruption, which the Bank has endorsed.
The integrity of its own activities and of its staff is governed through the Bank’s Code of Conduct, which sets the values and ethical standards expected from staff. The Code covers topics such as conflicts of interests, gifts, hospitality, trading limitations and perquisite positions.
Further, NIB places particular emphasis on mitigating the risk of engaging with parties and projects that are, or potentially could be, associated with corruption, fraud, money laundering or the financing of terrorism. This is achieved through investing significant efforts in the Integrity Due Diligence (IDD) applicable to customers and counterparties. The IDD aims at identifying any integrity or reputational risk indicators of entities that have a reputation of engaging in illegal or
unethical behaviour. During the past year, NIB updated its IDD policy and procedures to enhance its risk-based approach in managing NIB’s portfolio and engagements as well as to incorporate current IFI due diligence standards.
Allegations of fraud, corruption, collusion or any other Prohibited Practices related to the Bank’s projects and allegations of Misconduct by staff are investigated following a preliminary assessment of the allegation. The investigations are conducted by the Integrity and Compliance Office (ICO), which issues a findings report that is presented for decision to the President (for cases related to staff) or to the Sanctions Panel (for cases related to other parties). In 2022, no new investigations were initiated, and no sanctions decisions were issued.
ICO oversees and coordinates matters relating to integrity and reputational risks and provides independent expert advice to staff, management and the Board of Directors in integrity matters. This year, ICO devoted significant efforts in supporting NIB’s response to the sanctions issued by the EU and other relevant sanctions issuing bodies following the escalation of the war in Ukraine.
The Chief Compliance Officer (CCO) reports to the Chief Risk Officer with a dotted reporting line to the President as well as unrestricted access to the chairpersons of the Board of Directors and the Control Committee. The CCO regularly reports to the Board of Directors and the Control Committee. The CCO is also the appointed Data Protection Officer (DPO), who monitors the processing of personal data within NIB and acts as the contact point for data subjects in matters regarding the processing of their personal data.
Once a year, ICO publishes its Integrity Report, which is available on the Bank’s website.
| | |
| | |
ANNUAL REPORT 2022 | | 128 |
| | |
|
| |
| |
| |
| INTRODUCTION |
| |
| IMPACT |
| |
| GOVERNANCE |
| |
| BOD REPORT |
| |
| FINANCIALS |
| |
Operating and financial review |
| |
Capital and liquidity management |
| |
u Financial statements and notes |
| |
Proposal by the Board of Directors |
| |
Auditor’s report |
| |
Report of the Control Committee Chairmanship |
| |
Report of the Control Committee |
| |
Ratio definitions |
| |
| SUSTAINABILITY INDICES |
| |
| |
| |
| |
| |
| |
| |
| |
| |
| |
| |
| |
| |
| |
| |
| |
| |
| |
| |
| |
| |
| |
Note 3: Segment information
Operating segments
Operating segments are reported in a manner consistent with the internal reporting provided to the chief operating decision maker (“CODM”), who is responsible for allocating resources and assessing the performance of the operating segments. The CODM at NIB is the President. Segment results that are reported to the management include items directly attributable to that segment as well as other items allocated on a reasonable basis. In its segment reporting, NIB divides its operations into two major segments: lending and treasury operations. Treasury operations consist of Asset and Liability Management (liquidity management, collateral management, funding operations) and Portfolio Management.
| | | | | | | | | | | | | | | | | | | | |
2022 | | | | | | | | | | | | | | | | | | | | |
In thousands of euro | | | Lending total | | | | Asset and liability management | | | | Portfolio management | | | | Treasury total | | | | Total | |
Net interest income | | | 166,912 | | | | 19,683 | | | | 32,677 | | | | 52,360 | | | | 219,272 | |
Commission income and fees received | | | 8,409 | | | | 396 | | | | - | | | | 396 | | | | 8,805 | |
Commission expense and fees paid | | | -19 | | | | -1,992 | | | | -2 | | | | -1,994 | | | | -2,012 | |
Net profit on financial operations | | | -13,325 | | | | 4,964 | | | | -29,136 | | | | -24,172 | | | | -37,497 | |
Foreign exchange gains and losses | | | - | | | | -214 | | | | - | | | | -214 | | | | -214 | |
Administrative expenses | | | -29,615 | | | | -11,685 | | | | -5,008 | | | | -16,693 | | | | -46,308 | |
Depreciation | | | -2,269 | | | | -2,828 | | | | -1,212 | | | | -4,039 | | | | -6,308 | |
Net loan losses | | | 3,536 | | | | - | | | | - | | | | 0 | | | | 3,536 | |
Profit/loss for the year | | | 133,629 | | | | 8,324 | | | | -2,680 | | | | 5,644 | | | | 139,273 | |
| | | | | | | | | | | | | | | | | | | | |
2021 | | | | | | | | | | | | | | | | | | | | |
In thousands of euro | | | Lending total | | | | Asset and liability management | | | | Portfolio management | | | | Treasury total | | | | Total | |
Net interest income | | | 162,443 | | | | 22,205 | | | | 16,745 | | | | 38,951 | | | | 201,393 | |
Commission income and fees received | | | 9,003 | | | | 195 | | | | — | | | | 195 | | | | 9,199 | |
Commission expense and fees paid | | | -48 | | | | -2,108 | | | | -9 | | | | -2,117 | | | | -2,165 | |
Net profit on financial operations | | | 4,852 | | | | -37,955 | | | | 9,440 | | | | -28,515 | | | | -23,663 | |
Foreign exchange gains and losses | | | — | | | | 13 | | | | — | | | | 13 | | | | 13 | |
Administrative expenses | | | -27,652 | | | | -10,007 | | | | -4,289 | | | | -14,295 | | | | -41,948 | |
Depreciation | | | -6,116 | | | | -2,400 | | | | -1,029 | | | | -3,429 | | | | -9,545 | |
Net loan losses | | | 25,874 | | | | — | | | | — | | | | 0 | | | | 25,874 | |
Profit/loss for the year | | | 168,356 | | | | -30,056 | | | | 20,859 | | | | -9,197 | | | | 159,158 | |
| | |
| | |
ANNUAL REPORT 2022 | | 129 |
| | |
|
| |
| INTRODUCTION |
| |
| IMPACT |
| |
| GOVERNANCE |
| |
| BOD REPORT |
| |
| FINANCIALS |
| |
Operating and financial review |
| |
Capital and liquidity management |
| |
u Financial statements and notes |
| |
Proposal by the Board of Directors |
| |
Auditor’s report |
| |
Report of the Control Committee Chairmanship |
| |
Report of the Control Committee |
| |
Ratio definitions |
| |
| SUSTAINABILITY INDICES |
| |
| |
| |
| |
| |
| |
| |
| |
| |
| |
| |
| |
| |
| |
| |
| |
| |
| |
| |
| |
| |
| |
| |
| |
Geographical segments
The table below is based on the region where the borrowers reside, according to the domicile of the borrower’s group headquarters.
Net Interest Income
| | | | | | | | |
| In thousands of euro | | 2022 | | | 2021 |
| Member countries | | | | | | | | |
| Denmark | | | 18,997 | | | | 14,023 | |
| Estonia | | | 3,130 | | | | 2,791 | |
| Finland | | | 36,646 | | | | 36,974 | |
| Iceland | | | 7,298 | | | | 6,611 | |
| Latvia | | | 3,244 | | | | 2,582 | |
| Lithuania | | | 5,822 | | | | 6,932 | |
| Norway | | | 32,052 | | | | 31,329 | |
| Sweden | | | 56,323 | | | | 54,901 | |
| Total, member countries | | | 163,513 | | | | 156,142 | |
| | | | | | | | | |
| Non-member countries | | | | | | | | |
| Africa | | | 114 | | | | 159 | |
| Asia | | | 384 | | | | 707 | |
| Europe and Eurasia | | | 2,368 | | | | 4,253 | |
| Americas | | | 500 | | | | 1,105 | |
| Middle East | | | 32 | | | | 76 | |
| Total, non-member countries | | | 3,399 | | | | 6,301 | |
| Total, net interest income from lending | | | 166,912 | | | | 162,443 | |
Lending Operations
Mission and mandate
The mission of NIB, as currently defined, is to promote sustainable growth of its Member countries by providing long-term complementary financing, based on sound banking principles, to projects that strengthen productivity and/or enhance the environment. NIB fulfils this
mandate by providing financing in the form of loans and guarantees for activities in which NIB can add value and complement other financing sources. Moreover, NIB assesses the environmental aspect of all its financing.
Regarding NIB’s lending outside the Member countries, an agreement is generally required regarding the recipient country’s recognition of NIB as a legal person under public international law and as having legal capacity under the national law of the country in question as well as recognition of NIB’s status as an IFI. The Bank follows a policy similar to that of other international financial institutions concerning the debt service obligations of its borrowers. Therefore, the Bank has not participated in any debt rescheduling of sovereign debt.
Loans may be granted for both public and private projects. A loan will not be made, nor a guarantee provided, if opposed by the government of the country in which the related project is located. The Bank has a number of processes in place for assessing the eligibility of the projects. The Bank applies a mandate-rating tool as well as a sustainability policy to ensure that its financing fulfils the objectives and mission of the Bank. In addition, the Bank has an integrity due diligence procedure in relation to its granting of loans.
Lending Categories
The Bank previously had two main categories of lending: ordinary lending and lending under Special Programs. Lending under special programs comprised Project Investment Loans (PIL) and Environmental Investment Loans (MIL). Under the new statutes that came into force during 2020 these special programs were discontinued. The outstanding amounts under the PIL and MIL facilities became part of NIB’s ordinary lending, and new lending of this type since the statutes change, now constitutes ordinary lending.
Investing in green bonds, social bonds, sustainability bonds, sustainability-linked and Treasury corporate bonds issued by companies or municipalities in the Bank’s member countries is also part of NIB’s lending operations. The investments are used to finance environmentally sustainable projects that can contribute to mitigating climate change and achieve positive social outcomes in the Nordic-Baltic region. At the end of 2022, the Bank held lending labelled bonds and CPs of EUR 455 (337) million at fair value recorded in debt securities. For more information see Note 12: Loans outstanding and guarantee commitments.
| | |
| | |
ANNUAL REPORT 2022 | | 130 |
| | |
|
| |
| INTRODUCTION |
| |
| IMPACT |
| |
| GOVERNANCE |
| |
| BOD REPORT |
| |
| FINANCIALS |
| |
Operating and financial review |
| |
Capital and liquidity management |
| |
u Financial statements and notes |
| |
Proposal by the Board of Directors |
| |
Auditor’s report |
| |
Report of the Control Committee Chairmanship |
| |
Report of the Control Committee |
| |
Ratio definitions |
| |
| SUSTAINABILITY INDICES |
| |
| |
| |
| |
| |
| |
| |
| |
| |
| |
| |
| |
| |
| |
| |
| |
| |
| |
| |
| |
| |
| |
| |
| |
Treasury Operations
Assets and Liability Management
Liquidity Management
NIB’s liquidity policy is based on stress testing and incorporates recommendations from Basel III (published by the Basel Committee on Banking Supervision), EU directives and the rating methodologies used by rating agencies. The policy includes a survival horizon that measures the period the Bank is able to meet all its payment obligations arising from ongoing business operations during a severe stress scenario. The Bank has a statutory liquidity survival horizon of 180 days, however the operational target is to maintain it at least 365 days. At the end of 2022, NIB calculated its survival horizon as 417 days (450 days).
To mitigate liquidity risk, the Bank maintains a liquidity buffer that is mainly invested in EUR, but also in the USD, the Nordic and other currencies. At the end of 2022, the liquidity buffer, which also included cash and securities received from swap counterparties to mitigate counterparty credit risk, amounted to EUR 13,481 (13,299) million. Of this, EUR 5,305 (5,279) million was held as cash and short-term money market instruments 39% (40%), and EUR 8,176 (8,021) million was held in securities 61% (60%). In order to minimize market value volatility and liquidity risk under severe market conditions, the liquidity buffer must fulfil quality requirements stipulated in the liquidity policy. At the end of 2022, 86% (89%) of the liquidity buffer was invested in high quality liquidity assets (HQLA), 86% (88%) was eligible as collateral for securities repurchase transactions or repos at one or several central banks, and 90% (93%) of the assets belonged to the Bank’s top four internal rating categories. In addition, the Bank fulfils the liquidity coverage ratio (LCR) and net stable funding ratio (NSFR) requirements as specified in the Capital Requirements Regulation of the European Union. Under the objective of achieving additional earnings, part of the liquidity is invested in longer-term, high quality assets. For further information see Note 2: Risk management.
Collateral Management
The Bank receives collateral from its counterparties in order to mitigate counterparty risk arising from derivative transactions. The Bank has bilateral credit support agreements with its derivative counterparties which requires a higher liquidity buffer as the Bank also needs to post collateral, mainly EUR cash holdings, with its swap counterparties. For further information in this regard, see Note 2: Risk management.
The amount of cash collateral held at year-end 2022 was EUR 689 (752) million and the amount of cash collateral posted amounted to EUR 1,150 (400) million. For further information regarding received collateral at year-end, please refer to Note 19: Collateral and commitments.
Funding Operations
The Bank’s primary source of funding is through the issuance of bonds on the international capital market. The objective is to raise advantageous funds to the benefit of the Bank’s customers. The Bank seeks to take advantage of favourable market conditions, adapting its borrowing operations to investor preferences in terms of currency, maturity, liquidity and structures. Within this strategy, a diversified funding base and the risks involved in the structure and complexity are considered as well.
Furthermore, potential mismatches between the terms of the funding and lending transactions are taken into consideration. To this extent, the proceeds from the issues are converted in the derivatives markets to best manage the Bank’s foreign exchange, interest rate and refinancing risks.
Most of NIB’s medium and long-term borrowing is conducted under its borrowing programs. At year-end 2022 the Bank had the following active programs:
| • | | the Euro Medium Term Note Program (the “EMTN Program”), the program amount was changed in 2021 to unlimited on the total aggregate principal amount of bonds which may be issued or outstanding at any time under the program, |
| • | | the U.S. Medium Term Note Series D Program registered with the U.S. Securities and Exchange Commission (the “U.S. MTN Program”), with a ceiling of USD 20 billion, and |
| • | | the Australian and New Zealand Dollar Domestic Medium Term Note Program with a current ceiling of AUD 8 billion. |
| | |
| | |
ANNUAL REPORT 2022 | | 131 |
| | |
|
| |
| INTRODUCTION |
| |
| IMPACT |
| |
| GOVERNANCE |
| |
| BOD REPORT |
| |
| FINANCIALS |
| |
Operating and financial review |
| |
Capital and liquidity management |
| |
u Financial statements and notes |
| |
Proposal by the Board of Directors |
| |
Auditor’s report |
| |
Report of the Control Committee Chairmanship |
| |
Report of the Control Committee |
| |
Ratio definitions |
| |
| SUSTAINABILITY INDICES |
| |
| |
| |
| |
| |
| |
| |
| |
| |
| |
| |
| |
| |
| |
| |
| |
| |
| |
| |
| |
| |
| |
| |
| |
During 2022, NIB borrowed EUR 9,630 (7,028) million by means of 111 transactions in 12 different currencies. EUR 6,065 (4,158) million of this total came from 93 transactions under the EMTN Program. Under the U.S. MTN Program, NIB issued 8 transactions, of which two were global benchmark issuances in the amount of USD 1.25 billion each. During 2021, NIB issued 59 transactions under the EMTN Program and three transactions under the U.S. MTN Program, which were global benchmark issuances in the amount of USD 1.0 billion and 1.25 billion, respectively and an inaugural bond of USD 700 million linked to the SOFR index.
The weighted average maturity for NIB’s borrowing operations in 2022 was 4.3 years, compared with 4.4 years in 2021. Of debt securities outstanding, the amount of EUR 3,238 (2,039) million is at floating interest rates, while EUR 30,325 (29,194) million is at fixed interest rates which is mainly swapped to floating rate.
NIB may issue notes as part of NIB’s Environmental Bond (“NEB”) program. NIB has established an internal framework that allows for the funds raised through issuances of NEB to be directed to its environmental lending in NIB’s member countries and EU countries. Lending projects are eligible under the framework if they satisfy strict internal environmental criteria. Payment of principal and interest on such notes is made solely on the credit standing of NIB as a single institution and is not directly linked to the performance of environmental lending projects. Accordingly, such notes neither constitute “asset-backed” securities, nor are they otherwise credit-linked to any of NIB’s environmental lending projects. NIB Environmental Bonds can be issued under any of NIB’s debt issuance programs.
At year-end 2022, the Bank had a total of EUR 5,038 (4,819) million outstanding in NIB Environmental Bonds. During 2022, NIB’s total Environmental Bond issuance surpassed EUR 1 billion – a record-high amount over a course of one year since NIB started issuing environmental bonds in 2011. The issuance consisted of a seven-year EUR 500 million bond, an inaugural eight-year DKK 2 billion bond, a five-year SEK 2 billion bond and an increase of NOK 1 billion to a five-year bond. During 2021, NIB issued three NIB Environmental Bonds under its environmental framework, totalling EUR 898 million.
For the years 2022 and 2021, the Board of Directors of the Bank has authorized the Bank to raise medium and long- term borrowings in an aggregate amount of up to EUR 10.0 billion and EUR 8.0 billion respectively.
NIB has a Euro Commercial Paper Program (“ECP Program”) with a ceiling of EUR 2 billion. In addition to borrowings under this program and through short-term transactions under the EMTN Program, NIB can obtain short-term funds in the interbank market through money market loans and through repo transactions. These transactions are undertaken in most of the currencies listed in Note 16: Debts evidenced by certificates and swaps.
For the years 2022 and 2021, the Board of Directors has authorized the Bank to raise short-term funding, provided that the outstanding amount at any one time in each of these years does not exceed EUR 3.0 billion.
NIB had no commercial paper outstanding under the ECP Program at year-ends 2022 and 2021.
Portfolio Management
The Bank’s portfolio management deals with the management of that portion of NIB’s liquidity that is invested in longer term securities. Two types of portfolios have been established: (1) a portfolio with security investments measured at amortized cost issued by highly rated issuers and (2) actively managed portfolios measured at fair value. The return from the portfolios continues to contribute to NIB’s total results and are at any point in time impacted by the yield environment. NIB has signed the United Nations Principles for Responsible Investment (PRI), in which NIB has committed to incorporate environmental, social and governance factors in its investment and ownership decisions.
The actively managed portfolios contribute to NIB’s results through active yield curve and duration management strategies using fixed income derivatives as well as security investments.
For information regarding accounting treatment and volumes of NIB’s financial placements as of December 31, 2022, please refer to Note 11: Debt securities. The volume of outstanding derivatives as of December 31, 2022 are set forth in Note 24: Derivatives held for Risk Management and hedge accounting.
| | |
| | |
ANNUAL REPORT 2022 | | 132 |
| | |
|
| |
| INTRODUCTION |
| |
| IMPACT |
| |
| GOVERNANCE |
| |
| BOD REPORT |
| |
| FINANCIALS |
| |
Operating and financial review |
| |
Capital and liquidity management |
| |
u Financial statements and notes |
| |
Proposal by the Board of Directors |
| |
Auditor’s report |
| |
Report of the Control Committee Chairmanship |
| |
Report of the Control Committee |
| |
Ratio definitions |
| |
| SUSTAINABILITY INDICES |
| |
| |
| |
| |
| |
| |
| |
| |
| |
| |
| |
| |
| |
| |
| |
| |
| |
| |
| |
| |
| |
| |
| |
| |
Note 4: Net interest income
| | | | | | | | |
In thousands of euro | | | 2022 | | | | 2021 | |
| Interest income | | | | | | | | |
| Cash and cash equivalents | | | 2,761 | | | | -17,446 | |
| Long-term placements with credit institutions | | | -346 | | | | -17,024 | |
| Debt securities | | | 59,382 | | | | 33,515 | |
| Loans outstanding | | | 354,938 | | | | 201,862 | |
| Other interest income | | | 153 | | | | 341 | |
| Total, interest income | | | 416,889 | | | | 201,248 | |
| Of which, interest income from financial assets measured at amortised cost | | | 365,505 | | | | 197,089 | |
| Interest expense | | | | | | | | |
| Short-term amounts owed to credit institutions | | | -216 | | | | 7,686 | |
| Short-term repurchase agreements | | | -30 | | | | - | |
| Debts evidenced by certificates | | | -514,049 | | �� | | -382,637 | |
| Swap contracts and other interest expenses, net | | | 316,678 | | | | 375,096 | |
| Total, interest expense | | | -197,617 | | | | 145 | |
| Of which, interest expense from financial liabilities measured at amortised cost | | | -318,612 | | | | -12,147 | |
| Net interest income | | | 219,727 | | | | 201,393 | |
Interest income and expense includes amounts from related parties as described in Note 25: Related party disclosures.
Note 5: Commission income and fees received
| | | | | | | | |
In thousands of euro | | | 2022 | | | | 2021 | |
| Commitment fees | | | 4,262 | | | | 3,652 | |
| Loan disbursement fees | | | 2,989 | | | | 4,649 | |
| Early repayment fees | | | 1,290 | | | | 702 | |
| Commissions on lending of securities | | | 263 | | | | 195 | |
| Total | | | 8,805 | | | | 9,199 | |
Note 6: Net profit/loss on financial operations
| | | | | | | | |
In thousands of euro | | | 2022 | | | | 2021 | |
| Financial instruments measured at fair value, realised gains and losses | | | 10,613 | | | | 4,776 | |
| Financial instruments measured at fair value, unrealised gains and losses | | | -40,003 | | | | 9,169 | |
| Financial instruments measured at amortised cost, realised gains and losses | | | -5,741 | | | | 34 | |
| | |
| Expected credit loss on financial placements | | | -1,309 | | | | 323 | |
| Hedge accounting ineffectiveness | | | -1,058 | | | | -37,966 | |
| Net profit/loss on financial operations | | | -37,497 | | | | -23,663 | |
| | |
| | |
ANNUAL REPORT 2022 | | 133 |
| | |
|
| |
| INTRODUCTION |
| |
| IMPACT |
| |
| GOVERNANCE |
| |
| BOD REPORT |
| |
| FINANCIALS |
| |
Operating and financial review |
| |
Capital and liquidity management |
| |
u Financial statements and notes |
| |
Proposal by the Board of Directors |
| |
Auditor’s report |
| |
Report of the Control Committee Chairmanship |
| |
Report of the Control Committee |
| |
Ratio definitions |
| |
| SUSTAINABILITY INDICES |
| |
| |
| |
| |
| |
| |
| |
| |
| |
| |
| |
| |
| |
| |
| |
| |
| |
| |
| |
| |
| |
| |
| |
| |
Note 7: Personnel expenses, compensation and benefits
Net personnel expenses
| | | | | | | | |
| | | |
| In thousands of euro | | 2022 | | | 2021 | |
| | |
Salaries and other remuneration | | | 28,117 | | | | 27,404 | |
| | | |
Social security and employee insurances | | | 2,528 | | | | 1,761 | |
| | | |
Pensions | | | 9,698 | | | | 8,982 | |
| | | |
Board and Control Committee remuneration | | | 185 | | | | 164 | |
| | | |
Other personnel expenses | | | 2,714 | | | | 1,849 | |
| | | |
Gross personnel expenses | | | 43,243 | | | | 40,160 | |
| | | |
Host country reimbursement according to agreement with the Finnish Government (see next page) | | | -11,195 | | | | -10,978 | |
| | | |
Capitalisation of internal labour to assets | | | -284 | | | | - | |
| | | |
Net personnel expenses | | | 31,764 | | | | 29,182 | |
Employees
| | | | | | | | |
| | | |
| | | 2022 | | | 2021 | |
| | |
Number of employees at 31 December | | | 228 | | | | 221 | |
| | | |
Average age of employees | | | 46 | | | | 46 | |
| | | |
Average period (years) of employment | | | 11 | | | | 10 | |
| | | |
Distribution by gender as of 31 Dec | | | | | | | | |
| | | |
Female | | | 87 | | | | 90 | |
| | | |
Male | | | 141 | | | | 131 | |
The number of employees in the table above includes all contracted employees. Permanent employees and those with fixed term contracts of four years or more amounted to 213 (2021: 198). Employees on substitute contracts, fixed term contracts less than four years and temporary contracts amounted to 15 (2021: 23).
Compensation for the Board of Directors, the Control Committee, the President and the Executive Committee
Compensation for the Board of Directors (BoD) and the Control Committee (CC) is set by the Board of Governors (BoG). The compensation consists of fixed annual remuneration and an attendee
allowance. The members of the BoD and the CC are also entitled to reimbursement of travel and accommodation expenses and a daily allowance in accordance with the Bank’s Travel Policy.
The BoD decides on the appointment and remuneration of the President. As a rule, the President is appointed on a fixed-term contract for five years at a time, but the existing contract can also be prolonged. The current President’s contract commenced on 1 April 2021 for a five year period.
The President decides upon the employment of the Executive Committee (ExCo) members. The President is authorised by the BoD to make decisions regarding compensation within the scope of the Staff Regulations and the annually approved financial plan. The remuneration package for the members of the ExCo includes a fixed base salary and customary taxable benefits and allowances, which are in principle the same for all staff at the managerial level.
The Bank can pay performance premiums to the President, ExCo members and staff for excellent and extraordinary performance. The performance premiums (excluding staff) are included in the numbers presented in the table below, if awarded.
The table below includes fees paid to the Board of Directors and Control Committee as well as the taxable income of the President and Executive Committee.
| | | | | | | | |
| | | |
| In thousands of euro | | 2022 | | | 2021 | |
| | |
Board of Directors (remuneration and attendee allowance) | | | | | | | | |
| | | |
Chairman | | | 16 | | | | 16 | |
| | | |
Other Directors and Alternates (15 persons) | | | 74 | | | | 101 | |
| | | |
Control Committee | | | | | | | | |
| | | |
Chairman | | | 8 | | | | 8 | |
| | | |
Other members (9 persons) | | | 18 | | | | 21 | |
| | | |
President1 | | | 761 | | | | 979 | |
| | | |
Members of the Executive Committee2 | | | 3,100 | | | | 3,002 | |
1 André Küüsvek from 1 April 2021. Henrik Normann until 31 March 2021
2 Heikki Cantell, Hilde Kjelsberg, Gunnar Okk, Luca De Lorenzo, Søren Mortensen, Vera-Maria Lehtonen (associate member in 2021, ordinary member from 1.9.2022), Jukka Ahonen (associate member in 2021, ordinary member since 1.9.2022) and Kim Skov Jensen.
| | |
| | |
ANNUAL REPORT 2022 | | 134 |
| | |
|
| |
| INTRODUCTION |
| |
| IMPACT |
| |
| GOVERNANCE |
| |
| BOD REPORT |
| |
| FINANCIALS |
| |
Operating and financial review |
| |
Capital and liquidity management |
| |
u Financial statements and notes |
| |
Proposal by the Board of Directors |
| |
Auditor’s report |
| |
Report of the Control Committee Chairmanship |
| |
Report of the Control Committee |
| |
Ratio definitions |
| |
| SUSTAINABILITY INDICES |
| |
| |
| |
| |
| |
| |
| |
| |
| |
| |
| |
| |
| |
| |
| |
| |
| |
| |
| |
| |
| |
| |
| |
| |
| | | | | | | | |
| | | |
| Distribution by gender as of 31 Dec | | 2022 | | | 2021 | |
| | |
Board of Directors | | | | | | | | |
| | | |
Female | | | 5 | | | | 5 | |
| | | |
Male | | | 3 | | | | 3 | |
| | | |
Control Committee | | | | | | | | |
| | | |
Female | | | 3 | | | | 1 | |
| | | |
Male | | | 7 | | | | 9 | |
| | | |
Members of the Executive Committee including the President | | | | | | | | |
| | | |
Female | | | 2 | | | | 2 | |
| | | |
Male | | | 7 | | | | 7 | |
There were no advances, credit granted or any debt arrangements between the Bank and the members of CC, BoD, the President or the ExCo members, nor commitments entered into by the Bank on their behalf by way of guarantee of any kind.
Benefits
Pension benefits
NIB is responsible for arranging the pension security for its employees. The Finnish public sector pension system (JuEL Pension) forms the basis for the pension benefits. The JuEL Pension is calculated based on the employee’s annual taxable income and the applicable age-linked pension accrual rate. The employer’s pension contribution in 2022 was 17.37% of the pensionable income. The employee’s pension contribution was either 7,15% or 8,65%, depending on the employee’s age. NIB pays this contribution for its permanent staff, and it is taxed as a benefit for the employee. The pension is accounted for as a defined contribution plan. In addition to the JuEL Pension, the Bank has taken out a supplementary group pension insurance policy for its entire permanently employed staff. The insurance premium, 6.5%, is calculated based on the employee’s taxable income and paid until the age of individual retirement under the JuEL Pension, with an upper age limit of 65 years. The supplementary pension is also accounted for as a defined contribution plan. The employer’s pension contribution regarding the President amounted to EUR 346,321 (358,640) The corresponding figure for the ExCo members was EUR 1,779,110 (1,001,932 ) of which EUR 298,466 (272,001) related to supplementary pension premiums. The BoD and the CC members are not eligible for NIB pension arrangements.
Insurances
NIB has taken out several (both statutory and voluntary) insurance policies for its staff: unemployment insurance, group accident insurance, group life insurance, medical insurance and disability insurance. All personal insurance policies are valid for the total duration of employment (if not otherwise stated for the separate insurance alternatives). Longer periods of absence from work may interrupt the insurance coverage temporarily. Some of the insurances are available only to staff with a longer fixed term contract and permanently employed staff. The BoD and CC members are not under the coverage of the above mentioned insurances.
Health care
NIB has also arranged occupational health care for its staff through a private medical centre in Finland. The Bank’s medical insurance covers in addition use of other health care service providers if needed and it covers public sector health care services for more severe or complex medical treatment needs. The occupational health care benefit includes both preventive health care and wellbeing actions for staff and medical care. The BoD and CC members are not under the coverage of the health care benefit
Additional expatriate benefits
Professional staff (including ExCo members) who move to Finland for the sole purpose of taking up employment at the Bank are entitled to certain expatriate benefits, such as an expatriate allowance and a spouse/ family allowance. In addition, NIB assists the expatriate in finding accommodation, usually by renting a house or a flat in its own name. The staff member reimburses the Bank for a part of the rent, which is equal to at least the taxable value of the accommodation benefit established annually by the Finnish National Board of Taxes.
Taxation and host country reimbursement
According to an agreement between the Bank’s Member countries, taxation of staff and ExCo members salaries and taxable benefits and the President’s remuneration, shall be taxed in the host country Finland in accordance with applicable Finnish taxation legislation.
According to the Host Country Agreement between the government of the Republic of Finland and the Bank, the amount of tax withheld on the salaries of the Bank’s staff and the final tax on salaries collected shall be reimbursed to the Bank.
| | |
| | |
ANNUAL REPORT 2022 | | 135 |
| | |
|
| |
| INTRODUCTION |
| |
| IMPACT |
| |
| GOVERNANCE |
| |
| BOD REPORT |
| |
| FINANCIALS |
| |
Operating and financial review |
| |
Capital and liquidity management |
| |
u Financial statements and notes |
| |
Proposal by the Board of Directors |
| |
Auditor’s report |
| |
Report of the Control Committee Chairmanship |
| |
Report of the Control Committee |
| |
Ratio definitions |
| |
| SUSTAINABILITY INDICES |
| |
| |
| |
| |
| |
| |
| |
| |
| |
| |
| |
| |
| |
| |
| |
| |
| |
| |
| |
| |
| |
| |
| |
| |
Note 8: Other administrative expenses
| | | | | | | | |
| In thousands of euro | | 2022 | | | 2021 | |
| IT & purchased data | | | 10,434 | | | | 10,343 | |
| Office premises | | | 2,166 | | | | 2,061 | |
| Travel | | | 550 | | | | 146 | |
| Communications and marketing | | | 349 | | | | 434 | |
| Other administrative expenses | | | 2,841 | | | | 2,696 | |
| Cost coverage, NDF and NEFCO (Note 25) | | | -1,505 | | | | -2,606 | |
| Rental and other income | | | -291 | | | | -307 | |
| Total | | | 14,544 | | | | 12,766 | |
| | | | | | | | | |
| Remuneration to the auditors | | | 2022 | | | | 2021 | |
| Audit fee | | | 164 | | | | 157 | |
| Other audit-related fees | | | 112 | | | | 140 | |
| Non-audit related fees | | | 65 | | | | 61 | |
| Total remuneration | | | 341 | | | | 359 | |
Note 9: Net loan losses
| | | | | | | | |
| In thousands of euro | | 2022 | | | 2021 | |
Change in expected credit loss on performing loans | | | 10,550 | | | | 25,383 | |
Change in expected credit loss on non-performing loans | | | -7,014 | | | | 491 | |
Decrease of provision to cover realised losses | | | -79,331 | | | | - | |
| Realised loan losses | | | 79,331 | | | | - | |
| Net loan losses | | | 3,536 | | | | 25,874 | |
See also Note 12: Loans outstanding and guarantee commitments.
Note 10: Expected credit loss
Impairment Methodology
Introduction and governance
The Bank calculates and reports its impairments based on expected credit losses (ECL). The ECL Framework is based on the requirements of the International Financial Reporting Standard (IFRS 9 Financial Instruments). Additionally, the guidance of the Basel Committee on Banking Supervision and Global Public Policy Committee are followed, where applicable. The ECL Framework is governed by the Bank’s Risk Management Policy. The Executive Committee reviews and the President approves the ECL Framework. The Mandate, Credit and Compliance Committee approves the impairment allowances and ECL model based calculation results.
Three Stage Model
The Bank recognises a loss allowance for ECL on financial assets measured at amortised cost, or at fair value through comprehensive income, and for loan commitments. The ECL comprises of a three-stage model based on changes in credit quality since initial recognition. Impairments are reported based in either 12 months or lifetime expected credit losses, depending on the stage allocation of the financial asset. The stage allocation also determines if interest income for the financial asset is reported on gross carrying amount or net of impairment allowance.
Stage 1 - includes financial assets that have not had a significant increase in credit risk since initial recognition or have a low risk at the reporting date. For these assets, the allowance amount is calculated based on the coming 12 months.
Stage 2 - includes financial assets that have had a significant increase in credit risk (SICR) since initial recognition, but for which there is no objective evidence of impairment. For these assets, the allowance amount is calculated based on expected lifetime of the asset. A SICR is considered to have occurred if the life-time default probability (PD) has increased significantly compared to that at the initial recognition. For assets with an initial PD of 1 to 5 a SICR occurs after a 3-notch downgrade, for assets with an initial PD of 6 to 10 a SICR occurs after a 2-notch downgrade whereas assets with an initial PD of 11 to 19 a SICR occurs after a 1 notch downgrade. Stage 1 and 2 assets are categorised as performing assets.
| | |
| | |
ANNUAL REPORT 2022 | | 136 |
| | |
|
| |
| INTRODUCTION |
| |
| IMPACT |
| |
| GOVERNANCE |
| |
| BOD REPORT |
| |
| FINANCIALS |
| |
Operating and financial review |
| |
Capital and liquidity management |
| |
u Financial statements and notes |
| |
Proposal by the Board of Directors |
| |
Auditor’s report |
| |
Report of the Control Committee Chairmanship |
| |
Report of the Control Committee |
| |
Ratio definitions |
| |
| SUSTAINABILITY INDICES |
| |
| |
| |
| |
| |
| |
| |
| |
| |
| |
| |
| |
| |
| |
| |
| |
| |
| |
| |
| |
| |
| |
| |
| |
Stage 3 - includes assets that have been categorised as non-performing in the Bank’s credit rating processes. For the non-performing assets, assessment is done on an individual basis, as opposed to the collective model used for the Stage 1 and 2 assets. Exposures in default classes are classified as non-performing. A default occurs with regard to an obligor when either or both of the following have taken place:
| i) | NIB considers that the obligor is unlikely to pay its credit obligations in full, without recourse by the Bank to actions such as realising security; or |
| ii) | the obligor is past due by more than 90 or in the case of sovereign lending by more than 180 days. |

Inputs
The ECL calculation is performed at the level of individual financial assets and the main components comprise Probability of Default (PD), Loss Given Default (LGD), Exposure at Default (EAD) and Discount Factor. The model is forward-looking: current and future macroeconomic conditions are incorporated into the model through macro-financial scenarios.
Each transaction in the Bank’s portfolio has an internal PD rating associated with it. This rating is a best estimate rating resulting in a neutral estimate without explicit buffers of conservatism. For ECL purposes, the PD is estimated based on a regression model of macroeconomic variables to observed default data. PD term structures are derived for each rating grade reflecting the macro-financial scenarios. The short-end of the PD term structure (up to 3 years) reflects the macro-financial scenarios, while the long-end of the PD term structure is based on long-run average behaviour. The term structure construction considers both outright default probabilities and rating migration behaviour.
Loss Given Default (LGD) is the magnitude of the likely loss if there is a default. The Bank has established a Rating Framework for LGD, according to which LGD estimates are generated for all of the Bank’s exposures. The estimates are derived separately for different counterparty types: corporates, financial institutions, sovereigns and local & regional governments, and project finance. Credit enhancements (collateral, guarantees) and other transaction characteristics impact the LGD estimate. Depending on counterparty type, different datasets and modelling approaches are employed.
Exposure at Default (EAD) represents the expected exposure in the event of a default and is measured from discounted contractual cash flows. Loan commitments are included using a Credit Conversion Factor (CCF). The discount factor is calculated based on the Effective Interest Rate (EIR) of a contract.
Macro-Financial Scenarios - Forward-looking information is used for calculating ECL. NIB uses three scenarios: a baseline scenario, a favourable (upside) scenario and an adverse (downside) scenario. The baseline scenario, judged to be the most likely outcome, is also used in other processes, such as business and financial planning, ICAAP and stress testing. Using external independent sources as well as internal expert judgement, the scenarios are prepared by Risk & Compliance and approved by senior management. They are selected based on the risks most relevant for NIB and are assigned weights based on expert judgement over the balance of risks around the baseline scenario. At the end of 2022, the weights attached to the baseline, upside and downside scenarios were 50%, 10% and 40% compared with 50%, 20% and 30% at the end of 2021. The effects of macroeconomic scenarios are driven by a number of variables, including interest rates and credit spreads.
| | |
| | |
ANNUAL REPORT 2022 | | 137 |
| | |
|
| |
| INTRODUCTION |
| |
| IMPACT |
| |
| GOVERNANCE |
| |
| BOD REPORT |
| |
| FINANCIALS |
| |
Operating and financial review |
| |
Capital and liquidity management |
| |
u Financial statements and notes |
| |
Proposal by the Board of Directors |
| |
Auditor’s report |
| |
Report of the Control Committee Chairmanship |
| |
Report of the Control Committee |
| |
Ratio definitions |
| |
| SUSTAINABILITY INDICES |
| |
| |
| |
| |
| |
| |
| |
| |
| |
| |
| |
| |
| |
| |
| |
| |
| |
| |
| |
| |
| |
| |
| |
| |
The Mandate, Credit and Compliance Committee may do post-model adjustments to the model-based ECL estimates as deemed necessary, inter alia to reflect additional factors such as significant events not explicitly incorporated within the modelling of ECL or in the credit risk ratings. The loan impairment accounting policy is described in Note 1: Accounting policies, and the results of the ECL are described below.
| | | | | | | | | | | | | | | | |
| | | | | |
Expected credit loss provision In millions of euro | | Stage 1 | | | Stage 2 | | | Stage 3 | | | Total | |
| | | | |
Balance at 31 December 2020 | | | 52 | | | | 48 | | | | 73 | | | | 173 | |
| | | | |
Transfer to Stage 1 | | | 3 | | | | -3 | | | | - | | | | 0 | |
| | | | |
Transfer to Stage 2 | | | 0 | | | | 0 | | | | - | | | | 0 | |
| | | | |
Transfer to Stage 3 | | | - | | | | - | | | | - | | | | 0 | |
| | | | |
New assets originated or purchased | | | 3 | | | | 0 | | | | - | | | | 4 | |
| | | | |
Amortisations and repayments | | | -3 | | | | -3 | | | | - | | | | -6 | |
| | | | |
Impact of remeasurment on existing assets | | | -23 | | | | 0 | | | | 0 | | | | -24 | |
| | | | |
Foreign exchange adjustments and other changes | | | - | | | | - | | | | 6 | | | | 6 | |
| | | | |
Net change income statement | | | -20 | | | | -6 | | | | 6 | | | | -20 | |
| | | | |
Realised losses | | | - | | | | - | | | | - | | | | 0 | |
| | | | |
Balance at 31 December 2021 | | | 32 | | | | 42 | | | | 78 | | | | 152 | |
| | | | |
Transfer to Stage 1 | | | 7 | | | | -7 | | | | - | | | | 0 | |
| | | | |
Transfer to Stage 2 | | | 0 | | | | 0 | | | | - | | | | 0 | |
| | | | |
Transfer to Stage 3 | | | 0 | | | | -1 | | | | 1 | | | | 0 | |
| | | | |
New assets originated or purchased | | | 19 | | | | 1 | | | | - | | | | 20 | |
| | | | |
Amortisations and repayments | | | -4 | | | | -2 | | | | - | | | | -5 | |
| | | | |
Impact of remeasurment on existing assets | | | -2 | | | | -21 | | | | 6 | | | | -17 | |
| | | | |
Foreign exchange adjustments and other changes | | | - | | | | - | | | | 4 | | | | 4 | |
| | | | |
Net change income statement | | | 20 | | | | -29 | | | | 11 | | | | 2 | |
| | | | |
Realised losses | | | - | | | | - | | | | -79 | | | | -79 | |
| | | | |
Balance at 31 December 2022 | | | 52 | | | | 13 | | | | 10 | | | | 75 | |
| | | | | | | | |
| | | |
Expected credit loss Statement of financial position In millions of euro at 31 December | | 2022 | | | 2021 | |
| | |
Loans outstanding | | | 66 | | | | 150 | |
| | |
Other receivables | | | - | | | | 2 | |
| | |
Loan commitments | | | 8 | | | | 1 | |
| | |
Financial placements | | | 2 | | | | 0 | |
| | |
Total | | | 75 | | | | 152 | |
| | | | | | | | |
| | | |
| Expected credit loss income statement | | | | | | |
| | |
In millions of euro | | | 2022 | | | | 2021 | |
| | |
Net result on financial operations | | | -1 | | | | 0 | |
| | |
Net loan losses (Note 9) | | | 4 | | | | 26 | |
| | |
Foreign exchange gains and losses | | | -4 | | | | -6 | |
| | |
Total recognised in income statement | | | -2 | | | | 20 | |
| | | | | | | | | | | | | | | | |
| | | | | |
Assets subject to expected credit loss
In millions of euro | | Stage 1 | | | Stage 2 | | | Stage 3 | | | Total | |
| | | | |
Exposure at 31 December 2020 | | | 25,548 | | | | 1,740 | | | | 73 | | | | 27,360 | |
| | | | |
Transfer to Stage 1 | | | 508 | | | | -508 | | | | - | | | | 0 | |
| | | | |
Transfer to Stage 2 | | | -174 | | | | 174 | | | | - | | | | 0 | |
| | | | |
Transfer to Stage 3 | | | - | | | | - | | | | - | | | | 0 | |
| | | | |
New assets originated or purchased | | | 3,668 | | | | 7 | | | | - | | | | 3,675 | |
| | | | |
Amortisations and repayments | | | -3,296 | | | | -558 | | | | - | | | | -3,854 | |
| | | | |
Foreign exchange adjustments and other changes | | | 209 | | | | 9 | | | | 6 | | | | 223 | |
| | | | |
Exposure at 31 December 2021 | | | 26,462 | | | | 864 | | | | 78 | | | | 27,405 | |
| | | | |
Transfer to Stage 1 | | | 92 | | | | -92 | | | | - | | | | 0 | |
| | | | |
Transfer to Stage 2 | | | -249 | | | | 249 | | | | - | | | | 0 | |
| | | | |
Transfer to Stage 3 | | | -1 | | | | -8 | | | | 9 | | | | 0 | |
| | | | |
New assets originated or purchased | | | 10,174 | | | | 228 | | | | - | | | | 10,402 | |
| | | | |
Amortisations and repayments | | | -4,190 | | | | -87 | | | | - | | | | -4,277 | |
| | | | |
Foreign exchange adjustments and other changes | | | -4,471 | | | | -5 | | | | 2 | | | | -4,475 | |
| | | | |
Realised losses | | | 0 | | | | 0 | | | | -79 | | | | -79 | |
| | | | |
Exposure at 31 December 2022 | | | 27,816 | | | | 1,149 | | | | 10 | | | | 28,976 | |
| | | | | | | | |
| | | |
Assets subject to expected credit loss at 31 December In millions of euro | | 2022 | | | 2021 | |
| | |
Loans outstanding | | | 22,290 | | | | 22,016 | |
| | |
Loan commitments | | | 2,969 | | | | 2,837 | |
| | |
Treasury assets held at amortised cost | | | 3,717 | | | | 2,552 | |
| | |
Total Exposure | | | 28,976 | | | | 27,405 | |
| | |
| | |
ANNUAL REPORT 2022 | | 138 |
| | |
|
| |
| INTRODUCTION |
| |
| IMPACT |
| |
| GOVERNANCE |
| |
| BOD REPORT |
| |
| FINANCIALS |
| |
Operating and financial review |
| |
Capital and liquidity .management |
| |
u Financial statements and notes |
| |
Proposal by the Board of Directors |
| |
Auditor’s report |
| |
Report of the Control Committee Chairmanship |
| |
Report of the Control Committee |
| |
Ratio definitions |
| |
| SUSTAINABILITY INDICES |
| |
| |
| |
| |
| |
| |
| |
| |
| |
| |
| |
| |
| |
| |
| |
| |
| |
| |
| |
| |
| |
| |
| |
| |
The Bank defines “forbearance” as a concession granted to a counterparty for reasons of financial difficulties, i.e. a concession that would not otherwise be considered by the lender. Forbearance recognition is not limited to measures that give rise to a loss for the lender. Modification of the terms and conditions of the contract may include, for example, reduction of the interest rate, principal or accrued interest, or rescheduling of the payment dates of principal and/or interest, and has an actual effect on the future cash flows. Loan forbearance is granted on a selective basis and purposefully to avoid counterparty default in favour of the Bank’s collection opportunities. Loans granted forbearance are automatically watch listed, and subject to the impairment policies of the Bank. As of 31 December 2022, there were three non-performing (stage 3) loans totalling EUR 10 (76) million. A total of EUR 66 (151) million has been deducted from the Bank’s loans outstanding and from lending claims in “other assets”. Specific allowances for impairment amounted to EUR 10 (76) million and ECL on stage 1 & 2 assets amounted to EUR 65 (74) million. During 2022 or 2021, no lending transactions were converted into claims under “other assets”.
Note 11: Debt securities
The debt securities were issued by the following counterparties:
| | | | | | | | |
| | | |
| In millions of euro | | 2022 | | | 2021 | |
| | |
Governments | | | 1,168 | | | | 914 | |
| | |
Public institutions | | | 2,246 | | | | 2,214 | |
| | |
Other | | | 5,355 | | | | 5,162 | |
| | |
Total | | | 8,768 | | | | 8,291 | |
The distribution of the Bank’s debt security portfolios at 31 December was as follows:
| | | | | | | | | | | | | | | | |
| | | |
| | | Book value | | | Fair value | |
| | | | |
In millions of euro | | | 2022 | | | | 2021 | | | | 2022 | | | | 2021 | |
| | | | |
Held at fair value | | | 5,985 | | | | 6,342 | | | | 5,985 | | | | 6,342 | |
| | | | | |
| Held at amortised cost | | 2,783 | | | 1,950 | | | 2,600 | | | 1,982 | |
| | | | |
Total | | | 8,768 | | | | 8,291 | | | | 8,585 | | | | 8,323 | |
Of these debt securities, EUR 7,230 (6,583) million is at fixed interest rates and EUR 1,538 (1,708) million at floating interest rates. At 31 December 2022, EUR 446 (330) million of total debt securities were in lending labelled bonds. The fair values are disclosed in Note 20: Fair value of financial instruments.
Note 12: Loans outstanding and guarantee commitments
At 31 December 2022, 489 (521) loans amounting to EUR 21,740 (21,975) million were outstanding. These are held at amortised cost unless they form part of a qualifying hedging relationship with a derivative in a hedge accounting relationship, the MTNs are recognised at fair value.
At 31 December 2022, loans outstanding before impairments and hedge accounting adjustments with floating interest rates amounted to EUR 16,987 (16,936) million, while those with fixed interest rates amounted to EUR 5,301 (5,084) million. As a general rule fixed interest loans are swapped to floating rates through the use of derivatives instruments.
| | | | | | | | |
| | | |
| In millions of euro | | 2022 | | | 2021 | |
| | |
Opening balance | | | 21,975 | | | | 21,555 | |
| | |
Disbursements | | | 3,527 | | | | 2,271 | |
| | |
Amortisation | | | -2,142 | | | | -1,535 | |
| | |
Prepayments | | | -560 | | | | -441 | |
| | |
Change in expected credit losses | | | 11 | | | | 25 | |
| | |
Foreign exchange changes | | | -477 | | | | 250 | |
| | |
Fair value adjustments | | | 0 | | | | 0 | |
| | |
Hedge accounting adjustments | | | -586 | | | | -149 | |
| | |
Other movements | | | -8 | | | | -1 | |
| | |
Closing balance | | | 21,740 | | | | 21,975 | |
| | |
| | |
ANNUAL REPORT 2022 | | 139 |
| | |
|
| |
| INTRODUCTION |
| |
| IMPACT |
| |
| GOVERNANCE |
| |
| BOD REPORT |
| |
| FINANCIALS |
| |
Operating and financial review |
| |
Capital and liquidity .management |
| |
u Financial statements and notes |
| |
Proposal by the Board of Directors |
| |
Auditor’s report |
| |
Report of the Control Committee Chairmanship |
| |
Report of the Control Committee |
| |
Ratio definitions |
| |
| SUSTAINABILITY INDICES |
| |
| |
| |
| |
| |
| |
| |
| |
| |
| |
| |
| |
| |
| |
| |
| |
| |
| |
| |
| |
| |
| |
| |
| |
The following table sets forth a breakdown per business sector of NIB’s outstanding loans and issued guarantees at 31 December.
| | | | | | | | | | | | | | | | |
| | | |
| | | 2022 | | | 2021 | |
| | | | | |
| In millions of euro | | | | | % | | | | | | % | |
| | | | |
Industry | | | 4,509 | | | | 20.2 % | | | | 3,923 | | | | 17.8 % | |
| | | | |
Public Sector & Utilities | | | 8,320 | | | | 37.3 % | | | | 8,640 | | | | 39.2 % | |
| | | | |
Infrastructure & Project Finance | | | 5,505 | | | | 24.7 % | | | | 5,634 | | | | 25.6 % | |
| | | | |
Services and Consumer | | | 2,197 | | | | 9.9 % | | | | 2,087 | | | | 9.5 % | |
| | | | | |
Financial institutions | | | 1,757 | | | | 7.9 % | | | | 1,736 | | | | 7.9 % | |
| | | | |
Total before impairments and hedge accounting | | | 22,287 | | | | 100.0 % | | | | 22,021 | | | | 100.0 % | |
| | | | |
ECL Stage 3 | | | -10 | | | | | | | | -76 | | | | | |
| | | | |
ECL Stage 1&2 | | | -56 | | | | | | | | -74 | | | | | |
| | | | |
Fair value adjustments | | | 0 | | | | | | | | 0 | | | | | |
| | | | |
Hedge accounting adjustments | | | -482 | | | | | | | | 105 | | | | | |
| | | | | |
Total | | | 21,740 | | | | | | | | 21,975 | | | | | |
The following table sets forth the scheduled amortizations of outstanding loans at
31 December.
| | | | | | | | |
| | | |
| In millions of euro | | 2022 | | | 2021 | |
| | |
2022 | | | - | | | | 2,224 | |
| | |
2023 | | | 2,504 | | | | 2,578 | |
| | |
2024 | | | 2,561 | | | | 2,545 | |
| | |
2025 | | | 2,392 | | | | 2,261 | |
| | |
2026 | | | 2,516 | | | | 2,293 | |
| | |
2027 | | | 2,549 | | | | 2,104 | |
| | |
2028 and thereafter | | | 9,765 | | | | 8,016 | |
| | |
| Total before impairments and hedge accounting | | | 22,287 | | | | 22,021 | |
| | |
ECL Stage 3 | | | -10 | | | | -76 | |
| | |
ECL Stage 1&2 | | | -56 | | | | -74 | |
| | |
Fair value adjustments | | | 0 | | | | 0 | |
| | |
Hedge accounting adjustments | | | -482 | | | | 105 | |
| | | |
Total | | | 21,740 | | | | 21,975 | |
The remaining average time to maturity/re-pricing of loans outstanding at 31 December 2022, calculated to the next date on which the Bank has the right to adjust the terms of the interest rate or currency of denomination, was 5 years and 0 months (4 years and 0 months), with actual maturities from the date of first disbursement ranging from 1 to 30 years (from 2 to 30 years).
| | |
| | |
ANNUAL REPORT 2022 | | 140 |
| | |
|
| |
| INTRODUCTION |
| |
| IMPACT |
| |
| GOVERNANCE |
| |
| BOD REPORT |
| |
| FINANCIALS |
| |
Operating and financial review |
| |
Capital and liquidity .management |
| |
u Financial statements and notes |
| |
Proposal by the Board of Directors |
| |
Auditor’s report |
| |
Report of the Control Committee Chairmanship |
| |
Report of the Control Committee |
| |
Ratio definitions |
| |
| SUSTAINABILITY INDICES |
| |
| |
| |
| |
| |
| |
| |
| |
| |
| |
| |
| |
| |
| |
| |
| |
| |
| |
| |
| |
| |
| |
| |
| |
Currency distribution of loans outstanding
| | | | | | | | |
| | | |
| In millions of euro | | 2022 | | | 2021 | |
| | |
EUR | | | 10,139 | | | | 9,538 | |
| | |
USD | | | 1,642 | | | | 1,519 | |
| | |
Nordic currencies | | | 10,367 | | | | 10,761 | |
| | |
Other currencies | | | 138 | | | | 202 | |
| | | |
Total before impairments and hedge accounting | | | 22,287 | | | | 22,021 | |
| | |
ECL Stage 3 | | | -10 | | | | -76 | |
| | |
ECL Stage 1&2 | | | -56 | | | | -74 | |
| | |
Fair value adjustments | | | 0 | | | | 0 | |
| | |
Hedge accounting adjustments | | | -482 | | | | 105 | |
| | | |
Total at 31 December | | | 21,740 | | | | 21,975 | |
Distribution of loans outstanding and guarantees by various types of security
The following table shows loans outstanding, including guarantee commitments, distributed by type of security:
| | | | | | | | | | | | | | | | |
| | | |
| | | 2022 | | | 2021 | |
| | | | |
| In millions of euro | | | | | | | % | | | | | | | | % | |
| | | | |
To or guaranteed by governments | | | | | | | | | | | | | | | | |
| | | | |
To or guaranteed by member countries | | | 1,932 | | | | | | | | 1,980 | | | | | |
| | | | |
To or guaranteed by other countries | | | 319 | | | | | | | | 374 | | | | | |
| | | | |
To or guaranteed by governments, total | | | 2,250 | | | | 10.1 | % | | | 2,355 | | | | 10.7 | % |
| | | | |
To or guaranteed by local authorities in member countries | | | 3,492 | | | | 15.7 | % | | | 4,074 | | | | 18.6 | % |
| | | | |
To or guaranteed by companies owned 50% or more by member countries or local authorities in member countries | | | 5,288 | | | | 23.7 | % | | | 4,750 | | | | 21.6 | % |
| | | | |
To or guaranteed by banks | | | 1,707 | | | | 7.7 | % | | | 1,666 | | | | 7.6 | % |
| | | | |
Backed by a lien or other security in property | | | 1,738 | | | | 7.8 | % | | | 1,764 | | | | 8.0 | % |
| | | | |
With a guarantee from the parent company and other guarantees | | | 1,441 | | | | 6.5 | % | | | 952 | | | | 4.3 | % |
| | | | |
With a negative pledge clause and other covenants | | | 6,361 | | | | 28.6 | % | | | 6,385 | | | | 29.1 | % |
| | | | | |
Total after individually assessed impairments | | | 22,277 | | | | 100.0 | % | | | 21,944 | | | | 100.0 | % |
| | | | |
ECL Stage 1&2 | | | -56 | | | | | | | | -74 | | | | | |
| | | | |
Hedge accounting adjustments | | | -482 | | | | | | | | 105 | | | | | |
| | | | |
Fair value adjustments | | | 0 | | | | | | | | 0 | | | | | |
| | | | | |
Total loans outstanding at 31 December | | | 21,740 | | | | | | | | 21,975 | | | | | |
As of 31 December, loans committed but not disbursed amounted to EUR 2,981 (2,498) million.
| | |
| | |
ANNUAL REPORT 2022 | | 141 |
| | |
|
| |
| INTRODUCTION |
| |
| IMPACT |
| |
| GOVERNANCE |
| |
| BOD REPORT |
| |
| FINANCIALS |
| |
Operating and financial review |
| |
Capital and liquidity management |
| |
u Financial statements and notes |
| |
Proposal by the Board of Directors |
| |
Auditor’s report |
| |
Report of the Control Committee Chairmanship |
| |
Report of the Control Committee |
| |
Ratio definitions |
| |
| SUSTAINABILITY INDICES |
| |
| |
| |
| |
| |
| |
| |
| |
| |
| |
| |
| |
| |
| |
| |
| |
| |
| |
| |
| |
| |
| |
| |
| |
The table below sets forth the total principal amount and percentage distribution of lending outstanding as well as issued guarantees at 31 December, allocated by country according to the domicile of the risk owner’s group headquarters.
| | | | | | | | | | | | | | | | |
| | | 2022 | | | 2021 | |
| | | | |
| In millions of euro | | Loans
outstanding | | | Total
commitments | | | Loans
outstanding | | | Total
commitments | |
| | | | |
Denmark | | | 2,533 | | | | 280 | | | | 1,936 | | | | - | |
| | | | |
Estonia | | | 1,016 | | | | 202 | | | | 917 | | | | 127 | |
| | | | |
Finland | | | 4,268 | | | | 779 | | | | 4,244 | | | | 745 | |
| | | | |
Iceland | | | 635 | | | | 37 | | | | 579 | | | | 21 | |
| | | | |
Latvia | | | 719 | | | | 81 | | | | 676 | | | | 151 | |
| | | | |
Lithuania | | | 940 | | | | 357 | | | | 1,015 | | | | 380 | |
| | | | |
Norway | | | 5,138 | | | | 121 | | | | 5,371 | | | | 182 | |
| | | | |
Sweden | | | 6,530 | | | | 709 | | | | 6,569 | | | | 436 | |
| | | | |
Belarus | | | 8 | | | | - | | | | 8 | | | | 13 | |
| | | | |
Germany | | | 38 | | | | 3 | | | | 38 | | | | 10 | |
| | | | |
Poland | | | 261 | | | | - | | | | 309 | | | | - | |
| | | | |
Russia | | | 1 | | | | - | | | | 1 | | | | - | |
| | | | |
Turkey | | | 1 | | | | - | | | | 4 | | | | - | |
| | | | |
Multilateral | | | 135 | | | | 260 | | | | 167 | | | | 283 | |
| | | | |
Botswana | | | 10 | | | | - | | | | 12 | | | | - | |
| | | | |
Brazil | | | 2 | | | | - | | | | 15 | | | | - | |
| | | | |
China | | | 43 | | | | 150 | | | | 61 | | | | 150 | |
| | | | |
India | | | - | | | | - | | | | 76 | | | | - | |
| | | | |
Laos | | | - | | | | - | | | | 1 | | | | - | |
| | | | |
Tunisia | | | 4 | | | | - | | | | 7 | | | | - | |
| | | | |
United States | | | - | | | | - | | | | 3 | | | | - | |
| | | | |
Vietnam | | | 6 | | | | - | | | | 10 | | | | - | |
| | | | |
Other Non-European countries | | | 0 | | | | - | | | | 4 | | | | - | |
| | | | |
Total before ECL, Fair value & hedge accounting adjustments | | | 22,287 | | | | 2,981 | | | | 22,021 | | | | 2,498 | |
| | | | |
ECL Stage 3 | | | -10 | | | | - | | | | -76 | | | | - | |
| | | | |
ECL Stage 1&2 | | | -56 | | | | -8 | | | | -74 | | | | -1 | |
| | | | |
Fair value adjustments | | | 0 | | | | - | | | | 0 | | | | - | |
| | | | |
Hedge accounting adjustments | | | -482 | | | | - | | | | 105 | | | | - | |
| | | | | |
Total at 31 December | | | 21,740 | | | | 2,973 | | | | 21,975 | | | | 2,497 | |
Note 13: Tangible and intangible assets
Intangible assets
| | | | | | | | |
| | | |
| In millions of euro | | 2022 | | | 2021 | |
| | |
Acquisition value at the beginning of the year | | | 32 | | | | 31 | |
| | |
Acquisitions during the year | | | 4 | | | | 2 | |
| | | |
Acquisition value at the end of the year | | | 37 | | | | 32 | |
| | |
| | | | | | | | |
| | | |
Accumulated amortisation at the beginning of the year | | | 25 | | | | 19 | |
| | | |
Amortisation for the year | | | 3 | | | | 6 | |
| | | |
Accumulated amortisation at the end of the year | | | 28 | | | | 25 | |
| | |
Net book value at 31 December | | | 9 | | | | 8 | |
Intangible assets comprise of software development costs and right-of-use assets arising from leasing contracts.
| | |
| | |
ANNUAL REPORT 2022 | | 142 |
| | |
|
| |
| INTRODUCTION |
| |
| IMPACT |
| |
| GOVERNANCE |
| |
| BOD REPORT |
| |
| FINANCIALS |
| |
Operating and financial review |
| |
Capital and liquidity management |
| |
u Financial statements and notes |
| |
Proposal by the Board of Directors |
| |
Auditor’s report |
| |
Report of the Control Committee Chairmanship |
| |
Report of the Control Committee |
| |
Ratio definitions |
| |
| SUSTAINABILITY INDICES |
| |
| |
| |
| |
| |
| |
| |
| |
| |
| |
| |
| |
| |
| |
| |
| |
| |
| |
| |
| |
| |
| |
| |
| |
Tangible assets
2022
| | | | | | | | | | | | |
| | | | |
| In millions of euro | | Buildings | | | Office equipment
and other
tangible assets | | | Total | |
| | | |
Tangible assets | | | | | | | | | | | | |
| | | |
Acquisition value at the beginning of the year | | | 45 | | | | 31 | | | | 75 | |
| | | |
Acquisitions during the year | | | - | | | | - | | | | 0 | |
| | | |
Sales/disposals during the year | | | - | | | | -2 | | | | -2 | |
| | | |
Acquisition value at the end of the year | | | 45 | | | | 29 | | | | 74 | |
| | | |
| | | | | | | | | | | | | |
| | | |
Accumulated depreciation at the beginning of the year | | | 20 | | | | 20 | | | | 40 | |
| | | |
Depreciation for the year | | | 3 | | | | 1 | | | | 3 | |
| | | |
Accumulated depreciation on sales/disposals during the year | | | - | | | | -2 | | | | -2 | |
| | | |
Accumulated depreciation at the end of the year | | | 22 | | | | 19 | | | | 41 | |
| | | |
Net book value | | | 22 | | | | 11 | | | | 33 | |
On each closing date, the Bank’s assets are assessed to determine whether there is any indication of an asset’s impairment. As of 31 December 2022, there were no indications of impairment of the intangible or tangible assets.
| | | | | | | | | | | | |
2021 | | | | | | | | | | | | |
| | | | |
| In millions of euro | | Buildings | | | Office equipment
and other
tangible assets | | | Total | |
| | | |
Tangible assets | | | | | | | | | | | | |
| | | |
Acquisition value at the beginning of the year | | | 43 | | | | 30 | | | | 74 | |
| | | |
Acquisitions during the year | | | 1 | | | | 1 | | | | 2 | |
| | | |
Sales/disposals during the year | | | - | | | | - | | | | 0 | |
| | | |
Acquisition value at the end of the year | | | 45 | | | | 31 | | | | 75 | |
| | | |
| | | | | | | | | | | | | |
| | | |
Accumulated depreciation at the beginning of the year | | | 17 | | | | 19 | | | | 36 | |
| | | |
Depreciation for the year | | | 2 | | | | 1 | | | | 3 | |
| | | |
Accumulated depreciation on sales/disposals during the year | | | - | | | | - | | | | 0 | |
| | | |
Accumulated depreciation at the end of the year | | | 20 | | | | 20 | | | | 40 | |
| | | |
Net book value | | | 25 | | | | 11 | | | | 36 | |
| | |
| | |
ANNUAL REPORT 2022 | | 143 |
| | |
|
| |
| INTRODUCTION |
| |
| IMPACT |
| |
| GOVERNANCE |
| |
| BOD REPORT |
| |
| FINANCIALS |
| |
Operating and financial review |
| |
Capital and liquidity .management |
| |
u Financial statements and notes |
| |
Proposal by the Board of Directors |
| |
Auditor’s report |
| |
Report of the Control Committee Chairmanship |
| |
Report of the Control Committee |
| |
Ratio definitions |
| |
| SUSTAINABILITY INDICES |
| |
| |
| |
| |
| |
| |
| |
| |
| |
| |
| |
| |
| |
| |
| |
| |
| |
| |
| |
| |
| |
| |
| |
| |
Note 14: Depreciation
| | | | | | | | |
| | | |
| In thousands of euro | | 2022 | | | 2021 | |
| | |
Intangible assets (Note 13) | | | 3,155 | | | | 6,111 | |
| | |
Tangible assets (Note 13) | | | 3,153 | | | | 3,434 | |
| | |
Buildings | | | 2,573 | | | | 2,443 | |
| | |
Office equipment | | | 580 | | | | 991 | |
| | |
Total | | | 6,308 | | | | 9,545 | |
Note 15: Other assets
| | | | | | | | |
| | | |
| In millions of euro | | 2022 | | | 2021 | |
| | |
Interest rate swaps at floating rates | | | 14,478 | | | | 9,335 | |
| | |
Interest rate swaps at fixed rates | | | 21,520 | | | | 21,226 | |
| | |
Currency swaps at floating rates | | | 12,919 | | | | 11,400 | |
| | |
Currency swaps at fixed rates | | | 8,857 | | | | 8,130 | |
| | |
Nominal amount of receive leg | | | 57,774 | | | | 50,090 | |
| | |
Nominal amount payable leg | | | -56,721 | | | | -49,274 | |
| | |
Net nominal derivative receivables | | | 1,053 | | | | 816 | |
| | |
Fair value adjustments | | | 764 | | | | 439 | |
| | |
Derivative receivables at fair value | | | 1,817 | | | | 1,255 | |
| | |
Other | | | 35 | | | | 32 | |
| | |
Total at 31 December | | | 1,852 | | | | 1,287 | |
Derivatives are carried at fair value in the statement of financial position net per contract. Thus, swap contracts with a positive net fair value are recognised in the statement of financial position under “Other assets”, while swap contracts with a negative net fair value are recognised under “Other liabilities”.
The table below shows the net exposure of derivative instruments after collaterals at 31 December.
| | | | | | | | |
| | | |
| In millions of euro | | 2022 | | | 2021 | |
| | |
Derivative instruments in financial position | | | 1,817 | | | | 1,255 | |
| | |
Netting by counterparty | | | -1,251 | | | | -602 | |
| | |
Derivative instruments net per counterparty | | | 566 | | | | 653 | |
| | |
Accrued interest net per counterparty | | | 42 | | | | 118 | |
| | |
Net exposure before collaterals | | | 608 | | | | 771 | |
| | |
Collateral received | | | -601 | | | | -722 | |
| | |
Net exposure | | | 8 | | | | 49 | |
See also Risk Management, Credit Risk, Derivatives.
| | |
| | |
ANNUAL REPORT 2022 | | 144 |
| | |
|
| |
| INTRODUCTION |
| |
| IMPACT |
| |
| GOVERNANCE |
| |
| BOD REPORT |
| |
| FINANCIALS |
| |
Operating and financial review |
| |
Capital and liquidity .management |
| |
u Financial statements and notes |
| |
Proposal by the Board of Directors |
| |
Auditor’s report |
| |
Report of the Control Committee Chairmanship |
| |
Report of the Control Committee |
| |
Ratio definitions |
| |
| SUSTAINABILITY INDICES |
| |
| |
| |
| |
| |
| |
| |
| |
| |
| |
| |
| |
| |
| |
| |
| |
| |
| |
| |
| |
| |
| |
| |
| |
Note 16: Debts evidenced by certificates and related swaps
| | | | | | | | |
| | | |
| In millions of euro | | 2022 | | | 2021 | |
| | |
Opening balance | | | 31,526 | | | | 29,072 | |
| | |
New issues | | | 9,630 | | | | 7,028 | |
| | |
Amortisation | | | -7,218 | | | | -4,764 | |
| | |
Call and buybacks | | | -155 | | | | -299 | |
| | |
Foreign exchange movements | | | 56 | | | | 1,222 | |
| | |
Fair value adjustment on FVTPL debt | | | -59 | | | | -8 | |
| | |
Hedge accounting adjustments | | | -2,202 | | | | -720 | |
| | |
Other | | | 15 | | | | -4 | |
| | |
Closing balance | | | 31,595 | | | | 31,526 | |
At year-end, the Bank’s debt evidenced by certificates were distributed between the currencies shown in the table below. The table also demonstrates the distribution by currency on an after related swap nominal basis.
| | | | | | | | | | | | | | | | | | | | | | | | |
| | | | | | | | | Swap contracts | | | | | | | |
| | | |
| | | Debt | | | payable/receivable | | | Net balance | |
| | | | | | |
| In millions of euro | | 2022 | | | 2021 | | | 2022 | | | 2021 | | | 2022 | | | 2021 | |
| | | | | | |
Currency | | | | | | | | | | | | | | | | | | | | | | | | |
| | | | | | |
USD | | | 11,809 | | | | 10,516 | | | | -332 | | | | 399 | | | | 11,477 | | | | 10,915 | |
| | | | | | |
EUR | | | 7,223 | | | | 6,338 | | | | 8,268 | | | | 7,250 | | | | 15,491 | | | | 13,588 | |
| | | | | | |
NOK | | | 3,850 | | | | 3,650 | | | | - | | | | 122 | | | | 3,850 | | | | 3,772 | |
| | | | | | |
GBP | | | 3,155 | | | | 3,247 | | | | -3,155 | | | | -3,247 | | | | - | | | | - | |
| | | | | | |
SEK | | | 2,461 | | | | 2,935 | | | | - | | | | 64 | | | | 2,461 | | | | 3,000 | |
| | | | | | |
AUD | | | 2,053 | | | | 2,272 | | | | -2,053 | | | | -2,272 | | | | - | | | | - | |
| | | | | | |
NZD | | | 818 | | | | 829 | | | | -818 | | | | -829 | | | | - | | | | - | |
| | | | | | |
CNH | | | 637 | | | | 111 | | | | -637 | | | | -111 | | | | - | | | | - | |
| | | | | | |
HKD | | | 634 | | | | 535 | | | | -634 | | | | -535 | | | | - | | | | - | |
| | | | | | |
DKK | | | 403 | | | | 134 | | | | - | | | | - | | | | 403 | | | | 134 | |
| | | | | | |
RON | | | 190 | | | | 136 | | | | -190 | | | | -136 | | | | - | | | | - | |
| | | | | | |
MXN | | | 100 | | | | 115 | | | | -100 | | | | -115 | | | | - | | | | - | |
| | | | | | |
CHF | | | 51 | | | | 48 | | | | -51 | | | | -48 | | | | - | | | | - | |
| | | | | | |
PLN | | | 48 | | | | 22 | | | | -48 | | | | -22 | | | | - | | | | - | |
| | | | | | |
JPY | | | 40 | | | | 88 | | | | -40 | | | | -88 | | | | - | | | | - | |
| | | | | | |
BRL | | | 19 | | | | 26 | | | | -19 | | | | -26 | | | | - | | | | - | |
| | | | | | |
INR | | | 11 | | | | 47 | | | | -11 | | | | -47 | | | | - | | | | - | |
| | | | | | |
TRY | | | 16 | | | | 113 | | | | -16 | | | | -113 | | | | - | | | | - | |
| | | | | | |
ZAR | | | 9 | | | | 8 | | | | -9 | | | | -8 | | | | - | | | | - | |
| | | | | | |
Subtotal | | | 33,527 | | | | 31,171 | | | | 155 | | | | 239 | | | | 33,683 | | | | 31,409 | |
| | | | | | |
Fair value adjustments | | | 11 | | | | 70 | | | | -27 | | | | -70 | | | | -16 | | | | 0 | |
| | | | | | |
Hedge accounting adjustments | | | -1,979 | | | | 222 | | | | 2,017 | | | | -224 | | | | 38 | | | | -2 | |
| | | | | | |
Other | | | 36 | | | | 63 | | | | - | | | | - | | | | 36 | | | | 63 | |
| | | | | | |
Total at 31 December | | | 31,595 | | | | 31,526 | | | | 2,145 | | | | -55 | | | | 33,740 | | | | 31,471 | |
| | |
| | |
ANNUAL REPORT 2022 | | 145 |
| | |
|
| |
| INTRODUCTION |
| |
| IMPACT |
| |
| GOVERNANCE |
| |
| BOD REPORT |
| |
| FINANCIALS |
| |
Operating and financial review |
| |
Capital and liquidity management |
| |
u Financial statements and notes |
| |
Proposal by the Board of Directors |
| |
Auditor’s report |
| |
Report of the Control Committee Chairmanship |
| |
Report of the Control Committee |
| |
Ratio definitions |
| |
| SUSTAINABILITY INDICES |
| |
| |
| |
| |
| |
| |
| |
| |
| |
| |
| |
| |
| |
| |
| |
| |
| |
| |
| |
| |
| |
| |
| |
| |
Note 17: Other liabilities
| | | | | | | | |
| | | |
| In millions of euro | | 2022 | | | 2021 | |
| | |
Interest rate swaps at floating interest rates | | | 25,981 | | | | 22,320 | |
| | |
Interest rate swaps at fixed interest rates | | | 10,017 | | | | 8,241 | |
| | |
Currency swaps at floating interest rates | | | 19,735 | | | | 17,871 | |
| | |
Currency swaps at fixed rates | | | 1,578 | | | | 1,660 | |
| | |
Nominal amount payable leg | | | 57,311 | | | | 50,092 | |
| | |
Nominal amount receivable leg | | | -56,721 | | | | -49,274 | |
| | |
Net nominal derivative payables | | | 590 | | | | 818 | |
| | |
Fair value adjustments | | | 1,950 | | | | 235 | |
| | |
Derivative payables at fair value | | | 2,540 | | | | 1,052 | |
| | |
Other | | | 90 | | | | 39 | |
| | |
Total at 31 December | | | 2,630 | | | | 1,092 | |
Derivatives are carried at fair value in the statement of financial position net per contract. Thus, swap contracts with a positive net fair value are recognised in the statement of financial position under “Other assets”, while swap contracts with a negative net fair value are recognised under “Other liabilities”.
Derivative instruments net exposure after collaterals
| | | | | | | | |
| | | |
| In millions of euro | | 2022 | | | 2021 | |
| | |
Derivative instruments in financial position | | | 2,540 | | | | 1,052 | |
| | |
Netting by counterparty | | | -1,251 | | | | -602 | |
| | |
Derivative instruments net per counterparty | | | 1,289 | | | | 450 | |
| | |
Accrued interest net per counterparty | | | -89 | | | | -45 | |
| | |
Net exposure before collaterals | | | 1,200 | | | | 406 | |
| | |
Collateral given | | | -1,150 | | | | -387 | |
| | |
Net exposure at 31 December | | | 50 | | | | 19 | |
See also Risk Management, Credit Risk, Derivatives.
| | |
| | |
ANNUAL REPORT 2022 | | 146 |
| | |
|
| |
| INTRODUCTION |
| |
| IMPACT |
| |
| GOVERNANCE |
| |
| BOD REPORT |
| |
| FINANCIALS |
| |
Operating and financial review |
| |
Capital and liquidity management |
| |
u Financial statements and notes |
| |
Proposal by the Board of Directors |
| |
Auditor’s report |
| |
Report of the Control Committee Chairmanship |
| |
Report of the Control Committee |
| |
Ratio definitions |
| |
| SUSTAINABILITY INDICES |
| |
| |
| |
| |
| |
| |
| |
| |
| |
| |
| |
| |
| |
| |
| |
| |
| |
| |
| |
| |
| |
| |
| |
| |
Note 18: Capitalisation and reserves
The following table sets forth the capitalisation of NIB at 31 December.
| | | | | | | | |
| | | |
| In millions of euro | | 2022 | | | 2021 | |
| | |
Equity: | | | | | | | | |
| | |
Authorised and subscribed capital | | | 8,369 | | | | 8,369 | |
| | |
Of which callable capital | | | -7,523 | | | | -7,523 | |
| | |
Paid-in capital | | | 846 | | | | 846 | |
| | |
Statutory Reserve | | | 837 | | | | 837 | |
| | |
General Credit Risk Fund | | | 2,273 | | | | 2,154 | |
| | |
Hedging reserve | | | 3 | | | | 6 | |
| | |
Changes in own credit risk on liabilities at fair value | | | 3 | | | | -3 | |
| | |
Profit for the year | | | 139 | | | | 159 | |
| | |
Total Equity | | | 4,101 | | | | 3,999 | |
| | |
Debts evidenced by certificates | | | 31,595 | | | | 31,526 | |
| | |
Total Capitalisation | | | 35,696 | | | | 35,525 | |
The member countries’ portions of authorised capital at 31 December are as follows:
| | | | | | | | | | | | | | | | |
| | | | | |
| In millions of euro | | 2022 | | | Share, in % | | | 2021 | | | Share, in % | |
| | | | |
Member country | | | | | | | | | | | | | | | | |
| | | | |
Denmark | | | 1,763 | | | | 21.1% | | | | 1,763 | | | | 21.1% | |
| | | | |
Estonia | | | 77 | | | | 0.9% | | | | 77 | | | | 0.9% | |
| | | | |
Finland | | | 1,483 | | | | 17.7% | | | | 1,483 | | | | 17.7% | |
| | | | |
Iceland | | | 79 | | | | 0.9% | | | | 79 | | | | 0.9% | |
| | | | |
Latvia | | | 112 | | | | 1.3% | | | | 112 | | | | 1.3% | |
| | | | |
Lithuania | | | 163 | | | | 2.0% | | | | 163 | | | | 2.0% | |
| | | | |
Norway | | | 1,800 | | | | 21.5% | | | | 1,800 | | | | 21.5% | |
| | | | |
Sweden | | | 2,893 | | | | 34.6% | | | | 2,893 | | | | 34.6% | |
| | | | |
Total | | | 8,369 | | | | 100.0% | | | | 8,369 | | | | 100.0% | |
The member countries’ portions of paid-in capital at 31 December are as follows:
| | | | | | | | | | | | | | | | |
| | | | | |
| In millions of euro | | 2022 | | | Share, in % | | | 2021 | | | Share, in % | |
| | | | |
Member country | | | | | | | | | | | | | | | | |
| | | | |
Denmark | | | 178 | | | | 21.1% | | | | 178 | | | | 21.1% | |
| | | | |
Estonia | | | 8 | | | | 0.9% | | | | 8 | | | | 0.9% | |
| | | | |
Finland | | | 150 | | | | 17.7% | | | | 150 | | | | 17.7% | |
| | | | |
Iceland | | | 8 | | | | 0.9% | | | | 8 | | | | 0.9% | |
| | | | |
Latvia | | | 11 | | | | 1.3% | | | | 11 | | | | 1.3% | |
| | | | |
Lithuania | | | 17 | | | | 2.0% | | | | 17 | | | | 2.0% | |
| | | | |
Norway | | | 182 | | | | 21.5% | | | | 182 | | | | 21.5% | |
| | | | |
Sweden | | | 293 | | | | 34.6% | | | | 293 | | | | 34.6% | |
| | | | |
Total | | | 846 | | | | 100.0% | | | | 846 | | | | 100.0% | |
| | |
| | |
ANNUAL REPORT 2022 | | 147 |
| | |
|
| |
| INTRODUCTION |
| |
| IMPACT |
| |
| GOVERNANCE |
| |
| BOD REPORT |
| |
| FINANCIALS |
| |
Operating and financial review |
| |
Capital and liquidity management |
| |
u Financial statements and notes |
| |
Proposal by the Board of Directors |
| |
Auditor’s report |
| |
Report of the Control Committee Chairmanship |
| |
Report of the Control Committee |
| |
Ratio definitions |
| |
| SUSTAINABILITY INDICES |
| |
| |
| |
| |
| |
| |
| |
| |
| |
| |
| |
| |
| |
| |
| |
| |
| |
| |
| |
| |
| |
| |
| |
| |
Authorised Capital Stock
The Board of Governors can, upon a proposal by the Board of Directors of NIB, decide upon an increase in the authorised capital stock of the Bank. To become effective, such a decision usually requires the approval of the parliaments of the Member countries.
The authorised capital stock of the Bank, which initially was approximately EUR 510 million, has been increased several times. most recently in 2020, when the Bank updated its Statutes. The Bank previously had two main categories of lending: ordinary lending and lending under Special Programs. Lending under special programs comprised Project Investment Loans (PIL) and Environmental Investment Loans (MIL). Under the new statutes that came into force during 2020 these special programs were discontinued. The outstanding amounts under the PIL and MIL facilities became part of NIB’s ordinary lending. The Owner countries’ guarantees related to the PIL loans of 1,800 million has been converted to callable capital and the equity reserve allocated to PIL has been converted to paid-in-capital. As a result the authorised capital of the bank amounts to EUR 8,369 million. The split of NIB’s authorised capital into paid-in capital and callable capital is discussed below under “Paid-in Capital and Callable Capital.”
As stipulated in NIB’s Statutes, any increase of the authorised capital stock is allocated among the Member countries based upon their gross national income (GNI) at market prices as determined from time to time by the Board of Governors. From the establishment of NIB in 1975 until the Baltic countries joined NIB on January 1, 2005, gross national income (GNI) was calculated at factor prices for the Nordic countries as an average of the data from the two most recent years available. Since January 1, 2005 the source for the GNI statistics has been the International Monetary Fund’s International Financial Statistics publication. Allocations of new subscribed capital among the Member countries were fixed at the time of each increase and no adjustments or equalisation payments were made with respect to capital already subscribed. Accordingly, and because the GNI among the Member countries has varied over the years, the authorised and paid-in portions of the Member countries’ capital have not been the same. In 2016, the Bank’s Board of Governors decided to adjust and align NIB’s authorised capital so that each Member country’s share in percentage of paid-in capital and callable capital would equal its share of the authorised capital. Following the completion of the approval process in each Member country, the changes have entered into force and have been implemented.
Paid-in Capital and Callable Capital
The Statutes provide that NIB’s authorised capital stock shall consist of a paid-in portion and a callable portion. Of NIB’s total authorised capital stock of currently EUR 8,369 million, the paid-in portion amounts to EUR 846 million, which corresponds to approximately 10% of the total authorised capital stock of the Bank. All subscribed capital not paid in is subject to call by the Board of Directors of NIB to the extent that the Board deems it necessary for the fulfilment of the Bank’s debt obligations. The Statutes do not require that calls be made pro rata, but it is anticipated that, in the first instance, calls would be made in that manner. Failure by any Member country to make payment on any such call would not excuse any other Member country from its obligation to make payment. No Member country can legally be required on any such call to pay more than the unpaid balance of the callable portion of its subscribed capital. To date no such calls have been made.
In view of NIB’s mission as an institution for regional cooperation, there are no provisions in the 2004 Agreement for admitting additional countries. While a Member country may withdraw by giving notice in accordance with the provisions set forth in the 2004 Agreement, the 2004 Agreement also provides that a withdrawing country must remain liable for those commitments of NIB that were in force at the time of the withdrawal to the same extent as immediately prior to such withdrawal.
Reserves
Under the Statutes, NIB’s annual net profits are to be transferred to a statutory reserve (the “Statutory Reserve”) until such reserve equals at least 10% of the authorised capital stock of the Bank. Thereafter, the Board of Governors, acting upon the proposal of the Board of Directors of NIB, will determine the allocation of net profits between further transfers to the Statutory Reserve, General Credit Risk Fund and the payment of dividends to the Member countries.
At 31 December 2021, the Statutory Reserve of NIB amounted to EUR 837 million or 10% of the Bank’s authorised capital. NIB has annually allocated a portion of the respective year’s profit as a general credit risk reserve (the “General Credit Risk Fund”) for unidentified risks in the Bank’s operations. At 31 December 2022, the General Credit Risk Fund amounted to EUR 2,273 million. The General Credit Risk Fund is available to cover losses arising from NIB’s lending portfolio as well as other risks NIB assumes in its business activities, such as the activities of its treasury department. The risks covered with respect to the treasury activities include market risks as well as counterparty risks. For further information in this regard, please see Note 2: Risk management.
| | |
| | |
ANNUAL REPORT 2022 | | 148 |
| | |
|
| |
| INTRODUCTION |
| |
| IMPACT |
| |
| GOVERNANCE |
| |
| BOD REPORT |
| |
| FINANCIALS |
| |
Operating and financial review |
| |
Capital and liquidity management |
| |
u Financial statements and notes |
| |
Proposal by the Board of Directors |
| |
Auditor’s report |
| |
Report of the Control Committee Chairmanship |
| |
Report of the Control Committee |
| |
Ratio definitions |
| |
| SUSTAINABILITY INDICES |
| |
| |
| |
| |
| |
| |
| |
| |
| |
| |
| |
| |
| |
| |
| |
| |
| |
| |
| |
| |
| |
| |
| |
| |
Note 19: Collateral and commitments
At 31 December, collaterals and commitments were as follows;
| | | | | | | | |
| In millions of euro | | 2022 | | | 2021 | |
Loans committed but not yet disbursed (Note 12) | | | 2,981 | | | | 2,837 | |
Callable commitments in financial placements | | | 1 | | | | 2 | |
Collateral received for collateralised
placements 2 3 | | | 3,025 | | | | 2,166 | |
Collateral given for collateralised placements 1 4 | | | - | | | | - | |
Gross collateral with respect to derivatives exposure | | | | | | | | |
Collateral received 2 5 | | | 623 | | | | 748 | |
Collateral given 1 4 | | | 1,150 | | | | 400 | |
1 Book value. 2 Fair value. 3 Including cash of EUR 66 (4) million and securities of EUR 2,959 (2,162) million received.
4 Cash collateral. 5 Including cash of EUR 623 (748) million and securities of EUR 0 (0) million received.
NIB as lessee
At 31 December, the future minimum lease payments under non-cancellable leases were as follows;
| | | | | | | | |
| In thousands of euro | | 2022 | | | 2021 | |
Within one year | | | 995 | | | | 1,027 | |
Later than one but not two years | | | 877 | | | | 851 | |
Later than two but not three years | | | 367 | | | | 656 | |
Later than three but not four years | | | - | | | | 326 | |
Total | | | 2,240 | | | | 2,860 | |
NIB as lessor
At 31 December, the future minimum lease receipts under non-cancellable leases were as follows;
| | | | | | | | |
| In thousands of euro | | 2022 | | | 2021 | |
Within one year | | | 845 | | | | 675 | |
Later than one but not two years | | | 623 | | | | 461 | |
Later than two but not three years | | | 312 | | | | 461 | |
Later than three but not four years | | | - | | | | 230 | |
Total | | | 1,780 | | | | 1,828 | |
The Bank sub-lets office space to related parties as described in Note 25.
| | |
| | |
ANNUAL REPORT 2022 | | 149 |
| | |
|
| |
| INTRODUCTION |
| |
| IMPACT |
| |
| GOVERNANCE |
| |
| BOD REPORT |
| |
| FINANCIALS |
| |
Operating and financial review |
| |
Capital and liquidity management |
| |
u Financial statements and notes |
| |
Proposal by the Board of Directors |
| |
Auditor’s report |
| |
Report of the Control Committee Chairmanship |
| |
Report of the Control Committee |
| |
Ratio definitions |
| |
| SUSTAINABILITY INDICES |
| |
| |
| |
| |
| |
| |
| |
| |
| |
| |
| |
| |
| |
| |
| |
| |
| |
| |
| |
| |
| |
| |
| |
| |
Note 20: Fair value of financial instruments
Classification of financial instruments
| | | | | | | | | | | | | | | | | | | | |
| In millions of euro | | Amortised cost (AC) | | | Fair value through profit and loss
(FVTPL) | | | Designated at fair
value through profit
and loss (FVO) | | | Derivatives
for hedging | | | Total | |
Financial assets | | | | | | | | | | | | | | | | | | | | |
Cash and cash equivalents | | | 2,048 | | | | 30 | | | | - | | | | - | | | | 2,078 | |
Financial placements with credit institutions | | | 1,145 | | | | 3,325 | | | | - | | | | - | | | | 4,469 | |
Debt securities | | | 2,783 | | | | 5,985 | | | | - | | | | - | | | | 8,768 | |
Other financial placements | | | - | | | | 5 | | | | - | | | | - | | | | 5 | |
Loans outstanding | | | 21,738 | | | | - | | | | 2 | | | | - | | | | 21,740 | |
Derivatives | | | - | | | | 1,174 | | | | - | | | | 643 | | | | 1,817 | |
Total 31 December 2022 | | | 27,714 | | | | 10,519 | | | | 2 | | | | 643 | | | | 38,878 | |
| | | | | | | | | | | | | | | | | | | | | |
Financial liabilities | | | | | | | | | | | | | | | | | | | | |
Short-term amounts owed to credit institutions | | | 689 | | | | - | | | | - | | | | - | | | | 689 | |
Debt evidenced by certificates | | | 30,990 | | | | - | | | | 605 | | | | - | | | | 31,595 | |
Derivatives | | | - | | | | 153 | | | | - | | | | 2,387 | | | | 2,540 | |
Total 31 December 2022 | | | 31,679 | | | | 153 | | | | 605 | | | | 2,387 | | | | 34,824 | |
| | | | | | | | | | | | | | | | | | | | |
| In millions of euro | | Amortised cost (AC) | | | Fair value
through
profit and loss
(FVTPL) | | | Designated at fair
value through profit
and loss (FVO) | | | Derivatives
for hedging | | | Total | |
Financial assets | | | | | | | | | | | | | | | | | | | | |
Cash and cash equivalents | | | 1,122 | | | | 704 | | | | - | | | | - | | | | 1,826 | |
Financial placements with credit institutions | | | 589 | | | | 3,292 | | | | - | | | | - | | | | 3,881 | |
Debt securities | | | 1,950 | | | | 6,342 | | | | - | | | | - | | | | 8,291 | |
Other financial placements | | | - | | | | 9 | | | | - | | | | - | | | | 9 | |
Loans outstanding | | | 21,966 | | | | - | | | | 10 | | | | - | | | | 21,975 | |
Derivatives | | | - | | | | 606 | | | | - | | | | 649 | | | | 1,255 | |
Total 31 December 2021 | | | 25,626 | | | | 10,953 | | | | 10 | | | | 649 | | | | 37,237 | |
| | | | | | | | | | | | | | | | | | | | | |
Financial liabilities | | | | | | | | | | | | | | | | | | | | |
Short-term amounts owed to credit institutions | | | 752 | | | | - | | | | - | | | | - | | | | 752 | |
Debt evidenced by certificates | | | 31,053 | | | | - | | | | 473 | | | | - | | | | 31,526 | |
Derivatives | | | - | | | | 194 | | | | - | | | | 859 | | | | 1,052 | |
Total 31 December 2021 | | | 31,805 | | | | 194 | | | | 473 | | | | 859 | | | | 33,330 | |
| | |
| | |
ANNUAL REPORT 2022 | | 150 |
| | |
|
| |
| INTRODUCTION |
| |
| IMPACT |
| |
| GOVERNANCE |
| |
| BOD REPORT |
| |
| FINANCIALS |
| |
Operating and financial review |
| |
Capital and liquidity management |
| |
u Financial statements and notes |
| |
Proposal by the Board of Directors |
| |
Auditor’s report |
| |
Report of the Control Committee Chairmanship |
| |
Report of the Control Committee |
| |
Ratio definitions |
| |
| SUSTAINABILITY INDICES |
| |
| |
| |
| |
| |
| |
| |
| |
| |
| |
| |
| |
| |
| |
| |
| |
| |
| |
| |
| |
| |
| |
| |
| |
Fair valuation of financial instruments
| | | | | | | | | | | | | | | | |
| | | 2022 | | | 2021 | |
| In millions of euro | | Carrying amount | | | Fair value | | | Carrying amount | | | Fair value | |
Financial Assets | | | | | | | | | | | | | | | | |
Cash and cash equivalents | | | 2,078 | | | | 2,078 | | | | 1,826 | | | | 1,826 | |
Financial placements with credit institutions | | | 4,469 | | | | 4,466 | | | | 3,881 | | | | 3,881 | |
Debt securities | | | 8,768 | | | | 8,585 | | | | 8,291 | | | | 8,323 | |
Other financial placements | | | 5 | | | | 5 | | | | 9 | | | | 9 | |
Loans outstanding | | | 21,740 | | | | 21,728 | | | | 21,975 | | | | 22,245 | |
Derivatives | | | 1,817 | | | | 1,817 | | | | 1,255 | | | | 1,255 | |
Total | | | 38,878 | | | | 38,680 | | | | 37,237 | | | | 37,539 | |
Financial Liabilities | | | | | | | | | | | | | | | | |
Short-term amounts owed to credit institutions | | | 689 | | | | 689 | | | | 752 | | | | 752 | |
Debt evidenced by certificates | | | 31,595 | | | | 31,531 | | | | 31,526 | | | | 31,570 | |
Derivatives | | | 2,540 | | | | 2,540 | | | | 1,052 | | | | 1,052 | |
Total | | | 34,824 | | | | 34,759 | | | | 33,330 | | | | 33,374 | |
For short term instruments the carrying value is assumed to be a resonable approximation of fair value.
| | |
| | |
ANNUAL REPORT 2022 | | 151 |
| | |
|
| |
| INTRODUCTION |
| |
| IMPACT |
| |
| GOVERNANCE |
| |
| BOD REPORT |
| |
| FINANCIALS |
| |
Operating and financial review |
| |
Capital and liquidity management |
| |
u Financial statements and notes |
| |
Proposal by the Board of Directors |
| |
Auditor’s report |
| |
Report of the Control Committee Chairmanship |
| |
Report of the Control Committee |
| |
Ratio definitions |
| |
| SUSTAINABILITY INDICES |
| |
| |
| |
| |
| |
| |
| |
| |
| |
| |
| |
| |
| |
| |
| |
| |
| |
| |
| |
| |
| |
| |
| |
| |
Level of fair value measurement for financial instruments at the end of the year
The table below analyses financial instruments’ fair value at the end of the year by the level in the fair value hierarchy into which the fair value measurement is categorised.
See Accounting policies, Determination of fair value.
| | | | | | | | | | | | | | | | | | | | | | | | |
| | | |
| | | 2022 | | | 2021 | |
| | | | | | |
| In millions of euro | | Level 1 | | | Level 2 | | | Level 3 | | | Level 1 | | | Level 2 | | | Level 3 | |
| | | | | | |
Financial Assets | | | | | | | | | | | | | | | | | | | | | | | | |
| | | | | | |
Cash and cash equivalents | | | 2,078 | | | | - | | | | - | | | | 1,826 | | | | - | | | | - | |
| | | | | | |
Financial placements with credit institutions | | | - | | | | 4,466 | | | | - | | | | - | | | | 3,881 | | | | - | |
| | | | | | |
Debt securities | | | 8,579 | | | | - | | | | 7 | | | | 8,311 | | | | - | | | | 12 | |
| | | | | | |
Other financial placements | | | - | | | | - | | | | 5 | | | | - | | | | - | | | | 9 | |
| | | | | | |
Loans outstanding | | | - | | | | 21,726 | | | | 2 | | | | - | | | | 22,236 | | | | 10 | |
| | | | | | |
Derivatives | | | - | | | | 1,794 | | | | 23 | | | | - | | | | 1,211 | | | | 44 | |
| | | | | | |
Total | | | 10,657 | | | | 27,986 | | | | 37 | | | | 10,138 | | | | 27,328 | | | | 73 | |
| | | | | | |
Financial Liabilities | | | | | | | | | | | | | | | | | | | | | | | | |
| | | | | | |
Short-term amounts owed to credit institutions | | | - | | | | 689 | | | | - | | | | - | | | | 752 | | | | - | |
| | | | | | |
Debt evidenced by certificates | | | - | | | | 30,869 | | | | 661 | | | | - | | | | 30,955 | | | | 615 | |
| | | | | | |
Derivatives | | | - | | | | 2,393 | | | | 147 | | | | - | | | | 659 | | | | 393 | |
| | | | | | |
Total | | | 0 | | | | 33,951 | | | | 808 | | | | 0 | | | | 32,365 | | | | 1,009 | |
At 31 December 2022, recorded Credit Valuation Adjustment (CVA) amounted to EUR - 3.5 million, while Debit Valuation Adjustment (DVA) was EUR 1.6 million. At 31 December 2021, recorded CVA amounted to EUR -1.9 million, while DVA was EUR 0.5 million. Receivables from defaulted treasury counterparties are measured at fair value. Receivables from defaulted lending counterparties are measured at cost minus impairment.
| | |
| | |
ANNUAL REPORT 2022 | | 152 |
| | |
|
| |
| INTRODUCTION |
| |
| IMPACT |
| |
| GOVERNANCE |
| |
| BOD REPORT |
| |
| FINANCIALS |
| |
Operating and financial review |
| |
Capital and liquidity management |
| |
u Financial statements and notes |
| |
Proposal by the Board of Directors |
| |
Auditor’s report |
| |
Report of the Control Committee Chairmanship |
| |
Report of the Control Committee |
| |
Ratio definitions |
| |
| SUSTAINABILITY INDICES |
| |
| |
| |
| |
| |
| |
| |
| |
| |
| |
| |
| |
| |
| |
| |
| |
| |
| |
| |
| |
| |
| |
| |
| |
Changes in fair values categorised in level 3
| | | | | | | | | | | | | | | | | | | | | | | | | | | | | | | | | | | | |
| | | | |
| | | Financial assets | | | | | | Financial liabilities | |
| | | | | | | | | |
| In millions of euro | | Debt
securities | | | Other
financial
placements | | | Loans
outstanding | | | Derivative
assets | | | Level 3
total
assets | | | | | | Debt
evidenced By
certificates | | | Derivative
liabilities | | | Level 3
total
liabilities | |
| | | | | | | | | |
31 December 2020 | | | 17 | | | | 9 | | | | 15 | | | | 69 | | | | 109 | | | | | | | | 685 | | | | 281 | | | | 966 | |
| | | | | | | | | |
Financial instruments reclassified to level 3 | | | | | | | | | | | | | | | | | | | | | | | | | | | | | | | | | | | | |
| | | | | | | | | |
New trades | | | - | | | | - | | | | - | | | | - | | | | 0 | | | | | | | | 53 | | | | - | | | | 53 | |
| | | | | | | | | |
Matured transactions, buy backs and calls | | | - | | | | - | | | | - | | | | - | | | | 0 | | | | | | | | -49 | | | | -12 | | | | -61 | |
| | | | | | | | | |
Amortisation | | | -5 | | | | - | | | | -4 | | | | -14 | | | | -23 | | | | | | | | -54 | | | | - | | | | -54 | |
| | | | | | | | | |
Capitalisations | | | - | | | | - | | | | - | | | | 1 | | | | 1 | | | | | | | | 2 | | | | 31 | | | | 34 | |
| | | | | | | | | |
Sold transactions | | | - | | | | - | | | | - | | | | - | | | | 0 | | | | | | | | - | | | | - | | | | 0 | |
| | | | | | | | | |
Inflation adjustments | | | - | | | | - | | | | 2 | | | | -7 | | | | -5 | | | | | | | | -7 | | | | -2 | | | | -8 | |
| | | | | | | | | |
Changes in fair values | | | - | | | | - | | | | - | | | | -5 | | | | -4 | | | | | | | | 8 | | | | - | | | | 8 | |
| | | | | | | | | |
Exchange rate adjustments | | | - | | | | - | | | | -3 | | | | -1 | | | | -4 | | | | | | | | -22 | | | | 95 | | | | 73 | |
| | | | | | | | | |
31 December 2021 | | | 12 | | | | 9 | | | | 10 | | | | 44 | | | | 73 | | | | | | | | 615 | | | | 393 | | | | 1,009 | |
| | | | | | | | | |
Financial instruments reclassified to level 3 | | | | | | | | | | | | | | | | | | | | | | | | | | | | | | | | | | | | |
| | | | | | | | | |
New trades | | | - | | | | 0 | | | | - | | | | 1 | | | | 1 | | | | | | | | 332 | | | | 17 | | | | 348 | |
| | | | | | | | | |
Matured transactions, buy backs and calls | | | - | | | | - | | | | - | | | | -14 | | | | -14 | | | | | | | | -279 | | | | -265 | | | | -543 | |
| | | | | | | | | |
Amortisation | | | -5 | | | | - | | | | -5 | | | | -1 | | | | -10 | | | | | | | | - | | | | - | | | | 0 | |
| | | | | | | | | |
Capitalisations | | | - | | | | - | | | | - | | | | 1 | | | | 1 | | | | | | | | 3 | | | | 10 | | | | 13 | |
| | | | | | | | | |
Sold transactions | | | - | | | | - | | | | - | | | | - | | | | 0 | | | | | | | | - | | | | - | | | | 0 | |
| | | | | | | | | |
Inflation adjustments | | | - | | | | - | | | | 1 | | | | -26 | | | | -26 | | | | | | | | -26 | | | | -1 | | | | -27 | |
| | | | | | | | | |
Changes in fair values | | | - | | | | -4 | | | | - | | | | -52 | | | | -56 | | | | | | | | 52 | | | | - | | | | 53 | |
| | | | | | | | | |
Exchange rate adjustments | | | - | | | | - | | | | -3 | | | | 71 | | | | 68 | | | | | | | | -37 | | | | -8 | | | | -45 | |
| | | | | | | | | |
31 December 2022 | | | 7 | | | | 5 | | | | 2 | | | | 23 | | | | 37 | | | | | | | | 661 | | | | 147 | | | | 808 | |
The financial placement debt securities categorised as Level 3 are instruments that are not traded actively and the valuations are based on external market quotes, which management have applied an overlay to reduce the fair value recorded. The other Level 3 financial placements are Mezzanine funds, where the valuation is obtained from the external fund administrators. Level 3 loans, derivatives and issued securities consist of complex structured products and instruments denominated in currencies which have limited liquidity. The calculated fair values of the instruments in illiquid currencies are based on market data from a leading data provider. Both the structured debt issuances and the products in illiquid currencies are hedged back-to-back with swaps to reduce the risks.
| | |
| | |
ANNUAL REPORT 2022 | | 153 |
| | |
|
| |
| INTRODUCTION |
| |
| IMPACT |
| |
| GOVERNANCE |
| |
| BOD REPORT |
| |
| FINANCIALS |
| |
Operating and financial review |
| |
Capital and liquidity management |
| |
u Financial statements and notes |
| |
Proposal by the Board of Directors |
| |
Auditor’s report |
| |
Report of the Control Committee Chairmanship |
| |
Report of the Control Committee |
| |
Ratio definitions |
| |
| SUSTAINABILITY INDICES |
| |
| |
| |
| |
| |
| |
| |
| |
| |
| |
| |
| |
| |
| |
| |
| |
| |
| |
| |
| |
| |
| |
| |
| |
NIB uses an extended Libor Market Model (BGM) to value the structured derivatives and structured debt issuances. The main model inputs are market observable interest rates, foreign exchange rates, swaption volatilities and foreign exchange volatilities. The only unobservable inputs to the valuation model are correlations between different risk factors that are estimated from historical market data. In order to calculate a sensitivity of fair values of structured derivatives and structured debt to these unobservable inputs, a range of different methods for correlation estimation are applied. The table below gives the sensitivity range of fair values that contains the results using alternative correlation methods.
As the table shows, the sensitivity of the total net impact of structured derivatives and debt is lower than the sensitivities of derivatives or debt on their own. This is because the derivatives hedge the debt issuances back-to-back and the impacts of alternative correlation models partly cancel each other. The estimated uncertainty in the total fair value of structured instruments is EUR ± 1.8 million.
| | | | | | | | | | | | |
| | | | |
| | | Fair value
(EUR million) | | | Unobservable input | | | Sensitivity of
fair value
(EUR million) | |
| | | |
Structured OTC derivatives | | | -6.2 | | | | Correlations | | | | ± 2.9 | |
| | | |
Structured issued debt securities | | | -465.9 | | | | Correlations | | | | ± 2.3 | |
| | | |
Total Net impact | | | -472.1 | | | | | | | | ± 1.8 | |
| | |
| | |
ANNUAL REPORT 2022 | | 154 |
| | |
|
| |
| INTRODUCTION |
| |
| IMPACT |
| |
| GOVERNANCE |
| |
| BOD REPORT |
| |
| FINANCIALS |
| |
Operating and financial review |
| |
Capital and liquidity management |
| |
u Financial statements and notes |
| |
Proposal by the Board of Directors |
| |
Auditor’s report |
| |
Report of the Control Committee Chairmanship |
| |
Report of the Control Committee |
| |
Ratio definitions |
| |
| SUSTAINABILITY INDICES |
| |
| |
| |
| |
| |
| |
| |
| |
| |
| |
| |
| |
| |
| |
| |
| |
| |
| |
| |
| |
| |
| |
| |
| |
Note 21: Maturity profile of financial assets and liabilities
The table below sets out a maturity analysis for financial assets and liabilities containing principal and interest flows. For loans outstanding, undiscounted cash flows are presented until contractual final maturity. For borrowing outstanding and derivatives with call options, cash flows are presented until the first possible termination date. Cash flows are presented on net basis for interest rate swaps and on gross basis for all other swaps. Interest cash flows are projected based on the interest rates prevailing on the closing date. See also Notes 15 and 17, and Risk management, Liquidity Risk.
| | | | | | | | | | | | | | | | | | | | | | | | | | | | |
2022 | | | | | | | | | | | | | | | | | | | | | | | | | | | | |
| | | | | | | | |
| In millions of euro | | Carrying amount | | | Contractual
cash flows | | | Up to and
including 3 month | | | Over 3 months and
up to and including
6 months | | | Over 6 months and
up to and including
1 year | | | Over 1 year and
up to and including
5 years | | | Over 5 years | |
Assets | | | | | | | | | | | | | | | | | | | | | | | | | | | | |
Cash and cash equivalents | | | 2,078 | | | | 2,079 | | | | 2,079 | | | | - | | | | - | | | | - | | | | - | |
Financial placements | | | | | | | | | | | | | | | | | | | | | | | | | | | | |
Placements with credit institutions | | | 4,457 | | | | 4,480 | | | | 2,956 | | | | 1,525 | | | | - | | | | - | | | | - | |
Debt securities | | | 8,768 | | | | 9,470 | | | | 572 | | | | 649 | | | | 797 | | | | 6,212 | | | | 1,240 | |
Other | | | 5 | | | | 7 | | | | - | | | | - | | | | - | | | | - | | | | 7 | |
Loans outstanding | | | 21,740 | | | | 24,086 | | | | 475 | | | | 1,034 | | | | 1,467 | | | | 10,787 | | | | 10,323 | |
Other assets | | | | | | | | | | | | | | | | | | | | | | | | | | | | |
Derivative receive leg | | | 13,704 | | | | 15,310 | | | | 1,440 | | | | 2,121 | | | | 854 | | | | 9,568 | | | | 1,327 | |
Derivative pay leg | | | -11,887 | | | | -13,443 | | | | -1,313 | | | | -1,963 | | | | -666 | | | | -8,397 | | | | -1,104 | |
Assets, total | | | 38,866 | | | | 41,989 | | | | 6,208 | | | | 3,366 | | | | 2,452 | | | | 18,170 | | | | 11,794 | |
| | | | | | | | | | | | | | | | | | | | | | | | | | | | | |
Liabilities | | | | | | | | | | | | | | | | | | | | | | | | | | | | |
Amounts owed to credit institutions | | | | | | | | | | | | | | | | | | | | | | | | | | | | |
Short-term | | | 689 | | | | 689 | | | | 689 | | | | - | | | | - | | | | - | | | | - | |
Debts evidenced by certificates | | | 31,595 | | | | 35,620 | | | | 1,307 | | | | 3,751 | | | | 2,541 | | | | 24,622 | | | | 3,398 | |
Other liabilities | | | | | | | | | | | | | | | | | | | | | | | | | | | | |
Derivative receive leg | | | -11,490 | | | | -13,848 | | | | -2,207 | | | | -1,660 | | | | -973 | | | | -8,426 | | | | -582 | |
Derivative pay leg | | | 14,029 | | | | 15,080 | | | | 2,314 | | | | 1,826 | | | | 1,165 | | | | 9,027 | | | | 748 | |
Liabilities, total | | | 34,824 | | | | 37,541 | | | | 2,103 | | | | 3,918 | | | | 2,732 | | | | 25,224 | | | | 3,564 | |
| | | | | | | | | | | | | | | | | | | | | | | | | | | | | |
Net during the period | | | | | | | | | | | 4,106 | | | | -552 | | | | -280 | | | | -7,055 | | | | 8,230 | |
| | | | | | | | | | | | | | | | | | | | | | | | | | | | | |
Loans committed but not yet disbursed | | | | | | | | | | | 2,981 | | | | | | | | | | | | | | | | | |
| | |
| | |
ANNUAL REPORT 2022 | | 155 |
| | |
|
| |
| INTRODUCTION |
| |
| IMPACT |
| |
| GOVERNANCE |
| |
| BOD REPORT |
| |
| FINANCIALS |
| |
Operating and financial review |
| |
Capital and liquidity management |
| |
u Financial statements and notes |
| |
Proposal by the Board of Directors |
| |
Auditor’s report |
| |
Report of the Control Committee Chairmanship |
| |
Report of the Control Committee |
| |
Ratio definitions |
| |
| SUSTAINABILITY INDICES |
| |
| |
| |
| |
| |
| |
| |
| |
| |
| |
| |
| |
| |
| |
| |
| |
| |
| |
| |
| |
| |
| |
| |
| |
| | | | | | | | | | | | | | | | | | | | | | | | | | | | |
| 2021 | | | | | | | | | | | | | | | | | | | | | |
| | | | | | | |
| In millions of euro | | Carrying amount | | | Contractual
cash flows | | | Up to and
including 3 month | | | Over 3 months and
up to and including
6 months | | | Over 6 months and
up to and including
1 year | | | Over 1 year and up
to and including
5 years | | | Over 5 years | |
Assets | | | | | | | | | | | | | | | | | | | | | | | | | | | | |
Cash and cash equivalents | | | 1,826 | | | | 1,626 | | | | 1,626 | | | | - | | | | - | | | | - | | | | - | |
Financial placements | | | | | | | | | | | | | | | | | | | | | | | | | | | | |
Placements with credit institutions | | | 3,871 | | | | 4,063 | | | | 3,599 | | | | 464 | | | | - | | | | - | | | | - | |
Debt securities | | | 8,291 | | | | 8,412 | | | | 403 | | | | 304 | | | | 962 | | | | 5,859 | | | | 884 | |
Other | | | 9 | | | | 7 | | | | 0 | | | | 0 | | | | 0 | | | | 0 | | | | 7 | |
Loans outstanding | | | 21,975 | | | | 23,071 | | | | 339 | | | | 714 | | | | 1,311 | | | | 10,491 | | | | 10,216 | |
Other assets | | | | | | | | | | | | | | | | | | | | | | | | | | | | |
Derivative receive leg | | | 13,436 | | | | 16,007 | | | | 2,863 | | | | 762 | | | | 1,414 | | | | 9,491 | | | | 1,477 | |
Derivative pay leg | | | -12,181 | | | | -14,119 | | | | -2,635 | | | | -675 | | | | -1,186 | | | | -8,478 | | | | -1,146 | |
Assets, total | | | 37,228 | | | | 39,067 | | | | 6,194 | | | | 1,570 | | | | 2,502 | | | | 17,363 | | | | 11,438 | |
| | | | | | | | | | | | | | | | | | | | | | | | | | | | | |
Liabilities | | | | | | | | | | | | | | | | | | | | | | | | | | | | |
Amounts owed to credit institutions | | | | | | | | | | | | | | | | | | | | | | | | | | | | |
Short-term | | | 752 | | | | 752 | | | | 752 | | | | - | | | | - | | | | - | | | | - | |
Debts evidenced by certificates | | | 31,526 | | | | 32,599 | | | | 2,638 | | | | 807 | | | | 4,000 | | | | 21,660 | | | | 3,494 | |
Other liabilities | | | | | | | | | | | | | | | | | | | | | | | | | | | | |
Derivative receive leg | | | -9,188 | | | | -9,707 | | | | -2,558 | | | | -882 | | | | -971 | | | | -4,482 | | | | -814 | |
Derivative pay leg | | | 10,240 | | | | 10,498 | | | | 2,608 | | | | 977 | | | | 1,189 | | | | 4,768 | | | | 956 | |
Liabilities, total | | | 33,330 | | | | 34,142 | | | | 3,439 | | | | 903 | | | | 4,219 | | | | 21,946 | | | | 3,635 | |
| | | | | | | | | | | | | | | | | | | | | | | | | | | | | |
Net during the period | | | | | | | | | | | 2,756 | | | | 668 | | | | -1,717 | | | | -4,583 | | | | 7,802 | |
| | | | | | | | | | | | | | | | | | | | | | | | | | | | | |
Loans committed but not yet disbursed | | | | | | | | | | | 2,837 | | | | | | | | | | | | | | | | | |
| | |
| | |
ANNUAL REPORT 2022 | | 156 |
| | |
|
| |
| INTRODUCTION |
| |
| IMPACT |
| |
| GOVERNANCE |
| |
| BOD REPORT |
| |
| FINANCIALS |
| |
Operating and financial review |
| |
Capital and liquidity management |
| |
u Financial statements and notes |
| |
Proposal by the Board of Directors |
| |
Auditor’s report |
| |
Report of the Control Committee Chairmanship |
| |
Report of the Control Committee |
| |
Ratio definitions |
| |
| SUSTAINABILITY INDICES |
| |
| |
| |
| |
| |
| |
| |
| |
| |
| |
| |
| |
| |
| |
| |
| |
| |
| |
| |
| |
| |
| |
| |
| |
Note 22: Interest rate risk
Interest rate risk is the impact that fluctuations in market interest rates can have on the value of the Bank’s interest-bearing assets and liabilities and on the interest income recognised in the statement of comprehensive income. The table below provides information on the extent of the Bank’s interest rate exposure. The assets and liabilities are grouped into buckets defined by their time to maturity or the date of the interest rate adjustment. The difference, or gap, between assets and liabilities in each time bucket makes the Bank sensitive to interest rate fluctuations. See also Note 2: Risk management. A 100 bps interest rate shock to the income statement would have an approximate impact of EUR 45 to 50 million.
| | | | | | | | | | | | | | | | | | | | | | | | | | | | | | | | |
2022 | | | | | | | | | | | | | | | | | | | | | | | | | | | | | | | | |
| | | | | | | | | |
| In millions of euro | | Up to and
including
3 months | | | Over 3 months
and up to and
including
6 months | | | Over 6 months
and up to and
including 1 year | | | Over 1 year
and up to and
including 5 years | | | Over 5 years
and up to and
including
10 years | | | Over
10 years | | | Undefined | | | Total | |
| | | | | | | | | | | | | | | | | | | | | | | | | | | | | | | | | |
Assets | | | | | | | | | | | | | | | | | | | | | | | | | | | | | | | | |
Cash and cash equivalents | | | 2,078 | | | | - | | | | - | | | | - | | | | - | | | | - | | | | - | | | | 2,078 | |
Financial placements | | | | | | | | | | | | | | | | | | | | | | | | | | | | | | | | |
Placements with credit institutions | | | 2,946 | | | | 1,511 | | | | - | | | | - | | | | - | | | | - | | | | 12 | | | | 4,469 | |
Debt securities | | | 2,018 | | | | 530 | | | | 711 | | | | 4,746 | | | | 1,057 | | | | - | | | | -293 | | | | 8,768 | |
Other | | | - | | | | - | | | | - | | | | - | | | | - | | | | - | | | | 5 | | | | 5 | |
| | | | 4,964 | | | | 2,041 | | | | 711 | | | | 4,746 | | | | 1,057 | | | | 0 | | | | -277 | | | | 13,242 | |
Loans outstanding | | | 10,379 | | | | 6,999 | | | | 227 | | | | 2,509 | | | | 1,629 | | | | 538 | | | | -540 | | | | 21,740 | |
Intangible assets | | | - | | | | - | | | | - | | | | - | | | | - | | | | - | | | | 9 | | | | 9 | |
Tangible assets | | | - | | | | - | | | | - | | | | - | | | | - | | | | - | | | | 33 | | | | 33 | |
Other assets | | | | | | | | | | | | | | | | | | | | | | | | | | | | | | | | |
Derivative receive leg | | | 23,472 | | | | 8,265 | | | | 2,642 | | | | 20,614 | | | | 1,936 | | | | 903 | | | | 795 | | | | 58,628 | |
Other assets | | | - | | | | - | | | | - | | | | - | | | | - | | | | - | | | | 35 | | | | 35 | |
Accrued interest and fees receivable | | | - | | | | - | | | | - | | | | - | | | | - | | | | - | | | | 325 | | | | 325 | |
Total assets | | | 40,894 | | | | 17,304 | | | | 3,580 | | | | 27,869 | | | | 4,622 | | | | 1,440 | | | | 380 | | | | 96,090 | |
| | |
| | |
ANNUAL REPORT 2022 | | 157 |
| | |
|
| |
| INTRODUCTION |
| |
| IMPACT |
| |
| GOVERNANCE |
| |
| BOD REPORT |
| |
| FINANCIALS |
| |
Operating and financial review |
| |
Capital and liquidity management |
| |
u Financial statements and notes |
| |
Proposal by the Board of Directors |
| |
Auditor’s report |
| |
Report of the Control Committee Chairmanship |
| |
Report of the Control Committee |
| |
Ratio definitions |
| |
| SUSTAINABILITY INDICES |
| |
| |
| |
| |
| |
| |
| |
| |
| |
| |
| |
| |
| |
| |
| |
| |
| |
| |
| |
| |
| |
| |
| |
| |
| | | | | | | | | | | | | | | | | | | | | | | | | | | | | | | | |
| | | | | | | | | |
| In millions of euro | | Up to and
including
3 months | | | Over 3 months
and up to and
including
6 months | | | Over 6 months
and up to and
including 1 year | | | Over 1 year
and up to and
including 5 years | | | Over 5 years
and up to and
including
10 years | | | Over
10 years | | | Undefined | | | Total | |
Liabilities and equity | | | | | | | | | | | | | | | | | | | | | | | | | | | | | | | | |
Liabilities | | | | | | | | | | | | | | | | | | | | | | | | | | | | | | | | |
Amounts owed to credit institutions | | | | | | | | | | | | | | | | | | | | | | | | | | | | | | | | |
Short-term | | | 689 | | | | - | | | | - | | | | - | | | | - | | | | - | | | | - | | | | 689 | |
Debts evidenced by certificates | | | 4,184 | | | | 3,692 | | | | 2,347 | | | | 20,509 | | | | 1,930 | | | | 901 | | | | -1,968 | | | | 31,595 | |
Other liabilities | | | | | | | | | | | | | | | | | | | | | | | | | | | | | | | | |
Derivative pay leg | | | 37,534 | | | | 7,601 | | | | 913 | | | | 6,661 | | | | 2,627 | | | | 1,958 | | | | 2,056 | | | | 59,350 | |
Other liabilities | | | - | | | | - | | | | - | | | | - | | | | - | | | | - | | | | 90 | | | | 90 | |
Accrued interest and fees payable | | | - | | | | - | | | | - | | | | - | | | | - | | | | - | | | | 265 | | | | 265 | |
Total liabilities | | | 42,407 | | | | 11,293 | | | | 3,260 | | | | 27,170 | | | | 4,558 | | | | 2,859 | | | | 443 | | | | 91,989 | |
Equity | | | - | | | | - | | | | - | | | | - | | | | - | | | | - | | | | 4,101 | | | | 4,101 | |
Total liabilities and equity | | | 42,407 | | | | 11,293 | | | | 3,260 | | | | 27,170 | | | | 4,558 | | | | 2,859 | | | | 4,544 | | | | 96,090 | |
| | | | | | | | | | | | | | | | | | | | | | | | | | | | | | | | | |
Net during the period | | | -1,513 | | | | 6,012 | | | | 321 | | | | 699 | | | | 64 | | | | -1,419 | | | | -4,163 | | | | 0 | |
Cumulative net during the period | | | -1,513 | | | | 4,499 | | | | 4,819 | | | | 5,518 | | | | 5,582 | | | | 4,163 | | | | 0 | | | | - | |
Guarantee commitments | | | - | | | | - | | | | - | | | | - | | | | - | | | | - | | | | - | | | | - | |
| | |
| | |
ANNUAL REPORT 2022 | | 158 |
| | |
|
| |
| INTRODUCTION |
| |
| IMPACT |
| |
| GOVERNANCE |
| |
| BOD REPORT |
| |
| FINANCIALS |
| |
Operating and financial review |
| |
Capital and liquidity management |
| |
u Financial statements and notes |
| |
Proposal by the Board of Directors |
| |
Auditor’s report |
| |
Report of the Control Committee Chairmanship |
| |
Report of the Control Committee |
| |
Ratio definitions |
| |
| SUSTAINABILITY INDICES |
| |
| |
| |
| |
| |
| |
| |
| |
| |
| |
| |
| |
| |
| |
| |
| |
| |
| |
| |
| |
| |
| |
| |
| |
| | | | | | | | | | | | | | | | | | | | | | | | | | | | | | | | |
2021 | | | | | | | | | | | | | | | | | | | | | | | | | | | | | | | | |
| | | | | | | | | |
| In millions of euro | | Up to and
including
3 months | | | Over 3 months and
up to and including
6 months | | | Over 6 months
and up to and
including 1 year | | | Over 1 year
and up to and
including
5 years | | | Over 5 years
and up to and
including
10 years | | | Over
10 years | | | Undefined | | | Total | |
| | | | | | | | | | | | | | | | | | | | | | | | | | | | | | | | | |
Assets | | | | | | | | | | | | | | | | | | | | | | | | | | | | | | | | |
Cash and cash equivalents | | | 1,826 | | | | - | | | | - | | | | - | | | | - | | | | - | | | | - | | | | 1,826 | |
Financial placements | | | | | | | | | | | | | | | | | | | | | | | | | | | | | | | | |
Placements with credit institutions | | | 1,927 | | | | 1,945 | | | | - | | | | - | | | | - | | | | - | | | | 10 | | | | 3,881 | |
Debt securities | | | 2,009 | | | | 176 | | | | 593 | | | | 4,708 | | | | 793 | | | | - | | | | 11 | | | | 8,291 | |
Other | | | - | | | | - | | | | - | | | | - | | | | - | | | | - | | | | 9 | | | | 9 | |
| | | | 3,936 | | | | 2,121 | | | | 593 | | | | 4,708 | | | | 793 | | | | 0 | | | | 29 | | | | 12,181 | |
Loans outstanding | | | 9,768 | | | | 7,492 | | | | 545 | | | | 2,274 | | | | 1,228 | | | | 632 | | | | 36 | | | | 21,975 | |
Intangible assets | | | - | | | | - | | | | - | | | | - | | | | - | | | | - | | | | 8 | | | | 8 | |
Tangible assets | | | - | | | | - | | | | - | | | | - | | | | - | | | | - | | | | 36 | | | | 36 | |
Other assets | | | | | | | | | | | | | | | | | | | | | | | | | | | | | | | | |
Derivative receive leg | | | 20,227 | | | | 3,296 | | | | 4,003 | | | | 19,490 | | | | 2,214 | | | | 798 | | | | 565 | | | | 50,592 | |
Other assets | | | - | | | | - | | | | - | | | | - | | | | - | | | | - | | | | 32 | | | | 32 | |
Accrued interest and fees receivable | | | - | | | | - | | | | - | | | | - | | | | - | | | | - | | | | 241 | | | | 241 | |
Total assets | | | 35,758 | | | | 12,908 | | | | 5,141 | | | | 26,472 | | | | 4,235 | | | | 1,431 | | | | 946 | | | | 86,891 | |
| | |
| | |
ANNUAL REPORT 2022 | | 159 |
| | |
|
| |
| INTRODUCTION |
| |
| IMPACT |
| |
| GOVERNANCE |
| |
| BOD REPORT |
| |
| FINANCIALS |
| |
Operating and financial review |
| |
Capital and liquidity management |
| |
u Financial statements and notes |
| |
Proposal by the Board of Directors |
| |
Auditor’s report |
| |
Report of the Control Committee Chairmanship |
| |
Report of the Control Committee |
| |
Ratio definitions |
| |
| SUSTAINABILITY INDICES |
| |
| |
| |
| |
| |
| |
| |
| |
| |
| |
| |
| |
| |
| |
| |
| |
| |
| |
| |
| |
| |
| |
| |
| |
| | | | | | | | | | | | | | | | | | | | | | | | | | | | | | | | |
| | | | | | | | | |
| In millions of euro | | Up to and
including
3 months | | | Over 3 months
and up to and
including 6 months | | | Over 6 months
and up to and
including 1 year | | | Over 1 year
and up to and
including
5 years | | | Over 5 years
and up to and
including
10 years | | | Over
10 years | | | Undefined | | | Total | |
Liabilities | | | | | | | | | | | | | | | | | | | | | | | | | | | | | | | | |
Amounts owed to credit institutions | | | | | | | | | | | | | | | | | | | | | | | | | | | | | | | | |
Short-term | | | 752 | | | | - | | | | - | | | | - | | | | - | | | | - | | | | - | | | | 752 | |
Debts evidenced by certificates | | | 4,208 | | | | 793 | | | | 3,882 | | | | 19,328 | | | | 2,226 | | | | 797 | | | | 292 | | | | 31,526 | |
Other liabilities | | | | | | | | | | | | | | | | | | | | | | | | | | | | | | | | |
Derivative pay leg | | | 33,634 | | | | 5,236 | | | | 917 | | | | 6,213 | | | | 2,076 | | | | 2,016 | | | | 298 | | | | 50,390 | |
Other liabilities | | | - | | | | - | | | | - | | | | - | | | | - | | | | - | | | | 39 | | | | 39 | |
Accrued interest and fees payable | | | - | | | | - | | | | - | | | | - | | | | - | | | | - | | | | 185 | | | | 185 | |
Total liabilities | | | 38,594 | | | | 6,028 | | | | 4,800 | | | | 25,541 | | | | 4,302 | | | | 2,814 | | | | 815 | | | | 82,892 | |
Equity | | | - | | | | - | | | | - | | | | - | | | | - | | | | - | | | | 3,999 | | | | 3,999 | |
Total liabilities and equity | | | 38,594 | | | | 6,028 | | | | 4,800 | | | | 25,541 | | | | 4,302 | | | | 2,814 | | | | 4,813 | | | | 86,891 | |
| | | | | | | | | | | | | | | | | | | | | | | | | | | | | | | | | |
Net during the period | | | -2,836 | | | | 6,880 | | | | 341 | | | | 931 | | | | -66 | | | | -1,383 | | | | -3,867 | | | | 0 | |
Cumulative net during the period | | | -2,836 | | | | 4,044 | | | | 4,385 | | | | 5,316 | | | | 5,250 | | | | 3,867 | | | | 0 | | | | - | |
Guarantee commitments | | | - | | | | - | | | | - | | | | - | | | | - | | | | - | | | | - | | | | - | |
| | |
| | |
ANNUAL REPORT 2022 | | 160 |
| | |
|
| |
| INTRODUCTION |
| |
| IMPACT |
| |
| GOVERNANCE |
| |
| BOD REPORT |
| |
| FINANCIALS |
| |
Operating and financial review |
| |
Capital and liquidity management |
| |
u Financial statements and notes |
| |
Proposal by the Board of Directors |
| |
Auditor’s report |
| |
Report of the Control Committee Chairmanship |
| |
Report of the Control Committee |
| |
Ratio definitions |
| |
| SUSTAINABILITY INDICES |
| |
| |
| |
| |
| |
| |
| |
| |
| |
| |
| |
| |
| |
| |
| |
| |
| |
| |
| |
| |
| |
| |
| |
| |
Note 23: Currency risk
NIB’s operations are mostly in euro and US dollars. The table below shows the net of assets and liabilities in the major currencies. See also Note 2: Risk management.
Net currency position as of 31 December 2022
| | | | | | | | | | | | | | | | | | | | | | | | | | | | | | | | |
| | | | | | | | | |
| In millions of euro | | EUR | | | USD | | | SEK | | | NOK | | | DKK | | | Other
currencies | | | Fair value adjustments
and swap netting | | | Total | |
| | | | | | | | |
Assets | | | | | | | | | | | | | | | | | | | | | | | | | | | | | | | | |
| | | | | | | | |
Cash and cash equivalents | | | 1,557 | | | | 469 | | | | 1 | | | | - | | | | 49 | | | | 2 | | | | - | | | | 2,078 | |
| | | | | | | | |
Financial placements | | | | | | | | | | | | | | | | | | | | | | | | | | | | | | | | |
| | | | | | | | |
Placements with credit institutions | | | 2,779 | | | | - | | | | - | | | | - | | | | 1,694 | | | | - | | | | -4 | | | | 4,469 | |
| | | | | | | | |
Debt securities | | | 5,277 | | | | 881 | | | | 407 | | | | 997 | | | | 1,498 | | | | - | | | | -291 | | | | 8,768 | |
| | | | | | | | |
Other financial placements | | | 5 | | | | - | | | | - | | | | - | | | | - | | | | - | | | | - | | | | 5 | |
| | | | | | | | |
| | | | 8,060 | | | | 881 | | | | 407 | | | | 997 | | | | 3,193 | | | | 0 | | | | -295 | | | | 13,242 | |
| | | | | | | | |
Loans outstanding | | | 10,075 | | | | 1,641 | | | | 4,113 | | | | 4,424 | | | | 1,830 | | | | 138 | | | | -482 | | | | 21,740 | |
| | | | | | | | |
Intangible assets | | | 9 | | | | - | | | | - | | | | - | | | | - | | | | - | | | | - | | | | 9 | |
| | | | | | | | |
Tangible assets, property and equipment | | | 33 | | | | - | | | | - | | | | - | | | | - | | | | - | | | | - | | | | 33 | |
| | | | | | | | |
Other assets | | | | | | | | | | | | | | | | | | | | | | | | | | | | | | | | |
| | | | | | | | |
Derivatives | | | -7,751 | | | | 8,844 | | | | -2,060 | | | | -1,523 | | | | -4,687 | | | | 7,641 | | | | 1,354 | | | | 1,817 | |
| | | | | | | | |
Other assets | | | 34 | | | | 0 | | | | 0 | | | | 0 | | | | 0 | | | | 0 | | | | - | | | | 35 | |
| | | | | | | | |
| | | | -7,716 | | | | 8,844 | | | | -2,060 | | | | -1,523 | | | | -4,687 | | | | 7,641 | | | | 1,354 | | | | 1,852 | |
| | | | | | | | |
Accrued interest and fees receivable | | | 69 | | | | 93 | | | | 20 | | | | 42 | | | | 26 | | | | 75 | | | | - | | | | 325 | |
| | | | | | | | |
Total assets | | | 12,086 | | | | 11,928 | | | | 2,480 | | | | 3,939 | | | | 412 | | | | 7,856 | | | | 577 | | | | 39,280 | |
| | |
| | |
ANNUAL REPORT 2022 | | 161 |
| | |
|
| |
| INTRODUCTION |
| |
| IMPACT |
| |
| GOVERNANCE |
| |
| BOD REPORT |
| |
| FINANCIALS |
| |
Operating and financial review |
| |
Capital and liquidity management |
| |
u Financial statements and notes |
| |
Proposal by the Board of Directors |
| |
Auditor’s report |
| |
Report of the Control Committee Chairmanship |
| |
Report of the Control Committee |
| |
Ratio definitions |
| |
| SUSTAINABILITY INDICES |
| |
| |
| |
| |
| |
| |
| |
| |
| |
| |
| |
| |
| |
| |
| |
| |
| |
| |
| |
| |
| |
| |
| |
| |
| | | | | | | | | | | | | | | | | | | | | | | | | | | | | | | | |
| | | | | | | | | |
| In millions of euro | | EUR | | | USD | | | SEK | | | NOK | | | DKK | | | Other
currencies | | | Fair value adjustments
and swap netting | | | Total | |
| | | | | | | | |
Liabilities and equity | | | | | | | | | | | | | | | | | | | | | | | | | | | | | | | | |
| | | | | | | | |
Liabilities | | | | | | | | | | | | | | | | | | | | | | | | | | | | | | | | |
| | | | | | | | |
Amounts owed to credit institutions | | | | | | | | | | | | | | | | | | | | | | | | | | | | | | | | |
| | | | | | | | |
Short-term amounts owed to credit institutions | | | 689 | | | | - | | | | - | | | | - | | | | - | | | | - | | | | - | | | | 689 | |
| | | | | | | | |
Debt evidenced by certificates | | | 7,245 | | | | 11,828 | | | | 2,459 | | | | 3,885 | | | | 402 | | | | 7,744 | | | | -1,968 | | | | 31,595 | |
| | | | | | | | |
Other Liabilities | | | | | | | | | | | | | | | | | | | | | | | | | | | | | | | | |
| | | | | | | | |
Derivatives | | | - | | | | - | | | | - | | | | - | | | | - | | | | - | | | | 2,540 | | | | 2,540 | |
| | | | | | | | |
Other liabilities | | | 26 | | | | 14 | | | | 2 | | | | 10 | | | | 2 | | | | 37 | | | | - | | | | 90 | |
| | | | | | | | |
| | | | 26 | | | | 14 | | | | 2 | | | | 10 | | | | 2 | | | | 37 | | | | 2,540 | | | | 2,630 | |
| | | | | | | | |
Accrued interest and fees payable | | | 35 | | | | 86 | | | | 19 | | | | 44 | | | | 8 | | | | 74 | | | | 0 | | | | 265 | |
| | | | | | | | |
Total liabilities | | | 7,994 | | | | 11,928 | | | | 2,479 | | | | 3,939 | | | | 411 | | | | 7,855 | | | | 572 | | | | 35,179 | |
| | | | | | | | |
Equity | | | 3,955 | | | | - | | | | - | | | | - | | | | - | | | | - | | | | 6 | | | | 3,962 | |
| | | | | | | | |
Total liabilities and equity | | | 11,949 | | | | 11,928 | | | | 2,479 | | | | 3,939 | | | | 411 | | | | 7,855 | | | | 578 | | | | 39,140 | |
| | | | | | | | |
| | | | | | | | | | | | | | | | | | | | | | | | | | | | | | | | |
| | | | | | | | |
Net of assets and liabilities as of 31 Dec 2022 | | | 137 | | | | 0 | | | | 1 | | | | 1 | | | | 1 | | | | 1 | | | | -1 | | | | 139 | |
| | |
| | |
ANNUAL REPORT 2022 | | 162 |
| | |
|
| |
| INTRODUCTION |
| |
| IMPACT |
| |
| GOVERNANCE |
| |
| BOD REPORT |
| |
| FINANCIALS |
| |
Operating and financial review |
| |
Capital and liquidity management |
| |
u Financial statements and notes |
| |
Proposal by the Board of Directors |
| |
Auditor’s report |
| |
Report of the Control Committee Chairmanship |
| |
Report of the Control Committee |
| |
Ratio definitions |
| |
| SUSTAINABILITY INDICES |
| |
| |
| |
| |
| |
| |
| |
| |
| |
| |
| |
| |
| |
| |
| |
| |
| |
| |
| |
| |
| |
| |
| |
| |
Net currency position as of 31 December 2021
| | | | | | | | | | | | | | | | | | | | | | | | | | | | | | | | |
| In millions of euro | | EUR | | | USD | | | SEK | | | NOK | | | DKK | | | Other
currencies | | | Fair value adjustments
and swap netting | | | Total | |
Assets | | | | | | | | | | | | | | | | | | | | | | | | | | | | | | | | |
Cash and cash equivalents | | | 1,446 | | | | 79 | | | | - | | | | - | | | | 299 | | | | 2 | | | | - | | | | 1,826 | |
Financial placements | | | | | | | | | | | | | | | | | | | | | | | | | | | | | | | | |
Placements with credit institutions | | | 2,538 | | | | - | | | | - | | | | 104 | | | | 1,238 | | | | - | | | | 2 | | | | 3,881 | |
Debt securities | | | 3,945 | | | | 1,078 | | | | 494 | | | | 1,088 | | | | 1,675 | | | | - | | | | 11 | | | | 8,291 | |
Other financial placements | | | 9 | | | | - | | | | - | | | | - | | | | - | | | | - | | | | - | | | | 9 | |
| | | | 6,491 | | | | 1,078 | | | | 494 | | | | 1,191 | | | | 2,913 | | | | 0 | | | | 13 | | | | 12,181 | |
Loans outstanding | | | 9,465 | | | | 1,443 | | | | 4,409 | | | | 4,742 | | | | 1,610 | | | | 202 | | | | 104 | | | | 21,975 | |
Intangible assets | | | 8 | | | | - | | | | - | | | | - | | | | - | | | | - | | | | - | | | | 8 | |
Tangible assets, property and equipment | | | 36 | | | | - | | | | - | | | | - | | | | - | | | | - | | | | - | | | | 36 | |
Other assets | | | | | | | | | | | | | | | | | | | | | | | | | | | | | | | | |
Derivatives | | | -6,409 | | | | 7,942 | | | | -1,971 | | | | -2,249 | | | | -4,709 | | | | 7,394 | | | | 1,256 | | | | 1,255 | |
Other assets | | | 32 | | | | - | | | | - | | | | - | | | | - | | | | - | | | | - | | | | 32 | |
| | | | -6,378 | | | | 7,942 | | | | -1,971 | | | | -2,249 | | | | -4,709 | | | | 7,394 | | | | 1,256 | | | | 1,287 | |
Accrued interest and fees receivable | | | 62 | | | | 48 | | | | 16 | | | | 37 | | | | 18 | | | | 60 | | | | - | | | | 241 | |
Total assets | | | 11,130 | | | | 10,590 | | | | 2,948 | | | | 3,722 | | | | 132 | | | | 7,658 | | | | 1,374 | | | | 37,553 | |
| | |
| | |
ANNUAL REPORT 2022 | | 163 |
| | |
|
| |
| INTRODUCTION |
| |
| IMPACT |
| |
| GOVERNANCE |
| |
| BOD REPORT |
| |
| FINANCIALS |
| |
Operating and financial review |
| |
Capital and liquidity management |
| |
u Financial statements and notes |
| |
Proposal by the Board of Directors |
| |
Auditor’s report |
| |
Report of the Control Committee Chairmanship |
| |
Report of the Control Committee |
| |
Ratio definitions |
| |
| SUSTAINABILITY INDICES |
| |
| |
| |
| |
| |
| |
| |
| |
| |
| |
| |
| |
| |
| |
| |
| |
| |
| |
| |
| |
| |
| |
| |
| |
| | | | | | | | | | | | | | | | | | | | | | | | | | | | | | | | |
| In millions of euro | | EUR | | | USD | | | SEK | | | NOK | | | DKK | | | Other
currencies | | | Fair value adjustments
and swap netting | | | Total | |
Liabilities and equity | | | | | | | | | | | | | | | | | | | | | | | | | | | | | | | | |
Liabilities | | | | | | | | | | | | | | | | | | | | | | | | | | | | | | | | |
Amounts owed to credit institutions | | | | | | | | | | | | | | | | | | | | | | | | | | | | | | | | |
Short-term amounts owed to credit institutions | | | 752 | | | | - | | | | - | | | | - | | | | - | | | | - | | | | - | | | | 752 | |
Debts evidenced by certificates | | | 6,363 | | | | 10,531 | | | | 2,933 | | | | 3,685 | | | | 134 | | | | 7,588 | | | | 292 | | | | 31,526 | |
Other liabilities | | | | | | | | | | | | | | | | | | | | | | | | | | | | | | | | |
Derivatives | | | - | | | | - | | | | - | | | | - | | | | - | | | | - | | | | 1,052 | | | | 1,052 | |
Other liabilities | | | 14 | | | | 12 | | | | 3 | | | | 1 | | | | 1 | | | | 9 | | | | - | | | | 39 | |
| | | | 14 | | | | 12 | | | | 3 | | | | 1 | | | | 1 | | | | 9 | | | | 1,052 | | | | 1,092 | |
Accrued interest and fees payable | | | 35 | | | | 46 | | | | 12 | | | | 36 | | | | -3 | | | | 59 | | | | - | | | | 185 | |
Total liabilities | | | 7,164 | | | | 10,588 | | | | 2,948 | | | | 3,722 | | | | 132 | | | | 7,656 | | | | 1,345 | | | | 33,555 | |
Equity | | | 3,836 | | | | 0 | | | | 0 | | | | 0 | | | | 0 | | | | 0 | | | | 3 | | | | 3,839 | |
Total liabilities and equity | | | 11,000 | | | | 10,588 | | | | 2,948 | | | | 3,722 | | | | 132 | | | | 7,656 | | | | 1,348 | | | | 37,394 | |
| | | | | | | | | | | | | | | | | | | | | | | | | | | | | | | | | |
Net of assets and liabilities as of 31 Dec 2021 | | | 130 | | | | 1 | | | | 0 | | | | 0 | | | | 0 | | | | 1 | | | | 26 | | | | 159 | |
| | |
| | |
ANNUAL REPORT 2022 | | 164 |
| | |
|
| |
| INTRODUCTION |
| |
| IMPACT |
| |
| GOVERNANCE |
| |
| BOD REPORT |
| |
| FINANCIALS |
| |
Operating and financial review |
| |
Capital and liquidity management |
| |
u Financial statements and notes |
| |
Proposal by the Board of Directors |
| |
Auditor’s report |
| |
Report of the Control Committee Chairmanship |
| |
Report of the Control Committee |
| |
Ratio definitions |
| |
| SUSTAINABILITY INDICES |
| |
| |
| |
| |
| |
| |
| |
| |
| |
| |
| |
| |
| |
| |
| |
| |
| |
| |
| |
| |
| |
| |
| |
| |
Note 24: Derivatives held for risk management and hedge accounting
Derivatives
| | | | | | | | | | | | | | | | | | | | | | | | |
| | | 31 December 2022 | | | 31 December 2021 | |
| | | | | | Fair value | | | | | | Fair value | |
| In millions of euro | | Nominal amount | | | Positive | | | Negative | | | Nominal amount | | | Positive | | | Negative | |
Interest rate swaps | | | 9,091 | | | | 203 | | | | 19 | | | | 4,035 | | | | 31 | | | | 16 | |
Cross currency swaps | | | 12,849 | | | | 970 | | | | 60 | | | | 11,280 | | | | 501 | | | | 167 | |
Currency swaps | | | 3,716 | | | | 0 | | | | 74 | | | | 4,729 | | | | 74 | | | | 11 | |
Derivatives not used for hedge accounting | | | 25,656 | | | | 1,174 | | | | 153 | | | | 20,044 | | | | 606 | | | | 194 | |
Fair value hedges | | | 35,891 | | | | 643 | | | | 2,387 | | | | 34,712 | | | | 649 | | | | 859 | |
Total derivatives | | | 61,547 | | | | 1,817 | | | | 2,540 | | | | 54,755 | | | | 1,255 | | | | 1,053 | |
| | | | | | | | | | | | | | | | | | | | | | | | |
| | | | | | | | | | | | | | | | | | | | | | | | |
| Fair value hedges | | | | | | | | | | | | | | | | | | | | | | | | |
| Hedged items | | | | | | | | | | | | | | | | | | | | | | | | |
| | | | | | | | | | | | | | | | | | | | | | | | |
| 2022 | | | | | Carrying amount | | | | | | Accumulated hedge adjustment
included in the carrying amount | |
| In millions of euro | | Nominal amount | | | Assets | | | Liabilities | | | Change in fair value
used for recognising
hedge ineffectiveness | | | Assets | | | Liabilities | |
Loans outstanding | | | 5,547 | | | | 5,065 | | | | - | | | | -586 | | | | -482 | | | | - | |
Debts evidenced by certificates | | | 30,433 | | | | - | | | | 28,412 | | | | 2,202 | | | | - | | | | -1,979 | |
Total | | | 35,980 | | | | 5,065 | | | | 28,412 | | | | 1,615 | | | | -482 | | | | -1,979 | |
| | | | | | |
| | | | | | | | | | | | | | | | | | | | | | | | | |
| 2021 | | | | | Carrying amount | | | | | | Accumulated hedge adjustment included in the carrying amount | |
| In millions of euro | | Nominal amount | | | Assets | | | Liabilities | | | Change in fair value
used for recognising
hedge ineffectiveness | | | Assets | | | Liabilities | |
Loans outstanding | | | 5,095 | | | | 5,200 | | | | - | | | | -149 | | | | 105 | | | | - | |
Debts evidenced by certificates | | | 29,398 | | | | - | | | | 29,619 | | | | 720 | | | | - | | | | 222 | |
Total | | | 34,493 | | | | 5,200 | | | | 29,619 | | | | 571 | | | | 105 | | | | 222 | |
| | |
| | |
ANNUAL REPORT 2022 | | 165 |
| | |
|
| |
| INTRODUCTION |
| |
| IMPACT |
| |
| GOVERNANCE |
| |
| BOD REPORT |
| |
| FINANCIALS |
| |
Operating and financial review |
| |
Capital and liquidity management |
| |
u Financial statements and notes |
| |
Proposal by the Board of Directors |
| |
Auditor’s report |
| |
Report of the Control Committee Chairmanship |
| |
Report of the Control Committee |
| |
Ratio definitions |
| |
| SUSTAINABILITY INDICES |
| |
| |
| |
| |
| |
| |
| |
| |
| |
| |
| |
| |
| |
| |
| |
| |
| |
| |
| |
| |
| |
| |
| |
| |
Derivatives used for hedge accounting
| | | | | | | | | | | | | | | | | | | | | | | | |
| 2022 | | | | | Carrying amount | | | | | | | | | | |
| In millions of euro | | Nominal amount | | | Assets | | | Liabilities | | | Change in fair value
used for recognising
hedge ineffectiveness | | | Ineffectiveness
recognised in
profit or loss | | | Cost of hedging
recognised in OCI | |
Swaps hedging loans outstanding | | | 5,458 | | | | 539 | | | | 16 | | | | 620 | | | | 33 | | | | 2 | |
Swaps hedging debts evidenced by certificates | | | 30,433 | | | | 104 | | | | 2,371 | | | | -2,236 | | | | -34 | | | | -5 | |
Total | | | 35,891 | | | | 643 | | | | 2,387 | | | | -1,616 | | | | -1 | | | | -3 | |
| | |
| 2021 | | | | | Carrying amount | | | | | | | | | | |
| In millions of euro | | Nominal amount | | | Assets | | | Liabilities | | | Change in fair value
used for recognising
hedge ineffectiveness | | | Ineffectiveness
recognised in
profit or loss | | | Cost of hedging
recognised in
OCI | |
Swaps hedging loans outstanding | | | 5,314 | | | | 48 | | | | 147 | | | | 174 | | | | 25 | | | | 0 | |
Swaps hedging debts evidenced by certificates | | | 29,398 | | | | 601 | | | | 712 | | | | -783 | | | | -62 | | | | -22 | |
Total | | | 34,712 | | | | 649 | | | | 859 | | | | -609 | | | | -38 | | | | -22 | |
The Bank is subject to market risks arising from fluctuations in exchange rates, interest rates, credit spreads and cross currency basis spreads. The Bank employs a number of hedging strategies to mitigate against these risks as described in Note 2: Risk management, however the Bank only applies hedge accounting for some strategies as described below.
Hedge Accounting
The Bank uses interest and cross-currency swaps to hedge its exposure to changes in the fair values of fixed rate funding and lending transactions. The Bank is not allowed under its Risk Management Policy to have open positions, therefore all fixed rate transactions are swapped
back to back. As a consequence, the critical terms of the hedged item and hedging instrument are closely aligned and the maturities of the hedging instruments match the maturities of the underlying hedged items. For more information regarding the maturities of financial assets and liabilities see Note 21: Maturity profile of financial assets and liabilities. In addition to the qualitative assessment of critical terms, the Bank assesses the effectiveness of the hedges by comparing changes in the fair value of the hedged risk with changes in the fair value of the related hedging instrument. Ineffectiveness is recorded in the Statement of Comprehensive income in the line item “Net profit/loss on financial operations”.
| | |
| | |
ANNUAL REPORT 2022 | | 166 |
| | |
|
| |
| INTRODUCTION |
| |
| IMPACT |
| |
| GOVERNANCE |
| |
| BOD REPORT |
| |
| FINANCIALS |
| |
Operatingand financial review |
| |
Capital and liquidity management |
| |
u Financial statements and notes |
| |
Proposal by the Board of Directors |
| |
Auditor’s report |
| |
Report of the Control Committee Chairmanship |
| |
Report of the Control Committee |
| |
Ratio definitions |
| |
| SUSTAINABILITY INDICES |
| |
| |
| |
| |
| |
| |
| |
| |
| |
| |
| |
| |
| |
| |
| |
| |
| |
| |
| |
| |
| |
| |
| |
| |
Note 25: Related party disclosures
Nordic Development Fund and Nordic Environment Finance Corporation
According to the constituent documents of Nordic Development Fund (NDF) and Nordic Environment Finance Corporation (NEFCO), their principal offices shall be located at the principal office of Nordic Investment Bank (NIB). Furthermore, the Statutes of NDF and NEFCO set out that their Control Committee members appointed by the Nordic Council shall be the same persons as appointed by the Council to the Control Committee of NIB. In addition, the Statutes of NDF and NEFCO set out that the powers vested in their respective Board of Directors may to the extent appropriate be delegated to the President of the respective organisation and/or to NIB.
The Bank provides administrative services to NDF and NEFCO the compensation of which is disclosed in Note 8. The following table shows the outstanding balance of amounts owed to NDF, NEFCO and the trust funds administered by them, and the interest paid during the year. The interest paid to these institutions is at normal commercial rates. At 31 December 2022, NIB had loans agreed but not disbursed to NEFCO amounting to EUR 29 million.
| | | | | | | | | | | | | | | | |
| | | | | |
| In thousands of euro | | Lending
fees from
related parties | | | Interest to
related parties | | | Amounts owed by
related parties
as of 31 Dec | | | Amounts owed to
related parties
as of 31 Dec | |
| | | | |
2022 | | | 46 | | | | 8 | | | | 1,058 | | | | - | |
| | | | |
2021 | | | 122 | | | | 1 | | | | 1,036 | | | | 11 | |
Rental income (NDF, NEFCO)
| | | | | | | | |
| | | |
| In thousands of euro | | | NDF | | | | NEFCO | |
| | |
2022 | | | 221 | | | | 396 | |
| | |
2021 | | | 161 | | | | 274 | |
Key management personnel
The Bank has identified members of the Board of Directors, the Control Committee and the Executive Committee as key management personnel. Information regarding the compensation of key management personnel for the relevant reporting periods can be found in Note 7. There have been no other transactions between the Bank and key management personnel.
| | |
| | |
ANNUAL REPORT 2022 | | 167 |
| | |
|
| |
| INTRODUCTION |
| |
| IMPACT |
| |
| GOVERNANCE |
| |
| BOD REPORT |
| |
| FINANCIALS |
| |
Operatingand financial review |
| |
Capital and liquidity management |
| |
u Financial statements and notes |
| |
Proposal by the Board of Directors |
| |
Auditor’s report |
| |
Report of the Control Committee Chairmanship |
| |
Report of the Control Committee |
| |
Ratio definitions |
| |
| SUSTAINABILITY INDICES |
| |
| |
| |
| |
| |
| |
| |
| |
| |
| |
| |
| |
| |
| |
| |
| |
| |
| |
| |
| |
| |
| |
| |
| |
Note 26: Cash flow statement
Specification of the change in cash and cash equivalents, net on 31 December:
| | | | | | | | |
| In thousands of euro | | 2022 | | | 2021 | |
Cash and balances with banks 1 | | | 628,707 | | | | 615,017 | |
Short-term placements with credit institutions ² | | | 1,400,403 | | | | 508,608 | |
Collateralised placements 3 | | | 49,296 | | | | 702,826 | |
Cash and cash equivalents | | | 2,078,406 | | | | 1,826,451 | |
Short-term amounts owed to credit institutions 4 | | | -689,120 | | | | -751,697 | |
Cash and cash equivalents, net | | | 1,389,286 | | | | 1,074,754 | |
| | | | | | | | | |
Change in cash and cash equivalents, net | | | 314,532 | | | | -471,837 | |
1 Including an initial margin requirement of EUR 43 (72) thousand for futures on 31 December
2 of which cash given as collateral EUR 1,150,135 (400,056) thousand
3 Net exposure after collaterals for placements with collateral EUR 1,002 (6,231) thousand
4 Of which cash received as collateral EUR 688,943 (751,697) thousand
Note 27: Exchange rates
| | | | | | | | |
| | | Euro
exchange
rate at
31 December
2022 | | | Euro
exchange
rate at
31 December
2021 | |
DKK Danish krone | | | 7.43643 | | | | 7.43631 | |
ISK Icelandic króna | | | 151.4919 | | | | 147.6015 | |
NOK Norwegian krone | | | 10.51846 | | | | 9.98652 | |
SEK Swedish krona | | | 11.11912 | | | | 10.25463 | |
ARS Argentine peso | | | 188.5717 | | | | 116.269 | |
AUD Australian dollar | | | 1.57119 | | | | 1.56278 | |
BRL Brazilian real | | | 5.64246 | | | | 6.30986 | |
CAD Canadian dollar | | | 1.44485 | | | | 1.44034 | |
CHF Swiss franc | | | 0.98514 | | | | 1.03278 | |
CNH Chinese Yuan Renminbi | | | 7.37607 | | | | 7.20367 | |
CZK Czech koruna | | | 24.11555 | | | | 24.8715 | |
GBP Pound sterling | | | 0.88738 | | | | 0.84007 | |
HKD Hong Kong dollar | | | 8.32236 | | | | 8.83298 | |
INR Indian rupee | | | 88.2144 | | | | 84.2285 | |
JPY Japanese yen | | | 140.7805 | | | | 130.4065 | |
MXN Mexican peso | | | 20.88304 | | | | 23.15421 | |
NZD New Zealand dollar | | | 1.68136 | | | | 1.65886 | |
PLN Polish zloty | | | 4.68417 | | | | 4.59711 | |
RON Romanian leu | | | 4.94875 | | | | 4.94908 | |
RUB Russian rouble | | | 77.9073 | | | | 85.3551 | |
SDR Special drawing right | | | 0.79862 | | | | 0.8081 | |
SGD Singapore dollar | | | 1.4306 | | | | 1.52858 | |
TRY Turkish lira | | | 19.97859 | | | | 15.24985 | |
TWD New Taiwan dollar | | | 32.73439 | | | | 31.37604 | |
USD US dollar | | | 1.06733 | | | | 1.13257 | |
ZAR South African rand | | | 18.10612 | | | | 18.07144 | |
The Bank uses exchange rates acquired from a leading market data provider based on rates prevailing at 13:00 GMT at 31 December except for Special drawing right (SDR) which is based on the International Monetary Fund (IMF) published rate.
| | |
| | |
ANNUAL REPORT 2022 | | 168 |
| | |
|
| |
| INTRODUCTION |
| |
| IMPACT |
| |
| GOVERNANCE |
| |
| BOD REPORT |
| |
| FINANCIALS |
| |
Operatingand financial review |
| |
Capital and liquidity management |
| |
u Financial statements and notes |
| |
Proposal by the Board of Directors |
| |
Auditor’s report |
| |
Report of the Control Committee Chairmanship |
| |
Report of the Control Committee |
| |
Ratio definitions |
| |
| SUSTAINABILITY INDICES |
| |
| |
| |
| |
| |
| |
| |
| |
| |
| |
| |
| |
| |
| |
| |
| |
| |
| |
| |
| |
| |
| |
| |
| |
Note 28: Post balance sheet events
There have been no material post balance sheet events that would require disclosure or adjustment to these financial statements.
| | |
Hans Lindblad
| | |
ANNUAL REPORT 2022 | | 169 |
| | |
|
| |
| INTRODUCTION |
| |
| IMPACT |
| |
| GOVERNANCE |
| |
| BOD REPORT |
| |
| FINANCIALS |
| |
Operating and financial review |
| |
Capital and liquidity management |
| |
Financial statements and notes |
| |
u Proposal by the Board of Directors |
| |
Auditor’s report |
| |
Report of the Control Committee Chairmanship |
| |
Report of the Control Committee |
| |
Ratio definitions |
| |
| SUSTAINABILITY INDICES |
| |
| |
| |
| |
| |
| |
| |
| |
| |
| |
| |
| |
| |
| |
| |
| |
| |
| |
| |
| |
| |
| |
| |
| |
Proposal by the Board of Directors to the Board of Governors
The Board of Directors’ proposal with regard to the financial results for the year 2022 takes into account the need to maintain the Bank’s ratio of equity to total risk-weighted assets at a secure level, which is a prerequisite for maintaining the Bank’s high creditworthiness. It maintains the banks status as a dividend-paying entity and provides a return on the capital to the shareholders.
In accordance with Section 11 of the Statutes of the Bank, the profit for 2022 of EUR 139,272,860.30 is to be allocated as follows:
| - | EUR 114,272,860.30 will be transferred to the General Credit Risk Fund as a part of equity; and |
| - | EUR 25,000,000.00 will be made available for distribution as dividends to the bank’s member countries. |
More information can be found in the statement of comprehensive income, the statement of financial position, the changes in equity and cash flow statement, as well as the notes to the financial statements.
| | | | | | | | |
| | Helsinki, 23 February 2023 | | |
| | |
Ole Hovland (Chair of the Board) | | | | Merle Wilkinson (Deputy Chair) |
| | |
Julie Sonne | | Pekka Morén | | Esther Finnbogadóttir |
| | |
Līga Kļaviņa | | Jurgita Uzielienė | | Hans Lindblad |
| | |
| | |
ANNUAL REPORT 2022 | | 170 |
| | |
|
| |
| INTRODUCTION |
| |
| IMPACT |
| |
| GOVERNANCE |
| |
| BOD REPORT |
| |
| FINANCIALS |
| |
Operating and financial review |
| |
Capital and liquidity management |
| |
Financial statements and notes |
| |
Proposal by the Board of Directors |
| |
u Auditor’s report |
| |
Report of the Control Committee Chairmanship |
| |
Report of the Control Committee |
| |
Ratio definitions |
| |
| SUSTAINABILITY INDICES |
| |
| |
| |
| |
| |
| |
| |
| |
| |
| |
| |
| |
| |
| |
| |
| |
| |
| |
| |
| |
| |
| |
| |
| |
Auditor’s Report
To the Control Committee of Nordic Investment Bank
Report on the Audit of the Financial Statements
Opinion
We have audited the financial statements of Nordic Investment Bank (the Bank) which comprise the statement of financial position as at 31 December 2022, and the statement of comprehensive income, statement of changes in equity and statement of cash flows for the year then ended, and notes to the financial statements, including a summary of significant accounting policies. The financial statements of the Bank are included on pages 102-169 in this document.
In our opinion the financial statements present fairly, in all material respects, the Nordic Investment Bank’s financial position as at 31 December 2022 and its financial performance and its cash flows for the year then ended in accordance with International Financial Reporting Standards (IFRS).
Basis for Opinion
We conducted our audit in accordance with International Standards on Auditing (ISAs). Our responsibilities under those standards are further described in the Auditor’s Responsibilities for the Audit of Financial Statements section of our report.
We are independent of the Bank in accordance with the International Ethics Standards Board of Accountants’ Code of Ethics for Professional Accountants (IESBA Code) together with the ethical requirements that are relevant to our audit of the financial statements, and we have fulfilled our other ethical responsibilities in accordance with these requirements and the IESBA Code.
We believe that the audit evidence we have obtained is suffïcient and appropriate to provide a basis for our opinion.
Key Audit Matters
Key audit matters are those matters that, in our professional judgment, were of most significance in our audit of the financial statements of the current period. These matters were addressed in the context of our audit of the financial statements as a whole, and in forming our opinion thereon, and we do not provide a separate opinion on these matters. For each matter below, our description of how our audit addressed the matter is provided in that context.
We have fulfilled the responsibilities described in the Auditor’s Responsibilities for the Audit of the Financial Statements section of our report, including in relation to these matters. Accordingly, our audit included the performance of procedures designed to respond to our assessment of the risks of material misstatement of the financial statements. The results of our audit procedures, including the procedures performed to address the matters below, provide the basis for our audit opinion on the accompanying financial statements.
| | |
| | |
ANNUAL REPORT 2022 | | 171 |
| | |
|
| |
| INTRODUCTION |
| |
| IMPACT |
| |
| GOVERNANCE |
| |
| BOD REPORT |
| |
| FINANCIALS |
| |
Operating and financial review |
| |
Capital and liquidity management |
| |
Financial statements and notes |
| |
Proposal by the Board of Directors |
| |
u Auditor’s report |
| |
Report of the Control Committee Chairmanship |
| |
Report of the Control Committee |
| |
Ratio definitions |
| |
| SUSTAINABILITY INDICES |
| |
| |
| |
| |
| |
| |
| |
| |
| |
| |
| |
| |
| |
| |
| |
| |
| |
| |
| |
| |
| |
| |
| |
| |
| | | | |
| Fair value measurement of financial instruments |
| | | |
| Description | | | | How our audit addressed this key audit matter |
| | |
We refer to the Bank’s accounting policies in Note 1 “Determination of fair value” and, “Significant accounting judgements and estimates” and the notes 11, 15, 17 and 20 As a result of the Bank’s business model, a significant portion of the Bank’s balance sheet comprise of financial instruments valued at fair value, these financial instruments consist of bonds and derivatives. The Bank has financial instruments where no market price is available, and in these cases, fair value is determined using valuation models based on market data. These financial instruments are categorised as level 2 in the IFRS fair value valuation hierarchy. The Bank also has financial instruments for which the fair value measurement has been determined using valuation models where the value is affected by input data that cannot be verified by external market data. These financial instruments are categorised as level 3 in the IFRS fair value valuation hierarchy. The Bank has financial assets and financial liabilities categorised as level 2 totalling EUR 27 986 million and EUR 33 951 million respectively. Financial assets and liabilities categorised as level 3 totalling EUR 37 million and EUR 808 million respectively. The measurement of financial instruments includes assessments made by the Bank, since valuation models are used. The valuation of these financial instruments is therefore deemed to be a key audit matter. | | | | Our audit procedures over financial instruments included, among others: • gaining on understanding of the processes and controls put in place by the Bank to identify, measure and recognize financial instruments • testing the general IT controls, including the handling of authorisation and user access regarding the most significant systems used for valuing financial instruments at year end • testing the valuation of financial instruments at fair value by comparing the values recorded to independently obtained market prices on input data on a sample basis • including valuation specialists in our audit team to carry out independent valuations on a sample basis for various types of financial instruments across the entire fair value hierarchy of financial assets and liabilities • examining the assumptions, methodologies and models used by the Bank to estimate value of complex derivative financial instruments using internal models and/or unobservable data. • compared the assumptions made with appropriate benchmarks and price sources and examined any significant deviations • assessing the Bank’s disclosures with presentation requirements in applicable accounting standards. |
| | |
| | |
ANNUAL REPORT 2022 | | 172 |
| | |
|
| |
| INTRODUCTION |
| |
| IMPACT |
| |
| GOVERNANCE |
| |
| BOD REPORT |
| |
| FINANCIALS |
| |
Operating and financial review |
| |
Capital and liquidity management |
| |
Financial statements and notes |
| |
Proposal by the Board of Directors |
| |
u Auditor’s report |
| |
Report of the Control Committee Chairmanship |
| |
Report of the Control Committee |
| |
Ratio definitions |
| |
| SUSTAINABILITY INDICES |
| |
| |
| |
| |
| |
| |
| |
| |
| |
| |
| |
| |
| |
| |
| |
| |
| |
| |
| |
| |
| |
| |
| |
| |
| | | | |
| Hedge accounting |
| | �� | |
| Description | | | | How our audit addressed this key audit matter |
| | |
We refer to the Bank’s accounting policies in Note 1 “Derivative instruments and hedge accounting” and the notes 2, 20 and 24 The Bank enters into derivative financial instruments to manage its exposure to interest rate and foreign currency risk. Interest rate related derivatives are identified as hedging instruments in fair value hedge accounting relationships. Since hedge accounting is applied, such gains and losses arising from fair value changes on the derivatives are recognized in profit and loss. Derivatives to which hedge accounting is not applied are recorded at fair value through profit and loss. The hedged interest rate risk of the borrowing and lending transactions that are identified as hedged item is valued at fair value. At December 31, 2022 the Bank has EUR 5 065 million of loans identified as hedged instruments, and EUR 28 412 million of borrowing. The hedging derivatives have fair values of net EUR 523 million for assets of which EUR 2 million is recognized in OCI for the year and net EUR -2 267 million for liabilities of which EUR -5 million is recognized in OCI for the year. The application of hedge accounting is deemed to be a key audit matter as the large number of contracts necessitates a system to record and track each contract and consideration of hedge effectiveness can involve a significant degree of both complexity and management judgement and are subject to an inherent risk of error. | | | | Our audit procedures over hedge accounting included, among others: • gaining on understanding of the processes and controls put in place by the Bank to identify, measure and recognize hedge accounting relationships • inspecting, on a sample basis, the Bank’s hedge documentation and contracts • including specialists in our audit team to carry out independent valuations on a sample basis for fair value hedges • assessing the Bank’ disclosures with presentation requirements in applicable accounting standards. |
| | |
| | |
ANNUAL REPORT 2022 | | 173 |
| | |
|
| |
| INTRODUCTION |
| |
| IMPACT |
| |
| GOVERNANCE |
| |
| BOD REPORT |
| |
| FINANCIALS |
| |
Operating and financial review |
| |
Capital and liquidity management |
| |
Financial statements and notes |
| |
Proposal by the Board of Directors |
| |
u Auditor’s report |
| |
Report of the Control Committee Chairmanship |
| |
Report of the Control Committee |
| |
Ratio definitions |
| |
| SUSTAINABILITY INDICES |
| |
| |
| |
| |
| |
| |
| |
| |
| |
| |
| |
| |
| |
| |
| |
| |
| |
| |
| |
| |
| |
| |
| |
| |
| | | | |
| Granting of loans and provisioning for loan losses |
| | | |
| Description | | | | How our audit addressed this key audit matter |
We refer to the Bank’s accounting policies in Note 1 “Impairment of loans” and “Significant accounting judgements and estimates” and the notes 9, 10 and 12 Loans outstanding represent EUR 21 740 million (55 %) of total assets of the Bank which is net of impairment of loans of EUR 66 million. The credit reserve for loan commitments is EUR 8 million. The impairment requirements are based on an expected credit loss (ECL) model. The Bank is required to recognise an allowance for either 12-month or lifetime ECLs, depending on whether there has been a significant increase in credit risk since initial recognition. The calculation of expected credit loss is a complex process which included calculations reflecting a probability-weighted outcome, the time value of money and the best available forward-looking information. Further, the model incorporates forward-looking information through the inclusion of macroeconomic factors and can include management judgement and estimates. Since the outstanding loans are material and the credit risk represents the largest risk for the Bank and the related impairment are subject to judgement and estimates, we have assessed the granting of loans and provisioning of loan losses as a key audit matter. | | | | Our audit procedures on granting of loans and provisioning for loan losses included among others: • gaining on understanding of the processes and controls put in place by the Bank to grant new loans and to identify, measure and recognize impairment of loans • testing the design and efficiency of key controls in both the credit process and credit decisions, credit review rating classification as well as identifying and determining credits for which provisions should be made • testing the general IT controls, including the handling of authorisation and user access regarding these systems • evaluating the key input variables and assumptions in the ECL model including management judgment and estimates and where relevant, compared data and assumptions to external benchmark • testing the mathematical accuracy of the model • inspecting the key governance meetings including Credit Committee and Board to ensure that there are governance controls in place and • assessing the Bank’ disclosures with presentation requirements in applicable accounting standards. |
|
Other Information than the Annual Accounts
The Board of Directors and the President are responsible for the other information. The other information comprises information included in the report on pages 1-101 and 176-195, but does not include the financial statements and our auditor’s report thereon. We have obtained this other information prior to the date of this auditor’s report.
Our opinion on the financial statements does not cover the other information.
In connection with our audit of the financial statements, our responsibility is to read the other information identified above and, in doing so, consider whether the other information is
materially inconsistent with the financial statements or our knowledge obtained in the audit, or otherwise appears to be materially misstated.
In our opinion, the information on pages 1-101 and 176-195 is consistent with the information in the financial statements.
If, based on the work we have performed on the other information that we obtained prior to the date of this auditor’s report, we conclude that there is a material misstatement of this other information, we are required to report that fact. We have nothing to report in this regard.
| | |
| | |
ANNUAL REPORT 2022 | | 174 |
| | |
|
| |
| INTRODUCTION |
| |
| IMPACT |
| |
| GOVERNANCE |
| |
| BOD REPORT |
| |
| FINANCIALS |
| |
Operating and financial review |
| |
Capital and liquidity management |
| |
Financial statements and notes |
| |
Proposal by the Board of Directors |
| |
u Auditor’s report |
| |
Report of the Control Committee Chairmanship |
| |
Report of the Control Committee |
| |
Ratio definitions |
| |
| SUSTAINABILITY INDICES |
| |
| |
| |
| |
| |
| |
| |
| |
| |
| |
| |
| |
| |
| |
| |
| |
| |
| |
| |
| |
| |
| |
| |
| |
Responsibilities of the Board of Directors and the President for the Financial Statements
The Board of Directors and the President are responsible for the preparation and fair presentation of the financial statements in accordance with International Financial Reporting Standards (IFRSs), and for such internal control as they determine is necessary to enable the preparation of financial statements that are free from material misstatement, whether due to fraud or error.
In preparing the financial statements, the Board of Directors and the President are responsible for assessing the Bank’s ability to continue as going concern, disclosing, as applicable, matters relating to going concern and using the going concern basis of accounting unless management either intends to liquidate the Bank or to cease operations, or has no realistic alternative but to do so.
Those charged with governance are responsible for overseeing the Bank’s financial reporting process.
Auditor’s Responsibilities for the Audit of the Financial Statements
Our objectives are to obtain reasonable assurance on whether the financial statements as a whole are free from material misstatement, whether due to fraud or error, and to issue an auditor’s report that includes our opinion. Reasonable assurance is a high level of assurance, but is not a guarantee that an audit conducted in accordance with ISAs will always detect a material misstatement when it exists. Misstatements can arise from fraud or error and are considered material if, individually or in aggregate, they could reasonably be expected to influence the economic decisions of users taken on the basis of the financial statements.
As part of an audit in accordance with ISAs, we exercise professional judgment and maintain professional skepticism throughout the audit. We also:
| • | | Identify and assess the risks of material misstatement of the financial statements, whether due to fraud or error, design and perform audit procedures responsive to those risks, and obtain audit evidence that is sufficient and appropriate to provide a basis for our opinion. |
The risk of not detecting a material misstatement resulting from fraud is higher than for one resulting from error, as fraud may involve collusion, forgery, intentional omissions, misrepresentations, or the override of internal control.
| • | | Obtain an understanding of internal control relevant to the audit in order to design audit procedures that are appropriate in the circumstances, but not for the purpose of expressing an opinion on the effectiveness of the Bank’s internal control. |
| • | | Evaluate the appropriateness of accounting policies used and the reasonableness of accounting estimates and related disclosures made by management. |
| • | | Conclude on the appropriateness of the Board of Directors’ and the President’s use of the going concern basis of accounting and based on the audit evidence obtained, whether a material uncertainty exists related to events or conditions that may cast significant doubt on the Bank’s ability to continue as a going concern. If we conclude that a material uncertainty exists, we are required to draw attention in our auditor’s report to the related disclosures in the financial statements or, if such disclosures are inadequate, to modify our opinion. Our conclusions are based on the audit evidence obtained up to the date of our auditor’s report. However, future events or conditions may cause the Bank to cease to continue as a going concern. |
| • | | Evaluate the overall presentation, structure and content of the financial statements, including the disclosures, and whether the financial statements represent the underlying transactions and events so in a manner that achieves fair presentation. |
We communicate with those charged with governance regarding, among other matters, the planned scope and timing of the audit and significant audit findings, including any significant deficiencies in internal control that we identify during our audit.
We also provide those charged with governance with a statement that we have complied with relevant ethical requirements regarding independence, and to communicate with them all relationships and other matters that may reasonably be thought to bear on our independence, and where applicable, related safeguards.
From the matters communicated with those charged with governance, we determine those matters that were of most significance in the audit of the financial statements of the current period and are therefore the key audit matters. We describe these matters in our auditor’s report unless law or regulation precludes public disclosure about the matter or when, in extremely rare circumstances, we determine that a matter should not be communicated in our report because the adverse consequences of doing so would reasonably be expected to outweigh the public interest benefits of such communication.
| | |
| | |
ANNUAL REPORT 2022 | | 175 |
| | |
|
| |
| INTRODUCTION |
| |
| IMPACT |
| |
| GOVERNANCE |
| |
| BOD REPORT |
| |
| FINANCIALS |
| |
Operatingand financial review |
| |
Capital and liquidity management |
| |
Financial statements and notes |
| |
Proposal by the Board of Directors |
| |
u Auditor’s report |
| |
Report of the Control Committee Chairmanship |
| |
Report of the Control Committee |
| |
Ratio definitions |
| |
| SUSTAINABILITY INDICES |
| |
| |
| |
| |
| |
| |
| |
| |
| |
| |
| |
| |
| |
| |
| |
| |
| |
| |
| |
| |
| |
| |
| |
| |
Report on other requirements
Opinion
In addition to our audit of the financial statements, we have also audited the administration of the Board of Directors and the President of Nordic Investment Bank for the year 2022 in accordance with the Terms of the Engagement. In our opinion the administration of the Board of Directors and the President, in all material aspects, complied with the Statutes of the Bank.
Basis for Opinion
We conducted the audit in accordance with generally accepted auditing standards. Our responsibilities under those standards are further described in the Auditor’s Responsibilities section. We are independent of the Bank in accordance with professional ethics for accountants and have otherwise fulfilled our ethical responsibilities in accordance with these requirements.
We believe that the audit evidence we have obtained is sufficient and appropriate to provide a basis for our opinions.
Responsibilities of the Board of Directors and the President
All the powers of the Bank are vested in the Board of Directors except as what is vested in the Board of Governors provided for in Section 13 of the Statutes. The Board of Directors may delegate these powers to the President to the extent considered appropriate.
The President is responsible for the conduct of the current operations of the bank and shall follow the guidelines and instructions given by the Board of Directors.
Auditor’s Responsibilities
Our objective concerning the audit of whether the Board of Director’s and the President’s administration have complied with the Statutes of the bank, is to obtain audit evidence to assess with a reasonable degree of assurance whether any member of the Board of Directors or the President in any material respect has acted in contravention of the Statutes.
Reasonable assurance is a high level of assurance but is not a guarantee that an audit conducted in accordance with International Standards on Auditing will always detect actions or omissions that can give rise to liability to the Bank.
As part of an audit in accordance with International Standards on Auditing, we exercise professional judgment and maintain professional skepticism throughout the audit. The examination of the administration is based primarily on the audit of the accounts. Additional audit procedures performed are based on our professional judgment with starting point in risk and materiality. This means that we focus the examination on such actions, areas and relationships that are material for the operations and where deviations and violations would have particular importance for the Bank’s situation. We examine and test decisions undertaken, support for decisions, actions taken and other circumstances that are relevant to our opinion.
Auditor’s Appointment
Ernst & Young Oy and Ernst & Young AB have been appointed auditors by the Control Committee since the financial year 2018. The undersigned auditors have acted as responsible auditors since financial year 2018.
| | |
| Helsinki, 24 February 2023 | | |
| | |
| Ernst & Young Oy | | Ernst & Young AB |
| |
| Authorized Public | | Authorized Public |
| | |
| Accountant Firm | | Accountant Firm |
| |
| Terhi Mäkinen | | Mona Alfredsson |
| |
| Authorized Public | | Authorized Public |
| |
| Accountant | | Accountant |
| | |
| | |
ANNUAL REPORT 2022 | �� | 176 |
| | |
|
| |
| INTRODUCTION |
| |
| IMPACT |
| |
| GOVERNANCE |
| |
| BOD REPORT |
| |
| FINANCIALS |
| |
Operatingand financial review |
| |
Capital and liquidity management |
| |
Financial statements and notes |
| |
Proposal by the Board of Directors |
| |
Auditor’s report |
| |
u Report of the Control Committee Chairmanship |
| |
Report of the Control Committee |
| |
Ratio definitions |
| |
| SUSTAINABILITY INDICES |
| |
| |
| |
| |
| |
| |
| |
| |
| |
| |
| |
| |
| |
| |
| |
| |
| |
| |
| |
| |
| |
| |
| |
| |
Report of the Control Committee Chairmanship
To the Board of Governors of the Nordic Investment Bank.
This report from the Chairmanship has been presented to the Control Committee at its meeting on February 24, 2023.
Responsibilities of the Control Committee and its Chairmanship
1. Mandate
In accordance with Section 16 of the Statutes of the Nordic Investment Bank, the Control Committee (“Committee”) has been established to monitor that the operations of the Bank are conducted in accordance with its Statutes and the Control Committee is responsible for appointing the external auditors to carry out the audit of the Bank’s financial statements. The Control Committee is comprised of ten members, of which eight have been appointed by the Nordic Council and the Parliaments of Estonia, Latvia, and Lithuania. The remaining two members have been appointed as Chair and Deputy Chair by the Board of Governors to act as the Chairmanship, which administers the responsibilities and tasks of the Committee. More specifically, the Chairmanship focuses on overseeing the performance of the audit of the Bank’s financial statements, carried out by the external auditors, and monitors the Bank’s financial position, risk levels, and capital and liquidity positions. The Chairmanship met on seven occasions in fulfilling its obligations.
2. Chairmanship composition
The composition of the Chairmanship changed in 2022, with Mr Toomas Vapper (formerly Deputy Chair) rotating into the Chair position as of June 1, 2022. Mr Pentti Hakkarainen was from the same date appointed Deputy Chair.
The Chairmanship has also engaged the services of an external independent expert, Mr Claes Norgren, with in-depth knowledge of the banking industry to assist the Chairmanship with its monitoring activities.
Chairmanship mandate fulfilment
1. Administering the responsibilities and tasks of the Control Committee
We, the Chairmanship, reported our activities, findings and recommendations twice during the year, including the status of the external audit to the Control Committee. The Control Committee has also received the Independent Auditor’s Report on the 2022 financial statements, submitted on 24 February 2023 by the authorised public accountants. In performing our obligations, we have had unrestricted access to all information, documents, and staff necessary to fulfil our supervisory tasks.
2. Overseeing the performance of the audit of the Bank’s financial statements
We meet with the external auditors on a regular basis to agree on the audit plan and reporting the results of their work. In addition to the audit of the annual financial statements, the external auditors also review the half-year interim financial statements. They perform additional reviews and audit assignments whenever required on certain areas.
The Head of Internal Audit presents the Bank’s internal audit plan and results thereof on a regular basis.
In addition to these recurring items, the Chief Compliance Officer, the Head of Operational Risk & Security Control, as well as the Head of Credit report their activities to us at least annually.
The Chairmanship meets with both external and internal auditors without senior management presence during the year.
| | |
| | |
ANNUAL REPORT 2022 | | 177 |
| | |
|
| |
| INTRODUCTION |
| |
| IMPACT |
| |
| GOVERNANCE |
| |
| BOD REPORT |
| |
| FINANCIALS |
| |
Operating and financial review |
| |
Capital and liquidity management |
| |
Financial statements and notes |
| |
Proposal by the Board of Directors |
| |
Auditor’s report |
| |
u Report of the Control Committee Chairmanship |
| |
Report of the Control Committee |
| |
Ratio definitions |
| |
| SUSTAINABILITY INDICES |
| |
| |
| |
| |
| |
| |
| |
| |
| |
| |
| |
| |
| |
| |
| |
| |
| |
| |
| |
| |
| |
| |
| |
| |
3. Monitoring the Bank’s financial position, risk levels, and capital and liquidity positions
3.1. General
The Chairmanship meetings have several recurring agenda items. In each meeting, the President provides a business update. This is followed by the presentation of the financial position, results and development by the Chief Financial Officer (CFO) and the Risk & Capital Report by the Chief Risk Officer (CRO).
Two and half years have now passed since the Bank amended its Statutes in July 2020. A comprehensive risk-based framework for capital and liquidity management has been implemented. Institutional governance was strengthened with the implementation of an effective three lines of defence model. Operational risks and resilience (business continuity and information security) have come into increased focus and the Bank’s framework and practices for managing non-financial risks (including ESG and climate risk) are gradually maturing. The Integrity Due Diligence Policy and related procedures for lending, treasury and procurement activities were revised to incorporate current international practices regarding the prevention of financial crimes and sanctions compliance.
The Chairmanship receives and reviews multiple reports and policy updates throughout the year. Focus areas during 2022 were:
| • | | Revised ICAAP Guidelines (discussed in February), |
| • | | ICAAP Report FY2021 and stress testing outcomes (April), |
| • | | Recovery plan and related procedures (April), |
| • | | Operational Risk & Security Control incl. Information Security and Business Continuity (annual report in April and semi-annual report in November), |
| • | | Business continuity guideline and roadmap incl. Crisis management plan (April), |
| • | | Revised NIB strategy including the broadening of risk-taking (April), |
| • | | Revised Risk Management Policy, Credit Risk Policy and Credit Enhancement Guidelines reflecting the revised strategy (April & September), |
| • | | Revised ECL model incl. validation exercise (April), implementation of the revised ECL model discussed (June) and revision of the related ECL framework (November), |
| • | | Annual review of the Risk Appetite Statement and Risk Management Policy & limits (June), |
| • | | Information security roadmap and IT architecture (June & December), |
| • | | Non-financial risk review (September), |
| • | | Geopolitical circumstances (April & December). |
Considering the prevailing geopolitical and economic situation, the related risks to the Bank’s asset quality and operations were discussed on several occasions. In particular, the increasing inflation, the tightening of financial conditions (mainly via rising interest rates), disruptions in energy markets and subsequent impact on the Bank’s financial performance and counterparties. These aspects were also discussed in view of the revised strategy and broadened risk-taking including product development and broader customer segments.
Findings from previous internal IT-related audits and planned remedies were discussed. Information security and business continuity have been high on the Bank’s agenda and we have received regular updates on the Bank’s roadmap for these matters and implementation thereof.
3.2. Monitoring risk management
Monitoring of the limits and thresholds set in the Statutes and by the Board of Governors is the responsibility of the Board of Directors, who have fulfilled this obligation through the establishment of necessary frameworks, policies and procedures for the Banks’s risk, capital, leverage and liquidity management, as well as detailed policies for contingency measures and procedures. The main framework document in this regard is the Risk Appetite Statement (RAS), which was adopted in its most recent version by the Board of Directors on 7 June 2022. The RAS outlines the main considerations for the Bank’s risk-taking, risk mitigation and risk avoidance. The Bank’s risk appetite is reviewed annually by the Board of Directors with the goal of aligning risk-taking with the statutory requirements, strategic business objectives, and capital planning. The qualitative statements in the Bank’s RAS are complemented with a set of key risk indicators and their respective monitoring thresholds, including (amongst others) economic capital consumption, leverage ratios, external indicators (e.g. credit rating agencies), and liquidity survival horizon. The purpose of the indicators and thresholds is to support the evaluation of whether the Bank operates within its risk appetite. Risk limits are used to allocate the aggregate risk-taking mandate to business lines and portfolios. The main risk limits are decided by the
| | |
| | |
ANNUAL REPORT 2022 | | 178 |
| | |
|
| |
| INTRODUCTION |
| |
| IMPACT |
| |
| GOVERNANCE |
| |
| BOD REPORT |
| |
| FINANCIALS |
| |
Operating and financial review |
| |
Capital and liquidity management |
| |
Financial statements and notes |
| |
Proposal by the Board of Directors |
| |
Auditor’s report |
| |
u Report of the Control Committee Chairmanship |
| |
Report of the Control Committee |
| |
Ratio definitions |
| |
| SUSTAINABILITY INDICES |
| |
| |
| |
| |
| |
| |
| |
| |
| |
| |
| |
| |
| |
| |
| |
| |
| |
| |
| |
| |
| |
| |
| |
| |
Board of Directors and established in the Bank’s risk management policies, which were updated during 2022 to reflect the revised strategy, including broadening risk-taking.
The risk profile assessment is based on the Bank’s Internal Capital Adequacy Assessment Process (ICAAP), which also includes an assessment of liquidity adequacy. While the Bank is not directly subject to banking regulation or supervision, the Chairmanship deems it important that NIB continues to develop its risk management framework with the aim to comply in substance with relevant market standards, recommendations and best practices, consistent with the objectives of the RAS.
During 2022, the Bank’s ICAAP Guidelines were revised to reflect a number of recommendations following multiple reviews since 2019.
The Chairmanship engaged the independent external auditors (EY) to perform specific procedures with regards to the accuracy of NIB’s calculation of statutory metrics and their consistency with the Bank’s risk management framework. The Chairmanship, supported by this external review, observed that the Board of Directors had sufficient and reliable information from which to assess if NIB has adequate capital and liquidity.
3.3. Monitoring financial position
| | | | | | | | |
| | | |
| In millions of euro unless otherwise specified | | 2022 | | | 2021 | |
| | |
Net interest income | | | 219 | | | | 201 | |
| | |
Net profit | | | 139 | | | | 159 | |
| | |
Loans disbursed | | | 3,705 | | | | 2,440 | |
| | |
New debt issues | | | 9,630 | | | | 7,028 | |
| | |
Total equity | | | 4,101 | | | | 3,999 | |
| | |
Equity / total assets | | | 10.4 | % | | | 10.6 | % |
| | |
Profit / average equity | | | 3.4 | % | | | 4.1 | % |
| | |
Cost/income | | | 27.9 | % | | | 27.9 | % |
| | |
Number of people at period end | | | 228 | | | | 221 | |
The net profit for the year amounted to EUR 139 million, which is EUR 20 million lower than last year. Total operating income increased slightly, from EUR 185 million to EUR 188 million mainly due to a EUR 18 million rise in net interest income (partly offset by other items). Net fee and commission income was stable compared to 2021. Total operating expenses of EUR 53 million were only slightly (EUR 1 million) higher than in 2021. The implementation of a new ECL model and deterioration in macro-financial pushed up provisions, but this was more than offset by the release of a previous management overlay and (net aggregate) positive credit rating migrations, resulting in a slight (EUR 3 million) reversal in net loan losses. There was one realised loan loss during the year, relating to long-lasting non-performing exposures that had been fully provisioned for in earlier years – therefore without impact on net profit. The Bank has very limited direct exposure in Russia and Belarus. NIB ceased financing new projects in Russia in 2014 and no new loans have been signed in Belarus since 2012. The Bank had no other new non-performing exposures during the year.
3.4. Monitoring capital and liquidity positions
The Principles for Capital and Liquidity Management approved by the Board of Governors state that the Bank’s risk-based capital ratio must exceed 100 per cent, the Bank’s leverage ratio must exceed 7 per cent and the leverage ratio with callable capital must exceed 20 per cent and that the Bank’s liquidity survival horizon shall exceed six months. The table below provides an overview on the development of these requirements year-on-year.
| | | | | | | | | | | | |
| | | | |
| Statutory metrics | | Minimum | | | 31.12.2022 | | | 31.12.2021 | |
| | | |
Risk-based (economic) capital ratio | | | 100 | % | | | 144 | % | | | 147 | % |
| | | |
Leverage ratio | | | 7.0 | % | | | 10.8 | % | | | 10.6 | % |
| | | |
Leverage ratio with callable capital | | | 20.0 | % | | | 30.9 | % | | | 30.9 | % |
| | | |
Liquidity survival horizon (days) | | | 180 | | | | 417 | | | | 450 | |
| | |
| | |
ANNUAL REPORT 2022 | | 179 |
| | |
|
| |
| \INTRODUCTION |
| |
| IMPACT |
| |
| GOVERNANCE |
| |
| BOD REPORT |
| |
| FINANCIALS |
| |
Operating and financial review |
| |
Capital and liquidity management |
| |
Financial statements and notes |
| |
Proposal by the Board of Directors |
| |
Auditor’s report |
| |
u Report of the Control Committee Chairmanship |
| |
Report of the Control Committee |
| |
Ratio definitions |
| |
| SUSTAINABILITY INDICES |
| |
| |
| |
| |
| |
| |
| |
| |
| |
| |
| |
| |
| |
| |
| |
| |
| |
| |
| |
| |
| |
| |
| |
| |
Chairmanship conclusion
We can confirm that the Bank’s 2022 financial statements have been audited by independent external auditors. We also confirm through the procedures described above that we have monitored the Bank’s financial position, risk levels and capital, leverage and liquidity positions.
Helsinki, 24 February 2023
Toomas Vapper (Chairman of the Control Committee)
Pentti Hakkarainen (Deputy Chairman of the Control Committee)
| | |
| | |
ANNUAL REPORT 2022 | | 180 |
| | |
|
| |
| INTRODUCTION |
| |
| IMPACT |
| |
| GOVERNANCE |
| |
| BOD REPORT |
| |
| FINANCIALS |
| |
Operating and financial review |
| |
Capital and liquidity management |
| |
Financial statements and notes |
| |
Proposal by the Board of Directors |
| |
Auditor’s report |
| |
Report of the Control Committee Chairmanship |
| |
u Report of the Control Committee |
| |
Ratio definitions |
| |
| SUSTAINABILITY INDICES |
Report of the Control Committee
To the Board of Governors of the Nordic Investment Bank.
In accordance with Section 16 of the Statutes of the Nordic Investment Bank, the Control Committee (“Committee”) has been established to monitor that the operations of the Bank are conducted in accordance with its Statutes and to be responsible for appointing the external auditors to carry out the audit of the Bank’s financial statements. The Committee comprises ten members of which eight have been appointed by the Nordic Council and the Parliaments of Estonia, Latvia and Lithuania. The remaining two members have been appointed as Chair and Deputy Chair by the Board of Governors to act as the Chairmanship, which administers the responsibilities and tasks of the Committee. The Chairmanship oversees the performance of the audit of the Bank’s financial statements, carried out by the external auditors, and monitors the Bank’s financial position, risk levels and capital and liquidity position. Having completed our assignment for the year 2022, the Committee hereby submit the following report.
The Committee met twice in 2022 and its Chairmanship met on seven occasions. The Chairmanship has reported its activities, findings and recommendations including the status of the external audit to us. We have also received the Independent Auditors’ Report on the 2022 financial statements, submitted on 24 February 2023 by the authorised public accountants. In performing its obligations, the Committee and its Chairmanship have had unrestricted access to all information, documents and staff necessary to fulfil its supervisory tasks.
The Bank’s mission is to finance projects that improve the productivity and benefit the environment of the Nordic and Baltic countries. During 2022, a total of EUR 4,114 million in new loans were committed and EUR 3,705 million were disbursed. Before approval is given, all eligible projects are evaluated and rated against the mandate criteria developed based on the Bank’s mission. During 2022, mandate-rated projects achieving a “good” or “excellent” mandate rating accounted for 99% of the total amount of loans disbursed, exceeding the target level of 90% by a healthy margin.
We can confirm that the Bank’s 2022 financial statements have been audited by independent external auditors and that the Control Committee Chairmanship has reported its activities, findings and recommendations to us. We also confirm through the procedures described above that we have monitored the Bank’s financial position, risk levels and capital, leverage and liquidity positions.
We recommend to the Board of Governors that:
| - | the audited financial statements for 2022 be approved; |
| - | the allocation of the Bank’s profit as proposed by the Board of Directors, be approved. |
| | | | | | | | |
| | Helsinki, 24 February 2023 | | |
| | |
Toomas Vapper (Chair) | | | | Pentti Hakkarainen (Deputy Chair) |
| | |
Sjúrður Skaale | | Aivar Kokk | | Heli Järvinen |
| | |
Vilhjálmur Árnason | | Ilze Indriksone | | Zigmantas Balčytis |
| | | |
May Britt Lagesen | | Johan Andersson | | | | |
| | |
| | |
ANNUAL REPORT 2022 | | 181 |
| | |
| | |
| | |
| INTRODUCTION | | |
| | |
| IMPACT | | |
| | |
| GOVERNANCE | | |
| | |
| BOD REPORT | | |
| | |
| FINANCIALS | | |
| | |
Operating and financial review | | |
| | |
Capital and liquidity management | | |
| | |
Financial statements and notes | | |
| | |
Proposal by the Board of Directors | | |
| | |
Auditor’s report | | |
| | |
Report of the Control Committee Chairmanship | | |
| | |
Report of the Control Committee | | |
| | |
u Ratio definitions | | |
| | |
| SUSTAINABILITY INDICES | | |
| | |
| | | |
| | |
| | | |
| | |
| | | |
| | |
| | | |
| | |
| | | |
| | |
| | | |
| | |
| | | |
Ratio definitions
| | | | |
Equity/total assets = | | Total equity at reporting date | | |
| | Total assets at reporting date | | |
| | |
Profit/average equity = | | Annualised profit for the period | | |
| | Average equity for the period | | |
| | |
Cost/income = | | Total operating expenses for the period | | |
| | Total operating income for the period | | |
ANNUAL REPORT 2022 INTRODUCTION IMPACT GOVERNANCE BOD REPORT FINANCIALS SUSTAINABILITY INDICES GRI content index PRB content index TCFD disclosure index Sustainability indices We measure and report our impact
| | |
| | |
ANNUAL REPORT 2022 | | 183 |
| | |
| | |
| | |
| INTRODUCTION | | |
| | |
| IMPACT | | |
| | |
| GOVERNANCE | | |
| | |
| BOD REPORT | | |
| | |
| FINANCIALS | | |
| | |
| SUSTAINABILITY INDICES | | |
| | |
| u GRI content index | | |
| | |
PRB content index | | |
| | |
TCFD disclosure index | | |
| | |
| | | |
| | |
| | | |
| | |
| | | |
| | |
| | | |
| | |
| | | |
| | |
| | | |
| | |
| | | |
| | |
| | | |
| | |
| | | |
| | |
| | | |
| | |
| | | |
| | |
| | | |
| | |
| | | |
| | |
| | | |
| | |
| | | |
| | |
| | | |
| | |
| | | |
| | |
| | | |
| | |
| | | |
| | |
| | | |
| | |
| | | |
GRI content index
| | |
| Statement of use | | Nordic Investment Bank (NIB) has reported in accordance with the GRI Standards for the period 1 January to 31 December 2022. |
| GRI 1 used | | GRI 1: Foundation 2021 |
| Applicable GRI Sector Standard(s) | | No applicable sector standard available. |
| | | |
| | | | |
| GRI standard/other source | | Disclosure | | Location and comments |
General disclosures | | | | |
GRI 2: General Disclosures 2021 | | 2-1 Organisational details | | Nordic Investment Bank (NIB) headquarters and only office is located in Fabianinkatu 34, 00171 Helsinki, Finland. NIB finances projects that are located in the eight Nordic and Baltic member countries, as well as in non-member countries. See NIB’s Financial Reporting 2022 Note 12: Loans outstanding and guarantee commitments and website Signed loans for a list of financed projects. NIB is an international financial institution (IFI) owned by the governments of Denmark, Estonia, Finland, Iceland, Latvia, Lithuania, Norway and Sweden. |
| | 2-2 Entities included in the organisation’s sustainability reporting | | Nordic Investment Bank. NIB does not have any subsidiaries. |
| | 2-3 Reporting period, frequency and contact point | | Reporting period for sustainability and financial reporting is 1 January until 31 December and the reports are published 28.2.2023. This report covers the year 2022. Reporting cycle is annual. Contact: info@nib.int and report back cover. |
| | 2-4 Restatements of information | | Pages 48 and 54. In these locations part of the historical data recalculated for comparability due to the alignment of respective calculation principles or a reporting error. No material impact on historical figures. |
| | 2-5 External assurance | | p.66. Assurance report. |
| | 2-6 Activities, value chain and other business relationships | | NIB provides long-term lending to private and public limited companies, governments, municipalities and financial institutions. The Bank finances projects in several sectors, both in its member countries and in non-member countries, see p. 82 and 141. At the end of 2022, NIB employed a total of 228 people. See also p. 93 Operating and financial review 2022, and Note 18: Capitalisation and reserves. Read more about our stakeholders on pages 60-61. NIB’s internal procurement p. 47 and see our website and the Legal framework and policy documents. There were no significant changes to NIB’s organisation or its value chain during 2022. |
| | 2-7 Employees | | Permanent, temporary, full-time, and part-time employees, see table on page 54. The data has been compiled based on 2022 timestamp data for all employees. All numbers are based on head count and are per 31.12.2022. NIB’s only office is in Helsinki, where all staff members are located. NIB does not employ non-guaranteed hours employees. |
| | 2-8 Workers who are not employees | | NIB engages external service providers for certain functions in Office Services and Facilities Unit. As per 31.12.2022 the number of these External Service Providers was 6, of which 5 worked full time and one worked part time. Furthermore Lending Department had one full time in house consultant. |
| | 2-9 Governance structure and composition | | As an IFI, the Bank is governed by constituent documents adopted by the member countries. The structure of NIB’s Board of Governors, Board of Directors and Control Committee reflects the Bank’s ownership. See our webpage Member countries, governing bodies and capital, and the Governance Statement. |
| | 2-10 Nomination and selection of the highest governance body | | See Constituent Documents, Statues pages 10-11, Governance Statement, page 70. In addition, see the Rules of Procedures on NIB’s website. |
| | | 2-11 Chair of the highest governance body | | Constituent Documents, page 10. |
| | |
| | |
ANNUAL REPORT 2022 | | 184 |
| | |
| | |
| | |
| INTRODUCTION | | |
| | |
| IMPACT | | |
| | |
| GOVERNANCE | | |
| | |
| BOD REPORT | | |
| | |
| FINANCIALS | | |
| | |
| SUSTAINABILITY INDICES | | |
| | |
| u GRI content index | | |
| | |
PRB content index | | |
| | |
TCFD disclosure index | | |
| | |
| | | |
| | |
| | | |
| | |
| | | |
| | |
| | | |
| | |
| | | |
| | |
| | | |
| | |
| | | |
| | |
| | | |
| | |
| | | |
| | |
| | | |
| | |
| | | |
| | |
| | | |
| | |
| | | |
| | |
| | | |
| | |
| | | |
| | |
| | | |
| | |
| | | |
| | |
| | | |
| | |
| | | |
| | |
| | | |
| | |
| | | |
| | | | |
GRI standard/other source | | Disclosure | | Location and comments |
GRI 2: General Disclosures 2021 | | 2-12 Role of the highest governance body in overseeing the management of impacts | | All the powers of the Bank that are not vested with the Board of Governors are vested with the Board of Directors. The Board of Directors approves projects to be financed by the Bank and adopts policy decisions concerning the operations of the Bank, in particular the general framework for financing, borrowing and treasury operations, and their management. The Board of Directors may delegate its powers to the President to the extent it considers appropriate. Active communication with our stakeholders and the general public is an integral part of good business and administration. Our guiding principles are accountability, clarity, efficiency and transparency, as well as interaction with stakeholders. Loan projects with potentially negative social or environmental impacts are classified as Category A projects. These projects are required to undergo a full environmental impact assessment (EIA). The EIAs are made available on NIB’s website for public comment for 30 days before NIB’s Board of Directors makes a decision on financing. |
| | 2-13 Delegation of responsibility for managing impacts | | Sustainability Policy, pages 5-7, Sustainability Management and Governance Statement, pages 69-73. |
| | 2-14 Role of the highest governance body in sustainability reporting | | The Board of Governors approves the annual report of the Board of Directors and audited financial statements of the Bank. The Board of Directors is provided with the full Annual Report, including the sustainability reporting for information. |
| | 2-15 Conflicts of interest | | NIB’s Board of Directors (BoD) makes policy decisions in matters involving lending, borrowing and administrative questions. The members of the BoD are appointed by the Bank’s member countries. By virtue of their roles in the ministries of finance of their respective member countries, some sit on the governance bodies of other institutions. According to the Agreement establishing NIB, no individual shareholder can have control of the Bank. In line with the Code of Conduct for the Board, the members are required to disclose conflicts of interest, including positions and assignments outside of NIB and financial investments in NIB borrowers, to the CCO on an annual basis. The Chair of the BoD monitors adherence to the Code. |
| | 2-16 Communication of critical concerns | | See Integrity Report, page 4, ICO’s roles and page 7 (Investigating allegations of Prohibited Practices, Misconduct and Complaints). |
| | 2-17 Collective knowledge of the highest governance body | | NIB’s Board of Directors (BoD) makes policy decisions in matters involving lending, borrowing and administrative questions. In 2022, four separate Board seminars were held prior to the respective Board meetings. The seminar topics covered NIB’s role in supporting Green Transition and Energy Independence, Additionality, as well as Climate Strategy. In addition, the Board of Directors participate in client site visits. |
| | 2-18 Evaluation of the performance of the highest governance body | | As governors are ministers, mostly ministers of finance and economy who are representatives of democratically elected governments, there is no evaluation of the Board of Governors’ performance, including with respect to economic, environmental and social performance. |
| | 2-19 Remuneration policies | | Not applicable/Condifidentiality constraints. Sign on bonuses/recruitment incentive payments are not applicable. Termination payments and clawbacks not disclosed for confidentiality reasons. |
| | 2-20 Process to determine remuneration | | Not applicable – i (no), ii (no), iii (no- not for compensation principles – consultants used at times for general salary surveys). |
| | 2-21 Annual total compensation ratio | | Not reported for confidentiality reasons. |
| | | 2-22 Statement on sustainable development strategy | | Message from the President and CEO, p. 6. Report of the Board of Directors, page 80. |
| | |
| | |
ANNUAL REPORT 2022 | | 185 |
| | |
| | |
| | |
| INTRODUCTION | | |
| | |
| IMPACT | | |
| | |
| GOVERNANCE | | |
| | |
| BOD REPORT | | |
| | |
| FINANCIALS | | |
| | |
| SUSTAINABILITY INDICES | | |
| | |
| u GRI content index | | |
| | |
PRB content index | | |
| | |
TCFD disclosure index | | |
| | |
| | | |
| | |
| | | |
| | |
| | | |
| | |
| | | |
| | |
| | | |
| | |
| | | |
| | |
| | | |
| | |
| | | |
| | |
| | | |
| | |
| | | |
| | |
| | | |
| | |
| | | |
| | |
| | | |
| | |
| | | |
| | |
| | | |
| | |
| | | |
| | |
| | | |
| | |
| | | |
| | |
| | | |
| | |
| | | |
| | |
| | | |
| | | | |
GRI standard/other source | | Disclosure | | Location and comments |
GRI 2: General Disclosures 2021 | | 2-23 Policy commitments | | All investments proposed for financing also undergo a sustainability review in accordance with NIB’s Sustainability Policy. The review ensures that the project complies with internationally and nationally recognised environmental and social standards, such as UN Guiding Principles on Business and Human Rights, and that it is resilient. See Sustainability Policy, Annex 1 (Reference to international agreements, frameworks and conventions). In 2022, NIB joined the Partnership for Carbon Accounting Financials (PCAF) to further strengthen the Bank’s climate agenda. During the year, NIB also published new ESG guidance that describes how during a loan process NIB assesses due diligence. In addition to the publicly available sources and client interviews, NIB also utilises outsourced services for additional data on our counterparties and they performance, including controversies regarding human rights, labour rights, and corruption during the ESG assessment process. A critical element of preventative work is the scrutiny of NIB’s borrowers and other counterparties in the Integrity Due Diligence (IDD) process. NIB regularly revises its policies and processes. NIB held a public consultation during the process of updating the Bank’s Sustainability Policy. After the consultation, NIB considered the contributions received for possible amendments to the document and responded the contributors prior to launching the policy. All external policy documents are available here. Read about NIB’s updated Equality, diversity, and inclusion plan on page 50. |
| | 2-24 Embedding policy commitments | | The Bank’s policies and guidelines are impelemented internally and with counterparies by various ways. NIB’s Sustainability Policy sets out the principles, commitments and framework for sustainability at NIB and is approved by the Board of Directors. Its purpose is to define how sustainability is taken into account in all NIB’s business conduct, credit and investment decisions. The Policy applies Bank-wide to all of NIB’s operations. Read more on page 55, Sustainability management and see Integrity Report p. 7 (Training). (iv) Information partly incomplete/unavailable. |
| | 2-25 Processes to remediate negative impacts | | NIB has developed a channel for its stakeholders to express their views or comment on projects with potential significant adverse social or environmental impacts. These projects are classified as Category A projects, and project descriptions are made publicly available for comments for 30 days before the Bank makes a decision on financing. Communication is managed via the email address info@nib.int. In addition, if any persons involved in the activities of NIB observe or have reasonable grounds to suspect misconduct, they are encouraged to report such information. Grievances about the Bank’s activities and lending-related issues, including allegations of misconduct and corruption, can be addressed to the Integrity & Compliance Office (ICO). NIB’s Speaking-Up and Whistleblower Protection Policy outlines the process for raising concerns, and grants protection against retaliation. Read more on our website and see our Integrity Report 2022. |
| | 2-26 Mechanisms for seeking advice and raising concerns | | The Speaking-up and Whistleblower Protection Policy provides protections for whistleblowers. Contact forms in English and the eight Nordic and Baltic languages are publicly available on NIB’s website. See also NIB’s Integrity Report 2022 and Code of Conducts. Additionally, NIB’s staff members can also seek advice on ethical and lawful behaviour or report concerns to the Bank’s Ombudsman. |
| | 2-27 Compliance with laws and regulations | | NIB has not identified any significant instances of non-compliance with laws and regulations and no fines were paid during the reporting period. |
| | 2-28 Membership associations | | See pages 58-59, Our commitments and partnerships |
| | 2-29 Approach to stakeholder engagement | | See page 60, Stakeholder dialogue. |
| | | 2-30 Collective bargaining agreements | | NIB staff are employees of an international financial institution (IFI). Based on NIB’s legal status as an IFI, the Bank has established its own provisions for its employees. National legislation and procedures under which collective bargaining takes place are not applicable to NIB, hence there are no collective bargaining agreements (0%). NIB’s Code of Conduct for the Staff allows, however, freedom of association for its staff with reference to general democratic principles. As NIB enjoys immunity from national jurisdiction (court proceedings) in employment-related matters, the Bank has established arbitration rules for employment-related disputes. NIB also has an independent Ombudsman, whom the employees can consult in any employment-related matters and who may act as mediator between the employee and the Bank. NIB has a Cooperation Council that aims to promote communication between the Bank and the staff on issues related to conditions in the workplace. |
| | |
| | |
ANNUAL REPORT 2022 | | 186 |
| | |
| | |
| | |
| INTRODUCTION | | |
| | |
| IMPACT | | |
| | |
| GOVERNANCE | | |
| | |
| BOD REPORT | | |
| | |
| FINANCIALS | | |
| | |
| SUSTAINABILITY INDICES | | |
| | |
| u GRI content index | | |
| | |
PRB content index | | |
| | |
TCFD disclosure index | | |
| | |
| | | |
| | |
| | | |
| | |
| | | |
| | |
| | | |
| | |
| | | |
| | |
| | | |
| | |
| | | |
| | |
| | | |
| | |
| | | |
| | |
| | | |
| | |
| | | |
| | |
| | | |
| | |
| | | |
| | |
| | | |
| | |
| | | |
| | |
| | | |
| | |
| | | |
| | |
| | | |
| | |
| | | |
| | |
| | | |
| | |
| | | |
| | | | |
GRI standard/other source | | Disclosure | | Location and comments |
Material topics | | | | |
GRI 3: Material Topics 2021 | | 3-1 Process to determine material topics | | See page 62, Defining what matters. |
| | | 3-2 List of material topics | | See page 62-64 Defining what matters and The most material topics. No changes in material topics other than due to revised GRI Standards. |
Economic performance | | | | |
GRI 3: Material Topics 2021 | | 3-3 Management of material topics | | NIB’s purpose is to make financing available in accordance with sound banking principles and taking into account socio-economic considerations, to carry into effect investment projects of interest to the Nordic and Baltic owner countries, and other countries that receive such financing. NIB finances its lending by issuing bonds in the global financial markets. To maintain investor confidence in the Bank as a debt issuer, the Bank is rated by international credit rating agencies. The Bank’s risk appetite is defined in its Risk Appetite Statement (RAS), which is approved by the Board of Directors. |
GRI 201: Economic Performance 2016 | | 201-1 Direct economic value generated and distributed | | Financial Reporting 2022: Operating and Financial Review 2022, Statement of comprehensive income, Note 3: Segment information, and Note 18: Capitalisation and reserves, NIB’s main economic impact stems from its lending operations and the projects the Bank finances. |
| | 201-2 Financial implications and other risks and opportunities due to climate change | | See NIB and climate change and TCFD index. |
| | 201-3 Defined benefit plan obligations and other retirement plans | | Financial Reporting 2022, Note 1: Accounting policies Financial Reporting 2022, Note 7: Note 7: Personnel expenses |
| | 201-4 Financial assistance received from government | | Financial Reporting 2022, Note 18: Capitalisation and reserves |
Indirect economic impacts | | | | |
GRI 3: Material Topics 2021 | | 3-3 Management of material topics | | The Bank finances improvements to infrastructure, education, health and human capital to support well-functioning markets and equal opportunities, which are major drivers for prosperity and productivity growth. The quality of regional infrastructure and infrastructure services shapes the business environment of a region and supports productivity directly by reducing frictions in operations, and indirectly by increasing the efficiency of labour and product markets. The impact mainly occurs outside of the organisation. NIB conducts a sustainability review of all loan applications, according to its Sustainability Policy. With its lending, NIB aims to provide added value in its member countries, especially in respect to innovation, human capital development, energy, transport, telecommunications and environmental improvements. To assess whether the projects considered for financing support the vision of the Bank, NIB has a Mandate Rating Framework, which contains guidelines and tools to assess how the projects provide productivity gains and environmental benefits. A decision to grant a loan is made by the Board of Directors, after preliminary approval by the Bank’s Mandate, Credit and Compliance Committee. NIB’s President is authorised by the Board to make certain lending decisions. Complaints about the Bank’s activities and lending-related issues, including allegations of misconduct and corruption, can be addressed to the Integrity & Compliance Office (ICO). |
GRI 203: Indirect Economic Impacts 2016 | | 203-1 Infrastructure investments and services supported | | In 2022, disbursed EUR 704 million (19% of total lending disbursed) in the sector of Infrastructure & Project Finance, and EUR 835 million (23% of total lending disbursed) in the business area Public Sector & Utilities. Read more from Lending impact p.12 and the Report of the Board of Directors. |
| | | 203-2 Significant indirect economic impacts | | In line with its mandate rating framework, NIB considers both the micro- and economy-wide (direct and indirect) productivity impacts of the projects it finances. Indirect impacts are usually more widely distributed and can create spill over effects that support economies’ abilities to create value. Such projects involve investments in infrastructure, healthcare, education, R&D and in financial intermediation to support SMEs. Negative indirect economic impacts mainly occur when an investment is likely to strengthen the market power of a dominant company in an imperfectly competitive market, such as, for example, a large grocery retail chain in a NIB member country. However, the ex-ante quantification of indirect economic impact is rarely feasible, due to data limitations. Since the selection criteria for eligible projects emphasise indirect impacts that are beyond commercial interests and often well aligned with national and regional development goals, the impacts can be considered significant for stakeholders. |
| | |
| | |
ANNUAL REPORT 2022 | | 187 |
| | |
| | |
| | |
| INTRODUCTION | | |
| | |
| IMPACT | | |
| | |
| GOVERNANCE | | |
| | |
| BOD REPORT | | |
| | |
| FINANCIALS | | |
| | |
| SUSTAINABILITY INDICES | | |
| | |
| u GRI content index | | |
| | |
PRB content index | | |
| | |
TCFD disclosure index | | |
| | |
| | | |
| | |
| | | |
| | |
| | | |
| | |
| | | |
| | |
| | | |
| | |
| | | |
| | |
| | | |
| | |
| | | |
| | |
| | | |
| | |
| | | |
| | |
| | | |
| | |
| | | |
| | |
| | | |
| | |
| | | |
| | |
| | | |
| | |
| | | |
| | |
| | | |
| | |
| | | |
| | |
| | | |
| | |
| | | |
| | |
| | | |
| | | | |
GRI standard/other source | | Disclosure | | Location and comments |
Anti-corruption | | | | |
GRI 3: Material Topics 2021 | | 3-3 Management of material topics | | NIB’s anti-money laundering (AML) and anti-bribery and corruption (ABC) controls include policies and processes that cover a wide range of themes. As an IFI, NIB is not under the supervision of any financial or supervisory body but benchmarks its policies and procedures against the legislation of its member countries and that of the European Union. Read more from NIB’s Integrity Report 2022 and see our website [Compliance]. |
| | | 205-3 Confirmed incidents of corruption and actions taken | | In 2022, no incidents of corruption were confirmed. See p.7 NIB’s Integrity Report 2022 |
Emissions | | | | |
GRI 3: Material Topics 2021 | | 3-3 Management of material topics | | NIB consistently measures, monitors, and manages its internal processes for business travel, energy performance, waste management, and responsible procurement. Regarding its headquarter in Helsinki, NIB monitors its energy consumption and complies with the requirements set out in current EU environmental legislation and the WWF’s Green Office programme. The Internal Sustainability Council follows up on NIB’s internal sustainability performance in line with the annual action plan. The Council also gathers ideas from employees and works to raise awareness on sustainability topics. Information regarding facilities management and sustainability initiatives is regularly communicated to staff members. Read more from from our website and Impact from our internal operations. |
GRI 305: Emissions 2016 | | 305-1 Direct (Scope 1) GHG emissions | | See p. 47-49, Carbon emissions from internal operations |
| | 305-2 Energy indirect (Scope 2) GHG emissions | | See p. 47-49, Carbon emissions from internal operations |
| | 305-3 Other indirect (Scope 3) GHG emissions | | See p. 47-49, Carbon emissions from internal operations |
| | 305-4 GHG emissions intensity | | See p. 47-49, Carbon emissions from internal operations |
| | 305-5 Reduction of GHG emissions | | See p. 47-49, Carbon emissions from internal operations |
Employment | | | | |
GRI 3: Material Topics 2021 | | 3-3 Management of material topics | | NIB’s employees are Bank’s most important assets and its main internal stakeholder group. NIB’s goal as an employer is to provide a sustainable working environment that encourages personal and skills development, and a good work-life balance. The Bank aims to maintain continuous communication with its staff members and regularly collects feedback. Further, ensuring employee wellbeing and occupational health and safety are a priority of NIB’s human resource management. The impact occurs inside of the organisation. NIB’s staff are employees of an international financial institution. Based on NIB’s legal status, the labour laws or other legislation of the host country Finland, or any other member country, do not automatically apply to NIB’s employees. The Bank has therefore established its own regulations. NIB benchmarks its policies and practices against those of other IFIs. The Bank also collects regular feedback from its staff to evaluate the efficacy of its processes. The Cooperation Council works to promote communication between NIB and its staff, and evaluates the Bank’s management approach under consideration of employees’ opinions on an ongoing basis.Read more from NIB’s Legal framework for the staff, Staff Regulations, pages 50-53 on Annual Report, and NIB’s website. Other staff-related documents, such as the Speaking-up and Whistleblower Protection Policy, are availeble on NIB’s website. |
GRI 401: Employment 2016 | | 401-1 New employee hires and employee turnover | | In 2022, NIB hired 22 new permanent employees (6 women and 16 men), resulting in a hiring rate of 11%. New hires by age group: under 35: 6 persons 35- 50: 12 persons, over 50: 4 persons. In 2022, 15 people left the Bank (8 women and 7 men). The exit turnover rate stood at 7.6%. Exit turnover by age group: under 35: 2 persons, 35-50: 8 persons, over 50: 5 persons. Calculations are based on the number of permanent employees in 2022: 213 (31.12.2021:198). |
| | | 401-2 Benefits provided to full-time employees that are not provided to temporary or part-time employees | | Financial reporting 2022, Note 7: Personnel expenses, compensation and benefits includes explanations of Pension obligations, Staff loans and Additional benefits for expatriates. See also p. 52 Impactful workplace for more information. Stock ownership is not applicable as NIB is an international financial institution. |
| | |
| | |
ANNUAL REPORT 2022 | | 188 |
| | |
| | |
| | |
| INTRODUCTION | | |
| | |
| IMPACT | | |
| | |
| GOVERNANCE | | |
| | |
| BOD REPORT | | |
| | |
| FINANCIALS | | |
| | |
| SUSTAINABILITY INDICES | | |
| | |
| u GRI content index | | |
| | |
PRB content index | | |
| | |
TCFD disclosure index | | |
| | |
| | | |
| | |
| | | |
| | |
| | | |
| | |
| | | |
| | |
| | | |
| | |
| | | |
| | |
| | | |
| | |
| | | |
| | |
| | | |
| | |
| | | |
| | |
| | | |
| | |
| | | |
| | |
| | | |
| | |
| | | |
| | |
| | | |
| | |
| | | |
| | |
| | | |
| | |
| | | |
| | |
| | | |
| | |
| | | |
| | |
| | | |
| | | | |
GRI standard/other source | | Disclosure | | Location and comments |
Training and education | | | | |
GRI 3: Material Topics 2021 | | 3-3 Management of material topics | | NIB’s training and education programmes are an important aspect of the Bank’s commitment to fulfilling its mission by investing in employees’ skills and expertise. Without highly skilled personnel, NIB cannot reach its targets and fulfil its mission. The Human Resources (HR) unit is responsible for handling employment-related matters, including employee wellbeing and training. |
GRI 404: Training and Education 2016 | | 404-1 Average hours of training per year per employee | | The average number of training hours per year per permanent employee was 12.2 in 2022, compared to 16.2 in 2021 (figures are based on FTE). This figure does not include online trainings completed by employees during the year. Information unavailable / incomplete: Data on average hours of training by gender and employment category is not collected. Reporting the average number of training hours per year per employee is sufficient for our purpose and for tracking progress. We do not plan on reporting on training days broken down by gender or employee category in the future. |
| | 404-2 Programs for upgrading employee skills and transition assistance programs | | Impactful workplace see p. 51. In addition, NIB has support models for its employees in place, which include individual career counselling programmes, leadership training and job placement services. Such programmes are paid for by NIB and are facilitated by external service providers. For example, NIB offers a career counselling programme for employees who have been working at the Bank for several years. The programme functions as a development initiative and aims to ensure continued employability of NIB staff. Further, NIB encourages job rotations across different department at the Bank as well as secondment arrangement with other insitutions. Pre-retirement planning services are offered to staff reaching old-age pension, which include administrative support and guidance for pension applications, and related off-boarding services. NIB also offers language training to its employees in English, Swedish and Finnish and, in special circumstances, other work-related languages. |
| | 404-3 Percentage of employees receiving regular performance and career development reviews | | All permanent employees (2022: 213 employees, 100% of total staff) take part in regular, structured appraisal and development discussions with their supervisors, where individual work plans and performance are reviewed. These talks are held at least twice a year. Similar development discussions are also provided to temporary employees. |
Non-discrimination | | | | |
GRI 3: Material Topics 2021 | | 3-3 Management of material topics | | NIB is committed to promoting fair and equal treatment of all our employees and aim for a balanced diversity among our staff. We support inclusion and strive to prevent discrimination and harassment. NIB has an internal Equality, Diversity and Inclusion Plan in place that focuses on eliminating gaps in remuneration, diversity in recruitment, and promoting an inclusive work environment. The Bank has established Codes of Conduct for its staff and the members of its governing and supervisory bodies. The codes provide guidance on maintaining a respectful workplace, handling conflicts of interest and exercising good judgement in ethical matters. |
GRI 406: Non- discrimination 2016 | | 406-1 Incidents of discrimination and corrective actions taken | | In 2022, no formal claims of discrimination or harassment were reported. No corrective action was taken. |
Own indicators | | | | |
Own indicator: | | Impact of NIB’s lending on CO2 emissions | | Loan projects contributed to an annual CO2 reduction of 239,000 tonnes. The reduction equals the annual carbon footprint of around 28,000 people in the member country region. |
Own indicator: | | Renewable energy generation | | The disbursed energy generation projects contribute to annual increase of 693 GWh of generated electricity and thermal heat. Increase equals the energy need of 35,000 single family houses. Assuming that one single family house in the member country area consumes around 20 MWh per year. |
Own indicator: | | R&D programmes | | 4 R&D loans totalling EUR 477 million. The loans finance product innovation and new facilities in Sweden and Denmark. |
Own indicator: | | Onlending to SMES and environmental projects | | For loans to SMEs and environmental project through financial intermediaries only the total loan amount and the number of programmes financed are reported. Four loan programmes with financial intermediaries totalling EUR 272 million for onlending to SMEs, mid-caps and environmental projects in Finland, Iceland, Sweden and Norway. |
Own indicator: | | Electricity networks | | EUR 577 million disbursed to 10 electricity network projects providing 2,700 kilometers of distribution and transmission networks in Norway, Sweden, Denmark, Finland, Latvia and Iceland. The projects add 840 MW of renewable energy generation and enable further connections and strenghten grid resilience for increased intake of renewable energy generation. |
Own indicator: | | Healthcare | | EUR 100 million disbursed to 6 projects in heathcare - construction/refurbishement of healthcare facilities, purchase of medical equipment as well as digitalisation of heathcare services. The healthcare facilities will provide services to approximately 270,000 people living in their catchment areas. |
Own indicator: | | Green Buildings | | EUR 363 million were chanelled to 12 green building projects in Norway, Sweden and Finland. Combined, the green building projects cover 110,000 certified (for instance LEED, BREEAM etc.) square meters of gross floor area. |
| | |
| | |
ANNUAL REPORT 2022 | | 189 |
| | |
| | |
| | |
| INTRODUCTION | | |
| | |
| IMPACT | | |
| | |
| GOVERNANCE | | |
| | |
| BOD REPORT | | |
| | |
| FINANCIALS | | |
| | |
| SUSTAINABILITY INDICES | | |
| | |
GRI content index | | |
| | |
| u PRB content index | | |
| | |
TCFD disclosure index | | |
| | |
| | | |
| | |
| | | |
| | |
| | | |
| | |
| | | |
| | |
| | | |
| | |
| | | |
| | |
| | | |
| | |
| | | |
| | |
| | | |
| | |
| | | |
| | |
| | | |
| | |
| | | |
| | |
| | | |
| | |
| | | |
| | |
| | | |
| | |
| | | |
| | |
| | | |
| | |
| | | |
| | |
| | | |
| | |
| | | |
| | |
| | | |
PRB content index
This table sets out the reporting and self-assessment requirements for Signatories of the Principles for Responsible Banking. We have provided our response and self-assessment in relation to the principles, making references to where in our reports and website the required information can be found.
| | | | |
Reporting and Self- Assessment Requirements | | High-level summary of Bank’s response | | Reference(s)/Link(s) to Bank’s full response/relevant information |
Principle 1: Alignment We will align our business strategy to be consistent with and contribute to individuals’ needs and society’s goals, as expressed in the Sustainable Development Goals, the Paris Climate Agreement and relevant national and regional frameworks. |
1.1 Business model and description | | As the international financial institution of the Nordic and Baltic countries, NIB has both an economic and a societal role. NIB’s mission is to provide long-term financing to investments that improve productivity and benefit the environment of the five Nordic and three Baltic countries. In times of economic crisis, the owners of the Bank have also authorised NIB to provide additional mitigating instruments to support the member countries and the Bank’s customers. The drivers of NIB’s lending are outlined in the Mandate Rating Framework. Further, NIB will increase its climate finance activities to focus on high-impact transitions in hard-to-abate sectors, as these are deemed relevant in the context of NIB’s footprint of operations in the member countries’ economies. NIB will also support the development of sustainable finance and capital markets in its member countries by broadening its product offering and promoting high quality standards. NIB provides long-term lending to private and public limited companies, governments, municipalities, and financial institutions. The Bank grants loans for defined projects, investment programmes, sustainability-linked loans, and on-lending to SMEs and small midcaps, along with response loans. NIB’s lending business areas include public sector & utilities, infrastructure & project finance, industry, services & consumers, and financial institutions. In 2022, more than 94% of NIB’s lending was disbursed to counterparties in the member countries. | | GRI 2-1 Message from the President and CEO NIB’s business strategy and implementation |
1.2 Business strategy alignment | | NIB is committed to solving the climate challenge in line with the Paris Agreement whilst building resilient, prosperous, and well-functioning societies. Climate change is an environmental as well as a societal challenge, and one of the most pressing issues of our age. As outlined in NIB’s Sustainability Policy, the Bank will support its member countries’ efforts to achieve climate goals and enhance biodiversity in nature. Read more about NIB’s principles and commitments here. NIB’s strategy is to increase climate finance activities and focus them on high-impact transitions in hard-to-abate sectors, which are considered very relevant in NIB’s geography of operations. NIB will also support the development of sustainable finance and capital markets in its member region by broadening the product offering and promoting high quality standards. The Bank bases its core sustainability principles on international agreements, frameworks and conventions supporting sustainable business conduct. NIB also cooperates with other international financial institutions and organisations to develop sound, coordinated and effective ways of promoting sustainable finance. Read more here. NIB’s Sustainability Policy, Mandate rating framework and relevant ESG frameworks guide all credit decisions. Read more about ESG integration in business here. On the productivity mandate, drivers such as human capital and equal opportunities and technical progress and innovation align well with SDGs 3, 4, 5, 8, and 9. On the environmental mandate, drivers such as climate change mitigation, resource efficiency and pollution reduction align well with SDGs 6, 7, 11, 12, 13, 14, and 15. The NIB Environmental Bond programme focuses on climate action and environmental issues, and the NIB Blue Bond programme targets water and sea pollution reduction. Both programmes address relevant environmental challenges for the NIB’s member countries and direct the impact to areas of particular interest to the economies and societies in which NIB operates in. This is a way for NIB to align its strategy and activities with the challenges and action plans of its member countries in the region. In its NIB Environmental Bond reporting, NIB maps the projects financed to the relevant SDGs. Read more here. As the international financial institution of the Nordic and Baltic countries, NIB is committed to incorporating economic, social and governance factors in its investments and credit decisions as set out in the PRI. Read more about PRI here. NIB reports on its climate performance in line with the recommendations of the TCFD and is a member of the PCAF. Read more here. | | Sustainability management GRI 2-22 Message from the President and CEO Our commitments and partnerships |
| | |
| | |
ANNUAL REPORT 2022 | | 190 |
| | |
| | |
| | |
| INTRODUCTION | | |
| | |
| IMPACT | | |
| | |
| GOVERNANCE | | |
| | |
| BOD REPORT | | |
| | |
| FINANCIALS | | |
| | |
| SUSTAINABILITY INDICES | | |
| | |
GRI content index | | |
| | |
| u PRB content index | | |
| | |
TCFD disclosure index | | |
| | |
| | | |
| | |
| | | |
| | |
| | | |
| | |
| | | |
| | |
| | | |
| | |
| | | |
| | |
| | | |
| | |
| | | |
| | |
| | | |
| | |
| | | |
| | |
| | | |
| | |
| | | |
| | |
| | | |
| | |
| | | |
| | |
| | | |
| | |
| | | |
| | |
| | | |
| | |
| | | |
| | |
| | | |
| | |
| | | |
| | |
| | | |
| | | | |
| Reporting and Self- | | | | Reference(s)/Link(s) to Bank’s full |
Assessment Requirements | | High-level summary of Bank’s response | | response/relevant information |
Principle 2: Impact and Target Setting We will continuously increase our positive impacts while reducing the negative impacts on, and managing the risks to, people and the environment resulting from our activities, products and services. To this end, we will set and publish targets where we can have the most significant impacts. |
| | |
2.1 Impact Analysis | | NIB is driven by its mandate and evaluates a set of drivers for achieving environmental benefits. These are climate change mitigation, pollution reduction, preventive measures and resource efficiency. As with achieving productivity benefits, NIB evaluates the drivers of market efficiency and the business environment, human capital and equal economic opportunities, technical progress and innovations, as well as infrastructure improvement. NIB has set a mandate fulfilment target of at least 90% of the mandate rated projects. In 2022, this rate was 99.2% (59.3% of the disbursements had an environmental mandate, and 85.4% had a productivity mandate). Read more here. | | NIB’s business strategy and implementation Report of the Board of Directors |
| | |
| | 87.5% of disbursements related to loans with an environmental mandate supported climate change mitigation drivers, helping clients transition from carbon-intensive practices to climate neutrality in line with member states’ neutrality plans. Read more about NIB and climate here and NIB’s support for the green transition here. Additionally, 5.7% and 2.9% of loans with an environmental mandate were related to pollution prevention and resource efficiency respectively. This data highlights the current needs and future trends of NIB’s clients in member countries, where NIB has the most impact and further development potential. Furthermore, the remaining loans with an environmental mandate either could not have a driver allocation (i.e. lending for loan programmes for other banks), or the disbursement amount was insignificant.1 | | |
| | |
| | In 2022, NIB also carried out its portfolio impact analysis, using the UN FI Impact assessment tool2 and considering disbursement data and information on the economic activity for NIB’s eight member states during the last ten years, from 2013 to 2022. This allowed NIB to identify the most significant impacts in relation to NIB’s core business in terms of the economic activities and geographies of its counterparties. The results show that the top five disbursements are associated with the NACE codes D 35.1 Electric power generation, transmission and distribution & D 35 Electricity, gas, steam and air conditioning supply, K 64 Financial service activities, except insurance and pension funding, O 84.1 Administration of the State and the economic and social policy of the community, M 72 Scientific research and development, but the largest impacts are associated with such sectors as ‘Employment’ (+/-), ‘Economic convergence’ (+), ‘Inclusive, healthy economics’, and ‘Health and sanitation’ (+). The Bank’s portfolio is also associated with ‘Waste’ (-) and ‘Climate’ (-) impacts. This is consistent with NIB’s two mandates, which have have an impact on loan characteristics and the counterparties NIB finances. When performing mandate-rating, NIB assesses the environmental and productivity impacts, as well as the sustainability of the project and the counterparty (i.e. ESG assessment), also considering project and sector-related characteristics, impacts, legislative requirements, permits and mitigation measures, thus helping to improve the socioeconomic and environmental footprint and handprint of NIB’s clients and their projects. Read more about ESG integration practices here. | | |
| | |
| | In addition, to capture NIB’s impact in 2021, NIB carried out a stakeholder survey and identified eight material topics. NIB has grouped the material topics into three categories: sustainable finance; good governance; and meaningful work. The aim of NIB’s materiality process was to understand how NIB’s sustainability context evolves over time, and how this affects the stakeholders’ expectations of NIB as a financier of the prosperous Nordic–Baltic region. Read more here. | | |
NIB has undertaken its impact analysis and identified the significant impacts that are associated with NIB’s loan portfolio in its eight member countries in accordance to the methodology described above. |
| 1 | Loan correspondence to the NIB environmental drivers has been evaluated according to the Mandate rating framework and is provided for projects with an environmental mandate (i.e rated ‘good’ or ‘excellent’ according to NIB’s Mandate Rating Framework). For the projects that are related to two drivers, of which the primary driver can be detected, 80% of the disbursement amount was linked to the primary driver, and 20% to the secondary driver. For the loans where no primary driver can be detected, the disbursement amount is equally divided between drivers (except for lending for loan programmes for other banks). Sustainability linked loans are linked to the climate driver. |
| 2 | NIB used UN FI impact assessment tool’s functionalities to assess the Bank’s cartography on the best effort basis. NIB used in-built data sources and automatically calculated values. NIB run the analysis for its eight member countires, as they comprise the majority of NIB’s loans, using loan disbursement data from 2013 - 2022 (from the categories ordinary lending, international lending & project Investment loans) and excluding the repaid loans to show the impact of the current portfolio. Data on the NACE 1 codes (according to NIB’s system data) were utilised. (+) and (-) refer to positive and negative associated impact respectively. |
| | (+) and (-) marks refer to positive and negative associated impact respectively. |
| | |
| | |
ANNUAL REPORT 2022 | | 191 |
| | |
| | |
| | |
| INTRODUCTION | | |
| | |
| IMPACT | | |
| | |
| GOVERNANCE | | |
| | |
| BOD REPORT | | |
| | |
| FINANCIALS | | |
| | |
| SUSTAINABILITY INDICES | | |
| | |
GRI content index | | |
| | |
| u PRB content index | | |
| | |
TCFD disclosure index | | |
| | |
| | | |
| | |
| | | |
| | |
| | | |
| | |
| | | |
| | |
| | | |
| | |
| | | |
| | |
| | | |
| | |
| | | |
| | |
| | | |
| | |
| | | |
| | |
| | | |
| | |
| | | |
| | |
| | | |
| | |
| | | |
| | |
| | | |
| | |
| | | |
| | |
| | | |
| | |
| | | |
| | |
| | | |
| | |
| | | |
| | |
| | | |
| | | | |
| Reporting and Self- | | | | Reference(s)/Link(s) to Bank’s full |
Assessment Requirements | | High-level summary of Bank’s response | | response/relevant information |
| | |
2.2 Target Setting 2.3 Plans for Target Implementation and Monitoring | | NIB aims to develop a comprehensive Climate Strategy including a climate target. The strategy will support the transition towards a low-carbon, climate-resilient economy. As evaluated through the impact analysis, climate is one of the most significant areas of the Bank’s activities for the provision of products and services. The climate strategy and targets will be linked to the Sustainable Development Goals (Goal 13: Climate action), the goals of the Paris Agreement, and other relevant international, national or regional frameworks (such as the Net-zero targets of NIB member countries). During the development of the strategy, NIB is planning to approach the impacts of the strategy and discuss the relevant actions to maximise the net positive impact of the set targets (where necessary and feasible). Read more about the progress so far here. | | NIB’s Business strategy and implementation Message from the President and CEO |
| | |
2.4 Progress on Implementing Targets | |  | | |
| | |
| | NIB also has other commitments related to the Bank’s environmental and socioeconomic impacts. | | |
| | |
| | The mandate fulfilment target shows the share of total mandate-rated disbursements that need to achieve a rating of good or excellent environmental impact from climate, pollution reduction, resource efficiency or preventive (adaptive) perspectives, and/or have been assessed to have good or excellent direct and/ or wider gains from the socioeconomic and business aspect (for example, availability of health and social housing or public transport services, employment, collaboration with universities, etc.). This goal helps NIB to tackle a wide range of the impacts that are evaluated during the loan assessment and are associated with, but not limited to, employment, the economic convergence of the member countries, inclusive, healthy economies, health, climate, etc. In previous years, the target for mandate fulfilment has been 90%, but the new target for 2023 has been increased and set at 95%. The information on the environmental and productivity mandate fulfilment rates in 2022 and the new target of 95% for 2023 are published here. | | |
| | |
| | The mandate rating target shows the good and/or excellent rating on the productivity and/or environmental mandate from the mandate rated projects. The fulfilment of the mandate rating target is calculated from the data on the disbursed loan amounts in the respective reporting year and the mandate rating data associated with the particular loan. The mandate rating is carried out as part of the loan due diligence process, employing Mandate Rating Framework, Sustainability Policy and ESG guidance documents. The mandate fulfilment is reviewed in NIB’s Mandate, Credit and Compliance committee, and reported regularly to the BoD. | | |
| | |
| | NIB’s ‘30-by-30 pledge’ shows the amount of the total funding dedicated to environmental and climate activities, with an aim of reaching at least EUR 30 billion from 2021 to 2030. As an output target that shows the quantitative summary of an activity in the period; it does not therefore require a baseline. It is calculated as total project costs in EUR for the loans that have received a good or excellent rating on the environmental mandate. The calculation takes into account NIB’s disbursements starting from 2021 and the general rule that NIB typically finances up to 50% of a total project costs. In 2021 and 2022 the total cumulative disbursement amount to environmental projects was EUR 3.37 billion together, therefore the total cumulative amount for this target reached roughly EUR 7.5 bn, showing that NIB is on track to achieve the commitment. | | |
| | |
| | These commitments are aligned with several SDG goals, depending on the characteristics of the loans, but they include: | | |
| | |
| |  | | NIB’s Business strategy and implementation |
| | |
| | Read more about NIB’s commitments here. | | |
| | | | |
| | | | |
NIB has an existing target for environmental and productivity mandate fulfilment that has increased compared with previous years. NIB also remains committed to the ‘30-by-30’ pledge. These engagements are in line with the areas on which NIB has the most significant impact. NIB is also currently in the process of setting a new target for climate action. |
| | |
| | |
ANNUAL REPORT 2022 | | 192 |
| | |
| | |
| | |
| INTRODUCTION | | |
| | |
| IMPACT | | |
| | |
| GOVERNANCE | | |
| | |
| BOD REPORT | | |
| | |
| FINANCIALS | | |
| | |
| SUSTAINABILITY INDICES | | |
| | |
GRI content index | | |
| | |
| u PRB content index | | |
| | |
TCFD disclosure index | | |
| | |
| | | |
| | |
| | | |
| | |
| | | |
| | |
| | | |
| | |
| | | |
| | |
| | | |
| | |
| | | |
| | |
| | | |
| | |
| | | |
| | |
| | | |
| | |
| | | |
| | |
| | | |
| | |
| | | |
| | |
| | | |
| | |
| | | |
| | |
| | | |
| | |
| | | |
| | |
| | | |
| | |
| | | |
| | |
| | | |
| | |
| | | |
| | | | |
| Reporting and Self- | | | | Reference(s)/Link(s) to Bank’s full |
Assessment Requirements | | High-level summary of Bank’s response | | response/relevant information |
Principle 3: Clients and Customers We will work responsibly with our clients and our customers to encourage sustainable practices and enable economic activities that create shared prosperity for current and future generations. |
| | |
3.1 Policies and practices to promote responsible relationships with its customers | | NIB is committed to following best practices and market standards in the areas of accountability, transparency, and business ethics to promote sustainability with the Bank’s clients. NIB engages in ESG dialogue with all its clients and is committed to supporting them with knowledge sharing to foster sustainability and ESG integration. NIB’s updated Sustainability Policy and new Environmental, Social and Governance Guidance for Lending sets out how the Bank incorporates ESG factors in its investment and credit decisions. Our responsible Investment Framework sets out the principles for integrating environmental, social and governance aspects into the Bank’s treasury operations. NIB is committed to always considering material non-financial factors in its decision making and to having an open dialogue about them with its investors, clients, and treasury counterparties. Read more on sustainability management at NIB here. NIB has a Responsible Investment Framework and accompanying guidelines and processes to ensure that the companies in which NIB invests and with which it transacts, meet the Bank’s expectations of sound ESG performance. The framework has been fully implemented and strengthens NIB’s dialogue with investors and treasury counterparties on material ESG issues. Read more here. NIB strives to continuously develop its staff competence in matters related to sustainability and ESG. In addition, NIB cooperates with other international financial institutions and organisations to develop sound, coordinated and effective ways of promoting sustainable finance. The Bank also participates in several international and regional forums to develop common standards and principles for promoting sustainable finance NIB also follows up on the outcome of all projects three years after completion through ex-post assessments. | | Sustainability management |
| | |
3.2 Work with clients and customers to encourage sustainable practices and enable sustainable economic activities | | NIB is committed to always considering material non-financial factors in its decision making and to having an open dialogue about them with its investors, borrowers, and treasury counterparties. NIB’s loan originators and Sustainability and Mandate unit work closely with the Bank’s clients to carry out sustainability assessment according to above mentioned documents for projects and counterparties. | | |
Principle 4: Stakeholders We will proactively and responsibly consult, engage and partner with relevant stakeholders to achieve society’s goals. |
| | |
4.1 Stakeholders consulted, engaged, collaborated or partnered with | | As the international financial institution of the Nordic and Baltic countries, NIB engages with a wide variety of stakeholders. NIB’s main stakeholders are its customers, investors, political decision makers and public administrations, staff, non-governmental organisations, the media, and the public in the Nordic and Baltic countries. Please read more about the stakeholder dialogue here and the materiality analysis here. | | GRI 2-29 Stakeholder dialogue Materiality Message from the President and CEO |
Principle 5: Governance & Culture We will implement our commitment to these Principles through effective governance and a culture of responsible banking |
| | |
5.1 Governance structures, policies and procedures | | NIB has relevant governance structures, policies and procedures to manage impacts and support effective implementation of its commitments. Please read about the sustainability management at the Bank here and the Governance Statement is available here. | | GRI 2-9 GRI 2-13 Governance statement Sustainability management |
| | |
| | |
ANNUAL REPORT 2022 | | 193 |
| | |
| | |
| | |
| INTRODUCTION | | |
| | |
| IMPACT | | |
| | |
| GOVERNANCE | | |
| | |
| BOD REPORT | | |
| | |
| FINANCIALS | | |
| | |
| SUSTAINABILITY INDICES | | |
| | |
GRI content index | | |
| | |
| u PRB content index | | |
| | |
TCFD disclosure index | | |
| | |
| | | |
| | |
| | | |
| | |
| | | |
| | |
| | | |
| | |
| | | |
| | |
| | | |
| | |
| | | |
| | |
| | | |
| | |
| | | |
| | |
| | | |
| | |
| | | |
| | |
| | | |
| | |
| | | |
| | |
| | | |
| | |
| | | |
| | |
| | | |
| | |
| | | |
| | |
| | | |
| | |
| | | |
| | |
| | | |
| | |
| | | |
| | | | |
Reporting and Self- Assessment Requirements | | High-level summary of Bank’s response | | Reference(s)/ Link(s) to Bank’s full response/relevant information |
5.2 Initiatives and measures | | The continuous development of professional skills is of major importance to the Bank’s performance. NIB’s fundamental objective as an employer is to include the promotion of balanced diversity among staff. | | GRI 2-17 GRI 3-3 Management of material topics |
5.3 Governance Structure for Implementation of the Principles | | The mandate target is approved by the BoD and derives from NIB’s Mission, and the target fulfilment is reported on a monthly basis to the Report of the Board of Directors. The specific climate target, actions and monitoring mechanisms will be set during the Climate Strategy approval process in accordance with the Bank’s processes, and the target will be approved by and reported to the BoD. The ‘30-by-30’ pledge is a commitment from NIB’s President and CEO to report on the progress towards achieving the Bank’s sustainability goals. This pledge is documented in the Annual and Impact Reports. Remedial actions in the event of targets not being achieved or unexpected negative impacts being detected will be based on the evaluation of the situation and underlaying causes and potential tailor-made strategies for the improvements. Currently, NIB is on track to reach the set targets. The Bank can increase the monitoring frequency if it is necessary, for example, in the event of unexpected circumstances to prevent underperformance. Read about NIB’s sustainability management here and governance here. | | Report of the Board of Directors Governance statement Sustainability management |
NIB has fulfilled this requirement. The Bank has an established governance structure that allows PRB requirements to be implemented, significant impacts to be managed, and targets to be set and monitored. NIB has dedicated people whose work tasks include the reporting and managing the implementation of the requirements of the PRB. |
Principle 6: Transparency & Accountability We will periodically review our individual and collective implementation of these Principles and be transparent about and accountable for our positive and negative impacts and our contribution to society’s goals. |
6.1. Progress on Implementing the Principles | | Becoming a signatory to the Principles was a natural step given that NIB’s mission is to finance projects that improve productivity and benefit the environment of the Nordic and Baltic countries. The mission, reviewed by NIB’s Nordic and Baltic owner countries in 2021, addresses future challenges such as the urgency of climate action and the important role of international financial institutions and the private sector in mobilising climate finance. As mentioned above, NIB has made significant progress in implementing all six principles over the last 12 months and has set two integrative and overarching environmental climate and socioeconomic targets. NIB is currently developing its climate strategy, which will shape NIB’s investment and activity decisions. In 2022, NIB conducted comprehensive climate risk assessments which will help to build NIB’s climate strategy and climate targets. In 2022, NIB also became a member of the PCAF and continued to fulfil the reporting requirements of the GRI, PRI and the TCFD. In addition, NIB has evaluated all its new projects against the EU Taxonomy for Sustainable Investments. | | Sustainability management NIB and climate change |
NIB has fulfilled the requirements for the implementation of the Principles for Responsible Banking. NIB has policies on sustainability and the ESG framework in place, which helps us to assess the environmental, socioeconomic, and business development impacts, and NIB has made progress in setting the environmental, climate and socioeconomic targets related to its investments. |
| | |
| | |
ANNUAL REPORT 2022 | | 194 |
| | |
| | |
| | |
| INTRODUCTION | | |
| | |
| IMPACT | | |
| | |
| GOVERNANCE | | |
| | |
| BOD REPORT | | |
| | |
| FINANCIALS | | |
| | |
| SUSTAINABILITY INDICES | | |
| | |
GRI content index | | |
| | |
PRB content index | | |
| | |
| u TCFD disclosure index | | |
| | |
| | | |
| | |
| | | |
| | |
| | | |
| | |
| | | |
| | |
| | | |
| | |
| | | |
| | |
| | | |
| | |
| | | |
| | |
| | | |
| | |
| | | |
| | |
| | | |
| | |
| | | |
| | |
| | | |
| | |
| | | |
| | |
| | | |
| | |
| | | |
| | |
| | | |
| | |
| | | |
| | |
| | | |
| | |
| | | |
| | |
| | | |
TCFD disclosure index
In this index table we list NIB’s disclosures with reference to TCFD recommendations, and refer to those locations where these issues are addressed in the annual reporting.
| | |
Disclosure | | Page |
| Governance | | |
| a) Describe the Board’s oversight of climate-related risks and opportunities | | 37-39, 55-57, 89 |
| b) Describe the Management’s role in assessing and managing climate-related risks and opportunities | | 37-39, 55-57 |
| Strategy | | |
| a) Describe the climate-related risks and opportunities the organisation has identified over the short, medium and long-term | | 8-9, 37-39 |
| b) Describe the impact of climate-related risks and opportunities on the organisation’s business, strategy, and financial planning | | 8-9, 38, 83-84 |
| c) Describe the resilience of the organisation’s strategy, taking into consideration different climate-related scenarios, including a 2°C or lower scenario | | |
| Risk management | | |
| a) Describe the organisation’s process for identifying and assessing climate-related risks | | 38 |
| b) Describe the organisation’s process for managing climate-related risks | | 38-39, 55-57 |
| c) Describe how processes for identifying, assessing and managing climate-related risks are integrated into the organisation’s overall risk management | | 38-39, Note 2 |
| Metrics and targets | | |
| a) Disclose the metrics used by the organisation to assess climate-related risks and opportunities in line with its strategy and risk management process | | 39-45 |
| b) Disclose Scope 1, Scope 2, and, if appropriate, Scope 3 greenhouse gas emissions, and the related risks | | 43-44, 47-49 |
| c) Describe the targets used by the organisation to manage climate-related risks and opportunities and performance against targets | | 8 |
| | |
| | |
ANNUAL REPORT 2022 | | 195 |
| | |
| | |
| | |
| INTRODUCTION | | |
| | |
| IMPACT | | |
| | |
| GOVERNANCE | | |
| | |
| BOD REPORT | | |
| | |
| FINANCIALS | | |
| | |
| SUSTAINABILITY INDICES | | |
| | |
GRI content index | | |
| | |
PRB content index | | |
| | |
| u TCFD disclosure index | | |
| | |
| | | |
| | |
| | | |
| | |
| | | |
| | |
| | | |
| | |
| | | |
| | |
| | | |
| | |
| | | |
| | |
| | | |
| | |
| | | |
| | |
| | | |
| | |
| | | |
| | |
| | | |
| | |
| | | |
| | |
| | | |
| | |
| | | |
| | |
| | | |
| | |
| | | |
| | |
| | | |
| | |
| | | |
| | |
| | | |
| | |
| | | |
Financed emissions methodology
| | | | |
Scope of financed emissions calculated | | Scope 1 and scope 2 emissions for: - The full Lending portfolio, excluding public sector and financial institutions - Treasury portfolio for Corporate Bonds Green and labelled bonds are excluded as PCAF has not published a final methodology for these yet. |
| | |
PCAF methodology | | Unlisted companies | | 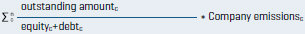 |
| | |
| | Listed companies | | 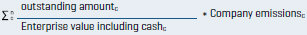 |
| | |
| | | | Where EVIC= market cap + minority interest + total debt |
| |
| | If a loan is given to a subsidiary of a company while emissions are reported only on group level, the financials in the attribution factor reflect group level data. The same logic holds for corporate bonds. NIB provides loans for specific purposes, i.e. the use of proceeds is known except for sustainability linked loans provided for general corporate purpose. However, only a small share of the loans outstanding are project finance cases that rely primarily on the project’s cash flow for repayment. Therefore, the methodology for business loans is used. The loans for which the project finance methodology suits better will be further assessed in 2023 and are not included in the scope in 2022. The methodology for commercial real estate is not used, as NIB’s real estate portfolio includes both commercial and public real estate. Financing was provided mainly for the construction of new green buildings or renovation of old buildings. NIB will assess this sector further in 2023. |
| |
Data sources and timing of data | | • Reported CO2e data from counterparties’ own sustainability reporting for the Lending portfolio • Reported CO2e data from MSCI Climate Change Metrics Service for the corporate bonds portfolio • Proxy data from PCAF database for emission intensities per million of euro of revenue (tCO2e/M€). Emission intensity factors are mapped to counterparties using GICS8 and the country of the borrower. Emissions data: For financial year 2021 Financial data, including market capitalizations: As of year-end 2021 Outstanding amount: As of year-end 2022. Represents the drawn amounts, i.e. committed exposure are not included. |
| |
Data quality specifications | | Reported data: verified and unverified company reported data (PCAF data quality score 1 or 2) Estimated Data: emissions estimated using emission intensities per million of euro of revenue (PCAF data quality score 4) |
| | | | | | |
Relative Indicators | | Carbon Footprint (tons CO2e / EUR million): | | 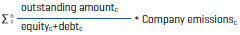 | | |
| | | | outstanding amount for sector | | |
| | Weighted Average Carbon Intensity (CO2e / MEUR revenue): | |  |
This disclosure was developed using information from MSCI ESG Research LLC or its affiliates or information providers. Although NORDIC INVESTMENT BANK’S information providers, including without limitation, MSCI ESG Research LLC and its affiliates (the “ESG Parties”), obtain information (the “Information”) from sources they consider reliable, none of the ESG Parties warrants or guarantees the originality, accuracy and/or completeness, of any data herein and expressly disclaim all express or implied warranties, including those of merchantability and fitness for a particular purpose. The Information may only be used for your internal use, may not be reproduced or redisseminated in any form and may not be used as a basis for, or a component of, any financial instruments or products or indices. Further, none the Information can in and of itself be used to determine which securities to buy or sell or when to buy or sell them. None of the ESG Parties shall have any liability for any errors or omissions in connection with any data herein, or any liability for any direct, indirect, special, punitive, consequential or any other damages (including lost profits) even if notified of the possibility of such damages.

CONTACT Kim Skov Jensen Jens Hellerup Luca De Lorenzo Jukka Ahonen Vice President & CFO Senior Director, Senior Director, Senior Director, kim.jensen@nib.int Head of Funding & Investor Relations Head of Sustainability & Mandate Head of Communications +358 10 618 0209 jens.hellerup@nib.int luca.delorenzo@nib.int jukka.ahonen@nib.int +358 10 618 0340 +358 10 618 0297 +358 10 618 0295 For more information about the Nordic Investment Bank, visit www.nib.int