
Exhibit XI Interim Management Statement – JANUARY SEPTEMBER 2023 (Unaudited) Q3
INTERIM MANAGEMENT STATEMENT / 2 Table of contents 3 President and CEO's comments 16 Notes to the interim financial statements 16 Note 1 - Net interest income 4 Key figures and ratios 16 Note 2 - Net profit/loss on financial operations 17 Note 3 - Expected credit loss 5 Operating and financial review 17 Note 4 - Net loan losses 5 Total comprehensive income 18 Note 5 - Lending outstanding 8 Financial position 18 Note 6 - Debts evidenced by certificates 10 Financial statements 19 Note 7 - Basis of preparation 10 Statement of comprehensive income 19 Ratio definitions 11 Statement of financial position 13 Statement of changes in equity 14 Cash flow statement
INTERIM MANAGEMENT STATEMENT / 3 President and CEO’s comments It has been a busy period for NIB since our last interim report. In August, NIB strengthened its Baltic presence with a new office in Riga. The new office brings NIB closer to its Baltic stakeholders, supporting the Bank’s strategic objectives to further enhance the outreach in the region. The opening is in line with NIB’s strategy to help develop and increase investments in underserved market segments. By establishing a regional hub, NIB aims to expand its activities towards Baltic private sector companies. It is of utmost importance for NIB to identify priorities of our member countries and how we can support them. During the quarter, we held several stakeholder meetings to explore that. Most importantly, we met with the finance ministers of Latvia, Finland, and Sweden. We also held NIB's Board of Directors' meetings after summer in Stockholm and Riga with external stakeholder seminars focusing on financing the green transition and the future of mobility. To get feedback from our stakeholders is particularly valuable as we are facing large geopolitical challenges across the world also impacting our region. The interest rate hikes over the past 15 months are unprecedented in the developed world, and the developing world continues to face deep problems with foreign exchange denominated debt burdens – and with more borrowing needs looming. However, despite these dark clouds we should not lose sight of the need to accelerate the green transition and support new innovation that can increase productivity and growth. In the first three quarters of 2023, a total of EUR 2,050 million was disbursed. Continued demand for NIB lending has allowed the bank to prioritise high impact projects. The focus on the green transition is quarter to quarter since 2021 and the results on financial operations in the second and third quarter were evident in the environmental mandate result, the share of which is at historical highs for NIB. New loans better than the first quarter as the markets stabilised after the volatility in March. Net loan losses remain included projects to accelerate the transition towards marine decarbonisation and renewable energy, and low and the expected loss provision on lending amounted to 0.3% of the lending exposure. to strengthen the electricity distribution networks in the region. The productivity mandate fulfilment also remains high. Details of all new lending can be found here. The Bank has raised EUR 6.7 billion in new funding in the first three quarters of 2023, including a five-year and a two-year global benchmark bond priced at attractive spreads over risk-free rates and both with Total assets at 30 September 2023 amounted to EUR 40 billion compared to EUR 41 billion at 30 large orderbooks. In September, NIB launched a five-year SEK 2 billion Environmental Bond. The proceeds September 2022. The total lending outstanding amounted to EUR 22 billion at 30 September 2023 from this transaction will be allocated to carefully selected projects that bring significant environmental compared to EUR 23 billion at 30 September 2022. The decrease was mainly attributable to significant benefits. foreign exchange impacts. Finally, I would like to welcome our newest member of the Executive Committee, Hanna Pajunen who has The net profit for the period January to September was strong and amounted to EUR 195 million been appointed Senior Director and Head of HR. compared to EUR 84 million in 2022. The increase in net profit is driven by higher net interest income and unrealised profits on financial operations. The underlying trend in core earnings has been improving from André Küüsvek, President & CEO
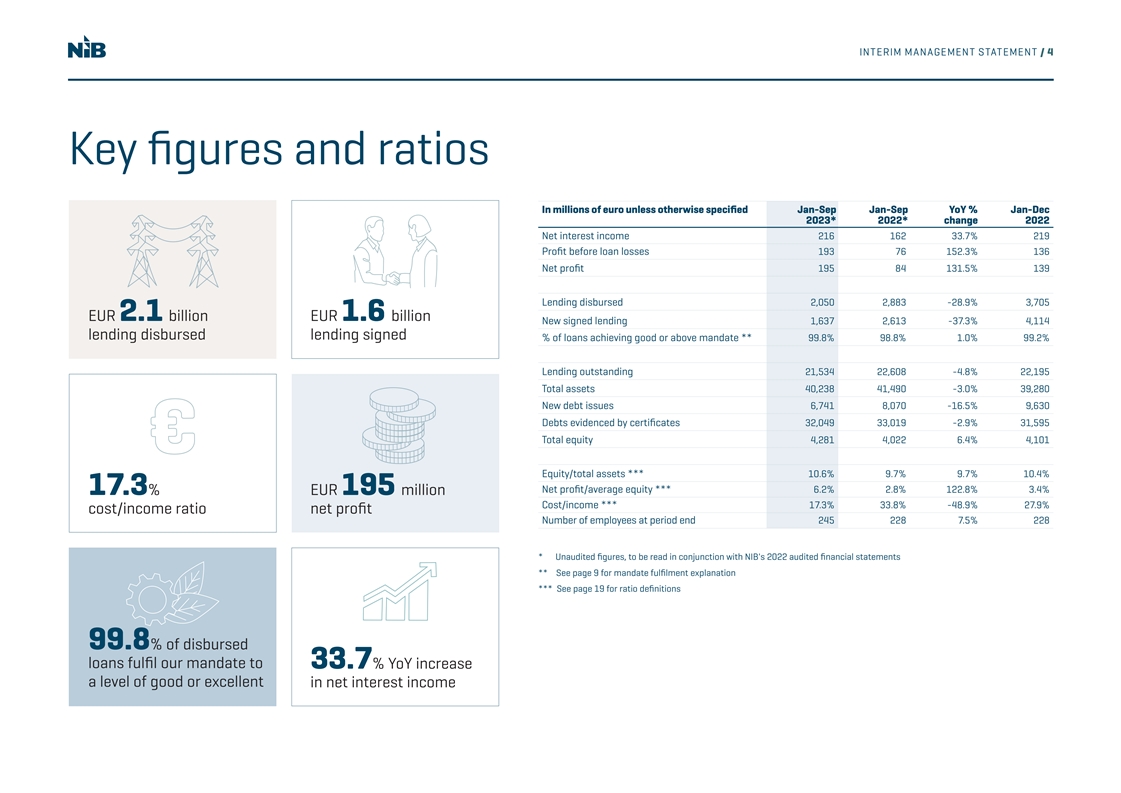
INTERIM MANAGEMENT STATEMENT / 4 Key figures and ratios In millions of euro unless otherwise specified Jan-Sep Jan-Sep YoY % Jan-Dec 2023* 2022* change 2022 Net interest income 216 162 33.7% 219 Profit before loan losses 193 76 152.3% 136 Net profit 195 84 131.5% 139 Lending disbursed 2,050 2,883 -28.9% 3,705 EUR 2.1 billion EUR 1.6 billion New signed lending 1,637 2,613 -37.3% 4,114 lending disbursed lending signed % of loans achieving good or above mandate ** 99.8% 98.8% 1.0% 99.2% Lending outstanding 21,534 22,608 -4.8% 22,195 Total assets 40,238 41,490 -3.0% 39,280 New debt issues 6,741 8,070 -16.5% 9,630 Debts evidenced by certificates 32,049 33,019 -2.9% 31,595 Total equity 4,281 4,022 6.4% 4,101 Equity/total assets *** 10.6% 9.7% 9.7% 10.4% Net profit/average equity *** 6.2% 2.8% 122.8% 3.4% 17.3% EUR 195 million Cost/income *** 17.3% 33.8% -48.9% 27.9% cost/income ratio net profit Number of employees at period end 245 228 7.5% 228 * Unaudited figures, to be read in conjunction with NIB's 2022 audited financial statements ** See page 9 for mandate fulfilment explanation *** See page 19 for ratio definitions 99.8% of disbursed loans fulfil our mandate to 33.7% YoY increase a level of good or excellent in net interest income
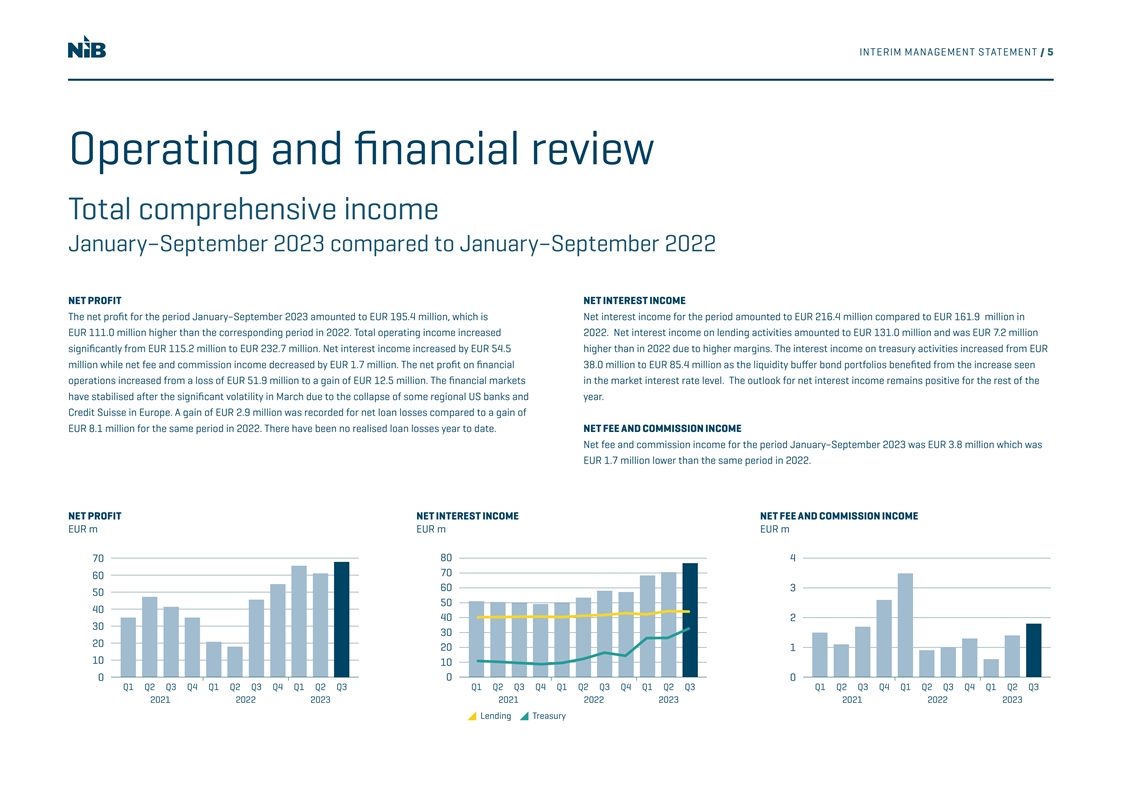
INTERIM MANAGEMENT STATEMENT / 5 Operating and financial review Total comprehensive income January–September 2023 compared to January–September 2022 NET PROFIT NET INTEREST INCOME The net profit for the period January–September 2023 amounted to EUR 195.4 million, which is Net interest income for the period amounted to EUR 216.4 million compared to EUR 161.9 million in EUR 111.0 million higher than the corresponding period in 2022. Total operating income increased 2022. Net interest income on lending activities amounted to EUR 131.0 million and was EUR 7.2 million significantly from EUR 115.2 million to EUR 232.7 million. Net interest income increased by EUR 54.5 higher than in 2022 due to higher margins. The interest income on treasury activities increased from EUR million while net fee and commission income decreased by EUR 1.7 million. The net profit on financial 38.0 million to EUR 85.4 million as the liquidity buffer bond portfolios benefited from the increase seen operations increased from a loss of EUR 51.9 million to a gain of EUR 12.5 million. The financial markets in the market interest rate level. The outlook for net interest income remains positive for the rest of the have stabilised after the significant volatility in March due to the collapse of some regional US banks and year. Credit Suisse in Europe. A gain of EUR 2.9 million was recorded for net loan losses compared to a gain of EUR 8.1 million for the same period in 2022. There have been no realised loan losses year to date. NET FEE AND COMMISSION INCOME Net fee and commission income for the period January–September 2023 was EUR 3.8 million which was EUR 1.7 million lower than the same period in 2022. NET PROFIT NET INTEREST INCOME NET FEE AND COMMISSION INCOME EUR m EUR m EUR m 80 4 70 70 60 60 3 50 50 40 40 2 30 30 20 20 1 10 10 0 0 0 Q1 Q2 Q3 Q4 Q1 Q2 Q3 Q4 Q1 Q2 Q3 Q1 Q2 Q3 Q4 Q1 Q2 Q3 Q4 Q1 Q2 Q3 Q1 Q2 Q3 Q4 Q1 Q2 Q3 Q4 Q1 Q2 Q3 2021 2022 2023 2021 2022 2023 2021 2022 2023 Lending T reasury
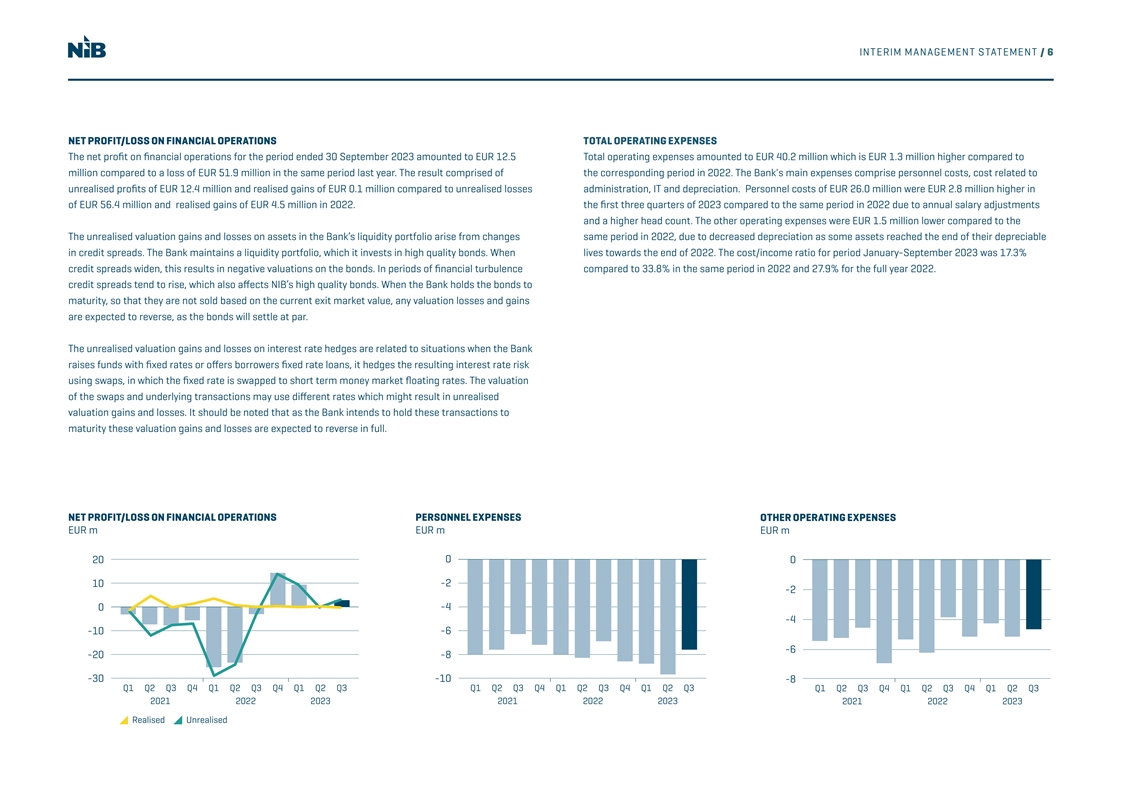
INTERIM MANAGEMENT STATEMENT / 6 NET PROFIT/LOSS ON FINANCIAL OPERATIONS TOTAL OPERATING EXPENSES The net profit on financial operations for the period ended 30 September 2023 amounted to EUR 12.5 Total operating expenses amounted to EUR 40.2 million which is EUR 1.3 million higher compared to million compared to a loss of EUR 51.9 million in the same period last year. The result comprised of the corresponding period in 2022. The Bank's main expenses comprise personnel costs, cost related to unrealised profits of EUR 12.4 million and realised gains of EUR 0.1 million compared to unrealised losses administration, IT and depreciation. Personnel costs of EUR 26.0 million were EUR 2.8 million higher in of EUR 56.4 million and realised gains of EUR 4.5 million in 2022. the first three quarters of 2023 compared to the same period in 2022 due to annual salary adjustments and a higher head count. The other operating expenses were EUR 1.5 million lower compared to the The unrealised valuation gains and losses on assets in the Bank’s liquidity portfolio arise from changes same period in 2022, due to decreased depreciation as some assets reached the end of their depreciable in credit spreads. The Bank maintains a liquidity portfolio, which it invests in high quality bonds. When lives towards the end of 2022. The cost/income ratio for period January-September 2023 was 17.3% credit spreads widen, this results in negative valuations on the bonds. In periods of financial turbulence compared to 33.8% in the same period in 2022 and 27.9% for the full year 2022. credit spreads tend to rise, which also affects NIB’s high quality bonds. When the Bank holds the bonds to maturity, so that they are not sold based on the current exit market value, any valuation losses and gains are expected to reverse, as the bonds will settle at par. The unrealised valuation gains and losses on interest rate hedges are related to situations when the Bank raises funds with fixed rates or offers borrowers fixed rate loans, it hedges the resulting interest rate risk using swaps, in which the fixed rate is swapped to short term money market floating rates. The valuation of the swaps and underlying transactions may use different rates which might result in unrealised valuation gains and losses. It should be noted that as the Bank intends to hold these transactions to maturity these valuation gains and losses are expected to reverse in full. NET PROFIT/LOSS ON FINANCIAL OPERATIONS PERSONNEL EXPENSES OTHER OPERATING EXPENSES EUR m EUR m EUR m 0 20 0 10 -2 -2 0 -4 -4 -10 -6 -6 -20 -8 -30 -10 -8 Q1 Q2 Q3 Q4 Q1 Q2 Q3 Q4 Q1 Q2 Q3 Q1 Q2 Q3 Q4 Q1 Q2 Q3 Q4 Q1 Q2 Q3 Q1 Q2 Q3 Q4 Q1 Q2 Q3 Q4 Q1 Q2 Q3 2021 2022 2023 2021 2022 2023 2021 2022 2023 Realised Unrealised

INTERIM MANAGEMENT STATEMENT / 7 NET LOAN LOSSES For the period ended 30 September 2023, the Bank has recorded a positive amount for net loan losses of TOTAL COMPREHENSIVE INCOME EUR 2.9 million compared to a positive amount of EUR 8.1 million for the corresponding period in 2022. All in all, NIB had a significantly higher total comprehensive income in the nine months of 2023 compared EUR 1.7 million of the gain recorded relates to performing loans and EUR 1.2 million relates to recoveries to the same period in 2022. Total comprehensive income amounted to EUR 205.1 million compared to on fully impaired non-performing loans. The positive impact on performing loans is mainly due to some EUR 63.1 million in the same period of 2022. large prepayments and credit upgrades offset by downgrades. In general, there have been no significant observed changes in the credit quality of the overall loan portfolio and there were no new non-performing loans during the period and no realised losses. OTHER COMPREHENSIVE INCOME The Bank separates the foreign currency basis spread from financial instruments used in fair value hedge accounting and this separated amount is recorded in Other comprehensive income (OCI) which amounted to a gain of EUR 10.2 million for the nine month period ended 30 September 2023 compared to a loss of EUR 24.3 million in the same period last year. Financial liabilities recorded at fair value through the profit and loss, see valuation changes due to changes in own credit spreads need to be recorded in OCI. For the period ended 30 September 2023, the Bank recorded a negative impact from these changes of EUR 0.5 million compared to positive amount of EUR 3.0 million in 2022. NET LOAN LOSSES OTHER COMPREHENSIVE INCOME TOTAL COMPREHENSIVE INCOME EUR m EUR m EUR m 80 20 30 20 15 60 10 10 0 40 5 -10 20 0 -20 -5 -30 0 Q1 Q2 Q3 Q4 Q1 Q2 Q3 Q4 Q1 Q2 Q3 Q1 Q2 Q3 Q4 Q1 Q2 Q3 Q4 Q1 Q2 Q3 Q1 Q2 Q3 Q4 Q1 Q2 Q3 Q4 Q1 Q2 Q3 2021 2022 2023 2021 2022 2023 2021 2022 2023
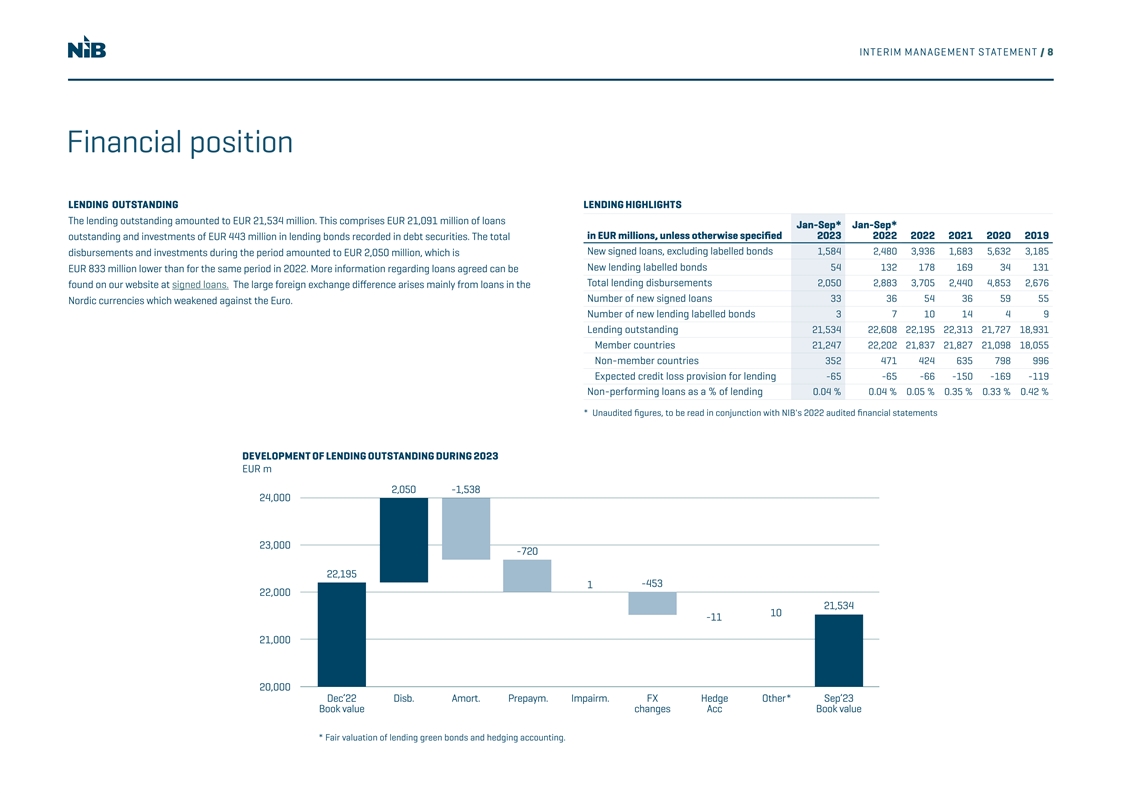
INTERIM MANAGEMENT STATEMENT / 8 Financial position LENDING OUTSTANDING LENDING HIGHLIGHTS The lending outstanding amounted to EUR 21,534 million. This comprises EUR 21,091 million of loans Jan-Sep* Jan-Sep* in EUR millions, unless otherwise specified 2023 2022 2022 2021 2020 2019 outstanding and investments of EUR 443 million in lending bonds recorded in debt securities. The total New signed loans, excluding labelled bonds 1,584 2,480 3,936 1,683 5,632 3,185 disbursements and investments during the period amounted to EUR 2,050 million, which is New lending labelled bonds 54 132 178 169 34 131 EUR 833 million lower than for the same period in 2022. More information regarding loans agreed can be Total lending disbursements 2,050 2,883 3,705 2,440 4,853 2,676 found on our website at signed loans. The large foreign exchange difference arises mainly from loans in the Number of new signed loans 33 36 54 36 59 55 Nordic currencies which weakened against the Euro. Number of new lending labelled bonds 3 7 10 14 4 9 Lending outstanding 21,534 22,608 22,195 22,313 21,727 18,931 Member countries 21,247 22,202 21,837 21,827 21,098 18,055 Non-member countries 352 471 424 635 798 996 Expected credit loss provision for lending -65 -65 -66 -150 -169 -119 Non-performing loans as a % of lending 0.04 % 0.04 % 0.05 % 0.35 % 0.33 % 0.42 % * Unaudited figures, to be read in conjunction with NIB's 2022 audited financial statements DEVELOPMENT OF LENDING OUTSTANDING DURING 2023 EUR m 2,050 -1,538 24,000 23,000 -720 22,195 1 -453 22,000 21,534 10 -11 21,000 20,000 Dec’22 Disb. Amort. Prepaym. Impairm. FX Hedge Other* Sep’23 Book value changes Acc Book value * Fair valuation of lending green bonds and hedging accounting.
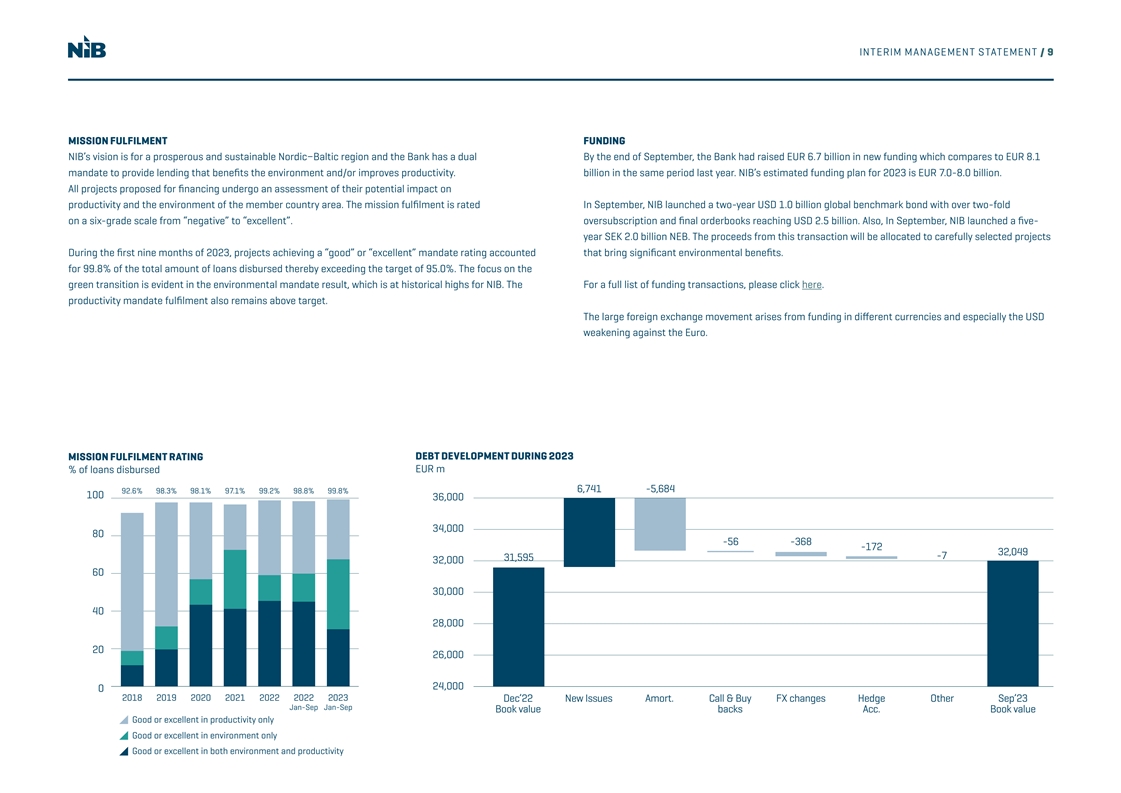
INTERIM MANAGEMENT STATEMENT / 9 MISSION FULFILMENT FUNDING NIB’s vision is for a prosperous and sustainable Nordic−Baltic region and the Bank has a dual By the end of September, the Bank had raised EUR 6.7 billion in new funding which compares to EUR 8.1 mandate to provide lending that benefits the environment and/or improves productivity. billion in the same period last year. NIB’s estimated funding plan for 2023 is EUR 7.0-8.0 billion. All projects proposed for financing undergo an assessment of their potential impact on productivity and the environment of the member country area. The mission fulfilment is rated In September, NIB launched a two-year USD 1.0 billion global benchmark bond with over two-fold on a six-grade scale from “negative” to “excellent”. oversubscription and final orderbooks reaching USD 2.5 billion. Also, In September, NIB launched a five- year SEK 2.0 billion NEB. The proceeds from this transaction will be allocated to carefully selected projects During the first nine months of 2023, projects achieving a “good” or “excellent” mandate rating accounted that bring significant environmental benefits. for 99.8% of the total amount of loans disbursed thereby exceeding the target of 95.0%. The focus on the green transition is evident in the environmental mandate result, which is at historical highs for NIB. The For a full list of funding transactions, please click here. productivity mandate fulfilment also remains above target. The large foreign exchange movement arises from funding in different currencies and especially the USD weakening against the Euro. MISSION FULFILMENT RATING DEBT DEVELOPMENT DURING 2023 % of loans disbursed EUR m 6,741 -5,684 92.6% 98.3% 98.1% 97.1% 99.2% 98.8% 99.8% 100 36,000 34,000 80 -56 -368 -172 32,049 -7 31,595 32,000 60 30,000 40 28,000 20 26,000 24,000 0 2018 2019 2020 2021 2022 2022 2023 Dec’22 New Issues Amort. Call & Buy FX changes Hedge Other Sep’23 Jan-Sep Jan-Sep Book value backs Acc. Book value Good or excellent in productivity only Good or excellent in environment only Good or excellent in both environment and productivity
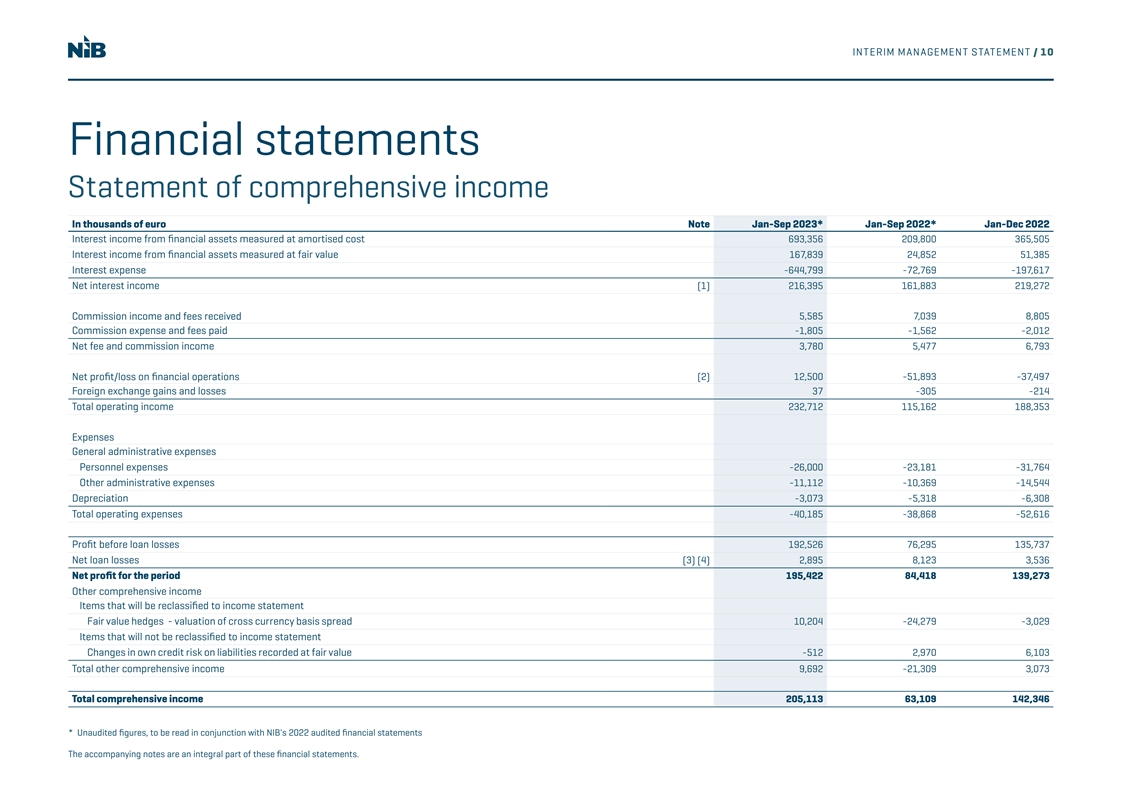
INTERIM MANAGEMENT STATEMENT / 10 Financial statements Statement of comprehensive income In thousands of euro Note Jan-Sep 2023* Jan-Sep 2022* Jan-Dec 2022 Interest income from financial assets measured at amortised cost 693,356 209,800 365,505 Interest income from financial assets measured at fair value 167,839 24,852 51,385 Interest expense -644,799 -72,769 -197,617 Net interest income (1) 216,395 161,883 219,272 Commission income and fees received 5,585 7,039 8,805 Commission expense and fees paid -1,805 -1,562 -2,012 Net fee and commission income 3,780 5,477 6,793 Net profit/loss on financial operations (2) 12,500 -51,893 -37,497 Foreign exchange gains and losses 37 -305 -214 Total operating income 232,712 115,162 188,353 Expenses General administrative expenses Personnel expenses -26,000 -23,181 -31,764 Other administrative expenses -11,112 -10,369 -14,544 Depreciation -3,073 -5,318 -6,308 Total operating expenses -40,185 -38,868 -52,616 Profit before loan losses 192,526 76,295 135,737 Net loan losses (3) (4) 2,895 8,123 3,536 Net profit for the period 195,422 84,418 139,273 Other comprehensive income Items that will be reclassified to income statement Fair value hedges - valuation of cross currency basis spread 10,204 -24,279 -3,029 Items that will not be reclassified to income statement Changes in own credit risk on liabilities recorded at fair value -512 2,970 6,103 Total other comprehensive income 9,692 -21,309 3,073 Total comprehensive income 205,113 63,109 142,346 * Unaudited figures, to be read in conjunction with NIB's 2022 audited financial statements The accompanying notes are an integral part of these financial statements.
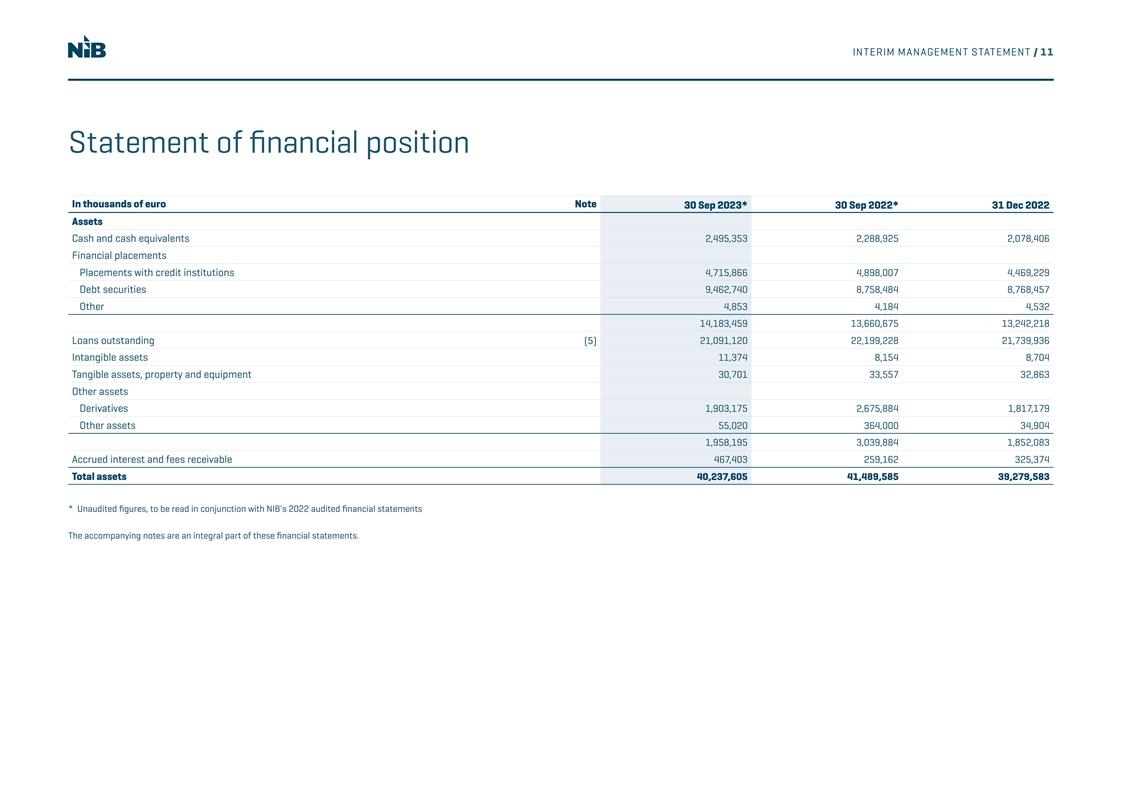
INTERIM MANAGEMENT STATEMENT / 11 Statement of financial position In thousands of euro Note 30 Sep 2023* 30 Sep 2022* 31 Dec 2022 Assets Cash and cash equivalents 2,495,353 2,288,925 2,078,406 Financial placements Placements with credit institutions 4,715,866 4,898,007 4,469,229 Debt securities 9,462,740 8,758,484 8,768,457 Other 4,853 4,184 4,532 14,183,459 13,660,675 13,242,218 Loans outstanding (5) 21,091,120 22,199,228 21,739,936 Intangible assets 11,374 8,154 8,704 Tangible assets, property and equipment 30,701 33,557 32,863 Other assets Derivatives 1,903,175 2,675,884 1,817,179 Other assets 55,020 364,000 34,904 1,958,195 3,039,884 1,852,083 Accrued interest and fees receivable 467,403 259,162 325,374 Total assets 40,237,605 41,489,585 39,279,583 * Unaudited figures, to be read in conjunction with NIB's 2022 audited financial statements The accompanying notes are an integral part of these financial statements.
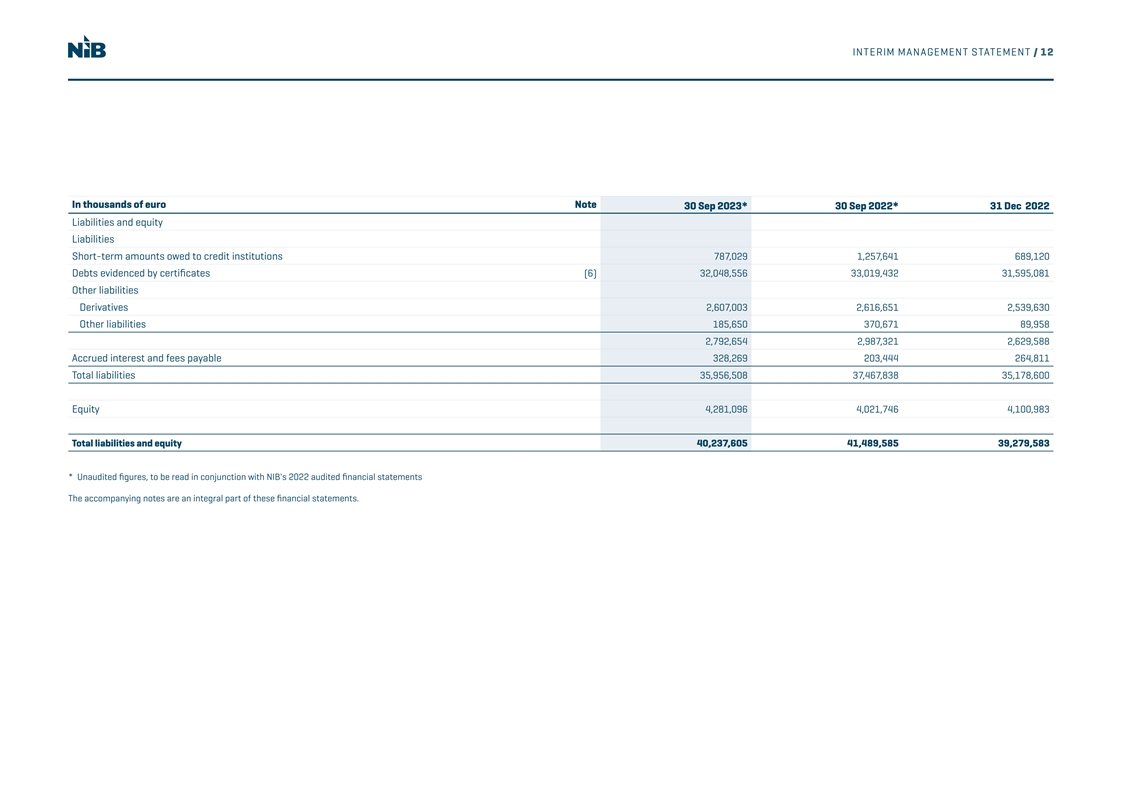
INTERIM MANAGEMENT STATEMENT / 12 In thousands of euro Note 30 Sep 2023* 30 Sep 2022* 31 Dec 2022 Liabilities and equity Liabilities Short-term amounts owed to credit institutions 787,029 1,257,641 689,120 Debts evidenced by certificates (6) 32,048,556 33,019,432 31,595,081 Other liabilities Derivatives 2,607,003 2,616,651 2,539,630 Other liabilities 185,650 370,671 89,958 2,792,654 2,987,321 2,629,588 Accrued interest and fees payable 328,269 203,444 264,811 Total liabilities 35,956,508 37,467,838 35,178,600 Equity 4,281,096 4,021,746 4,100,983 Total liabilities and equity 40,237,605 41,489,585 39,279,583 * Unaudited figures, to be read in conjunction with NIB's 2022 audited financial statements The accompanying notes are an integral part of these financial statements.
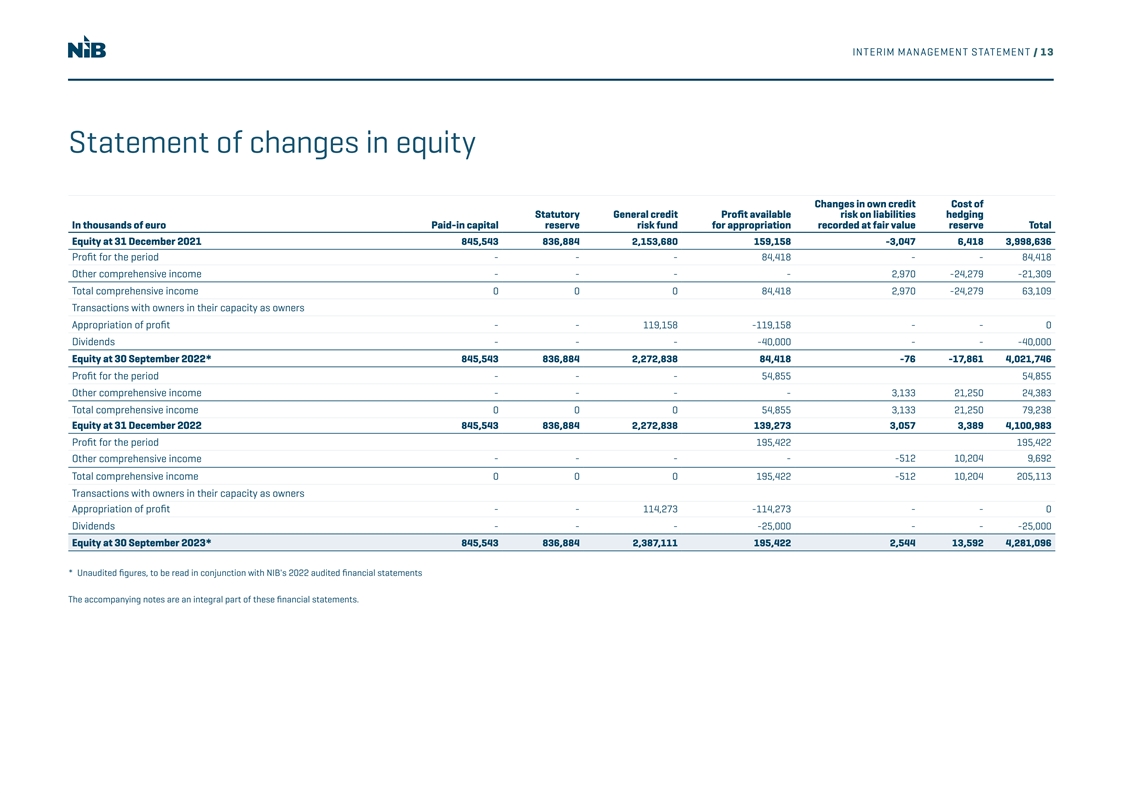
INTERIM MANAGEMENT STATEMENT / 13 Statement of changes in equity Changes in own credit Cost of Statutory General credit Profit available risk on liabilities hedging In thousands of euro Paid-in capital reserve risk fund for appropriation recorded at fair value reserve Total Equity at 31 December 2021 845,543 836,884 2,153,680 159,158 -3,047 6,418 3,998,636 Profit for the period - - - 84,418 - - 84,418 Other comprehensive income - - - - 2,970 -24,279 -21,309 Total comprehensive income 0 0 0 84,418 2,970 -24,279 63,109 Transactions with owners in their capacity as owners Appropriation of profit - - 119,158 -119,158 - - 0 Dividends - - - -40,000 - - -40,000 Equity at 30 September 2022* 845,543 836,884 2,272,838 84,418 -76 -17,861 4,021,746 Profit for the period - - - 54,855 54,855 Other comprehensive income - - - - 3,133 21,250 24,383 Total comprehensive income 0 0 0 54,855 3,133 21,250 79,238 Equity at 31 December 2022 845,543 836,884 2,272,838 139,273 3,057 3,389 4,100,983 Profit for the period 195,422 195,422 - - - - -512 10,204 9,692 Other comprehensive income Total comprehensive income 0 0 0 195,422 -512 10,204 205,113 Transactions with owners in their capacity as owners Appropriation of profit - - 114,273 -114,273 - - 0 Dividends - - - -25,000 - - -25,000 Equity at 30 September 2023* 845,543 836,884 2,387,111 195,422 2,544 13,592 4,281,096 * Unaudited figures, to be read in conjunction with NIB's 2022 audited financial statements The accompanying notes are an integral part of these financial statements.
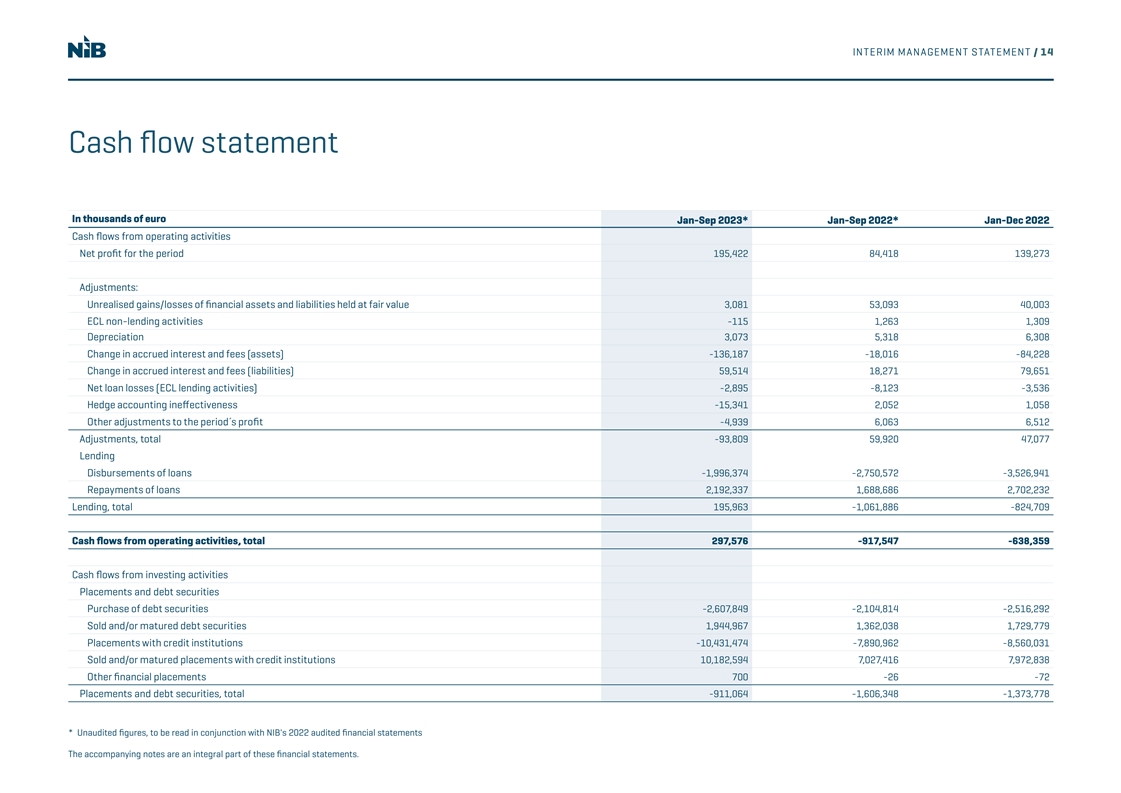
INTERIM MANAGEMENT STATEMENT / 14 Cash flow statement In thousands of euro Jan-Sep 2023* Jan-Sep 2022* Jan-Dec 2022 Cash flows from operating activities Net profit for the period 195,422 84,418 139,273 Adjustments: Unrealised gains/losses of financial assets and liabilities held at fair value 3,081 53,093 40,003 ECL non-lending activities -115 1,263 1,309 Depreciation 3,073 5,318 6,308 Change in accrued interest and fees (assets) -136,187 -18,016 -84,228 Change in accrued interest and fees (liabilities) 59,514 18,271 79,651 Net loan losses (ECL lending activities) -2,895 -8,123 -3,536 Hedge accounting ineffectiveness -15,341 2,052 1,058 Other adjustments to the period´s profit -4,939 6,063 6,512 Adjustments, total -93,809 59,920 47,077 Lending Disbursements of loans -1,996,374 -2,750,572 -3,526,941 Repayments of loans 2,192,337 1,688,686 2,702,232 Lending, total 195,963 -1,061,886 -824,709 Cash flows from operating activities, total 297,576 -917,547 -638,359 Cash flows from investing activities Placements and debt securities Purchase of debt securities -2,607,849 -2,104,814 -2,516,292 Sold and/or matured debt securities 1,944,967 1,362,038 1,729,779 Placements with credit institutions -10,431,474 -7,890,962 -8,560,031 Sold and/or matured placements with credit institutions 10,182,594 7,027,416 7,972,838 Other financial placements 700 -26 -72 Placements and debt securities, total -911,064 -1,606,348 -1,373,778 * Unaudited figures, to be read in conjunction with NIB's 2022 audited financial statements The accompanying notes are an integral part of these financial statements.
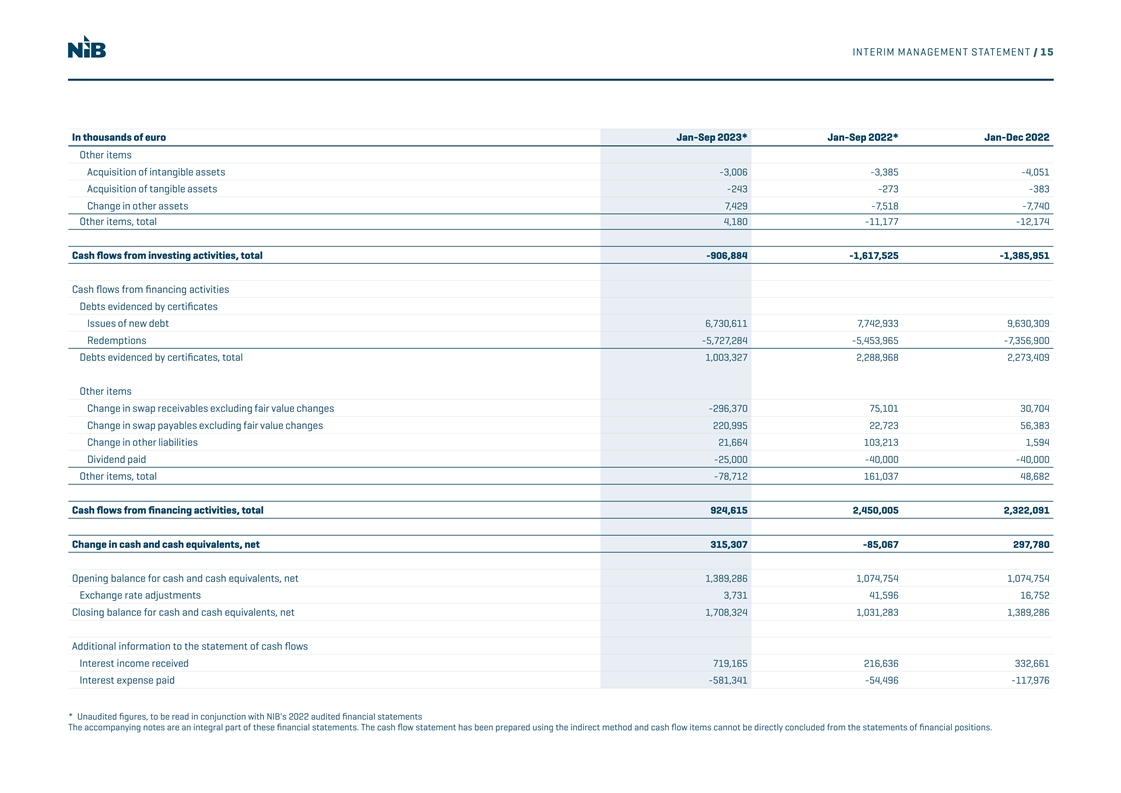
INTERIM MANAGEMENT STATEMENT / 15 In thousands of euro Jan-Sep 2023* Jan-Sep 2022* Jan-Dec 2022 Other items Acquisition of intangible assets -3,006 -3,385 -4,051 Acquisition of tangible assets -243 -273 -383 Change in other assets 7,429 -7,518 -7,740 Other items, total 4,180 -11,177 -12,174 Cash flows from investing activities, total -906,884 -1,617,525 -1,385,951 Cash flows from financing activities Debts evidenced by certificates Issues of new debt 6,730,611 7,742,933 9,630,309 Redemptions -5,727,284 -5,453,965 -7,356,900 Debts evidenced by certificates, total 1,003,327 2,288,968 2,273,409 Other items Change in swap receivables excluding fair value changes -296,370 75,101 30,704 Change in swap payables excluding fair value changes 220,995 22,723 56,383 Change in other liabilities 21,664 103,213 1,594 Dividend paid -25,000 -40,000 -40,000 Other items, total -78,712 161,037 48,682 Cash flows from financing activities, total 924,615 2,450,005 2,322,091 Change in cash and cash equivalents, net 315,307 -85,067 297,780 Opening balance for cash and cash equivalents, net 1,389,286 1,074,754 1,074,754 Exchange rate adjustments 3,731 41,596 16,752 Closing balance for cash and cash equivalents, net 1,708,324 1,031,283 1,389,286 Additional information to the statement of cash flows Interest income received 719,165 216,636 332,661 Interest expense paid -581,341 -54,496 -117,976 * Unaudited figures, to be read in conjunction with NIB's 2022 audited financial statements The accompanying notes are an integral part of these financial statements. The cash flow statement has been prepared using the indirect method and cash flow items cannot be directly concluded from the statements of financial positions.
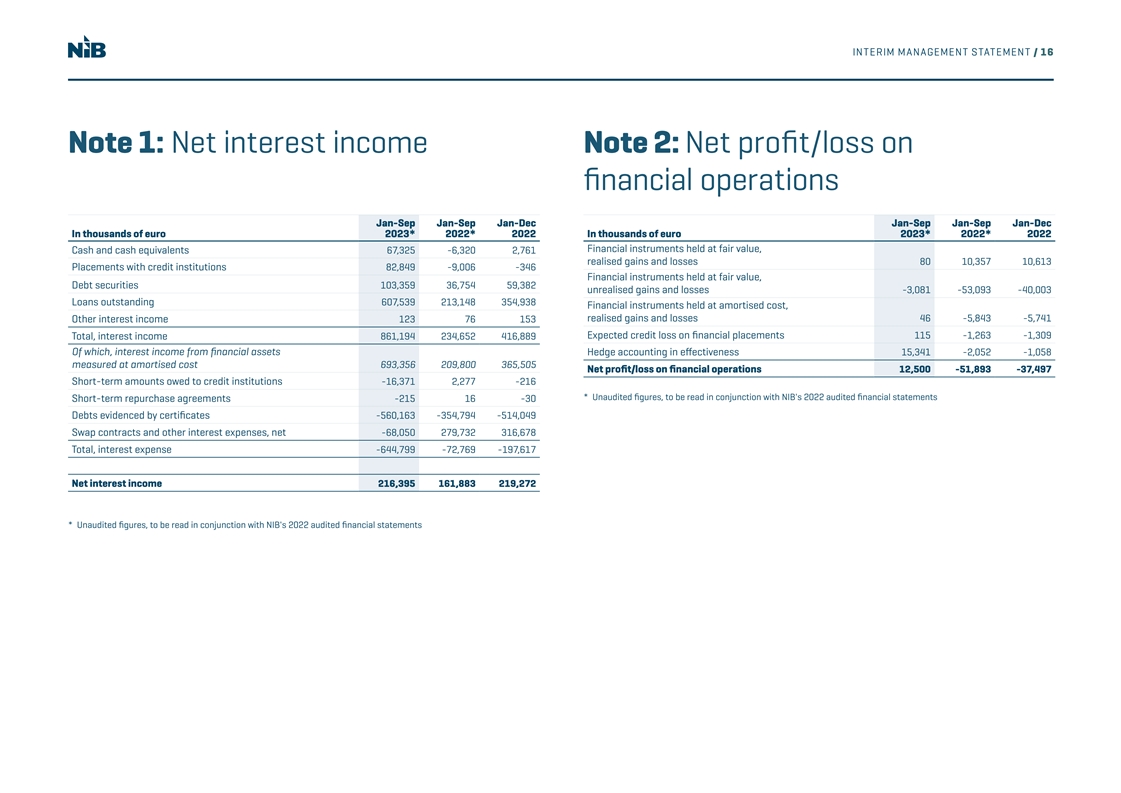
INTERIM MANAGEMENT STATEMENT / 16 Note 1: Net interest income Note 2: Net profit/loss on n fi ancial operations Jan-Sep Jan-Sep Jan-Dec Jan-Sep Jan-Sep Jan-Dec In thousands of euro 2023* 2022* 2022 In thousands of euro 2023* 2022* 2022 Financial instruments held at fair value, Cash and cash equivalents 67,325 -6,320 2,761 realised gains and losses 80 10,357 10,613 Placements with credit institutions 82,849 -9,006 -346 Financial instruments held at fair value, Debt securities 103,359 36,754 59,382 unrealised gains and losses -3,081 -53,093 -40,003 Loans outstanding 607,539 213,148 354,938 Financial instruments held at amortised cost, realised gains and losses 46 -5,843 -5,741 Other interest income 123 76 153 Expected credit loss on financial placements 115 -1,263 -1,309 Total, interest income 861,194 234,652 416,889 Of which, interest income from financial assets Hedge accounting in effectiveness 15,341 -2,052 -1,058 measured at amortised cost 693,356 209,800 365,505 Net profit/loss on financial operations 12,500 -51,893 -37,497 Short-term amounts owed to credit institutions -16,371 2,277 -216 * Unaudited figures, to be read in conjunction with NIB's 2022 audited financial statements Short-term repurchase agreements -215 16 -30 Debts evidenced by certificates -560,163 -354,794 -514,049 Swap contracts and other interest expenses, net -68,050 279,732 316,678 Total, interest expense -644,799 -72,769 -197,617 Net interest income 216,395 161,883 219,272 * Unaudited figures, to be read in conjunction with NIB's 2022 audited financial statements
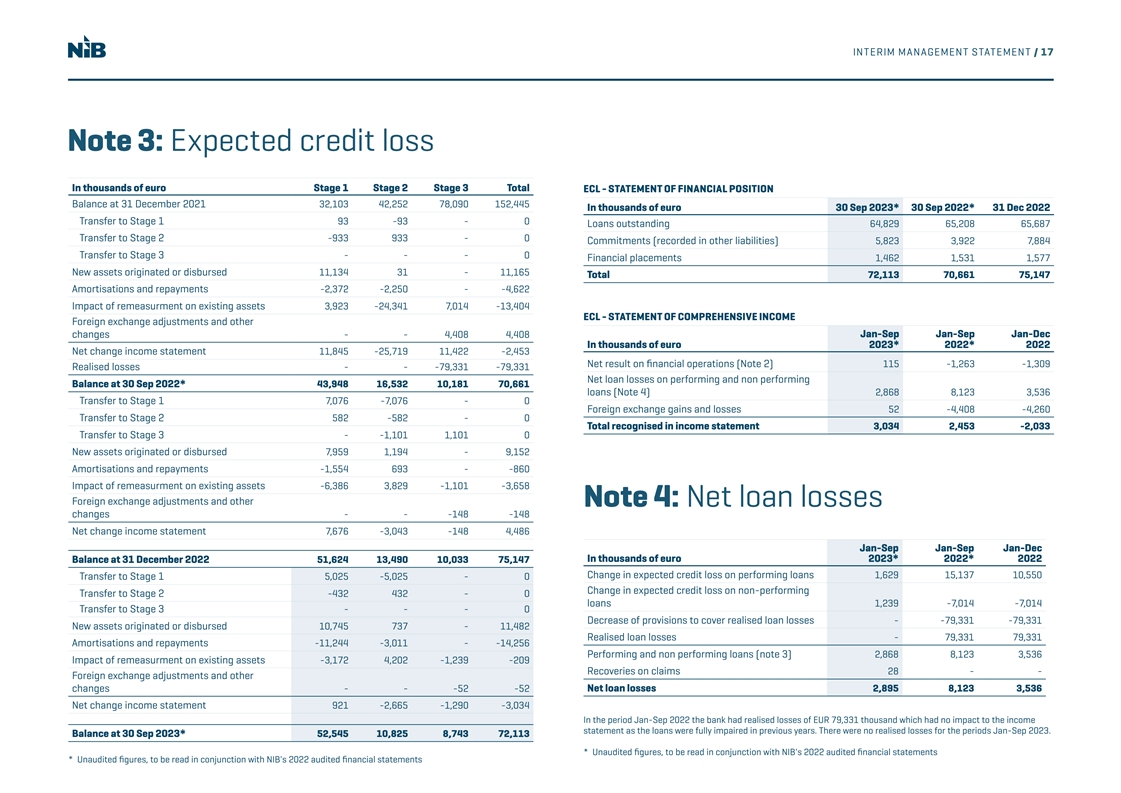
INTERIM MANAGEMENT STATEMENT / 17 Note 3: Expected credit loss In thousands of euro Stage 1 Stage 2 Stage 3 Total ECL - STATEMENT OF FINANCIAL POSITION Balance at 31 December 2021 32,103 42,252 78,090 152,445 In thousands of euro 30 Sep 2023* 30 Sep 2022* 31 Dec 2022 Transfer to Stage 1 93 -93 - 0 Loans outstanding 64,829 65,208 65,687 Transfer to Stage 2 -933 933 - 0 Commitments (recorded in other liabilities) 5,823 3,922 7,884 Transfer to Stage 3 - - - 0 Financial placements 1,462 1,531 1,577 New assets originated or disbursed 11,134 31 - 11,165 Total 72,113 70,661 75,147 Amortisations and repayments -2,372 -2,250 - -4,622 Impact of remeasurment on existing assets 3,923 -24,341 7,014 -13,404 ECL - STATEMENT OF COMPREHENSIVE INCOME Foreign exchange adjustments and other changes - - 4,408 4,408 Jan-Sep Jan-Sep Jan-Dec In thousands of euro 2023* 2022* 2022 Net change income statement 11,845 -25,719 11,422 -2,453 Net result on financial operations (Note 2) 115 -1,263 -1,309 Realised losses - - -79,331 -79,331 Net loan losses on performing and non performing Balance at 30 Sep 2022* 43,948 16,532 10,181 70,661 loans (Note 4) 2,868 8,123 3,536 Transfer to Stage 1 7,076 -7,076 - 0 Foreign exchange gains and losses 52 -4,408 -4,260 Transfer to Stage 2 582 -582 - 0 Total recognised in income statement 3,034 2,453 -2,033 Transfer to Stage 3 - -1,101 1,101 0 New assets originated or disbursed 7,959 1,194 - 9,152 Amortisations and repayments -1,554 693 - -860 Impact of remeasurment on existing assets -6,386 3,829 -1,101 -3,658 Foreign exchange adjustments and other Note 4: Net loan losses changes - - -148 -148 Net change income statement 7,676 -3,043 -148 4,486 Jan-Sep Jan-Sep Jan-Dec Balance at 31 December 2022 51,624 13,490 10,033 75,147 In thousands of euro 2023* 2022* 2022 Change in expected credit loss on performing loans 1,629 15,137 10,550 Transfer to Stage 1 5,025 -5,025 - 0 Change in expected credit loss on non-performing Transfer to Stage 2 -432 432 - 0 loans 1,239 -7,014 -7,014 Transfer to Stage 3 - - - 0 Decrease of provisions to cover realised loan losses - -79,331 -79,331 New assets originated or disbursed 10,745 737 - 11,482 Realised loan losses - 79,331 79,331 Amortisations and repayments -11,244 -3,011 - -14,256 Performing and non performing loans (note 3) 2,868 8,123 3,536 Impact of remeasurment on existing assets -3,172 4,202 -1,239 -209 Recoveries on claims 28 - - Foreign exchange adjustments and other changes - - -52 -52 Net loan losses 2,895 8,123 3,536 Net change income statement 921 -2,665 -1,290 -3,034 In the period Jan-Sep 2022 the bank had realised losses of EUR 79,331 thousand which had no impact to the income statement as the loans were fully impaired in previous years. There were no realised losses for the periods Jan-Sep 2023. Balance at 30 Sep 2023* 52,545 10,825 8,743 72,113 * Unaudited figures, to be read in conjunction with NIB's 2022 audited financial statements * Unaudited figures, to be read in conjunction with NIB's 2022 audited financial statements
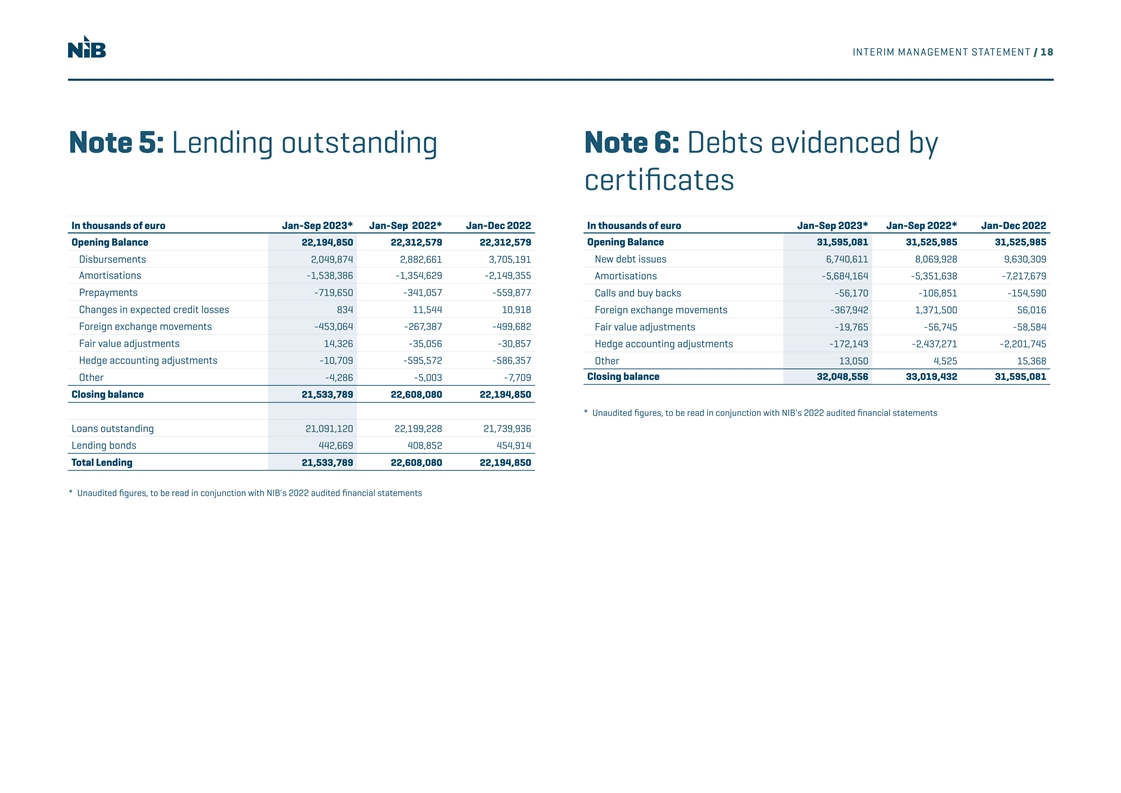
INTERIM MANAGEMENT STATEMENT / 18 Note 5: Lending outstanding Note 6: Debts evidenced by certicate fi s In thousands of euro Jan-Sep 2023* Jan-Sep 2022* Jan-Dec 2022 In thousands of euro Jan-Sep 2023* Jan-Sep 2022* Jan-Dec 2022 Opening Balance 22,194,850 22,312,579 22,312,579 Opening Balance 31,595,081 31,525,985 31,525,985 Disbursements 2,049,874 2,882,661 3,705,191 New debt issues 6,740,611 8,069,928 9,630,309 Amortisations -1,538,386 -1,354,629 -2,149,355 Amortisations -5,684,164 -5,351,638 -7,217,679 Prepayments -719,650 -341,057 -559,877 Calls and buy backs -56,170 -106,851 -154,590 Changes in expected credit losses 834 11,544 10,918 Foreign exchange movements -367,942 1,371,500 56,016 Foreign exchange movements -453,064 -267,387 -499,682 Fair value adjustments -19,765 -56,745 -58,584 Fair value adjustments 14,326 -35,056 -30,857 Hedge accounting adjustments -172,143 -2,437,271 -2,201,745 Hedge accounting adjustments -10,709 -595,572 -586,357 Other 13,050 4,525 15,368 Closing balance 32,048,556 33,019,432 31,595,081 Other -4,286 -5,003 -7,709 Closing balance 21,533,789 22,608,080 22,194,850 * Unaudited figures, to be read in conjunction with NIB's 2022 audited financial statements Loans outstanding 21,091,120 22,199,228 21,739,936 Lending bonds 442,669 408,852 454,914 Total Lending 21,533,789 22,608,080 22,194,850 * Unaudited figures, to be read in conjunction with NIB's 2022 audited financial statements
INTERIM MANAGEMENT STATEMENT / 19 RATIO DEFINITIONS Note 7: Basis of preparation Total equity at reporting date Equity/total assets = Total assets at reporting date This interim management statement is not presented in accordance with IAS 34 Interim Financial Reporting as it excludes a number of disclosures. The accounting policies and methods of computation Net profit/average Annualised profit for the period are the same as described in Note 1 of NIB's Financial Statements 2022. equity = Average equity for the period This report was approved by the Executive Committee on 18th October 2023 Total operating expenses for the period Cost/income = Total operating income for the period
CONTACT Kim Skov Jensen Jens Hellerup Jukka Ahonen Vice President & CFO Senior Director, Senior Director, kim.jensen@nib.int Head of Funding & Investor Relations Head of Communications +358 10 618 0209 jens.hellerup@nib.int jukka.ahonen@nib.int +358 9 6181 1401 +358 10 618 0295 For more information about the Nordic Investment Bank, visit www.nib.int